and roben. - library and archives canada€¦ · the d~sign and construction of an elecrrochemical...
TRANSCRIPT

MOBILE PHASE MODIFIER EFFF'=TS AND
ELECTROCHEMICAL DETECTION
IN SUPERCRITICAL Fl..UID CHROMATOGRAPHY
by
Marie Di Maso
A thesis submitted to the Faculty of Graduate Studies and Research in partial
fulfilment of the requirements for the degree of Doctor of Philosophy.
Deparnnent of Chemistry McGill University Montréal, Quéhec, Canada
(c) Marie Di Maso 1990
July 1990

To Mom and Dad
and
Roben.

MOBH.E PHASE MODIFIER EFFECTS AND
ELECTROCHEMICAL DETECTION
IN SUPERCRITICAL FLUID CHROMATOGRAPHY
The role of mobile phase modifiers in supercritical fluid chromatography (SFC)
and their effect on the separation process were invesngated. A study of the influence
of temperature and density on chromatographie behaviour in supercritical carbon
dioxide and four modified carbon Jioxide mobile phases demonstrates the imponance
of bath density and mobile phase composItion in controlling retenuon characteristics.
The L1formation gained from the se srudies was used to develop methodology for the
separation and detection of a series of phenothiazinone compounds and an assay for L-
615,919, 4-cl!loro-3H-phenothiazin-3-one, in plasma. The development of an analyncal
method for the analysis of sorbitan tnoleate in pharmaceutical formulauons
demonstrates a unique applicauon of SFC Wlth flame lOnlZaUOn detectlon (FID) that is
not possible by other chromatographic techniques
The feasibility of an electrocherrucal detecuon system for SFC has been
demonstrated. The d~sign and construction of an elecrrochemical detector wuh a
platinum ultramicro working electrode and factors influencmg HS perfonnance are
described.

LES EFFETS D'UN MODIFICATEUR DE LA PHASE SUPERCRITIQUE ET DETECTION ELECTROCHIMIQUE EN
CHROMATOGRAPHIE EN PHASE SUPERCRITIQUE
Le rôle du modificateur de la phase supercritique dans la chromatographie en
phase supercritique (CPS) et ses effet~ sur le processus de la séparation
chromatographique ont été investigés. Une étude de l'influence de la température et de
la densité sur le componement chromatographique démontre l'importance de la densité
et de la composition de la phase supercritique pour le contrôle de la rétention.
L'infonnation obtenu de cettes études a été utilisé pour le dévelopement d'une
méthodologie pour la séparation et la détection d'une sene de composé de
phénothiazinone et une méthode analytique pour L615,919, 4-chloro-3H-phénothiazm-
3-one, dans plasma. Le dévelopement d'une méthode pour l'analyse de sorbitan
trioléate dans les fonnulations pharmaceutiques démontre une application unique de la
CPS pour la détection par ionisation de flamme qui n'est pas pOSSIble avec les autres
techniques chromatograçhique~.
La pos~Ibilité d'utilisé la détection électrochimique pour la chromatographie en
phase supercritique a été démontrée. La conception et la construction d'un détecteur
électrochirnique qui unlise une micro-électrode de platine et les facteurs qui
influencent sa perfomlance sont décrits.
- 1 -
Acknowledgements
1 would like to express my gratitude to Professor William C. Purdy for his guidance and encouragement in pursuing my research interests. His support in the joint research with Merck Frosst Centre for Therapeutic Research is most appreciated.
1 would like to thank Dr. Meredith L. Conon for the umque opponunity to pursue my research goals in the departrnent of pharmaceutical research and development at Merck Frosst.
1 am most grateful for the assistance and suppon of many people at both the chemistry department at McGill University and Merck Frossl Centre for Therapeutic Research:
Pierre Lamarche, for his expertise in developing a technique for modifying supercritical fluids and many helpful discussions;
Dr. Elizabeth Kwong, for her aSSIstance in planning and execunng the plasma studies;
Dr. C.K. Lau and Dr. Yves Girard, for providing the phenothlazmone compounds;
George Kopp for preparing the microelectrodes and Fred Kluck for constructing a support for the electrochemical detector,
And the pharmaceutical research and development group at Merck Frosst.
The suppon, counùess discussions and friendship of Alexis Carpenter and Jeff McCarthy are very much appreciated.
1 most indebted to Dr. Sam A. McClintock, foremost, for co-direeung this research work and for having created a most Unitlue opportumty to carry out this research. Most of all, 1 would like to thanIe Sam for his gUIdance, many helpful discussions and suggestions, encouragement and patlence throughout the course of ù1is research and beyond.
The unselfish suppon and understanding throughout the pursult of my educational goals from my parents, Anna and Luigi; the etemal patience and encouragement from my husband, Roben; and suppon from my brother, Peter, have made this all possible.
Finally, 1 would like to thank the department of chemlstry at McGill Umversity for demonstrator assistantships, Natural Science and Engineenng Researeh Counell of Canada and Merck Frosst Centre for Therapeune Research for financlal suppon throughout the course of this work.

- ii -
Table of Contents
Aeknowledgements . . . . . . . . . . . . . . . . . . . . . . . . .... . - i -Table of Contents. . . . . . . . . . . . . . . . . . . . . . . . . ... . - ü -List of Figures. . . . . . . . . . . . . . . . . . . . . . . . . . . . . . - vi -List of Tables . . . . . . . . . . . . . . . . . . . . . . . . . . . . . - xiii -
Chapter 1
Supercritical Mobile Pbases in Chromatographie Separations - 1 -
1.1 1.2 1.3 1.4
I.S
Chapter 2
Introduction ............................. ...... . Dense gas ehromatc~.~aphy . . . . . . . . . . . . . . . . . . . ...... . Recent developments in supereritical fluid ehromatography .. Retention processes in binary mobile phases and electrochemical detection in supercritica1 fluid chromatography. . .............................. . References . . . . . . . . . . . . . . . . . . . . . . . . . . . . . . . ..... .
Instrumental Aspects of Supercritical Fluid Chromatography
- 1 -- 2 -- 7 -
- 13 -- 16 -
and Experimental Procedures. . . . . . . . . . . . . . . . . . . . . .. - 18 -
2.1 Instrumental considerations ...... . . . . . . . . . . . . . .... . 2.1.1 Solvent Delivery ...................... . 2.1.2 Sample Introduction ................... . 2.1.3 Column technology . . . . . . . . . . .......... . 2.1.4 Restnctors .......................... . 2.1.5 Mobile Phases ....................... . 2J .• 6 Programnung Methods ....... .......... . 2.1.7 Mobile phase modifiers ................. . 2.1.8 Detecoon Strategies .............. , .... .
2.2 Experimental procedures . . . . . . . . . . . . . . . .......... . 2.2.1 Instrumental ......................... . 2.2.2 The role of modifiers in chromatographie
separations .......................... . 2.2.2.1 Chromatographie system ........... .
- 18 -- 18 -- 18 -- 20 -. 21 -- 23 -- 24 -- 24 -- 25 -- 25 -- 25 .
- 26 -- 26 -

- III -
2.2.2.2 Chemicals ...................... - 26 -2.2.2.3 Technique to modify supercritical mobile
phases . . . . . . . . . . . . . . . . . . . . . . . .. - 27 -2.2.2.4 Isothermal srudies . . . . . . . . . . . . . . . .. - 27 -2.2.2.5 Isodense srudies ................ . - 27 -
2.2.3 Analysis of phenotbiazinones in plasma by packed column SFC. . . . . . . . . . . . . . . . . . .. - 29 -
2.2.3.1 Chromatographlc system . . . . . . . . . . .. - 29 -2.2.3.2 Chenncals ..... . . . . . . . . . . . . . . . .. - 29 -2.2.3.3 Calibration curve ................. - 29 -2.2.3.4 Preparation of dosing solution ........ - 30 -2.2.3.5 Dosing regime . . . . . . . . . . . . . . . . . .. - 30 -2.2.3.6 Plasma samples .................. - 30 -2.2.3.7 Cyclic voltammetry of phenothiazinones - 30 -
2.2.4 An electrochemical detection system for SFC. - 31 -2.2.4.1 Chemicals ...................... - 31 -2.2.4.2 Electrochemical Cell . . . . . . . . . . . . . .. - 31 -
2.2.5 Determination of sorbitan trioleate in metered-dose inbalers by SFC .................. . - 33 -
2.2.5.1 Chromatographic system ........... . - 33 -2.2.5.2 Sample preparation ............... . - 33 -
2.3 References . . . . . . . . . . . . . . . . . . . . . . . . . . . . . . . . - 34 -
Cbapter 3
The Role of Moditiers in Chromatographie Separations - 35 -
3.1 3.2 3.3
Introduction .................................. . Experimental . . . . . . . . . . . . . . . . . . . . . . . . . . . . . . . . . . . ResuUs and Discussion . . . . . . . . . . . . . . . . . . . . . . . . . . . . 3.3.1 Chromatographie parameters ............. . 3.3.2 Isothermal and isodense studies ....... .... .
3.3.2.1 Supercntical carbon dioxide moblle phase 3.3.2.2 Critical parameters in binary and teroary
3.3.2.3 3.3.2.4
3.3.2.5
mobile phases .. . . . . . . . . . . . . . . . Formic aCld modified carbon dioxlde ... Dlchloromethane/formlc aCld modIfied carbon dioxide .., . . .. ..... . Acetomtnle modIfied carbon dloxlde .. .
- 35 -- 37 -- 37 -- 37 -- 39 -- 39 -
- 42 -- 48 -
- 58 -- 58 -

r
3.4 3.5
Cbapter 4
- iv -
3.3.3 Modifier effects. . . . . . . . . . . . . . . . . . . . . . . . 3.3.3.1 Effects on retention rimes .......... . .3.3.3.2 Effects on enthalpy of transfer between
mobile and stationary phases ........ . Conclusion . . . . . . . . . . . . . . . . . . . . . . .............. . References . . . . . . . . . . . . . . . . . . . . . . .............. .
- 60-- 60-
- 72 -- 82 -- 83 -
Analysis of Phenotbiazinones in Plasma by Packed Column SFC .. - 84 -
4.1 4.2 4.3
4.4 4.5
Cbapter 5
Introduction .................................. . Experimental conditions . . . . . . . . . . . . . . . . . . . . . . . . . . . Results and Discussion . . . . . . . . . . . . . . . . . . . . . . . . . . . . 4,,3.1 Retention behaviour in supercritical carbon
dioxide. . .......................... . 4.3.2 Effa:t of modifiers on retenrion characteristics. . 4.3.3 Separation of phenothiazinone analogs. ...... . 4.3.4 Assay for L615,919 in plasma ............ . 4.3.5 Electrochemical investigation ........... . Conclusions .................................. . References . . . . . . . . . . . . . . . . . . . . . . . . . . . . . . . . . . ..
- 84 -- 87 -- 87 -
- 87 -- 90-- 93 -
- 102 -- 109-- 109-- 114 -
An Electrocbemical Detection System for Supercritical Fluid Chromatography . . . . . . . . . . . . . . . . . . . . . . . . . . . . . . . . . . .. - 115 -
5.1 Introôl'ction ................................. . - 115 -5.1.1 DiffUSIOn eharaeteristics ................ . - 117 -
5.1.2 5.1.3 5.1.4 5.1.5 5.1.6
5.1.1.1 Diffusion to a spherical electrode. . .. . - 120 -5.1.1.2 Shape of voltammogram at a spherical
5.1.1.3 5.1.1.4
eleetrode ...................... . - 123 -Diffusion to a dise eleetrode. . ...... . - 125 -Shape of voltammogram at a dise electrode - 128 -
Ohmic drop at ultramicroelectrodes. ........ - 129 -Cell time constant. .................... - 131 -Capacitative cunent at ultranneroeleetrodes ... - 133 -Small size advantage of ultrarrucroelectrodes " - 134-Steady state eurrent response ............ " - 135 -

. -,
5.2 5.3
5.4 5.5
Cbapter 6
5.1.7 5.1.8
- v -
Ultranucroelectrodes in hydrodynamic systems. Electrochemical measurements in supercritical fluids ............................. .
Experimental . . . . . . . . . . . . . . . . . . . . . . . . . . . . ..... . Re~ults and Discussion . . . . . . . . . . . . . . . . . . . . . . . . . . . 5.3.1 High pressure conditions. . . . . . . . . . . ..... . 5.3.2 Flow rate dependency .................. . 5.3.3 Design of electrochemical cell. . . . . . . ..... . 5.3.4 Characterization of electrochemical celi. .... . 5.3.5 Hydrodynamic performance of cell. ... .... . Conclusion . . . . . . . . . . . . . . . . . . . . . . . . . . . . . . ..... . References . . . . . . . . . . . . . . . . . . . . . . . . . . . . . . ..... .
Determination of Sorbitan Trioleate in Metered-dose Inhalers
- 136 -
- 137 -- 137 -- 138 -- 138 -- 138 -- 138 -- 139 -- 141 -- 149 -- 150 -
by Supercritical Fluid Chromatography ................... - 153 -
6.1 6.2 6.3
6.4 6.5
Introduction ................................. . Experimental . . . . . . . . . . . . . . . . . . . . . . . . . . . . . .... . Results and Discussion . . . . . . . . . . . . . . . . . . . . . . . . . . . 6.3.1 Restrictor placement ....................... . 6.3.2 Chromatographie separation .............. . . . . . 6.3.3 Concentration of SPAN 85 in each fonnulation .... . Conclusion . . . . . . . . . . . . . . . . . . . . . . . . . . . . . . . . ... . References . . . . . . . . . . . . . . . . . . . . . . . . . . . . . . . . . . . .
Contributions to Original Knowledge .................. . Appendix A. . . . . . . . . . . . . . . . . . . . . . . .. . .. . .. Appendix B ............................... .
- 153 -- 157 -- 157 -- 157 -- 161 -- 161 -- 164 -- 168 -
- 169 -- 170 -- 177 -

Chapter 1
Figure 1.1
Figure 1.2
Chapter 2
Figure 2.1
Figure 2.2
Figure 2.3
Figure 2.4
Chapter 3
Figure 3.1
Figure 3.2
Figure 3.3
Figure 3.4
- vi -
List of Figures
Phase diagram for carbon dioxide. . . . . . . . . . . . . . . . . . . . . .. - 2 -
Pressure-density isotherms for carbon dioxide. Figure reproduced from reference 9. . . . . . . . . . . . . . . . . . . . . . . . . . . . . . . . . .. - 5 -
Schematic of supercritical fluid chromatograph. ........... - 19 -
Restrictor models for SFC. See text for description. ........ - 22 -
Apparatus for the addition of organic solvents to supercritical fluids. ........................................ - 28 -
High pressure electrochemical cell. .................... - 32 -
Peak width (a) and capacity ratio (b) as a function of temperature at constant density (0.7 glml). Mobile phase: supercritical carbon dioxide. ... . . . . . . . . . . . . . . . . . . . . .. - 40 -
In(k') (a) and efficiency (b) as a function of temperature at a constant of 0.7 g/ml. Mobile phase: supercritical carbon dioxide. - 41 -
Selectivity (a) and resoluùon (b) as a function of temperature at a constant density of 0.7 g/ml. Mobile phase: supercritical carbon dioxide. . . . . . . . . . . . . . . . . . . . . . . . . . . . . . . . . .. - 43 -
Peak width (a) and capacity ratio (b) as a function of density at constant temperature (600C). Mobile phase: supercritical carbon dioxide. ....................................... - 44 -

Figure 3.5
Figure 3.6
- vü -
Selectivity (a) and resolution (b) as a function of density at constant temperature (6O"C). Mobile phh"e: supercritical carbon dioxide. ....................................... - 45 -
Chromatograms of model compounds at (.. ~nstant temperature (7CJ'C) for various densities. Supercritical carbon dioxide mobile phase. .. t • • • • • • • • • • • • • • • • • • • • • • • • • • • • • • • • • • • •• - 46 ..
Figure 3.7 Peak widths (a) and capacity ratios (b) as a function of temperature at constant density (0.7g/ml). Mobile phase: fonnic acid (0.25 mole%) in carbon dioxide. .................. - 50 -
Figure 3.8 Selectivity (a) and Resolution (b) plotted against temperature at constant density (0.7 g/ml). Mobile phase: formic acid (0.25 mole%) in carbon dioxide. .. . . . . . . . . . . . . . . . . . . . . . . . . - 51 -
Figure 3.9 Peak widths (a) and capacity ratios (b) plotted against density at constant temperature (6O"C). Mobile phase: formk liCld (0.25 mole%) in carbon dioxide. .. . . . . . . . . . . . . . . . . . . . . . . . . - 52 -
Figure 3.10 ln(k') (a) and efficiency (b) as a function of density at constant temperature (60°C). . . . . . . . . . . . . . . . . . . . . . . . . . . . . . .. - 53 -
Figure 3.11 Selectivity (a) and resolution (b) as a function of density at 6Q°C. . . . . . . . . . . . . . . . . . . . . . . . . . . . . . . . . . . . . . . . .. - 54 -
Figure 3.12 Capacity ratio (a) and efficiency (b) as a function of temperature at constant density (0.7 g/ml). Mobile phase: fOrmlc aCld (1.26 mole%) in carbon dioxide. .... . . . . . . . . . . . . . . . . . . . . . . . . . . . . .. - 55 -
Figure 3.13 Selectivity (a) and resolution (b) as a function of ternperature al constant density (0.7 g/ml). Mobile phase: formic aCld (1.26 mole%) in carbon dioXlde. .. . . . . . . . . . . . . . . . . . . . . . . .. - 56 -
Figure 3.14 Peak widths (a) and capacity ratios (b) as a funcuon of density at constant temperature (6O"C). Mobile phase: formic acid (1.26 mole%) in carbon dioxide. .... . . . . . . . . . . . . . . . . . . . . . . . . . . . . .. - 57 -
Figure 3.15 Selectivity (a) and resolution (b) as a function of density at constant temperature (&C). Mobile phase: formlc acid (1.26 mole%) in carbon dioxide. .. . . . . . . . . . . . . . . . . . . . . . . .. - 59 -

- Vlll -
Figure 3.16 k' as a function of density at constant temperatul:'e (60"C) and k' as a fonction of temperature at constant density (0.7g/ml) Mobile phase: 0.87 mole% dichloromethane/0.16 mole% fonnie acidlcarbon dioxide. - 61 -
Figure 3.17 Selectivity (a) and resolution (b) as a function of density at constant temperature (6O"C). Mobile phase: 0.87 mole % dichloromethane/0.16 mole% fonnie acidlcarbon dioxide. - 62 -
Figure 3.18 Peak widths (a) and capacity ratios (b) plotted against temperature at constant density (0.7 g/ml). Mobile phase: 0.8 mole% acetonitrile in carbon dioxide. .................. - 63 -
Figure 3.19 Selectivity (a) and resolution (b) as a function of temperature at constant density (0.7 g/ml). Mobile phase 0.8 mole% acetonitrile in carbon dioxide. ................................ - 64 -
Figure 3.20 Peak widths (a) and capacity ratios (h) as a function of density at 6O"C. Mobile phase: 0.8 mole% acetonitrile in carbon dioxide. - 1)5 -
Figure 3.21 Selectivity (a) and resolution (b) as a function of density at constant temperature (60°C). Mobile phase: 0.8 mole% acetonitrile in carbon dioxide. ....................................... - 66 -
Figure 3.22 Plot of k' versus temperature at constant density (0.7 g/ml) (a) and versus density at constant temperature (60°C) (b) for anthraquinone in simple carbon dioxide and tirree modified CO2
phases. . . . . . . . . . . . . . . . . . . . . . . . , . . . . . . . . . . . . . . .. - 68 -
Figure 3.23 Plot of k' versus temperature at constant density (0.7 g/ml) (a) and versus density at constant temperature (60DC) (b) for anthracene in simple carbon dioxide and three modified CO2 phases. ...... - 69 -
Figure 3.24 Plot of k' versus temperature at constant density (0.7 g/ml) (a) and versus denslty at constant temperature (60DC) (b) for pyrene in simple carbon dioxide and three modified CO2 phases. .... - 70 -
Figure 3.25 Chromatograms of model compounds in three modified and simple carbon dioxide mobile phases at constant temperature (600C) and equlvalent denstties (0.7 g/ml). .. . . . . . . . . . . . . . . . . . . . .. - 71 -
Figu!'e 3.26 van't Hoff plot for anthraquinone in supercritical carbon dioxide. - 73 -
Figure 3.27 van't Hoff plot for anthraquinone in (a) 0.25 mole% and (b) 1.26 mole% formic acid in carbon dioxlde. .................. - 74 -

- ix -
Hgure ~.28 van't Hoff plot for anthraquinone in (a) 0.87 mole% CH2Cly'0.16 mole% œOJi/C02 and (b) 0.8 mole% acetonitrile in carbon dioxide. .. . . . . . . . . . . . . . . . . . . . . . . . . . . . . . . . . . . . .. - 75 -
Figure 3.29 Enthalpy as a function of density br anthraquinone for each mobile phase investigated. .......................... - 77 -
Figure 3.30 Enthalpy as a function of density for anthracene for each mobile phase investigated. .................................... - 79 -
Figure 3.31 Enthalpy as a function of density for pyrene for each mobile phase investigated. . . . . . . . . . . . . . . . . . . . . . . . . . . . . . . .. - 80 -
Figure 3.32 Enthalpy as a function of mobile phase composition at a density of 0.7
Cbapter 4
Figure 4.1
Figure 4.2
Figure 4.3
Figure 4.4
Figure 4.5
Figure 4.6
Figure 4.7
Figure 4.8
g/ml. ......................................... - 81 -
Cyc1o-oxygenase and 5-lipoxygenase pathways. ........... - 85 -
Structure of phenothiazinone compounds. . . . . . . . . . . . . . . .. - 89 -
Chromatograms of phenothiazinone analogs at 80°C and 4500 psi in supercritical carbon dioxide. ...................... - 91 -
Chromatograms of phenothiazinone analogs at 80°C and 4500 psi in supercritical carbon dioxide. . . . . . . . . . . . . . . . . . . . . . . . .. - 92 -
Capacity ratios (a) and peak: widths (b) as a function of temperature at a density of 0.7 g/ml. Mobile phase: 0.25 mole% forrnic acid. .................................... - 94 -
Capacity ratios (a) and peak: widths (b) as a function of temperature at a density of 0.9 glml. Mobile phase: 0.25 mole% fornuc acid. .. - 95 -
Comparison of three phenothiazinone analogs in (A) 0.25 mole% forrnic acid and (B) 0.87 mole% dichloromethane/0.16 mole% fonruc acid in carbon dioxide at 80°C and 0.8 g/ml. ........ - 97 -
Capacity ratios (a) and peak widths (b) as a function acetoaitrile concentration in mobile phase. Temperat1'.re: 400C. ..... . . .. - 98 -

- x -
Figure 4.9 Resolution as a function of percent modifier. Temperature: 40°C. ............................... - 99 -
Figure 4.10 Chromatograms of phenothiazinone mixture at 4ere in (a) 0.8 mole% acetonitrile and (b) 1.6 mole% acetonitrile in carbon dioxide. 1. L615,919; 2. L649,991; 3. L649,927; 4. L651,392. ........ - 100 -
Figure 4J l Capacity ratios (a) and Peak widths (b) as function of modifier (acetonitrile) concentration at 8ere. .. . . . . . . . . . . . . . . . .. - 101 -
Figure 4.12 Comparison of chromatograms for the phenothiazinone mixture at equivalent density programs and same temperature (400C) in (a) 0.8 mole% acetonitrile/carbon dioxide and (b) simple carbon dioxide. - 103 -
Figure 4.13 Chromatogram of drug (L615,919) l and internai standard (L649,927) l (a) standard solution and (b) rat plasma ...... , - 104 -
Figure 4.14 Calibration curve for study 1 for an average of 3 injections. (a) full concentration range and (b) low concentration range. . . . . . .. - 105 -
Figure 4.15 Plasma prome for one rat in study 1. . . . . . . . . . . . . . . . . .. - 106 -
Figure 4.16 Calibration curve for study 2 ....................... - 107 -
Figure 4.17 Plasma prome study 2 . . . . . . . . . . . . . . . . . . . . . . . . . . .. - 108 -
Figure 4.18 Plasma prome for three rodents in a simultaneous srudy. . . .. - 110 -
Figure 4.19 Cyclic voltammogram of (a) L615,919 and (b) L649,927 in CH3CN/0.IM TBA TFB. Pt-wire auxiliary and Ag/AgCI reference electrodes and platinum ultramicroelectrode as the working electrode. . . . . . . . . . . . . . . . . . . . . . . . . . . . . . .. - 111 -
Figure 4.20 Cyclic voltammogram of (a) L653,849 and (b) L651,392 in CH3CN/0.1M TBA TFB. Pt-wire auxiliary and Ag/AgCI reference electrodes and platinum ultramicroelectrode as the working electrode. .,. . . . . . . . . . . . . . . . . . . . . . . . . . . . . . . . . .. - 112 -
Chapter S
Figure 5.1 Semi-infinite linear diffusion at a macroelectrode ......... , - 118 -

- xi -
Figure 5.2 Peak-shaped voltammogram at a macroelectrode. - 118 -
Figure 5.3 Radial düfusion at a micmelectrode. - 119 -
Figure 5.4 Sigmoidal-shaped voltammogram at a microelectrode. ...... - 119 -
Figure 5.5 High pressure electtochemical cell. ................... - 140 -
Figure 5.6 Platinum Microelectrode. .......................... - 142 -
Figure 5.7 Cyclic voltammogram of ferrocene (5mM) in CH3CN/O.lM TBA TFB in three-electrode celI. Reference electrode: Ag/Agel.
Figure 5.8
Auxiliary electrode: platinum wire. ................... - 142 -
Cyclic voltammogram of ferrocene (5mM) in CH3CN/O.lM TBA TFB in electrochemical celI. Stainless steel quasi-reference electrode. . . . . . . . . . . . . . . . . . . . . . . . . . - 143 -
Figure 5.9 Cyclic voltammogram of ferrocene (5 mM.> in CH)CN/O.1M TBA TFB in electrochemical cell pressurized to 2000 psi with CO2• Stainless steel quasi-reference electrode. ........... - 143 -
Figure 5.10 Schematic of complete SFC/ECD system. .............. - 144 -
Figure 5.11 Response of electrochemical detector for the solvent (acetonitrile) injected on column. Applied potentia! set at 0.8 volts. Isobaric at 2200 psi and 40°C. ................. - 146 -
Figure 5.12 Response of electrochemical detector for 10 J.lg of ferrocene injected on column. Applied potential set at 0.8 volts. Isobanc at 2200 psi and 400C. .................... . . . . . . . .. - 146 -
Figure 5.13 Hydrodynamic voltammogram for ferrocene, average of three injections. . . . . . . . . . . . . . . . . . . . . . . . . . . . . . . . . . . . .. - 147 -
Chapter 6
Figure 6.1 Schematic of a metered-dose inhaler. . . . . . . . . . . . . . . . . .. - 154 -
Figure 6.2 Structure of sorbitan trioleate. . . . . . . . . . . . . . . . . . . . . . .. - 156 -
Figure 6.3 Effeet of SPAN 85 concentration on aerosol plumes. . . . . . .. - 157 -

. ,
- xii -
Figure 6.4 Schematic of flame-ionization detector.
Figure 6.5 Chromatogram of sorbitan trioleate standard (3.2 j.1g). Column: 2.1xl00 mm ons (5 j.1m). Mobile phase: supercritical COz.
- 159 -
Isobaric at 2400 psi, 40°C. . . . . . . . . . . . . . . . . . . . . . . . . . - 162 -
Figure 6.6 Calibration curve for sorbitan trioleate with pyrene as the internai standard. . . . . . . . . . . . . . . . . . . . . . . . . . . . . . . . . - 163 -
Figure 6.7 Chromatogram of Medihaler ISO® sample (0.95 j.1g). See Figure 6.6 for chromatographie conditions. .................. - 165 -
Figure 6.8 Chromatogram of Medihaler EPI® sample (1.5 j.1g). See Figure 6.6 for chromatographie conditions. ....................... - 165 -
Figure 6.9 Chromatogram of Duo-Medihaler® sample (3.1 j.1g). See Figure 6.6 for chromatographie conditions. . . . . . . . . . . . . . . . . . .. ~ 166 -
Figure 6.10 Chromatogram of Alupent® sample (2.0 j.1g). See Figure 6.6 for chromatographie conditions. ....... . . . . . . . . . . . . . . . . . - 166 -
Figure 6.11 Chromatogram of in-house formulation (0.40 j.1g). Se~ Figure 6.6 for chromatographie conditions. ..................... - 167 -

- xili -
List of T'ibles
Chapter 2
Table 2.1 Physical Properties of Certain Supercritical Fluids . . . . . . . . .. - 23 -
Chapter3
Table 3.1 Linear regression of van't Hoff plots . . . . . . . . . . . . .. - 76 -
Chapter 5
Table 5.l Microelectrode Geometries . . . . . . . . . . . . . . . . . . . . . . . .. - 116 -
Chapter 6
Table 6.1 Effect of Restrictor Position - 160 -
Table 6.2 SP AN 85 in Drug Products. - 164 -

"
Chapter 1
Supereritical Mobile Phases in Chromatographie Separations
1.1 Introduction
Supercritical fluid chromatography (SFC) has recently received increased
anention as a complimentary technique to both high performance liquid
chromatography (HPLC) and gas chromatography (GC). Supercritical fluid
chromatography is essentially modified gas chrornatography, where the mobile phase is
a highly compressed gas operated at or above its critical temperature and pressure,
where it eXIsts as a supercritical fluid. The intrinsic properties of supercritical fluids
offer unique chromatographie advantages for the separauon and detection of a wide
range of compounds. Above the critical 'emperature, the vapour and liquid have the
same denslty and the fluid c'annot be liquified by mcreasing the pressure. A
supercritical fluid is obtained from a liquid by increasing the temperature at constant
pressure (greater than the cntical pressure) or from agas by increasing the pressure at
constant temperature (greater than the critical temperature). The phase diagram for
carbon dioxide (Figure 1.1) depicts the critical region as a shaded area wlth dashed
lines as the boundary since no phase change occurs. In the supercntical state the
physical properties of the flmd are in:ennediate between those of liqmds and gases at
ambient condiuons. SpecIfically, the densIty of a supercritical fluid approaches that of
a liquid, whIle its viscosity IS comparable to that of a gas. The density of a
supercritical fluid, which can be easIly controlled by a change In pressure, influences
the solubllity and chromatographie retenUon of solutes. The low vlscosity of a
supercntical fluid leads to lower pressure drops across a chromatographie column for a
- 1 -

UJ 0: ::J U) U)
UJ ~ 73.0
5.2
Figure 1.1
- 2 -
uaUID
SOUD
TEMPERATURE (OC)
Phase diagram for carbon dioxide.
given flow rate. Low pressure drops result in more theoretical plates per metre and
improved efficiency. The diffusivity in a supercritical fluid is between that of a liqUld
and agas. Higher solute diffusion coefficients 10 supercritical fluids, as compared to
liquids, produce higher efficlencles for SFC systems than comparable HPLC system
[1]. Supercritical fluids can dissolve a variety of solutes, mcluding hlgh molecular
weight and non-volatile compounds and have unique chemIcal and phYSICal propemes
which make them useful as chromatographIc mobile phases.
1.2 Dense gas chromatography
Supercritical fluid technology can be traced back to 1822 when the cntlcal
phenomenon was first observed [2]. Baron Cagmurd de la Tour descnbed the
disappearance of the vapour-llquid interface when pressunzmg cenam hqUlds and
recorded values for the critical temperature and pressure for the se solvents. Hannay
and Hoganh [3] studied the solvent propernes of carbomc aCld 10 HS cnncal state.

They reasoned that in going from the liqUld state to the critical state, a solution of
solvent and nonvolatile solid wou Id precipitate the solid, since the ability to dissolve
solids is a propeny of liquids, not gases. Experiments with various solvents and solids
indicated that solids were soluble in gases under high pressure and there is no
d.1scontinuity in passing from the liqUld to the gaseous (critical) state. Measurements
of critical parameters of severa! fluids compared well with those recorded by Baron
Cagnaird de la Tour. Further investigations showed that the critical point of the fluid
is nused by the presence of a small quantity of dissolved salt [4]. The solvating
ability of supercritical fluids is due to 'mo~ecular closeness' achieved by the high
pressure as opposed to 'internal attraction' as in liquids [3].
In 1958, Lovelock [5] proposed the use of solvents in their cntical state as the
chromatographic mobile phases in order to extend the scope of gas chromatography to
include ionic compounds which are otherwise non volatile. However, it was Klesper.
Corwin and Turner [6] who first put "dense gas" chromatography to practice in 1962.
Halogenated methanes (freons) were used as mobile phases for the elution of pjckel
porphyrin isomers. The authors suggested that the increased mobility observed with
increasing mobile phase pressure should pennit the analysis of high rnoleculaI' weight
compounds at lower temperatures.
Giddings [7,8] developed a theoretical basis for the effect of pressure
increase in gas chromatography. At very high pressures, gas and liquid
chromaîOgraphy converge and the intermolecular forces become large enough to
induce migration of nonvolanle analytes. There is no theoretical lirmt to the size of
analytes that wIll migrate since, above the critical point. compression of the fluid can
yleld any desrred density. The author also mathemancally described the phenomena of
differennal eqUllibnum Shlfts at high pressures. With increasmg pressure, the
illtermolecular distances decrease to reduce the volume, whIle the molecular volumes
tend to mcrease. This can result 10 eqUllibnum shifts depending upon the nature of
the solute mobile phase mteracnons and upon changes 10 the stationary phase structure
induced by the mcreased pressure. Since the solvent power of the mobIle phase is a
function of pressure lt cao be qUlckly and precisely vaned throughout a

- 4 -
chromatographie run by mechanical means. The relatively low viscosity and high
diffusivity of dense gases theoretically leads to enhanced speeds of separation.
Giddings also suggested that the solvent power of a dense gas depends on both its
'physical effect', as described by its pressure and temperature, and its 'chemical effect'
described by ilS polarity, acid-base properties and hydrogen-bonding abilities. In a
subsequent p&per [9] the authors developed mathemattcal equauons using the
Hildebrand solubility parameter to describe the magnitude of the solubility of solutes
in compressed gases from gas to liquid densities.
= = =
=
Hildebrand solubility parame ter critical pressure reduced critical density reduced density of corresponding liquid
(1.1)
The physical effect is given by the (p.JpJtÙ while the chemical effeet is
described by 1.25 Pcl/2
• To a first approximation, an eluIDipic series May be prepared
by including only the chemical effect term. As solute moleeules become larger and
more complex, the magnitude of Ô must increase as the volatility of the solute
decreases.
Sie et al. [10,11] described a theoretical basis for the sigmficance of
intermolecular forces between mobile phase molecules and solute Molecules. FlU1d
liquid (FLC) [12] and fluid-solid (FSC) [13] chromatography were compared to
gas-liquid (GLe), liquid-liquid (LLC), and liqUld-solid (LSC) chromatography. At the
high pressures, solute volatility increases with decreased temperature due to the
increased imermolecular interacttons at the greater denslty accompanymg the lower
temperatures. The enhancement of volatility IS more pronounced for heaVler
substances, consequently the separation of memben, of a series IS more dlfficult at
higher pressures. Selectivity between low and hlgh mQlecular welght compoUllùs
dominate at low pressures and elunon order is as ln GLC. At hlgher pressures,

" ,
Figure 1.2
- 5 -
Pressme-density isotherms for carbon dioxide. Figure reproduced from reference 9.
selectivity according to type predominates and elution is as would be for LLC.
Temperature change near me critical point has t.he greatest effeet, where a small
change in temperature results in a large change in fluid density [Figure 1.2J. In FLC
the phase of the same or different polarity can be combined unlike in GLC where the
stanonary phases are limited by therr thermal stability and in LLC where the two
phases must be inumscible. With a polar stanonary liquid on a non-polar mobile fluid
the effects of volatility and polarity tend to cancel each other and conditions are
favourable for the separation of different compound types. When both the stationary
liquid and the mobile pr!\Se are polar. the effects of solute volatility and polarity
reinforce each other such mat a senes of analogs can be separated. Wim a
supe.1 ntical mobile pha~. as compared to a gaseous mobile phase. there is an
increased solubility of the analyte molecules 10 the mobile phase and retention on the
stationary phase is reduced because of the competition between analyte molecules and
mobile phase molecules for acnve SIteS on the sùica suppon.
Jentoft and Gouw [14] i01roduced programming techniques for the separation
of matenals Wlth a large range of molecular weights. An increasing pressure program

- 6 -
results in lower k' values of solutes, making it ideally SUlted for the analysis of
mixtures with wiele molecular weight ranges. Temperature programming is used in a
limited number of applications in SFC since capacity ratio (k') values of a solute can
increase, decrease or remain constant with increasing temperature.
Use of supercritical mobile phases with low critical temperatures, such as
carbon dioxide, have Many advantages. Jentoft and Gouw [15] proposed that the
lower operating temperanrres permit (i) the analysis of thermally labile compounds, (ii)
the use of a stationary phase of limited thermal stability, and (iii) the posslbility of
simple solvent elimination from collected samples. These aUthors also presented the
flfSt paper on the separation of polyaromatic hydrocarbons (P AH) from automobile
exhaust by SFC with a supercritical carbon dioxide mobile phase [161. U sing a
pol ymer chemically bonded to porous microbeads as the stanonary phase In a packed
column, the PAH's were separated according to ring type. An octadecyl phase bonded
to porous silica particles separated the PAR's according to molecular welght.
Novotny et al. [17] studied the effects of temperature and pressure in SFC on
model compounds in the vicinity of the critical point. A gradual decrease in k' with
increasing pressure was obtained at various temperatures. Plots of k' as a function of
temperature show a m"ximum, the value of which is dependent on the mobile phase.
A change in stationary phase results in a change in the absolute values of the k' but
t.he shape of the k' versus temperarure curves remain the same. k' values of solutes
can also be decreased by the addition of a second component (modifier) ta the mobile
phase. The authors speculated that both pressure and inverse temperature
programming might be useful in SFC.
Klesper and Hartmann [181 reported a systemattc study of the mfluence of
operating temperature, rate 'Jf linear pressure programnung and mobIle phase
composition on the separa non of polystyrene oligomers. Better resolution was
observed for slower pressure programs, higher lsothennal operatmg temperatures and
the addition of a methanol modifier to the supercritical n-pentane mobIle phase. The
authors were the tïrst to suggest that the methanol mlght be covenng up actIve snes on
the silica suppon in the Porasil A packed column.

'"
- 7 -
1.3 Recent developments in supercritical nuid chromatography
Although the future of SFC seemed promising, the rnpid development of HPLC
during the same period overshadowed that of SFC. The lack of commercial SFC
instrumentation and prnctical problems encountered with using supercritical fluids also
contributed to the slow growth of the technique. Renewed interest in supercritical
fluid chromatography occurred in the early 1980's. This was in pan a result of: (i) the
introduction of capillary SFC in 1981; (li) commercial availability of packed-column
mstrumentation in 1982 and, (iii) the introduction of capillary instrumentation in
1985.
Novotny et al. [19] examined t.he potential advantages of capillary SFC over
both capillary GC and capillary Le. Capillary GC is restricted by the volatility and
thermal stability of the solutes. The lower diffusion coefficients in liquids as
compared to gases require very small diameter columns (10-30 microns) in capillary
LC, placing strict requirements on the instrumentation. Solute diffusion coefficients
are at least an order of magnitude greater in supercritical fluids than in liquids,
therefore larger diameter columns (50-100 microns) can be used. Much lower pressure
drops occur over capillary columns as compared to packed columns in SFC, thus
reducing negative density gradients along the length of the column. The authors later
descnbed the instrumentation needed for open-tubular SFC with particular emphasis on
sample introduction and detection systems [20]. Methods and principles of SFC
were later published by Peaden and Lee [21], where the imponance of mobile pha:;e
density on solute retenUon as opposed to pressure was discussed. An equation was
presente<! pred.icting that the log k' versus log of fluid density for a solute should be
linear.
During the same period an instrument company introduced a commercial
packed-column SFC system [22] and Gere et al. [23] discllssed the merits of
small partiele diameter COlUI'1.1S packed with 3, 5 and 10 micron panleles, coated with
an octadecylsilane layer. Although sorne workers believed the small particles wOllld
have deletenous effects on the pressure drop along the column, pressure differences
between the column mlet and outlet of 25% caused no observable changes in

t
l.
- 8 -
chromatographie perfonnance. Essentially the theoretical plate hcight improved with
smaller diameter particle packings. Resolution per unit time was 5-10 rimes better in
SFC than in HPLC with the same columns. Gere [24] first reported on the need of
modifiers in supercritical mobile phases to elute some polar solutes. Log k' of various
phthalates were measured as a function of weight percent of various modifiers
(hexane, TIIF, iso-propanol and methanol) in supercritical carbon dioxide. The effect
of each modifier was found to depend on its ability to fonn hydrogen bonds. The
rapid development of SFC from 1981 to the present has produced a growing body
of work on many aspects of the technique both from a theoretical standpoint and
instrumental point of view. Early instrumentation for packed column SFC proVlded
ooly one mode of operation, ignoring the advantages gained by pressure or density
programming. These instruments were also unable to interface with ionization
detectors. Consequently for the f1l'st half oÎ 1980's more work was carried out with
capillary SFC.
The technique of capillary SFC is highly suited to the analysis of complex
mixtures, since the increased permeability of capillary columns over packed columns
leads to high separation efficiencies. Density programming in SFC is most effecnve at
pressures near the, critical pressure since small changes ln pressure result In large
density changes. Large pressure drops along the length of the colurnn which may
result in a rapid 10ss of resolution during the denslty programmmg are not encountered
with capillary columns [25]. Many different programnung techmques have been
used including lincar pressure, linear denslty and asymptonc denslty [26]. Since
most solvent delivery systems provlde for pressure control, densIty programming IS
achieved by the use of algorithms to conven density into pressure.
Although the development of instrumentation was lmportant. growth of SFC as
an analytical technique was due mainly to a better understanding of retentIon processes
through the development of thermodynamic models. Solute retentlon as a functIon of
pressure or density at constant temperature was frrst descnbed by van Wasen and
Schneider [27] and is given by,

( âlnJcl) _ âP T
where k' = R = p = T = v m.-
1 = v·· ..
1 = K =
- 9 -
[v~·· - vtl RT
- K
eapaeity ratio gas constant pressure temperature
(1.2)
solute partial molar volume in the mobile phase at infinite dilution solute partial molar volume in the stationary phase at infinite dilution isothermal compressibility of fluid solution (IN[êN/dP])
The partial molar volume of the solute in the mobile phase at infinite dilution
is a measure of the solvent-solute interactions and can be expressed as follows [28],
where =
=
(1.3)
isothermal compressibility of the pure solvent molar volume of pure solvent
Combining equations 1.2 and 1.3 yields an expression for the slope of solute
retention as a funetion of pressure at constant temperature;
(alnlc') _ ap T
(1.4)
RT - K

- 10 -
The solute retention dependence on density at constant temperature is given by,
where (ê)P/àph =
(1.5)
the slope of pressure versus density as described by an equation of state
The Peng-Robinson equation of state [29], a relatively simple two parameter
cubic equation, can be used to evaluate (i) the partial molar volume of solute in the
mobile phase; (ü) the isothennal compressibility of the fluid solution and the pure
solvent; and (üi) the pressure relationship on density at constant pressure. The Peng
Robinson equation of state has the following fonn,
P -where V
a,b
KI' V-b
= =
V(V+b) + b(V-b)
molar volume (M/p) constants
(1.6)
The pressure is expressed as a function of the molar volume and two constants
(a) which is a measure of the intermolecular attraction force, and Ch) which is related
to the size of the (spherical) molecules.
RT b - b(Tc ) - 0.0778O-c
Pc
(1.7)
(1.8)

- 11 -
The tenn a(Tr.m) is a function of the reduced temperature and the acentric factor (Cil);
at the critical point it equals unity.
(1.9)
le is a constant characteristic of the solvent and is related to the acentric factor of the
solvent, by the foUowing equation,
le - 0.37464 + 1.54226 Ca) - 0.26992 (,,)2 (1.10)
AlI the terms of equations 1.4 and 1.5, except for the partial molar volume of
the solute in the stationary phase (which can be estimated), can he evaluated as a
function of pressure or density at constant temperature.
If infinite dilution during retention in SFC is assumed, the solute distribution
coefficient (KD) can he related to the Gibbs free energy of solute transfer from the
mobile phase to the statlonary phase by [30],
I1G - -RT lnKD (1.11)
The thennodynamic relationship between the solute distribution coefficient and
the temperature is
where ~ =
~S =
I1H lU
I1S + -
R (1.12)
change in enthalpy of solute transfer between the mobile and stationary phases change in entropy of solute transfer between the mobile and stationary phases

- 12-
The solute distribution coefficient is related to the solute retention by the
following,
KD C, , VIII
k'~ (1.13) - - - k- -CIII V"
where C. = solute concentration in stationary phase
Cm = solute concentration in mobile phase Vm = volume of mobile phase V. = volume of stationary phase cp = phase ratio
Substituting equation 1.13 into equation 1.12 gives an expression for the
capacity ratio in terms of entropy and enthalpy,
lnk' -/lH RT
+ 4S _ Incl» R
(1.14)
The slope of a plot of lnk' against the inverse of temperature at constant
pressure is,
(àlnk') _ àT-1
P
-AH R
(1.15)
While the slope of lnk' versus Tl at constant density is calculated as follows.
( alnk') (alnk') (ap) (àlnle') àT-1 p - ---ap- T aT- l p + àT-1 P
(1.16)

- 13 -
The effective enmalpy of solute transfer (MiT) between me mobile phase and
the stationary phase can be detennined at constant density;
where 8 =
(1.17)
correction term containing a thermal expansivity term and (àlnk'/àPh(àlnk'/àT1)p
In high pressure liquid chromatography, where pressure has a negligible effect
on solvent density, and in gas chromatography, where the pressure is held constant, 8
IS zero.
The effective enthalpy of solute transfer in SFC is obtained by detennining
solute retention as a function of temperature al various densities. A plot of MIT as a
function of density for different stanonary phases gives an indication of me solute
stationary phase interactions. A linear dependence, where the greatest solvation occurs
at higher density (less negative MiT values), is indicative of a partition-like
mechanism. An asymptotic curvature at higher densities is attributed to solvation or
swelling of the bonded phase particulariy for capillary columns.
The equanons developed above by Yonker and Smith [31] pro vide a simple
thennodynamtc model permitting the study of the effects of macroscopic
thennodynamic parameters and therr roie in retention. The thennodynamic studies of
retention as a function ('f temperature at constant density provides a method to study
SFC retention from gas-lilce to hquid-like densities, pennitting comparison with GC
and HPLC, respectively.
1.4 Retention processes in binary mobile phases and electrochemical detection
in supercritical tluid chromatography.
The acceptance of SFC as an alternate analytical technique to GC and HPLC
lies in understanding the effects of the many variables that can be controlled and the

- 14 -
development of applications that are unique to this technique. As mdicated by the
increasing number of publications and conference proceedings [32], supercritical
fluid chromatography shows great potential as a separatIon technique. However. this
potentia! will only be realized through the funher development of fundarnental
theoretical approaches and the application of SFC to problems of analytIeal
importance. This work has concentrated on two main aspects of SFC: (i) the study of
retention processes with binary and tertiary mobile phases and (ii) the development of
an electrochenùr.al detection (ECD) system.
The solvating power of common supercntical mobile phases can be
continuously varied and controlled by density programming. This approaeh has
obvious limitations and appropriate solvent strengths which provide reasonable
separations are not always available from a homogeneous mobile phase. The addition
of small quantities of organic solvents to the supercritical flUld alters retenùon
behaviour for many compounds. At the time this work was staned, the exact role of
modifiers in the chromatographie process was unknown and therefore the first
experiments were designed to identify the role of modifiers and their effect on the
separation process (Chapter 3). The infonnation gained from the se studies was used to
develop methodology for the separation and detection of a senes of phenothiazmone
analogs and an assay method for one of the analogs in plasma (Chapter 4).
An important advantage of SFC lies In the analysls of eompounds not
amenable to either GC or HPLC. The liquld-like solvaung abllities of supereriticai
fluids and the simple task of interfacing with GC-llke detectIon ~ystems makes Il
highly suited for the analysis of therrnally labile, hlgh molecular welght compounds.
In chapter 6, the ana1ysls of sorbitan trioleate, a hlgh molecular welght :mrfactant,
demonstrates a umque applicatIon of SFC that IS not possible by other
chromatographic techniques.
A second aspect of thiS work was to detenmne the feasibility of
electrochemical detecnon for SFC. Electrochemical detect!on systems for HPLC have
become a valuable tool for trace orgalllc analysls, mamly due ta thelr ,>electivity and
high sensitivlty. Electrochenucal measurements In supercntlcal flUlds have the

- 15 -
potential for improving these detection limits since diffusion coefficients are an order
of magnitude greater then those found in liquids. A two-electrode amperometric
detection system using a platinum ultramicroelectrode was designed and bullt and
factors influencing its performance discussed in Chapter 5.

- 16-
1.5 References
1. D.R. Gere, Hewlett-Packard Publication No. 43-5953-1695 (1983) 1.
2. Cagnaird de la Tour, Baron, Ann. Chim. Phys., 21 (1822) E7.
3. J. B. Hannay and l Hogarth, Proe. R. Soc. London, 30 (1880) 178.
4. J.P. Hannay, Proc. R. Soc. London, 30 (1880) 178.
5. J.E. Lovelock, Critieal State Chromatography, notarized documen4 State of Connecticut, County of New Haven, Mary G. DeCosta (notary), Detober 23, 1958, witnessed by: S.R. Lipsky and R. Landowne.
6. E. Klesper, A.H. COrwIn and D.A. Turner, J. Org. Chem., 27 (1962) 700.
7. lC. Giddings, Sep. Sei., 1 (1966) 73.
8. J.C. Giddings, W.A. Manwaring and M.N. Myers, Science, 154 (1966) 146.
9. J.C. Giddings, M.N. Myers and J.W. King, J. Chromacogr. SCl., 7 (1969) 276.
10. S.T. Sie, W. van Beersum and G.W.A. Rijnders, Sep. Sei., 1 (1966) 459.
11. S.T. Sie and G.W.A. Rijnders, Sep. Sei., 2 (1967) 699.
12. S.T. Sie and G.W.A. Rijnders, Sep. Sei., 2 (1967) 729.
13. S.T. Sie and G.W.A. Rijnders, Sep. Sei., 2 (1967) 755.
14. R.E. Jentoft and T.H. Gouw, 1. Chromarogr. Sei .• 8 (1970) 138.
15. R.E. Jentoft and T.H. Gouw, Anal. Chem., 44 (1972) 681.
16. R.E. Jentoft and T.H. Gouw, Anal. Cherr., 48 (1976) 2196.
17. M. Novotny, W. Bertseh and A. Zlatkis, J. Chromatogr., 61 (1971) 17.
18. E. Klesper and W. Hartmann, J. Polym. SCI. Po/ym. Let. Ed., 15 (1977) 707.
19. M. Novotny, S.R. Springston, P.A. Peaden, J.C. Fjeldsted and M.L. Lee, Anal. Chem., 53 (1981) 407.
20. P.A. Peaden, J.e. Fjeldsted, M.L. Lee. S.R. Spnngston and M. Novotny, Anal. Chem., 54 (1982) 736.

- 17 -
21. P.A. Peaden and M.L. Lee, J. Liq. Chromatogr., S (1982) 179.
22. Chemical and Engineering News (Ma.rch 22), (1982) .:15.
23. O.R. Gere, R. Board and O. McManigill, Anal. Chem., S4 (1982) 736.
24. O.R. Gere, Science, 222 (1983) 253.
25. P.A. Peaden and M.L. Lee, J. Chromatogr., 2S9 (1983) 1.
26. J.C. Fjeldsted, W.P. Jackson, P.A. Peaden, and M.L. Lee, J. Chromatogr. Sei., 21 (1983) 222.
27. U. van Wasen and a.M. Schneider, Chromarographia, 8 (1975) 274.
28. P.C. Wu and P. Ehrlich, AIChE J, 19 (1973) 533.
29. D-Y. Peng and D.B. Robinson, lmi. Eng. Chem. Fundam., IS (1976) 59.
30. M.A. McHugh and V.J. Kmkonis, Supercritical Pluid Extraction: Principles and Practice, Butterwonhs, Boston (1986) Chapter 11.
31. C.R. Yonker and RD. Smith, Supercritical F/uid Extraction and Chromatography, ACS Symposium Series, (1988) Chapter 9 1 P 162.
32. T.L. Chester and J.O. Pinkston, Anal. Chem., 62 (1990) 394R.

Chapter 2
Instrumental Aspects of Supercritical Fluid Chromatography
and Experimental Procedures
2.1 Instrumental considerations
2.1.1 Solvent Delivery
Instrumentation for SFC is essentially borrowed from both GC and microbore HPLC
with slight modificanons (Figure 2.1). Supercritical fluids require strict control of the
pressure as opposed ta the flow rate, therefore pulseless flUld delivery systems are
essential. Syringe pumpe; are commonly used, sorne of which provide cooling of the
pump head for delivelY of liquid mobile phases. The pumping system must also allow
for pressure or density programming. Pressure is typically programmed from 1800-
6000 psi in either a linear or asymptotic mode. Density programming IS usually
achieved by relating thl' mobile phase temperature and pressure to the denslty by the
use of computer algoritht.'1s.
2.1.2 Sample Introduction
Fixed volume injection valves origtnally deslgned for rrucrobore HPLC make
effective injectors for SFC. For packed columns injectlon volumes are between 0.1
and 1.0 Ill; capillary columns require in je cuon volumes below 0.1 III WhlCh is
achieved by installing a spliner between the mjector and me column. Slight changes
in the column temperature can cause unwantcd density gradIents along the length of
the column, therefore precise temperature control is achieved wlth convenuonal gas
chromatograph ovens.
- 18 -

SYRINGE PUMP
SWITCHING VALVE
Figure 2.1
GAS
- 19 -
INJECTOR DETECTOR
SPLITTER TEE t '
RESTRICTOR COLUMN
GAS CHROMATOGRAPH
Schematic of supercritical fluid chromatograph.

- 20-
2.1.3 Column technology
The small diameter capillary columns «100 micron Ld.) necessary to obtain
high efficiencies in reasonable analysis times for SFC place strict reqUlrements on the
preparation of the columns and on lnstrumentauon. The solvating power of many
supercritical fluids is sufficient to dissolve common stattonary phases, therefore
extensive crosslinking is necessary to stabilize the surface [1]. Modification of
common stationary phase coating techniques have been reported in the literature
[2,3,4].
The low sample capacity of capillary columns places stringent requirements on
the sample introduction technique. For typical SFC capillary columns of 50 micron
Ld., injection volumes less than 100 ni are necessary. This has been achleved with
high pressure internal sample loop valve injectors, used 10 microbore HPLC, connected
to a flow splitting device [5]. The split ratios are determined by both the detection
device and the sample concentration. Both fused sllica capillary columns and packed
columns are used in SFC, the choice is dependent on the analytical problem. Open
tubular columns are made of narrow fused silica tubing, in which a film of a
stationary phase is coated on the inside wall. The stationary phase is typically a
polymeric film which is immobilized by extensIve cross-linlang. The dlameter of th'!
column affects the mobile phase flow through the column, the sample loadabllity, the
permissible injections and detection volumes and the pressure drop across the colùmn
[6]. Capillary columns for SFC are of smaller internai dtameter, typlcally 1 0-50 ~m,
than those used for GC due to the lower diffusion coefficients in supercntlcal fluids.
Greater efficiencies ran be obtamed wlth caplllary columns since the y can be made
very long producing a large number of theoretical plates. Low mobile phase flow
rates associated with capillary columns allow easy interfacmg with both Ge-type and
micro bore HPLC-type detectors.
Microbore columns ongmally developed for microbore Le are typlcally used
for packed-column SFC. The types of packing are simllar to those u~ed for Le, while
the lengths and internal diameters of SFC packed columns are more lirnlted due tCl
pressure drop considr:rations and upper flow limnatlons uf sorne comrnonly used

,.
- 21 -
detectors. Particle diameters range between 5 and 20 Ilm and column lengths are
between 10 and 25 cm. Typical reversed-phase materials containin6 long-chain
hydrocarbon groups (Cs or Ct8) have been used as weIl as phases containing cyano,
amino or diol groups bonded to sùica particles. Insufficient shielding of residual
silanol groups on the silica support favours strong interactions wim polar solute
molecules resulting in broad tailing peaks. Two methcxi can be used to minimize this
problem: (i) use of homogeneous polymer bonded stationary phases or, (ii) use of
mcxiifiers in the mobile phase to compete with solute molecules for the se active sites.
Packed columns have higher sample loading capacity, which can result in lower
detection limits. Higher flow rates lead ta faster analyses and greater efflciency per
unit length. Packed coIumns have been used for all studies in this work.
2.1.4 Restrictors
Restrictors are used to (i) maintain the operaùng pressure throughout the
chromatographie system by providing a back pressure and (li) reduce the system
pressure ta atmospheric pressure in a smooth, rapid decompression step. Placement
and requirements of the restrictor differ according to the detection system used. For
LC-type detectors, where measurements are made in the supercriticai state, the
restrictor is placed after the detector [7]. The restrictor is placed at the inlet of the
detection system when using GC-type detectors so that the eluent is decompressed to
atmospheric pressure and measurements are made in the gaseous state. Ideally the
restriction de vice for SFC should: (i) provide unifonn flow; (ii) provide resistance to
pluggmg; (iii) provide variable flow rate capabilities; and (iv) allow for complete
transfer of labIle or non-volatile solutes ta the detector without pyrolysis or
precipItation of analyte particles. Although a variety oÎ designs are available, me ideal
restrictor has yet ta be developed. To avoid solute precipitation and erratic detector
response, the restnctor should be short and made of a heat conducting material. Fused
silica tubing is typically used.
There are various types of restrictors available (Figure 2.2). The integral type
restrictor is fabricated by sealing the Hp of a fused silica capillary and polishing it

- 22 -
INTEGRAL
FUSED S.LICA CAPILLARY
CERAMIC FRIT
ROBOT-PULLED
------------------------~ CRIMPED
Figure 2.2 Restrictor models for SFC. See text for descriptIon.

- 23 -
until a small orifice giving the desired flow rate is obtained. Decompression occurs
only at this orifice, therefore mmimizing problems of precipitation and erratic response
of the detector. These restrictors are most commonly used for both capillary and
packed columns. Linear restrictors are lengths of narrow bore fused silica (5-10 Ilm),
the length determines the flow rate. Since decompression occurs throughout the length
of the column, problems with spiking have been encountered. Ceramic frit restrictors
have a 2 cm frit at the end of narrow bore fused silica tubing; these work weIl with
open tubular columns but have problems with clogging when used with packed
columns. The most sturdy resmctors are the crimped-type made of platinum, but
reproducibility of the crimped orifice size is very low. Integral-type restrictors which
can be fabricated in the laboratory are reliable and were used for all experiments.
2.1.5 Mobile Phases
Table 2.1 Physical Properties of Certain Supercritical Auids
Auid Critical Critical Critical Temperature Pressure Density
(OC) (atm) (g !TIr')
CO2 31.3 72.9 0.47 N20 36.5 72.5 0.45 NH3 132.5 112.5 0.24 n-C4 152.0 37.5 0.23 n-C!5 196.6 33.3 0.23 SF6 45.5 37.1 0.74 Xe 16.6 58.4 1.10 CC12F2 111.8 40.7 0.56 CHF3 25.9 46.9 0.52

- 24-
Typical mobile phases include carbon dioxlde, nitrous oxide, arnmonia, sulphur
hexafluoride, and chlorofluorocarbons (Table 2.1). To analyze thennaIly labile
substrates an eluent is chosen v.rith a low critical temperature. To a fust
approximation the value of the cri tic al pressure is a measure of solve nt strength,
therefore high critical pressures are preferred, although practical consIderations place
limitations on this value. Supercritical carbon dioxide is most commonly used as a
mobile phase in SFC because of its low critical temperature (31.8°C) and high cntical
pressure (72.2 atm). Carbon 1ioxide is aIso non-taxie, non-explosIve, mexpensive and
has a minimal background response in flame-based and spectroscopie detecuon
systems. The most obvious disadvantage of supercritical carbon dioxlde is Ils low
polarity.
2.1.6 Programming Methods
The most evident advantage of SFC over both GC and LC is the variety of
methods available to control solute retention. SFC offers both temperature
programming (as in GC) and mobile phase composition programming (as in LC) plus
density programming. The ability to alter solvent strength Wlth densIly is a primary
advantage of SFC over other chromatographie techniques. Dual control of temperature
and pressure is used to influence mobile phase density. Generally capacIty ratIos
decrease exponentially with an increase in density, indlcating greater solvauon at the
higher density. In developing a method for the separation of a number of species a
density gradient is used to optimize resolution.
2.1.7 Mobile phase modlfiers
For sorne polar compounds the range in solvent strength offered by densIty
prograrnroing of the mobile phase May not be adequate to dute the compound or
provide reasonable separation. Addition of a second component (modifier) to the
mobile phase can greatly extend the power of denslty programnung.

- 25 -
2.1.8 Detection Strategies
Both LC-type and GC-type detectors have been used for SFC. Fluorescence
and ultraviolet absorption detection systems for SFC use high pressure cell able to
withstand pressures up to 6000 psi. These are most commonly used for packed
column SFC with modified supercritical mobile phases. Sorne flow eeU configurations
for capillary SFC use on column detection, where the polyimide coating is removed
from the end of the column which is then placed in the light path of a UV detector.
Flame-ionization detection is Most popular with capillary SFC; the higher flow
rates associated with packed-columns poses sorne problems with keeping the flame lit
and maintaimng ionization efficiency. Flame ionization detection (FID) and nitrogen
phosphorous thennionic detection (NPD) have been used in SFC by deeompressing the
fluid at the detector inlet [8].
Fourier Transform Infrared spectrorneters (FT-IR) have been utilized for
measurernents in both the supercritical state, using sma11 volume, high pressure cells,
and after fluid decompression, using solve nt evaporation/deposition techniques.
Interfacing SFC and mass spectrometers has proven to be a simpler task than
interfacing HPLC-MS systems because of the reduced amount of solvents. The low
flow rates associated with capillary SFC permit the entire effluent to be accommodated
by eXlsnng GC-MS pumping systems. The major problems are the placement of the
restnctor and heating of the capillary interface. TYPICally temperature regulated
interfaces are used which place the restrictor at the end of a nozzle drrected into the
ion soW'ee reglOn [9,10]. Both thermospray and solve nt elirnination techmques
have also been used for packed column SFC.
2.2 Experimental procedures
2.2.1 Instrumental « ~ A model 5890 gas chromatograph (Hewlett-Packard, Palo Alto, CA) was

- 26-
equipped with a Microgradient System ~flinge Pump (Applied Biosystems Inc., Santa
Clara. CA) to pressurize and pump the supercritieal fluid mobile phase. Samples
were introdueed onto the column via a Rheodyne injection valve with a 0.5 or 1.0 ~
sample rotor. Separations were performed on a Rexchrom 300Â C-18, 5 Ilm, 100 X
2.1 mm ID column (Chromatographie Sciences Company, St. Laurent, Québec,
Canada). Fused silica integral restrictors, constructed in.- nouse, maintained the
supercritical conditions. Retention tunes, peak: heights and areas and peak widths at
half height were recorded by a Hewlett-Packard 3390 integrator. Unless otherwise
stated this chromatographie system was used for all experiments in this work.
2.2.2 The role of modifiers in chromatographie separations.
Results from the investigation of the role of severa! modifiers (fonrue acid,
dichloromethane, and acetonitrile) in supercritical mobile phases are discussed in
chapter 3.
2.2.2.1 Chromatographie system
A Kratos model 773 UV-Absorbance detector (Applied Biosystems Ine., Santa
Clara, CA, USA) set at 250 nm served as the deteetion system. A 1.0 III loop was
used for the Rheodyne injection valve.
2.2.2.2 Chemicals
Isobutyl benzene, phenyl aeetic acid, anthraeene, anthraquinone and pyrene
were obtained from Aldrich (Milwaukee, Wisconsin, USA) and used as recelved.
Dichloromethane and formic acid were obtamed from BDH (Toronto, Ontano,
Canada). The acetonitrile-doped and simple supercnucal carbon dloxlde were obtained
from Scott Speelalty Gases tPlurnsteadville, Pennsylvania, USA). Other modified
phases were prepared in-house according to the followmg technIque.

- 27-
2.2.2.3 Technique to mod.ify supercntical mobile phases
A glass vacuum manifold constructed from ~tock components (see Figure 2.3)
was connected via a trap immersed in liquid nitrogen to a laboratory vacuum pump
and the system was evacuated. A known amount of modifier was poured into a clean
aluminum gas cylinder which was then immersed in liquid nitrogen for a sufficient
time to allow the modifier to freeze. The target cy!inder is then connected to the
manifold and the system evacuated again. The supply cylinder containing SFC grade
CO2 was connected to the manifold and the rate of gas flow from the supply cylinder
to the target cylinder was controlled with a fine control regulator. Throughout the
filling process the vacuum was monitored with a mercury manometer. The length of
time necessary to fill the cylinder was dependent not onlyon the flow rate of the gas
but the rate at which it freezes, requiring Its weight to be determmed at regular
intervals, 25-30 minutes for a final weight of 300 grams. Care must be taken not to
overfill the cylinder. It should be allowed to reach room temperature under ambient
conditions before use. Although exacùy predetermined modifier/gas ratios are difficult
to attain, the final concentrations are readily calculated. The method described
provided a useful in-house technique for making binary and tertiary mobile phases.
2.2.2.4 Isothermal studies
Isobutyl benzene, phenyl acetic aCld, anthracene. anthraquinone and pyrene
were dissolved in dichloromethane at a concentration of 1 00 ~g/ml and were injected
(1.0 Ill) under conditions of constant temperature and changing density. Four
injecnons were averaged for each densny setttng (0.5 -0.9 g/ml). The process was
repeated for each change in temperature (40 -100°C) and each mobile phase. The
operating pressure to obtain the desrred density for a glven temperature was calculated
using a computer algorithm. For details see Appendix A.
2.2.2.5 Isodense studies
Isobutyl benzene, phenyl acetic acid, anthracene, anthraquinone and pyrene
were dissolved in dichloromethane at a concentration of 100 ~g/ml and were injected

..
OEWAR
Figure 2.3
TARGET CYLINDER
MERCURY
- 28 -
VACUUM PUMP
.-- SUPPL Y CYLINOER
lIaUIO C02 WITH 1500 PSI
HELIUM HEAOSPACE
Apparatus for the addition of orgamc solvents ta supercnucal fluids.

r
- 29 -
(1.0 J.lI) under conditions of constant density and changing temperature. Four
injections were made for eaeh a range of temperatures (40 -lOOOC) at a given density.
The process was repeated for densities between 0.5 - 0.9 g/ml and for each mobile
phase. For both the isothermal and iscxlense studies, the peak heights, peak widths at
half height and retention rimes were recorded as an average of four injections.
2.2.3 Analysis of pbenothiazinones in plasma by packed column SFC.
The separation of a series of phenothiazinone analogs and an assay for one
analog in plasma are described in chapter 4.
2.2.3.1 Chromatographie system
A Kratos model 773 UV -Absorbance detector (Applied Biosystems Ine., Santa
Clara, CA, USA) set at 250 nm served as the detection system. A 1.0 III loop was
used for the Rheodyne injection valve.
2.2.3.2 Chemicals
Dichloromethane and acetonitrile were obtained from BDH (Toronto, Ontario,
Canada). The acetonitrile-doped and simple supercritical carbon dioxide were obtained
from Scon Specialty Gases (Plumsteadville, PennsylvanIa, USA). Phenothiazmone
analogs were syntheslzed by the medicinal chemistry group at Merck Frosst Centre for
Therapeutic Research.
2.2.3.3 Calibrauon curve
A stock solution of L615,919 (4-chloro-3H-phenothiazin-3-one) was prepared
by dissolvmg 10 mg of the drug in 10 ml of dichloromethane. A stock solution of the
internal standard L649,927 (benzo(a)-phenothlazm-3-one) was also prepared with a
concentrdtion of 1 mg/ml. Ten standard solutIons were prepared wlth a concentration
range between 2 and 900 Ilg/ml each containing 100 III of the internaI standard for a
tinal concentration of 0.1 mg/ml. A calibration curve was obtamed by plottmg the
average peak helght rano of five injections of each standard solutIon agamst the

- 30 -
concentration.
2.2.3.4 Preparation of dosing solution
A 20 mg/ml suspension was prepared by grinding the drug to a fine powder
using a mortar and pestle. A 1 % Methocel solution was added to the powdered drug
and ground to obtain a homogeneous suspension.
2.2.3.5 Dosing regime
Rats ranging from 300 to 400 g weight were used for the se studies. The
animais were fasted overnight before the study and fed six hours after dosing. Water
was allowed ad libitum. On the day of the study, the ammaIs were weighed and
dosed 150 mg of drug per 1 kg welght of the rodent orally VIa gastrIc mtubauon.
Under ether anaesthesia, seri al blocxi sarnples were withdrawn from the Jugular vein of
the animal at various rimes. Plasma samples were separated by centrifugation and
stored at -200C until analysis.
2.2.3.6 Plasma samples
Ta eaeh 400 J.Ù sample of plasma 50 III of 0.1 mg/ml solution of L649,927
(internai standard) and 200 III of 0.1 N Hel was added. The mixture was agnated on
a v'.)rtex mixer for two minutes. Ethyl acetate (J ml) was added and the mIxture was
ago'.Î.n vortexed for four rrunutes and then centrifuged for 15 minute at 12000 rpm.
The ethyl aeetate layer was collected and evaporated to dryness under a stream of
nitrogen. The aqueous layer was extracted a second ume WIth 1 ml ot ethyl aeetate.
The organic layer was combined Wlth the first evaporated extract and evaporated to
dryness. Each sample was redissolved in 50 III of dichloromethane and 1.0 ~l was
injected on colurnn.
2.2.3.7 Cyclic voltammetry of phenothiazInones
The phenothiazinone compounds (1 mg/ml) were dissolved In acetomtrile
containing O.lM te trab ut yi ammonium tetrafluoroborate (TBA TFB) :.;:; the supportmg

.. - 31 -
electrolyte. A platinum ultramicroelectrode served as the working electrode, a
silverlsilver chloride electrode as the reference and a platinum wire as the auxiliary
electrode. All scans were recorded at 100 mY/sec. Cyclic voltammograms were
recorded with a BAS CV 27 voltammograph (BioAnalytical Systems, West Lafayette,
Indiana, USA) and a HP7090A pIotter (Hewlett-Packard, Palo Alto, CA, USA).
2.2.4 An electrochemical detection system for SFC
The design and perfonnance of an electrochemical detection system for SFC is
described in chapter 5.
2.2.4.1 Chemicals
Ferrocene and tetrabutylammonium tetrafluoroborate (Aldrich, Milwaukee,
Wisconsin, USA) were used as received. The acetonitrile and tetrabutylammonium
tetrafluoroborate/acetonitrile-doped supercritical carbon dioxide were obtained from
Scott Specialty Gases (plumsteadville, Pennsylvania, USA). The solubility of the salt
in the carbon dioxide/acetonitrile mixture was verified before shipping.
2.2.4.2 Electrochemical Cell
An ultramicroelectrode made from 1O-~1.m diameter platinum wire sealed in
narrow-bore glass capIllary was obtamed from BioAnalytical Systems Inc. (West
Lafayette, Indiana, USA). The glass capiHary was of narrower diameter (3.2 J.lm) than
those commerclally avallable. The electrode body was filled Wlth epoxy resin to
provide mechamcal suppon. Two cenumetres of the electrode body were ground to
accommodate the celI compartment and to provlde a rough surface for sealing. The
preliminary deSIgn uses a hlgh pressure stainless steel tee-umon as the electrochemical
cell (Figure 2.4). The mlet and outlet pons are 1/16 Inch diameter wnh a 1/8 inch
diameter third pon for the working electrode. The colurnn eluent enters the cell
through a fused silica capillary threaded into the swagelok umon p-:.sltloned directly
above the working electrode In a wall-jet geometry. The restrtctor, placed through the

Figure 2.4
- 32 -
COLUMN OUTLET ---+
,
-'-'~~ ==~=l§§§~11 -;,' l SSUT TEE-UNION
RESTRICTOR
+--GRAPHITE FERRULE
u PLATINUM
MICROElECTROOE --+1
lf1 , 1
: 1 1
i 1
High pressure electrochemical cell.

r •
- 33 -
side arm, is weIl removed from the working electrode to avoid decompression near the
electrode which may cause precipitation of either the analyte or electrolyte modifier
[11]. Graphite ferrules were used to swage aIl components. The cell body served as
the quasi-reference electrode.
Cyelic voltammograms were recorded with a BAS CV 27 voltammograph and
an HP7090A pIotter. For the hydrodynamic studies, the potential was controIled by a
BAS amperometric detector LC-4 and the current was recorded on a HP3390
integrator. The cell was housed in a BAS Faraday cage.
2.2.5 Determination of sorbitan trioleate in metered-dose inbalers by
SFC.
A method for the analysis of sorbitan trioleate in aerosol fonnulations has been
developed and is described in chapter 6.
2.2.5.1 Chromatographie system
Eluents were monitored with a flame-ionization detector set at 35<J'C. AIl
experiments were run at constant pressure (2400 psi) and temperature (4<J'C).
Soivents were ali HPLC grade and were used as received. Sorbitan trioleate was
obtamed from ATLAS Chemicals (lot #Al7297).
2.2.5.2 Sample preparation
Each aerosol caruster was immersed in hquid nitrogen for twenty minutes ta
liquefy me contents. The canister was opened wim a pipe cutter and the contents
poured into a beaker. After all the propellant evaporate<:. the dry residue was vortexed
with a known quantity of dichloromethane to dissolve the sorbitan trioleate. The
sarnple was then cenmfuged at 12000 rpm for 15 nnnutes and the supernatant filtered
through a 0.45 /lm filter prior to injection. A calibration curve was prepared by
dissolvmg appropriate amounts of sorbitan trioleate and an internai standard (pyrene
0.2 mg/ml) in dichloromethane .

- 34-
2.3 References
1. L. McLaren, M.N. Myers and J.C. Giddings, Science, 159 (1968) 197.
2. B.W. Wrigh~ P.A. Peaden, M.L. Lee and T. Stark, J. Chromatogr., 248 (1982) 17.
3. R.e. Kong and M.L. Lee, J. High Resolut. Chromatogr. Chromatogr. Commun., 6 (1983) 319.
4. B.E. Richter, J.C. Kuei, J.I. Shelton, L.W. Castle, J.S. Bradshaw and M.L. Lee, J. Chromatogr., 279 (1983) 21.
5. P.A. Peaden, J.C. Fjeldste.d, M.L. Lee, S.R. Springston and M. Novotny, Anal. Chem., 54 (1982) 1090.
6. P.J. Schoenmakers, in Supercritical Fluid Chromatography, RSC Chromatography Monographs, London, (1988), Chapter 4, pl02.
7. J.e. Fjeldsted. B.E. Richter, W.P. Jackson and M.L. Lee, J. Chromatogr., 279 (1983) 423.
8. J.e. Fjeldsted, R.C. Kong, and M.L. Lee, J. Chromatogr., 279 (1983) 449.
9. R.D. Smith, W.D. Felix, J.e. Fjeldsted and M.L. Lee, Anal. Chem., 54 (1982) 1883.
10. R.D. Smith, J.C. Fjeldsted and M.L. Lee, J. Chromatogr., 247 (1982) 231.
Il. A.C. Michael and R.M. Wightman, Anal. Chem., 61 (1989) 2193.

Chapter 3
The Role of Modi6ers in Chromatographie Separations
3.1 Introduction
A key feature of SFC is that a chromatographie separation can be optimized for
a given stationary phase by varying temperature, as in GC, mobile phase composition,
as in HPLC, plus the additional option of varying pressure and density. Since the
solvent strength of a supercritical fluid is closely related to its density, pressure or
density gradients can be used in the development of a separation [1]. The solubility
parame ter of the supercritical mobile phase is influenced both by its critical
temperature and the operating density. To solubilize a solute, the solubility parameters
of the solute and the solvent should be nearly equal. To a ftrSt approximation, the
value of the critical pressure is a measure of a supercritical fluid's sol\'ent strength,
but practical limitations of presently available instrumentation do not permit the use of
fluids with high critical pressures. Increasing the density of the supercritical mobile
phase also increases the solubility parameter and consequently affects the solutes.
Enhancing the solvent strength by increasing density is limited by both practical
constraints of the solve nt delivery system and the low compressibility of the fluid as it
reaches liquid-like densities (2].
Supercritical carbon dioxide is the most commonly used SFC mobile phase due
to its low critical temperature and moderate critical pressure, which pennits the elution
of thermally labile compounds while operating within practical pressure limits of
CUITent instrumentation. Carbon dioxlde 15 non-toxie, mexpensive, non-flammable and
has minimal response in flame ionization detectors. Under typical SFC operating
conditions (40-120"C, 1200-5500 psi) supercritical carbon dloxide's solvent strength,
- 35 -
- 36 -
as measured by the Hildebrand solubility parame ter, overlaps those of several common
organic sol vents such as hexane, pentane, dichloromethane, toluene, THF and
isopropyl alcohol [3]. This suggests that migrauon in supercritical CO2 wIll occur if
the compound is soluble in any of these organic sol vents. A problem occurs beeause
of the limited solvating ability of supen:ritiC'a} carbon dioxide for man y polar
substrates. Increased solvent strength can be achieved by the addition of organie
solvents, in which the solute is soluble, to the supercritieal CO2 mobIle phase.
Addition of a polar modifier typically results in decreased capacity rauos as compared
to the single eomponent mobile phase. Retention in a chromatographie process is
eontrolled by severa! interactions: (i) the solubility of the solute ID the mobile phase,
as determined by the solute-solvent interactions; (ii) the affinity of the !lolute for the
stationary phase; and (iii) interaction of the mobile phase moleculeli with the stationary
phase. With bonded stationary phases interactions can occur with both the bonded
phase and the support material, typically sllica. To influence retenuon the modifier
must alter one or more of the above mentioned mecharusms.
The suecessful development of SFC requires a more complete understanding of
fluid praperties, their dependence on physical parameters, temperature, density and
composition, and their influence on retention behavlOur. When thiS work was started
there was no clear understanding or consensus by those working in the area as ta the
exact raIe of mobile phase modifiers. It was suspected that mobile phases could be
tailored for a specitk application but littl'! mforrnatlon was available on which to base
the selection of a mobile phase composition for a glven applicaticn. Although
thermodynamic models existed to descnbe retention and selecuvlty they were unable
to account for stationary phase interacuons and were not useful for predictive purposes
in developing a sepaPItlon strategy [or a glven series of compounds. Therefore a
systematic study of the i.lt1uence of tempe!'ature, denslty and mobIle phase
composition on chromatographie parameters for several compounds on a reversed
phase column was undertaken. The pracucal problem in dehvenng mlxed supercntical
phases was overcome by adopnng a common techmque for subdlvldmg gases ta
modify commercIally available supercritical fluids. This permItted the ~tudy of the

1
- 37 -
influence of density and temperature on mcxiel compounds in binary and tertiary eluent
mixtures and helped defme the importance and raIe of modifiers generally.
3.2 EXpi:rimental
For experimental details see section 2.2.2.1 - 2.2.2.4 in chapter 2.
3.3 Results and Discussion
Several investigators [4,5,6J have suggested possible raIes for modifiers in
supercritical mobile phases. Polar additives can act as surfactants decreasing the
interfacial tension between the mobile and stationary phases. They can also provide
competition between solute and mobile phase molecules for active sites on the
chromatographie coluIIlJ1. Co-solvent molecules may interact with functional groups
on the solutes and/or increase the fluid's dielectric constant, introduce hydrogen
bonding capabilities, and allter mass transfer characteristics and solvent viseosity. The
addition of a less volatil~ solvent has the added effect of increasing the critical
temperature and pressure of the mobile phase and thus the density or solvating power
of the fluid [7].
3.3.1 Chromatographie parameters
Solute affinity for the mobile and stationary phases in SFC is dependent on the
composItion of each, as well as on the mobile phase density and temperature. Initial
studies were designed to lDvestigate the influence of density and temperature on the
chromatographic behaviour of a set of model compounds for a given mobile phase and
st3tionary phase.
The chromatographie; parameters invesugated included peak wldth at half
helght. capaclty rano, effective plate number, selectivity and resolution. The capacity
factor (k') IS the rano of the: number of moles of solute fi the stationary phase over

- 38 -
the number of moles in the mobile phase and is related to the retention time of the
solute according to the following equation,
le' - (3.1)
where to = retention time of an unretamed species tR = retention time of species of interest
The separation factor or selectivity (a) is the ratio of capacity factors for two
adjacent peaks,
œ - (3.2)
where kt = capacity ratio of earlier eluting an alyte k2 = capacity ratio of adjacent analyte
Selectivity is varied by changing the composition of the mobile and/or
stationary phase. Both selectivity and capacity factor are a measure of the peak
position.
Column efficiency (N) is the relative ability of a given column to provide
narrow bands of solute.
N - 5.54 (~l2 twtu
where 1wos = peak width at half helght
(3.3)
The value of N is constant for different solutes for a glven column, mobile
phase, temperature and linear veloclty. Therefore an increase 10 retention ume results
in an increased peak width. The separation efficiency is controlled by changmg the
column length or the solvent velocity.
The resolution IS a measure of the relative resolutIon achieved for a glven
sample mixture. The resolution between two adjacent peaks IS equal to the distance
- 39 -
between the two peak centres divided by the average peak width. Resolution can be
expressed in tenns of experimental parameters such as k', N and a:
R - (1.) (CI - 1) ..jN ( k' ) 4 1 + i'
(3.4)
Both the separation efficiency and the resolution are a measure of the peak
distortion developed throughout the length of the column.
The availability of solubility data for various organic solvents in supercritical
carbon dioxide, provides a means for preparing homogeneous binary and tertiary
mobile phases. Packed column" designed for HPLC are routinely used for SFC. C-18
bonded phase packed columns have shown versatility for the separation of a large
variety of compounds in HPLC and seemed an appropriate candidate for SFC.
3.3.2 Isothermal and isodense studies
3.3.2.1 Supercritical carbon dioxide mobile phase
A series of model compounds (iso-butyl benzene, phenyl acetic acid,
anthraquinone, anthracene and pyrene) was selected to demonstrate subsutuent and
molecular size effects under various conditions. Chromatograms were obtained for
four injections of the test mixture at each temperature and density (see appendix B for
table of data). Chromatographie parameLers were plotted under conditions of constant
denslty as a funcuon of temperature. Generally capacity ranos and peak widths
decreased in a non-linear fashion with increasing temperature at constant density
(Figure 3.1). The shape of the k' versus temperature curve for the mdividual
compounds remained the same for each density studied, but the values of the capacity
ranos decreased with increasing densny. The greatest change in capacity ratio was
obtained for pyrene. the largest molecule of the mIxture, indicating that HS solubility in
the mobile phase is mcreased at the higher temperature. A plot of ln(k') as a funcnon
of ternperature shows a linear dependence for each solute (Figure 3.2a). The

1.400 1
1.200 ~ 1 - 1.000 ~ c
E 0.800 l "-"
... -1
-' "'0 - 0.600 ~ == ..:s::
0.400 ~ ;0 il)
~ i 1
0.200 f-
0.000 !
30
14.00 ~
12.00 r-I
0 10.00 ~ --'
;0 -v
>- 8.00 -
'-l 'J ô.OO -.... -::: . , .....,
4.00 r
2.00 -
0.00 ' 30
Figure 3.1
..t0
..t0
• \ \
50 60
- 40 -
• ISO ButyJ benzene ~ Phenyl acetlc aCld ... Anthraquinone o Anlhracene
• Pyrene
70 BO 90 100 110
Temperature (oC)
• ISO ButyJ benzene 2. Phenyl dcetlc aCld ... Anthraquinone o Anthracene
• Pyrene
50 60 iD BO 90 100 110
Temperature (oC)
Peak. wldth (a) and capaclty rano (b) as a funcnon of temperature at constant density (0.7g/ml). Ylobile phase: supercnncal carbon dioxide.

r \
-
>. C,)
c: ~
C,)
'-..... :..J
- 41 -3.00 ri -------------------
1
1
2.00 t 1.00
0.00
-1.00
-2.00
• Iso But yi benzene .6. Phenyl scetlc sCld • Anthraquinone o Anthracene
• Pyrene
-3.00 '--_~_~ ___ _.L. __ ~_~_~ _ _.J
30
4000
3500
3000
2500
2000 1 ï
1500 1-
1
1000 f-
500 ~
0 30
40 50 60 70 80 90 100 110
• 130 But yi benzene .6. Phenyl acetic aCld • Anthraquinone o Anthracene
• • Pyrene
--'i~~/.~. >c: \\. n~. ~o ~ \/ ,/
ë;.
40 50 60 70 80 90 100 110
Temperature (0 C)
Figure 3.2 ln(k') (a) and efficlency (b) as a funcuon of temperature at a constant of 0.7 g/ml. Mobile phase: supercntical carbon dioxide.

- 42 -
dependence of efficiency on temperature shows a maximum at 70°C for anthraquinone,
anthracene, and pyrene, while the smaller compounds haVt~ a maximum value at 5erC;
this is true for all densities invesogated (Figure 3.2b). Selecovity between
anthraquinone and anthracene remains constant for the temperature range studied.
whlle selectivity for anthracene and pyrene decreases slightly W1th mcreasing
temperature (Figure 3.3a). The greatest change occurs for the resoluuon between
anthracene and pyrene, which decreases rapldly with mcreasing temperature. This 1S a
direct result of the large retention time change for pyrene with temperature (Figure
3.3b).
At constant temperature, capac1ty ratios decrease with lIIcreasmg densuy much
more rapidly, than at constant density with increasing temperature. Agam the curve 15
asymptotic, and the shape dependent on the analyte at each temperature (Figure 3.4b).
The eapacity ratio values are higher at the Iower temperature. Resolution between
anthraeene and anthraquinone, which differ in polarity, remams constant, whlle the
resolution between anthracene and pyrene decreases rapldly with mcreasmg density
(Figure 3.5b). This suggests that the effeet of denslty is greater on the larger
molecule, due to its increased solubility m the mobile phase.
At constant temperature, changes m density greatly mfluences the
chromatographie separanon. The control denslty exens on retenUon behavlOur IS best
seen by eompanng chromatograms obtained for the test mixture at constant
temperature and different densuies. A decrease m analySlS Urnes by a factor of ten
was obtained by mcreasmg the densIty from 0.5 ta 0.7 g/ml (Figure 3.6). However,
the inereased speed of analysis IS at the cast of resoluuon. The smaJler molecules are
better resolved at the lower denslUes. while the larger solutes. anthraqumone, pyrene
and anthracene. have better peak shape at mtennediate denslties. In order 10 separale
such a mIxture a denslty gradIent must be used.
3.3.2.2 Critical pararneters In bmary and tertIary mobile pha~es
Binary mobile phases are bemg used In SFC due ta the abihty of the ~econd
component ta chetnlcally alter the propemes of the moblle phase. Problems occur

~ ..... > .... C) Il) .-Il)
rn
- 43 -4.00 1
1 • 190 But yi benzene - Phenyl acetlc aCld
3.50 t::. Phenyl acetl~ aCld - Anthraquinone • Anthraquinone - Anthracene <> Anthracene - pyreoe
3.00
2.50
2.00
1.50 t 1.00
30 40 50 60 70 80 90 100 110
Temperature (oC)
14,00 <> • iso But yI benzene - Phenyl acetic aCld 1 \ t::. Phenyl ace tic 8Cld - AnthraqulDone
12.00 t • Anthraquinone - Anthracene <> Antbracene - Pyrene
10.00 O.
;L ~0---8.00 --0
'\
6.00 ~
4- 00 r ~ ~O
2.00 f-
0.00 30 40 50 60 70 80 90 100 110
TemDerature (oC)
Figure 3.3 Selecnvlty (al and resolutlon (b) as a functlon of temperature at a constant denslty of 0.7 g/ml. Mobile phase: supercritical carbon dioxlde.

-\: .-s '-"
,... --' "0 .-== ~ ~ CJ ,., -
a
'0 ~
>,
-,.; ": ,.... -": . ,
'-'
0.600 !
i
0.500 ~ 0.400 ~
1 1
0.300 r 1
0.200 ~
1 0.100 r 1 , ,
0.000 1
0.40 0.50
10.000 1
1 1 1
8.000 f-1
1
6.000 L-
4-.000 ....
2.000 -
- 44-
... ISO Bulvl benzene  [J Phenyl "acetIc aCld • Ant.hraquInone
\ 6 Ant.hracene • Pyrene
\
\~ ~= \....j •
0.60 0.70 0.80 0.90
Denslty (g/ml)
Â
\ \
\ \
\ \ \
.... ISO Bulyl benzene C Phenyl acetlc aCld • AnthraquInone b,. Anthracene  Pyrene
~~, ~~---- ~ .... ____ _ ___ ~ 1\ Â
1.00
--=::::::::r-- ---1'""--- ., o. 000 ~-------=::::::Yy~-~~~-~;::::l'L--
0.40 0 50 0 60 0 70 0 80 0 90 00
Denslty (g/ml)
Figure 3.4 Peak width (a) and capacny ratlo (b) as a tunctlon ot denslty at constant temperature (60°C). ~obile phase: supercntical carbon dioxide.

. .. 3.00 1
1
1 2.50 r !
:>. 2.00 t -' -> --' 1.50 C) CJ
! il) U)
1.00 ~
0.50
0.00 ! 0.40
16.00 1
1
14.00 r 12.00 ~
- 1 - 10.00 r c -' : ::: 1
8.00 1--,:) :Il ., ~ 6.00 .......
4.00 -
2 00 -
0.00 a -.ta
Figure 3.5
. '
- 45 -
'Y 150 but yI benzene - - phenyl acetlc aCld 1
::J phenyl acetlc aCld - anthraquInone • anthraquInone - an thracene ~ anthracene - pyrene
0.50 060 0.70 0.80 0.90 1.00
DensIty (g/ml)
'Y ISO but yI benzene - - phenyi ace tIC aCld ::J phenyl acetlc aCld - anthraquInone • anthraquInone - anthracene ~ anthracene - pyrene
~ ~
........... "
~ ""~ " 6
.:.-?::t- ~----. T ~
o 50 060 070 0.80 0.90 1.00
Denslty (g/ ml)
Selecn vay (a) and resolutlon (b) as a funcuon of denslty at constant temperature (60°C), MobIle phase: supercntical carbon dioxide .

- 46-
1 2 3
5
!I 1 1
J 1 1 1
0.0 5.0 10.0
1 3 56
0.6 g/ml 4
7
1 1 1 1 1 0.0 2.0 4.0 6.0 8.0
0.8 g/ml
1 i 1
0.0 2.0 4.0
T l 0.01 Au
0.5 g/ml
6
1
15.0
1-4 5 6 7 .. "
J
~
1
1
20.0
0.7 g/ml
1 1 1 1 0.0 2.0 4.0 6.0
1 Methylene Chlonde
2 Isobutyl Benzene
3 Phenylacetic Acid
4 Ibuprofen
5 Anthraquinone
6 Anthracene
7 Pyrene
Figure 3.6 Chromatograms of model compounds at constant tempe rature (7CfC) for various densities. Supercnucal carbon dioxlde mobile phase.

- 47 -
when using modifiers in supercritical mobile phases due to the non-linear relationship
between the critical parameters of a binary mixture of eluents and the eluent
composition. Critical parameters for mixed phases have not been experimentally
detennined, therefore the critical temperature and pressure are estimated on a
theoretical basis using equations of state. The Peng-Robinson equation of state was
chosen for the calculation of critical parameters and for the determination of pressure
and density values since: (i) it is a simple two-parameter cubic equation with solvable
roots and (ü) it is cornmonly used, therefore providing a means for comparison with
other data in the literature.· Genecaily semi-empirical equations of state express
pressure as the sum of a repulsion pressure (term n and an attraction pressure (term
II). The Peng-Robinson equation of state has modified the attractive pressure term of
the van der Waals equation (term II).
p -RT -- -V-b
1
a(7)
V(V+b) + b(V-b)
II
(3.5)
Other equations of state have been developed [8,9] but most require solution
by numerical methods. The density of a supercritical fluid changes rapidly near the
critical point and therefore an equation of state wlth more parameters would best
describe the change in uensity with pressure and temperature. However, since most of
the following studies were conducted at conditions well above the critical point, the
Peng-Robinson equation of state provided a good estimate of the critical parameters.
The denslty of the binary and tertiary fluids was determmed by addition
parameters as descnbed by the Peng-Robinson equation.
a - E LX(tP" i j
(3.6)

- 48 -
(3.7)
(3.8)
The two constants for the equation were ealculated for eaeh component of the
mobile phase and were added according to the mixing rules describe by Peng and
Robinson befme being used in the equation of state. A computer program was
written to ealeulated the denslty and critical parameters of vanous mixtures of org.mie
solvents with carbon dioxide (see Appendix A for a listing of the program). For a
given temperature and density, the Peng-Robmson equauon gave the operating
pressure for the partieular mobile phase.
3.3.2.3 Formic acid modified carbon dioxide
Coverage of the silica support on common HPLC bonded-phase columns is
usually less than 30%, leaving many silanol groups bare. Peak tailing of polar solutes
may occur as a result of adsorption of the solute onto bare sites on the stlica support.
In HPLC trifluoroacetic, phosphoric or formlc aCld is typleally added ta the mobile
phase to compete with the solute molecules for the bare sllica SItes. ThIS produces a
more unifonn stationary phas~ surface, therefore conslderably reducmg peak truling. It
was hoped that similar effects cou Id be achieved by the addition of formlc acid to
supercritical CO2 mobile phase. At the ume of .he se smdies only smgle component
mobile phases were available commercially, therefore the bmary and teroary phase
were prepared in the laboratory by adapting a technique commonly used for
subdividing gases (section 2.2.2.3).
Formic acid was chosen because of its solubllity in supercntical carbon dioxlde
and its compaubility wuh both FID and UV absorptIon detection. AdditIon of the
formic acid (0.25%) initially decreased retentIon urnes for an the compounds.
Capacity ratio curves for anthraquinone, anthracene, and pyrene decrease

f
- 49-
asymptotically with temperature at constant density (Figure 3.7), the shape of the
curves are similar to those obtained with simple CO2, while the k' values are lower for
the same density in the fonnic acid modified phase. Selectivity and resolution curves
(Figure 3.8) for anthraquinone/anthracene and anthracene/pyrene are very similar
indicating that the resolution of these compounds in this system is governed by its
selectivity. Resolution of two compounds takes into account the capacity ratios of
each solute, the selectivity ratio and efficiency and therefore a plot of these individual
components would indicate the predominate factor.
Capacity ratios and peak widths for isobutyl benzene remained constant for
increasing density, suggesting no change in solute-solvent interaction (Figure 3.9). At
constant tempemture both the capacity ratios and peak widths decrease in a non-linear
fashion with increasing density, indicating that the increase in density increases the
solubility of the solutes in the mobile phase as weIl as the solute-stationary phase
int..;raction. Efficiency for anthraquinone, anthracene and pyrene reach maxima at 0.8
g/ml (Figure 3.1 Ob). Selectivity and resolution for anthraquinone/anthracene reach
minima at a density of 0.8 g/ml (Figure 3.11). Selectivity of anthracene over pyrene
steadily increases with density, while the resolution between the two increases only
slightly.
The amount of fonnic acid in the mobile phase was then increased to 1.26
mole%. Plots of capacity rano as a function of temperature at constant density have
smùlar shapes to those recorded for the lower formic acid concentration, but the
values of k' at lower temperatures for pyrene are slightly higher (Figure 3.12a).
Efficiency for anthraquinone, anthracene and pyrene reach a maximum at 500C and a
minimum at 80°C (Figure 3.12b). Selectivity for anthraquinone and anthracene is
constant for the temperarure range mvestigated, while the anthracene/pyrene selectivity
decreases slightly Wlth increasing temperature (Figure 3.13). The resolution of both
pairs is influenced by both the selectivity and capacity ratios.
At constant temperature the peak wldth curves are sInular to the capacity ratio
curves, indicanng higher solvanon of each solute with increasing denslty (Figure 3.14).
Selectivity for anthraquinone/anthracene increases wuh density and the resolution
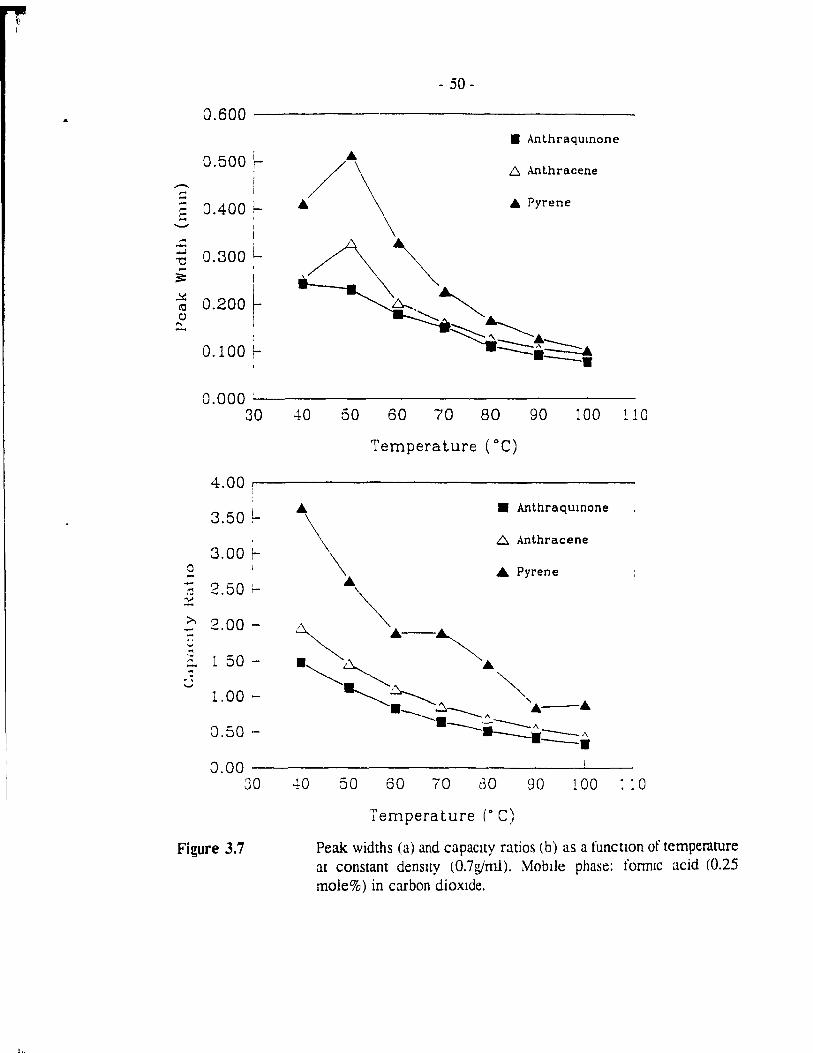
0.600
1 0.500 r ..-;:: - 0.400 f.-;:: ...
'-" 1
,.. 1 - 0.300 L ..,j
"'0 -~ 1
~ 0.200 ~ CO
C) 1 '" :
0.100f-
0.000 ' 30
4.00 !
3.50 L
3.00 f-0 - 2.50 r-~
:::: >. 2.00 ---., ~
,~
1 50 -~ -~ . . , '-'
1.00 -
0.50 -
0.00 30
Figure 3.7
- 50 -
• Anthraquinone .. /\ 6 Anlhracene
.. Pyrene
~ ~~.~ ---. 40 50 60 70 80 90 100 ~10
Temperature (OC)
.. • Anthraqulnone
\ L:::. Anlhracene
\ .. Pyrene .. ~~ .. -~ .~~ .. ~~---,~ ... - ...
---.=::::::'" .---.\ --. ~o 50 60 70 aD 90 100 : : 0
Temperature (0 C)
Peak widths (a) and capacay ratios (b) as a funcuon of temperature at constant denslty (0.7g/nù). MobIle phase: fonmc acid (0.25 mole%) in carbon dioxlde.

>,
> -' :J ~
~ 'J)
il :.;
3.00
2.50 -2.00 ï
1.50 ~
1.00 1 r-
0.50 r
0.00 30
8.00
7.00 >-
6.00 r-5 00 -
4- 00
2.00 -
2.00 -
l 00 -
0.00 30
Figure 3.8
- 51 -
L::. Anlhracene -- pyrene
.--__ • __ --__ .----.----•• r---•• ~--.
• AnlhraqulOone - anthracene
40 50 60 70 80 90 100 110
Temperature (OC)
6 Anlhracene - pyrene
4
~/~ ~ \
\ \ \
\
• Anthraquinone - an thrace ne .-----.--.-. ..;0
---.-. 50 60 70 80 90 100 : 10
-:'emperature (oC)
Selecuvny (a) and Resoluuon tb) plotted against temperarure at constant denSlt)' tO.7 g/ml). ~obtle phase: fonruc aCld (0.25 mole%) III carbon dioxlde.

....-.. c: -c: -----v ~
~ .':)
::J ~
a .-
1.40
1.20 r
1 1.00 r
0.80 ~ ,
0.60 ~ 1
1
0.40 L
0.20 "-
0.00 0.40
\
0.50 o 60
- 52 -
0.70
• Anlhracene ~ Anlhraq umone ... Pyrene o lso-Butyl benzene
o BO rJ 90
Denslty (g/ ml)
: 00
10.00 r---------------------
8 00 .-
• \ 6.00 -
-t.00 -
2.00 .-
\ \
• Anthracene ~ Anthraqumone  Pvrene o lso-3utyl benzene
~' ~~t=:=:=. > !> ~- ! o .00 __ '-;)~e =====:2::====~010"-_--=::"--===~--
0.40 0.50 o 60 o 70 ') 80 :J 90 : 00
Jenslty (g/m1)
Figure 3.9 Peak wldths (a) and capaclty ratlos (b) plotted agamst denslty at constant temperature (60°C). Ylobtle phase: tormlC aCld (0.25 mole%) ln carbon dioxlde.

, 1 3 00
2.00 ~
1.00 1-
........ -...:: 0.00 f---:: -1.00 f-
-2.00 -
-J 00 0.40
4000 '
3000 f-
-:.>
~ 2000-
1000 -
0.40
Figure 3.10
- 53 -
• Anthracene L;. AnthraquInone • Pyrene o Isobutyl benzene
~~ ~~-~ -.
~. 0~ ~ 0/ 0
0.50 0.60 0.70 0.80
Denslty (g/ml)
• Anthracene 2:. Anthraqumone ... pyrene o Iso-But yI benzene
(] 50 0.60 0.70 0.80
JenslLy (g/ ml)
0.90
0.90
1.00
: .00
In(k') (a) and efficiency (b) a~ a function of denslty at constant temperature t60°C).

:: 0 -'
= '" v ':Jl il) .....
- 54 -3.50 -------------------
3.00 ~
2.50 ~ >. -' >-~ 2.00 r-2 i il)
r:n 1
1.50 r-I
1 00 L
• Anthracene - Anthraquinone
~ Anlhracene _. Pyrene
0.50 -' --------------------040
12.00 1
1
10.00 1
r 1
800 -
6.00
4: 00 -
200 -
0.00 040
Figure 3.11
0.50 0.60 070
• Anthracene- Anthraquinone
~ Anlhracene - Pyrene
• \ , \
050 0.60
\ , \
\ \
o 70
080 o 90
'.,-----/\ 080 o 90
DensIly (g/ ml)
1 00
J 00
Seler.:uvity (a) and resolunon (h) as a funcuon of denslty at 6ffC.

~
~ --:: 'V
>, --'"' ~ " -, -"J
::.....
6 00
5.00 -
4- 00 -
Cl 00 -u
2.00 '-
1.00 -
Cl.OO 30 --t0
, \
50
- 55 -
• ~ùlthraqumone
2:. .\nthracene
.... Pyrene
60 70 80 90 100 :: 0
-:'emperature (' C)
~500 ----------------------------------------------
3000 -
:: :':500-
-~ ~ooo.-
:500 -
:000 ~O
Figure 3.12
•
. " -:- 1...) 50 60
" "
70
• Anthraquinone
6 Anlhracene
.... Pyrene
.... - ....
ao 90 l 00 ~ ~ 0
~emperature (0 C)
Capacny rano (a) and efficlency (b) as a function of temperarure at constant denslty (0.7 glml). Mobile phase: fonruc acid (1.26 mole%) in carbon dioxlde.

~
> ---ü :.J
:.J 'JJ
-..,
- 56 -
3.00 -------------------
2.50 1
r-
2.00 f--
1 50 -
1 00 30
12.00
10.00 r-
8.00 ~
6 00 -
~ 00 -
2 00 -
~ Anthracene - pyrene
_ Anlhraqumone - anlhracene
.---.-.-----. ~O 50 60 70 80 90 100 : 10
';:'emperature (oC)
• Anthraquinone -
~ Anthracene - pyrene
, , ,
~, ~---,' anthracene ~-____ " .--------. --------._'----.
0.00 ------ --------------30 .;0 50 60 70 BO QO i 00 :: 0
:'emperature (OC)
Figure 3.13 Selecnvay (a) and resoluuon (b) .lS a tunctIon of temperature at constant densny (0.7 g;ml). MobIle phase: tormlC aCld (l.26 mole%) ln carbon dlOxlde.

J.80
J.70 -.- 0.60 1-,... ----:: 0.50 1 -- r
-- 0.40 r .... '"
== ~ 0.30 -i'J :.J ~ 0.20 -
:J. 10 -J.OO
0.40
8.00 i
(' 00 r
6.00 :-
"'" .:: 1 -' 5.00 1-iO
::::: >- ~ 00 ---~
~
- 3 00 --: ~
":.00 -
1 00 -
J 00 0.40
Figure 3.14
050
o 50
0.60
\ \
\
- 57 -
0.70
• Anthracene .0. AnthraquInone .Â. Pyrene
0.80 0.90
Jenslty (gjml)
À \
\
o 60 0.70
• Anthracene ~ An thraqUlnone .Â. Pyrene
a 80 0.90
Jenslty (g/ mi)
: 00
: 00
Peak widths (a) and capaclty ranos tb) as a funcnon of density at constant temperarure (60"C). MobIle phase: fonnic acid (1.26 mole%) ln carbon dloxlde.

- 58 -
between the two is constant (Figure 3.15). Both the selecuvny and resolution for the
anthracene/pyrene pair decrease with lncreasmg denslty. Addition of an increased
amount of fonnic acid essentially has little effect on the chromatographIe propemes of
the solutes.
Since the addition of fonnie acid decreased both the peak wldth and capacity
factor, it must modify both the stauonary phase surface and at least to sorne extent
increase the solubùity of the solutes In the mobile phase. Increasmg the fonmc aCld
content had little effect on retention, indicating its modifymg abIiity IS hmlted.
3.3.2.4 Dichloromethane/fornuc acid modified carbon dIoxlde
A third compone nt was added to the fonruc aCld (0.16 mole %) modified
mobile phase In order to asses its mfluence on capaclty ratIo. Dichloromethane, a
solvent in WhlCh all the solutes are soluble, was added at a concentrauon of 0.87 mole
% in order to Increase the solubility of the compounds 10 the mobile phase and
because of its low rE"ponse ln both FID and UV detecnon !lystems and HS lntnnslC
solubility In supercritical carbon dloxlde. Dlchloromethane was added In an attempt to
decrease solute retentlon rimes while the forrnic aCId covered up the deBve sites on the
silica support. However, $Jnce a dec rease ln capaclly rauos causes peak wldtlls to
decrease, it is not pOSSIble to rusungLllsh between the two mechamsms
Capaclty ranDs decreased wuh an lncrease In denslty, In a ~Inlllar pattern 10
that obtained \ltith the three prevlOus mobIle phases (FIgure 3.16a); lIttle change
occurred at Increasmg temperature (Figure 3.16b). For anthmqulnone/anthracene both
the selectivlty and resolution lncreased Wlth densny. Selectlvlty and resoluuon for
a.l1tlliacene/pyrene both decreased wnh lncreasmg densny (Figure 3.17)
3.3.2.5 Acetomtnle modified carbon dlOxlde
Fmally the effects of acetomtnle mcxilfiers on the chromatographIe
perfonnance of the test nuxture were mvesugated. TIns was carned out for two
1

c c -= 0 r.r; ~
'V
- 59 -
3.50 ------------------------------------------
3 00 -
>- 2 50 -
> --' CJ C..l
C..l 'J.J
2.00 -
1.50 r-
1 00 -
• Anlhracene - Anlhraqulnone
6. Anlhracene - Pyrene
0.50 ------------------~-------------------0.40
20 00
1600 -
1200 -
800 -
4- 00 -
000 ' o 40
Figure 3.15
0.50 0.60 0.70
• Anthracene- Anlhraqulnone
6 Anlhracene - Pyrene
080
,~ ~''-..
.----- •
o 50 0.60 o 70 0.80
Denslty (g; ml)
0.90 1 00
~/\ L->
• 0.90 1 00
Selectivity (a) and resolutlon (h) as a functlon of density at constant temperature (600C). Mobile phase: fonnic acid (1.26 mole%) 10 carbon dlOxlde.

- 60-
reasons: (i) since acetoni01le increases the polarity of the mobile phase. il extends the
range of supercnücal CO2 making lt useful for the separation of phenothlazmones (see
chapter 4), a senes of relatively polar compounds; and (11) the feaslblhty of an
electrochemical detecuon system for SFC was also under InvestIgation and
acetonitrile/tetrabutyl ammomum salt modIfied carbon dloxlde provlded the necessary
conductivity to the mobile phase.
Peak wldths decreased for anthraquInone. anthracene and pyrene wlth
increasing temperature at constant density. Little change was obtamed 10 capacIty
ratios for the three compounds with increasing temperature (FIgure 3.18).
Temperature aiso had a minimal effect on resolutlon and selecu vay for the three
solutes (Figure 3.19). At constant temperature both peak wldths and capaclty ratIos
decreased at higher densities (Figure 3.20). Selecnvlly 10creased for
anthraquinone/anthracene pair Wlth increas10g mobIle phase density, but remained
constant for ?llthracene/pyrene paIl' (Figure 3.21a). Resolunon between anthracene and
pyrene detTeased rapidly with increasing density (Figure 3.21b).
3.3.3 Modifier effects.
3.3.3.1 Effects on retention times
The results of the prevlOUS investigatIon indIcate that mobIle phase densay l~
the main factor controlling retention. Under lsobaric conditions. temperature has a
mimmal eîfect on retenuon parameters. Hence compansons of modifier effects should
be made at equivalent densaies under l~~tfennal condltIons. The capacny rauos for
anthraqUInone (FIgure 3.22a), anthracene (Figure 3 23a) and pyren~ (FIgure 3.24a) are
plotted as a funcuon of densny at a constant tempemture of 60"C for '>Imple carbon
dioxide and three modified CO2 mobIle phases. Capacny ratlo~ were hlghe~t for the
three compounds ln the supercnucal carbon dloxlde mobIle pha~e 1l1e order of
decrease In k' values was dependent on the solute For anthraqUinone, the next
highest values were obtained for 0.25 mole% formlc aCldlCO~ mIxture Jnd the lowest

4 00
3 00 ,.. v --'"J ,..,.. ->.. 2.00 -'
'" :'Il ,.., ...... "0 ~
1.00
0.00 040 050
3.00 i
2.50 \... 1
0 2.00 1-.-
..J :il ~
>.. 1.50 ---., ..., ... ,... -.., 1.00 ---
050 -
o 00 30 40
Figure 3.16
- 61 -
• Anthracene 6 AnthraquInone  Pyrene
~ ~~. ~~----.
--6
0.60 070 080 0.90 1.00
Density (g/ml)
• Anthraqumone
~~ 6. Anthracene
... Pyrene
~ ... ""
~ ~
~--~" ~ ~_____ Â
~ ~---.6
50 60 70 80 90 100 110
Temperature (0 C) k' as a funcnon of denslty at constant temperature (6Q"C) and k' as a funcnon of temperature at constant densIty (0.7g!ml) MobIle phase: 0.87 mole% dichloromethane/O.16 mole% fornuc aCld/carbon dIoxlde.

- 62 -
3.50
• Anlhracene - Anthraquinone
3 00 \-f:::" Anlhracene - Pyrene
>. 2.50 f- ~ 1 ~
1
'S; 1 f:::,, __ ~
~ 2.00 ~ ~~ C,) Cl)
~. Q
Cf.l 1.50 r-
I .----1.00 r ~ 0.50 ~I __________________ ~~ ________________ ___
0.40
18 00 :
16.00 f-I
14.00 L-, 1
c 12.00 r 0 "
..... 10.00 1-.... -c 8.00 -1/l C)
"'" 6.00 -
4.00 -
2.00 -
a 00 0.40
Figure 3.li
0.50 0.60 a 70
• Anlhracene- AnlhraquInone
f:::" Anthracene - Pyrene
080 0.90
.------. . ------ : 0.50 0.60 a 70 0.80 a 90
DensIty (g/ ml)
1 00
: 00
Selectivlty (a) and resolutlon (b) as a functlon of denslty at constant temperature (600C). MobIle phase 0.87 mole % dichloromethane/O.16 mole% fonruc aCld/carbon dlOxlde.

:J 300
0.250 r
.---- 8.200 - ~ = -- 0.150 ~ ~ -:::
...::: 0.100 f... -:J l)
o 050 r-
2.000 30
4- 00
3.50 ~
3.00 , -
c -:::1 250 '-...... >, .2 00 ---~
-: l 50 - ----1.00 -J 50 -
000 30
Figure 3.18
-la
-la
- 63 -
• Anthraqulnone 1
\ ~ Anthracene
\ , \ \
50
50
At.. Pyrene
60 70 80 90 100 110
Temperature (OC)
• Anthraqulnone
~ Anthracene
At.. Pyrene
60 70 80 90 100 110
'~emperature (0 C)
Peak wldths ,a) and capaclty rauos (b) p!0ued agalflst temperature at constant densny (0.7 g/ml). Mobile phase: 0.8 mole% acetonitrile ln carbon dlOxlde.

3.00
2.50 ~
> 2.00 r
1.50 r-
l.OO 30
10.00
8.00 r-
= 6.00 ~ -..., -:: ~ ..., 1:
-t.00 -..., 'V
2.00 r-
0.00 30
Figure 3.19
- 64-
~ Anthracene - pyrene
.~ .. 1--.--. • Anthraqulnone - anthr~cene
40 50 dO 70 80 90 100 110
Temperature (0 C)
~ Anthracene - pyrene
~~6-~
~~ _ Anthraqumone - anthracene
---------/ .---4-0 50 60 70 80 90 100 110
Temperature (OC)
Selectivity (a) and resolution tb) as a funcuon of temperarure at constant densuy (0.7 g!ml). MobIle phase 0.8 mole% acetommle in carbon ruoxlde.

- 65 -
J200 ----------------------------------------
-- 0.150-
.; 0.100-
o 050 "-
J 000 a 40
3.00 1
2.50 ~
0 2.00 - 1
~ .y
>-. l 50
-.., ~ --.: l 00 -
'-"
050 -
J.OO a 4-0
Figure 3.20
T anthraauInone "] an thraèene • pyrer.e
0.50 0.60 0.70 0.80
Jensity (g/ ml)
T anthraquInone :J anthracene !I pyrene
.~ •
-~
0.90
.-"'----. -~ ___ "-....r-
'" -------T
'J 50 060 070 080 0.90
Jenslty (g/ ml)
: .00
: 00
Peak wldths ta) and capacny raum tb) as a funcuon of density at 60°C. ~lobile phase: 0.8 mole% acetomtnle ln carbon dioXlde.

>,
> -:.; ~
:l J)
3.00
2.50 -
2.00 -
1.50 -
1.00 r-
0.50 -
J.OO 0.40
8.00
6.00 -
~ 00 -
2.00 -
CJ 00 DAO
Figure 3.21
- 66 -
.. anhtraqulnone - anthracene
- anthracene - pyrene
0.50 060 0.70 0.80 0.90 00
Je:1sIty (g/ ml)
anthracene - pyrene
... anthraquinone - anthracene
0.50 o 60 0.70 080 a 90 : 00
JenSl ty (g/ ml)
Selecovlty la) and resoluuon (b) as J funcuon of denslty at constant temperature (60°C). Moblle phase: 0 X mole% ;lcetomtrile in carbon dioxlde.

.. - 67 -
values for the 1.26 mole% fonnie acidlearbon dioxide mobile phase. The
dichloromethane actually decreases the polarity of the mobile phase as compared to
the phase Wlth higher formic acid content, therefore decreasmg the solubllity of the
polar anthraquinone molecule. Anthracene IS retamed least m the
dichloromethane/formic aCld/carbon dioxlde mobile phase at lower densities, while
capaclty raUos are eqUlvalent to those ln the 1.26% foIT'1ic aCld/COz mobile phase at
higher densiues. CapaeIty rauos for pyrene are slmllar for both CHzCIJCH02HJC02
and CH02H/C02•
CapacIty ratio values were compared at equivalent denSIUes ( 0.7 glml) as a
funcnon of ternperature for the five mobile phases. Anthraq (l1none (FIgure 3.22b),
anthracene (Figure 3.23b) and pyrene (Figure 3.24b) showed decreases m k' values
with mcreasmg temperature, mdIcaung greater solvatlon of the solutes at hlgher
temperatures. Only siight changes were obtamed wnh the acetomtnle modified COz,
suggesnng that the k' is affectcd more by enhancement of solubIlity by this modifier
than ternperature. k' values for the dichloromethane/formic acid/ carbon dlOxide
mobile phase showed only a small decrease with increasmg temperature. At constant
denslty much greater changes m k' values were obtamed for small changes in density.
At 6O"C only two denslties were mvesugated for the acetomtnle/carbon dioxlde mobIle
phase.
ln thls study plate helght cornpanson could not be camed out. smce a change
In denslty and/or temperature results In changmg hnear velocltIes. Inforrnanon on
peak shape and symmerry is mcluded III plate helght and plate number measurements.
Peak dIstortion dunng the length of orne a ~ubmate mlgrates through the eùlumn IS
dependent on the linear veloclty of the eluent. Chromatograms of the t~st mIxture are
compaœd at eqUlvalent denslues of 07 g/ml and a temperature ",.- 60°C (FIgure 3.25).
Addmon of the modIfier has decreased the analysls urnes, especmlly for the larger
compo'..lnos, for each type of modJtïer. Although dlchloromethanc was added ta the
fonrue aCld modIfied CO~ ta Increa~e the ~olublhty of the compounds ln the mobIle
phase. Il had htùe etfect on retentlOl1 tImes. Peak shape of ~ome compounds change
nouceably; a greater response and ~harpcr peak was obtamed for pyrene and a

250
2.00 -
o
1 50 -
1.00 -
o 50 -
- 68 -
y CarDon alOXlde - 0 25 ~ formlc aCla
_ l 26 ~ formlc <1CIQ
~ 0 87 ~ dlchlaromelhane o :6 ~ (ormlC <1Cld
.. 0 8 ~ aLetonttnie
C) 00 -------------------JO
3.00
? 50 -0
2.00 i-..... ";l ~,.
>, 1.50 ---... ~
~ - . 00 'J -. '-"
J 50 -
, 00 v
0.40
Figure 3.22
-;0 50 60 70 ria 90 100 :: 0
~emperature \0 C)
Y
\ -\
\ \
'\ ...... -\
\ \ \ , , \
T
• -\
Carbon QIOXlde 0.25 % formlc aCld l 26 ~ rormlc aCld o 87 % dlcnlaromethane 1
0.16 % farmlC aCld
\ \ \
,\ \ \ '\\' \ \
\\" ~~~
~ ~~ ~
a.50 0.60 070 o 80 J 90 co Jenslty (fJ,/:nI)
Plot of k' versus temperature at constant density (0.7 g/ml) (a) and versus densuy at constant temperature (60"C) (b) for anthraquinone.

J 00
250
~ - :2 00 -;:)
-v
:>, 1 50 :-,-,
-:l -... V 1 00 -.
>oJ
(] 50 -
'J OG 30
, 00
" 50 -L.J
'J 00 -cJ
0
'J 2.50 --.J
:..... -, 00 - - --~
- 50 --':; . 00 -
1 50 -
~ 00 'J
J 40
Figure 3.23
.""
40
J 50
50 60
- 69 -
... CarDan alaxJde o 25 % formlC aCld
• 1 26 % farmlC aCld. ~ 0 87 ~ dlcnlaramethane 1
o 16 % formlC aClQ Â 08 % acetamtnle
70 80 90 1 00 110
'~emperature (0 C)
. \ , - '
J 60
... Carbon cloxlde o 25 % farmlc aCld
• : 26 % farmlc aCld ~ 0 87 % dlcnlaromethane 1
0.16 % formlC aCld
J.70 Q 80 090 : 00
~C:1S1ty (g/ ml) Plot of k' versus temperature al constant denSlty LÜ.7 g/ml) (a) :md versus densny at constant temperature (60°C) (b) for anthracene.

0 -...J "j
:::: >-" -.J
,"j ~ -.~
-~
8.00
7 00
6.00 -5.00
""'"
4-.00
3.00
2.00 -
1 00
000 30
t 0.00
8.00 -
5.00 -
.; 00 -
.: 00 -
J 00 JAO
Figure 3.24
'Y \
--i0
\
50 60
- 70 -
'Y Carbon clOxlde a 25 ~ formlc aCld
• 1 26 ~ formlc aCld ...:::. 087 <-; tilcnloromethane:
o 16 ~ formlc dCld • a 8 ~ acelomtnle
70 80 90 100 ; 10
~emperature (0 c:
.. Carbon C110xlde _ 0.25 ~ formlc .lcld • 1.26 ~ formlc ë!cld il 0.87 ~ dlchloromethane 1
o 16 ~ formlc aCld
J 50 J 60 1] ,a J 80 J 90 . JO
JensIty (g/:nl)
Plot of k' versus temperature at con~tant den~lty (07 yml) (a) and velSUS densny at constant tempe rature (60°C) (b) for pyrene.

5 6
: 11 ' \
J
1 ;; il
'N~ 1) 1
,l \ Il J '----..' ,
JO :0 .10 130
"6
Ji , 0 ::J 40 ':30
Figure 3.25
- 71 -
C02 10.01 Au
:; 6 1.26% CH02H . 1
, in CO2
7
\ 7
,\ 1 1
L 'L' '- _{ 1 ~
ao la 0 12.0 0.0 :.0 40 i3 a a.o
1 -0.8% CH 3CN
1 1
0.87% CH2CJ2 in C02
,\
0.1(;% CH02H in CO2 :2
~ 1 1
Îf\~ L _( J----J
30 ')0 :0 40 '30 30
TIME (MIN)
Chromatograms of model compounds ln three modlfied and slll1ple carbon dioxlde mobIle phases at constant temperature (60"C) and èqunalem densmes tO.7 g;ml).

- 72 -
decreased response for anthracene was recorded. The addItion of acetomtnle modifier
to the carbol1 dioxide resulted in better resolution between anthracene and
anthraquinone and increased response for the pyrene, anthracenc and anthraquInone,
indicating greater solubility of these compounds in this mobile phase.
3.3.3.2 Effects on enthalpy of transfer between mobile and stanonary phases
At constant pressure, the dependence of capaclty ranos on temperature can be
calculated by the van' t Hoff equanon,
where LlH =
6.H
R (3.9)
enthalpy for the transition of a solute between the mobile and stauonary phases.
At constant density, the slope of the plot of ln(k') as a functlon of the Inverse
ternperature is eqllal to the effecnve enthalpy of solute transfer between the mobile
phase and stationary phase, according to the followlng equauon,
(aInk') -- - ô aT-1 p
+ dB - ÂBT (3.10)
Plots of ln(k') as a function of the inverse of temperature (van't Hoff plots) are
!inear. The slope of the se plots represents the tramitlOn enthalpy. Figures 3.26 - 328
are representatlve for anthraquinone' enthalpy values are summanzeù In Table 3 1 A
!inear dependence ot enthalpy \Vith denslty, where the greatest ~olvatlon occurs at
hlgher denslties (less ncgauve valuc~) IS mdIcatlve ot cl pamuon-iIke mecham ')m.
Non-lineQ: behaVlOur IS attnbuteù to 'iolvatlon or ~welhnb of ùle bonùed pha~e by the
mobIle phase. Enthalpy values have been plotteù for anthnqulI10ne (Figure 3.29),

- 73 -
3.00 1
2.50 r y 0.5 g/ml ::J 0.6 g;ml
• 0.7 gjml '\ 0.8 g/ml .2 00
..... Â o 9 g/ml
y 1
1 / ~
50 ~ ..,;~ / /
1
1
/ fJ / / • : 00 ~ y LJ /
,,--...
1/ ...:, 0.50 '-' --1 -
cI/~ 0.00 1 -0.50 f- .~/ 1
1 -: / /
-: 00 f-- ~
-;. 50 ~-
1 1
-2.00 1
.2 00 .2 ..;Ù 2 80 320 J.60 -t 00
l/T(K) \,<1000)
Figure 3.26 van' t Hoff plot for amhraquInone In supercnncal carbon dioX1de.

- 74 -
... 0.5 g/ ml
2.00 r- :J 0.6 g/ ml T • 0.7 g/ml j
6 08 g/ml <if
 ').9 g/ml 1 1
C ... 1 00 r- I
1 ... ,Z) ~ 1 - Y J1 • ...:::: -- / - ;j • - /
a 00 f- ;J' ~ / :3 .-• / ;S . ,. L/ -1 00 - • c:
2.00 2 . .t0 2.80 320 J 60 -t 00
l/T(K) (xl000)
~.uu 1 ... 0.5 g/ml ~ 06 g/ml
• 07 g/ml ! , 6 0.8 g/ml
1.00 - 0.9 g/ml 1 ... :.é.J
& ,'" /
J ... :J • 1 -----.
ï • -.-J.OO -
'-
'--" .:.., 1 - 4 - ...,. • - 1 ~ • /
 • ~ , ,;s.' A
-: 00 - • .' /
j.
-2.00 ~' --------------------------------------2.00
Figure 3.27
2.40 2.80 3.20 J 60 .t 00
van' t Hoff plot for anthraqulnone ln (a) 0.25 mole% and (b) 1.26 mole% fonruc acid ln carbon dioxlde.

l'
- 75 -
1.50 ~------------------
1.00 ~
0.50 r
0.00 r
-0.50 f-
-1 00 ~
T 05 g/ ml :J 0.6 g/ ml • 0.7 g/ml
/ 6 0.8 g/ml -/" • 0.9 g/ml 1
y
-1 50 --------------------2.00 2.40 2.80 3.20 3.60 4.00
l/T(K) (xl000)
1.00 ~------------------
1 0.50 r
o 00 -
-0 50 ....
:J 0.6 g/ml _ 0.7 g/ml
6 0.8 g/ml ! ]J 1
iCJ /
J .,-
It" / . /
-100 ---------------------~ 00
Figure 3.28
2.4-0 :2 80 320 3 60 -+ 00
l/':'(K) (xl000)
van 't Hoff plot for anthraquinone In (a) 0.87 mole% Π2C12l'0.16 mole% CHO:HJC02 and (b) 0.8 mole% acetommle in carbon dloxlde.

--~--~-------------
- 76 -
Table 3.1 Linear regression of van't Hoff plots
Compound Anthraq uinone Anthracene Pyrene
Mobile phase p Slope r Slope i Slope i
CO2 0.5 -10.74 0.9060 -10.17 0.9347 -10.85 0.9258 0.6 -10.99 0.9865 -10.83 0.9896 -11.54 0.9912 0.7 -9.09 0.9929 -9.l3 0.9960 -9.71 0.9964 0.8 -7.63 0.9777 -7.80 0.9914 -8.51 0.9988 0.9 -7.28 0.9938 -7.38 0.9996 -7.92 0.9982
CH02H (0.25%) 0.5 -10.63 0.9979 -10.63 0.9978 -10.61 0.9978 0.6 -9.79 0.9985 -9.31 0.9963 -9.90 0.9964
in 0.7 -8.94 0.9995 -8.55 0.9998 -9.17 0.9582 0.8 -9.16 0.9999 -8.30 0.9998 -7.77 0.9692
CO2 0.9 -6.95 0.9806 -7.67 1.0000 -7.86 0.9958
CH02H (1.26%) 0.5 -10.06 0.9864 -9.83 0.9849 -10.31 0.9878 0.6 -8.46 0.9932 -8.71 0.9992 -9.12 0.9988
ln 0.7 -9.09 0.9966 -8.80 0.9982 -9.15 0.9978 0.8 -8.61 0.9982 -8.40 0.9991 -8.48 0.9996
CO2 0.9 -8.97 0.9997 -8.02 1.0000 -875 0.9996
CH2C12 (0.87%) 0.5 -13.75 0.9760 -12.23 0.9876 -13.03 0.9860 CHOzH (0.16%) 0.6 -9.61 0.9542 -7.70 0.9914 -941 0.9740
in 0.7 -8.83 0.9388 -7.65 0.9586 -7.76 0.9506 CO2 0.8 -6.84 0.9752 -6.83 09645 -6.85 0.9655
0.9 -5.68 0.9423 -5.71 0.9569 -5.91 0.9803
CH3CN (0.8%) 0.6 -9.75 0.9926 -9.53 0.9942 -9.86 0.9962 in 0.7 -4.06 0.9196 -4.21 0.9454 -4.44 0.9561
CO2 0.8 -2.58 0.9997 -2.63 0.9996 -2.90 0.9519

0.00
-2.00 -
-4.00 --:: -.--~ -6 00 - -~ ~
.J ........ >, ,.... .... -8.00 -
'. :-:: ----..:.0
-10.00 -
- 12.00 -
Figure 3.29
y
• ,
'-'
...
- 77 -
CarDon QIOXlde
a 25 % forrmc aCld
1 26 % formlC aCld
0.87 % àlchloromethane / a 16 % :ormlC aCld/
a 8 % acetomlnle /
o 50 o 60 070 0.80 0.90 1 00
Jenslb 'a l ml) . \01
Enthalpy as a funcuon of denslty for anthraquinone for each mobile phase mvesugated.
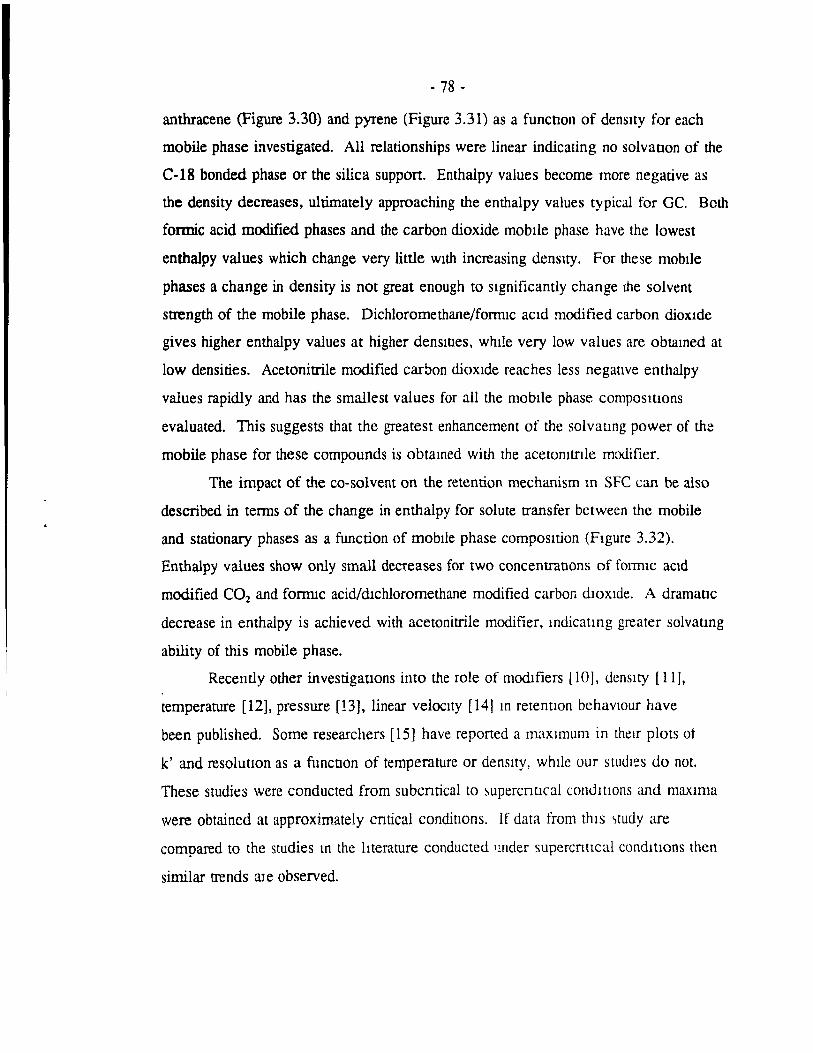
- 78 -
anthracene (Figure 3.30) and pyrene (Figure 3.31) as a funcoon of denslty for each
mobile phase investigated. AlI relationships were !inear indicating no solvanon of the
C-18 bonded phase or the silica suppon. Enthalpy values become more negative as
the density decreases, ultimately approaching the enthalpy values typical for Ge. Beth
formic acid modified phases and the carbon dioxide mobIle phase have the lowest
enthalpy values which change very little With increasing densIty. For these mobtle
phases a change in density is not great enough to slgnificantly change me solve nt
strength of the mobile phase. Dichloromethane/formlc aCld modified carbon dioxlde
gives higher enthalpy values at higher denslues, whlle very low values are obtamed at
low densities. Acetonitrile modified carbon dioxlde reaches less negauve enthalpy
values rapidly and has the smallest values for all the mobIle phase composlOons
evaluated. This suggests that the greatest enhancement of the solvaung power of th~
mobile phase for these compounds is obtamed with the acetamtnle modifier.
The impact of the co-solvent on the retention mechanism ln SFC can be aiso
described in terms of the change in enthalpy for solute rransfer between the mobile
and stationary phases as a funcrion of moblle phase compoSItion (FIgure 3.32).
Enthalpy values show only small deC1"eases for two concentrauons of fOlIDIC aCld
modified CO2 and fonruc acidldlchloromethane modified carbon dlOxlde. A dramauc
decrease in enthalpy is achieved with acetonitrile modifier, mdicatmg greater solvaung
ability of this mobile phase.
Recently other investigaoons into the role of modtfiers [10], denslty [111.
temperature [12], pressure [13], linear veloclty [14J m rerentlOn behavlOur have
been published. Sorne researchers [15] have reported a maXImum in thelr plots ot
k' and resoluoon as a funcnon of temperature or denslty, whtle our slUdles do not.
These studies were conducted from subcntical ta ~llpercnural condwons and maxIma
were obtained at approximately cntical condinons. If data from thIS ~tudy are
compared to the studÏes 111 the hterature conducted lmder supercntlcal condlt1ons then
similar trends rue observed.

. '
-0 ::: -"-It! C.l -~ c.. It!
..c: ... ::::
::J
- 79 -
0.00 ;-----------------
-2.00
-4.00 .....
-6.00 f-1
:
1
-8.00 r-
-10.00 f-
-12.00 ,
-14.00 0.40
Figure 3.30
" Carbon dloxlde
0.25 70 formlC aCld
• 1.26 % formlc aCld
2. 0.87 70 dlchloromethane /~ 0.16 % formlc aCld 1;./
li. 0.8 % acetomtrIle
!
0.50 0.60 0.70 0.80
Denslty (g/ml)
0.90 : .00
Enthalpy as a function of densiry for anthracene for each mobile phase investigated.
•
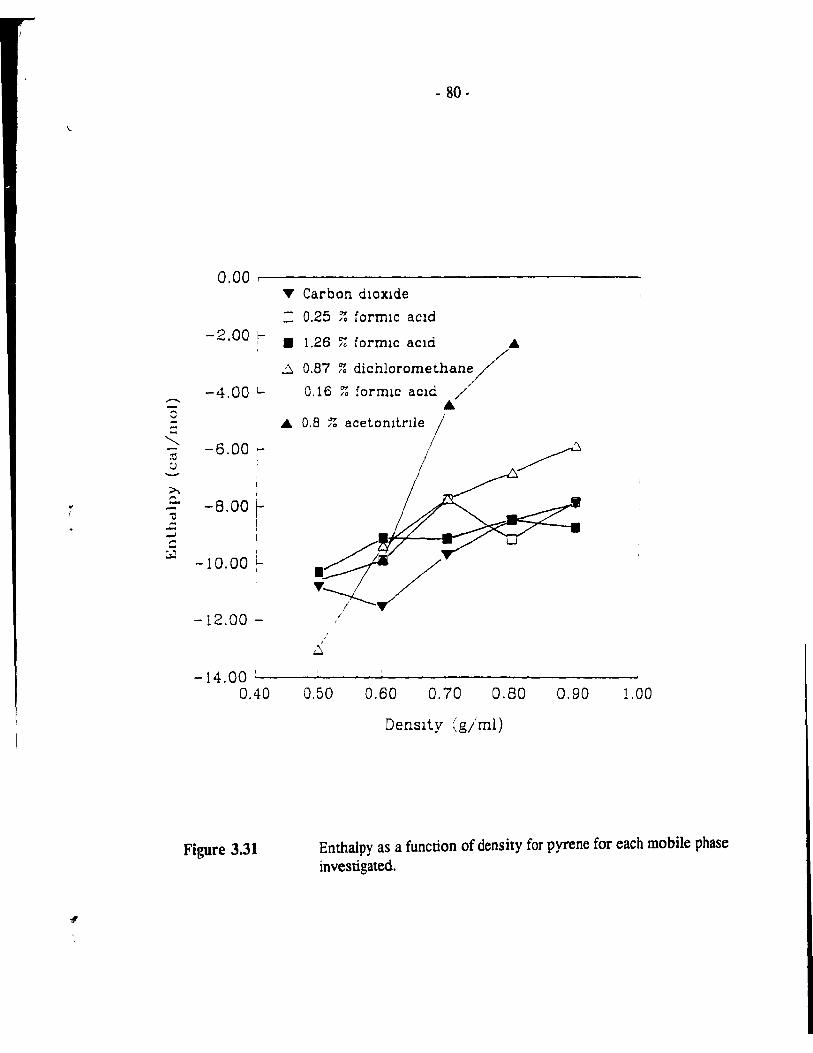
\.
0.00 1
-2.00 r-
-4.00 l-" '" " = "- -6.00 i-:tl ~ -- 1
>. 1
1
~ Co -8.00 r -1 '<l - i --'
1 ::: :il 1
-10.00 ~
-12.00 -
-14.00 1
0.40
Figure 3.31
~
• ~
Â
- 80·
Carbon dloxlde
0.25 ;: formlc aCld
1.26 ~ formlc aCld .... 0.87 % diChloromethany
0.16 ;: :orrmc aCld / Â
O.B % acetomtrlle ./
, i
0.50 0.60 0.70 0.80 0.90 1.00
Denslty (g/ml)
Enthalpy as a function of density for pyrene for each mobile phase investigated.

-2.00 1 1
i 1
1
-4.00 ~
--0 ~ ... -6.00 1"" "-r:: ., " ->... c.. -r:: -8.00 1 .=
...;,
c :::J 1
1 1 1
1
-10.00 r :
-12.00
Figure 3.32
• 81 -
" AnthraquInone LJ Anlhracene
• Pyrene
1 hl / "
:\iP 2 MP 3 MP 4- MP 5
Moblle Phase Composition
Enthalpy as a function of mobile phase composiuon at a densuy of
0.7 g/ml.

'.
- 82 -
3.4 Conclusion
A model for the dependence of chromatographic parameters (k', N, n, R) on
temperature, density pressure, linear velocity and mobile phase composition requires
instrumentation capable of varying one physical parameter independent of all others.
At present this is not possible; studies of changing temperature under constant density
conditions results in non-linear pressure changes and changes in density at constant
temperature varies the linear velocity of the mobile phase. These studies on the
retention behaviour as a function of physical parameters for a given chromatographie
system provide a means to determine initial conditions for a particular application.
Changes in retention are best understood in terms of changes in density for a particular
mobile phase, where the capacity ratio decreases non-linearly with increasing density.
At higher densities, the linear velocity also increases causing the solute to elute faster
from the column, decreasing analysis times. An increase in temperature leads to a
decrease in density with the resulting increase in retention. At constant density
retention is only slightly affected by temperature.
The mobile phase modifier can alter the chromatographie process by increasing
the solubility of the solutes in the mobile phase and by modifying the stationary phase.
Although fonnic acid was added to supercritical carbon dioxide to coyer up the active
sites on the silica suppon, the decrease in both the peak widths and capacity ratios
indieate both a modification of the stationary phase surface and the properties of the
mobile phase. Dichloromethane modifier slightly increased the solvation of the solutes
in the mobile phase. Acetonitrile doped carbon dioxide greatly improved peak shape
for later eluting species and decreased analysis times. The less negative enthalpy
values for the acetonitrile modified COz demonstrates the greater solvating ability for
this modifier.
- 83 -
3.5 References
1. J.C. Giddings, M.N. Myers, L. McLaren, and R.A. Keller, Science, 162 (1968) 67.
2. F.P. Schmitz and E. Klesper, J. Chromatogr., 357 (1987) 3.
3. L.M. Bowman Jr., Doctoral Dissertation entitled Dense Gas Chromatographie Studies, University of Utah, Salt Lake City (1976).
4. S.M. Fields, K.E. Markides, M.L. Lee, J. High Resolut. Chromatogr. Chromarogr. Commun., 11 (1988) 25.
5. J.M. Levy and W.M. Ritchey, J. High Resolut. Chromatogr. Chromatogr. Commun., 10 (1987) 493.
6. M.E. McNally, J.R. Wheeler, and W.R. Melander, LC-GC, 6 (1988) 816.
7. P. Mourier, P. Sassiat, M. Caude, and R. Rosset, J. Chromatogr., 353 (1986) 61.
8. P.R. Sassiat, P. Maurier, M.H. Caude and R.H. Rosset, Anal. Chem., 59 (1987) 1164.
9. K.D. Bartle, Theory and Principles of Supercritical Fluid Chromatography, in Supercritical Fluid Chromatography, ed. R.M. Smith, Royal Society of Chemistry Burlington House, London (1988) Chapter 1, pl.
10. F.O. Geiser, S.G. Yocklovich, S.M. Lurcott, J.W. Guthrie and EJ. Levy, J. Chromatogr., 459 (1988) 173.
11. P.J. Schoenmakers, P.E. Rothfusz and F.c.e.J.G. Verhoeven, J. Clzromatogr., 395 (1987) 91.
12. D. Leyendecker, EP. Schmitz and E. Klesper, J. Chromatogr., 315 (1984) 19.
13. R.D. Smith, E.G. Chapman and B.W. Wright, Anal. Chem., 57 (1985) 2829.
14. S.Shah and L.T. Taylor, Anal. Chem., in press.
15. D. Leyendecker, D. Leyendecker, F.P. Schmitz and E. Klesper, J. Liq. Chromatogr., 10(8+9) (1987) 1917.

Chapter 4
Analysis of Pbenotbiazinones in Plasma by Packed Column SFC
4.1 Introduction
Leukotrienes are believed to play an important pathophysiologicaJ role in the
allergie broncoconstriction of asthma. Under normal physiological conditions
leukotrienes and prostaglandins behave as chemical mediators in maintaining
homeostasis in their micro-environment. When conditions bec orne so hostile that
normal homeostasis cannot be achieved, then full inflammatory response occurs.
Arachidonic acid, stored in membrane-bound phospholipids, is then released by
phospholipases. Enzymatic conversion of arachidonic acid then proceeds through one
of several routes {Figure 4.1). The cyclo-oxygenase pathway produces prostaglandins,
prostacyclin and thromboxanes. The formation of leukotrienes is initiated by 5-
lipoxygenase and dehydrase producing leukotriene A4, an epoxide intermediate.
Hydrolysis of LT ~ results in the formation of leukottiene B4' Leukotriene CM fonned
by the incorporation of glutathione in L T A4, undergoes further conversion to form
leukotriene D4 and leukotriene E4'
Leukotriene C4 and D4 are pepùdo-lipid conjugales which collectively account
for the biological activity known as the slow reacting substance of anaphylaxis. They
have patent smooth muscle conrracting activity and high structural affinity for specifie
receptor sites. In addition the se leukonienes promote rnucous production, decrease
mucocilliary clearance, modulate vascular permeability changes. are potent
inflammatory agents ln human ski n, and may be mvolved in the induction of non
specifie bronchial hyperactivity. The sulphidopeptide leukotrienes, LTC4 and LTD4,
- 84 -

- 85 -
:;'fCLO-OXYGENASE 1 ~ o\RACHIDONIC ACIO
LlPOXYGENASE
C,H
) """,.,/"'-~./~~ ,
ÜIOIH
::>C'lOSTAGLANDIN G,
':---.. ~CO,H o :l~'
OH 7HROMBOXANE A,
OH
~""""'CO,H
'<0' -':l,' ......... ~~,~
OH
~HROM80XANE 8,
OOH :::EHYDRASE
~,~,,-"".../'''''''
5-MPETE
-iYOROlASE /
HO~,~ ./"--.../~ "0 ~ ,H
OH
~/ LEUKOTRIENE 8.
CH,CHCO,H
S NH, , /~~/- "../'....---"
OH
_EUKOTRIENE E.
JIPEDTIDASE
Figure 4.1 Cyclo-oxygenase and 5-lipoxygenase pathways.
.EUKOTRIENE A.
GlUT A THIONE- ~
TRANSFER~SE t
CH,CHCOHHCH,CO,>
5 NHCOCH,CH,CH , NH
/-.... ... "-"/'//-~-~ ......
OH
.EUKOTRIENE C.
!GGTP
t
CO,H
CH,CHCOHHCH,cO,. NH,
OH
.:UKOTRIENE D.
l - 86 -
are thought to be imponant mediators of human bronchial asthma and allergic
diseases, They are also potent vasoconsmctors for both coronary and cerebral
circulation, hence have important cardiovascular implicatIons.
Leukotrienc B4 is a hydroxyeicosatetraenoic acid which has a high affinity,
structurally specIfic receptor sites on the neutrophil cell surface. Int~raction with the se
receptor SItes !eads to inductIon of neutrophil cell functions including chemotaxis,
chemokinesis and aggregation. In addition a subpopulation of both helper and
Juppressor T-cells have receptor sites for leukomene B4, interaction with which results
In :ut overall immunosuppresslve effeet. Injection of leukotriene B4 into arumal
modeh or man results in induction of leucocyte accumulation. vascular perrneability
changes and modulation of pam responses suggesting that this lellkoment: is an
Important mediator of inflammatIon.
Potential 5-lipoxygenase mhibitors are chosen according ta the following
critena. (i) To compete Wlth arachidonic aeid for the 5-lipoxygenase enzyme, the
inhibitor must have structural similarity with the substrate. In particular, the inhibitor
should possess a moiety bearing slgnificant lipophilic and it character, mimicking
aradlldonic aeid; (ii) The generally accepted mechanism of lipoxygenation of fatty
aClds suggests an electron transfer from a skipped diene (1,4 Z,Z diene) followeè. by
proton abstractIon and the trappmg of the resultmg radical by oxygen to gtve nse to a
hydroperoxy derivative. To funcuonally lTIlmic the substrate of the enzyme, chemical
entities known to favour an electron transfer process must be incorporated in the
desIgn of the inhlbitor [IJ.
Studies using aromatIc tricyclic derivatives in the alteration of the biologtcal
activities of prostanoids [2J, combined with their lipophilic and 1t character, led to the
study of tricyclic compounds with a heterocyclic nng, which could potentially permit a
facllitated electron transfer. U sing these concepts it wa~ found that phenothiazines and
therr oxidized fonn, phenothiazmones, were selectlve mhlbitors of the 5-lipoxygenase
enzyme. One denvanve of phenothiazmone c1ass of compounds L65l,392 (4-bromo-
2.7-dimethoxy-3H-phenothiazin-3-one) [lJ has shown potency as an oral drug for
inhlblùng leukotriene-mediated allergie responses. Such a compound may prove

- 87 -
useful in elucidating the role of 5-lipoxygenase products in biological and pathological
processes both in vitro and in vivo. The separanon and detection of plasma levels of
the se phenothiazinone compounds (Figure 4.2) are imponant in their development as
drug therapy.
Information from the studies conducted m the previous chapter was used to
develop a separation strategy for a series of phenothiazinone compounds. The
behaviour of the se compounds was invesngated under changmg condinons of
temperature, density and moblle phase composition. An assay for 4-chloro-3H
phenothiazin-3-one (L615,919) in plasma is descnbed. The electrochenucal acnvity of
these compounds was also Illvestigated as potennal candidates for electrochemical
detection in SFC.
4.2 Experimental conditions
For exverimental details see sections 2.2.3.1 - 2.2.3.7 in chapter two.
4.3 Resulfs and Discussion
4.3.1 Retennon behavlOur 10 supercnncal carbon dioxide.
The behaviour of one analog, 4-bromo-2,7-dImethoxy-3H-phenothIazm-3-one
(L651,392) was studied under various chromatographic condItions. Imtial expenments
were conducted on a C-18 bonded phase column Wltn supercntlcal carbon dIoxlde as
the mobile phase. At a temperature of 40°C and pressures below 3500 pSI (d = 0.85-
0.90 g/ml) compound L651,392 does not elure wlthm a run ume of 15 mmutes. At
3500 psi, the an alyte elutes as a very broad peak at k' = 12.7, and upon mcreasmg to
4500 pSI the front end of the peak begins to sharpen and retentIon decreases, k' =
7.11. Chromatograms obtamed at mcreasmg temperarures (60, 80 , & lOOoe) and
constant pressure (4500 psi) showed sharpening of the front end ot the analyte peak
and a slight reductlOn in retenuon ume. lmprovements ln peak. t:111ing were not

- 88 -
observed. Retenuon of L651 ,392 is most likely due to more than one mechanism. At
higher temperarures the solubIlity of the compound increases resulting in a sharper
peak front. Tailing of L651 ,392 is probably due to interaction between one or more
substituents on the molecule with active sites on the silica support. Two expenments
were carried out to eluclClate the retention mechamsm. (i) A srudy of the behaviour of
similar molecules with various substituents revealed the particlpating grOUD and (ii)
the use of a modifier to cover-up the active sites minimized interaction Wlth the
stanonary phase, resulting in less peak tailing. A series of phenothiazinone
compounds were chromatographed at 4500 psi and 80 Oc (Figures 4.3 and 4.4). The
peak shape and elution order of the series is very much dependent on the substituent
groups on the molecules. L615,919 (4-chloro-3H-phenothiazm-3-one) elutes as a
sharp peak at k'= 1.06, it is the least retained of the senes. L649,991 (l-methyl-2-
propylsulfide-phenothiazin-3-one) also elutes as sharp peak at k' = 1.44, lt has a
slighùy increased retention due to the large substituents as compared to L615,919.
L653.849 (7-methoxy-4-amino-phenothiazin-3-one) shows sorne tailing and increased
retention, suggesting that the methoxy group may interact with acuve snes on the
chromatographie support. L649,927 (benzo(a)-phenothiazin-5-one) elutes with
increased retention indicating that the large benzene ring retards its mobility and the
lack of peak tailing is supported by the lack of polar groups 10 interact with active
sites on column. The two methoxy groups on L651,392 results in slightly longer
retention and a substantial incre .. se in tailing. L653,086 (4-mtro-2,7-dimethoxy-3H
phenothiazin-3-one) which is similar in structure to L651,392 with its bromine
replaced by a nitro group, is retained for a very long time reFulting in an extremely
broad peak.. This compound is not very soluble in dichloromethane, therefore its
solubllity ln carbon dioxlde may be not great enough to remove the compound from
the stationary phase.
In order ta obtain separauon of a mixture of the first four compounds with
reasonable resolution and an improved peak shape for the inruvidual compounds a
density or temperature gradient was necessary. Detennining the actual values for such
a graillent reqUIres sorne knowledge of the prinCIpal mechanism of retentIon, therefore

cc::yo CI
L-615,919
L-653,849
CH)
CCN~ ~ s
0 L-649,991
0
- 89 -
L-649,927
Br
L-651,392
fXN~ 1
h ~ CH 30 ~ S
N02
L-653,086
Figure 4.2 Structure of phenothiazmone compounds.
OCH3

... i
- 90-
their behaviour was studieu under various conditions of temperature, density and
mobile phase composItion.
4.3.2 Effect of modifiers on retention charaeteristies.
Chromatographie behaviour is govemed by the interaction of the analyte with
(i) the bonded stationary phase, including active sites on the chromatographie suppon;
(ii) the mobile phase, inc1uding its solubility in the mobile phase or; (iii) the volatility
of the species of interest; or (iv) some combination of the se effects. As was shown in
Chapter 3, modifiers, in the form of organic solvents, in the supercritical mobile phase
can alter the stationary phase by eovering up active sites, or by altering the solvent
strength of the mobile phase. The choice and concentration of the modifier detenmnes
us effect. Fonrue acid (0.25 mole%) was added to the supercritical carbon dioxide
mobile phase in order to cover up active sites on the stanonary phase. Four analogs
L615,919, L649,991, L653,849, and L649,927 were each injected at 100 ngllJl under
conditions of constant density and varying temperarures for supercritical carbon
dioxlde with 0.25% fonnic acid mobile phase. Retention times, peak wldths and
heights were recorded for the average of four injections. Addition of the fonnie acid
modifier reduced capacity ratIo values for a11 compounds as compared to the values
obtained with simple supercritical carbon dioxide mobile phase. At a density of 0.9
g/ml, chromatograrns were obtained betw~en 60 - 80°C, higher temperatures required
very large pressures not fcasible wnh current instrumentation. Capacny ratios for the
four analogs increased from 60 to 7rtC and decreased al 80°C to values below those
recorded at 6(fC {Figure 4.5b). The decreased capaeity rauos at 80°C are a result of
Increased solubility of the anal y tes at the hlgher temperarure. Peak wldths generally
Increase propomonally with retenuon time, therefore a plot of peak wldths at half
helght versus temperature should have a sinular pattern to that of capacity ratIo plots
(Figure 4.5a). Although L649,991 IS retamed slightly longer than L615,919, its peak
wldths are smaller, suggesung that the lower polanty of the former nummlzes lts
InteractIon with the s11ica support and its increase in retention IS governed by its
lncreased interactIon wuh the bonded phase. The same compounds were investigated

1 - 91 -
_.uL L-615.919
{
0.01 Au
L-649,991
l ' • 1
-_lU \'-- L-653,849
1 1 1
0.0 2.0 4.0 6.0 8.0 10.0
Figure 4.3
TIME (MIN)
Chromatograms of phenothiazinone analogs at 8erc and 4500 pSI
in supercritical carbon dioxide.

'" 0 J.
Figure 4.4
4.0
'·92·
L-649,927
0.01 Au
L-651,392
L-653,086
1
8.0 12.0 16.0 20.0
TIME (MIN)
Chromatograms of phenothiazinone analogs at 800C and 4500 psi in supercritical carbon dioxide.

- 93 -
at a lower density (0.7 g/ml) and higher temperatures of 8C to lOOOC. Although the
density and consequently the solvent strength is decreased the compounds eluted with
similar capacity ratio values as those recorded at the higher density (Figure 4.6a). This
suggests that the solubility of the analytes is greater at higher temperatures. At lOOOC,
the capacity ratio decreases considerably suggesting that the incœase solubility of the
analytes at higher temperatures contributes to the retention mechanism at this
temperature. The plots of peak width at half height as a function of temperature
reflect the change in capacity ratio (Figure 4.6b).
As with the study of the model compounds in Chapter 3, a funher increase in
formic aeid content resulted in little change in capacity factors, indicating that the
original concentration was sufficient to decrease the interaction of the analytes Wlth
active sites but a funher increase in concentration had no influence on me mobile
phase interactions. A thircl component, dichloromethane, was added to the mobile
phase in àn attempt to increase the solubility of the phenothiazinone compounds in this
phase. It had no visible effects on retention times but did show sorne differences in
peak shape. In Figure 4.7, chromatograms of three compounds of the series are
compared at equivalent densities and temperatures for the formic aeid and the fonnic
acidldichloromethane modified supercritical carbon dioxide phases. L615,919, the
phenothiazinone with a chlorine substituent, showed an increased peak helght and
better peak shape in the tertiary mobile phase. Peak height and peak tailing improved
more for L653,849, the compound with the one methoxy substituent, upon the addition
of dichloromethane ta the mobile phase. No difference was observed for L649,927,
the phenothiazinone with the large aromatic subsutuent 10 binary and ternary mobile
phases. This suggests that the addition of dichloromethane increased the solubility of
the more polar compounds in the mobile phase with the improvement decreasing as
the molecule becomes less polar.
4.3.3 Separation of phenothiazinone analogs.
Separation of a mixture of the phenothiazinone compounds wah reasonable
resolution and improved peak shape necessitates the addition of a modifier to the

5.00
4.00 -
c .-c 3.00 r :::: >. -c..; c 2.00 t-e.. c , , --
1.00 t-
0.00 50
'Il o.eoo 1
" 1 . "
0.600 ~
-~ -v ..." ::.- OAOO --::. ç ,:,)
" --
0.200 -
0.000 ' 50
Figure 4.5
L
- 94-
6 L649,927
• L653,849
:J L649,991
... L615,919
60 70 te)
80 90 Temperature
6 L649,927
... L615,919 ~ L649,991
~6 ~
60 70 Temperature te) 80 90
Capacity ranos (a) and peak. widths (b) as a funcnon of temperature at a density of 0.7 g/ml. Mobile phase: 0.25 mole% formie acid.
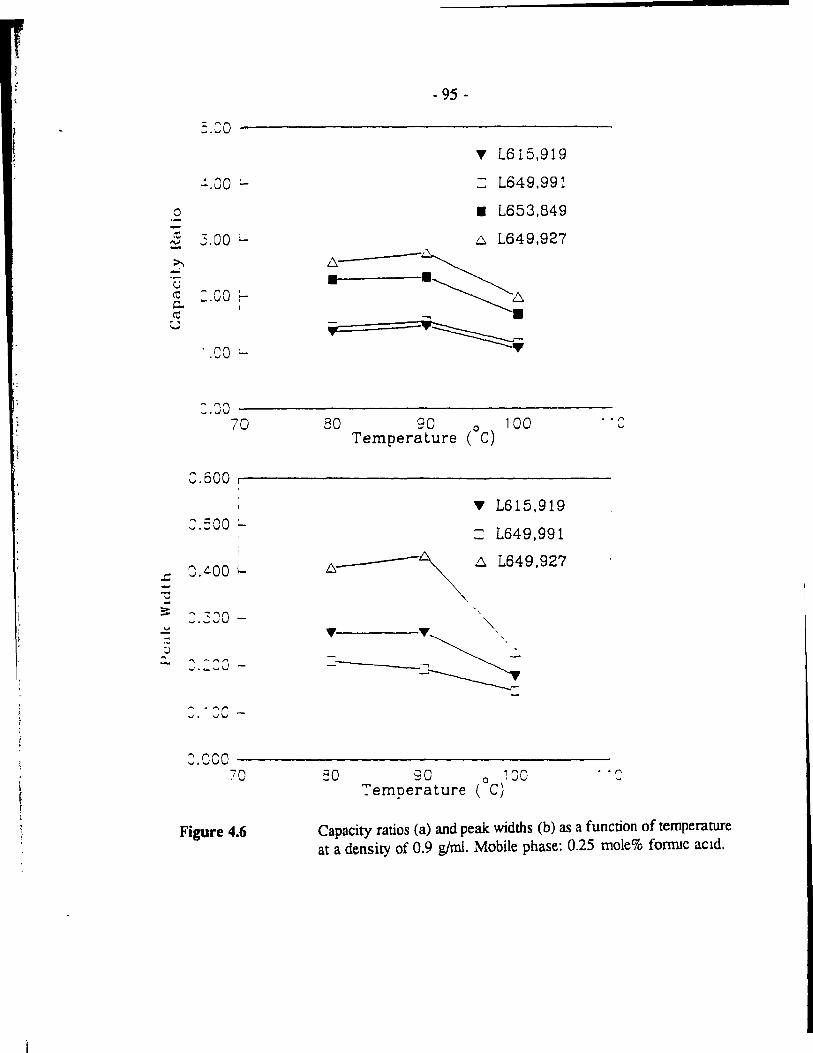
:.20 .
':'.00 :....
0 -(';) .3.00 :-'V
>, -' ü (i) :.00 r-c... 1
(i) . , '-'
• '"'1"\ ' .vv -
Figure 4.6
- 95 -
~ L615,9 1 9 ~ L649,991
• L653,849
6- L649,927
-~ t::. • ·~6
...., . • ~-
'"
Capacity ratios (a) and peak widths (b) as a function oftemperature at a density of 0.9 glml. Mobile phase: 0.25 rnole% fOnIDe aCld.

- 96-
mobile phase and the use of a density gradient. The phenothiazinone analogs are not
soluble in aqueous solvents therefore highly polar modifiers cannot be used. An
increased solvation power is required to elute the larger, more polar analogs with
minimal peak tailing. Acetonitrile is a suitable choice since the phenothiazinone
compounds are soluble in this medium and it increases the solvent strength of the
mobile phase. The effect of increasing acetonitrile content on retention times, peak
widths, resolution, and efficiency at two temperatures was investigated. A solution
containing L615,919, L649,991, L649,927, and L651,392 at 100 nglui was injected in
a mobile phase of varying acetonitrile concentration under conditions of a constant
pressure gradient and constant temperature. Capacity ratios for each of the compounds
decreased, in a non-linear fashion, with increasing acetonitrile concentration (Figure
4.8a). Peak widths decreased slightly for three of the compounds with acetonitrile
concentration, but decreased rapid1y for L651,392 from 0.4 to 1.2 mole% (Figure
4.8b). This suggests a reduced interaction with the bonded phase. Increasing the
modifier content in the mobile phase increases the solve nt strength of the mobile
phase, thus increasing the solubility of the analytes. This results in faster analysis
times and sharpeT peaks, but reduced resolution. A much sharper decrease in
resolution is observed between L649,927 and L651,392 since the capacity ratios of the
latter decreases more rapidly than that for the former (Figure 4.9). Resoluuon between
L615,919 and L649,991 remains constant since their retention times are affected in the
same manner with increasing modifier concentration. Figure 4.10 demonstrates the
loss of resolution with increasing modifier concentration in the mobile phase, peaks 3
and 4 are not resolved at the higher acetonitnle concentration. Similar studies were
carried out at a higher temperature of 80DC. Capacity ratios are generally greateT at
the higher temperature (Figure 4.11 a). Although capacity ratio values decrea!'e with
the amount of acetonitnle, little change is observed above a concentrauon uf 1.2
mole%. The higher temperature decreases the density of the mobile phase, but is not
high enough for volatility effects to be observed on the retention mechanism. Peak:
widths decrease slowly with increasing modifier concentration for three of the
analytes; values are similar to those obtained at 40°C (Figure 4. llb). For L651,392

L-61S,919
A.
i
--i 1 i 1
0.0 2.0 4.0
B.
1
0.0 2.0 4.0
Figure 4.7
1 0.0
- 97 -
L-653,849
1 i 2.0 4.0
j
l ,
1 U ~
1 1 0.0 2.0 4.0
L-649,927
0.01 Au .......
1 1 i 1 1 8.0 0.0 2.0 4.0 8.0
l 0.01 Au
1
LI 1 1
---i ; i 1
, 1 1
8.0 0.0 2.0 4.0 6.0
Comparison of three phenothlazmone analogs In (A) 0.25 mole% fonDie aCld and (B) 0.87 mole% dichloromethane/0.16 mole% forone acid In earbon dloxlde at 80De and 0.8 g/ml.
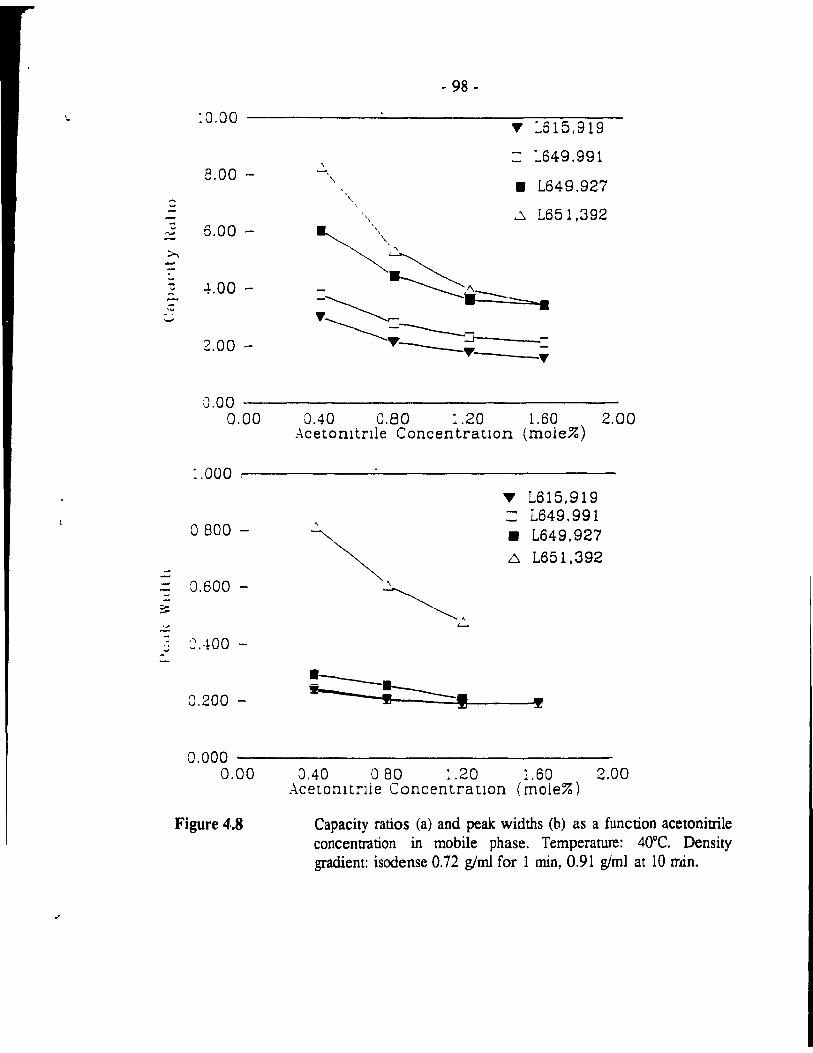
\,.
. '
- 98 -
:0.00 ~ ::"615,919
- :"649,991 \
8.00 - \ • L649,927 ::::
, - ~ L651,392 - " - 6.00 -
~, ,.....
>--~ ~.----=
-~ ...
~.OO -w --'w • -- .,. ----.:------
2.00 - y J --. .,.
0.00 0.00 0.40 0.80 : .20 1.60 2.00
Acetonltnle Concentratlon (mole%)
1.000 ,
'Y L615,919 L649,991 ,
0800 -
~, • L649,927 2,. L651,392 --- 0.600 --
~, --== ..::: t.......
-.. 2 AOO -- • ----. 0.200 - . ~-------,
~
0.000 ------------------0.00
Figure 4.8
0.40 0 80 : .20 1.60 2.00 AcetonItnle Concentrauon (mole%)
Capacity ratios (a) and peak widths (b) as a function acetonitrile concentration in mobile phase. Temperature: 40°C. Density gradient: isodense 0.72 glml for 1 min. 0.91 g/ml at 10 min .

> C 1
;
--.... --= 0 'r. Ü ,..,...
5.00
4.00 -
J.OO -
2.00 -
1.00 -
Cl.OO 0.00
Figure 4.9
- 99 -
= 991 - 927
•
\
\ \ ,
\ 'f' 919 - 991
~.~. ~ 927 - 392
0.40 0.80 : .20 1.60 2.00
Acetomtnle ConcentratIon (mole%)
Resolution as a funcnon of percent modifier. Temperature: 40°C. Density gradient: isodense 0.72 glml for 1 min. 0.91 g/ml at 10 min.

o
Figure 4.10
l
1
:
i
Il
1
i ! , 'I 1
, l '
i \): ; , \ 1
, .
2
.... Il .., 1 1 1
1 1
2
-
1
4
~~--- --
- 100 -
3
-: 0.01 Au
4 1
1
3 4
, 1 .,'----
lit 6 8 10 T'ME (min)
Chromatograms of phenothlazinone n,ixrure at 400C in (a) 0.8 mole% acetomtrile and (b) 1.6 mole% acetonitnle in carbon dioxide. 1. L615.919; 2. L649,991; 3. L649.927; 4. L651,392.

-:::
- 101 -
16.00 ----------------
.... L615,919 4-.00 -
...). L651,392 - L649,991
2.00 -
------------------------------O.O~ 00 a 40 0.80 : 20 1 60 2 00 Acetomtnle ConcentratlOn (mole%)
0.800 -----------------
O.600~
, 0.400 - .-------,',
~.-=-----a .2 a 0 -:. ---=:::::::.~ 1
.... L615,9 1 9 - L649,991 • L649,927
6 L651,392
, 0.000 -------------------
0.00
Figure 4.11
0.40 0.80 : .20 l 60 2.00 Acetomlnle Concen tratlon (moJe%)
Capacity ratios (a) and peak widths (b) as function of modifier lacetomtnle) concenrranon at 800C.

- 102 -
peak widths improve at a more rapid rate and actual values are smaller than those
recorded at the lower temperature. At 8erC, the increased solubility of L651,392 in
the mobile phase therefore reducing the retention time and decreasing peak width.
4.3.4 Assay for L615,919 in plasma.
An optimum set of operating conditions was obtained from the se results. After
an initial one minute isobanc period, a density gradient ramping from 0.72 glml to
0.91 g/ml al a rate of 0.021g/ml at 40"C was used to separate four analogs of this
series. Figure 4.12a was obtained for a 1 1J,1 injection of 100 ng of each analog
dissolved in acetonitrile. A comparison of this chromatogram with that obtained for
the same pressure gradient in simple supercritical carbon diOXlde mobile phase clearly
demonstrates the need for the modifier (Figure 4.l2b). These conditions were then
used as a starting point in the development of a method for the analysis of one of the
analogs, 4-chloro-3H-phenothiazin-3-one, in plasma.
The drug was initially administered at a dose of 150 mglkg p.o. as a
suspension in 1 % Methocel. An internal standard (L649,927) was used for all
measurements. Chromatograms of the drug and internaI standard as a standard
sOIUtiU,l and in plasma are represented in Figure 4.13. A calibration curve for peak
height ratio of L615.9191L649,927 was !inear between 2 and 900 ng injected on
column, Wlth a xl value of 0.9988 (Figure 4.14a). A plot of the low concentration
range, 2 to 100 ng, was aiso linear at xl = 0.9972 (Figure 4.14b).
Plasma levels increased up to 2.7 IJ,g1ml at 2 hours following the oral
adnunistration. followed by a slow increase to 5.19 Ilglmi at 24 hours (Figure 4.15).
AlI pOints on the plasma profile were obtained with %RSD's between 0.8 and 3.2 %.
A second study was conducted with time points up to 29 hours 10 an attempt to
detennine the elimination profile for this drug. Since studies were conducted on
dIfferent weeks, different resmctors were used resulting In changes in linear velocity.
It was, therefore, necessary to prepare calibration curves for each study. A calibration
curve was prepared between 1 and 100 ng with i = 0.9971 (Figure 4.16). Again a
sirrular plasma profùe was obtamed (Figure 4.17). The final study was then conducted

1
o 1 1 2 4
Figure 4.12
6
( b) .., ...
J\.J ',-------------~/~~-----
1
8 j
10
T'ME (min)
j 12
1
14 1
16
Companson of chromatograms for the phenothtazlnone mIxture at equlvalent densuy programs and same temperarure (40"C) ln (a) 0.8 mole% acetomtnle/carbon d.!oxlde and (b) simple carbon dioxlde.

Figure 4.13
lO.01Au
- 104·
1
1 ::.
..1 0
~IMr: ('11111)
2
1 • \'" __ ' \
- 1 _ ...
, 1
1
i
1
Tl~.lE (rn:n )
3 0
'----
Chromatogram of drug (L615,919) J. and internaI standard (L649,927) l (a) standard solution and (b) rat plasma.

'.
f 1 1. f
:) .--' -j ,....
-' ..... -:0 V -~ :;) v ~ -
0 --' :;) ,.... --' --::n v
...:l::
." ~
10.00
9.00 -
8.00 -
7.00 :-
6.00 l-
5.00 f-
4.00 f-
3.00 r-2.00 -1.00 ~
1.00 1
1
0.80 -
0.60 -
0.40 -
0.20 -
- 105 -
y = 0.00876 x - 0.09903 ., r ~ = 0.9988
100 200 300 400 500 600 700 800 900 1000 Amount of L615,919 on Column (ng)
v = 0.00783 x - 0.0277 2
r = 0.9972
,/ ... ~
0.00 -----------.-------o
Figure 4.14
20 40 60 80 100 :20 Amount oÎ L615,919 on Column lng)
Calibration curve for study 1 for an average of 3 in je cu ons. (a) full concentration range and (b) low concentration range.

- 106 -
1000 ~----------______ ~ ______________ _____
8.00 -----~ :J) ... ""-
6.00 -- -:: :J -' • "J --- 4.00 - -:; v -:) .------'-" • 2.00 :.II
ù 00 ~-----'-_--1.. __ -L-_-L_---L_ o 8 12 16 20 24
Time (hr)
Figure 4.15 Plasma profile for one rat in study 1.

8 -., ~
---~
:.J
~ :";l :J
'"
- 107 -
1.00 ri ---_______________ _
0.80 -
0.60 -
0.40 -
0.20 -
/t' "'~ -
y = 0.00715 X - 0.0131
?
r- = 0.9971
/! /
-'
0.00 ----_____________ _ o 20 40 60 80 100
Amount of L615.919 on Colulnn (ng)
Figure 4.16 Calibration curve for study 2
120

- 108 -
n = 4 In]ectlOns 1000 ----------~~~~~~~ ________ ___
8 00 ---:: "-::n ... --- 6.00 -
0 - /-; -0
c 4.00 r-;;; v
.-a • 0 U
i 1
2 00 -
OOO •• -----~--~---__ _L ________ L_ __ ~ _____ ~ a la 15 20 25 30
rime (hr)
Figure 4.17 Plasma profile study 2
l - 109-
by administering the drug at 150 mglkg in three rats simultaneously (Figures 4.18).
Studies of plasma levels of another analog, L651,392 have shown that at the high dose
of 150 mglkg, maximum peak levels were reached at 30 minutes and maintained after
24 hours. At lower doses of 20 mg/kg, plasma level drop after 5 hours and the drug
is completely eliminated by 24 hOUTS. Due to the low bioavailibility of the se
compounds detection limits are consistently a problem.
4.3.5 Electrochemical investigation
The high sensitivity achieved with HPLC/ECD prompted the investigation of
SFClECD as a viable alternate for this class of compounds. The electrochemical
activity of sorne of the phenothiazine analogs were investigated. Cyclic
voltammograms of the phenothiazinone derivatives were obtained in acetonitrile with
O.IM TBA 1FB as the supporting electrolyte. A platinum microdisc electrode served
as the working electrode, a silverlsilver chloride electrode as the reference and a
platinum wire as the auxiliary electrode. AlI voltammograms were obtained for 1
mg/ml concentrations of the analyte. For L615,919 a reversible oxidation is obtained
with a half wave potential of 0.4 volts (Figure 4.19a). L649,991 undergoes a frrst
oxidation at EI/2 = 0.16 volts, which does not reach a steady state response as a second
oxidation occurs at EI!2 = 0.38 volts (Figure 4.19b). On the reverse scan a reduction is
obtained at EI/2 = -0.29 volts. Two weIl resolved, sigmOldal-shaped red-ox waves are
recorded at EI/2 = 0.38 and 0.91 volts for L653,849 (Figure 4.20a). The cyclic
voltammogram for L651,392 has one oxidation at EIIl == 0.32 volts (Figure 4.20b).
4.4 Conclusions
The mIe of physical pararneters (temperature, density and mobile phase
composition) on the retention behaviour of four phenothiazinone analogs has been
investigated. Results obtamed de mon strate the need for both an orgamc modifier
(acetonitrile) in the carbon dioxide mobile phase and a density gradient for the eluuon
of each analog with reasonable retention times and resolutlon. An assay for

- 110 -
n = 3 rodents 600 ------------~--~~~~-------------
5.00 -
.----" , 400 -:I: .... -'-'
::
3.00 - T __ • TT ~ ~
T -·!0~ -":l ....-. l • - l .-J • { 1 .J. 1 ff -...
ü ''- ...J - 2.00 r ...
0 U
1 1
1 00 .;-
OOO·.-----L-------L-------L------~------~---~ o 6 12 18 24 30 36
TIme (hr)
Figure 4.18 Plasma profile for three rodents in a simultaneous study.

- 111 -
5nA / ====================~~
ID 0.5
Porenbal (voirs)
5nA
0.0
1 /
/~ ~/
====f/ 1.0
Figure 4.19
-------------------0.3 -04
Porenbal (volts)
Cyclic voltammogram of (a) L615.919 and (b) L649,927 in CH3CN/O.IM TBA TFB. Pt-wrre auxiliary and Ag/AgCl reference electrodes and platinum ultranucroelectrode as the working electrode.
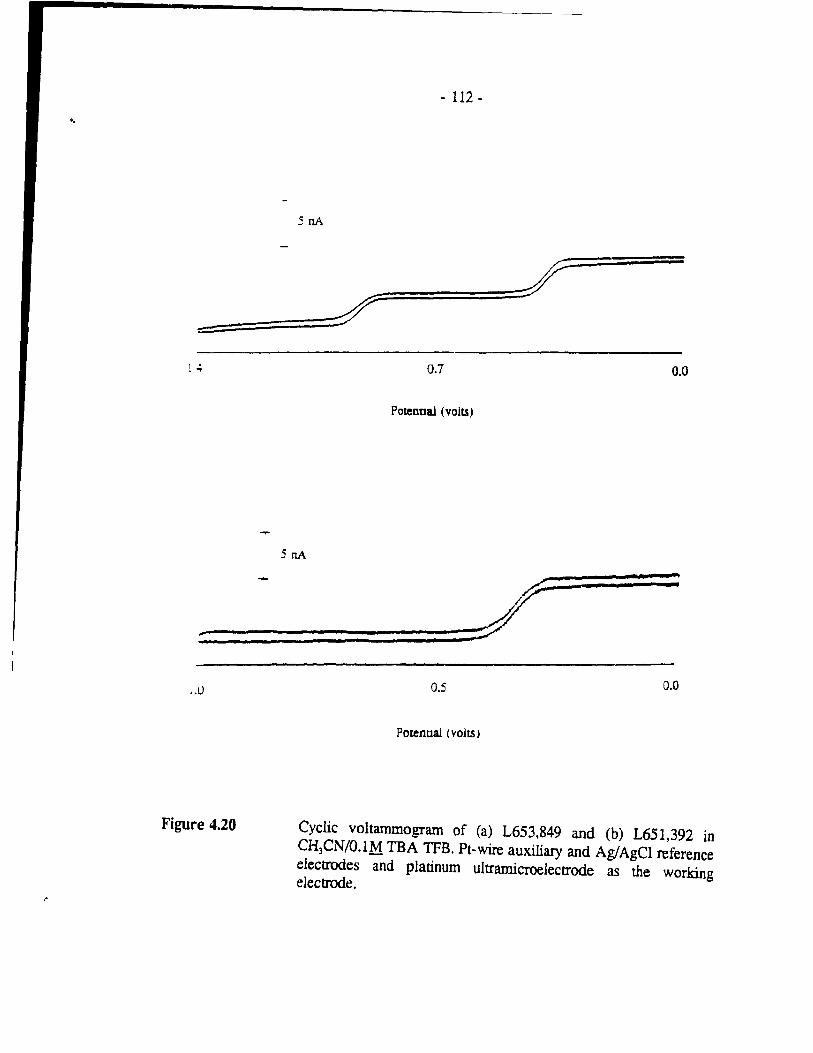
..
"
- 112 -
5 nA
==~f _====--J
1 • . "
SnA
0.7
Poteooal (volts,
0.0
: : ::
/ ~~::::::::::::::=::==============~
.. 0
Figure 4.20
0.5 0.0
Potenoal (volts)
Cyclic voltammogram of Ca) L653,849 and (b) L651,392 in CH)CN/O.IM TBA TFB. Pt-wire auxiliary and Ag/Agel reference electrodes and platinum ultramicroelectrode as the working electrode.

- 113 -
determining the plasma profile of L615,919 in rodents was developed. The
electrochemical activity of these phenothiazinones were also investigated. The low
oxidation potentials of these compounds make them suitable for measurement with
amperometric detectOl s.

- 114 -
4.5 References
1. Y. Guindon, Y. Girard, A. Maycock, A.W. Ford-Hutchinson, J.G. Atkinson, P.C. Bélanger, A. Dalliob, D. DeSousa, H. Dougherty, R. Egan, M.M. Goldenberg, E. Ham, R. Fortin, P. Hamel, R. Hamel, C.K. Lau, Y. Leblanc, C.S. McFarlane, H. Piechuta, M. Thérien, C. Yoakim, and J. Rokach, L-651,392: A Novel, Potent and Selective 5·Lipoxygenase Inhibitor, in Advances Prostaglandin, Thromboxane and Leukotriene Research, ed. B. Samuelsson, R. Poaletti and P. W. Ramwell, Raven Press, New York, 17 (1987) p557.
2. E.J. Cragoe, D. Ethier, A.W. Ford-Hutchinson, Y. Girard, R.A. Hall, P. Hamel, J. Rokach, N.N. Share, c.A. Stone, and P. Yusko, Br. J. Pharmacol. 82 (1984) 389.

..
- 115 -
Chapter 5
An Electrochemical Detection System for Supercritical Fluid Chromatography
5.1 Introduction
Electrochemical detection in liquid chromatography is a highly sensitive and
selective technique for the aI alysis of a wide range of biologically important
compounds. The possibility of extending electrochemical detection to supercritical
fluid chromatography would greaùy broaden the range and scope of analyses currenùy
being carried out by this techfuque. Electrochemical measurements in supercritical
media have, at least in principle, me potential for improving detection limits, since
diffusion coefficients in supercritical fluids are approximately an order of magnitude
greater than those found in liquids. This advantage, until recently, has been offset by
the highly resistive nature of supercritical fluids. The recem development of
ultramicroelectrodes with their inherenùy low resldual ohmic effects and reduced
requirement for added supporting electrolyte make them ideal candtdates for electrodes
in supercritical fluid chromatography electrOChemIcal detection systems.
Voltammetric behaviour changes dramancally as the Size of the electrode
decreases from rnillimeter to micro me ter dimensions. Wightman first reported on the
unique properties of these electrodes aIld the size advantage of mlcroelectrodes for
direct measurements of neurottansrrutter concentration inside the mammalian bram
[1]. Steady-state current responses are obtruned at microvoltammetnc electrodes and
the small currents produced are vrrtually non-destructIve of the specles of interest.
Other advantages include reduced IR drop. mcreased mass transport 10 and from the
electrode surface, and rapid response rimes .
Microelectrodes have been constructed from various matenals including carbon,
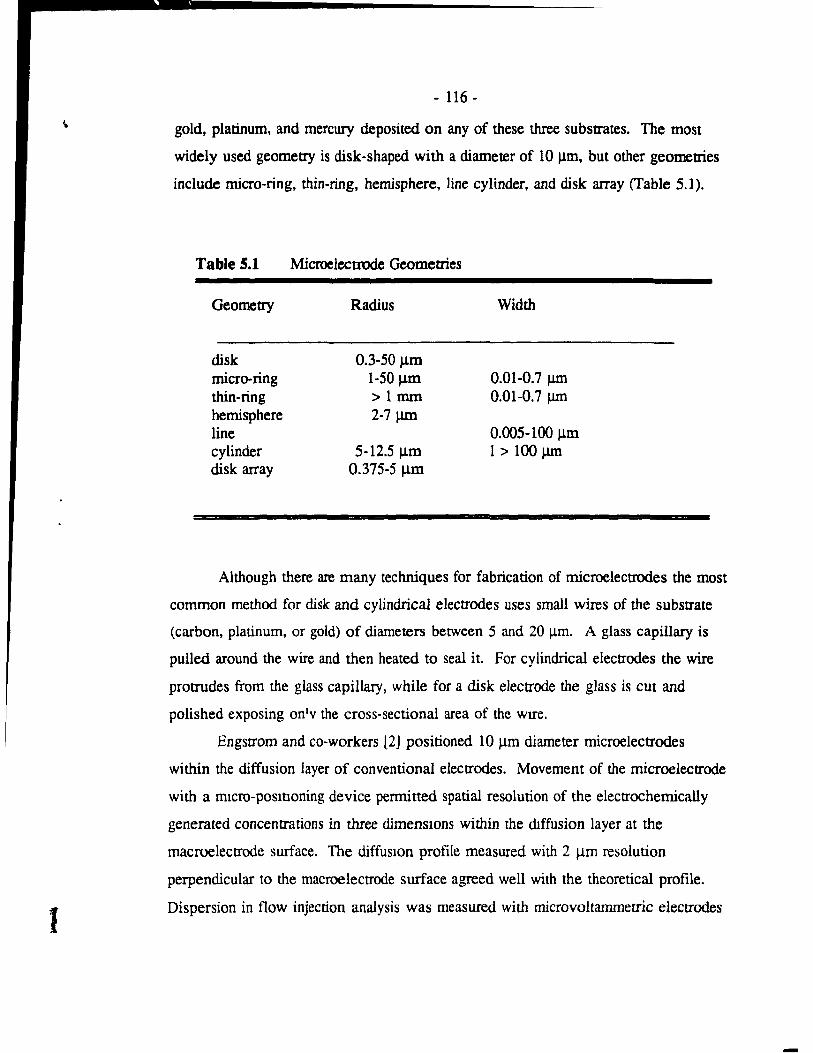
1
- 116-
gold, platinum, and mercury deposited on any of these three substrates. The most
widely used geometry is disk-shaped with a diameter of 10 Ilm, but other geometries
include micro-ring, thin-ring, hemisphere, Hne cylinder, and disk array (Table 5.1).
Table 5.1 Microelecttode Geomeaies
Geometry Radius Width
disk 0.3-50 IJ.m micro-ring 1-50 IJ.m 0.01-0.7 J.1m thin-ring > 1 mm 0.01-0.7 J.1m hemisphere 2-7 J.1Il1 line 0.005-100 Ilm cylinder 5-12.5 IJ.m 1 > 100 J.1Ill disk array 0.375-5 IJ.m
Although there are many techniques for fabrication of microelectrodes the most
common method for disk and cylindrical electrodes uses small wires of the substrate
(carbon, platinum, or gold) of diarneters between 5 and 20 Ilm. A glass capillary is
pulled around the wire and then heated to seaI il. For cylindrical electrodes the wire
protrudes from the glass capillary, while for a disk electrode the glass is cut and
poli shed exposing onlv the cross-sectional area of the wrre.
Engstrom and co-workers [2] positioned 10 /lm diarneter microelectrodes
within the diffusion layer of convention al electrodes. Movement of the microelectrode
with a ffilcro-posltloning device permitted spatial resolution of the electrochemically
generated concentrations in three dimensIOns within the dIffusion layer at the
macruelectrode surface. The diffusIon profile measured with 2 /lm resoluùon
perpendicular to the macroelectrode surface agreed weIl with the theoretical profile.
Dispersion in tlow injection analysis was measured with microvoltammecric electrodes
-

- 117 -
by Kristensen, Wilson and Wightman [3]. The results obtained demonstrated that the
primary source of dispersion was due to the tubing, while the fmite volume of the
channel-type detector contributed negligibly to the observed response. This technique
has also been used to observe less defined flow situations such as turbulent flow or
secondary dispersion effects.
5.1.1 Diffusion characteristics
Microvoltammetric electrodes perform differently from conventional electrodes.
One snildng difference is the sigmoidal-shaped cyclic voltammograrn obtained at
microelectrodes as opposed to the peak.-shaped voltammograrns at macroelectrodes.
The current during electrolysis is proportion al to the flux of molecules at the electrode
surface. Initially, the flux at the electrode surface is due pnmanly to planar diffusion
of the electroactive species to the electrode. The current, which IS proporuonal to the
electrode area, decreases with rime since the rate at which the specles reaches the
electrode surface decreases (Figure 5.l). The rale of electrolysis exceeds the rate of
diffusion resulting in a peak shaped voltammogram (Figure 5.2). When the diffUSIon
layer thickness approaches the radius of the electrorle, the dIffusion layer boundary
will grow into a hemispherical shape. At this point non-planar or convergent diffUSion
predominates (Figure 5.3). As the volume of the diffUSIOn layer Increases, more of the
bulle solution contributes to the flux at the electrode which In-tum counteracts the
increase in diffusion time. The rate of mass transport of the analyte to the electrode
surface equals the rate of electrolysis and a steady-state CUITent proportIon al to the
radius of the electrode is obtamed. The sigmOldal-shaped voltammograms retlect the
steady-state character of the redox process at these electrodes. Thus diffusIOn
processes th~t occur at an ultramicroelectrode can be equated wlth processes that occur
at spherical electrodes.

- 118 -
Figure 5.1 Semi-infinite linear diffusion at a macroelectrode.
120JJA
Figure 5.2 Peak-shaped voltammogram at a macroelectrode.

- 119 -
Figure S.3 Radial diffusion at a microelectrode.
Figure 5.4 Sigmoidal-shaped voltammogram at a rrucroelecrrode.

- 120-
5.1.1.1 Diffusion to a spherical electrode.
In chronoamperometry, the potential is stepped from a value where electrolysis
does not occur to a value where an oxidation or reduction takes place and where the
current is limited only by diffusion of the analyte to the electrode surface. A
chronoamperometric experiment at a spherical electrode with radius ro will be
considere<! first.
Working in spherical coordinates, the boundary conditions for reduction of
species 0 are,
lim. C(r,t) - C· Bulle Concentration r'" CIO
C(r,O) - C· WMn r > '0
C(r~t) - 0 wMn t > 0
5.1
5.2
5.3
The concentration gradient at the electrode surface can be expressed in terms of
the Faradaic current (i),
where
From Ficks's second law,
n = number of electrons F = Faraday constant i\ = electrode area (cm2
)
D = diffusion coefficient (cm2/sec)
é ~("t) _ D &C(r,t)
at ar2
5.4
5.S

" - 121 -
Solution of this second order differential equation with the bounclary conditions
established above, gives the following complimentary eITOr function for the
concentration profile (4],
C(r,t) _ Ce(1 _ ro) erfc ( r - '0 ) r (401)1/2
For large electrodes, where ro approaches infinity, the equation for the
concentration profile at a large planar electrode is given by:
C(r,t) - C· erf 0 ( r - r ) (4Dt) 1/2
At long times, the expression becomes
By plotting cie· as a function of r - ro (the distance from the electrode
5.6
5.7
5.8
surface), equation 5.7 predicts that the concentration profIle will keep extending into
the solution as a funetion of time. At small spherical eleetrodes the growth of the
diffusion layer is initially sitrular to that observed at la!" Je planar electrodes (as
described by equation 5.7), but al longer rimes the growth rate deereases considerably ,
as predicted by equanon 5.8.
The eurrent at a spherical electrode is obtamed by differentlatmg equation 5.6
with respect 10 the radius and integrating over the area of the electrode.

'.
"
- 122 -
; _ "FADe. ( 1 ('JtDt)1f1
+ 1] '0 5.9
1 II
where A = 41tro 2 for a sphere
= 21tro 2 for a hemisphere
At short times, term 1 is significant and the cumnt al a spherical electrode is
governed by pl anar diffusion. However, at long times term 1 becornes insignificant
and term fi predominates resulting in a steady-state (or tirne-independent) current
response. Ta detennine the point at which the steady-state response predominates, the
expression for the CUITent at a spherical electrode can be divided by the current at a
planar electrode, as described by the Cottrell equation.
i "'.1+ i".
(nDt) 1/2
'0
S.lO
S.U
The relative amount of the rirne-independent contribution to the total current
can be determined from the dimensionless parameter, Dt/rt For a 10% contribution
from the steady-"tate tenn, Dtlro2 should have a value of 3.2x1O-3• For aqueous
soluttons, where D "" lxlo-s cm2jsec and a typical ultramicroelectrode diameter radius
of 5x10⁴, a 10% contribution corresponds to a time of 0.08 msec. Therefore at
spherical ultramicroelectrodes, sorne effect of non-planar diffusion is seen at
reasonably short times. Shain and Martin [5] used a hanging mercury drop electrode
ta experimentally verity the response described by equauon 5.9. At large values of
Dt/ro2, namely small radii and long rimes, the limiting CUITent under diffusion
conrrolled conditions will be independent of the potential excitation. In other words,
- 123 -
for cyclie voltammetric experiments at slow scan rates, the current beyond t.he
oxidation (or reduction) potential of the analyte will be constant and given by the
second term of equation 5.9.
where a = 41t for a sphere = 21t for a hemisphere
5.12
Under the se steady-state conditions a reverse wave is not observed since the
electtolysis product bas rime to leave the diffusion layer. The resulting
voltammograms are sigmoidal in shape. For the same experiment at faster scan rates,
with small values for Dt/ro 2, the voltammograms resemble those observed at planar
electrodes, peak-shaped. This has been experimentally verified for the reduction of
RU(NH3)l~ in aqueous medium al a hemispherical mercury electrode [6].
5.1.1.2 Shape of voltammogram at a spherical electrode.
The shape of a voltammogram can be easily evaluated under steady-state
conditions. Consider the following reversible reaction.
o + ne -+ R
Under steady-state conditions, the denvative of the concentration Wlth respect
to rime is zero and therefore, equation 5.4 can be evaluated linearly,
. (c~ -co(r~l J - nFAn ----
ô 5.13
This is the same equation used in the Nernst diffuslOn layer concept for
hydrodynamic voltarnmetry [7]. The Nernst or stagnant diffusion layer thickness is
given by a. The concentration of 0 at the eleco-ode 1S a functIon of the applied
potential and is given by the Nernst equation.

1 - 124 -
CoCrJ (nF ..d) - exp - (E - ~-) CJrcJ RT"
5.14
where EO, = formal reduction potential E.pp = applied potential
When the applied potential becomes more negative than the fonnal potential,
aU the 0 getting to the surface is prompdy reduced, decreasing its concentration at the
electrode surface to zero. The limiting current under this steady state condition is
given by equation 5.12. Substituting this in equation 5.13 and with Co(ro) = 0, then
i, -- -nFA.
DC~
ô De· 5.15
Byassuming that the diffusion coefficient of 0 is equivalent to that of R, the
concentration of R at the electrexie surface is equal to the bulk concentration of 0
minus its concentration at the electrode surface, CR(rO) = Co'· Co(ro)' According to
equation 5.14,
( nF exp -(E -RI app
Therefore, solving for Co(ro) gives the following,
5.16
5.17

- 125 -
5.18 1 + exp (- nF (E - ed))
RT app
The value of a has been found to be equal to the electrode radius (equation
5.15) and substituting equation 5.18 for the value of Co(ro) into equation 5.13. gives an
expression for the voltammetric curve at a spherical electtode under steady-state
conditions;
i -nFADC~
5.19
5.1.1.3 Diffusion to a dise electrode.
Although there are many ultramicroelectrode geometries, the most easily
fabricated electrode is a microdisc. In cyc1ic voltammetry at convenuonal electrodes,
the current produced is propofÙonal to the flux of analyte molecules ta the electrode
surface. this flux is conttolled by planar diffusion. The diffusion-limited CUITent, in
response to a potential step under conditions of semi-infimte linear diffuslOn, is
described by the Cotttell equaoon (equation 5.10).
The current decreases Wlth ùme since the length of ùme requirtd for the
species ta diffuse to the electrode surface increases as the dIffuse layer thickness
grows, resulùng in rapid depleùon of the analyte. This leads to the convenuonal peak
shaped voltarnmogram. When the diffusion layer thickness approach,'!s the radius of
the electrode it cononues to grow in a herrusphencal shape. At thiS pomt a radial
component connibutes to the flux at the electrode surface. Devlations from the

."
....
- 126 -
Conrell equation, due to this additional quasi-spherical component, are obtained for
dise electrodes of small size and for long analysis urnes. This increased flux has been
referred to as 'edge effects'; with construction of smaller electrodes these effects have
become more pronouneed. For small electrodes this increased flux to the surface
counteracts the increase in time for a molecule to diffuse to the electrode surface and
therefore a steady-state current response is achieved. At macroelectrodes the
diffusion layer thickness that must be obtained is quite large requiring a long time ta
grow and because of its size it can he disturbed by convection of analyte solution. At
microelectrodes the diffusion layer thickness that must be realised in arder to obtain
contribution from the radial diffusion is much smaller and therefore established mueh
faster. Soos and Lingane [8] modified the Cottrell equation to quantify this ~ffect:
Saito [9] first derived an expression for the diffusion limited steady-state
current at a dise of radius ro.
5.20
5.21
By substituting this into equation 5.20, the value of b is ta equal ta 4/rc1(l
which agrees Wlth the analytical solunon by Oldham [la] and a simulated response
by Heinze [11]. The diffu.,ion-limited current at a fmite dise electrode is identical
ta that of a sphere of radius 7trJ4 [12J or a hermsphere rrr/2. Oldham (lOJ fust
noted that rmcrodiscs and microherruspheres of equal superficlal diameters give
Idenncal steady-state voltammograms under reverslble conditions. Treanng the
mlcrodtsc electrode as though it were a sphere of radius mJ4, the equations developed
for sphencal electrodes can be applied. The CUITent, in response ta a potential step for
a diffusion controlled process at a ffilcroelectrode or a spherical electrode, IS made up
of two components, a rransient one proponional ta the elecrrode a.rea which is time

- 127 -
dependent. and a steady-state tenn ploportional to the electrode radius.
i -5.22
At low scan rates (large t) and electrodes of small radii, the fust tenn becomes
insignificant and the second tenn, corresponding to a steady-state response,
predominates resulting in sigmoidal-shaped voltammograms. Unlike spherical
electrodes. the current density at microdisc electrodes is not unifonn but more
concentrated on the edges. Therefore. derivation of expressions for diffusion processes
at a dise is more eomplieated.
The expected current can be predicted by analytical solutions as weIl as digital
simulation procedures [13,14]. Aoki and Osteryoung [13] have described a two-
part solution for a chronoamperometric experiment at a finite dise. The current is
expressed as a function of a dimensionless time variable, t = 4Dtlr/,
At short rimes the solution takes the following form,
At long rimes,
lim j{t) -t .. 0
1t 31tt ----+ ... 4 210
5.23
5.24
5.25

(
(
- 128-
Shoup and Szabo [14] have proposed a simpler form for this funetion, whieh is
aceurate to 0.6% for all times.
j{'r) - 0.7854 + 0.8862 + 0.21.u1exp (_ 0.7832)) t~ ~ t~
5.26
The ehronoamperometric expressions described above were verified by
applying them to the oxidation of ferrocyanide in O.5M K2S04 al a gold dise eleetrodt
of radius 1.34xlO-3cm [15]. It has been shown experimentally that for fast scan
rates (small values of Dt/ro·)' cyclic voltammograms al microdisc electrodes are peak
shaped, indicating the predominance of planar diffusion [16]. Al slow scan rates
(large value for Dt/rb, sigmoidal-shaped voltammograms are obtained. Howell and
Wightman [17] obtained sigmoidal-shaped voltammograms for ferrocene in
acetonitrile at a gold microvoltammetric dise eleetrode (radius = 6.5xlO-3 cm) for a 0.1
volt sec- l scan rate and a eonventional peak-shaped curve at a scan rate of 10 V-sec-l•
5.1.1.4 Shape of voltammogram at a dise electrode
As with spherical electrodes, the shape of the voltammogram under steady-state
conditions al a microdisc ean be derived using the Nernst diffUSIOn layer concept
(equation 5.13).
By eombining equation 5.21 and equation 5.26, the Nernst diffusion layer
thickness for a dise eleetrode 1S given by 0 = rrrJ4, thus,
The concentration of 0 at the electrode surface is a function only of the
applied potennal under steady-state conditions. Consequently, the expression for
Co(ro) is similar to that previously developed for spherical electrodes.
S.27

- 129-
c~ - CJ..rO) - 5.28
Therefore, the forward scan of the voltammetric curve at a microdisc electtode.
under steady-state conditions, is described by the following expression;
i - 5.29
Again, this is identical ta that abtained for the spherical electrode case, if
rsphln = 4rm.Jrr.. Since the products formed at the electrode rapidly diffuse away from
the diffusion layer and the mass transport of 0 to the electrode is time-independent,
the current on the reverse scan is identical ta that on the forward scan. As shown
above there are similarities between the CUITent observed at microdisc and at spherical
electrodes and this presents an approximate way to obtain solutions far the more
complicated geometry [18].
5.1.2 Ohmic drop at ultramicroelectrodes.
Ohmic drop, caused by cUITent through the uncompensated solution resistance,
reduces the potential at the electrode-solution interface. In practice, voltammetry with
macroelectrodes in highly resistive solutlons results 10 non-linear change In potential
with time. The cUITent throug!l the electrolyte solution actually generates a potenttal
that opposes the applied patentia!. With conventlonal electrodes the ohmlc drop
generated is snbtracted from the applied potential differènce between the working and
reference electrode by the use of a three-electrode potentlostat. However, thlS method
to minirruze distonion from iR drop requires accurate and reproduclble placement of
the reference electrode tip relative ta the working electrode. Other techmques ta
reduce ohrruc drop such as semi-integral analysls (19] or denvatlve methods (20]

i
r ,
- 130-
are often difficult to implernent. Severe ohmic drop has precluded voltammetric
measurernents in highly resistive media such as supercritical fluids until the advent of
microelectrodes.
The total resistance for a working microdisc electrode with a large reference
electnxie placed an infmite distance away is given by the following [21]:
5.30
where p = conductivity of the electrolyte
Although the cell resistance increases as the radius of the microelectrode is
made smaller, the resistance per unit area of the electrode surface is low and becomes
lower with decreasing radius. As will be shown later, the capacitative current is
direcùy proportional to the electrode area and the resistance is inversely proportion al
to the electrode radius, therefore ohmic drop caused by charging current and by
Paradaic current decreases with decreasing electrode area. For sorne voltammetric
processes the observed ohmic drop at microdisc electrodes of srnall diameter is
actually less than that predicted by combining the equations for resistance and
Paradaic current [22]. This may be due to a change ln the conductance at the
electrode surface. As electrolysis occurs a charged species is produced which is at its
highest concentration in the diffusion layer, thus generatmg a less resistive medium in
this region. The reduced iR drop at u!tramicroelectrodes allows measurements to be
obtamed 10 solunons ~:: hlghly reSlsnve nature not previously explored. Howell and
Wightman [17] obtained undistorted voltammograms for ferrocene in acetonitrile with
low concentrations of supponing electrolyte (O.OlM TBAP) utilizing a two-electrode
celI. If the CUITent is maintained at a low value, as with microelectrodes, the potential
of the working electrode can be controlled in a two-electrode cell by passing the
current between the working elecrrc Je and a reference electrode (lf much larger area
[21]. Studies have been perfonned with rnicroelectrodes in other resistive media.
Bond. Fleischmann and Robinson [23] were the frrst to report on the voltarnmetry of

1-
- 131 -
ferrocene at the liquid-glass transition temperature of acetonitrile. Electrochemical
measurements have been made in chlorobenzene, benzene, te trahydrofuran , and 1,2-
dimethoxyethane [24,25]. Ghoroghchian et al. [26] demonstrated that
microelectrodes can be used as sensitive electrochemical detectors or sensors in me
gas phase. In their system, me charge required for the double layer is supplied from
the free carrier charge at the surface of an insulator in contact with the working
microelectrode. Undistoned voltammograms for ferrocene have been achieved in
supercritical carbon dioxide with added water and tetrahexylammonium
hexafluorophosphate [27]. By eliminating the supporting eleetrolyte, Cassidy and
co-workers [28] have extended the positive potentiallimit of acetomtnle from 2.4
volts to 4.3 volts, and were able to observe the oxidation of methane and other short
chain alkanes. Electrochernical measurements can be used to predict the feasibdity of
homogeneous electron-transfer reactions. With conventional electrodes these
measurements have been restricted to conduetive solutions which often are dlfferent
from the medium in which me homogeneous reaction takes place. Microelc,r ":"Odes
can now be used to de termine thermodynamic and kinetic parameters for
heterogeneous electron-transfer reactions in the highly resistive media of the
homogeneous reactions.
5.1.3 Cell rime constant.
The cell rime constant (RC) of an electrochernical ceil detennines the
maximum rate of potential change. The capacitative nature of the Impedance of an
electrochemical cell with macroelectrodes precludes rapid changes ln potenual. The
interest in fast electrochcmical measurements stems from the deslre to determme mpld
heterogeneous or homogeneous reaction rates. The double layer capacltance l C) is
directly pmportional 10 the area of the electrode surface. The solutIon reslstance (R),
as shown previously, is inversely proportion al to the radius, therefore the Re ume
constant is directly proportion al to the radIus of the mlcrodisc. Wlth reduced oh nue
drop and the small celI time constant at microelectrodes, voltammetnc measurements
can be made in the sub-trucrosecond domain. As the electrode IS made smaller, faster

- 132 -
scan rates may be used while still rttaining the sigmoidal shape. At very fast scan
rates with microelectrodes, current is primarily due to planar diffusion and the
electrode response can he treated as a conventional electrode. A decrease in electrode
radius allows faster scan rates to be used before non-planar diffusion becomes
insignifican t.
Robinson and co-workers [29,30] tirst demonstrated that the reduced
values of resistance and capacitance al microelectrodes lower the rime constant of the
cell and therefore are useful in spectroelectrochemical measurements. At these very
fast time scales planar diffusion predominates al the microelectrodes and therefore
current is uniformly distributed across the electrode surface. Although background
subtraction is necessary, voltammograms with useful electrochemical information can
be obtained at scan rates greater than 100 000 volts sec-1 with microdisc electrodes
[31,32J. Fast scan cyclic voltammetry has been used to detect and characlerize
transient species generated electrochemically. Howell and Wightman [25] studied the
doubly charged cation of diphenylanthracene which is ooly stable on a microsecond
time sCale in acetonitrile. Ultrafast cyclic voltammetry with microelectrodes has been
used for the study of a fast chemical step in an electrode reaction [33]. Structural
changes similar to the thennochromic conversion of bianthrone were induced by
electrochemical reduction of bianthrone and the rate constant for conversion
detennined. Andrieux and co-workers [34] have shown that the use of fast scan
cyclic voltammetry al microelectrodes allows kinetic characterization of
electrochemically generated intennediates having lifetimes in the microsecond range.
Double potenrial step chronoamperometry has been used ta accurately de termine the
rate constant for the dimerization of the radical obtained from the reduction of 1-
methyl-4-1err-butyl pyridinium cation [35]. The low capacitative charging current
and low ohmic drop al microelectrodes pennits rapid measurernent of Faradaic current
after an imtial potr.ntial step. Fast s\::an cyclic voltammetry can also be used to
detennine the standard oxidation potential for an electrochemical oxidation generating
a chemically reacnve species. With macroelectrodes, upon reversmg the potential
sweep no reverse wave is present because of the follow-up chemical reaction. By
,.
- 133 -
increasing the scan rate, the ensuing chemical reaction can be out run and a reverse
wave observed. A scan rate of 10 000 volts sec·1 with microelectrodes allows direct
electrochemical observation of species with half-lives of 1.0 j..l.sec [251.
5.1.4 Capacitative current at ultramicroelectrodes
In the absence of electrolysis, a two-electrode electrochemical cell behaves
similar to a resistor-capacitor series network. The electrolyte soluùon has a finite
resistance, while the working electrode behaves as a capacitor. Charge cannot cross
the solution-electrode interface unless electrolysis is taking place and consequently, a
capaci~ce (C) arises from the order of the ions in the clouble layer. Upon application
of a potential step &E, CUITent will flow as the capacitor is charged or discharged.
With no electroactive species in solution, this cUITent is equal to the chargmg current
and is given by [36];
. 4E ~- t) 1 - - -C R RC
5.31
The current produced as a result of the oxidation or reduction of an
electroactive species in solution tS actually a coml"lination of the Faradaic c urre nt,
given by the equations described previously, and me charging current. Infonnation
about the species undergoing electrolysis is contained in the Faradaic pomon of the
current, therefore most favourab1e electroanalytical techr.iques are those that Ollnimize
the effeet of charging currents. Large capacitative corrents have aiso precluded
electrochemical measurements under a variety of condiuons. Most common
techniques that discriminate against capacitarive current use pulsed wavefonns. Upon
application of a potential step, the capacitauve current will decay exponenually with
rime, while Faradaic current decay is inversely proportional ta the square-root of time.
In pulsee! methods, the chargmg CUITent is aliowed ta decay before measurements are
made. For long rimes at ultramicroelectrodes the Faradaic current rapidly converges to
a steady-state value as the chargmg current connnues ta fall. As shawn prevlOusly,

· 134-
the Re time constant at microvoltammetric electrodes is small, and combined with
long analysis times, the capacitative current at these electrodes is also reduced.
Consequently, ultramicroelectrodes are better suited for pulseu voltammetric
techniques. On the reverse step of a pulse a small amount of Faradaic current is
produced since me product of electrolysis rapidly diffuses away from the diffusion
layer. Thus, the current produced on the reverse step can be subtracted from the
current measured at the pulse to obtain only the Faradaic current response. Ewing et
al. [37] and Ponchon et al. [38] used normal pulse voltammetry for the in vivo
determination of dopamine in the rat neostratium. The pulsed waveform minimizes
electtode response deterioration caused by filming of the electrode surface by
electrogenerated products.
S.l.5 Small size advantages of ultramicroelectrodes
The most obvious advantage of microelectrodes is their small size. Ponchon
and co-workers [38J were tirst to use carbon fibre electrodes in vivo to study the
release of dopamine in the rat neostratium. Microvoltammetric electrodes can be used
to provide reproducible results in an extremely complex medium such as the
mammalian brain. Nerve terminais have diameters in the 1 !lm range, therefore
microelectrodes are necessary in order not to destroy the region where measurements
are bemg made. The electrode must be implanted in the brain and monitored for a
minimum of 8 hours for most experiments; mis does not permit any electrode
resurfacing ln the interim. Ewing, Dayton, and Wightman [37] have demonstrated that
stable voltammograrns can be obtained with ultramicroelectrodes using pulse potential
waveform. Voltammograms of dopamine are sigmoidal, but dihydroxylphenylacetate,
a major dopamine metabolite, and ascorbic acid both give drawn out voltammograms
due to their slow rate of charge transfer at carbon fibre electrodes [39]. Almough
these three compounds have very similar fonnal potenuals, the difference in charge
transfer rates make the carbon fibre electrode more sensitive to dopamine. In the
presence of ascorbic acid, the oxidauon of dopamine is followed by the catalytic
regenerauon of the reductant. At mIcroelectrodes the product of the oxidation will

- 135 -
diffuse a distance, given by (Dt)ll2, greater than the radius from the microelecttode; the
regenerated dopamine is far removed from the electrode surface and therefore a
minimal catalytic contribution to the current is ohserved. The incrcased rate of mass
transpon due to non-planar diffusion eliminat'!s the need for forced convection during
the preconcentration stage of stripping analysis, thus minimizing a source of error. A
statie solution gives higher precision and the lower iR drop elinunates the need for
high concentrations of supponing electrolyte, which interferes with the Faradaic
current. Baransld and Quon [40] described the use of anodic stripping voltammetry
with ultramicro mercury electrodes for cadmium and lead in 5.0 ~ volumes. Very
sharp peaks are obtain for anadic stripping analysis at ultramicroelectrodes SlOce the
analyte concentrated at the electrode is completely stripped during the scan.
5.1.6 Steady state cUITent response.
Reactions following an initial electron transfer (EeE mechanism) are less
apparent at microvoltammetric electrodes because of the steady-state nature of the
current. The product formed during the chemical reaction following the inItial
electron transfer can diffuse away from the electrode surface. Since the diffusion
layer thickness is considerably reduced at ultramicroelectrodes, the product is not
available to undergo the second electron transfer at the electrode. This has been
demonstrated experimentally for the intra-cyc1ization of dopamine-o-qulOone, an ECE
reaction [41]. The pseudo flfSt order and second order rate constants for the
catalytic regeneration of ferrocyanide followmg Ils oxidauon in the presence of
amidopyrine (EC' mechanism) have becn detenmnea by plotting ~teady-state currents
as a function of electrode radius [42]. In the same paper, a rate constant for the
dissociation reaction near the diffusion limit for the reducnon of protons 10 a soluuon
of acetic acid ~CE mechanism) has been deterrnined from the linear dependence of the
inverse of the current density on electrode radius. Similarly, steady-~tate
measurements at microelectrodes have been used to obtam kInetlc data for ECE and
DISP 1 (fust order disproponionation reaction) type reaCllons [43).

- 136 -
5.1.7 Ultramicroelectrodes in hydrodynamic systems.
Amperometric detection in liquid chromatography and flow injectioI" analysis is
capable of detecting nanomolar concentrations of electroactive species [44].
Variations in the path of the solvent flow due to incomplete wetting of the electrode
surface and fluctuations in the applied potential are two major sources of noise. Since
both these soun:es are proportional to the electrode area (A) and the Faradaic currenl
in a channel electrode is proportional to A'}JJ, Weber and Purdy [45] have proposed
a reduction in electrode area to reduce noise levels. Fluctuations in flow rate lead to a
changes in the size of the stagnant layer. At macroelectrodes the diffusion layer
thickness is determined by the thickness of the stagnant layer, therefore a change in
flow rate results in a change in the current response of the electrode [46]. Under
steady-state conditions, the small diffusion layer al an ultramicroelectrode is much
smaller than the stagnant layer next to the electrode surface in a flow stream.
Changes in flow rate do not effect the diffusion layer at the se electrodes.
As a result of their small size, small currents are produced at
microvoltammetric electrodes. To increase the magnitude of the current, an array of
microdisc electrodes has been employed, where the total current is equal to the sum of
the individuaI currents. Caudill and co-workers [47], using an array of 100 5 /lm
carbon dise electrodes as a detection system for liquid chromatography, have found a
slgmficant increase in the signal-to-nOIse ratio as well as a flow rate independent
response. Since ultramicroelectrodes can be easily used in resistive media, they are
particularly suited for norm::ù phase chromatography where non-polar mobile phases
are used. The abl1ity to use ultranucroelectrodes at low electrolyte concentrations with
high analytical sensitivlty provides new areas for electrochemical detection for both
high performance liqUld chromatography and flow injecuon analysis. Bixler and
Bond [48] used 5 J..I.I11 carbon and 50 /lm platinum rrucrodlsc electrodes ln a wall-jet
electrochenucal ceU for a flow injection system wuh micromolar concel.trations of
supporting electrolyte. Good sensinvlty has been obtained for the detection of four
catecholamines. after separanon by an Le system, at a plaunum thin ring electrode in
the absence of a suppornng electrolyte [49]. Caudill and co-workers [50]

~ 137 ~
combined rapid scanning pulse voltammetry with a microelectrode array channel~type
detector for lise with flow injection analysis and high perfonnance liquid
chromatography. The background corrected voltammograms obtained in the flowing
stream were characteristic of the particular analyte and therefore used to identify each
eluting peak.
High separation efficiencies can be achieved with open-tubular capIllary
column liquid chromatography. Jorgenson and co-workers [51,52J have
successfully used carbon-fibre cylindrical electrodes as chromatographie detectors with
open tubular capillary columns.
5.1.8 Electrochemical measurements in supercritical fluids.
Recently Bard et al., using macroelectrodes, have invesugated electrochemical
processes in polar supercrltical fluids including ammonia [53]. water [54], and
acetonitrile [55]. The high critical temperatures of both acetonitnle and water and
the highly corrosive nature of ammonia make them inappropnate as mobile phases for
SFC at this time. Supercritical carbon dioxide, a non-polar solve nt, is the most
commonly used mobile phase for SFC because of its moderate cntical pressure and
temperature. However, electrochemical measurements In supercnucal carbon dioxlde
using conventional electrodes are difficult at best due to the non-conducuve. non polar
nature of the media. Philips et al. [27] fmt demonstrated that voltammctry WIth
surface modified microelectrodes is possIble ln near-r:ntlcal carbon dlOxlde Wlth small
amounts of suppomng electrolyte.
A two-electrode amperometric detector deSIgn uSlOg a platInum microelectrode
working electrode based on the wall-Jet pnnciple has been developed. The
electtochemical ceU has been investigated as a detection system for SFC and the
factors infll!encmg its performance are dlscussed.
5.2 Experimental
For detru.ls on experimental procedures see sectIons 2.2.4.1. - 2.2.4.2 in
chapter 2.

.. - 138 -
5.3 Results and Discussion
5.3.1 High pressure conditions.
Operation of an electrochemical detector in a flowing stream of supercritical
media places strict requirements on both the electrode system and the cell. The
electrochemical cell must be placed before fluid decompression in order to make
measurements while the mobile phase is in the supercritical state. This means that
under convention al SFC operating conditions the detector must withstand pressures up
to 5000 psi.
5.3.2 Flow rate dependency.
The current response of amperometric detectors employing conventional
electrodes in laminar flow streams is proportion al to 1/3 power of the flow rate
[56]. In liquid chromatographie systems where analyses are conducted under
conditions of constant flow, this does not present a problem. However in SFC,
pressure or denslty are controlled as opposed to flow; this results in varying flow rates
throughout the chromatographIc run. This precludes the use of conventional sized
electrodes in SFC detectors. Under steady-state conditions, the small diffusion layer at
an ultranncroelectrode is well within the stagnant layer next to the electrode surface in
a flowmg stream. Changes in flow rate will affect only the stagnant layer and leave
the diffusion layer undisturbed at micro-amperometric detectors.
These unique propemes of nucroelecrrodes overcome sorne of the difficulties
presented by elecrrochenucal detemunations in a supercntical flowmg system and they
were therefore investigated funher.
5.3.3 Design of elecU"ochenucal cell.
The preliminary deSIgn employs a high pressure stainless steel tee-union as the
elecoocherrucal cell (Figure 5.5). Two pons are 1/16" diameter where fused silica
tubing is swaged and the thlrd pon IS 1/8" diameter for the working electrode. Al!

- 139 -
components are swaged into the cell using gnlphite ferrules. The small currents at
microelectrodes pennit the use of two-electrode systems with the cell body acting as a
quasi-reference electrode. A platinum wire (10 Ilm) sealed in soft glass functions as
the working microdisc electrode (Figure 5.6). About two centimetres of the electrode
body was ground such that it slides easily inta the ceIl compartrnent and provides a
rough surface for swaging. A new ferrule was necessary for the electrode port each
time the cell was disassembled. The restrictor IS placed through the sidearm such that
decompression is weIl removed from the working electrode. Re-sealing the electrode
with the same ferrule causes fallure of the Ltting upon pressunzation. The column
eluent enters the cell through a fused silica capillary threaded into the swagelok union
positioned directly above the working electrode 10 a wall-jet geometry. This is so
since decompression near the electrode may cause precipItation of euher analyte or the
eIectroIyte modifier causing fouling of the electrode surface. ThIS problem WIth
decompression has been noted in other cell designs [57].
5.3.4 Characterization of electrochemical cell.
Voltammetric data obtained in resisti ve media cannot be direcùy compared to
that obtained in convennonal solutions. For this reason initial cell charactenzations
were canied out using ferrocene since (i) this redox couple has been widely used in
the characterizanon of electrochemical systems. thus providing means for companson
and (ii) ferrocene is so!uble 10 supercritical carbon dioxIde [58]. The voltammetnc
behaviour of ferrocene was examined in all cases wnh a plaunum mlcrovoltammetnc
working electrode 10 both a three- and two-electrooe system. Cychc voltammograms
of ferrocene in acetomtrile and supporting electrolyte were camed out usmg the lO-jlm
platinum working electrode in a convention al three-electrode mode. The cychc
voltammogram shown in Figure 5.7 was recorded for 5mM solutIon of ferrocene In
acetonitnle wlth 0.01 M tetrabutylammomum tetrafluoroborate as the ~upportmg
electrolyte. A SlgmOldal shaped voltammogram charactensnc of ultramlcroelectrodes
was obtamed Wlth a half-wave potennal of 0.42 volts vs Ag/AgCI reference electrode.
This established the performance of the electrode under normal operaung condltlOns.

Figure S.S
- 140 -
COLUMN OUTLET --....... 1
-'::.~ =:===~~~:i '--- i SSUT TEE-UNION
RESTRICTOR
+--- GRAPHITE FERRUU:
PLATINUM MICROELECTRODE ---+1
High pressure electrOChemical celle

- 141 -
The platinum working electrode was then incorporated into the flow cell, the flow cell
was then filled with the same ferrocene/acetonitrile/supporttng electrolyte mixture and
a cyclic voltammogram carried out under static conditions usmg a two-electrode mode,
where the celi body is used as a quasi-reference electrode. This established the
performance of the working electrode in the celI operating in the two-electrode mode.
As can he seen in Figure 5.8 the cyclic voltammogram has retained HS characteristic
sigmoidal shape but the half-wave potenual has shifted negatively by 140 millivolts.
This is due to the lack of a true reference electrode.
The electrode performance was then evaluated under more realistic operating
conditions, lhûugh still in the static mode. A solution of
ferrocene/acetonitrile/supporting electrolyte (50 ~) was placed ln the cell, the system
was then sealed and pressurised with carbon dioX1de from a syringe pump to 2000 psi
at 4CfC. Again the sigmoidal shape of the cyclic voltammogram is mamtruned but the
half-wave potential shifted more negauvely by about 220 rmllIvolts (Figure 5.9),
again due to the lack of a true reference electrode. This estabhshed the performance
of the detector using carbon dioxide/acetomtnle/supporung electrolyte mIxtures under
supercritical but static conditions.
5.3.5 Hydrodynamic perfonnance of cell.
The next evaluation was to establish the perfonnance of the electrochemlcal
celI in a flowmg stream under nonnaI operaung condIuons. Due to Interference from
injection solvents and turbulence gcnerated by the lnJecnon process lt was necessary to
develop a chromatographie procedure so that the ferrocene sIgnal is weIl removed
from the VOId volume SIgnaIs. Separanons were achieved on a rever~ed phase column
at 4<rC using a vanety of moblle phases from SImple carbon dlOxIde ta mIxtures of
carbon dioxide/acetomtnle/tetrabutylammomum tetrafluoroborate. An ultravIolet
absorbance detector was posinoned before the electrochemIcal detector, provlding a
dual-detecuon system (Figure 5.10). FeITocene/acetomtnle solutIons were then
injected onto the column and the detector response mOnItored under a vanety of
operating conditions. ~o faradruc response was obtruned from the electrochemical

- 142 -
\iercury EpolY
PI .. llOum Wire Glus C.lplll.uy Capper Rod 110 uml 10.125 inch dlolmeter)
____________ :1 Inches ----------"
PLA TINUM MICROELECTRODE
Figure 5.6 Platinum Microelectrode.
Figure 5.7
T : 10 nA
i 1
350 mV
r /
/
====J 1.0
500 mV
0.5 -1.0
Potennal (volts)
Cychc voltarnmogram of ferrocene (SmM) in CH3C~/O.lM TBA TFB in three-electrode ceil. Reference electrode: Ag/Agel. Auxiliary electrode: plannum wrre.

1.2
Figure 5.8
0.5
- 143 -
10 nA 210mV
360mV
0.1
Potennal (volts)
Cyclic voltammogram of ferrocene (5mM) in CH3CN/O.IM TBA TFB in electI'ochemiC'al celI. Stainless steel quasi-reference electrode.
'10 nA
o mV
) ~1
140 mV
n.a -0.5
Figure 5.9 Cyclic voltammogram of ferrocene l5 mM) !fi CH1C~l/O.1 M TBA TFB in electI'ochenucal cell pressurized to 1000 pSI with CO". Stainless steel quasi-reference electrode.

SYRINGE PUMP
LlQUID CO,
SWITCHING~
VALVE
. 144-
INJECTOR
Irt t~ COLUMN ,......,
J
GAS CHROMA TOGRAPH
Figure 5.10 Schemauc of complete SFC/ECD system.
• •
• JI 0
0 • 1 i Il ~ 1 11 <=
, UL TRA-VIOLET DETECTOR ... ;~l POTENTIAL CONTROL
cm @) [, 0
0 0 [gJ
'-...
"" ,/
ELECTROCHEMICAL DETECTOR

- 145 -
detector at applied potentials up to 1.2 volts with simple carbon dioxide mobile
phases. AcetorJtrile modifier was then added to the carbon dioxide up to 1.6 mole%,
at 0.4 mole% intervals. Again no faradaic response was detected at applied potentials
ranging from 0.0 to 1.2 volts. Although the positive potentiallinut of this medium
has not been determined, low noise backgrounds were recorded at applied potentials as
high as 1.4 volts.
Tetrabutylammonium tetrafluoroborate (TBA TFB) at 0.05 mole% was then
added to the acetonitrile modified supercritical carbon dioxide and a faradaic response
was observed from the electrochemical detector. Figure 5.11 and Figure 5.12
represent chromatograms obtained for a 1-~ injection of acetomtnle and ferrocene in
acetonitrile (10 Ilg/rnl), respecnvely, with 1.6 mole% acetonitnle and 0.05 mole%
TBA TFB modified supercritical carbon dioxide mobile phase under isobaric
conditions at 2200 psi and 400C. The addition of the electrolyte has eaher mcreased
the conductivity of the mobile phase or, as predicted by Niehaus et al. [59], the
electrolyte has formed a conducting layer on the electrode surfaces. The latter IS
unlikely as in situ formation of a conducting layer would tend to give meproducible
current responses, at least initially, and this was not observed. The hlgh solubility of
TBA TFB in acetomtrile and the low concentration of the electrolyte in the mobile
phase also precludes the precipitation of the salt al the electrode surface.
Formal redox potential tables or potentials obtamed from cyclic
voltammograms obtained under static conditions are msufficlent for detennining the
optimal operating potental for detecting the same species ln a nowmg stream. This IS
due to the increased IR drop in the se systems. The optimum operatJng potentIal for
the detection of ferrocene was established by injecung 10 ~g of ferrocene on column
and measuring the CUITent response at applied potennals between 0.0 and 1.1 volts.
The reduced capacitative currems at ffilcroelectrodes led ta rapld equIilbratlon after
changes in the applied potenual. Unlike liquid chromatographie ~ystems.
chromatograms were recorded within fifteen filnutes of a change In applied potentIa!.
A hydrodynarruc voltammogram (Figure 5.13) plotted for ferrocene In thlS system
shows an opnmal applied potennal of 0.9 volts. Beyond this potenual there l~ a drop

..,
0.0
15 pA
2.0 1
4.0 1
6.0 TIME (min.)
1
8.0 10.0 1
12.0
Figure 5.11 Response of electrochemical detector for the solvent (acetonitrile) injected on column. Applied potential set at 0.8 volts. Isobaric at 2200 psi and 40°C.
j 0.0
1
2.0 i
4.0 1
6.0 TIME (min,)
1
8.0 1
10.0 1
12.0
Figure 5.12 Response of electrochemical detector for 10 Jlg of ferrocene injected on column. Applied potential set at 0.8 volts. Isobaric at 2200 psi and 40°C.
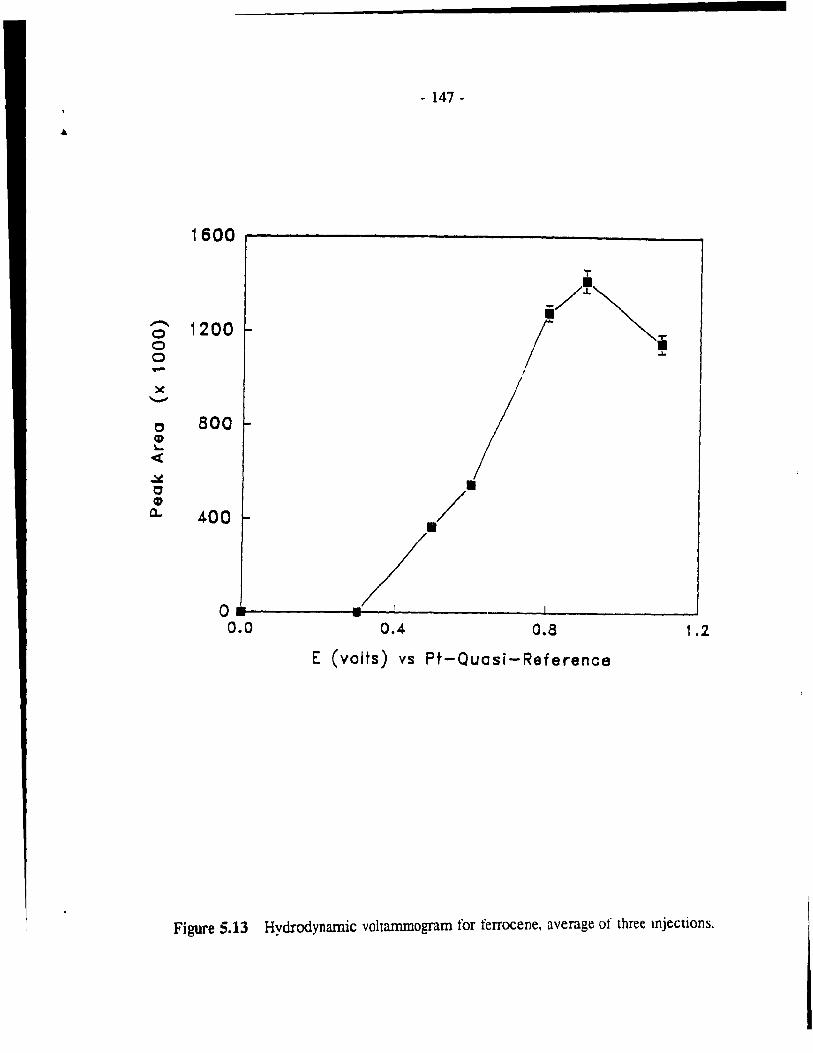
• 147 •
1600
'j
..-... 1200 1-i/'~
0 0 l ' 0 ~
x ........
0 800 -CD ~
« ~ 0 • CD ./ a.. 400 -
0 _/
1 --0.0 0.4 0.8 1.2
E (volts) vs Pt-Quasi-Reference
Figure S.13 Hydrodynamic voltammogram for ferrocene, average of three mjections.

- 148 -
in the eurrent response that may be due to the effects of increased iR drop at higher
applied potentials. The relative standard deviations are less than 5% indicating good
reproducibility for this electrochemical detection system
Although the preliminary electrochemieal cell has functioned weB, sorne
problems were encountered. The hairlike thickness of the platinum fibre and the
fragility of the glass capillary require specialized equipment, such as
micromanipulators and mierobunsen burners, for fabrication of the mieroelectrode.
While attempting to construet the electrodes in-house, it became apparent that a
perfect seal between the glass body and the platinum fibre is essential. The high
pressure encountered in an SFC system tend to push the wire out of the glass capillary
sleeve causing fluid build-up around and behind the fibre which eventually shatters the
glass. An attempt was made to enhance the seal by using non-conducting epoxy, but
supercritical carbon dioxide IS able to dissolve the epoxy. These problem were
overcome by using slighùy modified commercially available microelectrodes from
BioAnalytical Systems. Eventually after a period of use, hairline cracks were
observed on the giass surrounding the electrode, resulting in erratie response.
Although it is necessary iO add an electrolyte t', the mobIle phase for deteetion,
anticipated problems of precipitation of the tetraalk.ylammonium salt at the restrictor
were not encountered.
The results reponed above have shown the feasibiliry of developing an
electroChenn~al detecnon strategy for SFC. According to two recent repons [58,60],
voltarnmetry in supercntical carbon dioxide is possible only with a thin film of
conducting phase, either 10 the fonn of an 10n-exehange pol ymer or a molten salt
layer, on both the surfaces of the working and quasi-reference electrodes. We have
demonstrated that this conducting phase is not necessary and that electroactive species
can be detected at a bare platinum microdise working electrode of an SFC/ECD
system.

- 149 -
5.4 Conclusion
The application of an electrochemical detection strategy 10 supercritical fluid
chromatography would extend both the sensitivity and selectivlty of the technique.
The advantages of inCleased diffusion coefficients in supercntical flUlds and low
ohmic drop, fast RC rime constants and flow-rate independent response at
microelectrodes has led ta the design and use of an electrochemical cell in an SFC
method. The ceU design is simple and inexpensive; the celI casing is a commercially
available stainless steel tee-union and the working electrode IS a slightly modified
commercial microdisc platinum electrode. The ceU can be easlly rusassembled for
cleaning while maintaining high pressures when the pons are swaged. Potential IS
controlled with a simple three-electrode potentIostat by shomng the reference and
auxiliary electrode leads. The current produced was recorded wlth a chromatographlc
integrator with no modification. The conducuvlty of the supercnucal mobile phase
was increased with the addition of tetrabutylammonium tetrafluoroborate (0.05 mole%)
in acetonitrile; the electrolyte had no detnmental effect on the chromatographie
behavlOur. A hydrodynamic voltammogram plotted for ferrocene 10 thls system shows
an optimal applied potential of 0.9 volts. The relatIve standard devlatIon calculated
for three replicatc mjectIons at each applied potential IS less than 5% millcaung good
reproduclbility for this electrochenucal detectIon system. Funher modificauon and
complete charactenzauon of the celi 1S requued 10 order to develop a method for the
separation and detectIon of the electroacuve phenothiaz1Oone compounds mvesugated
in the previous chapter.

- 150-
5.5 References
1. R.M. Wightman, Anal. Chem. 53 (1981) 1125A.
2. R.C. Engsttom, M. Weber, DJ. Wander, R. Burgess, S. Winquist, Anal. Chem. 58 (1986) 844.
3. E.W. Kristensen, R.L. Wilson, and R.M. Wightman, Anal. Chem. 58 (1986) 986.
4. P. Delahay, New Instrumental Methods in Electrochemistry, Interscience, New York, (1954).
5. 1. Shain and K.J. Maron, J. Phys. Chem., 65 (1961) 254.
6. K,R. Wehmeyer and R.M. Wightman, Anal. Chem., 57 (1985) 1989.
7. Laboratory Techniques in Electroanalytical Chemistry, P.T. Kissinger and W.R. Heineman ed., Marcel Dekker, New York, (1984), Chapter 3.
8. z.a. Soos and P.J. Lingane, J. Phys. Chem. 68 (1964) 3821.
9. Y. Saite, Rev. Polag,. Jpn., IS (1968) 177.
10. K.B. Oldham, J. Electroanal. Chem., 122 (1981) 1.
11. J. Heinze, J. Electroanal. Chem., 124 (1981) 73.
12. J.R. Delmastro and D.E. Snuth. J. Phys. Chem., 71 (1967) 2138.
13. K, Aolci and J. Osteryoung, J. Electroanal. Chem., 122 (1981) 19.
14. D. Shoup and A Szabo, J. Electroanal. Chem., 140 (1982) 237.
15. T. Hepel, W. Plot, and 1. Osteryoung, J. Phys. Chem., 87 (1983) 1278.
16. T. Galus, J.O. Schenk, and R.N. Adams, J. Elecrroanal. Chem., 135 (1982) 1.
17. J.o. Howell and RM. Wightman, Anal. Chem., 56 (1984) 524.
18. ~.A. Dayton, A.G. Ewing, and R.M. Wightman, Anal. Chem., 52 (1980) 2392.
19. M.W. Vandenbom and D.M. Evans, Anal. Chem, 46 (1974) 643.
20. E. Ahlberg and V.O. Parker, J. Elecrroanal. Chem., 121 (1981) 57.

21.
22.
23.
24.
25.
26.
.,-_1.
28.
29.
30.
31.
32.
33.
34.
35.
36.
37.
38.
39.
40.
- 151 -
B. Schariflcer and G. Hills, J. E/ectroanal. Chem., 130 (1981) 81.
A.M. Bond, M. Fleischmann, and 1. Robinson, J. Electroanal. Chem., 172 (1984) 11.
A.M. Bond, M. Fleischmann, and J. Robinson, J. E/ecrroanal. Chem., 180 (1984) 257.
R. Lines and V.D. Parker, Acta. Chem. Scand. B., 31 (1977) 369.
J.O Howell and R.M. Wighnnan, J. Phys. Chem., 88 (1984) 3915.
J. Ghoroghchian, F. SarfaraZl, T. Dibble, 1. Cassldy, 1.1. SmIth, A. Russel, G. Dunmore, M. Fleischmann, and S. Pons, Anal. Chem., 58 (1986) 2278.
M.E. Phillips, M.R. Deakm, M.V. Novotny, and R.M. Wightman, J Phys. Chem., 91 (1987) 3934.
J. Cassidy, S.B. Khoo, S. Pons, and M. Fleischmann,1. Phys. Chem., 89 (1985), 3933.
R.S. Robinson and R.L. McCreery, Anal. Chem., 53 (1981) 997.
R.S. Robinson, C.W. McCurdy, and R.L. McCreery, Anal. Chem, 54 (1982) 2356.
D.O. Wipf, E.W. Knstensen, M.R. Deakin, and R.M. Wightman. Anal. Chem., 60 (1988) 306.
M.!. Montenegro and D. Pletcher, J. E/ecrroanal. Chem .. 88 (986) 371.
A. Fitch and D.H. Evans, J. E/ectroanal. Chem., 202 (1986) 83.
C.P. Andrieux, P. Hapiot, and J-M. Saveant. 1. Phys. Chem , 92 (1988) 5987.
C.P. Andrieux, P. Haplot, and J-M. Saveant. 1. Plzys Chem, 92 09H8) 5992.
A.l Bard and L.R. Faulkner, E/ecrrochemlcal Merhods, Wiley, ~ew York, (1980) p384.
A.G. Ewmg, M.A. Dayton. and R.M. WIghtman, Anal Chem. 53 (l9R1) 1842.
J-L. Ponchon, R. Cespugho, F. Gonon, M. Jouvet. and J-F. PUJol. Anal Chem, 51 (1979) 1483.
M.A. Dayton, A G. Ewmg, and R.M. WIghtman. Anal Glem. 52 (980) 2392.
A.S. Baranski and H. Quan, Anal. Chem., 58 (1986) 407.
1
- 152 -
41. M.A. Dayton, le. Brown, K.J. Stutts, and R.M. Wightman, Anal. Chem., 52 (1980) 946.
42. M. Fleischmann, F. Lasserre, J. Robinson, and D. Swan, J. Electroanal. Chem., 177 (1984) 97.
43. M. Fleischmann, F. Lasserre, and 1. Robinson, J. Elecrroanal. Chem., 177 (1984) 115.
44. P.T. Kissinger, Anal. Chem., 49 (1977) 447A.
45. S.G. Weber and W.C. Purdy, Anal. Chim. Aera, 100 (1978) 53l.
46. D.G. Swanzfager, Anal. Chem., 48 (1976) 2189.
47. W.L. Caudill, J.O. Howell, and R.M. Wightman, Anal. Chem., 54 (1982) 2532.
48. J.\V. Bixler and A.M. Bond, Anal. Chem., 58 (1986) 2859.
49. S.B. Khoo, H. Gunasingham, K.P. Ang, and B.T. Tay, J. Electroanal. Clzem., 216 (1987) 115.
50. W.L. Caudill, A.G. Ewing, S. Jones, and R.M. Wighonan, Anal. Chem.,55 (1983) 1877.
51. L. A. Knecht, EJ. Guthrie, and J.W. Jorgensvn, Anal. Chem., 56 (1984) 479.
52. J.G. White and J.W. Jorgenson, Anal. Chem., 58 (1986) 2992.
53. R.M. Crooks and AJ. Bard, J. Phys. Chem., 91 (1987) 1 ~74.
54. W.M. Flarsheim, Y -M. Tsou, I. Trachtenberg, K.P. Johnston, and A.J. Bard, J. Phys. Chem .• 90 (1986) 3857.
55. R.M. Crooks and ." . .1. Bard, J Electroanal. Chem., 243 (1987) 117.
56. L.R. Snyder and J.J. Kirkland, IntroductIOn to Modern Liquid Chromarography, John Wiley & Sons, lne., New York, 1979, pp.153-8.
57. A.C. Michael and R.M. Wlghnnan, Anal. Chem., 61 (1989) 2193.
58. R.E. Jentoft and T,H. Gouw, Anal. Chem., 44 (1972) 681.
59. D. Niehaus. M. PhIlips. A.C. Michael, and R.M. Wightman, J. Phys. Chem., 93 l1989) 6232.
60. A.C. Michael and R.M. Wightman, Anal. Chem .• 61 (1989) 270.
Chapter 6
Determination of Sorbitan Trioleate in Metered-dose lnhalers
by Super(:ritical Fluid Chromatography
6.1 Introduction
Supercritieal fluid ehromatography ean be interfaced wuh both specifie and
universal detection systems. Although Ge techniques can provide umversal deteetion,
the solutes must be thennally stable and have an appreclable volaulity for migrauon.
HPLC is sui table for the analysis of thermally labIle, non-volatile solutes, but common
LC detection systems require that the anal y te have a chromophore. By combining the
elution power of liquid-like densities, low cntical temperature mobile phases and
univers al detection systems, SFC is capable of analyzmg many compounds not
amenable to either Ge or HPLC techniques. The analysis of sorbitan trioleate, a high
molecular weight, thermally labile surfactant by supercntlcal flUld chromatography
with flame-ionization deteetion was carried out to demonstrate the umque capabihties
of this technique.
Metered-dose inhalers are compact, pressunzed aerosol dispensers specially
designed for the oral inhalation delivery of multiple doses of a tinely dlspersed drug to
the lung. Metered-dose mhalers typlcally dIschlSge several hundred accurately
metered shots, each with c. drug concentrauon between 50 /lg and 5 mg, generally
delivered in a metered liqUld volume between 25 and lOO /lI as a tinely .\tomlzed
spray. The basic metered-dose mhaler conslsts of five essennal components 1.
container (alurrunum); 2. metenng valve; 3. propellant: 4 actualor and. 5 drug In
suspension form (Figure 6.1). The metenng valve IS the most cntlcal component ln
terms of deSign and manufactunng qualny, smce lt must accurately meter many
- 153 -

...
Aerosol can
Actuator body
- 154 -
Drug suspension
Metering valve
'" .. := 0 C
C' 0
. . . . . . ~. . .
6 Q • . . o ..
o •
Spray cone
Droplets Mouthpiece generated by flash breakup
1 Figure 6.1 Schemanc of a metered-dose inhaler.

- 155 -
successive doses of a liquid formulation while maintainmg a proper vapour seaI during
the lifetime of the aerosoi product. The drug IS usuaIIy present 10 a suspensIOn
formulation because of the greater chemical Stabllity and lower irnpactional deposltion
of droplets in the thlOat. The particle size of the drug powder is cnncal in
determining the pulmonary deposition, suspension stability and metering valve
function. The propellant is a blend of approved liquefied gas chlorofluorocarbons,
capable of producing an aerosol cloud of suitably fine drug paruc1es. The liquefied
gas propellants must also mamtam a steady vapour pressure dunng emptytng In order
to give uniform particle dispersion during the use of the whole contents. Excipients
used in the propellant blend are typically surfactants which presumably reduce the
flash breakup and volaulity of the droplets, resulnng In greater dehvery efficiency.
The concentratlon of Lite surfactant does not affect the concentranon of the drug
released per dose, but does mfluence the aerosol flumes (FIgure 6.2). The addiuon of
increasing amounts of sorbitan trioleate, a surfactant, to the propellant blend causes a
progressive increase ln the persistence of the flumes. This IS a direct result of the
redueed rate of volatilization and redueed flash break up of the droplets. There are
considerable eonstraints on selection of surfactants WhlCh are toxlcologlCally
satisfactory for inhalation use.
Sorbitan esters are nonionic surface acnve agents used in the preparation of
various pharmaceuncal formulauons and as addluves ID foods, beverages, drugs,
texules, and plasncs. Sorbaan tnoleate (SPAN 85®) (Figure 6.3), a pamaI ester of
olele aCld denved from sorbitol. IS commonly used in many drug products. It lS used
in metered-dose mhalers ta keep the drug dispersed ln the propellant and to lubncate
the actuator valve. SPAN 85 IS presently used ln .he preparation of an m-house
aerosol fonnulauon. up to approxlmately 5% by welght. There has been ~ome concern
as ta the ;Jossible toxlcny by 1Ohalauon of sorbnan tnoleate. Pubh~hed oral and
dermal toxicuy sturues label sorbuan tnoleate as relauvely non-toxlc by oral
adnnmstrauon and causes shght ImtaUon when admmmered toplcally [1,21.
However, good product deSign dlctates that the amount of )orbltan tnoleate u~ed be
companble wnh achievmg optimum perfonnance characten~tlc~ and be wlthm the

1
0%
O -- 5 0/ . l ,0
- 156 -
0.15%
3.0~~
Figure 6.2 Effee! of SPAN 85 concenrrauon on aerosol plumes.

· 157 -
HO
o
Figure 6.3 Structure of sorbltan tnoleate.
indusrry-accepted quantities. Although listed as an Ingredient In several commercially
available aerosol formulations, the level In each dose lS not reponed. Consequently an
assay procedure for the measurement of sorbitan tnoleate in four marketed aerosol
preparations and an experunental fonnulation was developed.
6.2 Experimental
For experimental detaùs see sections 2.2.5.l - 2.2.5.2 in chapter 2.
6.3 Results and Discussion
6.3.1 Resmctor placement
When supercnocal carban diaxlde IS used as the mobIle phase. tlame·lanIZatIOn
detecuon can be readlly mterflced ta SFC ta provlde a detecoan method wlth
universal arld senSlUve response charactensncs. The low cnncal temperature ot

1 - 158 -
carbon dioxide also pennits the analysis of thennally labile compounds. The effluent
from the column is introduced into the flame ionization detector after il has expanded
to ambient pressure. High flow rates, typical for packed columns, causes cooling
which can result in decreased ionization efficiency in the flame or it can extinguish it
entirely. This is a result of a large Joule-Thompson cooling effect which occurs due
to the adiabatic expansion of the supercritical fluid mobile phase [3]. FID spiking is
controlled by postponing decompression as long as possible (this allows less time for
nucleation) while heating the mobile phase at the restrictor outlet where the cooling
effect of the expanding fluid is greatest [3]. When using packed columns, the en~ of
the restrictor IS plaeed about 1 to 2 cm below the FID jet (Figure 6.4), pennitting
higher flows to be introdueed into the flame while keepmg the flame stable during
pressure or denslty programmmg. For a given set of chromatographie parameters the
effect of the restrictor tip position for two flow rates was invesngated. U sing a
reversed column (250 X 1.0 mm) al 6O"C, supercritical carbon dioxide mobile phase, a
pressure pro gram from 1800 psi to 2800 psi at 65 psi per minute, and the flame
iomzation detector set al 3500C, a test solution of tetradecane, pentadecane and
hexadecane (0.03% w/w) in hexane was injected for various restnctor positions. The
restrlctor outlet gas flow rate was measured using a flow-meter WIth the restrictor tip
Hush wah the Jet head (heated 10 3500C) and a carbon dioxlde mlet pressure of 1800
psi. At agas flow rate of 30 ml per mInute, the restrictor must be placed at least 0.5
cm away ta keep the flame lIt.
Four mJectIons of the standard solution were averaged for each set of
conditIons, the data collected have been summarized In Table 6.1. The peak to peak
nOlse ln the base Ille was determmed by mulnplymg the noise leveI measured from
the chromatogran1 by the range setUng on the gas chromatogram and dividing by the
attenuatlon settlng on the mtegrator. The noise Ievel was measured at a constant
mobile phase pressure of 1800 pSI. Peak areas generally decreased at the higher flow
rate. as would be expected for a mass sensltIve detector. Peak areas are smaller for
the huer elutIng peaks as the resmctor tIp 1S placed funher from the Jet head. The
later eluting peaks were chromatographed ut higher pressures, mrucatmg that the

Air Inlet ===========!
Hz Inlet
- 159 -
RD Collectar Assembly
'-----Jet
Figure 6.4 Schemanc of flame-lOnlZanOn detector.

- 160-
Table 6.1 Effect of Restrictor Position
Position Background Signal Noisep-p Peak Area RSD% (cm) (pA) (pA)
Flow rate = 17 ml/min 0.5 48 1.74 441832500 4.49
12508725 7.75 1540950 9.90 1670625 9.44
1.0 57 3.48 383920000 2.70 9740620 4.84 1229340 8.86 1454700 5.12
1.5 54 1.84 382825000 0.67 9347540 6.97 1159050 2.86 1223000 2.21
2.0 44 2.56 381700000 1.35 8645000 9.43 949360 8.36 977375 3.97
Flow rate = 30 ml/min 0.5 62 1.04 481293333 2.95
8610833 4.95 1156867 6.86 1200487 9.10
1.0 48 2.80 353298000 0.82 6387880 2.93 939680 5.55 1113290 5.34
1.5 56 1.74 355985000 1.46 6591733 2.50 957333 1.03 1024300 0.95
2.0 52 3.48 353506667 0.55 6541977 3.27 832371 6.03 923053 1.93
==

- 161 -
position of the resttictor is more critical at the higher densities (i.e. higher flow rates).
The restrictor should, therefore, be placed as close to the jet head as possible without
extinguishing the flame. For the all experiments a 30 mVmin restrictor was placed 0.5
cm from the flame jet head.
6.3.2 Chromatographie separation
The separation of sorbitan trioleate was achieved on a C18 column with
supercritieal carbon dioxide mobile phase at comparatively low to.!mperature and
pressure. The capacity ratio for the surfactant decreased Wlth increasmg pressure at
constant temperature, suggesnng that the retention mechanism is govcmed by the
analyte solubility in the supercritical fluid phase. Under Isobanc and isothennal
conditions, sorbitan trioleate elutes as one major and two minor components (Figure
6.5). The larger peak with a capacity ratio of 1.7 was used to quanntate sorbitan
trioleate. For both standards and samples, four injections were averaged and pyrene (2
mg/ml) was used as the internal standard for all solutions. A calibra non curve was
prepared by injecting seriaI dilutions of a stock solution (16.4 mg/ml) of sorbitan
trioleate in dichloromethane. A !inear response was obtained for a plot of peak height
ratio between 0.5 - 16 ug injected on column (Figure 6.6).
6.3.3 Concentration of SP AN 85 in each fonnulanon
Five canisters of each product were analyzed. RSD values for retention urnes
were less than 0.5 % and peak. height rauos measurements had RSD's between 1.0 and
2.0 %. The amount per dose was calculated by dividing the total wt!lght of sorbnan
trioleate per canister by the label claim number of bursts (Table 6.2). The sorbltan
trioleate is well separated from other components of all the fonnulauons tested.
Figures 6.7 to 6.11 are representative chromatograms for each of the four marketed
aerosols and the in-house fonnulation. The in-house fonnulatIon IS deslgned ta deliver
120 ~g of sorbitan trioleate per dose WhlCh agrees weIl wlth the amount found, 123
~g/burst. The detection lirnit calculated as three urnes the peak-ta-peak basehne noise
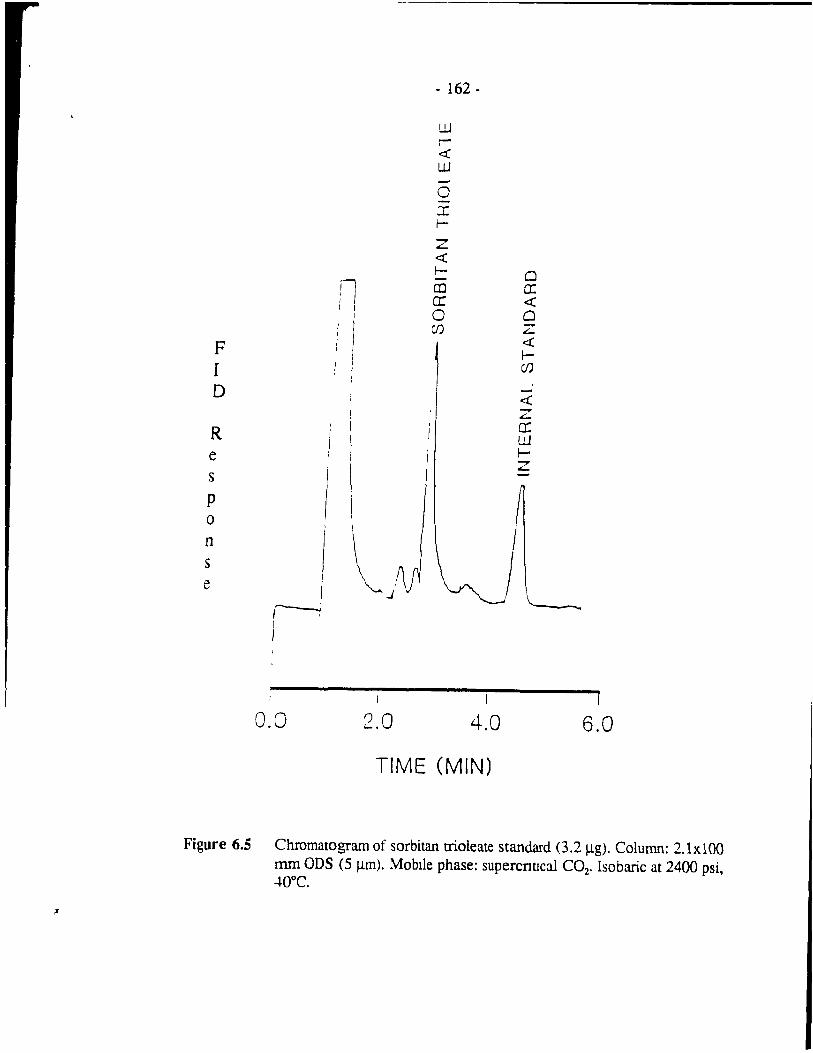
.'
F I D
R e s p 0
n s
1 e 1
r--~
)
0.0
il i 1
1
1
1
1
~0 .J
2.0
- 162-
w , or.:{
W
0 X f-
Z or.:{ f-co CI: 0 U)
1
4.0
TIME (MIN)
0 Cl: or.:{
0 z c:(
f-U)
-or.:{ -. "-a: w f-Z
1
6.0
Figure 6.S Chromatogram of sorbitan trioleate standard (3.2 ~g). Column: 2.1xl00 mm OOS (5 ~m). MobIle phase: supercnncal CO2• Isobaric at 2400 psi, ..tO°c.

- 163 -
500
450 .. y = 025 x - 0.13
/
/
4.00 Z r = 09889
3 50 ..
~ ~ -" 300 -v
/
~
" 2.50 ... /
« /Â
-~ 2 00 /
~ /
~ / c... /
, 50
/ l
// 1.00 - /Â
? ?
o 50 /
~
Ji./ 'J 00
0.00 4.00 B.OO 12 00 16 00 2000
Cane SPAN 85 (ug/ ml)
Figure 6.6 Calibrauon curve for sorbaan moleate wlth pyrene as the Internai standard.

Table 6.2 - 164 -
SP AN 85 in Drug Products.
Product Amount per Dose
Experimental Duo-Medihaler~ Medihaler ISO~ Medihaler EP~ Alupent~
123 ~g 214 ~g 267 ~g 160 ~g 212 ~g
RSD%
1,4
1.6 1.7 1.2 1.8
was 50 ng per injected volume. This method is currenùy being used to de termine
sorbitan tnoleate droplet size and distribution in metered-dose inhaler plumes.
6.4 Conclusion
An assay has been developed for the detennination of sorbitan trioleate in
metered-dose inhalers. Analysis by conventional GC or HPLC methods is not possible
because of SPAN 85's thermal instability and lack of a chromophore. Supercritical
fluid chromatography Wlth flame-lOnization detection was ta separate and detect
sorbitan trioleate in aerosol formulations. This method is being used ta study effects
of surfactant concentration on the formulation perfonnance.
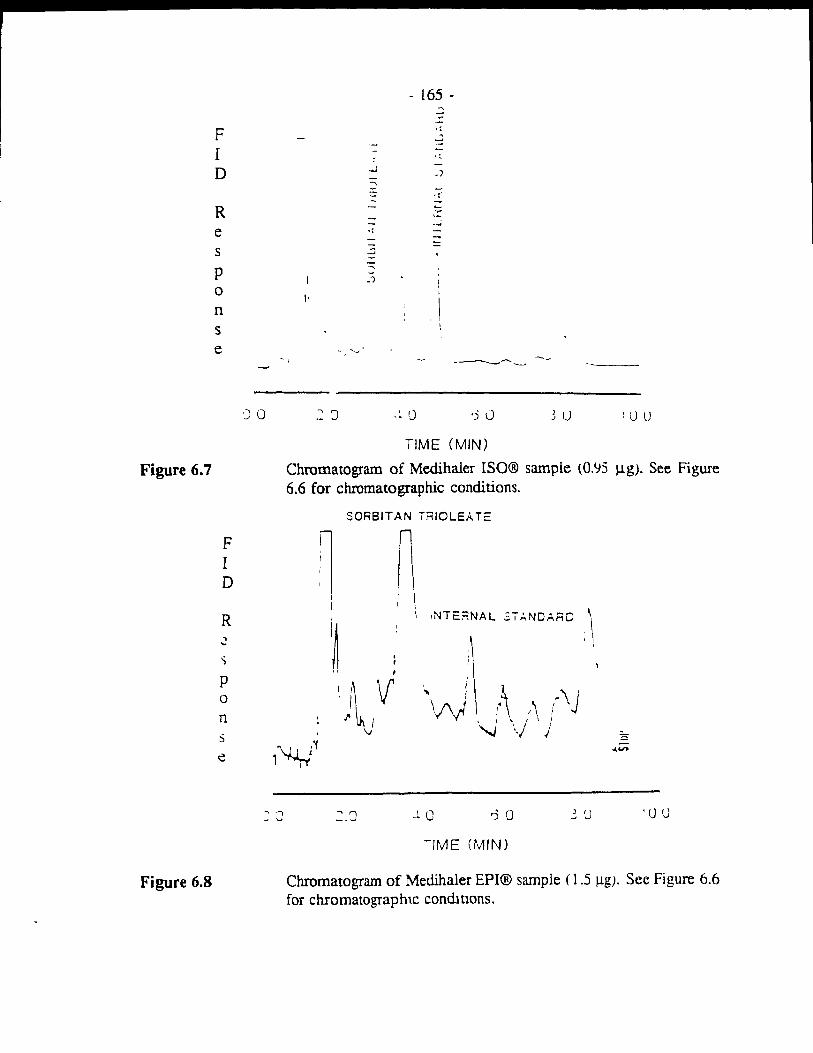
Figure 6.7
Figure 6.8
F l D
R e s p o n s e
F l D
R , ... 'i
P 0
n s è
'JO
l'
- ! ---------... --
. ~ fJ 'J ù 3 U
TIME (MIN)
Chromatogram of Medihaler ISO® sample (G.YS ~g). See Figure 6.6 for chromatographie conditions.
SORSITAN iR/OLEA TE
1 ~ 1
1 1 j
1 \ INTE~NAL 3; ANDARD ;\ ~ \~\
,
"~ V t\ /\ (\J \ 1
J' 1 ' " j j
" ""'J " j
~,"1 -
, 1 .... ..,.
:.'J .1 0 , !j Ij
~IME (MIN)
Chromatogram of Medihaler EPI® sample (1.5 Ilg). See Figure 6.6 for chromatographlc condmons.

f"
l D
R e :)
p o n s e
- 166 •
-, i
1 1 Il ( INTERNAl STANDARD
i ~ dl' JI. 1 V\Jv V
,---1
Figure 6.9
F l o
R
n
Figure 6.10
JO
1 ,V , ,
~.Q .10 6.0 80 10.0
TIME (MIN)
Chromatogram of Duo-Medihaler® sample (3.1 ~g). See Figure 6.6 for chromatographie conditions.
SORSIT AN TRIOlEA TE
~ 1
1
':.CJ
~ : INTERNAl
1 / STANDARD r i
VJ 1 i
\j yV ...! 0 60 3.0
-:ME (MIN)
10 (]
Chromatogram of Alupem® sample (2.0 ~g). See Figure 6.6 tor chromatographie conditions.

1
F l 0
R e s p a n s e
Figure 6.11
- 167 -
SORBIT AN iNJOLEA JE
1 J
r-J \~
(
8.0 ~.O 4.0 6.0
TIME (MIN)
Chromatogram of in-house formulauon (0.40 Ilg). See Figure 6.6 for chromatographie candiuon').

- 168-
6.S References
1. Cosmetic, TOlletry and Fragrance Assoc., 1. Am. Coll. Toxicol., 3(5), 1·82, (1984).
2. Yamamoto, H.; TsutSUl, K.; Shimadu, K.; !mai, S., 1. Toücol. Sei., 8(4), 301·310, (1983).
3. T.L. Chester, Microbore Column Chromatography: A Unified Approach to
Chromatography., New York, (1989) Chapter 11. 369.
- 169 -
Contributions to Original Knowledge
In this work the following contributions to onginal knowledge are cl.:umed.
1. The importance of the influence of denslty on chromatographIe behavlOUf ln
simple supercritical carbon dioxide and modIfied carbon dioxide mobile phases was demonstrated.
2. A teehmque to subdivlde gases was modIfied for the preparatIon of ffilXed supercritical mobile phases.
3. It was demonstrated that certain mobile phase mod.lfiers alter the chromatographie process by mcreasmg the solubilIty of the solutes in the mobile phase and/or by modIfymg the stationary phase surface.
4. The information gained from mobile phase modIfier stuilles was used to develop methodology for the separauon and deteeuon of a senes of phenothiazinone compounds.
5. A simple and rapid assay for L-615,919 in plasma was developed.
6. The determination of sorbaan trioleate In metered-dose inhalers by supercntieal fluid chromatography with flame-ionization deteeuon was achieved.
7. An eleetrochernical detector mcorporating a plaunum ultranllcro workmg electrode and a hlgh pressure stamless steel ceil was designed and constructed.
8. The feaslbility of this elecrrochemical system as a detector for SFC was demonstrated.

".
- 170 -
Appendix A
Paseai Program to Calculate Operating Pressure
Program Pressure;
{Program to calculate pressure at a given density and temperature for pure and for modtfied supercriucal carbon dioX1de, using the Peng-Robinson Equation of state.}
const
var
r = 0.082054; TC = 304.2; PC = 72.8; WC = 0.225; KC = 0.70798; MC = 44.02;
G, CHOICE, T, D : INTEGER; XI, XJ, PA, V, TA, KA, Z : REAL; AT, BT, MA, MW, VP, W, AI, AJ, AC, PRESS: REAL; I, J, K, PRES, Zl, LL, UNE: INTEGER; RESULT : A RRA Y[1..63, 1..4] OF INTEGER, HIGH : BOOLEAN;
PROCEDURE VPRESSURE(A,B,T: REAL; VAR VP :P.EAL); {Calculates the vapour pressure of each compone nt of mixture}
VAR TI, lP : REAL;
BEGIN TI := 0.7*T - 273.15; LP := A - (B/m + 230)); VP := EXPCLP*2.3026)n60;
END; {VPRESSVRE}

- 171 -
PROCEDURE ACENTRIC(VP,P :REAL; V AR W :REAL); {Calculates the acentric factor for each component}
VAR PR: REAL;
BEGIN PR := VP/P; W := -LN(PR)/2.3026 - 1;
END; {ACENTRIC}
PROCEDURE AITERM(CT,CP,K,TT :REAL; VAR AI: REAL); {Determines constant (a) in Peng-Robinson Equ:uion of State}
VAR TR, L ,M : REAL;
BEGIN TR := TT/CT; L := SQR(1 + K*(1 - SQRT(TR»); M := (0.45724 * SQR(R) * SQR(CT»/CP; AI := L * M;
END; {AlTERM}

-f/
- 172-
PROCEDURE PENG(V AR PRESS : REAL); VAR
D, T: INTEGER; A, B : REAL;
BEGIN D := 500; 1 := 1; WRITELN(LST); WRJTELN(LST,' TEMPERATURE " 'DENSITY ','PRESSURE ','Z '); WRITELN(LST); WHll.E D <= 900 DO
BEGIN T := 313; WHILE T <= 373 DO
BEGIN MW := XI*MC + XJ*MA; AITERM(TC,PC,KC,T, AI); AC:= Al; IF Xl > 0 TIlEN
BEGIN AITERM(TA,PA,KA,T, Al); AJ := AI;
END; A := XI*XI*AC + XJ*XJ*AJ; B := XI*O.0778*R *Tc/pC; PRESS := (R*T/(MW/D - B» - (N«MWID)*(MWID+B) +
B*(MW/D-B)); Z := PRESS*(MWID)/(R*T); PRESS := INT(PRESS ... 14.696); PRES := ROUND(PRESS); ZI :=ROUND(Z"'lQOO); RESULT[I,)] .= 0; RESULT[I,2] := T; RESULT[I,3] := PRES; RESULT[I,4] := ZI; T:= T + 10; l := 1 + 1;
END; D := D + 50; END;

K := 1; 1:= 1; LL:= 4; WHILE K <= 7 DO
BEGIN 1:= K; WHllE l <= 63 DO
BEGIN HIGH := F ALSE;
- 173 -
IF RESULT[1,3] >5500 THEN HIGH := TRUE; IF HlGH = FALSE THEN
WRITELN(LST,RES UL T[I,2]-273:8, RESULT[I,1]/1000: 15:2, RESUL T[I,3]: 13, RESUL T[I,4]/lOOO: 13:3);
1 := 1 + 7; LL := LL + 1; IF (LL >= 73) and (l <= 63) 1lIEN
BEGIN writeln(lst); WRITELN(LST);
WRITELN(LST, 'TEMPERA TURE', 'DENSITY', 'PRESSURE', 'Z'); WRITELN(LST); LL :=4;
END; END; WRITELN(LST); LL:= LL + 1; K:= K + 1;
END; END; {PENG}

- 174 -
BEGIN {GeneraleS a sereen menu for selection of mobHe phase mixtures}
ClrScr; GOTOXY(5,IO); WRITELN('MOBILE PHASES '); WRITELN(' 1. CARBON DIOXIDE'); WRITELN(' 2. ACETONITRILE'); WRITELN(' 3. METHANOL'); WRITELN(' 4. DICHLOROMETHANE'); WRITELN(' 5. FORMIC ACID'); WRITELN(' 6. QUIT'); WRITELN; WRITELN; WRITELN; WRITE('SELECf MOBll..E PHASE (1-6). '); READLN(CHOICE); WRITELN; WRITELN; CASE CHOlCE OF
1: BEGIN {CARBON DIOXIDE} WRITELN(LST); WRl1ELN(LST, 'SUPERCRITICAL CARBON DIOXIDE'); XJ :=0; XI := 1 - XJ; PENG(PRESS);
END;
2: BEGIN {ACETONITRll..E} WRI1E('ENTER MOLE FRACTION OF MODIFIER: '); READLN(XJ); writeln(LST);
WRITELN(LST, XJ*I00:5:2,'MOLE% ACETONITRILE IN CARBON DIOXIDE');
11 := 1; • XI := 1 - Xl; TA := 547.85; PA := 47.7; AT := 7.12578; BT := 1322.74; MA := 41.06; VPRESSURE(AT,BT,TA, VP); ACENTRIC(VP,PA, W); KA := 0.37464 + 1.54226*W - 0.26992*SQR(W); PENG(PRESS);
END:

l
- 175 -
3: BEGIN {METHANOL) WRITE('ENTER MOLE FRACTION OF MODIFIER: '); READLN(XJ);
WRITELN(LST, XJ*100:5:2,' MOLE% METHANOL IN CARBON mOXIDE');
XI := 1- XJ; TA := 512.6; PA := 78.2; AT := 8.23608; BT := 1580.6; MA := 32.04; VPRESSURE(AT,BT,TA, VP); ACENTRIC(VP,PA, W); KA := 0.37464 + 1.54226*W - O.26992*SQR(W); PENG(PRESS);
END;
4: BEGIN {DICHLOROMETHANE} WRITE('ENTER MOLE FRACTION OF MODIFIER: '); READLN(XJ);
WRITELN(LST, XJ*100:5:2,' MOLE% DICHLOROMETHANE IN CARBON DIOXIDE');
XI := 1 - Xl; TA := 510.2; PA:= 60; AT := 6.91821; BT := 1090.1; MA := 84.93; VPRESSURE(AT,BT,TA, VP); ACEN1RIC(VP,PA, W); KA := 0.37464 + 1.54226*W - 0.26992*SQR(W); PENG(PRESS);
END;
5: BEGIN {FORMIC ACIDl WRITE ('ENTER MOLE FRACllON OF MODIFIER: '); READLN (XJ);
WRITELN(LST. XJ*100:5:2,' MOLE% FORMIC ACID IN CAP..BON mOXillE');
XI := 1 - XJ; TA:= 487.0; PA := 59.2;

END.
• 176 -
AT :~ 7.15563; BT := 1413.9; MA := 60.05; VPRESSURE(AT,BT,TA, VP); ACENTRIC (VP, PA. W); KA := 0.37464 + 1.54226*W - 0.26992"'SQR(W); PENG(pRESS);
END;
6: END; END.
{QUIT};

- 177 -
Appendix 8
Retention Data for Modifiers Studies in Chapter 3.
Mobile Phase: Supercritical carbon dioxide
Compouad Temp DeDJ1ty to tr Wiutb
lsobutyl benzene 4{) 0.7 1.77 2.22 0.141 isobutyl benzene 40 0.8 1.43 1.62 0.1 lsobutyl bem.enc 40 0.9 1.04 1.14 0.064
phcnyl acenc acid 40 0.7 1.77 3.28 0.303 phenyl acenc acui 40 0.8 1.43 2.01 0.186 phcnyl acenc 3Cld 40 0.9 1.04 1.27 0.096
antbraqumonc 40 0.7 1.77 5.25 0.297 anthraqumonc 40 0.8 1.43 2.49 0.127 anduaquinone 40 0.9 1.04 1.44 0.074
anlbracenc 40 0.7 1.77 6.78 0.33 anthracenc 40 0.8 1.43 3.21 0.149 anthracenc 40 0.9 1.04 1.81 0.084
pyrcnc 40 0.7 1.77 14.39 0.766 pyrene 40 0.8 1.43 5.62 0.249 pyrene 40 0.9 1.04 2.76 0.112
lsobutyl benz.enc 50 0.6 1.48 2.16 0.162 lsobutyl benz.enc 50 0.7 1.35 1.61 0.095 isobutyl benzenc 50 0.8 1.11 1.23 0.101 lsobutyl benz.enc 50 0.9 0.82 0.82 0.091
phcnyl acenc 3Cld 50 0.6 1.48 3.56 0.571 phcnyl acenc aCld 50 0.7 1.35 2 0.115 phcnyl acenc aCld 50 0.8 1.11 1.41 0.151 phcnyl acenc aCld 50 0.9 0.82 0.95 0.065
.uuhraqwnonc 50 0.6 1.48 8.48 0.502
.lllthraqwnone 50 0.7 1.35 3.11 0.177 anthraqwnone 50 0.8 1.11 1.76 0.113 .lllthraqwnone 50 0.9 0.82 1.08 0.056
.lllthracene 50 0.6 lA8 996 0.565

- 178 -
Compound Tcmp Denslly to tr Width
anthracene 50 0.7 1.35 3.89 0.201 anthnœne 50 0.8 1.11 2.18 0.117 antbnœne 50 0.9 0.82 1.3 0.056
pyrene 50 0.6 1.48 23.32 1.24 pyrene 50 0.7 1.35 7.42 0.365 pyrene 50 0.8 1.11 3.49 0.164 pyrene 50 0.9 0.82 1.85 0.075
isobutyl benzene 60 0.6 1.22 2.24 0.265 isobutyl benzcne 60 0.7 1.1 1.77 0.103 lsobutyl benzene 60 0.8 0.91 0.99 0.054 lsobutyl benzene 60 0.9 0.69 0.69 0.047
phcnyl acCDC 3C1d 60 0.6 1.22 2.62 0.261 phcnyl acenc 3C1d 60 0.7 1.1 1.55 0.233 phenyl acetic 3C1d 60 0.8 0.91 1.08 0.104 phenyl aceac aCld 60 0.9 0.69 0.69 0.091
amiu3qwnone 60 0.6 1.22 .t.57 0.266 amhraqwnone 60 0.7 1.1 :.18 0.131 anthraqwnone 60 0.8 0.91 1.32 0.07 antbraqwnone 60 0.9 0.69 0.87 0.06
anthracene 60 0.6 1.22 5.35 0.194 anthracene 60 0.7 1.1 2.64 0.139 anthracene 60 0.8 0.91 1.59 0.071 anthracene 60 0.9 0.69 102 0.057
pyrene 60 0.6 1.22 11.33 0.532 pyrene 60 0.7 1.1 461 0.22 pyrene 60 8.8 0.91 2.38 1) 101 iJyrene bO 0.9 0.69 1.36 1).065
lsoouryl benzene -0 0.5 :.08 :.66 !J.l

- 179 -
Compound Temp Deosuy tO lI' Width
lsobutyl benzcne 70 0.6 1.04 1.59 0.136
isobutyl benzcne 70 0.7 0.93 1.04 0.072
isobutyl benzcne 70 0.8 0.78 0.86 0.067
isobutyl bemene 70 0.9 0.58 0.58 0.049
rhenyl aceoc acld 70 0.5 1.08 2.62 0.48
phenyl aceoc acld 70 0.6 1.04 1.79 0.165
phenyl acetic acld 70 0.7 0.93 1.18 0.115
phenyJ aceoc 3C1d 70 0.8 0.78 0.86 0.09
phenyJ aceoc acld 70 0.9 0.58 0.58 0.051
anthraqumone 70 0.5 1.08 8.36 0.74
anthraqwnone 70 0.6 1.04 3.02 0.161
anthraqumone 70 0.7 0.93 1.63 0.083
anthraqwnone 70 0.8 0.78 1.06 0.07
anthraqwnone 70 0.9 0.58 0.58 0.042
anthracene 70 0.5 1.08 8.36 0.74
anthracenc 70 0.6 1.04 3.48 0.176
anthracene 70 0.7 0.93 1.92 0.089
Jnthracene 70 0.8 0.78 1.24 0.068
anthracene 70 0.9 0.58 0.81 0.078
pyrene 70 0.5 1.08 20.15 0.92
pyrene 70 0.6 1.04 6.76 0.311
pyrene iD 0.7 0.93 3.09 0.137
pyrene 70 0.8 0.78 1.73 0.08
pyrene 70 0.9 0.58 1.04 0.077
lsoburyl benzene 80 0.5 0.95 1.33 0.079
lsoburyJ benzene 80 0.6 0.9 1.08 0.098
:sobutvl benzene 80 0.7 0.81 081 0089
lsoburyl benzene 80 0.8 0.66 0.66 0.058
~nenvi acecc aCld ~o 0.5 0.95 : 8 1) 277
Jnenvl acecc aCld ~O 0.6 0.9 :.:3 fU03

· 180 -
Compound Temp Denslty to cr Width
phenyl aceoc aCld 80 0.7 0.81 0.81 0.097 phenyl accric acld 80 0.8 0.66 0.66 0.088
anthrilqwnone 80 0.5 0.95 5 0.244 anthrilqwnonc 80 0.6 0.9 2.:1 0.144-anthrilqumonc 80 0.7 0.81 1.3 0.094 anthnqwnonc 80 0.8 0.66 0.89 0.08
anthra.ccnc 80 0.5 0.95 5.2~ 0.273 and1racenc 80 0.6 0.9 2.5 0.15 and1racenc 80 0.7 0.81 1.49 0.093 and1racenc 80 0.8 0.66 1.01 0.083
pyrenc 80 0.5 0.95 11,48 0.568 pyrenc 80 0.6 0.9 445 0.212 pyrenc 80 0.7 0.81 2.24 0.12 pyrenc 80 0.8 0.66 1.32 0.084
lsobutyl benzc:nc 90 0.5 0.87 1.: O.ll~ lsobutyi benzc:nc 90 0.6 0.8 0.92 0.076 lsobutyl benzc:nc 90 0.7 0.7 0.76 0.065 lsobutyl benzc:nc 90 0.8 0.58 0.58 0.054
phenyl aceoc acld 90 0.5 0.87 1.56 0.252 phenyl aceuc aCld 90 0.6 0.8 1 01 0.063 phenyl accoc aCld 90 0.7 0.7 0.76 0.065 phenyl aceoc aCld 90 0.8 0.58 0.58 0.054
.uu.hraqwnone 90 0.5 0.87 ..1.42 1) :278 3llthraqwnone 90 0.6 0.8 1.65 0.1 3llthraqwnone 90 0.7 0.7 1.04 0.101 ..lI1 t.nr:lO wnone ùO (J.8 () 58 r).73 ').058
..lI1thracene 90 ().5 0.87 ..1 42 1) 273
..lI1tnracene 90 1)6 0.8 !.84 ').1
..lI1U1raCene ùO 1)7 n.7 l 17 ,) 067

- 181 -
Compound Temp Denslty '0 t: WidÛl
anthracene 90 0.8 0.58 0.81 0.057
pyrcne 90 0.5 0.87 9.61 0.474
pyrcne 90 0.6 0.8 3.03 0.135
pyrcne 90 0.7 0.7 1.65 0.076
pyrcne 90 0.8 0.58 1.03 0.059
lsobutyl benune 100 0.5 0.77 0.96
lsobutyl benune 100 0.6 0.71 0.71
lsobutyl benzene 100 0.7 0.63 0.63
phenyl ace ne acld 100 0.5 0.77 1.12
phenyl aceae acui 100 0.6 0.71 0.79
phenyl aceae 3Cld 100 0.7 0.63 0.63
anthraqwnone 100 0.5 0.77 2.47 0.12
anthraqwnone 100 0.6 0.71 1.32 0.083
anthraqumone 100 0.7 0.63 0.88 0.067
.il1U1racene 100 0.5 0.77 :.59 0.153
lIlU1racene 100 0.6 0.71 1.45 0.08
.uuhracene 100 0.7 0.63 0.97 0.06
pyrene 100 0.5 0.77 4.87 0.22
pyrene 100 0.6 0.71 :.25 0.102
pyrene 100 0.7 0.63 1.3 0.065
"

.. - 182 -
Mobile phase: 0.25 mole% fonDie acid in supercritical carbon dioxide
Compound Temp
isobutyl benzcne 40.00
anthraquinone 40.00
ant.hracene
pyrene
lsobutyl benzene 50.00
ll1thraqwnone
ll1t.hracene
pyrene
.sooutyi benzene t)().oo
Denslly
0.70
0.70 0.80 0.90
0.70 0.80 0.90
0.70 0.80 0.90
0.60 0.70 0.80
0.60 0.70 0.80 0.90
0.60 0.70 0.80 0.90
0.60 0.70 0.80 1).90
1).50 1) 60
Hetght
:5986
32141 54884 65226
71706 63132
141500
:1943 45212 64746
41106 67977
77543 87914 06724 00696
ï7543 17:~n7
124864 115669
5140 63769 567"26 5S1~2
Width
0.158
0.242 0.118 0.076
0.251 0.125 0.078
0.411 0.188 0.094
0.263 0.193
0.719 0.230 1).148 0075
0.719 0.327 0.165 0.076
1).451 0.513 r) 2 .. B J093
J.2 !6 1) ::0
k'
0.17
1.48 0.67 0.34
1.96 1.00 0.60
3.64 :.37 1.38
0.29 0.13
.3 20 1 12 1).51 1).20
.3 57 :.46 1).77 t).48
';l 17 :.61 : -:'4
04

- 183 -
Compound Tcmp Densuy Hcight Widtb k'
0.70 ï3801 0.181 0.10
anlhr'aqUlDonc 0.50 65215 1.181 7.35
0.60 55867 0.360 1.24
0.70 97562 0.177 0.83
0.80 58266 0.076 0.40
0.90 162528 0.088 0.22
JIlthracene 0.50 65215 1.180 7.35
0.60 117547 0.437 :.41
0.70 192387 0.201 1.10
0.80 121911 0.086 0.61
0.90 317859 0.085 0.39
.' 0.60 40893 pyrene 0.349 5.81 ", 0.70 75584 0.328 1.89
0.80 51540 0.115 0.91
0.90 154972 0.093 0.84
:sobutyl benzene 70.00 0.50 :9560 0.270 0.38
0.60 34194 0.l74 0.16
0.70 62045 0.142 0.07
.lllthraq UlDone 0.50 55442 0.790 ~.94
0,60 41359 0.252 1.55
0.70 68315 0.149 0.64 0.80 87819 0.104 0.31
.uuhraccnc 0.50 55442 0.786 493
0.60 86451 0.302 [,80
0.70 128511 0.159 0.86
0.80 :56368 1),103 1) 48
2yrenc n.50 9118 : 380 ::.48 0.60 .3107ï 1)530 .1 21
0.70 55090 0.225 : 39

- 184 -
Compound Temp Densuy Helght Wldth k'
0.80 76716 0.111 1.02
isoburyl bcnzcnc 80.00 0.50 31273 0.211 0.28 0.60 39627 0.141 0.12 0.70 :5986 0.158 0.16
anthraqumone 0.50 79033 0.610 342 0.60 51008 0.180 1.17 0.70 70470 0.109 0.51 0.80 89888 0.091 0.15
anthracene 0.50 79033 0.483 3.42 0.60 104984 0.219 1.37 0.70 142075 0.125 0.69
0.80 170551 0.091 0.39
pyrcne 0.50 17533 0.890 8.37 0.60 .w480 0.363 3.08 0.70 66559 0.164 1,46
0.80 87079 0.098 0.81
lsooutyl benzene 90.00 0.50 35678 0.175 0.:2 0.60 44739 0.116 0.09
J.mhraqumone 0.50 101970 0.343 2A9 0.60 60284 0.136 0.91 0.70 74064 0.090 0041
ant.hracene 0.50 101970 ().343 :A9 0.60 120442 1).165 : 07 ').iO !40927 ,) 104 ,) 55
?yrene 1) 50 :5690 ) 619 ~ sa 0.60 51099 ) :60 : :: 1
. n.iD -+434 U:5 1) ~5

- 185-
Compound Tcmp Densuy HClght Width k'
lsobutyl benzcne 100.00 0.50 45937 0.177 0.17
anthraqwnone 0.50 117464 0.260 1.92 0.60 65791 0.117 0.72 0.70 75553 0.076 0.33
.lllthracene 0.50 117464 0.260 1.92 0.60 128341 0.134 0.85 0.70 171939 0.092 0.44
pyrene 0.50 31731 0.409 4.33 0.60 56487 0.178 1.79
( 0.70 77358 0.101 0.89
(

r - 186-
Mobile phase: 1.26 mole% formic acid in supercritical carbon dioxide
Compound Temp Densuy to II' HClght Width
lsobutyl benzene 40 0.7 2.02 2.~8 39845 0.194 0.8 1.56 1.69 ~9235 0.152
phcnyl aceoc ac1d 40 0.7 2.02 2.59 23406 0.25
anthraqwnone 40 0.7 2.01 ~.47 ~5655 0.267 0.8 1.57 2.38 75370 0.122 0.9 1.13 1,44 92785 0078
anthracenc 0.7 2.01 5.63 48832 0.307 0.8 1.57 2.97 84489 0.141 0.9 1.13 1.76 113448 0.084
,~ pyrcnc 0.7 2.01 10.92 28113 0.547 0.8 1.57 ~.85 58451 0.22 'li 0.9 1.13 2.56 84415 0.109
Isobutyl bcnzene 50 0.6 1.99 2.4 32776 0.249 0.7 1.7 1.86 39089 0143
phenyl accoc acld 50 0.6 1.99 :.95 15823 1).~3
0.7 Li :.02 :5376 1).147
anthraqwnonc 50 0.6 1.99 6.29 33086 0.363 0.7 1.7 ~13 55939 1) 165 0.8 1.37 1.9 31393 ().lOI 0.9 1.17 1,42 103392 1),088
.mtnracenc 50 0.6 1.99 - c:-, 32612 'H18 '._-0.7 1.7 386 45722 1).19 0.8 1.37 :.29 -9086 1 ),111 IJ,9 1.17 : 68 :05083 ,) 084
?~Tene 50 1).6 !.99 ~5 85 ':O3~6 \ 654 1).7 I-
f) ï 4 _~4S22 ,) ~O9 1 • ....... 1).8 ' ~- .: ·n -1263 ) 156 ~ . .) "
,< ,

- 187 -
Compound Tcmp Densuy to tr Hcight Width
0.9 1.17 2.3 96783 0.102
Isobutyl benzcne 60 0.6 1.91 2.23 37973 0.203
phenylaceoc 3Cld 60 0.6 1.91 2.62 21305 0.2CJ7
ln thraqwnone 60 0.6 1.91 5.01 -13888 0.313 0.7 l.68 2.78 74278 0.152 0.8 1.4 1.84 94260 0.106 0.9 LI'; 105318 0.077
lnlhracene 60 0.6 1.91 5.86 42513 0.358 ft' i 0.7 1.68 3.31 68124 0.169 ...
0.8 1,4 2.16 93180 0.112 0.9 1.33 108958 0.078
pyrenc 60 0.6 1.91 11.39 26376 0.581 0.7 1.68 5.37 55978 0.257 0.8 lA 3.06 85795 0.14 0.9 1.75 98448 0.087
Isobutyl benzene 70 0.5 2J17 2.38 -W798 0.204 0.6 1.98 :.26 -15118 0.186
phenylaceDc aCld 70 0.5 2.07 :.76 25971 0.387 0.6 1.98 2.56 27116 0.228
mtMaq wnone 70 0.5 2.07 10.11 ::1527 0.602 0.6 1.98 .t 46 58094 0.27 0.7 :.96 :.99 ~5689 ,) 18 0.8 1.8 :.:5 9326 IU41
mtnracene -0 1) 5 :.07 '0.61 :3978 1),58 0.6 1.98 5 12 53917 0.322

- 188 •
Compound Temp Densuy tO tI' Helght Width
0.7 1.96 3.48 75892 0.199
0.8 1.8 2.58 102887 0.148
pyreuc 70 0.5 2.07 25.18 12058 1.311
0.6 1.98 9.35 37984 0.529
0.7 1.96 5.31 65907 O.2ïo
0.8 1.8 3.44 93626 0.168
lsoburyi benzcnc 80 0.5 2.45 3.02 38786 0.415
0.6 2.32 2.56 44289 0.194
phenylaceac acld 80 0.5 2,45 3.91 13437 0.343
0.6 2.32 2.82 28719 0.226
mthraqwnone 80 0.5 2.45 8.97 36317 0.549
0.6 2.32 4.49 62370 0.28
0.7 2.12 2.98 92292 0.183
0.8 1.58 1.91 115036 0.119
mthracene 80 0.5 2.45 95 35142 0.612
0.6 2.32 5.08 S7382 n.333
0.7 2.12 3.39 ~5913 0.209
0.8 1.58 2.15 108702 0.1'27
pyrene 80 0.5 2AS 19.17 18497 1.131
0.7 2.32 ~.41 ..l3374 0.524
0.7 2.12 4.8 75365 0.263
0.8 1.58 2.74 96223 0.137
lsoouryl benzene 90 0.5 1.46 1.77 ..l8306 (J • .! 16
0.6 1.37 l 48 S7678 0.103
pnenvlaceac 3Cld 90 0.5 1 46 :.19 :6116 1).: 13
0.6 i.37 :.6 ..lI 389 'U4

- 189 -
Compound Temp Densuy to tr Helght Width
Jmhraqwnonc 90 0.5 1.46 -1..49 50862 0.238 0.6 1.37 2.39 86085 0.136 0.7 1.22 1.62 107001 0.097
anthracene 90 0.5 1.46 ~.74 49003 0.298 0.6 1.37 2.66 71486 0.156 0.7 1.22 1.81 90032 0.102
pyrene 90 0.5 1.46 8.97 32102 0.508 0.6 1.37 ~ 13 65852 0.219 0.7 1.22 :.43 95549 0.117
lsobutyl benzenc 100 0.5 1.41 1.64 53529 0.163
phenylacenc aCld 100 0.5 1.41 1.94 30991 0.21
anthrnqwnone 100 0.5 1.41 3.63 63083 0.187 0.6 1.32 :.18 101259 0.122 0.7 1.14 1.57 112183 0.087
mthracene 100 0.5 1.41 3.82 60613 0.241 0.6 1.32 2.33 84186 0.136 0.7 1.24 1.73 90920 0.096
pyrene 100 0.5 1...1.1 6.76 -+ 1027 0.398 0.6 1.32 3.41 66855 0.176 0.7 1.24 :.22 100892 0.108

- 190 -
Mobile phase: J.87 mole% dichloromethane/0.16 mole% formic acid in CO2
Compound Temp Densn)' to Il' Helght Width
lsobutyl benzene .m 0.8 1.95 :.08 51736 0.254
anthraqwnonc .m 0.8 1.95 :.93 79347 0.158 anthraquinonc .m 0.9 1.34 1.69 100498 0.101
anthra1:ene ~ 0.8 1.95 3.54 38938 0.182 a"'b.racene ~ 0.9 1.34 :.01 36846 0.138
pyrene -lO 0.8 1.95 5.64 58006 0279 pyrene -lO 0.9 1.34 :.84 78855 0.124
lsobutyl benzene 50 0.7 2.34 :.55 ..15958 0.165 50 0.8 1.85 1.96 64869 0.18
phenyl accnc aCld 50 0.7 :.34 2.74 33073 0.195
anthraqwnooc 50 0.7 2.34 4.08 67915 0.244 anùtraqwnouë 50 0.8 1.85 2.54 94471 0.137 anùtraqwnonc 50 0.9 1.33 1.62 W0835 0.089
lllthracene 50 0.7 :.34 ·.t85 :2582 0.:7 lllthracene 50 0.8 1.85 :.99 33761 0.145
anthracene 50 0.9 1.33 1.88 :5432 0.086
pyrene 50 0.7 :.34 ,~.03 -15370 (JAIS
pyrene 50 0.8 1.85 -137 '70234 1).215 pyrenc 50 0.9 1.33 :.51 97954 0.11
:sobucyl benzene 60 0.6 :.25 :.69 33643 0.256 60 0.7 :.01 :.18 .!9039 ').145
;Jnenylaceoc aCla bO 0.6 :.:.5 .: :6 :3312 1) 1 Y9 bO 1)7 :.01 : 35 :3524 ,) 1 ~9
.lI1tnraqwnone tJO 0.6 :.:5 f) 46 .:6163 ') ..w3

- 191 -
Compound Tcmp Dcnsuy to tr HClght Width
anthraquinone 60 0.7 2.01 3.48 76749 0.249 anthraqwnove 60 0.8 1.6 2.24 94902 0.146 anthraquinone 60 0.9 1.12 1.35 106770 0.087
antbracene 60 0.6 2.25 6.46 36163 0.443 anthracene 60 0.7 2.01 3.96 :3326 0.323 anthracene 60 0.8 1.6 2.55 23713 0.18 anthracene 60 0.9 1.12 1.54 31435 0.115
p~ne 60 0.6 2.25 13.55 26234 0.805 p~ne 60 0.7 2.01 6.39 54682 0.342 p~ne 60 0.8 1.6 3.68 78689 0.174 p~ne 60 0.9 1.12 ..., 104092 0.092
f l • Isobutyl bcnzene 70 0.6 1.89 2.16 46512 0.197
phenylacenc 3Cld 70 0.5 1.89 2.55 26275 0.253
amhraqwnone 70 0.6 1.89 4.84 47101 0.362 anthraqwnone 70 0.7 1.64 2.69 86306 0.185 anthraqwnone iD 0.8 1.34 1.75 107871 0.109
anthracene 70 0.6 1.89 4.84 47101 0.362 anthracene 70 0.7 1.64 3.02 25000 0.23 .mthracene 70 0.8 1.34 1.96 27226 0.169
pyrene 70 0.6 1.89 9.82 33619 0.538 pyrene 70 0.7 1.64 4.7 64638 0.242 :Jyrenc 70 0.8 1.34 :.68 90412 0.129
lsoouryl bcnzene 30 0.5 Li 2.18 .36812 0.213 SO 0.6 1.61 1.8 51273 0.153
;Jnenylacenc aCld ~O 0.5 1.7 3.04 11948 0.187 SO 0.6 1.61 2.05 :7840 ù.1R9

- 192 -
Compound Temp Densu)' tO cr Heigbt Widù,
anthraqwnone 80 0.5 1.7 7.62 34317 0.55 anthraqwnone 80 0.6 1.61 3.53 60320 0.266 anthraquinone 80 0.7 lAI 2.11 95311 0.116 anth.raqwnone 80 0.8 1.15 1.42 105509 0.088
anthracene 80 0.5 1.7 7.62 34317 0.55 3Jlthracene 80 0.6 1.61 3.53 60320 0.266 3Jlthracene 80 0.7 l. .. U Z.33 ~3235 0.155 anthracene 80 0.8 l.15 1.58 33120 0.107
pyrcne 80 0.5 1.7 16.17 18312 0.957 pyrcne 80 0.6 1.61 6.57 44850 0.365 pyrcne 80 0.7 lAI 3.39 76360 0.167 pyrcue 80 0.8 1.15 Z.03 97771 0.094
lsobutyl benzene 90 0.5 1.46 1.77 ~8306 0.216 90 0.6 1.37 1.48 57678 0.103
phenyiaceac aCId 90 0.5 1.46 :.19 :6116 0.213 90 0.6 1.37 L6 .. H389 1) 14.
anthraqwnone 90 0.5 1.46 4..49 50862 0.238 anthraqwnone 90 0.6 1.37 2.39 86085 0.136 anthraqwnone 90 0.7 1.22 1.62 107001 0.097
anthracene 90 0.5 1.46 4.74 ..19003 0298 anthracene 90 0.6 1.37 :.66 ;1486 0.156 anthracene 90 0.7 1.:: 1.81 90032 0.102
pyrene 90 0.5 1.46 8.97 32102 (J.S08 ::lyrene 00 0.6 1.37 ..1 13 tJ5852 1)219 pyrene 90 0.7 1.:: :.43 95549 1) 117
.!>oDutyl benzene :00 1)5 i 4.1 :.64 53529 1).lh3

- 193 -
Compound Tcmp Denslty to cr Height Width
phcnylaceac 3Cld 100 0.5 1.41 1.94 30991 0.21
anthraqwnone 100 0.5 1.41 3.63 63083 0.187 anthraqwnone 100 0.6 1.32 2.18 101259 0.122 andtraqwnone 100 0.7 1.24 1.57 112183 0.087
anthracenc 100 0.5 1.41 3.82 60613 0.241 anUtraccne 100 0.6 1.32 2.33 84186 0.136 anthraceoe 100 0.7 1.24 1.73 90920 0.096
pyrene 100 0.5 1.41 6.76 ·U027 0.398 pyrenc 100 0.6 1.32 3.41 66855 0.176 pyrenc 100 0.7 1.24 2.22 100892 0.108

- 194-
Mobile phase: 0.80 mole% acetonitrile in supercritical carbon dioxide
Compound Temp Denslty la
anthraquinone 40 0.7 1.07 anthraqwnone 40 0.8 0.78 anthraqwnone 40 0.9 0.57
anthracene 40 0.7 1.07 anthracene 40 0.8 0.78 anthracene 40 0.9 0.57
pyrcne 40 0.7 1.07 pyrene 40 0.8 0.78 pyrene 40 0.9 0.57
anthraqwnone 50 0.7 0.81 anthraqwnone 50 0.8 0.65 anthraqwnone 50 0.9 0.51
anthracene 50 0.7 0.81 anthracenc 50 0.8 0.65 anthracenc 50 0.9 0.51
pyrene 50 0.7 0.81 pyrene 50 0.8 0.65 pyrcne 50 0.9 0.51
ant.hraqwnanc 60 0.7 0.65 lJ1 t.hraq wnonc 60 0.8 0.53
mthraccne 60 0.7 0.65 mthracene 60 0.8 0.53
;:Jyrene 1)() 0.7 0.65 pyrene ()() 0.8 0.53
J.mh.raq U1J1one 0.6 ().64
cr
1.87 1.06 0.69
2.41 1.32 0.84
~.3
2.07 1.18
1.29 0.91 0.61
1.6 1.13 0.74
::.65 1.79 1.03
1.17 0.73
i.~2
0.87
:.-l5 : 28
. -.., . ,-
area
669037 ~79302
272017
1188200 846582 J43513
:79880 194875 101927
391815 ~65720
927440 870340
::66440 167772
481395 :51675
~41662
439495
':08623 <.)6116
::49153
wldth
0.149 0.095 0.073
0.166 0.101 0.074
0.267 0.126 0.078
0.098 0.102 0.051
0.099 1).1 0 1 0.052
1) 144
0.12 0.074
/).091 r).054
1) 096
n.057
1) lS:!
1) 062
) 133

- 195 -
(
Compound Tcmp Denslty to tr area Wldth
anthraqwnone 70 0.7 0.56 0.91 ~29330 0.07
anthracenc 70 0.6 0.64 1.97 888710 0.14 anthracenc 70 0.7 0.56 1.08 695120 0.073
pyrcne 70 0.6 0.64 3.79 :15930 0.24 pyrcne 70 0.7 0.56 1.72 161945 0.097
anthraqwnone 80 0.6 0.58 1.26 503992 0.099 anthraqwnone 80 0.7 0.5 0.75 0.056
anthraceoc 80 0.6 0.58 1.43 894920 0.102 anthraceoc 80 0.7 0.5 0.86 0.058
( 80 0.6 0.58 2.53 209728 pyrcne 0.155
pyrcne 80 0.7 0.5 1.28 0.068
anthraqumone 90 0.6 0.51 0.99 433242 0.075
mthracene 90 0.6 0.51 1.11 730315 0.075
pyrcne 90 0.6 0.51 1.82 169427 0.097
mthraqwnonc 100 0.6 0.47 0.81 0.069
mthracene 100 0.6 0.47 0.89 0.07
100 0.6 0.47 1.38 0.082
(