and schumpeter said, 'this is how thou shalt grow': the ... · following schumpeter’s...
TRANSCRIPT

WP/04/40
And Schumpeter Said, “This Is How Thou Shalt Grow”: The Further
Quest for Economic Growth in Poor Countries
Philippe Beaugrand

© 2004 International Monetary Fund WP/04/40 IMF Working Paper African Department
And Schumpeter Said, “This Is How Thou Shalt Grow”: The Further Quest for Economic Growth in Poor Countries
Prepared by Philippe Beaugrand 1
Authorized for distribution by Francesco Caramazza
March 2004
Abstract
This Working Paper should not be reported as representing the views of the IMF. The views expressed in this Working Paper are those of the author(s) and do not necessarily represent those of the IMF or IMF policy. Working Papers describe research in progress by the author(s) and are published to elicit comments and to further debate.
The paper reviews the “stylized facts” on economic growth gathered by Easterly and Levine in their 2001 joint paper and illustrates some of the points made on the basis of data from the IMF’s World Economic Outlook on real growth and per capita GDP since 1970. The data show that the growth performance of many poor countries has been disappointing: most of the “developing” world, especially sub-Saharan Africa, has been getting poorer while the advanced economies have been getting richer. To reverse this trend requires finding ways to raise total factor productivity in poor countries; in turn, this implies letting entrepreneurs innovate—in the Schumpeterian sense—in order to bring about structural changes in the economy. The conclusion highlights several essential steps in creating a favorable environment for innovation and growth. JEL Classification Numbers: O00, O01, O50 Keywords: Developing Countries; Growth; Innovation; Entrepreneurship; Schumpeter, J.A. Author’s E-Mail Address: [email protected] 1 The author is indebted to participants in an IMF African Department seminar and other IMF staff members for useful comments on an earlier version of this paper. Any remaining errors, however, are the responsibility of the author.

- 2 -
Contents Page
I. Introduction....................................................................................................................3
II. Stylized Facts About Economic Growth........................................................................3
III. Strong and Weak Performers, 1970–2001 .....................................................................6
IV. How to Grow Out of Poverty.......................................................................................11
V. Wanted: Entrepreneurship and Growth .......................................................................14
VI. Evolution and Development ........................................................................................16 References................................................................................................................................19 Tables 1. Five Stylized Facts on Growth.......................................................................................5 2. Population, GDP, Per Capita GDP, and GDP Growth, 1970–2001 ..............................7 3. Growth Performance, 1970–2001..................................................................................8 4. Strong and Weak Mineral Exporters..............................................................................8 5. Per Capita GDP in Constant (2000) U.S. Dollars, 1970–2000......................................9 6. Per Capita GDP, 1970–2000........................................................................................10 7. Key Steps to Promote Entrepreneurship and Growth ..................................................16

- 3 -
Schumpeter is a sort of patron saint in this field. I may be alone in thinking that he should be treated like a patron saint: paraded around one day each year and more or less ignored the rest of the time.
Robert M. Solow (1994, p. 52)
I. INTRODUCTION
How to promote economic growth is one of the most important questions facing practical economists and researchers alike, especially when they are considering the situation of poor countries. Yet the question remains among the most bewildering in economics. Even after many centuries of research on the best ways to promote the wealth of nations, no consensus seems to have emerged as to the mainspring of growth. For that matter, it would seem that there is no universally accepted view of what make the economic world tick.
Over the last few decades, the growth performance of many poor countries has been disappointing. In most parts of the alleged “developing” world, and singularly in sub-Saharan Africa, the poor have been getting poorer, while in the advanced economies the rich have been getting richer. The growing economic divide across nations has led to the development of new approaches, such as the definition of Millennium Development Goals (MDGs) and the New Partnership for Africa’s Development (NEPAD). However, it is unclear how the ambitious objectives of raising per capita income and improving social indicators in poor countries can realistically be achieved.
This paper argues that promoting economic growth is simple: It’s entrepreneurship, stupid! Following Schumpeter’s well-known theory of economic development, innovation is the main driving force behind economic growth and the entrepreneur is the Ideal Type of economic innovator. To grow, poor countries need to do things differently and develop new activities, which means letting entrepreneurs innovate to bring about structural changes in the economy. Like all simple solutions to complex problems, obviously, this approach raises more questions than it answers, and the questions raised are only briefly touched upon in this paper. It is hoped that further research on this topic can help identify concrete policies that would actively promote entrepreneurship and sustained growth in poor countries.
II. STYLIZED FACTS ABOUT ECONOMIC GROWTH
Extensive research on the sources of economic growth conducted at the World Bank and elsewhere has yielded mostly negative conclusions. In sum, there is no magic wand to spur economic growth, no individual factor is necessary or sufficient, and all the simple solutions that have been tried have failed. While there are examples of successful takeoff by poor countries, which presumably stemmed in good part from a “right” policy mix and a set of

- 4 -
proper conditions, economists have been unable to identify conclusively all the ingredients of such a mix and conditions.2
The search for panaceas to foster economic development in poor countries has been brilliantly exposed by William Easterly. In The Elusive Quest for Growth (2001), Easterly explores various attempts of the last fifty years to raise the living standards in poor countries. These attempts included the provision of external aid, investments in machinery, efforts at raising education, measures to control population growth, and initiatives to make—and subsequently to forgive—loans on condition of institutional reforms. Easterly concludes that these attempts have largely failed and that “the problem of making poor countries rich was much more difficult than we thought” (p. 291).
In a research paper prepared in collaboration with Ross Levine, Easterly has listed five “stylized facts” on economic growth, which provide a useful springboard for pursuing the quest further (Table 1). The main points are as follows: (1) growth does not arise from factor accumulation but from something else, denoted as “A”;3 (2) cross-country rates of growth do not tend to converge—even controlling for key variables such as savings rates and population growth—but have been diverging increasingly since 1960; (3) neither success nor failure in terms of economic growth is permanent; (4) the richest areas tend to attract the most dynamic people and reciprocally, as well as conversely; and (5) all studies show that some indicators of national policy are strongly linked to economic growth, although effects vary greatly across countries.
The idea that the increase in production factors cannot explain economic growth is not original, nor is it new. In the field of professional economists, this insight is closely associated with Robert Solow, who showed nearly half a century ago that only one-eighth of economic growth in the United States during 1909–49 could be imputed to increased capital intensity (Solow, 1957, p. 316; see also Solow, 1956). Solow’s results were quickly duplicated by many researchers and despite refinements in the measure of labor and capital none were able to reduce the “residual” element in growth equations much below 50 percent.4 More recently, discussions of the role of new technologies in accelerating U.S. economic growth during the late 1990s have remained largely inconclusive—in sum, it is difficult to ascertain the source of the increase in total factor productivity (see Oliner and Sichel, 2000, as well as the comments by Foley and Michl, 2001; and Gordon, 2001).
2 Contemporary growth theories are described in Barro and Sala-i-Martin (1995), mostly from a neoclassical point of view. For an attempt to synthesize various growth models, see Bleaney and Nishiyama (2002); the authors note (p. 45) that explanatory variables tend to take extreme values for the OECD and sub-Saharan Africa, two groups that epitomize the strongest and weakest performers in terms of growth. 3 In the standard production function, Yt = At f ( Kt, Lt ), where Y is final output, K the capital stock, and L the quantity of labor; A is generally defined as the index level of technology. 4 For example, only one-half of economic growth in France over 1913–63 could be explained by the growth in production factors, even after taking into account the improved quality of labor and capital (Malinvaud and others, 1972, Chapter VII). For recent references and estimates, see Barro and Sala-i-Martin (1995), Chap. 10.

- 5 -
Table 1. Five Stylized Facts on Growth (Adapted from Easterly and Levine, 2001)
1. It’s not factor accumulation, it’s “A.”
Factor accumulation does not account for the bulk of cross-differences in the level or growth rate of GDP per capita; something else—total factor productivity (TFP)—accounts for a substantial amount of cross-country differences.
2. Divergence, not convergence, is the big story.
There are huge and growing differences in GDP per capita: there is neither convergence nor conditional convergence.1 Yet, the “divergence” findings do not provide unequivocal support for any particular conception of what best explains the “something else” producing these stylized facts.
3. Growth is not persistent over time.
Growth paths are remarkably different across countries; factor accumulation is persistent and less erratic. Some countries “take off,” others are subject to peaks and valleys, a few grow steadily, and others have never grown. In contrast, capital accumulation is much more persistent than overall growth.
4. When it rains, it pours.
All factors of production flow to the same places, suggesting important externalities. The consequence is that economic activity is highly concentrated.
5. Policy matters. National policies influence long-run growth. This finding is consistent with theories that emphasize productivity growth and technological externalities and makes one increasingly wary of theories that focus excessively on factor accumulation.
1 Conditional convergence holds that countries with similar production factors converge to the same income level over time; conversely, the dispersion of income levels reflects differences in the factors required for economic growth such as savings, population, and natural resources.
The reason for the poor correlation between investment and growth is at the core of classical economics. As Solow himself wrote recently, “Diminishing returns to capital implies that the long-run rate of growth is completely independent of the saving-investment quota” (1994, p. 48). Fundamentally, doing more of the same—trying to grow through capital accumulation and increased labor—is doomed to fail because economic activity is generally subject to falling marginal yields. Even constant returns to scale would not be sufficient to account for growth in per capita incomes. However, contrary to the classical teachings of Malthus, Ricardo, and Marx, this does not mean that stagnation and pauperization are ineluctable. As demonstrated by several centuries of amazing economic progress, especially since the 1800s, human ingenuity has kept on pushing back the economic frontiers and generated limitless growth. Invention and technical progress have allowed shifting the production function upward—i.e., output has risen through the “A” of growth equations. In effect, growth has resulted from dynamically increasing returns to scale (the so-called “Verdoorn’s Law” stated by Kaldor in 1966).
Again, this view is far from new. The concept of innovation as the mainspring of economic growth has been the hallmark of Joseph A. Schumpeter for nearly a century. In his Theorie der Wirtschaftlichen Entwicklung published in 1911, Schumpeter contrasted the static “circular flow” from the dynamic capitalist economy. In his view, evolution—which conveys the notion that deep qualitative changes accompany economic development—arises from the

- 6 -
implementation of new combinations, or innovations,5 which may all be summarized by the expression of “doing new things” or “doing things differently.”
Economic historians have relied extensively on Schumpeter’s concept of innovation as the mainspring of economic growth during the last 250 years, or indeed the past millennium (see in particular Braudel, 1995a and 1995b; and Maddison, 2001). Although the theory of economic evolution is remote from today’s mainstream economics, it has been the subject of a revival under the impetus of Richard Nelson and Sidney Winter. Their major book—An Evolutionary Theory of Economic Change, published in 1982—has sprung an entire field of research, which has found its expression into its own periodical, the Journal of Evolutionary Economics.6 The Schumpeterian paradigm is also at the core of the “new” neoclassical growth theory that emphasizes technological change as an endogenous process (Romer, 1986 and 1990; Aghion and Howitt, 1992).
III. STRONG AND WEAK PERFORMERS, 1970–2001
Growth performance across countries during the last 30 years of the 20th century was spread out on a wide range (Tables 2 and 3). Over 1970–2001, the world’s average annual growth rate was estimated at 3.8 percent, with individual rates of up to 10.8 percent in Botswana and as low as -1.3 percent in the Democratic Republic of the Congo (the former Zaïre). Among the standard groupings used in the World Economic Outlook (WEO),7 the range of growth rates was from 7.7 percent in the newly industrialized Asian economies (Hong Kong SAR, Korea, Singapore, and Taiwan Province of China) to 1.3 percent for the Commonwealth of Independent States (CIS) and Mongolia, excluding Russia.
Focusing on the 30 strongest and 30 weakest performers in terms of economic growth during 1970–2001 (Table 2), it is a priori difficult to establish common patterns. With the excepti
5 Schumpeter identified five cases of new combinations: (1) the introduction of a new good or a new quality of good; (2) the introduction of a new method of production; (3) the opening of a new market; (4) the conquest of a new source of supply of raw materials or semi-manufactured products; and (5) the carrying out of a new organization of any industry (see Theory of Economic Development, 1934, p. 66, and Business Cycles, Vol. I, Chap. 3). Schumpeter provides an overview of the historical precedents for his theory in a long footnote in Chapter II of Theory of Economic Development (pp. 59–60). See also Capitalism, Socialism, and Democracy (1942), Chap. VII. As is well known, Schumpeter’s theory was largely anticipated by Wicksell, as well as shared to some extent by Hayek (see Hagemann, 2001). 6 Additional references are in Nelson and Winter (2002) and Fagerberg (2003). Nelson and Winter did not address the question of comparative development in their 1982 book, but listed to topic among those that would deserve further research (1982, p. 409). The issue of convergence (or catching up) versus divergence is discussed from an evolutionary point of view in Verspagen (1991 and 2000), and Caniëls and Verspagen (2001). 7 The classification of countries in the WEO is described in IMF (2003), Statistical Appendix.

- 7 -
1970
1980
1990
2000
1970
–200
119
80–2
001
Popu
latio
nG
DP
(US$
Per c
apita
Popu
latio
nG
DP
(US$
Per c
apita
Popu
latio
nG
DP
(US$
Per c
apita
Popu
latio
nG
DP
(US$
Per c
apita
R
eal G
DP
grow
th ra
te(m
illio
ns)
billi
ons)
GD
P (U
S$)
(mill
ions
)bi
llion
s) G
DP
(US$
)(m
illio
ns)
billi
ons)
GD
P (U
S$)
(mill
ions
)bi
llion
s) G
DP
(US$
)
(Ann
ual a
vera
ge)
Adv
ance
d ec
onom
ies
735
2,19
82,
991
804
8,11
510
,095
861
17,4
7620
,307
940
25,2
2026
,843
3.2
3.0
Maj
or a
dvan
ced
econ
omie
s55
01,
892
3,43
759
76,
637
11,1
1963
814
,304
22,4
3669
921
,012
30,0
543.
02.
8O
ther
adv
ance
d ec
onom
ies
185
306
1,65
820
71,
478
7,14
122
33,
172
14,2
2124
04,
208
17,5
043.
93.
8O
f whi
ch: N
ewly
indu
stria
lized
A
sian
eco
nom
ies
5321
392
6314
42,
270
7252
57,
294
801,
031
12,8
447.
77.
0O
ECD
854
2,31
72,
713
950
8,44
78,
894
1,03
217
,752
17,2
061,
129
25,5
9222
,668
3.2
2.9
Euro
pean
Uni
on32
376
12,
358
339
3,45
710
,210
350
6,75
119
,268
377
7,91
220
,964
2.7
2.3
Dev
elop
ing
coun
tries
2,50
760
224
03,
184
2,41
475
83,
916
3,17
381
04,
669
5,42
41,
162
5.2
5.0
Afr
ica
322
7222
442
135
484
156
039
670
772
643
159
43.
12.
6Su
b-Sa
hara
Afr
ica
288
5920
637
628
475
450
231
262
165
732
449
32.
92.
5O
f whi
ch: e
xclu
ding
Nig
eria
&
Sout
h A
fric
a21
032
154
278
139
499
371
170
458
485
154
317
2.8
2.7
CFA
cou
ntrie
s45
817
558
3763
578
5165
810
445
436
3.3
2.9
Asi
a1,
806
286
159
2,23
774
433
32,
691
1,10
341
03,
150
2,19
669
76.
87.
4Em
ergi
ng A
sia
1,85
830
716
52,
300
888
386
2,76
31,
628
589
3,23
03,
227
999
6.9
7.4
Of w
hich
: ASE
AN
-420
328
139
257
176
687
315
288
914
373
438
1,17
55.
65.
0O
ther
dev
elop
ing
Asi
a ex
clud
ing
Chi
na &
Indi
a45
614
130
957
526
946
971
240
456
886
865
275
25.
25.
0
Mid
dle
East
and
Nor
th A
fric
a15
361
397
204
538
2,63
927
452
81,
928
344
750
2,18
34.
43.
0O
f whi
ch: M
iddl
e Ea
st13
565
482
178
527
2,95
323
656
92,
407
294
833
2,83
14.
53.
2
Wes
tern
Hem
isph
ere
270
180
668
347
790
2,27
242
91,
105
2,57
350
01,
966
3,93
23.
72.
6
Fuel
exp
orte
rs14
372
502
192
601
3,13
226
545
01,
699
342
719
2,10
23.
92.
4N
onfu
el e
xpor
ters
2,36
553
122
42,
976
1,81
060
83,
631
2,70
874
64,
299
4,67
21,
087
5.4
5.4
Non
fuel
prim
ary
prod
ucts
145
4430
118
912
063
724
912
349
632
616
049
13.
03.
1M
anuf
actu
res
1,09
415
914
51,
358
642
473
1,60
690
756
51,
833
2,07
91,
134
7.2
7.5
Serv
ices
, inc
ome,
and
priv
ate
trans
fers
6318
292
8052
649
9812
91,
322
121
173
1,42
64.
03.
9D
iver
sifie
d1,
062
310
291
1,34
999
673
81,
678
1,54
892
22,
019
2,26
01,
120
3.8
3.9
Net
cre
dito
r cou
ntrie
s87
514
116
11,
077
770
715
1,27
177
460
91,
424
1,72
51,
211
7.3
7.4
Net
deb
tor c
ount
ries
1,63
346
228
32,
090
1,64
078
52,
625
2,38
490
83,
217
3,66
71,
140
5.3
3.9
PRG
F el
igib
le c
ount
ries
1,10
124
422
11,
394
539
387
1,76
175
142
62,
199
903
410
4.2
4.5
Leas
t dev
elop
ed c
ount
ries
307
3411
139
311
328
850
516
733
065
320
030
63.
03.
2H
IPC
elig
ible
cou
ntrie
s28
112
143
036
716
645
147
916
534
461
418
430
13.
33.
3O
f whi
ch: e
xclu
ding
Vie
tnam
238
3615
131
313
844
041
315
737
953
615
428
72.
72.
6
Cou
ntrie
s in
trans
ition
343
n.a.
n.a.
37
41,
197
3,20
040
11,
952
4,87
039
875
31,
892
1.9
0.2
Cen
tral a
nd E
aste
rn E
urop
e10
3n.
a.n.
a.
111
296
2,67
011
637
93,
259
115
399
3,47
42.
51.
0C
IS a
nd M
ongo
lia24
039
81,
657
263
901
3,42
328
51,
573
5,52
828
435
51,
251
1.5
-0.4
Of w
hich
: exc
ludi
ng R
ussi
a11
313
81,
219
125
315
2,51
413
658
14,
266
138
9569
21.
3-0
.7
Wor
ld3,
621
3,40
594
04,
361
11,7
262,
689
5,17
822
,600
4,36
56,
007
31,3
985,
227
3.8
3.4
Sou
rces
: Int
erna
tiona
l Mon
etar
y Fu
nd,
Wor
ld E
cono
mic
Out
look
dat
abas
e; a
nd IM
F st
aff e
stim
ates
.
1/ E
xclu
des A
fgha
nist
an, B
osni
a an
d H
erze
govi
a, B
rune
i Dar
ussa
lam
, Erit
rea,
Iraq
, Som
alia
, and
Yug
osla
via,
for w
hich
no
cons
iste
nt d
ata
wer
e av
aila
ble.
Tabl
e 2.
Pop
ulat
ion,
GD
P, P
er C
apita
GD
P, a
nd G
DP
Gro
wth
, 197
0–20
01 1
/

- 8 -
Table 3. Growth Performance, 1970–2001 (Average annual real GDP growth in parenthesis)
Strong performers
Botswana (10.8) Equatorial Guinea (9.0) Mainland China (9.0) Taiwan Province of
China (8.0) Singapore (8.0) Korea (7.6) Malaysia (7.0) Hong Kong SAR (6.8) Maldives (6.6) Oman (6.6)
Yemen (6.5) Thailand (6.5) Malta (6.3) Mauritius (6.2) Bhutan (6.0) Indonesia (5.9) Vietnam (5.8) Syrian Arab Republic (5.6) Lao PDR (5.5) Cambodia (5.5)
Tunisia (5.5) Bahrain (5.3) Dominican Republic (5.3) Antigua and Barbuda (5.3) Saint Lucia (5.2) Swaziland (5.1) Sri Lanka (5.0) United Arab Emirates (5.0) India (4.9) St. Vincent and the
Grenadines (4.9)
Weak performers
Argentina (1.7) Kyrgyz Republic (1.7) Croatia (1.7) Switzerland (1.6) Gabon (1.6) Libya (1.6) Jamaica (1.6) Angola (1.5) Russia (1.5) Suriname (1.5)
Trinidad and Tobago (1.5) Macedonia, FYR of (1.4) Guyana (1.3) Haiti (1.2) Madagascar (1.2) Djibouti (1.1) Liberia (1.1) Nicaragua (1.0) Armenia (0.9) Azerbaijan (0.8)
Kuwait (0.7) Zambia (0.4) Ukraine (0.2) Georgia (-0.4) Tajikistan (-0.6) Moldova (-0.7) Lebanon (-0.8) Kiribati (-0.8) Sierra Leone (-1.1) Congo, Dem. Rep. of (-1.3)
Source: IMF, World Economic Outlook database.
of the countries in transition8—which all recorded sharp contractions in output during the 1990s—no clear pattern seems to emerge. Strong and weak performers include countries from all continents, fuel and nonfuel exporters, as well as countries that have experienced conflicts. Moreover, both groups include exporters of mineral products such as oil and diamonds (Table 4).
Table 4. Strong and Weak Mineral Exporters Strong performers Botswana (diamonds); Equatorial Guinea (oil); Oman (oil); Bahrain (oil);
United Arab Emirates (oil) Weak performers Gabon (oil); Libya (oil); Angola (oil); Trinidad and Tobago (oil); Kuwait (oil);
Sierra Leone (diamonds); Democratic Republic of the Congo (diamonds) Developments in per capita GDP at constant prices provide an even more dramatic picture (Tables 5 and 6). Over 1971–2000, the changes in per capita GDP in constant U.S. dollars ranged from 7.6 percent in the newly industrialized Asian economies to -6.0 percent in the
8 The countries in transition comprise 15 central and east European countries, the 12 members of the CIS, and Mongolia.

- 9 -
Table 5. Per Capita GDP in Constant (2000) U.S. Dollars, 1970–2000 1/
1970 1980 1990 2000 1971–2000 1971–80 1981–90 1991–2000 Growth rate
(Annual average)
Advanced economies 11,001 18,917 25,090 26,843 3.0 5.6 2.9 0.7Major advanced economies 12,645 20,836 27,721 30,054 2.9 5.1 2.9 0.8Other advanced economies 6,098 13,382 17,570 17,504 3.6 8.2 2.8 0.0
Of which : Newly industrialized Asian economies 1,440 4,254 9,012 12,844 7.6 11.4 7.8 3.6
OECD 9,980 16,666 21,258 22,668 2.8 5.3 2.5 0.6European Union 8,673 19,132 23,806 20,964 3.0 8.2 2.2 -1.3
Developing countries 884 1,421 1,001 1,162 0.9 4.9 -3.4 1.5
Africa 825 1,576 873 594 -1.1 6.7 -5.7 -3.8Sub-Sahara Africa 757 1,414 767 493 -1.4 6.4 -5.9 -4.3
Of which : excluding Nigeria & South Africa 568 935 566 317 -1.9 5.1 -4.9 -5.6CFA countries 643 1,190 812 436 -1.3 6.4 -3.7 -6.0
Asia 583 624 507 697 0.6 0.7 -2.1 3.2Emerging Asia 608 724 728 999 1.7 1.8 0.1 3.2
Of which : ASEAN-4 511 1,286 1,129 1,175 2.8 9.7 -1.3 0.4Other developing Asia excluding China & India 1,137 878 701 752 -1.4 -2.5 -2.2 0.7
Middle East and North Africa 1,460 4,946 2,382 2,183 1.4 13.0 -7.0 -0.9Of which : Middle East 1,774 5,534 2,974 2,831 1.6 12.1 -6.0 -0.5
Western Hemisphere 2,459 4,258 3,179 3,932 1.6 5.6 -2.9 2.1
Fuel exporters 1,846 5,868 2,100 2,102 0.4 12.3 -9.8 0.0Nonfuel exporters 825 1,140 921 1,087 0.9 3.3 -2.1 1.7
Nonfuel primary products 1,107 1,194 613 491 -2.7 0.8 -6.4 -2.2Manufactures 535 886 698 1,134 2.5 5.2 -2.4 5.0Services, income, and private transfers 1,073 1,215 1,633 1,426 1.0 1.3 3.0 -1.3Diversified 1,072 1,383 1,140 1,120 0.1 2.6 -1.9 -0.2
Net creditor countries 591 1,340 752 1,211 2.4 8.5 -5.6 4.9Net debtor countries 1,040 1,471 1,122 1,140 0.3 3.5 -2.7 0.2
PRGF eligible countries 814 725 527 410 -2.3 -1.2 -3.1 -2.5Least developed countries 410 539 408 306 -1.0 2.8 -2.7 -2.8HIPC eligible countries 1,584 845 425 301 -5.4 -6.1 -6.7 -3.4
Of which : excluding Vietnam 554 825 469 287 -2.2 4.1 -5.5 -4.8
Countries in transition n.a. 5,997 6,017 1,892 ... ... 0.0 -10.9Central and Eastern Europe n.a. 5,004 4,027 3,474 ... ... -2.1 -1.5CIS and Mongolia 6,095 6,414 6,830 1,251 -5.1 0.5 0.6 -15.6
Of which : excluding Russia 4,486 4,711 5,271 692 -6.0 0.5 1.1 -18.4
World 3,459 5,038 5,393 5,227 1.4 3.8 0.7 -0.3
Sources: International Monetary Fund, World Economic Outlook database; and IMF staff estimates. 1/ Excludes Afghanistan, Bosnia and Herzegovia, Brunei Darussalam, Eritrea, Iraq, Somalia, and Yugoslavia, for which no consistent data were available.
- 10 -
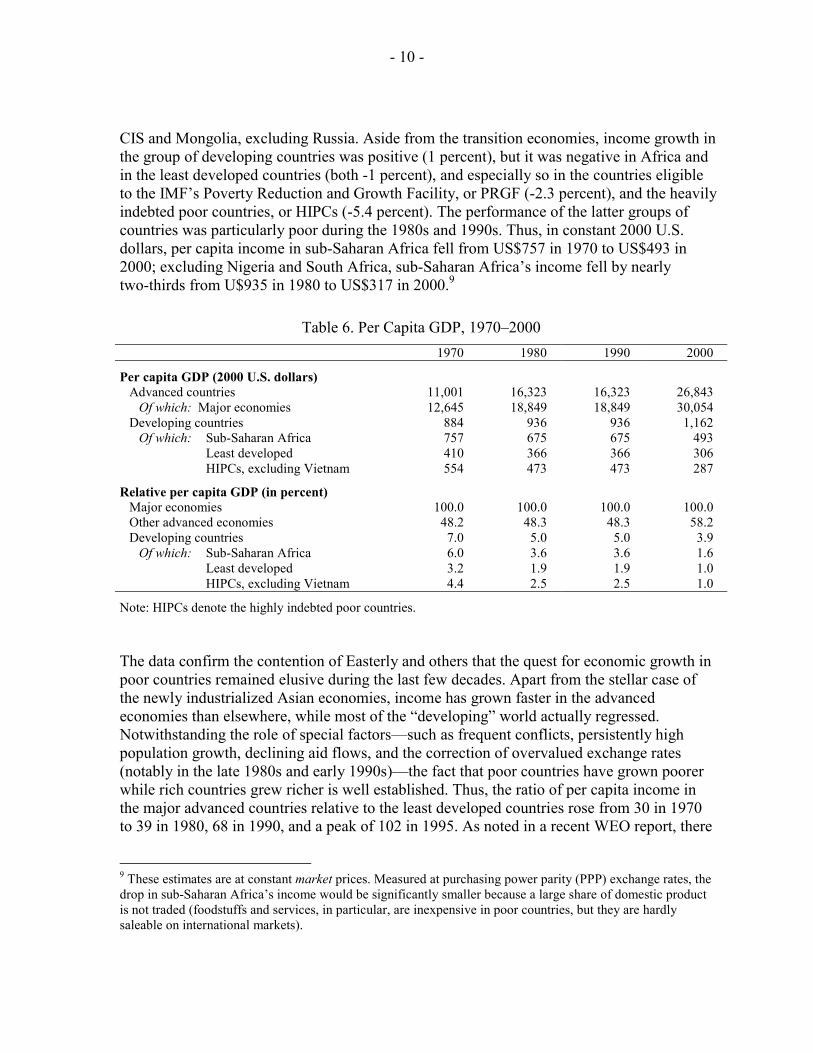
CIS and Mongolia, excluding Russia. Aside from the transition economies, income growth in the group of developing countries was positive (1 percent), but it was negative in Africa and in the least developed countries (both -1 percent), and especially so in the countries eligible to the IMF’s Poverty Reduction and Growth Facility, or PRGF (-2.3 percent), and the heavily indebted poor countries, or HIPCs (-5.4 percent). The performance of the latter groups of countries was particularly poor during the 1980s and 1990s. Thus, in constant 2000 U.S. dollars, per capita income in sub-Saharan Africa fell from US$757 in 1970 to US$493 in 2000; excluding Nigeria and South Africa, sub-Saharan Africa’s income fell by nearly two-thirds from U$935 in 1980 to US$317 in 2000.9
Table 6. Per Capita GDP, 1970–2000 1970 1980 1990 2000
Per capita GDP (2000 U.S. dollars)
Advanced countries 11,001 16,323 16,323 26,843 Of which: Major economies 12,645 18,849 18,849 30,054
Developing countries 884 936 936 1,162 Of which: Sub-Saharan Africa 757 675 675 493
Least developed 410 366 366 306 HIPCs, excluding Vietnam 554 473 473 287
Relative per capita GDP (in percent)
Major economies 100.0 100.0 100.0 100.0 Other advanced economies 48.2 48.3 48.3 58.2 Developing countries 7.0 5.0 5.0 3.9
Of which: Sub-Saharan Africa 6.0 3.6 3.6 1.6 Least developed 3.2 1.9 1.9 1.0 HIPCs, excluding Vietnam 4.4 2.5 2.5 1.0
Note: HIPCs denote the highly indebted poor countries. The data confirm the contention of Easterly and others that the quest for economic growth in poor countries remained elusive during the last few decades. Apart from the stellar case of the newly industrialized Asian economies, income has grown faster in the advanced economies than elsewhere, while most of the “developing” world actually regressed. Notwithstanding the role of special factors—such as frequent conflicts, persistently high population growth, declining aid flows, and the correction of overvalued exchange rates (notably in the late 1980s and early 1990s)—the fact that poor countries have grown poorer while rich countries grew richer is well established. Thus, the ratio of per capita income in the major advanced countries relative to the least developed countries rose from 30 in 1970 to 39 in 1980, 68 in 1990, and a peak of 102 in 1995. As noted in a recent WEO report, there
9 These estimates are at constant market prices. Measured at purchasing power parity (PPP) exchange rates, the drop in sub-Saharan Africa’s income would be significantly smaller because a large share of domestic product is not traded (foodstuffs and services, in particular, are inexpensive in poor countries, but they are hardly saleable on international markets).

- 11 -
are vast differences observed in incomes across the world, “ranging from US$100 a year in parts of sub-Saharan Africa to over US$40,000 a year in the richest industrialized countries” (IMF, 2003, p. x), or a 1 to 400 ratio!10
IV. HOW TO GROW OUT OF POVERTY
The WEO database paints a bleak picture of the long-run performance of the group of developing countries as a whole, especially those that have been targeted for special assistance from the international development agencies (i.e., PRGF-eligible countries and HIPCs).11 At the same time, however, the wide range of growth rates in Tables 2 and 5 points to a few elements that can be associated with success or failure. Most important, countries can hardly hope to develop by doing more of the same, especially starting from a position of primary products exporter.
Some characteristics for groups of developing countries seem to have little importance for growth. As noted earlier, the strong and the weak performers include countries from all continents. This would tend to discount considerations such as the “afro-pessimism” and other culture-centric views. Net creditors countries generally perform better than net debtor countries, as do nonfuel exporters relative to fuel exporters, but the differences are not considerable (likewise, the source of financing for net debtor countries—official, private, or diversified—is not associated with a significantly different growth performance).
The nonfuel primary products exporters have consistently experienced the worst economic performance over time; most diversified exporters also have had poor results. By contrast, exporters of manufactures have recorded the best performance.12 It is no surprise, then, that most sub-Saharan African countries (nearly three-fourths), as well as the bulk of HIPC-eligible countries (more than four-fifths), are primary products or diversified exporters. While it may seem counterintuitive that diversified exporters perform little better than primary products exporters, this reflects the fact that many of these countries remain essentially exporters of primary products and have not found their comparative advantage.
Obviously, poor countries can hardly expect moving up on the income scale by expanding failed activities. Doing more of the same—growing more cocoa, coffee, or cotton; digging 10 Much of the literature on “convergence” remained inconclusive through the 1980s. By the early 1990s, it seemed well established that the catching up tendency applied mainly within the group of developed countries, or within large advanced economies such as the United States, and much less to poor countries (see Verspagen, 1991, p. 375). However, a numbers of authors have argued that the evidence if favor of convergence is much stronger once differences in human capital are controlled for (see, e.g., Caselli and others, 1997). 11 Easterly (2001) points out that the failure of poor countries to develop cannot be blamed squarely on development agencies such as the World Bank, given the absence of a counterfactual. Indeed, it is likely that most poor countries would have been worse off without external assistance. 12 The WEO group of exporters of manufactures comprises Brazil, China, India, Malaysia, Pakistan, and Thailand; the newly industrialized Asian economies also grew out of manufactures exports.
- 12 -
for more bauxite, copper, phosphate, or zinc; and harvesting more fish, rubber, or wood—is unlikely to generate much reward. The traditional activities in poor countries are all subject to diminishing returns, which is a powerful obstacle to sustained growth. Primary products remain essentially the same over time and there is little scope of significant productivity gains in their production, while exports from advanced economies benefit from technical progress and evolve into increasingly more sophisticated products. Notwithstanding the classical wisdom, the relative prices of goods that embody productivity growth tend to increase. As a result, the basic North-South barter, in which primary products are exchanged for manufactures, recurrently translates into deteriorating terms of trade for the South. On average, it took 7 tons of coffee or 9 tons of cotton in the early 1960s to purchase an automobile from an advanced economy; by 2000, the respective figures were 11 and 12 tons, or one-third to one-half more.13
To grow, therefore, poor countries should stop concentrating on their traditional activities and turn into producers of manufactures. In order to be “developing,” countries need to abandon their static way of life and embrace a dynamic approach to economic growth. Development is foremost a process of transformation, or evolution, which is a one-way avenue for economic progress. The alternative is not stagnation but regression, even if the output of primary products could keep up with population growth.
Graduating from producer of primary products to manufacturer is easier said than done. While this is undoubtedly no simple task, however, there are many precedents—including some partially successful countries—that suggest how such a transformation can be achieved. The brightest examples are the strong performers of emerging Asia (i.e., the newly industrialized Asian economies of Hong Kong SAR, Korea, Singapore, and Taiwan Province of China, as well as Cambodia, the People’s Republic of China, India, Lao PDR, Malaysia, Thailand, and Vietnam), and several respectable performers in the Western Hemisphere (notably Brazil, Colombia, Costa Rica, the Dominican Republic, Paraguay, and most of the small Caribbean island economies).14
Among the well-documented successful cases, Korea stands out for its remarkable growth since 1960 against many odds. Although the Confucian mentality prevalent in far-east Asia is often mentioned as a favorable startup condition for Korea, actually, in the late 1950s and early 1960s, it was seen as a hindrance—as traditions emphasized philosophy, poetry, and 13 The calculations are based on a hypothetic US$15,000 car (at 2000 prices), using the average price index for new vehicles in the United States, as published in the U.S. Statistical Abstract (the calculation ignores shipment costs, which would be expected to affect both sides of the transaction); commodity prices are drawn from the International Financial Statistics Yearbook. Poor African farmers may console themselves by noting that the 2000 car comes generally equipped with air conditioning and power steering, and perhaps even anti-lock brakes and improved fuel economy... 14 The list does not include the two top performers in Box 2 above (Botswana and Equatorial Guinea), which should be seen as exceptions to the rule that countries do not grow out of mineral resources. Obviously, jackpot winners hardly qualify as models for success stories, even though using a large windfall wisely is always a challenge.

- 13 -
meditation, rather than industry! In fact, the economic takeoff in Korea required overcoming traditions.15 A singular feature of Korea in the 1960s was the impetus given by the government, beginning with President Park Chung Hee, on economic success above nearly everything else. As a result, energies were directed at improving economic performance and transforming the country as rapidly as possible.
By definition, few countries can expect to become top performers and it is unlikely (though not impossible) that the achievements of the newly industrialized Asian economies can be duplicated elsewhere. Nevertheless, several countries—including Bangladesh, Bhutan, Cambodia, Lao PDR, the Maldives, Swaziland, and Yemen—stand out among the least developed economies that made significant progress during the last few decades. For instance, Bangladesh’s per capita income at 2000 prices rose from about US$200 in the early 1970s to US$360 in 1990 (however, per capita income stayed broadly unchanged during the 1990s). This relative success—when compared with most other least developed countries—stemmed mostly from successful ventures into small-scale industries, especially garment factories, which provided gainful employment for a growing labor force, at a time when Bangladesh’s traditional export product (jute) recorded diminishing demand and falling prices. To some extent, this duplicated the earlier remarkable performance of Mauritius, which also grew initially out of low technology industries (as well as tourism) and increasingly diversified its resource base over time (Mauritius is among the “successful” diversified exporters, together with Malta, Indonesia, Syria, Lao PDR, and Tunisia).16
Even those countries among the least developed that have achieved high rates of growth have not emerged overnight out of poverty. As is well known, with 7 percent annual growth comes a near doubling of GDP over ten years. But with population increasing by 2½ percent annually, per capita GDP growth is 4½ percent “only” (ceteris paribus), in which case it takes 16 years to raise it by a factor of 2. At such a brisk pace, Bangladesh would need less than a century to reach the present average income level of OECD countries. With its remarkable growth performance from the early 1960s onward, Korea’s per capita income rose to the equivalent of nearly 40 percent of average income in the major advanced economies in 2001, up from 9 percent in 1970.
Sustaining a high rate of growth requires extensive structural changes, including through the adoption of new technologies and industries. In order to grow, a country needs to identify
15 A similar revolution took place in India in the late 1970s and 1980s, when many Brahmins left their spiritual studies (or, in some cases, careers in the civil service) to pursue more earthly matters in Mumbai, Kolkata, New Delhi, Chennai, or Bangalore. For a discussion of “culture as destiny,” see Zakaria (2003), pp. 51–55. 16 Relatively successful countries may well include special cases or even mirages due to faulty statistics. A broader analysis would need to assess growth sustainability as well as progress in various indicators.

- 14 -
new activities for which it can muster a comparative advantage, or, at the very least, to improve methods in its existing line of business.17
V. WANTED: ENTREPRENEURSHIP AND GROWTH
Schumpeter is celebrated for his emphasis on the entrepreneur as the mainspring of economic evolution. Entrepreneurship is the prime force behind innovations and thus the origin of the “creative destruction” process that generates economic growth. More than just astute businessmen and unusual risk-takers, entrepreneurs break the routine, overcome the inherent conservatism of the establishment, and change the economic and social landscape.
The Schumpeterian entrepreneur is an Ideal Type, which in practice may take various forms, from an individual businessman to a large corporate structure. In poor countries, evolution is likely to spring primarily from individual entrepreneurs rather than corporations, except through foreign direct investment (FDI). In some cases—e.g., Mainland China, Korea, or Vietnam—large companies have developed rapidly in close relationship with the state, either as public or remotely controlled private enterprises (as in the Korean chaebols). However, the latter model may only work if such companies are allowed a large degree of autonomy and financial responsibility and genuinely respond to market forces. As a rule, poor countries are more likely to develop through the promotion of homegrown entrepreneurs (be it only because most governments interfere with the operations of public enterprises). Moreover, development “from the ground up” is more prone to generate virtuous circles of growth and to raise national income, since FDI implies large income transfers to the rest of the world.18
No poor country has a large class of successful entrepreneurs. This statement is nearly a tautology, as successful entrepreneurs would soon lift the country out of poverty. Obviously, however, it does not follow that poor countries are doomed to remain poor. Most—probably all—countries have a large pool of potential entrepreneurs, who have been unable to blossom because of unfavorable conditions, or precluded from fulfilling their function by a repressive regime, or even corrupted into joining a small clique of profiteers or rent-seekers.19 The continuous “brain drain” from poor countries to the advanced economies is a clear sign that dynamic and adventurous people find it unattractive or even impossible to become 17 Although technology in the broad sense of the term is the fundamental explanation for long-term economic growth, this does not mean that poor countries need to jump into hi-tech lines of business. Progress is often the result of unconventional thinking rather than cutting-edge invention. 18 Huang and Khanna (2003) argue that India’s long-term development potential is probably greater than China’s, mainly because the former has laid out a strong infrastructure to support private enterprise while the latter has grown primarily through FDI. 19 There is no universal yardstick to distinguish successful entrepreneurs from rent-seekers at any point of time. However, a major difference lies with the scope for progress and welfare enhancement. For example, an importer with trade preferences who merely repackages goods to sell them on the domestic market with a large profit does not foster economic growth, whereas a low-cost producer generates gainful employment and a sustained expansion of output.

- 15 -
entrepreneurs in their home countries. Large numbers of highly successful entrepreneurs from China and the Indian subcontinent emigrated in the course of the 20th century to prosper elsewhere, at times when their home countries seemed hopelessly backward and poor. More recently, many emigrants from poor African and Asian countries—such as Bangladesh, Cameroon, the Democratic Republic of the Congo, Ethiopia, Senegal, or Vietnam—have developed successful businesses abroad (especially in the United States, but also within Africa and Asia), even though many of them might have preferred to remain in their own countries.20
The literature on the sociology of entrepreneurship is limited, but it has grown in recent years (with a focus on the transition economies). Studies generally confirm that many individuals wish to run their own business and that scholastic aptitude is not necessarily a determining factor (Blanchflower and Oswald, 1998; these authors note that lack of capital is often an important constraint, which may be overcome when the would-be entrepreneurs receive a large inheritance). A research paper on Ethiopia finds that small-scale factories owned by an indigenous minority ethnic group among the least educated (the Gurage) typically perform better than those owned by other groups, although performance also improves with the education level of the owner (Mengistae, 2001). The wide ranging performance of formerly planned economies has been attributed in large part to differences in entrepreneurial development, and such differences have also been identified within a large national economy such as Russia (Berkowitz and DeJong, 2001).
The question remains as to how governments in poor countries can unleash entrepreneurial spirits and thus promote economic development. The short answer is that this takes literally everything—a “holistic” approach. Drawing from Schumpeterian economics (as encapsulated in Part II of Capitalism, Socialism, and Democracy) as well the history of capitalism (as told by Braudel and Maddison), development depends not only on economic conditions but also on sociology and politics. No universal blueprint is likely to exist for such an undertaking, but a number of key steps can help to promote entrepreneurship and growth (Box 5). The main considerations are, first, the establishment of an adequate environment for efficient economic activity and innovation and, second, the provision of essential public goods. No single step is likely to prove sufficient and not all may be absolutely necessary, but there are undoubtedly minimum standards and a critical mass required to spur a genuine economic takeoff. In practice, policy priorities are likely to depend on the specific conditions and traditions of each country, and in some places success may demand nothing short of a new way of thinking.
In many respects, the seven steps listed in Table 7 are familiar and, in part, duplicate the standard components of “policy matrices” attached to policy framework papers since the late 1980s or poverty reduction strategy papers since the late 1990s. Indeed, the list includes most
20 In many places around the world, politicians could well raise the question asked by a famous deputy, Piloo Mody, to Indira Gandhi: “Can the prime minister explain why Indians seem to thrive economically under every government in the world except hers?” (quoted in Zakaria, 2003, p. 53).

- 16 -
of the panaceas that have been tried to no avail during the last few decades. The earlier approaches were perhaps appropriate and well designed overall, but they generally turned out incomplete and lacked a critical ingredient to make things change. International financial organizations probably promised too much, as Easterly suggests, although this was not primarily by paying too little attention of economic incentives; rather, they understated the importance of overhauling the way developing countries operate. A systematic approach that
Table 7. Key Steps to Promote Entrepreneurship and Growth
Areas Objectives
1. Peace and stability Establish a credible political system that ensures legitimacy and continuity (civil strife and war are not conducive to economic development).
2. Governance and the rule of law
Maintain law and order, enforce property rights; avoid capricious changes in the legal and regulatory framework; promote accountability; set up credible judiciary system; weed out corruption.
3. Mentality Drum up support for economic and social reforms, encourage innovation, and place economic success at the forefront of the political discourse.
4. Economic incentives Adopt sound economic policies, including hard budget constraints, open competition, a neutral tax system, no nontariff barriers and low tariffs, basic protection for FDI, etc.
5. Basic infrastructure Ensure the provision of a minimum array of public services, especially as regards the transportation network and utilities
6. Access to capital Develop efficient financial intermediation systems; mobilize external savings, but with prudent debt management.
7. Education Build up human capital—raise literacy and gain access to up-to-date knowledge (promote adaptability and inventiveness).
focuses on laying the right conditions for entrepreneurs to prosper could have momentous consequences in most poor countries. As a matter of fact, seen from the entrepreneur’s vantage point, some of the policy priorities pursued in poor countries may well be seen as radically wrongheaded.21
VI. EVOLUTION AND DEVELOPMENT
The conclusion that societies should first and foremost promote a proper environment for entrepreneurial activity is fully consistent with the emphasis on institutions as the key
21 As a case in point, which is more than merely anecdotal, consider the priorities for infrastructure development in those countries that have dual capital cities: the political capital nearly always get the better share of available funds, while the economic capital is left with decrepit facilities and equipment. The examples of Cameroon, the Republic of Congo, Côte d’Ivoire, and Nigeria readily come to mind. See Easterly (2001, pp. 133-34) about “the curious case of Côte d’Ivoire.”

- 17 -
foundation for economic growth.22 The evolutionary theory of economic change goes one step further, however, as it explains why so many features of the organization of society—such as political stability, governance and the rule of law, voice and accountability, government effectiveness, a light regulatory burden, property rights, and freedom from graft—are essential to promoting economic development. Once the main point of Schumpeterian economics is granted, once it is recognized that entrepreneurs and innovations are the mainspring of growth, it follows that the sociopolitical order does matter to a high degree.23 Institutional improvement is essential to raise economic performance because it helps to channel initiatives toward greater efficiency in the same way apt regulation helps promote sound financial intermediation, as opposed to Ponzi schemes.
The Schumpeterian approach to economic development is much broader and more complex than most economists generally realize. Only three of the seven steps listed above (the fourth, fifth, and sixth) belong to the sphere of competence of development agencies, which have traditionally shied away from intervening in sensitive areas such as governance and the rule of law, and the functioning of the judiciary system. Yet experience has shown that sound economic and financial policies and increased investment are far from sufficient to promote sustainable development. Indeed, it may be argued that the most important step toward economic growth is to ensure good governance and the rule of law.24
Schumpeter was justifiably proud of his theory of economic evolution. As a professional economist, he considered that among his most far-reaching contribution was to have provided a resolution of the Methodenstreit (the controversy over method) that had opposed the pure theoreticians and the historicists. However, the Methodenstreit remains alive to this day, as can be verified by a survey of the literature on economic growth. The neoclassical theoretical strand exemplified by Barro and Sala-i-Martin all but ignores Schumpeterian economics, especially as restated in the works of Nelson and Winter; conversely, articles in the Journal of Evolutionary Economics rarely quote papers from Aghion and Howitt, Lucas, Romer, or Alwyn Young. Meanwhile, economic historians like Maddison largely dispense
22 See Rodrik and others, 2002; Easterly and Levine, 2003; and the survey in IMF, 2003, Chapter III. Easterly and Levine conclude that institutions matter above everything else: “In sum, measures of tropics, germs, and crops explain cross-country differences in economic development through their impact on institutions. These findings are consistent with the institutions hypothesis and inconsistent with the geography hypothesis. Furthermore, policies do not explain cross-country differences in GDP per capita once one controls for the impact of endowments on institutions and on to economic development” (2003, p. 35). 23 This is the point where the Austrian theories of Mises and Hayek meet Schumpeterian economics; see Nelson and Winter, 1982, p. 356. As these authors note, “modern advocacy of private enterprise solutions tends to suffer from vagueness or utopianism in its treatment of institutional matters,” adding “three particularly important (and closely interrelated) ones involve the treatment of property rights, contracts, and law enforcement” (p. 363). 24 “Whatever progress is made on governance will almost certainly have a positive impact on other sectors. Probably no other dimension of foreign assistance yields so many synergies” (Diamond, 2003).

- 18 -
with references to contemporary theories. (Several theoretical works are listed in the bibliography of Maddison’s The World Economy: A Millennial Perspective, but none are referred to in the text.)
The disappointing growth performance of most poor countries and, in particular, the failed panaceas of the past thirty years call into question the received economic wisdom. In many respects, development agencies have seemed to promise more than they could deliver because, as Easterly put it, the task at hand was harder than we thought. Promoting economic development requires much more than the adoption of sound economic and financial policies and the provision of external aid. The recent work on the importance of institutions suggests that a broader approach is in order. To evolve—and thus develop—poor countries must change in a qualitative way and lay out proper conditions for thriving entrepreneurship and increased FDI. The aim must be to do things differently and develop new activities, which is the role of the entrepreneur par excellence.
Implementing comprehensive reforms to promote entrepreneurship and foster economic growth may have vast consequences for the social fabric of poor countries. In some cases, economic progress may even necessitate traumatic changes, as occurred during the experience of perestroika, glasnost, and novoye myshleniye (restructuring, openness, and new thinking) that led to the collapse of the Soviet Union. Few developing countries are in need of such shock treatment, but wide-ranging changes will always bring unintended consequences, which, in turn, may profoundly affect the political balance of societies.25
Political and social changes, and at times traumatic transitions, are inherent in the process of economic evolution. As noted by Simon Kuznets, growth can be a difficult and painful experience: “We are so used to sustained and substantial growth in per capital product that we tend to take it for granted—not realizing how exceptional growth of that magnitude is on the scale of human history; and how much it requires in the complicated process of invention, application, accumulation, and adjustment.”26
For poor countries, there is no genuine alternative to economic evolution—that is, the qualitative transformation that brings new activities and initiates a virtuous cycle of rising productivity. Although these countries will continue to need external aid on a large scale, aid will obviously never substitute for homegrown economic development.
As for economists, the conclusion is clear: let’s parade Schumpeter as a patron saint—at least once a year. 25 In Bangladesh, the development of garment factories and the extension of microcredits by the Grameen Bank resulted in a surge of female employment, which created tensions in a traditionally male-dominated society. In many countries, a rich minority group tends to grow into a dominant economic and financial power, which may appear threatening to the rest of the population. While such tensions have the potential to turn into civil war, they can also be managed successfully (e.g., as in Malaysia or South Africa). 26 Kuznets (1977), p. 6. The wide scope of political and social changes accompanying economic development is noted recurrently in Maddison (2001).

- 19 -
REFERENCES Aghion, Philippe, and Peter Howitt, 1992, “A Model of Growth Through Creative
Destruction,” Econometrica, Vol. 60 No. 2 (March), pp. 323–51.
Barro, Robert J., and Xavier Sala-i-Martin, 1995, Economic Growth (New York: McGraw-Hill).
Berkowitz, Daniel, and David N. DeJong, 2001, “Entrepreneurship and Post-Socialist Growth,” William Davidson Institute, Working Paper No. 406 (October); also available on the web at www.wdi.bus.umich.edu.
Blanchflower, David G., and Andrew J. Oswald, 1998, “What Makes an Entrepreneur?” Journal of Labor Economics, Vol. 16 No. 1 (January), pp. 26–60.
Bleaney, Michael, and Akira Nishiyama, 2002, “Explaining Growth: A Contest Between Models,” Journal of Economic Growth, Vol. 7 No. 1 (February), pp. 43–56.
Braudel, Fernand, 1985a, La dynamique du capitalisme (Paris: Arthaud).
———, 1985b, Civilization and Capitalism, 15th–18th Century (3 vols.—New York: Harper and Row).
Caniëls, Marjolein C. J., and Bart Verspagen, 2001, “Barriers to Knowledge Spillovers and Regional Convergence in an Evolutionary Model,” Journal of Evolutionary Economics, Vol. 11 No. 3 (September), pp. 307–29.
Caselli, Francesco, Gerardo Esquivel, and Fernando Lefort, 1997, “Reopening the Convergence Debate: A New Look at Cross-Country Growth Empirics,” Working Paper No. 3, Central Bank of Chile; available on the web at www.bcentral.cl.
Diamond, Larry, 2003, “Universal Democracy?”, Policy Review, Vol. 119 (June–July); also available on the web at www.policyreview.org.
Easterly, William, 2001, The Elusive Quest for Growth—Economists’ Adventures and Misadventures in the Tropics (Cambridge: MIT Press).
———, and Ross Levine, 2001, “It’s Not Factor Accumulation: Stylized Facts and Growth Models,” unpublished, World Bank (March); also available on the web at www.worldbank.org.
———, 2003, “Tropics, Germs, and Crops: How Endowments Influence Economic Development,” Journal of Monetary Economics, Vol. 50 No. 1 (February), pp. 3–39.

- 20 -
Fagerberg, Jan, 2003, “Schumpeter and the Revival of Evolutionary Economics: An Appraisal of the Literature,” Journal of Evolutionary Economics, Vol. 13 No. 2 (March), pp. 125–59.
Foley, Duncan K., and Thomas R. Michl, 2001, “The Production Function and Productivity” (comment on a series of papers on the “new economy,” Journal of Economic Perspectives, Vol. 14 No. 4, fall 2000), Journal of Economic Perspectives, Vol. 15 No. 3 (summer), pp. 257–58.
Gordon, Robert J., 2001, “The Production Function and Productivity” (response to Foley and Michl, 2001), Journal of Economic Perspectives, Vol. 15 No. 3 (summer), pp. 257–58.
Hagemann, Harald, 2001, “Wicksell’s ‘New Theory of Crises:’ An Introduction,” Structural Change and Economic Dynamics, Vol. 12, pp. 331–34.
Huang, Yasheng, and Tarun Khanna, 2003, “Can India Overtake China?” Foreign Policy, July–August 2003, pp. 74–81.
International Monetary Fund, various years, International Financial Statistics Yearbook (Washington, DC).
———, 2003, World Economic Outlook, April 2003—Growth and Institutions (Washington, DC); also available on the web at www.imf.org.
Kaldor 1966.
Kuznets, Simon, 1977, “Two Centuries of Economic Growth: Reflections on U.S. Experience,” Richard T. Ely Lecture, American Economic Review, Vol. 67 No. 1 (February), pp. 1–14.
Maddison, Angus, 2001, The World Economy: A Millennial Perspective (Paris: Organization for Economic Cooperation and Development).
Malinvaud, Edmond, Jean-Jacques Carré, and Paul Dubois, 1972, La croissance française (Paris: Seuil).
Mengistae, Taye, 2001, “Indigenous Ethnicity and Entrepreneurial Success in Africa: Some Evidence from Ethiopia,” World Bank Research Working Paper, No. 2534; also available on the web at www.worldbank.org.
Nelson, Richard S., and Sidney G. Winter, 1982, An Evolutionary Theory of Economic Change (Cambridge: Belkap Press of Harvard University Press).
———, 2002, “Evolutionary Theorizing in Economics,” Journal of Economic Perspectives, Vol. 16, No. 2 (Spring), pp. 23–46.
- 21 -
Oliner, Stephen, and Daniel E. Sichel, 2000, “The Resurgence of Growth in the Late 1990s: Is Information Technology the Story?” Journal of Economic Perspectives, Vol. 14 No. 4 (fall), pp. 3–22.
Rodrik, Dani, Arvind Subramanian, and Francesco Trebbi, 2002, “Institutions Rule: The Primacy of Institutions over Geography and Integration in Economic Development,” NBER Working Paper No. 9305 (October), available on the web at www.nber.org.
Romer, Paul M., 1986, “Increasing Returns and Long-Run Growth,” Journal of Political Economy, Vol. 94 No. 5 (October), pp. 1002–37.
———, 1990, “Endogenous Technological Change,” Journal of Political Economy, Vol. 98 No. 5 (October), pp. S71–102.
Schumpeter, Joseph A., 1911, Theorie der Wirtschaftlichen Entwicklung (Vienna: Duncker & Humblot); English translation as The Theory of Economic Development—An Inquiry into Profits, Capital, Credit, Interest, and the Business Cycle (Cambridge: Harvard University, 1934; reprinted, New York: Oxford University Press, 1961).
———, 1939, Business cycles (New York: McGraw-Hill).
———, 1942, Capitalism, Socialism and Democracy (London: Allen & Unwin; 3rd ed., 1950).
Solow, Robert M., 1956, “A Contribution to the Theory of Economic Growth,” Quarterly Journal of Economics, Vol. 70 No. 1 (February), pp. 65–94.
———, 1957, “Technical Change and the Aggregate Production Function,” Review of Economics and Statistics, Vol. 39 No. 3 (August), pp. 312–20.
———, 1994, “Perspectives on Growth Theory,” Journal of Economic Perspectives, Vol. 8 No. 1 (winter), pp. 45–54.
U.S. Census Bureau, various years, Statistical Abstract of the United States (Washington, DC); recent editions also available on the web at www.census.gov.
Verspagen, Bart, 1991, “A New Empirical Approach to Catching Up or Falling Behind,” Structural Change and Economic Dynamics, Vol. 2 No. 2, pp. 359–80.
———, 2000, “Economic Growth and Technological Change—An Evolutionary Interpretation,” mimeo, Eindhoven Center for Innovative Studies (April); also available on the web at www.merit.unimaas.nl.
Zakaria, Fareed, 2003, The Future of Freedom—Illiberal Democracy at Home and Abroad (New York: Norton).