andrei gheorghiŃă department of sociology lucian blaga...
TRANSCRIPT

THE IMPACT OF POLITICAL LEADERS ON VOTING IN ROMANIA
Andrei GheorghiŃă
Department of Sociology
Lucian Blaga University of Sibiu, Romania
Paper prepared for the European Leaders and Democratic Elections Workshop,
ECPR Joint Sessions, Lisbon, April 2009
(Work in progress, please do not cite without the author’s permission)

2
THE IMPACT OF POLITICAL LEADERS ON VOTING IN ROMANIA∗∗∗∗ ∗∗∗∗∗∗∗∗
1. POLITICAL PARTIES AND THE PERSONALISATION OF ELECTORAL POLITICS
Classic models have generally placed political parties at the centre of any explanation
of voting behaviour during parliamentary elections. According to such a perspective,
elections should be regarded as competitions among political parties (hence group actors)
legitimized through a specific placement in relation to the main cleavages a society has to
deal with at a particular moment of time. As a consequence, personal characteristics of a
candidate for public office are not expected to bear great influence upon the electoral
decision, especially in societies where latent conflicts among large social groups tend to set
the general framework for the electoral competition. A significant transformation in the
relevance for the electoral decision of such frozen political alignments is anticipated by
Otto Kircheimer in a famous essay (1966), discussing a new species of parties, catch-all,
seriously challenging the old-fashioned class-mass parties and denominational mass parties.
Catch-all parties are defined in terms of: (a) drastic reduction of the ideological baggage; (b)
strengthening of top leadership groups; (c) downgrading the role of the individual party
member; (d) de-emphasis of the specific social-class or denominational clientele; (e)
securing access to a variety of interest groups (Kircheimer, 1966: 190).
The change anticipated by Kircheimer finally occurred, involving the generalization
of the new party species. Consequently, from the electoral perspective, political leaders
have begun to play an increasingly important role. This role of political leaders in the game
of elections encompasses at least two dimensions, namely presentation and impact (Mughan,
2000: 11). The first one relates to the way political parties choose to present themselves to
the public, setting their leaders as the core element or the public face of the party. The
second one relates to the presumed effects of leader’s personality and behaviour on the
voting patterns of the citizens.
∗ This paper is based on work carried out during a visit (AG0108) to the European Centre for Analysis in the Social Sciences (ECASS) at the Institute for Social and Economic Research, University of Essex, supported by the Access to Research Infrastructures action under the EU Improving Human Potential Programme. ∗∗ I wish to thank Cristina Stănuş, HoraŃiu Rusu, and Mircea Comşa for their valuable comments and help in the various stages of writing this paper.
3
The two dimensions define the phenomenon referred in the literature as the
personalization of electoral politics or the presidentialization of voting1. It involves a growing
tendency to associate the electoral decision in favour of a party or another with the image
of its leader, but also to identify the party itself with the leader. As a consequence, the
personal characteristics of political leaders are expected to have a growing impact on the
party vote during parliamentary elections. Although still debated in the literature, because
of rather inconsistent empirical findings, the personalization thesis is largely taken for
granted by campaign strategists all over the world. Thus, electoral campaigns are regarded
as increasingly ‘personalized’ (Schmitt and Ohr, 2000), ‘presidentialized’ (Crewe and King,
1994; Mughan, 2000; Poguntke and Webb, 2005) or ‘candidate-centered’ (Wattenberg,
1991). Explanations for such a change in the voting patterns in parliamentary elections, but
also in the way such campaigns are fought, are not linked exclusively to the substantive
transformations faced by political parties, but also to other relevant factors that are to be
outlined in the next section of this paper.
2. THE CAUSES OF PRESIDENTIALIZATION
Change in the patterns of mass communication, with a growing role of electronic media
(especially television), is the phenomenon most widely referred to in the literature in
relationship to the presidentialization of voting (Bean and Mughan, 1989; McAllister, 1996,
2007; King, 2000; Schmitt and Ohr, 2000; Poguntke and Webb, 2005). Television focuses
on image for broadcasting political information and, for this purpose, is in a desperate need
for faces. Thus, it is just natural for television to use politicians as a vehicle for
disseminating information, while disregarding abstract ideas, institutions or political
documents. Additionally, television has the capacity to reveal, more directly and more
authentically than any other mean of mass communication, a multitude of nonverbal
attributes of politicians: facial appearance, style, clothing, and body language (Schmitt and
Ohr, 2000: 6).
On the other side, voters might find it easier to manage political issues by reference
to leaders and their media representations. Hence, the information costs of the individual
voter are significantly reduced: while, before the age of the television, developing an
1 Presidentialization of voting is frequently regarded in the literature as a constituent of a larger process of presidentialization of parliamentary systems. As a process, the presidentialization involves a transformation in the functional logic of parliamentarianism along three directions: an increase in the power resources of the prime ministers within the executive, an increase in the autonomy vis-à-vis his/her own party, and the personalization of the electoral process (Poguntke and Webb, 2005: 4-5).

4
individual position related to various issues was a rather difficult (perhaps even prohibitive)
task, the use of individual politicians as reference frames for political topics has significantly
simplified the choice of the voter. The voters might empathize or not with the politician’s
goals, might put themselves or not in their shoes. However, it’s likely that the voters shall
gain a better understanding of the politician’s views and understandings (McAllister, 2007:
579). Thus, for television, political leaders represent a visual shortcut in the effort of
capturing and retaining the viewers’ attention on political issues (McAllister, 2007: 579),
while for the viewers they act as an information shortcut for forming electoral decisions in
favour or against parties (Popkin, 1994: 61). Later prevalence of commercial private
television has further amplified such changes (Poguntke and Webb, 2005: 15). In order to
gain larger shares of viewers, private television frequently combined information and
entertainment in a mixed infotainment (Schmitt and Ohr, 2000: 6), leaving no place to
anything else than the human element of politics. Thus, political leaders turned fast into TV
superstars (Schwartzenberg, 1995: 12-14, Gidengil et al., 2000: 3).
Political parties adjusted their strategies as a reaction to transformations in the media
system. Leaders turned into the ‘public faces’ of political parties and their discourse
adapted to the logic and format of television by focusing extensively on symbolism instead
of substance (Poguntke and Webb, 2005: 15). This is mainly a conscious choice taken by
politicians in order to exploit the visual media’s potential for simplification and symbolism
for their own purposes (Poguntke and Webb, 2005: 15).
Erosion of traditional electoral alignments is another cause of presidentialization widely
mentioned in the literature (Wattenberg, 1991; McAllister, 1996, 2007; Schmitt and Ohr,
2000). The traditional ties between parties and social groups, developed along political
cleavage lines, have faced a continuous decline during the last decades, in spite of
considerable efforts done by political parties to revitalize them. Such dealignments reflected
in a continuous decline in both party membership and turnout (McAllister, 2007: 582-583).
While traditional cleavage politics had previously assumed a coherent political program
addressing the aligned electorate is the key to electoral success, dealignment has largely
subverted the very substance of such a strategy. Political parties had to face more
heterogeneous electorates, both socially and ideologically, less interested in the ‘ideology’
and the loyalties of the social group they belong to (Poguntke and Webb, 2005: 15), and
consequently more volatile (Wattenberg, 1991: 2). Thus, group identification has turned
into a rather lousy predictor of voting behaviour, with a limited and decreasing
mobilization potential. Once the catch-all strategy has been adopted by a large majority of

5
political parties, the signals transmitted towards social groups became more ambiguous, as
political manifestos were targeting rather heterogeneous categories of voters.
As a consequence, large categories of voters became ‘available’ (Poguntke and Webb,
2005: 16) on the electoral market, politically dealigned and ideologically confuse, potentially
easy to ‘catch’ and, eventually, mobilize. Parties reacted with a strategic increase in the
focus given to political leaders and their attributes, considered to be the appropriate tools
for re-mobilizing the electorate. Thus, personal characteristics of the candidates became
elements largely exploited in the campaign strategies, in a deliberate attempt to extrapolate
the positive image of candidates towards their parties as a whole.
A general shift in voters’ awareness from local elections to national elections might be regarded as
a simultaneous result of the decline in the ties between parties and social groups and of the
changes in the patterns of mass communication about politics. National politics is by its
nature more spectacular and hence more able to draw citizens’ attention. Moreover,
resources invested by the political actors in national campaigns are significantly higher than
in local ones, meaning a more fascinating representation for the public. If in context of
print (or even audio) media national politics was hardly accessible to most of the voters,
television has radically transformed things. National politics is nowadays easily accessible to
everyone having a TV and it became a much simpler business than ever before, thanks to
parties’ efforts of adaptation to the television formats and standards. Furthermore, the
growth in the role of the state in contemporary societies, after the second world war, has
supplementary nourished this orientation of the voters towards the national context of
politics instead of the local one. Since national politics mainly uses political leaders as
agents of electoral mobilization (rather than local networks, based on group loyalties, as it
was the case in local politics), this shift should be regarded as bringing up additional
leadership-centeredness in electoral politics.
The internationalization of politics has largely reduced the relevance of collective decision-
making bodies, at least at national level. A growing share of the political problems
governments have to face can only be dealt with via international cooperation, involving
inter-governmental cooperation (Poguntke and Webb, 2005: 13). The globalization of
political decisions has shifted the power to high rank executive actors (prime ministers,
presidents), while deliberative bodies (parliaments, even cabinets) find themselves in the
uncomfortable position of simply ratifying decisions taken elsewhere (Poguntke and Webb,
2005: 13-14). Thus, individual actors (leaders) concentrate more decisional resources and,
consequently, more visibility, to the detriment of group actors (parliaments, parties).

6
The increasing complexity of political issues in the last decades has additionally nourished
the voters’ severe need for a simplification of their political representations. Thus, they
might find easier to associate political power and authority with a readily identifiable
political personality than with an abstract institution or political ideal (McAllister, 1996:
287). For the ordinary citizen, it’s easier to hold individuals accountable for political actions
than an institution or an ideology. Such a mechanism of building political representations
will hold direct consequences upon how ordinary people design their representations on
political parties and elections.
3. ANALYTICAL STRATEGIES
Analysing the effects of political leaders on party voting is a difficult task. There are
rather few authors that contest the very existence of leader effects. Usually, the dispute is
focused upon the strength of leader effects in the electoral decision-making process. At the
origins of this dispute lie the difficulty of disentangling the effects of leaders’ personalities
and other personal attributes borne on individuals’ vote decisions from the influences of all
the other factors, such as group loyalties, partisan likes or dislikes, personal values,
ideological preferences, previous performance of political parties (King, 2002: 14-15). In
other words, it is extremely difficult, if not impossible, to isolate ‘pure’ leadership effects
without being contaminated with influences from other variables. Broadly speaking, there
are three analytical strategies mentioned in the literature for measuring leadership effects:
the experimental strategy, the improved-prediction strategy, and the counterfactual strategy (Crewe and
King, 1994: 185-187; King, 2002: 15-21). Following, we shall briefly discuss each of the
three strategies, in an attempt to review the specific advantages and disadvantages involved
by such approaches.
A pure experimental design would imply running a considerable number of national
elections with a strict control of alternative explanatory variables, allowing exclusively
variations of stimuli related to the personalities and other personal characteristics of the
parties’ leaders or candidates. Obviously, in this pure format, the experimental strategy is
impossible to execute. Additionally, such a design would fail to consider the indirect leader
effects on voting (the influence exerted via leaders’ activity inside the party organization or
the government).
Experimental studies focusing on the personalization of electoral politics attempt to
simulate an electoral context in which stimuli are represented by fictitious candidates that
7
‘express themselves’ by the means of pictures/flyers (Rosenberg et al., 1986) or video clips
(Jenssen and Aalberg, 2006). The experimental group (university students or customers of a
local store) is introduced to pictures/video clips of the candidates, but also to additional
information about their party affiliation, issue positions adopted and their background
(education, occupation, political experience) (Rosenberg et al., 1986: 114-117). In the
Norwegian experiment, video clips reproduce discourses of real politicians, by the means
of fictitious candidates played by professional actors (Jenssen and Aalberg, 2006: 258-261).
Hence, such studies attempt to reproduce an electoral context, under which they
manipulate different stimuli related to personal characteristics of the candidates, with a
strict control of alternative explanatory factors for the electoral decision. However, there is
very little to do in order to avoid the artificiality of such an electoral context, although the
subjects appeared to have taken the task of voting quite seriously in both cases (Rosenberg
et al., 1986: 117; King, 2002: 16; Jenssen and Aalberg, 2006: 261). Both experimental
studies confirm the hypothesis of a significant impact that personal characteristics of the
candidates bear on the vote decision2.
The improved-prediction strategy chooses a different approach for dealing with the
need to measure ‘pure’ leadership effects. It attempts a statistical measurement of the
additional explanatory power brought in a model of party vote by the personal judgments
on political leaders. In other words, it assumes the explanatory variables of vote coming
from alternative models (voters’ values, ideological affiliations, party preferences, group
loyalties, retrospective perceptions of recent performance in office) that are entered to
multiple regressions as independent variables, in order to statistically control their effects.
The goal of such a design is a precise measurement of the additional explanatory power
(improvement in prediction) brought to such multiple regression models by the evaluations
of political leaders. The improved-prediction strategy is extensively used into analyses of
the personalization of the electoral politics. It is employed in a famous series of studies by
Warren E. Miller and J. Merrill Shanks dedicated to the U.S. presidential elections of the
1980s and 1990s (Miller and Shanks, 1982, 1996; Shanks and Miller, 1990, 1991). Miller and
Shanks explain the choices of individual voters as being a cumulative effect of several
factors temporally ordered: (1) partisan and ideological predispositions, (2) policy
preferences, (3) performance evaluations, (4) issue distances between respondent and the
candidates, and (5) other (non-political) candidate evaluations (Miller and Shanks, 1982:
2 Obviously, the two experimental studies are not comparable, neither in terms of design, nor of results. There is a significant number of variables that should also be taken into consideration, like the political system, the electoral system, the party system, the type of elections simulated etc.

8
341). Thus, each of the five factors has a ‘net’ contribution (and theoretically measurable)
in the formation of the vote decision. Their ordering is not at all arbitrary, as the sequence
starts with more stable factors (far from the electoral decision) and continues with less
stable and more contextual ones (nearer in time to the individual’s final vote decision) 3.
Perhaps the most explicit use of the improved-prediction strategy in the analysis of the
personalization of the vote decision comes from Schmitt and Ohr (2000). They employ the
so-called ∆R² strategy for analysing the relevance of leader effects on voting in Germany for
the period between 1961 and 1998. Hence, they measure the additional variance in the
party vote (R²) explained by leaders’ evaluations (net effects), after controlling for the
effects of social-structural factors and party/ideological identification (Schmitt and Ohr,
2000: 16).
The counterfactual strategy is somehow linked to the experimental strategy and relies
on the technique of thought-experiments, emphasizing the explicit answers to ‘What if?’
questions. What if John Edwards were the Democrat challenger of George W. Bush for the
American presidency instead of John Kerry? An infinite number of such counterfactual
questions can be formulated, at least theoretically, about a single electoral competition, and
consequently an infinite number of thought-experiments are needed. In practice, as
Mughan (2002: 19) noticed, the few authors adopting the counterfactual strategy have
chosen to run their thought-experiments on counterfactuals for which real-world data are
available.
Bean and Mughan employ this strategy in the final section of a highly influential
article on leadership effects in parliamentary elections in Australia and Britain (1989). Their
counterfactual question refers to the possible electoral effect of a reversal in the personal
profiles of the two main party leaders in elections of 1987 in Australia and 1983 in Britain
(the Labour leader John Hawke and the Conservative John Howard in the first case,
respectively Conservative Margaret Thatcher and Labour leader Michael Foot in the second
case). Based on British Election Study (1983) and Australian Election Study (1987) data,
Bean and Mughan develop a projection of the election results in the hypothetical case of
the ‘losers’ (Howard and Foot respectively) would have been perceived by the electorate
similarly to the winners (Hawke and Thatcher respectively) in terms of personal
characteristics4. Results suggest a significant influence of leaders’ personal characteristics
3 In their view, earlier more stable factors will simultaneously have a direct influence on the vote decision, but also an indirect one, via influencing later less stable factors (King, 2002: 18). 4 Respondents were offered a limited set of attributes (caring, determined, shrewd, likable as a person, tough, listens to reason, decisive, sticks to principles, effective) and asked about the degree to which the main two

9
upon the party vote5. Thus, Bean and Mughan’s strategy provides an estimation of the vote
gains brought by having the ‘right’ party leader (Bean and Mughan, 1989: 1175).
4. DEFINING EXPECTATIONS: LEADERS IN THE ROMANIAN SOCIAL, POLITICAL, AND CULTURAL CONTEXT
History gives leaders a central part in Romanian political life, be them “voievod”,
princes, kings or Communist dictators. With the notable exception of kings, in each of
these cases we can identify leaders that went far beyond acceptable barriers for the exercise
of power in a modern constitutional regime. The last of the series, the Nicolae Ceauşescu
regime, contributed through its extreme degree of personalization and arbitrary decision-
making to defining the contemporary concept of sultanism (Linz and Stepan, 1996: 44-45,
51-54; Pasquino, 2002: 286-289). Nevertheless, the periods when political life was
dominated by single actors alternated with periods when collective actors successfully
counterbalanced the autocratic tendencies of leaders. Among these collective actors we
should mention assemblies of aristocrats, the Diet of Transylvania (both during the
medieval age), and the proto-political parties and the parliament (in the modern age). Given
these aspects, it is almost impossible to define some clear expectations regarding the role
and relevance of political leaders for the electoral competition, based on analyzing
historical events or traditions. Despite the numerous examples of political leaders
exercising power in a discretionary manner, we can hardly say that these examples are
characteristic of a given historical period, no matter what that period would be.
Nevertheless, collective memory seems to be dominated by the images of such leaders,
sketched in highly positive shades, which determines many to see nostalgia of powerful
leaders at population level.
Fresh memories of the sultanistic regime determined the 1990 Constituent Assembly
to opt for semipresidentialism, which would limit the potential authoritarian tendencies of the
president by giving him limited prerogatives6. Regardless of this aspect, the Constituent
party leaders possess such attributes. Additionally, they were asked to offer a score of the perceived effectiveness of alternative leaders (Bean and Mughan, 1989: 1168). 5 Regression models employed by Bean and Mughan in the British case suggest that if Foot had had Thatcher’s personality profile, other things being equal, Labour’s vote in 1983 would have been 6-7 percentage points higher. In the Australian case, the contrast in personality profiles would have translated into 4 percentage points (Bean and Mughan, 1989: 1175). 6 The prerogatives of the president of Romania can be separated into three categories: prerogatives of representation (he or she is representative because he or she is legitimated via direct expression of the will of the people, but also he or she represents the state, inside and outside Romania), prerogatives of safeguarding (the state and the constitution) and prerogatives of mediation (between different public authorities or

10
Assembly also opts for a directly elected president, solution which is often seen as a
corrective mechanism in the event of the emergence of a highly fragmented party system
(Siaroff, 2003: 308). Consequently there is a contradiction between the position of a
president, well above the typical president in a parliamentary regime, and his real
prerogatives, that contributes to diminishing his role within the state. The results was often
characterized as parliamentarism with a presidential corrective (Siaroff, 2003: 287, 308), with
unclear implications for the personalization of voting. On the one hand the electoral
competition for the presidential office will stimulate the appearance of strong personalities,
capable of launching multiple messages aimed at the voters; while on the other hand, the
prerogatives suggest a secondary position once the electoral process is finished. Despite
these unclear constitutional implications, our expectations converge toward strong leader
effects, created by the joint organizing of presidential and legislative elections. At the same
time, it is our expectation that these leader effects will diminish in time, as a result of the
separation of presidential and legislative elections following the changes brought to the
constitution by law no. 429/20037.
Another regulation regarding electoral competition with potential impact upon the
intensity of voting personalization is law no. 68/1992 regarding the election of the
Chamber of Deputies and the Senate, which introduces a proportional representation
system with closed lists. This electoral formula gives the image and the reputation of the
candidates the lowest possible influence on voting (Carey and Shugart, 1995: 424),
transferring to the party label the essential part in the formation of the voting decision. It is
to be expected that such an institutional framework will successfully inhibit the
personalization of electoral politics at constituency level, but it will not have a similar effect
on the transfer of popularity from the leaders of the national party, especially since
legislative and presidential elections are simultaneous.
A different set of expectations is outlined by the change of electoral formula
introduced by law no. 35/2008 - from PR with closed lists to a mixed system (majority
voting in single seat constituencies, with redistribution mechanisms). It is expected that this
change would give extra meaning to the image and personality of local candidates to the
expense of the leaders of the national party and party etiquette in general. But such
consequences can only be anticipated and, since the effects of this change will become
obvious at a moment of time outside the reach of this paper, I will not address them.
between society and public authorities) (Deleanu, 1998b: 334-339). 7 A change to the Romanian Constitution by Law no. 429 /2003 expands the presidential term from 4 to 5 years, while the term of the members of parliament remains 4 years. Thus, the presidential and legislative elections are separated and can only be organized simultaneously every 20 years.

11
Literature emphasizes the erosion of traditional alignments among the factors that
contributed to the increase in personalization of electoral politics. This erosion left behind
an ideologically confused, de-aligned and volatile electorate (Poguntke and Webb, 2005:
16), that needed to be ‘captured’ by appeal to the personal qualities of the candidates. Such
an explanation loses all relevance when we look at new democracies in Central and Eastern
Europe, where we do not have stable party systems or long term party and ideological
identification materialized in consolidated electoral alignments. Nevertheless, we can not
neglect some similarities between the erosion of traditional alignments in Western Europe
and the formation and consolidation of Central and Eastern European party systems that
manifest at the voter level: low ideological and political party involvement; weak party
identification; generalized dissatisfaction, lack of trust and alienation regarding politics; and
high electoral volatility. Once we delineate this similarity between the two historical periods
in party system evolution, there seem to be enough premises to consider the party system
development and consolidation stage a facilitating factor in the personalization of politics in
Central and Eastern Europe, in general, and Romania, in particular. Moreover, individual
personalities remain an element of stability in the context of a young, fragmented and
unstable, party system (for a similar argument see Kitschelt, 1995; Ştefuriuc, 2003).
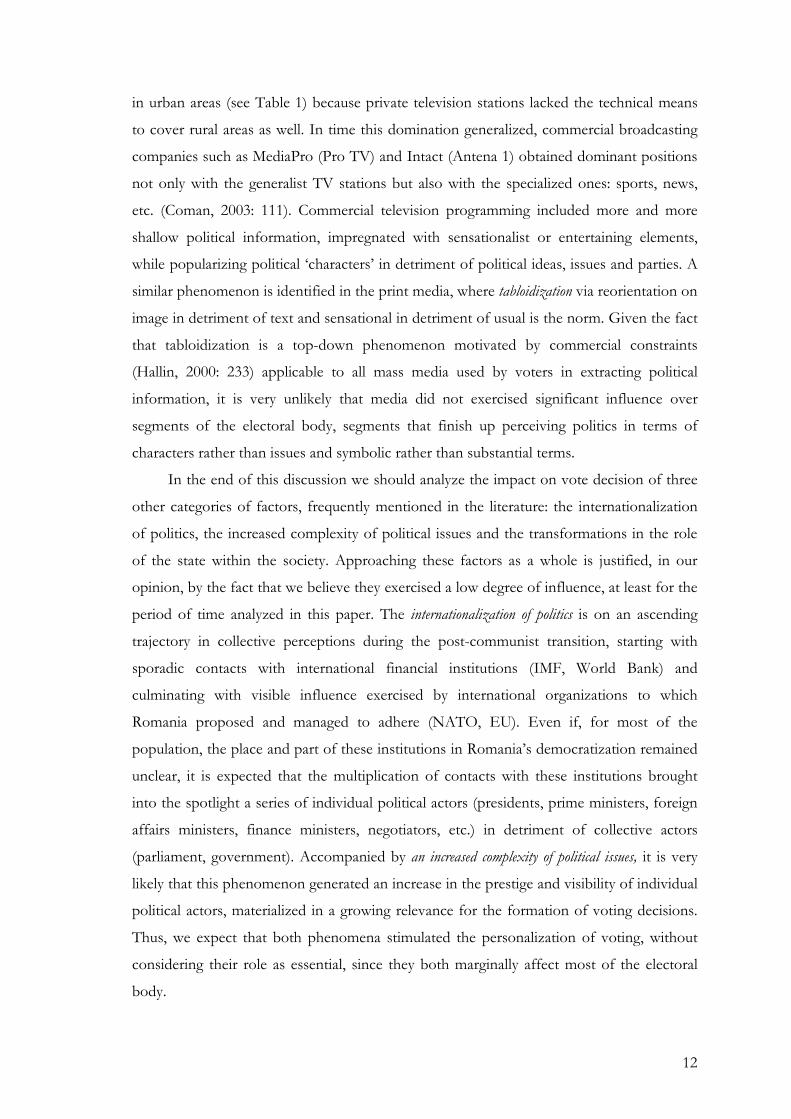
TVR 1 TVR 2 ProTV Antena 1 PrimaTV AcasăTV Others 1998 21,2% 5% 35,1% 17,4% 4,8% 4,1% 11,3% 1999 16,5% 3,1% 33,7% 22,5% 4,9% 6,9% 10,2% 2000 15,6% 3,7% 25,4% 21,5% 5,7% 8,4% 16,3% 2001 14,4% 4,3% 21,8% 19,9% 9,7% 9,1% 18,6% 2002 14,5% 3% 21% 17% 7% 8%
Table 1: Market shares for the main TV stations, urban areas (cities) according to AGB Data Research.
Source: Coman, 2003: 111
The accelerated development of the Romanian media system, especially of broadcasting, is
probably the most important facilitating factor for the personalization of electoral politics.
Dominantly uninformed, politically or ideologically not aligned, and lacking a consolidated
political culture, voters found an unexpected simplification of political life in the mass
media, especially in television programs, given by the projection of the human element into
politics. It is expected that the personalization of politics found a catalyst in the increased
market share of private commercial television stations, at the expense of the public service,
especially after 1998 (Coman, 2003: 110-111). For a while this domination only materialized
12
in urban areas (see Table 1) because private television stations lacked the technical means
to cover rural areas as well. In time this domination generalized, commercial broadcasting
companies such as MediaPro (Pro TV) and Intact (Antena 1) obtained dominant positions
not only with the generalist TV stations but also with the specialized ones: sports, news,
etc. (Coman, 2003: 111). Commercial television programming included more and more
shallow political information, impregnated with sensationalist or entertaining elements,
while popularizing political ‘characters’ in detriment of political ideas, issues and parties. A
similar phenomenon is identified in the print media, where tabloidization via reorientation on
image in detriment of text and sensational in detriment of usual is the norm. Given the fact
that tabloidization is a top-down phenomenon motivated by commercial constraints
(Hallin, 2000: 233) applicable to all mass media used by voters in extracting political
information, it is very unlikely that media did not exercised significant influence over
segments of the electoral body, segments that finish up perceiving politics in terms of
characters rather than issues and symbolic rather than substantial terms.
In the end of this discussion we should analyze the impact on vote decision of three
other categories of factors, frequently mentioned in the literature: the internationalization
of politics, the increased complexity of political issues and the transformations in the role
of the state within the society. Approaching these factors as a whole is justified, in our
opinion, by the fact that we believe they exercised a low degree of influence, at least for the
period of time analyzed in this paper. The internationalization of politics is on an ascending
trajectory in collective perceptions during the post-communist transition, starting with
sporadic contacts with international financial institutions (IMF, World Bank) and
culminating with visible influence exercised by international organizations to which
Romania proposed and managed to adhere (NATO, EU). Even if, for most of the
population, the place and part of these institutions in Romania’s democratization remained
unclear, it is expected that the multiplication of contacts with these institutions brought
into the spotlight a series of individual political actors (presidents, prime ministers, foreign
affairs ministers, finance ministers, negotiators, etc.) in detriment of collective actors
(parliament, government). Accompanied by an increased complexity of political issues, it is very
likely that this phenomenon generated an increase in the prestige and visibility of individual
political actors, materialized in a growing relevance for the formation of voting decisions.
Thus, we expect that both phenomena stimulated the personalization of voting, without
considering their role as essential, since they both marginally affect most of the electoral
body.

13
Institutional factors: - Direct election of the president. - Simultaneous presidential and legislative elections. Historical and cultural factors: - Collective memory dominated by images of authoritarian leaders. Stimulate - Antecedent sultanistic regime, followed by a difficult transition. the personalization Structural factors: of electoral politics - Unstable and unconsolidated party system. - Lack of consolidated electoral alignments. + Contextual factors: - Domination of commercial TV stations. - Tabloidization. - Internationalization of politics. - Increased complexity of political issues. Institutional factors: - Semipresidentialism with limited presidential prerogatives. - Electoral formula (1990-2004) – PR, closed party lists, one round. - Separation of presidential and legislative elections (starting 2008). Historical and cultural factors: Inhibit - Powerful remembrance of the personality cult of the sultanistic regime. the personalization Structural factors: of electoral politics. - Party system consolidation. Contextual factors: - - Decrease in the role of state in society during the post-communist period.
Figure 1: Defining expectations regarding the personalization of voting decisions in Romania.
The need for decentralization specific to the transition from communism to
democracy and free market naturally reflected itself in a step by step diminishing of the role
played by the state in society. Such a retreat of the state resulted in a natural decrease of the
resources available to the national top leadership, as well as in a clear delineation of the
leverages for intervention in economy and society. Still, these transformations reflected
very late at the level of social perceptions of these offices and their holders. If we correlate
these changes with party alternation in these offices, and also with the increased
competition between national and local leaders, it is very likely that a depersonalization in
the perception of public offices becomes manifest, accompanied by a similar effect in
terms of competition for these offices.
Summarizing, we may say that Romania’s case generates unclear expectations about
the personalization of politics. Even though there is a significant number of institutional
mechanisms meant to inhibit this phenomenon, there is also a significant number of

14
historical, cultural, structural and institutional factors, as well as some institutional
inconsistencies, that diminish the effects of the institutional mechanisms mentioned.
Nevertheless, taking into account both the facilitating and inhibiting factors (Figure 1), it is
our expectation that the manifestation of this phenomenon is well above the average
Western European consolidated democracy.
5. DATA SOURCES AND DIRECTIONS OF ANALYSIS
The hypothesis of personalization is obviously a dynamic one. The nature of such a
hypothesis demands a specific strategy for analysis – longitudinal, on an extensive period of
time. The attempt to apply such an analytic strategy to the phenomenon of personalization
of voting in post-communist Romania is blocked by the limited amount of data available,
especially for the first decade after the fall of communism. Basically, the number of
independent studies dedicated to voting behaviour between 1990 and 1999 is limited8, most
of the times batteries of questions referring to this phenomenon being included in broader
research endeavours. In this category, in terms of data consistency, we mention the Public
Opinion Barometers (BOP), a series of surveys funded by the Open Society Foundation
between 1994 and 20079, which constantly included a battery of questions focused on
voting intentions and confidence in public personalities. The last eight years were marked
by a more coherent presence of studies focused on voting behaviour10, but results are still
far from the place and significance given to this phenomenon in other democratic
countries.
In the attempt to analyze the personalization of electoral politics from a longitudinal
perspective we used the battery of political questions from the BOPs from 1995 to 2006, data
collected during 12 years and 4 electoral cycles. Given the characteristics of the data
available, we focused on indicators of behavioural intentionality and not on indicators of
8 Among these we shoud mention: the May 1990 exit poll by IRSOP and INFAS Bonn (coordinated by Petre Datculescu and Klaus Liepelt); two Septermber 1992 IRSOP surveys done with three weeks, respectively four days, before elections; the September 1992 exit poll by IRSOP and INFAS Bonn; the June-July 1993 survey by Science Center Berlin and Informatix România as part of the “Election Studies from Eastern Europe” project (coordinated by Georgeta Muntean); the “Romanian Political Culture” survey from Novermber-December 1996, which included a battery of questions for the “Comparative Study of Electoral Systems” (coordinated by Cătălin Baba, Gabriel Bădescu and Paul Sum). 9 Data collection by CURS, Metro Media Transilvania, Gallup România and LUAS. 10 Among these we should mention: the “Political Culture and Civic Engagement in Romania” study, November-December 2004, including the “Comparative Study of Electoral Systems” battery of questions (coordinated by Gabriel Bădescu); a study by the Romanian Society for Political Science (SRSP) - “Parties, Organizations, and Individual Actors: Behavior, Influence, and Political Recruitment” (coordinated by LaurenŃiu Ştefan, Aurelian Muntean, Răzvan Grecu and Andrei GheorghiŃă); as well as two dedicated Public Opinion Barometers, from October 2004 and November 2006.

15
actual political behaviour. More exactly, we focused on survey data collected regularly
(every three or six months), containing at least the following variables: declared voting
intentions for legislative and presidential elections, declared confidence in the political
leaders, socio-demographical variables. For the purposes of this analysis some variables
were subject to successive recoding. First, the dependent variable – ‘voting intention in the
legislative elections’ - was transformed, for each political party included in the analysis, in a
dummy variable, with two response categories: voting for the party X and voting for any
other party, with non-responses being eliminated. Only voting intention for political parties
deemed relevant11 was included in the analysis, taking into account political relevance
(represented in the parliament during the time interval analyzed) and electoral relevance
(cumulative, they cover over 95 percent of the voting intentions). Secondly, the
independent variable – ‘confidence in political leaders’12 – was transformed in a confidence in
political leaders score as follows: ‘a lot of confidence’ answers were associated with 2 points,
‘some confidence’ with 1 points, ‘little confidence’ with -1 point, ‘very little confidence’
with -2 points. Non-responses were excluded, as well as ‘I do not know him or her’
answers, which we interpreted as an indicator of lack of political visibility. Based on
individual scores, we built an index of confidence in a certain political leader, calculated as an
average between scores given to the respective individual by the entire sample at a certain
moment in time. The index obtained varies in the [-3; +2]13 interval, with positive values
reflecting a favourable level of confidence in the respective political leader and negative
values reflecting in an ‘average’ situation of social mistrust14. From the longitudinal
perspective, our analysis is structured on two levels. On the first level, dominantly
descriptive, we look at the evolution of the confidence in political leaders indexes for over a decade,
in connection with main political events. The second level is dedicated to the analysis of
11 From the relevant politcal parties we excluded the Democrat Union of Hungarians in Romania (Uniunea Democrată a Maghiarilor din România, UDMR), for reasons related to its exclusivelly ethnic electoral background. 12 Measured in the Public Opinion Barometers via a closed question, “How much trust do you have in the following political personalities: (a) a lot; (b) some; (c) little; (d) very little; (e) I do not know him or her; (f) I don’t know/Not responding?”. 13 The apparent disequilibrium of the index’s variation interval is due to a disequilibrium in the structure of the categories of answers provided to respondents in the POBs starting May 1999. There is a supplementary negative response category compared to older POBs, namely “not at all” to which no positive category corresponds. We associated -3 points to this category which, in case of 100 percent answers placed in this category, would lead to the index being equal with -3. 14 Traditional analyses of confidence in political personalities resource, for presentation purposes, to summing up the positive (confidence) and negative (no confidence) categories and comparing the totals as follows:: “x% of the population displays high and very high confidence in Z, while (100-x)%of the population displays low and very low confidence in the same personality”. The index used in this paper – in the formula presented above – has the obvious advantage of introducing a qualitative criterium into the final evaluation. Moreover, by obtaining single scores for each candidate ar a certain moment in time, the idenx allows for easier and nuanced comparison between the confidence scores of the political leaders.

16
the intensity of association between the index of confidence and voting intention for the political parties
represented by these leaders, as well as to variations in its intensity. It is obvious that, in
order to support the hypothesis of personalization of voting for legislative elections, we
expect a significant and dynamically relevant level of association.
The longitudinal study of the personalization of electoral politics is complemented
with a cross-sectional perspective on the phenomenon, focused on the November-December
2004 general elections. We chose to focus on this election due to the extremely dynamic
character of the electoral race, as well as due to availability of data issues. We are referring
to the ‘Political Culture and Civic Engagement in Romania’ (CPICR)15 national two-wave
(pre- and post-elections) panel study. The cross-sectional analysis tries to measure the ‘raw’
and ‘net’ effects of leader evaluations (independent variable, IV) on political parties’
evaluations and voting intentions (dependent variables, DV), by introducing them into
multiple regression models while controlling for alternative explanatory variables (socio-
demographics, party identification, retrospective evaluations). The proposed analysis is in
line with a more general improved-prediction strategy, being built on a logic similar to the one
proposed by Schmitt and Ohr (2000), and aims at explaining intentions to vote for the
main competitors in the 2004 general elections, namely the National Union PSD+PUR
(Uniunea NaŃională PSD+PUR, PSD+PUR)16 and the ‘Justice and Truth’ PNL-PD
Alliance (AlianŃa „Dreptate şi Adevăr” PNL-PD, ADA). We focus on two distinct
categories of regression models: the first test the effects of leader evaluations17 on the
perceptions of the political party, while the second tests the impact of leader evaluations on
the intention to vote for the political party represented by the leader. In the first category
of regression models the dependent variable (the evaluation of the political party) takes the
form of an evaluative 0-10 score of the liking/disliking toward the respective party18 and
we measure the raw impact of leader evaluations on party evaluation (R² of the model with
one dependent and one independent variable) or net impact (∆R² in multiple regression
15 Data collection was financed by joining several resources comming from the CNCSIS A 382/2004 grant - “Political Culture and Civic Engagement in Romania” (Gabriel Bădescu), research funds from Princeton University (Grigore Pop-Elecheş), Central European University (Marina Popescu) and OSI International Policy Fellowship (Aurelian Muntean), and the CNCSIS BD 85/2003 research scholarship (Andrei GheorghiŃă). 16 There are some differences in CPICR questions when referring to the National Union PSD+PUR. The question regarding the perception of political parties referrs strictly to the PSD (with no referrence to the alliance with PUR), while the question regarding voting intentions referrs explicitly to PSD+PUR. 17 Measured in CPICR through a closed question: “Please express your degree of liking for each of the following politicians”, on a scale from 0 to 4, where 0 means “I do not like him at all” and 4 is “I like him a lot”. 18 Measured in CPICR through a closed question: “I would like to know what you think about some of the political parties in Romania. After I read the name of a party please give a mark betwen 0 and 10, where 0 means you do not like that party at all and 10 means that you like it a lot”.

17
models). The net effect/impact is the increase of explained variation we obtain by
introducing leader evaluation as an independent variable in the multiple regression model
next to/together with other explanatory variables or, in other words, the increase in R²
obtained by introducing IV (compared to a similar model that only lacks the leader
evaluation IV). A similar strategy is behind the second category of regression models,
where we try to measure the raw and net effects of leader evaluation on the intention to
vote for a certain political party. In this case, the dependent variables are obtained by
dummy-zation of the categories of the closed question from the first CPICR wave19.
The choice of supplementary explanatory variables controlled for in the regression
models needs to be discussed separately. Naturally, there are two categories of criteria that
should guide such a choice: theoretical expectations (starting from alternative explanatory
models of voting) on the one side, and availability of data on the other side. A thorough
taking into account of both criteria led to the choice of three categories of explanatory
variables: (a) party identification variables (closeness to the political party, ideological distance,
voting in the last local elections); (b) retrospective evaluation of government activity variables
(evaluation of general government performance, evaluation of government performance in
fighting corruption) and (c) socio-demographic variables (age, region, residence in urban or
rural areas). A detailed explanation of the strategy for choosing and building these
explanatory variables can be found in Figure 2.
Summarizing, the following sections focus on three directions for analysis. First, we
look at the evolution of the confidence indexes in the political leaders, for the period 1995-2006, in a
dominantly descriptive manner. Secondly, we analyze the relationship between the confidence
in the political leaders and vote intentions for the party they represent, in an attempt to build an image
of the transfers of electoral capital between political leaders and their parties. Thirdly, we
try to measure the impact of leaders on the perception of and vote intensions for political parties.
19 Via building dichotomic variables with the categories: vote for party X and vote for any other party. Non-responses were eliminated.

18
Dimension Variables Values Construction A1. Closeness to political party
Score (0, 6)
The CPICR questionnaire uses a filter question – “Please tell me whether there is a political party you feel close to?”. This is followed by the “Which political party?” question, which gives the respondent the possibility to name up to three political parties. The closeness to a political party score is built as follows: 3 points if the political party or alliance is the first option, 2 points if it is the second option or 1 point if it is the last option. The closeness to a political party score varies from 0 (if the political party or alliance is not mentioned at all) to 6 (if an alliance is mentioned as such and two of the member parties are also mentioned). For example, if a respondent lists first ADA, then PNL, and then PD, his closeness to ADA score will be 3+2+1=6.
A2. Ideological distance
Distance (0, 10)
The CPICR questionnaire asks respondents to place themselves on a 0 to 10 left-right axis and to place political parties on the same axis. Ideological distance is calculated as a difference (module, positive) between the self-placement score and the score corresponding to the ideological placement attributed by the respondent to the respective political party. The smaller the ideological distance (difference), the higher the probability of voting for the respective political party.
A. Party identification
A3. Voting, last local elections
Dichotomy 0, 1
The answer to the closed question: “To which party belonged the candidate you voted for in the last local elections?” was dichotomized as follows: 1=voting for party X and 0=voting for any other party.
B1. Perception of government’s general performance
Score (1, 4)
Measured by the closed question: “Please think of the general government performance, how good or how bad do you think it was in the past 4 years?”. The answer categories were recoded as follows: 1=very bad, 2=bad, 3=good, 4=very good. Please note that this indicator measures the performance of the Adrian Năstase PSD government (2000-2004), which also included PUR ministers during the first three years in office.
B. Retrospective evaluation
B2. Perception of government performance in fighting corruption
Score (1, 4)
Measured by the closed question: “How do you think the current government performed in fighting corruption?”. Answer categories were recoded as follows: 1=very bad, 2=bad, 3=good, 4=very good. Please note that this indicator measures the performance of the Adrian Năstase PSD government (2000-2004).
C1. Age 18 - 102 Years old. C2. Historical region
Dichotomy 0, 1
Categories: Transilvania, Crişana-Maramureş, Banat, Oltenia, Muntenia, Dobrogea, Moldova, Bucureşti. For each region we built dichotomical variables, 1 = the individual lives in the Y region and 0=the individual lives in any other region.
C. Socio-demographic characteristics
C3. Residence
Dichotomy 0, 1
Categories: large city, over 200.000 inhabitants; city, 100-200.000 inhabitants; town, 30-100.000 inhabitants; very small town, under 30.000 inhabitants; village, capital of a commune (rural municipality); village. For each category we built dichotomical variables, 1= the individual lives in the Z area of residence and 0= the individual lives in any other area of residence.
Figure 2: Explanatory variables controlled for in the regression models. Data source: CPICR.

19
6. PARTY LEADERS’ PERCEPTIONS IN THE PUBLIC OPINION
A longitudinal analysis of survey data should explicitly reflect the social realities (and
the changes in social realities) that shape the particular moment of data gathering. Any
significant historical event is expected to bear some degree of influence upon the data.
Thus, the first level of the analysis is dedicated to a longitudinal perspective on the
evaluations of the main political leaders’ in the Public Opinion Barometer (POB) national
surveys.
An overview of the confidence indexes in the main political leaders calculated for the
1995-2006 period (Appendix 1) suggests the occurrence of significant variations over time.
Indexes vary between a minimum of -1,81 (Valeriu Stoica, May 2001) and a maximum of
+0,40 (Ion Iliescu, March 1995). Positive values are rare, only five political leaders being
able to score positively over a period of twelve years: Ion Iliescu, Emil Constantinescu,
Petre Roman, Teodor Meleşcanu, and Traian Băsescu. For the beginning, it should be
emphasized that, in the case of three of them, positive scores are related to the election
in/exercise of the presidential office, associated with the highest electoral legitimacy.
Furthermore, in the political evolution of each of the five political leaders there is a unique
positive peak over time. In other words, no matter how many or how large subsequent
variations might occur, a sub-zero descent from positive scores seems to be irreversible20,
none of the five leaders being able to score positively over two different periods of time
(separated in time by at least a negative value). Such beginning remarks suggest the
existence of a unique outburst of popularity/confidence in the career of a single high rank
politician, followed by a continuous erosive process of that political leader, which occurs
faster or slower. The fact that Ion Iliescu has his last positive confidence index in October
1996 and is defeated in the presidential elections only a few weeks later can not be ignored
at this point. Four years later he wins the presidential elections, although he does not score
positive in confidence again.
A hierarchy of political leaders for the interval of analysis is dominated by Ion Iliescu,
with continuous positive scores for two years (1995-1996), during the second half of his
presidential term 1992-1996: +0,40 in March 1995, +0,21 in June 1995, +0,35 in
September 1995, +0,28 in December 1995, +0,22 in July 1996, and +0,15 in October 1996.
Another leader scoring remarkably high on confidence indexes is Teodor Meleşcanu,
20 However, the evolution of confidence in Traian Băsescu deserves a closer look in the future, in order to identify potential changes in the pattern referred. For the remaining four leaders, a return to positive scores is highly unlikely, given their current ‘middle rank’ political activity.

20
president of a small opposition party, Alliance for Romania (ApR) (separated from the
former PDSR - Party of Social Democracy in Romania), during a post-election year (1997):
+0,08 in March 1997, +0,20 in June 1997. Corneliu Vadim Tudor, leader of Greater
Romania Party (PRM) has the most instable evolution of confidence scores during the
period of analysis, with significant oscillations. Although continuously scoring negative due
to a categorical rejection from specific categories in the electorate, Corneliu Vadim Tudor
has remarkable comebacks during the pre-electoral periods, both in 1996 (an increase of
0,21 points during the electoral year) and 2000 (an increase of 0,60). However, a similar
evolution in confidence scores did not occur before the 2004 presidential elections and the
PRM leader received only 12,57% of the votes, allowing many commentators to label him
an ‘expired political product’. Undoubtedly, the most spectacular evolution in our analysis
is that of Traian Băsescu, leader of the Democratic Party (PD), that enters the electoral year
of 2004 with the lowest confidence score in his entire top political career (-1,05 in October
2003), rises to -0,53 one year later, and reaches a maximum of +0,11 in May 2006, one year
and a half after winning the presidential elections.
-3,00
-2,50
-2,00
-1,50
-1,00
-0,50
0,00
0,50
1,00
1,50
2,00
June 1995
December 1995
July 1996
October 1996
June 1997
December 1997
May 1998
October 1998
May 1999
October 1999
May 2000
November 2000
May 2001
November 2001
May 2002
October 2002
May 2003
October 2003
May 2004
October 2004
May 2005
November 2005
May 2006
October 2006
Time
Co
nfi
den
ce i
nd
exes Ion Iliescu
Adrian Năstase
Emil Constantinescu
Petre Roman
Traian Băsescu
Corneliu VadimTudor
Figure 3: Evolution of confidence in the main political leaders, 1995-2006
Data source: POB 1995-2006.

21
Beyond such variations, that are more or less contextual, data show a general decline
in confidence given to political leaders, likely to be linked to an evolution in the electorate’s
experience and abilities to manage electoral information and contexts. For a period of
about eight years (beginning 1997 - November 2005), not a single political leader succeeded
to score positive on confidence indexes. After that period, Traian Băsescu is the only such
case of a politician scoring rather high on confidence.
Leaders of small parties are generally credited with lower scores of confidence than
those of big parties. There are rare exceptions (Teodor Meleşcanu, George Becali) from
that pattern, with rather inconsistent evolutions. On the other hand, leaders of big parties
experience a rapid erosion of confidence while being in office, followed by a slower rise
while being in opposition. However, this ascending evolution in opposition never returns
them the top level of confidence reached at the beginning of the previous electoral cycle.
Such an observation is highly consistent with our previous findings of a systematic erosion
of high rank political leaders, asking for a regular ‘freshening’ of political parties leadership.
7. IS THERE A LINK? CONFIDENCE IN POLITICAL LEADERS AND PARTY VOTE
The next section of this paper aims at measuring the statistical association between
voters’ evaluations of political leaders21 and the expressed party vote intention for the
period of analysis. Although it is impossible to speak about the directionality of the
relationship between the two variables, we expect higher values in the coefficients of
association22 to reflect peaks in the personalization of electoral politics for a specific
moment of time. Obviously, such coefficients of association are not stricto sensu measures of
the leadership effects; however they offer a valid insight into the dynamics of the
personalization phenomenon, into its trends and variations. Gamma (γ) coefficients for the
21 Measured as ‘confidence in political leaders’ in the Public Opinion Barometers 1995-2006. 22 Some of the readers of this paper might have serious doubts about the choice of Gamma (γ) coefficient, particularly suited for ordinal-level variables, in our analysis. However, our choice is based on epistemological arguments. As we have mentioned before, the ‘vote intention for parliamentary elections’ variable is subject to a dummy-zation process for each party that introduces some kind of ‘ordinal loading’ in the resulting dichotomic variables. In other words, we consider that the dichotomization process (as in A and non-A) introduces a particular type of ‘order’ in the otherwise nominal-level variable. In our case, we considered that the manifestation of a vote intention for Party A means ‘more’ than the absence of such an intention. Under these circumstances, we consider the Gamma coefficient to be appropriate enough for measuring the association between leader evaluations and party vote. However, for the readers rejecting such an argument, the same statistical association has also been measured using the contingency coefficients (C), as in Appendix 3.

22
association between ‘confidence in political leaders’ and ‘party vote for parliamentary
elections’ for the period 1995-2006 are presented in Appendix 2.
A first remark relates to the longitudinal distribution of values: it looks like the level
of personalization follows an ascendant pattern along an electoral cycle. Leadership effects
seem to face a fast decrease immediately after the elections. However, as elections are
closer, liking a particular leader converts to a growing degree into vote intention for his/her
party. Explanations for the sharp post-electoral decline in the personalization should be
placed in the particular framework of previous election’s results, namely separately for
winners and losers. In the case of the winners, holders of public offices, either newly
elected or re-elected, benefit of an extensive capital of confidence that, most of the times,
transcends partisan alignments (honeymoon effect). Such political leaders receive high
confidence scores that do not necessarily reflect into vote intention in favour of the parties
they represent. This situation will have as an immediate effect a decline in the coefficients
of association.
For the ‘losers’, the post-electoral situation is somehow reversed. The party gradually
decreases in vote intention, while its leader simply collapses in confidence scores. We might
actually speak of a ‘vote of non-confidence’ given to the leader by the party’s electorate,
that considers him/her responsible for the electoral defeat. Such is the case of Valeriu
Stoica and PNL in 2001, Adrian Năstase and PSD in 200523, and, to a certain degree, Ion
Iliescu and PDSR in 1997. Actually, it is about a reversed rationality of personalization, by
which leaders are sanctioned by their own party’s electorate.
The approaching of the electoral competition brings the highest personalization
levels for each of the parties in the analysis. Basically, the association between the vote
intention for parliamentary elections and confidence in political leaders follows an
ascending trend during the post-election period, with a maximum right before the moment
of the next electoral competition. Such a pattern is due not only to the rather normal
increase in the leader’s influence on the party vote (mainly because of the pre-election
extensive media coverage), but also to the clear identification of the candidate-leader
(actually the presidential candidate) in the public mind. Once a unique presidential
candidate is identified, an entire arsenal of likes or dislikes concerning other leaders of the
party (who suddenly become marginal) are projected towards him/her.
It is rather unclear whether the leader-party relationship works differently in the case
of alliances than of (individual) parties. Our expectations, based on previous findings
23 Although National Union PSD+PUR has won the parliamentary elections of 2004, PSD failed to enter the government coalition, mainly because of having lost the presidential elections.

23
(GheorghiŃă, 2004: 10), went towards lower leadership effects in the case of political
alliances, due to the aggregation of multiple bases of support in favour of the alliance. In
other words, the candidate-leader is necessarily a member of one of the allied parties and
can not enjoy unconditioned confidence from the supporters of the rest of the parties in
the alliance. On the other side, party alliances are built in pre-election periods, when the
level of personalization follows an ascending trend. For the whole period of existence of
the Democratic Convention (CDR), vote intention is strongly associated with the
confidence in its leader (first formal, later informal, as president of the country), Emil
Constantinescu, with Gamma coefficients varying between 0,600 and 0,863. For the same
interval, such values are lower than in the case of some individual parties (Greater Romania
Party - PRM or Party of Social Democracy - PDSR), but higher than those of the
Democratic Party (PD). On the other side, during the short existence of Social Democratic
Union (USD)24, personalization seems to be significantly higher than it was for the
Democratic Party (alliance’s main party), although they have the same leader, Petre Roman.
However, the last remark should be cautiously accepted, since USD as an electoral alliance
is built in an electoral year (1996), coinciding with a natural grow in Gamma coefficients
due to the elections’ approaching (0,448 in December 1995, 0,801 in July 1996, 0,799 in
October 1996).
Moment Political leader
Association with the vote in favour of
ADA
Association with support for the party
Difference
Traian Băsescu 0,613 PD 0,563 +0,050 October 2003
Theodor Stolojan 0,638 PNL 0,609 +0,029 Traian Băsescu 0,532 PD 0,490 +0,042
May 2004 Theodor Stolojan 0,722 PNL 0,570 +0,152 Traian Băsescu 0,587 PD 0,210 +0,377
May 2005 Călin Popescu Tăriceanu 0,428 PNL 0,145 +0,283 Traian Băsescu 0,625 PD 0,427 +0,198 November
2005 Călin Popescu Tăriceanu 0,287 PNL 0,470 -0,183
Traian Băsescu 0,488 PD 0,622 -0,134 May 2006
Călin Popescu Tăriceanu 0,296 PNL 0,398 -0,102
Traian Băsescu 0,485 PD 0,616 -0,131 October 2006
Călin Popescu Tăriceanu 0,163 PNL 0,457 -0,294
Table 2: Evolution of the statistical association between confidence in the leaders of the two parties forming ADA
(PNL and PD) and the vote intention for the alliance, respectively for the composing parties (Gamma coefficients)
Data source: POB October 2003-October 2006.
24 An alliance between the Democratic Party (PD) and the Romanian Social Democratic Party (PSDR) for the elections of 1996.

24
A less arguable case is that of the ‘Truth and Justice’ Alliance PNL-PD (ADA), that
lasts, similarly to former CDR, for a rather long period of time. During its effective
existence, Public Opinion Barometers have collected the vote intention by an open-ended
question, which allowed the respondents to express their support either for ADA as an
alliance, or for one of its composing parties, the National Liberal Party (PNL) or the
Democratic Party (PD). Obviously, there might be variations both in political preference
and political information between the respondents declaring their support for a specific
political party and those declaring it for the alliance to which that particular party belongs
to. However, in the general context of the leadership effects, a comparison between such
subsamples of voters is a must. It is surprising that, for the whole interval of non-
conflictual functioning of ADA, confidence in each of the two party leaders is more
intensely associated with the vote in favour of the alliance than of their own parties. That
conclusion is valid both for the Democrat leader Traian Băsescu and for the Liberal leaders
Theodor Stolojan and, later, Călin Popescu Tăriceanu. Nevertheless, it should be re-
emphasized here that coefficients are not calculated on the same voters, but on three non-
overlapping subsamples of voters, namely of ADA, PD, and PNL. Things radically change
at the moment when the sharp disagreements inside the ‘Truth and Justice’ Alliance (ADA)
come to the surface. A major reversal occurs: confidence in Călin Popescu Tăriceanu and,
shortly after, confidence in Traian Băsescu tends to associate more intensely with the
support for their own parties than for the alliance as a whole. What is the explanation of
such a phenomenon? A clear-cut answer beyond any speculation is impossible to give on
the available data. However, we can solidly assume that the key to the explanation of such
variations in the personalization of vote intention is related to the specific categories of
supporters of the two parties that move towards an electoral identification with the alliance
(during its ‘good times’, not necessarily electoral periods) and then slowly break off with it
(during ‘bad times’ of conflict inside the alliance). Furthermore, it is rather likely for this
‘fluctuant’ electorate to be much more ‘personalized’ in making up its vote option than the
rest of PNL and PD supporters. However, in the absence of panel data, the exploration of
such assumptions remains impossible.
Intention to vote for smaller parties, with no experience in office (PRM, ApR, PNG),
seems to be associated with leader evaluations to greater extent in comparison with parties
that made it to governmental structures. Since they are incapable of demonstrating
governmental effectiveness, small parties can only use image in order to mobilize electoral
resources, and their leaders are the only ones with the prospect of reaching an adequate

25
level of visibility. On the other hand, these are parties lacking a historical tradition, built
and developed around a leader, either starting from zero or via separation from another
party. The high level of personalization of voting for these parties is a natural consequence,
as the leader’s personality is the only electoral resource available and reliable for the
respective party.
0,000
0,200
0,400
0,600
0,800
1,000
June 1995
December 1995
July 1996
October 1996
June 1997
December 1997
May 1998
October 1998
May 1999
October 1999
May 2000
November 2000
May 2001
November 2001
May 2002
October 2002
May 2003
October 2003
May 2004
October 2004
May 2005
November 2005
May 2006
October 2006
Time
Gam
ma
coef
fici
ents
PSD/PDSR
CDR/CDR 2000
PD/USD
PRM
ApR
PNL
ADA
PNG
Figure 4: Evolution of leadership effects on vote intention for legislative elections, 1995-2006
(Statistical association between confidence in the main political leaders and vote intention for their parties. Gamma
coefficients)
Data source: POB 1995-2006.
Greater Romania Party (PRM) seems to reach the highest degree of personalization
among the relevant parties. During the 12 years analysed, the intensity of association
between the level of confidence in the leader, Corneliu Vadim Tudor, and the intention to
vote for the party, goes below 0,80 only two times, both at the beginning of an electoral
cycle (0,773 in March 1997 and, respectively, 0,795 in December 1997). The PRM leader
seems to be the political personality that performs best in the effort of mobilizing his liking
capital in favour of his party. The party is identified with the leader; it does not offer
alternative political figures. C.V. Tudor can either be loved or hated, and the first situation
automatically translates into votes for PRM. Symbolically speaking, the party is a ‘rostrum’

26
without which the ‘tribune’ can not be heard and voting for the party is connected with the
perpetuation of the leader’s discursive narchoticisms.
A very similar tendency seems to be consolidating in the case of another party, the
PNG25. For many years a party lacking electoral relevance, PNG sees an increase in voting
intentions following the election as party leader of George Becali, highly controversial
business man and owner of a football club. Even though lacking any political experience at
the moment of ‘taking over’ the party, Becali is a highly visible personality in the national
media, due to his connection with football. He successfully manages to convert an image of
managerial competence in football, a very popular sport, into political confidence, having a
remarkable ascension (Comşa, 2006; GheorghiŃă, 2006). At this moment, it is too early to
speak about the extent to which George Becali manages to convert his personal confidence
capital in votes for his party. Nevertheless, after the arrival of Becali, PNG saw a
remarkable increase in vote intentions (5 percent according to the October 2006 POB), and
leader effects for this party are among the highest, comparable to the case of PRM (0,921
in May 2006, 0,893 in October 2006).
8. LEADERS’ IMPACT ON VOTE INTENTIONS IN THE 2004 LEGISLATIVE ELECTIONS
Estimating the ‘real’ impact of political leaders on party vote remains, no matter the
case, a very difficult mission. The analysis of association coefficients between leader
evaluations and vote intentions in the legislative elections allows for identification of trends
and dynamics of the phenomenon, but not for stricto sensu measurement of leader effects. It
is very likely that such a strategy overestimates the intensity of these effects (Schmitt and
Ohr, 2000: 16), given its incapacity to isolate the influence of a leader’s personal
characteristics from influences over voting due to some other inter-related factors, such as
party identification, group loyalties, ideological preference or satisfaction with prior
performance of the respective party. In the attempt to isolate authentic leader effects from
other categories of influences, we resorted to a design based on bi- and multivariate
regression models on CPICR data, using voter evaluation of the political party and voting
intention for the political party as dependent variables. The R² coefficient calculated in
bivariate models offers us an image of the raw effects of leaders’ personal characteristics on
the voting intention for legislative elections, when we are not controlling for
25 New Generation Party (Partidul Noua GeneraŃie, PNG), currently New Generation Party - Christian Democrat (Partidul Noua GeneraŃie - Creştin Democrat, PNG-CD).

27
complementary explanatory variables. Multivariate regression allows for an increase in the
explained variance by simultaneously entering the leader evaluations and the alternative
explanatory variables into a single model, thus controlling for the effects of the latter. The
difference between the adjusted R² (∆R²) calculated for the model offering the maximum
level of explained variance and the same coefficient calculated for a similar model, but
without leader evaluations as an independent variable, will provide us with an adequate
measure of the net leadership effects on the dependent variable. The ∆R² thus calculated must
be interpreted as the additional variance in the dependent variable (party evaluation in the
first category of models, voting intentions in the second category) explained by the
popularity of the political leader (IV), while controlling for the party/ideological
identification, retrospective evaluations of government activity an the voter’s positioning in
the social structure. The regression models, as well as the results of the analysis, are
synthesized in tables 3, 4, 5, and 6.
A few general remarks are required. First, data confirm the existence of a significant
impact of leader evaluations on the liking capital of a political party, and also on the intention to
vote for that party. Bivariate analyses indicate significant values of raw effects in the case of
both alliances studied here, PSD+PUR (0,625 respectively 0,556) and ADA (0,414
respectively 0,393). Basically, without controlling for the effects of other explanatory
variables, variations in liking Adrian Năstase account for 62,5 percent from the variance of
the popularity of the alliance he represents. The effect of Traian Băsescu on ADA, even if
lower, it is not negligible as the evaluation of his personal characteristics by the voters
accounts for 41,4 percent from the variance in liking for the alliance. Voting for
PSD+PUR is sensibly more personalized than voting for ADA. It is difficult to say what
are the reasons for such a difference but, all together, Adrian Năstase is sensibly more
efficient than Traian Băsescu in transferring his popularity (but also his unpopularity)
towards his own political party. Amongst the potential explanations of such a
phenomenon, purely speculative at this moment, we mention: higher visibility given by the
prime-ministerial office, greater unity of the political alliance led by Năstase (a large party and an
almost invisible one) compared to the one led by Băsescu (two parties almost equal in
voting intentions, divided by historical disagreements), the dominant position of PSD in
broadcasting media content, as well as the late nomination of the PD leader as ADA
candidate for the presidential office.

28
Independent variable
Leader evaluation
Party/Ideological identification
Retrospective evaluations of government performance
Socio-demographic characteristics
Dependent variable Score leader
popularity
(0-4)
Closeness to
the party
Ideological
distance
Vote in the
last local
elections
Perception of
general gvt.
performance
Perception of
gvt.
performance
in fighting
corruption
Bucureşti
Oltenia
Age
Rural
Very large
urban
R² adjusted
Model 1† (0,791) ■ ■ ■ ■ ■ ■ ■ ■ ■ ■ 0,625 Model 2 ■ 0,313 -0,233 0,345 ■ ■ ■ ■ ■ ■ ■ 0,453 Model 3 ■ ■ ■ ■ 0,233 0,318 ■ ■ ■ ■ ■ 0,235 Model 4 ■ ■ ■ ■ ■ ■ -0,059 0,063 0,134 0,060 -0,065 0,044 Model 5 ■ 0,252 -0,150 0,289 0,107 0,241 0,049 0,018 0,028 0,052 -0,023 0,540
Popularity National Union PSD+PUR
Model 6 0,561 0,067 -0,094 0,136 0,064 0,125 0,020 0,018 0,001 0,047 0,006 0,695
Model 1† (0,746) ■ ■ ■ ■ ■ ■ ■ ■ ■ ■ 0,556 Model 2 ■ 0,380 -0,134 0,431 ■ ■ ■ ■ ■ ■ ■ 0,571 Model 3 ■ ■ ■ ■ 0,165 0,331 ■ ■ ■ ■ ■ 0,197 Model 4 ■ ■ ■ ■ ■ ■ ■ ■ ■ ■ ■ ■ Model 5 ■ 0,358 -0,061 0,418 -0,023 0,206 ■ ■ ■ ■ ■ 0,627
Voting intention National Union PSD+PUR
Model 6 0,407 0,223 -0,009 0,296 -0,051 0,127 ■ ■ ■ ■ ■ 0,703
Table 3: Explanatory models of voter evaluation of the National Union PSD+PUR and voting intention for the National Union PSD+PUR.
Standardized (beta coefficients), OLS regression Source of data: CPICR, November 2004
Note: † Bivariate OLS regression.

29
Independent variable Leader
evaluation Party/Ideological identification
Retrospective evaluations of government performance
Socio-demographic characteristics
Dependent variable Score leader
popularity
(0-4)
Closeness to
the party
Ideological
distance
Vote in the
last local
elections
Perception of
general gvt.
performance
Perception of
gvt.
performance
in fighting
corruption
Dobrogea
Very large
urban
R² adjusted
Model 1† (0,644) ■ ■ ■ ■ ■ ■ ■ 0,414 Model 2 ■ 0,286 -0,248 0,259 ■ ■ ■ ■ 0,340 Model 3 ■ ■ ■ ■ -0,108 -0,092 ■ ■ 0,025 Model 4 ■ ■ ■ ■ ■ ■ ■ ■ ■ Model 5 ■ 0,255 -0,228 0,251 -0,089 -0,040 0,025 0,045 0,349
Popularity ‘Truth and Justice’ Alliance PNL-PD
Model 6 0,454 0,135 -0,147 0,141 -0,032 -0,025 0,032 0,020 0,484
Model 1† (0,627) ■ ■ ■ ■ ■ ■ ■ 0,393 Model 2 ■ 0,384 -0,099 0,440 ■ ■ ■ ■ 0,552 Model 3 ■ ■ ■ ■ ■ ■ ■ ■ ■ Model 4 ■ ■ ■ ■ ■ ■ ■ ■ ■ Model 5 ■ ■ ■ ■ ■ ■ ■ ■ ■ Model 6 0,268 0,298 -0,048 0,368 ■ ■ ■ ■ 0,599
Voting intention ‘Truth and Justice’ Alliance PNL-PD
Model 6.2 0,310 0,271 ■ 0,385 ■ ■ ■ ■ 0,605
Table 4: Explanatory models of voter evaluation of the “Justice and Truth” Alliance PNL-PD and voting intention for the ‘Truth and Justice’ Alliance PNL-PD. Standardized (beta coefficients), OLS regression Source of data: CPICR, November 2004
Note: † Bivariate OLS regression.

30
Secondly, if we look at it in multivariate analyses in relation with other explanatory
dimensions (model 6, in Tables 3 and 4; model 2c in Table 5; model 2d in Table 6), the
evaluation of political leaders is the variable with the highest or second highest explanatory potential in all
the situations. In other words, the popularity of the political leader has a significant
influence over the liking capital of the political party or vote intention in both cases.
Dependent variable: Vote intention for the National Union PSD+PUR Predictors B Wald Exp(B) Overall Model 1c -2LL=719,080 Leader evaluation (Adrian Năstase) 1,682 303,359 5,374 R² Cox & Snell=0,505 R² Nagelkerke=0,675 Model 2c Leader evaluation (Adrian Năstase) 1,056 49,481 2,875 Party closeness 0,895 34,851 2,448 Ideological distance -0,009 0,013 0,991 Vote in the local elections 2,313 43,049 10,106 Perception of general PSD gvt. performance -0,174 0,409 0,840 Perception of PSD gvt. performance in fighting corruption
0,872 10,202 2,392
Bucureşti 0,690 1,083 1,994 Oltenia -0,800 2,664 0,449 Age 0,010 0,905 1,010 -2LL=252,898 Rural -0,050 0,015 0,952 R² Cox & Snell=0,608 Urban very large -0,949 3,322 0,387 R² Nagelkerke=0,812
Table 5: Explanatory models of vote intention for National Union PSD+PUR
Binary logit regression
Data source: CPICR, November 2004.
Thirdly, the net or ‘pure’ effects of the leader on the party are significant in the case of
both competitors disputing victory in the November 2004 general elections. The evaluation
of leaders’ personal characteristics, if we control for the party identification, retrospective
evaluations and socio-demographic characteristics, improves the prediction (∆R²) with 13,5
percent, respectively 15,5 percent in the case of the liking capital of the party. The impact is
highly remarkable if we look at it in context of the extreme multidimensionality of
motivation of electoral decisions.

31
Dependent variable: Vote intention for the ‘Truth and Justice’ Alliance PNL-PD Predictors B Wald Exp(B) Overall Model 1d -2LL=891,256 Leader evaluation (Traian Băsescu) 1,389 273,590 4.012 R² Cox & Snell=0,381 R² Nagelkerke=0,520 Model 2d Leader evaluation (Traian Băsescu) 0,789 43,297 2,201 Party closeness 0,635 36,902 1,887 Ideological distance -0,144 3,384 0,866 Vote in the local elections 2,028 46,887 7,600 Perception of general PSD gvt. performance -0,286 1,935 0,751 Perception of PSD gvt. performance in fighting corruption
-0,255 2,907 0,775 -2LL=346,143
Dobrogea 0,682 1,138 1,979 R² Cox & Snell=0,521 Urban very large 0,435 2,217 1,545 R² Nagelkerke=0,704
Table 6: Explanatory models of vote intention for the ‘Truth and Justice’ Alliance PNL-PD
Binary logit regression
Data source: CPICR, November 2004.
9. CONCLUSIONS
The present analysis focused on direct electoral effects of political leaders (as a result
of their personal characteristics and behaviour) on voting patterns for legislative elections.
In brief, we tried to assess the dynamics and intensity of the personalization of electoral
politics in a context defined by unclear expectations, that of post-communist Romania. The
analytical strategy used combined the longitudinal analysis of survey data for a period of 12
years, covering 4 electoral cycles, with cross-sectional analysis of data (CPICR) collected for
the 2004 legislative elections. Next, we shall briefly overview the main conclusions of this
analysis:
(1) The personalization of the voting decision is moderate in the Romanian social and
political context, and comparable with the level of personalization from other European
democracies. We can identify some variation from one moment of time to another and
from one political party to another.
(2) The degree of personalization is ascendant during an electoral cycle and is
significantly enhanced in the pre-election period.
(3) The personality of the political leader seems to be the most important cognitive
shortcut used by Romanian voters for evaluating political parties in pre-election moments.
(4) Voting intention is more personalized for small political parties, lacking
governmental experience, than for larger parties or political alliances.

32
(5) We observe a general tendency of leaders’ ‘erosion’ during the analyzed interval.
The general level of confidence in political leaders is in constant decline, positive values for
confidence indexes are rare in the last decade.
(6) Mainstream political leaders seem to encounter an unique explosion of popularity
during their career, followed by a faster or slower, more or less sinuous, erosion.
Spectacular comebacks of political leaders seem highly improbable (even impossible) once
the confidence indexes drop sub-zero.

33
REFERENCES:
Bean, Clive and Anthony Mughan (1989) “Leadership Effects in Parliamentary Elections in
Australia and Britain”, in The American Political Science Review, vol. 83, no. 4, pp. 1165-
1179.
Carey, John M. and Matthew Soberg Shugart (1995) “Incentives to Cultivate a Personal
Vote: a Rank Ordering of Electoral Formulas”, in Electoral Studies, vol. 14, no. 4, pp.
417-439.
Coman, Mihai (2003) Mass media în România post-comunistă, Iaşi: Polirom.
Comşa, Mircea (2006) “De la «Statul Părinte» la «Părintele Becali»”, in Barometrul de Opinie
Publică Octombrie 2006. Profiluri electorale, Bucureşti: FundaŃia pentru o Societate Deschisă,
pp. 55-65.
Crewe, Ivor and Anthony King (1994) “Are British Elections Becoming More
«Presidential»?”, in M. Kent Jennings and Thomas E. Mann (eds.), Elections at Home and
Abroad. Essays in Honor of Warren E. Miller, Ann Arbor: The University of Michigan
Press, pp. 181-206.
Curtice, John and André Blais (2001) “Follow My Leader? A Cross-National Analysis of
Leadership Effects in Parliamentary Democracies”, CREST Working Paper no. 91,
Oxford: University of Oxford, September 2001.
Deleanu, Ion (1998a) InstituŃii şi proceduri constituŃionale, Vol. I, Arad: Editura Servo-Sat.
Deleanu, Ion (1998b) InstituŃii şi proceduri constituŃionale, Vol. II, Arad: Editura Servo-Sat.
Gidengil, Elisabeth, André Blais, Richard Nadeau, and Neil Nevitte (2000) “Are Party
Leaders More Important To Vote Choice in Canada?”, paper presented at the 2000
Annual Conference of the American Political Science Association, Washington DC,
August 31st - September 3rd.
GheorghiŃă, Andrei (2006) “Lideri politici şi electorat”, in Barometrul de Opinie Publică
Octombrie 2006. Profiluri electorale, Bucureşti: FundaŃia pentru o Societate Deschisă, pp.
41-52.
GheorghiŃă, Andrei (2004) “Măsurarea fenomenului personalizării în politica românească:
impactul liderilor asupra intenŃiei de vot 1995-2003”, in Studia Universitatis Babeş-Bolyai.
Seria Politica, no. 1, pp. 3-20.
Hallin, Daniel C. (2000) “Commercialism and Professionalism in the American News
Media”, in James Curran and Michael Gurevitch (eds.), Mass Media and Society, London:
Arnold Publishers, pp. 218-237.

34
Jenssen, Anders Todal and Toril Aalberg (2006) “Party-Leader Effects in Norway: A Multi-
Methods Approach”, in Electoral Studies, vol. 25, nr. 2, pp. 248-269.
Kaase, Max (1994) “Is There Personalization in Politics? Candidates and Voting Behavior
in Germany”, in International Political Science Review, vol. 15, no. 3, pp. 211-230.
King, Anthony (2002) “Do Leaders’ Personalities Really Matter?”, in Anthony King (ed.),
Leaders’ Personalities and the Outcomes of Democratic Elections, Oxford: Oxford University
Press, pp. 1-43.
Kircheimer, Otto (1966) “The Transformation of the West European Party Systems”, in
Joseph LaPalombara and Myron Weiner (eds.), Political Parties and Political Recruitement,
Princeton: Princeton University Press, pp. 177-200.
Kitschelt, Herbert (1995) “Formation of Party Cleavages in Post-Communist
Democracies”, in Party Politics, vol. 1, no. 4, pp. 447-472.
Linz, Juan J. and Alfred Stepan (1996) Problems of Democratic Transition and Consolidation,
Baltimore: The Johns Hopkins University Press.
McAllister, Ian (2007) “The Personalization of Politics”, in Russell J. Dalton şi Hans-Dieter
Klingemann (eds.), The Oxford Handbook of Political Behavior, Oxford: Oxford University
Press, pp. 571-588.
McAllister, Ian (1996) “Leaders”, in Lawrence LeDuc; Richard G. Niemi, and Pippa Norris
(eds.), Comparing Democracies. Elections and Voters in Global Perspective, Thousand Oaks:
Sage Publications, pp. 280-298.
Miller, Warren E. and J. Merrill Shanks (1996) The New American Voter, Cambridge: Harvard
University Press.
Miller, Warren E. and J. Merrill Shanks (1982) “Policy Directions and Presidential
Leadership: Alternative Interpretations of the 1980 Presidential Election”, in British
Journal of Political Science, vol. 12, no. 3, pp. 299-356.
Mughan, Anthony (2000) Media and The Presidentialization of Parliamentary Elections,
Houndmills: Palgrave.
Pasquino, Gianfranco (2002) Curs de ştiinŃă politică, Iaşi: Institutul European.
Poguntke, Thomas and Paul Webb (2005) “The Presidentialization of Politics in
Democratic Societies: A Framework for Analysis”, in Thomas Poguntke and Paul
Webb (eds.), The Presidentialization of Politics. A Comparative Study of Modern Democracies,
Oxford: Oxford University Press & ECPR.
Popkin, Samuel L. (1994) The Reasoning Voter. Communication and Persuasion in Presidential
Campaigns, Chicago: The University of Chicago Press.

35
Rosenberg, Shawn W., Lisa Bohan, Patrick McCafferty, and Kevin Harris (1986) “The
Image and the Vote: The Effect of Candidate Presentation on Voter Preference”, in
American Journal of Political Science, vol. 30, nr. 1, pp. 108-127.
Schmitt, Hermann şi Dieter Ohr (2000) “Are Party Leaders Becoming More Important in
German Elections? Leader Effects on the Vote in Germany, 1961-1998”, paper
presented at the 2000 Annual Conference of the American Political Science
Association, Washington DC, August 31st - September 3rd.
Schwartzenberg, Roger-Gérard (1995) Statul spectacol. Eseu asupra şi împotriva star-sistemului în
politică, Bucureşti: Editura Scripta.
Shanks, J. Merrill and Warren E. Miller (1990) “Policy Direction and Performance
Evaluation: Complementary Explanations of the Reagan Elections”, in British Journal of
Political Science, vol. 20, no. 2, pp. 143-235.
Shanks, J. Merrill and Warren E. Miller (1991) “Partisanship, Policy and Performance: The
Reagan Legacy in the 1988 Election”, in British Journal of Political Science, vol. 21, no. 2,
pp. 129-197.
Siaroff, Alan (2003) “Comparative Presidencies: The Inadequacy of the Presidential, Semi-
presidential and Parliamentary Distinction”, în European Journal of Political Research, vol.
42, no. 3, pp. 287-312.
Ştefuriuc, Irina (2003) “Campaign Presidentialization and Personal Voting in Romania: A
Longitudinal Analysis, 1995-2002”, in The Romanian Journal of Society and Politics, vol. 3,
no. 2.
Tóka, Gábor (2000) Inventory of Political Attitude and Behaviour Surveys in East Central Europe
and the former Soviet Union 1989-1997, Bergisch Gladbach: E. Ferger Verlag.
Wattenberg, Martin P. (1991) The Rise of Candidate-Centered Politics. Presidential Elections of the
1980s, Cambridge: Harvard University Press.

36
Appendix 1: Confidence indexes for the main political leaders, 1995-2006
Political parties Period PDSR/PSD/
PSD+PUR CDR/CDR
2000 PD/USD PRM PNL ApR ADA PNG E
lectoral
cycle
Iliescu Constantinescu Roman Tudor * * * * March 1995 +0,400 -0,001 +0,036 -0,270 * * * *
a
Iliescu Constantinescu Roman Tudor * * * * June 1995 +0,210 -0,140 -0,130 -0,280 * * * *
a
Iliescu Constantinescu Roman Tudor * * * * September 1995 +0,350 +0,059 +0,058 -0,330 * * * *
a
Iliescu Constantinescu Roman Tudor * * * * December 1995 +0,280 +0,071 +0,083 -0,520 * * * *
a
Iliescu Constantinescu Roman Tudor * * * * July 1996 +0,220 +0,380 +0,430 -0,460 * * * *
a
Iliescu Constantinescu Roman Tudor * * * * October 1996 +0,150 +0,350 +0,520 -0,310 * * * *
a
Elections
Iliescu Constantinescu Roman Tudor * Meleşcanu * * March 1997 -0,356 +0,260 -0,343 -0,438 * +0,080 * *
b
Iliescu Constantinescu Roman Tudor * Meleşcanu * * June 1997 -0,743 +0,197 -0,432 -0,613 * +0,205 * *
b
Iliescu Constantinescu Roman Tudor * Meleşcanu * * September 1997 -0,526 +0,114 -0,406 -0,389 * -0,043 * *
b
Iliescu Constantinescu Roman Tudor * Meleşcanu * * December 1997 -0,874 +0,066 -0,532 -0,610 * -0,094 * *
b
Iliescu Constantinescu Roman Tudor * Meleşcanu * * May 1998 -0,703 -0,326 -0,710 -0,659 * -0,195 * *
b
Iliescu Constantinescu Roman Tudor * Meleşcanu * * October 1998 -0,551 -0,486 -0,785 -0,498 * -0,237 * *
b
Iliescu Constantinescu Roman Tudor * Meleşcanu * * May 1999 -0,366 -0,662 -0,866 -0,924 * -0,126 * *
b

37
Iliescu Constantinescu Roman Tudor * Meleşcanu * * October 1999 -0,286 -1,111 -1,091 -1,037 * -0,314 * *
b
Iliescu Isărescu Roman Tudor * Meleşcanu * * May 2000 -0,272 -0,133 -1,051 -0,778 * -0,333 * *
b
Iliescu Isărescu Roman Tudor Stolojan Meleşcanu * * November 2000 -0,003 -0,349 -1,109 -0,435 -0,438 -0,967 * *
b
Elections
Năstase * Băsescu Tudor Stoica Meleşcanu * * May 2001 -0,135 * -0,022 -1,273 -1,812 ? * *
c
Năstase * Băsescu Tudor Stoica Meleşcanu * * November 2001 -0,154 * -0,273 -1,723 -1,701 ? * *
c
Năstase * Băsescu Tudor Stoica Meleşcanu * * May 2002 -0,310 * -0,630 -1,620 -1,780 ? * *
c
Năstase * Băsescu Tudor Stolojan * * * October 2002 -0,360 * -0,470 -1,480 -0,530 * * *
c
Năstase * Băsescu Tudor Stolojan * * * May 2003 -0,810 * -0,880 -1,750 -0,910 * * *
c
Năstase * Băsescu Tudor Stolojan * Stolojan/Băsescu * October 2003 -0,780 * -1,050 -1,660 -0,890 * -0,890/-1,050 *
c
Năstase * Băsescu Tudor Stolojan * Stolojan/Băsescu * May 2004 -0,280 * -0,940 -1,530 -0,750 * -0,750/-0,940 *
c
Năstase * Băsescu Tudor Stolojan * Stolojan/Băsescu * October 2004 -0,610 * -0,530 -1,540 -0,460 * -0,460/-0,530 *
c
Elections
Năstase * Băsescu/Boc Tudor Tăriceanu * Tăriceanu/Băsescu * May 2005 -1,420 * -0,020/-1,170 -1,790 -0,680 * -0,680/-0,020 *
d
Geoană * Băsescu/Boc Tudor Tăriceanu * Tăriceanu/Băsescu * November 2005 -0,710 * +0,001/-0,960 -1,030 -0,780 * -0,780/+0,001 *
d
Geoană * Băsescu/Boc Tudor Tăriceanu * Tăriceanu/Băsescu Becali May 2006 -0,940 * +0,110/-1,080 -1,030 -0,970 * -0,970/+0,110 -0,810
d
Geoană * Băsescu/Boc Tudor Tăriceanu * Tăriceanu/Băsescu Becali October 2006 -1,300 * -0,050/-1,580 -1,640 -1,460 * -1,460/-0,050 -1,020
d

38
Appendix 2: Association between confidence in political leaders and vote intention in favour of their parties (Gamma coefficients), 1995-2006.
Political parties Period PDSR/PSD/
PSD+PUR CDR/CDR
2000 PD/USD PRM PNL ApR ADA PNG E
lectoral
cycle
Iliescu Constantinescu Roman Tudor * * * * March 1995 0,647 0,628 0,483 0,849 * * * *
a
Iliescu Constantinescu Roman Tudor * * * * June 1995 0,752 0,693 0,615 0,845 * * * *
a
Iliescu Constantinescu Roman Tudor * * * * September 1995 0,717 0,703 0,504 0,833 * * * *
a
Iliescu Constantinescu Roman Tudor * * * * December 1995 0,765 0,693 0,448 0,865 * * * *
a
Iliescu Constantinescu Roman Tudor * * * * July 1996 0,814 0,733 0,801 0,935 * * * *
a
Iliescu Constantinescu Roman Tudor * * * * October 1996 0,867 0,863 0,799 0,889 * * * *
a
Elections
Iliescu Constantinescu Roman Tudor * Meleşcanu * * March 1997 0,793 0,750 0,527 0,773 * * * *
b
Iliescu Constantinescu Roman Tudor * Meleşcanu * * June 1997 0,867 0,760 0,553 0,874 * * * *
b
Iliescu Constantinescu Roman Tudor * Meleşcanu * * September 1997 0,731 0,676 0,472 0,813 * 0,600 * *
b
Iliescu Constantinescu Roman Tudor * Meleşcanu * * December 1997 0,790 0,758 0,653 0,795 * 0,666 * *
b
Iliescu Constantinescu Roman Tudor * Meleşcanu * * May 1998 0,862 0,600 0,721 0,859 * 0,777 * *
b
Iliescu Constantinescu Roman Tudor * Meleşcanu * * October 1998 0,702 0,628 0,733 0,825 * 0,685 * *
b
Iliescu Constantinescu Roman Tudor * Meleşcanu * * May 1999 0,797 0,731 0,768 0,884 * 0,737 * *
b

39
Iliescu Constantinescu Roman Tudor * Meleşcanu * * October 1999 0,896 0,857 0,806 0,947 * 0,809 * *
b
Iliescu Isărescu Roman Tudor * Meleşcanu * * May 2000 0,852 0,260 0,751 0,851 * 0,823 * *
b
Iliescu Isărescu Roman Tudor Stolojan Meleşcanu * * November 2000 0,915 0,765 0,847 0,864 0,823 0,814 * *
b
Elections
Năstase * Băsescu Tudor Stoica Meleşcanu * * May 2001 0,624 * 0,618 0,813 0,531 ? * *
c
Năstase * Băsescu Tudor Stoica Meleşcanu * * November 2001 0,602 * 0,728 0,945 0,560 ? * *
c
Năstase * Băsescu Tudor Stoica Meleşcanu * * May 2002 0,723 * 0,688 0,905 0,543 ? * *
c
Năstase * Băsescu Tudor Stolojan * * * October 2002 0,669 * 0,832 0,832 0,613 * * *
c
Năstase * Băsescu Tudor Stolojan * * * May 2003 0,677 * 0,684 0,869 0,698 * * *
c
Năstase * Băsescu Tudor Stolojan * Stolojan/Băsescu * October 2003 0,737 * 0,563 0,840 0,609 * 0,638/0,613 *
c
Năstase * Băsescu Tudor Stolojan * Stolojan/Băsescu * May 2004 0,813 * 0,490 0,909 0,570 * 0,722/0,532 *
c
Năstase * Băsescu Tudor Stolojan * Stolojan/Băsescu * October 2004 0,909 * ? 0,942 ? * 0,762/0,718 *
c
Elections
Năstase * Băsescu/Boc Tudor Tăriceanu * Tăriceanu/Băsescu * May 2005 0,822 * 0,210/0,246 0,852 0,145 * 0,428/0,587 *
d
Geoană * Băsescu/Boc Tudor Tăriceanu * Tăriceanu/Băsescu * November 2005 0,598 * 0,427/0,282 0,835 0,470 * 0,287/0,625 *
d
Geoană * Băsescu/Boc Tudor Tăriceanu * Tăriceanu/Băsescu Becali May 2006 0,646 * 0,622/0,125 0,928 0,398 * 0,296/0,488 0,921
d
Geoană * Băsescu/Boc Tudor Tăriceanu * Tăriceanu/Băsescu Becali October 2006 0,642 * 0,616/0,321 0,927 0,457 * 0,163/0,485 0,893
d

40
Appendix 3: Association between confidence in political leaders and vote intention in favour of their parties (contingency coefficients), 1995-2006.
Political parties
Period PDSR/PSD/ PSD+PUR
CDR/CDR 2000
PD/USD PRM PNL ApR ADA PNG Electoral
cycle
Iliescu Constantinescu Roman Tudor * * * * March 1995 0,375 0,324 0,224 0,363 * * * *
a
Iliescu Constantinescu Roman Tudor * * * * June 1995 0,434 0,418 0,261 0,449 * * * *
a
Iliescu Constantinescu Roman Tudor * * * * September 1995 0,426 0,375 0,211 0,300 * * * *
a
Iliescu Constantinescu Roman Tudor * * * * December 1995 0,436 0,425 0,171 0,403 * * * *
a
Iliescu Constantinescu Roman Tudor * * * * July 1996 0,467 0,407 0,401 0,370 * * * *
a
Iliescu Constantinescu Roman Tudor * * * * October 1996 0,490 0,483 0,416 0,391 * * * *
a
Elections
Iliescu Constantinescu Roman Tudor * Meleşcanu * * March 1997 0,486 0,491 0,211 0,286 * * * *
b
Iliescu Constantinescu Roman Tudor * Meleşcanu * * June 1997 0,527 0,488 0,212 0,442 * * * *
b
Iliescu Constantinescu Roman Tudor * Meleşcanu * * September 1997 0,447 0,415 0,164 0,375 * 0,155 * *
b
Iliescu Constantinescu Roman Tudor * Meleşcanu * * December 1997 0,467 0,473 0,299 0,421 * 0,259 * *
b
Iliescu Constantinescu Roman Tudor * Meleşcanu * * May 1998 0,519 0,373 0,356 0,459 * 0,317 * *
b
Iliescu Constantinescu Roman Tudor * Meleşcanu * * October 1998 0,422 0,380 0,371 0,452 * 0,226 * *
b
Iliescu Constantinescu Roman Tudor * Meleşcanu * * May 1999 0,517 0,441 0,348 0,447 * 0,348 * *
b

41
Iliescu Constantinescu Roman Tudor * Meleşcanu * * October 1999 0,590 0,528 0,450 0,557 * 0,412 * *
b
Iliescu Isărescu Roman Tudor * Meleşcanu * * May 2000 0,552 0,108 0,275 0,443 * 0,405 * *
b
Iliescu Isărescu Roman Tudor Stolojan Meleşcanu * * November 2000 0,603 0,333 0,427 0,493 0,429 0,507 * *
b
Elections
Năstase * Băsescu Tudor Stoica Meleşcanu * * May 2001 0,395 * 0,246 0,472 0,223 ? * *
c
Năstase * Băsescu Tudor Stoica Meleşcanu * * November 2001 0,410 * 0,315 0,569 0,267 ? * *
c
Năstase * Băsescu Tudor Stoica Meleşcanu * * May 2002 0,464 * 0,340 0,340 0,202 ? * *
c
Năstase * Băsescu Tudor Stolojan * * * October 2002 0,430 * 0,366 0,366 0,284 * * *
c
Năstase * Băsescu Tudor Stolojan * * * May 2003 0,444 * 0,332 0,533 0,395 * * *
c
Năstase * Băsescu Tudor Stolojan * Stolojan/Băsescu * October 2003 0,474 * 0,235 0,540 0,285 * 0,308/0,302 *
c
Năstase * Băsescu Tudor Stolojan * Stolojan/Băsescu * May 2004 0,533 * 0,162 0,541 0,267 * 0,312/0,203 *
c
Năstase * Băsescu Tudor Stolojan * Stolojan/Băsescu * October 2004 0,596 * ? 0,580 ? * 0,501/0,461 *
c
Elections
Năstase * Băsescu/Boc Tudor Tăriceanu * Tăriceanu/Băsescu * May 2005 0,508 * 0,082/0,101 0,449 0,054 * 0,285/0,379 *
d
Geoană * Băsescu/Boc Tudor Tăriceanu * Tăriceanu/Băsescu * November 2005 0,365 * 0,172/0,126 0,467 0,193 * 0,171/0,368 *
d
Geoană * Băsescu/Boc Tudor Tăriceanu * Tăriceanu/Băsescu Becali May 2006 0,372 * 0,304/0,117 0,548 0,202 * 0,163/0,251 0,434
d
Geoană * Băsescu/Boc Tudor Tăriceanu * Tăriceanu/Băsescu Becali October 2006 0,387 * 0,307/0,209 0,578 0,203 * 0,123/0,289 0,424
d