andrew gentner norman disney & young, spring hill … · 275 george street, brisbane – case...
TRANSCRIPT
275 GEORGE STREET, BRISBANE – CASE STUDY
Andrew Gentner Norman Disney & Young, Spring Hill QLD, Australia
ABSTRACT 275 George Street, Brisbane provides approximately 40,000m² of ‘A Grade’ commercial office space for the Brisbane CBD. Energy Simulation was undertaken for the NABERS 4.5 Star Commitment Agreement, Green Star submission, BCA Section J performance solution and Building Energy Tracking. The building has now completed its first year of operation and achieved its official 4.5 Star NABERS Energy Rating. This paper will review: • How the Energy Simulation influenced the
design of the building. • Limitations of the simulation. • Review of design default figures and
assumptions. • Comparison of energy simulations undertaken
for NABERS, Green Star and BCA Compliance. • Comparison of the simulation results with the
first twelve months of actual operational energy consumption.
INTRODUCTION In 1974, design drawings were completed for a 33-storey office tower adjacent to the Brisbane City Council Administration Centre at 69 Ann Street, Brisbane. Only 2 basement levels and retail plaza levels were completed at 275 George Street before construction ceased. For the next 30 plus years, the four levels facing Adelaide and George Streets remained essentially untouched. The 275 George Street site is unique in that the 2 level basement, plaza structure, substructure, footings and lift core of the building were completed during the construction of the original 69 Ann Street and Plaza over 30 years ago. The building was designed to achieve a 4.5 Star NABERS Office Energy Rating and 5 Star Green Star. Norman Disney & Young were responsible for all services design, Energy Simulation and ESD for the project. Instead of using the original plans for 33,500m² NLA building, Charter Hall the Building developers selected to strengthen the existing structure, which
resulted in a building with a greater floor area and less internal columns. The building was in effect reverse engineered around the existing foundations and lift core arrangement. This placed limitations on available facade options, building orientation, setbacks and floor structural solutions. Energy Simulation was undertaken to: • Review facade options. • Allow a NABERS (National Australian Built
Environment Rating System) Commitment Agreement to be entered into for a 4.5 Star Office Energy Rating.
• Provide a performance solution in relation to BCA Section J requirements to allow the projects 3 storey glass entry lobby to be as transparent as possible to meet the architect/developers vision for the building.
• Meet Green Star ENE-1 & 2 requirements. • Confirm tenant upgraded brief requirements
would not impact the NABERS Commitment Agreement.
The output of the energy simulation was then used to track the building performance during the first 12 months of operation to the award of the first 4.5 Star NABERS Office Energy Rating.
BUILDING DESCRIPTION 275 George Street, Brisbane occupies the block bordering Ann, George and Adelaide Streets, directly adjacent to the Brisbane City Hall. The Buildings consists of: • Basement 1 – shared carpark with neighbouring
building located at 69 Ann Street. • Basement 2 – shared carpark with neighbouring
building located at 69 Ann Street. • Basement 3 – shared carpark with neighbouring
building located at 69 Ann Street. • Annex – Adjoining four level Annex wing
consisting of double height Foyer and Retail and two levels of Commercial office.
• Ground Level – Foyer and Retail space. • Podium – Level 1 to Level 5 • Tower Mid Rise – Levels 6 to 14 • Tower Level 15 – Plantrooms and plant area.
Proceedings of Building Simulation 2011: 12th Conference of International Building Performance Simulation Association, Sydney, 14-16 November.
- 816 -
• Tower High Rise – Levels 16 to 30 office areas • Tower Level 31 and 32 – Plantrooms and plant
areas.
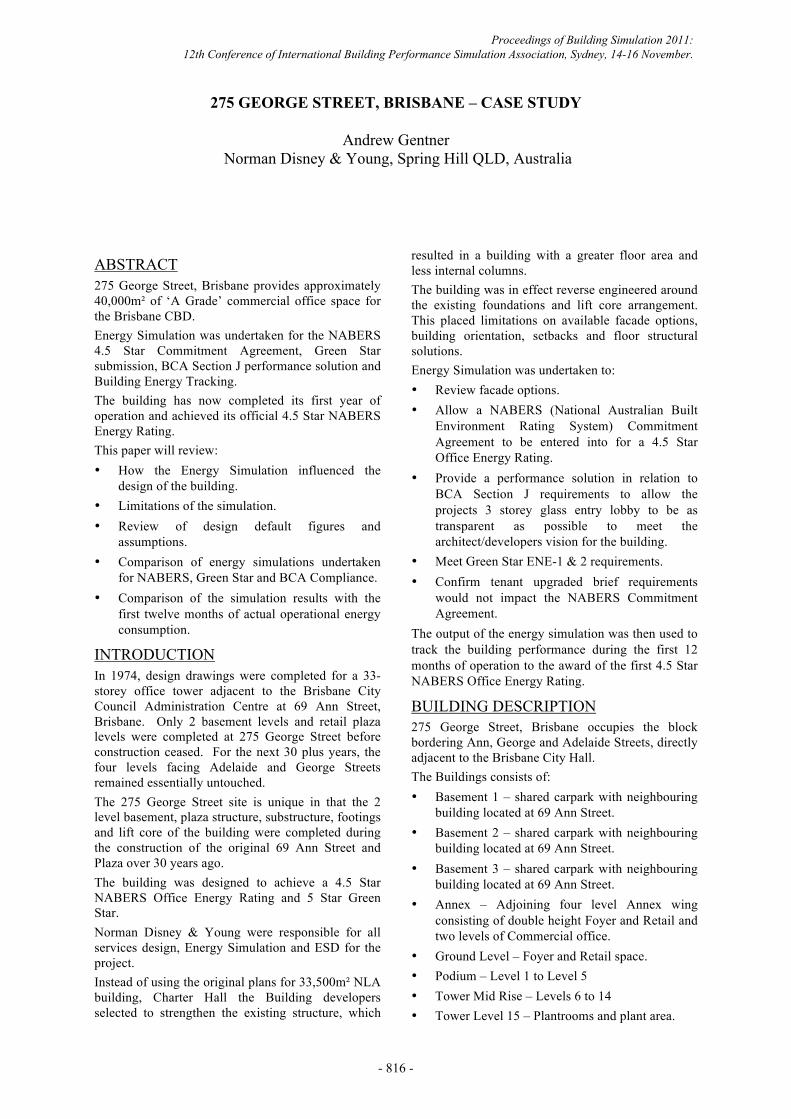
Figure 1 275 George Street, Brisbane
The building has three (3) plant levels located on Levels 15, 31 and 32 respectively for the location of the building services. The tower’s square floor plate is positioned offset within the larger rectangular floor plate of the podium. The adjoining four level Annex building is separated by an enclosed space located on the North-western side of the building. The foyer’s ceiling height matches the roof of the annex building, to create a large high ceiling space, which contributes to the aesthetics of the overall complex. The building is served by seven high rise lifts, four mid rise, three low rise, one tower goods, one carpark and one retail goods lift. A separate lift serves the Annex building. The building is air conditioned from a central chilled water system, with central variable air volume air-handling unit. Individual AHU’s are responsible for the serving of air-conditioning to separately zoned perimeter and internal areas within the floor plan. Retail areas are air conditioned from water-cooled package units connected to the building’s tenant condenser water loop. To achieve the required energy efficiency many initiatives were incorporated in the building design including: • High Performance Façade – the use of spandrel
panels and glazing with good thermal properties
decrease the solar transmission in summer and heat loss in winter. Therefore decreasing the heating and cooling requirements of the building.
• Building control system enabling close control of mechanical plant and monitoring of energy used within the building, relating to mechanical, electrical, hydraulic, fire and lift services.
• High efficiency chillers. • Use of variable speed drives on all pumps and
most fans to minimise energy consumption. • Installation of VOC and CO2 sensors in the
office areas to modify outside air rates at low occupancy.
• Zoning of air conditioning to ensure after hours air conditioning is limited to a confined area.
• All central air handling systems have been designed with economy cycle operation functionality to allow “free cooling” when ambient conditions permit.
• Central VAV air handling units have been zoned per facade face with separate internal units.
• All air system components designed for low pressure drop to minimize fan energy.
• Installation of lighting control system with occupancy sensors throughout the base building and tenancy areas to ensure close control and programming of lighting operation.
• Installation of motion detectors within office lobby and toilet areas to ensure lights are turned off when the areas are not in use. For after hours control of lighting in toilet, carpark and other back of house areas motion detector controls were utilised.
• High efficiency pump motors, and low system pressure drop.
• Solar collectors used to supplement the provision of Domestic Hot Water.
• Intelligent metering systems.
ENERGY SIMULATION Software The energy consumption estimates were based on computer simulations obtained from the Software BEAVER/ESPII from ACADS-BSG. This software uses the weather data from 1986 as reference year.
Limitations Energy simulation is inherently imprecise and, whilst providing helpful relative and comparative information between systems and features options, cannot be relied upon to provide definitive performance outcomes. The simulation processes has limitations and are based on a number of assumptions any of which may
Proceedings of Building Simulation 2011: 12th Conference of International Building Performance Simulation Association, Sydney, 14-16 November.
- 817 -

affect the energy simulation outcomes. The most significant issues are:
i. The documented energy simulation applies to base building design only and may not be interpolated or extrapolated from that.
ii. Energy programmes are imperfect in the way they simulate actual buildings and, in particular, air conditioning systems and controls.
iii. Assumptions have to be made on items such as, building occupancy, lighting, equipment usage and the like. The Designers and Energy Simulators have no control over these variables, so the assumed values may or may not be those that eventuate in the operational building.
iv. Simulations will be based on a test reference year data, which will not necessarily be valid for any given year.
v. Performance of the completed building may be significantly affected by the quality of construction; the quality of commissioning, ongoing management of the building, and the way the building is operated, monitored and maintained.
vi. The simulation process provides no guarantee that the rating predicted via modelling will be the final rating achieved by the fully constructed and functional building.
SIMULATION PROCESS A major compact of the simulation process is the Building services. Before any simulation can commence, Building services designs must be sufficiently advance to allow input of equipment capacities, control strategies, etc. Based on previous project experience and the Project Brief requirements building services design were progressed to provide Base Building data for the simulations. In excess of 10 energy simulations were requested for the project. The various simulations are described below.
BCA 2006 – Section J Performance Verification The Building facade options were initially assessed against BCA (Building Code of Australia) 2006 to assess deemed-to-satisfy (DTS) requirements. This review looked at the various facade glass and shading options. This process initially indentifies an issue with the ground floor 3 storey glazed lobby facade compliance. As a DTS solution was not achievable, Energy Stimulation in accordance with BCA 2006 Verification methods was required. This simulation was used to demonstrate that by providing a better
performing facade on the office levels the 3 storey transparently glazed lobby facade could be provided in accordance with the architect/developer’s vision for the project. In this case the simulation was being used for comparison purposes.
NABERS To enable the building energy performance to be marketed a NABERS Commitment Agreement was required. To achieve this energy simulation is required in accordance with the NABERS Validation Protocol’s for computer simulation. To address some of the limitations of the energy modelling the validation protocol requires off axis testing to assess the impact of the building not performing to design. These off axis simulations allow a better assessment of predicted energy performance as they are replicating occurrences that may occur in the real world.
Green Star As the building was designed to achieve a 5 Star Green Star Office Design V2 energy simulation was required for ENE-1 Energy and ENE-2 Energy Improvement. ENE-1 is a conditional requirement that a minimum 4 Star ABGR (NABERS) rating is achieved. ENE-2 credit recognise energy improvement that reduce energy consumption and greenhouse gas emissions. This simulation is again being used for comparison purposes.
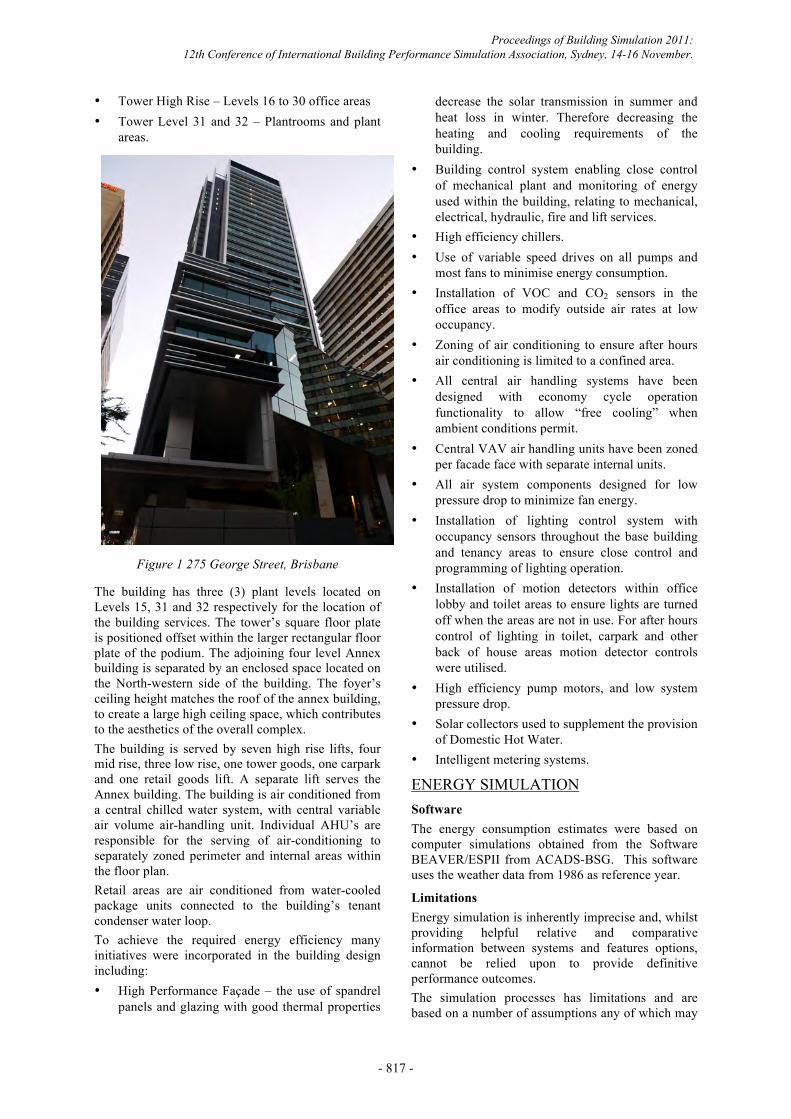
SIMULATION OUTPUTS BCA 2006 BCA 2006 provides two methods for determining performance compliance: JV2 – Verification using a stated value; and JV3 – Verification using a reference building. For this project JV2 approach was used. It should be noted that this approach is no longer available in the current BCA (now known as National Construction Code 2011). JV2 requires 2 energy simulations to be carried out; i) the proposed building with proposed services, ii) the proposed building with DTS services. Both simulation output must be less than the BCA stated value for the nearest location. If JV3 verification had been used 3 energy simulations would have been required; i) reference building (building with DTS construction and DTS services), ii) proposed building with proposed services, iii) proposed building with DTS reference services. The following table summarises the JV2 output from the BCA Base Building Energy Efficiency Report completed for the project.
Proceedings of Building Simulation 2011: 12th Conference of International Building Performance Simulation Association, Sydney, 14-16 November.
- 818 -
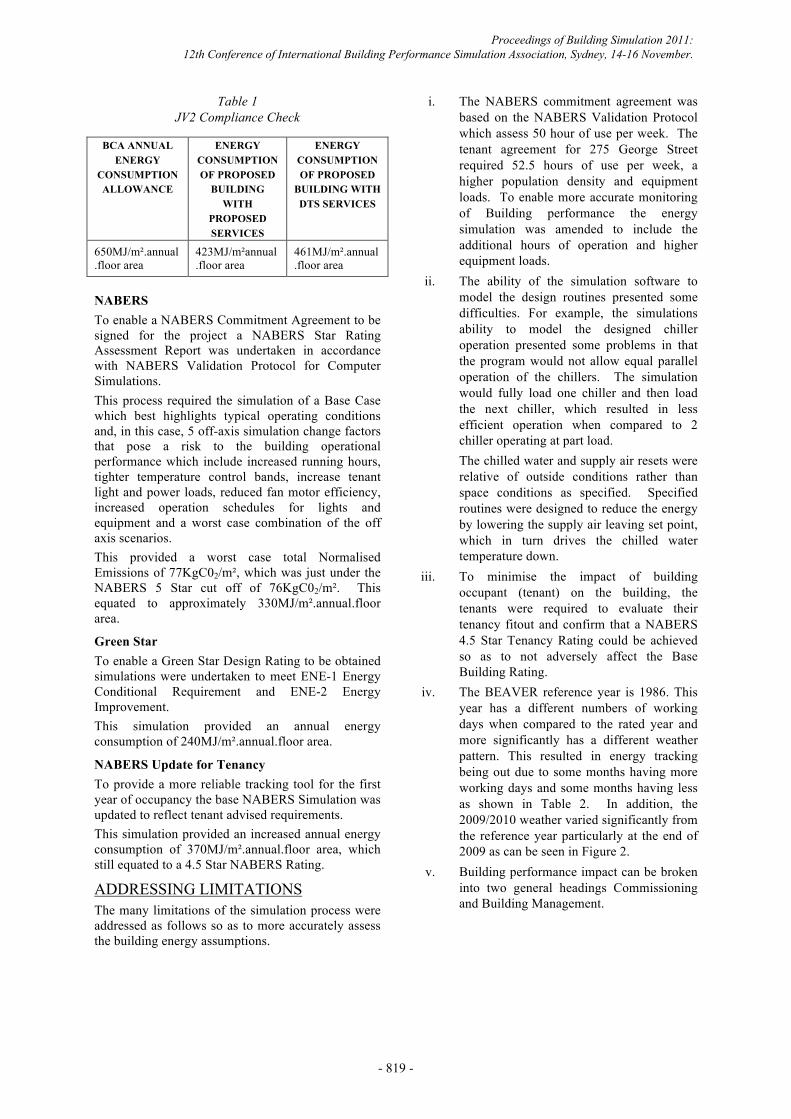
Table 1 JV2 Compliance Check
BCA ANNUAL ENERGY
CONSUMPTION ALLOWANCE
ENERGY CONSUMPTION OF PROPOSED
BUILDING WITH
PROPOSED SERVICES
ENERGY CONSUMPTION OF PROPOSED
BUILDING WITH DTS SERVICES
650MJ/m².annual.floor area
423MJ/m²annual.floor area
461MJ/m².annual.floor area
NABERS To enable a NABERS Commitment Agreement to be signed for the project a NABERS Star Rating Assessment Report was undertaken in accordance with NABERS Validation Protocol for Computer Simulations. This process required the simulation of a Base Case which best highlights typical operating conditions and, in this case, 5 off-axis simulation change factors that pose a risk to the building operational performance which include increased running hours, tighter temperature control bands, increase tenant light and power loads, reduced fan motor efficiency, increased operation schedules for lights and equipment and a worst case combination of the off axis scenarios. This provided a worst case total Normalised Emissions of 77KgC02/m², which was just under the NABERS 5 Star cut off of 76KgC02/m². This equated to approximately 330MJ/m².annual.floor area.
Green Star To enable a Green Star Design Rating to be obtained simulations were undertaken to meet ENE-1 Energy Conditional Requirement and ENE-2 Energy Improvement. This simulation provided an annual energy consumption of 240MJ/m².annual.floor area.
NABERS Update for Tenancy To provide a more reliable tracking tool for the first year of occupancy the base NABERS Simulation was updated to reflect tenant advised requirements. This simulation provided an increased annual energy consumption of 370MJ/m².annual.floor area, which still equated to a 4.5 Star NABERS Rating.
ADDRESSING LIMITATIONS The many limitations of the simulation process were addressed as follows so as to more accurately assess the building energy assumptions.
i. The NABERS commitment agreement was based on the NABERS Validation Protocol which assess 50 hour of use per week. The tenant agreement for 275 George Street required 52.5 hours of use per week, a higher population density and equipment loads. To enable more accurate monitoring of Building performance the energy simulation was amended to include the additional hours of operation and higher equipment loads.
ii. The ability of the simulation software to model the design routines presented some difficulties. For example, the simulations ability to model the designed chiller operation presented some problems in that the program would not allow equal parallel operation of the chillers. The simulation would fully load one chiller and then load the next chiller, which resulted in less efficient operation when compared to 2 chiller operating at part load. The chilled water and supply air resets were relative of outside conditions rather than space conditions as specified. Specified routines were designed to reduce the energy by lowering the supply air leaving set point, which in turn drives the chilled water temperature down.
iii. To minimise the impact of building occupant (tenant) on the building, the tenants were required to evaluate their tenancy fitout and confirm that a NABERS 4.5 Star Tenancy Rating could be achieved so as to not adversely affect the Base Building Rating.
iv. The BEAVER reference year is 1986. This year has a different numbers of working days when compared to the rated year and more significantly has a different weather pattern. This resulted in energy tracking being out due to some months having more working days and some months having less as shown in Table 2. In addition, the 2009/2010 weather varied significantly from the reference year particularly at the end of 2009 as can be seen in Figure 2.
v. Building performance impact can be broken into two general headings Commissioning and Building Management.
Proceedings of Building Simulation 2011: 12th Conference of International Building Performance Simulation Association, Sydney, 14-16 November.
- 819 -

Figure 2 Monthly Mean Maximum Temperature
Table 2
BEAVER Reference Year Working Days Comparison
Commissioning Commissioning was addressed as the Building was also to achieve a 5 Star Green Star. Green Star Credit targeted and achieved included: • MAN-2 Commissioning Clauses • MAN-3 Building Tuning • MAN-4 Commissioning – Commissioning
Agent • MAN-5 Building Users Guide This approach meant that the building services were commissioned to achieve the design intent.
Building Management During the first 12 months of occupation the building was closely monitored by the Building Manager, Managing Contractor and Consultant. Energy consumption was tracked against the updated energy simulation. The following chart shows the energy tracking for the 12 months of operation for the NABERS Rating. The monitoring was not limited to
energy but also reviewed the Building Management system control routines, electricity meter checks, review of after hours operations and the like.
Figure 3 – Actual Base Building Energy Consumptions vs. Simulated Consumption
In addition to monitoring Base Building energy consumption, Tenant Energy consumption was also monitored against predicted values to ensure that the tenants would not adversely affect base building energy consumption.
DEFAULT VALUES As can be seen from the above simulation outputs the various simulations provided a range of the annual energy consumption, which is largely due to the different Default Figures used for each simulation. The Default Figures are the values set by the various organisations to comply with their respective simulation protocols. As can be seen from table 3 each simulation protocol has slightly different values. These differences lead to significant variations in the simulated annual energy consumption per m² as can be seen in table 3.
Proceedings of Building Simulation 2011: 12th Conference of International Building Performance Simulation Association, Sydney, 14-16 November.
- 820 -
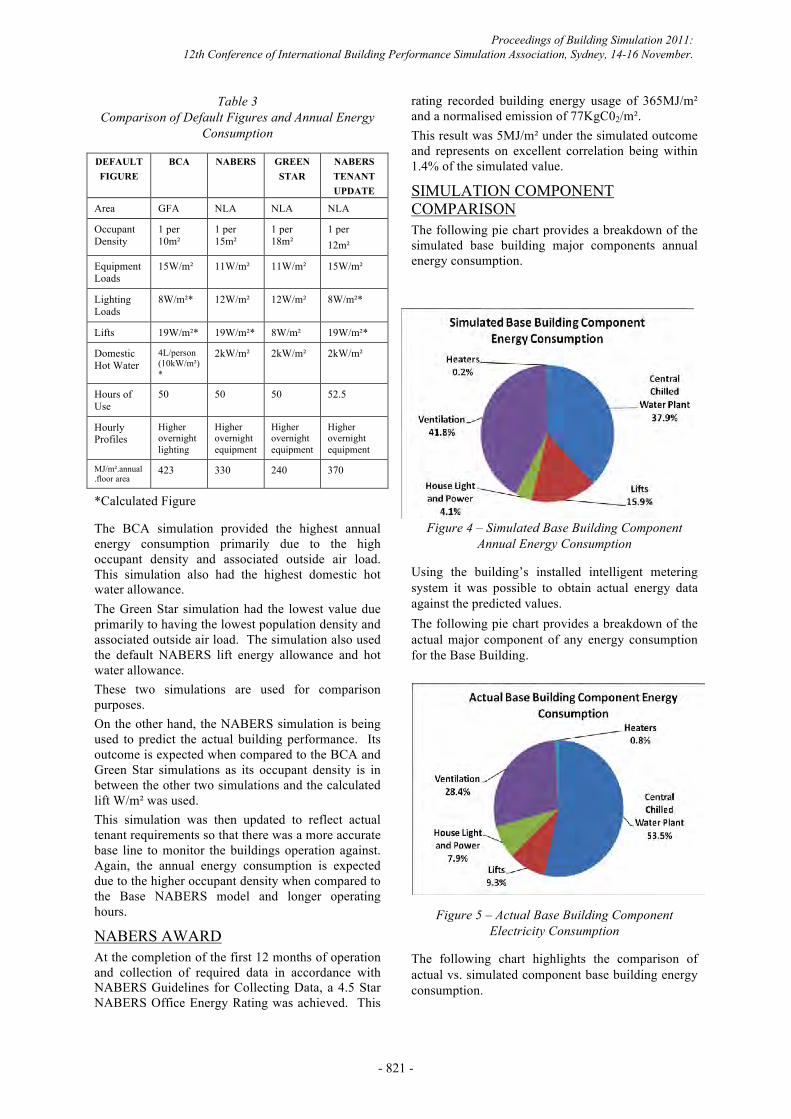
Table 3 Comparison of Default Figures and Annual Energy
Consumption
DEFAULT FIGURE
BCA NABERS GREEN STAR
NABERS TENANT UPDATE
Area GFA NLA NLA NLA
Occupant Density
1 per 10m²
1 per 15m²
1 per 18m²
1 per 12m²
Equipment Loads
15W/m² 11W/m² 11W/m² 15W/m²
Lighting Loads
8W/m²* 12W/m² 12W/m² 8W/m²*
Lifts 19W/m²* 19W/m²* 8W/m² 19W/m²*
Domestic Hot Water
4L/person (10kW/m²)*
2kW/m² 2kW/m² 2kW/m²
Hours of Use
50 50 50 52.5
Hourly Profiles
Higher overnight lighting
Higher overnight equipment
Higher overnight equipment
Higher overnight equipment
MJ/m².annual.floor area
423 330 240 370
*Calculated Figure
The BCA simulation provided the highest annual energy consumption primarily due to the high occupant density and associated outside air load. This simulation also had the highest domestic hot water allowance. The Green Star simulation had the lowest value due primarily to having the lowest population density and associated outside air load. The simulation also used the default NABERS lift energy allowance and hot water allowance. These two simulations are used for comparison purposes. On the other hand, the NABERS simulation is being used to predict the actual building performance. Its outcome is expected when compared to the BCA and Green Star simulations as its occupant density is in between the other two simulations and the calculated lift W/m² was used. This simulation was then updated to reflect actual tenant requirements so that there was a more accurate base line to monitor the buildings operation against. Again, the annual energy consumption is expected due to the higher occupant density when compared to the Base NABERS model and longer operating hours.
NABERS AWARD At the completion of the first 12 months of operation and collection of required data in accordance with NABERS Guidelines for Collecting Data, a 4.5 Star NABERS Office Energy Rating was achieved. This
rating recorded building energy usage of 365MJ/m² and a normalised emission of 77KgC02/m². This result was 5MJ/m² under the simulated outcome and represents on excellent correlation being within 1.4% of the simulated value.
SIMULATION COMPONENT COMPARISON The following pie chart provides a breakdown of the simulated base building major components annual energy consumption.
Figure 4 – Simulated Base Building Component Annual Energy Consumption
Using the building’s installed intelligent metering system it was possible to obtain actual energy data against the predicted values. The following pie chart provides a breakdown of the actual major component of any energy consumption for the Base Building.
Figure 5 – Actual Base Building Component Electricity Consumption
The following chart highlights the comparison of actual vs. simulated component base building energy consumption.
Proceedings of Building Simulation 2011: 12th Conference of International Building Performance Simulation Association, Sydney, 14-16 November.
- 821 -
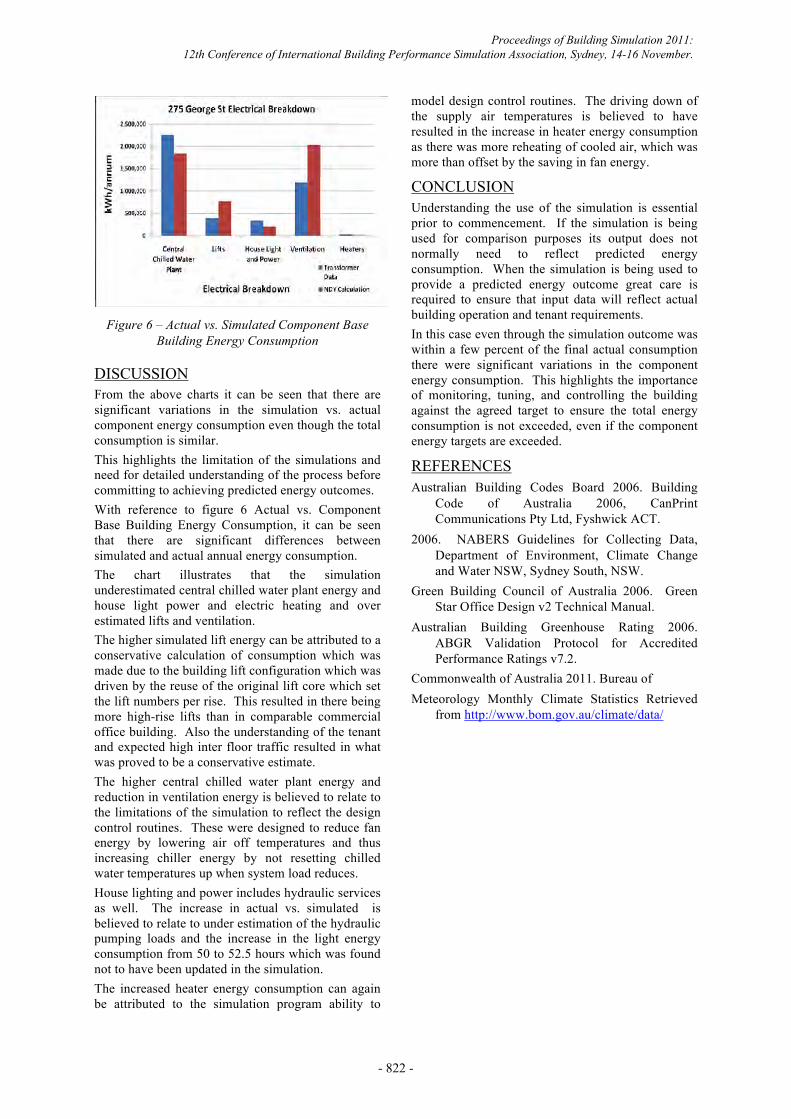
Figure 6 – Actual vs. Simulated Component Base Building Energy Consumption
DISCUSSION From the above charts it can be seen that there are significant variations in the simulation vs. actual component energy consumption even though the total consumption is similar. This highlights the limitation of the simulations and need for detailed understanding of the process before committing to achieving predicted energy outcomes. With reference to figure 6 Actual vs. Component Base Building Energy Consumption, it can be seen that there are significant differences between simulated and actual annual energy consumption. The chart illustrates that the simulation underestimated central chilled water plant energy and house light power and electric heating and over estimated lifts and ventilation. The higher simulated lift energy can be attributed to a conservative calculation of consumption which was made due to the building lift configuration which was driven by the reuse of the original lift core which set the lift numbers per rise. This resulted in there being more high-rise lifts than in comparable commercial office building. Also the understanding of the tenant and expected high inter floor traffic resulted in what was proved to be a conservative estimate. The higher central chilled water plant energy and reduction in ventilation energy is believed to relate to the limitations of the simulation to reflect the design control routines. These were designed to reduce fan energy by lowering air off temperatures and thus increasing chiller energy by not resetting chilled water temperatures up when system load reduces. House lighting and power includes hydraulic services as well. The increase in actual vs. simulated is believed to relate to under estimation of the hydraulic pumping loads and the increase in the light energy consumption from 50 to 52.5 hours which was found not to have been updated in the simulation. The increased heater energy consumption can again be attributed to the simulation program ability to
model design control routines. The driving down of the supply air temperatures is believed to have resulted in the increase in heater energy consumption as there was more reheating of cooled air, which was more than offset by the saving in fan energy.
CONCLUSION Understanding the use of the simulation is essential prior to commencement. If the simulation is being used for comparison purposes its output does not normally need to reflect predicted energy consumption. When the simulation is being used to provide a predicted energy outcome great care is required to ensure that input data will reflect actual building operation and tenant requirements. In this case even through the simulation outcome was within a few percent of the final actual consumption there were significant variations in the component energy consumption. This highlights the importance of monitoring, tuning, and controlling the building against the agreed target to ensure the total energy consumption is not exceeded, even if the component energy targets are exceeded.
REFERENCES Australian Building Codes Board 2006. Building
Code of Australia 2006, CanPrint Communications Pty Ltd, Fyshwick ACT.
2006. NABERS Guidelines for Collecting Data, Department of Environment, Climate Change and Water NSW, Sydney South, NSW.
Green Building Council of Australia 2006. Green Star Office Design v2 Technical Manual.
Australian Building Greenhouse Rating 2006. ABGR Validation Protocol for Accredited Performance Ratings v7.2.
Commonwealth of Australia 2011. Bureau of Meteorology Monthly Climate Statistics Retrieved
from http://www.bom.gov.au/climate/data/
Proceedings of Building Simulation 2011: 12th Conference of International Building Performance Simulation Association, Sydney, 14-16 November.
- 822 -