andrew j. woods, ka lun yuen, and kai s. karvinen...
TRANSCRIPT

Characterizing crosstalk in anaglyphic stereoscopic images on LCD monitors andplasma displays
Andrew J. WoodsKa Lun YuenKai S. Karvinen
Abstract — In 1853, William Rollman1 developed the inexpensive and easy to use anaglyph methodfor displaying stereoscopic images. Although it can be used with nearly any type of full-color display,the anaglyph method compromises the accuracy of color reproduction, and it often suffers from cros-stalk (or ghosting) between the left- and right-eye image channels. Crosstalk degrades the ability ofthe observer to fuse the stereoscopic image, and hence reduces the quality of the 3-D image. Crosstalkis present in various levels with most stereoscopic displays; however, it is often particularly evidentwith anaglyphic 3-D images. This paper summarizes the results of two projects that characterized thepresence of anaglyphic crosstalk due to spectral issues on 13 LCD monitors, 14 plasma displays, anda CRT monitor when used with 25 different pairs of anaglyph 3-D glasses. A mathematical model wasused to predict the amount of crosstalk in anaglyphic 3-D images when different combinations ofdisplays and glasses are used, and therefore highlight displays, glasses, and combinations thereofwhich exhibit lower levels of crosstalk when displaying anaglyphic 3-D images.
Keywords — Anaglyph, 3-D, stereoscopic, crosstalk, ghosting, LCD monitors, plasma displays, CRTdisplays.
1 IntroductionThe anaglyph method of displaying stereoscopic imagesuses a complementary color-coding technique to send sepa-rate left and right views to an observer’s two eyes. The twoperspective images of a stereo-pair are stored in comple-mentary color channels of the display, and the observerwears a pair of glasses containing color filters which act topass the correct image but block the incorrect image to eacheye.
For example, if a red/cyan anaglyph is used, the leftperspective image is stored in the red color channel and theright perspective image is stored in the blue and green colorchannels (blue + green = cyan), and the observer wears apair of anaglyph 3-D glasses with the left-eye filter red andthe right-eye filter cyan.
The main advantages of the anaglyph 3-D method areits simplicity, low cost, and compatibility with any full-colordisplay. The main disadvantages are its inability to accu-rately depict full-color images, and commonly the presenceof crosstalk. Crosstalk (or ghosting) is the leaking of animage to one eye when it is intended exclusively for theother eye. For example, the left eye should only be able tosee the left perspective image, but due to crosstalk, the lefteye may see a small proportion of the right perspectiveimage. Crosstalk occurs with most stereoscopic displays andresults in reduced image quality and difficulty of fusion ifthe amount of crosstalk is large.
This paper considers the two spectral contributors toanaglyphic crosstalk: display spectral response and anaglyphglasses spectral response. Two other possible contributors to
anaglyph ghosting, image compression and image encod-ing/transmission,2 are not explored in this paper.
Figure 1 provides an illustration of the process of cros-stalk in anaglyph stereoscopic images due to spectral leak-age (as illustrated for the red/cyan method). Firstly, thedisplay has a specific spectral output for the red, green, andblue color channels. Usually the left perspective image isstored in the red color channel and the right perspectiveimage is stored in the green and blue color channels (cyan).Second, the red/cyan anaglyph 3-D glasses used to view theanaglyph display also have a certain spectral transmissionresponse for the left and right eye filters. Here the left filterpredominantly transmits red light but with a little bit oftransmission in the green band, and the right filter predomi-nantly transmits blue and green light but with a little bit oftransmission in the red band. Due to the non-ideal nature ofthe display and the glasses, some light from the right (cyan)color channel leaks through the left (red) eye filter. Simi-larly, some light from the left (red) color channel leaks. Thisis in addition to the transmission of the intended imagethrough the left- and right-eye filters. Therefore, the lefteye predominantly sees the left perspective image but witha small amount of the right perspective image visible, andthe right eye predominantly sees the right perspectiveimage but with a small amount of the left perspective imagevisible.
This paper carries on from the work of Woods andRourke2 which considered anaglyph ghosting with cathode-ray tube (CRT) monitors, one liquid-crystal display (LCD)monitor, and a mixture of LCD and digital light processing(DLP) projectors. This paper focuses on anaglyph ghostingon LCD monitors and plasma displays with 13 LCD moni-
The authors are with the Centre for Marine Science & Technology, Curtin University of Technology, GPO Box U1987, Perth, WA 6845 Australia;telephone +61-8-9266-7920, fax –4799, e-mail: A.Woods cmst.curtin.edu.au.
© Copyright 2007 Society for Information Display 1071-0922/07/1511-0889$1.00
Journal of the SID 15/11, 2007 889
Andrew J. Woods, Ka Lun Yuen, and Kai S. Karvinen, “Characterizing crosstalk in anaglyphic stereoscopic images on LCD monitors and plasma displays” in Journal of the Society for Information Display, Volume 15, Issue 11, pp. 889-898, November 2007. www.AndrewWoods3D.com

tors and 14 plasma-displays panels (PDPs) tested. A CRTmonitor was also tested for comparison purposes. All datafor this project was measured using more accurate equip-ment than was available in the previous study.2
This paper only examines crosstalk in red/cyan ana-glyph stereoscopic images, although the simulation methodsdiscussed could also be applied to blue/yellow or green/magenta anaglyphs.
2 Experimental methodThe first step was to measure the spectral output of the dis-plays using a manually calibrated Ocean Optics USB2000spectroradiometer. Table 1 itemizes the displays tested –consisting of 13 LCD computer monitors, 14 PDPs, and oneCRT monitor.
Each display was connected to a PC which displayed aslide show consisting of a plain white slide (R = G = B =255), a plain red slide (R = 255, G = B = 0), a plain greenslide (R = B = 0, G = 255), a plain blue slide (R = G = 0, B= 255), and a plain black slide (R = G = B = 0). The spec-troradiometer was used to measure the spectrum of each ofthese slides (as displayed on each display) and the data col-lected on a PC.
The second step was to measure the transmissionspectrum of a large selection of anaglyph 3-D glasses usinga PG Instruments T90+ UV/Vis spectrophotometer. A totalof 50 pairs of anaglyph glasses were tested3; however, only25 pairs are reported here for the sake of brevity.
The third step was to use a specially developed Matlabcomputer program to calculate the presence of crosstalk inthe anaglyph images for different display and glasses combi-nations. With reference to Fig. 1, the program first loadsand resamples the display and filter spectral data so that alldata is on a common x-axis coordinate system. Next, the pro-gram determines the display’s cyan spectral output by add-ing the green and blue color channel data of the display. Theprogram then multiplies the red display spectrum with thered filter’s spectral response to obtain the intended imagecurve for the red eye, multiplies the cyan display spectrumwith the cyan filter’s spectrum to obtain the intended imagecurve for the cyan eye, multiplies the red display spectrumwith the cyan filter’s spectral response to obtain the crosstalkcurve for the cyan eye, and multiplies the cyan display spec-trum with the red filter’s spectrum to obtain the crosstalkcurve for the red eye.
The program also scales these result curves to includethe human-eye response to light by multiplying by the curveshown in Fig. 2, which shows the CIE (International Com-mission on Illumination) model for simulating photopic(bright light) human-eye sensitivity to light.4
The crosstalk percentage for each eye is then calcu-lated by dividing the area under the crosstalk curve by thearea under the intended signal curve for each eye and mul-tiplying by 100. The overall crosstalk factor for a particular
FIGURE 1 — Illustration of the process of anaglyph spectral ghostingand its simulation in this project. From the top: (1) Spectral response ofdisplay, (2) spectral response of anaglyph glasses, (3) simulation ofghosting using a computer program, (4) spectral output characteristic ofcrosstalk and intended image, and (5) visual illustration of left- andright-eye view with crosstalk.
TABLE 1 — Listing of the tested displays.
890 Woods et al. / Characterizing anaglyph crosstalk on LCD monitors and plasma displays

pair of glasses in combination with a particular display is thesum of the left- and right-eye percentage crosstalk values. Itshould be noted that the overall crosstalk factor is not a per-centage, but rather a number that allows the comparison ofdifferent glasses/display combinations. The program alsoautomates the process of performing a cross comparison ofall the displays against all of the glasses.
3 Results
3.1 Display device resultsThe spectral output measurement of 13 different LCDmonitors, 14 different PDP monitors, and one CRT monitorare reported in this study.
Figure 3 shows the spectral output of an exampleLCD monitor (LCD04). All of the LCD monitors testedused cold cathode fluorescent lamp (CCFL) backlights.CCFLs are a form of mercury-vapor fluorescent lamp thatgenerate visible light by energizing the gas in the fluores-cent tube so that it emits ultraviolet rays which in turncauses the phosphor material that coats the inside surface ofthe tube to emit visible light. The spectrum of a CCFL isfairly broad but with many notable narrow peaks. Althoughthe spectral output of the raw CCFL was not measured inany of the LCDs tested, its general form can be approxi-mated from the summation of the three traces shown inFig. 3. The three individual color primaries (red, green, andblue) are created by placing color filters over the individualsubpixel groups in the LCD pixel grid.5 The light spectrumoutput by each color channel is primarily a multiplication ofthe backlight spectrum by the spectrum of the color filtersused in each subpixel. In the example LCD monitor shownin Fig. 3, there is a considerable amount of overlap betweeneach of the three color channels. The amount of overlapvaried from monitor to monitor.
The combined spectral results for the 13 LCD moni-tors tested are shown in Appendix B (Figs. B1, B2, and B3).
A separate graph is provided for each of the three color pri-maries. There is a lot of similarity between the spectralcharacteristics of all the LCD monitors; however, some dif-
FIGURE 2 — CIE 1931 standard normalized photopic human-eyeresponse.
FIGURE 3 — Color spectrum of an example LCD monitor (LCD04).
FIGURE 4 — Color spectrum of an example plasma display (PDP08).
FIGURE 5 — Color spectrum of the example CRT monitor.
Journal of the SID 15/11, 2007 891

ferences occur in the out-of-band rejection (e.g., theamount of green light present in the red color primary)which will probably be related to the quality of color filtersused for each of the color primaries.
Figure 4 shows the spectral output of an exampleplasma display (PDP08). Color plasma displays generate vis-ible light by energizing a gas mixture in each cell so that itemits ultraviolet light rays which in turn causes the phos-phor material that coats the inside of each cell to emit visiblelight. The spectral output of each of the color channels isdetermined by the phosphor formulation used for eachgroup of subpixels.6 The blue output has a classic bell-shaped curve centered around 450 nm. The red output is amixture of several narrow peaks and the green output is amixture of a bell curve and another major narrow peak.
The combined spectral results for all of the 14 plasmadisplays tested are shown in Appendix B (Figs. B4, B5, andB6). A separate graph is provided for each of the three colorprimaries. The color spectrum of the red and blue color pri-maries are very similar across all the tested plasma displays;however, there is a lot of variation of the spectral responseof the green color primary which will probably relate to theformulation of the phosphors used.
Figure 5 shows the spectral output of an example CRTmonitor. A previous paper by Woods and Tan7 reported that11 tested CRT monitors had almost exactly the same spec-tral response which suggests that most CRTs use the samephosphor formulation for each of the color primary chan-nels. The blue and green output have a bell-shaped curvewhereas the red output is made up of several narrow peaks.
3.2 Anaglyph 3-D glasses resultsFigure 4 shows the spectral transmission of an example pairof red-cyan anaglyph glasses. In this example the red filterhas a pass band of wavelengths roughly 600–700 nm. Thecyan filter has a pass band of wavelengths roughly 550–400nm. As can be seen in Fig. 4, a little bit of light at the wave-length of around 590 nm will be transmitted through boththe red and cyan filters, therefore arriving at both eyes.When this overlap occurs it is another possible source ofcrosstalk.
All of the anaglyph glasses reported in this paper arelisted in Table 2. This list is substantially similar to thatreported in Woods and Rourke2 except that all pairs ofglasses have been retested using a more accurate instru-ment.
The spectral transmission of all the glasses from Table2 are shown overlaid in Fig. 7 (red filters) and Fig. 8 (cyanfilters). It can be seen that there is considerable variationbetween the spectral response of the various glasses tested.There is some clustering of some of the data, however, thisis probably due to some glasses being from the same manu-facturer or manufacturing process.
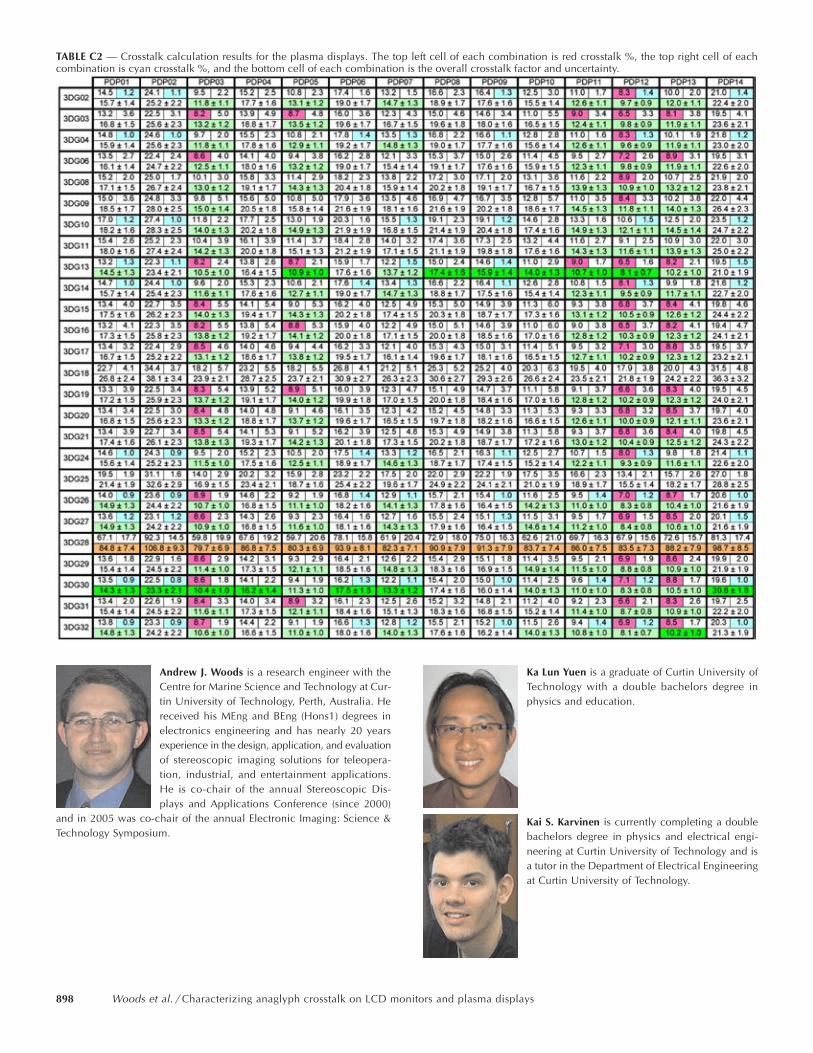
3.3 Crosstalk calculation resultsThe crosstalk and uncertainty results calculated by the Mat-lab program for the combination of all displays against allanaglyph glasses are shown in Tables C1 and C2 in AppendixC. For each display/glasses combination, the table lists thepercentage crosstalk for the red eye (top left), the percent-age crosstalk for the cyan eye (top right), and the overallcrosstalk factor for both eyes combined (bottom). The over-all crosstalk factor is the sum of the left- and right-eye per-centages, and as such is not a percentage. The uncertaintyfigures are only shown for the overall crosstalk factor. Theuncertainty figures were calculated for the individual redand cyan crosstalk but are omitted here due to space limita-tions.
3.4 Validation testA first-order validation test was performed to confirm thatthe results from the crosstalk model were sensible. A set of
FIGURE 6 — Spectral transmission of an example pair of anaglyph 3-Dglasses (3DG16).
FIGURE 7 — Spectral transmission for all the red filters.
892 Woods et al. / Characterizing anaglyph crosstalk on LCD monitors and plasma displays

test images were viewed on a CRT monitor and subjectivelyranked in order of increasing crosstalk. The results of thesubjective ranking were then compared with the crosstalkranking generated by the MATLAB program and this isshown in Table 2.
As can be seen from the table, the subjective rankingagrees extremely well with the calculated results, which pro-vides some confidence in the validity of the crosstalk calcu-lation results. Two of the differences occurred where thecrosstalk percentage difference was just 0.1, and two differ-ences occurred where the crosstalk percentage differencewas 0.4. Crosstalk differences of 0.1 and 0.4 are very smalland are hard to discern by the naked eye.
4 DiscussionCrosstalk in anaglyph images acts to degrade the 3-D imagequality by making them hard to fuse. One important way tooptimize the quality of anaglyph 3-D images is therefore tominimize the presence of crosstalk. In most circumstances,the easiest way to minimize crosstalk would be with thechoice of anaglyph 3-D glasses, but in some circumstancesit may also be possible to choose different display monitors.This project aims to highlight possible low-crosstalk combi-nations so crosstalk can be reduced.
Across all of the displays, the LCD monitors had thelowest overall crosstalk, both from an average (18.6) and alsoa global minimum (7.0) perspective. The plasma displays werevery close behind with an average overall crosstalk of 18.6and global minimum of 8.1. The CRT had much worse ana-glyph crosstalk with an average overall crosstalk of 27.0 andglobal minimum of 18.2. On average, the CRT had 45%more crosstalk than the LCD and plasma displays.
As cited earlier, there is a reasonable amount of vari-ation of the color spectrum across all LCD monitors andacross all plasma displays. Similarly, there is a fairly largevariation in overall crosstalk factor across all of the LCDmonitors and all of the plasma displays. For example, the
LCD monitor with the highest crosstalk factors (LCD04)only performs marginally better than a CRT, and the plasmadisplay with the highest crosstalk factors (PDP02) hadslightly worse performance than a CRT.
The best performing LCD monitor was LCD14 whichprovided an average crosstalk factor of only 13.8 andachieved the lowest crosstalk factor across all displays of 7.0(when combined with glasses 3DG32). The best performingplasma display was the PDP12 with an average crosstalk fac-tor of 11.9 which achieved the third lowest crosstalk factoracross all plasma displays of 8.1 (when used with glasses3DG13).
The worst pair of anaglyph glasses across all displaysby far was 3DG28 – the ink-jet-printed transparency filters.This is not an unexpected result since these filters have suchpoor performance in the out-of-band wavelengths and verypoor contrast.
The choice of best glasses depends upon which displayis being considered. For the LCD monitors, 3DG32,3DG26, and 3DG13 usually had the lowest overall crosstalk(all were within the uncertainty limits of each other). Forthe plasma displays, 3DG30, 3DG13, and 3DG32 usually
TABLE 2 — Subjective testing of anaglyph glasses and comparison withcalculated results. Lines join matching entries.
FIGURE 8 — Spectral transmission for all the cyan filters.
Journal of the SID 15/11, 2007 893

had the lowest overall crosstalk (within the uncertainty lim-its). For the CRT case, the best glasses were 3DG32,3DG26, and 3DG13. It is interesting to note that the “cyan”filters of 3DG13 and 3DG26 have a more blue appearancethan those of 3DG30 and 3DG32 that have a more cyanappearance. These differences may have some effect oncolor perception which is discussed below.
As can be seen in Tables C1 and C2, red crosstalk isusually significantly greater than cyan crosstalk – on averagealmost four times greater. Red crosstalk usually thereforedominates the overall crosstalk value. This can be attributedto the shape of the spectral curves for the display andglasses, but will also be due to the fact that the green chan-nel is usually much brighter than the red channel.
It is usually possible to obtain a slightly lower overallcrosstalk figure for a particular display by mixing and match-ing filters from different glasses; however, the improvementachieved is usually less than the calculated overall uncer-tainty value.
It is worth mentioning that even a perfect filter (onethat transmits 100% of light in the desired wavelengthdomain and 0% outside it) would still have crosstalk if thedisplay’s color channels overlap in the spectral domain (asmost displays do).
Three further items are worth considering. First,intensity. If the filter cuts out most of the light, the imagewill be very dim and hard to see. Lower light levels alsomake the effect of even small ghosting levels proportionallygreater than they might otherwise be. A brightness imbal-ance between left and right eye can also result in the Pul-frich effect8 whereby horizontal motion can be interpretedas binocular depth, which is generally undesirable. Bright-ness levels and imbalance have not been considered in thispaper.
Second, color perception. Truly full-color stereoscopicimages are not possible with anaglyphs, but a properly con-structed anaglyph using complimentary colors can approxi-mate a full-color image. This distorted color image is usuallyreferred to as a “pseudo-color anaglyph” or a “polychromaticanaglyph” as opposed to a “full-color anaglyph” (which is notpossible). If a non-complimentary combination is used (e.g.,red/blue or red/green), pseudo-color anaglyphs are impossi-ble because a large portion of the visible spectrum is miss-ing. The overall image may also be darker. This paper hasonly considered red/cyan anaglyphs, although it is some-times hard to draw a line between what is classified as a cyanfilter and what is classified as a blue filter.
Third, color balance and color temperature. Mostmonitors allow the color balance or color temperature of thedisplay to be adjusted. This allows the user to change therelative intensities of the three color channels (but not thespectral output of each color channel). We have found thatsuch adjustments do affect the results of the crosstalk calcu-lations; however, as yet we have not used this knowledge tochoose an optimum color balance, or performed any valida-tion experiments to confirm whether the simulation of color
balance changes matches human perception. For the pur-poses of this study, the default color profiles were used foreach monitor.
5 ConclusionAlthough there are a range of stereoscopic display technolo-gies available that produce much better 3-D image qualitythan the anaglyph 3-D method, the anaglyph remains widelyused because of its simplicity, low cost, and compatibilitywith all full-color displays. This paper highlights one par-ticular way of improving the image quality of anaglyph 3-Dimages specifically relating to spectral crosstalk.
This study has revealed that crosstalk in anaglyphic3-D images can be minimized by the appropriate choice ofanaglyphic 3-D glasses. The study has revealed that therecan be considerable variation in the amount of crosstalk pre-sent when an anaglyphic 3-D display is viewed with differ-ent anaglyphic 3-D glasses.
The study has also revealed that there is considerablevariation in the amount of anaglyphic crosstalk exhibited bydifferent displays. For example, on average CRT monitorsexhibit approximately 45% more crosstalk than LCD moni-tors and plasma displays.
An anaglyphic crosstalk calculation algorithm has beendeveloped that appears to work well and generates outputsthat agree well with subjective assessments of anaglyphic3-D crosstalk.
It should be noted that the results of this paper are notintended to be a leader board of one glasses manufacturerversus another – we have not tested all glasses from allmanufacturers, nor have we tested a large sample of eachmanufacturers glasses. This paper does, however, highlightthat there is significant variation between different ana-glyph 3-D glasses and displays. Further crosstalk optimiza-tion may be possible by using the anaglyphic crosstalkcalculation algorithm and working with 3-D glasses manu-facturers.
AcknowledgmentsWe would like to thank the multitude of companies andindividuals who lent LCD monitors and plasma displays fortesting.3,9 We also wish to thank iVEC (the hub of advancedcomputing in Western Australia) and Jumbo Vision Interna-tional for their support of the plasma displays phase of thisproject.
References1 R Zone, “Good old fashion anaglyph: High tech tools revive a classic format
in spy kids 3-D,” Stereo World 29, No. 5, 11–13 and 46 (2002–2003).2 A J Woods and T Rourke, “Ghosting in anaglyphic stereoscopic im-
ages,” Stereoscopic Displays and Virtual Reality Systems XI, Proc SPIE5291, 354–365 (2004).
3 K S Karvinen and A J Woods, “The compatibility of plasma displayswith stereoscopic visualization,” Technical Report CMST2007-04 (Cur-tin University of Technology, Australia, 2007).
894 Woods et al. / Characterizing anaglyph crosstalk on LCD monitors and plasma displays

4 CIE, Commission Internationale de l’Eclairage Proceedings (Cam-bridge University Press, 1932).
5 B A Wandell and L D Silverstein, “Digital color reproduction,” TheScience of Color (Elsevier, 2003), pp. 296.
6 H Uchiike and T Hirakawa, “Color plasma displays,” Proc IEEE 90,Issue 4, 533–539 (2002).
7 A J Woods and S S L Tan, “Characterizing sources of ghosting intime-sequential stereoscopic video displays,” Stereoscopic Displaysand Virtual Reality Systems IX, Proc SPIE 4660, 66–77 (2002).
8 C Pulfrich, “Die Stereoskopie im Dienste der isochromem undherterochromen Photometrie,” Naturwissenschaft 10, 553–564 (1922).
9 K L Yuen, “Compatibility of LCD monitors with stereoscopic displaymethods,” Undergraduate Student Project Report (Curtin Universityof Technology, 2006).
Appendix A: Red/cyan anaglyph glasses
Appendix B: Spectral results for all testedLCD monitors and plasma displays
The figures below show the spectral results for each colorchannel of all tested LCD monitors and plasma displays.Figure B1 is normalized on the average value between 450and 455 nm. Figures B2 and B3 are normalized on the peakvalue. Figures B4–B6 are normalized on the area under the
TABLE A1 — Red/cyan anaglyphic 3-D glasses measured.
Journal of the SID 15/11, 2007 895

curve. These normalizations were chosen so as to more eas-ily reveal the similarities and differences between the vari-ous traces.
FIGURE B1 — Blue-color-primary spectral output for 13 LCD monitors.
FIGURE B2 — Green-color-primary spectral output for 13 LCD monitors.
FIGURE B4 — Blue-color-primary spectral output for 14 plasma displays.
FIGURE B3 — Red-color-primary spectral output for 13 LCD monitors.
FIGURE B5 — Green-color-primary spectral output for 14 plasmadisplays.
FIGURE B6 — Red-color-primary spectral output for 14 plasma displays.
896 Woods et al. / Characterizing anaglyph crosstalk on LCD monitors and plasma displays

Appendix C: Crosstalk calculation results forLCD monitors and plasma displaysThe following tables contain the results from the crosstalkcalculation program. Every combination of anaglyph glassesand display has been calculated. The lowest overall crosstalkcombinations are highlighted in bright green and the worstoverall crosstalk results are highlighted in orange. Overall
crosstalk results of less than 15 have been highlighted inlight green. Red crosstalk percentages less than nine havebeen highlighted in pink, and cyan crosstalk percentagesless than 1.5 have been highlighted in cyan. These thresholdfigures do not have any significance apart from allowing usto highlight the lower crosstalk results.
TABLE C1 — Crosstalk calculation results for the LCD and CRT monitors. The top left cell of each combination is red crosstalk %, the top right cell ofeach combination is cyan crosstalk %, and the bottom cell of each combination is the overall crosstalk factor and uncertainty.
Journal of the SID 15/11, 2007 897
Andrew J. Woods is a research engineer with theCentre for Marine Science and Technology at Cur-tin University of Technology, Perth, Australia. Hereceived his MEng and BEng (Hons1) degrees inelectronics engineering and has nearly 20 yearsexperience in the design, application, and evaluationof stereoscopic imaging solutions for teleopera-tion, industrial, and entertainment applications.He is co-chair of the annual Stereoscopic Dis-plays and Applications Conference (since 2000)
and in 2005 was co-chair of the annual Electronic Imaging: Science &Technology Symposium.
Ka Lun Yuen is a graduate of Curtin University ofTechnology with a double bachelors degree inphysics and education.
Kai S. Karvinen is currently completing a doublebachelors degree in physics and electrical engi-neering at Curtin University of Technology and isa tutor in the Department of Electrical Engineeringat Curtin University of Technology.
TABLE C2 — Crosstalk calculation results for the plasma displays. The top left cell of each combination is red crosstalk %, the top right cell of eachcombination is cyan crosstalk %, and the bottom cell of each combination is the overall crosstalk factor and uncertainty.
898 Woods et al. / Characterizing anaglyph crosstalk on LCD monitors and plasma displays