aneural networkarchitecture for general image recognition · pdf file• harveyetal. a...
TRANSCRIPT

A Neural NetworkArchitecturefor General Image RecognitionRobert L. Harvey, Paul N. DiCaprio, and Karl G. Heinemann
• As part ofLincoln Laboratory's research on neural network technology, a generalputpose machine vision system that can learn to recognize diverse objects has beendesigned. The system models human vision, primarily with neural networks, and thelearning is by example.
We tested the system on two disparate classes ofobjects-militaryvehicles andhuman eells-with video images ofnatural scenes. These objects were chosenbecause large databases were available and because most researchers judged the twotypes ofobjects unrdated. When we trained and tested the system on 40 images ofmilitaryvehicles, the system was able to recognize the tanks, howitzers, and armoredpersonnel carriers without any errors. Pathologists at Lahey Clinic Medical Centercollaborated in the cytology study in which we trained and tested the system on156 cell images from human cervical Pap smears. The system recognized normal andabnormal (Le., precancer) cells perfectly. Because ofthe small number ofsamples ofthe military vehicles and Pap-smear cells, these results are preliminary.
We should note that the architecture ofthe system is applicable to many civilianand military tasks. The application depends mainly on training.
If one way be better than another, that you may be sure isNature's way.
-Aristode
RESEARCHERS HAVE BEEN STUDYING machine vision (MY) technology for more than 30 years.As a result of their work, a standard technology
for computer vision has evolved. The most rigorous ofthe conventional MY methods comes from D. Marr'swork at MIT in the 1970s (see the box "ConventionalMachine Vision Design"). Yet, to some researchers andpotential users, the performance of conventional MYsystems is disappointing. To establish the context of ourwork, we quote from a recent review byA. Rosenfeld []],a founder and leading MY figure:
... Standard vision techniques for feature detection,segme,ntation, recovery,' etc., often do not performverywell when' applied ro natural scenes.
Ideally, the [vision process] stages should be closely integrated; the results obtained ar a given stageshould, provide feedback to modify the techniquesused at previous stages. This is rarely done in existing
vision systems, and as a result, lide is known abouthow to design systems that incorporate feedback between stages.
. . . Humans can recognize objeets--even complex objects whose presence was unexpected-in afraction ofa second, which is enough time for only afew hundred (!) "cycles" of the neural "hardware" inthe human visual system. Computer vision systemshave a long way to go before they will be able tomatch this performance.
Our main goal was to develop a general MY architecture thatwould work on a variety ofimage types withoutsignificant changes in the algorithm. This robusmesscontrasts with the current practice of tailoring an MYsystem to a specific application. Such tailored systemshave not performed well in situations unforeseen by thedesigners.
In many respects the human vision system-knownfor its high performance over a wide range ofobjects andsituations--is far superior to current MY systems. Thus,in developing the architecture ofour system, we decidedto model the human vision system. Although this idea
VOLUME 4. NUMBER 2. 1991 THE LINCOLN LABORATORY JOURNAL 189

• HARVEY ET ALA Neural Network Architecture for General Image Recognition
CONVENTIONAL MACHINEVISION DESIGN
TO A MAJOR EXTENT, conventionalmachine vision (MY) technologyevolved from the work ofone man,
D. Marr, at MIT in the 1970s.Developed from the informationtheory, cybernetics, and digital computer technology ofthat era, Marr's
contributions were made within thefield of artificial intelligence. His
work led to numerous papers onvision and, finally, to the bookVision [l], which was published
after Marr died ofleukemia in 1980at the age of 35. Reference 2 provides a recent summary of Marr'swork in relation to that ofothers.
An acknowledged contributionof Marr's was his attempt to clarifythe thinking about vision systemsor, more generally, information processing systems. In his work, Marr
introduced the distinction amongthree levels ofexplanations: (1) thecomputational theory, (2) the algorithm, and (3) the hardware im
plementation. Consideration ofthese levels and associated issues
leads to a sequence ofquestions that
guides the design.At the time, Marr's explicit ideas
somewhat puzzled researchers in
vision because other approachesused concepts that were undefined,or they used descriptions ratherthan explanations. Marr attained a
high degree of rigor because his approach produced ideas that could
be directly checked by computersimulation.
At the computational-theory level, Marr assened that the key issue
is to determine both a goal for thecomputation and strategies forachieving that goal. By explicitly
stating the goal and accompanyingstrategies, we can describe what the
machine achieves and characterizethe constraints. Knowledge of theconstraints, in turn, allows the
processes to be defined. At the algorithm level, the key issue is how
the input and output are represented, and the actual algorithm fortransformation. The algorithm willdepend partially on the nature ofthe data representation. At the implementation level, the key issue is
how the machine acrually works.The concern here is with the hardware of the machine, and the na
ture and operation of its component parts.
For example, applying Marr's ap
proach to optical sensors and twodimensional processing leads to a
modular design with the followingconsecutive processing stages:
Stage 1. Extract features such asedges from an image to produce amap representation. The map(called the primal sketch) consistsof pixels and their feature values,
such as edge strengths. (In this context, edge strengths are various com-
binations offirst and second derivatives at each point in the image.)
Stage 2. Improve the mapby grouping pixels in connectedregIons.
Stage 3. Represent the map by anabstract relational structure.
Stage 4. Recognize objects bycomparing the strUcture with storedmodels.
Three-dimensional scenes are anextension oftwo-dimensional ones.For the extension to three dimensions, stages 1 and 2 should bereplaced by a method to find thesurface orientation ofeach pixel. The
process will produce a representation map called the 2Y2-D sketch.
Further extensions of Marr'smethod add one or more of the
following stages: (1) cleanup of input pixel values with image-restoration techniques, (2) production ofmultiple images for stereomapping and motion analysis, (3) ad
justment of the processing byfeedback from later stages to earlierstages, and (4) recognition of ob
jects by matching them with models made up ofcomposite parts.
Refl!rences
1. D. Man, Vision (W.H. Freeman, SanFrancisco, 1982).
2. 1. Gordon, "Marr's Computational Approach to Visual Perception,» in Theo,us of Vzsual Pl!rception Oohn Wiley,
ew York, 1989), chap. 8.
190 THE LINCOLN LABORATORY JOURNAL VOLUME 4. NUMBER 2. 1991

• HARVEY ET AL.A Neural Network Architecturefor General Image Recognition
was not new, our approach was; it was to model theentire system module by module, primarily through theuse of neural networks. We also incorporated featuresthat give the human vision system advantages over MY
systems, namely, feedback, parallel architecture, and aflexible control structure. We tested the system moduleby module and in its major composite subsystems.
Two new technologies made this study feasible: neural network theory and a new class ofcomputers. These
technologies were not available in the 1970s, whenMarr developed his method.
The Approach-A Biologically Inspired System
Our approach was to model the human brain. Thus we
based the functions and names of different modules onstructures in the human vision system (see the box "Hu
man Vision-A BriefSurnrnary"). The modules roughlyapproximated functions of their biological counterparts.For convenience, we used a mixture of neural networks
and standard processing algorithms to implement themodule functions.
Our system recognizes gray images in a field ofview(FOY); the images can have arbitrary translations androtations. We omitted certain biological features-bin
ocularity, size invariance, motion perception, color sensitivity, and the discernment of virtual boundaries-be
cause we wanted to study the simplest architecture.Moreover, these features are unnecessary for many appli-
A20
El
r+f SUMII
•ITC1
A18 A21LGN
V2I.A,V~,~,~,~~1~ I'CALIBRATEI
~ ITC2• ," w • "., .$ ~. '._ .
IVISAREA21INORMALIZEIk • ( ; J' ;g" ' ... "I STO
1*A17
FineAdjustment V1 I SPIRAL I
.. MAP ~ ...IVISAREA11Coarse
Adjust.entA71
PPC IDELTA1 I... SUPERC .-HADJUSTMENT II IDELTA2 I
t Enable
InputImage
525@}525
.... Principal Data Flow Paths~ Tuning and Control Paths
FIGURE 1. Block diagram of the neural network architecture. The modules that are in the location channel are shownshaded in yellow, the modules in the classification channel are shaded in blue, and the modules common to bothchannels are shaded in gray. Some modules are neural networks; others use conventional processing (see text). A525 x 525 image with 8-bit pixels has been included at the left of the figure as an example input image. (Note: See thebox "Glossary of Acronyms" for definitions of the acronyms used.)
VOLUME 4, NUMBER 2, 1991 THE LINCOLN LABORATORY JOURNAL 191

• HARVEY ET AL.A Neural Network Architecture ftr General Image Recognition
HUMAN VISIONA BRIEF SUMMARY
THE HUMAN BRAIN has three main
structures-the forebrain, the mid
brain, and the hindbrain. Figure A
(top) shows the forebrain, or neo
cortex. Red indicates some of the
areas associated with vision.
The visual cortex occupies the
entire back half of the neocortex
hemisphere. At least a dozen corti
eal areas (not all shown in Figure A
but described by D.H. Hubel in
Reference 1) are involved with the
vision process. Areas 17, 18, and 19
are feature detectors, areas 20 and
21 function as classifiers, and area
7b helps to locate objects in thefield of view (FOY). (Note: The
numbering scheme was originated
Area 8
Area 20, 21
Area 7
Area 17
Area 18
LGN
Y Retina Cell
X Retina Cell
Temporal
Legend
<J Synapse (Weights)
o Typical Neuron
FIGURE A. Neural network vision model: (top) sketch of human forebrain in which areas associated withvision are shown shaded in red, and (bottom) block diagram of human vision process.
cations (see the section '~pplications and Extensions").
The architecture of the system includes two major
channels that work together. The location channel search
es for objects of interest in the FOV and, after one is
found, the classification channel classifies it. Studies of
the human vision system as well as that of other animals
suggest that the locating and classifYing functions are
separate [2].
192 THE LINCOLN LABORATORY JOURNAL VOLUME 4, NUMBER 2, 1991

• HARVEY ET AL.A Neural Network Architecture for General Image Recognition
by K Brodmann in 1909.)
Cenain modules in the midbrain
also belong to the visual system: for
example, the lateral geniculate nucleus (LGN), shown in Figure A
(bottom). The optic nerves relay
the images captured by the eyeballs
to the LGN, which has processing
functions and acts as a buffer.
The retina has about 1.25 X 10⁸
receptors. Data compression by ret
inal ptocessing is about 125 to 1,
which gives a resolution near the
fovea ofabour 1000 X 1000 pixels.
Assuming 7 bits ofrelative discrim
ination of stimulus frequency per
pixel [2] and a 100-Hz pulse fre
quency along the optic nerve, we
find that the data rate to the visual
cortex is about 700 Mb/sec, less
than the capacity of fiber optic
channels.
Researchers have mapped over
30 pathways among the visual areas
bur the actual number probably is
much larger because there are many
connections to areas that have not
been studied. A basic finding is that
with few exceptions the pathways
connect the modules in reciprocal
fashion.
Evidence shows a hierarchical
structure for the vision system [3]
for the dozen visual areas, the over
all cortical hierarchy has six levels.
Anatomical, behavioral, and physi
ological data show two distinct
channels for classifying and locat
ing. In Figure A (bottom), the clas
sification channel consists of the
LGN, AI7, AI8, AI9 (not shown
in the figure), AlO, and All; the
location channel consists of the
LGN, AI8, A7, andA8.
The two channels separate at the
retina and they have their own reti
nal cells, labeled X and Y (Another
cell type not shown, the W cell,
goes to the midbrain areas to coor
dinate the FOV to head and eye
movements). At the cortical and
midbrain levels, the channels re
main separate. Evidence shows
the classification channel analyzes
form and color while the location
channel analyzes visual motion
across the FOY:
In AI7, AI8, and AI9, three
types of cells work like feature de
tectors. The features in primate vi
sion are stationary or moving edges,
slots or lines, and their respective
ends [1]. (In comparison, the fea
tures in current MY technology aremuch more varied: corners, human
faces, spatial frequencies, and re
sponses of matched filters are typi
cally used).
The population of retinal cells
that feed into a given feature cell are
not scattered about all over the
retina bur are clustered in a small
area. This area of the retina is
called the receptive field of the fea
ture cell. The size of the recep
tive field of simple cells is about
one-quarter degree by one-quarter
degree at the fovea.
Research shows that feedback
rakes place in the human vision sys-
tern [4]. In normal operation, stim
ulating AlO changes the receptive
fields of AI7. This result suggests
that AlO exerts feedback conuol
over the feature detectors. Thus rec
ognition is likely an active feedback
process that restructures the feature
extraction stage. The restructuringcontinues until the transformed in
put matches some known class of
stimulus. Research also suggests that
there is a mechanism for directing
attention within the FOY: In short,
windowingrakes place. Wmdowingfocuses attention on small derails
and also suppresses notice of other
objects in the FOY: Researchers sus
pect that the midbrain directs the
windowing process auromatically,
perhaps by using cortical inputs.
In summary, human vision is a
system in which a small number of
serial stages (sensor-preprocessor
feature-extracting-classifier) pro
cess large arrays of data in parallel.
The architecture has two channels
that use feedforward and feedback
signals.
References
1. D.H. Hubel, Eye, Brain, and Virion(W.H. Freeman, New York, 1988).
2. T.B. Sheridan and W.R. Ferrell, ManMachine Sysrems (MIT Press, Cambridge, 1974), p. 261.
3. D.C. Van Essen and ].H.R. Maunsell, "Hierarchical Organization andFunctional Streams in the VisualCortex," Trends Neurosci. 6, 370(l983).
4. E.W. Kent, The Brains ofMan andMachines (McGraw-Hill, New York,1981).
Figure 1 shows a block diagram of the architecture,
the box "Glossary of Acronyms" contains a list of the
acronyms used, and the following sections briefly de
scribe the functions of each module. We used feed-
forward and feedback paths to coordinate the modules.
To illustrate how the system works, we carry through an
example of a 525 X 525-pixel input image with 8-bit
pixels. For convenience, we start our description with
VOLUME 4, NUMBER 2, 1991 THE LINCOLN LABORATORY JOURNAl 193

• HARVEY ET AL.A Neural Network Architecturefor General Image Recognition
the classification channel and the modules that are common to both channels.
Classification Channel
Certain classification-channel modules approximatethe functioning of selected brain areas: the lateral geniculate nucleus (LGN), visual area 1 (VI, also calledAI7; see the box "Human Vision-A Brief Summary"), visual area 2 (V2, also called AI8), inferiortemporal cortex 1 (ITCI, also called AlO), and inferior temporal cortex 2 (ITC2, also called All).Other modules, such as the SUM module, approximate certain biological functions without the anatom-
GLOSSARY OFACRONYMS
FOV-field ofview
ITCI-inferior temporal cortex 1 (also calledAlO); an unsupervised classifier
ITC2-inferior temporal cortex 2 (also calledAll); a supervised classifier
LGN-lateral geniculate nucleus; buffers andplaces a window around an object
LTM-Iong-term memory
MY-machine vision
PPG--posterior parietal cortex; centers a window about an object
SUPERG--superior colliculus; performs coarselocation ofan object
VI-visual area 1 (also called AI7); extracts
high-resolution features from an image
V2-visual area 2 (also calledAI8); extracts
information about an object's general shape
194 THE LINCOLN LABORATORY JOURNAl VOLUME 4, NUMBER 2,1991
ical correspondence, as described below.
LGN-Grayness Processing
Figure 2 shows the front-end processing in the classification channel. The LGN uses inputs from the locationchannel (see the following section) to place a windowaround an object. We set the window size to fit theobject, so the system does not emulate size invariance.Starting with a 525 X 525-pixel input image, our example uses a window of 175 X 175 pixels.
The CALIBRATE and NORMALIZE boxes ofLGN(Figure 1) operate on gray-scale imagery. CALIBRATEperforms a histogram equalization of the object's pixelvalues, and NORMALIZE rescales the pixel values sothat they leave LGN within a range from zero to one.These two procedures enhance the image contrast andadjust for varying brightness in the FOY:
Vl-High-Resolution Features
The first feature-generating module is VI, which breaksthe input window into subwindows of 7 X 7 pixels.Thus, in our example ofa 175 X 175-pixel window, thereare 625 subwindows. Note that the 7 X 7 subwindow sizeis unrelated to the input image size. Each 7 X 7 subwindowis then processed by SPIRAL MAP and VISAREAI.
SPIRAL MAP (Figure 1) scans through the subwindows in a spiral pattern. The mapping proceeds as follows: left to right across the top row, down the rightcolumn, right to left across the bottom row, up the leftcolumn, back across the second rovv, and so forth untilthe process ends at the center subwindow. The purposeof the spiral mapping is to simplify interpretation of thefeature data.
VISAREAI (Figures 1 and 2) does the high-resolution feature extraction. For each 7 X 7-pixel subwindow,VISAREAI measures luminance gradients (increasing ordecreasing) in four different directions. A gradient is acharacteristic ofgray images, and is analogous to an edgein a binary image. The luminance gradient in our systemis the rate ofchange, or slope, in brightness across a 7 X 7subwindow. Windows with an abrupt step in brightnessin one direction will have a large gradient in that direction; windows with a gradual change in brightness fromone side to the other will have a small gradient; andwindows with uniform brightness, i.e., windows with novisible edges, will have zero gradient.

• HARVEY ET ALA Neural Network Architecturefor General Image Recognition
Feature Vector(SUM)
1Line
Typical NormalizedCell Image (V2)
I
4Lines
/~II J 175
I / 7525 ,,/
~1 ~LocationAdjust (V1 )/i x,/iy 2500
Lines
FIGURE 2. Summary of image processing operations. For the example of a 525 x 525 input image (Figure 1), theclassification channel places a window of 175 x 175 pixels around the object in the image. (The window size is set tofit the object size.) The 175 x 175 window is then broken into subwindows to extract details of the image, and thedetails are stored in a feature vector.
Because the slope depends on direction, the gradientsin different directions are usually not the same. The
system produces representative gradients in four directions-vertical, horiwntal, and the 45° diagonals-foreach 7 x 7 subwindow.
The gradient detectors in the system use cooperativecompetitive neural networks that model similar biologi
cal processes. In biological nervous systems, a neuron iseither excitatory or inhibitory; i.e., it either attempts toturn on or turn offother neurons [3]. A general coopera
tive-competitive neural network employs a mixture ofinteracting excitatory and inhibitory neurons. Cooperative-competitive neural networks are one type of neural
network. Other common types are special cases that canconsist of only inhibitory neurons, which produce oncenter/off-surround networks.
For binary images, we found that on-centerloff-sur-
round networks could detect the edges and measure their
orientations. However, the gradients in gray images required cooperative-competitive networks for the sametasks. Our feature-extracting neural networks had 25hidden neurons and one output neuron. We used fixed
neuron connection weights that we computed off-line bya genetic algorithm method, described in Reference 4.
To help interpret the feature values obtained fromSPIRAL MAP and VISAREAl, we arranged the VI
outputs in a vertical vector (Figure 2). For the 175 x 175pixel window, there were 2500 VI feature values becauseeach 7 X 7 subwindow produced four values. We stored
feature values from the image's outer parts at the top ofthe vector and feature values from inner parts at thebottom of the same vector. Thus data about the generalshape ofan image could be found at the top ofthe vectorand data about the interior at the bottom.
VOLUME 4, NUMBER 2, 1991 THE LINCOLN LABORATORY JOURNAL 195

• HARVEY ET AL.A Neural Network Architecturefor General Image Recognition
}F2Level
IF1Level
TurnoffandResetF2 Nodes
Q)ucctl
Ol .....--,
> CompareM-"......Norm
FIGURE 3. Summary of the ART-2 classifier, a neuralnetwork with two levels F1 and F2 that consist of interconnected neurons. The bottom layer of F1 receives aninput pattern that is then filtered, enhanced, and rescaledby the three F1 layers. The filtered pattern appears at F1'stop layer, which is connected to the F2 level. The filteredpattern is the pattern that ART-2 stores.
IInputFeature
.....&_...&..._L----"_....L._.&-_ Vecto r
There are three classes of ARTs. ART-I, which was
developed first, is used with binary inputs; ART-2 is usedwith patterns consisting of real numbers; and ART-3
handles sequences ofasynchronous input patterns in realtime. This study used ART-2. Several versions ofART-2
exist, but they all have the same basic characteristicsdescribed below.
Figure 3 shows the basic structure ofART-2, a neural
network with two levels of interconnected neurons, F1
and F2•The neurons are mathematical models ofbiological neurons. In the figure, the bottom layer ofF1 receivesthe input pattern-a list of numbers representing the
input. F1 consists of three layers of interconnected neurons that filter out noise, enhance the shape of the
pattern, and rescale the input pattern values. The filteredpattern appears at Fl's top layer, which is connected to
neural network classifiers, such as perceptrons andHopfield nets, because of ART-2's speed, stability, feature amplification, and noise reduction-features thatwere better suited to our application. ART-2 is also abetter model of the biology.
Adaptive Resonance Theory (ART) is a learning theory introduced by Boston University professors G. Carpenter and S. Grossberg [5]. ART mimics the humanbrain by taking inputs from the environment, organizing
the inputs into internally defined categories, and thenrecognizing similar patterns in the future.
V2-Shape Features
The second feature-generating module is V2 (Figures1 and 2), which detects edges near the perimeter ofthe input window. V2 is also part of the location channel(see the following section), and its output contains infor
mation about an object's general shape.To detect edges, V2 produces a single defocused 7 x 7
image of the 175 x 175 input. In the defocused image,
each pixel corresponds to a subwindow of the originalinput. AVERAGE sets a subwindow size that partitionsthe input image and then computes a mean pixel valuefor each of the subwindows. For the 175 X 175-pixelwindow, the subwindows are 25 X 25 pixels.
VISAREA2 detects edges near the four sides ofthe defocused image. The output of this module, which usescooperative-competitive neural networks similar to those
in VI, contains four values that measure the edge strengthson the north, east, south, and west sides ofthe 175 X 175
unage.
SUM-Size Feature
The third feature-generating module is SUM (Figures 1and 2), which adds up the pixel values of the inputwindow. Thus the single output from SUM measures
the object's gross size. The corresponding biological function occurs in both VI and V2, but we have made it
separate for the sake ofconvenience.
Feature vector
The system classifies objects by using features based ondetailed structure (VI), overall shape (V2), and size(SUM). The different subwindow sizes ofVI, V2, and
SUM approximate the different size-receptive areas ofthe visual conex. For the 175 X 175-pixel window, thereare 2500 values from VI, four values from V2, and one
value from SUM. These 2505 values form the featurevector. We can adjust the values ofeach module's outputto give equal influence to an object's size, shape, anddetailed structure (see the section "Test Results").
fTC] Module-Unsupervised Clmsification
The recognition process consists ofan unsupervised classifier (ITCl) followed by a supervised one (!TC2). Forthe unsupervised classifier, we used the well-known
ART-2 neural network. We selected ART-2 over other
196 THE LINCOLN LABORATORY JOURNAl VOLUME 4. NUMBER 2, 1991

• HARVEY ET AL.A Neural Network Architecturefor General Image Recognition
the F2 level. The filtered pattern, called the exemplar, is
the pattern that ART-2 stores.In the F2 level, each neuron represents a category, or,
with high sensitivity (see below), one example input that
defines a category. The activation of F1 and F2 modelsthe activation of biological neurons.
The F1 and F2 levels are connected in both a bottomup and top-down fashion by the long-term-memory(LTM) trace. Mathematically, the LTM trace is the set of
weights given to the F1 neurons as they attempt to turnon an F2 node. Functionally, the LTM trace stores information permanently or until the trace is modified by
learning. The LTM trace models the synaptic junctionsof biological neurons.
To train an ART-2, the initial LTM trace values are set
according to a rule given by Carpenter and Grossberg[5]. Next, a set of training patterns is presented to Floneafter another. Initially, when ART-2 is untrained, the first
pattern immediately causes the neural network to enterinto the learning mode. The network learns the patternby modifying the weights associated with one of the F2
nodes.After the first pattern is learned, each succeeding pat
tern will trigger the network to search for a match amongthe F2 nodes. Ifthe pattern is a close match to a previous
ly learned pattern, ART-2 enters the learning mode andmodifies the LTM trace so that the trace is a compositionof all the past, closely matched patterns. If the pattern is
mismatched with all the previously learned patterns,ART-2 goes into the learning mode and learns the pattern by modifYing the weights associated with an unusedF2 node. Thus each pattern is automatically associated
with an F2 node, and in this manner ART-2 programsitse1£
After training is completed and a new pattern is presented, the pattern's exemplar is produced, and ART-2searches the LTM trace for the stored pattern that mostclosely matches the exemplar. When a match is found
the corresponding F2 neuron turns on, indicating thecategory that best matches the pattern.
Before using ART-2, we must set several parametersthat influence the network's performance. For many of
these parameters, suitable values have been determinedby experience. One parameter of imponance is the Vigilance, which serves as a threshold on the degree of simi
larity between the LTM trace and the input pattern's
exemplar. If a cenain mathematical matching formula
equals or exceeds the Vigilance, that pattern will beassociated with the corresponding F2 node. When theVigilance criterion is not satisfied, ART-2 declares a mismatch and searches for a match among the other nodes.
The selection of a low Vigilance value (i.e., a valuenear 0) leads the system to tolerate large differences,
resulting in coarsely defined categories. A high Vigilancevalue (i.e., a value near 1) leads to increased sensitivity in
pattern discrimination, resulting in finely defined categories. In practice, the Vigilance should be adjusted high
enough to distinguish patterns that represent differentcategories. However, the value should be low enoughthat slight changes resulting from incomplete or wronginformation will not cause mismatches.
ITC2 Module-External Labels and Flexible Control
After training, the ITC1 (ART-2) output nodes in F2
correspond to particular patterns, or objects. For instance, if the first ten examples are tanks, the first tenITC1 output nodes will correspond to tanks. In ourbasic system, the supervised classifier ITC2 uses a simple
logical OR operation to associate activity ofany of thesenodes with the name TANK
(Note: ITC1 is called an unsupervised classifier be
cause the label of an input pattern is the F2 node number, which is automatically and internally defined by thealgorithm. ITC2 is called a supervised classifier becausethe user defines the labels externally.)
After ITC2 processing, the system decides whether to
store the object's name and location, and the ART-2
matching parameter [5] serves as a confidence measure
for the decision process. If the matching parameter justpasses a threshold (the Vigilance), the confidence level is50%. A perfect match corresponds to a confidence levelof 100%. If the confidence level passes a second thresh
old specified by the user, the system stores the results. Butif the confidence is not high enough, the location chan
nel adjusts the window (discussed in the following section) and the system processes the image again.
Location Channel
The location channel places an input window around an
object so that the system might classifY it. As shown inFigure 1, the location channel consists of the following
modules: superior colliculus (SUPERC), LGN, V2, and
VOLUME 4, NUMBER 2, 1991 THE LINCOLN LABORATORY JOURNAL 197

• HARVEY ET AI...A Neural Network Architecturefor General Image Recognition
posterior parietal cortex (PPe). Location is a two-stageprocess consisting ofcoarse location followed by pull-in.
SUPERG-Coarse Location
The SUPERC module uses a second ART-2 neural network to perform coarse location. The network's LTMtrace, which we compute off-line, corresponds to generalshapes ofinterest. This trace primes the system. To detectthe presence ofan object, the SUPERC ART-2 comparesthe exemplar of its current window to the LTM trace.Even an off-center object will trigger a match if theobject's size is correct.
SUPERC judges a match by comparing the ART-2matching parameter with a threshold [5]. If the systemdoes not find a match, SUPERC shifts its attention to anabutting window. When a match does occur, SUPERCsends signals to other modules; the ART-2 matchingparameter is an Enable signal for LGN, and the PPCmodule receives the coarse position as a starting point tocenter the window.
PPC-Pull-In
Pull-in operates over a feedback path that consists ofLGN, V2, and ppe. Using the outputs of V2, PPCmakes small changes in the window's position. When thesystem centers a window on an object, all the V2 edgestrengths are about equal. Otherwise, PPC tries to equalize the V2 edge strengths. For example, Figure 2 showsan object that is above and to the right of the window.This position produces a stronger north than south response and a stronger east than west response because ofthe stronger gradient. To center the object, the D ELTA-1box (Figure 1) must move the window north and east.
A second pull-in path, which consists of LGN, V2,ITC1, ITC2, and PPC, makes repeated tries at recognition. ITC2 activates this path when the classificationchannel has low confidence in a match between an inputpattern and the closest stored pattern. When the path isactivated, the DELTA-2 box generates a small, randomadjustment ofthe window's position and the system thentries to classify the object with greater confidence. Acounter limits the number of tries.
The Software Testbed
One ofour major goals was to test the architecture withcomputer simulation. To that end, we developed a series
198 THE LINCOLN LABORATORY JOURNAL VOLUME 4. NUMBER 2. 1991
ofsoftware testbeds to study the algorithm performance.As we programmed the testbeds to handle more complexand extensive data, the architecture and algorithmsevolved.
We built up the software in three stages. The earliestversion was written in the APL*PLUS programminglanguage and ran on an IBM PCIAT. Using synthetic binary images such as alphabetic letters, theAPL*PLUS software tested algorithms for the individualmodules.
We developed a second version for Sun Microsystemsworkstations. The Sun testbed provided a convenientoperator interface, handled gray-scale images from realsensors, and incorporated algorithm modifications thatwere needed to process gray-scale data.
A third version incorporated a Convex C220 supercomputer along with the Sun 4/110 or SPARC workstation. The Sun/Convex testbed increased the run speedwhile maintaining the previous version's operator interface and options. We used the Sun/Convex testbed totest the databases of military vehicles and Pap-smearunages.
Source code for the Sun and Sun/Convex testbedswas written in the C programming language, and theprograms ran under the UNIX operating system. In theSun/Convex testbed, we distributed the module functions between the two computers: the Sun workstationperformed 1/0 and interacted with the operator whilethe Convex computer carried out the VI and ART-2calculations. A local area network enabled communication among the separate subprograms.
Adapting and optimizing the VI and ART-2 sourcecode for the Convex computer resulted in performancegains that were dramatic (our colleague e. Mehanianoptimized the ART-2 algorithm). For example, the SunlConvex testbed ran VI over a 175 x 175 image in only45 sec, while a Sun 4/110 required 4Y2 min. On theConvex, ART-2 learned the corresponding feature vectorin only 18 sec, as compared to 20 min on a Sun 4/110.
Figure 4 shows the Sun screen display, which consistsofa set ofwindows. The operator enters data through thekeyboard and selects run options with a mouse. Algorithm execution can be monitored by text and graphicaldisplays. Figure 4 displays a normal cell, its histogram,and its feature vector.
To test large databases, we have programmed a batch

• HARVEY ET AL.A Neural Network Architecturefor General Image Recognition
1 'pl i.,... ·or LGN Sun: 8.981.... 1 plle' fo' V2 S1 Is: 8.1L nou flle:lTM ave file:
[ F ch L 'l lues I ( Store LTM .lues I
FIGURE 4. Sun workstation display of a Pap-smear cell, its histogram, and its feature vector.
mode in which a list of input images can be read automatically from a disk me. The batch option runsthe images through the algorithm without operatorintervention.
Test Results
We tested the major subsystems to assess their performance. To simplifY the interpretation of the results, wetested the location and classification channels separately.For the classification channel, we centered, or foveated,the objects by hand so that the tests evaluated recognition under ideal conditions. Thus our results gave anupper bound on system performance because the location process introduces additional errors.
The preliminary test results were auspicious. The system located and recognized objects in their natural settings, and the algorithm was robust with respect to
centering accuracy and clutter. In the following subsections we describe the classification-channel tests. (Note:The location-channel tests are contained in Reference 4.)
Military Vehicles
We assembled a dataset of three common military vehicles: an M48A5 tank, an MI13 armored personnelcarrier (APC), and an MIlO self-propelled howitzer. Thedatabase consisted of 40 images: 20 tanks, four APes,and 16 howitzers. The vehicles were at 700-m range,with orientations that varied from front-on to broadsideto end-on, and the background consisted of trees androlling hills.
The images, intensity measurements made with alow-level TV camera, were 120 x 128 pixels with eachpixel containing eight bits, so that 28 gray values couldbe represented. We made no effort to improve the
VOLUME 4, NUMBER 2,1991 THE LINCOLN LABORATORY JOURNAl 199

• HARVEY ET AL.A Neural Network Architecturefor General Image Recognition
Pap-Smear Cells
We assembled a dataset of 23 normal and 16 abnormalPap-smear cells (our Lahey Clinic collaborators judged
the cell types). The images were 175 X 175 pixels, with8-bit gray values. Figure 7(a) shows a typical image
FIGURE 6. SUM and V2 multipliers (Figure 1) for an 18image training set of military vehicles. Note that thenumber of categories was equal to the number of inputpatterns when we selected low values for both multipliers. As we increased the values of the multipliers, thesystem lost its ability to discriminate between certaincategories, and. the number of categories decreased below the number of inputs. The dotted line represents arough boundary for this transition. We selected a designvalue inside the boundary and near the elbow of thecurve.
I
~ 16 Categoriesf- Approximate Boundary out of 18 Inputs
~----------~--- +f- e ',_ 16{18
18{18 \
Design Value~18 ~IIII
1j8{18 el_15{18
I I I I I I I I I
V2 Multiplier
c.
...Q)
dow size and sensor properties.We trained the system on 10 random tank images
that spanned orientations from head-on to end-on, andthe corresponding exemplars were stored inART-2 nodes
othrough 9. Next we trained the system on eight howitzers, which were stored in ART-2 nodes 10 through 17.During training we used a Vigilance of 0.999, whichcorresponded to a 2.6° angular separation in featurevector space.
After the training was completed, we tested the system on the remaining 22 images. Table 1, which summarizes the results, shows that the system correctly classifiedthe remaining 10 tanks and eight howitzers. When the
Vigilance was set to 0.997, which corresponded to anangular separation of 4.4°, the four APC images wentto an untrained node. Thus, for this example, the systems recognition was errorless.
FIGURE 5. Typical intensity image of a howitzer.
images with, for example, preprocessing. Figure 5 shows
a typical image ofa howitzer.To simulate the foveation of an image, we centered a
42 X 42-pixel window by hand. The system then generated a feature vector that contained three kinds of data:SUM, VI, and V2. We varied the relative weighting
among the three components. Large SUM and V2 values resulted in VI having little effect on recognitionwhile small SUM and V2 values allowed VI to playapredominant role. By adjusting the SUM and V2 multipliers, we gave the three feature-vector components rough
ly equal influence.To find suitable weighting values, we trained the sys
tem on a small set of images and watched the resultingnumber ofcategories that ART-2 formed. Figure 6 showssome of our results for an 18-image training set. Notethat when the SUM and V2 multipliers have low values,
the number of categories is the same as the number ofinputs. As the SUM and V2 multipliers increase, the VIfeatures become less important, and the system loses itsability to discriminate between certain categories. Conse
quently, the number ofART-2 categories decreases belowthe number of input patterns. The dotted line in Figure
6 represents a rough boundary for this transition. Toobtain equal weighting for SUM, VI, and V2, we chose
a point inside the boundary near the elbow. In general,the SUM and V2 multiplier values depend on the win-
200 THE LINCOLN LABORATORY JOURNAL VOLUME 4, NUMBER 2, 1991

• HARVEY ET AL.A Neural Network Architecturefor General Image Recognition
Edge-Detector Results
(a)
Edge-Detector Results
(b)
FIGURE 7. Comparison of (a) normal Pap-smear cell and (b) abnormal Pap-smear cell.
of a normal cell and Figure 7(b) a typical image of anabnormal cell (the grid suggests the VI processing). Tothe right of the photographs, VI feature values nearthe cell's nuclei are shown.
To train and test the system on different orientations,we rotated each cell image 90°, 180°, and 270°. The
rotations expanded the dataset to 92 normal and 64abnormal cells, or 156 altogether.
As with the military-vehicle example, we selected themultipliers to weight the SUM, VI, and V2 contributions about equally. We trained the system with a Vigilance of0.99999, which corresponded to a 0.256° sepa-
Table 1. Preliminary Classification Results for Military Vehicles
System Classification
Tank Howitzer Unknown
Vehicle
Tank 10 0 0
Howitzer 0 8 0
Armored Personnel 0 0 4Carrier
Note: For training, we used 10 tanks and 8 howitzers.
VOLUME 4, NUMBER 2, 1991 THE LINCOLN LABORATORY JOURNAL 201
• HARVEYET AL.A Neural Network Architecture for General Image Recognition
Applications and Extensions
Reliable MY systems have many applications. Besidesthose areas of interest to MIT Lincoln Laboratory in
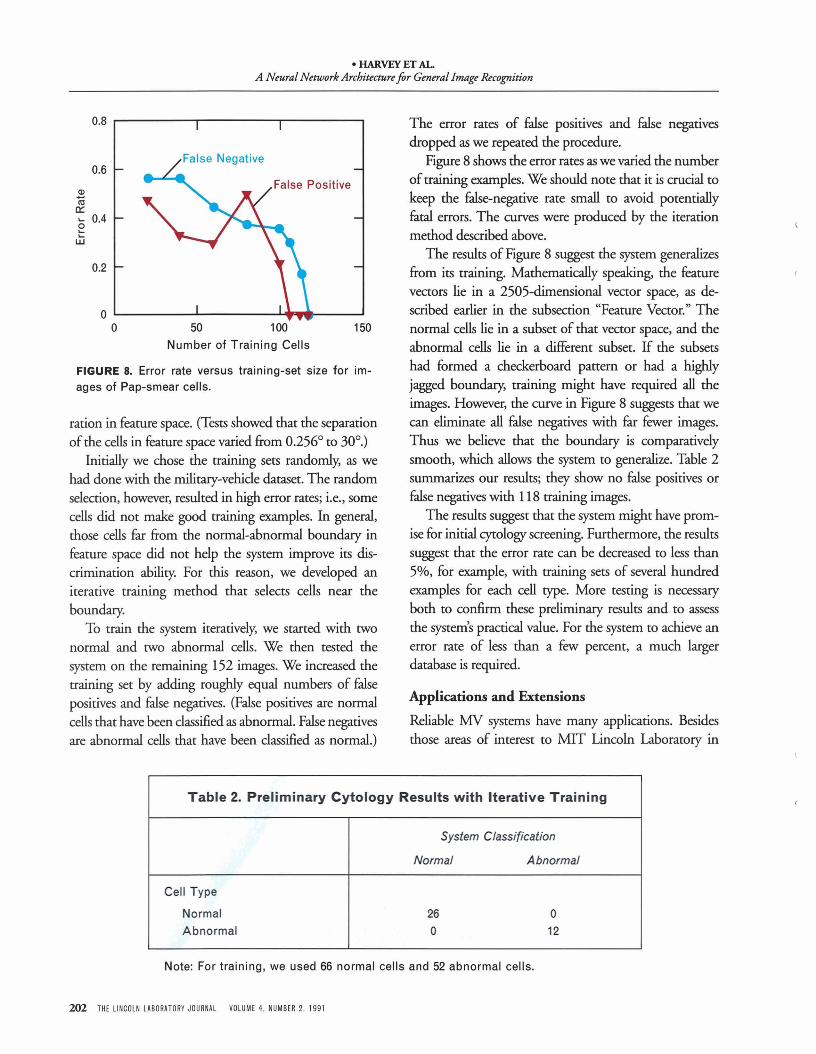
The error rates of false positives and false negativesdropped as we repeated the procedure.
Figure 8 shows the error rates as we varied the numberof training examples. We should note that it is crucial tokeep the false-negative rate small to avoid potentiallyfatal errors. The curves were produced by the iterationmethod described above.
The results of Figure 8 suggest the system generalizesfrom its training. Mathematically speaking, the featurevectors lie in a 2505-dimensional vector space, as described earlier in the subsection "Feature Vector." Thenormal cells lie in a subset of that vector space, and theabnormal cells lie in a different subset. If the subsetshad formed a checkerboard pattern or had a highlyjagged boundary, training might have required all theimages. However, the curve in Figure 8 suggests that wecan eliminate all false negatives with far fewer images.Thus we believe that the boundary is comparativelysmooth, which allows the system to generalize. Table 2summarizes our results; they show no false positives orfalse negatives with 118 training images.
The results suggest that the system might have promise for initial cytology screening. Furthermore, the resultssuggest that the error rate can be decreased to less than5%, for example, with training sets of several hundredexamples for each cell type. More testing is necessaryboth to confirm these preliminary results and to assessthe system's practical value. For the system to achieve anerror rate of less than a few percent, a much largerdatabase is required.
15050 100
Number of Training Cells
OL..-----...L-----...&.ll...---J
o
0.8 .-------,------,---------.
FIGURE 8. Error rate versus training-set size for images of Pap-smear cells.
0.2
Q)-roa::.... 0.4ew
0.6
ration in feature space. (Tests showed that the separationof the cells in feature space varied from 0.256° to 30°.)
Initially we chose the training sets randomly, as wehad done with the military-vehicle dataset. The randomselection, however, resulted in high error rates; i.e., somecells did not make good training examples. In general,those cells far from the normal-abnormal boundary infeature space did not help the system improve its discrimination ability. For this reason, we developed aniterative training method that selects cells near the
boundary.To train the system iteratively, we started with two
normal and two abnormal cells. We then tested thesystem on the remaining 152 images. We increased thetraining set by adding roughly equal numbers of falsepositives and false negatives. (False positives are normalcells that have been classified as abnormal. False negativesare abnormal cells that have been classified as normal.)
Table 2. Preliminary Cytology Results with Iterative Training
System Classification
Normal Abnormal
Cell Type
Normal 26 0
Abnormal 0 12
Note: For training, we used 66 normal cells and 52 abnormal cells.
202 THE LINCOLN LABORATORY JOURNAL VOLUME 4, NUMBER 2, 1991

• HARVEY ET AL.A Neural Network Architecturefor General Image Recognition
remote sensing and automatic target recognition, otheruses include medical screening, industrial inspection,and robot vision. The architecture ofour system is applicable to these diverse areas.
The basic system architecture is also extendable, andthe following subsections describe several possible extensions. We should note that the examples include newprinciples and so are speculative.
Sensor Fusion
A direct extension of our research is to combine parallelsensors. Figure 9 shows a fusion concept at the featurevector level. The bottom system is our basic system withminor additions, and the top is another system, whichcan be a different type.
The two systems produce features that train the classifier. Using video and laser-radar range images, we havedone preliminary tests of this concept [6].
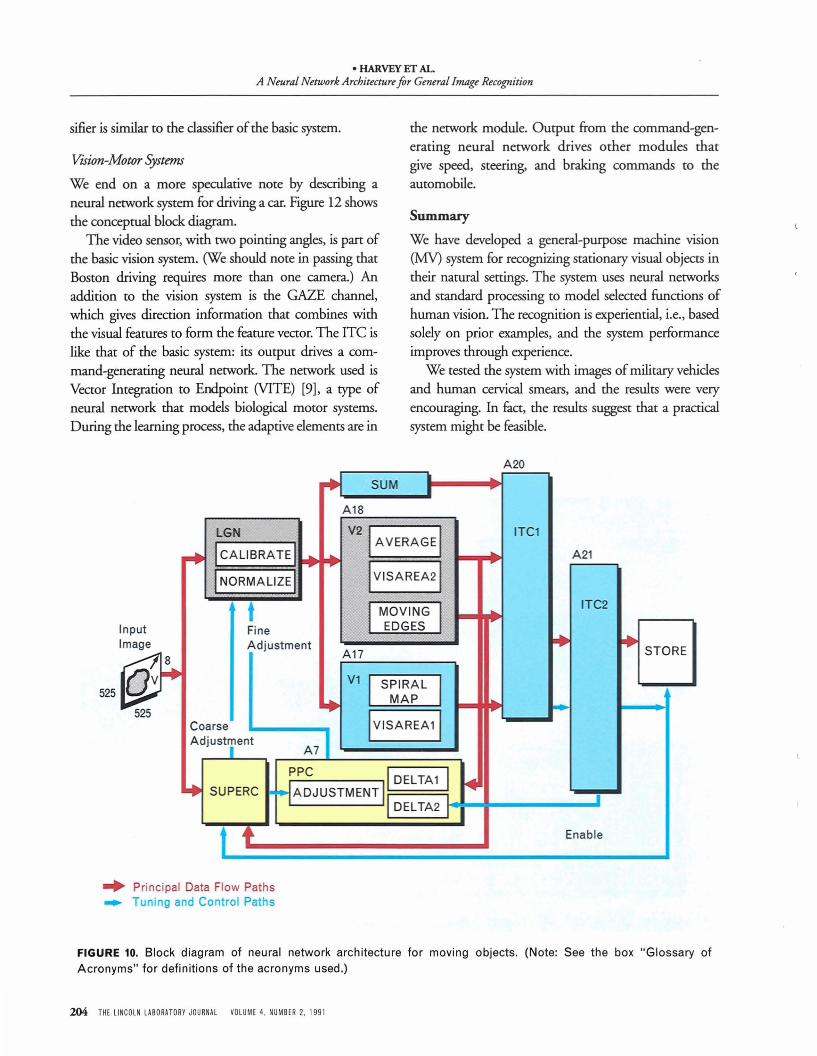
Moving Objects
Another extension is the capability to track and recognize moving objects. Figure 10 shows a conceptual blockdiagram in which an object in the FOV is moving inan arbitrary direction. To detect this motion, we can
add modules that are sensltlve to the motion ofedges at multiple orientations. These motion detectors would mimic the characteristics of biological visionsystems.
In Figure 10, the system feeds signals from the motion detectors back to the SUPERC module for tracking, and the motion-detection features are stored inthe feature vector for recognition. To use time-varyingfeatures for recognition, we can replace the ART-2module by an Avalanche neural network [7]. This modification would enable the recognition of, for example,a flying butterfly [8].
Binocular Vision
For an extension to binocular vision, Figure 11 shows ablock diagram of two of our basic systems working inparallel. In the figure, the SUPERC module pointsthe two "eyeballs," and the left and right FOV of eachsensor (denoted as Ll, L2, R1, and R2, respectively)go separately to two LGNs for calibration andnormalization.
The system uses parallel sets of feature detectors,and the feature vector consists of the left and rightfeatures and their difference, or disparity. The clas-
Feedback for Second Look
Medium-Receptive-Area Outputs
Imaging or Nonimaging Sensor
'-Q)
00 ~00 00~ 00 Store
Instantaneous FOV U <tl
""C U Result
• Q) ""C00 Q)
~ 00
Q) ~a. Q):l a.00 :lC en::::>
FIGURE 9. Block diagram showing a system that combines two parallel sensors.
VOLUME 4, NUMBER 2, 1991 THE LINCOLN LABORATORY JOURNAL 203
• HARVEY ET AL.A Neural Network Architecturefor General Image Recognition
sifier is similar to the classifier of the basic system.
Vision-Motor Systems
We end on a more speculative note by describing aneural network system for driving a car. Figure 12 showsthe conceptual block diagram.
The video sensor, with two pointing angles, is part ofthe basic vision system. (We should note in passing thatBoston driving requires more than one camera.) Anaddition to the vision system is the GAZE channel,which gives direction information that combines withthe visual features to form the feature vector. The ITC islike that of the basic system: its output drives a command-generating neural network. The network used isVector Integration to Endpoint (VITE) [9], a type ofneural network that models biological motor systems.During the learning process, the adaptive elements are in
the network module. Output from the command-generating neural network drives other modules thatgive speed, steering, and braking commands to theautomobile.
Summary
We have developed a general-purpose machine vision(MY) system for recognizing stationary visual objects intheir natural settings. The system uses neural networksand standard processing to model selected functions ofhuman vision. The recognition is experiential, i.e., basedsolely on prior examples, and the system performanceimproves through experience.
We tested the system with images ofmilitary vehiclesand human cervical smears, and the results were veryencouraging. In fact, the results suggest that a practicalsystem might be feasible.
A20
525
~ SUM • ..•
A18
V21 AVERAGEILGN ITC1.. ICALIBRATEI ... .-"0.... A21
IVISAREA21INORMALIZEI...
t IMOVING I ITC2
Input Fine EDGES
Image AdjustmentA17
.. ..STORE
1 8
Qv'r-+ V1 I SPIRAL I~ ~ MAP
~
IVISAREA11CoarseAdjust.ent
A71
PPC IDELTA1 I~~ SUPERC I-HADJUSTMENT II I
DELTA2 I
t t Enable
... Principal Data Flow Paths... Tuning and Control Paths
FIGURE 10. Block diagram of neural network architecture for moving objects. (Note: See the box "Glossary ofAcronyms" for definitions of the acronyms used.)
204 THE LINCOLN LABORATORY JOURNAL VOLUME 4. NUMBER 2. 1991

• HARVEY ET AL.A Neural Network Architecture for General Image Recognition
ow(J)
>c::~ Store:::>(J)
ow(J)
>c::wa..:::>(J)z:::>
ITCLGN
,A---....-J~ -./CALIBRATE I...........~
FIGURE 11. Block diagram of neural network architecture for binocular vision. (Note: See the box "Glossary ofAcronyms" for definitions of the acronyms used.)
We believe this approach to MY is promising formany applications. At Lincoln Laboratory we are studying improvements that include motion detection, application to microwave radar and passive/active infraredimagery, and integration into complex systems. We arealso considering the hardware implementation of selected modules.
Acknowledgments
The Innovative Research Program at Lincoln Laboratory supported this work from February 1989 toJanuary 1990. Our supervisor, Robert Rafuse, gaveus much encouragement.
We wish to acknowledge our Lincoln Laboratorycolleagues Mary Fouser, Al Gschwendtner, PatHirschler-Marchand, Paul Kolodzy, Gloria Liias,Courosh Mehanian, Murali Menon, and Alex Sonnenschein for their help and valuable discussions.
We are also grateful to Prof John Uhran, Jr., of theUniversity of Notre Dame, and Dr. Barney Reiffen andProf Mike Carter of the University of New Hampshirefor their consultation during this work. Special thanksgo to our Lahey Clinic Medical Center collaboratorsDrs. Mark Silverman and John Dugan.
This work was supported by the Department of theAir Force.
•VISION
FEATURES
GAZEFEATURES
ITC
TARGETCOMMAND
MAP
SpeedCommands
SteerCommands
BrakeCommands
FIGURE 12. Block diagram of neural network architecture for driving a car. (Note: VITE, or Vector Integration toEndpoint, is a type of neural network that models biological motor systems.)
VOLUME 4. NUMBER 2. 1991 THE LINCOLN LABORATORY JOURNAL 205

• HARVEY ET AL.A Neural Network ArchitecturefOr General Image Recognition
REFERENCES1. A. Rosenfeld, "Computer Vision: Basic Principles," Proc. IEEE
76,863 (1988).2. D.C. Van Essen and ].H.R. Maunsell, "Hierarchical Organi
zation and Functional Streams in the Visual Cortex," TrendsNeurosci. 6, 370 (1983).
3. F. Crick and C. Asanuma, "Certain Aspects of the Anatomyand Physiology of the Cerebral Cortex," in Paralfel DistributedProcessing, Vol. 2, eds.]. McClelland and D. Rumelhart (MITPress, Cambridge, MA, 1986), pp. 333-37l.
4. R.L. Harvey, P.N. DiCaprio, and K.G. Heinemann, "A Neural Architecture for Visual Recognition of General Objects by Machines," Technical Report, MIT Lincoln
206 THE LINCOLN LABORATORY JOURNAL VOLUME 4. NUMBER 2, 1991
Laboratory (to be published).5. G.A. Carpenter and S. Grossberg, "ART 2: Self-Organization
of Stable Category Recognition Codes for Analog Input Patterns," Appl. Opt. 26, 4919 (1987).
6. R.L. Harvey and K.G. Heinemann, "A Biological Vision Modelfor Sensor Fusion," IEEE 4th Nat!. Symp. on Semor Fusion(to be published).
7. S. Grossberg, Studies ofMind and Brain (D. Reidel, Boston,1982).
8. K.A.C. Martin and V.H. Perry, "On Seeing a Butterfly: ThePhysiology of Vision," Sci. Prog., Oxf 72, 259 (1988).
9. D. Bullock and S. Grossberg, "Neural Dynamics of PlannedArm Movements: Emergent Invariants and Speed-AccuracyProperties during Trajectory Formation," in Neural Networksand Natural Intelligence, ed. S. Grossberg (MIT Press, Cambridge, MA, 1988), pp. 553-622.

• HARVEY ET AL.A Neural Network Architecturefor General Image Recognition
•
•
ROBERT L. HARVEY
is a staff member in the OptoRadar Systems Group, wherehis focus in research has beenin space technology, sensorsystems, and neural networks.Before joining LincolnLaboratory in 1972, Bobworked for the ConductronCorp. He received thefollowing degrees from theUniversity ofMichigan: aB.S.E. in aerospace andmechanical engineering, and aPh.D. in aerospace engineering. He is a member ofTauBeta Pi, IEEE, the AmericanInstitute ofAeronautics andAstronautics (AIM), and theInternational Neural NetworkSociety (INNS).
PAUL N. DICAPRIO
received a B.S. degree incomputer science from JohnCarroll University and an M.S.degree in computer engineeringand science from Case WesternReserve University. Paulworked for Conley, Canitanoand Associates Inc. beforejoining Lincoln Laboratorythree years ago. An associatestaff member in the OptoRadar Systems Group, hespecializes in connectionistmodels and interactive 3-Dvisualization.
KARL G. HEINEMANN
is an assistant staff member inthe Opto-Radar SystemsGroup, where he designsalgorithms and software foradvanced sensor systems. Hespecializes in vision and neuralnetworks. Karl worked at theSmithsonian AstrophysicalObservatory before joiningLincoln Laboratory in 1979.He received a B.A. degree inphysics from SwarthmoreCollege and has done graduatework in astronomy at CornellUniversity. He is a member ofthe American Association forthe Advancement ofScience(AMS) and the InternationalNeural Network Society(INNS) .
VOLUME 4, NUMBER 2, 1991 THE LINCOLN LABORATORY JOURNAL 207

•,