angel finance - angel capital association · the other venture capital ... previous research has...
TRANSCRIPT
Angel Finance:The Other Venture Capital
Andrew Wong∗
First Draft: August 2001This Draft: January 2002
Abstract
Angel financing is one of the most common, but least studied methods, to finance newventures. In this paper, I propose a model to explain angel behavior. I use a unique dataset ofangel-backed firms to test the predictions of the model and examine the characteristics of angelfinancing. Although they are exposed to greater uncertainty by investing earlier in the life ofa firm compared to venture capital, angel investors do not rely on traditional control mecha-nisms such as board control, staging, or contractual provisions to protect against expropriation.Instead, angels reduce expected agency costs by forcing entrepreneurs to hold a larger stakein the firm, thereby aligning the interests of the entrepreneur with the outcome of the firm. Inaddition, angels use more informal methods such as investing in close geographic proximityand syndicating investments with other angels to mitigate risks.
∗The author is a Ph.D. candidate at the Graduate School of Business at the University of Chicago. This docu-ment has benefitted from comments and conversations with Mark Garmaise, Steve Kaplan, Raghu Rajan, ChristopherMalloy, David T. Robinson, Jeff Sohl, Per Stromberg, Bill Wetzel, Brian Wong and participants at the Universityof Chicago Corporate Finance Brown Bag Workshop. Input, comments and guidance from Julian Chan, Jeff Cohn,Ron Conway, James Geshwiler, Bijoy Goswami, Mark Harrington, Andrew Hoyne, Ray Hurcombe, Cary Nourie,Phil Polishook, Roliff Purrington, John Van Dyke, Pete Viti, the Texas Angel Investors and countless other an-gels and entrepreneurs have contributed tremendously. Address correspondence to Andrew Wong, c/o PhD Office,Graduate School of Business, The University of Chicago, 1101 East 58th Street, Chicago, IL 60637 or [email protected]. All errors are my own.
1 Introduction
With the recent rise (and fall) in the returns and prominence of new entrepreneurial ventures, much
attention has focused on the genesis of new firms. One of the most important considerations these
new entities face in the transformation from entrepreneurial ideas to revenue generating companies
is the procurement of capital. Because traditional avenues of finance such as debt are often not
available, entrepreneurs must seek risk capital by offering equity. While some companies may
be able to generate capital by forming alliances1, most new ventures must rely on two sources of
outside equity: venture capital and angel financing.
Institutional venture capital has been glamorized in the press and academic research as the
primary source of outside equity finance. However, many studies estimate institutional venture
capital contributes less than half of the total equity financing for new firms. The less-scrutinized,
yet equally important, source of start-up capital is the informal venture capital market, known as
angel financing. While it is difficult to precisely quantify the size of the angel market due to its
informal nature, some studies estimate the size of the angel investments to be twice that of the
institutional venture capital market.2 The National Venture Capital Association assesses the size
of the angel market to be $100 billion in the United States while the institutional venture capital
market is less than half this size at $48.3 billion.3 The Small Business Association estimates that
250,000 angels commit $20 billion each year to over 30,000 private companies.4 Freear et al.
(1992) suggest angels provide the largest amount of capital among early stage financiers and fund
1See Robinson(2001) for a detailed examination on alliances2Many people refer to angels as informal venture capital. Unless otherwise specified, I use the term venture capital
to refer to institutional venture capital partnerships.3Venture Economics press release, January 2000,www.ventureeconomics.com4U.S. Small Business Association releasehttp://www.sba.gov/opc/pubs/fs83.html
1
more than ten times the number of firms as venture capitalists. In the United Kingdom, Mason
and Harrison (1990) find angel investors finance at least five times as many small firms as venture
capitalists.
Despite the importance of angel funding, much of what is known about angels is incomplete
and not well understood. Very few academic studies have examined angels, in part because data
on angel investment is difficult to obtain. The lack of research leaves many questions unanswered.
Specifically, why do two types of equity based start-up financing exist and do these investors oper-
ate in the same manner with respect to control? Asymmetric information and uncertainty problems
in new firms makes corporate governance very important. If angel financiers are similar to institu-
tional venture capital, they should maintain a comparable degree of control over their investments.
Previous research has found the implementation of control mechanisms with venture capital in-
vestments to be more important as expected agency costs or uncertainty increase. Alternatively, if
angels do not behave similarly to venture capitalists with regard to the use of traditional control
rights, what mechanisms (if any) do angels use to protect themselves from expropriation?
Using a unique dataset of angel financed firms, I examine the role of angels in funding, moni-
toring and providing assistance to their investments. While many of my results are different from
conclusions that other researchers have found with institutional venture capital, some similarities
exist. Many of the findings are consistent with the model that I propose in the appendix. Angel
financed firms typically receive their first outside funding when the firm is less than a year old,
suggesting the degree of uncertainty is great and the need for control important. However, angel
investors do not employ the same control mechanism as venture capitalists. For example, I find
that angels seldom receive board seats in the firm the invest in. When board seats are allocated, the
founders usually retain board control, indicating board control is not the primary control mecha-
2
nism utilized by angels. The allocation of board seats is not sensitive to measures of agency costs
or greater uncertainty. Gompers(1995) finds venture capitalist use staged capital infusions as a
mechanism to control agency costs. In contrast, I find little support for the use of staging in angel
investments. While some investors follow-on their initial investments, the majority of angels do
not stage their investments. The use of staging does not increase in response to higher degrees
of uncertainty or expected agency costs in the firm. Lastly, Kaplan and Stromberg(2001) report
venture capitalists employ many contractual clauses as protection. Unlike venture capitalists, I
find angels do not appear to use contractual design to safeguard their investment. Angels usually
take common equity claims, which do not afford them a higher degree of protection in the event of
bankruptcy or liquidation. The majority of contracts between firms and angels also do not contain
clauses for anti-dilution or contingent equity claims.
Angels may use alternative mechanisms of control. On average, less than a quarter of the
firm is sold to outsiders in each round. Potential moral hazard problems are mitigated because
the entrepreneur retains a large share of the equity. While their funding levels are not sensitive
to measures of investment uncertainty or expected agency costs, angels receive a higher level of
equity ownership to compensate for investing in earlier rounds. The average contribution per angel
decreases as the amount of uncertainty increases. Additionally, many investors syndicate risky
investments to share the risk and minimize the losses for any single investor. However, venture
capitalists also use syndication and incentive alignment in their investments, yet they maintain
strong traditional control rights as well.
An important facet of angel investing materializes by investigating the geographical proximity
of the investors. Geographic proximity is a substitute for many of the formal control mechanisms
and a compliment to other mechanisms such as syndication. Taken together, these results suggest
3
that the entrepreneur appeals to sociological networks and uses local ties to generate initial funding
for the venture. The angels rely on trust in lieu of formal control. As the need for more capital
arises, the entrepreneur exhausts local funding sources. The entrepreneur must appeal to more pro-
fessional and remote funders, such as venture capitalists, for assistance. Because the new funders
are not as familiar with the entrepreneur as the local investors, more formal control mechanisms
need to be implemented to protect their investment. This finding provides some insight into the
extensive control mechanisms used by institutional venture capital and the relative lack of formal
control with angels.
While much empirical and theoretical research has been conducted on venture capital, there
are few empirical studies of angel investing. Much of what is known is based on anecdotal evi-
dence or small, regional surveys of angel investors (see Van Osnabrugge and Robinson(2000) for
an overview of survey results). These papers tend to focus mainly on descriptive statistics of in-
vestment size while my paper focuses on the control aspects of angel investment. Wetzel(1983)
provides one of the earliest profiles of angel investment in his survey of New England area angels.
Lerner(1998) analyzes the plausibility of public efforts to fund new firms via angels. Prowse(1998)
describes the characteristics of angel investors in the Dallas area. Ehrlich et al. (1994) publish sur-
vey results comparing the level of investor involvement of venture capitals and angels. Freear
and Wetzel (1990), Freear et al. (1992), and Sohl, Van Osnabrugge, and Robinson(2000) provide
survey evidence on the investment behavior of angels within certain industries.
The study that is most similar to this is Kaplan and Stromberg(2001), one of the first papers
to formally study the details of venture capital contracting. In their paper, Kaplan and Stromberg
provide detailed empirical evidence on the degree of board control, cash flow, liquidation and
voting rights in venture capital financings. They find that the control rights are held mostly by the
4
venture capitalists, particularly when the performance of the firm is poor.
Casamatta(2000) develops a model that captures some of the differences between angel in-
vestment and venture capital. She finds the optimal choice of security is a function of the size of
investment. She finds that smaller investments (typically by angels) should use common equity
and straight preferred while larger investments (typically by venture capitalists) should use more
complicated securities. The empirical results from this paper support her predictions.
In additional to Kaplan and Stromberg(2001), a related line of literature examines investor
control in venture capital literature. Sahlman(1990) and Gompers and Lerner(1996) examine ven-
ture capital contracts and reports some typical stipulations in the contracts. Gompers(1995) finds
staged capital infusions to be more prevalent in situations of higher agency costs. Lerner(1995)
and Baker and Gompers(2000) investigate the degree of board control of venture capitalists in their
investments. Both papers find venture capitalists maintain active board participation.
Many theoretical papers examine the control aspects of venture capital. Berglof(1994), Cornelli
and Yosha(2001), Repullo and Suarez(1999), and Hellmann(2001) investigate the role of convert-
ible debt in venture financings. Admati and Pfleiderer(1994) and Garmaise(2000) investigate how
venture capital investors contract in asymmetric information environments. Hellmann(1998) looks
at how the allocation of control rights is affected by quality of replacement help. Kirilenko(2001)
argues that venture capitalists should get more control rights to compensate for information prob-
lems. Papers such as Hart and Moore(1994), Bergemann and Hege(1998), and Neher(1999) stress
the role of staging in their theoretical models.
My results are at odds with some theoretical findings, in large part because much of this re-
search does not explicitly distinguish between angel investors and venture capital. As is the case
with much of the literature, it is possible the authors did not consider angel finance as a viable
5
source of start-up capital since very little is known about angels. For example, Admati and Pflei-
derer(1994) argue investors should hold a fixed fraction of equity through each investment stages.
However, my results show angels do not follow-on, meaning the the fraction of equity held by
angels decreases. Trester(1998) suggests investors should only use common equity in later stages;
I find common equity is most frequently used in the earliest stages of investment. Gompers(1997)
argues control rights should be assigned to investors in periods of highest asymmetric informa-
tion, such as the early in the life of the project. I find that control rights are actually retained by
entrepreneurs even though investment occurs when the firms are young. My results also do not
support the results of Neher(1999), Bergemann and Hege(1998), and Cornelli and Yosha(2001)
who advocate the staging of capital and the optimality of convertible securities. The results of
many of these models rely on assumptions based on the stylized facts of venture capital investing
and did not consider angel investors as a financing alternative.
This paper proceeds as follows. Section 2 is a brief background on angels and angel invest-
ments. Section 3 details the sample and the data collection process. A brief summary of the
model is described in section 4. The empirical tests and results are described section 5. Section 6
concludes. In the appendix, details of the model are provided.
2 Angel background
The term ’angel investor’ originates from funders for Broadway shows. Today, an angel investor
refers to a high-net worth individual who typically invests in small, private firms on their own
account. Formally, angel investors are ‘accredited investors’ according to the SEC. SEC Rule 501
of Regulation D states an accredited investor is an individual who has a net worth of more than $1
6

million or an expected individual (household) yearly income of more than $200,000 ($300,000).
While the Federal Reserve’s Survey of Consumer Finances estimates that over 6 million household
qualify to be accredited investors, many studies estimate of the number of active angel investors in
the United States to be between 250,000 to 400,000.5
Sohl (1999) reports that angels are usually cashed-out entrepreneurs who continue to yearn
for the next high-growth venture. Because angels have to perform their own due diligence, they
typically invest in ventures in the familiar industries. Prowse (1998) reports that angels are diverse
in background, with some being financially sophisticated and others relatively inexperienced. In
addition to making a financial investment, some angels actively participate in the firm’s operations;
however, such participation varies by angel. He reports that angels usually invest close to home.
Using information collected from interviews with angels, Linde and Prasad(1999) finds the average
angel has a total of $335,000 invested in 4 different companies. As individual investors, angels
exhibit great heterogeneity in personal characteristics such as age, experience, and investment
preferences.
3 Sample Description
3.1 Data Gathering
To investigate the hypotheses of the model, I need a sample of angel-backed firms. The task is
complicated by the fact that no commercial database exists that systematically records angel trans-
actions. The angel market involves private transactions which are not subject to public disclosure
5ForbesNovember 2, 1998 andIndividual InvestorJuly 2000.
7
with very little institutional infrastructure supporting the market. Additionally, much of the market
is fragmented and unorganized. These factors make data difficult to obtain.
To conduct this study, I collect data through surveys and interviews with entrepreneurial firms.
Over 800 angel-backed firms were identified via newswires, periodicals (such asAngel Investor,
press releases, angel networks, and websites (such asRed Herring’sHerringtown and Localbusi-
ness.com). Firms were asked if they had received any outside funding. Angel backed firms were
contacted for information regarding all financing received since firm initiation. In addition to fi-
nancial information, the firms were asked to provide descriptive information on their firm such as
the number of employees, revenues (if any), and background information on the founders. Due
to issues of confidentiality and competition, some respondents only provided partial responses.
Whenever possible, a founder or person responsible for investor relations was contacted for in-
formation. The final sample consists of 215 investment rounds made by angel investors in 143
companies from 1994 to 2001.
All funding rounds consisted of some financial participation by angels, whether it was angels
only or co-investing with venture capitalists, strategic investors, or other investors such as friends
and family. For my purposes, any funding conducted by ’angel venture’ funds or limited-liability
organizations acting as ’early-stage-angel’ funds are considered venture capital funds because I
only wanted investments by individuals. For example, entities such as Angel Investors LLP and
the Band of Angels Fund are considered a venture fund. However, investments from individual
Band of Angels members are classified as angel investments.
The sample of firms has many advantages. Since entrepreneurial firms were asked for infor-
mation (instead of angels), the sample is free from the bias caused by investors only reporting
information from only the successful ventures. Although surveys are imperfect for the usual rea-
8
sons, the approach allowed for subjective answers from entrepreneurs on questions such as the
quality of help from outside investors. While it is impossible to obtain information on every com-
pleted angel financing due to the very nature of the transactions, every effort has been made to
make the sample as unbiased and representative as possible. The 215 financings are a large enough
sample to draw representative conclusions.
3.2 Sample Selection Issues
In this section, I discuss potential selection issues concerning my sample. The financings are not a
completely random sample in that the data is from firms that were willing to respond to inquiries
and provide confidential information.
I contacted 801 companies for information and received information from 143 companies.
Of the 143 companies in the sample, 56 companies are identified via newswires, 48 companies
from Red Herring’sHerringtown website,6 33 from angels or angel networks and 6 from other
miscellaneous sources.7 It is possible that the companies surveyed were more successful, having
released some information publicly. However, many of the companies surveyed have since been
acquired, ceased operations, or continued to operate successfully. As of November 2001, 102 of
the companies are still operating, 9 have been acquired, 22 have ceased operations. No companies
have gone public in the time. I am not able to verify the status of 10 companies.
The average age of the companies when surveyed is 24.5 months (with a median of 19 months),
relatively close to the age of the companies at funding in table 1. The proximity between the survey
age and the funding age should reduce selection bias problems.
6Herringtown was a database of young start up companies maintained by the publishers ofRed Herring.7These include companies personally referred by angels.
9
Despite the possibilities of modest selection bias existing in the sample, the biases should not
be of great concern since I am not attempting to measure performance. Instead, I am trying to
detail the specifics of angel investments and the role of angel investors. In this respect, the sample
is likely to be similar to typical angel investments.
3.3 Summary Statistics
Table 1 presents summary information for the sample. Panel A of table 1 reports the geographical
distribution of the dataset.8 In comparison to venture capital investments, the dataset has fewer
observations in California and New England, although the sample remains heavily weighted to-
ward California. For the time period of 1995-2000, Venture Economics reports slightly more than
22% of venture-capital-backed companies are located in California. A major difference between
Venture Economics and my data is the high representation of firms in the southeast and an under-
representation of firms from New England. Venture Economics reports between 12% of venture
backed companies are located in New England whereas less than six percent of my sample comes
from New England. If angel activity is concentrated in the highest areas of venture capital activity,
then the sample has minor geographical differences. However, the data geographic breakdown
falls roughly in line with AngelSociety’s Survey of angel group activity.9
Panel B shows the date of company formation. Most of the companies are founded between
1998 and 2000. While it is easy to state the founding date of the company as the date of legal
incorporation, many firms had other significant events occur, such as the hiring an employee or
the beginning of business operations, before legal incorporation. I take the founding date as the
8A superconductor firm refused to give its geographical location for confidentiality purposes.9Angel Society, January 2001
10
earliest date that I have for any significant firm activity. Most of the angel rounds were completed
in 1998-2000, with over half of my sample financing rounds from 2000. While the young age
of the companies does not allow for long term panel studies, the relative youth of our companies
and the freshness of the funding is positive for many aspects. First, the findings in this paper will
not suffer from survivorship bias caused by analyzing data from older companies. Secondly, the
companies reflect the current state and trends in angel financing.
Panel C divides the sample into different industries as defined by Venture Economics. Most
of the sample are from the ’Computer Related’ industry, reflecting the technology boom in the
late 1990s. ’Computer Related’ firms include are internet services, internet content and design
firms, and business-to-business/consumer companies. This may be oversampling of one industry,
or it may represent the trend in the late 1990s to invest heavily in computer related companies, an
industry which experienced rapid growth during this time. Data from venture capital disbursements
seem to support this idea. Gompers and Lerner(2001) find 60% of all venture capital disbursements
went to information technology industries.
As Panel D indicates, the majority of the rounds in my sample are pre-revenue. 69% (99 of 143
companies) of the firms are pre-revenue for all funding rounds. This is significantly different than
the sample of firms in most venture capital research. For example, less than 40% of the firms in
Kaplan and Stromberg’s (2001) sample are pre-revenue firms. If revenue generation is an indicator
of development, my analysis focuses on firms who are earlier in their life-cycle than analysis on
venture capital financed firms. Panel E indicates the age of the firms in the sample at first funding.
The average age of first funding is 10.5 months. Most firms that receive funding are less than 12
months old. In comparison, the average age at first funding for venture-backed firms is greater than
one year (Gompers (1995)). If information quality is linked to age, then the uncertainty should be
11

much greater in angel-financed than in venture capital financed firms. Panel D and E of table 1
support the idea that angels typically finance earlier stage companies.
Panel A of Table 2 shows that most of my sample (157 rounds) is financed entirely by angels.
Co-investment by angels and venture capitalists accounts for less than twenty percent of all funding
rounds. This indicates that angels are a different type of venture investor, not merely co-investors
with institutional venture capital.
Panel B of Table 2 describes the funding amounts for the financing rounds. The median in-
vestment per investment round is $1 million. Not surprisingly, firms with positive revenue or are
in later stages of financing receive greater amounts financing, suggesting as asymmetric informa-
tion decreases in later rounds or with observable revenue streams, financing increases. In rounds
having only angel participation, the mean investment is 1.28M (median of 850,000). Compared
to the results in Kaplan and Stromberg(2001), the average amount of financing provided by ven-
ture capitalists is twice the size of amount of financing provided by angels only for companies at
comparable stages.
Comparing the results from table 2 with data from institutional venture capital data from Ven-
ture Economics yields many differences between angels and venture capital. In rounds closed
between 1998 and 2000, the average round of venture capital investment is 17.95M per round.
Considering only venture capital funded seed and start-up rounds, the size of average venture cap-
ital investment remains larger than angel contributions. From 1998 to 2000, an average of 4.77M
was received from venture capitalists by companies in these startup/seed stages. The average angel
funding is 2.17M across all rounds. Panel D and E of table 2 reports angel financing is smaller
than venture capital fundings in comparable industries.
The difference in funding size provides some evidence that angels play a complementary role
12
to venture capital. Instead of competing with venture capitalists for firms at similar stages of
development, angels provide a smaller amount of funding to younger firms.
4 Model Implications
The model in the appendix predicts entrepreneurs will retain control rights in their investments
even with the ability to renegotiate contracts. However, certain investments may not be feasible if
the entrepreneur does not relinquish control to the outside investor. In particular, if a project re-
quires a large investment, the only way that the investor will fund a project is if he receives control.
Additionally, control rights shift to the outside investor as the value of liquidation increases. More-
over, if the entrepreneur retains controls rights (as is the case with smaller investments), straight
equity will be the preferred security. Larger investments which require the ceding of control rights
will use a more complicated security similar to convertible debt.
Within the context of angel investors, the model predicts that smaller investments will use
straight equity. As long as the outside investors only own a small fraction of the firm, the en-
trepreneur will retain the control rights. As the ownership of the angels increase, more control will
be ceded.
The model has predictions regarding the variation in contracts between angel and venture cap-
ital investments. As the information in the summary statistics indicate, angel investors typically
provide small amounts of capital,10 typically with less than 20% of the equity exchanged for in-
vestment, while venture capitalists typically provide larger amounts of capital for larger ownership
shares.11 According to the model, venture capitalists should receive more control provisions in
10See table 111See Kaplan and Stromberg(2001) for details on venture capital ownership levels.
13
their deals. Additionally, venture capitalists often have a better ability to liquidate the firm because
of their larger network of contacts compared to angel investors. Because of this, control rights are
more likely to be held by venture capitalists rather than angels. Lastly, the model predicts a more
complicated security with larger investment; therefore, venture capitalists should use a convertible
claim, while angels should use an equity-like claim.
5 Empirical Tests and Results
In this section, I use my sample to provide detailed evidence on the predictions of the model. In-
ferences regarding the differences in the allocation of control rights between venture capital and
angel investors are drawn by comparing existing results on venture capital to my findings. Subse-
quently, I investigate the variation of the distribution of control rights within angel investments. In
addition to the model’s predictions, I test for other determinants that may determine distribution of
control rights. These factors are culled from existing literature on venture capital. In addition to
funding, venture capitalists often provide professionalization assistance. I examine whether angels
can provide the same non-monetary benefits to the new enterprise.
5.1 Control Rights
Many investors seek to protect their investment from expropriation through the use of control
rights. I consider three common controls mechanisms used by institutional venture capital. The
first measure is representation on the board of directors. Receiving board rights is an indication that
investors maintain a degree of authority over the manager. Secondly, the control of investments
through staging has been documented in the venture capital literature (see Gompers(1995)) as a
14
control mechanism. Staging an investment can effectively halt the progress of a wayward venture
as capital is no longer available for the new firm. Lastly, as Kaplan and Stromberg(2001) demon-
strate in venture capital contracts, contracting mechanisms such as security choice and contractual
provisions can be effective methods of control. If angels are identical to venture capitalists, they
should maintain similar protections, particularly in ventures where the threat of expropriation is
the highest.
Many theories emphasize the role that capital providers such as venture capital provide af-
ter the investment is made. Lerner(1995) finds venture capitalists exercise control through board
representation and the active recruitment and dismissal CEOs. Kaplan and Stromberg(2000) find
many venture capitalists anticipate having an active role in management and the hiring of new
management. If angel investors are similar to venture capital organizations, angels should actively
participate in the lives of the firms.
5.1.1 Board Rights
Board seats give outside investors the ability to affect corporate decisions. Board rights are par-
ticularly important in environments with greater uncertainty since it is not feasible to specify all
possible contingencies in theex antecontract. Sahlman(1990) finds board seats are typically allo-
cated to venture capitalists as part of a financing rounds. Panel A of table 3 shows this is not the
case with angel investments. Board seats are granted only in 42.5% of all funding rounds. The
likelihood of providing a board seat does not change much when considering pre- and post-revenue
funding rounds. The initial round of angel financing tends to have a slightly higher (though not
statistically significant) probability of board seat allocation, although fewer than half of all first
rounds relinquish board seats to outside investors.
15
Lerner(1995) reports an average of 1.12 board seats are added in each venture capital round.
In panel C of table 3, an average of only 0.59 board seats are added to the board of directors in a
typical angel financed investment round. The board size in the angel-financed ventures are much
smaller than public companies12 or venture-backed firms.13 Panel C shows that the average board
size of the firms is 3.71 members with a median of 4 members. Panel D reports, on average,
angels only represent 18% of the board of directors. Kaplan and Stromberg(2001) find venture
capitalists control between 37 to 47 % of the board seats in the firms they invest in. In my sample,
insiders have the majority of board seats on 100 boards (out of 116 where I have information on
board composition subsequent to funding) which is consistent with Kaplan and Stromberg’s (2001)
finding that outside board control is less common for early-stage companies. However, in venture
capital funded firms, insiders comprise the majority in only 13.9% of the boards. From table 3,
angels take a much smaller degree of control through board representation than venture capitalists.
The results on boards of directors are consistent with other theories which suggest a passive role
for angels. Fama and Jensen(1983) hypothesize that the composition of board should be shaped
by the need for monitoring. If the threat of managerial expropriation is high, then the board will
bear a greater responsibility for oversight. Additionally, at the early age of the firm, much of the
value of venture is embodied in the human capital of the entrepreneurs, so the replacement of the
founders would not seem to increase the value of the company.
Similarly, the need for a board seat may be determined by the need for oversight within each
company. Larger investments (and equity stakes) by outsiders will increase the need for oversight.
Ventures with larger potential agency costs should be monitored more often. Firms in industries
12See Denis and Sarin(1999), Yermack(1996) or Gertner and Kaplan(1996) for evidence on public companies.13See Barry, Muscarella, Peavy III, and Vetsuypens(1990), Lerner(1995), Baker and Gompers(2000), and Kaplan
and Stromberg(2001) for evidence on board seats and board size in venture-backed firms
16

with higher market-to-book ratios may need more monitoring as agency costs are often associated
with growth options. Tangible assets lower expected the agency costs in inefficient continuation,
decreasing the need for board seats. Industry volatility should increase the need for a board seat
if the volatility is a measure of the uncertainty in the project. Firms with intensive R&D may
need more oversight since it is likely that these firms will have more specific assets that can be
expropriated. Entrepreneurs with previous entrepreneurial history may not need as much oversight
because their reputations have already been established. Finally, early rounds, when uncertainty is
the highest, should have more board seats allocated.
Table 4 reports results from the probit regressions on the factors determining the allocation
of board seats. Panel A examines the results for all funding rounds and panel B only considers
funding rounds composed entirely of angel funders. The coefficient on industry volatility has the
opposite sign as predicted and different from Kaplan and Stromberg’s (2001) finding that outsider
board control is positively related to industry volatility. Though the coefficients on R&D are eco-
nomically large, they are not always statistically significant. However, the coefficient on the ratio
of fixed assets has the opposite sign from expectation. In total, the regression provides mixed re-
sults on the predictions of the models and other theories. It appears that angels do not increase
the use of board representation as a control mechanism in projects with higher agency costs or
uncertainty.
5.1.2 Staging
Empirical and theoretical works have emphasized the importance of staging as a control mecha-
nism for venture capitalists. Instead of providing all the needed capital in a lump sum, the invest-
ment is provided in stages, preserving the investor’s option to abandon. Models such as Hart and
17

Moore(1994), Bergemann and Hege(1998), and Neher(1999) stress the importance of staging as
a control mechanism. Gompers(1995) finds that venture capitalists use staging as an important
method to control agency costs.
Panel A of table 5 provides mixed results for the use of staging. Consecutive rounds funded
by angels only do tend to have follow on investors. However, if the subsequent financing round
involves venture capital participation, angels do not follow on. This finding supports the com-
plementary nature of angel and venture capital investment. Once the firm has been nurtured to
success, with success being venture capital investment, the angels step aside to more professional
investors.14 Panel B shows that even when angels follow on, only an average of 40% of investors
from previous rounds participate in the subsequent rounds.
I investigate the factors that affect the probability of staging investment in the probit regres-
sions in panels C and D of table 5. Similar to the predictions on board seats, investors in ventures
with high degrees of agency costs and uncertainty should have a higher probability of staging their
investments. The predictions for the coefficients of the independent variables are similar to the
predictions for board rights. However, the results indicate that many of the variables do not signifi-
cantly affect whether angels stage investment. Most of the variables are not statistically significant.
Investigating only angel financed rounds, none of the independent variables are statistically signif-
icant although the coefficient on research and development is economically large. Angels may
want to wait for the product to be closer to development before committing additional funds. In
summary, staging is not a frequently used control mechanism by angels. Staging does not appear
to be used to control agency costs or relieve uncertainty in investment decisions.
14Alternatively, venture capitalists may not want to co-invest with angels, thereby forcing angels aside. Evidencefor this idea is provided in panel C of table 11. The number of angels is significantly lower in rounds with venturecapital co-investment.
18
5.1.3 Contractual Provisions
Angel investors may use contractual provisions as protection from expropriation. More com-
plex securities may provide investors stronger protections in the event of liquidation. Contractual
clauses may give the investor additional protection from expropriation. Common protections in
venture contracts include ratcheting and anti-dilution agreements.
Panel A of table 6 reports the types of security used in each round. Common equity is the
most prevalent security, used in 34% of all rounds and 39.5% of angel-only rounds. In contrast,
Sahlman(1990), Gompers(1998) and Kaplan and Stromberg(2001) report that convertible preferred
is the dominant security in venture capital financing. The high usage of preferred and common
equity is consistent with the theoretical predictions of Casamatta (2000). In her model, Casamatta
finds common equity is better suited to smaller investments (such as those made by angels) while
larger investments should use preferred or convertible preferred securities. Equity may be used
more often with angel investments because of the higher costs of writing a complex securities with
a small investment outweigh the benefits.
Panels B and C of table 6 reports regression results from probit regressions where the dependent
variable is equal to one if the security used is equity and 0 otherwise. Smaller investments may not
justify the use of complex securities because of the higher costs of implementing a more complex
security. Complex securities should be used the threat of expropriation is greater. Thus, a negative
coefficient is expected for the market-to-book ratio, R & D and industry volatility. Firms that have
an identifiable revenue stream and entrepreneur with prior entrepreneurial experience may not need
as strong a security than other firms.
The results in table 6 support the relation between funding and security choice. Large invest-
19
ment rounds use more complex securities, providing some support for the model. However, if the
size of the investment is measured by equity stake, the coefficient is not statistically significant,
lending support to the fixed costs of security choice. The other independent variables do not af-
fect the choice of security, indicating that the cross sectional variation in security choice is not
influenced by concerns with reducing agency costs or expropriation.
In addition to security choice, many investment contracts have provisions that protect and em-
power the investor. Panel D contains information on many of these contractual clauses. Many
contracts contain a follow-on right of first refusal provision that allows angels to participate in fu-
ture rounds to capture the potential upside in successful ventures. However, as table 5 shows, many
angels do not exercise this right. 26% of financing rounds contain weighted ratchet closes for pro-
tection against future rounds at decreased valuations. Full ratcheting protection was not given in
any investment round. In comparison, Kaplan and Stromberg(2001) find 21.9% of their sample use
full-ratcheting and 78.1% of their sample use weighted-ratcheting. Kaplan and Stromberg(2001)
find contingent equity ownership prevalent in venture capital contracts. However, very few angel
contracts contain provisions for contingent equity stakes.
Contractual protection from expropriation is not one-sided. Panel E indicates 38 financing
rounds contain provisions that allow the firm to repurchase the stake of the angel, similar to the
call provisions explained in Sahlman(1990). Many entrepreneurs cite this clause as a way to rid
themselves of ’bad apples’ or investors whose vision does not coincide with that of the founders.
20
5.2 Alternative Mechanisms
In contrast to previous results on the control mechanisms adopted by venture capitalists, I find an-
gels do not implement the same methods of managerial oversight. In particular, angels typically do
not receive board seats, stage investments, or use particularly strong contractual claims to protect
their claims. The use of the conventional control mechanisms is not very sensitive to commonly
used measures of agency costs and uncertainty. Little support is found that increases in potential
agency costs and uncertainty lead to increased use of protections. The puzzle remains: how do
angel investors mitigate the increased risks of investing at early stages?
5.2.1 Funding
This section investigates the factors affecting the amount of funding. If investors are concerned
with large degrees of uncertainty, then the average contribution per investor, total funding amounts,
and number of investors will be sensitive to industry proxies for uncertainty, characteristics of the
entrepreneur and management team, and the presence of a revenue stream. Intangibles factors such
as entrepreneur’s prior experience may provide signals to alleviate investor uncertainty. Funders
may feel more secure investing with entrepreneurs who have a previous track record. More mature
firms and larger firms also should have more existing information, decreasing the uncertainty with
investment. Having a management team or a revenue stream signals to investors that the firm has
completed the initial research and development phases. Hellmann and Puri(2000) find the hiring of
a marketing and sales vice president to be an indicator for product development. Another method
to protect against large potential losses it to invest smaller amounts in greater uncertainty and to
syndicate riskier investments. Lerner(1994) finds venture capitalists syndicate early rounds as a
21

method to verify their decision making processes.
Table 7 provides evidence on the factors influence the amount of funding in a round. The
results on the total funds raised in the round are displayed in panel A, and the funds in angel-only
investment rounds are shown panel B. Focusing on the angels-only results in panel B, post-revenue
firms actually receive less funding. High growth firms, as measured by the industry market-to-
book ratio, receive more funding in each round. However, there is little support that any other
measures of uncertainty strongly influence the amount of funding as most of the coefficients are
not statistically significant.
As evidenced by the statistics on cash flow rights in table 8, the majority of residual claims
belong to management. Outside investors typically own less than a quarter of the new firm. Angels
may not need a high degree of control because the threat of expropriation is minimized by the large
residual claim held by the founders. The incentives of the founders are aligned with the prospects
of the firm. In comparison, Kaplan and Stromberg(2001) find venture capitalists hold a slightly
larger proportion of cash flow rights (on average 40%) in the investments that they make. Because
the incentives of the entrepreneur are not as strongly aligned with the outside investors, the need
for formal control may be greater. However, it is questionable whether such a small decrease in
managerial ownership drastically increases the need for formal controls.
Table 9 presents estimates from two stage least squares regressions where the dependent vari-
able is the equity ownership allocated to the outside investors in each round. Angels receive a
higher equity stake to compensate for the extra risk of investing under greater uncertainty. The
statistically significant and positive coefficient on the first round dummy indicates angels receive
a premium for investing early. Having a management team in place, an indication that the firm
has progressed passed the initial development stages, decreases the equity ownership purchased
22

by outsiders. Investors in firms with more uncertainty, as measured by industry volatility, receive
more cash flow rights. Greater research and development intensity leads to a decreased equity
stake for angels. These results agree with the results from Kaplan and Stromberg(2001).
5.2.2 Syndication
Another method of reducing risk is to syndicate investment with other investors. By syndicat-
ing investments, the investors may be able to share the risks and share in the monitoring of the
firm. Additionally, more angels investing may signify that firm has passed the evaluations of more
screeners. Syndication may act as a verification mechanism, thus it is expected that earlier funding
rounds will have more investors.
Table 10 shows the average number of angels participating in each round. On average, twelve
angels co-invest in a round. In comparison, Kaplan and Stromberg(2001) find venture rounds
are normally syndicated with two to nine funds co-investing. While the increase in syndication
may increase the monitoring capacities of the angel investment group,15 venture capitalists also
syndicate their investments while maintaining more formal control mechanisms.
Panel A of table 10 shows that the number of angels in each round is higher in earlier rounds.
As firms develop, later rounds and post-revenue firms receive larger average contributions per
angel. On average each angel owns between three to five percent of the firm.
I run regressions to further examine the factors that influence the variation of contribution
amounts. Panels A and B of table 11 shows the average contribution per angel is only affected by
early rounds, although the coefficient is not statistically significant in panel B. In panel B, angels
have a higher average contribution when a management team is in place at the firm.
15The increased syndication may lead to free-rider problems as well
23

Panel C and D of table 11 provides results on the factors that determine the number of angels
investing in a round. The model is an instrumental variables estimate of a poisson model, following
the 2SQML method detailed in Mullahy(1997). Using this procedure, the estimates are consistent,
but the standard errors may be positively biased using this procedure. The results in panel D for
angels-only rounds indicate more investors in firms in higher market-to-book industries, suggesting
that more investors want to invest in ventures with the higher growth. Entrepreneurial experience
seems to attract more investors.
5.3 Geographic Proximity
The results on geographical proximity deserve further elaboration and may provide insight into
the investing behavior of angels. Entrepreneurs may begin their search for capital by exploring
local resources. A localized bond of trust may exist between the entrepreneur and investor, making
formal control mechanisms unnecessary. Because of the strong trust and familiarity many local
investors may have with each other, syndication is greater among local investors. Subsequent
larger fundings may exhaust the resources of the local investors and need to be funded by more
professional investors. Additionally, as a firm progresses, the need to professionalization services
is greater, leading the entrepreneur to turn to more professional investors who require more formal
control because of their lack of familiarity with the founders.
If investment size is related to the degree of uncertainty and the cost of information dissemi-
nation is related to geography, the amount of investment should increase as the angels are closer.
Alternatively, investments made by investors at a distance can be most costly (either to monitor,
to negotiate, etc.). The results in table 7 show the total funding and the angels’ contribution to the
24
round decrease when the nearest angel is less than fifty miles away, supporting the second idea.
Panel B of table 11 shows the average contribution per angel also decreases as the angels
are closer, suggesting that local investors may not be as wealthy as more professional investors.
However, this is offset by the increase in the number of angels who invest if they are located
closer to the entrepreneur. Lastly, from table 12 local investors provide more help given their local
proximity. However, geographical proximity may delay venture capital investment. A possible
explanation is local angels do not have as large as a contact network as more professional investors.
Some additional validation for this idea is provided by examining the results on the formal
control mechanisms: board seats, staging and security choice. In contrast to Lerner’s (1995) find-
ing that close geographical proximity increases the likelihood of board representation, I find geo-
graphical proximity has a negative effect on the probability of board representation in angel funded
rounds (table 4), albeit the results not highly significant. The need for contractual monitoring (via
a board seat) may be reduced because of the geographic proximity of investors. Although not sta-
tistically significant, geographic proximity also decreases the use of staging and increases the use
of equity, consistent with the localized investor hypothesis.
Taken together, these results suggest many entrepreneurs begin their search for capital with
local resources, relying on local ties to encourage investment. Local angel investors may not be as
sophisticated as more professional investors, but may be more trusting.
5.4 Other Post-Investment Activities
In this section, I consider the role angels have in the success of the firm. Gorman and Sahlman(1989),
Sahlman(1990), and Ehrlich et al. find that venture capitalist actively participate in their invest-
25
ments after funding. In addition to funding, angel investors may play an active role in profession-
alizing the firm or bringing a product to market, similar to some activities that venture capitalists
provide (Hellmann and Puri(2001)). Since many angels are former entrepreneurs or industry exec-
utives, many angels may derive some private benefits from assisting in the development of a new
firm.
Building the management team is an important responsibility of the founders. In table 7, a
complete management team leads to larger funding amounts. Hellmann and Puri(2001) find that
venture capitalists help form the management team. In panel A of table 12, 23.5% of respondents
said that angel investors assisted in identifying and recruiting members of the management team.
Kaplan and Stromberg(2000) find that 50% of venture capitalists expect to replace the CEO or
help recruit the management team. I find that angels tend to provide less assistance than venture
capitalist in recruiting top management.
Angels can provide assistance in another important area, helping to locate and secure sub-
sequent financing from venture capital. Gorman and Sahlman(1989) report venture capitalists
consider raising additional funds the most important activity. If angels are helpful in securing ad-
ditional funding from venture capital, the time until venture funding should decrease as the number
of angels increases because of a larger network of contacts. Panel B of table 12 presents hazard
rate duration regressions on the time until venture capital financing assuming that the hazard rate
follows the Weibull distribution. There are 57 financing rounds where the subsequent round is
financed by venture capital. I find that more angel investors leads to a faster time to venture financ-
ing. This is evidence that angels can play a networking role; a larger number of angels leads to a
larger network of contacts and faster venture capital financing.
Panel C of table 12 presents results from ordered logit regressions where the dependent variable
26
is the amount of help that angel investors provided the firm. The amount of help is a subjective
response from the founders, so it is tainted by the usual problems with subjective responses. The
variable is separated into 5 categories with the lowest category representing ’little or no help’
and the highest category corresponding to ’a lot of beneficial help from angel investors.’ In all
the regressions, geography is statistically significant at the 5% level. Angels who are in closer
proximity tend to provide better assistance. Familiarity with issues confronting new ventures may
require more interaction, therefore geographical proximity may encourage more assistance. Other
variables do not appear to affect the degree of assistance.
6 Conclusion
This paper presents an examination of angel investing. Using a hand-collected dataset, I detail the
characteristics of angel finance, from the implemented control mechanisms to the determinants of
funding levels. I find that angels are not given the traditional control rights that venture capitalists
typically use. Rather, one of the primary mechanisms to control agency costs is the alignment of the
entrepreneur’s interests with those of the firm through the large ownership positions. Additionally,
angels make smaller investments and increase syndication when investing in the riskier ventures.
The results suggest a difference between venture capital investors and angel investors. The
summary statistics show angels fund smaller amounts than venture capital. Firms that require larger
amounts will seek venture capital investment, while angels may be preferred for small capital.
Closer examination reveals that venture capitals may not like to co-invest with angels. Angel
investors appear to nurture younger firms until the company is established enough for venture
capital consideration.
27

A puzzle still remains as to why angels provide capital in highly uncertain operations with-
out much formal protection from expropriation. I suggest a geographic based explanation. Ge-
ographical proximity plays a large role in determining the funding amount, control, and degree
of post-investment assistance from angels. These results are similar to the networking effects for
venture capital found by Sorenson and Stuart(forthcoming). Sorenson and Stuart find close geo-
graphic proximity increases the likelihood of funding and the ease of monitoring. Additionally,
some support is found that investors may receive private benefits from investing. O
ther theories cannot be excluded. It is entirely possible that the returns from investing at early
stages may be commensurate to the risk involved. Table 9 shows first round investments receive a
significantly higher equity claim, enhancing the possible return for early investors. To address this
hypothesis, reliable estimates on private equity returns need to be obtained. As Cochrane(2001)
shows, private equity returns are problematic to measure.
Another explanation may be that angels have specialized information and have a high ability to
screen for higher quality projects. Many investors have made their fortunes in the same industries
that they subsequently invest in. Industry knowledge is difficult to measure and examine since the
identities of the investors need to be known. In such a confidential environment, the screening
ability of angels would be difficult to examine.
Lastly, issues of liquidity and exit strategy are not addressed. Since the investor seeks to make
a high return from his investment, the time to and method of exit may affect the funding and
contractual status between parties. These issues are left for future work.
28

Appendix: Model
A Model
A wealth constrained entrepreneur has a project with a payoffM with support[M,M]. The en-
trepreneur can exert effort at a cost,k, which will improve the project’s payoff by a factor ofθ,
making the final payoffθM. Not exerting effort results in an expected payoff ofθM.
The entrepreneur has the exclusive rights (monopoly rights or specific human capital) to de-
velop this project, but is wealth constrained, and needs to raise funds from outside resources. The
entrepreneur is risk-neutral; her utility is only affected by her final wealth. Risk-neutral financiers
have funds to finance the project. In exchange for the the investment, the financier receives a share
of the project’s outcome,α.
Assumption 1 Equity is the only security in this economy.
The financier and entrepreneur share the same beliefs regarding the probabilities, payoffs, and
cost of effort in this economy. There are three dates in the model. At the initial date 0, the
entrepreneur negotiates with outside investors and the investment is made if the contracting is
successful. At date 1, a liquidation opportunity,L is available. The party that holds the control
rights makes the liquidation decision. At date 2, the project is revealed a success or failure and the
payoffs are distributed to the contracting parties. All payoffs are in date 0 present values.
In addition to the payoffs from the project, the entrepreneur enjoys private benefits from manag-
ing the project. The private benefits accumulate to the entrepreneur only if the project is not liqui-
dated. Private benefits may be on-the-job consumption, recognition for leading an entrepreneurial
29

venture or any other similar benefit.B denotes the monetary equivalent of the entrepreneur’s pri-
vate benefits.
The contract agreed upon at date zero specifies the allocation of control rights,γ, the share of
the liquidation value,β, and the share of the final payoff, given to the investors in exchange for the
required investmentI . Let αγ denote the share retained by the entrepreneur and 1−αγ equal the
share given to the outside financier. If the project is liquidated, the entrepreneur will receiveβL
and the financier will receive(1−β)L. The contract cannot be made contingent on the effort of
the entrepreneur. Denote entrepreneurial control of liquidation byγ = 0, and outsider control by
γ = 1.
In the first best scenario, effort is provided by the entrepreneur if
(θ−θ
)M ≥ k (A-1)
If the entrepreneur must go to the outside financier for capital, she must decide the share to
offer and whether or not to allocate the control rights to the outsiders. In this section, the initial
contract agreed upon at date zero cannot be renegotiated at intermediate dates. Later sections will
investigate the ramifications of renegotiation.
Consider the regime whereγ = 0. With control rights, the entrepreneur will not liquidate the
firm if the private benefits are large enough. The entrepreneur will exert effort if
α0(θ−θ
)M ≥ k (A-2)
The investor will contribute to the new venture if his rationality constraint is not violated:
30

(1−α0)θM ≥ I if effort is provided
(1−α0)θM ≥ I if effort is not provided
Without loss of generality, assume effort is provided. Assuming a competitive market for investors,
the rationality constraint will bind with equality. Solving for the share,
α0 = 1− I
θM(A-3)
Comparing equation A-2 with equation A-1, it is apparent that the entrepreneur will not work
the optimal amount as she must share part of the surplus from effort with the investor.
Suppose the outside investor has control, soγ = 1. Without renegotiation, there is inefficient
liquidation whenθM > L > (1−α1)θM. 16 The entrepreneur will exert effort if
Pr((1−α1)θM ≥ (1−β)L
)(α1θM +B)+Pr
((1−α1)θM < (1−β)L
)βL (A-4)
≥ Pr((1−α1)θM ≥ (1−β)L
)(α1θM +B)+Pr
((1−α1)θM < (1−β)L
)βL+k
The rationality constraint for the investor is
Pr((1−α1)θM ≥ (1−β)L
)((1−α1)θM)+Pr
((1−α1)θM < (1−β)L
)(1−β)L ≥ I (A-5)
If equation A-5 holds, then the investor will provide beneficial effort.
Notationally, let
Pr(C|E) = Pr((1−α1)θM ≥ (1−β)L
)16Or if the entrepreneur does not exert effort:θM > L > (1−α1)θM
31

and
Pr(C|NE) = Pr((1−α1)θM ≥ (1−β)L
)Pr(C|E) denotes the probability of continuation with effort andPr(C|NE) denotes the proba-
bility of continuation without effort provision.
Assumption 2 M has a convex cdf
With this assumption, effort is more likely to be provided ifβ = 0.
Lemma 1 If β = 0, the entrepreneur is more likely to exert effort.
Proof.
Consider the IC constraint of the entrepreneur. If the IC constraint is more likely to hold if
β = 0, then the lemma is true.
Equation A-5 can be rewritten as:
Pr(C|E)(α1θM−βL)−Pr(C|NE)(α1θM−βL)−k
Since Pr(C|E) ≥ Pr(C|NE) and M has a convex cdf, the expression is decreasing in beta.
Hence, the expression is maximized withβ = 0.
β may be considered the bargaining power of the investor in liquidation. The lemma shows
that effort is provided more often if the investor retains all the payoff in liquidation, making the
entrepreneur work harder to avoid liquidation. From a security design standpoint, the claim that
the investor holds is no longer a straight equity claim, but it resembles a convertible security that
is fixed in low states and converted to equity in high states.
32

In a competitive equilibrium,
α1 = 1− I − (1−Pr(C|E))LPr(C|E)θM
(A-6)
If L < I , α0 ≥ α1 sinceα1−α0 = (1−p)(L−I)P(C|E)θM
. If γ = 1 andL > I , the investor recoups extra
rents in the low state, thus he only needs a smaller share in the high state for compensation.
Proposition 1 if γ = 0 is feasible, the entrepreneur prefers to retain the control rights.
Proof.
Consider the difference in the entrepreneur’s utility between the control regimes:
Uγ=0−Uγ=1 = (A-7)
= θM(α0−P(C|E)α1)+(1−P(C|E))B
≥ θM
(θM− I − (P(C|E)θM− I +(1−P(C|E))L)
θM
)= (1−P(C|E))(θM−L) > 0
(A-8)
The proof is analogous if the entrepreneur decides to expend no effort. Clearly, if the en-
trepreneur expends effort withγ = 1, then she will also expend effort withγ = 0. If expending effort
with γ = 0 is rational, this will dominate any choice withγ = 1.
Without renegotiation of the contract, the entrepreneur is better off by retaining the control
rights. If γ = 0, the entrepreneur will work more often, but many projects are not feasible ifγ = 0.
If the project requires a large investment, retaining control may require thatα ≥ 1. The set of
feasible projects withγ = 1 is larger (although not as large as the first best) since the outside
33

investor does not require as large of a share. In the next section, I outline the characteristics of
project feasibility.
A.1 Project Feasibility
More projects will be contracted under the first best optimum than if the entrepreneur is forced to
seek outside investment. If effort is required for the project to be successful, many projects are
not completed because the required effort is not provided as the entrepreneur bears the cost of this
effort while receiving only part of the gains.
If γ = 0, the feasibility of the project depends on the NPV. Denote
NPVeffort = θM− I (A-9a)
NPVno effort = θM− I (A-9b)
If NPVno effort ≥ 0 then any project that is funded in the first best will also be funded. If
NPVeffort > 0 then the project will be funded only if equation A-2 is satisfied. However, consider a
project where
NPVeffort ≥ 0 > NPVno effort
but equation A-2 is not satisfied. These projects will not be funded, despite being positive net
present value.
From proposition 1, the entrepreneur will prefer to retain control rights whenever it is feasi-
ble. However, some projects are only feasible by ceding the control rights to the outside investor.
Projects that require more capital are more likely to be feasible with outside control because the in-
34
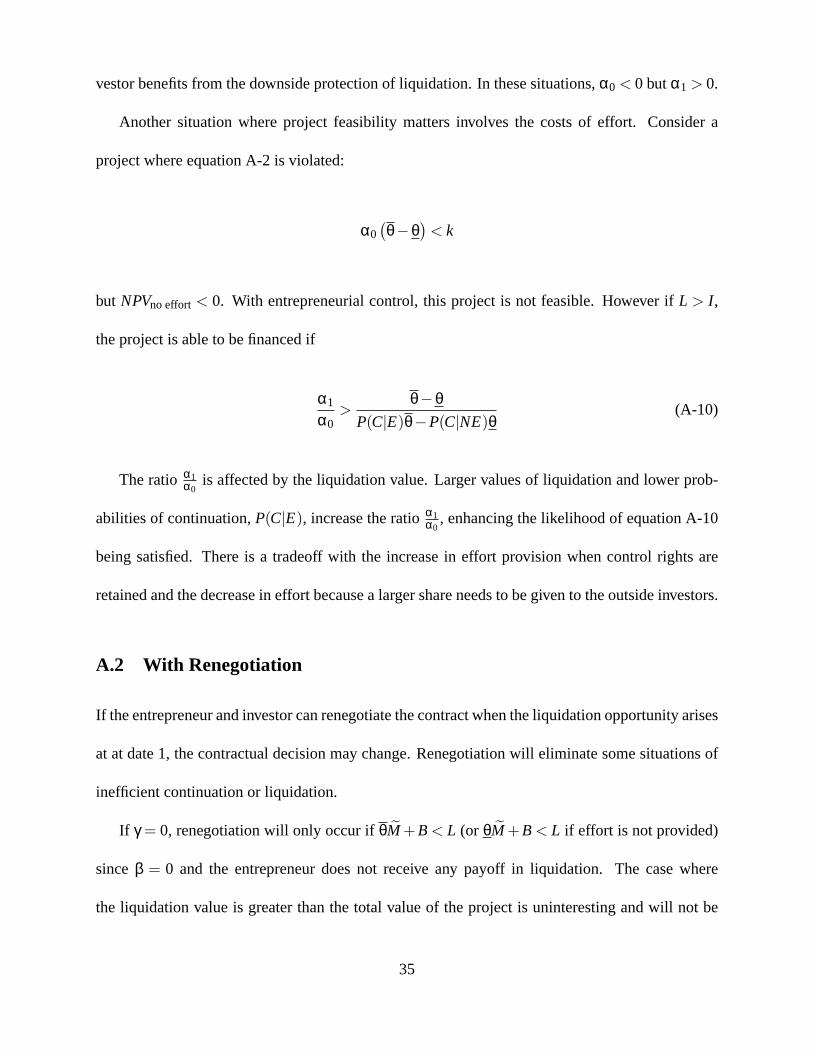
vestor benefits from the downside protection of liquidation. In these situations,α0 < 0 butα1 > 0.
Another situation where project feasibility matters involves the costs of effort. Consider a
project where equation A-2 is violated:
α0(θ−θ
)< k
but NPVno effort < 0. With entrepreneurial control, this project is not feasible. However ifL > I ,
the project is able to be financed if
α1
α0>
θ−θP(C|E)θ−P(C|NE)θ
(A-10)
The ratioα1α0
is affected by the liquidation value. Larger values of liquidation and lower prob-
abilities of continuation,P(C|E), increase the ratioα1α0
, enhancing the likelihood of equation A-10
being satisfied. There is a tradeoff with the increase in effort provision when control rights are
retained and the decrease in effort because a larger share needs to be given to the outside investors.
A.2 With Renegotiation
If the entrepreneur and investor can renegotiate the contract when the liquidation opportunity arises
at at date 1, the contractual decision may change. Renegotiation will eliminate some situations of
inefficient continuation or liquidation.
If γ = 0, renegotiation will only occur ifθM +B < L (or θM +B < L if effort is not provided)
sinceβ = 0 and the entrepreneur does not receive any payoff in liquidation. The case where
the liquidation value is greater than the total value of the project is uninteresting and will not be
35
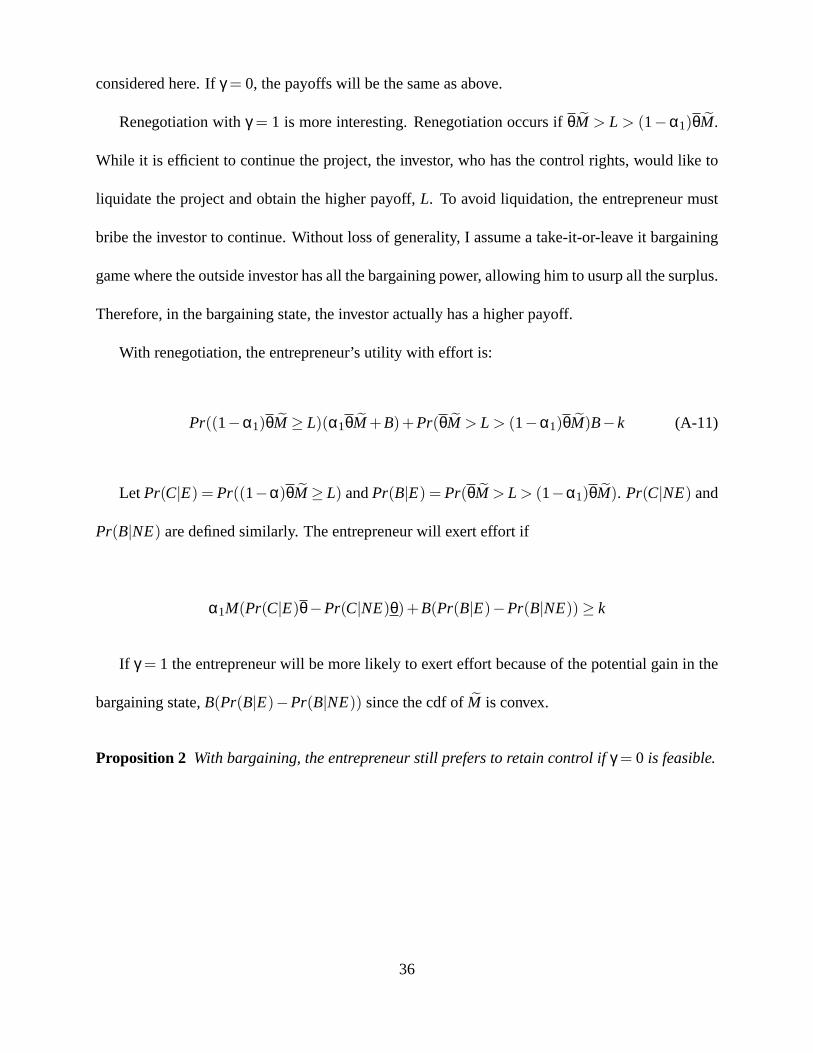
considered here. Ifγ = 0, the payoffs will be the same as above.
Renegotiation withγ = 1 is more interesting. Renegotiation occurs ifθM > L > (1−α1)θM.
While it is efficient to continue the project, the investor, who has the control rights, would like to
liquidate the project and obtain the higher payoff,L. To avoid liquidation, the entrepreneur must
bribe the investor to continue. Without loss of generality, I assume a take-it-or-leave it bargaining
game where the outside investor has all the bargaining power, allowing him to usurp all the surplus.
Therefore, in the bargaining state, the investor actually has a higher payoff.
With renegotiation, the entrepreneur’s utility with effort is:
Pr((1−α1)θM ≥ L)(α1θM +B)+Pr(θM > L > (1−α1)θM)B−k (A-11)
Let Pr(C|E) = Pr((1−α)θM ≥ L) andPr(B|E) = Pr(θM > L > (1−α1)θM). Pr(C|NE) and
Pr(B|NE) are defined similarly. The entrepreneur will exert effort if
α1M(Pr(C|E)θ−Pr(C|NE)θ)+B(Pr(B|E)−Pr(B|NE))≥ k
If γ = 1 the entrepreneur will be more likely to exert effort because of the potential gain in the
bargaining state,B(Pr(B|E)−Pr(B|NE)) since the cdf ofM is convex.
Proposition 2 With bargaining, the entrepreneur still prefers to retain control ifγ = 0 is feasible.
36

Proof. Consider the entrepreneur’s utility under the two regimes,γ = 0 andγ = 1
Uγ=0−Uγ=1 = (A-12)
= θM(α0−P(C|E)α1)+(1−P(C|E)−P(B|E))B
≥ θM− I − ((θM(P(C|E)+P(B|E))− I +(1−P(B|E)−P(C|E))L+P(B|E)B)
≥ (1−P(B|E)−P(C|E))(θM−L) > 0
(A-13)
Although the entrepreneur prefers to retain control, many projects may not be feasible with
γ = 0. With renegotiation, the same problems with project feasibility under theγ = 0 regime
still exist. However, renegotiation allows for greater efficiency as more projects are funded with
renegotiation.
37
References
Admati, Anat R., and Paul Pfleiderer, 1994, Robust Financial Contracting and the Role of VentureCapitalists,Journal of Finance49, 371–402.
Baker, Malcolm, and Paul A. Gompers, 2000, The Determinants of Board Structure and Functionat Initial Public Offering,Harvard University Working Paper.
Barry, Christopher B., Chris J. Muscarella, John W. Peavy III, and Michael R. Vetsuypens, 1990,The Role Of Venture Capital In The Creation Of Public Companies: Evidence From The Going-Public Process,Journal of Financial Economics27, 447–472.
Bergemann, Dirk, and Ulrich Hege, 1998, Venture Capital Financing, Moral Hazard, and Learning,Journal of Banking and Finance22, 703–735.
Berglof, Erik, 1994, A Control Theory of Venture Capital Finance,Journal of Law, Economics,and Organization10, 247–267.
Casamatta, Catherine, 2000, Financing and Advising: Optimal Financial Contracts with VentureCapitalists,Working Paper.
Cochrane, John H., 2001, The Risk and Return of Venture Capital,University of Chicago WorkingPaper.
Cornelli, Francesca, and Oved Yosha, 2001, Staged Financing and the Role of Convertible Debt,Working Paper.
Denis, David J., and Atulya Sarin, 1999, Ownership and Board Structures in Publicly TradedCorporations,Journal of Financial Economics52, 187–223.
Ehrlich, Sanford B., Alex F. De Noble, Tracy Moore, and Richard R. Weaver, 1994, After theCash Arrives: A Comparative Study of Venture Capital and Private Investor Involvement inEntrepreneurial Firms,Journal of Business Venturing9, 67–82.
Fama, Eugene, and Michael Jensen, 1983, Separation of Ownership and Control,Journal of Lawand Economics26, 301–325.
Fama, Eugene F., and Kenneth R. French, 1997, Industry Costs of Equity,Journal of FinancialEconomics43, 153–193.
Freear, John, Jeffrey E. Sohl, and William E. Wetze Jr.L, 1992, The Investment Attitudes, Behaviorand Characteristics of High Net Worth Individuals,Frontiers of Entrepreneurship Research.
Freear, John, and William E. Wetzel Jr., 1990, Who Bankrolls High-Tech Entrepreneurs?,Journalof Business Venturing5, 77–89.
Garmaise, Mark, 2000, Informed Investors and the Financing of Entrepreneurial Projects,Univer-sity of Chicago Working Paper.
38
Gertner, Robert, and Steven Kaplan, 1996, The Value-Maximizing Board,University of ChicagoWorking Paper.
Gompers, Paul, and Josh Lerner, 2001, The Venture Capital Revolution,Journal of EconomicPerspectives15, 145–168.
Gompers, Paul A., 1995, Optimal Investment, Monitoring, and the Staging of Venture Capital,Journal of Finance50, 1461–1489.
Gompers, Paul A., 1997, An Examination of Convertible Securities in Venture Capital,HarvardUniversity Working Paper.
Gompers, Paul A., 1998, Venture Capital Growing Pains: Should the Market Diet?,Journal ofBanking & Finance22, 1089–1104.
Gompers, Paul A., and Joshua Lerner, 1996, The Use of Covenants: An Empirical Analysis ofVenture Partnership Agreements,Journal of Law and Economics39, 463–498.
Gorman, Michael, and William A. Sahlman, 1989, What Do Venture Capitalists Do?,Journal ofBusiness Venturing4, 231–48.
Hart, Oliver, and John Moore, 1994, A Theory of Debt Based on the Inalienability of HumanCapital,Quarterly Journal of Economics109, 841–79.
Hellmann, Thomas, 1998, The Allocation of Control Rights in Venture Capital Contracts,RANDJournal of Economics29, 57–76.
Hellmann, Thomas, 2001, IPOs, Acquisitions and the Use of Convertible Securities in VentureCapital,Stanford University Working Paper.
Hellmann, Thomas, and Manju Puri, 2000, The Interaction Between Product Market and FinancingStrategy: The Role of Venture Capital,Review of Financial Studies13, 959–984.
Hellmann, Thomas, and Manju Puri, 2001, How Venture Capital Professionalizes a Firm,forth-coming, Journal of Finance.
Kaplan, Steven N., and Per Stromberg, 2000, How Do Venture Capitalists Choose Investments?,University of Chicago Working Paper.
Kaplan, Steven N., and Per Stromberg, 2001, Financial Contracting Theory Meets the Real World:An Empircial Analysis of Venture Capital Contracts,University of Chicago Working Paper.
Kirilenko, Andrei A., 2001, Valuation and Control in Venture Finance,Journal of Finance56,567–587.
Lerner, Joshua, 1994, The Importance of Patent Scope: An Empirical Analysis,RAND Journal ofEconomics25, 319–333.
Lerner, Joshua, 1995, Venture Capitalists and the Oversight of Private Firms,Journal of Finance50, 301–317.
39
Lerner, Joshua, 1998, ”Angel” Financing and Public Policy: An Overview,Journal of Banking &Finance22, 773–783.
Linde, Lucinda, and Alok Prasad, 1999, Venture Support Systems Project: Angel Investors,work-ing paper.
Mason, Colin, and R.T. Harrison, 1990, Informal Risk Capital: A Review and Research Agenda,Venture Finance Research Project.
Mullahy, John, 1997, Instrumental-Variables Estimation of Count Data Models: Applications toModels of Cigarette Smoking Behavior,Review of Economics and Statistics79, 586–593.
Neher, Darwin, 1999, Staged Financing: An Agency Perspective,Review of Economic Studies66,255–274.
Newey, Whitney K., 1987, Efficient Estimation of Limited Dependent Variable Models with En-dogenous Explanatory Variables,Journal of Econometrics36, 231–50.
Prowse, Stephen, 1998, Angel Investors and the Market for Angel Investments,Journal of Banking& Financing22, 785–792.
Repullo, Rafael, and Javier Suarez, 1999, Venture Capital Finance: A Security Design Approach,CEPR Working Paper 9804.
Robinson, David, 2001, Strategic Alliances and the Boundaries of the Firm,Columbia UniversityWorking Paper.
Sahlman, William A., 1990, The Structure and Governance of Venture-Capital Organizations,Journal of Financial Economics27, 473–521.
Sohl, Jeffrey E., 1999, The Early Stage Equity Market in the USA,Venture Capital1, 101–120.
Sohl, Jeffrey E., Mark Van Osnabrugge, and Robert Robinson, 2000, Models of Angel Investing:Portals to the Early Stage Market,Frontiers of Entrepreneurship Research.
Sorenson, Olav, and Toby Stuart, forthcoming, Syndication Networks and the Spatial Distributionof Venture Capital Investments,American Journal of Sociology.
Trester, Jeffrey J., 1998, Venture Capital Contracting Under Asymmetric Information,Journal ofBanking & Finance22, 675–699.
Van Osnabrugge, Mark, and Robert J. Robinson, 2000,Angel Investing: Matching Start-Up Fundswith Start-Up Companies. (Jossey-Bass San Francisco, CA).
Wetzel, William E., 1983, Angels and Informal Risk Capital,Sloan Management Review24, 23–34.
White, Halbert, 1980, A Heteroskedasticity-Consistent Covariance Matrix Estimator and a DirectTest for Heteroskedasticity,Econometrica48, 817–38.
Yermack, David, 1996, Higher Market Valuations of Companies with a Small Board of Directors,Journal of Financial Economics40, 185–211.
40
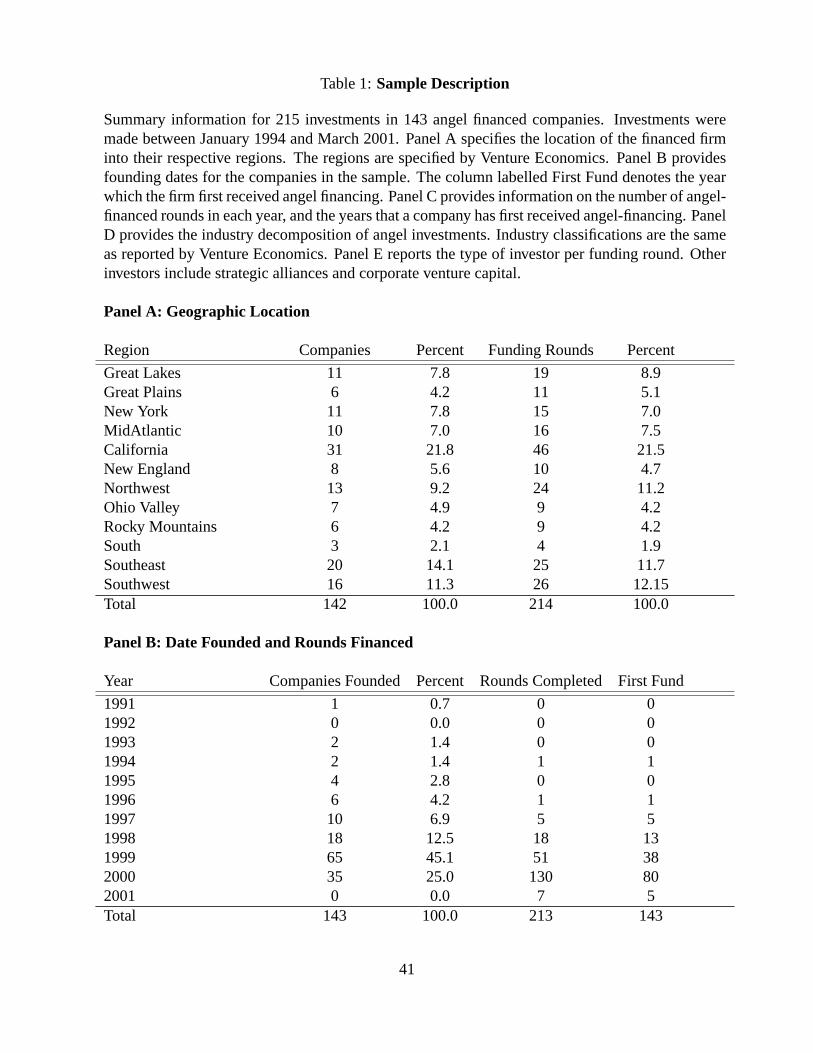
Table 1:Sample Description
Summary information for 215 investments in 143 angel financed companies. Investments weremade between January 1994 and March 2001. Panel A specifies the location of the financed firminto their respective regions. The regions are specified by Venture Economics. Panel B providesfounding dates for the companies in the sample. The column labelled First Fund denotes the yearwhich the firm first received angel financing. Panel C provides information on the number of angel-financed rounds in each year, and the years that a company has first received angel-financing. PanelD provides the industry decomposition of angel investments. Industry classifications are the sameas reported by Venture Economics. Panel E reports the type of investor per funding round. Otherinvestors include strategic alliances and corporate venture capital.
Panel A: Geographic Location
Region Companies Percent Funding Rounds Percent
Great Lakes 11 7.8 19 8.9Great Plains 6 4.2 11 5.1New York 11 7.8 15 7.0MidAtlantic 10 7.0 16 7.5California 31 21.8 46 21.5New England 8 5.6 10 4.7Northwest 13 9.2 24 11.2Ohio Valley 7 4.9 9 4.2Rocky Mountains 6 4.2 9 4.2South 3 2.1 4 1.9Southeast 20 14.1 25 11.7Southwest 16 11.3 26 12.15Total 142 100.0 214 100.0
Panel B: Date Founded and Rounds Financed
Year Companies Founded Percent Rounds Completed First Fund
1991 1 0.7 0 01992 0 0.0 0 01993 2 1.4 0 01994 2 1.4 1 11995 4 2.8 0 01996 6 4.2 1 11997 10 6.9 5 51998 18 12.5 18 131999 65 45.1 51 382000 35 25.0 130 802001 0 0.0 7 5Total 143 100.0 213 143
41

Table 1: Sample Description, continued
Panel C: Industry Distribution of Companies and RoundsIndustry Companies Percent Rounds Percent
Communications 4 2.8 7 3.3Computers 0 0.0 0 0.0Computers Related 78 54.6 117 54.4Computer Software 33 23.1 49 22.8Electronic Components 7 4.9 11 5.12Other Electronics 5 3.5 7 3.3Biotechnology 3 2.1 5 2.3Medical/Health 3 2.1 5 2.3Energy 0 0.0 0 0.0Consumer Products 3 2.1 6 2.8Industrial Products 1 0.7 1 0.5Transportation 3 2.1 3 1.4Other Industries 3 2.1 4 1.9Total 143 100.0 215 100.0
Panel D: Pre-revenue and Post-Revenue Funding RoundsNumber of rounds
Pre-Revenue Rounds 151Post-Revenue Rounds 59First Funding Round 137Later Rounds 78
Panel E: Age at First FundingMonths
1st Quartile 2Median 73rd Quartile 12Mean 10.5
Panel F: Number of EmployeesEmployees First Funding All1 12 132 20 203 14 174 21 245 24 306-10 26 3411-20 17 3721 and higher 7 27
42
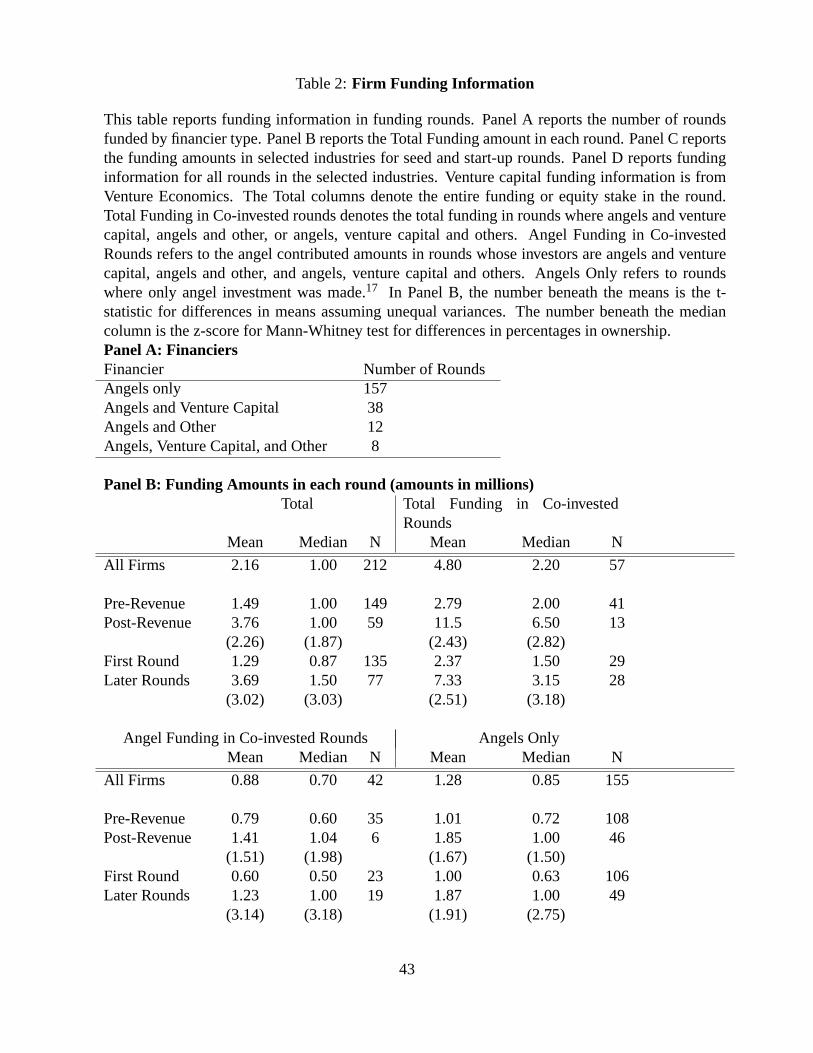
Table 2:Firm Funding Information
This table reports funding information in funding rounds. Panel A reports the number of roundsfunded by financier type. Panel B reports the Total Funding amount in each round. Panel C reportsthe funding amounts in selected industries for seed and start-up rounds. Panel D reports fundinginformation for all rounds in the selected industries. Venture capital funding information is fromVenture Economics. The Total columns denote the entire funding or equity stake in the round.Total Funding in Co-invested rounds denotes the total funding in rounds where angels and venturecapital, angels and other, or angels, venture capital and others. Angel Funding in Co-investedRounds refers to the angel contributed amounts in rounds whose investors are angels and venturecapital, angels and other, and angels, venture capital and others. Angels Only refers to roundswhere only angel investment was made.17 In Panel B, the number beneath the means is the t-statistic for differences in means assuming unequal variances. The number beneath the mediancolumn is the z-score for Mann-Whitney test for differences in percentages in ownership.Panel A: FinanciersFinancier Number of RoundsAngels only 157Angels and Venture Capital 38Angels and Other 12Angels, Venture Capital, and Other 8
Panel B: Funding Amounts in each round (amounts in millions)Total Total Funding in Co-invested
RoundsMean Median N Mean Median N
All Firms 2.16 1.00 212 4.80 2.20 57
Pre-Revenue 1.49 1.00 149 2.79 2.00 41Post-Revenue 3.76 1.00 59 11.5 6.50 13
(2.26) (1.87) (2.43) (2.82)First Round 1.29 0.87 135 2.37 1.50 29Later Rounds 3.69 1.50 77 7.33 3.15 28
(3.02) (3.03) (2.51) (3.18)
Angel Funding in Co-invested Rounds Angels OnlyMean Median N Mean Median N
All Firms 0.88 0.70 42 1.28 0.85 155
Pre-Revenue 0.79 0.60 35 1.01 0.72 108Post-Revenue 1.41 1.04 6 1.85 1.00 46
(1.51) (1.98) (1.67) (1.50)First Round 0.60 0.50 23 1.00 0.63 106Later Rounds 1.23 1.00 19 1.87 1.00 49
(3.14) (3.18) (1.91) (2.75)
43
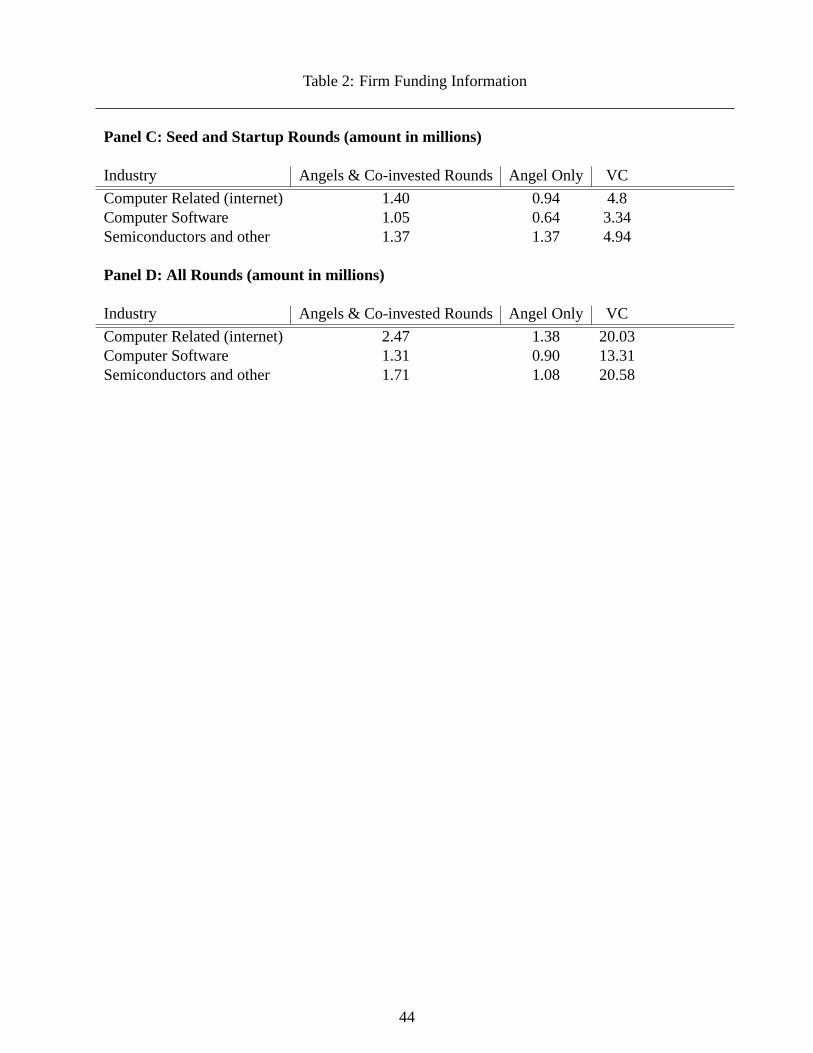
Table 2: Firm Funding Information
Panel C: Seed and Startup Rounds (amount in millions)
Industry Angels & Co-invested RoundsAngel Only VC
Computer Related (internet) 1.40 0.94 4.8Computer Software 1.05 0.64 3.34Semiconductors and other 1.37 1.37 4.94
Panel D: All Rounds (amount in millions)
Industry Angels & Co-invested RoundsAngel Only VC
Computer Related (internet) 2.47 1.38 20.03Computer Software 1.31 0.90 13.31Semiconductors and other 1.71 1.08 20.58
44
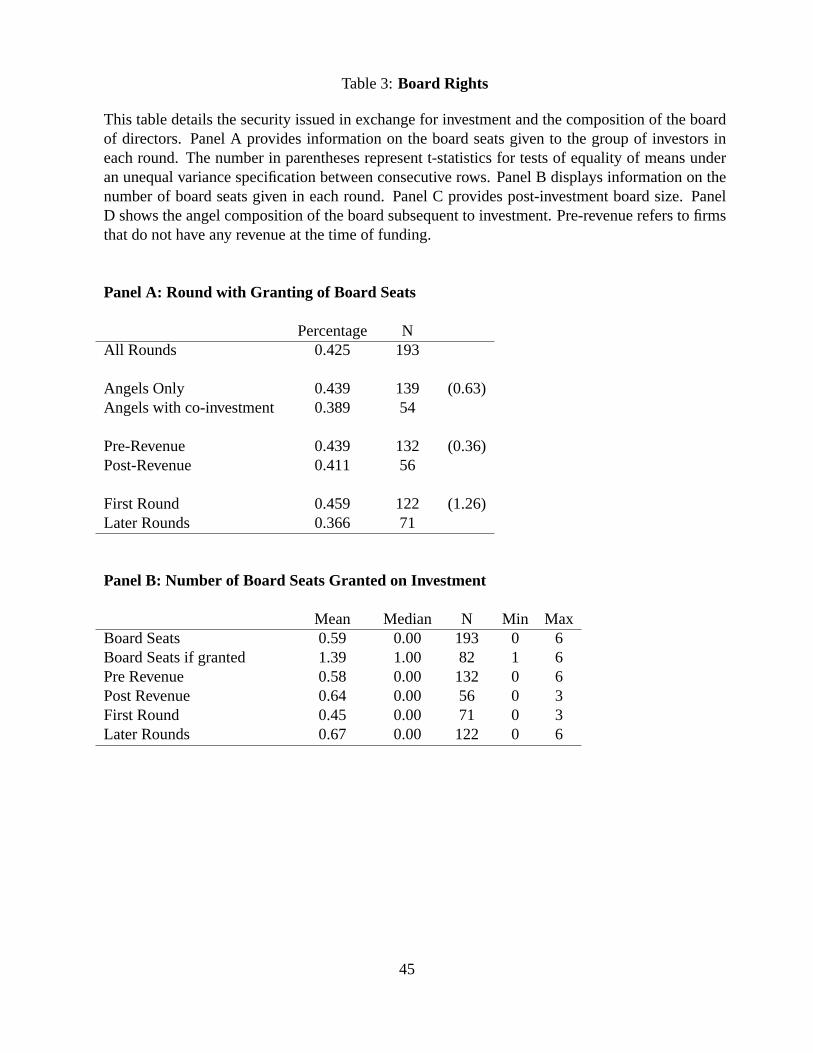
Table 3:Board Rights
This table details the security issued in exchange for investment and the composition of the boardof directors. Panel A provides information on the board seats given to the group of investors ineach round. The number in parentheses represent t-statistics for tests of equality of means underan unequal variance specification between consecutive rows. Panel B displays information on thenumber of board seats given in each round. Panel C provides post-investment board size. PanelD shows the angel composition of the board subsequent to investment. Pre-revenue refers to firmsthat do not have any revenue at the time of funding.
Panel A: Round with Granting of Board Seats
Percentage NAll Rounds 0.425 193
Angels Only 0.439 139 (0.63)Angels with co-investment 0.389 54
Pre-Revenue 0.439 132 (0.36)Post-Revenue 0.411 56
First Round 0.459 122 (1.26)Later Rounds 0.366 71
Panel B: Number of Board Seats Granted on Investment
Mean Median N Min MaxBoard Seats 0.59 0.00 193 0 6Board Seats if granted 1.39 1.00 82 1 6Pre Revenue 0.58 0.00 132 0 6Post Revenue 0.64 0.00 56 0 3First Round 0.45 0.00 71 0 3Later Rounds 0.67 0.00 122 0 6
45
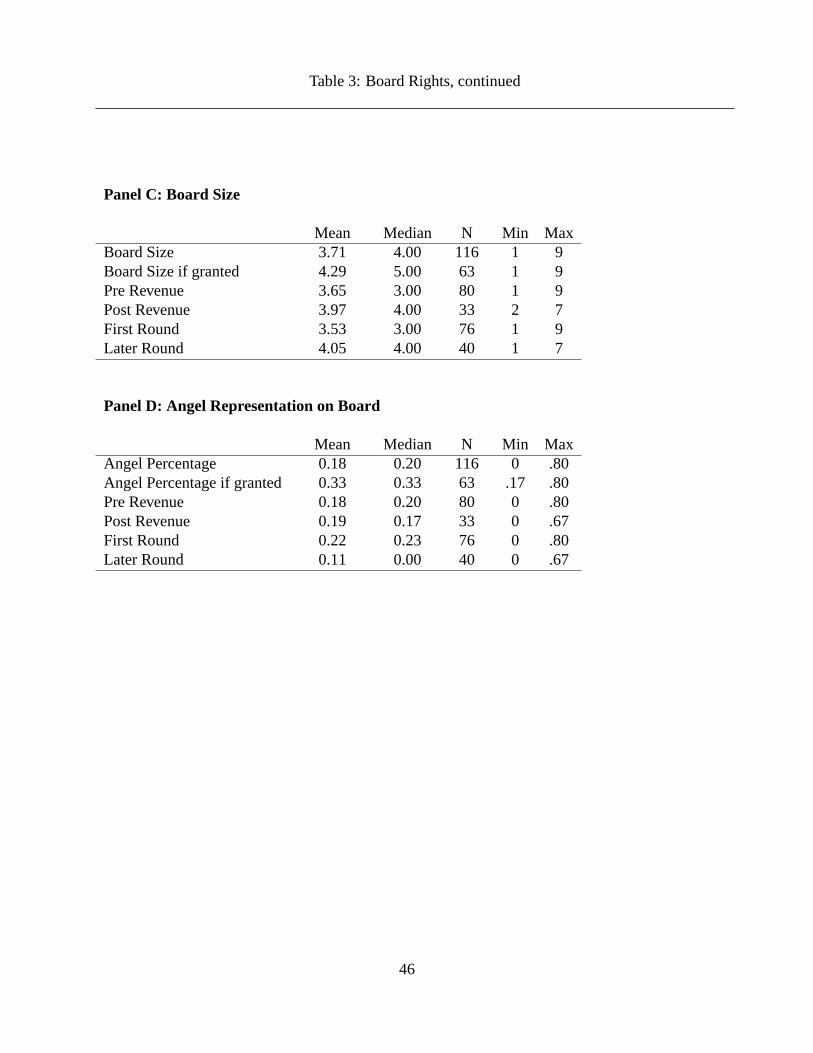
Table 3: Board Rights, continued
Panel C: Board Size
Mean Median N Min MaxBoard Size 3.71 4.00 116 1 9Board Size if granted 4.29 5.00 63 1 9Pre Revenue 3.65 3.00 80 1 9Post Revenue 3.97 4.00 33 2 7First Round 3.53 3.00 76 1 9Later Round 4.05 4.00 40 1 7
Panel D: Angel Representation on Board
Mean Median N Min MaxAngel Percentage 0.18 0.20 116 0 .80Angel Percentage if granted 0.33 0.33 63 .17 .80Pre Revenue 0.18 0.20 80 0 .80Post Revenue 0.19 0.17 33 0 .67First Round 0.22 0.23 76 0 .80Later Round 0.11 0.00 40 0 .67
46
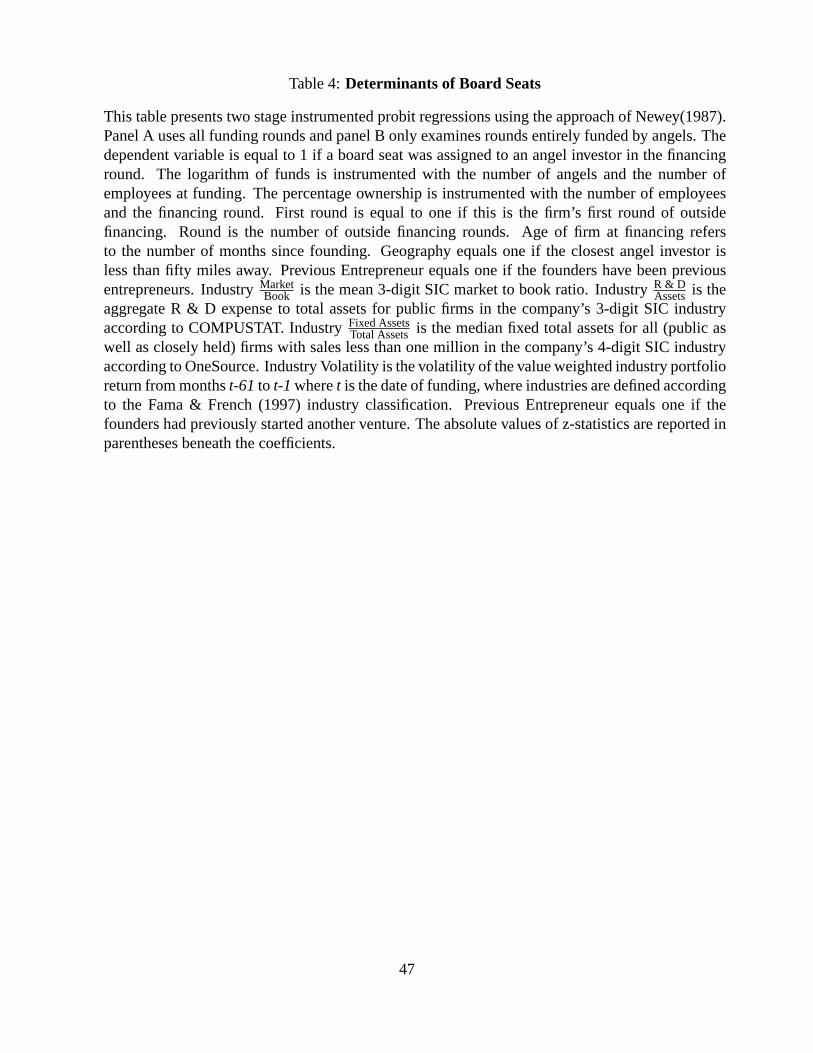
Table 4:Determinants of Board Seats
This table presents two stage instrumented probit regressions using the approach of Newey(1987).Panel A uses all funding rounds and panel B only examines rounds entirely funded by angels. Thedependent variable is equal to 1 if a board seat was assigned to an angel investor in the financinground. The logarithm of funds is instrumented with the number of angels and the number ofemployees at funding. The percentage ownership is instrumented with the number of employeesand the financing round. First round is equal to one if this is the firm’s first round of outsidefinancing. Round is the number of outside financing rounds. Age of firm at financing refersto the number of months since founding. Geography equals one if the closest angel investor isless than fifty miles away. Previous Entrepreneur equals one if the founders have been previousentrepreneurs. IndustryMarket
Book is the mean 3-digit SIC market to book ratio. IndustryR & DAssets is the
aggregate R & D expense to total assets for public firms in the company’s 3-digit SIC industryaccording to COMPUSTAT. IndustryFixed Assets
Total Assets is the median fixed total assets for all (public aswell as closely held) firms with sales less than one million in the company’s 4-digit SIC industryaccording to OneSource. Industry Volatility is the volatility of the value weighted industry portfolioreturn from monthst-61 to t-1 wheret is the date of funding, where industries are defined accordingto the Fama & French (1997) industry classification. Previous Entrepreneur equals one if thefounders had previously started another venture. The absolute values of z-statistics are reported inparentheses beneath the coefficients.
47
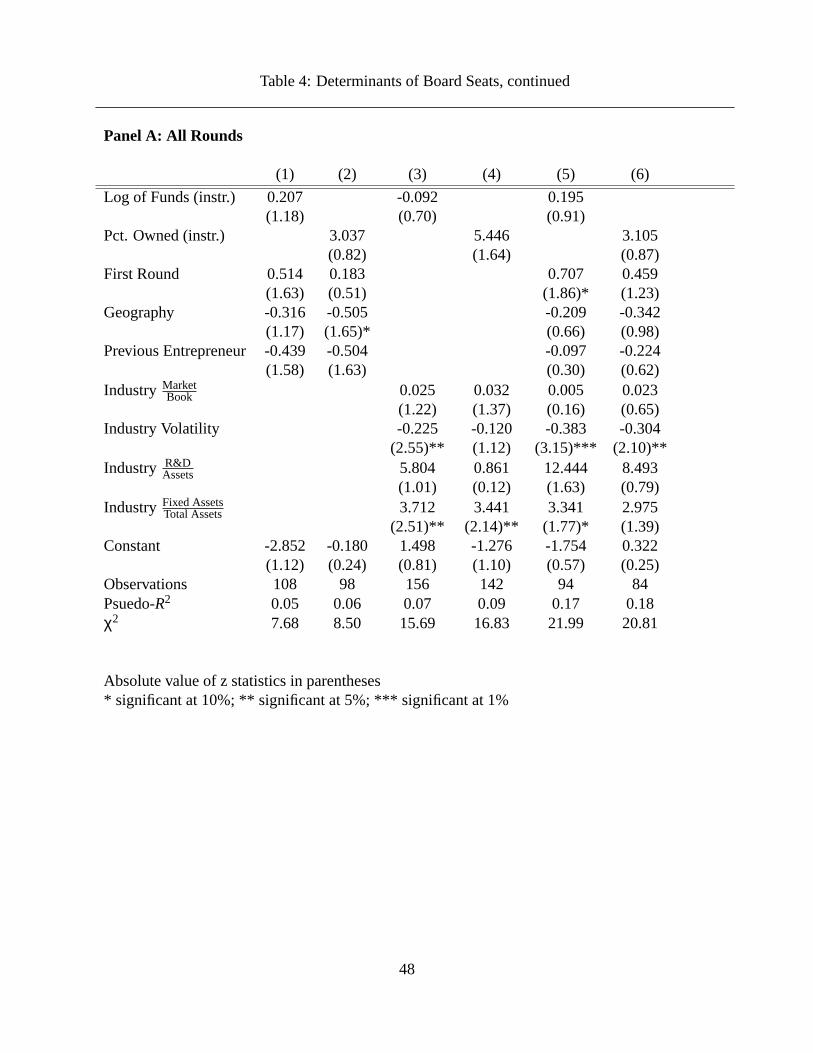
Table 4: Determinants of Board Seats, continued
Panel A: All Rounds
(1) (2) (3) (4) (5) (6)
Log of Funds (instr.) 0.207 -0.092 0.195(1.18) (0.70) (0.91)
Pct. Owned (instr.) 3.037 5.446 3.105(0.82) (1.64) (0.87)
First Round 0.514 0.183 0.707 0.459(1.63) (0.51) (1.86)* (1.23)
Geography -0.316 -0.505 -0.209 -0.342(1.17) (1.65)* (0.66) (0.98)
Previous Entrepreneur -0.439 -0.504 -0.097 -0.224(1.58) (1.63) (0.30) (0.62)
Industry MarketBook 0.025 0.032 0.005 0.023
(1.22) (1.37) (0.16) (0.65)Industry Volatility -0.225 -0.120 -0.383 -0.304
(2.55)** (1.12) (3.15)*** (2.10)**Industry R&D
Assets 5.804 0.861 12.444 8.493(1.01) (0.12) (1.63) (0.79)
Industry Fixed AssetsTotal Assets 3.712 3.441 3.341 2.975
(2.51)** (2.14)** (1.77)* (1.39)Constant -2.852 -0.180 1.498 -1.276 -1.754 0.322
(1.12) (0.24) (0.81) (1.10) (0.57) (0.25)Observations 108 98 156 142 94 84Psuedo-R2 0.05 0.06 0.07 0.09 0.17 0.18χ2 7.68 8.50 15.69 16.83 21.99 20.81
Absolute value of z statistics in parentheses* significant at 10%; ** significant at 5%; *** significant at 1%
48
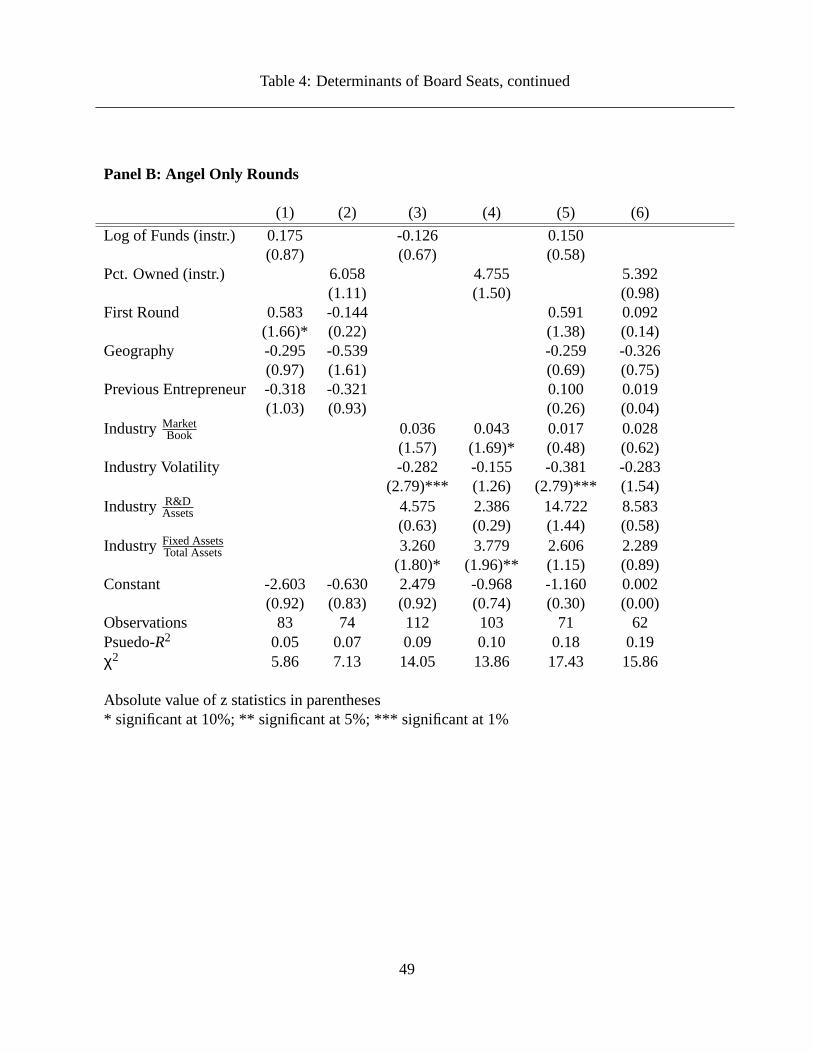
Table 4: Determinants of Board Seats, continued
Panel B: Angel Only Rounds
(1) (2) (3) (4) (5) (6)
Log of Funds (instr.) 0.175 -0.126 0.150(0.87) (0.67) (0.58)
Pct. Owned (instr.) 6.058 4.755 5.392(1.11) (1.50) (0.98)
First Round 0.583 -0.144 0.591 0.092(1.66)* (0.22) (1.38) (0.14)
Geography -0.295 -0.539 -0.259 -0.326(0.97) (1.61) (0.69) (0.75)
Previous Entrepreneur -0.318 -0.321 0.100 0.019(1.03) (0.93) (0.26) (0.04)
Industry MarketBook 0.036 0.043 0.017 0.028
(1.57) (1.69)* (0.48) (0.62)Industry Volatility -0.282 -0.155 -0.381 -0.283
(2.79)*** (1.26) (2.79)*** (1.54)Industry R&D
Assets 4.575 2.386 14.722 8.583(0.63) (0.29) (1.44) (0.58)
Industry Fixed AssetsTotal Assets 3.260 3.779 2.606 2.289
(1.80)* (1.96)** (1.15) (0.89)Constant -2.603 -0.630 2.479 -0.968 -1.160 0.002
(0.92) (0.83) (0.92) (0.74) (0.30) (0.00)Observations 83 74 112 103 71 62Psuedo-R2 0.05 0.07 0.09 0.10 0.18 0.19χ2 5.86 7.13 14.05 13.86 17.43 15.86
Absolute value of z statistics in parentheses* significant at 10%; ** significant at 5%; *** significant at 1%
49
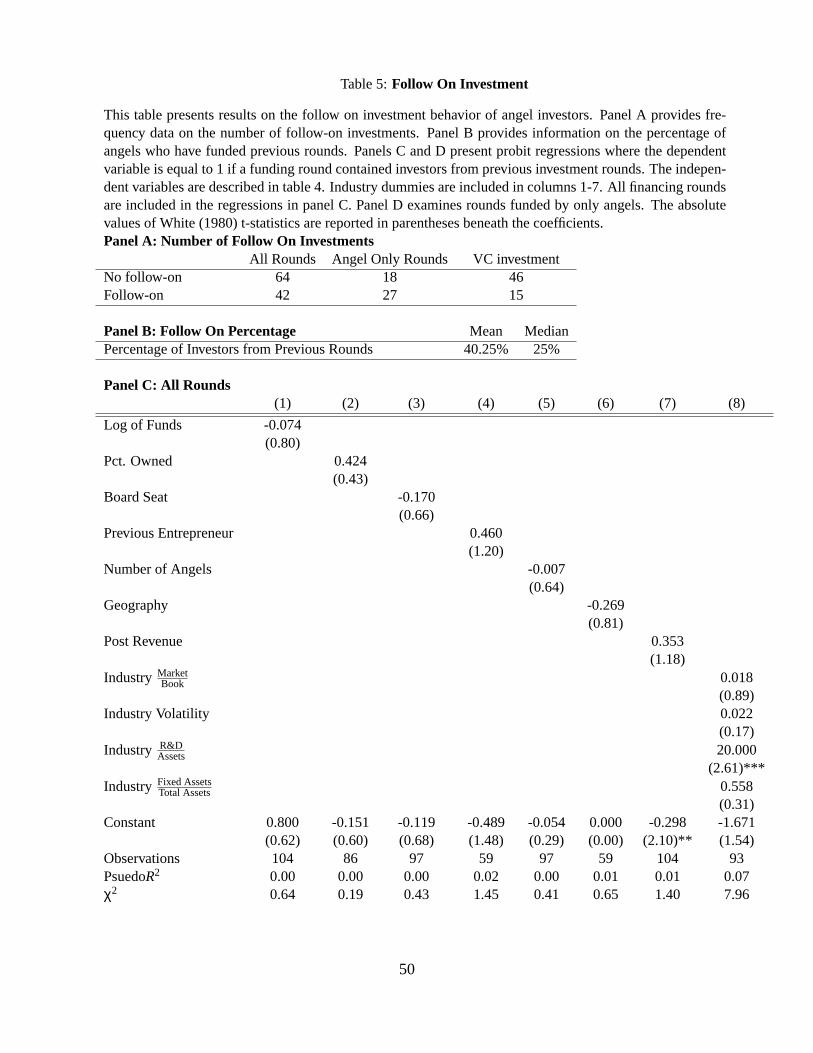
Table 5:Follow On Investment
This table presents results on the follow on investment behavior of angel investors. Panel A provides fre-quency data on the number of follow-on investments. Panel B provides information on the percentage ofangels who have funded previous rounds. Panels C and D present probit regressions where the dependentvariable is equal to 1 if a funding round contained investors from previous investment rounds. The indepen-dent variables are described in table 4. Industry dummies are included in columns 1-7. All financing roundsare included in the regressions in panel C. Panel D examines rounds funded by only angels. The absolutevalues of White (1980) t-statistics are reported in parentheses beneath the coefficients.Panel A: Number of Follow On Investments
All Rounds Angel Only Rounds VC investmentNo follow-on 64 18 46Follow-on 42 27 15
Panel B: Follow On Percentage Mean MedianPercentage of Investors from Previous Rounds 40.25% 25%
Panel C: All Rounds(1) (2) (3) (4) (5) (6) (7) (8)
Log of Funds -0.074(0.80)
Pct. Owned 0.424(0.43)
Board Seat -0.170(0.66)
Previous Entrepreneur 0.460(1.20)
Number of Angels -0.007(0.64)
Geography -0.269(0.81)
Post Revenue 0.353(1.18)
Industry MarketBook 0.018
(0.89)Industry Volatility 0.022
(0.17)Industry R&D
Assets 20.000(2.61)***
Industry Fixed AssetsTotal Assets 0.558
(0.31)Constant 0.800 -0.151 -0.119 -0.489 -0.054 0.000 -0.298 -1.671
(0.62) (0.60) (0.68) (1.48) (0.29) (0.00) (2.10)** (1.54)Observations 104 86 97 59 97 59 104 93PsuedoR2 0.00 0.00 0.00 0.02 0.00 0.01 0.01 0.07χ2 0.64 0.19 0.43 1.45 0.41 0.65 1.40 7.96
50
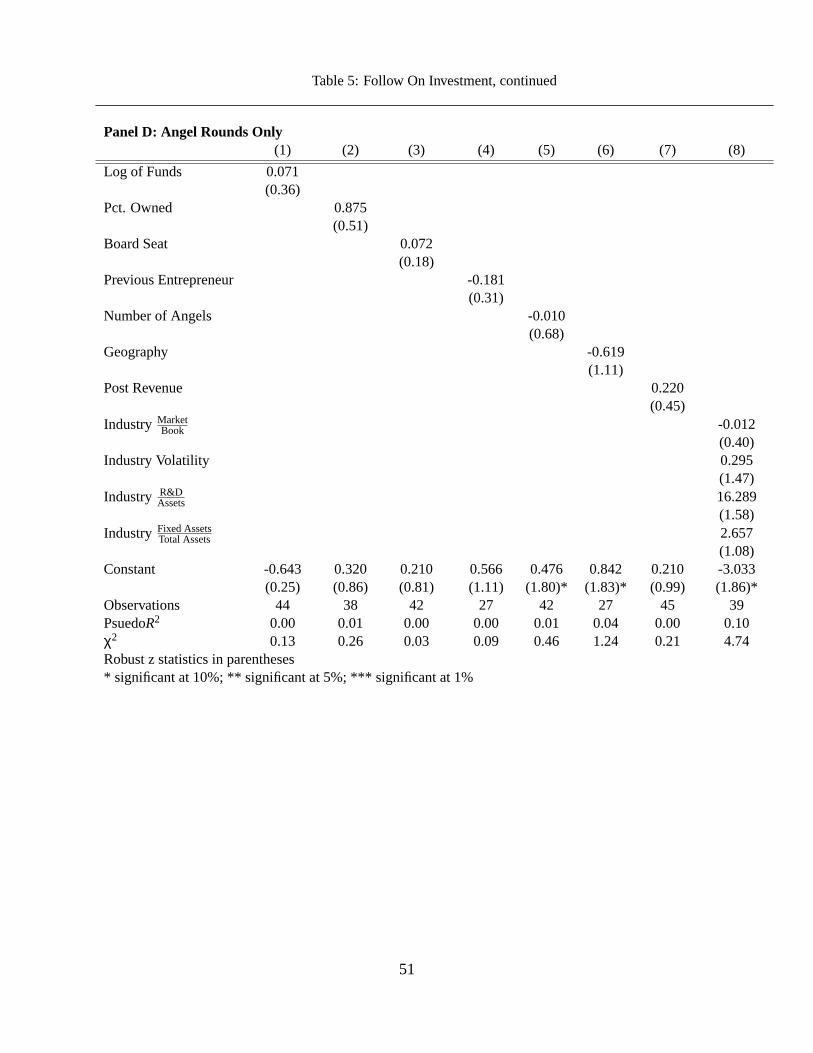
Table 5: Follow On Investment, continued
Panel D: Angel Rounds Only(1) (2) (3) (4) (5) (6) (7) (8)
Log of Funds 0.071(0.36)
Pct. Owned 0.875(0.51)
Board Seat 0.072(0.18)
Previous Entrepreneur -0.181(0.31)
Number of Angels -0.010(0.68)
Geography -0.619(1.11)
Post Revenue 0.220(0.45)
Industry MarketBook -0.012
(0.40)Industry Volatility 0.295
(1.47)Industry R&D
Assets 16.289(1.58)
Industry Fixed AssetsTotal Assets 2.657
(1.08)Constant -0.643 0.320 0.210 0.566 0.476 0.842 0.210 -3.033
(0.25) (0.86) (0.81) (1.11) (1.80)* (1.83)* (0.99) (1.86)*Observations 44 38 42 27 42 27 45 39PsuedoR2 0.00 0.01 0.00 0.00 0.01 0.04 0.00 0.10χ2 0.13 0.26 0.03 0.09 0.46 1.24 0.21 4.74Robust z statistics in parentheses* significant at 10%; ** significant at 5%; *** significant at 1%
51
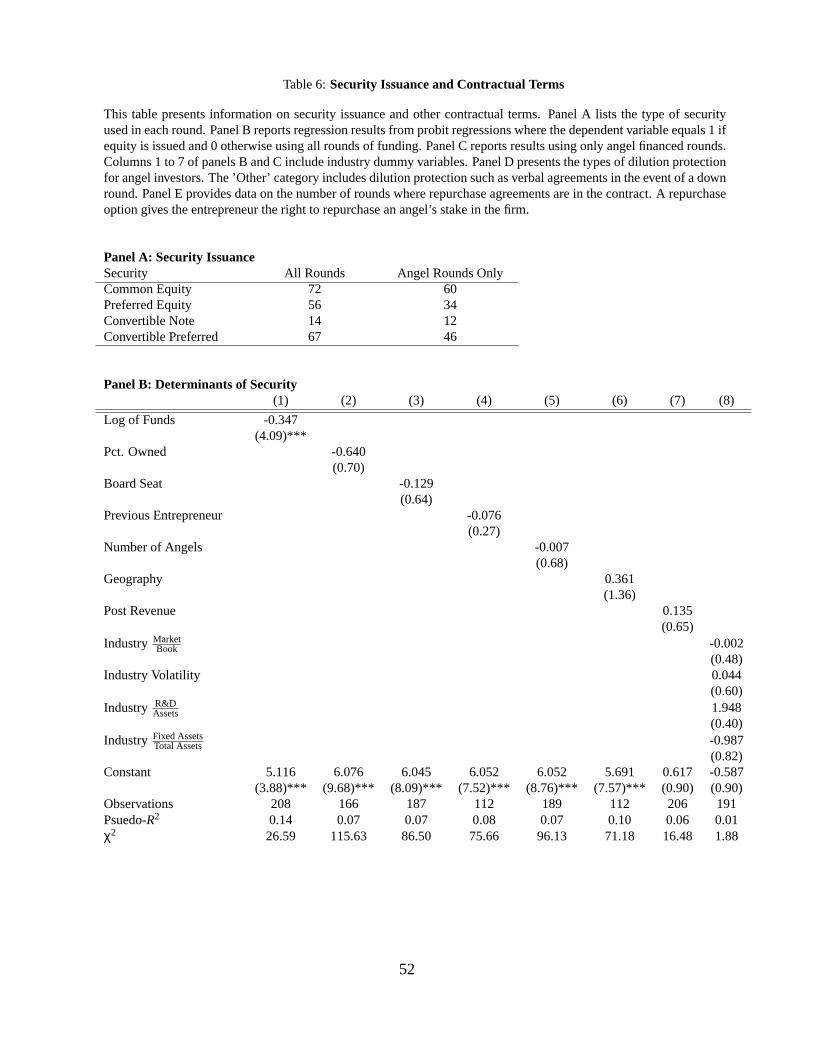
Table 6:Security Issuance and Contractual Terms
This table presents information on security issuance and other contractual terms. Panel A lists the type of securityused in each round. Panel B reports regression results from probit regressions where the dependent variable equals 1 ifequity is issued and 0 otherwise using all rounds of funding. Panel C reports results using only angel financed rounds.Columns 1 to 7 of panels B and C include industry dummy variables. Panel D presents the types of dilution protectionfor angel investors. The ’Other’ category includes dilution protection such as verbal agreements in the event of a downround. Panel E provides data on the number of rounds where repurchase agreements are in the contract. A repurchaseoption gives the entrepreneur the right to repurchase an angel’s stake in the firm.
Panel A: Security IssuanceSecurity All Rounds Angel Rounds OnlyCommon Equity 72 60Preferred Equity 56 34Convertible Note 14 12Convertible Preferred 67 46
Panel B: Determinants of Security(1) (2) (3) (4) (5) (6) (7) (8)
Log of Funds -0.347(4.09)***
Pct. Owned -0.640(0.70)
Board Seat -0.129(0.64)
Previous Entrepreneur -0.076(0.27)
Number of Angels -0.007(0.68)
Geography 0.361(1.36)
Post Revenue 0.135(0.65)
Industry MarketBook -0.002
(0.48)Industry Volatility 0.044
(0.60)Industry R&D
Assets 1.948(0.40)
Industry Fixed AssetsTotal Assets -0.987
(0.82)Constant 5.116 6.076 6.045 6.052 6.052 5.691 0.617 -0.587
(3.88)*** (9.68)*** (8.09)*** (7.52)*** (8.76)*** (7.57)*** (0.90) (0.90)Observations 208 166 187 112 189 112 206 191Psuedo-R2 0.14 0.07 0.07 0.08 0.07 0.10 0.06 0.01χ2 26.59 115.63 86.50 75.66 96.13 71.18 16.48 1.88
52
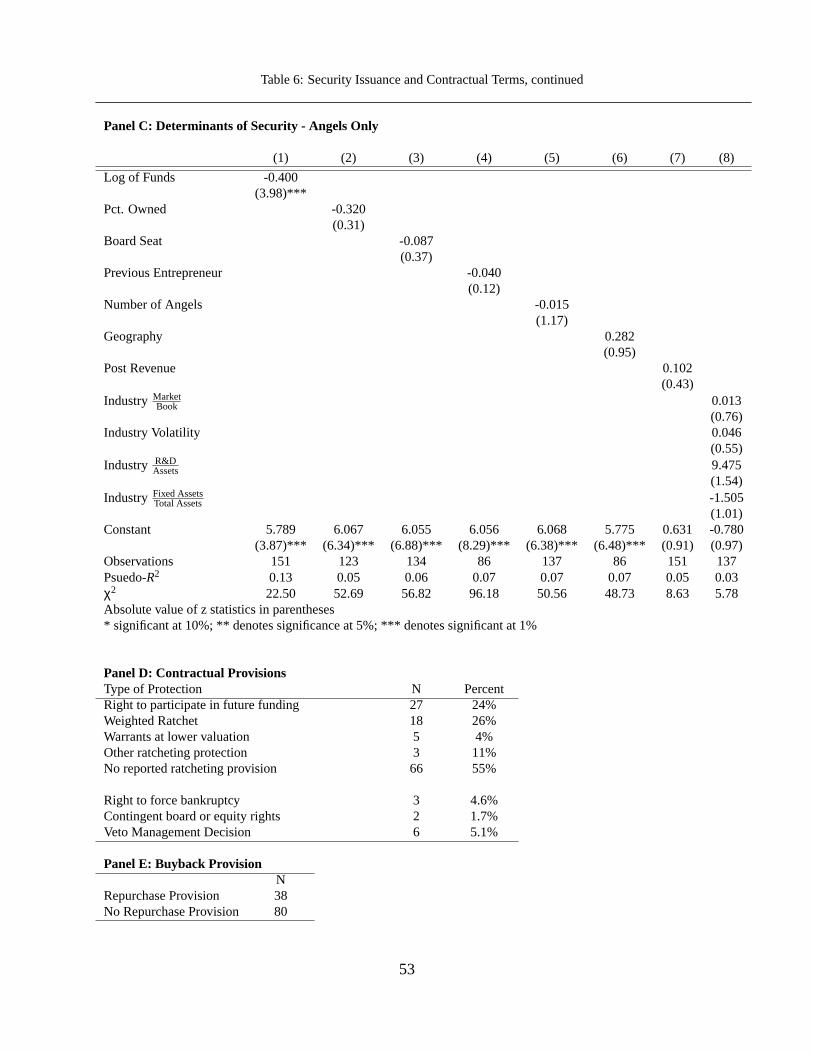
Table 6: Security Issuance and Contractual Terms, continued
Panel C: Determinants of Security - Angels Only
(1) (2) (3) (4) (5) (6) (7) (8)
Log of Funds -0.400(3.98)***
Pct. Owned -0.320(0.31)
Board Seat -0.087(0.37)
Previous Entrepreneur -0.040(0.12)
Number of Angels -0.015(1.17)
Geography 0.282(0.95)
Post Revenue 0.102(0.43)
Industry MarketBook 0.013
(0.76)Industry Volatility 0.046
(0.55)Industry R&D
Assets 9.475(1.54)
Industry Fixed AssetsTotal Assets -1.505
(1.01)Constant 5.789 6.067 6.055 6.056 6.068 5.775 0.631 -0.780
(3.87)*** (6.34)*** (6.88)*** (8.29)*** (6.38)*** (6.48)*** (0.91) (0.97)Observations 151 123 134 86 137 86 151 137Psuedo-R2 0.13 0.05 0.06 0.07 0.07 0.07 0.05 0.03χ2 22.50 52.69 56.82 96.18 50.56 48.73 8.63 5.78Absolute value of z statistics in parentheses* significant at 10%; ** denotes significance at 5%; *** denotes significant at 1%
Panel D: Contractual ProvisionsType of Protection N PercentRight to participate in future funding 27 24%Weighted Ratchet 18 26%Warrants at lower valuation 5 4%Other ratcheting protection 3 11%No reported ratcheting provision 66 55%
Right to force bankruptcy 3 4.6%Contingent board or equity rights 2 1.7%Veto Management Decision 6 5.1%
Panel E: Buyback ProvisionN
Repurchase Provision 38No Repurchase Provision 80
53
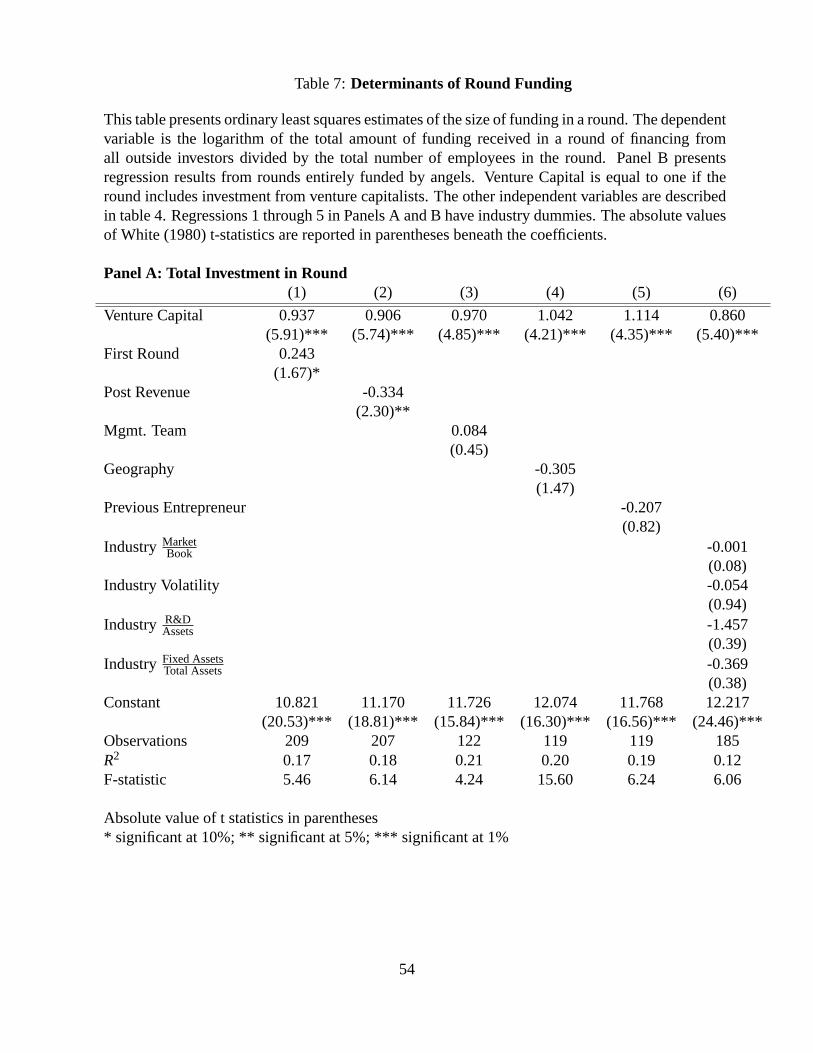
Table 7:Determinants of Round Funding
This table presents ordinary least squares estimates of the size of funding in a round. The dependentvariable is the logarithm of the total amount of funding received in a round of financing fromall outside investors divided by the total number of employees in the round. Panel B presentsregression results from rounds entirely funded by angels. Venture Capital is equal to one if theround includes investment from venture capitalists. The other independent variables are describedin table 4. Regressions 1 through 5 in Panels A and B have industry dummies. The absolute valuesof White (1980) t-statistics are reported in parentheses beneath the coefficients.
Panel A: Total Investment in Round(1) (2) (3) (4) (5) (6)
Venture Capital 0.937 0.906 0.970 1.042 1.114 0.860(5.91)*** (5.74)*** (4.85)*** (4.21)*** (4.35)*** (5.40)***
First Round 0.243(1.67)*
Post Revenue -0.334(2.30)**
Mgmt. Team 0.084(0.45)
Geography -0.305(1.47)
Previous Entrepreneur -0.207(0.82)
Industry MarketBook -0.001
(0.08)Industry Volatility -0.054
(0.94)Industry R&D
Assets -1.457(0.39)
Industry Fixed AssetsTotal Assets -0.369
(0.38)Constant 10.821 11.170 11.726 12.074 11.768 12.217
(20.53)*** (18.81)*** (15.84)*** (16.30)*** (16.56)*** (24.46)***Observations 209 207 122 119 119 185R2 0.17 0.18 0.21 0.20 0.19 0.12F-statistic 5.46 6.14 4.24 15.60 6.24 6.06
Absolute value of t statistics in parentheses* significant at 10%; ** significant at 5%; *** significant at 1%
54
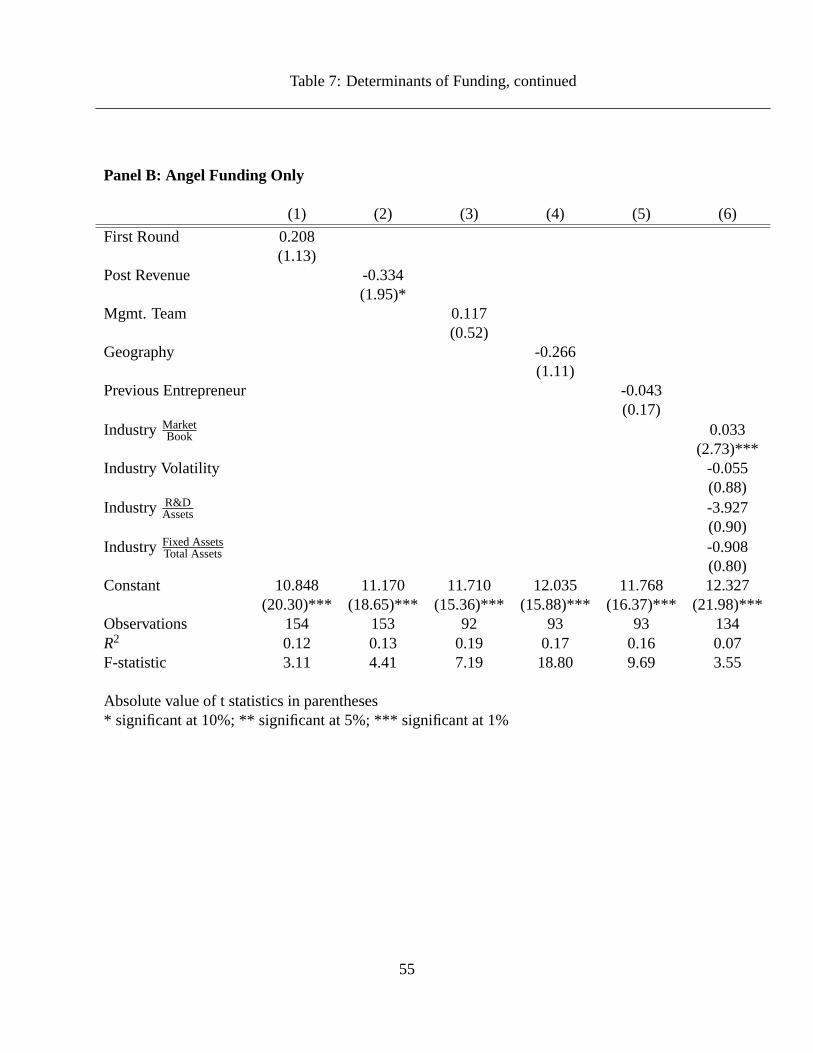
Table 7: Determinants of Funding, continued
Panel B: Angel Funding Only
(1) (2) (3) (4) (5) (6)
First Round 0.208(1.13)
Post Revenue -0.334(1.95)*
Mgmt. Team 0.117(0.52)
Geography -0.266(1.11)
Previous Entrepreneur -0.043(0.17)
Industry MarketBook 0.033
(2.73)***Industry Volatility -0.055
(0.88)Industry R&D
Assets -3.927(0.90)
Industry Fixed AssetsTotal Assets -0.908
(0.80)Constant 10.848 11.170 11.710 12.035 11.768 12.327
(20.30)*** (18.65)*** (15.36)*** (15.88)*** (16.37)*** (21.98)***Observations 154 153 92 93 93 134R2 0.12 0.13 0.19 0.17 0.16 0.07F-statistic 3.11 4.41 7.19 18.80 9.69 3.55
Absolute value of t statistics in parentheses* significant at 10%; ** significant at 5%; *** significant at 1%
55
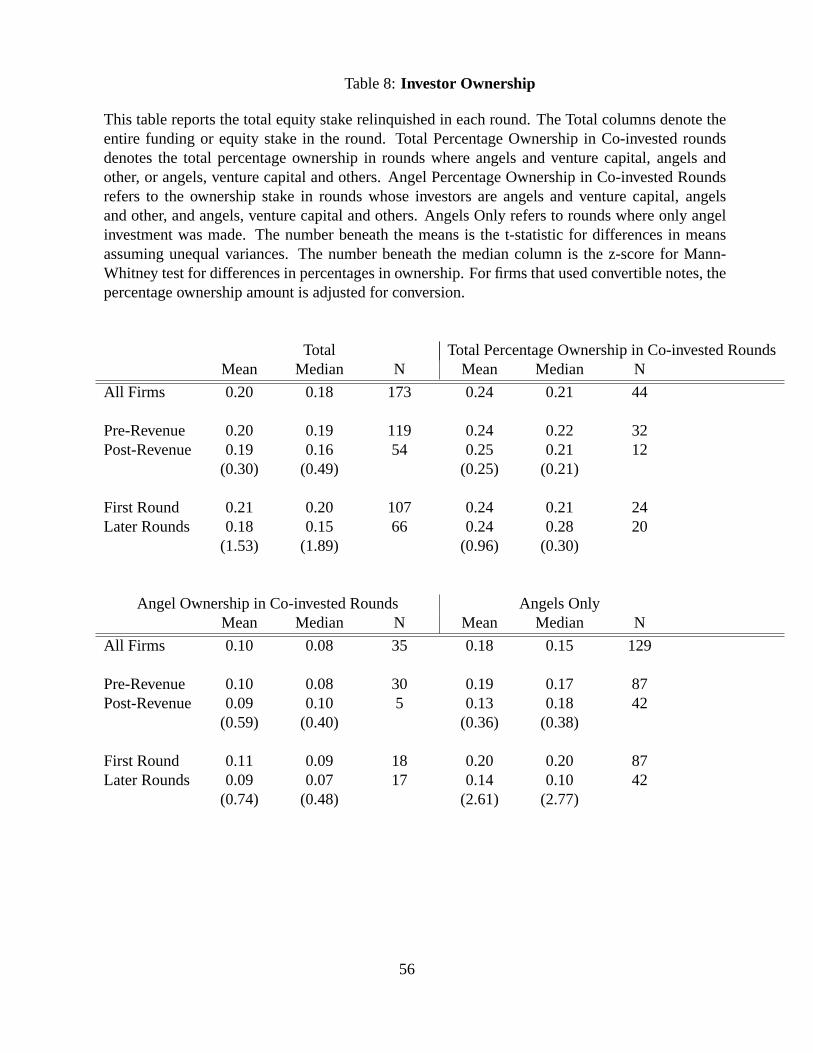
Table 8:Investor Ownership
This table reports the total equity stake relinquished in each round. The Total columns denote theentire funding or equity stake in the round. Total Percentage Ownership in Co-invested roundsdenotes the total percentage ownership in rounds where angels and venture capital, angels andother, or angels, venture capital and others. Angel Percentage Ownership in Co-invested Roundsrefers to the ownership stake in rounds whose investors are angels and venture capital, angelsand other, and angels, venture capital and others. Angels Only refers to rounds where only angelinvestment was made. The number beneath the means is the t-statistic for differences in meansassuming unequal variances. The number beneath the median column is the z-score for Mann-Whitney test for differences in percentages in ownership. For firms that used convertible notes, thepercentage ownership amount is adjusted for conversion.
Total Total Percentage Ownership in Co-invested RoundsMean Median N Mean Median N
All Firms 0.20 0.18 173 0.24 0.21 44
Pre-Revenue 0.20 0.19 119 0.24 0.22 32Post-Revenue 0.19 0.16 54 0.25 0.21 12
(0.30) (0.49) (0.25) (0.21)
First Round 0.21 0.20 107 0.24 0.21 24Later Rounds 0.18 0.15 66 0.24 0.28 20
(1.53) (1.89) (0.96) (0.30)
Angel Ownership in Co-invested Rounds Angels OnlyMean Median N Mean Median N
All Firms 0.10 0.08 35 0.18 0.15 129
Pre-Revenue 0.10 0.08 30 0.19 0.17 87Post-Revenue 0.09 0.10 5 0.13 0.18 42
(0.59) (0.40) (0.36) (0.38)
First Round 0.11 0.09 18 0.20 0.20 87Later Rounds 0.09 0.07 17 0.14 0.10 42
(0.74) (0.48) (2.61) (2.77)
56
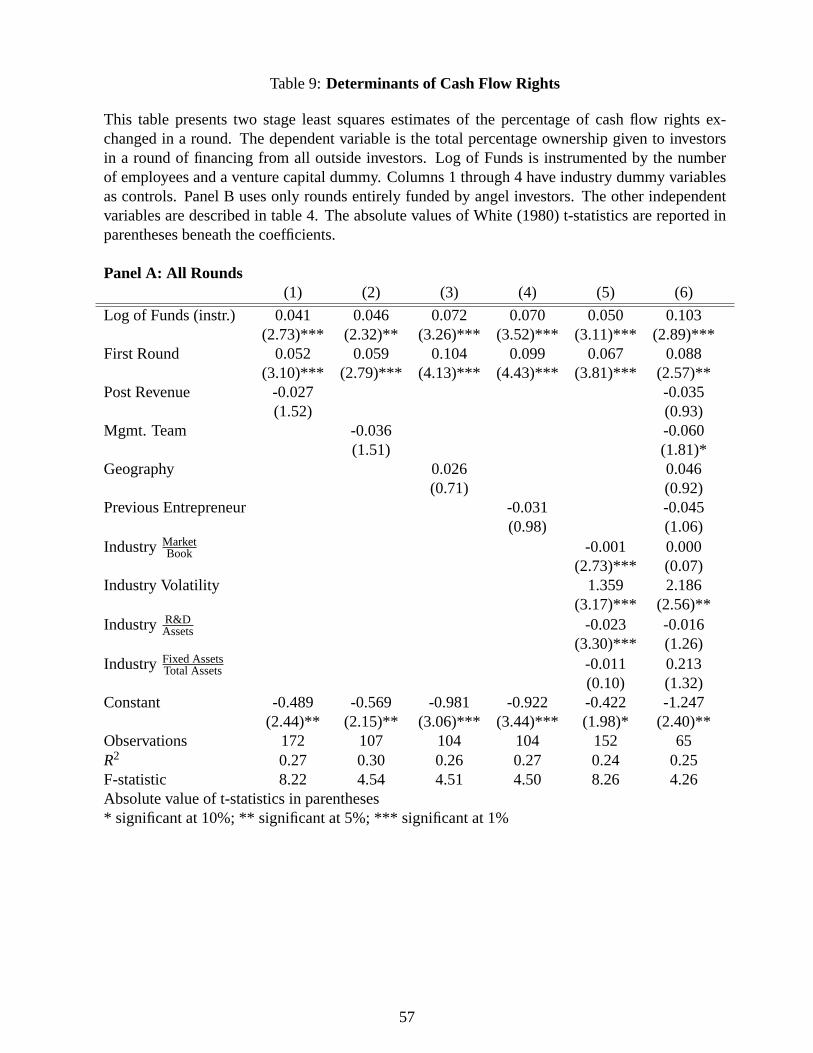
Table 9:Determinants of Cash Flow Rights
This table presents two stage least squares estimates of the percentage of cash flow rights ex-changed in a round. The dependent variable is the total percentage ownership given to investorsin a round of financing from all outside investors. Log of Funds is instrumented by the numberof employees and a venture capital dummy. Columns 1 through 4 have industry dummy variablesas controls. Panel B uses only rounds entirely funded by angel investors. The other independentvariables are described in table 4. The absolute values of White (1980) t-statistics are reported inparentheses beneath the coefficients.
Panel A: All Rounds(1) (2) (3) (4) (5) (6)
Log of Funds (instr.) 0.041 0.046 0.072 0.070 0.050 0.103(2.73)*** (2.32)** (3.26)*** (3.52)*** (3.11)*** (2.89)***
First Round 0.052 0.059 0.104 0.099 0.067 0.088(3.10)*** (2.79)*** (4.13)*** (4.43)*** (3.81)*** (2.57)**
Post Revenue -0.027 -0.035(1.52) (0.93)
Mgmt. Team -0.036 -0.060(1.51) (1.81)*
Geography 0.026 0.046(0.71) (0.92)
Previous Entrepreneur -0.031 -0.045(0.98) (1.06)
Industry MarketBook -0.001 0.000
(2.73)*** (0.07)Industry Volatility 1.359 2.186
(3.17)*** (2.56)**Industry R&D
Assets -0.023 -0.016(3.30)*** (1.26)
Industry Fixed AssetsTotal Assets -0.011 0.213
(0.10) (1.32)Constant -0.489 -0.569 -0.981 -0.922 -0.422 -1.247
(2.44)** (2.15)** (3.06)*** (3.44)*** (1.98)* (2.40)**Observations 172 107 104 104 152 65R2 0.27 0.30 0.26 0.27 0.24 0.25F-statistic 8.22 4.54 4.51 4.50 8.26 4.26Absolute value of t-statistics in parentheses* significant at 10%; ** significant at 5%; *** significant at 1%
57
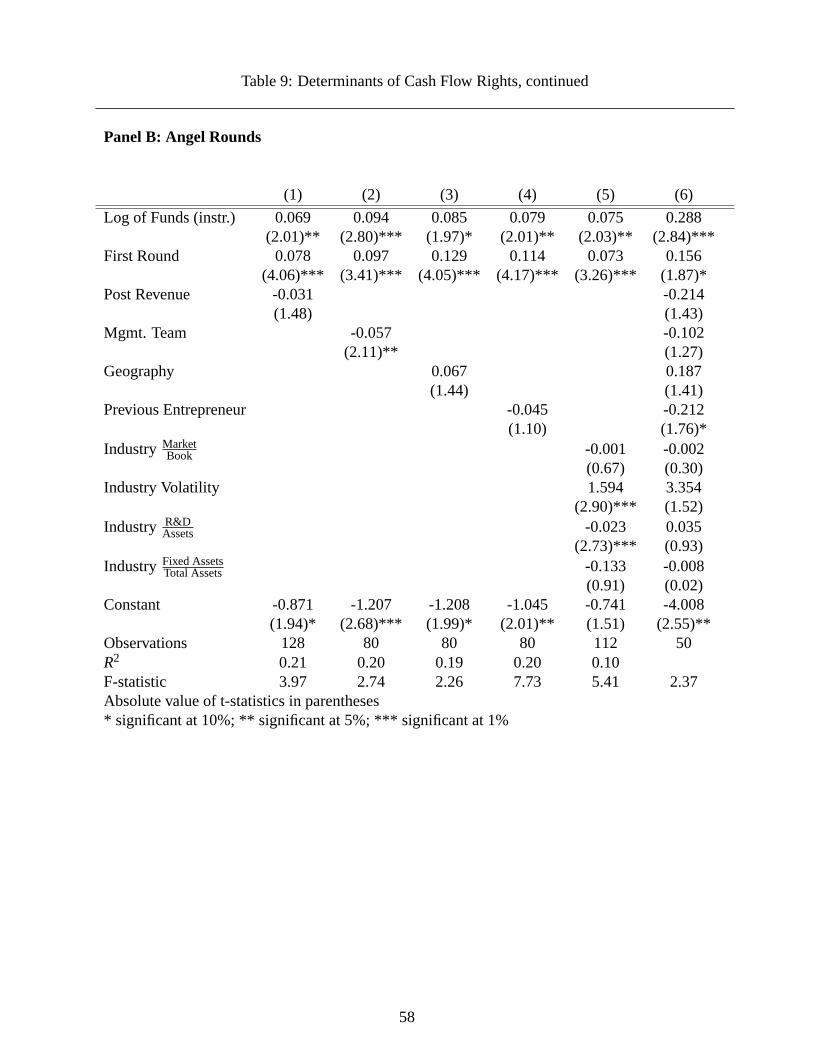
Table 9: Determinants of Cash Flow Rights, continued
Panel B: Angel Rounds
(1) (2) (3) (4) (5) (6)
Log of Funds (instr.) 0.069 0.094 0.085 0.079 0.075 0.288(2.01)** (2.80)*** (1.97)* (2.01)** (2.03)** (2.84)***
First Round 0.078 0.097 0.129 0.114 0.073 0.156(4.06)*** (3.41)*** (4.05)*** (4.17)*** (3.26)*** (1.87)*
Post Revenue -0.031 -0.214(1.48) (1.43)
Mgmt. Team -0.057 -0.102(2.11)** (1.27)
Geography 0.067 0.187(1.44) (1.41)
Previous Entrepreneur -0.045 -0.212(1.10) (1.76)*
Industry MarketBook -0.001 -0.002
(0.67) (0.30)Industry Volatility 1.594 3.354
(2.90)*** (1.52)Industry R&D
Assets -0.023 0.035(2.73)*** (0.93)
Industry Fixed AssetsTotal Assets -0.133 -0.008
(0.91) (0.02)Constant -0.871 -1.207 -1.208 -1.045 -0.741 -4.008
(1.94)* (2.68)*** (1.99)* (2.01)** (1.51) (2.55)**Observations 128 80 80 80 112 50R2 0.21 0.20 0.19 0.20 0.10F-statistic 3.97 2.74 2.26 7.73 5.41 2.37Absolute value of t-statistics in parentheses* significant at 10%; ** significant at 5%; *** significant at 1%
58
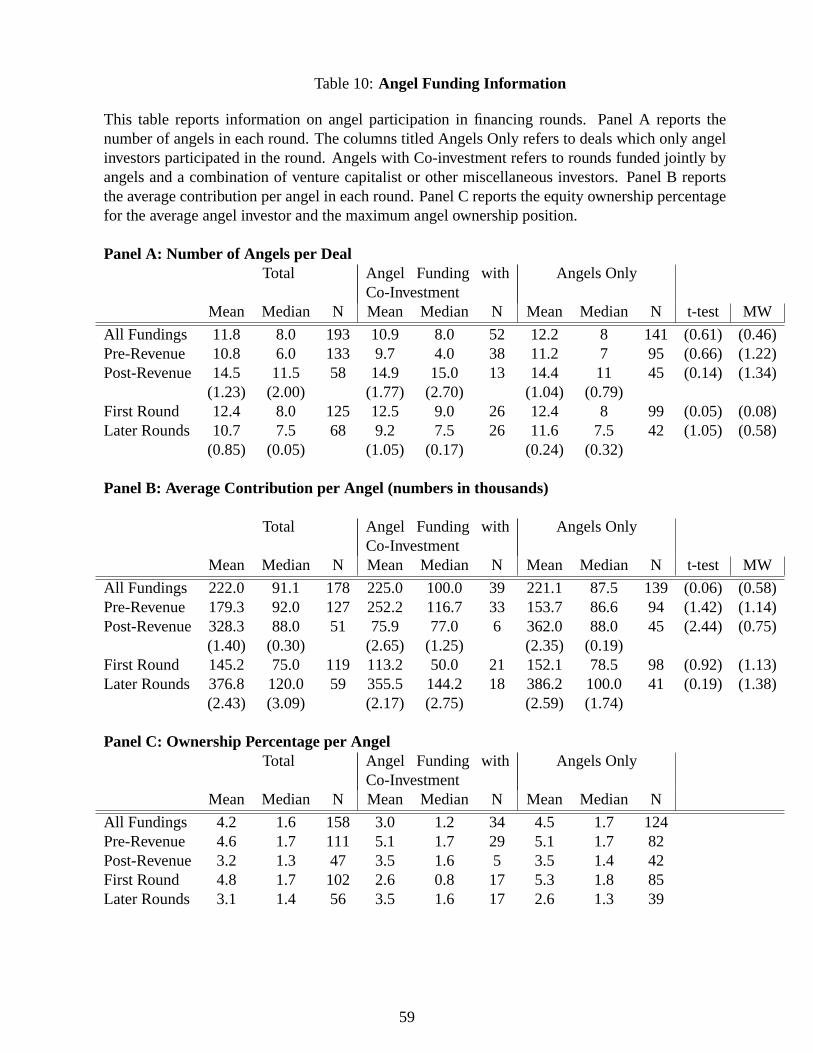
Table 10:Angel Funding Information
This table reports information on angel participation in financing rounds. Panel A reports thenumber of angels in each round. The columns titled Angels Only refers to deals which only angelinvestors participated in the round. Angels with Co-investment refers to rounds funded jointly byangels and a combination of venture capitalist or other miscellaneous investors. Panel B reportsthe average contribution per angel in each round. Panel C reports the equity ownership percentagefor the average angel investor and the maximum angel ownership position.
Panel A: Number of Angels per DealTotal Angel Funding with
Co-InvestmentAngels Only
Mean Median N Mean Median N Mean Median N t-test MW
All Fundings 11.8 8.0 193 10.9 8.0 52 12.2 8 141 (0.61) (0.46)Pre-Revenue 10.8 6.0 133 9.7 4.0 38 11.2 7 95 (0.66) (1.22)Post-Revenue 14.5 11.5 58 14.9 15.0 13 14.4 11 45 (0.14) (1.34)
(1.23) (2.00) (1.77) (2.70) (1.04) (0.79)First Round 12.4 8.0 125 12.5 9.0 26 12.4 8 99 (0.05) (0.08)Later Rounds 10.7 7.5 68 9.2 7.5 26 11.6 7.5 42 (1.05) (0.58)
(0.85) (0.05) (1.05) (0.17) (0.24) (0.32)
Panel B: Average Contribution per Angel (numbers in thousands)
Total Angel Funding withCo-Investment
Angels Only
Mean Median N Mean Median N Mean Median N t-test MW
All Fundings 222.0 91.1 178 225.0 100.0 39 221.1 87.5 139 (0.06) (0.58)Pre-Revenue 179.3 92.0 127 252.2 116.7 33 153.7 86.6 94 (1.42) (1.14)Post-Revenue 328.3 88.0 51 75.9 77.0 6 362.0 88.0 45 (2.44) (0.75)
(1.40) (0.30) (2.65) (1.25) (2.35) (0.19)First Round 145.2 75.0 119 113.2 50.0 21 152.1 78.5 98 (0.92) (1.13)Later Rounds 376.8 120.0 59 355.5 144.2 18 386.2 100.0 41 (0.19) (1.38)
(2.43) (3.09) (2.17) (2.75) (2.59) (1.74)
Panel C: Ownership Percentage per AngelTotal Angel Funding with
Co-InvestmentAngels Only
Mean Median N Mean Median N Mean Median N
All Fundings 4.2 1.6 158 3.0 1.2 34 4.5 1.7 124Pre-Revenue 4.6 1.7 111 5.1 1.7 29 5.1 1.7 82Post-Revenue 3.2 1.3 47 3.5 1.6 5 3.5 1.4 42First Round 4.8 1.7 102 2.6 0.8 17 5.3 1.8 85Later Rounds 3.1 1.4 56 3.5 1.6 17 2.6 1.3 39
59

Table 11:Syndication and Average Contribution
Panels A and B presents estimates from OLS regressions on average angel contribution. In panel A, the dependentvariable is the logarithm of the average contribution per angel in all financing rounds. Panel B reports results for onlyangel financed rounds. Panel C and D reports the results from a instrumental variable regression Poisson regressionas specified in Mullahy(1997). The dependent variable is the number of angel investors. Panel D only uses roundsentirely financed by angels. The natural logarithm of funds is instrumented by the number of employees and thepresence of venture capital. The other independent variables are defined in table 4. The regressions in columns 1-6of panels A and B and columns 1-6 of panel C and D have industry dummy variables. The absolute values of White(1980) t-statistics are reported in parentheses below the coefficients in panels A and B.
Panel A: Average Contribution per Angel
(1) (2) (3) (4) (5) (6) (7) (8)
Venture Capital 0.237 0.336(1.04) (0.78)
Post Revenue 0.077 0.353(0.37) (1.05)
First Round -0.559 -0.745(2.89)*** (2.33)**
Mgmt. Team 0.391 0.445(1.58) (1.53)
Geography -0.811 -0.528(3.13)*** (1.55)
Previous Entrepreneur 0.442 0.352(1.52) (0.96)
Industry MarketBook -0.007 0.028
(2.91)*** (0.87)Industry Volatility 0.021 -0.123
(0.29) (0.98)Industry R&D
Assets -5.148 -4.091(1.07) (0.49)
Industry Fixed AssetsTotal Assets 3.630 2.723
(2.76)*** (1.42)Constant 13.214 13.136 13.493 13.018 14.024 13.214 10.834 12.210
(29.98)*** (26.85)*** (20.68)*** (21.56)*** (26.98)*** (29.32)*** (15.31)*** (10.68)***Observations 178 178 178 111 111 111 158 70R2 0.09 0.08 0.14 0.11 0.21 0.15 0.09 0.30F-statistic 3.39 6.81 9.55 9.14 7.13 4.48 3.77 2.97
60

Table 11: Syndication and Average Contribution, continued
Panel B: Average Contribution per Angel - Angels Only
(1) (2) (3) (4) (5) (6) (7)
Post Revenue 0.221 0.286(0.92) (0.83)
First Round -0.395 -0.387(1.65) (1.01)
Mgmt. Team 0.679 0.630(2.42)** (1.97)*
Geography -0.568 -0.179(1.86)* (0.48)
Previous Entrepreneur 0.358 0.131(1.08) (0.31)
Industry MarketBook 0.002 0.011
(0.11) (0.32)Industry Volatility -9.750 -14.026
(1.76)* (1.46)Industry R&D
Assets 3.679 1.300(2.40)** (0.49)
Industry Fixed AssetsTotal Assets -0.018 -0.182
(0.21) (1.22)Constant 12.992 13.411 12.874 13.782 13.214 11.235 13.027
(25.67)*** (22.22)*** (17.84)*** (25.06)*** (28.87)*** (13.03)*** (8.18)***Observations 139 139 87 89 89 122 54R2 0.09 0.10 0.18 0.18 0.15 0.12 0.31F-statistic 8.39 9.07 3.36 5.62 7.62 2.85 2.34
61
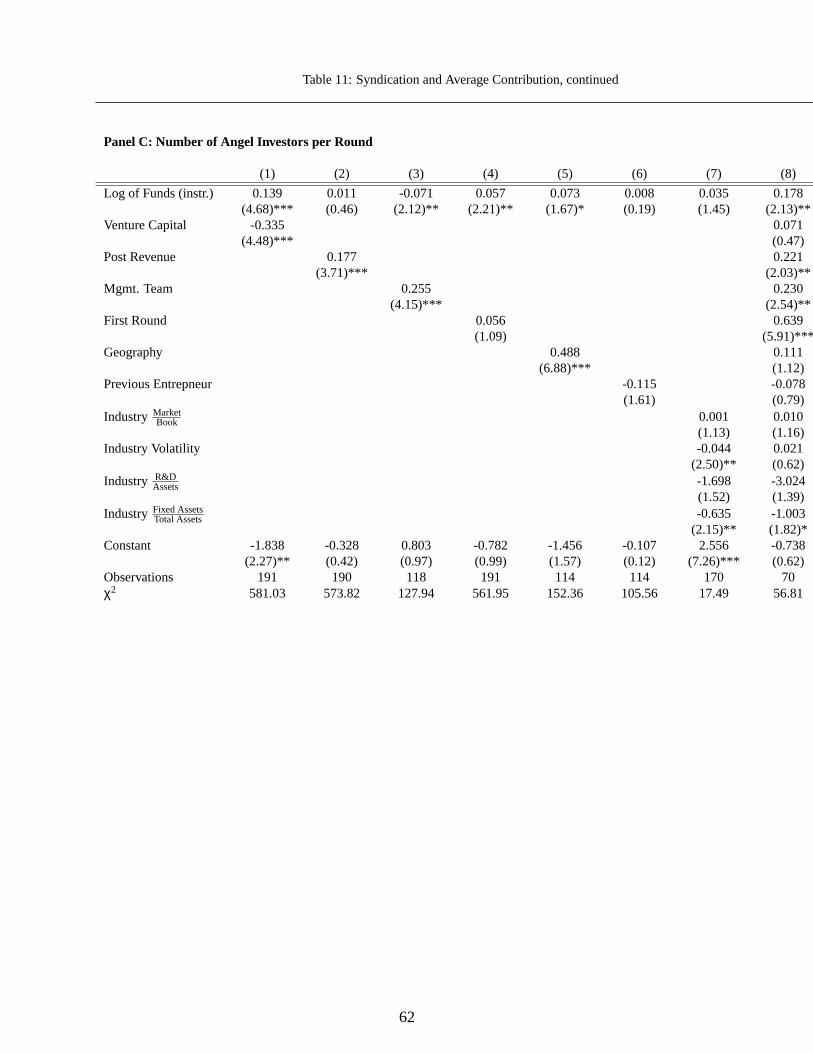
Table 11: Syndication and Average Contribution, continued
Panel C: Number of Angel Investors per Round
(1) (2) (3) (4) (5) (6) (7) (8)
Log of Funds (instr.) 0.139 0.011 -0.071 0.057 0.073 0.008 0.035 0.178(4.68)*** (0.46) (2.12)** (2.21)** (1.67)* (0.19) (1.45) (2.13)**
Venture Capital -0.335 0.071(4.48)*** (0.47)
Post Revenue 0.177 0.221(3.71)*** (2.03)**
Mgmt. Team 0.255 0.230(4.15)*** (2.54)**
First Round 0.056 0.639(1.09) (5.91)***
Geography 0.488 0.111(6.88)*** (1.12)
Previous Entrepneur -0.115 -0.078(1.61) (0.79)
Industry MarketBook 0.001 0.010
(1.13) (1.16)Industry Volatility -0.044 0.021
(2.50)** (0.62)Industry R&D
Assets -1.698 -3.024(1.52) (1.39)
Industry Fixed AssetsTotal Assets -0.635 -1.003
(2.15)** (1.82)*Constant -1.838 -0.328 0.803 -0.782 -1.456 -0.107 2.556 -0.738
(2.27)** (0.42) (0.97) (0.99) (1.57) (0.12) (7.26)*** (0.62)Observations 191 190 118 191 114 114 170 70χ2 581.03 573.82 127.94 561.95 152.36 105.56 17.49 56.81
62
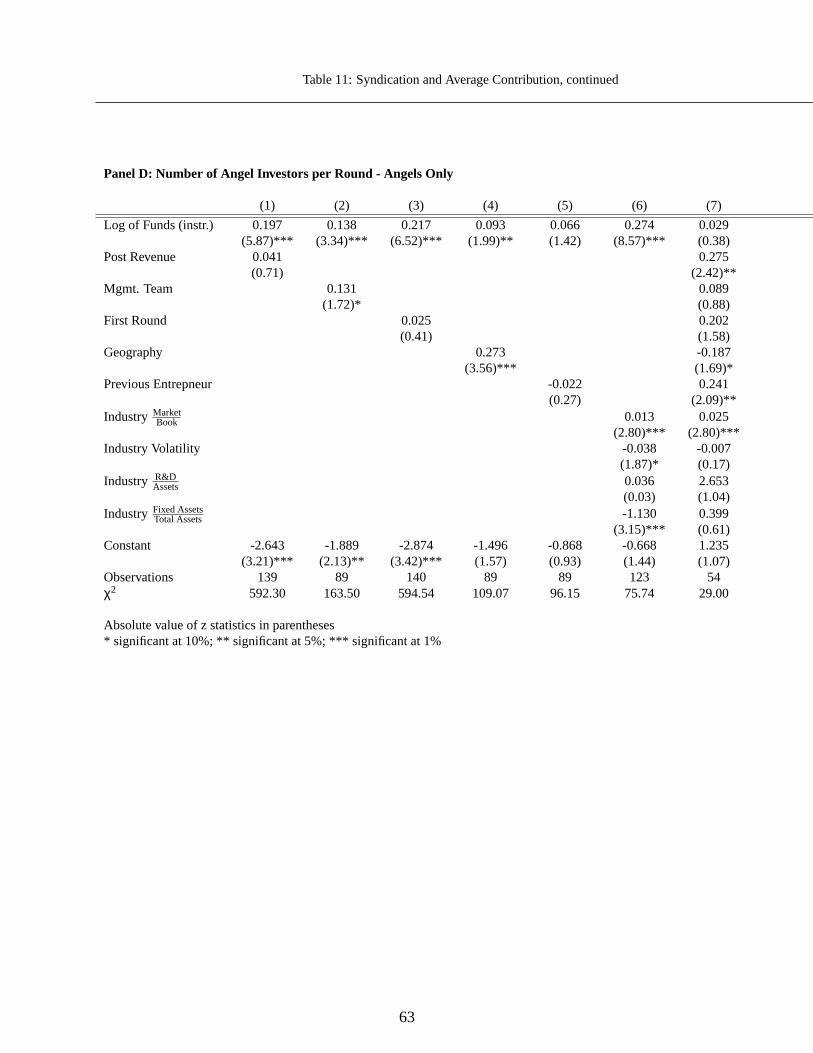
Table 11: Syndication and Average Contribution, continued
Panel D: Number of Angel Investors per Round - Angels Only
(1) (2) (3) (4) (5) (6) (7)
Log of Funds (instr.) 0.197 0.138 0.217 0.093 0.066 0.274 0.029(5.87)*** (3.34)*** (6.52)*** (1.99)** (1.42) (8.57)*** (0.38)
Post Revenue 0.041 0.275(0.71) (2.42)**
Mgmt. Team 0.131 0.089(1.72)* (0.88)
First Round 0.025 0.202(0.41) (1.58)
Geography 0.273 -0.187(3.56)*** (1.69)*
Previous Entrepneur -0.022 0.241(0.27) (2.09)**
Industry MarketBook 0.013 0.025
(2.80)*** (2.80)***Industry Volatility -0.038 -0.007
(1.87)* (0.17)Industry R&D
Assets 0.036 2.653(0.03) (1.04)
Industry Fixed AssetsTotal Assets -1.130 0.399
(3.15)*** (0.61)Constant -2.643 -1.889 -2.874 -1.496 -0.868 -0.668 1.235
(3.21)*** (2.13)** (3.42)*** (1.57) (0.93) (1.44) (1.07)Observations 139 89 140 89 89 123 54χ2 592.30 163.50 594.54 109.07 96.15 75.74 29.00
Absolute value of z statistics in parentheses* significant at 10%; ** significant at 5%; *** significant at 1%
63
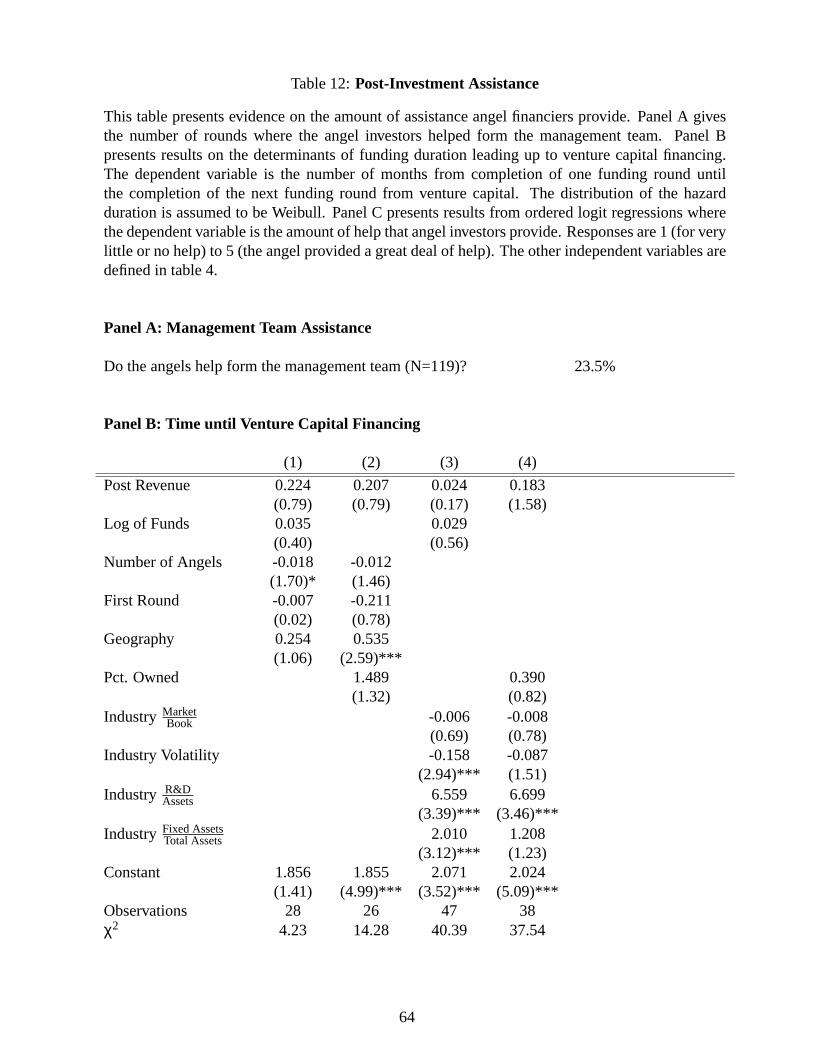
Table 12:Post-Investment Assistance
This table presents evidence on the amount of assistance angel financiers provide. Panel A givesthe number of rounds where the angel investors helped form the management team. Panel Bpresents results on the determinants of funding duration leading up to venture capital financing.The dependent variable is the number of months from completion of one funding round untilthe completion of the next funding round from venture capital. The distribution of the hazardduration is assumed to be Weibull. Panel C presents results from ordered logit regressions wherethe dependent variable is the amount of help that angel investors provide. Responses are 1 (for verylittle or no help) to 5 (the angel provided a great deal of help). The other independent variables aredefined in table 4.
Panel A: Management Team Assistance
Do the angels help form the management team (N=119)? 23.5%
Panel B: Time until Venture Capital Financing
(1) (2) (3) (4)
Post Revenue 0.224 0.207 0.024 0.183(0.79) (0.79) (0.17) (1.58)
Log of Funds 0.035 0.029(0.40) (0.56)
Number of Angels -0.018 -0.012(1.70)* (1.46)
First Round -0.007 -0.211(0.02) (0.78)
Geography 0.254 0.535(1.06) (2.59)***
Pct. Owned 1.489 0.390(1.32) (0.82)
Industry MarketBook -0.006 -0.008
(0.69) (0.78)Industry Volatility -0.158 -0.087
(2.94)*** (1.51)Industry R&D
Assets 6.559 6.699(3.39)*** (3.46)***
Industry Fixed AssetsTotal Assets 2.010 1.208
(3.12)*** (1.23)Constant 1.856 1.855 2.071 2.024
(1.41) (4.99)*** (3.52)*** (5.09)***Observations 28 26 47 38χ2 4.23 14.28 40.39 37.54
64
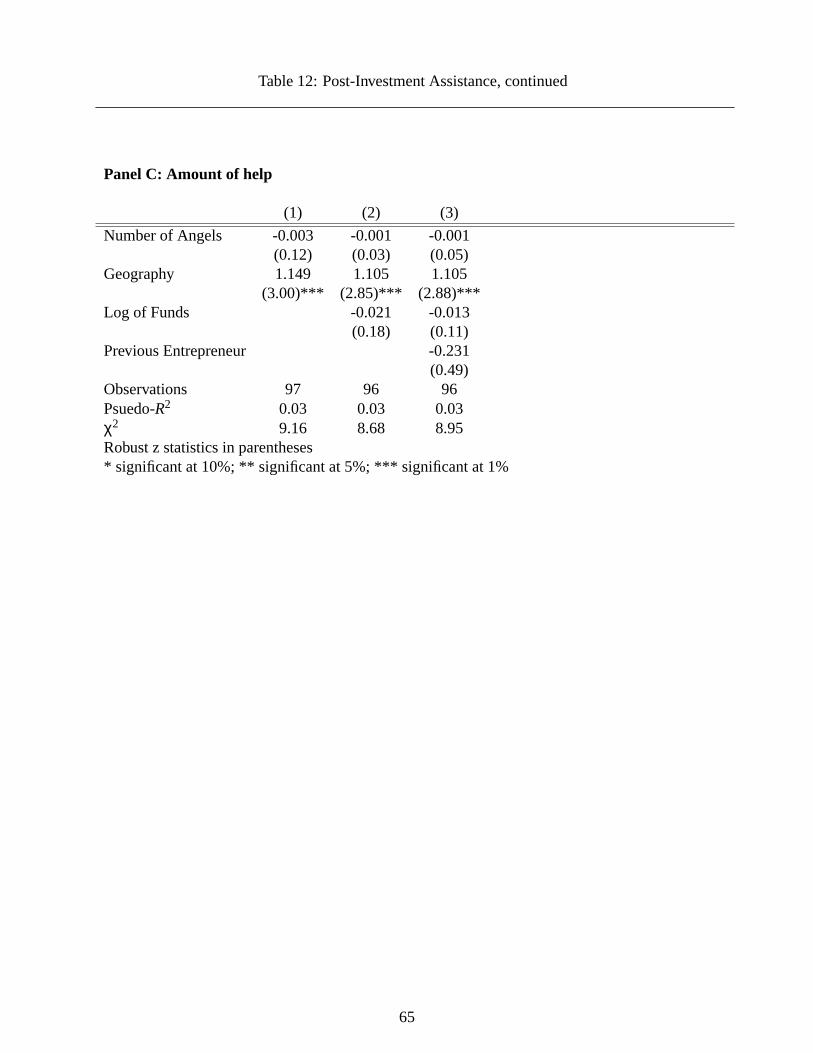
Table 12: Post-Investment Assistance, continued
Panel C: Amount of help
(1) (2) (3)
Number of Angels -0.003 -0.001 -0.001(0.12) (0.03) (0.05)
Geography 1.149 1.105 1.105(3.00)*** (2.85)*** (2.88)***
Log of Funds -0.021 -0.013(0.18) (0.11)
Previous Entrepreneur -0.231(0.49)
Observations 97 96 96Psuedo-R2 0.03 0.03 0.03χ2 9.16 8.68 8.95Robust z statistics in parentheses* significant at 10%; ** significant at 5%; *** significant at 1%
65