angeles state university
TRANSCRIPT

Performance Analysis for
Colleges of Education
Angeles State University
150 Miles
Center for Research, Evaluation and
Advancement of Teacher Education
www.createtx.org

YEAR 8
Released October 2014
CREATE Center for Research, Evaluation and Advancement
of Teacher Education
PACE 2014 Performance Analysis for
Colleges of Education

CREATE COORDINATING COMMITTEE
CREATE ADVISORY COUNCIL
Linda Mora
Deputy Superintendent
Curriculum & Instruction
Northside Independent School District
Ed Crowe
Senior Adviser
Woodrow Wilson National
Fellowship Foundation
Charles Coble
Partner
The Third Mile Group, LLC
Jeanne Gerlach
Dean, College of Education
The University of Texas at Arlington
Jeanne Burns
Associate Commissioner for Teacher Initiatives
Governor’s Office of Education /
Louisiana Board of Regents
Sabrina Laine
Vice President
American Institutes for Research
Robert McPherson
Dean, College of Education
University of Houston
Nancy Pelz-Paget
Director of Education & Society Program
Aspen Institute
Rosanne Stripling
Provost & Vice President for Academic Affairs
Texas A&M University – Texarkana
Johnny Veselka
Executive Director
Texas Association of School Administrators
Perry Moore, Chair
Vice Chancellor for Academic Affairs
The Texas State University System
Pedro Reyes
Executive Vice Chancellor for
Academic Affairs
The University of Texas System
Paula Myrick Short
Sr. VC/VP, Academic Affairs/Provost
The University of Houston System
James Hallmark
Vice Chancellor for Academic Affairs
The Texas A&M University System

CREATE MEMBER SYSTEMS AND INSTITUTIONS
OPERATING PARTNERS
TEXAS A&M UNIVERSITY SYSTEM
Prairie View A&M University
Tarleton State University
Texas A&M International University
Texas A&M University
Texas A&M University-Central Texas
Texas A&M University-Commerce
Texas A&M University-Corpus Christi
Texas A&M University-Kingsville
Texas A&M University-San Antonio
Texas A&M University-Texarkana
West Texas A&M University
TEXAS STATE UNIVERSITY SYSTEM
Lamar State College-Orange
Lamar University
Sam Houston State University
Sul Ross State University
Sul Ross State University-Rio Grande
Texas State University
UNIVERSITY OF HOUSTON SYSTEM
University of Houston
University of Houston-Clear Lake
University of Houston-Downtown
University of Houston-Victoria
UNIVERSITY OF TEXAS SYSTEM
The University of Texas at Arlington
The University of Texas at Austin
The University of Texas at Brownsville
The University of Texas at Dallas
The University of Texas at El Paso
The University of Texas-Pan American
The University of Texas of the Permian Basin
The University of Texas at San Antonio
The University of Texas at Tyler
PROGRAM PARTNERS
Abilene Christian University
Angelo State University
Austin College
Baylor University
East Texas Baptist University
Hardin-Simmons University
Houston Baptist University
Howard Payne University
McMurry University
Midwestern State University
Our Lady of the Lake University
Schreiner University
Southwestern University
St. Edward’s University
St. Mary’s University
Stephen F. Austin State University
Texas Christian University
Texas Lutheran University
Texas Southern University
Texas Tech University
Texas Wesleyan University
Texas Woman’s University
University of Mary Hardin-Baylor
University of North Texas
University of St. Thomas
University of the Incarnate Word

i
TABLE OF CONTENTS
Performance Analysis for Colleges of Education
(PACE)
Overview
Purpose and Objectives of PACE ..............................................................................................1
CREATE Assumptions about the Professional Influence and Impact of Colleges of
Education ...................................................................................................................................3
The Proximal Zone of Professional Impact (PZPI): A Contextual Framework for
Assessing Long-Term Influence and Impact of Colleges of Education ....................................4
Data Sets Used in the PACE Report ..........................................................................................5
How to Use and Apply the PACE Report ..................................................................................6
PACE Reports
I. Educational Trends in University’s Proximal Zone of Professional
Impact
A. Descriptive Reports on the Characteristics of Public Schools in the Proximal
Zone of Professional Impact ....................................................................................7
A.1. Summary of Public School Enrollment in the Proximal Zone of
Professional Impact ............................................................................................9
A.2. Public School Enrollment by District in the Proximal Zone of Professional
Impact (Sample)...............................................................................................10
A.3. Public School Listings in the Proximal Zone of Professional Impact
(Sample) ...........................................................................................................11
B. Educational Trend Reports on Public Schools in the Proximal Zone of
Professional Impact ................................................................................................12
B.1. Student Enrollment Trends in Proximal Zone of Professional Impact ............14
B.2. Student Academic Performance in the Proximal Zone of Professional
Impact: STAAR Performance Summary: High Schools ...............................16
B.2.1. STAAR Performance by Ethnicity: High School Reading .................17

ii
B.2.2. STAAR Performance by Ethnicity: High School Writing ..................18
B.2.3. STAAR Performance by Ethnicity: High School Mathematics .........19
B.2.4. STAAR Performance by Ethnicity: High School Science ..................20
B.2.5. STAAR Performance by Ethnicity: High School Social Studies .......21
B.3. Student Academic Performance in the Proximal Zone of Professional
Impact: STAAR Performance Summary: Middle Schools ............................22
B.3.1. STAAR Performance by Ethnicity: Middle School Reading .............23
B.3.2. STAAR Performance by Ethnicity: Middle School Writing ..............24
B.3.3. STAAR Performance by Ethnicity: Middle School Mathematics ......25
B.3.4. STAAR Performance by Ethnicity: Middle School Science ..............26
B.3.5. STAAR Performance by Ethnicity: Middle School Social Studies ....27
B.4. Student Academic Performance in the Proximal Zone of Professional
Impact: STAAR Performance Summary: Elementary Schools .....................28
B.4.1. STAAR Performance by Ethnicity: Elementary School Reading ......29
B.4.2. STAAR Performance by Ethnicity: Elementary School Writing .......30
B.4.3. STAAR Performance by Ethnicity: Elementary School
Mathematics .........................................................................................31
B.4.4. STAAR Performance by Ethnicity: Elementary School Science .......32
B.5. Highest and Lowest Performing Schools by Level
B.5.1. Highest Performing High Schools Ranked by STAAR Algebra I .......33
B.5.2. Lowest Performing High Schools Ranked by STAAR Algebra I .......34
B.5.3. Highest Performing Middle Schools Ranked by STAAR Reading .....35
B.5.4. Lowest Performing Middle Schools Ranked by STAAR Reading ......36
B.5.5. Highest Performing Elementary Schools Ranked by STAAR
Reading ................................................................................................37
B.5.5. Lowest Performing Elementary Schools Ranked by STAAR
Reading ................................................................................................38
II. University and Teacher Education Trends
C. University and Teacher Production Reports ........................................................39
C.1. Five-Year University Production Trends .........................................................40
C.2. Teacher Production Trends for University Completers ...................................41

iii
C.3. Teacher Production by Race/Ethnicity ............................................................42
C.4. Initial Certification Production by Level .........................................................43
C.5. Other Producers of Teachers in the Proximal Zone of Professional Impact ....44
D. Professional Impact Trend Reports ......................................................................45
D.1. Teacher Hiring in the Proximal Zone of Professional Impact
D.1.a: High Schools ........................................................................................46
D.1.b: Middle Schools ....................................................................................47
D.1.c: Elementary Schools .............................................................................48
D.2. Percentage of Newly-Certified Teachers Employed Inside and Outside the
Proximal Zone of Professional Impact ............................................................49
D.3. District Hiring Patterns of University-Prepared Teachers in PZPI (Sample) ..50
D.4. Percentage of University Completers in the Proximal Zone of Professional
Impact
D.4.a. High Schools ........................................................................................51
D.4.b. Middle Schools ....................................................................................52
D.4.c. Elementary Schools .............................................................................53
D.5. Comparison of Teacher Retention Trends
D.5.a. Five-Year Retention of First-Year Teachers ........................................54
D.5.b. Five-Year Retention of First-Year Teachers: High School ................55
D.5.c. Five-Year Retention of First-Year Teachers: Middle School .............56
D.5.d. Five-Year Retention of First-Year Teachers: Elementary School ......57
III. University Benchmarks to Guide Improvement
E. University Comparison Reports ............................................................................58
E.1. Comparison of Teacher Production .................................................................59
E.2. Five-Year Teacher Production of Consortium Universities ............................60
E.3. Comparison of Longitudinal Certificate Production Trends ...........................62
E.4. Teacher Retention Comparison .......................................................................63
Changes Made to the 2013 Reports .........................................................................................64
Data Corrections and Data Requests........................................................................................64

iv
IV. Attachments
Attachment 1: Public School Enrollment in the Proximal Zone of Professional Impact
Attachment 2: Public School Listings in the Proximal Zone of Professional Impact
Attachment 3: District Hiring Patterns of University-Prepared Teachers in the Proximal
Zone of Professional Impact
V. Origins of Source Data for 2014 PACE Reports
Section A: TAPR, AY 2012-2013, TEA;
PZPI, CREATE
Section B: AEIS, AY 2010-2012, TAPR, AY 2012-2013, TEA;
PZPI, CREATE
Section C: IPEDS Fall 2012; ICUT Fall 2012;
Teacher certification file FY 2012-2013, TEA;
THECB Accountability System, Prep Online, AY 2012-2013
Section D: Teacher certification file, FY 2012-2013, TEA;
Teacher assignment and employment files, AY 2013-2014, TEA;
TAPR, AY 2012-2013, TEA;
PZPI, CREATE
Section E: Teacher certification file, FY 2012-2013, TEA;
Teacher employment file, AY 2013-2014, TEA

PACE 2014 1
PERFORMANCE ANALYSIS FOR COLLEGES OF EDUCATION
(PACE)
Purpose and Objectives of PACE
As a consortium of universities devoted to on-going analysis and continuous quality
improvement of university-based teacher preparation, the Center for Research,
Evaluation and Advancement of Teacher Education (CREATE) seeks to develop
planning and information systems that can assist universities in professional analysis of
their teacher preparation initiatives, particularly as these practices relate to long-term
teacher influence and effect.
The preparation of effective teachers for Texas public schools is of paramount
importance in assuring sound economic footing and an enhanced quality of life for all
Texans. To this end, university-based teacher preparation is of great public significance
in the state, worthy of careful attention, and an important subject of continuous quality
improvement.
Performance Analysis for Colleges of Education (PACE) is offered in support of the
teacher preparation programs associated with the CREATE consortium. PACE presents a
useful reporting system for universities and their Colleges of Education centered on
public schools. Reports are intended to be used as a planning and resource tool that can
assist teacher education leaders in assessing needs, targeting refinements in their
preparation programs, and evaluating organizational effects over time.
PACE reports are intended to address the following objectives:
1. Present a system which describes and charts a Proximal Zone of Professional
Impact (PZPI) for each CREATE institution, within which to consider long-
term program interventions and measure effectiveness of university teacher
preparation programs.
2. Provide a school-centered tool that can assist in the continuous quality
improvement of university-based teacher preparation programs.
3. Provide information that will enable university and public school leaders to
track long-term trends related to public schools in their immediate area.
4. Provide information that will enable university and public school leaders to
track long-term trends related to teacher supply in relation to regional demand.
5. Furnish a structured format that will enable university and public school
leaders to engage in systematic analysis of production, academic performance,
and staffing patterns in their immediate vicinity.

PACE 2014 2
As an information system, the PACE reports are subject to continuous quality
improvement. For Year 8, the core reports on university and teacher production,
professional impact trends, and benchmarking have been retained. Changes to the State
of Texas Assessments of Academic Readiness (STAAR) accountability system continue.
Almost all of the trend reports on public school academic performance have been
redesigned. Report modifications on this set of reports will continue until the STAAR
system is completely functional.
PACE is offered as a common data platform that can assist all consortium members in
establishing a school-centered planning focus. However, PACE data must be augmented
with university program information in order to thoroughly answer critical evaluation
questions about each institution’s teacher preparation programs. Hopefully, the
information found in PACE will encourage users to integrate local university information
to inform teacher preparation practices at the campus and regional level.
It is also important to note that PACE reports are derived from Texas state data sources.
Large files of this size and scope are always subject to variability and standard degree of
error. To this end, it is imperative that PACE users verify and authenticate these reported
data prior to final analysis and interpretation. CREATE staff stand ready to assist in
answering questions or clarifying issues regarding data quality. A summary of changes
made to the 2014 PACE reports and information about whom to contact regarding data
requests and data errors can be found on page 64.

PACE 2014 3
CREATE Assumptions about the Professional Influence and Impact
of Colleges of Education
The PACE report is based upon key assumptions that are central to CREATE’s mission
and program of work. CREATE assumes the following with regard to the professional
influence and impact of Colleges of Education.
A. Colleges of Education are an integral component of a system of public education
and, as such, have a professional obligation to contribute to the continuous quality
improvement of public school teaching and K-12 academic performance.
B. Colleges of Education can and do influence continuous quality improvement of
public school teaching and K-12 academic performance through their core
functions of:
• teacher preparation
• research and development
• service to the profession
C. To optimize professional influence, Colleges of Education leaders must regularly
assess the status of public school teaching and student academic performance, and
based upon identified needs, work with their public school partners to develop
and implement program interventions that support measured improvement over
time.
D. The College of Education’s long-term effects on public school teaching and K-12
academic performance can best be assessed through:
• on-going analysis of the College’s teacher production, placement and
retention trends
• faculty and graduate student research and development activities
• faculty and staff service to the local profession as implemented in
a Proximal Zone of Professional Impact (PZPI)
E. Faculty and public school collaboration in planning, implementing and/or
assessing educational interventions in the PZPI should be actively encouraged
within every College of Education.

PACE 2014 4
The Proximal Zone of Professional Impact (PZPI):
A Contextual Framework for Assessing Long-Term Influence and
Impact of Colleges of Education
To facilitate consistent long-term assessment of institutional impact, and afford
comparative analysis, CREATE has established a Proximal Zone of Professional Impact
(PZPI) for CREATE institutions. The Proximal Zone of Professional Impact is
comprised of the university and all school districts and campuses within a seventy-five
mile radius of the university. This proximal zone describes a “P-16” professional
community in the immediate vicinity of each university, and provides each College of
Education a professional community in which to collaboratively design and implement
program improvements over time and to gauge their long-term success.
While this Proximal Zone of Professional Impact does not convey the complete impact
scenario of the university’s teacher preparation programs, it does provide a common and
consistent setting in which the university may measure program effects over time.
From CREATE’s perspective, designating a PZPI offers the following advantages:
A. It establishes parameters of a professional community that are consistently
defined across the CREATE consortium, enabling long-term program
benchmarking and institutional comparisons.
B. It presents a useful frame of reference for Colleges of Education to utilize in
assessing teaching and learning trends over time in the geographic area nearest
their institution.
C. It provides support for long-term regional networking and professional
partnerships among public and higher education institutions in the zone.
D. It provides geographic boundaries that correlate to the university’s primary
admission centers.

PACE 2014 5
Data Sets Used in the PACE Report
The data used to compile the PACE reports are based on the following data sets, listed in
alphabetical order:
Academic Excellence Indicator System (AEIS) and Texas Academic Performance Reports
(TAPR). With the recent implementation of the STAAR accountability system, AEIS has
been replaced by TAPR. Both reporting systems contain student and staff data on every
public school campus and district in Texas. The AEIS data, showing TAKS performance,
is available from the TEA website from 1990-1991 through 2011-2012. The TAPR data,
showing STAAR performance, is available from the TEA website.
Independent Colleges and Universities of Texas (ICUT). The independent colleges and
university production data downloaded from IPEDS was verified through the University and
College Accountability Network (UCAN) found at http://www.ucan-
network.org/members.asp.
Integrated Postsecondary Education Data System (IPEDS). The independent colleges and
university production data was downloaded from The National Center for Education
Statistics (NCES) through the IPEDS Data Center (http://nces.ed.gov/ipeds/datacenter).
Proximal Zone of Professional Impact (PZPI). This data set, produced by CREATE,
contains a list of the K-12 public schools and districts within a 75-mile radius of each
university in the CREATE consortium offering teacher preparation.
Teacher Assignment Data Set. This data set, obtained from the Texas Education Agency
(TEA), matches each teacher to the district and campus(s) in which he or she teaches. The
type of information available includes the specific course and subject area assignments by
percentage of full-time equivalent (FTE) for every teacher of record in every Texas public
school.
Teacher Certification Data Set. This data set, also obtained from TEA, lists information
about each Texas teaching certificate obtained by a qualified applicant in Texas. The data
are available from FY 1994 through the current year. It is a dynamic data set in that
changes are made on a daily basis. Thus, any analysis based on a Teacher Certification
Data Set purchased in one month will likely differ somewhat from an analysis based on a
data set purchased in another month.
Texas Higher Education Accountability System. This data is used to track performance on
critical measures that exemplify higher education institutions' missions. It is an interactive
website (http://www.txhighereddata.org/Interactive/Accountability/), providing information
related to the four success goals of the Texas Higher Education Closing the Gaps Initiative.
Information about university production was downloaded from the THECB Prep Online site
(http://www.txhighereddata.org/Interactive/PREP_New/).

PACE 2014 6
How to Use and Apply the PACE Report
PACE is intended as a tool to assist universities, their Colleges of Education, and their
leadership teams in analyzing teaching and learning trends within their institutions and
within the public schools of the surrounding area. PACE offers a structure to monitor and
gauge long-term professional improvement. The data included in this report are important,
therefore, only to the degree that each university chooses to address them in a systematic
and continuous manner. It is hoped that the PACE reports will be used as planning tools
that universities will use to create institutional mechanisms for the on-going refinement of
their teacher preparation programs, as well as other educational programs. Based on this
intended use, we recommend the following actions associated with the PACE reports:
1. Organize and empower a teacher preparation leadership team which includes both
university and public school partners (a standing work committee) to analyze and
interpret these data as well as recommend organizational improvements based on
the needs identified.
2. Verify and validate the state data sets to be certain that they are relatively consistent
with comparable data reported by the university. Extend and augment the data in
the PACE reports with university data bases and programmatic information
available only at your institution.
3. Develop an institutional report which identifies regional teaching and learning
needs. Disseminate this report extensively within and outside the institution.
4. Plan, implement and evaluate program improvements intended to address regional
teaching and learning needs. Encourage experimental research and development
projects based on these planned interventions in conjunction with school district
partners.
5. Build regional collaboratives based on the needs identified and the organizational
interventions pursued.
How CREATE Can Assist
CREATE will continue to refine the PACE reports and data sets for annual distribution and
deliver additional support and technical assistance to university/school leadership teams
by:
1. Developing customized reports for active university teams
2. Consulting with leadership teams regarding analysis and interpretation of data
3. Facilitating meetings and other local events that employ these data in a
systematic manner for program improvement
4. Assisting with university-based initiatives to design and implement program
improvements.

I.
Educational Trends in
University’s Proximal Zone of
Professional Impact

A.
Descriptive Reports on the Characteristics
of Public Schools in the Proximal Zone
of Professional Impact
7
SECTION A: Descriptive Reports on the Characteristics of Public Schools
in the Proximal Zone of Professional Impact
The reports in Section A provide information about the characteristics of public and charter schools
located within a 75-mile radius of the target university. The definitions used to generate the various
reports in Section A are discussed below. Please see Section V in the Table of Contents for a
complete listing of the original data sources and the year(s) of data used to complete Section A
reports.
A.1: Summary of Public School Enrollment in the Proximal Zone of Professional Impact
(PZPI).
This report provides a summary of student enrollment within the PZPI by various subpopulations of
students. The data include the number and percent by school level for race/ethnicity, economically
disadvantaged, special education, bilingual, and English language learners (ELL)/limited English
proficient (LEP) students and students who are at risk for dropping out. Percentages of students in
special categories will NOT add up to 100% because different denominators are used to calculate
level percentages. The definitions of the subpopulations are described below:
Economically Disadvantaged: Economically disadvantaged students are those coded as
eligible for free or reduced price lunch or eligible for other public assistance also see
Campus Group and Total Students, PEIMS, Oct. 2012, Oct. 2011; and TEA Student
Assessment Division).
Special Education: This refers to the population served by programs for students with
disabilities. (Source: TEA, 2013. Subchapter AA. Commissioner's Rules Concerning
Special Education Services found at
http://ritter.tea.state.tx.us/rules/tac/chapter089/ch089aa.html and Texas Education Code
(TEC) §29.001 - 29.020 found at
http://www.statutes.legis.state.tx.us/Docs/ED/htm/ED.29.htm#B).
Bilingual: These are students who have a home language other than English, and who are
identified as English language learners because their English language skills are such that
they have difficulty performing ordinary classwork in English. (Source: TEA, 2013,
Subchapter BB. Commissioner’s Rules Concerning State Plan for Educating English
Language Learners found at http://ritter.tea.state.tx.us/rules/tac/chapter089/ch089bb.html)
and the Texas Education Code (TEC) §29.051-29.064 - Bilingual Education and ESL
Programs found at http://www.statutes.legis.state.tx.us/Docs/ED/htm/ED.29.htm#B).
English Language Learner (ELL): These are students who are in the process of acquiring
English and have another language as their first native language. They have been identified
as English language learners by the Language Proficiency Assessment Committee
(LPAC) according to criteria established in the Texas Administrative Code. The terms
English language learner and limited English proficient student are used
interchangeably (TEC, 29.052). Not all students identified as ELL receive bilingual
or English as a second language instruction, although most do. (Source: November 2013
TAPR Glossary, page 10, and Texas Education

8
Code (TEC), Chapter 29, Subchapter B found at
http://ritter.tea.state.tx.us/rules/tac/chapter089/ch089bb.html).
Limited English Proficient (LEP): These are students identified as limited English
proficient by a district’s Language Proficiency Assessment Committee (LPAC) according
to criteria established in the Texas Administrative Code. The terms English language
learner and limited English proficient student are used interchangeably (TEC, 29.052). Not
all pupils identified as LEP receive bilingual or English as a second language instruction,
although most do. (Source: TEA, 2013. Commissioner's Rules Concerning State Plan for
Educating English Language Learners. Chapter 89: Adaptations for Special Populations,
Subchapter BB found at http://ritter.tea.state.tx.us/rules/tac/chapter089/ch089bb.html).
At-Risk: These are students identified as being at risk of dropping out of school using state-
criteria only. (See TEC §29.081, Compensatory and Accelerated Instruction). A description
of the at-risk criteria can be found at:
http://www.statutes.legis.state.tx.us/Docs/ED/htm/ED.29.htm#B
A.2: Public School Enrollment by District in the Proximal Zone of Professional Impact.
This report is the first page of a supplemental document (See Attachment 1 for a full inventory)
showing public school enrollment in the PZPI in different configurations. All districts and charter
schools in the target university’s PZPI are listed in the first column. Then, the next six columns
show the number of campuses by school level (elementary, middle, high, and elementary/
secondary). The middle section, columns eight through thirteen, disaggregate student enrollment by
ethnicity. The last five columns disaggregate the district’s enrollment of selected student
subpopulations by campus level.
A.3: Public School Listing in the Proximal Zone of Professional Impact.
This report is the first page of a supplemental document (See Attachment 2 for a full inventory)
listing all districts and campuses (including charter schools) within the university’s PZPI. The
listing includes the district name, campus code and campus name, school type (elementary, middle,
high, and elementary/secondary), school size, and 2012-2013 STAAR accountability ratings.
The campus accountability rating uses the following system:
M = Met Standard
A = Met alternative standard
I = Improvement required
X = Not rated
Z = Not rated
Requirements for each rating can be found in the 2014 Accountability Manual on the TEA website or the Master Reference for Data Elements Used in the Accountability System.

Angelo State University2012‐2013
Summary of Public School Enrollment in Proximal Zone of Professional Impact
Traditional Districts 155
Charter Schools 6
District Types in the PZPI
96.3
3.7
N %
Total 161 100.0
LevelNumber
ofSchools
African AmericanN %
HispanicN %
WhiteN %
AsianN %
Native AmericanN %
Total
Number of Students
ELEM 278 5,290 4.7 59,688 43,278 38.7 931 0.8 369 0.3 111,90853.3
MS 100 1,974 4.7 20,820 17,535 42.1 347 0.8 178 0.4 41,61350.0
HS 173 2,846 5.0 26,538 25,412 44.9 516 0.9 249 0.4 56,54046.9
EL/SEC 73 203 1.7 4,913 6,537 54.9 29 0.2 56 0.5 11,91241.2
Total 624 10,313 4.6 111,959 92,762 41.8 1,823 0.8 852 0.4 221,97350.4
(for dropping out) At-RiskStudents in Special Categories
LevelNumber
ofSchools
Eco DisadvantagedN %
Special EducationN %
BilingualN %
LEPN % N %
38.543,135ELEM 278 68,730 61.4 8,586 11,885 10.6 12,321 11.07.7
39.416,381MS 100 22,578 54.3 4,001 1,632 3.9 1,798 4.39.6
49.828,144HS 173 25,585 45.3 5,598 2,006 3.5 2,105 3.79.9
41.84,983EL/SEC 73 6,669 56.0 1,132 1,064 8.9 1,064 8.99.5
92,643 41.7Total 624 123,562 55.7 19,317 16,587 7.5 17,288 7.88.7
Source Data9Page
A.1AEIS, TEAPACE 2014

District Name School Level EL MS HS El/Sec Total Afro‐Amer
His‐panic
White Asian Native Amer
Total Eco Dis SpecEduc
Bilingual
LEP At‐Risk
SAMPLE DOCUMENT: To view the Total School Listing for Your Proximal Zone of Professional Impact Refer to Attachment 1
Angelo State University2012‐2013
Public School Enrollment by District in the Proximal Zone of Professional Impact
ABILENE ISD EL/SEC 0 0 0 4 8610 28 44 2 04 53 44 1 1 77ELEM 20 0 0 20 9,2171,058 3,968 3,602 164 300 6,635 873 399 410 1,900HS 0 0 4 4 4,153517 1,559 1,827 92 210 2,225 586 105 105 2,086MS 0 5 0 5 3,536425 1,443 1,461 61 180 2,290 472 96 103 1,542
ALBANY ISD ELEM 1 0 0 1 2776 40 213 3 20 128 25 8 8 82HS 0 0 1 1 2265 43 175 1 00 67 21 5 5 84
ANDREWS ISD ELEM 3 0 0 3 1,90126 1,294 543 7 70 932 115 443 320 508HS 0 0 2 2 93920 580 314 3 30 258 93 17 30 407MS 0 1 0 1 77719 489 255 3 10 299 42 26 48 283
ANSON ISD ELEM 1 0 0 1 3653 177 173 1 10 249 32 10 10 107HS 0 0 1 1 1805 88 81 3 00 94 28 9 9 80MS 0 1 0 1 1535 72 72 2 00 94 12 6 6 64
ASPERMONT ISD EL/SEC 0 0 0 1 1074 23 77 1 01 39 9 0 0 22ELEM 1 0 0 1 1465 43 94 2 00 89 13 5 5 39
BAIRD ISD ELEM 1 0 0 1 1330 28 104 1 00 98 10 0 0 61HS 0 0 1 1 900 14 75 1 00 50 11 1 1 40MS 0 1 0 1 660 12 53 0 00 54 9 2 2 33
BALLINGER ISD ELEM 1 0 0 1 46012 214 222 2 10 315 45 10 10 192HS 0 0 2 2 2804 133 136 0 00 136 31 1 1 112MS 0 1 0 1 2053 86 113 0 10 120 9 3 3 78
BANDERA ISD ELEM 2 0 0 2 1,1366 371 727 9 30 639 115 79 80 424HS 0 0 1 1 7671 194 541 3 110 302 80 7 7 271MS 0 1 0 1 5402 174 354 3 20 280 44 16 16 164
BANGS ISD ELEM 1 0 0 1 36212 116 222 2 10 231 39 5 5 123HS 0 0 2 2 31512 77 217 0 20 123 27 3 3 106MS 0 1 0 1 31617 64 228 0 10 167 33 2 2 103
BIG SPRING ISD ELEM 5 0 0 5 2,288143 1,429 646 12 40 1,599 207 51 54 734HS 0 0 1 1 98783 553 330 3 50 478 121 6 8 612MS 0 1 0 1 90553 554 273 4 10 583 82 10 14 471
BIG SPRINGS CHARTER SC EL/SEC 0 0 0 2 16520 70 71 2 12 152 100 3 6 142
Source Data10Page
A.2AEISPACE

District Name Campus Code Campus Name
SAMPLE DOCUMENT: To view the Total School Enrollment by District for Your Proximal Zone of Professional Impact Refer to Attachment 2Angelo State University
2012‐2013Public School Listings in the Proximal Zone of Professional Impact
School Type School SizeAccountability Rating
ABILENE ISD 221901001 ABILENE H S HS 1,841 MABILENE ISD 221901010 ACADEMY FOR TECHNOLOGY ENGINEERING HS 308 MABILENE ISD 221901002 COOPER H S HS 1,809 MABILENE ISD 221901003 WOODSON CENTER FOR EXCELLENCE HS 195 IABILENE ISD 221901047 CLACK MIDDLE MS 760 MABILENE ISD 221901048 CRAIG MIDDLE MS 996 MABILENE ISD 221901006 JEFFERSON OPPORTUNITY CTR MS 5 XABILENE ISD 221901044 MADISON MIDDLE MS 918 MABILENE ISD 221901045 MANN MIDDLE MS 857 MABILENE ISD 221901102 AUSTIN EL EL 585 MABILENE ISD 221901153 BASSETTI EL EL 626 MABILENE ISD 221901103 BONHAM EL EL 586 MABILENE ISD 221901104 BOWIE EL EL 576 MABILENE ISD 221901107 CROCKETT EARLY HEADSTART EL 1 XABILENE ISD 221901208 DAY NURSERY OF ABILENE EL 74 MABILENE ISD 221901108 DYESS EL EL 510 MABILENE ISD 221901112 JACKSON EL EL 563 MABILENE ISD 221901113 JOHNSTON EL EL 548 MABILENE ISD 221901116 LEE EL EL 435 MABILENE ISD 221901117 LOCUST ECC EL 360 MABILENE ISD 221901118 LONG EL EL 424 MABILENE ISD 221901155 MARTINEZ EL EL 714 MABILENE ISD 221901152 ORTIZ EL EL 608 MABILENE ISD 221901154 REAGAN EARLY CHILDHOOD EL 72 MABILENE ISD 221901120 REAGAN EL EL 408 MABILENE ISD 221901121 TAYLOR EL EL 602 MABILENE ISD 221901151 THOMAS EL EL 559 M
Source Data11Page
A.3AEISPACE 2014

B.
Educational Trend Reports on
Public Schools in the Proximal Zone
of Professional Impact

12
SECTION B: Educational Trend Reports on Public Schools in
the Proximal Zone of Professional Impact
Section B describes student enrollment and academic trends within the PZPI. Because of the
changes in the Texas accountability system, the PACE reports in this section have been
redesigned. In spring 2012, the State of Texas Assessments of Academic Readiness (STAAR®)
replaced the Texas Assessment of Knowledge and Skills (TAKS). There will be yearly changes
to the rating criteria and targets until the performance index framework is fully implemented on
2016. Please note that the material on accountability on the TEA website is constantly being
updated, revised, and rearranged. The 2013 and 2014 state accountability ratings for districts,
charters and campuses are presently on the Texas Education Agency website. Assessment
summary results for the state, region, district and campus.
The STAAR data compiled for this section are for academic years 2012 and 2013. Included are
annual assessments for grades 3–8 in reading and mathematics; assessments in writing at grades 4
and 7; in science at grades 5 and 8; and in social studies at grade 8. There are15 end-of-course
assessments in high school these two years: English I, II, and III reading; English I, II, and III
writing; algebra I, algebra II, and geometry; biology, chemistry, and physics; U.S history, world
geography, and world history.
The definitions used to generate the various reports in Section B are discussed below. Please see
Section V in the Table of Contents for a complete listing of the original data sources and the
year(s) of data used to complete this section.
B.1: Student Enrollment Trends in the Proximal Zone of Professional Impact.
This two-page analysis describes the trends in student enrollment within the PZPI from 2010 to 2013. The enrollment data are disaggregated by school level and student racial/ethnic categories. Other charts describe trends and distributions for other special student subpopulations (e.g. economically disadvantaged, students in bilingual programs, and special education).
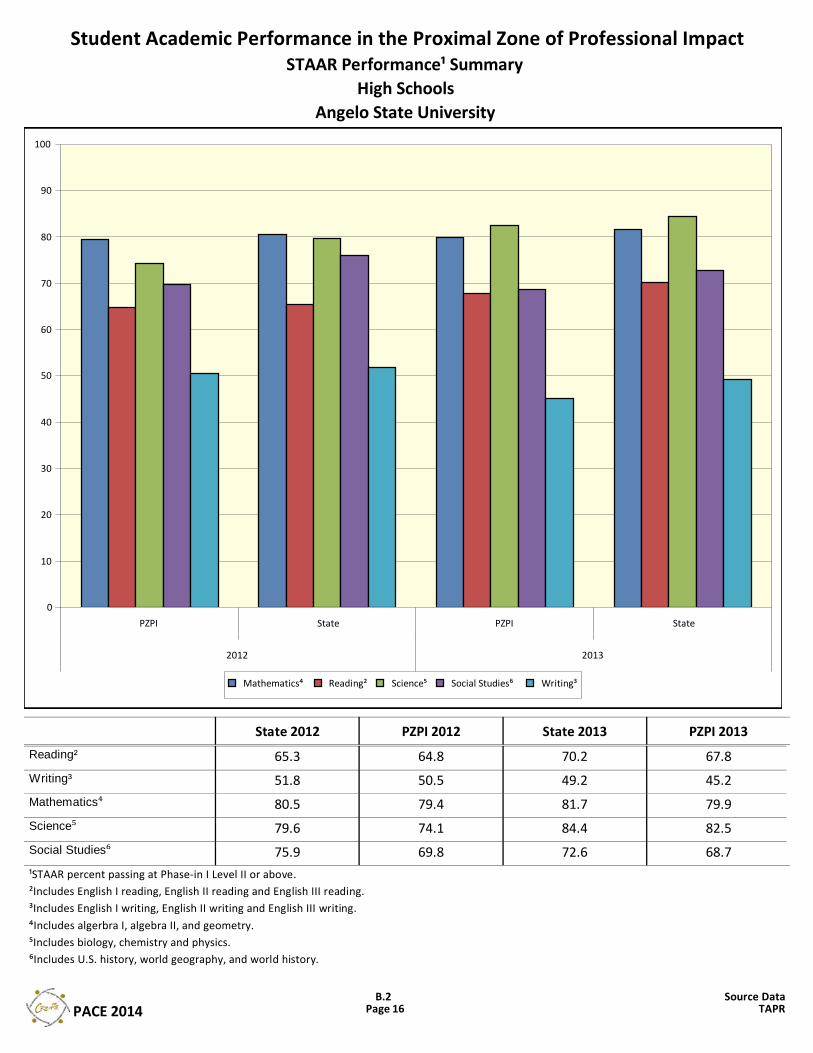
B.2: Student Academic Performance in the Proximal Zone of Professional Impact: High School STAAR Performance Summary.
This chart compares STAAR Performance (percent passing) of high school students in the PZPI with state high school STAAR performance in reading, writing, mathematics, science and social studies in academic years 2012 and 2013.
B.2.1- B.2.5: High School STAAR Performance by Ethnicity in Reading, Writing, Mathematics,
Science, and Social Studies: This series compares two years of high school STAAR
performance in core academic subjects by ethnicity. The number of students taking the exam
and the percent passing at Phase-in 1, Level II or above are represented.

13
B.3: Student Academic Performance in the Proximal Zone of Professional Impact: Middle
School STAAR Performance Summary. This chart compares STAAR Performance of middle school students in the PZPI with state
middle school STAAR performance in reading, writing, mathematics, science and social studies
in academic years 2012 and 2013. The data are aggregated by level and grade at Phase-in 1,
Level II and above for campuses designated by the state as middle level.
B.3.1- B.3.5: Middle School STAAR Performance by Ethnicity in Reading, Writing,
Mathematics, Science, and Social Studies: This series of analyses compares two years of middle
school STAAR performance in core academic subjects by ethnicity. The number of students
taking the exam and the percent passing at Phase-in 1, Level II or above are represented.
B.4: Student Academic Performance in the Proximal Zone of Professional Impact:
Elementary School STAAR Performance Summary.
This chart compares STAAR Performance of elementary school students in the PZPI with state
elementary school STAAR performance in reading, writing, mathematics, and science in
academic years 2012 and 2013. The data are aggregated by subject and grades at Phase-in 1,
Level II and above for campuses designated by the state as elementary.
B.4.1- B.4.4: Elementary School STAAR Performance by Ethnicity in Reading, Writing,
Mathematics, Science, and Social Studies; This series of analyses compares two years of
elementary school STAAR performance in STAAR-tested academic subjects and grades
disaggregated by ethnicity. The number of students taking the exam and the percent passing at
Phase-in 1, Level II or above are represented.
B.5: Highest and Lowest Performing Schools by Level.
The last set of reports in this section lists the 25 highest and lowest performing high, middle, and
elementary schools. Although the six reports show the results of different subjects, the format of
the table is the same. Each lists the district and campus names, the campus enrollment, the
percent of students who are economically disadvantaged, the percent of minority students at the
campus, the subject, the number of students taking the STAAR test in a subject, the percent of
students who passed at Phase-in 1, Level II or above, and the percent of those students who
passed at Phase-in 1, Level II at the advanced level.
B.5.1 and B.5.2: 25 Highest and Lowest Performing High Schools Ranked by STAAR Algebra I
Performance: These two reports list the 25 highest- and lowest-performing high schools in the
PZPI on the following STAAR-tested subjects: algebra I, biology, U.S. history, reading I,
writing I, reading II, and writing II.
B.5.3 and B.5.4: 25 Highest and Lowest Performing Middle Schools Ranked by STAAR
Reading Performance: These two reports list the 25 highest- and lowest-performing middle
schools in the PZPI on the following STAAR-tested subjects: reading, mathematics, writing,
science, and social studies.
B.5.5 and B.5.5: 25 Highest and Lowest Performing Elementary Schools Ranked by STAAR
Reading Performance: These two reports list the 25 highest- and lowest-performing elementary
schools in the PZPI on the following STAAR-tested subjects: reading, mathematics, writing, and
science.

Fiscal YearStudent Enrollment Trends in Proximal Zone of Professional Impact
2010‐2013Angelo State University
Total
2010 2011 2012 2013212,544 213,870 218,486 221,973
12,236 10,118 10,299 10,313
98,252 103,718 108,398 111,959
98,955 93,892 93,245 92,762
2,048 1,553 1,683 1,823
1,053 993 913 852
121,877 123,572 125,010 123,562
21,387 20,873 20,252 19,317
13,949 13,822 15,670 16,587
15,011 14,642 16,398 17,288
Headcount - Fall of
Fiscal Year
Elementary
2010 2011 2012 2013All 107,624 109,107 109,639 111,908
African American 6,610 5,391 5,252 5,290
Hispanic 53,002 56,423 57,688 59,688
White 46,511 44,073 43,358 43,278
Asian 1,023 747 791 931
Native American 478 466 408 369
Economically Disadvantaged
69,829 70,420 69,517 68,730
Special Education 9,108 9,205 8,884 8,586
Bilingual 10,605 10,606 11,113 11,885
LEP 11,372 11,137 11,575 12,321
Middle
2010 2011 2012 201340,516 40,626 41,015 41,613
2,276 1,869 1,920 1,974
18,768 19,732 20,369 20,820
18,857 17,833 17,464 17,535
412 336 345 347
203 177 194 178
22,421 22,775 22,782 22,578
4,456 4,157 4,057 4,001
1,553 1,527 1,607 1,632
1,701 1,678 1,754 1,798
High School
2010 2011 2012 201355,017 54,366 56,240 56,540
3,143 2,735 2,915 2,846
23,253 24,081 25,788 26,538
27,736 26,044 25,864 25,412
564 439 519 516
321 299 261 249
24,406 24,937 26,056 25,585
6,718 6,448 6,130 5,598
1,374 1,225 1,892 2,006
1,512 1,364 2,009 2,105
Both Elem/Second
2010 2011 201320129,387 9,771 11,592 11,912
207 123 212 203
3,229 3,482 4,553 4,913
5,851 5,942 6,559 6,537
49 31 28 29
51 51 50 56
5,221 5,440 6,655 6,669
1,105 1,063 1,181 1,132
417 464 1,058 1,064
426 463 1,060 1,064
Pct Change
Net Change
9,429 4.4
-1,923 -15.7
13,707 14.0
-6,193 -6.3
-225 -11.0
-201 -19.1
1,685 1.4
-2,070 -9.7
2,638 18.9
2,277 15.2
Middle School %178 0.4
347 0.8
17,535 42.1
20,820 50.0
1,974 4.7
41,613 100.0
African American
Asian
Hispanic
Native American
White
Middle School
African American
Asian
Hispanic
Native American
White
High School
African American
Asian
Hispanic
Native American
White
Elementary SchoolElementary School
%EthnicityEthnic Comparisons by Level 2013
369 0.3Native American
931 0.8Asian
43,278 38.7White
59,688 53.3Hispanic
5,290 4.7African American
111,908 100.0All
High School %249 0.4
516 0.9
25,412 44.9
26,538 46.9
2,846 5.0
56,540 100.0
EthnicityOther Trends and Distributions
Net Change2010-2013
-201Native American
-225Asian
-6,193White
13,707Hispanic
-1,923African American
9,429All
‐20000
0
20000 African American
Asian
Hispanic
Native American
White
Net Change in Zone Enrollment byEthnicity
Year AmountEco. Disadvantaged
121,8772010
123,5722011
125,0102012
123,5622013
13-Yr. Change 120000
122000
124000
126000 2010
2011
2012
2013
Economically Disadvantaged Year AmountBilingual
13,9492010
13,8222011
15,6702012
16,5872013
193-Yr. Change 0
10000
20000 2010
2011
2012
2013
Bilingual
Source Data14Page
B.1AEIS, TEAPACE 2014
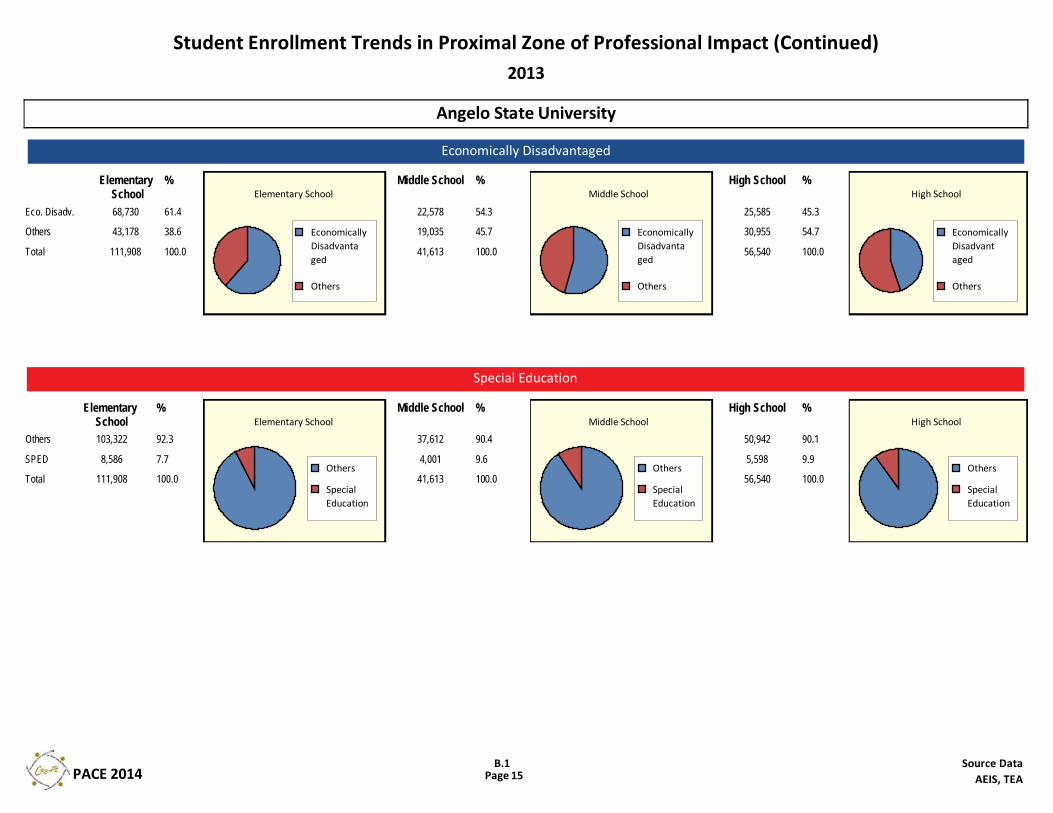
Economically Disadvantaged
Special Education
Student Enrollment Trends in Proximal Zone of Professional Impact (Continued)2013
Angelo State University
Elementary School
%
68,730 61.4Eco. Disadv.
43,178 38.6Others
111,908 100.0Total
EconomicallyDisadvantaged
Others
Elementary SchoolMiddle School %
22,578 54.3
19,035 45.7
41,613 100.0
EconomicallyDisadvantaged
Others
Middle SchoolHigh School %
25,585 45.3
30,955 54.7
56,540 100.0
EconomicallyDisadvantaged
Others
High School
Elementary School
%
103,322 92.3Others
8,586 7.7SPED
111,908 100.0TotalOthers
SpecialEducation
Elementary SchoolMiddle School %
37,612 90.4
4,001 9.6
41,613 100.0Others
SpecialEducation
Middle SchoolHigh School %
50,942 90.1
5,598 9.9
56,540 100.0Others
SpecialEducation
High School
Source Data15Page
B.1AEIS, TEAPACE 2014
Student Academic Performance in the Proximal Zone of Professional Impact
State 2012 PZPI 2012 State 2013 PZPI 2013
STAAR Performance¹ SummaryHigh Schools
Angelo State University
0
10
20
30
40
50
60
70
80
90
100
PZPI State PZPI State
2012 2013
Mathematics⁴ Reading² Science⁵ Social Studies⁶ Writing³
64.8 70.2 67.8Reading² 65.3
50.5 49.2 45.2Writing³ 51.8
79.4 81.7 79.9Mathematics⁴ 80.5
74.1 84.4 82.5Science⁵ 79.6
69.8 72.6 68.7Social Studies⁶ 75.9
¹STAAR percent passing at Phase‐in I Level II or above.
³Includes English I writing, English II writing and English III writing.²Includes English I reading, English II reading and English III reading.
⁴Includes algerbra I, algebra II, and geometry.⁵Includes biology, chemistry and physics.⁶Includes U.S. history, world geography, and world history.
Source Data16Page
B.2TAPRPACE 2014

Student Academic Performance in the Proximal Zone of Professional Impact
2012
N
2013
N
STAAR Performance¹ in Reading² by EthnicityHigh Schools
Level II: Satisfactory Level II: Satisfactory
Angelo State University
0
10
20
30
40
50
60
70
80
90
100
2012 2013
African American Asian Hispanic Native American
Pacific Islander Two or More Races White
41.0 1,360 48.9African American 705
55.0 13,671 57.9Hispanic 7,247
74.2 12,606 78.1White 7,706
41.9 280 46.4Asian 148
0.0 109 12.8Native American 54
63.6 33 33.3Pacific Islander 11
40.5 490 49.6Two or More Races 269
¹STAAR percent passing at Phase‐in I Level II or above.²Includes English I reading, English II reading and English III reading.
Source Data17Page
B.2.1TAPRPACE 2014

Student Academic Performance in the Proximal Zone of Professional Impact
2012
N
2013
N
STAAR Performance¹ in Writing² by EthnicityHigh Schools
Level II: Satisfactory Level II: Satisfactory
Angelo State University
0
10
20
30
40
50
60
70
80
90
100
2012 2013
African American Asian Hispanic Native American
Pacific Islander Two or More Races White
30.1 1,459 26.5African American 701
40.6 14,395 35.2Hispanic 7,209
59.9 13,177 56.3White 7,705
43.2 274 37.2Asian 148
0.0 123 8.1Native American 52
45.5 27 18.5Pacific Islander 11
31.2 520 31.5Two or More Races 269
¹STAAR percent passing at Phase‐in I Level II or above.²Includes English I writing, English II writing and English III writing.
Source Data18Page
B.2.2TAPRPACE 2014

Student Academic Performance in the Proximal Zone of Professional Impact
2012
N
2013
N
STAAR Performance¹ in Mathematics² by EthnicityHigh Schools
Level II: Satisfactory Level II: Satisfactory
Angelo State University
0
10
20
30
40
50
60
70
80
90
100
2012 2013
African American Asian Hispanic Native American
Pacific Islander Two or More Races White
59.3 1,204 60.2African American 577
72.4 11,984 73.0Hispanic 5,818
83.4 11,678 85.7White 6,597
40.6 225 35.1Asian 128
0.0 103 10.7Native American 43
45.5 26 30.8Pacific Islander 11
44.8 456 48.9Two or More Races 210
¹STAAR percent passing at Phase‐in I Level II or above.²Includes algebra I, algebra II and geometry.
Source Data19Page
B.2.3TAPRPACE 2014

Student Academic Performance in the Proximal Zone of Professional Impact
2012
N
2013
N
STAAR Performance¹ in Science² by EthnicityHigh Schools
Level II: Satisfactory Level II: Satisfactory
Angelo State University
0
10
20
30
40
50
60
70
80
90
100
2012 2013
African American Asian Hispanic Native American
Pacific Islander Two or More Races White
51.9 1,152 63.5African American 794
67.2 11,481 76.3Hispanic 7,158
80.0 11,285 88.4White 8,327
68.6 239 56.5Asian 140
0.0 102 10.8Native American 59
50.0 25 48.0Pacific Islander 14
43.3 446 54.9Two or More Races 268
¹STAAR percent passing at Phase‐in I Level II or above.²Includes biology, chemistry and physics.
Source Data20Page
B.2.4TAPRPACE 2014

Student Academic Performance in the Proximal Zone of Professional Impact
2012
N
2013
N
STAAR Performance¹ in Social Studies² by EthnicityHigh Schools
Level II: Satisfactory Level II: Satisfactory
Angelo State University
0
10
20
30
40
50
60
70
80
90
100
2012 2013
African American Asian Hispanic Native American
Pacific Islander Two or More Races White
44.1 1,313 50.1African American 787
61.9 12,874 58.6Hispanic 6,608
77.7 12,003 79.2White 7,159
54.3 239 50.2Asian 127
1.9 108 11.1Native American 52
50.0 25 28.0Pacific Islander 16
41.0 471 48.0Two or More Races 256
¹STAAR percent passing at Phase‐in I Level II or above.²Includes U.S. History, world geography, and world history.
Source Data21Page
B.2.5TAPRPACE 2014

Student Academic Performance in the Proximal Zone of Professional Impact
State 2012 PZPI 2012 State 2013 PZPI 2013
STAAR Performance¹ SummaryMiddle Schools
Angelo State University
0
10
20
30
40
50
60
70
80
90
100
PZPI State PZPI State
2012 2013
Mathematics Reading Science Social Studies Writing
74.4 77.2 75.9Reading 76.7
68.7 69.8 67.0Writing 71.1
72.1 73.9 71.1Mathematics 74.4
67.6 75.1 71.3Science 70.3
51.7 63.7 55.9Social Studies 59.7
¹STAAR percent passing at Phase‐in I Level II or above aggregated by subject and grade for campuses designated by the state as middle level.
Source Data22Page
B.3TAPRPACE 2014

Student Academic Performance in the Proximal Zone of Professional Impact
2012
N
2013
N
STAAR Performance¹ in Reading² by EthnicityMiddle Schools
Level II: Satisfactory Level II: Satisfactory
Angelo State University
0
10
20
30
40
50
60
70
80
90
100
2012 2013
African American Asian Hispanic Native American
Pacific Islander Two or More Races White
60.8 1,754 60.8African American 1,704
66.6 18,069 68.6Hispanic 17,740
83.4 15,655 84.8White 15,809
39.1 317 40.1Asian 325
8.9 149 0.0Native American 146
0.0 47 0.0Pacific Islander 46
51.6 623 53.3Two or More Races 614
²STAAR reading test is administered in grades 3‐8.¹STAAR percent passing at Phase‐in I Level II or above aggregated by subject and grade for campuses designated by the state as middle level.
Source Data23Page
B.3.1TAPRPACE 2014

Student Academic Performance in the Proximal Zone of Professional Impact
2012
N
2013
N
STAAR Performance¹ in Writing² by EthnicityMiddle Schools
Level II: Satisfactory Level II: Satisfactory
Angelo State University
0
10
20
30
40
50
60
70
80
90
100
2012 2013
African American Asian Hispanic Native American
Pacific Islander Two or More Races White
54.1 643 56.6African American 664
61.5 6,881 58.9Hispanic 6,926
77.8 5,649 76.7White 5,781
39.8 134 44.0Asian 123
0.0 57 0.0Native American 52
0.0 17 0.0Pacific Islander 21
46.1 220 45.5Two or More Races 219
²STAAR writing test is administered in grades 4 and 7.¹STAAR percent passing at Phase‐in I Level II or above aggregated by subject and grade for campuses designated by the state as middle level.
Source Data24Page
B.3.2TAPRPACE 2014

Student Academic Performance in the Proximal Zone of Professional Impact
2012
N
2013
N
STAAR Performance¹ in Mathematics² by EthnicityMiddle Schools
Level II: Satisfactory Level II: Satisfactory
Angelo State University
0
10
20
30
40
50
60
70
80
90
100
2012 2013
African American Asian Hispanic Native American
Pacific Islander Two or More Races White
55.3 1,648 55.3African American 1,601
64.0 16,885 63.7Hispanic 16,781
81.5 14,174 80.5White 14,882
33.5 216 30.1Asian 242
8.8 141 0.0Native American 136
0.0 42 0.0Pacific Islander 47
50.8 573 49.6Two or More Races 577
²STAAR mathematics test is administered in grades 3‐8.¹STAAR percent passing at Phase‐in I Level II or above aggregated by subject and grade for campuses designated by the state as middle level.
Source Data25Page
B.3.3TAPRPACE 2014

Student Academic Performance in the Proximal Zone of Professional Impact
2012
N
2013
N
STAAR Performance¹ in Science² by EthnicityMiddle Schools
Level II: Satisfactory Level II: Satisfactory
Angelo State University
0
10
20
30
40
50
60
70
80
90
100
2012 2013
African American Asian Hispanic Native American
Pacific Islander Two or More Races White
50.5 684 53.9African American 643
56.7 6,775 62.3Hispanic 6,480
80.4 5,599 83.3White 5,665
44.2 106 41.5Asian 104
13.8 51 0.0Native American 58
0.0 18 22.2Pacific Islander 14
50.5 217 51.6Two or More Races 216
²STAAR science test is administered in grades 5 and 8.¹STAAR percent passing at Phase‐in I Level II or above aggregated by subject and grade for campuses designated by the state as middle level.
Source Data26Page
B.3.4TAPRPACE 2014

Student Academic Performance in the Proximal Zone of Professional Impact
2012
N
2013
N
STAAR Performance¹ in Social Studies² by EthnicityMiddle Schools
Level II: Satisfactory Level II: Satisfactory
Angelo State University
0
10
20
30
40
50
60
70
80
90
100
2012 2013
African American Asian Hispanic Native American
Pacific Islander Two or More Races White
37.8 684 43.9African American 640
39.4 6,768 45.3Hispanic 6,426
65.8 5,608 68.8White 5,619
41.7 106 38.7Asian 103
10.3 51 0.0Native American 58
0.0 19 21.1Pacific Islander 14
39.2 217 41.9Two or More Races 212
¹STAAR percent passing at Phase‐in I Level II or above aggregated by subject and grade for campuses designated by the state as middle level.²STAAR social studies test is administered in grade 8.
Source Data27Page
B.3.5TAPRPACE 2014

Student Academic Performance in the Proximal Zone of Professional Impact
State 2012 PZPI 2012 State 2013 PZPI 2013
STAAR Performance¹ SummaryElementary Schools
Angelo State University
0
10
20
30
40
50
60
70
80
90
100
PZPI State PZPI State
2012 2013
Mathematics Reading Science Writing
72.4 76.2 70.9Reading 77.1
65.3 70.9 64.0Writing 71.6
65.5 71.0 63.8Mathematics 71.2
68.0 73.2 67.9Science 73.1
¹STAAR percent passing at Phase‐in I Level II or above aggregated by subject and grade for campuses designated by the state as elementary.
Source Data28Page
B.4TAPRPACE 2014

Student Academic Performance in the Proximal Zone of Professional Impact
2012
N
2013
N
STAAR Performance¹ in Reading² by EthnicityElementary Schools
Level II: Satisfactory Level II: Satisfactory
Angelo State University
0
10
20
30
40
50
60
70
80
90
100
2012 2013
African American Asian Hispanic Native American
Pacific Islander Two or More Races White
44.8 2,029 43.5African American 2,046
64.7 21,949 62.0Hispanic 21,820
81.8 17,320 82.0White 17,874
11.2 366 13.1Asian 338
0.0 146 0.0Native American 158
0.0 60 0.0Pacific Islander 55
25.5 836 24.9Two or More Races 773
²STAAR reading test is administered in grades 3‐8.¹STAAR percent passing at Phase‐in I Level II or above aggregated by subject and grade for campuses designated by the state as elementary.
Source Data29Page
B.4.1TAPRPACE 2014

Student Academic Performance in the Proximal Zone of Professional Impact
2012
N
2013
N
STAAR Performance¹ in Writing² by EthnicityElementary Schools
Level II: Satisfactory Level II: Satisfactory
Angelo State University
0
10
20
30
40
50
60
70
80
90
100
2012 2013
African American Asian Hispanic Native American
Pacific Islander Two or More Races White
39.4 667 38.5African American 714
58.2 7,398 56.6Hispanic 7,293
73.7 5,916 72.9White 6,074
14.7 122 7.4Asian 109
0.0 45 0.0Native American 59
0.0 20 0.0Pacific Islander 19
15.5 275 26.2Two or More Races 258
²STAAR writing test is administered in grades 4 and 7.¹STAAR percent passing at Phase‐in I Level II or above aggregated by subject and grade for campuses designated by the state as elementary.
Source Data30Page
B.4.2TAPRPACE 2014

Student Academic Performance in the Proximal Zone of Professional Impact
2012
N
2013
N
STAAR Performance¹ in Mathematics² by EthnicityElementary Schools
Level II: Satisfactory Level II: Satisfactory
Angelo State University
0
10
20
30
40
50
60
70
80
90
100
2012 2013
African American Asian Hispanic Native American
Pacific Islander Two or More Races White
37.6 2,017 36.1African American 2,036
57.9 21,918 55.6Hispanic 21,701
74.8 17,399 74.2White 17,930
8.7 319 9.7Asian 299
2.5 150 0.0Native American 161
0.0 58 0.0Pacific Islander 56
25.5 834 22.8Two or More Races 777
²STAAR mathematics test is administered in grades 3‐8.¹STAAR percent passing at Phase‐in I Level II or above aggregated by subject and grade for campuses designated by the state as elementary.
Source Data31Page
B.4.3TAPRPACE 2014

Student Academic Performance in the Proximal Zone of Professional Impact
2012
N
2013
N
STAAR Performance¹ in Science² by EthnicityElementary Schools
Level II: Satisfactory Level II: Satisfactory
Angelo State University
0
10
20
30
40
50
60
70
80
90
100
2012 2013
African American Asian Hispanic Native American
Pacific Islander Two or More Races White
38.7 680 40.6African American 643
57.9 7,164 58.4Hispanic 7,235
80.8 5,526 79.9White 5,718
8.0 99 11.1Asian 100
0.0 56 0.0Native American 55
0.0 20 0.0Pacific Islander 16
25.7 263 24.0Two or More Races 230
²STAAR science test is administered in grades 5 and 8.¹STAAR percent passing at Phase‐in I Level II or above aggregated by subject and grade for campuses designated by the state as elementary.
Source Data32Page
B.4.4TAPRPACE 2014

District Name Campus Name
25 Highest High Schools ranked by STAAR Algebra Performance¹
BiologyEnrollment
Angelo State University2013
Student Academic Performance in the Proximal Zone of Professional Impact
Algebra I
N²% Pass
US History Reading I Writing I Reading II Writing II% STU Eco
Disadv
% STU Minority %
Adv N²% Pass
% Adv N²
% Pass
% Adv N²
% Pass
% Adv N²
% Pass
% Adv N²
% Pass
% Adv N²
% Pass
% Adv
MULLIN ISD MULLIN HIGH SCHOOL 100552 1006 00 676 506 676 33677 35 0 0 0 0 00 0
NUECES CANYON CISD NUECES CANYON JH/HS 10010136 10012 00 9212 5315 9522 452261 52 0 0 0 8 187 0
RISING STAR ISD RISING STAR H S 1001384 10013 00 9213 7713 7914 641473 21 31 8 0 23 360 14
ROBERT LEE ISD ROBERT LEE H S 10020104 9520 00 7020 5020 717 57754 34 35 25 0 5 00 14
WALL ISD WALL H S 10064310 10084 00 9483 8683 9980 858014 17 20 17 0 29 485 11
EARLY ISD EARLY H S 9982332 9487 00 8193 6795 8776 647635 23 32 14 0 15 334 11
EULA ISD EULA H S 972985 9628 01 8425 6428 9627 632746 15 21 4 0 4 114 4
WYLIE ISD WYLIE H S 96192955 99266 01 90260 81266 92246 8324710 21 19 27 0 30 268 4
CROSS PLAINS ISD CROSS PLAINS H S 9522142 9628 00 9029 4529 9623 742356 10 5 0 0 7 480 0
HARPER ISD HARPER H S 9555202 9656 00 8461 5963 9248 734834 16 31 12 0 8 293 4
CISCO ISD CISCO H S 9464247 9764 00 8468 6467 9656 665652 20 22 12 0 13 200 0
MILES ISD MILES H S 9418220 8621 00 6926 4127 8233 583337 35 33 10 0 15 214 0
IRION COUNTY ISD IRION H S 9328165 10026 00 7027 3228 8330 673038 36 11 12 0 0 200 13
WATER VALLEY ISD WATER VALLEY H S 9327141 9624 00 7322 6025 7322 622141 22 26 25 0 14 140 0
SCHLEICHER ISD ELDORADO H S 9236156 8944 00 6749 5452 9537 543735 67 6 5 0 12 140 3
MASON ISD MASON H S 9248206 8755 01 7247 6247 8548 794852 41 21 5 0 17 252 4
THROCKMORTON ISD THROCKMORTON H S 921260 9212 00 8312 7713 8015 471542 17 25 25 0 25 138 0
MARBLE FALLS ISD MARBLE FALLS H S 912761,152 94300 01 62353 45364 76272 5226949 43 12 14 0 8 191 4
COMANCHE ISD COMANCHE H S 9080325 8888 00 7394 6395 8268 497060 46 10 5 0 14 130 3
ALBANY ISD ALBANY JR-SR H S 8832226 9734 00 7536 5439 8025 642530 23 9 15 0 22 80 0
DUBLIN ISD DUBLIN H S 8874288 7678 00 5985 4188 6659 545966 55 9 10 0 5 70 2
JIM NED CISD JIM NED H S 8874324 93118 00 81111 61111 8369 656918 10 1 17 0 4 254 4
POST ISD POST H S 8857216 8251 00 5761 3260 8153 495346 62 18 6 0 10 150 0
MIDLAND ISD EARLY COLLEGE H S AT MIDLAND COLL 8761316 10089 00 9392 7894 9375 777552 79 10 20 0 24 273 1
EASTLAND ISD EASTLAND H S 8671317 8474 00 7083 4390 7468 596846 26 28 3 0 12 250 0
STAAR percent passing at Phase‐in 1 level II or above.Total number of students taking STAAR exam
12
Source Data33Page
B.5.1TAPRPACE 2014

District Name Campus Name
25 Lowest High Schools ranked by STAAR Algebra Performance¹
BiologyEnrollment
Angelo State University2013
Student Academic Performance in the Proximal Zone of Professional Impact
Algebra I
N²% Pass
US History Reading I Writing I Reading II Writing II% STU Eco
Disadv
% STU Minority %
Adv N²% Pass
% Adv N²
% Pass
% Adv N²
% Pass
% Adv N²
% Pass
% Adv N²
% Pass
% Adv N²
% Pass
% Adv
ANDREWS ISD ANDREWS EDUCATION CENTER 0136 01 00 03 205 03 0339 78 0 0 0 0 00 0
CISCO ISD CISCO LEARNING CENTER 0120 03 00 03 02 04 0490 30 0 0 0 0 00 0
EASTLAND ISD EASTLAND CARE CAMPUS 0124 01 00 01 02 02 0163 17 0 0 0 0 00 0
ECTOR COUNTY ISD ECTOR CO YOUTH CTR 01130 4010 00 1315 015 229 11947 93 0 0 0 0 00 0
GRAPE CREEK ISD FAIRVIEW ACCELERATED 016 01 00 02 02 02 02100 33 0 0 0 0 00 0
WALL ISD FAIRVIEW ACCELERATED 0112 00 00 01 01 01 0183 50 0 0 0 0 00 0
MARBLE FALLS ISD FALLS CAREER H S 0144 01 02 03 03 405 0561 36 0 0 0 0 00 0
KERRVILLE ISD K C J D C 0211 01 00 00 00 00 00100 64 0 0 0 0 00 0
LAMESA ISD LAMESA SUCCESS ACADEMY 0220 01 00 03 04 04 0435 85 0 0 0 0 00 0
MIDLAND ISD MIDLAND ALTERNATIVE PROGRAM 0616 405 00 04 04 00 0056 94 0 0 0 0 00 0
MONAHANS-WICKETT-PYOTE MONAHANS ED CTR 0120 01 00 01 01 00 0045 60 0 0 0 0 00 0
PARADIGM ACCELERATED S PREMIER H S OF DAYTON 0188 7311 00 4010 3010 9010 701047 13 0 0 0 0 100 0
PARADIGM ACCELERATED S PREMIER H S OF MISSION 04179 5012 01 2711 1414 4010 4010100 98 0 0 0 0 00 0
PARADIGM ACCELERATED S PREMIER H S OF SOUTH IRVING 04118 04 03 08 010 577 29771 86 0 0 0 0 00 0
PARADIGM ACCELERATED S PREMIER H S OF TYLER 03172 717 00 3611 1010 506 33673 77 0 14 0 0 00 0
SNYDER ISD SNYDER ACADEMY 0526 03 03 04 05 176 0654 65 0 0 0 0 00 0
COLORADO ISD WALLACE ACCELERATED H S 0318 03 01 011 911 205 0539 56 0 0 0 0 00 0
SWEETWATER ISD WALLACE ACCELERATED H S 0220 03 00 06 06 02 0265 65 0 0 0 0 00 0
MIDLAND ISD LEE H S 12502,204 6436 00 21129 7181 71732 4473727 66 0 3 0 0 170 2
PARADIGM ACCELERATED S PREMIER H S OF EL PASO 1216206 4015 01 715 522 758 569100 87 0 0 0 0 250 0
ECTOR COUNTY ISD ODESSA H S 131042,530 74514 03 18225 7268 66867 3687037 84 0 0 0 0 130 2
PARADIGM ACCELERATED S PREMIER H S OF BROWNSVILLE 176233 717 01 3010 911 6411 551173 98 0 0 0 0 90 0
SAN FELIPE-DEL RIO CISD DEL RIO H S 19771,987 3296 676 25122 22153 63456 3246062 93 0 0 0 0 60 0
ECTOR COUNTY ISD ALTER ED CTR 221849 4020 00 1718 017 4010 81365 96 0 0 0 0 00 0
PARADIGM ACCELERATED S PREMIER H S OF BEAUMONT 22974 4212 805 4511 1010 1007 14769 78 0 0 0 0 00 0
STAAR percent passing at Phase‐in 1 level II or above.Total number of students taking STAAR exam
12
Source Data34Page
B.5.2TAPRPACE 2014

District Name Campus Name
25 Highest Performing Middle Schools ranked by STAAR Reading Performance¹
MathematicsEnrollment
Angelo State University2013
Student Academic Performance in the Proximal Zone of Professional Impact
Reading
N⁴ % Pass
Writing² Science³ Social Studies³% STU Eco
Disadv
% STU Minority % Adv N⁴ % Pass % Adv N⁴ % Pass % Adv N⁴ % Pass % Adv N⁴ % Pass % Adv
EULA ISD EULA J H 935455 7553 9123 7629 773058 20 24 13 9 7 30
HARPER ISD HARPER MIDDLE 93127134 94127 8938 9343 724341 19 33 17 24 19 9
WYLIE ISD WYLIE J H 93843860 91784 85298 87259 7926113 21 35 17 7 21 17
HAMILTON ISD HAMILTON J H 91153169 75146 9251 7850 525054 18 26 9 10 16 8
JIM NED CISD JIM NED MIDDLE 91245244 83224 8376 7976 647621 14 31 14 13 9 8
MASON ISD MASON J H 91146205 92130 8552 9648 714850 32 32 18 6 21 12
WALL ISD WALL MIDDLE 91253255 95235 9485 8284 708413 18 34 18 15 8 7
BANGS ISD BANGS MIDDLE 90216316 77204 7469 6879 518153 28 21 4 4 5 5
STEPHENVILLE HENDERSON J H 88526548 79457 77260 77263 6326344 32 26 9 7 14 10
CISCO ISD CISCO J H 87178194 79178 9559 7859 815958 23 28 11 17 14 17
JOHNSON CITY ISD LYNDON B JOHNSON MIDDLE 87173250 83157 6470 9156 705645 34 24 13 3 38 12
DE LEON ISD PERKINS MIDDLE 87134142 80132 7654 6840 624054 35 18 8 4 2 8
KERRVILLE ISD PETERSON MIDDLE 87687720 91650 86347 83336 7033655 49 29 14 3 18 16
HAWLEY ISD HAWLEY MIDDLE 86158173 73147 5358 8045 424545 16 19 5 0 11 0
LLANO ISD LLANO J H 86386411 83355 77131 82126 7412655 22 29 16 5 18 15
EARLY ISD EARLY MIDDLE 85294308 94293 81108 9390 858942 23 24 19 6 19 20
GOLDTHWAITE ISD GOLDTHWAITE MIDDLE 85124128 96114 9039 8945 464643 25 31 16 3 20 4
BRADY ISD BRADY MIDDLE 84241264 84240 7775 7496 679669 52 22 11 0 10 9
COMANCHE ISD JEFFERIES J H 84173183 78169 9169 76104 4310462 52 17 5 3 9 3
COPPERAS COVE ISD S C LEE J H 83839887 83780 76259 82279 7027948 53 21 10 1 19 11
BANDERA ISD BANDERA MIDDLE 82522540 77474 68172 85172 6517252 34 20 8 5 15 7
BRACKETT ISD BRACKETT J H 82139146 78120 7246 5951 395153 73 21 15 4 10 0
COMFORT ISD COMFORT MIDDLE 82228253 76210 9274 6877 587848 58 27 13 19 6 17
SCHLEICHER ISD ELDORADO MIDDLE 82119167 83106 7435 7942 674349 66 18 14 3 5 12
FREDERICKSBURG ISD FREDERICKSBURG MIDDLE 82581629 76497 74183 80200 6720055 47 22 12 4 18 13
STAAR percent passing at Phase‐in 1 level II or above.Administered only to 7th grade students.
12
Administered only to 8th grade students.3
Total number of students taking STAAR exam.4
Source Data35Page
B.5.3TAPRPACE 2014

District Name Campus Name
25 Lowest Performing Middle Schools ranked by STAAR Reading Performance¹
MathematicsEnrollment
Angelo State University2013
Student Academic Performance in the Proximal Zone of Professional Impact
Reading
N⁴ % Pass
Writing² Science³ Social Studies³% STU Eco
Disadv
% STU Minority % Adv N⁴ % Pass % Adv N⁴ % Pass % Adv N⁴ % Pass % Adv N⁴ % Pass % Adv
ABILENE ISD JEFFERSON OPPORTUNITY CTR 0145 3614 336 03 03100 100 0 0 0 0 0
RADIANCE ACADEMY OF LEA RADIANCE ACADEMY OF LEARNING WE 22910 229 605 04 0490 100 0 0 0 0 0
RADIANCE ACADEMY OF LEA RADIANCE ACADEMY OF LEARNING (AB 501421 2914 00 00 0071 86 0 0 0 0 0
RANGER ISD RANGER MIDDLE 558397 4886 5632 4529 342975 27 10 2 3 0 3
REAGAN COUNTY ISD REAGAN COUNTY MIDDLE 57167177 53151 5652 6060 376046 88 5 1 0 3 2
SAN FELIPE-DEL RIO CISD SAN FELIPE MEMORIAL MIDDLE 59699723 62676 00 00 0075 93 12 10 0 0 0
MERKEL ISD MERKEL MIDDLE 6067140 6668 00 00 0067 27 12 1 0 0 0
BIG SPRING ISD BIG SPRING J H 61829905 44779 58269 60255 3925764 70 8 1 1 7 2
ECTOR COUNTY ISD ECTOR J H 619421,500 49793 42431 62486 2848254 86 7 0 1 6 2
ECTOR COUNTY ISD JOHN B HOOD 62422462 43375 48220 40210 2521055 74 7 1 0 1 1
MIDLAND ISD ALAMO J H 64715764 56651 50354 53357 3835751 77 9 2 1 6 4
SNYDER ISD SNYDER J H 64551594 64536 48174 70175 5417654 60 11 4 1 10 6
ECTOR COUNTY ISD CROCKETT J H 65553811 58504 56282 62270 3627262 82 6 2 1 4 1
SAN FELIPE-DEL RIO CISD DEL RIO MIDDLE 6513051,519 581316 53714 58712 4571173 94 7 3 1 5 4
LAMESA ISD LAMESA MIDDLE 65409425 47378 56144 36128 3112780 85 8 3 0 2 1
SAN ANGELO ISD LINCOLN MIDDLE 67912991 66871 64317 72287 5628476 76 12 5 0 10 7
CROCKETT COUNTY CONSO OZONA MIDDLE 67154156 58141 7145 6859 585966 74 14 2 4 3 5
WINTERS ISD WINTERS J H 68117127 61107 6458 6436 563672 60 14 3 2 19 17
ANDREWS ISD ANDREWS MIDDLE 69747777 69723 57239 75223 5722338 67 12 7 0 12 4
BAIRD ISD BAIRD MIDDLE 696166 6959 8217 5018 221882 20 15 12 6 0 0
BROWNWOOD ISD BROWNWOOD INT 69256528 66253 00 00 0063 47 22 17 0 0 0
MCCAMEY ISD MCCAMEY MIDDLE 69118144 53113 4738 5538 473855 76 8 3 3 5 3
ABILENE ISD CLACK MIDDLE 71703760 73598 71251 79210 5620966 61 15 7 3 15 11
MIDLAND ISD GODDARD JUNIOR HIGH 71873929 64773 56429 62452 3645346 69 12 4 0 7 3
MONAHANS-WICKETT-PYOTE WALKER J H 71283294 66247 67156 67123 5312349 62 12 5 1 10 11
STAAR percent passing at Phase‐in 1 level II or above.Administered only to 7th grade students.
12
Administered only to 8th grade students.3
Total number of students taking STAAR exam.4
Source Data36Page
B.5.4TAPRPACE 2014

District Name Campus Name
25 Highest Performing Elementary Schools ranked by STAAR Reading Performance¹
MathematicsEnrollment
Angelo State University2013
Student Academic Performance in the Proximal Zone of Professional Impact
Reading
N⁴ % Pass
Writing² Science³% STU Eco
Disadv
% STU Minority % Adv N⁴ % Pass % Adv N⁴ % Pass % Adv N⁴ % Pass % Adv
MIDLAND ISD CARVER CENTER 100230395 99230 10080 1007616 30 64 43 36 68
ECTOR COUNTY ISD EL MAGNET AT REAGAN EL 99276710 98279 9684 9110217 63 37 27 27 9
WALL ISD WALL EL 96264455 97263 9998 867916 22 36 44 29 13
JIM NED CISD LAWN EL 94118247 92119 9240 783743 13 47 24 15 8
JIM NED CISD BUFFALO GAP EL 93106199 89107 8238 893732 15 30 21 24 22
WATER VALLEY ISD WATER VALLEY EL 9342148 7141 10013 851348 27 24 12 15 31
CHRISTOVAL ISD CHRISTOVAL EL 9299181 8299 6932 943323 22 23 11 0 24
CISCO ISD CISCO EL 92168417 74166 8443 717068 20 20 17 2 4
HUNT ISD HUNT SCHOOL 9259193 8159 8614 882435 31 29 17 7 17
MILES ISD MILES EL 9290221 9089 9132 973539 41 27 28 6 9
WYLIE ISD WYLIE INT 92801805 91809 86294 8527218 22 35 34 13 16
SAN ANGELO ISD BONHAM EL 91199461 86198 8157 926628 40 28 28 4 24
KERRVILLE ISD NIMITZ EL 91224484 89223 9564 939561 48 23 26 11 11
MARBLE FALLS ISD SPICEWOOD EL 9191201 8993 7528 913452 27 36 35 14 12
BROWNWOOD ISD WOODLAND HEIGHTS EL 9195449 8395 00 0051 41 25 19 0 0
BLUFF DALE ISD BLUFF DALE EL 9051117 5751 4416 852020 8 12 6 0 0
FREDERICKSBURG ISD STONEWALL EL 9051106 8153 6520 1001630 19 37 36 5 31
MASON ISD MASON EL 8981302 9884 8540 0065 42 31 27 8 0
RISING STAR ISD RISING STAR EL 8946107 9447 9520 751674 23 20 23 10 6
ABILENE ISD DYESS EL 88197510 90194 8671 885148 51 25 31 18 8
FORSAN ISD FORSAN EL AT ELBOW 88144330 78145 9042 805130 32 35 14 17 14
GOLDTHWAITE ISD GOLDTHWAITE EL 88123274 87123 5737 874750 27 30 24 5 11
ALBANY ISD NANCY SMITH EL 8894277 9194 8425 773946 23 17 21 4 8
SAN ANGELO ISD SANTA RITA EL 88155354 90158 8657 815241 43 28 28 12 6
SWEETWATER ISD EAST RIDGE EL 87157352 80159 00 0072 64 24 18 0 0
STAAR percent passing at Phase‐in 1 level II or above.Administered only to 4th grade students.
12
Administered only to 5th grade students.3
Total number of students taking STAAR exam.4
Source Data37Page
B.5.5TAPRPACE 2014

District Name Campus Name
25 Lowest Performing Elementary Schools ranked by STAAR Reading Performance¹
MathematicsEnrollment
Angelo State University2013
Student Academic Performance in the Proximal Zone of Professional Impact
Reading
N⁴ % Pass
Writing² Science³% STU Eco
Disadv
% STU Minority % Adv N⁴ % Pass % Adv N⁴ % Pass % Adv N⁴ % Pass % Adv
DIVIDE ISD DIVIDE EL 0813 08 02 020 31 0 0 0 0
CHRISTOVAL ISD WALL SP PROG (FLC/BAC) 012 00 00 010 0 0 0 0 0
RADIANCE ACADEMY OF LEA RADIANCE ACADEMY OF LEARNING (INTE 283677 837 1811 231394 100 8 0 0 0
BIG SPRING ISD GOLIAD EL 38246562 30249 2687 246872 77 5 2 1 1
LUEDERS-AVOCA ISD LUEDERS-AVOCA EL/J H 382485 1926 147 571476 29 8 0 0 7
ECTOR COUNTY ISD SAN JACINTO EL 43283719 22284 3393 2610473 88 4 2 0 0
MIDLAND ISD SOUTH EL 46158514 35158 5567 356077 98 3 3 0 2
ECTOR COUNTY ISD GALE POND ALAMO EL 47129506 33154 1243 624562 78 7 1 0 4
OLFEN ISD OLFEN EL 471551 4015 836 0480 51 0 0 0 0
ECTOR COUNTY ISD BURLESON EL 48250657 32249 4992 467165 83 7 2 1 0
ECTOR COUNTY ISD EL MAGNET AT ZAVALA 48184594 32185 6572 535775 94 3 1 0 0
BIG SPRING ISD MARCY EL 48290614 32295 2892 219770 72 7 4 2 0
MIDLAND ISD MILAM EL 48181561 30191 3358 477778 95 4 3 2 0
BIG SPRING ISD WASHINGTON EL 48282571 36286 40100 4110567 66 5 3 0 2
SAN ANGELO ISD BRADFORD EL 49209472 46212 4078 456591 82 5 5 0 2
MIDLAND ISD CROCKETT EL 49126453 40129 4349 604283 98 5 3 0 0
ECTOR COUNTY ISD GOLIAD EL 49217575 35219 3977 597174 73 3 2 0 3
MCCAMEY ISD MCCAMEY PRI 5182237 3884 3936 0055 76 5 7 3 0
BIG SPRING ISD MOSS EL 51195451 42193 5772 516367 72 4 3 3 2
REAGAN COUNTY ISD REAGAN COUNTY EL 51202456 40201 5480 555351 85 6 4 0 2
ECTOR COUNTY ISD CAMERON DUAL LANGUAGE MAGNET 52166626 41172 3260 476669 95 4 6 0 6
ECTOR COUNTY ISD EL MAGNET AT TRAVIS 52221632 47224 6060 437479 92 4 5 3 4
ECTOR COUNTY ISD NOEL EL 52303757 41304 37106 4310659 78 4 4 0 5
MONAHANS-WICKETT-PYOTE SUDDERTH EL 53301474 46303 57162 4814353 67 10 8 2 3
SAN ANGELO ISD FANNIN EL 54186391 60188 4668 496785 79 11 12 1 6
STAAR percent passing at Phase‐in 1 level II or above.Administered only to 7th grade students.
12
Administered only to 8th grade students.3
Total number of students taking STAAR exam.4
Source Data38Page
B.5.6TAPRPACE 2014

II.
University and Teacher
Education Trends

C.
University and Teacher
Production Reports
39
SECTION C: University and Teacher Production Reports
Section C provides data on university production trends, university teacher and certificate
production, as well as data regarding other producers of teachers in the PZPI. Please see Section
V in the Table of Contents for a complete listing of the original data sources used to complete the
Section C reports.
C.1: Five-Year University Production Trends.
This report shows five-year trend data (FY2009-2013) describing university enrollment, degrees
awarded and the number of teachers produced. The Teachers Produced by Pathway section
shows teacher production for all university pathways.
C.2: Teacher Production Trends for University Completers.
This analysis provides the total number of teachers produced from FY 2003 through FY 2013 for
all university pathways. Teacher production is defined as the total number of individuals
(unduplicated) receiving any type of teacher certification from a program during the complete
academic year (fiscal year) from September 1st through August 31
st. For example, the 2013
production count includes university completers from all university pathways who obtained
certification in any academic semester between September 1, 2012 and August 31, 2013.
It is important to note that certification cohorts are not graduation cohorts. A program typically
graduates more individuals than those who actually obtain certification in that year. Individuals
often graduate and obtain certification in a subsequent academic year.
The formula used to calculate the one-year change as a percent was: 2013-2012/2012 x 100%.
The formula used to calculate the five-year change was: 2013-2008/2008 x 100%.
C.3: Teacher Production by Race/Ethnicity.
This analysis provides the number and percentages of individuals produced from FY 2003
through FY 2013 disaggregated by race/ethnicity. The race/ethnicity of the individual is self-
reported. The three and five year change is reported as a number rather than a percent.
C4: Initial Certification Production by Level.
This analysis shows initial standard certificate production disaggregated by level over a ten-year
period (2004-2013). During any certification year, the number of certificates is greater than the
number of teachers produced since many teachers obtain more than one certificate. A 5-year
average certificate production is calculated.
Certification data are based upon when the individual initially applies for certification. For
example, a person may complete a program in AY 2004, yet decide not to obtain certification
until AY 2006. Such an individual would be included in the 2006 certification cohort rather than
the 2004 certification cohort. TEA generally uses the date of the initial application as the date of
certification.
C.5: Other Producers of Teachers in the Proximal Zone of Professional Impact.
This report shows the ten-year production trends for other suppliers of teachers in the same PZPI
as the target university sorted from highest to lowest producer. The listing shows the
unduplicated number of individuals obtaining standard certification though an approved Texas
educator preparation program.

University Production
5‐Year Inc/Dec
Degrees Awarded (Spring of academic year)
Enrollment (Fall of fiscal year)
Total enrollment also includes doctoral and professional level degree‐seeking students.Total degrees awarded also includes doctoral level degrees.
12
Teachers Produced by Pathway (End of fiscal year)
Angelo State University2009‐2013
Five‐Year University Production Trends
FY 2009 FY 2010 FY 2011 FY 2012 FY 2013
Program numbers may not add up to Total because of missing data.3
Enrollment for private universities is projected fromearly fall estimates from IPEDs.4
6,113 6,376 7,077 6,826 6,430Total 1,4 5.2%
5,592 5,767 6,157 5,881 5,433Undergraduate ‐2.8%
465 506 754 789 842Masters 81.1%
1,049 1,098 1,147 1,343 1,399Total 2 33.4%
782 816 805 932 938Baccalaureate Degrees 19.9%
11 15 15 17 18Mathematics 63.6%
37 40 39 46 55Biological Science 48.6%
14 14 6 22 31Physical Science 121.4%
169 157 187 251 283Masters 67.5%
166 158 148 150 138Total 3 ‐16.9%
0 0 0 0 0ACP Certified 0.0%
18 22 37 24 15Post‐Baccalaureate Certified ‐16.7%
148 136 111 126 123Traditional Undergraduate Certified ‐16.9%
Source Data40Page
C.1THECB Accountability System, PREP Online, ICUT,
IPEDS (Private Universities Only)PACE 2014

Total Teachers Produced by Fiscal YearTotal
1‐Year Change
5‐Year Change
Angelo State UniversityFY 2003‐2013
Teacher Production Trends for University Completers
2012‐2013 2008‐20132003 2004 2005 2006 2007 2008 2009 2010 2011 2012 2013
1
2No. of C
ompleters
Fiscal Year
0
200
400
600
800
1000
1200
2003 2004 2005 2006 2007 2008 2009 2010 2011 2012 2013
Post Bacc Standard
242 237 234 195 180 180 166 158 148 150 138 2,028 ‐8.0% ‐23.3%
1 Number of university completers is the unduplicated number of individuals obtaining certification through the university.2 Certificate year equals fiscal year (September 1 ‐ August 31).
Source Data41Page
C.2Teacher Certification Data, TEAPACE 2014

3-Year Change
5-Year Change
Angelo State UniversityFY 2003‐2013
Teacher Production by Race/Ethnicity
2010-2013 2008-2013
Fiscal Year
1
2003 2004 2005 2006 2007 2008 2009 2010 2011 2012 2013
2Num
ber
Fiscal Year
0
200
400
600
800
1000
1200
2003 2004 2005 2006 2007 2008 2009 2010 2011 2012 2013
White Unknown Other Hispanic African American
4African American 2 5 3 7 5 5 2 0 3 3 1 ‐2
39Hispanic 41 40 39 37 31 32 28 24 20 30 2 ‐1
3Other 2 3 1 2 1 3 3 3 3 2 ‐1 1
0Unknown 1 1 0 0 0 0 0 0 0 0 0 0
196White 191 185 152 134 143 126 125 121 124 103 ‐22 ‐40
242 237 234 195 180 180 166 158 148 150 138TOTAL
Source Data42Page
C.3Teacher Certification Files, TEA
1 Race/ethnicity is self‐reported.2 Certification year equals fiscal year (September 1 ‐ August 31).
PACE 2014

2004 2005 2006 2007 2008 2009 2010 2011 2012 2013
Fiscal YearCertificate2009-2013
5‐YearAverage
Angelo State UniversityFY 2004‐2013
Initial Certification Production by Level 12
Bilingual Generalist 0 0 0 0 0 0 0 0 0 0 0.0ELEMENTARY (EC-4 and EC-6)
Bilingual Other³ 0 0 0 0 0 0 0 0 0 0 0.0ESL Generalist 0 0 0 0 0 0 0 0 0 0 0.0ESL Other⁴ 0 0 0 0 0 0 0 0 0 0 0.0Generalist 95 119 97 84 88 87 78 64 78 77 76.8Other⁵ 37 0 1 0 0 0 0 0 0 0 0.0Subtotal 132 119 98 84 88 87 78 64 78 77 76.8
Bilingual Generalist 0 0 0 0 0 0 0 0 0 0 0.0MIDDLE SCHOOL (4-8)
ESL Generalist 0 0 0 0 0 0 0 0 0 0 0.0ESL Other⁶ 0 0 0 0 0 0 0 0 0 0 0.0Generalist 6 0 3 6 4 9 17 27 25 18 19.2ELA/Reading 2 2 5 5 4 0 2 3 4 2 2.2ELA/Reading/Social Studies 0 0 0 0 0 0 0 0 0 1 0.2Mathematics 3 7 3 3 3 5 5 2 5 1 3.6Mathematics/Science 0 1 4 1 2 2 3 0 0 0 1.0Science 1 1 1 3 3 1 2 1 0 0 0.8Social Studies 0 1 1 1 0 1 2 0 0 0 0.6Subtotal 12 12 17 19 16 18 31 33 34 22 27.6
Career & Technology Education⁷ 0 0 0 0 0 0 1 1 1 4 1.4HIGH SCHOOL (6-12, 7-12 and 8-12)
Chemistry 0 1 0 0 0 1 1 0 1 0 0.6Computer Science 0 1 0 0 0 0 0 0 0 0 0.0Dance 0 0 0 0 0 0 0 0 0 0 0.0ELA/Reading 7 7 6 10 9 9 9 9 8 12 9.4History 6 2 4 3 4 4 6 5 2 5 4.4Journalism 2 1 0 0 1 0 1 1 0 0 0.4Life Sciences 2 5 3 4 5 5 9 7 2 3 5.2Mathematics 7 14 9 5 8 7 5 9 10 7 7.6Mathematics/Physical Sc/Engineering 0 0 0 0 0 0 0 0 0 0 0.0Physical Science 2 1 1 1 0 0 0 1 0 0 0.2Physics 1 0 0 0 0 0 0 0 0 0 0.0Physics/Mathematics 0 0 0 0 0 0 1 0 0 0 0.2Science 1 0 0 0 0 0 0 0 0 0 0.0Secondary French 0 0 0 0 0 0 0 0 0 0 0.0Secondary German 0 0 0 0 0 0 0 0 0 0 0.0Secondary Latin 0 0 0 0 0 0 0 0 0 0 0.0Secondary Spanish 7 4 3 6 6 6 2 3 0 0 2.2Social Studies 2 4 1 2 4 3 2 2 1 2 2.0Speech 3 0 5 1 7 5 7 2 1 2 3.4Technology Applications 2 0 0 0 0 0 0 0 0 0 0.0Subtotal 42 40 32 32 44 40 44 40 26 35 37.0
American Sign Language 0 0 0 0 0 0 0 0 0 0 0.0ALL LEVEL (EC-12 and PK-12)
Fine Arts⁸ 8 7 2 6 13 7 11 9 7 12 9.2Health and Phy Education 10 22 42 41 35 27 17 11 14 3 14.4LOTE - French 0 0 0 0 0 0 0 0 0 0 0.0LOTE - German 0 0 0 0 0 0 0 0 0 0 0.0LOTE - Latin 0 0 0 0 0 0 0 0 0 0 0.0LOTE - Spanish 0 0 0 0 0 0 0 1 1 4 1.2Special Education⁹ 17 8 14 10 16 16 13 13 27 33 20.4Technology Applications 1 0 0 0 0 0 0 0 0 0 0.0Subtotal 36 37 58 57 64 50 41 34 49 52 95.6
Bilingual 0 0 0 0 0 0 0 0 0 0 0.0SUPPLEMENTALS
ESL 0 0 0 0 0 1 1 0 0 0 0.4Gifted/Talented 0 0 0 0 0 0 0 0 0 0 0.0Special Education⁹ 0 1 7 4 1 0 1 0 0 0 0.2Subtotal 0 1 7 4 1 1 2 0 0 0 0.61 Individual candidates may receive multiple certificates.2 Certificate year equals fiscal year (Sept. 1 ‐ Aug. 31).3 Includes all other elementary bilingual ESL and bilingual certificates.4 Includes all other elementary ESL certificates.5 Includes all other 1‐6, 1‐8, and PK‐6 self contained certificates no longer issued.6 Includes all other 4‐8 and 6‐12 ESL certificates.
7 Includes technology education, family and consumer sciences composite, human development and family studies, hospitality, nutrition, and food sciences, agriculture, science, and technology, business education, marketing education, health science technology education, trade and industrial education, career and technical education.8 Includes certificates issued in art, music, theatre.9 Includes certificates issued in special education, deaf and hard of hearing and teacher of students with visual impairment.
Source Data43Page
C.4Teacher Certification Files, TEAPACE 2014

Production Entity Total
Angelo State UniversityFY 2003‐2013
Other Producers of Teachers in the Proximal Zone of Professional Impact
2003 2004 2005 2006 2007 2008 2009 2010 2011 2012 2013
12
275 3,971296317300318397350411412437458Tarleton State University138 2,028150148158166180180195234237242Angelo State University81 1,57198122132136112164148150242186University of Texas - Permian Basin72 1,11371479510011192120114148143Abilene Christian University69 92361821091031066890737983Region 18 Education Service Center51 72862498375606478696374McMurry University46 71360445858807755738181Hardin-Simmons University21 48935304339364865595954Howard Payne University18 31320231722391930414737Schreiner University31 22630272222171414211315Region 14 Education Service Center0 00000000000Region 15 Education Service Center
1 Number of university completers is the unduplicated number of individuals obtaining standard certification.2 Certificate year equals fiscal year (September 1 ‐ August 31).
802 12,0758838891,0171,0391,1381,0761,2061,2461,4061,373TOTAL
Source Data44Page
C.5Teacher Certification Files, TEA, AEISPACE 2014

D.
Professional Impact Trend Reports

45
SECTION D: Professional Impact Trend Reports
Section D includes information about teacher and district hiring patterns, the placement of university
completers within the PZPI, and retention rates for the 2010 cohort of first-year teachers.
D.1 a-c: Teacher Hiring in the Proximal Zone of Professional Impact. These three reports show
school district hiring patterns in the PZPI by comparing the supply of new teacher FTEs provided by a
preparation program to the total FTEs employed by subject area and school level. The category
“Teachers Supplied” is defined as the number of newly-hired teacher Full Time Equivalents (FTEs) in
the PZPI who obtained probationary or standard certification from the preparation program in FY 2013
with no prior teaching experience. The category “District Hires” is defined as the number of newly-
hired teacher Full Time Equivalents (FTEs) employed in the PZPI in AY 2013-2014. A hiring ratio
was calculated to represent the impact of university teacher production in the PZPI.
D.2: Percentage of Newly-Certified Teachers Employed Inside and Outside the Proximal Zone
of Professional Impact. This analysis shows the percentage of the university’s newly-certified
teachers (those obtaining a standard certificate with no prior teaching experience) employed within a
seventy-five mile radius of the university.
D.3: District Hiring Patterns of University-Prepared Teachers in the Proximal Zone of
Professional Impact. This report is the first page of a supplemental document comparing the AY
2013-2014 hiring patterns of districts in the university’s PZPI. (See Attachment 3 to view the full
report). The first chart shows which PZPI districts employed teachers from the university in AY 2014
who were newly-certified in FY 2013. The second shows the same information for all teachers
employed in the PZPI in AY 2014 who were certified through the university between FY 1995 and FY
2013.
D.4 a-c: Percentage of University Completers in the Proximal Zone of Professional Impact by
Level. This set of analyses provides information about the percentage of Full Time Equivalents
(FTEs) certified through the university’s preparation program since 1995 who are employed at a
campus within the PZPI disaggregated by level. To provide context about the campus, the percent of
school students classified as economically disadvantaged is provided. The column labeled “# School
FTEs” shows the total number of teacher FTEs at the campus. The columns labeled “# Univ FTEs”
and the “% Univ FTEs” show the total number and percent of FTEs employed at that campus who
obtained certification from the target university’s preparation program from FY 1995 through FY
2013.
D.5: Comparison of Teacher Retention Trends. D.5.a: Five-Year Retention of First-Year Teachers.
The table and corresponding graphic displays the five-year teacher retention and attrition rates for first-
year teachers certified in FY 2009 who became employed in a Texas public school in AY 2010. A
first-year teacher is defined as an individual issued either a standard or probationary certificate in FY
2009 who had no prior teaching experience. The retention rate for spring 2010 is always 100% in each
analysis because the analysis starts with all cohort members employed in Texas public schools in AY
2009-2010. The target university’s retention rates are compared with CREATE public and private
universities, profit and nonprofit ACPs, and the state total. D.5.b-d: Five-Year Retention of First-Year
Teachers by School Level. These reports further disaggregate the five-year retention rates and attrition
rates of first-year teachers into high, middle, and elementary school level. Numbers less than 10 are
not graphically represented.

High Schools
Subject Area English Total FTEsMathe‐matics
Science Social Studies
Foreign Language
Fine Arts PE / Health Computer Science
Voc / Bus Education
Special Education
Bilingual / ESL
Other Assign
Teacher Hiring in the Proximal Zone of Professional Impact
Angelo State University
Newly‐Hired Teachers in PZPI in FY 2013‐2014
Hiring Ra
tio
Subject Area
6.2 5.4
0 0 0 01.3
0
4.7
14.9
01.3
3.7
0
5
10
15
20
25
30
35
40
45
50
English
Mathematics Science
SocialStudies
ForeignLanguage
Fine Arts PE/Health ComputerScience
Voc/BusEducation
SpecialEducation
ESL Other Total FTEs
3.3Teachers Supplied 1.9 0.0 0.0 0.0 0.0 0.4 0.0 2.0 3.7 0.0 0.2 11.41
52.9District Hires 35.2 39.4 24.7 12.6 18.5 31.3 1.5 42.5 24.9 6.1 15.9 306.62
1 Includes number of newly‐hired FTEs from university preparation programs who obtained standard or probationary certification in FY 2013 with no prior teaching experience.
2 The number of newly‐hired teacher FTEs in the PZPI in AY 2013‐2014.
3 Newly‐hired university FTEs divided by number of newly‐hired district FTEs in the PZPI.
6.2%Hiring Ratio 5.4% 0.0% 0.0% 0.0% 0.0% 1.3% 0.0% 4.7% 14.9% 0.0% 1.3% 3.7%3
Source Data46Page
D.1.aTeacher Assignment and Certification Files, TEAPACE 2014

Middle Schools
Subject Area English Total FTEsMathe‐matics
Science Social Studies
Foreign Language
Fine Arts PE / Health
Computer Science
Voc / Bus Education
Special Education
Bilingual / ESL
Other Assign
Self‐Contained
Teacher Hiring in the Proximal Zone of Professional Impact
Angelo State University
Newly‐Hired Teachers in PZPI in FY 2013‐2014
Hiring Ra
tio
Subject Area
0
4.5
9.9
4
7.9
3.3
16.6
2.5
0 0
4.1
0
46.2
0
5
10
15
20
25
30
35
40
45
50
Self‐Contained
English
Mathematics Science
SocialStudies
ForeignLanguage
Fine Arts PE/Health ComputerScience
Voc/BusEducation
SpecialEducation
ESL Other Total FTEs
Teachers Supplied 1.9 3.6 0.8 2.7 0.2 3.0 0.5 0.0 0.0 1.0 0.0 0.5 14.10.01
District Hires 41.9 36.3 20.1 34.1 6.0 18.1 19.8 1.0 5.1 24.4 9.6 12.5 229.00.22
1 Includes number of newly‐hired FTEs from university preparation programs who obtained standard or probationary certification in FY 2013 with no prior teaching experience.
2 The number of newly‐hired teacher FTEs in the PZPI in AY 2013‐2014.
3 Newly‐hired university FTEs divided by number of newly‐hired district FTEs in the PZPI.
4.5%Hiring Ratio 9.9% 4.0% 7.9% 3.3% 16.6% 2.5% 0.0% 0.0% 4.1% 0.0% 4.0% 6.2%0.0%3
Source Data47Page
D.1.bTeacher Assignment and Certification Files, TEAPACE 2014

Elementary Schools
Subject Area Non‐CoreSubjects
TotalFTEs
SpecialEducation
Bilingual/ESL
CoreSubjects
Angelo State University
Newly‐Hired Teachers in PZPI in FY 2013‐2014
Teacher Hiring in the Proximal Zone of Professional Impact
4 5
Hiring Ra
tio
Subject Area
8
12.19.9
0
8.4
0
5
10
15
20
25
30
35
40
45
50
Core Subjects Non‐Core Subjects Special Education Bilingual/ESL Total
12.7 3.0 0.0 49.633.9Teachers Supplied 1
105.3 30.3 27.9 588.5425.0District Hires 2
4 Core subjects are subjects that are TAKS tested.
5 Non‐core subjects are all subjects not TAKS tested.
1 Includes number of newly‐hired FTEs from university preparation programs who obtained standard or probationary certification in FY 2013 with no prior teaching experience.
2 The number of newly‐hired teacher FTEs in the PZPI in AY 2013‐2014.
3 Newly‐hired university FTEs divided by number of newly‐hired district FTEs in the PZPI.
12.1%Hiring Ratio 9.9% 0.0% 8.4%8.0%3
Source Data48Page
D.1.cTeacher Assignment and Certification Files, TEAPACE 2014

New Teachers Employed
% Change
Number Percent Number Percent Number Percent
Percentage of Newly‐Certified Teachers Employed Inside and Outsidethe Proximal Zone of Professional Impact
Angelo State University
2012‐2014
2012 2013 2014
2012 to 2014
Percen
t of New
Teachers Em
ploy
ed
Spring of Academic Year
76.3 75.570
23.7 24.530
0
20
40
60
80
100
2012 2013 2014
Not in the Zone In the Zone
In the Zone 58 76.3 77 75.5 77 70.0 ‐6.3
Not in the Zone 18 23.7 25 24.5 33 30.0 6.3
Total 76 100.0 102 100.0 110 100.0 0.0
Source Data49Page
D.2Teacher Assignment and Certification Files
TEAPACE 2014

All Teachers Certified
SAMPLE DOCUMENT: To view the Full Hiring Patterns Report Refer to Attachment 3
District Hiring Patterns of University‐Prepared Teachers in PZPI
Angelo State University2013‐2014
Teachers Newly‐Certified in FY 2012‐20131
Employing District% University Newly-
Certified Compared to New Teachers Employed
University-Prepared Employed by District in
2013-2014
New Teachers Employed by District in 2013-2014
GLASSCOCK COUNTY ISD 1 1 100.0SANTA ANNA ISD 1 1 100.0PAINT ROCK ISD 3 4 75.0MCCAMEY ISD 5 9 55.6BALLINGER ISD 1 2 50.0WESTBROOK ISD 1 2 50.0SAN ANGELO ISD 34 72 47.2REAGAN COUNTY ISD 6 13 46.2CISCO ISD 1 3 33.3CROCKETT COUNTY CONSOL 2 6 33.3GRAPE CREEK ISD 4 12 33.3RULE ISD 1 3 33.3SONORA ISD 1 3 33.3STERLING CITY ISD 1 3 33.3SAN SABA ISD 1 6 16.7
Employing District Percent of Univ-Prepared Teachers in District
University-Prepared (1994-1995-2012-2013) Employed
by District in 2013-2014
Total Teachers Employed by District in 2013-2014
VERIBEST ISD 13 24 54.2GRAPE CREEK ISD 46 88 52.3SAN ANGELO ISD 420 932 45.1CHRISTOVAL ISD 16 38 42.1PAINT ROCK ISD 8 19 42.1MILES ISD 17 41 41.5REAGAN COUNTY ISD 28 72 38.9OLFEN ISD 3 8 37.5WALL ISD 39 108 36.1SCHLEICHER ISD 19 63 30.2EDEN CISD 7 24 29.2BALLINGER ISD 24 83 28.9BLACKWELL CISD 7 25 28.0IRION COUNTY ISD 8 29 27.6STERLING CITY ISD 8 30 26.71. Includes standard certificates from all university pathways.
Source Data50Page
D.3Teacher Certification and Employment Files
TEAPACE 2014

District Name Campus Code Campus Name# Campus
FTEs# UnivFTEs
% UnivFTEs
% School Econ Disadvantaged 2 3 4
Angelo State University2012‐2013
1Percentage of University Completers in High Schools in the Proximal Zone of Professional Impact
WATER VALLEY ISD 226905202 SAN ANGELO STATE SCHOOL 1.0 0.9 91.00.0MILES ISD 200902001 MILES H S 21.0 9.7 46.336.8VERIBEST ISD 226908001 VERIBEST H S 12.4 4.9 39.746.0WALL ISD 226906001 WALL H S 33.4 13.3 39.713.5SAN ANGELO ISD 226903041 CENTRAL FRESHMAN CAMPUS 43.0 14.9 34.653.4SAN ANGELO ISD 226903002 LAKE VIEW H S 90.8 31.1 34.371.2GRAPE CREEK ISD 226907001 GRAPE CREEK H S 29.2 9.7 33.360.3SAN ANGELO ISD 226903001 CENTRAL H S 132.2 42.8 32.442.5WALL ISD 226906002 FAIRVIEW ACCELERATED 4.4 1.4 30.983.3SNYDER ISD 208902004 SNYDER ACADEMY 4.4 1.1 25.653.8SCHLEICHER ISD 207901001 ELDORADO H S 24.0 6.0 24.934.6BALLINGER ISD 200901001 BALLINGER H S 30.0 7.2 24.148.2GLASSCOCK COUNTY ISD 87901001 GLASSCOCK COUNTY H S 16.2 3.9 23.943.4BRADY ISD 160901001 BRADY H S 28.8 6.4 22.353.6SONORA ISD 218901001 SONORA H S 34.2 7.0 20.635.9MENARD ISD 164901001 MENARD H S 11.6 2.4 20.349.4REAGAN COUNTY ISD 192901001 REAGAN COUNTY H S 25.0 5.0 20.043.4IRION COUNTY ISD 118902001 IRION H S 17.0 3.3 19.537.6ROBERT LEE ISD 41902001 ROBERT LEE H S 14.0 2.6 18.753.8ANSON ISD 127901001 ANSON H S 23.6 4.3 18.252.2BRONTE ISD 41901001 BRONTE H S 15.2 2.5 16.437.1COAHOMA ISD 114902001 COAHOMA H S 24.2 3.8 15.627.5CLYDE CISD 30902001 CLYDE H S 38.4 5.6 14.737.9WATER VALLEY ISD 226905001 WATER VALLEY H S 14.4 2.1 14.341.1WINTERS ISD 200904001 WINTERS H S 19.0 2.7 14.362.7COLORADO ISD 168901001 COLORADO HIGH SCHOOL 27.2 3.7 13.549.1CROCKETT COUNTY CONSOLIDATED CS 53001001 OZONA H S 24.4 3.0 12.337.1
Listing includes both charter and public schools. Only the first 25 campuses are listed.Number of Full Time Equivalents (FTEs) employed by the campus.Number of Full Time Equivalents (FTEs) employed by the campus from the university.Percent of University FTEs employed by the campus.
1234
Source Data51Page
D.4.aAEIS, TEAPACE 2014

1
Angelo State University2012‐2013
Percentage of University Completers in Middle Schools in the Proximal Zone of Professional Impact
District Name Campus Code Campus Name# Campus
FTEs# UnivFTEs
% UnivFTEs
% School Econ Disadvantaged 2 3 4
GRAPE CREEK ISD 226907041 GRAPE CREEK MIDDLE 18.0 8.4 46.764.5SAN ANGELO ISD 226903045 LINCOLN MIDDLE 59.4 26.0 43.875.9SAN ANGELO ISD 226903042 GLENN MIDDLE 68.2 29.0 42.549.4SAN ANGELO ISD 226903043 LEE MIDDLE 57.8 23.9 41.358.3REAGAN COUNTY ISD 192901041 REAGAN COUNTY MIDDLE 16.2 6.0 37.046.3BALLINGER ISD 200901041 BALLINGER J H 20.0 6.5 32.558.5WALL ISD 226906041 WALL MIDDLE 24.6 7.8 31.612.5MENARD ISD 164901041 MENARD J H 5.2 1.6 30.069.1BRADY ISD 160901041 BRADY MIDDLE 24.6 5.6 22.868.6SCHLEICHER ISD 207901041 ELDORADO MIDDLE 17.0 3.9 22.748.5BRACKETT ISD 136901041 BRACKETT J H 10.6 2.3 21.252.7WINTERS ISD 200904041 WINTERS J H 11.0 2.3 20.771.7CROCKETT COUNTY CONSOLIDATED CS 53001041 OZONA MIDDLE 14.8 2.6 17.666.0GORMAN ISD 67904042 GORMAN MIDDLE 5.8 1.0 17.269.7COLORADO ISD 168901041 COLORADO MIDDLE 21.0 3.3 15.859.5IRAAN‐SHEFFIELD ISD 186903041 IRAAN J H 9.0 1.4 15.624.3SONORA ISD 218901041 SONORA J H 18.6 2.7 14.347.4ANSON ISD 127901041 ANSON MIDDLE 14.2 2.0 13.961.4GREENWOOD ISD 165902041 JAMES R BROOKS MIDDLE SCHOOL 16.4 2.0 12.135.0BIG SPRING ISD 114901043 BIG SPRING J H 59.6 7.0 11.764.4FORT STOCKTON ISD 186902041 FORT STOCKTON MIDDLE 34.6 4.0 11.665.2COMANCHE ISD 47901041 JEFFERIES J H 18.8 2.2 11.462.3SAN SABA ISD 206901041 SAN SABA MIDDLE 17.6 2.0 11.460.4MASON ISD 157901041 MASON J H 14.8 1.7 11.250.2ROTAN ISD 76904041 ROTAN J H 5.6 0.6 10.575.5SNYDER ISD 208902041 SNYDER J H 40.6 4.3 10.553.9COLEMAN ISD 42901041 COLEMAN J H 18.0 1.8 10.258.9
Listing includes both charter and public schools. Only the first 25 campuses are listed.Number of Full Time Equivalents (FTEs) employed by the campus.Number of Full Time Equivalents (FTEs) employed by the campus from the university.Percent of University FTEs employed by the campus.
1234
Source Data52Page
D.4.bAEIS, TEAPACE 2014

Angelo State University2012‐2013
1Percentage of University Completers in Elementary Schools in the Proximal Zone of Professional Impact
District Name Campus Code Campus Name# Campus
FTEs# UnivFTEs
% UnivFTEs
% School Econ Disadvantaged 2 3 4
SAN ANGELO ISD 226903114 HOLIMAN EL 24.4 17.9 73.454.9GRAPE CREEK ISD 226907101 GRAPE CREEK INT 18.6 13.1 70.669.5SAN ANGELO ISD 226903113 GOLIAD EL 33.8 20.6 60.978.8SAN ANGELO ISD 226903115 MCGILL EL 24.0 14.0 58.372.8SAN ANGELO ISD 226903111 FT CONCHO EL 23.0 13.0 56.553.8SAN ANGELO ISD 226903119 SAN JACINTO EL 27.0 15.0 55.692.7SAN ANGELO ISD 226903101 ALTA LOMA EL 20.0 11.0 55.084.3SAN ANGELO ISD 226903103 BELAIRE EL 25.0 13.0 52.076.3SAN ANGELO ISD 226903105 BOWIE EL 26.0 13.0 50.042.8GRAPE CREEK ISD 226907104 GRAPE CREEK PRI 23.0 10.8 47.076.8VERIBEST ISD 226908101 VERIBEST EL 9.6 4.5 47.047.4SAN ANGELO ISD 226903112 GLENMORE EL 26.0 12.0 46.257.9SAN ANGELO ISD 226903106 BRADFORD EL 29.0 13.0 44.890.7WALL ISD 226906101 WALL EL 36.6 16.2 44.216.3REAGAN COUNTY ISD 192901101 REAGAN COUNTY EL 34.0 14.6 43.050.7SAN ANGELO ISD 226903102 AUSTIN EL 28.0 12.0 42.975.5SCHLEICHER ISD 207901101 ELDORADO EL 20.4 8.7 42.650.6SAN ANGELO ISD 226903116 REAGAN EL 28.0 11.9 42.684.9MILES ISD 200902101 MILES EL 19.2 8.0 41.739.4SAN ANGELO ISD 226903122 BONHAM EL 26.6 11.0 41.427.5SONORA ISD 218901101 SONORA EL 19.4 7.6 39.462.4SAN ANGELO ISD 226903108 CROCKETT EL 21.0 8.0 38.164.8SAN ANGELO ISD 226903120 SANTA RITA EL 21.0 8.0 38.141.2SAN ANGELO ISD 226903123 LAMAR EL 31.8 12.0 37.739.5CROCKETT COUNTY CONSOLIDATED CS 53001103 OZONA EL 31.0 11.0 35.554.1SAN ANGELO ISD 226903110 FANNIN EL 23.0 7.9 34.485.2WATER VALLEY ISD 226905101 WATER VALLEY EL 13.0 4.4 34.248.0
Listing includes both charter and public schools. Only the first 25 campuses are listed.Number of Full Time Equivalents (FTEs) employed by the campus.Number of Full Time Equivalents (FTEs) employed by the campus from the university.Percent of University FTEs employed by the campus.
1234
Source Data53Page
D.4.cAEIS, TEAPACE 2014

Percent Retained in Spring of Academic Year AttritionRate
Number Teachers³
Entity/Organization
1,2
Angelo State University2010‐2014
Comparison of Teacher Retention TrendsFive‐Year Retention of First‐Year Teachers
2010 2011 2012 2013 2014
Percen
t Retaine
d
40
45
50
55
60
65
70
75
80
85
90
95
100
2010 2011 2012 2013 2014
Angelo State CREATE Private Universities CREATE Public Universities
For Profit ACPs Non‐Profit ACPs State Total
100.0 89.0 80.0Angelo State 75.0 70.0100 30.0
100.0 94.2 87.5CREATE Public Universities 83.5 79.16312 20.9
100.0 93.2 84.5CREATE Private Universities 79.7 74.3517 25.7
100.0 90.4 79.5For Profit ACPs 72.4 67.45869 32.6
100.0 89.0 75.5Non-Profit ACPs 67.0 62.23064 37.8
100.0 91.5 81.9State Total 75.7 70.916981 29.11 Includes teachers obtaining a standard or probationary certificate in 2008‐2009 with no prior teaching experience.Texas data only tracks public school employment.2
3 Numbers less than 10 are not represented on this figure.
Source Data54Page
D.5.aTeacher Certification and Assignment Files, AEIS,
TEAPACE 2014

Percent Retained in Spring of Academic Year AttritionRate
Number Teachers³
Entity/Organization
High SchoolAngelo State University
2010‐2014
Comparison of Teacher Retention Trends
2010 2011 2012 2013 2014
1,2Five‐Year Retention of First‐Year Teachers by School LevelPe
rcen
t Retaine
d
40
45
50
55
60
65
70
75
80
85
90
95
100
2010 2011 2012 2013 2014
Angelo State CREATE Private Universities CREATE Public Universities
For Profit ACPs Non‐Profit ACPs State Total
100.0 85.7 71.4Angelo State 67.9 67.928 32.1
100.0 92.7 85.0CREATE Public Universities 78.8 73.41309 26.6
100.0 95.2 83.2CREATE Private Universities 80.8 72.8125 27.2
100.0 88.4 75.8For Profit ACPs 66.4 62.62068 37.4
100.0 87.7 71.8Non-Profit ACPs 60.1 57.4904 42.6
100.0 89.5 77.7State Total 69.0 64.84663 35.21 Includes teachers obtaining a standard or probationary certificate in 2008‐2009 with no prior teaching experience.Texas data only tracks public school employment.2
3 Numbers less than 10 are not represented on this figure.
Source Data55Page
D.5.bTeacher Certification and Assignment Files, AEIS,
TEAPACE 2014

Percent Retained in Spring of Academic Year AttritionRate
Number Teachers³
Entity/Organization
Middle School
2010‐2014
Comparison of Teacher Retention Trends
Angelo State University
2010 2011 2012 2013 2014
1,2Five‐Year Retention of First‐Year Teachers by School LevelPe
rcen
t Retaine
d
40
45
50
55
60
65
70
75
80
85
90
95
100
2010 2011 2012 2013 2014
Angelo State CREATE Private Universities CREATE Public Universities
For Profit ACPs Non‐Profit ACPs State Total
100.0 93.8 93.8Angelo State 81.2 81.216 18.8
100.0 94.2 87.8CREATE Public Universities 83.2 78.91143 21.1
100.0 94.7 84.2CREATE Private Universities 77.9 72.695 27.4
100.0 91.2 81.6For Profit ACPs 75.9 69.51638 30.5
100.0 89.8 74.9Non-Profit ACPs 66.3 60.3725 39.7
100.0 92.0 82.2State Total 76.3 70.53841 29.51 Includes teachers obtaining a standard or probationary certificate in 2008‐2009 with no prior teaching experience.Texas data only tracks public school employment.2
3 Numbers less than 10 are not represented on this figure.
Source Data56Page
D.5.cTeacher Certification and Assignment Files, AEIS,
TEAPACE 2014

Percent Retained in Spring of Academic Year AttritionRate
Number Teachers³
Entity/Organization
Elementary School
2010‐2014
Comparison of Teacher Retention Trends
Angelo State University
2010 2011 2012 2013 2014
1,2Five‐Year Retention of First‐Year Teachers by School LevelPe
rcen
t Retaine
d
40
45
50
55
60
65
70
75
80
85
90
95
100
2010 2011 2012 2013 2014
Angelo State CREATE Private Universities CREATE Public Universities
For Profit ACPs Non‐Profit ACPs State Total
100.0 88.9 80.0Angelo State 77.8 71.145 28.9
100.0 94.9 88.5CREATE Public Universities 85.7 81.43651 18.6
100.0 92.3 85.2CREATE Private Universities 79.9 75.7284 24.3
100.0 92.8 82.6For Profit ACPs 76.6 71.21920 28.8
100.0 90.4 79.2Non-Profit ACPs 72.7 67.31313 32.7
100.0 93.0 84.8State Total 80.1 75.17835 24.91 Includes teachers obtaining a standard or probationary certificate in 2008‐2009 with no prior teaching experience.Texas data only tracks public school employment.2
3 Numbers less than 10 are not represented on this figure.
Source Data57Page
D.5.dTeacher Certification and Assignment Files, AEIS,
TEAPACE 2014

III.
University Benchmarks to
Guide Improvement

E.
University Comparison Reports

58
SECTION E: University Comparison Reports
Section E contains comparison information among universities regarding teacher and certificate
production, and teacher retention.
Comparison universities were systematically selected for each university by choosing the two
closest universities in proximity to the target university. The data associated with each
university represents that university’s Proximal Zone of Professional Impact. If there were more
than two universities in the target university’s PZPI, the two having the highest correlation based
on student enrollment in the PZPI were chosen as the comparison universities. When there were
no universities in the PZPI, CREATE staff used professional judgment to determine the
comparison universities.
E.1: Comparison of Teacher Production.
The table and accompanying graph in this report compares teacher production over a ten-year
time period between the target university and two comparison universities. The production
number represents the number of unduplicated individuals obtaining certification through all
university pathways in any given fiscal year. A ten-year total and a ten-year average are
computed.
E.2: Five-Year Teacher Production of Consortium Universities.
This report shows the five-year teacher production of all CREATE consortium institutions from
2009-2013. The data are sorted into quintiles by the five-year average with the universities in
Quintile 1 having the highest average number of teachers, and Quintile 5 having the fewest.
E.3: Comparison of Longitudinal Certificate Production Trends.
The data for this comparison come from individual university data found in Report C.4. See the
C.4 data explanation on page 39 for a more detailed description of initial certification production.
E.4: Teacher Retention Comparison.
The data for this comparison includes only those teachers with no prior teaching experience who
obtained a standard certificate in FY 2009, became employed in a Texas public school in AY
2009-2010, and were still teaching in the spring of each academic year. This report should not
be compared with the D.5a report found on page 54 because Report E.4 includes only those
individuals who have a standard certificate. The column labeled Attrition Rate is calculated by
subtracting the 2014 retention rate from 100%.

AcademicYear
TotalPreparation Programs
Angelo State University2004‐2013
Comparison of Teacher Production
Angelo State University Sul Ross State University ‐ Alpine University of Texas ‐ Permian Basin
1,786 508 1,38510‐Year Total 3,679
237 85 2422004 564
234 69 1502005 453
195 76 1482006 419
180 54 1642007 398
180 57 1122008 349
166 45 1362009 347
158 39 1322010 329
148 36 1222011 306
150 32 982012 280
138 15 812013 234
178.6 50.8 138.510‐Year Avg 367.9
0
200
400
600
800
1000
1200
2004 2005 2006 2007 2008 2009 2010 2011 2012 2013
Angelo State University Sul Ross State University ‐ Alpine University of Texas ‐ Permian Basin
Source Data59Page
E.1Teacher Certification Data, TEAPACE 2014
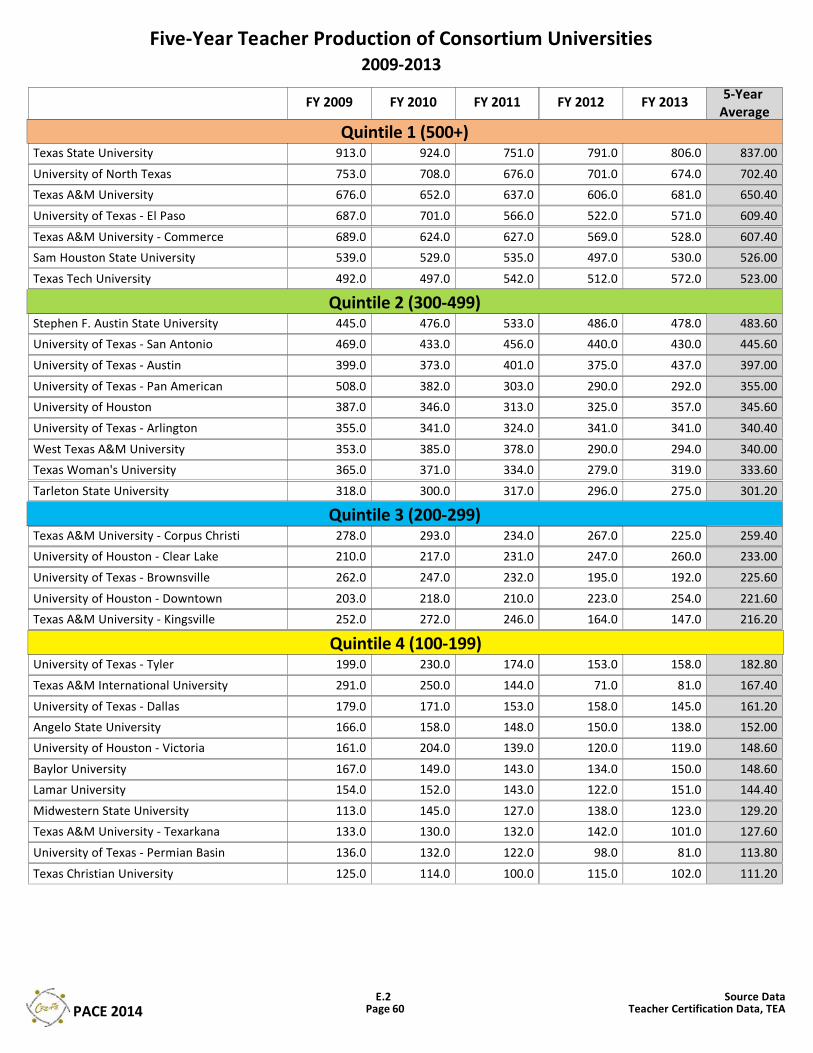
Five‐Year Teacher Production of Consortium Universities2009‐2013
5‐Year Average
FY 2009 FY 2010 FY 2011 FY 2012 FY 2013
Quintile 1 (500+)
Quintile 2 (300‐499)
Quintile 3 (200‐299)
Quintile 4 (100‐199)
Texas State University 913.0 924.0 751.0 791.0 806.0 837.00
University of North Texas 753.0 708.0 676.0 701.0 674.0 702.40
Texas A&M University 676.0 652.0 637.0 606.0 681.0 650.40
University of Texas ‐ El Paso 687.0 701.0 566.0 522.0 571.0 609.40
Texas A&M University ‐ Commerce 689.0 624.0 627.0 569.0 528.0 607.40
Sam Houston State University 539.0 529.0 535.0 497.0 530.0 526.00
Texas Tech University 492.0 497.0 542.0 512.0 572.0 523.00
Stephen F. Austin State University 445.0 476.0 533.0 486.0 478.0 483.60
University of Texas ‐ San Antonio 469.0 433.0 456.0 440.0 430.0 445.60
University of Texas ‐ Austin 399.0 373.0 401.0 375.0 437.0 397.00
University of Texas ‐ Pan American 508.0 382.0 303.0 290.0 292.0 355.00
University of Houston 387.0 346.0 313.0 325.0 357.0 345.60
University of Texas ‐ Arlington 355.0 341.0 324.0 341.0 341.0 340.40
West Texas A&M University 353.0 385.0 378.0 290.0 294.0 340.00
Texas Woman's University 365.0 371.0 334.0 279.0 319.0 333.60
Tarleton State University 318.0 300.0 317.0 296.0 275.0 301.20
Texas A&M University ‐ Corpus Christi 278.0 293.0 234.0 267.0 225.0 259.40
University of Houston ‐ Clear Lake 210.0 217.0 231.0 247.0 260.0 233.00
University of Texas ‐ Brownsville 262.0 247.0 232.0 195.0 192.0 225.60
University of Houston ‐ Downtown 203.0 218.0 210.0 223.0 254.0 221.60
Texas A&M University ‐ Kingsville 252.0 272.0 246.0 164.0 147.0 216.20
University of Texas ‐ Tyler 199.0 230.0 174.0 153.0 158.0 182.80
Texas A&M International University 291.0 250.0 144.0 71.0 81.0 167.40
University of Texas ‐ Dallas 179.0 171.0 153.0 158.0 145.0 161.20
Angelo State University 166.0 158.0 148.0 150.0 138.0 152.00
University of Houston ‐ Victoria 161.0 204.0 139.0 120.0 119.0 148.60
Baylor University 167.0 149.0 143.0 134.0 150.0 148.60
Lamar University 154.0 152.0 143.0 122.0 151.0 144.40
Midwestern State University 113.0 145.0 127.0 138.0 123.0 129.20
Texas A&M University ‐ Texarkana 133.0 130.0 132.0 142.0 101.0 127.60
University of Texas ‐ Permian Basin 136.0 132.0 122.0 98.0 81.0 113.80
Texas Christian University 125.0 114.0 100.0 115.0 102.0 111.20
Source Data60Page
E.2Teacher Certification Data, TEAPACE 2014

Five‐Year Teacher Production of Consortium Universities2009‐2013
5‐Year Average
FY 2009 FY 2010 FY 2011 FY 2012 FY 2013
Quintile 5 (below 99)Lamar State College ‐ Orange 153.0 116.0 105.0 69.0 44.0 97.40
University of Mary Hardin‐Baylor 79.0 86.0 100.0 73.0 68.0 81.20
Abilene Christian University 100.0 95.0 47.0 71.0 72.0 77.00
Prairie View A&M University 88.0 85.0 63.0 39.0 62.0 67.40
Texas Wesleyan University 66.0 58.0 64.0 73.0 67.0 65.60
McMurry University 75.0 83.0 49.0 62.0 51.0 64.00
Texas A&M University ‐ San Antonio 23.0 116.0 173.0 62.40
Sul Ross State University ‐ Rio Grande 105.0 72.0 53.0 37.0 35.0 60.40
University of the Incarnate Word 78.0 66.0 46.0 37.0 50.0 55.40
East Texas Baptist University 45.0 43.0 45.0 47.0 41.0 44.20
Texas Southern University 58.0 38.0 47.0 26.0 44.0 42.60
Houston Baptist University 34.0 37.0 46.0 49.0 47.0 42.60
Our Lady of the Lake University 75.0 48.0 30.0 19.0 24.0 39.20
St. Edward's University 29.0 44.0 33.0 35.0 45.0 37.20
Howard Payne University 39.0 43.0 30.0 35.0 21.0 33.60
Sul Ross State University ‐ Alpine 45.0 39.0 36.0 32.0 15.0 33.40
Texas Lutheran University 36.0 27.0 44.0 26.0 30.0 32.60
St. Mary's University 35.0 27.0 27.0 33.0 28.0 30.00
University of St. Thomas 27.0 24.0 30.0 16.0 26.0 24.60
Schreiner University 22.0 17.0 23.0 20.0 18.0 20.00
Austin College 22.0 22.0 17.0 18.0 18.0 19.40
Texas A&M University ‐ Central Texas 8.0 1.60
Source Data61Page
E.2Teacher Certification Data, TEAPACE 2014

CertificateFiscal Year Fiscal Year Fiscal Year
Comparison of Longitudinal Certificate Production Trends¹FY 2009-2013²
Angelo State University
2009 2010 2011 2012 2013 2009 2010 2011 2012 2013 2009 2010 2011 2012 2013
Angelo State University Sul Ross State University - AlpineUniversity of Texas - Permian Basin
Bilingual Generalist 0 0 0 0 0 1 3 0 3 0ELEMENTARY (EC-4 and EC-6)
7 8 1 0 0Bilingual Other³ 0 0 0 0 0 0 0 0 0 0 0 0 0 0 0ESL Generalist 0 0 0 0 0 0 0 0 0 0 3 1 1 0 0ESL Other⁴ 0 0 0 0 0 0 0 0 0 0 0 1 0 1 0Generalist 87 78 64 78 77 15 10 9 15 10 68 58 62 60 55Other⁵ 0 0 0 0 0 0 0 0 0 0 0 0 0 0 0Subtotal 87 78 64 78 77 16 13 9 18 10 78 68 64 61 55
Bilingual Generalist 0 0 0 0 0 0 0 0 1 0 1 0 0 0 0MIDDLE SCHOOL (4-8)
ESL Generalist 0 0 0 0 0 0 0 0 0 0 0 1 0 1 0ESL Other⁶ 0 0 0 0 0 0 0 0 0 0 0 0 0 0 0Generalist 9 17 27 25 18 0 0 0 0 0 6 15 14 14 14ELA/Reading 0 2 3 4 2 3 5 0 1 2 2 3 2 1 1ELA/Reading/Social Studies 0 0 0 0 1 0 0 0 0 0 2 0 0 0 0Mathematics 5 5 2 5 1 5 0 1 0 0 4 1 1 1 0Mathematics/Science 2 3 0 0 0 0 0 0 0 0 0 0 0 0 0Science 1 2 1 0 0 1 1 0 1 1 1 1 1 0 0Social Studies 1 2 0 0 0 5 1 4 1 0 0 0 0 0 1Subtotal 18 31 33 34 22 14 7 5 4 3 16 21 18 17 16
Career & Technology Education⁷ 0 1 1 1 4 4 5 8 3 0 0 0 4 1 1HIGH SCHOOL (6-12, 7-12 and 8-12)
Chemistry 1 1 0 1 0 0 0 0 0 0 0 0 0 0 0Computer Science 0 0 0 0 0 0 0 0 0 0 0 0 0 0 0Dance 0 0 0 0 0 0 0 0 0 0 0 0 0 0 0ELA/Reading 9 9 9 8 12 3 4 1 2 2 8 7 7 5 8History 4 6 5 2 5 0 1 3 2 0 9 10 9 8 6Journalism 0 1 1 0 0 0 0 0 0 0 0 1 0 0 0Life Sciences 5 9 7 2 3 3 0 1 1 0 4 5 2 5 4Mathematics 7 5 9 10 7 3 2 1 0 1 6 6 5 6 7Mathematics/Physical Sc/Enginee 0 0 1 0 0 1 0 0 0 0 1 0 0 0 0Physical Science 0 0 0 0 0 0 0 0 0 0 0 0 0 0 0Physics 0 0 0 0 0 0 0 0 0 0 0 0 0 0 0Physics/Mathematics 0 1 0 0 0 0 0 0 0 0 0 0 0 0 0Science 0 0 0 0 0 3 2 3 1 0 3 3 3 1 1Secondary French 0 0 0 0 0 0 0 0 0 0 0 0 0 0 0Secondary German 0 0 0 0 0 0 0 0 0 0 0 0 0 0 0Secondary Latin 0 0 0 0 0 0 0 0 0 0 0 0 0 0 0Secondary Spanish 6 2 3 0 0 1 3 0 0 0 6 8 7 0 0Social Studies 3 2 2 1 2 2 4 1 1 2 2 6 3 1 1Speech 5 7 2 1 2 0 0 0 0 1 1 0 2 1 0Technology Applications 0 0 0 0 0 0 0 0 0 0 0 0 0 0 0Subtotal 40 44 40 26 35 20 21 18 10 6 40 46 42 28 28
American Sign Language 0 0 0 0 0 0 0 0 0 0 0 0 0 0 0ALL LEVEL (EC-12 and PK-12)
Fine Arts⁸ 7 11 9 7 12 3 4 5 2 3 8 9 6 5 2Health and Phy Education 27 17 11 14 3 7 12 7 4 4 11 11 5 5 5LOTE - French 0 0 0 0 0 0 0 0 0 0 0 0 0 0 0LOTE - German 0 0 0 0 0 0 0 0 0 0 0 0 0 0 0LOTE - Latin 0 0 0 0 0 0 0 0 0 0 0 0 0 0 0LOTE - Spanish 0 0 1 1 4 0 1 0 3 1 0 0 0 1 7Special Education⁹ 16 13 13 27 33 0 0 0 0 0 15 14 9 6 9Technology Applications 0 0 0 0 0 0 0 0 0 0 0 0 0 0 0Subtotal 50 41 34 49 52 10 17 12 9 8 34 34 20 17 23
Bilingual 0 0 0 0 0 0 0 0 0 0 0 7 7 2 3SUPPLEMENTALS
ESL 1 1 0 0 0 0 0 0 0 0 15 7 5 6 5Gifted/Talented 0 0 0 0 0 0 0 0 0 0 0 0 0 0 0Special Education⁹ 0 1 0 0 0 0 0 0 0 0 0 0 2 0 1Subtotal 1 2 0 0 0 0 0 0 0 0 15 14 14 8 91 Individual candidates may receive multiple certificates.2 Certificate year equals fiscal year (Sept. 1 ‐ Aug. 31).3 Includes all other elementary bilingual ESL and bilingual certificates.4 Includes all other elementary ESL certificates.5 Includes all other 1‐6, 1‐8, and PK‐6 self contained certificates no longer issued.6 Includes all other 4‐8 and 6‐12 ESL certificates.
7 Includes technology education, family and consumer sciences composite, human development and family studies, hospitality, nutrition, and food sciences, agriculture, science, and technology, business education, marketing education, health science technology education, trade and industrial education, career and technical education.8 Includes certificates issued in art, music, theatre.9 Includes certificates issued in special education, deaf and hard of hearing and teacher of students with visual impairment.
Source Data62Page
E.3Teacher Certification Files, TEAPACE 2014

Percent Retained in Spring of Academic Year AttritionRate
Preparation Program Name
1
Angelo State University
2010‐2014
Teacher Retention ComparisonFive‐Year Retention Rates for the Certification Cohort of 2009
2010 2011 2012 2013 2014
Percen
t Retaine
d
0
10
20
30
40
50
60
70
80
90
100
2010 2011 2012 2013 2014
Angelo State University Sul Ross State University ‐ Alpine University of Texas ‐ Permian Basin
100.0 90.1 81.3Angelo State University 74.7 72.5 27.5
100.0 100.0 100.0Sul Ross State University - Alpine 100.0 90.0 10.0
100.0 95.3 89.1University of Texas - Permian Basin 82.8 71.9 28.11 Includes only teachers obtaining certification in FY 2009, becoming employed in AY 2010 with no teaching experience prior to 2010.
Source Data63Page
E.4Teacher Certification and Assignment Files, TEAPACE 2014

64
PERFORMANCE ANALYSIS for COLLEGES of EDUCATION
Changes Made to the 2014 PACE Reports
Data Sets Used in the PACE Report: Addition of Texas Academic Performance Reports
(TAPR) to data set list (page 5).
Section A: Descriptive Reports on the Characteristics of Public Schools in the Proximal
Zone of Professional Impact.
A.1: A definition was added for the following: English language learner (page 7).
A.3: An explanation of the new campus accountability rating system was added (page 8).
Section B: Educational Trend Reports on Public Schools in the Proximal Zone of
Professional Impact.
B.2.a-b: Retired.
B.2.c: Retired and replaced by STAAR reports B.2 through B.4. This series of reports
reflect STAAR academic performance for 2012 and 2013 by campus level and ethnicity
(pages 16-32).
B.2.d: Retired and replaced by STARR reports B.5.1-B.5. This series of reports ranks the
25 highest and lowest achieving campuses by STAAR results on core academic subjects.
Data Corrections and Data Requests
The 2014 PACE Report is intended for use by various educational stakeholders. The data
presented should be validated by each individual university. Depending on each university’s
particular need, CREATE offers the additional support and technical assistance described on
page 6 of this report.
All inquiries regarding PACE and information about obtaining the customized data should be
forwarded to:
Sherri Lowrey
CREATE Associate Director of Research
936-273-7661 [email protected]

Mona S. Wineburg Executive Director
Jeanette Narvaez
Director of Operations & Research Dissemination
Sherri Lowrey
Associate Director of Research
John Beck
Higher Education Research Liaison
Robert Cox
Higher Education Research Liaison
Paula Hart Administrative Assistant
Nancy Olson
Administrative Secretary
Center for Research, Evaluation & Advancement of Teacher Education 3232 College Park Drive, Suite 303
The Woodlands, TX 77384 www.createtx.org