angels and venture capitalists: complements or substitutes?cepr.org/sites/default/files/hellmann...
TRANSCRIPT

Angels and Venture Capitalists:
Complements or Substitutes?
Thomas Hellmann (UBC Sauder and NBER)Paul Schure (UVIC Economics)
Dan Vo (UVIC Economics)

Broad objectives
• Examine interaction between angels and VCs
• Examine angel heterogeneity
• Explore implications for start-up performance
Central research question
•Are Angels and VCs complements or substitutes?▫Choice of investors over timeHow do prior investor type choices affect
subsequent investor type choices?▫Performance implications of
investor choices
Angel – VC Relationships
•“[VCs are] stupid, insufferable, arrogant, (… they) don't know how to build communities or good products, and they don't back start-ups early enough.”▫ Dave McClure (Super-angel)
“When angels invest that brings
credibility to the company, making it
easier for venture capitalists to invest”
▫ From a BC angel
Theoretical Considerations (1): Dynamic financing pattern
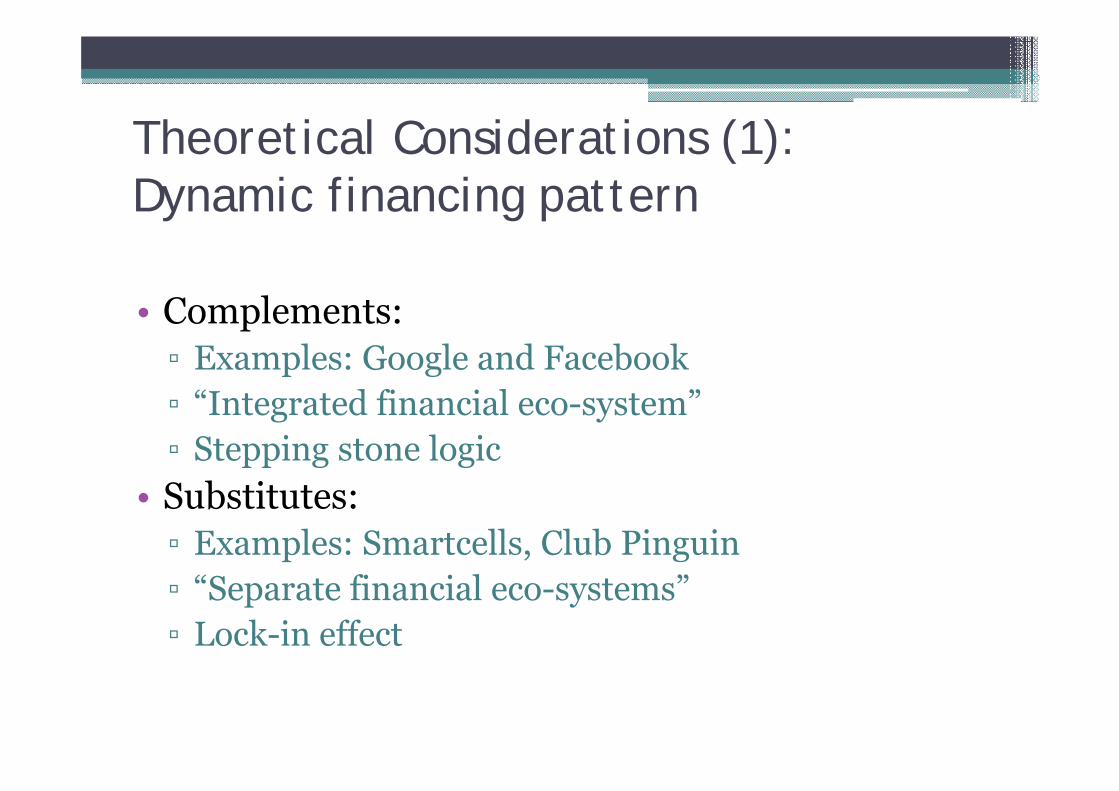
• Complements: ▫ Examples: Google and Facebook▫ “Integrated financial eco-system”▫ Stepping stone logic
• Substitutes:▫ Examples: Smartcells, Club Pinguin▫ “Separate financial eco-systems”▫ Lock-in effect
Theoretical Considerations (2):Reasons for substitute / complements
• Investor-led▫ Investors create integration/separation▫ Treatment effect logic
• Company-led▫ Companies self-select into investor types▫ Selection effect logic
• Both important▫ Slightly different implications
Theoretical considerations (3): Performance implications
• Complements hypothesis▫ Supermodular production function▫ Benefits of diversity
• Substitutes hypothesis▫ Submodular production function▫ Benefits of investor homogeneity
• Super/Submodularity could come from company selection or investor treatment effects▫ Identification challenges: see Athey & Stern (1998),
Cassiman & Veuglers (2006)
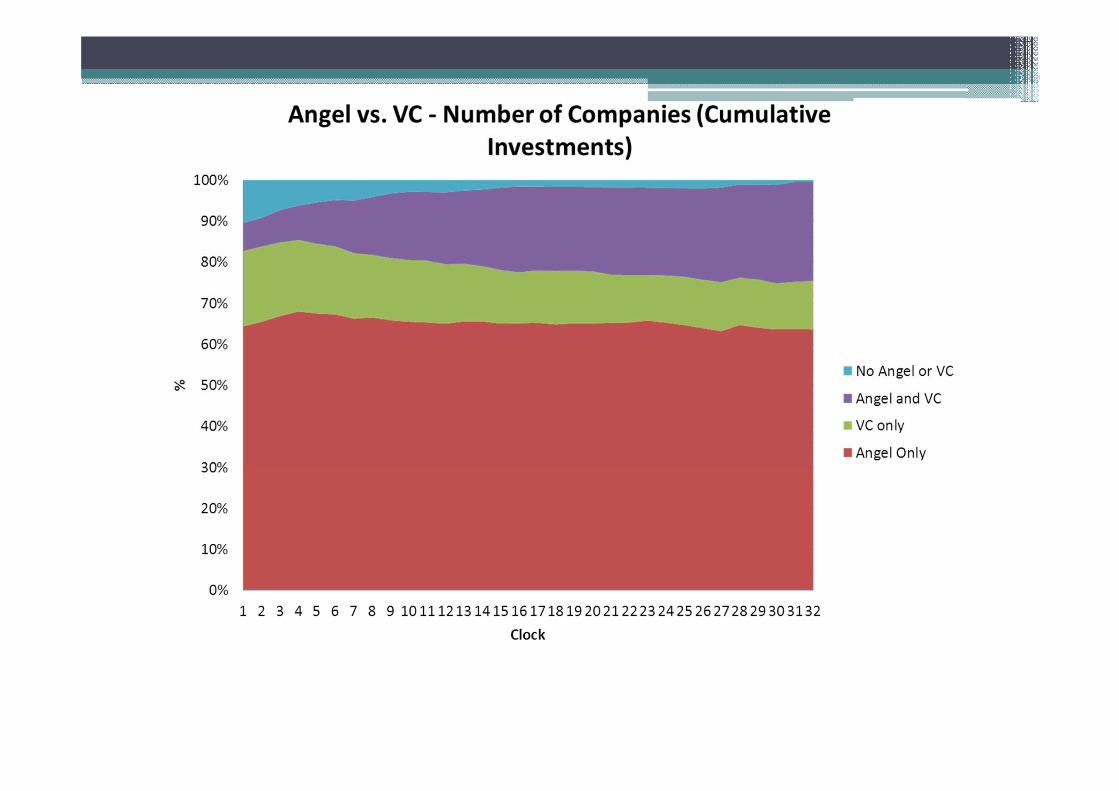
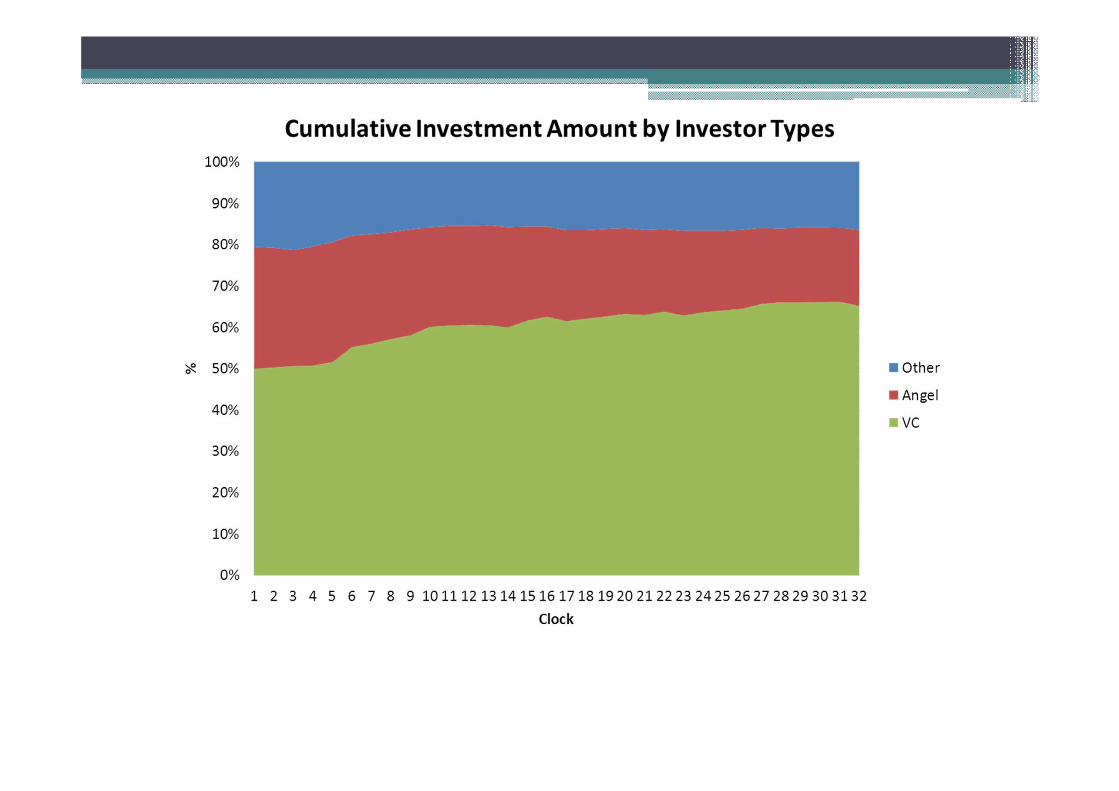
Our Main Findings• Angels and VCs are dynamic substitutes▫ Substitutes stronger for VC=>Angel than Angel=>VC VC => Angel driven by a selection effect Angel =>VC driven by a treatment effect
▫ Substitutes stronger for one-company angels▫ Strong within-type persistence Driven by selection effects
• VCs associated with better performance▫ Simple angels have lowest exit rate▫ Tentative: negative interaction effects angel and VC
funding (“performance substitutes”)▫ Performance effects largely driven by selection
Literature• Goldfarb, Hoberg, Kirsch, and Triantis (2012) ▫ “Brobeck” data of VC & angel syndicates ▫ VCs have more aggressive control rights▫ Mixing angels & VCs bad for performance Driven by split decision rights
• Kerr, Lerner and Schoar (2013)▫ Data on 2 angel groups▫ Regression discontinuity approach▫ Getting angel financing good for companies
• Nascent angel literature ▫ Theory: Chemmanur and Chen (2006), Schure (2006),
Schwienbacher (2009)▫ Empirical: Mason and Harrison (2002), Shane (2008)
Friends or Foes?The Interrelationship between
Angel and Venture Capital Markets
by Hellmann and Thiele(2013)
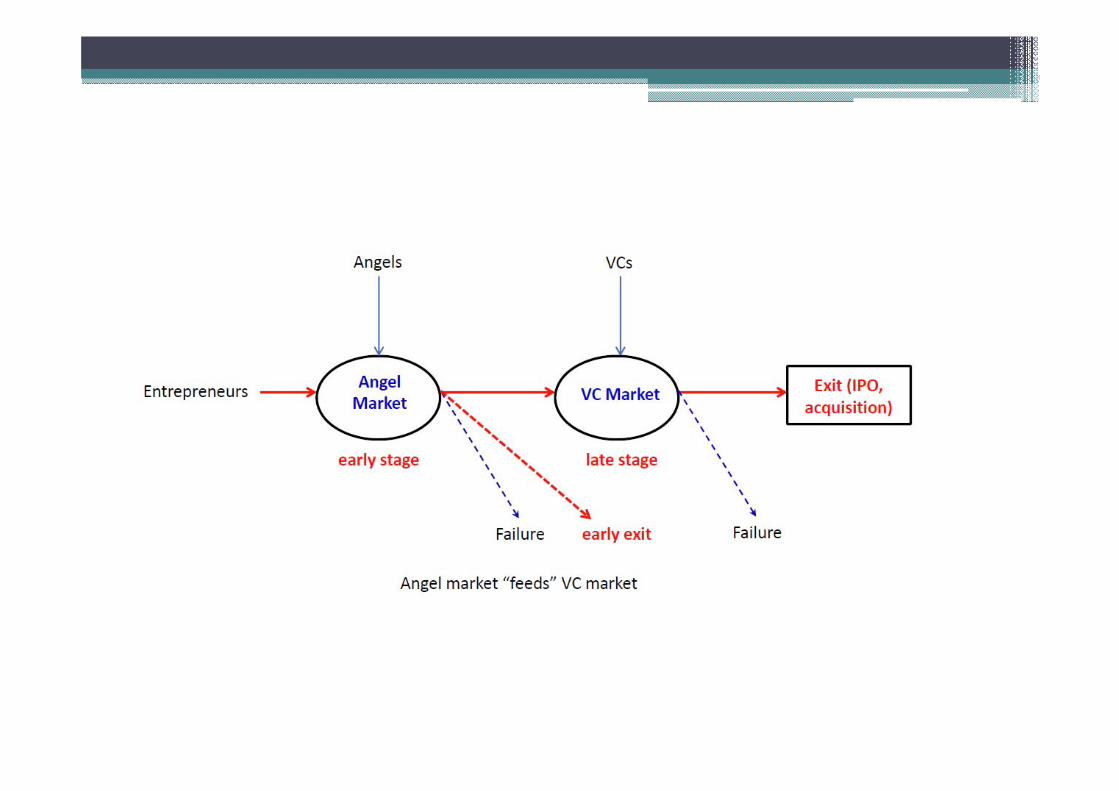
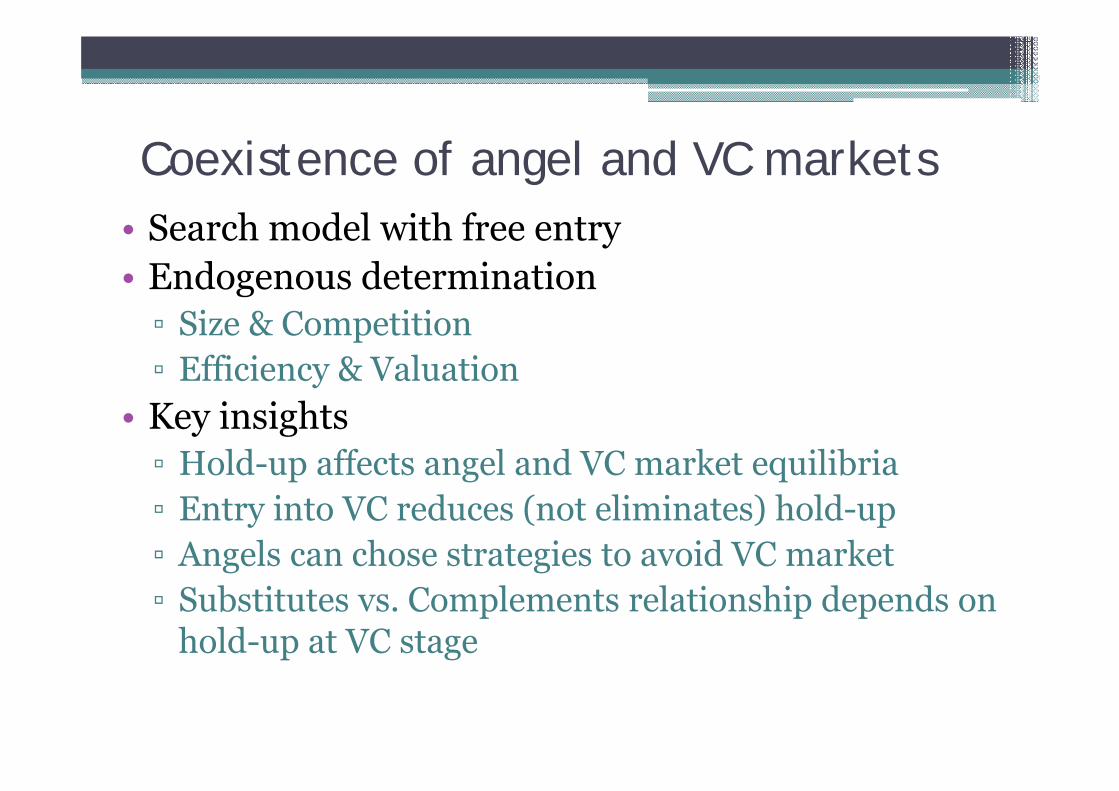
Coexistence of angel and VC markets• Search model with free entry• Endogenous determination▫ Size & Competition▫ Efficiency & Valuation
• Key insights ▫ Hold-up affects angel and VC market equilibria▫ Entry into VC reduces (not eliminates) hold-up▫ Angels can chose strategies to avoid VC market▫ Substitutes vs. Complements relationship depends on
hold-up at VC stage

Special thanks to the Investment Capital Branch of the Government of the Province of British Columbia
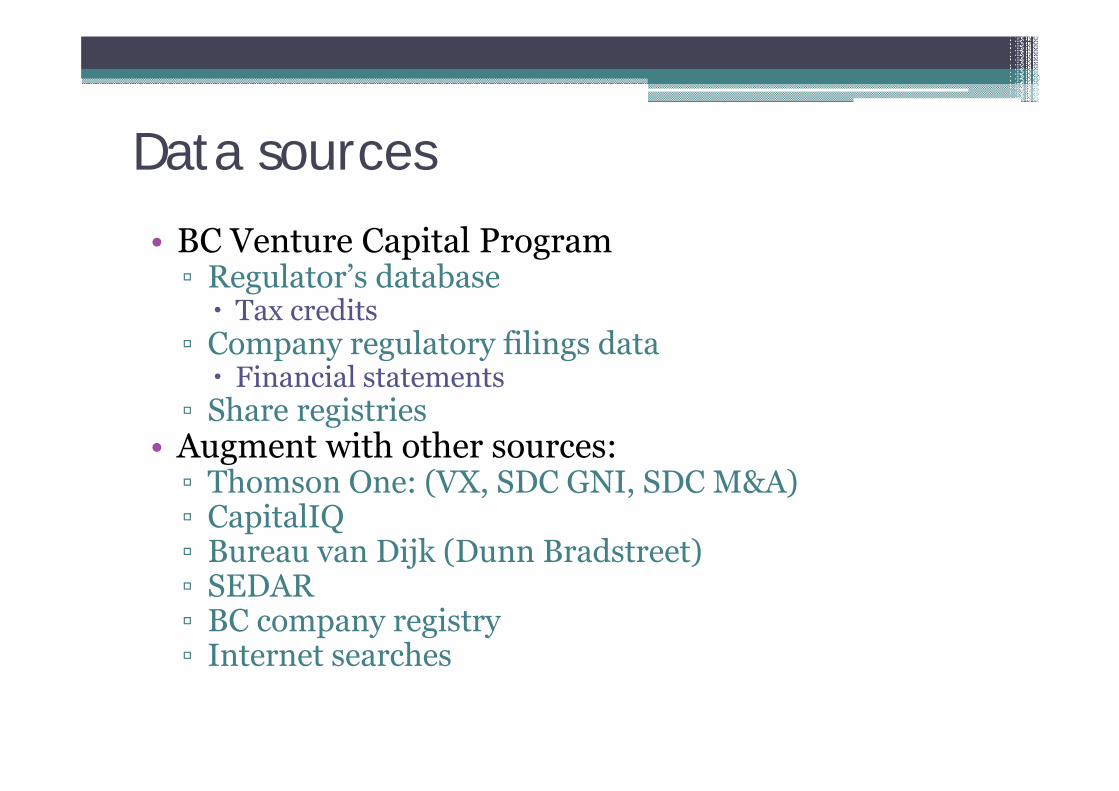
Data sources
• BC Venture Capital Program▫ Regulator’s database Tax credits
▫ Company regulatory filings data Financial statements
▫ Share registries• Augment with other sources:▫ Thomson One: (VX, SDC GNI, SDC M&A)▫ CapitalIQ▫ Bureau van Dijk (Dunn Bradstreet)▫ SEDAR▫ BC company registry▫ Internet searches
Data quality• Strengths:▫ Rare data▫ Rich data▫ Precise data▫ Near comprehensive data
• Weaknesses:▫ Huge data processing▫ Still want more data▫ Imperfect instrument▫ External validity
Company sample• Must have received funding under tax credit program• Sample period: ▫ Funding: 1995 Q1 – 2009 Q1▫ Exits up to 2012Q4
• Number of observations▫ 469 companies▫ 6815 company – quarter observations with financing
• Average company age:▫ …at first financing: 2.4 years▫ …at last financing: 6.2 years▫ … at exit / end of sample: 10.2 years
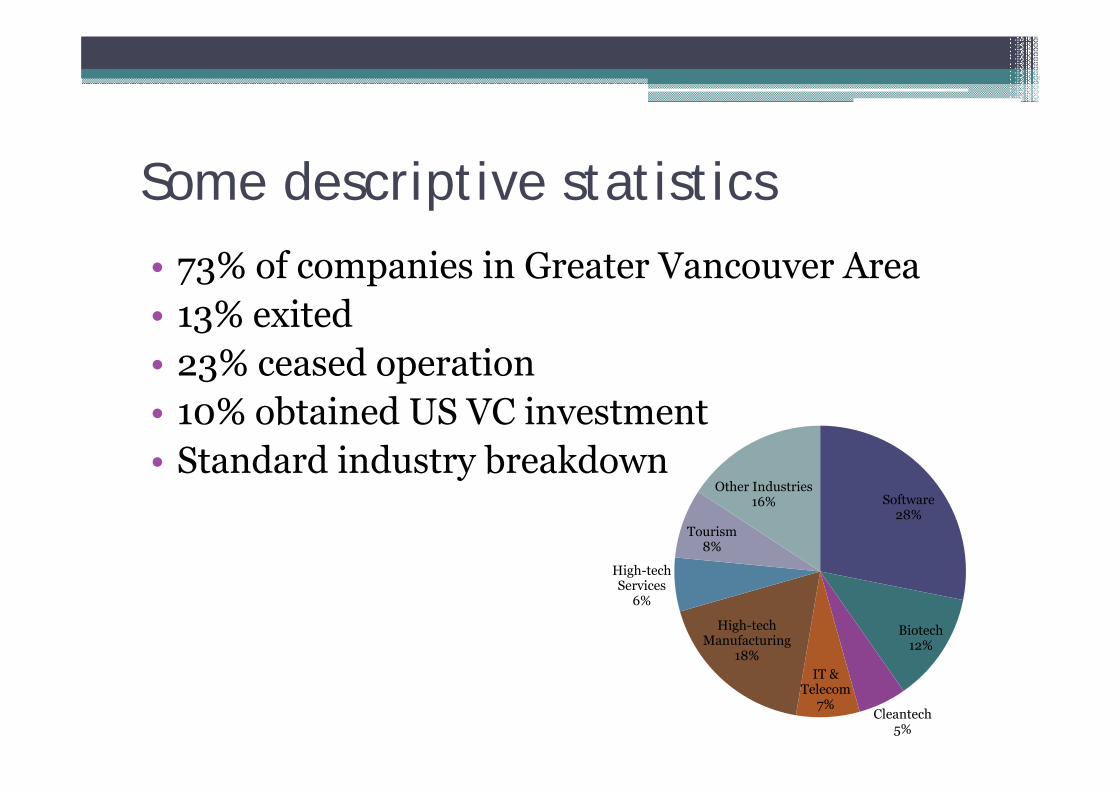
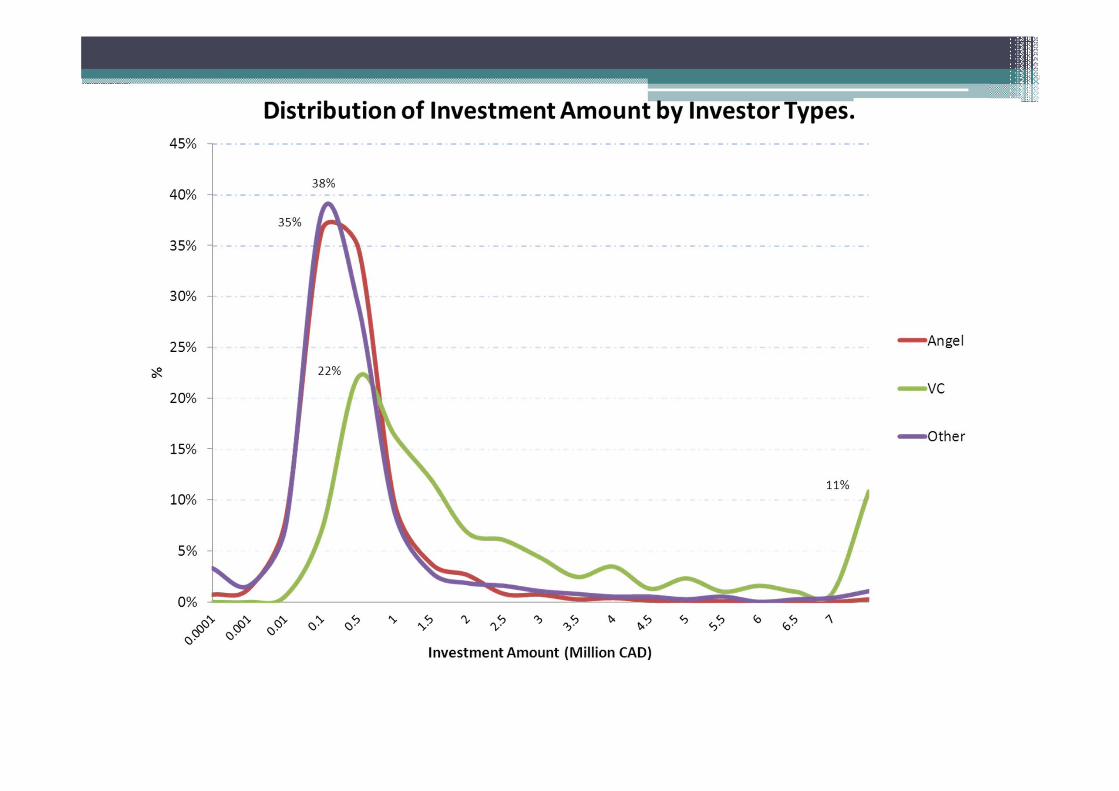
Some descriptive statistics• 73% of companies in Greater Vancouver Area• 13% exited• 23% ceased operation• 10% obtained US VC investment• Standard industry breakdown
Software28%
Biotech12%
Cleantech5%
IT & Telecom
7%
High-tech Manufacturing
18%
High-tech Services
6%
Tourism8%
Other Industries16%
Definitions: Angels and VCs• Many informal characterizations untenable▫ Small vs. large, active vs. passive, nice vs. nasty, …
• Key distinction: intermediated or not?▫ VC invest other’s money: GP-LP structure▫ Angels invest own money
• Grey zone: angel funds▫ Individuals, but some intermediation
• Angels vs. “family & friends”▫ Family: objective definition, partially observable▫ Friends: subjective definition, unobservable

Investor data sources• Share registries▫ Detailed and accurate▫ Available for 49% of companies 38% of all financing quarters
• Tax credit database▫ Accurate for all tax credit investments▫ Misses all non-tax-credit investments
• Venture Expert▫ Decent coverage, but not perfect▫ Mostly contains venture capital investments
Are all angels alike?• Simple angels▫ Single company investors ▫ Friends and acquaintances
• Sophisticated angels▫ Repeat investors▫ Professional angels (“Super angels”)▫ Family offices & Individual’s funds
• Angel funds▫ Syndication with stable set of private investors▫ Spectrum of informal to formal
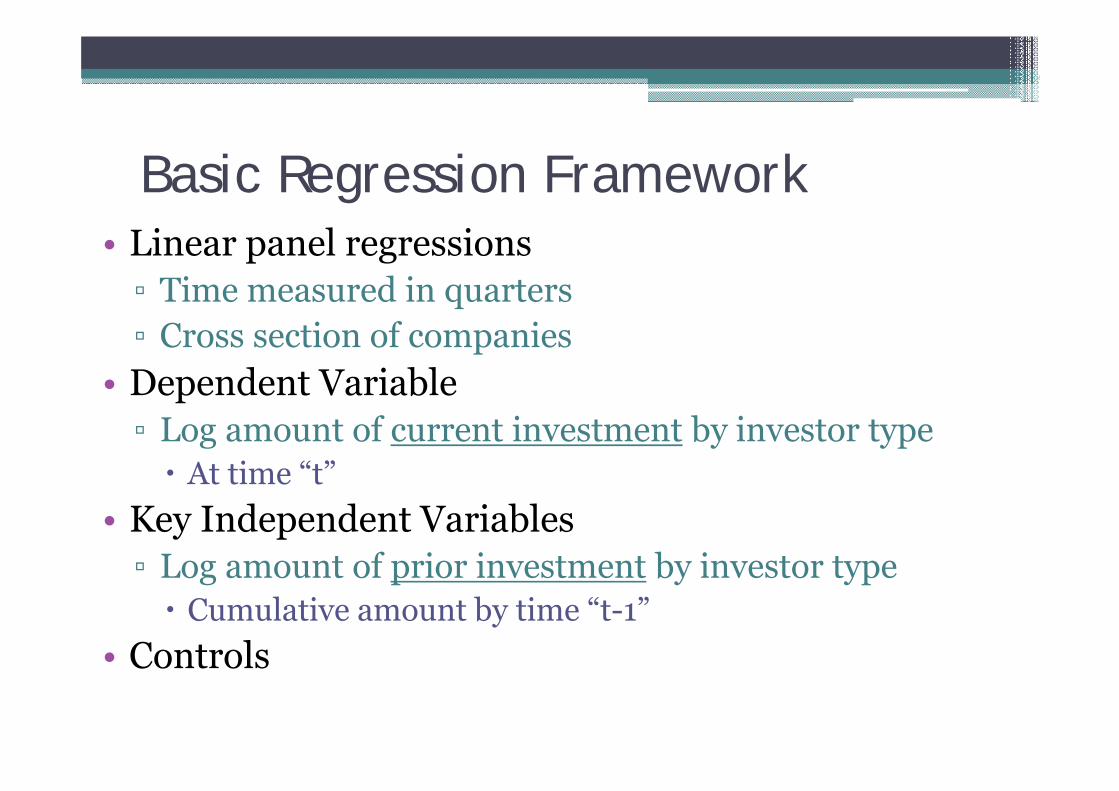
Basic Regression Framework• Linear panel regressions ▫ Time measured in quarters▫ Cross section of companies
• Dependent Variable ▫ Log amount of current investment by investor type At time “t”
• Key Independent Variables▫ Log amount of prior investment by investor type Cumulative amount by time “t-1”
• Controls
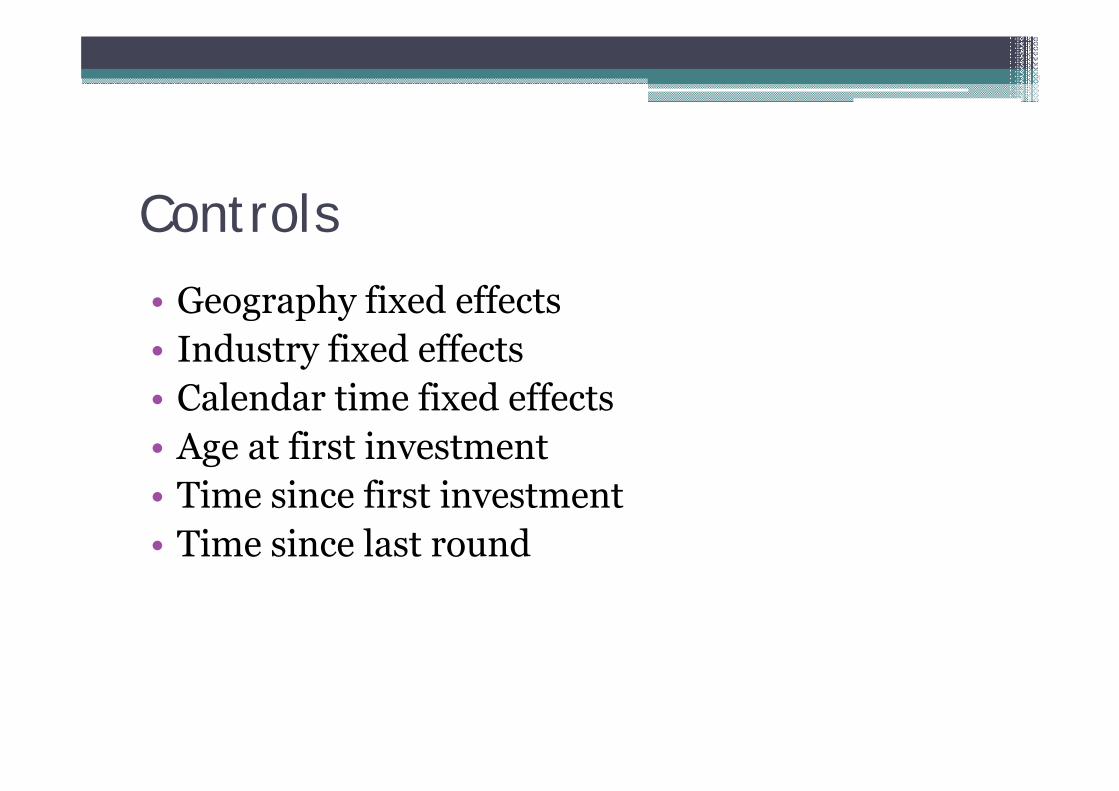
Controls
• Geography fixed effects• Industry fixed effects• Calendar time fixed effects• Age at first investment• Time since first investment• Time since last round
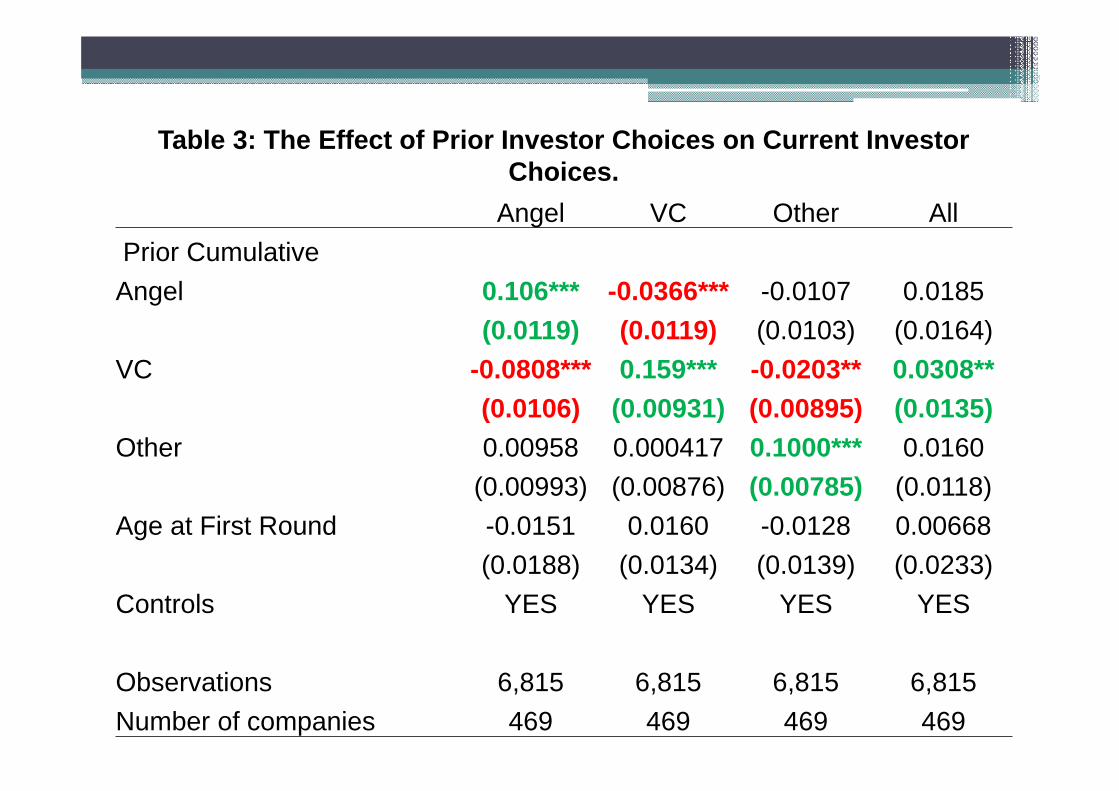
Table 3: The Effect of Prior Investor Choices on Current Investor Choices.
Angel VC Other AllPrior Cumulative Angel 0.106*** -0.0366*** -0.0107 0.0185
(0.0119) (0.0119) (0.0103) (0.0164)VC -0.0808*** 0.159*** -0.0203** 0.0308**
(0.0106) (0.00931) (0.00895) (0.0135)Other 0.00958 0.000417 0.1000*** 0.0160
(0.00993) (0.00876) (0.00785) (0.0118)Age at First Round -0.0151 0.0160 -0.0128 0.00668
(0.0188) (0.0134) (0.0139) (0.0233)Controls YES YES YES YES
Observations 6,815 6,815 6,815 6,815Number of companies 469 469 469 469
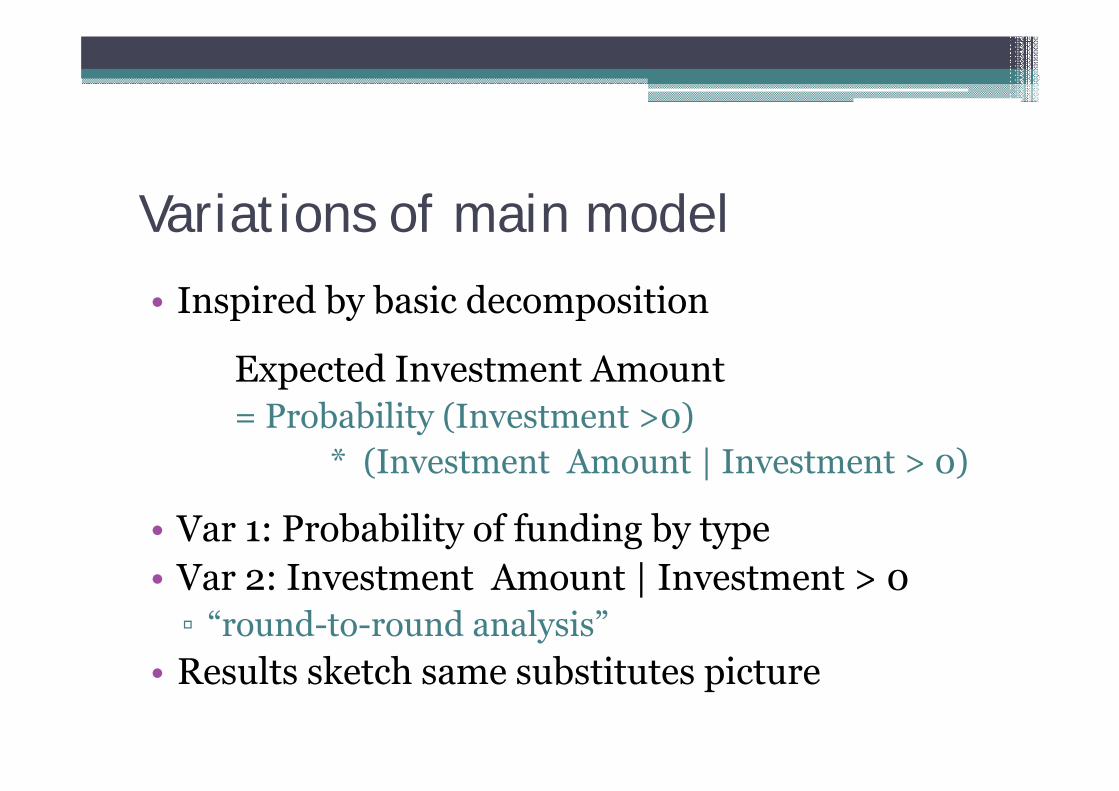
Variations of main model
• Inspired by basic decomposition
Expected Investment Amount = Probability (Investment >0)
* (Investment Amount | Investment > 0)
• Var 1: Probability of funding by type• Var 2: Investment Amount | Investment > 0▫ “round-to-round analysis”
• Results sketch same substitutes picture

Table 4A: Probability (Investment > 0)
Angel VC Other Any Investment
Prior Cumulative
Angel 0.00694*** -0.00221*** -0.000985 0.00110
(0.000848) (0.000719) (0.000732) (0.00105)
VC -0.00644*** 0.00981*** -0.00201*** 5.99e-05
(0.000771) (0.000569) (0.000639) (0.000893)
Other 0.000449 -5.63e-05 0.00716*** 0.000702
(0.000724) (0.000540) (0.000561) (0.000802)
Controls YES YES YES YES
Observations 6,815 6,815 6,815 6,815Number of companies 469 469 469 469
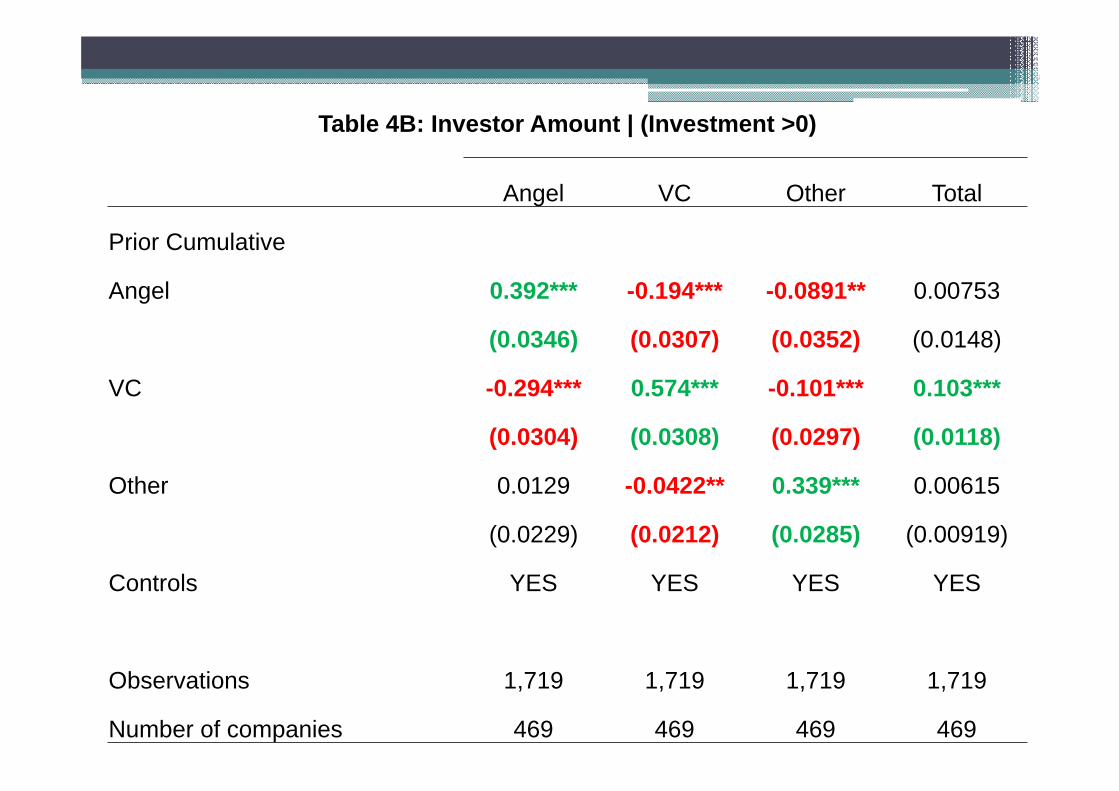
Table 4B: Investor Amount | (Investment >0)
Angel VC Other Total
Prior Cumulative
Angel 0.392*** -0.194*** -0.0891** 0.00753
(0.0346) (0.0307) (0.0352) (0.0148)
VC -0.294*** 0.574*** -0.101*** 0.103***
(0.0304) (0.0308) (0.0297) (0.0118)
Other 0.0129 -0.0422** 0.339*** 0.00615
(0.0229) (0.0212) (0.0285) (0.00919)
Controls YES YES YES YES
Observations 1,719 1,719 1,719 1,719
Number of companies 469 469 469 469
Endogeneity• Treatment: ▫ Prior investor actions cause current investor
choices• Selection / Unobserved heterogeneity▫ Unobserved company characteristics (“company
needs”) are driving correlation current and prior investor choices
• Both effects interesting• Approach 1: Company fixed effects▫ Takes out all time-invariant unobserved
heterogeneity

Table 6: Company Fixed Effect Regressions
Angel VC Other Total
Prior Cumulative
Angel -0.0372 -0.0409* -0.0552* -0.0673
(0.0457) (0.0209) (0.0306) (0.0523)
VC -0.110*** 0.0163 -0.0400* -0.0660*
(0.0276) (0.0235) (0.0225) (0.0347)
Other -0.00655 -0.000309 -0.0890*** -0.00561
(0.0304) (0.0239) (0.0254) (0.0400)
Controls YES YES YES YES
Observations 6,815 6,815 6,815 6,815
Number of companies 469 469 469 469
R-squared 0.101 0.074 0.048 0.113
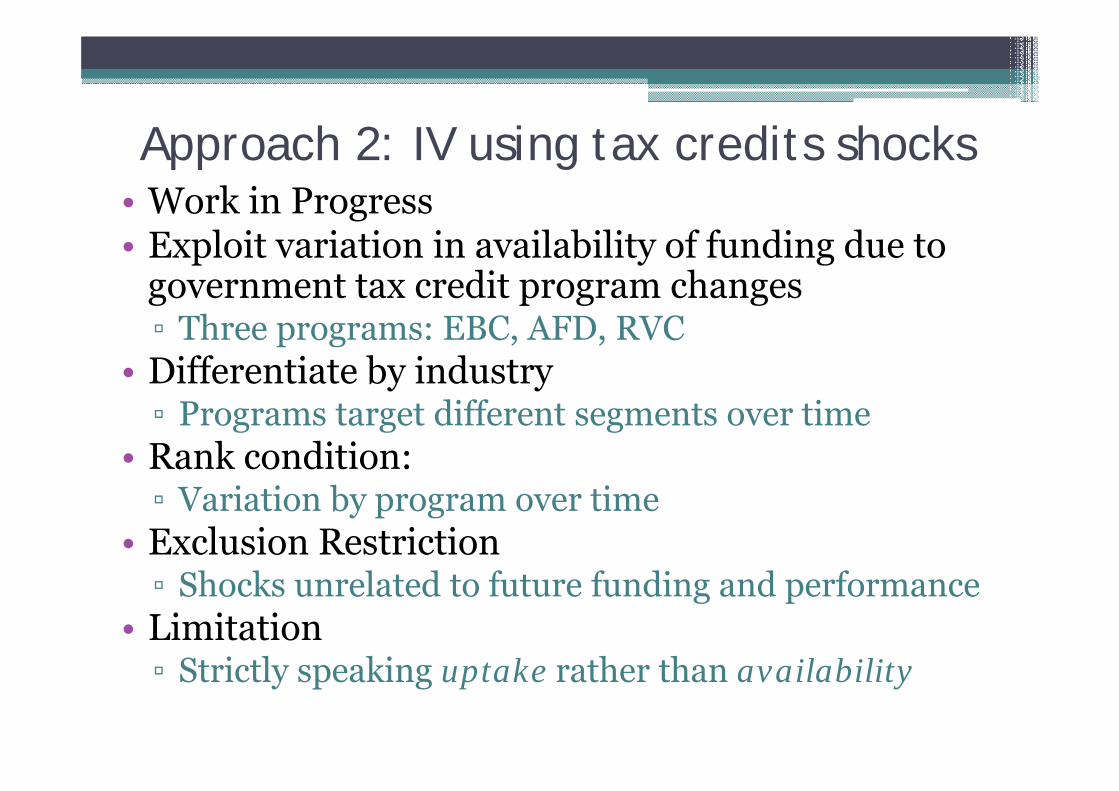
Approach 2: IV using tax credits shocks• Work in Progress• Exploit variation in availability of funding due to
government tax credit program changes▫ Three programs: EBC, AFD, RVC
• Differentiate by industry▫ Programs target different segments over time
• Rank condition: ▫ Variation by program over time
• Exclusion Restriction▫ Shocks unrelated to future funding and performance
• Limitation▫ Strictly speaking uptake rather than availability
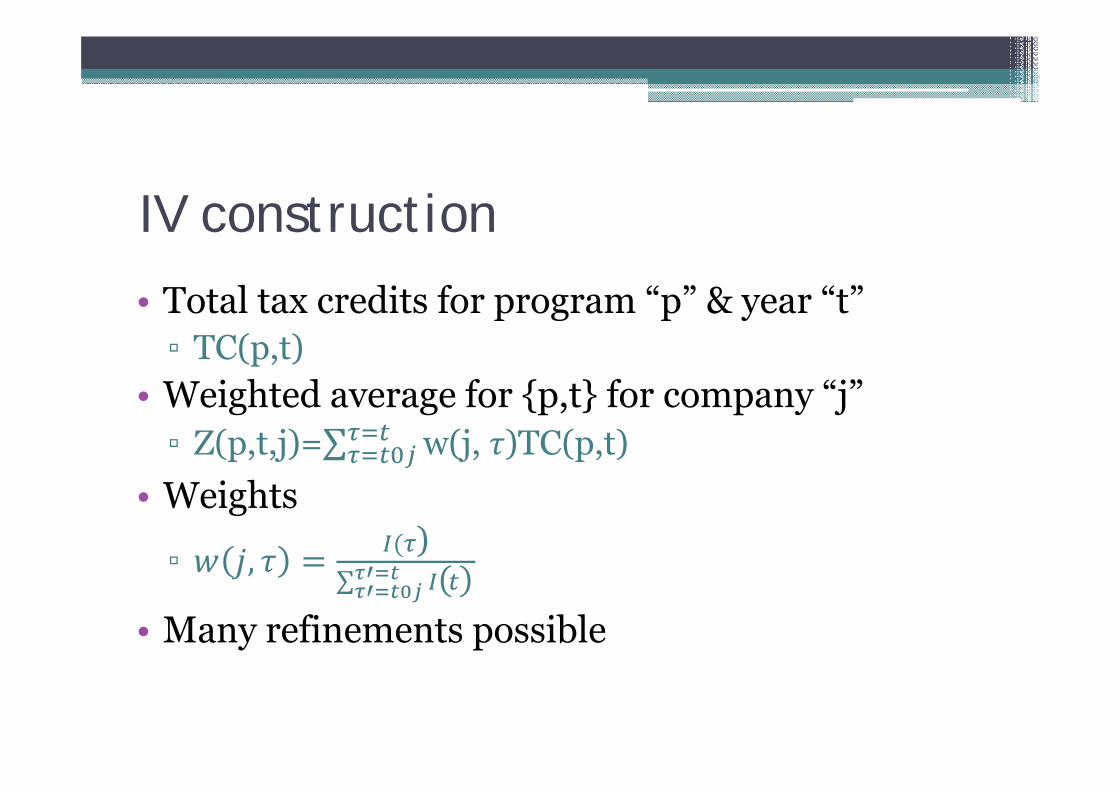
IV construction
• Total tax credits for program “p” & year “t” ▫ TC(p,t)
• Weighted average for {p,t} for company “j”▫ Z(p,t,j)= w(j, )TC(p,t)
• Weights
▫ ( )∑ • Many refinements possible
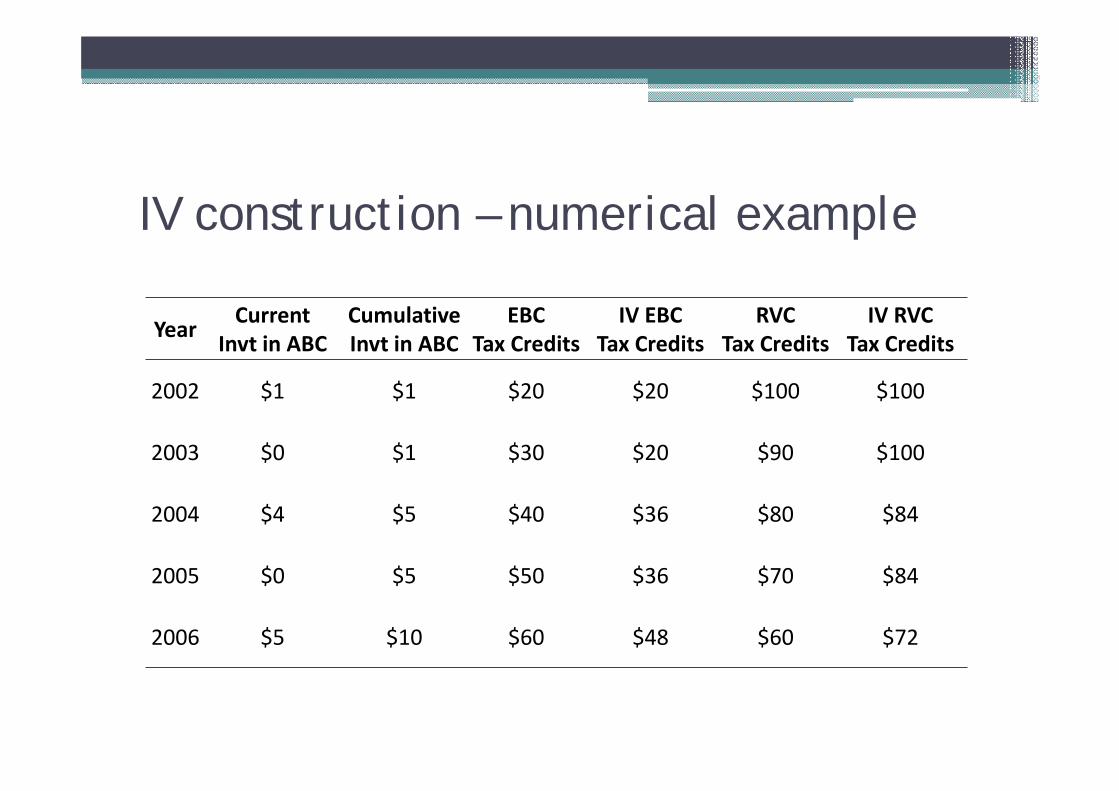
IV construction – numerical example
Year Current Invt in ABC
Cumulative Invt in ABC
EBC Tax Credits
IV EBC Tax Credits
RVC Tax Credits
IV RVC Tax Credits
2002 $1 $1 $20 $20 $100 $100
2003 $0 $1 $30 $20 $90 $100
2004 $4 $5 $40 $36 $80 $84
2005 $0 $5 $50 $36 $70 $84
2006 $5 $10 $60 $48 $60 $72
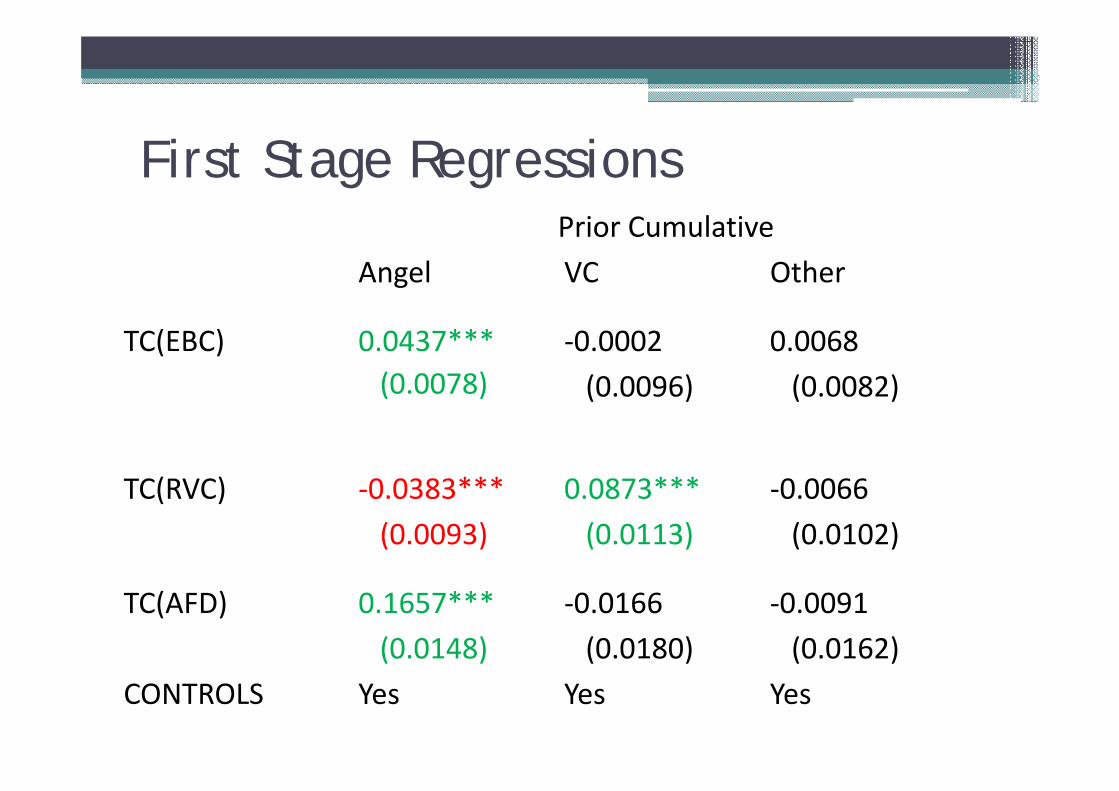
First Stage RegressionsPrior Cumulative
Angel VC Other
TC(EBC) 0.0437*** ‐0.0002 0.0068(0.0078) (0.0096) (0.0082)
TC(RVC) ‐0.0383*** 0.0873*** ‐0.0066(0.0093) (0.0113) (0.0102)
TC(AFD) 0.1657*** ‐0.0166 ‐0.0091(0.0148) (0.0180) (0.0162)
CONTROLS Yes Yes Yes
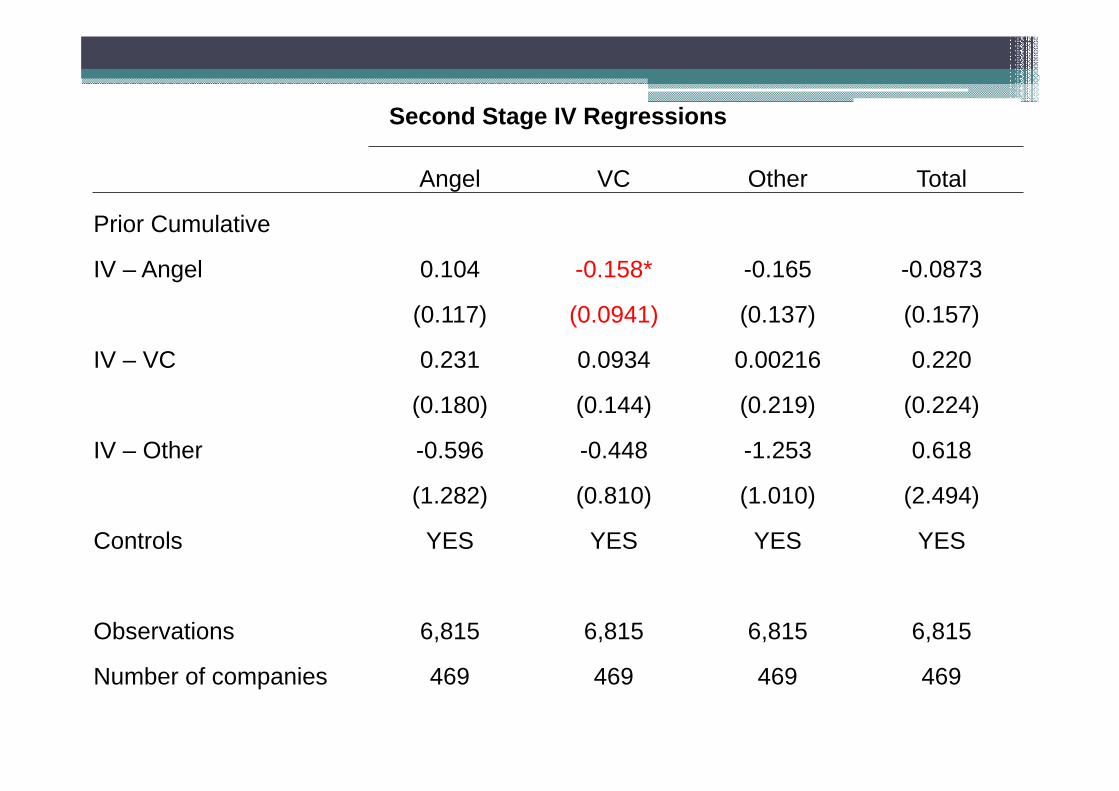
Second Stage IV Regressions
Angel VC Other Total
Prior Cumulative
IV – Angel 0.104 -0.158* -0.165 -0.0873
(0.117) (0.0941) (0.137) (0.157)
IV – VC 0.231 0.0934 0.00216 0.220
(0.180) (0.144) (0.219) (0.224)
IV – Other -0.596 -0.448 -1.253 0.618
(1.282) (0.810) (1.010) (2.494)
Controls YES YES YES YES
Observations 6,815 6,815 6,815 6,815
Number of companies 469 469 469 469
Decomposing Angel Investors• Single Company Angel▫ Angel invests in only one company May invest in several rounds
▫ No indication of commitment to angel investing• Multiple Company Angel▫ Angel invests in more than one company▫ Some indication of commitment to angel investing
• Angel Fund▫ Investment vehicle owned by multiple angels
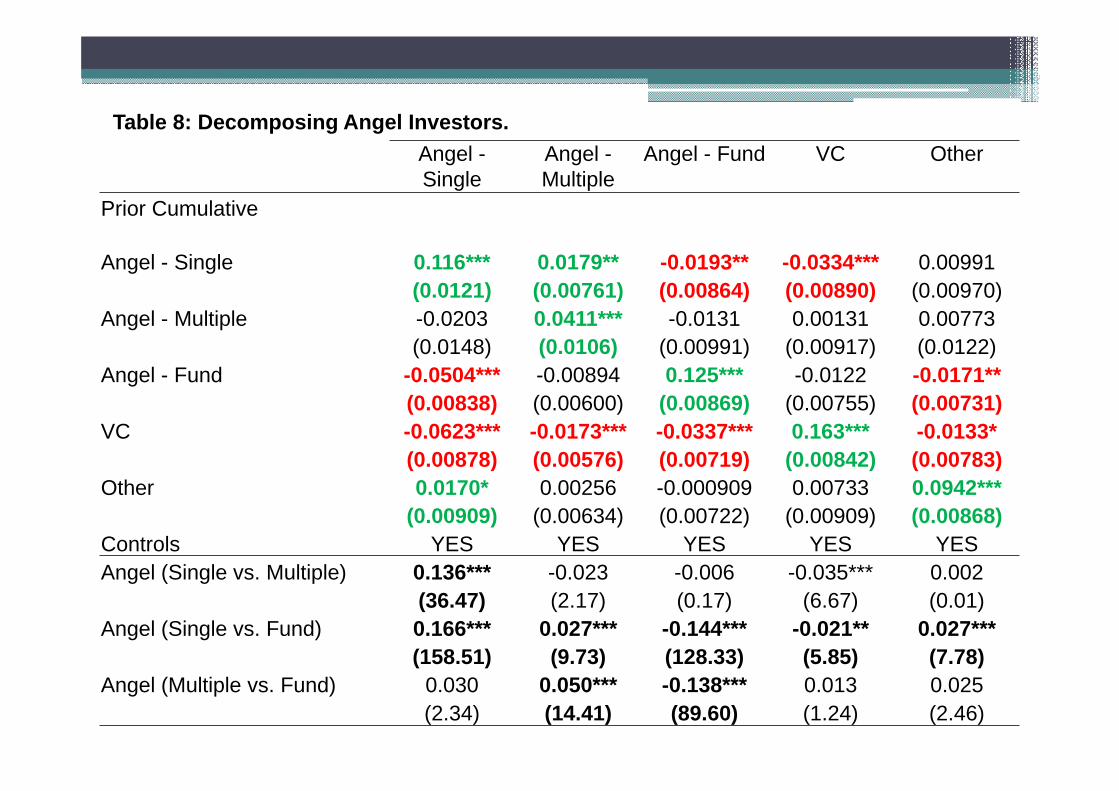
Table 8: Decomposing Angel Investors.Angel -Single
Angel -Multiple
Angel - Fund VC Other
Prior Cumulative
Angel - Single 0.116*** 0.0179** -0.0193** -0.0334*** 0.00991(0.0121) (0.00761) (0.00864) (0.00890) (0.00970)
Angel - Multiple -0.0203 0.0411*** -0.0131 0.00131 0.00773(0.0148) (0.0106) (0.00991) (0.00917) (0.0122)
Angel - Fund -0.0504*** -0.00894 0.125*** -0.0122 -0.0171**(0.00838) (0.00600) (0.00869) (0.00755) (0.00731)
VC -0.0623*** -0.0173*** -0.0337*** 0.163*** -0.0133*(0.00878) (0.00576) (0.00719) (0.00842) (0.00783)
Other 0.0170* 0.00256 -0.000909 0.00733 0.0942***(0.00909) (0.00634) (0.00722) (0.00909) (0.00868)
Controls YES YES YES YES YESAngel (Single vs. Multiple) 0.136*** -0.023 -0.006 -0.035*** 0.002
(36.47) (2.17) (0.17) (6.67) (0.01)Angel (Single vs. Fund) 0.166*** 0.027*** -0.144*** -0.021** 0.027***
(158.51) (9.73) (128.33) (5.85) (7.78)Angel (Multiple vs. Fund) 0.030 0.050*** -0.138*** 0.013 0.025
(2.34) (14.41) (89.60) (1.24) (2.46)
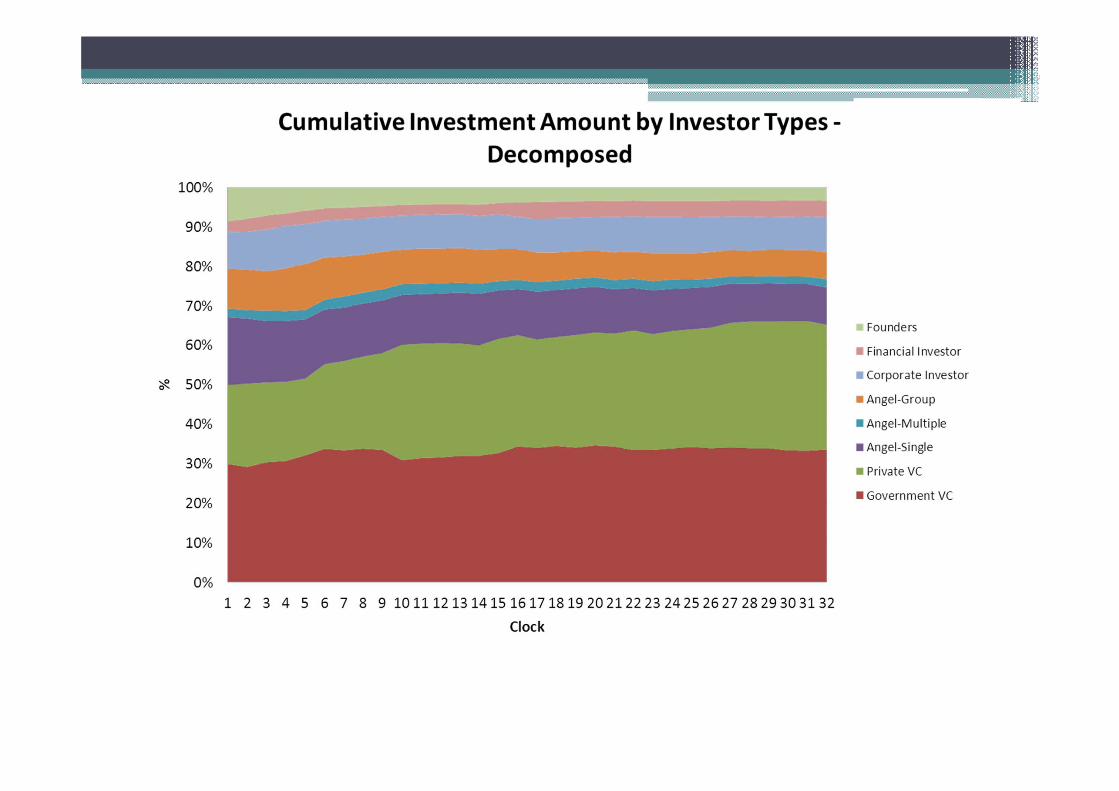
Further Decomposing Non-Angel Investors
• VCs▫ Government VCs Retail VCCs Government-owned banks
▫ Private VCs• Other investors▫ Corporate Investors▫ Financial Investors▫ Founders and Families
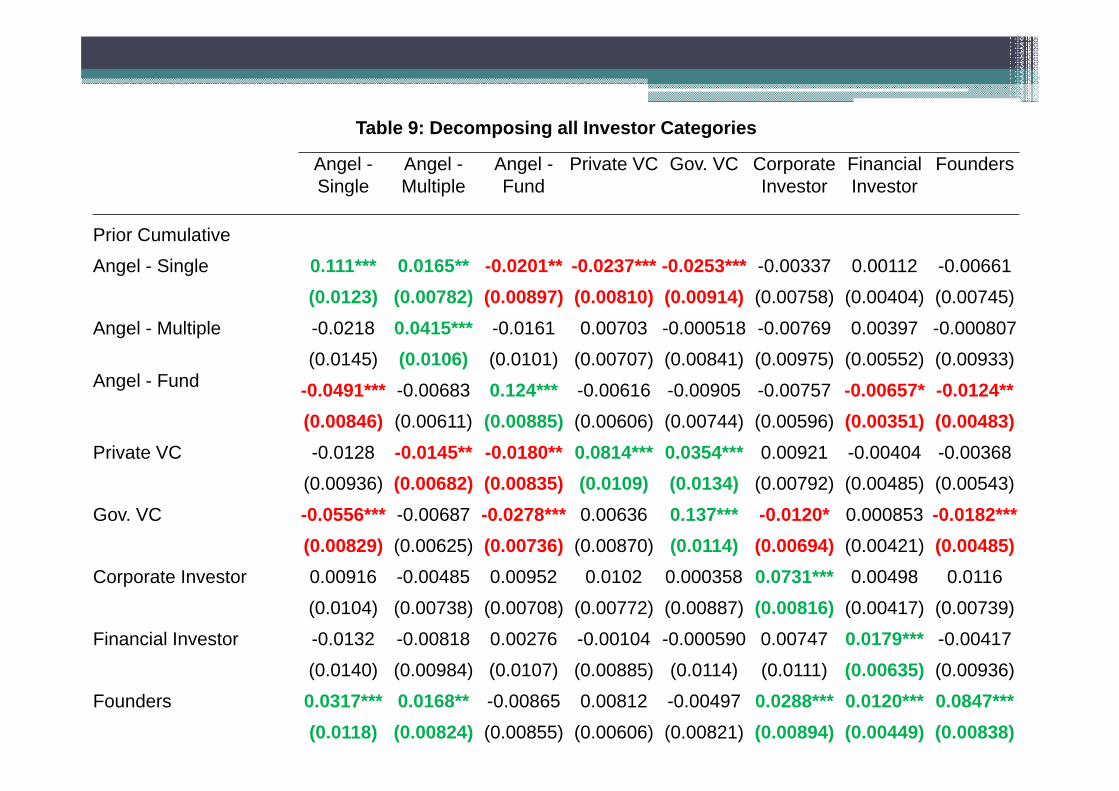
Table 9: Decomposing all Investor Categories
Angel -Single
Angel -Multiple
Angel -Fund
Private VC Gov. VC Corporate Investor
Financial Investor
Founders
Prior Cumulative
Angel - Single 0.111*** 0.0165** -0.0201** -0.0237*** -0.0253*** -0.00337 0.00112 -0.00661
(0.0123) (0.00782) (0.00897) (0.00810) (0.00914) (0.00758) (0.00404) (0.00745)
Angel - Multiple -0.0218 0.0415*** -0.0161 0.00703 -0.000518 -0.00769 0.00397 -0.000807
(0.0145) (0.0106) (0.0101) (0.00707) (0.00841) (0.00975) (0.00552) (0.00933)Angel - Fund -0.0491*** -0.00683 0.124*** -0.00616 -0.00905 -0.00757 -0.00657* -0.0124**
(0.00846) (0.00611) (0.00885) (0.00606) (0.00744) (0.00596) (0.00351) (0.00483)Private VC -0.0128 -0.0145** -0.0180** 0.0814*** 0.0354*** 0.00921 -0.00404 -0.00368
(0.00936) (0.00682) (0.00835) (0.0109) (0.0134) (0.00792) (0.00485) (0.00543)
Gov. VC -0.0556*** -0.00687 -0.0278*** 0.00636 0.137*** -0.0120* 0.000853 -0.0182***(0.00829) (0.00625) (0.00736) (0.00870) (0.0114) (0.00694) (0.00421) (0.00485)
Corporate Investor 0.00916 -0.00485 0.00952 0.0102 0.000358 0.0731*** 0.00498 0.0116
(0.0104) (0.00738) (0.00708) (0.00772) (0.00887) (0.00816) (0.00417) (0.00739)
Financial Investor -0.0132 -0.00818 0.00276 -0.00104 -0.000590 0.00747 0.0179*** -0.00417
(0.0140) (0.00984) (0.0107) (0.00885) (0.0114) (0.0111) (0.00635) (0.00936)
Founders 0.0317*** 0.0168** -0.00865 0.00812 -0.00497 0.0288*** 0.0120*** 0.0847***(0.0118) (0.00824) (0.00855) (0.00606) (0.00821) (0.00894) (0.00449) (0.00838)

Performance measures used
• Exit (IPO or Acquisition)• “Death”• US Venture Capitalist
• Measure of distinction• Revenues
• Log($1+Revenues)• Obtained from financial statements and BvD
• Employees• Log(1+ # of employees)
• Obtained from variety of sources
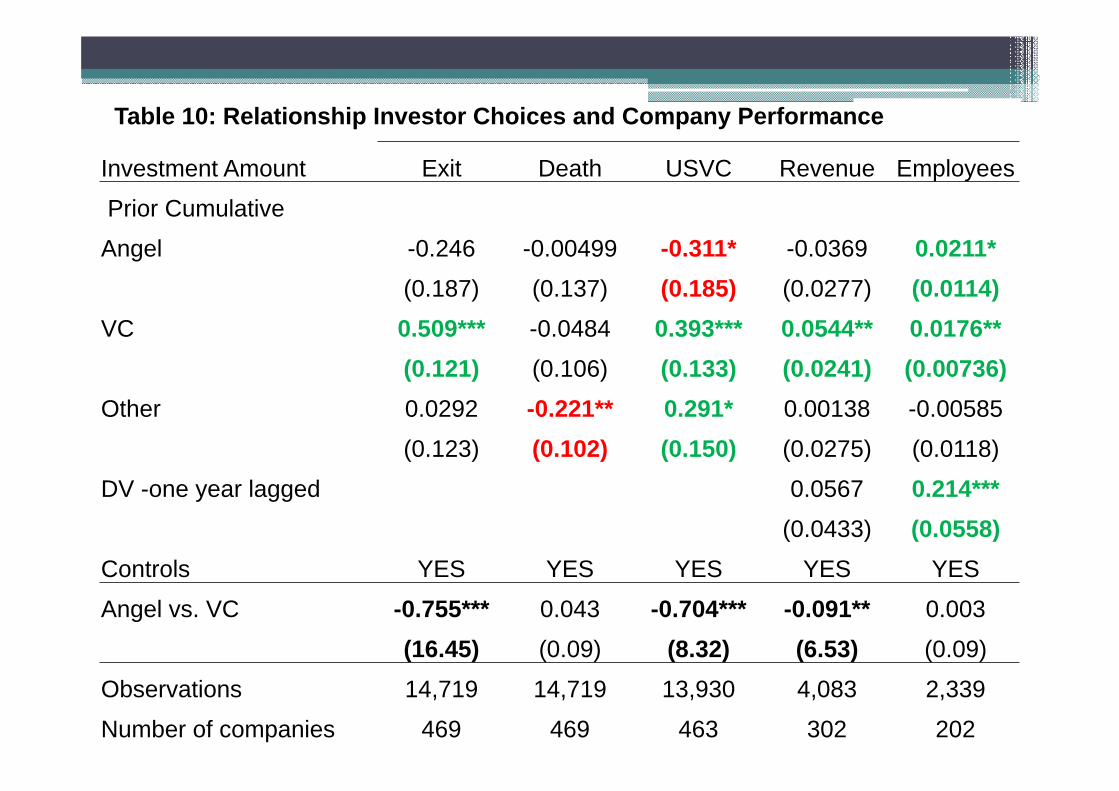
Table 10: Relationship Investor Choices and Company Performance
Investment Amount Exit Death USVC Revenue Employees
Prior Cumulative
Angel -0.246 -0.00499 -0.311* -0.0369 0.0211*(0.187) (0.137) (0.185) (0.0277) (0.0114)
VC 0.509*** -0.0484 0.393*** 0.0544** 0.0176**(0.121) (0.106) (0.133) (0.0241) (0.00736)
Other 0.0292 -0.221** 0.291* 0.00138 -0.00585
(0.123) (0.102) (0.150) (0.0275) (0.0118)
DV -one year lagged 0.0567 0.214***(0.0433) (0.0558)
Controls YES YES YES YES YES
Angel vs. VC -0.755*** 0.043 -0.704*** -0.091** 0.003
(16.45) (0.09) (8.32) (6.53) (0.09)
Observations 14,719 14,719 13,930 4,083 2,339
Number of companies 469 469 463 302 202
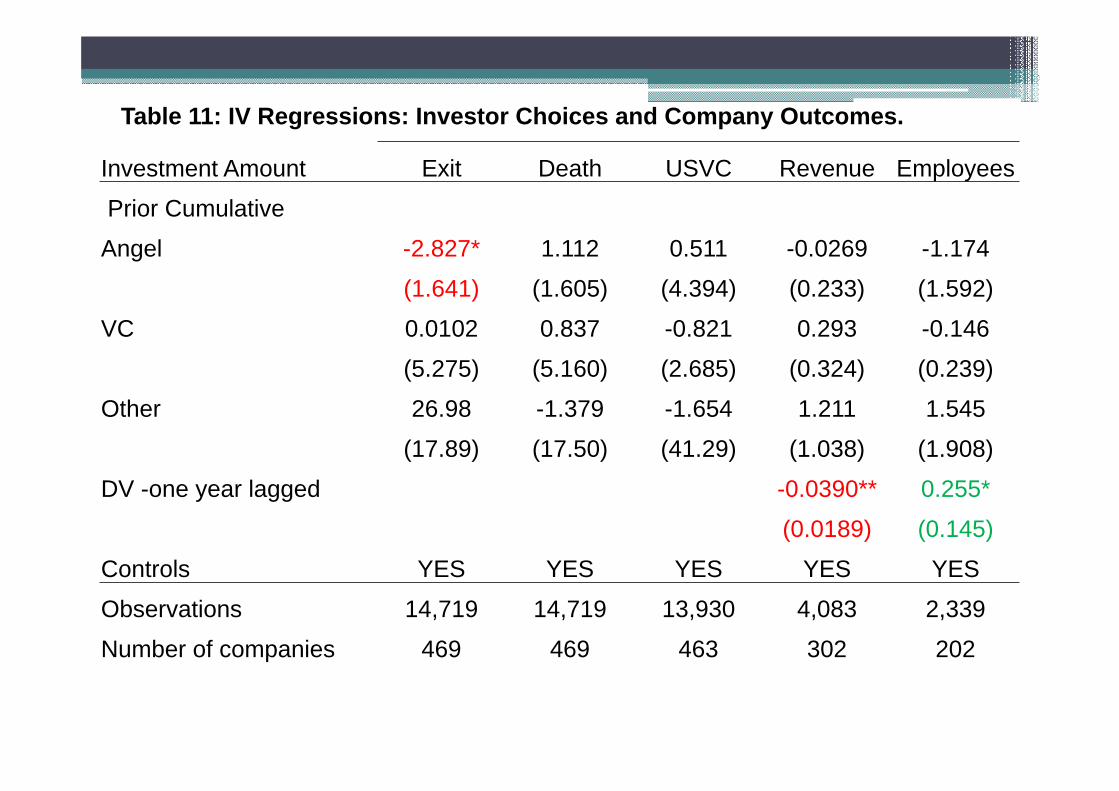
Table 11: IV Regressions: Investor Choices and Company Outcomes.
Investment Amount Exit Death USVC Revenue Employees
Prior Cumulative
Angel -2.827* 1.112 0.511 -0.0269 -1.174
(1.641) (1.605) (4.394) (0.233) (1.592)
VC 0.0102 0.837 -0.821 0.293 -0.146
(5.275) (5.160) (2.685) (0.324) (0.239)
Other 26.98 -1.379 -1.654 1.211 1.545
(17.89) (17.50) (41.29) (1.038) (1.908)
DV -one year lagged -0.0390** 0.255*
(0.0189) (0.145)
Controls YES YES YES YES YES
Observations 14,719 14,719 13,930 4,083 2,339
Number of companies 469 469 463 302 202
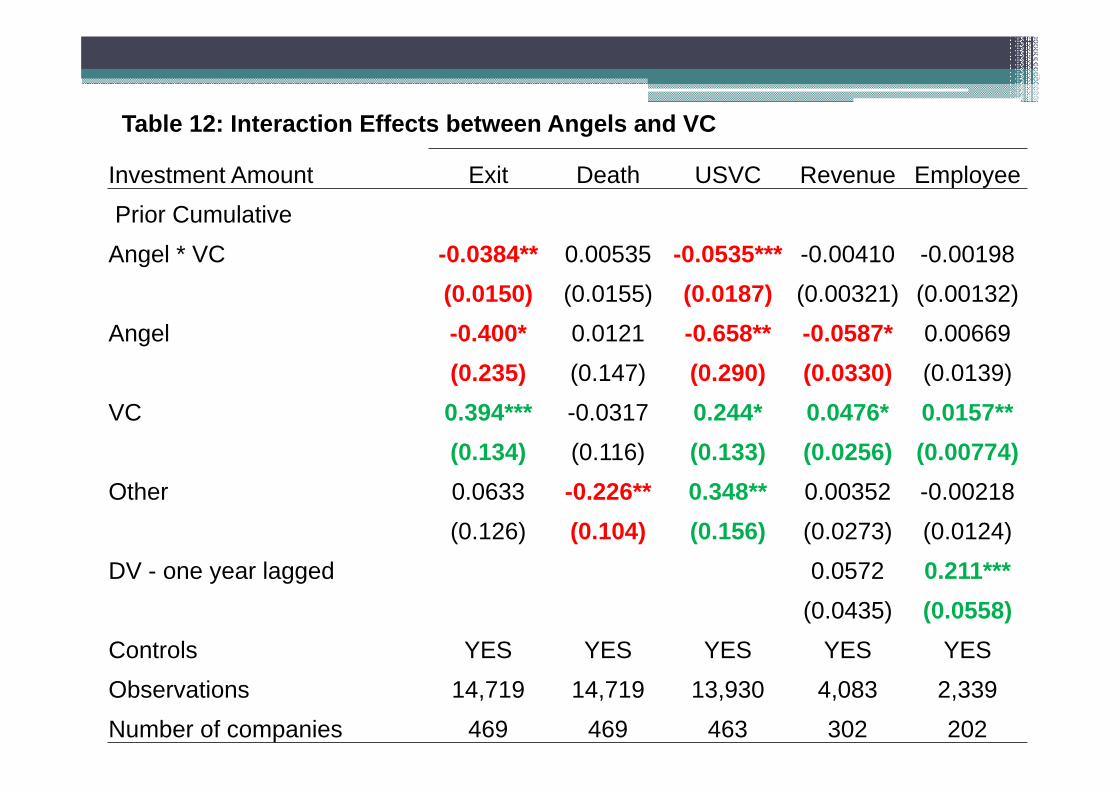
Table 12: Interaction Effects between Angels and VC
Investment Amount Exit Death USVC Revenue EmployeePrior CumulativeAngel * VC -0.0384** 0.00535 -0.0535*** -0.00410 -0.00198
(0.0150) (0.0155) (0.0187) (0.00321) (0.00132)Angel -0.400* 0.0121 -0.658** -0.0587* 0.00669
(0.235) (0.147) (0.290) (0.0330) (0.0139)VC 0.394*** -0.0317 0.244* 0.0476* 0.0157**
(0.134) (0.116) (0.133) (0.0256) (0.00774)Other 0.0633 -0.226** 0.348** 0.00352 -0.00218
(0.126) (0.104) (0.156) (0.0273) (0.0124)DV - one year lagged 0.0572 0.211***
(0.0435) (0.0558)Controls YES YES YES YES YESObservations 14,719 14,719 13,930 4,083 2,339Number of companies 469 469 463 302 202
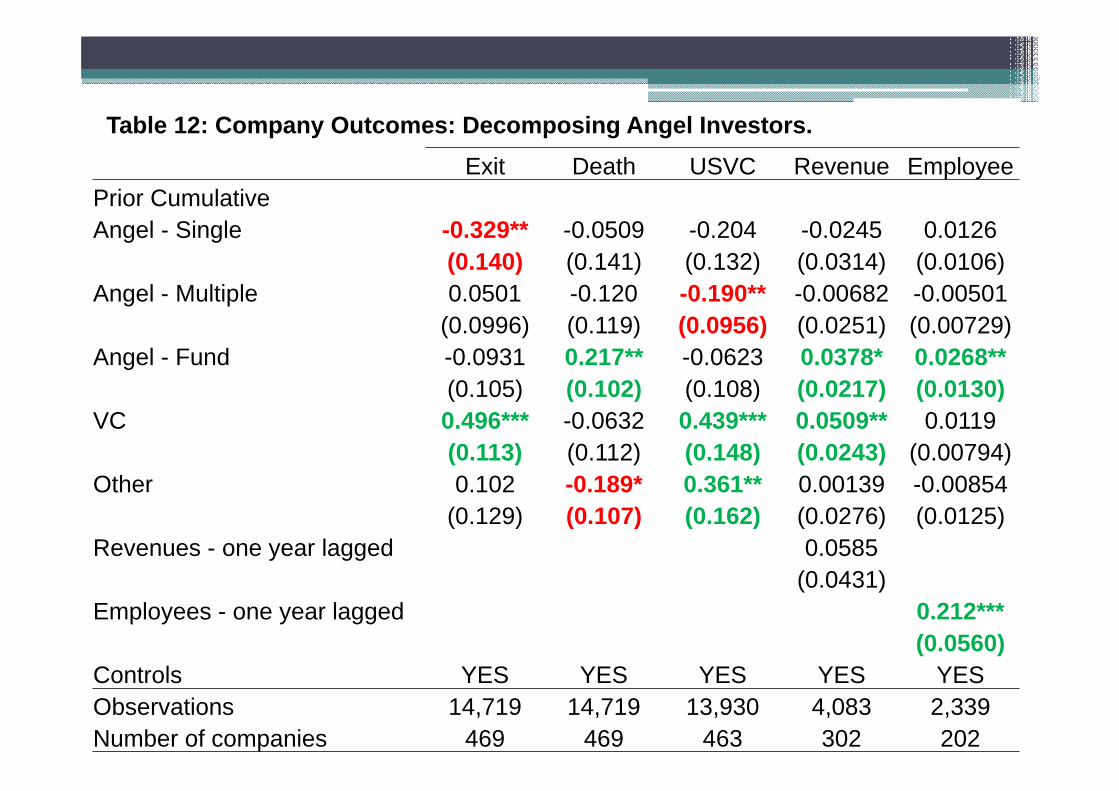
Table 12: Company Outcomes: Decomposing Angel Investors.Exit Death USVC Revenue Employee
Prior CumulativeAngel - Single -0.329** -0.0509 -0.204 -0.0245 0.0126
(0.140) (0.141) (0.132) (0.0314) (0.0106)Angel - Multiple 0.0501 -0.120 -0.190** -0.00682 -0.00501
(0.0996) (0.119) (0.0956) (0.0251) (0.00729)Angel - Fund -0.0931 0.217** -0.0623 0.0378* 0.0268**
(0.105) (0.102) (0.108) (0.0217) (0.0130)VC 0.496*** -0.0632 0.439*** 0.0509** 0.0119
(0.113) (0.112) (0.148) (0.0243) (0.00794)Other 0.102 -0.189* 0.361** 0.00139 -0.00854
(0.129) (0.107) (0.162) (0.0276) (0.0125)Revenues - one year lagged 0.0585
(0.0431)Employees - one year lagged 0.212***
(0.0560)Controls YES YES YES YES YESObservations 14,719 14,719 13,930 4,083 2,339Number of companies 469 469 463 302 202
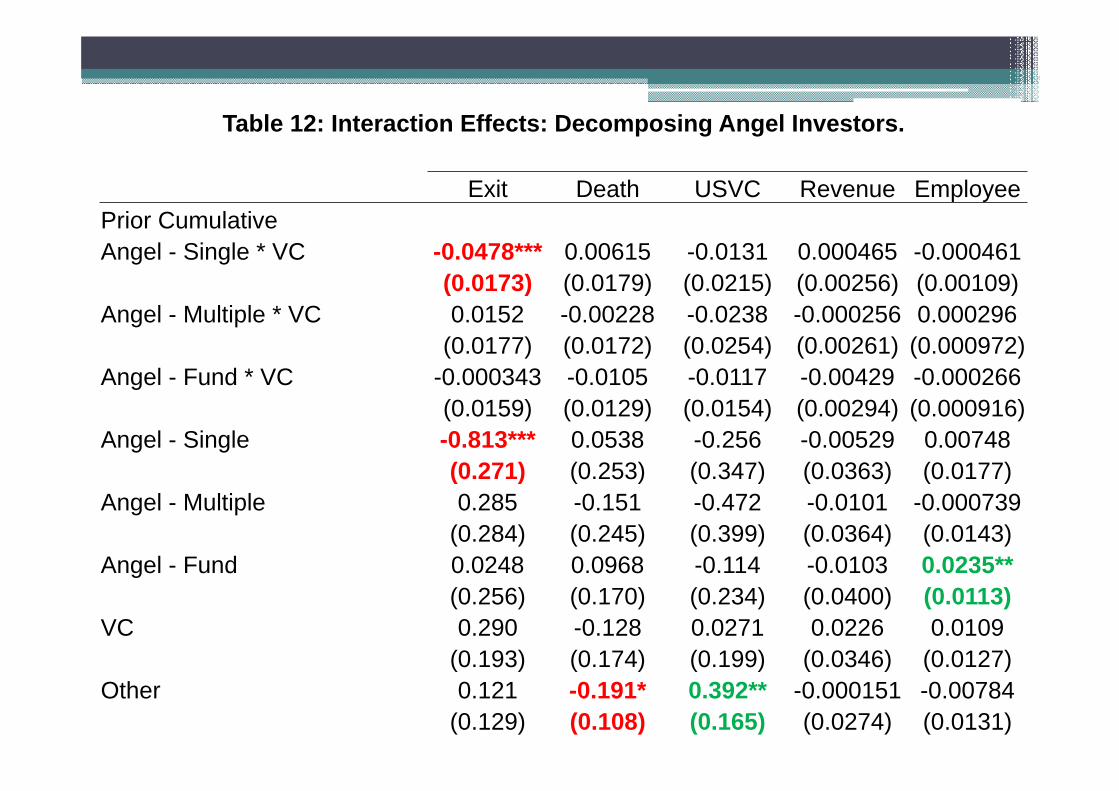
Table 12: Interaction Effects: Decomposing Angel Investors.
Exit Death USVC Revenue EmployeePrior CumulativeAngel - Single * VC -0.0478*** 0.00615 -0.0131 0.000465 -0.000461
(0.0173) (0.0179) (0.0215) (0.00256) (0.00109)Angel - Multiple * VC 0.0152 -0.00228 -0.0238 -0.000256 0.000296
(0.0177) (0.0172) (0.0254) (0.00261) (0.000972)Angel - Fund * VC -0.000343 -0.0105 -0.0117 -0.00429 -0.000266
(0.0159) (0.0129) (0.0154) (0.00294) (0.000916)Angel - Single -0.813*** 0.0538 -0.256 -0.00529 0.00748
(0.271) (0.253) (0.347) (0.0363) (0.0177)Angel - Multiple 0.285 -0.151 -0.472 -0.0101 -0.000739
(0.284) (0.245) (0.399) (0.0364) (0.0143)Angel - Fund 0.0248 0.0968 -0.114 -0.0103 0.0235**
(0.256) (0.170) (0.234) (0.0400) (0.0113)VC 0.290 -0.128 0.0271 0.0226 0.0109
(0.193) (0.174) (0.199) (0.0346) (0.0127)Other 0.121 -0.191* 0.392** -0.000151 -0.00784
(0.129) (0.108) (0.165) (0.0274) (0.0131)
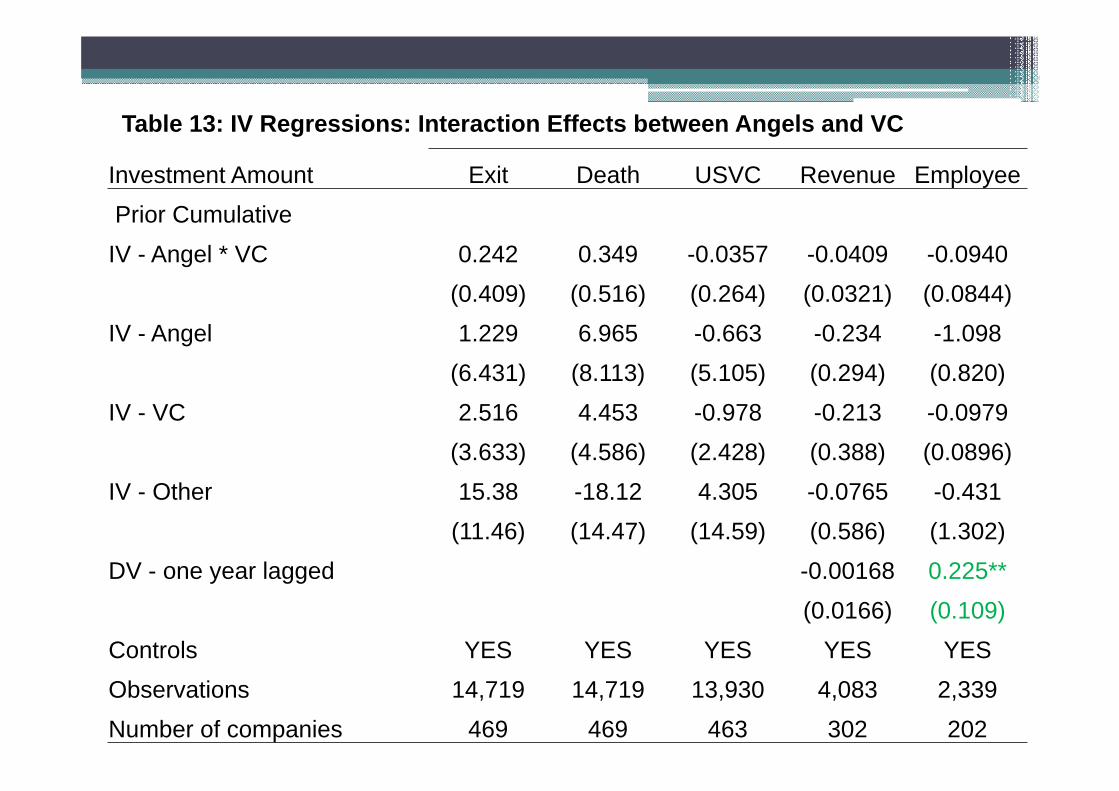
Table 13: IV Regressions: Interaction Effects between Angels and VC
Investment Amount Exit Death USVC Revenue EmployeePrior CumulativeIV - Angel * VC 0.242 0.349 -0.0357 -0.0409 -0.0940
(0.409) (0.516) (0.264) (0.0321) (0.0844)IV - Angel 1.229 6.965 -0.663 -0.234 -1.098
(6.431) (8.113) (5.105) (0.294) (0.820)IV - VC 2.516 4.453 -0.978 -0.213 -0.0979
(3.633) (4.586) (2.428) (0.388) (0.0896)IV - Other 15.38 -18.12 4.305 -0.0765 -0.431
(11.46) (14.47) (14.59) (0.586) (1.302)DV - one year lagged -0.00168 0.225**
(0.0166) (0.109)Controls YES YES YES YES YESObservations 14,719 14,719 13,930 4,083 2,339Number of companies 469 469 463 302 202
Conclusion• Examine interactions of angels and VC▫ Consider heterogeneity among angels
• Main findings▫ Substitutes co-financing patterns▫ Stronger patterns for less committed angels▫ Weaker performance results
• Results have implications for ▫ Investors▫ Entrepreneurs▫ Policy Makers
Conclusion• Agenda: Examine interaction angels and VCs• Question: Substitutes or complements?• British Columbia dataset:▫ Share registries with time dimension▫ BC Government that has tweaked the program
• Main findings▫ Substitutes in dynamic financing patterns Pattern stronger for less committed angels Both selection and treatment at work
▫ Performance results … are more tentative, but… VC backed companies appear to do better Mixing investor type appears to harm performance