angle in aerobic rice production systems genomic region
TRANSCRIPT

Page 1/27
QTL Validation and Development of SNP-based HighThroughput Molecular Markers Targeting aGenomic Region Conferring Narrow Root ConeAngle in Aerobic Rice Production SystemsRicky Vinarao
The University of Queensland School of Agriculture and Food SciencesChristopher Proud
The University of Queensland School of Agriculture and Food SciencesPeter Snell
NSW DPI: New South Wales Department of Primary IndustriesShu Fukai
The University of Queensland School of Agriculture and Food SciencesJaquie Mitchell ( [email protected] )
The University of Queensland School of Agriculture and Food Sciences https://orcid.org/0000-0001-7641-7935
Research Article
Keywords: QTL validation, KASP, molecular markers, aerobic production, rice, root angle
Posted Date: June 28th, 2021
DOI: https://doi.org/10.21203/rs.3.rs-636404/v1
License: This work is licensed under a Creative Commons Attribution 4.0 International License. Read Full License
Loading [MathJax]/jax/output/CommonHTML/fonts/TeX/fontdata.js

Page 2/27
AbstractBackground
Aerobic rice production (AP) is a potential solution to the imminent global water crisis as it consumesless water than traditional permanent water culture. Narrow root cone angle (RCA) and subsequentdevelopment of deeper rooting systems are considered AP adaptation traits by enabling water uptake atdepth. Quantitative trait loci (QTL), such as qRCA4, contributing to RCA variation in AP systems havebeen previously identi�ed. However, their usefulness depends on validation in a range of geneticbackgrounds, development of associated molecular markers, and identi�cation of possible donors inother subpopulations.
Results
Using three F2 bi-parental populations derived from IRAT109 crossed with three different geneticbackgrounds, and genotypes with known qRCA composition, QTL validation were performed andmolecular markers developed. qRCA4 was shown to be effective in multiple backgrounds, explaining 9.3-17.3% of the genotypic variation in the populations tested and the introgression of the favourable alleleresulted in 11.7-15.1° narrower RCA. Novel kompetive allele speci�c PCR (KASP) molecular markers havebeen developed associated with narrow RCA. Core molecular marker quality metrics have shownrobustness and breeding program speci�c utility of up to 83%. qRCA4 was further �ne mapped into a 720kb region. Analysis of candidate genes identi�ed those related with plant response to abiotic stressstimulus together with root development. Available public database search found 178 potential donorsrepresenting major rice subpopulations and may be used readily by breeding programs.
Conclusion
This study validated qRCA4’s effect in multiple genetic backgrounds further strengthening its value inimprovement of rice genotypes for AP adaptation. Furthermore, the development of novel KASP markershas ensured the opportunity for its seamless introgression across pertinent breeding programs. Futureresearch in metabolomic and transcriptomic analysis of QTL positive genotypes should improve theunderstanding of the physiological mechanisms underpinning narrow RCA and development of deeperrooting. Finally, this work provides the tools and opportunity to accelerate the development of genotypeswith narrow RCA through marker assisted selection in breeding programs targeting AP, which mayultimately contribute to more sustainable rice production where water availability is limited.
BackgroundTo feed the increasing number of rice consumers by 2030, world rice production has to increase by 40%(Khush 2005). This is a tall order considering the devastating negative effects of climate change such aslooming water crisis brought about by climate change, increasing population, and higher food demand(Elliott et al. 2014). Aerobic rice production (AP) system is a promising technology which may provide
Loading [MathJax]/jax/output/CommonHTML/fonts/TeX/fontdata.js

Page 3/27
solutions to this conundrum. AP system is an intensive rice farming method consisting of direct seededrice cultivation under non-�ooded conditions and is usually well-irrigated (Kato et al. 2009). Comparedwith upland cultivation, AP has higher input levels and does not encounter drought (Kato and Katsura2014). Although water availability in AP system is generally high, transient water de�cit may developbetween irrigation events. This is distinct from water de�cit as commonly perceived in relatively lowyielding upland cultivation.
Several physiological and morphological attributes have been postulated to minimise effect ofintermittent water de�cit and enable stable or increased rice yield in AP systems. These include (1)vigorous biomass production with harvest index ranging from 0.40-0.48, (2) improved yield componenttraits such as increased number of spikelets per unit area, (3) plants with intermediate height (<130 cm),larger and thicker tillers and leaves, and (4) improved root system architecture (RSA) such as increasedrooting depth (Kato and Katsura 2014). RSA is the arrangement of the crop root system in terms ofspeci�c geometric con�guration across a rooting medium, and is particularly important as it determinesanchorage, soil nutrient and water exploitation, and developmental plasticity, which will ultimately affectmaximum yield and yield stability. One of the components of RSA is rooting angle – root cone angle(RCA), is the plant’s root angle relative to the vertical axis. Genotypes with narrow RCA tend to havedeeper rooting systems (Uga et al. 2013a) and is therefore highly relevant for AP adaptation. Severalexperiments in upland �eld conditions with drought stress have shown the advantage given by narrowRCA. Using 12 cultivars, it was shown that narrow RCA was associated with development of deeperroots (Kato et al. 2006)). Similarly, genotypes with higher ratio of deep roots (RDR, narrow RCA) tended tohave increased rooting depth in an upland �eld condition with drought stress (Uga et al. 2013a). Theadvantage of having deeper roots in an AP system was indicated with positive genetic correlationsobserved between percentage of deep roots and grain yield when a set of 20 diverse cultivars wereevaluated (Mitchell et al. 2019). To facilitate the development of genotypes with narrower RCA anddeeper rooting and their further inclusion in breeding programs, identi�cation of genes and quantitativetrait loci (QTL) governing these traits is imperative.
To date, a number of studies conducted in paddy �elds or in transplanted systems identi�edgenomic regions associated with rooting angle. Using Kinandang Patong, several deep rooting QTL(DRO1, DRO2, DRO3, DRO4, and DRO5) located in different chromosomes were identi�ed (Kitomi et al.2015; Uga et al. 2015; Uga et al. 2013a; Uga et al. 2013b). Of these, only DRO1 was cloned and wasshown to increase rooting depth of genotypes with favourable allele, thereby stabilising rice yield inupland conditions and under drought stress. IRAT109, an upland tropical japonica (tropjap) genotype,was also utilised to map QTL for RDR in transplanted systems, identifying qRDR-2 as a genomic regionlocated in chromosome 2 (Lou et al. 2015). Recently, novel, stable, consistently identi�ed acrossenvironments and environment-speci�c genomic regions conferring narrow RCA were identi�ed in APsystems (Vinarao et al. 2021). qRCA4 was found to be a major and stable QTL identi�ed across allenvironments tested, and qRCA1.1 was a novel QTL which was also expressed in all environments. Of theenvironment speci�c QTL, qRCA2.1 and qRCA2.2 were found to be associated in intermittent water stressconditions (IWS) and was shown to have moderate to high effects. In order to facilitate the introgressionLoading [MathJax]/jax/output/CommonHTML/fonts/TeX/fontdata.js

Page 4/27
of these QTL in relevant breeding programs, it is imperative to demonstrate the effect of these genomicregions in multiple genetic backgrounds (Cobb et al. 2019). Additionally, molecular markers tagging theseQTL, and ultimately the target trait – narrow RCA and deeper roots will also be vital for seamlessintrogression of these loci into breeding programs.
A number of molecular markers have been developed and used extensively in rice improvement efforts(Collard and Mackill 2008; Mackill and McNally 2004) including restriction fragment lengthpolymorphism, random ampli�ed polymorphic DNA, cleaved-ampli�ed polymorphic sequence, simplesequence repeat (SSR), and single nucleotide polymorphism (SNP) markers. Numerous SSR markerswere developed by McCouch et al. (2002) and their corresponding sequences are available online(https://archive.gramene.org/markers/). SSRs are most widely used markers in major cereals crops asthey are highly reproducible, co-dominant, relatively simple and cheap to use, and generally highlypolymorphic. SSRs do come with some disadvantages such that they generally give information to asingle locus only per assay, have di�culty in merging data across platforms and cumbersome curation ofallele sizes into databases. With the advent of whole genome sequence information, SNPs became themarker of choice for majority of high throughput genotyping applications because of (1) they areubiquitous in eukaryotic genomes, (2) cost effectiveness in terms of assay and automation, and (3)simple allele calling, data analysis and curation into databases due to their bi-allelic nature (Thomson etal. 2017). Recently, high-density SNP chip called the Cornell-IR RiceLD Array have been developed at theInternational Rice Research Institute (IRRI) in collaboration with Cornell University(https://isl.irri.org/services/genotyping/7k). This chip allows for the simultaneous genotyping of asample across 7,000 SNP loci including 21 gene-based SNP diagnostic for submergence toleranceSUB1A gene, grain quality characteristics, and loci for resistance to bacterial leaf blight, blast, brownplanthopper, and tungro. One disadvantage of this SNP chip is that it is �xed (SNP markers and traits),similar to an amplicon-based SNP genotyping assay developed recently (Arbelaez et al. 2019a). On theother hand, there are a number of available high-throughput technologies able to run �exible sets of SNPmarkers. Kompetitive allele-speci�c polymerase chain reaction (KASP) marker assay is a single-stepgenotyping technology that uses two competing allele-speci�c forward primers, one reverse primer, and amaster mix with a �uorescence resonance energy transfer cassette and Taq DNA polymerase. With this,pre-identi�ed, co-dominant alleles for SNPs and insertion/deletion variants between parents, progeny, andother genotypes being tested are determined (Semagn et al. 2014). The Genotyping Services lab of IRRIhave developed and validated trait based KASP SNP markers for the following: yield components (grainnumber, grain size, and panicle architecture), grain quality (amylose, chalk, and gelatinizationtemperature), abiotic stress tolerance (anaerobic germination, drought, cold, and submergence), anddisease and pest resistance (bacterial blight, blast, brown planthopper, and tungro)(https://isl.irri.org/services/genotyping/trait-based-genotyping). To our knowledge, KASP SNP markerstargeting root angle, whether in conventional �ooded or AP systems, have not been developed andvalidated to date. Using genotypes with known qRCA composition and newly developed segregatingpopulations, this study was carried out to validate the effect of qRCA QTL across several geneticbackgrounds and to develop KASP-based SNP markers targeting qRCA QTL for its precise introgression
Loading [MathJax]/jax/output/CommonHTML/fonts/TeX/fontdata.js

Page 5/27
into various genetic backgrounds pertinent to rice breeding programs, particularly targeting environmentsexposed to transient water de�cit. Additionally, this study also determined molecular marker qualitymetrics of the newly developed markers and identi�ed potential donors using publicly availabledatabases.
Methods
Plant materialsTo validate the effect of target QTL in different genetic backgrounds, progenies were produced betweenIRAT109 and three recipient parents (RP), RL11, Langi, and Norin PL8. F1s were produced by crossingIRAT109 with RPs, and subsequently, F2 progenies were produced by sel�ng F1s. A total of 810 F2
progenies were genotyped and evaluated for RCA. Of these, 283, 196, and 331 were derived from crossesbetween IRAT109/Norin PL8 (IRNO), IRAT109/Langi (IRLA), and IRAT109/RL11 (IRRL), respectively. Atotal of 60 genotypes were utilised to test the molecular marker quality metrics of the newly developedmarkers. Of these, six were either released varieties or donors of high importance to the Australianbreeding program – IRAT109, Sherpa, Reiziq, Langi, RL11, and Norin PL8. The other 54 genotypes wererecombinant inbred lines (RILs) derived from Sherpa/IRAT109 and were previously identi�ed to havevarying combinations of QTL for RCA (Vinarao et al. 2021).
Phenotyping for RCAThree experiments were carried out to evaluate the segregating populations developed above, along withthe six varieties/checks following the clear pot method described by Vinarao et al. (2021), with somemodi�cations, at the University of Queensland (UQ) St Lucia (27.4975° S, 153.0137° E) campus. Brie�y,single seeds of F2s and check genotypes were direct seeded in 4L clear pots (ANOVApot®, 200 mmdiameter, 190 mm height, http://www.anovapot.com/php/anovapot.php) �lled with pine bark pottingmedia (70% composted pine bark 0–5 mm, 30% coco peat, pH 6.35, EC = 650 ppm, nitrate = 0, ammonia < 6 ppm and phosphorus = 50 ppm) with 3g/L Osmocote Exact 3-4M (19-9-10 + 2MgO + TE, ICL SpecialtyFertilizers), 2g/L Osmocote Exact 5-6M (15-9-12 + 2MgO + TE) and 0.82g/L Suscon Maxi Green (Nufarm,Australia). Using a pair of forceps, seeds were sown vertically at a depth of 3 cm along the pot wall with a�nal density of 12 plants per pot. In every experiment, parental genotypes for each speci�c F2 populationwere replicated in every pot, while the other check genotypes were replicated every incomplete block (fourclear pots/incomplete block). To prevent penetration of light, similar sized black pots were used to coverthe clear pots. Pots were placed on a table and a constant layer of water (~ 4 cm from the base of theinner pot) was maintained to mimic aerobic growing conditions. The experiments were carried out in atemperature-controlled glasshouse set at 28°C/21°C day/night temperatures with natural light. RCA weremeasured manually 35, 42, and 49 days after sowing (DAS) using a protractor, by measuring the coneangle between the two most external nodal roots.
Development of KASP SNP molecular markersLoading [MathJax]/jax/output/CommonHTML/fonts/TeX/fontdata.js

Page 6/27
SNP variations across target QTL regions were investigated using the 3K Rice Genome Project (3KRGP)database which included IRAT109, the main donor genotype in this study as well as six varieties relevantto the Australian breeding program (M7, M102, M401, M203, Calrose 76, and YRM6-2). For qRCA4, SNPsunique to IRAT109 were identi�ed along the region, ± 100kb upstream and downstream the QTL’scon�dence interval. Using the SNPs identi�ed, linkage disequilibrium (LD) in the region was investigatedusing TASSEL (Bradbury et al. 2007) by computing the standardised disequilibrium coe�cient (D’) fromthe full matrix, in both the japonica sub-group and all the genotypes included in 3KRGP. Additionally, allelefrequencies of the selected SNPs were also determined using the SNP-Seek database (Mansueto et al.2017). Their relative allele frequencies were noted in different populations: tropjap, subtropical japonica(subtrop), temperate japonica (tempjap), and in all 3KRGP (japonica, indica, and admixed, all3K). SNPshaving the desired allele frequencies were selected and analysed further. DNA sequence surrounding theSNP of interest (± 200 bp) were downloaded from the SNP-Seek database and multiple sequencealignment was carried out using CLUSTALW implemented in Molecular Evolutionary Genetic Analysis X(Kumar et al. 2018) software to ascertain that the region surrounding the target SNP was fairly conservedor with minimal variation. Finally, the downloaded IRAT109 sequence was aligned through basic localalignment search tool with the Nipponbare sequence implemented in the Rice Annotation ProjectDatabase (RAP-DB) to con�rm that the regions selected were unique and only occurred in the targetchromosome. SNPs and their surrounding sequences which passed the criteria described above werecompiled and sent to Intertek, Australia (https://www.intertek.com/agriculture/agritech/) for subsequentdevelopment of KASP molecular markers. To constitute a plate to validate newly designed molecularmarkers, IRAT109 and Sherpa were replicated four times while Reiziq, Langi, RL11, and Norin PL8 werereplicated thrice. Leaf samples of IRAT109 were also combined with other genotypes (Sherpa, Reiziq,Langi, RL11, and Norin PL8) to create heterozygotes (a total of 20 samples). To complete the set, leafsamples of the 54 RILs derived from IRAT109/Sherpa were also included, bringing the total to 94. Two 4–6 mm leaf samples were sampled and placed per well of an Abgene™ 96 deepwell storage plate(ThermoFisher Scienti�c, USA) to constitute the validation plate. Leaf samples were subsequently freeze-dried at -55°C for 48 h using Alpha 1–2 LDplus (Martin Christ, Germany) and then sealed using 96-wellsealing mats (ThermoFisher Scienti�c, USA). Upon selection of well-performing markers, a similar methodwas used to prepare the F2 segregating genotypes. KASP genotyping of validation genotypes andsegregating population was carried out at the Intertek, Australia laboratory following standardmanufacturer speci�cations.
Molecular marker and QTL validationCluster graph for each SNP genotyping assay was visualised using KlusterCaller™ and SNPviewersoftware (LGC Biosearch Technologies, UK). In some instances where automated SNP genotype calling ofthe software classi�ed some individuals into ‘uncallable’ but were clearly belonging into a cluster, thesewere manually called into their respective cluster genotypes. Newly developed KASP molecular markerswere evaluated for core quality metrics as described by Platten et al. (2019), which included call rate,false positive rate (FPR), false negative rate (FNR) and utility. FPR was the proportion (percent, %) of
Loading [MathJax]/jax/output/CommonHTML/fonts/TeX/fontdata.js

Page 7/27
known genotypes (recipients) which were incorrectly classi�ed as having the QTL, and was computedwith the following equation:
FPR(%) =#ofrecipientswithfavourableallele
Total#ofknownrecipients x100
On the other hand, FNR was the proportion of donor genotypes (known to harbour QTL) which wereincorrectly classi�ed to not possess the QTL due to not having the favourable allele of a marker, and wasgiven by the following equation:
FNR(%) =#ofdonorswithunfavourableallele
Total#ofknowndonors x100
To estimate these molecular marker metrics, a set of 60 genotypes identical to the genotypes speci�edabove were assembled and genotyped using the newly designed KASP markers targeting qRCA4,qRCA1.1, qRCA2.1, and qRCA2.2. Of the 54 RILs, 23, 22, 21, and 30 of them had qRCA4, qRCA1.1,qRCA2.1, and qRCA2.2, respectively. Based on the QTL composition of the RILs, FPR and FNR of theindividual markers were analysed and were subsequently used to select markers used to genotype thesegregating F2 populations for succeeding QTL validation.
Three F2 populations: IRLA, IRNO and IRRL were genotyped with selected markers to validate the effect ofqRCA QTL across genetic backgrounds. Composite interval mapping was carried out to validate theeffect of qRCA4 across multiple genetic backgrounds, and then stepwiseqtl, re�neqtl, and �tqtl functionsin R/qtl were used to estimate the QTL effect (Broman et al. 2003). Bayesian credible con�dence intervalwas determined using bayesint function of R/qtl. Single marker analysis (SMA) was carried out in R (RCore Team 2019) to test for the association of marker with RCA in case of qRCA1.1, qRCA2.1, andqRCA2.2 and R2 was computed to estimate the proportion of phenotypic variation contributed byindividual markers to the phenotype.
Identi�cation of candidate genes and possible donorspresent in 3KRGPUsing the new con�dence interval calculated for qRCA4, details of the annotated genes located within theregion were batch downloaded from RAP-DB which included information such as gene ID, gene function,strand, physical position, and gene ontology (Sakai et al. 2013). Possible candidate genes controllingqRCA4-mediated reduction in RCA were identi�ed based on the gene function along with ontology, givingpriority with those involved in root development as well as those related with response to abiotic stressstimulus.
Allele frequencies of the candidate SNP molecular markers were investigated using the 3KRGP dataavailable online (Mansueto et al. 2017). Genotypes possessing the favourable qRCA4 allele wereidenti�ed in each subpopulation which may represent donors for breeding programs dealing with speci�csubpopulations. Loading [MathJax]/jax/output/CommonHTML/fonts/TeX/fontdata.js

Page 8/27
Statistical analysisA multiplicative mixed linear model was carried out for the analysis of the phenotype data per population which was executed in ASReml (V4.1; VSNi, UK) package running in the R environment (R Core Team2019). Parents of the respective F2 population and other checks were treated as �xed effects while the F2
plants were treated as random effects. Best linear unbiased predictors were then calculated afteraccounting for the randomisation and other blocking parameters. Heritability for each experiment (F2
population) was computed as speci�ed by Smith et al. (2006). Additionally, chi-square test for deviationfrom expected Mendelian F2 segregation ratios (1:2:1) of the SNP genotype data was carried out acrossthe three populations to show either conformance or deviation with expected ratios.
Results
Phenotypic variation of the segregating populationsHighly signi�cant variation (P < 0.001) for RCA was observed in all three F2 populations across each ofthe three measurement times, with 42 DAS showing the highest heritability ranging from 0.67–0.69(Table 1). Highly signi�cant positive correlations were also observed between measurement times in thethree populations for IRNO (r = 0.61–0.82**), IRLA (r = 0.68–0.87**), and IRRL (r = 0.76–0.89**)populations, respectively with the highest correlation between RCA measured at 42 and 49 DAS for eachpopulation. With these results across the populations tested and the relatively high heritability, the datacollected from 42 DAS was used in subsequent analyses.
Loading [MathJax]/jax/output/CommonHTML/fonts/TeX/fontdata.js

Page 9/27
Table 1RCA (°) statistics of F2s derived from crossing IRAT109 with three recipient parents.
IRLA
n = 196
IRRL
n = 331
IRNO
n = 283
Mean 90 98 85
Min 67 68 63
Max 124 130 116
P value < 0.0001 < 0.0001 < 0.0001
Heritability 0.69 0.67 0.68
Check Genotypes
IRAT109 71 79 77
Langi 111 106 102
RL11 ND 122 95
Norin PL8 93 98 94
Sherpa 108 117 101
Reiziq 121 124 117
RCA- root cone angle; IRLA- IRAT109/Langi F2; IRRL- IRAT109/RL11 F2; IRNO- IRAT109/Norin PL8 F2;ND- No Data
Examining the phenotypic data of the populations, IRRL showed the largest range in terms of RCA,followed by IRLA, and IRNO with the smallest range (Table 1). In terms of the population mean, a similartrend was also observed with IRRL which had a mean RCA of 98°, followed by IRLA with 90°, and thenIRNO with 85°. Signi�cant genotypic variation was also observed in the checks included in the evaluation.Of the checks, IRAT109 produced the narrowest RCA ranging from 71–79°. Norin PL8 tended to haverelatively narrow RCA ranging from 93–98°. All the other checks (Langi, Reiziq, RL11, and Sherpa)included in the experiments showed relatively wide RCA, ranging from 102–111°, 117–124°, 95–122°,and 101–117°, respectively.
SNP selection using 3KRGPA total of 40 SNPs unique to IRAT109 were identi�ed across the qRCA4 region ± 100 kb of the con�denceinterval. Initially, all 40 SNPs showed that the average IRAT109 SNP allele frequency was 44.7%, 33.9%,3.6%, and 13.6% in tropjap, subtrop, tempjap, and all3K, respectively. An LD map was constructed usingthese 40 SNPs and based on the D’ values, the qRCA4 region was found to have three linkage blockswhether the analysis was carried out using the japonica subgroup or all3K genotypes (Fig. S1). This wasindicative that a total of three SNP markers were required to track the introgression of the whole qRCA4Loading [MathJax]/jax/output/CommonHTML/fonts/TeX/fontdata.js

Page 10/27
region. After �ltering for low allele frequencies, a total of 12 SNPs were retained with an average allelefrequency of 24.6%, 5.4%, 1.5%, and 3.7% in tropjap, subtrop, tempjap, and all3K, respectively. Markerdevelopment for qRCA4 was prioritised since it was shown to be a major genomic region associated withnarrow RCA, although SNP markers for other genomic regions were also developed. For qRCA1.1,qRCA2.1, and qRCA2.2, two, one, and one SNP were selected near the peak marker previously reported,respectively. The strategy for selection of SNP for qRCA2.2 was similar to that of qRCA4, while it was abit different for qRCA1.1 and qRCA2.1, where SNPs selected had moderate allele frequencies in tempjapsince the favourable allele for these loci came from Sherpa, a tempjap genotype. In total, a set of 16SNPs were selected and subsequent KASP marker assays were developed targeting qRCA1.1, qRCA2.1,qRCA2.2, and qRCA4.
Molecular marker development and quality metrics of KASPmarkers targeting qRCA QTLSNP genotype information from the validation plate was processed and visualised to identify well-performing markers and cull-out poor performing ones. Upon visual inspection, of the 16 markers, twomarkers - snpOS00936 and snpOS00943 were immediately discarded as they were monomorphic andunable to call heterozygotes, respectively (Fig. S2). On the other hand, molecular markers snpOS00939and snpOS00948 were polymorphic but showed close clustering among alleles and further inspectionwas carried out. All other markers showed acceptable clustering and were considered for further analysis.Using the known QTL composition of 54 RILs included in the validation plate, FPR and FNR werecomputed per molecular marker. From this analysis, two molecular markers were further discarded asthey showed high FPR. The SNP marker snpOS00939, which also showed close clustering, had an FPR of26.1% and an FNR of 6.5%. Another discarded marker was snpOS00948, which initially showed goodclustering, but further analysis showed a very high FPR of 54.5% and an FNR of 3.1%. In total 12 markersshowed acceptable FPR and FNR and were considered good candidates to validate the effect of QTLmentioned above across multiple genetic backgrounds (Table 2). On average, the newly developed KASP-based SNP molecular markers showed excellent call rates of 99.56% and ranged from 97.87–100.00%.FNR was also relatively low with an average of 2.27%, ranging from 0.0–8.3%. Finally, FPR ranged from3.3–9.5%, with an average of 7.61%. In summary, nine markers (snpOS00933, snpOS00934,snpOS00935, snpOS00937, snpOS00938, snpOS00940, snpOS00941, snpOS00942, and snpOS00944)targeting qRCA4 and one each for qRCA1.1 (snpOS00945), qRCA2.1 (snpOS00947), and qRCA2.2(snpOS00948) were used to validate their respective effects across genetic backgrounds. For qRCA4, thenine markers were distributed across the previously reported con�dence interval of the QTL. Two of themarkers, snpOS00933 and snpOS00944 were designed to be �anking the QTL, while the other seven weredesigned within the QTL. On average, the physical inter-marker distance was 136.7 kilobase (kb), with thehighest distance (273.3 kb) observed between snpOS00933 and snpOS00934 and the lowest (41.2 kb)between snpOS00940 and snpOS00941.
Loading [MathJax]/jax/output/CommonHTML/fonts/TeX/fontdata.js

Page 11/27
Table 2Molecular marker quality metrics of newly developed KASP-based SNP markers targeting qRCA QTL.
SNP ID Chr_bp QTL SNP FavourableAllele
CallRate
FPR(%)
FNR(%)
snpOS00933 Chr04_29670314 qRCA4 T/A T 98.94 4.3 6.5
snpOS00934 Chr04_29943687 qRCA4 A/C A 97.87 8.7 3.2
snpOS00935 Chr04_30001385 qRCA4 C/T C 100.00 8.7 0.0
snpOS00937 Chr04_30193259 qRCA4 G/C G 100.00 8.7 0.0
snpOS00938 Chr04_30302635 qRCA4 A/G A 98.94 8.7 0.0
snpOS00940 Chr04_30420667 qRCA4 A/C A 100.00 8.7 0.0
snpOS00941 Chr04_30461857 qRCA4 T/A T 100.00 8.7 0.0
snpOS00942 Chr04_30524467 qRCA4 A/G A 100.00 8.7 0.0
snpOS00944 Chr04_30764226 qRCA4 G/A G 98.94 8.7 0.0
snpOS00945 Chr01_39443793 qRCA1.1 G/A A 100.00 4.5 3.1
snpOS00947 Chr02_27974625 qRCA2.1 C/T T 100.00 9.5 6.1
snpOS00948 Chr02_30450101 qRCA2.2 A/T A 100.00 3.3 8.3
FPR- false positive rate; FNR- false negative rate; KASP- Kompetitive Allele-Speci�c PCR; SNP- singlenucleotide polymorphism; Chr_bp- chromosome_base pairs
Examining the genotype composition of the six varieties, the nine markers targeting qRCA4 were shownto be polymorphic between the donor IRAT109, and other genotypes – Langi, Reiziq, RL11, and Sherpa. Inthe case of Norin PL8, of the nine markers, six were shown to be polymorphic, while the other three(snpOS00934, snpOS00938, and snpOS00941) were monomorphic. For qRCA1.1, Reiziq and RL11,including IRAT109, showed unfavourable allele, while for qRCA2.1, only IRAT109 showed unfavourableallele. Lastly, for qRCA2.2, except for IRAT109, all genotypes have unfavourable allele.
QTL validation and effects across genetic backgroundsThree F2 populations were used to validate the effects of qRCA QTL in different genetic backgrounds. Ofthe nine qRCA4 markers developed, two (snpOS00937 and snpOS00942) were excluded from theanalysis as they were calling IRAT109 as heterozygote. Downstream analysis was carried out using theremaining seven markers. Across the three populations, all the seven markers followed the expectedMendelian segregation ratio of F2 (χ2
[1:2:1] = 0.57–4.86, P > 0.05) populations (Table S1). This indicatedconformance of both the molecular makers and the populations with expected ratios. Estimation of thegenetic distance between the markers revealed a total of 5.70 centiMorgan (cM) distance between thetwo �anking markers, with an average distance of 0.97 cM between markers. Evaluation of the effect ofqRCA4 across the three populations using these markers revealed signi�cant associations in twoLoading [MathJax]/jax/output/CommonHTML/fonts/TeX/fontdata.js
Page 12/27
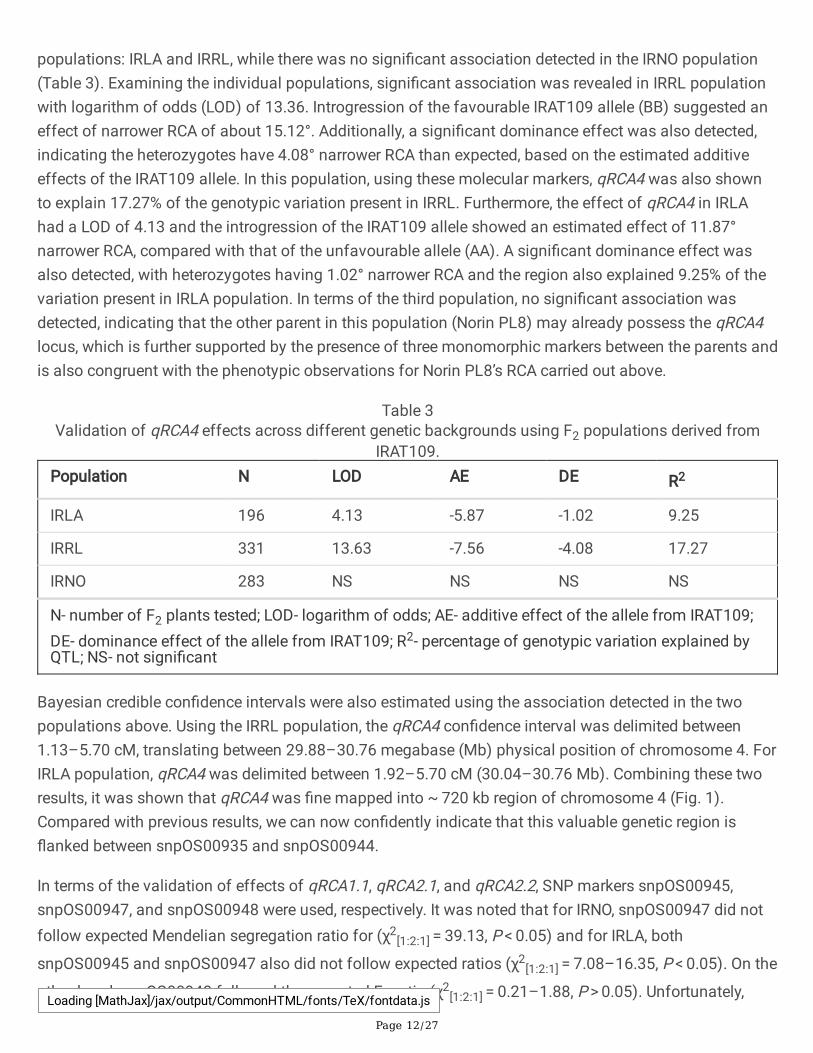
populations: IRLA and IRRL, while there was no signi�cant association detected in the IRNO population(Table 3). Examining the individual populations, signi�cant association was revealed in IRRL populationwith logarithm of odds (LOD) of 13.36. Introgression of the favourable IRAT109 allele (BB) suggested aneffect of narrower RCA of about 15.12°. Additionally, a signi�cant dominance effect was also detected,indicating the heterozygotes have 4.08° narrower RCA than expected, based on the estimated additiveeffects of the IRAT109 allele. In this population, using these molecular markers, qRCA4 was also shownto explain 17.27% of the genotypic variation present in IRRL. Furthermore, the effect of qRCA4 in IRLAhad a LOD of 4.13 and the introgression of the IRAT109 allele showed an estimated effect of 11.87°narrower RCA, compared with that of the unfavourable allele (AA). A signi�cant dominance effect wasalso detected, with heterozygotes having 1.02° narrower RCA and the region also explained 9.25% of thevariation present in IRLA population. In terms of the third population, no signi�cant association wasdetected, indicating that the other parent in this population (Norin PL8) may already possess the qRCA4locus, which is further supported by the presence of three monomorphic markers between the parents andis also congruent with the phenotypic observations for Norin PL8’s RCA carried out above.
Table 3Validation of qRCA4 effects across different genetic backgrounds using F2 populations derived from
IRAT109.Population N LOD AE DE R2
IRLA 196 4.13 -5.87 -1.02 9.25
IRRL 331 13.63 -7.56 -4.08 17.27
IRNO 283 NS NS NS NS
N- number of F2 plants tested; LOD- logarithm of odds; AE- additive effect of the allele from IRAT109;DE- dominance effect of the allele from IRAT109; R2- percentage of genotypic variation explained byQTL; NS- not signi�cant
Bayesian credible con�dence intervals were also estimated using the association detected in the twopopulations above. Using the IRRL population, the qRCA4 con�dence interval was delimited between1.13–5.70 cM, translating between 29.88–30.76 megabase (Mb) physical position of chromosome 4. ForIRLA population, qRCA4 was delimited between 1.92–5.70 cM (30.04–30.76 Mb). Combining these tworesults, it was shown that qRCA4 was �ne mapped into ~ 720 kb region of chromosome 4 (Fig. 1).Compared with previous results, we can now con�dently indicate that this valuable genetic region is�anked between snpOS00935 and snpOS00944.
In terms of the validation of effects of qRCA1.1, qRCA2.1, and qRCA2.2, SNP markers snpOS00945,snpOS00947, and snpOS00948 were used, respectively. It was noted that for IRNO, snpOS00947 did notfollow expected Mendelian segregation ratio for (χ2
[1:2:1] = 39.13, P < 0.05) and for IRLA, both
snpOS00945 and snpOS00947 also did not follow expected ratios (χ2[1:2:1] = 7.08–16.35, P < 0.05). On the
other hand, snpOS00948 followed the expected F2 ratio (χ2[1:2:1] = 0.21–1.88, P > 0.05). Unfortunately,Loading [MathJax]/jax/output/CommonHTML/fonts/TeX/fontdata.js

Page 13/27
SMA carried out using these markers indicated no signi�cant effect in the RCA across three populationstested. With these results, no downstream analyses were carried out for these loci and SNP markers.
Performance of newly developed KASP markers targetingqRCA4 locusUtilising the F2 SNP genotyping data, molecular marker quality metrics were analysed for the sevenmarkers. On average, the qRCA4 targeting markers showed a call rate of 99.21%, with snpOS00940 andsnpOS00944 showing the highest call rates at 99.51%, while snpOS00933 had 98.64% (Fig. 2). Anadditional 13 genotypes important to the Australian breeding program were also genotyped for qRCA4markers. This analysis showed three genotypes (55A, Moroberekan, and YRF210) possess the qRCA4favourable alleles. Bringing these results together with the checks previously genotyped, it can be notedthat the breeding program speci�c utility of these markers were at about 83%.
Identi�cation of candidate genes and possible donorsqRCA4 in 3K in all subpopulationsThrough the 3KRGP, potential donors for qRCA4 were identi�ed among different rice subpopulations.Since the original donor, IRAT109, is a tropjap genotype, it was expected that there were more donors inthis subpopulation. Indeed, 157 out of 372 (42.2%) tropical japonicas possessed the favourable alleles ofqRCA4. In terms of the other subpopulations, a total of 21 potential donors were identi�ed (Table S2). Asingle donor, Y134, from the indica subpopulation was identi�ed while two, IAS 22 − 8 Palmar and CX578,were identi�ed for the tempjap subpopulation. The remaining 18 were representatives of the subtroppopulation, majority of which (13) originated from Lao People’s Democratic Republic, two from Thailand,and a single accession from China.
Examining the annotated genes within the qRCA4 region, it was found that there were 111 genes withtranscript evidence, with 22 of them having alternative transcripts or splice variants. Of the 111 genes, 83have been identi�ed to have known molecular and/or biological functions or have been shown to havehigh similarity with known proteins, while the other 28 code for hypothetical genes or non-protein codingtranscript. Of those identi�ed with known functions, four have been identi�ed to be associated with plantresponse to abiotic stress stimulus (LOC_Os04g50820, LOC_Os04g50880, LOC_Os04g50990, andLOC_Os04g51330). The SNP marker, snpOS00938 sits within the sequence of LOC_Os04g51172, and ispredicted to be an intron variant of the gene. Additionally, it was noted that snpOS00941 is a downstreamgene variant of LOC_Os04g51440, a putative villin protein and have been shown to be important regulatorof actin. It is orthologous to the Arabidopsis gene AT4G30160 with a putative villin 4 function.
Discussion
qRCA4 is effective across multiple genetic backgroundsLoading [MathJax]/jax/output/CommonHTML/fonts/TeX/fontdata.js

Page 14/27
Due to variation in genetic backgrounds, a genomic region identi�ed to be effective in one mappingpopulation may not necessarily be identi�ed in other genetic backgrounds. Validation of the effect ofthese QTL in multiple genetic background is necessary before more downstream work can be carried outi.e., gene cloning and integration in breeding programs. This study utilised F2 segregating populationsderived from three different genetic backgrounds to validate the effect of a major genomic region, qRCA4,controlling narrow root cone angle in AP systems. This region was shown to have signi�cant effects intwo (RL11 and Langi) out of three genetic backgrounds, with effects ranging from a decrease of 11.7° − 15.1° in RCA, explaining between 9.3–17.3% of the genetic variation present, further strengthening itssigni�cance and utility in improving rice AP adaptation. In rice, similar strategies have been carried out,such as the case of SUB1A QTL mapping and molecular breeding. SUB1 was �rst mapped using F3sderived from IR40931-26/PI543581 (Xu and Mackill 1996), and then several independent studiescon�rmed this QTL across several genetic backgrounds (Nandi et al. 1997; Siangliw et al. 2003). Theselaid down the foundation towards breeding for Sub1 mega-varieties through the subsequent identi�cationof causative gene and SNP molecular markers which enabled transfer through marker assisted selection(MAS) (Bailey-Serres et al. 2010). Following this, validation of qRCA4 is therefore a critical step not onlyto ensure its effectiveness across several genetic backgrounds but to also warrant its utility in breedingprograms through MAS. Similar to the present results, DRO2 was also detected in three geneticbackgrounds, ARC5955, Pinulupot 1, and Tupa729, and was shown to be related with deeper rooting intransplanted systems (Uga et al. 2013b). In the population derived from Norin PL8, no signi�cantassociation was detected although signi�cant phenotypic variation existed in the F2 indicating that othergenomic regions may play a role in the control of RCA in this population. It can also be noted that threemarkers utilised in this study were monomorphic between IRAT109 and Norin PL8, in addition to NorinPL8 showing narrower RCA compared with the other checks evaluated in this study. This further supportsthe notion that Norin PL8 already possess the qRCA4 locus.
KASP-based SNP markers tagging qRCA4 were developedMolecular markers are essential for the seamless introgression of target traits into recipient genotypescarried out through MAS in a typical molecular breeding program. In rice, a suite of molecular markershas been designed and developed tagging high value traits such as yield components, grain quality, anddisease resistance (Steele et al. 2018; Yang et al. 2019). This study, for the �rst time, reports thesimultaneous validation and development of KASP based SNP markers targeting qRCA4, a highlyvaluable genomic region for AP adaptation. With the advent of more cost-effective whole genomesequencing technologies, SNPs became the marker of choice in many breeding programs. Using theFluidigm SNP genotyping platform, Kim et al. (2016) developed SNP markers targeting yield enhancingloci – Gn1a, SPL14, Ghd7, GS5, and GS3. Gel-based SNP markers have also been developed targetingblast and bacterial blight resistance genes, Pita and xa5, respectively (Ramkumar et al. 2015). Theseother SNP genotyping platforms were also available but KASP has been in the forefront of these as it ismore preferred due to its cost effectivity, assay conversion rate, accuracy, and �exibility (Semagn et al.2014), especially in the context of marker assisted backcrossing and marker assisted recurrent selectionapplications. KASP technology have also been shown to work using single seed genotyping in rice,Loading [MathJax]/jax/output/CommonHTML/fonts/TeX/fontdata.js

Page 15/27
further facilitating its adoption in breeding programs by allowing breeders to combine rapid generationadvance techniques more effectively (Arbelaez et al. 2019b). To our knowledge, these are the �rst highthroughput SNP markers targeting root growth angle traits developed, whether in traditional �ooded or inAP systems. KASP markers have been developed at IRRI, but have not included root traits such as RCA.An independent work by Steele et al. (2018) also developed KASP markers but only included diseaseresistance and grain quality traits. Additionally, Yang et al. (2019) also developed a core KASP SNP settailored for rice varietal assessment, genetic diversity analysis, and also included markers for agronomictraits such as yield, quality, resistance, fertility, and phenology.
Using the newly developed KASP markers, this present study also further delimited the con�dence intervalof the qRCA4 QTL into ~ 720 kb region, from a previous ~ 910 kb region. This new con�dence interval is�anked by markers snpOS00935 and snpOS00944. Additionally, SNP markers snpOS00938 andsnpOS00941, may also be the most useful markers as they may represent the variation that is indicativeof the presence of qRCA4. In terms of qRCA1.1, qRCA2.1, and qRCA2.2, no markers were developedassociated with these as the markers used did not show signi�cant association with RCA in the testedpopulations. This may be due to several reasons. First, the markers tested were very limited, only oneeach for the individual QTL and may warrant the design of additional markers to saturate each region.Second is that these QTL might be background speci�c which further highlights the importance of thisQTL validation exercise. Lastly, in terms of qRCA2.1 and qRCA2.2, the markers targeting them may havenot shown effect since these QTL were only shown to be signi�cant in IWS conditions (Vinarao et al.2021). Further testing of the designed markers in IWS conditions should be carried out to de�nitivelycheck the association of these markers with RCA.
Examining the LD map for qRCA4, the four markers identi�ed above represent the three linkage groupsdetected and are therefore enough to ascertain the introgression of the qRCA4 locus. Molecular markerquality metrics (as described by Platten et al. (2019)) of these four markers also showed high call rates,low FNR, and relatively low FPR. By genotyping lines relevant to the Australian breeding program, it hasalso shown the predicted high utility of these markers. The KASP assay, compared with other �xed SNParrays, are �exible and individual markers can be run together with other markers. By developing qRCA4markers in KASP system, this also ensures its seamless integration in breeding programs and can beeasily pyramided with other high-value AP adaptation genes/QTL such as those for cold tolerance.
3KRGP and database search facilitated the identi�cation ofpotential donors and candidate genesIn any breeding program, the availability of donor and favourable alleles for traits of interest is veryimportant. In cases where these alleles/traits are not available, exotic germplasm such as wildprogenitors may be used but this would take an arduous effort to transfer the traits into cultivatedgermplasm. It is therefore highly important to identify readily available donor genotypes for use inspeci�c breeding programs. Using the publicly available 3KRGP SNP genotyping data (Mansueto et al.2017), allele mining was carried out to identify possible donors within speci�c subpopulations. Donors in
Loading [MathJax]/jax/output/CommonHTML/fonts/TeX/fontdata.js

Page 16/27
various subpopulations were identi�ed including indica, tempjap, tropjap, and subtrop. These donors areavailable at IRRI and may be requested if deemed useful for the particular program. This study alsohighlights the utility of publicly available databases to augment in discovery process and help breedersmake more informed decisions, as in this case, donor parent selection.
Using the newly determined con�dence interval, candidate genes along the qRCA4 region were alsoidenti�ed through RAPDB (Sakai et al. 2013). Genes related with plant response to abiotic stress stimuluswere identi�ed, including LOC_Os04g51330. LOC_Os04g51330 was similar to a maltose excess protein, aprobable maltose transporter vital for the conversion of starch to sucrose in leaves at night (Niittyla et al.2004) and more importantly, an orthologue of the Arabidopsis root cap protein 1. On the other hand,LOC_Os04g51440, was identi�ed which is an orthologue of to the Arabidopsis gene AT4G30160 (putativeVILLIN 4). In Arabidopsis, VILLIN 4 proteins have been to be involved in root hair growth through theregulation of actin organisation (Zhang et al. 2011), and in rice, VILLIN 2 was shown to be important inregulating plant architecture through the modulation of micro�lament dynamics and polar auxintransport (Wu et al. 2015). These genes represent excellent targets for downstream cloning experimentsto characterise the molecular function of the gene associated with qRCA4 and narrow RCA in APsystems. Emerging technologies for gene cloning such as CRISPR (Clustered Regularly Interspaced ShortPalindromic Repeats) with CRISPR-associated protein Cas9 (CRISPR-Cas9) holds promise and may beutilised to precisely engineer and target variations present in the qRCA4 region and candidate genes ofinterest (Zafar et al. 2020). Non-targeted metabolic pro�ling of genotypes with contrasting RCAphenotypes and qRCA composition across several environmental conditions may also reveal biochemicalpathways and speci�c metabolites which may aid in understanding mechanisms related with rice plant’sability to cope with and tolerate stress involving transient water de�cit. Finally, transcriptomic pro�lingand network analysis of contrasting genotypes may show differentially expressed genes in modules andalong with metabolic pro�ling, may provide a systems level understanding of rice response to transientwater de�cit, and ultimately, AP adaptation.
ConclusionsThis study validated the effect of qRCA4 in multiple genetic backgrounds further reinforcing its value inimprovement of rice genotypes for AP adaptation. Simultaneously, high-throughput KASP SNP molecularmarkers were also developed to tag this genomic region which will facilitate its seamless introgressioninto target recipient genotypes especially in breeding programs where AP adaptation traits are important.This study reports for the �rst time the development of such markers associated with root traits, whetherin traditional transplanted �ooded or in AP systems. Molecular marker quality metrics also show markerrobustness and possible high utility in breeding programs. Using 3KRGP, potential donors acrosssubpopulations were identi�ed representing readily available donors for use of prospective breedingprograms. Candidate genes along the qRCA4 region were also identi�ed and were shown to either beassociated with plant response to abiotic stress stimulus or related with root development. Physiologicalanalysis of the relationship of RCA and this locus with grain yield and key traits such as those related tophotosynthetic rates and metabolic activities under different environmental conditions will shed someLoading [MathJax]/jax/output/CommonHTML/fonts/TeX/fontdata.js

Page 17/27
light on mechanisms related to its action and further increase the value of this genomic region andassociated molecular markers, speci�cally in AP systems. This study provides the tools to breeders forthe development of genotypes with narrow rooting angle and greater depth, through MAS, ultimately formore sustainable rice production in environments where rice is exposed to transient water de�cit.
Abbreviations3KRGP3K Rice Genome ProjectAPaerobic rice productionDASdays after sowingFNRfalse negative rateFPRfalse positive rateIRLAIRAT109/LangiIRNOIRAT109/Norin PL8IRRIInternational Rice Research InstituteIRRLIRAT109/RL 11IWSintermittent water stressKASPkompetive allele-speci�c PCRLDlinkage disequilibriumLODlogarithm of oddsMASmarker assisted selectionQTLquantitative trait lociRAP-DBRice Annotation Project DatabaseRCA
Loading [MathJax]/jax/output/CommonHTML/fonts/TeX/fontdata.js

Page 18/27
root cone angleRDRratio of deep rootsRILrecombinant inbred linesRPrecipient parentRSAroot system architectureSMAsingle marker analysisSNPsingle nucleotide polymorphismSSRsimple sequence repeatsUQUniversity of Queensland
Declarations
FundingThis work was funded by AgriFutures under project number: PRJ-011067.
Competing interestsThe authors declare no con�icts of interest in this study.
Ethics approval and consent to participateNot applicable
Consent for publication
Not applicable
Availability of Data and MaterialsThe datasets used and/or analysed during the current study are available from the corresponding authoron reasonable request.
Loading [MathJax]/jax/output/CommonHTML/fonts/TeX/fontdata.js

Page 19/27
Code availabilityNot applicable
Authors’ contributionsAll authors contributed to the study design. C.P. developed the segregating populations utilised in thispaper. R.V. carried out glasshouse experiments, R.V. and C.P. performed data analysis and linkagemapping. The �rst draft of the manuscript was written by R.V. and all authors commented on subsequentversions of the manuscript. All authors read and approved the �nal manuscript.
AcknowledgmentsThe authors would like to thank the UQ’s Central Glasshouse Services, Dr. Lisa Xian, and Dr. Venea DaraDaygon for their technical support. The authors would also like to thank the New South WalesDepartment of Primary Industries for providing the �xed genotypes utilised in this study. R.V. wassupported by the Australian Government Research Training Program Scholarship and the CharlesMorphett Pegler Scholarship.
ReferencesArbelaez JD et al. (2019a) 1k-RiCA (1K-Rice Custom Amplicon) a novel genotyping amplicon-based SNPassay for genetics and breeding applications in rice. Rice 12:55. doi:10.1186/s12284-019-0311-0
Arbelaez JD et al. (2019b) Methodology: ssb-MASS: a single seed-based sampling strategy for marker-assisted selection in rice. Plant Methods 15. doi:10.1186/s13007-019-0464-2
Bailey-Serres J, Fukao T, Ronald P, Ismail A, Heuer S, Mackill D (2010) Submergence tolerant rice: SUB1’sjourney from landrace to modern cultivar. Rice 3:138-147. doi:10.1007/s12284-010-9048-5
Bradbury PJ, Zhang Z, Kroon DE, Casstevens TM, Ramdoss Y, Buckler ES (2007) TASSEL: software forassociation mapping of complex traits in diverse samples. Bioinformatics 23:2633-2635
Broman KW, Wu H, Sen S, Churchill GA (2003) R/qtl: QTL mapping in experimental crosses.Bioinformatics 19:889-890. doi:10.1093/bioinformatics/btg112
Cobb JN, Biswas PS, Platten JD (2019) Back to the future: revisiting MAS as a tool for modern plantbreeding. Theor Appl Genet 132:647-667. doi:10.1007/s00122-018-3266-4
Collard BCY, Mackill DJ (2008) Marker-assisted selection: an approach for precision plant breeding in thetwenty-�rst century. Philos Trans R Soc B-Biol Sci 363:557-572. doi:10.1098/rstb.2007.2170
Loading [MathJax]/jax/output/CommonHTML/fonts/TeX/fontdata.js

Page 20/27
Elliott J et al. (2014) Constraints and potentials of future irrigation water availability on agriculturalproduction under climate change. Proc Natl Acad Sci U S A 111:3239-3244.doi:10.1073/pnas.1222474110
Kato Y, Abe J, Kamoshita A, Yamagishi J (2006) Genotypic variation in root growth angle in rice (Oryzasativa L.) and its association with deep root development in upland �elds with different water regimes.Plant Soil 287:117-129. doi:10.1007/s11104-006-9008-4
Kato Y, Katsura K (2014) Rice adaptation to aerobic soils: physiological considerations and implicationsfor agronomy. Plant Prod Sci 17:1-12. doi:10.1626/pps.17.1
Kato Y, Okami M, Katsura K (2009) Yield potential and water use e�ciency of aerobic rice (Oryza sativaL.) in Japan. Field Crop Res 113:328-334. doi:10.1016/j.fcr.2009.06.010
Khush GS (2005) What it will take to feed 5.0 billion rice consumers in 2030. Plant molecular biology59:1-6. doi:10.1007/s11103-005-2159-5
Kim SR et al. (2016) Development and validation of allele-speci�c SNP/indel markers for eight yield-enhancing genes using whole-genome sequencing strategy to increase yield potential of rice, Oryzasativa L. Rice 9. doi:10.1186/s12284-016-0084-7
Kitomi Y, Kanno N, Kawai S, Mizubayashi T, Fukuoka S, Uga Y (2015) QTLs underlying natural variation ofroot growth angle among rice cultivars with the same functional allele of DEEPER ROOTING 1. Rice 8:12.doi:10.1186/s12284-015-0049-2
Kumar S, Stecher G, Li M, Knyaz C, Tamura K (2018) MEGA X: Molecular Evolutionary Genetics Analysisacross computing platforms. Molecular Biology and Evolution 35:1547-1549.doi:10.1093/molbev/msy096
Lou QJ et al. (2015) Quantitative trait locus mapping of deep rooting by linkage and association analysisin rice. J Exp Bot 66:4749-4757. doi:10.1093/jxb/erv246
Mackill DJ, McNally KL (2004) A model crop species: Molecular markers in rice. In: Molecular markersystems in plant breeding and crop improvement. Springer, pp 39-54
Mansueto L et al. (2017) Rice SNP-seek database update: new SNPs, indels, and queries. Nucleic AcidsRes 45:D1075-D1081. doi:10.1093/nar/gkw1135
McCouch SR et al. (2002) Development and mapping of 2240 new SSR markers for rice (Oryza sativa L.).DNA Res 9:199-207. doi:10.1093/dnares/9.6.199
Mitchell JH, Proud C, Nguyen TM, Fukai S (2019) Traits of importance for aerobic rice Paper presented atthe Proceedings of the 19th Australian Society of Agronomy Conference, Wagga Wagga, NSW, Australia,
Loading [MathJax]/jax/output/CommonHTML/fonts/TeX/fontdata.js

Page 21/27
Nandi S, Subudhi PK, Senadhira D, Manigbas NL, Sen-Mandi S, Huang N (1997) Mapping QTLs forsubmergence tolerance in rice by AFLP analysis and selective genotyping. Molecular and GeneralGenetics MGG 255:1-8. doi:10.1007/s004380050468
Niittyla T, Messerli G, Trevisan M, Chen J, Smith AM, Zeeman SC (2004) A previously unknown maltosetransporter essential for starch degradation in leaves. Science 303:87-89. doi:10.1126/science.1091811
Platten JD, Cobb JN, Zantua RE (2019) Criteria for evaluating molecular markers: Comprehensive qualitymetrics to improve marker-assisted selection. PLoS One 14:e0210529.doi:10.1371/journal.pone.0210529
R Core Team (2019) R: A language and environment for statistical computing. R Foundation forStatistical Computing.
Ramkumar G, Prahalada GD, Hechanova SL, Vinarao R, Jena KK (2015) Development and validation ofSNP-based functional codominant markers for two major disease resistance genes in rice (O. sativa L.).Mol Breed 35:129. doi:10.1007/s11032-015-0323-4
Sakai H et al. (2013) Rice Annotation Project Database (RAP-DB): An integrative and interactive databasefor rice genomics. Plant Cell Physiol 54:E6. doi:10.1093/pcp/pcs183
Semagn K, Babu R, Hearne S, Olsen M (2014) Single nucleotide polymorphism genotyping usingKompetitive Allele Speci�c PCR (KASP): overview of the technology and its application in cropimprovement. Mol Breed 33:1-14. doi:10.1007/s11032-013-9917-x
Siangliw M, Toojinda T, Tragoonrung S, Vanavichit A (2003) Thai jasmine rice carrying QTLch9 (SubQTL)is submergence tolerant. Ann Bot 91:255-261. doi:10.1093/aob/mcf123
Smith AB, Liw P, Cullis BR (2006) The design and analysis of multi-phase plant breeding experiments.Journal of Agricultural Science 144:393-409. doi:10.1017/s0021859606006319
Steele KA et al. (2018) Accelerating public sector rice breeding with high-density KASP markers derivedfrom whole genome sequencing of indica rice. Mol Breed 38. doi:10.1007/s11032-018-0777-2
Thomson MJ et al. (2017) Large-scale deployment of a rice 6 K SNP array for genetics and breedingapplications. Rice 10:40. doi:10.1186/s12284-017-0181-2
Uga Y, Kitomi Y, Yamamoto E, Kanno N, Kawai S, Mizubayashi T, Fukuoka S (2015) A QTL for root growthangle on rice chromosome 7 is involved in the genetic pathway of DEEPER ROOTING 1. Rice 8.doi:10.1186/s12284-015-0044-7
Uga Y et al. (2013a) Control of root system architecture by DEEPER ROOTING 1 increases rice yield underdrought conditions. Nature Genet 45:1097. doi:10.1038/ng.2725
Loading [MathJax]/jax/output/CommonHTML/fonts/TeX/fontdata.js

Page 22/27
Uga Y, Yamamoto E, Kanno N, Kawai S, Mizubayashi T, Fukuoka S (2013b) A major QTL controlling deeprooting on rice chromosome 4. Sci Rep 3. doi:10.1038/srep03040
Vinarao R, Proud C, Zhang X, Snell P, Fukai S, Mitchell J (2021) Stable and novel quantitative trait loci(QTL) confer narrow root cone angle in an aerobic rice (Oryza sativa L.) production system. Rice 14:28.doi:10.1186/s12284-021-00471-2
Wu SY et al. (2015) VLN2 regulates plant architecture by affecting micro�lament dynamics and polarauxin transport in rice. Plant Cell 27:2829-2845. doi:10.1105/tpc.15.00581
Xu K, Mackill DJ (1996) A major locus for submergence tolerance mapped on rice chromosome 9. MolBreed 2:219-224. doi:10.1007/BF00564199
Yang G et al. (2019) Development of a core SNP arrays based on the KASP method for molecularbreeding of rice. Rice 12:21. doi:10.1186/s12284-019-0272-3
Zafar K et al. (2020) Genome editing technologies for rice improvement: progress, prospects, pand safetyconcerns. Frontiers in Genome Editing 2:5. doi:10.3389/fgeed.2020.00005
Zhang Y, Xiao YY, Du F, Cao LJ, Dong HJ, Ren H (2011) Arabidopsis VILLIN4 is involved in root hairgrowth through regulating actin organization in a Ca2+-dependent manner. New Phytol 190:667-682.doi:10.1111/j.1469-8137.2010.03632.x
Supplementary TablesTable S1 Chi-square analysis of the observed and expected Mendelian segregation ratio for unfavourable(AA), favourable (BB), and heterozygote (AB) alleles in the F2 populations (POP).
Loading [MathJax]/jax/output/CommonHTML/fonts/TeX/fontdata.js

Page 23/27
SNP ID POP AA AB BB Chi-Square P Value
snpOS00933 IRLA 50 101 42 1.08 0.582
snpOS00934 IRLA 49 103 43 0.99 0.610
snpOS00935 IRLA 49 104 41 1.67 0.434
snpOS00938 IRLA 44 109 43 2.48 0.289
snpOS00940 IRLA 44 107 45 1.66 0.435
snpOS00941 IRLA 44 107 45 1.66 0.435
snpOS00944 IRLA 44 106 46 1.35 0.510
snpOS00945 IRLA 47 111 33 7.08 0.029*
snpOS00947 IRLA 46 118 25 16.35 0.000*
snpOS00948 IRLA 54 91 48 1.00 0.607
snpOS00933 IRNO 65 134 82 2.66 0.265
snpOS00935 IRNO 66 137 80 1.67 0.434
snpOS00940 IRNO 65 138 79 1.52 0.468
snpOS00944 IRNO 66 141 75 0.57 0.750
snpOS00945 IRNO 70 151 58 2.93 0.231
snpOS00947 IRNO 70 179 26 39.13 0.000*
snpOS00948 IRNO 61 146 76 1.88 0.391
snpOS00933 IRRL 87 171 67 3.35 0.187
snpOS00934 IRRL 89 166 69 2.67 0.264
snpOS00935 IRRL 89 168 71 2.17 0.338
snpOS00938 IRRL 92 168 65 4.86 0.088
snpOS00940 IRRL 91 170 67 3.95 0.139
snpOS00941 IRRL 91 168 67 3.84 0.147
snpOS00944 IRRL 89 170 69 2.88 0.237
snpOS00947 IRRL 74 169 65 3.45 0.178
snpOS00948 IRRL 77 155 82 0.21 0.900
*: P < 0.05
Loading [MathJax]/jax/output/CommonHTML/fonts/TeX/fontdata.js

Page 24/27
Genotype/Variety 3KRGPIRIS ID
Countryof Origin
Chr04:30302635 Chr04:30461857 Subpopulation
Y134 CX15 - A T Indica
IAS 22-8PALMAR::IRGC26058-1
IRIS313-10967
Brazil A T Temperatejaponica
CX578 CX578 - A T Temperatejaponica
LEUANGGLIANG::IRGC71271-1
IRIS313-9123
Thailand A T Subtropicaljaponica
NAM ROO::IRGC66996-1
IRIS313-10176
Thailand A T Subtropicaljaponica
CHA LOY OE::C1 IRIS313-7856
- A T Subtropicaljaponica
KAO SONGHAI::IRGC 61827-1
IRIS313-11623
China A T Subtropicaljaponica
SI NAMPUENG::IRGC75165-1
IRIS313-11926
Thailand A T Subtropicaljaponica
XIENGKANG::IRGC82533-1
IRIS313-12063
Lao PDR A T Subtropicaljaponica
THATENG::IRGC86377-1
IRIS313-12134
Lao PDR A T Subtropicaljaponica
SET::IRGC 92200-1
IRIS313-12227
Lao PDR A T Subtropicaljaponica
A MOUK::IRGC94474-1
IRIS313-12252
Lao PDR A T Subtropicaljaponica
BAN BONG::IRGC94565-1
IRIS313-12254
Lao PDR A T Subtropicaljaponica
NYAE::IRGC95302-1
IRIS313-12262
Lao PDR A T Subtropicaljaponica
TA SENG::IRGC99176-1
IRIS313-12312
Lao PDR A T Subtropicaljaponica
Loading [MathJax]/jax/output/CommonHTML/fonts/TeX/fontdata.js

Page 25/27
BAN KEO::IRGC99953-1
IRIS313-12323
Lao PDR A T Subtropicaljaponica
DENG NYAY::IRGC106907-1
IRIS313-12332
Lao PDR A T Subtropicaljaponica
HAI NA::IRGC107117-1
IRIS313-12342
Lao PDR A T Subtropicaljaponica
LAB::IRGC107468-1
IRIS313-12346
Lao PDR A T Subtropicaljaponica
KHAI DO::IRGC12903-2
IRIS313-10679
Lao PDR A T Subtropicaljaponica
KHAO TAM::IRGC30085-2
IRIS313-11093
Lao PDR A T Subtropicaljaponica
Table S2. Potential donors of qRCA4 locus identi�ed using SNP genotype data publicly available throughthe 3K Rice Genotyping Project (3KRGP).
Figures
Loading [MathJax]/jax/output/CommonHTML/fonts/TeX/fontdata.js

Page 26/27
Figure 1
Molecular map of qRCA4 using newly designed molecular markers and validation results from twopopulations. Black lines indicate polymorphic markers between IRAT109 and other check genotypes used,while blue lines indicate monomorphic markers between IRAT109 and Norin PL8. Red dashed linesindicate the new con�dence interval computed.
Loading [MathJax]/jax/output/CommonHTML/fonts/TeX/fontdata.js

Page 27/27
Figure 2
Cluster genotype of KASP molecular markers (A) snpOS00938 and (B) snpOS00941 using F2 segregatingpopulation.
Supplementary Files
This is a list of supplementary �les associated with this preprint. Click to download.
Fig.S1.png
Fig.S2.png
Loading [MathJax]/jax/output/CommonHTML/fonts/TeX/fontdata.js