angle of attack modulation for mars entry terminal state
TRANSCRIPT

American Institute of Aeronautics and Astronautics
1
Angle of Attack Modulation for Mars Entry Terminal State Optimization
Jarret M. Lafleur* Georgia Institute of Technology, Atlanta, Georgia 30332
and
Christopher J. Cerimele† NASA Johnson Space Center, Houston, Texas 77058
From the perspective of atmospheric entry, descent, and landing (EDL), one of the most foreboding destinations in the solar system is Mars due in part to its exceedingly thin atmosphere. To benchmark best possible scenarios for evaluation of potential Mars EDL system designs, a study is conducted to optimize the entry-to-terminal-state portion of EDL for a variety of entry velocities and vehicle masses, focusing on the identification of potential benefits of enabling angle of attack modulation. The terminal state is envisioned as one appropriate for the initiation of terminal descent via parachute or other means. A particle swarm optimizer varies entry flight path angle, ten bank profile points, and ten angle of attack profile points to find maximum-final-altitud e trajectories for a 10 × 30 m ellipsled at 180 different combinations of values for entry mass, entry velocity, terminal Mach number, and minimum allowable altitude. Parametric plots of maximum achievable altitude are shown, as are examples of optimized trajectories. It is shown that appreciable terminal state altitude gains (2.5-4.0 km) over pure bank angle control may be possible if angle of attack modulation is enabled for Mars entry vehicles. Gains of this magnitude could prove to be enabling for missions requiring high-altitude landing sites. Conclusions are also drawn regarding trends in the bank and angle of attack profiles that produce the optimal trajectories in this study, and directions for future work are identified.
Nomenclature CD = vehicle drag coefficient m = vehicle mass CL = vehicle lift coefficient MOLA = Mars Orbiter Laser Altimeter D = drag force on vehicle Mterm = trajectory termination Mach number DRM = Design Reference Mission r = vector from planet center to vehicle mass center EDL = Entry, Descent, and Landing ventry = inertial atmospheric entry velocity JSC = Johnson Space Center α = angle of attack L/D = vehicle lift-to-drag ratio φ = bank angle
I. Introduction ROM the perspective of atmospheric entry, descent, and landing (EDL), one of the most foreboding destinations in the solar system is the planet Mars. Unlike Earth, which has a relatively thick atmosphere and high gravity,
and the Moon, which has no atmosphere but low gravity, Mars has essentially the worst of both worlds: a thin atmosphere and relatively high gravity. Furthermore, the atmosphere of Mars is thick enough to require that vehicles utilize thermal protection against the heat of entry, necessitating rapid configurational changes throughout flight. In the case of human-class vehicles – or even large robotic vehicles – massive payloads coupled with launch-vehicle-limited aeroshell diameters typically result in very high vehicle ballistic coefficients and low L/D. Because of this, it is generally impossible to decelerate these vehicles to velocities much lower than Mach 1.5 or Mach 2
*Ph.D. Candidate, Daniel Guggenheim School of Aerospace Engineering, Student Member AIAA. †Branch Chief, Flight Mechanics and Trajectory Design Branch/EG5, Member AIAA.
F
AIAA Atmospheric Flight Mechanics Conference10 - 13 August 2009, Chicago, Illinois
AIAA 2009-5611
This material is declared a work of the U.S. Government and is not subject to copyright protection in the United States.

American Institute of Aeronautics and Astronautics
2
without the assistance of supersonic propulsion, large supersonic parachutes, or other large inflatable aerodynamic decelerators, none of which are yet proven for the Martian environment.
Given the difficulty of Mars EDL, it is of interest to the Mars entry community to benchmark best possible entry scenarios for the evaluation of potential descent and landing system designs. This paper focuses on the optimization of the entry-to-terminal-state phase for a variety of entry velocities and vehicle masses by selecting appropriate entry flight path angles, bank angle profiles, and angle of attack profiles. The terminal state is envisioned as one appropriate for initiation of a terminal descent system, such as a parachute. As will soon be discussed, the metric chosen to represent these “best” cases is the maximum achievable altitude at a given Mach number.
This study is an extension of a previous vehicle-independent parametric study1 which considered only entry flight path angle and bank angle profile as free variables. Thus, the present study is important in that it allows an assessment of the potential benefit to developing angle of attack modulation techniques for future Mars entry vehicles. As will be discussed, unlike the previous vehicle-independent study, study of angle of attack modulation requires the assumption of a representative vehicle, which is here chosen to be a 10 m × 30 m ellipsled. The ellipsled shape is basically cylindrical with an ellipsoidal nose, in the same aerodynamic class as biconics. Its shape tends to package well in launch vehicles while allowing exposure of a relatively large drag surface area during entry.
II. Previous Work on Entry Angle of Attack Profile Design Overall, in civil space programs, the design of angle of attack modulation profiles for atmospheric entry is less
established than the design of bank angle modulation profiles. Banking during atmospheric entry allows for the rotation of a vehicle’s lift vector (see Fig. 1) and allows a large degree of vertical and out-of-plane control for achieving target landing sites or other trajectory objectives. A variety of guidance algorithms have been developed to effect these bank angle modulations, and entry guidance has been employed in Earth entry for manned vehicles since the Gemini program.1
In contrast, whereas banking allows the direction of the lift vector to vary throughout flight, angle of attack modulation allows the lift and drag coefficient magnitudes (and thus both ballistic coefficient and lift-to-drag ratio) to vary. The means of achieving angle of attack modulation (flaps, center of gravity movement, [limited] thrusters, or a combination of these) are somewhat more varied than bank angle modulation but are also more limited in the angular range they allow. While it is relatively simple to fire rotational thrusters and bank a full 360° during flight, angle of attack modulation by any of the methods above is typically limited to a few tens of degrees because of the aerodynamic moments that must be overcome.
No previous or planned missions to Mars have utilized trajectory control through angle of attack modulation during entry, and in the history of civil spaceflight, only two vehicles – the U.S. Space Shuttle and the Soviet Buran counterpart – are known to have used angle of attack modulation in re-entry from orbit at Earth.‡ In the case of the U.S. Space Shuttle, bank angle is the primary control and governs downrange and crossrange during entry, in part because changes in bank angle have a much smaller effect on the heating distribution on the vehicle than changes in angle of attack. Angle of attack is used to control this heating environment and is also used for short-period guidance to the reference drag profile, particularly during atmospheric density spikes and bank reversals when the bank angle is temporarily unable to guide to the reference3. One additional study in the literature regarding angle of attack modulation for planetary entry treats the aerocapture at Neptune. In this study, angle of attack modulation is used to reduce propellant usage after aerocapture by increasing the accuracy with which the target orbit is achieved.4
However, to date, no study known to the authors has considered the systematic optimization of high-ballistic-coefficient Mars entry trajectories through control of angle of attack profile (or angle of attack plus bank profile). This is particularly important for Mars, where high-ballistic-coefficient vehicle trajectories can be severely limited
‡ It is known that the Soviet Buran shuttle, which flew once in 1988, utilized elevons and a body flap during entry,2 but the paucity of technical literature on its trajectory design complicates comparison with the U.S. Space Shuttle.
Figure 1. Bank Angle (φ) and Angle of Attack (α) definition.
American Institute of Aeronautics and Astronautics
3
in the landed altitudes they can achieve. It might be easily envisioned that a pitch-up maneuver (or pitch-down maneuver) at some point in the trajectory would be advantageous to achieving higher final altitudes and would be overlooked without considering angle of attack modulation. The goal of the present study is to assess the gains possible through such modulation, particularly in the context of the preliminary design of Mars entry trajectories.
III. Assumptions and Objective Function Selection
A. Objective Function One of the first steps in any trajectory optimization study is the definition of an objective function by which to
define an optimal trajectory. If a vehicle is defined and sizing models are available, the most obvious choice is the maximization of landed payload mass for a given entry mass or, equivalently, the minimization of entry mass for a given landed payload mass. However, vehicle sizing models are not available for this study, and in part for consistency with the previous parametric study,1 maximum terminal altitude is selected as the objective. That is, this study seeks altitude maximization for a given trajectory termination Mach number. The inherent assumption behind this objective is that it is desirable for an entry vehicle to be traveling as slow and as high as possible when terminal descent is initiated (via parachutes, inflatable aerodynamic decelerators, or propulsion) since altitude is often a proxy for time-to-ground. This reflects the desire to allow the vehicle the maximum altitude range over which to decelerate to acceptable touchdown velocities. Additionally, the maximum possible altitude can serve, in some cases, to bound the area of the Martian surface that a given vehicle can access,§ and it also serves to minimize initial aerodynamic loading on terminal descent devices such as parachutes and inflatable aerodynamic decelerators.
B. Assumptions In the completion of this study, several assumptions are made. These assumptions may be divided into the
categories of vehicle, atmosphere, constraints, and parametric ranges. Note that most of these assumptions, with the principal exception of the vehicle, are identical to those used in Ref. 1.
1. Vehicle Assumption
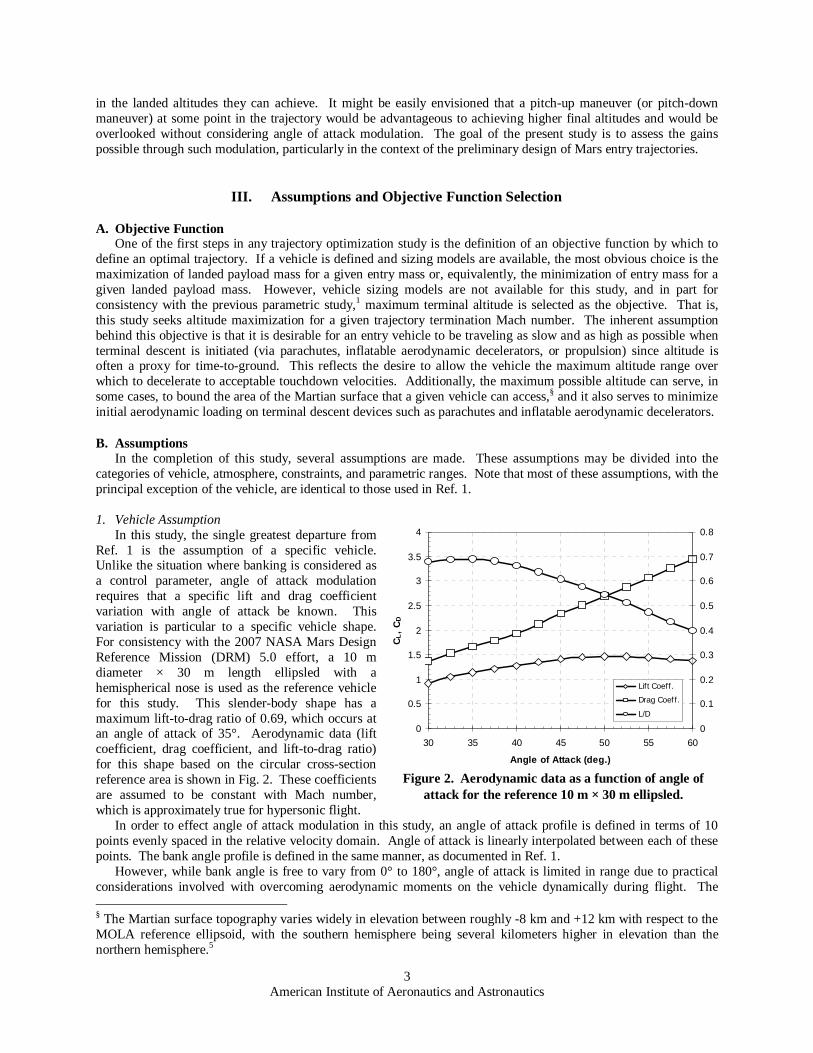
In this study, the single greatest departure from Ref. 1 is the assumption of a specific vehicle. Unlike the situation where banking is considered as a control parameter, angle of attack modulation requires that a specific lift and drag coefficient variation with angle of attack be known. This variation is particular to a specific vehicle shape. For consistency with the 2007 NASA Mars Design Reference Mission (DRM) 5.0 effort, a 10 m diameter × 30 m length ellipsled with a hemispherical nose is used as the reference vehicle for this study. This slender-body shape has a maximum lift-to-drag ratio of 0.69, which occurs at an angle of attack of 35°. Aerodynamic data (lift coefficient, drag coefficient, and lift-to-drag ratio) for this shape based on the circular cross-section reference area is shown in Fig. 2. These coefficients are assumed to be constant with Mach number, which is approximately true for hypersonic flight.
In order to effect angle of attack modulation in this study, an angle of attack profile is defined in terms of 10 points evenly spaced in the relative velocity domain. Angle of attack is linearly interpolated between each of these points. The bank angle profile is defined in the same manner, as documented in Ref. 1.
However, while bank angle is free to vary from 0° to 180°, angle of attack is limited in range due to practical considerations involved with overcoming aerodynamic moments on the vehicle dynamically during flight. The § The Martian surface topography varies widely in elevation between roughly -8 km and +12 km with respect to the MOLA reference ellipsoid, with the southern hemisphere being several kilometers higher in elevation than the northern hemisphere.5
0
0.5
1
1.5
2
2.5
3
3.5
4
30 35 40 45 50 55 60
Angle of Attack (deg.)
CL,
CD
0
0.1
0.2
0.3
0.4
0.5
0.6
0.7
0.8
L/D
Lift Coeff.
Drag Coef f.
L/D
Figure 2. Aerodynamic data as a function of angle of attack for the reference 10 m × 30 m ellipsled.

American Institute of Aeronautics and Astronautics
4
range of angles of attack used in this study is chosen in two steps: First, the center of the angle of attack range is defined, and next the allowable variation from that range is defined. To determine the center of the range, the findings of Ref. 1 are applied to the case of a 10 × 30 m ellipsled. Figure 3 shows vehicle characteristics for the chosen 10 m × 30 m ellipsled overlaid onto maximum altitude contours derived from Ref. 1. The contours from Ref. 1 provide the best attainable terminal altitude for Mars entry as a function of vehicle ballistic coefficient and lift-to-drag ratio (L/D), assuming only bank angle modulation is used. However, since the ballistic coefficient and L/D of a given vehicle (e.g., the ellipsled in this study) depends on its angle of attack, a locus of points exists on these plots (referred to as a “vehicle characteristic”) representing the achievable ballistic coefficient and L/D as a function of trim angle of attack. Overlaying the vehicle characteristic on plots from Ref. 1 allows an optimum trim angle of attack to be selected at the point where an altitude contour and the vehicle characteristic are parallel. Figure 3 is an example of the many such plots that can be drawn for varying ellipsled masses, entry velocities, and terminal velocities. These plots help illustrate a consistent tendency for optimum trim angles of attack for the banking-only case to fall in or near the 40-45° range.** This is consistent with the 45° hypersonic angle of attack investigated during the NASA 1998 Mars Combo Lander study,6 and 45° is chosen as the center of the angle of attack range in this study. Note that the basic assumption underlying the use of data from Ref. 1 is that optimal angle of attack modulation will be in a range near the angle of attack that would be optimal if modulation were not employed.
To develop an appropriate range of angles of attack
about the 45° center defined above, a modified Newtonian aerodynamics code is used to evaluate the change in angle of attack attainable through movement of a notional 15 m² (3.82 m chord) flap at the aft end of an ellipsled (see Fig. 4). The results, shown in Table 1, suggest that a 20-30° range in angle of attack may be attainable with a flap. It is felt that a reasonable range for this problem is 20°, and therefore the final absolute range of angle of attack for this study is taken to be 45 ± 10° (or 35° to 55°). It is important to note that because of the vehicle and angle of attack assumptions made here, this study should be taken in the context of a proof-of-concept analysis and parametric study of angle of attack modulation. If a future user has a definite vehicle in mind, this type of analysis should be re-executed with the aerodynamic data and angle of attack ranges for that vehicle. ** Note that maximum altitude does not result from flying continuously at L/Dmax and that the upward slope of the altitude contours indicate maximum altitude will only occur when flying on the “back side” of the L/D vs. α curve (i.e., at α higher than αL/D,max).
60 t Ellipsled 120 t Ellipsled
Figure 3. Vehicle characteristics for 10 × 30 m ellipsleds of different masses overlaid on a 4.7 km/s entry
velocity, Mach 5 terminal velocity plot from Ref. 1. Black contours represent best altitude (in km) achievable through banking only. Angles of attack indicated are for trim conditions.
Table 1. Effect of deflection of a notional flap on ellipsled angle of attack.
Flap Deflection ∆α
0° 0.0° 10° -11.2° 20° -26.9°

American Institute of Aeronautics and Astronautics
5
2. Atmosphere Assumption For consistency purposes with Ref. 1 and corresponding human Mars entry simulation efforts at other NASA
centers, an equatorial landing site is assumed for entry on November 3, 2010. The corresponding atmospheric density and temperature profiles from the widely-used Mars-GRAM engineering-level atmospheric model7 are shown in Fig. 5. Altitudes reported are above the MOLA reference ellipsoid.
3. Constraints Constraints include a 4.5 Earth-G acceleration limit to reflect acceptable deceleration for a deconditioned human
crew while also allowing a 0.5 G margin for dispersion performance. Convective heat rate is constrained to 1000 W/cm² (half the limit published by Ref. 8) over an assumed one-meter-radius sphere, although in the study results, no trajectories were limited by this constraint. Some series of runs are noted as implementing a 10 km “dip constraint”, which constrain those trajectories to minimum altitudes no less than 10 km, reflecting the desire to limit the extent to which a vehicle is allowed to skim close to the ground prior to a loft to a higher altitude. Additionally, trajectories are automatically terminated if they fall below -5 km in altitude.
4. Parametric Ranges
As summarized in Table 2, the effective matrix of runs for this study consists of inertial entry velocities of 3.3 km/s (representative of entry from a 500 km circular orbit), 4.7 km/s (representative of entry from a 1-sol elliptical orbit), and 5.5 km/s (representative of a robotic-class direct entry). Note that, while entry velocities reported are inertial, they are approximately equal to the relative entry velocity since the assumed entry azimuth is 0° (north). Vehicle mass (which is assumed constant throughout entry) ranges from 40 t to 120 t in increments of 20 t.†† Altitude is maximized at three distinct termination Mach numbers meant to represent potential parachute, inflatable, or propulsion deployment points: Mach 2.0, 3.5, and 5.0. †† Note that although absolute masses and vehicle dimensions are used in this study, these parameters can be scaled as necessary through mass-to-reference-area ratios. For example, a 100 t, 10 × 30 m ellipsled will have the same optimum altitude performance as a 50 t, 7.07 × 21.21 m ellipsled.
Figure 5. Density and Temperature profiles for the atmosphere assumed for this study.
Figure 4. 10 × 30 m ellipsled with a notional 15 m² (3.82 m chord) flap.
Table 2. Parameterization of Vehicle and Boundary Condition Variables.
Parameter Values Assessed Inertial Entry Velocity (km/s) 3.3, 4.7, 5.5 Termination Mach Number 2.0, 3.5, 5.0 Vehicle Mass (t) 40, 60, 80, 100, 120

American Institute of Aeronautics and Astronautics
6
IV. Simulation and Optimization Method
A. Entry Simulation The entry simulator used in this study is selected to allow quick, accurate trajectory simulation. A custom
MATLAB simulation models vehicle motion about an assumed spherical, rotating planet in a planet-centered inertial frame. Only three forces act on the vehicle: lift, drag, and gravity. These vector forces are translated into accelerations for the assumed constant-mass vehicle and integrated over time using MATLAB’s ode45 function. No bank rate or bank acceleration limitations are modeled, nor is sideslip angle considered. Heating is computed over a reference one-meter-radius sphere via the Sutton-Graves convective heating approximation. Note also that, as is applicable for skip-entry cases, atmospheric density is assumed to be zero above 125 km in altitude. Planet-specific simulation constants are shown in Table 3. Sample trajectory results from the MATLAB simulation were validated against trajectories generated via the Simulation and Optimization of Rocket Trajectories (SORT) tool used extensively at NASA Johnson Space Center (JSC).
B. Optimizer To allow a thorough global search through the bank-angle and entry-flight-path-angle space, the optimizer
selected is a particle swarm optimizer written originally for use on Mars Science Laboratory entry optimization.9 When both bank angle and angle of attack profile are allowed to vary, optimizations involve 100 particles limited to 300 iterations to determine the maximum attainable altitude by varying the inertial entry flight path angle, 10 bank angles, and 10 angles of attack evenly spaced along the expected relative velocity range (a 21-variable problem). When only angle of attack profile is allowed to vary, optimizations involve 50 particles limited to 200 iterations to determine the maximum attainable altitude by varying the inertial entry flight path angle, one (constant) bank angle, and 10 angles of attack evenly spaced along the expected relative velocity range (a 12-variable problem). Bank angles are limited to a range of 0° to 180°, angles of attack are limited to a range of 35° to 55° as discussed earlier, and entry flight path angle is limited to skip-out and g-limited ranges computed prior to the optimization process. Deceleration is limited to 4.5 Earth-G’s, and skip-out occurs when a simulation terminates on a 7-day time limit (allowing the optimizer to consider skip-entry trajectories). Otherwise, simulations nominally terminate based on Mach number (2.0, 3.5, or 5.0) or at a -5 km altitude.
V. Results and Discussion The data from this study yields a wealth of information on characteristics of Mars entry physics and implications
for the design of future Mars entry vehicles (crewed or otherwise). By no means is this section comprehensive in covering the implications of all this data; however, the most important trends and implications are illustrated. First, a parametric representation is presented to show the optimum altitudes that are identified by this study. Second, a series of sample trajectories is shown to illustrate typically how these altitudes are reached.
A. Parametric Representation of Optimum Altitudes Shown in Fig. 6 through Fig. 8 are plots of the maximum attainable final altitude (the objective function of the
optimization) as a function of vehicle entry mass, termination Mach number, whether the 10 km dip constraint is imposed, and what type of control is used (bank angle only, angle of attack only, or both bank angle and angle of attack). Each figure represents a different entry velocity (3.3 km/s, 4.7 km/s, or 5.5 km/s).
The first note to make about these figures is that, as would be expected, for a given termination Mach number and dip constraint, maximum attainable altitude decreases with increasing vehicle mass. Interestingly, the slopes of the lines on each plot are nearly identical, so the effect of increasing vehicle mass is essentially the same regardless of whether bank angle control, angle of attack control, or both bank and angle of attack control are used. However, the magnitude of the altitude that can be achieved is clearly dependent on the type of control used. In all cases, as expected, the combination of bank angle control and angle of attack control results (α + φ) in the highest possible
Table 3. Mars Entry Simulation Constants.
Mars Atmospheric Constants Mars Physical Constants Ratio of Specific Heats 1.289 Gravitational Parameter 42828 km³/s² Molecular Weight 43.34 g/mol Planetary Radius 3396 km Specific Gas Constant 191.8 J/kg/K Rotational Period 24.62 hours Maximum Altitude of Atmosphere 125 km Sphere of Influence Altitude 571140 km

American Institute of Aeronautics and Astronautics
7
terminal altitude. In all instances for the 4.7 km/s and 5.5 km/s entry velocities, angle of attack control (α only) is less effective than bank angle control (φ only). However, at the slower 3.3 km/s entry velocity and the two highest termination Mach numbers, this relative performance reverses and angle of attack control allows for higher final altitudes than bank angle control. This effect is likely related to the fact that, as found in the study from Ref. 1, bank-angle-only controlled trajectories tend not to follow the 4.5-G deceleration constraint for vehicles entering at low velocities and terminating at high Mach numbers. In contrast, the angle-of-attack-only controlled trajectories in these cases tend to fly a full-lift-up bank profile‡‡ from a steep initial flight path angle and add angle of attack variation which allows them to follow the 4.5-G constraint for a portion of the trajectory.
Also interestingly, comparison of the 4.7 km/s and 5.5 km/s figures (Fig. 7 and Fig. 8) shows that the φ only and α + φ curves are nearly identical, while the α only curves show higher altitude performance at the 4.7 km/s entry velocity than at 5.5 km/s. This may be due to the combination of the 20° range on angle of attack allowed in this study and the skip characteristics of optimal high-velocity entry that will be illustrated later in this paper.
Finally, as noted earlier, the three curves in each of the plots from Fig. 6 through Fig. 8 each tend to have similar slopes, indicating a near-constant altitude offset between the three control strategies. Allowing α + φ control consistently increases optimum final altitude by 2.5-4.0 km compared to φ only control. At 4.7 km/s, φ only control increases optimum final altitude by 3.5-5.0 km compared to α only control, and at 5.5 km/s, this increases to 3.5-8.0 km. These magnitudes are significant and could be mission-enabling. For example, this suggests that a future Mars mission (manned or unmanned) may be able to land at a site kilometers higher if angle of attack control is enabled in addition to the more traditional bank-angle control.
B. Sample Optimum Trajectories In this section, a series of sample trajectories is shown to illustrate the characteristics that allow the optimum
final altitudes in Fig. 6 through Fig. 8 to be reached. This data is organized to show comparisons among vehicles and scenarios that resemble the baseline design of the 1998 Mars Combo Lander6, which entered the Martian atmosphere at 3.3 km/s at 71.2 metric tons in a 10 × 20 m ellipsled. The entry trajectory design of this vehicle involved deploying a drogue parachute at Mach 3.52 at an altitude of 8.8 km. The comparison case selected from the runs in the present study was an 80-ton vehicle with a termination Mach number of 3.5. The most significant differences between the 1998 Mars Combo Lander and the case selected here are the length of the elliplsed (30 m instead of 20 m, which would tend to increase the achievable L/D and increase the maximum attainable altitude) and the entry mass (80 t instead of 71.2 t, which would increase the vehicle ballistic coefficient and decrease the maximum attainable altitude).
Seven trajectories are illustrated, and the characteristics of these trajectories are summarized in Table 4. Salient features of the trajectories are described in each of the following sections.
‡‡ In virtually all cases, the optimum angle-of-attack-only trajectories utilized a constant bank angle of zero degrees (i.e. full lift up).
Table 4. Summary of Sample Optimum Trajectories. Trajectory
No. Control
Type Entry Vel.
Dip Constraint
Termination Mach Mass
1 α + φ 3.3 km/s None 3.5 80 t 2 α only 3.3 km/s None 3.5 80 t 3 α + φ 3.3 km/s 10 km 3.5 80 t 4 α only 3.3 km/s 10 km 3.5 80 t 5 α + φ 4.7 km/s None 3.5 80 t 6 α + φ 5.5 km/s None 3.5 80 t 7 α only 5.5 km/s None 3.5 80 t

American Institute of Aeronautics and Astronautics
8
Figure 6. Maximum attainable altitude (in km) for an entry velocity of 3.3 km/s.
Absent data indicate cases that could not converge to meet 10 km dip constraints. Line color indicates the level of control used in the given case (i.e., only bank angle control, only angle of attack control, or both). The crossover of
the green and blue lines in the Mterm = 3.5, 10 km dip constraint plot is likely a result of the difficulty the particle swarm optimizer encounters in finding feasible cases near the 10 km dip constraint boundary.

American Institute of Aeronautics and Astronautics
9
Figure 7. Maximum attainable altitude (in km) for an entry velocity of 4.7 km/s.
Absent data indicate cases that could not converge to meet 10 km dip constraints. Line color indicates the level of control used in the given case (i.e., only bank angle control, only angle of attack control, or both).

American Institute of Aeronautics and Astronautics
10
Figure 8. Maximum attainable altitude (in km) for an entry velocity of 5.5 km/s.
Absent data indicate cases that could not converge to meet 10 km dip constraints. Line color indicates the level of control used in the given case (i.e., only bank angle control, only angle of attack control, or both).

American Institute of Aeronautics and Astronautics
11
1. Mars-Combo-Class Entry: No Dip Constraint, α + φ Control
Figure 9 shows a Mars-Combo-class entry with no dip constraint imposed and with both bank angle and angle of attack control allowed. The vehicle enters at a -14.2° entry flight path angle and initially banks to a full-lift-down orientation. However, the vehicle soon banks to full-lift-up, and angle of attack is at the minimum allowable value of 35° for the majority of the peak deceleration pulse. Note that this trend of pitching to the minimum angle of attack is common through the deceleration-limited trajectories in this study, and it is likely due to the fact that both lift and drag forces are minimized (resulting in lower decelerations) at this orientation (see Fig. 2). Some fluctuation of bank angle and angle of attack is visible through this deceleration pulse as these control parameters modulate to keep the deceleration within the 4.5-G constraint. At the end of the trajectory, bank angle remains steady at 0° and, importantly, angle of attack is at its maximum allowable limit (55°). This final pitch-up maneuver is common among the optimal trajectories in this study.
Additionally, it should be noted from Fig. 9 that the Mach 3.5 altitude achieved is 22.4 km, which is 2.5 times higher than the 8.8 km altitude achieved in the Mars Combo Lander study. However, in order to achieve this altitude, the vehicle dipped to a minimum altitude of 2.8 km. While this illustrates the substantial gains available from optimal banking and angle of attack control, it is not entirely realistic since the vehicle comes within a few kilometers of the surface of the planet while traveling Mach 8. In particular, this means that any advantages due to the accessibility of higher-altitude landing sites likely cannot be exploited by using this trajectory. This motivates the examination of dip constraints in this study.
Figure 9. Optimal trajectory data for a Mars-Combo-class entry with α + φ control and no dip constraint.

American Institute of Aeronautics and Astronautics
12
2. Mars-Combo-Class Entry: No Dip Constraint, α-only Control Figure 10 shows a Mars-Combo-class entry with no dip constraint imposed and with only angle of attack control
allowed (and with the constant bank angle determined through the optimization procedure). First, note the similarity in the achieved altitude: 22.1 km, as opposed to 22.4 km in the case where both angle of attack and bank angle control were allowed. The reason for these nearly-identical final altitudes becomes apparent when one realizes that the optimum bank profile from Fig. 9 is nearly full-lift-up for the entire trajectory, which is very close to the constant 0° bank angle profile converged upon for the α only case in Fig. 10. Furthermore, note that the major deviation from full-lift-up in Fig. 9 is the initial 180° bank angle. This initial bank angle has the effect of steepening the trajectory initially. However, note that this same effect is captured in Fig. 10 in the steeper entry flight path angle (i.e., steepening the entry flight path angle and banking to full-lift-down initially have very similar effects).§§ As a result of the reasons above, it is not surprising that the trajectory in Fig. 10 is nearly identical to the one in Fig. 9, including the fact that the 4.5-G constraint is reached, the minimum altitude is 3.0 km, and the angle of attack reaches the maximum allowable at the end of the trajectory. This type of similarity between the α only and α + φ cases is common at the low 3.3 km/s entry velocity terminating at high Mach numbers.
§§ In fact, it is very likely that the exceedingly steep -19.3° entry flight path angle in this case is enabled by the fact that angle of attack can be reduced to 35° to reduce loads on the vehicle during the peak deceleration pulse.
Figure 10. Optimal trajectory for a Mars-Combo-class entry with α-only control and no dip constraint.

American Institute of Aeronautics and Astronautics
13
3. Mars-Combo-Class Entry: 10 km Dip Constraint, α + φ Control Figure 11 shows a Mars-Combo-class entry with a 10 km dip constraint imposed and with both bank angle and
angle of attack control allowed. Note that this case is identical to the first case considered except with a dip constraint imposed, lending credibility to it as a less risky entry trajectory. Note that the achieved final altitude is only 16.6 km, or 5.8 km lower than the case where no dip constraint existed (although this is still nearly double the altitude achieved by the 1998 Mars Combo Lander). Substantial bank and angle of attack control occurs between Mach 11 and Mach 7 to prevent the trough of the trajectory from falling below 10 km. This leaves substantial deceleration margin (deceleration peaks at only 3.8 G’s), in part because the vehicle does not reach the high-density region of the atmosphere close to the surface. Note again that bank angle reaches 0° and angle of attack reaches 55° at the end of the trajectory.
Figure 11. Optimal trajectory for a Mars-Combo-class entry with α + φ control and 10 km dip constraint.

American Institute of Aeronautics and Astronautics
14
4. Mars-Combo-Class Entry: 10 km Dip Constraint, α-only Control Figure 12 shows a Mars-Combo-class entry with a 10 km dip constraint imposed and with only angle of attack
control allowed. Importantly, note that when the dip constraint was imposed in Fig. 11, the optimum bank profile was no longer full-lift-up. As a result, the trajectory in Fig. 12 is very different from Fig. 11 and has an optimum altitude of 12.6 km rather than 16.6 km. However, this is still 3.8 km higher than the 8.8 km achieved by the 1998 Mars Combo Lander. Here, the minimum altitude in the trajectory is the final altitude. Additionally, the deceleration environment is very benign, with deceleration peaking at less than 1.0 G.
Note once again that angle of attack reaches 55° at the end of the trajectory. However, also note the interesting spike in angle of attack at 2500 m/s. Mid-trajectory angle of attack spikes such as this are difficult to explain but can be found in many of the trajectories in this study (although the spike in this example is particularly prominent). As evidence that this spike is a real feature of the optimal trajectory and not an artifact of the optimization process, Fig. 13 shows the result of simulating the same trajectory without the spike. The result is a final altitude of 12.1 km rather than the 12.6 km achieved with the spike present.
Figure 12. Optimal trajectory for a Mars-Combo-class entry with α-only control and 10 km dip constraint.

American Institute of Aeronautics and Astronautics
15
Figure 13. Trajectory from Fig. 12 modified by removing the 2500 m/s angle of attack spike.

American Institute of Aeronautics and Astronautics
16
5. Mars-Combo-Class Vehicle with 4.7 km/s Entry: No Dip Constraint, α + φ Control Figure 14 shows a Mars-Combo-class vehicle entering at 4.7 km/s with no dip constraint imposed and with both
bank angle and angle of attack control allowed. Note that this is the same case as the first trajectory shown except with entry at 4.7 km/s instead of 3.3 km/s (e.g. entry from a 1-sol orbit rather than a low Mars orbit). Note that, despite the 42% higher entry velocity, the optimum altitude is 22.9 km compared to the original optimum of 22.4 km and the minimum altitude is 2.7 km compared to the original value of 2.8 km. This trajectory is deceleration-limited, as is clear from the fact that the peak deceleration is 4.48-G, and this is likely related to the similarities in the minimum and final altitudes (i.e. the 3.3 km/s case also reached the deceleration constraint). Again, angle of attack reaches 55° at the end of the trajectory and is near its minimum 35° value during the deceleration pulse.
Figure 14. Optimal trajectory for a 4.7 km/s entry with α + φ control and no dip constraint.

American Institute of Aeronautics and Astronautics
17
6. Mars-Combo-Class Vehicle with 5.5 km/s Entry: No Dip Constraint, α + φ Control Figure 15 shows a Mars-Combo-class vehicle entering at 5.5 km/s with no dip constraint imposed and with both
bank angle and angle of attack control allowed. Note that this is the same case as the first trajectory shown except with entry at 5.5 km/s instead of 3.3 km/s (e.g. entry from a hyperbolic incoming trajectory rather than a low Mars orbit). Despite the 67% higher entry velocity, the optimum altitude is 23.0 km compared to the original optimum of 22.4 km. This trajectory is deceleration-limited, as is clear from the fact that the peak deceleration is 4.44-G, and as noted for the 4.7 km/s case, this is likely related to the similarities in the final altitude (i.e., the 3.3 km/s case also reached the deceleration constraint). This trajectory, like many of the 5.5 km/s optimal trajectories, exhibits a skip, where an initial pass through the atmosphere to an altitude of 33.3 km is followed by a Keplerian phase with an apoapsis at 12,000 km altitude and a re-entry velocity of just under 4.5 km/s. As a result, the time from initial entry to the terminal state is 7.8 hours. Again, though, angle of attack reaches 55° at the end of the trajectory and is near its minimum 35° value during the deceleration pulse. Note also the presence of two angle of attack spikes, one prior to and one following the skip.
Figure 15. Optimal trajectory for a 5.5 km/s entry with α + φ control and no dip constraint.

American Institute of Aeronautics and Astronautics
18
7. Mars-Combo-Class Vehicle with 5.5 km/s Entry: No Dip Constraint, α-only Control Figure 16 shows a Mars-Combo-class vehicle entering at 5.5 km/s with no dip constraint imposed and with only
angle of attack control allowed. Compared to the previous trajectory, in this trajectory the absence of bank control (i.e., the need to select a single bank angle for the entire trajectory) prevents the vehicle from diving deep into the atmosphere to allow lofting, resulting instead in two skips, the first of which reaches an apoapsis altitude of 1500 km. As a result, the best achievable final altitude is 13.5 km, which is 9.5 km lower than the 23.0 km for the case with both angle of attack and bank angle control. However, again angle of attack reaches 55° at the end of the trajectory and is near its minimum 35° value during the deceleration pulse. Also again, an angle of attack spike is visible near 2500 m/s.
Figure 16. Optimal trajectory for a 5.5 km/s entry with α only control and no dip constraint.
American Institute of Aeronautics and Astronautics
19
VI. Conclusions and Implications This study has generated a wealth of data and insight into the characteristics of optimal trajectories for a wide
range of combinations of ellipsled masses, entry velocities, termination Mach numbers, and dip constraints. In the completion of this study, an estimated 1.8 million trajectory runs were completed to optimize 180 data points.
A. Performance Implications and the Potential of Angle of Attack Control Perhaps the most important conclusion from this study is that significant terminal altitude gains may be possible
if angle of attack modulation is enabled for Mars entry vehicles. For the ellipsled studied in this paper, these gains are consistently 2.5-4.0 km over the more traditional approach of only using bank angle control. Gains of this magnitude could prove to be mission-enabling for scenarios where high-altitude landing sites (e.g., in the southern hemisphere of Mars or in the Tharsis region) are required.
However, it is important to note that if angle of attack modulation is enabled, in most cases it cannot be substituted for bank angle control. While adding angle of attack modulation improves altitude performance, removing bank angle modulation generally has a detrimental effect on the best achievable altitude (at 4.7 km/s and 5.5 km/s entry velocities, angle-of-attack-only modulation consistently underperforms bank-angle-only modulation by 3.5-8.0 km).*** Exceptions to this statement occur at low entry velocities and high termination Mach numbers where optimal trajectories tend to be full-lift-up and can be assisted solely through angle of attack modulation.
B. Characteristics of Optimum-Altitude Trajectories Investigation of sample optimum-final-altitude trajectories yields general insights into the characteristics that
allow best-attainable altitudes to be reached. First, just as in Ref. 1, optimal trajectories tend to have zero-degree bank angles near their terminal states. Also as in Ref. 1, the combination of smooth optimum-altitude curves and coarse variations in the design variables that resulted in those curves suggests that multiple combinations of these design variables may be capable of producing the same (or nearly the same) optimum altitudes. Additionally, when both bank angle control and angle of attack control are implemented, deceleration constraints and dip constraints have a major influence on the trajectory. When only angle of attack control is implemented, these effects are less pronounced.
In terms of the characteristics of optimum angle of attack profiles, four characteristics are common to virtually all trajectories encountered in this study. The most common characteristic is that the final angle of attack of the vehicle reaches its maximum allowable value of 55°, and often this occurs gradually. It is believed that the reason for this is related to the short-term objective of the vehicle at the end of the trajectory to rapidly raise its altitude before reaching the terminal velocity. In the angle of attack region in which the vehicle in this study operates, increasing angle of attack increases both lift and drag. Next, perhaps the simplest feature to explain is the tendency for the angle of attack to remain near the lowest bound of 35° during the peak deceleration pulse. The hypothesized explanation for this is that this minimum angle of attack simultaneously minimizes both lift and drag forces in the short term, which allows the deceleration loads on the vehicle to be reduced. A related characteristic is the tendency for angle of attack modulation to enable very steep entry flight path angles (at times roughly -19°), which allows the vehicle to penetrate deeper into the atmosphere for higher lofting later in flight. These steep angles are enabled by the fact that the vehicle can pitch to a low angle of attack when necessary to minimize aerodynamic loads (otherwise, such steep angles would cause deceleration constraints to be violated). Finally, a characteristic that does not yet have a clear explanation but which is consistent among many optimum trajectories is the presence of one or more distinct spikes in angle of attack – often in the middle of low-angle-of-attack regions – that have clearly positive effects on the final altitude but which do not seem to be associated with any obvious trajectory events.
C. Study Limitations and Considerations for Future Work While this study has largely succeeded in assessing the potential of angle of attack modulation for Mars entry, a
number of avenues exist for future work, and most of these avenues are related to the limitations of the present study.
First and foremost, this study is limited in its applicability to ellipsleds and similar slender-body vehicle shapes. Although it is almost certain that angle of attack will have a benefit for other vehicles as well, it is not clear how large the magnitude of this benefit will be. An interesting direction of study that is very applicable to near-term robotic missions is an assessment identical to this except using a blunt body or capsule as an entry vehicle. In the
*** Besides having altitude implications, absence of bank angle control also removes cross-range control.

American Institute of Aeronautics and Astronautics
20
long-term, if significant benefits arise for capsules, this may improve the appeal of capsules for use in human or heavy robotic exploration of Mars.
Additionally, an interesting study would be a theoretical approach to explaining some of the key, consistent features in the optimum angle of attack profiles identified here. For example, an analytic study may be able to provide additional justification regarding the final pitch-up maneuvers – and especially the angle of attack spikes – consistently seen in these results. Such a study may also be able to identify optimum characteristics of unconstrained trajectories, which may be of assistance in understanding results such as those in the present study.
Also, similar to the future directions in Ref. 1, this study has not considered environment and state knowledge dispersions which are crucial to any real, guided landing on Mars, especially for human missions. This study has also not specified what type of guidance would be required to adequately fly the optimal trajectories which have been identified, or if guided trajectories could maintain their altitude performance benefits in spite of dispersions. It should be noted, however, that margin is included in these trajectories in the form of a 10 km dip constraint and a 4.5-G deceleration limit (instead of a 5-G or higher duration-dependent limit). This study was principally concerned with maximizing final altitude and assumes that adequate margin was given at this stage of design. It is hoped that this work will continue in the future and include consideration of guidance performance; one positive result for bank-only modulation is reported by Ref. 10.
One concern which is acknowledged is the inherent limitation of the optimizer and angle of attack and bank profiles used. For example, the profiles were inherently limited by the ten evenly-spaced points prescribed in the relative velocity domain. This imposes limitations in terms of resolution and in terms of allowable angular rates and accelerations. Furthermore, the particle swarm optimizer has a somewhat more limited ability to pinpoint optima near constraint boundaries than, for example, a gradient optimizer. While the approach used in this study was suitable for the goal of a broad parametric sweep, higher-fidelity studies in the future should assess different methods of defining profiles which are more flexible and adaptable to recognized trends (for example, to follow deceleration or dip constraints).
Despite the limitations mentioned here, however, this study has accomplished its original goal of assessing the potential of angle of attack modulation for Mars entry. It has identified both the best attainable altitudes and the bank and angle of attack profile characteristics that generally allow those altitudes to be achieved. It is hoped that this study’s result will find broad use within the Mars entry community.
Acknowledgments The authors would like to thank the Mars DRM 5.0 Aerocapture, Entry, Descent, and Landing team led by Walt
Engelund and Rob Manning. Thanks are especially due to Carlos Westhelle, Lee Bryant, Eduardo García-Llama, Phil Stuart, and Michael Grant at NASA JSC for their support throughout this study.
References 1Lafleur, J.M. and Cerimele, C.J. “Mars Entry Bank Profile Design for Terminal State Optimization.” AIAA 2008-6213.
AIAA Atmospheric Flight Mechanics Conference and Exhibit, Honolulu, 18-21 Aug. 2008. 2Lozino-Lozinsky, E.G. and Neiland, V.Y. “The Convergence of the 'Buran' Orbiter Flight Test and Preflight Study Results
and the Choice of a Strategy to Develop a Second Generation Orbiter.” AIAA 1989-5019. AIAA 1st National Aerospace Plane Conference, Dayton, 20-21 July 1989.
3Harpold, J.C. and Graves, C.A. “Shuttle Entry Guidance.” NASA-TM-79949. Houston, Feb. 1979. 4Masciarelli, J.P., Westhelle, C.H., and Graves, C.A. “Aerocapture Guidance Performance for the Neptune Orbiter.” AIAA
2004-4954, AIAA Atmospheric Flight Mechanics Conference and Exhibit, Providence, 16-19 Aug. 2004. 5NASA GSFC Solar Exploration Division, The Topography of Mars by the Mars Orbiter Laser Altimeter [online database].
Available: http://ssed.gsfc.nasa.gov/tharsis/Mars_topography_from_MOLA.new/ [8 Aug. 2008]. 6Schneider, W.C. “Mars Combo Lander Design Study Team.” NASA JSC Presentation, 31 July 1998. 7Justus, C.G. and Johnson, D.L. “Mars Global Reference Atmospheric Model 2001 Version (Mars-GRAM 2001): Users
Guide.” NASA-TM-2001-210961. April 2001. 8National Aeronautics and Space Administration. “NASA’s Exploration Systems Architecture Study.” NASA-TM-2005-
214062. Nov. 2005. 9Grant, M. and Mendeck, G. “Mars Science Laboratory Entry Optimization Using Particle Swarm Methodology.” AIAA
2007-6393. AIAA Atmospheric Flight Mechanics Conference and Exhibit, Hilton Head, 20-23 Aug. 2007. 10García-Llama, E. “Apollo-Derived Terminal Control for Bank-Modulated Mars Entries with Altitude Maximization.”
AIAA 2008-6819. AIAA Guidance, Navigation, and Control Conference and Exhibit, Honolulu, 18-21 Aug. 2008.