anglo coal - angloamerican.com/media/files/a/anglo-american-plc-v... · from 1999 to 2004 2004...
TRANSCRIPT

1
Presentation to Analysts: June 2005 1
Anglo CoalPresentation to Analysts
June 2005

2
Presentation to Analysts: June 2005 2
Agenda and Participants► Anglo Coal Overview
Ken Bell SVP International Business Development
► Anglo Coal Australia OverviewEric Ford CEO Anglo Coal Australia
► Dawson OverviewMike O’Brien GM Dawson
Rod Elliott GM Marketing and Transportation

3
Presentation to Analysts: June 2005 3
Overview of Anglo CoalKen Bell

4
Presentation to Analysts: June 2005 4
Overview of Anglo Coal ► Operations in:
• South Africa: 9 mines• Australia: 6 mines
1 equity mine• Colombia: 1 mine• Venezuela: 1 mine
► Long life mines► Good quality reserves ► Exposure to export and domestic thermal
coal market and export metallurgical coal market
► Contributed 13% to AA plc's 2004 headline earnings
► Generated US$1.8 billion in free cash from 1999 to 2004
2004 Saleable Tonnes (Mt) By Region
5526
10
South AfricaAustraliaSouth America

5
Presentation to Analysts: June 2005 5
Anglo Coal Location Map
Beijing
Representative Office
LondonMarketing Office
ColombiaExport Export Domestic
Met ThermalCerrejon X
8 Mt3983
US$185 m
Attributable Production (2004)EmployeesAttributable EBITA (2004)
Mine
VenezuelaExport Export Domestic
Met ThermalCdG X X
2 Mt1059
US$20 m
Attributable Production (2004)EmployeesAttributable EBITDA (2004)
Mine
AustraliaExport Export Domestic
Met ThermalGerman Creek XMoranbah North XJellinbah X XDawson X XDartbrook X XDrayton X XCallide X
26 Mt2120
US$184m
Attributable Production (2004)EmployeesAttributable EBITDA (2004)
Mine
South AfricaExport Export Domestic
Met ThermalGoedehoop X XKleinkopje X X XBank X X XGreenside X XLandau X XIsibonelo XKriel XMafube XNew Denmark XNew Vaal X
55 MT7275
US$297m
Attributable Production (2004)EmployeesAttributable EBITDA (2004)
Mine

6
Presentation to Analysts: June 2005 6
Anglo Coal’s Market Share
5%
5%
24%
10%4%
52%
Anglo CoalXstrataBHPB (includes Mitsubishi)Canada (Fording & Teck)Rio TintoOthers
Anglo Coal has a competitive share in both markets
SOURCE: PUBLICLY AVAILABLE DATA & ANGLO COAL ANALYSIS
6%
7%
7%
7%
4%
69%
Anglo Coal Xstrata BHPBPT Bumi Rio Tinto Others
Export Thermal Coal Export Metallurgical Coal

7
Presentation to Analysts: June 2005 7
Anglo Coal’s Product Portfolio and Customer Destination
37
18
10
710
8
South African DomesticSouth African Thermal ExportsAustralian DomesticAustralian Thermal ExportsAustralian Metallurgical ExportsSouth American Exports
52%
31%
17%
Domestic MarketMed-Atlantic Market
Indo-Pacific Market
2004 Actual Saleable CoalBy Product Million Tonnes
2004 Actual Product Destination90 Million Tonnes

8
Presentation to Analysts: June 2005 8
0
20
40
60
80
100
120
140
1980
1981
1982
1983
1984
1985
1986
1987
1988
1989
1990
1991
1992
1993
1994
1995
1996
1997
1998
1999
2000
2001
2002
2003
2004
2005
US$/T FOBExport Hard Coking Coal (Goonyella Benchmark)
Export Thermal Coal (Japan/Newcastle Benchmarkbasis 6322 GAR)
Coal Price History & Projection

9
Presentation to Analysts: June 2005 9
Key Financials 2003 Vs. 2004
► Revenue up 29% to US$2.4 bn
► Operating Profit up 46% to US$487m
► Headline Earnings up 51% to US$351m
► Free Cash Flow up 38% to US$445m
► Total Free Cash of US$1.8 bn generated from 1999 to 2004
Solid Results

10
Presentation to Analysts: June 2005 10
EBITDA
Good EBITDA Returns
0100200300400500600700800
2002 2003 20040%5%10%15%20%25%30%35%40%
South Africa Australia South America EBITDA Margin
Significant growth in EBITDA - CAGR 33% since 1999
Average EBITDA margin ~ 30% (1999 to 2004)US$m

11
Presentation to Analysts: June 2005 11
2004 Regional ResultsRevenue (US$m)
1109
433
840
EBITDA (US$m)
297205
184
South Africa Australia South America
Operating Profit (US$m)
244164
79
Headline Earnings (US$m)
162116
73
Capex (US$m)*
137
4581
*Annual Financial Statements exclude Anglo Coal’s share of Associates’
Net Operating Assets (US$m)*
1634
398923

12
Presentation to Analysts: June 2005 12
Outlook 2005
► Anticipate sound operating performance across operations in all regions
► Higher costs•Inflationary pressures continue across
all regions•Weaker US Dollar impacting on South
African Rand and Australian Dollar► Higher average realised prices versus 2004
Anglo Coal has sold significant amount of 2005 tonnage at current high prices

13
Presentation to Analysts: June 2005 13
Project Pipeline
Cerrejon Expansion
China
Russia
Mafube
WesternComplex
Isibonelo LakeLindsay Moranbah
South
Dawson
Grasstree
Saddlers Creek
GrosvenorMonash Energy

14
Presentation to Analysts: June 2005 14
New Business Development
► Coal Bed/Mine Methane• Dawson (Australia)• Waterberg (South Africa)• German Creek (Australia)
► Monash Energy • Power and low sulphur diesel• Carbon capture & storage • Government support
► Coal Gasification• China – Xiwan• Chemical and Power• Emissions reduction
Long lead timeHigh capitalNew skills
Potential high returns

15
Presentation to Analysts: June 2005 15
In Conclusion..
► Significant earnings and cash flow contributor to AA plc
► Exposed to domestic and export coal markets► Good quality long life reserves► Diversified geographical base► Proven track record for operating in existing
and new geographies► Good growth opportunities within existing
operations► Continue to optimise existing operations and
develop new assets and business initiatives

16
Presentation to Analysts: June 2005 16
Overview of Anglo Coal Australia
Eric Ford

17
Presentation to Analysts: June 2005 17
Anglo Coal in Australia
Long LifeQualityReservesGrowthStrategy

18
Presentation to Analysts: June 2005 18
2004 Sales by Coal Type
10.1
10.414.5
Domestic Thermal Coal Export Thermal CoalExport Metallurgical Coal
35 Million Tonnes
19
Presentation to Analysts: June 2005 19
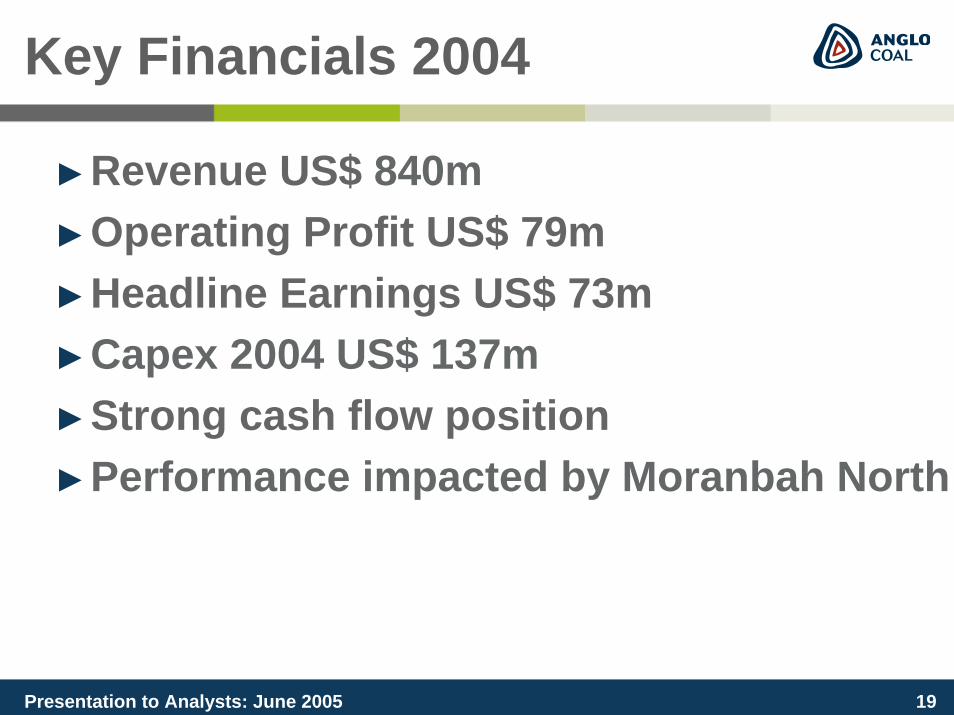
Key Financials 2004
►Revenue US$ 840m►Operating Profit US$ 79m►Headline Earnings US$ 73m ►Capex 2004 US$ 137m►Strong cash flow position►Performance impacted by Moranbah North

20
Presentation to Analysts: June 2005 20
Coal Sales Projection
0.0
5.0
10.0
15.0
20.0
25.0
30.0
35.0
40.0
2004 2005 2006 2007 2008 2009Domestic E xport ThermalE xport Metallurgical E xpansions (inc luding Dawson)
Anglo Share Of Coal Sales (Mtpa)

21
Presentation to Analysts: June 2005 21
Projects
► Significant growth ahead:•Brownfield
•Grasstree•Dawson•Coal Seam Methane
•Greenfield•Lake Lindsay•Moranbah South•Grosvenor •Saddlers Creek•Monash Energy

22
Presentation to Analysts: June 2005 22
Outlook 2005
►Metallurgical►Export Thermal►Domestic Thermal►Coal Seam Methane►Skills►Materials►Contractors►Legislation

23
Presentation to Analysts: June 2005 23
Conclusion
►Strong global environment
►Good expansion projects
►Operational excellence
►M & A opportunities

24
Presentation to Analysts: June 2005 24
Dawson Overview
Mike O’Brien

25
Presentation to Analysts: June 2005 25
Dawson Location

26
Presentation to Analysts: June 2005 26
Historic Slide
0
200
400
600
800
1,000
1,200
1,400
62 63 64 65 66 67 68 69 70 71 72 73 74 75 76 77 78 79 80 81 82 83 84 85 86 87 88 89 90 91 92 93 94 95 96 97 98 99 00 01 02 03 04
Number of Employees
0
1
2
3
4
5
6
7
8
Sales Million's Tonnes
Thiess Peabody Mitsui Coal formed BHP acquires 58% BHP acquires further 22%Peabody / Mitsui JV CNA /
Mitsui JV
Anglo / Mitsui JV
Underground Mining ceasesAug 94
Annual Tonnes
Employees
Rail line to Gladstone
DL4BE 1370
DL5Marion8200
DL6Marion8200
Highw all Mining

27
Presentation to Analysts: June 2005 27
Reserves
0
50,000,000
100,000,000
150,000,000
200,000,000
250,000,000
2005
2006
2007
2008
2009
2010
2011
2012
2013
2014
2015
2016
2017
2018
2019
2020
2021
2022
2023
2024
Proven Probable Other250
200
150
100
50
0
Payback: April 2011
Mt

28
Presentation to Analysts: June 2005 28
Coal Rank
► Well understood rank trend dictates coal quality and products
► Rank reduces from ~ 1.6 in north to 0.7 in south
► Ranges from: ► sub-anthracite in north► hard coking in the
centre ► to thermal in the south

29
Presentation to Analysts: June 2005 29
Dawson Pit 68

30
Presentation to Analysts: June 2005 30
Dawson Pit 68

31
Presentation to Analysts: June 2005 31
Capital Expenditure
► Total capital expenditure is US$653m• US$225m mining equipment• US$294m conveyors,coal handling and
preparation infrastructure• US$134m Infrastructure and land
► Agreements for the provision of port and rail infrastructure in place

32
Presentation to Analysts: June 2005 32
Operating Costs
► The expansion and recapitalisation of Dawson will deliver improvements in unit operating costs of 15%
► This is achieved through a combination of economies of scale, improved mining schedules, and the use of larger more efficient equipment

33
Presentation to Analysts: June 2005 33
Seam Gas
Moura is currently contracted to produce 6.5 PJ per annum (approximately 5% of the Queensland market)
The extraction and sale of seam gas may provide future carbon credits
Overburden
C Seam
D Seam
D Lower Seam
A Seam
(approx 800m in coal)
Source: Geogas Systems

34
Presentation to Analysts: June 2005 34
Environment and Community
► Strong community support► Agreements with traditional owners► Special Act Lease complies with
mainstream environmental management practices
► New mining plan addresses historically approved rehabilitation liability
► ISO14001 and AS4801 compliant► Nature refuge ‘Willawa’ established

35
Presentation to Analysts: June 2005 35
Dawson Overview
Rod Elliott

36
Presentation to Analysts: June 2005 36
► Metallurgical Coal• Moura C• Dawson HV• Dawson LV
• Moura ‘K’• Soft coking
► Thermal• Moura
Coal Brands
Prime Coking
Soft Coking
Thermal
37
Presentation to Analysts: June 2005 37
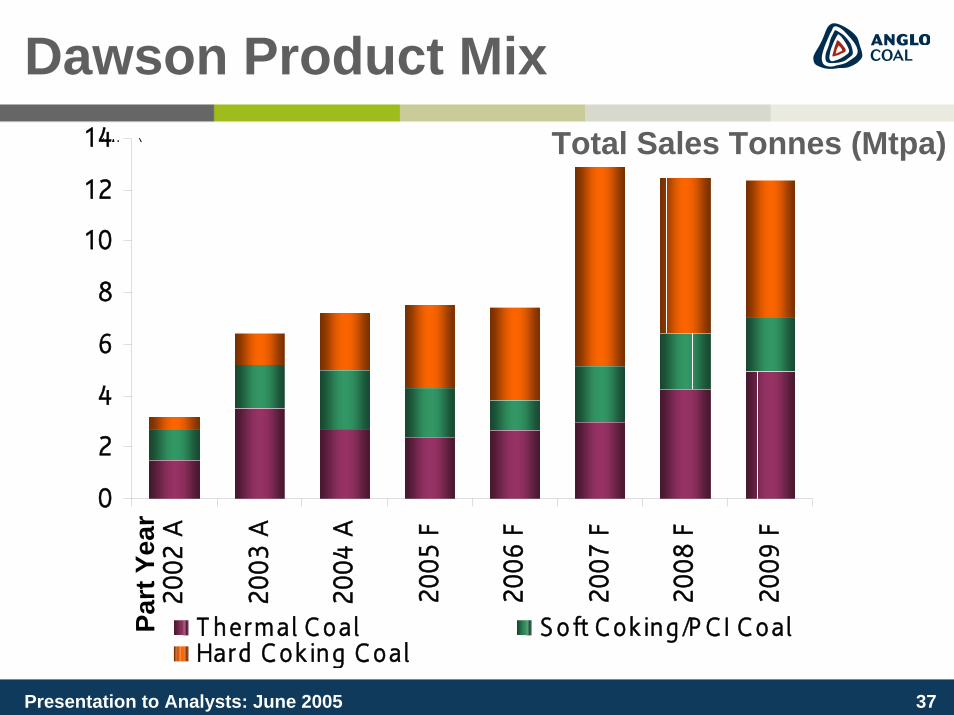
Dawson Product MixTotal Sales Tonnes (Mtpa)
0
2
4
6
8
10
12
1420
02 A
2003
A
2004
A
2005
F
2006
F
2007
F
2008
F
2009
F
T hermal Coal Soft Cok ing /P C I CoalHard Cok ing Coal
(Mtpa)Pa
rt Y
ear

38
Presentation to Analysts: June 2005 38
Marketing Strategy
► Established brands and market presence► Term contracts covering thermal and
metallurgical coal► Strong portfolio of buyers:
• Asian thermal coal focus• Diversified metallurgical coal sales strategy
► Reliable infrastructure:• Queensland Rail• Port of Gladstone
► Anglo and Mitsui global marketing strength

39
Presentation to Analysts: June 2005 39
Dawson

40
Presentation to Analysts: June 2005 40
Questions & Answers