angola's infrastructure: a continental perspective - africa
TRANSCRIPT

COUNTRY REPORT
Angola’s Infrastructure: A Continental Perspective
Nataliya Pushak and Vivien Foster
MARCH 2011

© 2010 The International Bank for Reconstruction and Development / The World Bank 1818 H Street, NW Washington, DC 20433 USA Telephone: 202-473-1000 Internet: www.worldbank.org E-mail: [email protected] All rights reserved A publication of the World Bank. The World Bank 1818 H Street, NW Washington, DC 20433 USA The findings, interpretations, and conclusions expressed herein are those of the author(s) and do not necessarily reflect the views of the Executive Directors of the International Bank for Reconstruction and Development / The World Bank or the governments they represent. The World Bank does not guarantee the accuracy of the data included in this work. The boundaries, colors, denominations, and other information shown on any map in this work do not imply any judgment on the part of The World Bank concerning the legal status of any territory or the endorsement or acceptance of such boundaries.
Rights and permissions The material in this publication is copyrighted. Copying and/or transmitting portions or all of this work without permission may be a violation of applicable law. The International Bank for Reconstruction and Development / The World Bank encourages dissemination of its work and will normally grant permission to reproduce portions of the work promptly. For permission to photocopy or reprint any part of this work, please send a request with complete information to the Copyright Clearance Center Inc., 222 Rosewood Drive, Danvers, MA 01923 USA; telephone: 978-750-8400; fax: 978-750-4470; Internet: www.copyright.com. All other queries on rights and licenses, including subsidiary rights, should be addressed to the Office of the Publisher, The World Bank, 1818 H Street, NW, Washington, DC 20433 USA; fax: 202-522-2422; e-mail: [email protected].

About AICD and its country reports
This study is a product of the Africa Infrastructure Country Diagnostic (AICD), a project designed to expand the world’s knowledge of physical infrastructure in Africa. The AICD provides a baseline against which future improvements in infrastructure services can be measured, making it possible to monitor the results achieved from donor support. It also offers a solid empirical foundation for prioritizing investments and designing policy reforms in Africa’s infrastructure sectors.
The AICD is based on an unprecedented effort to collect detailed economic and technical data on African infrastructure. The project has produced a series of original reports on public expenditure, spending needs, and sector performance in each of the main infrastructure sectors, including energy, information and communications technologies, irrigation, transport, and water and sanitation. Africa’s Infrastructure—A Time for Transformation, published by the World Bank and the Agence Française de Développement in November 2009, synthesized the most significant findings of those reports.
The focus of the AICD country reports is on benchmarking sector performance and quantifying the main financing and efficiency gaps at the country level. These reports are particularly relevant to national policy makers and development partners working on specific countries.
The AICD was commissioned by the Infrastructure Consortium for Africa following the 2005 G8 (Group of Eight) summit at Gleneagles, Scotland, which flagged the importance of scaling up donor finance for infrastructure in support of Africa’s development.
The first phase of the AICD focused on 24 countries that together account for 85 percent of the gross domestic product, population, and infrastructure aid flows of Sub-Saharan Africa. The countries are: Benin, Burkina Faso, Cape Verde, Cameroon, Chad, Côte d’Ivoire, the Democratic Republic of Congo, Ethiopia, Ghana, Kenya, Lesotho, Madagascar, Malawi, Mozambique, Namibia, Niger, Nigeria, Rwanda, Senegal, South Africa, Sudan, Tanzania, Uganda, and Zambia. Under a second phase of the project, coverage was expanded to as many of the remaining African countries as possible.
Consistent with the genesis of the project, the main focus is on the 48 countries south of the Sahara that face the most severe infrastructure challenges. Some components of the study also cover North African countries so as to provide a broader point of reference. Unless otherwise stated, therefore, the term Africa is used throughout this report as a shorthand for Sub-Saharan Africa.
The World Bank has implemented the AICD with the guidance of a steering committee that represents the African Union, the New Partnership for Africa’s Development (NEPAD), Africa’s regional economic communities, the African Development Bank (AfDB), the Development Bank of Southern Africa (DBSA), and major infrastructure donors.

Financing for the AICD is provided by a multidonor trust fund to which the main contributors are the United Kingdom’s Department for International Development (DFID), the Public Private Infrastructure Advisory Facility (PPIAF), Agence Française de Développement (AFD), the European Commission, and Germany’s Entwicklungsbank (KfW). A group of distinguished peer reviewers from policy-making and academic circles in Africa and beyond reviewed all of the major outputs of the study to ensure the technical quality of the work. The Sub-Saharan Africa Transport Policy Program and the Water and Sanitation Program provided technical support on data collection and analysis pertaining to their respective sectors.
The data underlying AICD’s reports, as well as the reports themselves, are available to the public through an interactive Web site, www.infrastructureafrica.org, that allows users to download customized data reports and perform various simulations. Many AICD outputs will appear in the World Bank’s Policy Research Working Papers series. Inquiries concerning the availability of data sets should be directed to the volume editors at the World Bank in Washington, DC.

iii
Contents
List of figures iii
List of tables iii
Acknowledgments iv
Synopsis 1
The continental perspective 2
Why infrastructure matters 3
The state of Angola’s infrastructure 4
Power 10Transport 18
Roads 18Rail 22
Ports 24
Air transport 26Water supply and sanitation 28
Information and communication technology 32
Financing Angola’s infrastructure 35
How much more can be done within the existing resource envelope? 39
Annual funding gap 41What else can be done? 42
Bibliography and references 44
General 44Financing 44
Growth 44
Information and communication technologies 44Irrigation 45
Power 45
Transport 46Water resources 47
Irrigation 47
Water supply and sanitation 47Other 48
List of figures
Figure 1. Infrastructure’s contribution to annual per capita economic growth, actual and potential 4Figure 2. Angola’s infrastructure networks align with population density and natural resource concentrations 6Figure 3. Angola’s fragmented power infrastructure network 12Figure 4. The costs of power production in Angola are relatively high 13Figure 5. The average Angolan consumer pays extremely low prices for power 14Figure 6. Massive hidden costs in the power sector in Angola 16Figure 7. The hidden costs of Angola’s power sector are among the worst on the continent 17Figure 8. Cost recovery will remain a questionable prospect even in the future 17Figure 9. Angola’s spending on roads is more than sufficient to cover maintenance and rehabilitation needs 18Figure 10. Angola’s roads: Type and condition versus traffic 19

iv
Figure 11. The condition of Angola’s main road network benchmarked against others in southern Africa 20Figure 12. Angola’s public contribution exceeds the maintenance and rehabilitation needs of its road network 21Figure 13. Angola’s poor road conditions constrain SADC’s regional connectivity 22Figure 14. Ratio of current demand to reported capacity 24Figure 18. Benchmarking the hidden costs of EPAL against those of selected countries in southern Africa 31Figure 19. Urban versus rural access to water supply and sanitation, 2007 32Figure 20. Angola’s Internet market benchmarked against southern African peers 34Figure 21. Angola’s infrastructure spending needs are comparatively low relative to GDP 36Figure 22. Angola’s existing infrastructure spending is quite high 38Figure 23. Capital investment in infrastructure in Angola and comparator countries 38Figure 24. Underpricing of power and water in Angola and other low-income, resource-rich countries 40Figure 25. Affordability of water and power 40Figure 26. The burden of inefficiency carried by Angola’s power and water utilities 41Figure 27. Angola needs to attract more private investment, in particular beyond the ICT sector 43
List of tables
Table 1. The achievements and challenges of Angola’s infrastructure sectors 5Table 2. Benchmarking Angola’s power infrastructure 11Table 3. Angola pays very little for diesel per liter compared to several oil-producing neighbors 14Table 4. Power underpricing per kilowatt-hour (US cents per kWh) 14Table 5. Bill collection in Angola in 2008 15Table 6. Large hidden costs associated with ENE 16Table 7. Increasing hidden costs at EDEL in terms of monetary value 16Table 8. Angola’s road indicators benchmarked against Africa’s low- and middle-income countries 20Table 9. Rail networks in Angola 23Table 10. Railway indicators for Angola and selected countries, 2000–05 23Table 11. Benchmarking port performance 25Table 12. Benchmarking air transport indicators for Angola and selected countries 27Table 13. Benchmarking water and sanitation indicators 28Table 14. Evolution of operational indicators associated with EPAL 32Table 15. Benchmarking ICT indicators 33Table 16. Illustrative investment targets for infrastructure in Angola 35Table 17. Infrastructure spending needs in Angola, 2006–15 36Table 18. Financial flows to Angola’s infrastructure 37Table 19. Angola’s potential gains from greater operational efficiency 39Table 20. Funding gaps, by sector 42Table 21. Potential savings from innovation 43
Acknowledgments
This paper draws on contributions from sector specialists from the Africa Infrastructure Country
Diagnostic Team; notably, Heinrich Bofinger on air transport, Carolina Dominguez-Torres on water and
sanitation, Michael Minges on Information and Communication Technologies, Alberto Nogales on roads,
Nataliya Pushak and Cecilia M. Briceño-Garmendia on public expenditure, Rupa Ranganathan on power
and ports, and Alvaro Federico Barra on spatial analysis.
The paper is based on data collected by local consultants and benefited greatly from feedback
provided by colleagues in the relevant World Bank and IFC country teams; notably, Kai-Alexander
Kaiser, Ricardo Costa Gazel, Isabel Marques De Sa, and Fares Khoury.

Synopsis
Infrastructure made a net contribution of around 1 percentage point to Angola’s improved per capita
growth performance in recent years, despite unreliable power supplies and roads each holding back
growth by 0.2 percentage points. Raising the country’s infrastructure endowment to that of the region’s
middle-income countries (MICs) could boost annual growth by about 2.9 percentage points.
As a resource-rich postconflict country, Angola has shown an exceptionally strong commitment to
financing the reconstruction and expansion of its infrastructure, which was severely damaged and
neglected during the country’s long civil war. The end of the war coincided with soaring oil prices,
bringing in the necessary petroleum revenues to fund such a reconstruction effort. A financing agreement
with China, backed by future petroleum revenues, further expanded the resource envelope for investment.
Thus, in the space of a few years, Angola has expanded its generation capacity by 400 MW (a 50 percent
increase), embarked on an ambitious multibillion-dollar road rehabilitation program, begun to make
investments aimed at easing congestion at the Port of Luanda, and begun the rehabilitation program for
urban water systems. All these are significant steps.
Numerous challenges remain, however. Many of them involve going beyond investment to strengthen
and optimize the policy and institutional environment for infrastructure provision.
Despite the expansion of power-generation capacity, deficient transmission and distribution
infrastructure prevents electricity from flowing to customers, and the reliability of supply remains very
poor. A complex web of subsidies and operational deficiencies makes Angola’s power sector among the
least efficient in Africa, hemorrhaging resources equivalent to 1.6 percent of gross domestic product
(GDP).
Angola’s water utilities have been unable to cope with burgeoning urbanization to a point where
about 40 percent of the urban population relies on largely untreated water supplied by vendors. This has
disastrous public health consequences, leaving Angola with one of the highest rates of diarrheal disease in
the world. For reasons that seem difficult to justify, Angola’s utility tariffs are among the highest in
Africa, at $2.30 per cubic meter of water, while vendors charge $4–$20 for untreated supplies.
Serious congestion problems at Angola’s main international gateway—the Port of Luanda—have
made its facilities so costly and frustrating to use that traffic is increasingly diverting to Walvis Bay in
Namibia, more than 2,000 kilometers distant.
Addressing Angola’s infrastructure challenges and providing a basic infrastructure platform within
the course of a decade would require sustained expenditure of $2.1 billion per year over the next decade.
Some 70 percent of the required spending is associated with capital investments, with the remaining 30
percent is needed for operational and maintenance spending. Almost one-third of the total spending needs
are related to the power sector, followed by the water supply and sanitation sectors. The effort that
Angola would need to make to meet its infrastructure needs is equivalent to 7 percent of its GDP,
significantly below the average for Sub-Saharan Africa (14.5 percent).
Angola already spends around $4.3 billion per year on infrastructure, equivalent to 14 percent of its
GDP. Spending is about double estimated needs due to the fact that the government is pursuing an

ANGOLA’S INFRASTRUCTURE: A CONTINENTAL PERSPECTIVE
2
accelerated program of infrastructure reconstruction and hence is spending a massive $2.9 billion a year
in that sector alone. As a result, Angola’s capital spending on infrastructure is heavily skewed toward
transport, which accounts for some 70 percent of the total. In contrast to many of its peers, and reflecting
buoyant petroleum revenues, Angola’s infrastructure investment is predominantly funded by domestic
fiscal resources. China is by far the most significant source of external finance, with only modest private
capital inflows and negligible overseas direct investment (ODA).
Remarkably, some $1.3 billion is being lost to inefficiencies of various kinds, equivalent to almost 5
percent of GDP. By far the largest culprit is the power sector, which hemorrhages $700 million annually,
primarily as a result of massive underpricing ($475 million) as well as some other factors. The
underexecution of capital budgets is also exceptionally high in Angola, at $573 million annually, and
primarily reflects difficulties in the implementation of the country’s huge road investment program
(accounting for $401 million of this total). By taking suitable policy measures, Angola could recapture
these lost resources for investment in its infrastructure.
Given the urgent pressure to reconstruct Angola’s infrastructure platforms, there is some evidence
that decisions have not always been optimal. For example, the expansion of generation capacity has not
been matched by reinforcements in transmission and distribution that would allow the power to flow
through to end users. And the scale of Angola’s road investment program seems to have outstripped the
implementation capacity of the key sector institutions. There is also evidence that the water and sanitation
sector may not yet have received as much attention as it deserves.
After taking sectoral allocations and inefficiencies into account, a modest funding gap of $115 million
per year remains, almost entirely relating to the achievement of the Millennium Development Goals
(MDGs) for the water and sanitation sector. Nevertheless, this funding gap could be largely eliminated by
focusing service expansion on lower cost water and sanitation options. Furthermore, with such a high
spending envelope overall, there looks to be some scope for the reallocation of resources toward water
and sanitation.
While Angola’s infrastructure reconstruction needs are large in absolute terms, they look manageable
relative to the size of the country’s fast-growing economy. Moreover, Angola has amply demonstrated its
commitment to channeling significant volumes of petroleum rents toward infrastructure development.
Consequently, Angola is one of a very few African countries that does not face a significant infrastructure
funding gap, as long as the country is able to make headway in reducing its massive efficiency gap. In the
medium term, Angola could potentially attract much more private finance for infrastructure than it has to
date, thereby helping to liberate public funds for other pressing social needs.
The continental perspective
The Africa Infrastructure Country Diagnostic (AICD) has gathered and analyzed extensive data on
infrastructure in more than 40 Sub-Saharan countries, including Angola. The results have been presented
in reports covering different areas of infrastructure—information and communication technology (ICT),
irrigation, power, transport, water and sanitation—and different policy areas, including investment needs,
fiscal costs, and sector performance.

ANGOLA’S INFRASTRUCTURE: A CONTINENTAL PERSPECTIVE
3
This report presents the key AICD findings for Angola, allowing the country’s infrastructure situation
to be benchmarked against that of its African peers. Given that Angola is a low-income resource-rich
country, two sets of African benchmarks will be used to evaluate Angola’s situation: fragile low-income
countries and resource-rich countries. Detailed comparisons will also be made with immediate regional
neighbors in the Southern African Development Community (SADC).
Several methodological issues should be borne in mind. First, because of the cross-country nature of
data collection, a time lag is inevitable. The period covered by the AICD for Angola runs from 2005 to
2009. But financial data for comparator countries typically cover an earlier period, 2001–06, and are
averaged to smooth out fluctuations, while technical data are reported for 2006. Second, in order to make
comparisons across countries, it was necessary to standardize the indicators and analysis so that
everything was done on a consistent basis. This means that some of the indicators presented here may be
slightly different from those that are routinely reported and discussed at the country level.
Why infrastructure matters
In recent years, Angola’s economy has been among the fastest growing in Africa. Looking ahead, the
country’s GDP is projected to rise by 6.5 percent in 2011, with oil-sector growth of 3.8 percent and non-
oil-sector growth of 8.1 percent (IMF 2011). A 27-year war that ended in 2002 ravaged the country and
destroyed most of its economic infrastructure. Many roads, rails, and bridges were mined and obliterated;
surviving infrastructure is dilapidated after years of neglect. Following the war’s end, the government
turned its attention to the reconstruction of the country. And indeed, for the period 2003 to 2007,
improvements in infrastructure added 1 percentage point to the per capita growth rate, which is substantial
even if not as high as many countries in Africa (figure 1a). This boost to growth came predominately
from the ICT revolution. Meanwhile, Angola’s road and power sectors held back the per capita growth
rate by 0.2 percentage points each over the same period.
Looking ahead, simulations suggest that if Angola’s infrastructure could be improved to the level of
the African leader, Mauritius, annual per capita growth rates would be 2.9 percentage points higher than
they are at present. This impact would come from an increase in power-generating capacity and improved
road infrastructure (figure 2b).

ANGOLA’S INFRASTRUCTURE: A CONTINENTAL PERSPECTIVE
4
Figure 1. Infrastructure’s contribution to annual per capita economic growth, actual and potential a. Infrastructure’s contribution between 2001 and 2005
b. Potential contributions
Source: Calderón 2009.
The state of Angola’s infrastructure
Angola’s population of around 18.5 million is unequally distributed across the country. The most
densely populated areas surround the capital Luanda and a handful of other major cities. Overall, the
coast and the southern and eastern parts of the country are less populated than the interior highlands
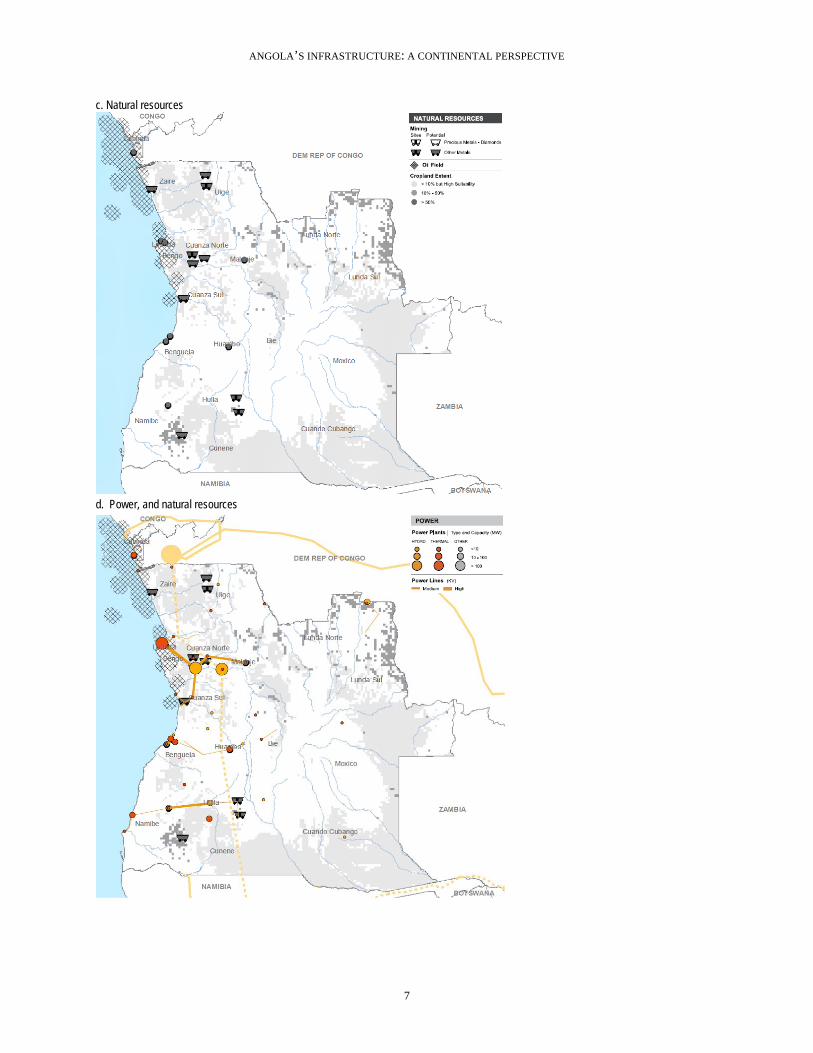
(figure 2a). The spatial distribution of population is influenced by the presence of vast natural resources
and agricultural potential. Angola’s interior highlands (figure 2c), abundant in water resources, are well
suited for agriculture. The south and southeast are dry savanna; the far north is covered by rain forest.
Angola’s oil fields are located in the coastal region in the north and west. Angola is rich in various
-0.5
0.0
0.5
1.0
1.5
2.0
2.5
Perc
enta
ge p
oint
s
ICT Power Roads
-2.0
-1.0
0.0
1.0
2.0
3.0
4.0
5.0
Perc
enta
ge p
oint
s
ICT Power Roads

ANGOLA’S INFRASTRUCTURE: A CONTINENTAL PERSPECTIVE
5
minerals that are found in the western and central parts of the country (figure 2d). The distribution of
Angola’s infrastructure networks broadly follows the pattern of population and natural resource
distribution, with a greater density of transport, power, and ICT infrastructure along the western half of
the country (figure 2e, 2f, 2g, 2h).
Angola has quite an extensive road network. The main links in the western half of the country appear
to be in reasonable condition, while roads on the eastern side are sparser and more dilapidated. In terms of
regional integration, Angola’s most salient international road corridor connects the country to the
Democratic Republic of Congo (DRC) and Zambia in the east, although the infrastructure is in poor
condition.
Angola lacks anything that could be described as a national power grid, let alone regional
interconnections. There are a number of isolated power systems, with minimal local transmission links,
although a backbone is planned to link the main power assets in the north and south of the country.
Angola’s national fiber-optic backbone is already much further developed than its power grid, linking up
all the major towns on the western side of the country. Hydraulic infrastructure and irrigation is
conspicuously absent.
This report begins by reviewing the main achievements and challenges in each of Angola’s major
infrastructure sectors, with the key findings summarized in table 1. Thereafter, attention will turn to the
problem of how to finance Angola’s outstanding infrastructure needs.
Table 1. The achievements and challenges of Angola’s infrastructure sectors
Achievements Challenges
Air transport Significant growth in seats. Increasing competition in the sector. Improving safety oversight.
ICT Improved access to ICT. Sector reform.
Increasing competition in the sector. Increasing internet penetration.
Power Major expansion in generation capacity and rehabilitation of existing power assets. Decreased delay in connecting to grid.
Increasing low power access rates. Improving power supply reliability. Decreasing cost of connecting to grid. Developing transmission infrastructure. Raising tariffs to cost recovery level. Improving operational efficiency of utilities.
Ports Recent expansion and rehabilitation. Decreasing congestion. Boosting efficiency and performance.
Rails A number of railways exist. Rehabilitating 70 percent of the rails. Increasing freight and labor productivity. Introducing private participation.
Roads Huge investment program. Improving quality and density of roads. Establishing operational road fund and fuel levy. Improving the condition of regional corridor, as well as delays and cost of border crossing.
Water and sanitation Reduced reliance on open defecation. Decreasing high rates of water-borne disease. Improving water supply systems. Improving efficiency of the utilities. Raising tariffs to cost-recovery levels.
Source: Authors’ own elaboration based on findings of this report. Note: ICT = information and communication technology.

ANGOLA’S INFRASTRUCTURE: A CONTINENTAL PERSPECTIVE
6
Figure 2. Angola’s infrastructure networks align with population density and natural resource concentrations
a. Population
b. Topography
ANGOLA’S INFRASTRUCTURE: A CONTINENTAL PERSPECTIVE
7
c. Natural resources
d. Power, and natural resources

ANGOLA’S INFRASTRUCTURE: A CONTINENTAL PERSPECTIVE
8
e. Type and condition of roads, rail, and ports, and population

ANGOLA’S INFRASTRUCTURE: A CONTINENTAL PERSPECTIVE
9
f. ICT and population
g. Water, cropland extent, and airports
Source: AICD Interactive Infrastructure Atlas for Angola (www.infrastructureafrica.org/library/doc/698/angola-interactive-infrastructure-atlas).

ANGOLA’S INFRASTRUCTURE: A CONTINENTAL PERSPECTIVE
10
Power
Achievements
Angola has been making substantial investments in the power sector since 2002 to restore and
reconstruct the infrastructure that was destroyed during the civil war. Recent estimates from Empresa
Nacional de Electricidade (ENE)—Angola’s major power-generating company—indicate that these
investments led to an increase in generation capacity from around 830 MW in 2002 to over 1,200 MW in
2008 (World Bank 2010a) (table 2). In terms of per capita generating capacity, Angola fares better than
the average African fragile state or resource-rich country. Angola has 70 MW per million people
compared to resource-rich or low-income fragile countries, which have only 43 or 46 MW per million
people, respectively (table 1).
Furthermore, a relatively high share of Angola’s generation capacity is actually operational. In 2008
almost 1,000 MW or 80 percent of the installed power generation capacity was operational. This is
higher, on average, than resource-rich countries, where roughly 66 percent was operational and generating
power. Thus, Angola has been able to rapidly ramp up its power production over the past decade. This
increased generation and operational capacity facilitated a 13 percent average annual growth in power
production between 1999 and 2008. As of 2008 around 4,133 GWh of power was produced, a steep
increase compared to 1999 production levels of 1,295 GWh (World Bank 2010a).
The delay involved in obtaining an electricity connection has fallen dramatically since 2007.
Investment climate surveys in 2007 reported that firms encountered delays of over two months in Luanda
and over six months in other parts of Angola in order to obtain a new electricity connection (World Bank
2007b). But Angola has achieved tremendous progress in this area—firms in 2010 recorded only a seven-
day delay, on average, in obtaining a power connection (World Bank 2010b).
Challenges
But increased investments in power infrastructure have not necessarily translated into widespread
electrification. As of 2008 only a little more than 30 percent of Angola’s population benefited from access
to power, lower than the 46 percent average for the nation’s resource-rich African peers. No
disaggregated data are available on the levels of rural versus urban access in Angola (World Bank 2010a),
but it is known that Luanda consumes around two-thirds of the nation’s electricity, suggesting relatively
high access in the urban and peri-urban areas of the capital. Further, at least 85 percent of Luanda’s
municipalities indicate that they use electricity for lighting, corroborating that the availability of
electricity in urban areas is high (World Bank 2005). It is estimated that about half of the connected
residential consumers in Luanda are served by informal providers who pay a bulk tariff of around
US$0.04 cents per kilowatt-hour to the utility and resell to consumers at approximately three times this
price. Given the limited attention given to rural electrification to date, rural access can be expected to be
quite low.

ANGOLA’S INFRASTRUCTURE: A CONTINENTAL PERSPECTIVE
11
Table 2. Benchmarking Angola’s power infrastructure
Units Angola
Low-income, fragile
Low-income, nonfragile
Middle-income
Resource rich
Access to electricity, national % of population 30 15 33 50 46
Installed generation capacity per capita MW per million people 70 46 20 799 43
Firms that find power a constraint for business % of firms 46 67 52 31 56
Firms with own generator % of firms 68 33 41 18 63
Outages per year days 36 11.1 41 5.6 15
Outages, value lost, annually % of sales 13 5 6 2 7
Collection rate, reported by utility, electricity % of billing 42 92 91 70
Cost-recovery ratio, historical % 15 85 89 85 97
Revenue per unit US cents per KWh 2.5 3 14 13 13
System losses % of generation 18–23 24 24 20 52
Total hidden costs % of revenue 375 544 69 0 168
Angola Predominantly hydropower Other developing
countries
Effective power tariff Residential at 100 kWh 3.72 10.27
5.0–10.0 Effective power tariff Commercial at 100 kWh 4.88 11.73
Effective power tariff Industrial at 50.000 kWh 4.88 11.39
Source: Data for aggregates for low-income, middle-income, and fragile states based on data for 2005 unless indicated otherwise (www.infrastructureafrica.org/tools/data). Data for access to electricity, installed and operational capacity, collection rate, and system losses provided by World Bank specialists (2011). Data on revenue per unit, cost recovery, and hidden costs based on information from World Bank (2010a). Firms that find power to be a constraint taken from World Bank (2007b). Value lost and outages per year is from enterprise surveys and is from World Bank (2010b). Note: kWh = kilowatt-hour; MW = megawatts
Additionally, even though power availability has improved, service continues to be relatively
unreliable, with growing recourse to emergency rentals to safeguard supply. Despite the steep growth in
power production, World Bank investment climate surveys in 2007 reported that around 84 percent of
firms experience power outages, lasting around 21 hours, on average 8 times a month. Large firms
indicated a more acute problem, with at least 16 outages a month; the manufacturing sector overall was
the worst affected. The problems were reportedly worse outside Luanda (World Bank 2007b). In 2010
results from the enterprise showed marginal improvement, with Angolan firms enduring a modestly better
6 outages a month lasting around 14 hours (World Bank 2010b). Overall 36 days were spent without
electricity, twice the time endured by other resource-rich African countries.
Inadequate power supply is a huge impediment to private sector activity. In 2007 at least 68 percent
of Angolan firms surveyed in the larger cities had their own generation capacity to compensate for
intermittent grid supply. Outside of Luanda, 90 percent of firms owned their own generators, producing
almost a third of their own power needs. Recent estimates suggest that at least 900 MW of self-generation
capacity has been put in place by Angola’s firms. This is not far short of ENE’s generation capacity, and
much higher than in many other resource-rich countries. Around 5 percent of firms’ annual turnover was
lost due to electricity shortages, which is typical of resource-rich countries in Africa (World Bank 2007b).
In 2010 the impact of unreliable power supply was reportedly worse, such that the value lost due to erratic
power supply had increased substantially to 13 percent, much higher than for the peer group (World Bank
2010b). Self-generation by firms is largely diesel-based and can cost as much as $0.40 per kilowatt-hour

ANGOLA’S INFRASTRUCTURE: A CONTINENTAL PERSPECTIVE
12
(kWh) to operate in spite of the relatively low diesel prices in Angola (table 2)—or roughly twice ENE’s
production costs. Most of the time, self-generation is operated on stand-by mode, as a backup for frequent
outages. To ensure steady supply, however, it is not uncommon to have self-generation operating
continuously, thereby adding significantly to the costs of power.
Further, while the time taken to obtain an electricity connection has reduced in recent years, new
connections still impose a large cost to firms in Angola. The cost for firms to obtain an electricity
connection is ten times the country’s per capita income. Although these costs are lower than elsewhere in
Africa, they nonetheless represent a significant burden on firms (World Bank 2010c).
Figure 3. Angola’s fragmented power infrastructure network
Source: AICD Interactive Infrastructure Atlas for Angola (www.infrastructureafrica.org/library/doc/698/angola-interactive-infrastructure-atlas).
Poor access and erratic power supply can be attributed to the fragmented nature of Angola’s power
system as well as deficiencies in existing transmission and distribution infrastructure. Angola has three
major electric systems that are not interconnected, each operating independently. The north, south, and
central systems each have their own networks linking generation sources to load centers (figure 3). The
northern system, serving Luanda, accounts for over 80 percent of the country’s generation assets, while
the central and southern systems have less than 10 percent each. While blackouts are commonplace in
Luanda, they are even more so in the central and southern systems. Ironically, the north actually has a
surplus of energy—its blackouts are less due to lack of energy than to operational challenges associated
with managing the system during peak-load periods. The absence of a national transmission backbone

ANGOLA’S INFRASTRUCTURE: A CONTINENTAL PERSPECTIVE
13
prevents surplus power in the north being wheeled to the center and south of the country. This problem of
regional imbalances in power supply and demand will only become more accentuated as new generation
capacity comes on stream, underscoring the importance of improving the transmission network.
Power production costs, at $0.16 per kWh, are relatively high by the standards of neighboring
countries in southern Africa (figure 4). The higher costs in Angola, particularly when compared to its
neighbors, are partly explained by the country’s reliance on oil-based generation for about 40 percent of
its production, at a cost of around $0.30 per kWh.
Figure 4. The costs of power production in Angola are relatively high
Source: Derived from Briceño-Garmendia and Shkaratan (2010-); based on data from 2005–06. Angola costs derived based on IFC staff estimates and are for 2010. Note: DRC = Democratic Republic of Congo; kWh = kilowatt-hour.
Meanwhile, tariffs, at $0.042 per kWh, are among the lowest in Africa, covering only a small fraction
of costs (figure 5). Power tariffs in Angola are low even by the standards of other hydropower-dependent
countries, whose power tariffs typically stand closer to $0.10 per kWh. Angola has not revised its power
tariffs since 2004. These low power prices, although meant to benefit the poor, largely subsidize the
better-off minority that live in larger cities covered by the grid, while the poor remain unconnected.
0
5
10
15
20
25
30
35
40
45
Mali
Burki
na F
aso
Cong
o
Benin
Cape
Ver
de
Came
roon
Rwan
da
Nige
r
Ango
la
Mada
gasc
ar
Keny
a
Tanz
ania
Botsw
ana
Chad
Ghan
a
Sene
gal
Nami
bia
Cote
d'Ivo
ire
Leso
tho
Ugan
da
Nige
ria
Malaw
i
Moza
mbiqu
e
Ethio
pia
DRC
Zamb
ia
South
Afric
a Pow
er P
rodu
ctio
n co
sts
(US
cent
s pe
r KW
h)

ANGOLA’S INFRASTRUCTURE: A CONTINENTAL PERSPECTIVE
14
Figure 5. The average Angolan consumer pays extremely low prices for power
Source: Derived from Briceño-Garmendia and Shkaratan (2010); Angola data from IFC staff estimates and for 2011. Note: DRC = Democratic Republic of Congo.
In part due to these low tariffs, Angola’s power sector faces a dire financial situation. The two central
actors in the sector are the power utilities ENE and Empresa de Distribuição de Electricidade (EDEL).
ENE produces power and distributes around 30 percent of it in the south and central region. EDEL buys
power from ENE and distributes the remaining 70 percent in the north of the country. Both companies
receive direct subsidies from government as well as implicit subsidies through low fuel prices. Angola
charges very nominal prices for fuel when compared to other oil-producing nations or to its oil-importing
neighbors (table 3). Recent data on the magnitude of direct subsidies are not available. But the historical
record shows that the power utilities were unable to attain
financial sustainability despite the major subsidies they were
receiving. In 2000 ENE received a direct subsidy of $150 million
plus fuel subsidies that together covered 25 percent of its costs,
and still registered losses of over $4 million. In 2001 EDEL’s
revenues from sales did not cover the cost of energy purchase
from ENE even after the direct subsidy from the government was
included, resulting in financial losses of $15 million.
One problem is the cumulative underpricing of energy along
the production chain.
Cost-recovery challenges
plague Angola’s power system
(table 4). ENE produces power at
$0.16 per kWh. Around 70
percent of the power is sold to
EDEL at a bulk supply tariff of
$0.022 per kWh, recovering only
14 percent of production costs.
The other 30 percent of ENE’s
power is distributed to customers in the central and southern areas of Angola at a price of $0.042 cents per
kWh, recovering only 26 percent of the costs of production. For EDEL the cost of purchase and
0
10
20
30
40
50 Lib
eria
Chad
Sier
ra Le
one
Cape
Ver
de
Sene
gal
Burki
na F
aso
Mali
Ugan
da
Nige
r
Keny
a
Cong
o, Re
p.
Rwan
da
Benin
Cote
d'Ivo
ire
Nami
bia
Mada
gasc
ar
Came
roon
Ghan
a
Botsw
ana
Moza
mbiqu
e
Leso
tho
Tanz
ania
Zimba
bwe
South
Afric
a
Ethio
pia
Botsw
ana
Nige
ria
Ango
la
Malaw
i
DRC
Zamb
ia
Table 3. Angola pays very little for diesel per liter compared to several oil-producing neighbors
US cents/liter 2004 2006 2008
Angola 29 36 39
Cameroon 83 107 104
Congo, Rep. of 59 67 57
Namibia 65 87 88
South Africa 80 84 45
Source: GTZ 2009.
Table 4. Power underpricing per kilowatt-hour (US cents per kWh)
Cost of
production/purchase EDEL Consumer
ENE 16 2.2 4.2
Underpricing by ENE 13.8 11.8
EDEL 7 4.2
Underpricing by EDEL 2.8
Source: AICD estimates based on World Bank (2010a) and IFC staff estimates.

ANGOLA’S INFRASTRUCTURE: A CONTINENTAL PERSPECTIVE
15
transmission and distribution of power amounts to approximately $0.07 per kWh, yet the tariff charged to
the final consumer is $0.042 per kWh, recovering only 60 percent of costs (table 4).
Furthermore, distribution losses are substantial. Estimates of ENE’s technical and nontechnical losses
are 18–23 percent. Losses are much worse for EDEL, totaling 36 percent, of which 15 percent is
attributable to technical losses and 21 percent to nontechnical losses. Nontechnical losses are largely due
to pilfering through illegal connections, lack of meters, and faulty billing systems. Recent estimates
suggest that overall losses were reduced from 40 percent in 2006 to around 32 percent in 2010. While this
represents important progress, losses remain very high in absolute terms.
In addition, the nonpayment of
power bills is rampant. The
pervasive culture of nonpayment
found in Angola seriously impedes
financial performance. The
government estimates that, on
average, only 40 percent of the energy generated is billed, and that only 42 percent of what is billed is
collected. This collection rate is exceptionally low compared to the African peer group (table 5). While
EDEL’s collection performance used to be much worse than ENE’s, it has improved in recent years to a
point where the two companies have largely converged (table 7). Ironically, the collection ratio of what
the utilities charge their end consumers, at around 70 percent, is much higher than the collection ratio
between ENE and EDEL, which stands at only 27 percent (table 5). The trail of arrears between the
various entities involved in the power sector starts with nonpayment by EDEL’s clients, leading to
nonpayment for power purchased by EDEL from ENE, leading to nonpayment of fuel purchased by ENE
from the national oil company SONAGOL.
In total, inefficiencies contributed to a combined financial hemorrhage of $618 million for ENE and
EDEL in 2009, with underpricing, distribution losses, and low collection ratios accounting for over $550
million of that total. Hidden costs in the power sector have been increasing steadily since 2007. ENE
accounts for the lion’s share of the hidden costs—almost $500 million in 2009, or 0.7 percent of GDP.
The largest source of hidden costs for ENE is the underpricing of power, both to EDEL and to its own
consumers. The failure of EDEL to make timely payments on its bills further augments ENE’s hidden
costs (table 6). EDEL’s hidden costs amounted to $120 million a year in 2009, equivalent to 0.2 percent
of GDP (table 7). Once again these costs are largely driven by underpricing, and to a lesser extent system
losses.
Table 5. Bill collection in Angola in 2008
ENE % of ENE sales EDEL
Collections from consumers (%) 71 30 68
Collections from EDEL (%) 27 70
Source: World Bank 2010a.

ANGOLA’S INFRASTRUCTURE: A CONTINENTAL PERSPECTIVE
16
Table 6. Large hidden costs associated with ENE
Power billings (consu-mers + EDEL) (Gwh/ year)
System losses
in distri-bution
to consu-mers (%)
Collections (%)
Cost-recovery bench-mark
($/kWh)
Average revenue (US$/ KWh)
Average effective tariff (US$/kWh)
Total hidden costs ($ million/ year)
Total hidden costs (% reve-nues)
Consu-mers EDEL
Consu-mers EDEL
Consu-mers EDEL
2007 2,374 23 70 27 0.16 0.04 0.02 0.04 0.02 366 542
2008 2,920 23 70 27 0.16 0.04 0.02 0.04 0.02 450 542
2009 3,236 23 70 27 0.16 0.04 0.02 0.04 0.02 498 542
Source: Derived based on Briceño-Garmendia, Smits, and Foster (2009); Angola calculations derived from IFC staff estimates and World Bank (2010a). Note: kWh = kilowatt-hour.
Table 7. Increasing hidden costs at EDEL in terms of monetary value
Power billings
(GWh/year)
System losses
(%)
Implicit collection
ratio (%)
Cost-recovery
benchmark ($/kWh)
Average revenue ($/kWh)
Average effective
tariff ($/kWh)
Total hidden costs
($ million/year)
Total hidden costs
(% revenues)
2005 1001 46 54 0.06 0.02 0.04 59 239
2006 1252 40 61 0.06 0.03 0.04 67 203
2007 1475 36 61 0.07 0.03 0.04 91 214
2008 1814 36 68 0.07 0.03 0.04 102 171
2009 2200 36 68 0.06 0.03 0.04 120 164
Source: Derived based on Briceño-Garmendia, Smits, and Foster (2009); Angola calculations derived from IFC staff estimates and World Bank (2010a). Note: kWh = kilowatt-hour; GWh = gigawatt-hour.
Figure 6. Massive hidden costs in the power sector in Angola
a) ENE b. EDEL
Source: AICD calculations.
The magnitude of hidden costs in Angola’s power sector, at about 400 percent of revenues, is second
only to the Democratic Republic of Congo (figure 7). ENE’s hidden costs are 542 percent of its revenue
and EDEL’s hidden costs are 164 percent of its revenue (figures 6a and 6b). In the Democratic Republic
0%
100%
200%
300%
400%
500%
600%
2007 2008 2009 Losses Underpricing Collection Inefficiencies
0 50
100 150 200 250 300
2005 2006 2007 2008 2009
Losses Underpricing Collection Inefficiencies

ANGOLA’S INFRASTRUCTURE: A CONTINENTAL PERSPECTIVE
17
of Congo, hidden costs reach 600 percent of sector revenues, but for most other countries in the region,
hidden costs rarely exceed 200 percent of sector revenues.
Figure 7. The hidden costs of Angola’s power sector are among the worst on the continent
Source: Briceño-Garmendia, Smits, and Foster 2009. Note: DRC = Democratic Republic of Congo.
Although Angola’s power costs can be expected to fall in the medium term, today’s tariffs will
nonetheless need to increase if the sector is to reach financial equilibrium. Angola faces relatively high
power costs as of today, but there is reason to believe these costs will fall over time. Angola still has vast
unexploited hydropower potential as well as abundant gas reserves estimated at 10 trillion cubic feet
(World Bank 2010a). Both of these primary sources of energy could be harnessed to produce power at a
much lower cost than today. Backing up Angola’s largely hydro-based system with gas-fired generation,
as opposed to the current oil-fired generation, would prove to be a great deal more cost effective. In
addition, as Angola develops its national power grid it will be in a position to interconnect with the
Southern Africa Power Pool, opening up access to a range of other cost-effective sources of power, most
notably the Inga power scheme in the Democratic Republic of Congo. Even taking all of these factors into
account, Angola’s long-run marginal cost of power could still be expected to amount to around $0.11 per
kWh, which is almost three times today’s tariffs. This points to the importance of moving tariffs on to a
more sustainable trajectory.
Figure 8. Cost recovery will remain a questionable prospect even in the future
Source: AICD calculations based on Rosnes and Vennemo (2009); IFC staff estimates; World Bank (2010a).
0 100 200 300 400 500 600 700
DRC Congo Angola Malawi Tanzania Zimbabwe (2009)
Botswana Zambia Mozambique
Losses Underpricing Collection Inefficiencies
Historical total cost Long-run cost of imported power (trade stagnation scenario)
Long-run cost of imported power (trade
scenario)
Tariff to consumers Average revenue Bulk tariff to EDEL

ANGOLA’S INFRASTRUCTURE: A CONTINENTAL PERSPECTIVE
18
Transport
Roads
Achievements
Angola is making extraordinary efforts to reconstruct its dilapidated road infrastructure. The level of
public spending on roads increased dramatically in recent years, averaging a staggering $2.8 billion over
the period 2005–09. This makes Angola one of the highest spenders on road infrastructure in Africa. This
spending is about four times the estimated $423 million annual longer-term requirement for road-network
preservation, reflecting Angola’s desire to reconstruct its road infrastructure on an accelerated timetable
(figure 9). According to budget figures, as much as two-thirds of this total is classified as maintenance.
This is somewhat surprising; however, the boundary between maintenance and rehabilitation activities
can be a blurry one, and so this may simply reflect issues of expenditure classification.
Figure 9. Angola’s spending on roads is more than sufficient to cover maintenance and rehabilitation needs
Source: Gwilliam and others 2008.
Challenges
Angola’s road network is in very poor condition. Angola’s road network covers 62,560 km. Of this
total length, the classified network (primary, secondary, and tertiary) accounts for 58 percent or 36,399
km. The rest is the urban network of 11,057 km and the unclassified network of 15,104 km. Most of the
traffic is concentrated in the area surrounding Luanda (figure 10), but overall traffic levels are
comparatively low (table 8). The inadequate condition of the roads caused by years of destruction and
undermaintenance is one of the factors contributing to the low traffic levels. As much as 58 percent of
Angola’s classified network and 40 percent of its rural network is in poor condition, which is among the
worst road condition statistics in Africa (figures 10 and 11). Only 17 percent of classified and urban roads
are paved. Poor road quality in combination with very low road density and a lack of bridges—as many
were destroyed or imbedded with mines during the war—makes some of the provincial capitals
impossible to access by road. In addition, feeder roads are nonexistent in many parts of the country.
-100
-50
0
50
100
150
200
250
300
350
400
Spe
ndin
g as
% o
f req
uire
men
ts
Maintenance Rehabilitation

ANGOLA’S INFRASTRUCTURE: A CONTINENTAL PERSPECTIVE
19
Figure 10. Angola’s roads: Type and condition versus traffic
a. Type and condition of roads, rail, and ports, and population
b. Road traffic, airports, and natural resources
Source: AICD Interactive Infrastructure Atlas for Angola (www.infrastructureafrica.org).

ANGOLA’S INFRASTRUCTURE: A CONTINENTAL PERSPECTIVE
20
Table 8. Angola’s road indicators benchmarked against Africa’s low- and middle-income countries
Indicator Unit
Low-income,
nonfragile countries
Resource-rich
countries Angola
Middle-income
countries
Classified road network density km/1,000 km2 of land area 88 98 29 278
Total road network density [1] km/1,000 km2 of land area 132 128 41 318
GIS Rural accessibility % of rural pop. within 2 km of all-season road 25 20 31 31
Main road network condition [2] % in good or fair condition 72 68 58 86
Rural road network condition [3] % in good or fair condition 53 61 40 65
Classified paved road traffic AADT 1,131 1,408 884 2,451
Classified unpaved road traffic AADT 57 54 10 107
Primary network overengineering % of primary network paved with 300 AADT or less
30 15 42 18
Perceived transport quality [4] % firms identifying transport as major business constraint
13 27 — 20
Source: AICD Road Sector Database on 40 Sub-Saharan African countries. [1] Total network includes the classified and estimates of unclassified and urban networks. [2] Main network for most countries is defined as result of adding the primary and secondary networks. [3] Rural network is generally defined as the tertiary network and does not include the unclassified roads. [4] Source: World Bank—IFC Enterprise Surveys on 32 Sub-Saharan Africa countries. GIS = geographic information system; AADT = average annual daily traffic. — = Not available.
Figure 11. The condition of Angola’s main road network benchmarked against others in southern Africa
Source: AICD Road Sector Database on southern Sub-Saharan African countries.

ANGOLA’S INFRASTRUCTURE: A CONTINENTAL PERSPECTIVE
21
The quality of Angola’s regional road corridors is also poor, making the country’s regional
connectivity with the broader SADC economic area difficult. This situation both prevents Angola from
developing regional trade with surrounding countries and limits surrounding countries from making
greater use of the Port of Luanda (see figure 13).
Transportation represents an important bottleneck for Angola’s economy. Poor road infrastructure
and transport logistics slow Angola’s overall economic development. Angola is one of the worst
performers in the world according to the 2010 Logistics Performance Index (LPI). Its manufacturing
sector depends on imports for as much as 40 percent of inputs, which can be difficult and expensive to
procure given the poor quality of the roads. Moreover, around 2.1 percent of the production of
manufacturing firms is lost in transit, more than in any other African country (World Bank 2007). It takes
49–531 days to export or import goods, among the longest times in Africa. Road access is particularly
problematic for firms outside Luanda.
For all of these reasons, Angola urgently needs to establish an operational road fund. The country’s
current extraordinary spending on the road sector is entirely budget-financed. Such high levels of public
funding are not sustainable in the long term, and there is the risk that today’s heavy investments may not
be adequately maintained in the future. It is therefore critical for Angola to work toward the establishment
of a road fund resourced from a fuel levy and other road-user charges. The optimal fuel levy needed for
long-term road-network sustainability in Angola would be on the order of $0.15 per liter of fuel, which is
toward the middle of the range for African countries (figure 12). But currently, gasoline and diesel prices
are heavily subsidized by the state and there is no mechanism for fuel levy collection.
Figure 12. Angola’s public contribution exceeds the maintenance and rehabilitation needs of its road network
Source: Gwilliam and others, 2008 .
1 www.doingbusiness.org/data/exploretopics/trading-across-borders.

ANGOLA’S INFRASTRUCTURE: A CONTINENTAL PERSPECTIVE
22
Figure 13. Angola’s poor road conditions constrain SADC’s regional connectivity
Source: AICD SADC Interactive Infrastructure Atlas (www.infrastructureafrica.org/aicd/tools/maps) . Note: Southern African Development Community.
Rail
Achievements
Angola has three operational railways in place. The railway systems once carried 9.3 million metric
tonnes of freight to Angola’s ports in Namibe, Luanda, Benguela, and Amboim, before the civil war but
freight levels are currently low (World Bank 2005). Similar to its other transport infrastructure, Angola’s
railways suffered during the 27 years of war: at present, only 30 percent of the total rail network is
operating (table 9). The railways are currently under rehabilitation with support from several parties,
including Chinese and Indian entities.

ANGOLA’S INFRASTRUCTURE: A CONTINENTAL PERSPECTIVE
23
Table 9. Rail networks in Angola
Lines (km) % Gauge
Company Port Region Total Operating operating (mm)
Caminhos de Ferro de Benguela (CFB) Lobito Central 1,333 246 18 1,067
Caminhos de Ferro de Luanda (CFL) Luanda Northern 479 181 38 1,067
Caminhos de Ferro de Moçamedes (CFM)
Namibe Southern 907 425 47 1,067
Amboim Amboim Central 122 0 0 760
Total 2,841 852 30 -
Source: Bullock 2009.
Challenges
Angola will need to rehabilitate or rebuild the 60 percent of its current rail network that is currently
out of operation. This is a tremendous task, since in many cases it requires expensive works to remove
mines and complete replacement of the obsolete or deteriorated rails. In addition, the performance of
existing lines is very poor. Freight density and labor productivity are low in Angola in comparison to
other African countries, and will need to be tackled through institutional reform (table 10).
Table 10. Railway indicators for Angola and selected countries, 2000–05
CFM
(Ang
ola)
BR (B
otsw
ana)
CEA
R (M
alaw
i)
Nac
ala
Rai
lroad
(M
ozam
biqu
e)
Beira
Rai
lroad
(M
ozam
biqu
e)
Res
sano
Gar
cia
Line
(M
ozam
biqu
e)
Tran
snam
ib (N
amib
ia)
Spoo
rnet
(Sou
th A
frica
)
RSZ
(Zam
bia)
NR
Z (Z
imba
bwe)
Concessioned (1)/ state run (0) 0 0 0 1 1 0 0 0 1 0
Freight density (1,000 tonne-km/km)
469 827 90 270 663 364 475 2,427 406 902
Passenger density (1,000 passenger-km/km)
— — 38 103 44 44 33 60 92 166
Labor productivity (1,000 traffic units per employee)
580 722 131 710 281 — 484 3,308 502 390
Locomotive productivity (million traffic units per locomotive)
30 41 3 25 13 — 25 33 25 8
Carriage productivity (1,000 passenger-km per carriage)
4,046 2,391 1,176 3,333 750 — — — 3,286 —
Wagon productivity (1,000 net tonne-km per wagon)
950 987 82 260 476 — 805 913 377 195
Freight yield (US cents/tonne-km) — — 6 5 3 3 — — 4 —
Passenger yield (US cents/passenger-km) — — 1 0.9 0.5 1 — — 1 —
Source: Bullock 2009. Derived from AICD rail operator database (www.infrastructureafrica.org/aicd/tools/data). Note: * With 2.5 passenger-km equivalent to 1 traffic unit, 1 tonne-km equivalent to 1 traffic unit. — = Not available.

ANGOLA’S INFRASTRUCTURE: A CONTINENTAL PERSPECTIVE
24
Ports
Achievements
The Port of Luanda offers natural deep-sea access to Angola and serves as the nation’s main route for
international trade. The existing port consists of 1,150 meters of quays (six berths), with an additional five
berths on a finger pier. The current draft at the port is 10.5 meters, allowing a maximum vessel size of
about 30,000 deadweight tonnes. But the depth in Luanda Bay exceeds 20 meters, potentially allowing
vessels larger than 150,000 deadweight tonnes to enter the bay as long as dredging activities are sustained
(Nathan 2010).
The Port of Luanda is benefitting from the recent rehabilitation, expansion, and upgrading financed
by a number of investors. There has been ongoing modernization of the second container terminal,
operated by Sogester, at a cost of $56.5 million since July 2010. The Sogester terminal commissioned
three new mobile container cranes in 2010. The port has recently acquired three new tugs to speed up the
mooring and departure of vessels, and thus increase port capacity. Luanda has also begun to move ships
offshore and offload cargo onto barges using ship’s gear (Nathan 2010).
Challenges
Burgeoning demand over the past few years has resulted in serious congestion at the Port of Luanda,
with traffic volumes increasing more than tenfold, from 30,000 to 346,000. As a major transit port not
only for Angolan goods but also for the Democratic Republic of Congo, Zambia, and Zimbabwe, Luanda
is one of the fastest-growing ports in Africa, witnessing a dramatic compound growth rate of around 30
percent over the past decade. This growth has created handling constraints leading to port congestion for
both general cargo and container traffic (figure 14). The congestion problem is responsible for a number
of the shortcomings in the port’s performance, problems that can only be addressed once capacity
increases.
Figure 14. Ratio of current demand to reported capacity
a. General cargo b. Container traffic
Source: AICD Ports Database 2008.

ANGOLA’S INFRASTRUCTURE: A CONTINENTAL PERSPECTIVE
25
The Port of Luanda is notorious for long delays and poor performance relative to other ports in
Africa. Container dwell times, at 12 days, are twice as long as Durban, Africa’s best-performing port, and
are rivaled only by ports in Mozambique that perform slightly worse. Truck cycle time, at 14 hours, is
over twice as long as other southern African ports. Crane productivity is less than half that of other
southern African ports.
Port-handling charges in Angola are among the highest in Africa. The container cargo-handling
charge is almost five times what is charged at the Port of Mombasa (Kenya) and 25 percent higher than
Durban (South Africa). Bulk cargo-handling charges are also on the higher end of what is observed in
African ports.
Deterred by the lengthy delays and high prices, Angolan traffic is increasingly using the Port of
Walvis Bay in Namibia as the main gateway to the sea. Walvis Bay is located 2,100 km to the south of
Luanda, yet improvements in road and rail infrastructure linking the two cities have made the port more
accessible to the Angolan market. The fact that port users increasingly prefer this long-distance road
journey and its associated border-crossing delays is testimony to the severity of the problems facing the
Port of Luanda.
Efforts that are now under way should help to ease the congestion problems at the Port of Luanda. A
dry port has been developed at Viana, about 30 km inland from the port, connected by road and rail. The
Viana dry port is in the process of being further expanded at a cost of about $70 million. A $136 million
contract was signed in 2009 to improve road access to the port and to reclaim additional land for
development around the port area. Further, a new container port is also being planned for a 2,400 hectare
site, at Barra do Dande, north of Luanda, which is in the process of being cleared of land mines (Nathan
2010).
Table 11. Benchmarking port performance
Performance
Cap
e To
wn
Dur
ban
East
Lon
don
Port
Eliz
abet
h
Wal
vis
Bay
Luan
da
Beira
Map
uto
Mom
basa
Dar
es
Sala
am
Tem
a
Container dwell time—average (days) 6 4 7 6 8 12 20 22 5 7 25
Truck time for receipt and delivery of cargo (hours) 5 5 2 5 3 14 7 4 5 5 8
Container crane productivity (container per hour) 18 15 8 15 7 10 11 10 20 13
Prices
Container-cargo-handling charge ($ per TEU) 258 258 258 258 110 320 125 155 68 275 168
General-cargo-handling charge ($ per tonne) 8 8 8 15 9 7 6 7 14 10
Source: AICD Ports Database 2008. Note: TEU = 20-foot equivalent unit.

ANGOLA’S INFRASTRUCTURE: A CONTINENTAL PERSPECTIVE
26
Air transport
Achievements
Angola’s air transport seat capacity grew significantly between 2001 and 2007 (figure 15, table 12).
The decline in capacity for 2009 may be more of a function of missing domestic capacity figures than a
true slowing of growth, since both intercontinental traffic and international traffic within Africa still show
growth in spite of the global recession. Angola’s restructured national airline, TAAG Angolan Airlines,
seems to be expanding its routes and fleet, which includes several Boeing 777s. Reflecting cultural ties,
flights to Portugal and Brazil feature prominently in the country’s pattern of intercontinental connectivity.
Figure 15. Evolution of seats and city pairs in Angola
a. Seats b. City pairs
Source: Bofinger 2009. Derived from AICD national database (www.infrastructureafrica.org/aicd/tools/data). Note: As reported to international reservation systems. NA = North Africa; SSA = Sub-Saharan Africa.
-
500,000
1,000,000
1,500,000
2,000,000
2,500,000
2001 2004 2007 2009 (Est)
Num
ber o
f sea
ts
Total International Intercontinental excluding flights between NA and SSA Domestic
0
5
10
15
20
25
30
35
40
45
2001 2004 2007 2009 (Est)
City
Pair
s
Total International
Intercontinental Domestic

ANGOLA’S INFRASTRUCTURE: A CONTINENTAL PERSPECTIVE
27
Table 12. Benchmarking air transport indicators for Angola and selected countries2
Country Angola DRC Zambia Mozambique
Namibia Republic of Congo
Traffic (2007)
Domestic seats (seats per year) 1,199,016 327,988 437,658 1,144,644 84,162 443,634
Seats for international travel within Africa (seats per year) 484,179 468,217 1,459,766 582,836 877,812 351,882
Seats for intercontinental travel (seats per year) 588,978 193,414 113,217 91,637 242,736 117,962
Seats available per capita 0.134 0.24 0.168 0.087 0.574 0.016
Herfindahl-Hirschmann Index—air transport market (%) 33.25 22.65 17.53 31.54 39.39 30.79
Quality
Percent of seat-km in newer aircraft 59.7 74.7 63.8 57.0 79.0 73.3
Percent of seat-km in medium or smaller aircraft 13.9 39.3 50.6 42.5 28.3 40.5
Percent of carriers passing IATA/IOSA Audit 1 (as of 2009)
0 0 100.0 100.0 0
FAA/IASA Audit Status No audit Failed No audit No audit No audit No audit
Source: Bofinger 2009. Derived from AICD national database (www.infrastructureafrica.org/aicd/tools/data). Note: The Herfindahl-Hirschmann Index is a commonly accepted measure of market concentration. It is calculated by squaring the market share of each firm competing in the market and then summing the resulting numbers. An HHI of 100 indicates the market is a monopoly; the lower the HHI, the more diluted the market power exerted by one company/agent. FAA = U.S. Federal Aviation Administration; IASA = International Aviation Safety Assessment; IATA = International Air Transport Association; IOSA = IATA International Safety Audit; DRC = Democratic Republic of Congo.
Challenges
There is relatively limited competition in the air transport sector. The dominant position of the
national carrier TAAG keeps the Herfindahl-Hirschmann Index for Angola’s air transport market
relatively high. But this is not to suggest that Angola relies on TAAG alone. Namibian carriers also
provide much of the capacity.
Rather than capacity or competition, Angola’s biggest challenge in the air transport sector is safety
oversight. All airlines from Angola are on the European Union (EU) blacklist, with exceptions for
specified 777s and one 737 operated by TAAG. The latest International Civil Aviation Organization
(ICAO) audit results still show significant room for improvement, with Angola being below international
averages in nearly all categories except primary aviation legislation.
2 All data are as of 2007, based on estimations and computations of scheduled advertised seats, as published by the Diio SRS Analyzer. This captures 98 percent of worldwide traffic, but a percentage of African traffic is not captured by these data.

ANGOLA’S INFRASTRUCTURE: A CONTINENTAL PERSPECTIVE
28
Water supply and sanitation
Achievements
Angola has made important progress in reducing reliance on open defecation. In 2007, 24 percent of the
population practiced open defecation compared to 49 percent in 2001. Even though the improvement has
been significant, the percentage is still high, at almost twice the level of middle-income countries (MICs)
(table 13).
Table 13. Benchmarking water and sanitation indicators
Unit Resource-
rich countries Angola
Middle-income
countries
Mid-2000s 2001 2007 Mid-2000s
Access to piped water % pop 13 13 18 52.1
Access to stand posts % pop 12 14 10 18.9
Access to wells/boreholes % pop 47 39 31 6.0
Access to surface water [1] % pop 27 34 40 13.0
Access to septic thanks % pop 13 17 31 40.8
Access to improved latrines % pop 37 18 22 1.4
Access to traditional latrines % pop 22 16 21 30.4
Open defecation % pop 28 49 24 14.3
2005 2009
Domestic water consumption liter/capita/day 115 75 56 154
Revenue collection % sales 60 85 44 100
Distribution losses % production 40 62 61 27
Cost recovery [2] % total costs 67 81 72 81
Operating cost recovery % operating costs 94 114 100 145
Labor costs connections per employee 96 25 34 369
Total hidden costs as % of revenue % 194 140
Angola
Low-income, water-scarce
resources
Other developing
regions
2005 2009
Average effective tariff U.S. cents per cubic meter 120 230 60–120 3–60
Source: Demographic and Health Survey 2006/7 and AICD water and sanitation utilities database (www.infrastructureafrica.org/aicd/tools/data). Note: Access figures from the 2001 Multiple Indicator Survey and 2007 Malaria Indicator Survey. [1] Surface water includes rivers, lakes, and ponds in the vicinity as the main source of water supply, as well as other nonimproved sources of water such as water from vendors and rain water. [2] Cost recovery is estimated based on the assumption of a capital cost of 40 cents per cubic meter.
The reduction in open defecation has been achieved by the expansion of higher-end forms of
sanitation in urban areas and traditional latrines in rural areas. Access to septic tanks almost doubled
between 2001 and 2007, from 17 to 31 percent. In urban areas about 4.8 percent of the population has
been gaining access to septic tanks each year, an exceptionally high rate of expansion that mirrors the
country’s rapid urbanization process (figure 16b). The use of improved latrines increased from 18 percent

ANGOLA’S INFRASTRUCTURE: A CONTINENTAL PERSPECTIVE
29
to 22 percent over the same year (table 13), particularly in urban areas. Use of traditional latrines also
increased from 16 to 21 percent between 2001 and 2007, mostly in rural areas, where 2.2 percent of the
population has been gaining access to this form of sanitation each year (figure 16b).
Figure 16. Angola has made important progress in the sanitation sector but not in the water supply sector Population gaining access per year, 1998–2006
a. Water b. Sanitation
Source: WHO Joint Monitoring Program 2010, from the 2001 Multiple Indicator Survey and 2007 Malaria Indicator Survey.
Challenges
Angola still has the highest rate of diarrheal disease in the world, with 114 years of life lost to diarrheal
diseases for every 1,000 Angolans. In 2006 a cholera epidemic hit Luanda, affecting 23,000 people and
causing almost 300 deaths (LUPP 2007). Contaminated water, inadequate storm-water drainage, deficient
operation of the limited sewer system, and high reliance on open defecation have resulted in high—and
steadily increasing—rates of water- and excreta-related diseases (USAID 2009). The situation is
particularly bad in periurban informal settings and in refugee camps, where more than a million internally
displaced persons still reside.
Angola’s urban population is growing at an increasingly fast rate (4.7 percent per year), and the
current piped and stand-pipe water supply and management system cannot keep up with the demand for
domestic water consumption. This gap is increasingly being filled by private water vendors selling largely
untreated water. The supply of water from tankers rose from 10 percent of the population in 2001 to 37
percent in 2007 (figure 17). Indeed, in periurban areas of Luanda, 70 percent of residents purchased their
water from water vendors. This water is extremely expensive, with prices varying from $4/m3 close to the
distributional area of the water tank to $20 in more distant areas (Cain, Daly, and Robson 2002), leading
to a significant increase in the number of small-scale operators (figure 17). Most of the water comes from
the ANGOMENHA filling station and is untreated, posing serious health risks. Tanker drivers who buy

ANGOLA’S INFRASTRUCTURE: A CONTINENTAL PERSPECTIVE
30
the ANGOMENHA water are expected to stop at the small water-treatment station for chlorine treatment
at a cost of $0.10/m3, but there is no enforcement system in place (Development Workshop—Angola,
2007). The water trucks then sell the water to an estimated 10,000 fixed-point water vendors, primarily
households that have built water-storage tanks; these households in turn sell the water to the rest of the
population (Keener, Luengo, and Banerjee 2009).
Due to its largely untreated nature,
water from vendors counts as surface
water (table 13). This accounts for
statistics showing a growing reliance
on surface water in Angola, increasing
from 34 to 40 percent between 2001
and 2007. Again, this was mainly
driven by the trend in urban areas,
where the use of surface water grew
from 22 to 39 percent; in fact the share
of the urban population moving to
surface-water reliance each year was as
high as 3.8 percent (figure 16a).
Most urban centers in Angola are
served by precarious water supply
systems unable to cope with rapid
urbanization. Most of these systems
were damaged during the war and have
suffered from lack of proper
maintenance. On average 34 liters per
capita per day are provided to urban residents, but in fact the distribution ranges from about 80 liters per
capita per day in the most privileged areas to 3 liters per capita per day in the poorest (World Bank 2008).
This situation should begin to improve in the near future, since the government is investing heavily to
rehabilitate treatment facilities, pumping stations, transmission mains, and distribution networks in major
urban areas throughout Angola, and working on parallel institutional reforms to make the sector more
sustainable (World Bank 2008).
Luanda’s utility provider, Empresa Provincial de Agua de Luanda (EPAL),3 is struggling with aging
infrastructure built to support a much smaller population. The utility’s deteriorating performance puts it
well behind those in other resource-rich countries. The water supply system in Luanda was built in
colonial times for a population of 500,000 people, yet by 2007 Luanda’s population was estimated to be
over 5 million. Utility water consumption per capita between 2005 and 2009 decreased from 75 to 56
liters per day. Even so, putting Luanda well ahead of the national average for water consumption..
Revenue collection dropped from 85 percent of the billings in 2005 to 44 percent in 2009, below the 60
percent average for resource-rich countries (table 1). Whereas distribution losses remain stagnant, at
around 60 percent of production, they are well above the average 40 percent for utilities in resource-rich 3 Empresa Pública de Água de Luanda.
Figure 17. Evolution of water truck operators Cumulative increase in the number of small scale operators between 1995 and 2005
Source: Development Workshop—Angola 2007. Note: SHO = small-scale high-size operator; SSO = small-scale single operator; SMO = small-scale medium-size operator;.

ANGOLA’S INFRASTRUCTURE: A CONTINENTAL PERSPECTIVE
31
countries and three times above the international benchmark of 20 percent. EPAL revenues covered only
72 percent of total costs in 2009 vis-à-vis 81 percent in 2005. Despite an increase in connections per
employee from 25 in 2005 to 34 in 2009, EPAL’s labor productivity is just one-third of the average for
utilities in resource-rich countries and well behind the international benchmark of 200 connections per
employee.
The burden of EPAL’s inefficiencies has increased over time. By comparing key performance
indicators of the utilities for which data are available against those of a well-performing utility or norm,
we are able to quantify—in monetary terms—the key inefficiencies affecting each utility. Here three
types of hidden costs are considered: first, utilities unable to collect 100 percent of their bills (collection
inefficiencies); second, utilities incurring losses on their water distributional network above the norm of
20 percent of production (losses); and, third, utilities whose average effective tariffs are not enough to
cover the cost of producing a cubic meter of water (underpricing). On this basis, the hidden costs of
EPAL grew from 98 percent of revenues in 2005 to 132 percent in 2009. The largest source of hidden
costs were high distributional losses, followed by low collection rates. In absolute terms this represents an
almost threefold increase in losses, from $45 million in 2005 to $125 million in 2009 (table 14). When
compared to the performance of other southern African utilities, EPAL’s hidden costs are among the
highest in the region (figure 18).
Figure 18. Benchmarking the hidden costs of EPAL against those of selected countries in southern Africa Percentage of revenues a. EPAL’s hidden costs b. Hidden costs of select water utilities in southern Africa
Source: Derived from Banerjee and others (2008b) and Briceño-Garmendia, Smits, and Foster (2009).
In the rural context, water supply is provided mainly by wells and boreholes that do not guarantee the
provision of safe water. Around 50 percent of rural dwellers are supplied by water coming from 4,000
wells and boreholes countrywide (figure 19). Many of these are not working due to shortages of spare
parts or fuel for pumps (USAID 2009). Low rural-road accessibility and the slow process of clearing mines
left over from the civil war make it harder to develop rural water supply systems. The government has
launched an ambitious rural strategy aimed at increasing water supply coverage to periurban and rural
areas to 80 percent by 2012.
0
20
40
60
80
100
120
140
Perc
enta
ge o
f rev
enue
s
Collection inefficiencies Underpricing Distribution losses
0
50
100
150
200
250
300
350
Perc
enta
ge o
f rev
enue
s
Collection inefficiencies Underpricing Distribution losses

ANGOLA’S INFRASTRUCTURE: A CONTINENTAL PERSPECTIVE
32
Table 14. Evolution of operational indicators associated with EPAL
Water delivered (million m3/year)
System losses (%)
Collection ratio (%)
Average total cost
($/m3)
Average effective tariff
($/m3)
Total hidden costs
($ million/year)
Total hidden costs
(% revenues)
2005 99 62 86 1.5 1.2 45 98
2006 100 60 82 1.3 1.5 37 63
2007 94 65 58 2.4 2.3 77 100
2008 98 60 48 2.5 2.5 100 100
2009 105 61 45 2.7 2.3 125 132
Source: Derived from Briceño-Garmendia, Smits, and Foster (2009). Note: Total cost is estimated based on the assumption of a capital cost of 40 cents per cubic meter.
Figure 19. Urban versus rural access to water supply and sanitation, 2007
a. Water supply b. Sanitation
Source: AICD water supply and sanitation utilities database (www.infrastructureafrica.org/aicd/tools/data). Note: Access figures calculated by AICD using data the 2007 Malaria Indicator Survey.
Information and communication technology
Achievements
Access to ICT has improved markedly since the end of Angola’s civil war in the early 2000s. Mobile
penetration rose from less than 1 subscriber per 100 people in 2000 to almost 50 subscribers per 100
people in 2009. Fixed-telephone access has risen marginally, but this is offset to some extent by the
development of wireless access (table 15) (Narain 2009).
Angola has made reforms to its telecommunications sector. The Ministry of Telecommunications and
Information Technology is responsible for overall sector oversight, while the Angolan Institute of
Communications (INACOM), created in 1999, is the industry regulator. Two mobile operators have been
licensed: Movicel, an Angolan firm, and Unitel, partly owned by Portugal Telecom, which entered the
market in April 2001. In addition to the incumbent, four fixed-line operators have been licensed
(Mercury, Nexus, Mundo Startel, and Wezacom).
0 10 20 30 40 50 60 70 80 90
100
Piped Stand Posts/ Shared
Wells and Boreholes
Surface Water
% p
opul
atio
n
Urban Rural
0 10 20 30 40 50 60 70 80 90
100
Septic thanks Improved Latrines
Traditional Latrines
Open Defecation
% p
opul
atio
n
Urban Rural

ANGOLA’S INFRASTRUCTURE: A CONTINENTAL PERSPECTIVE
33
Table 15. Benchmarking ICT indicators
Angola 2000
Angola 2008
Lower-middle-income group
2008
Sub-Saharan African region
2008 Angola 2009
GSM coverage % population under signal — 31 77 56 31
International bandwidth bits/person 0.1 20 153 34 —
Internet users/100 people 0.1 5.3 13.9 5.1 6.4
Landline subscribers/100 people 0.5 0.6 13.6 1.5 0.7
Mobile phone subscribers/100 people 0.2 39.9 28.5 33.3 48.5
US dollars Angola 2005
Angola 2008
Lower-middle-income group
2008
Sub-Saharan African region
2008 Angola 2009
Price of monthly mobile basket 12.45 11.8 8.4 11.8 11.32
Price of monthly fixed-line basket — 21.1 4.8 11.6 20.3
Price of monthly fixed broadband — 119 31.4 100 77
Price of a call to the United States per minute 1.2 1.3 — 0.8 1.2
Price of an inter-Africa call per minute — 1.4 — 1.0 1.3
Source: Adapted from Angola Telecom, Inacom, Unitel, AICD, and World Bank ICT at-a-Glance. — = Not available.
Challenges
Despite sector reforms, the actual level of competition remains low. Mobile competition is limited;
the two operators providing service use two different technologies (CDMA4 in the case of Movicel and
GSM5 in the case of Unitel), making it more costly for subscribers to switch networks because of the need
to purchase new equipment. While there is a high de jure level of competition in the fixed-line market, in
reality, the new operators have delayed getting off the ground. Despite being licensed years back, they
have only recently started to provide services. Movicel spun off from Angola Telecom in 2010, with 80
percent sold to investors (Almeida 2009). Meanwhile, Angola Telecom remains fully government owned.
The impact of limited competition is apparent in pricing: Angola’s ICT tariffs are above both the Sub-
Saharan African and lower-middle-income group averages (table 15, bottom).
Angola’s domestic backbone consists of microwave, VSAT,6 and as of recently fiber-optic cable. The
first phase of the national fiber-optic backbone linking 18 provincial capitals through 6,000 km of fiber-
optic cable is scheduled to be concluded in 2011 (Macaohub, November 17, 2010). A notable feature of
the domestic backbone is the 1,800-km ADONES portion stretching along the country’s Atlantic
coastline (WFN Strategies 2009). Angola was one of the few African countries to obtain access to an
international undersea fiber-optic cable when it connected to the South Atlantic 3 (SAT-3) cable in 2002.
Despite this, Internet access prices have remained high, in part due to Angola Telecom’s monopoly over
the cable. The country is slated to connect to two more cables in the near future: the Africa Coast to
Europe (ACE) cable and the West Africa Cable System (WACS). A consortium made up of the country’s 4 Code division multiple access. 5 Global system for mobile communications. 6 Very small aperture terminal.

ANGOLA’S INFRASTRUCTURE: A CONTINENTAL PERSPECTIVE
34
leading operators has reportedly been established for developing the connection to undersea cables, which
presumably will enhance open access (TelecomPaper, June 5, 2009).
Internet penetration in Angola is average for the southern African region (figure 20). There are no
official data on the number of Internet users in Angola. But according to the government, there were some
300,000 subscribers in 2008; assuming 3 users to a subscription, this amounts to about 900,000 users or
5.4 percent of the total population.7
Figure 20. Angola’s Internet market benchmarked against southern African peers
a. Internet service trends, Angola, 2000–08 b. Internet service trends, southern Africa, 2008
Source: Minges 2008.
Several of the new fixed-line operators have launched WiMAX8 networks, which, along with Angola
Telecom’s ADSL9 service, provides a degree of fixed broadband competition. Movicel recently launched
a GSM network that should enhance intermodal competition in the mobile market.10 It is likely that it will
also launch mobile broadband based on HSDPA11 technology to complement its high-speed wireless EV-
DO12 network. Unitel has also launched mobile broadband services. Given these developments and the
availability of international access through up to three undersea fiber-optic cables in the near future, the
prognosis for Angola’s broadband infrastructure is positive. The government will need to enhance
7 Conselho de Ministros, “Programa Executivo do Sector para 2009,” Resolução n.º 33/09 de 7 de Maio. 8 Worldwide interoperability for microwave access. 9 Asymmetric digital subscriber line. 10 www.consuladogeral-angola.hk/sub/Press/Press_2010_1201_3.html. 11 High-speed downlink packet access. 12 1x Evolution-Data Optimized.
0
5
10
15
20
25
0.0
1.0
2.0
3.0
4.0
5.0
6.0
2000 2001 2002 2003 2004 2005 2006 2007 2008
Inte
rnat
iona
l Inte
rnet
ban
dwid
th
Inte
rnet
use
rs
Internet users (per 100 people)
International Internet bandwidth (bits per second per person)
0
50
100
150
200
250
300
350
0
2
4
6
8
10
12
14
16
18
20
Mada
gasc
ar
Malaw
i
Zamb
ia
Leso
tho
Moza
mbiqu
e
Zimba
bwe
Botsw
ana
Ango
la
South
Afric
a
Nami
bia
Maur
itius
Inte
rnat
iona
l Inte
rnet
ban
dwid
th
Inte
rnet
use
rs
Internet users (per 100 people)
International Internet bandwidth (bits per second per person)

ANGOLA’S INFRASTRUCTURE: A CONTINENTAL PERSPECTIVE
35
competition to lower prices and spread availability so that access to high-speed Internet is not limited to
companies and well-off individuals.
Financing Angola’s infrastructure
To meet its most pressing infrastructure needs and to catch up with developing countries in other parts of
the world, Angola needs to expand its infrastructure assets in key areas (table 16). The targets outlined in
table 16 are purely illustrative, but they represent a level of aspiration that is not unreasonable. Developed
in a standardized way across African countries, they allow for cross-country comparisons of the
affordability of meeting targets that can be modified or delayed as needed to achieve financial balance.
Table 16. Illustrative investment targets for infrastructure in Angola
Economic target Social target ICT Install fiber-optic links to neighboring capitals and submarine cable.
Provide universal access to GSM signal and public broadband facilities.
Power Develop additional 2,028 hectares of large-scale and 305 hectares of economically viable small-scale irrigation.
n.a.
Transport Develop 8 MW of new-generation capacity and 2,120 MW interconnectors (no-trade scenario).
Increase electrification to 24.1 percent (42.4 percent urban and 9.1 percent rural).
WSS Achieve regional (national) connectivity with good-quality 2-lane (1-lane) paved road.
Provide rural road access to 42 percent of the highest-value agricultural land, and urban road access within 500 meters.
Source: Mayer and others 2009 ; Rosnes and Vennemo 2009; Carruthers, Krishnamani, and Murray 2009; You and others 2009. Note: WSS = water supply and sanitation; ICT = information and communication technology; GSM = global system for mobile communications. n.a. = Not available.
Meeting these illustrative infrastructure targets for Angola would cost around $2 billion per year over
a decade. About 70 percent of this total relates to capital expenditure, and the remaining 30 percent to
operating expenditure, suggesting that Angola’s priority should be investment, though it must not neglect
to maintain its assets. In the case of transport and irrigation, investment consists primarily of asset
rehabilitation, whereas for other infrastructure sectors investment should be focused on expanding the
asset base.
The largest share of spending needs relates to the power sector, followed by water and sanitation and
transport. The power sector requires sustained spending of $785 million annually due to major capital
investment needs. The second-highest needs are in the water and sanitation sector, with annual spending
needs of $574 million needed to meet the MDGs (table 17).

ANGOLA’S INFRASTRUCTURE: A CONTINENTAL PERSPECTIVE
36
Table 17. Infrastructure spending needs in Angola, 2006–15
$ million per year
Sector New investments Rehabilitation
Total capital expenditure
Operations and maintenance Total needs
ICT 169 0 169 119 288
Irrigation 1 16 16 2 18
Power 558 50 608 177 785
Transport 107 156 263 160 423
Water supply and sanitation 233 128 361 213 574
Total 1,067 350 1,417 671 2,088
Source: Mayer and others 2009; Rosnes and Vennemo 2009; Carruthers, Krishnamani, and Murray 2009; You and others, 2009. Derived from models that are available online at www.infrastructureafrica.org/aicd/tools/models. Note: WSS = water supply and sanitation; ICT = information and communication technology.
While Angola’s infrastructure spending needs are comparatively high in absolute terms, they look
manageable relative to the country’s burgeoning GDP. Expressing infrastructure spending needs as a
percentage of GDP gives a sense of the economic burden involved in providing adequate infrastructure.
For Angola, this burden amounts to no more than 7 percent of GDP, much lower than most other African
countries (figure 21). Infrastructure investment would absorb around 5 percent of GDP—only around
one-third of what China invested in infrastructure during the mid-2000s.
Figure 21. Angola’s infrastructure spending needs are comparatively low relative to GDP
Estimated infrastructure spending needed to meet targets, as percentage of GDP
Source: Foster and Briceño-Garmendia 2009. Note: LIC = low-income country; MIC = middle-income country; ECOWAS = Economic Community of West African States; SSA = Sub-Saharan Africa; GDP = gross domestic product; O&M = operations and maintenance; CAPEX = capital expenditure.

ANGOLA’S INFRASTRUCTURE: A CONTINENTAL PERSPECTIVE
37
Angola already spends a sizable $4.3 billion per year to meet its infrastructure needs (table 18). Around 57 percent of the total is allocated to operations and maintenance, while the remaining 43 percent
is capital expenditure. Operating expenditure is entirely covered from budgetary and state-owned
enterprise (SOE) resources, and payments by infrastructure users. Seventy-four percent of capital
expenditure is funded by the public sector, though significant shares of capital investments are provided
by the private sector (7 percent) and financiers other than member countries in the Organisation for
Economic Co-operation and Development (OECD) (18 percent). Official development assistance (ODA)
for infrastructure is negligible (2 percent).
Table 18. Financial flows to Angola’s infrastructure
$ million per year
O&M Capital expenditure
Total spending Public sector
Public sector ODA
Non-OECD financiers PPI
Total CAPEX
ICT 97 102 2 40 110 253 350
Irrigation 2 5 0 0 0 5 7
Power 295 184 6 81 9 280 575
Transport 1,815 1,026 10 127 3 1,166 2,981
WSS 233 22 16 70 0 109 341
Total 2,442 1,339 34 318 121 1,813 4,255
Source: Derived from Foster and Briceño-Garmendia (2009). Note: O&M = operations and maintenance; ODA = official development assistance; PPI = private participation in infrastructure; CAPEX = capital expenditure; OECD = Organisation for Economic Co-operation and Development; WSS = water supply and sanitation; ICT = information and communication technology. The public sector figures are averages of actual spending for 2007–09 in the case of government data. In the case of state-owned enterprises (SOEs), the average spans over 2004–08 and in some cases 2004–09. Funding from external financiers is averaged over the 2002–07 period.
Angola’s existing spending amounts to almost 14 percent of its 2005 GDP (figure 22). This represents
quite a high level of effort, well above the averages for the country’s regional peer groups. While total
spending is high, the balance between investment and operating expenditure is unusual. While Angola’s
capital spending of 6 percent of GDP is almost on par with its resource-rich peers, its operating
expenditure at 8 percent of GDP is several times the level found in other resource-rich countries.
Angola’s pattern of capital investment in infrastructure differs from that of comparator countries. It is
heavily skewed toward transport (taking 70 percent), leaving much smaller shares for power (14 percent),
ICT (8 percent), and water supply and sanitation (8 percent). Relative to its peer group, Angola is much
more reliant on public funding for capital investments for the transport, power, and ICT sectors. The level
of recent public investment in the transport sector is particularly high. Non-OECD financing is important
across the board in Angola. Private sector investment has been limited to the ICT sector, while other
resource-rich countries have received private flows also to other infrastructure sectors. Angola’s
investment efforts in ICT, power, and water supply and sanitation are lower than the respective average
for resource-rich countries. By contrast, investment in transport is substantially higher (figure 23).

ANGOLA’S INFRASTRUCTURE: A CONTINENTAL PERSPECTIVE
38
Figure 22. Angola’s existing infrastructure spending is quite high
Source: Derived from Foster and Briceño-Garmendia (2009). Note: LIC = low-income country; MIC = middle-income country; ECOWAS = Economic Community of West African States; SSA = Sub-Saharan Africa; GDP = gross domestic product; O&M= operations and maintenance; CAPEX = capital expenditure.
Figure 23. Capital investment in infrastructure in Angola and comparator countries Investment in infrastructure sectors as percentage of GDP, by source
Source: Derived from Briceño-Garmendia, Smits, and Foster (2009). Note: Private investment includes self-financing by households. ODA = official development assistance; OECD = Organisation for Economic Co-operation and Development; ICT = information and communication technology; GDP = gross domestic product; WSS = water supply and sanitation
Angola
Resource-rich
0.0 0.5 1.0 1.5 2.0 2.5 3.0 3.5 4.0
% o
f GD
P
Public ODA Non-OECD Private

ANGOLA’S INFRASTRUCTURE: A CONTINENTAL PERSPECTIVE
39
How much more can be done within the existing resource envelope?
As much as $1.3 billion of additional resources—equivalent to almost 5 percent of Angola’s GDP—
could be recovered each year by improving efficiency (table 19). The largest source of inefficiency is low
capital budget execution, leaving $573 million allocated to infrastructure unspent each year. Given the
magnitude of the road-sector investment program currently under way in Angola, which amounts to an
average of $2.9 billion annually, it makes sense that budget execution would be an issue. The second
serious source of inefficiency is underrecovery of costs in the power sector, which drains a further $475
million a year. Distribution losses and collection inefficiencies across both the power and water sectors
are also substantial, together absorbing $252 million each year.
Table 19. Angola’s potential gains from greater operational efficiency
ICT Irrigation Power Transport WSS Total
Underrecovery of costs — n.a. 475 n.a. 16 491
Overstaffing n.a. — n.a. — n.a. n.a. Distribution losses — — 65 — 57 122
Undercollection — n.a. 78 n.a. 53 131
Low budget execution 78 0 92 401 3 573
Total 78 0 709 401 128 1,317
Source: Derived from Foster and Briceño-Garmendia (2009). Note: WSS = water supply and sanitation; ICT = information and communication technology. — = Not available. n.a. = Not applicable.
Underpricing of power and water in Angola is less burdensome than in other low-income, fragile
countries in GDP terms. Nevertheless, it is very high in absolute terms and remains a huge problem for
Angola. Both power utilities, ENE and EDEL, charge tariffs of $0.042/kWh, recovering barely a quarter
of the full costs of power production estimated at $0.16/kWh. Furthermore, there is a huge subsidy
implicit in the bulk-supply tariff at which ENE sells power to EDEL. Overall, the hidden costs due to
undercharging in Angola’s power sectors amount to 0.7 percent of GDP. In the water sector, as of 2009,
EPAL’s average tariffs stood at $2.3/m3 versus the estimated $2.7/m3 average cost-recovery tariff. But
given the relatively small reach of the water utility, the macroeconomic burden, at 0.02 percent of GDP, is
relatively small (figure 24).
Cost-recovery tariffs for power look to be affordable to a majority of the population. With a tariff of
$0.16/kWh and a monthly subsistence consumption of 50 kWh, the associated utility bill comes to $8 per
month in Angola. Detailed information on the income distribution of Angolan households was not
available. But based on the distribution of household budgets in other Sub-Saharan low-income countries
(LICs), one can conclude that monthly power utility bills at these levels would likely be affordable to
around 60 percent of the population (figure 25). A more limited level of subsistence power consumption
of 25 kWh/month—enough to meet only the most basic needs—would cost $4 per month and would be
affordable to 80 percent of the population. Given that only 30 percent of the population has access to
electricity, it would appear that Angola has scope to increase electricity coverage at cost-recovery prices
before affordability becomes a serious impediment.

ANGOLA’S INFRASTRUCTURE: A CONTINENTAL PERSPECTIVE
40
Figure 24. Underpricing of power and water in Angola and other low-income, resource-rich countries Financial burden of underpricing as percentage of GDP
Source: Derived from Briceño-Garmendia, Smits, and Foster (2009). Note: GDP = gross domestic product.
Water costs are so exorbitantly high that cost-recovery tariffs could present affordability problems;
therefore the policy priority should be the reduction of costs. While Angola has some of the lowest power
tariffs in Africa, its water tariffs are among the highest in Africa. Angola’s water tariffs at $2.30/m3 are
more than double those found in most other African countries, and second only to Cape Verde, whose
costs of $3–$5/m3 are more understandable due to the archipelago’s high energy costs and heavy reliance
on desalination. Achieving full cost-recovery would entail raising tariffs to $2.7 /m3. At these prices, it
would cost $27 to consume 10 m3/month, which would be affordable to less than 20 percent of the
population. A more limited level of subsistence consumption of 4 m3/month for water would cost $10.8
per month, which would still be affordable to only 40 percent of the population. These findings suggest
that for the water sector, the priority needs to be reducing costs rather than raising tariffs.
Figure 25. Affordability of water and power
Source: Banerjee and others 2009. Note: LIC = low-income country; kWh = kilowatt-hour.
0.0
0.5
1.0
1.5
2.0
Power Water
Perc
enat
age o
f GDP
Angola Resource-Rich
0
20
40
60
80
100
2 4 6 8 10 12 14 16
Shar
e of u
rban
hous
ehold
s who
se ut
ility b
ill wo
uld be
less
tha
n 5 pe
rcent
of the
mon
thly h
ouse
hold
budg
et
Monthly utility bill (US$) Angola
LIC
Average cost of power is 4 USD/Month per 25 kwh or 8 USD/Month per 50 kwh subsistence consumption Average cost of water is 10.84 USD/Month per 4 m3 or 27.1 USD/Month per 10 m3 subsistence consumption Power cost-recovery tariff is 0.16 USD/kwh
Water cost-recovery tariff is 2.71 USD/m3

ANGOLA’S INFRASTRUCTURE: A CONTINENTAL PERSPECTIVE
41
The operational inefficiencies of power and water utilities cost Angola a further $252 million a year,
equivalent to 0.4 percent of GDP. The annual value of inefficiencies in the power sector (at $143 million)
is higher than that in the water sector (at $109 million). Both power utilities, ENE and EDEL, and the
water utility EPAL, can benefit from improving bill collection and reducing distributional losses. In 2009
ENE collected only 27 percent of its billings to EDEL and only 70 percent of its billing to end users.
EDEL reported collecting 68 percent of its billings to consumers. EPAL managed to collect only 45
percent of its billings for water services. If all utilities were able to collect 100 percent of billings, they
would receive an additional $131 million per year—$78 million in power and $53 million in the water
sector. ENE lost 23 percent of power distributed to end users in 2009, while EDEL’s distributional losses
stood at 36 percent. When compared to the best-practice benchmark of 10 percent, the overall distribution
losses result in $65 million in annual potential savings. Nonrevenue water in the water sector stood at a
high 61 percent of total water production in 2009, three times the best-practice benchmark of 20 percent.
Nonrevenue water inefficiencies cost Angola about $57 million a year, equivalent to 0.08 percent of GDP.
In the power sector, the burden of utility inefficiencies in terms of GDP in Angola is lower than for the
benchmark countries, but in water, the burden is slightly higher (figure 26).
Figure 26. The burden of inefficiency carried by Angola’s power and water utilities
a. Uncollected bills and unaccounted losses in the power sector, as a percentage of GDP
b. Uncollected bills and unaccounted losses in the water sector, as a percentage of GDP
Source: Derived from Briceño-Garmendia, Smits, and Foster (2009).
Annual funding gap
Angola’s infrastructure funding gap amounts to $115 million per year, or about 0.4 percent of GDP,
once efficiencies are captured. Most of the gap is found in the water and sanitation sector (table 20). Most
of the other sectors do not face any funding gap once all inefficiencies are taken into account. But in the
power, water, and ICT sectors there is some potential for redistributing spending between capital and
operating expenditure. As noted above, transport spending substantially exceeds the benchmark level
established here, due to a government preference for accelerating reconstruction of the national road
network. The remaining funding gap is very small relative to the size of Angola’s economy, and could
easily be filled by a modest reallocation of resources from the transport to the water and sanitation sector;
particularly in view of the low budget execution in the transport sector. Furthermore, the funding gap for
water and sanitation could be eliminated simply through a greater reliance on lower-cost technologies
0.000
0.100
0.200
0.300
0.400
0.500
Angola Resource-Rich
Perc
enat
age
of G
DP
Collection inefficiencies Unaccounted losses
0.00
0.05
0.10
0.15
0.20
Angola Resource-Rich
Perc
enat
age
of G
DP
Collection inefficiencies Unaccounted losses

ANGOLA’S INFRASTRUCTURE: A CONTINENTAL PERSPECTIVE
42
than previously used (such as stand posts, boreholes, and improved latrines) for meeting the MDGs,
thereby saving $165 million annually.
Table 20. Funding gaps, by sector
$ millions
ICT Irrigation Power Transport WSS Total
Needs (288) (18) (785) (423) (574) (2,088)
Spending* 266 7 457 423 322 1,474
Within sector reallocation 22 0 118 0 20 160
Potential efficiency gains 78 0 709 401 128 1,317
Funding gap — (11) — — (104) (115)
Across sectors reallocation potential 62 0 0 2,558 0 2,620
Source: Derived from Foster and Briceño-Garmendia (2009). Note: Potential overspending across sectors is not included in the calculation of the funding gap, because it cannot be assumed that it would be applied toward other infrastructure sectors. WSS = water supply and sanitation; ICT = information and communication technology. * traced to needs. — = Not available.
What else can be done?
While Angola’s infrastructure reconstruction needs are large in absolute terms, they look manageable
relative to the size of the country’s fast-growing economy. Moreover, Angola has already amply
demonstrated its commitment to channeling significant volumes of petroleum rents toward infrastructure
development. A significant expansion in power generation capacity has taken place, and a huge road
investment program is currently under way. Consequently, Angola is one of a very few African countries
that does not really face any significant infrastructure funding gap.
But this conclusion is contingent on Angola capturing the sizeable $1.3 billion of resources that are
each year being lost to inefficiency, equivalent to almost 5 percent of GDP. Two policy measures alone
would suffice to capture the bulk of these resources, and deserve priority attention. The first is the
increase of power tariffs toward cost-recovery levels. The second is an easing of the pace of the road-
sector investment program to reduce the problem of underexecution of budgetary resources.
Given the urgent pressure to reconstruct Angola’s infrastructure platforms, there is some evidence
that decisions have not always been optimal. For example, the expansion of generation capacity has not
been matched by reinforcements in transmission and distribution that would allow the power to flow
through to end users. And the scale of Angola’s road-investment program seems to have outstripped the
implementation capacity of the key sector institutions. There is also evidence that the water and sanitation
sector may not yet have received as much attention as it deserves.
In addition, Angola’s considerable achievements in infrastructure expansion over the past few years
have been almost entirely funded from public investment, with significant support from non-OECD
financiers. Angola has only captured about 0.4 percent of GDP in private investment for infrastructure,
compared with numerous African peers that have managed to capture 1–3 percent of GDP in private
investment (figure 27). Given the size and vibrancy of Angola’s economy it ought to be feasible in the

ANGOLA’S INFRASTRUCTURE: A CONTINENTAL PERSPECTIVE
43
medium term to attract a more significant volume of private finance, particularly in the energy sector (for
the development of a gas-fired plant), thereby helping to liberate public funds for other pressing social
needs.
Figure 27. Angola needs to attract more private investment, in particular beyond the ICT sector
Source: PPI Database, World Bank, 2010. Note: GDP = gross domestic product; ICT = information and communication technology.
Selecting optimal technology choices could reduce the funding gap by three-quarters. Adopting
lower-cost technologies could substantially reduce the cost of meeting infrastructure targets, and reduce
the funding gap. If Angola could strategically expand its power trade, this would reduce the resource
deficit of the power sector, lowering power needs from $785 million per year to $485 million per year,
leading to savings of $300 million annually. Similarly, meeting transport connectivity standards using
lower-cost road-surfacing technologies (such as single-surface treatment) could reduce the associated
price tag from $423 million to $241 million. The overall savings from these measures would amount to
$647 million, and would eliminate Angola’s funding gap (table 21).
Table 21. Potential savings from innovation
$ millions
Before innovation After innovation Savings
Savings as % of sector funding
gap
Savings as % of total
funding gap
Power trade 785 485 300 no gap 260
WSS appropriate technology 574 409 165 158 143
Roads appropriate technology 423 241 183 no gap 158
Total 1,783 1,135 647 no gap 562
Source: Derived from Carruthers and others, 2009 and Banerjee and others, 2008 Note: WSS = water supply and sanitation.
It will likely be necessary for Angola to consider planning for a period longer than a decade to reach
the illustrative infrastructure targets here outlined. If the huge efficiency potential could be fully captured,
Angola could meet the posited targets today, assuming current level of spending. But under business-as-
usual assumptions of spending and efficiency, it will take up to 20 years for Angola to reach these goals.
0.0 0.5 1.0 1.5 2.0 2.5 3.0 3.5
% G
DP
Power ICT

ANGOLA’S INFRASTRUCTURE: A CONTINENTAL PERSPECTIVE
44
Bibliography and references
This country report draws upon a wide range of papers, databases, models, and maps that were
created as part of the Africa Infrastructure Country Diagnostic (AICD). All of these can be downloaded
from the project Web site: www.infrastructureafrica.org. For papers go to the document page
(www.infrastructureafrica.org/aicd/documents), for databases to the data page
(www.infrastructureafrica.org/aicd/tools/data), for models go to the models page
(www.infrastructureafrica.org/aicd/tools/models), and for maps to the map page
(www.infrastructureafrica.org/aicd/tools/maps ). The references for the papers that were used to compile
this country report are provided in the table below.
General
AICD (Africa Infrastructure Diagnostic). Africa’s Infrastructure: A Time for Transformation.
www.infrastructureafrica.org.
Foster, Vivien, and Cecilia Briceño-Garmendia, eds. 2009. Africa’s Infrastructure: A Time for
Transformation. Paris and Washington, DC: Agence Française de Développement and World
Bank.
Financing
Briceño-Garmendia, Cecilia, Karlis Smits, and Vivien Foster. 2009. “Financing Public Infrastructure in
Sub-Saharan Africa: Patterns and Emerging Issues.” AICD Background Paper 15, Africa Region,
World Bank, Washington, DC.
Growth
Calderón, César. 2009. “Infrastructure and Growth in Africa.” Policy Research Working Paper 4914,
World Bank, Washington, DC.
Escribano, Alvaro, J. Luis Guasch, and Jorge Pena. 2010. “Assessing the Impact of Infrastructure Quality
on Firm Productivity in Africa.” Policy Research Working Paper 5191, World Bank, Washington,
DC.
Yepes, Tito, Justin Pierce, and Vivien Foster. 2009. “Making Sense of Africa’s Infrastructure
Endowment: A Benchmarking Approach.” Policy Research Working Paper 4912, World Bank,
Washington, DC.
Information and communication technologies
Almeida, Henrique. 2009. “Angola Sells 80 pct of Telecoms Group Movicel.” Reuters, July 30.
http://in.reuters.com/article/2009/07/30/angola-movicel-idINLU58752720090730.

ANGOLA’S INFRASTRUCTURE: A CONTINENTAL PERSPECTIVE
45
Ampah, Mavis, Daniel Camos, Cecilia Briceño-Garmendia, Michael Minges, Maria Shkaratan, and Mark
Williams. 2009. “Information and Communications Technology in Sub-Saharan Africa: A Sector
Review.” AICD Background Paper 10, Africa Region, World Bank, Washington, DC.
Macaohub. 2010. “Provincial Capitals of Angola Linked by Fibre Optic Cable in 2011.” November 17.
www.macauhub.com.mo/en/news.php?ID=10506.
Mayer, Rebecca, Ken Figueredo, Mike Jensen, Tim Kelly, Richard Green, and Alvaro Federico Barra.
2009. “Connecting the Continent: Costing the Needs for Spending on ICT Infrastructure in
Africa.” AICD Background Paper 3, Africa Region, World Bank, Washington, DC.
Narain, Divya. 2009. “Mundo Startel Expands WiMAX Services in Angola.” TMCnet, August 4.
http://africa.tmcnet.com/topics/othercountries/articles/61312-mundo-startel-expands-wimax-
services-angola.htm.
TelecomPaper. 2009. “Govt, Private Operators Launch Angola Cable Joint Venture.” June 5.
www.telecompaper.com/news/govt-private-operators-launch-angola-cable-joint-venture.
WFN Strategies. 2009. “WFN Strategies to Supervise Maintenance of the ADONES Cable System.”
Press Release, June 29. www.wfnstrategies.com/pressroom.php.
Irrigation
Svendsen, Mark, Mandy Ewing, and Siwa Msangi. 2008. “Watermarks: Indicators of Irrigation Sector
Performance in Africa.” AICD Background Paper 4, Africa Region, World Bank, Washington,
DC.
You, L., C. Ringler, G. Nelson, U. Wood-Sichra, R. Robertson, S. Wood, G. Zhe, T. Zhu, and Y. Sun.
2009. “Torrents and Trickles: Irrigation Spending Needs in Africa.” AICD Background Paper 9,
Africa Region, World Bank, Washington, DC.
Power
Eberhard, Anton, Vivien Foster, Cecilia Briceño-Garmendia, Fatimata Ouedraogo, Daniel Camos, and
Maria Shkaratan. 2008. “Underpowered: The State of the Power Sector in Sub-Saharan Africa.”
AICD Background Paper 6, Africa Region, World Bank, Washington, DC.
EIU (Economic Intelligence Unit). 2010. Niger Country Report. November 2010 Report, Economic
Intelligence Unit, London.
Foster, Vivien, and Jevgenijs Steinbuks. 2009. “Paying the Price for Unreliable Power Supplies: In-House
Generation of Electricity by Firms in Africa.” Policy Research Working Paper 4913, World Bank,
Washington, DC.
GTZ (Deutsche Gesellschaft für Internationale Zusammenarbeit). 2009. International Fuel Prices 2009.
6th ed. Eschborn, Germany: GTZ.

ANGOLA’S INFRASTRUCTURE: A CONTINENTAL PERSPECTIVE
46
Rosnes, Orvika, and Haakon Vennemo. 2009. “Powering Up: Costing Power Infrastructure Spending
Needs in Sub-Saharan Africa.” AICD Background Paper 5, Africa Region, World Bank,
Washington, DC.
Briceño-Garmendia, Cecilia and Shkaratan, Maria. 2010. “Power Tariffs: Caught between Cost-Recovery
and Affordability.” Policy Research Working Paper forthcoming, World Bank, Washington DC
World Bank. 2010a. Angola: Electricity Dialogue. Back to the Office Report, World Bank, Washington,
DC, March 15–26.
———. 2010b. Angola Enterprise Surveys 2010.
www.enterprisesurveys.org/ExploreEconomies/?economyid=142&year=2009.
———. 2010c. “Getting Electricity: A Pilot Indicator Set from the Doing Business Project.”
http://doingbusiness.org/data/exploretopics/getting-electricity.
Transport
Bofinger, Heinrich C. 2009. “An Unsteady Course: Growth and Challenges in Africa’s Air Transport
Industry.” AICD Background Paper 16, Africa Region, World Bank, Washington, DC.
Bullock, Richard. 2009. “Off Track: Sub-Saharan African Railways.” AICD Background Paper 17, Africa
Region, World Bank, Washington, DC.
Carruthers, Robin, Ranga Rajan Krishnamani, and Siobhan Murray. 2009. “Improving Connectivity:
Investing in Transport Infrastructure in Sub-Saharan Africa.” AICD Background Paper 7, Africa
Region, World Bank, Washington, DC.
Curtis, Barney. 2009. “The Chirundu Border Post: Detailed Monitoring of Transit Times.” SSATP
Discussion Paper No. 10, Regional Integration and Transport—RIT Series, Africa Region, World
Bank, Washington, DC.
Gwilliam, Ken, Vivien Foster, Rodrigo Archondo-Callao, Cecilia Briceño-Garmendia, Alberto Nogales,
and Kavita Sethi. 2008. “The Burden of Maintenance: Roads in Sub-Saharan Africa.” AICD
Background Paper 14, Africa Region, World Bank, Washington, DC.
Kumar, Ajay, and Fanny Barrett. 2008. “Stuck in Traffic: Urban Transport in Africa.” AICD Background
Paper 1, Africa Region, World Bank, Washington, DC.
Nathan Associates. 2010. Definition and Investment Strategy for a Core Strategic Transport Network for
Eastern and Southern Africa. Draft Report prepared for the World Bank, Washington, DC, as of
October 2010.
Ocean Shipping Consultants, Inc. 2009. “Beyond the Bottlenecks: Ports in Africa.” AICD Background
Paper 8, Africa Region, World Bank, Washington, DC.

ANGOLA’S INFRASTRUCTURE: A CONTINENTAL PERSPECTIVE
47
Water resources
Irrigation
Svendsen, Mark, Mandy Ewing, and Siwa Msangi. 2008. “Watermarks: Indicators of Irrigation Sector
Performance in Africa.” AICD Background Paper 4, Africa Region, World Bank, Washington,
DC.
You, L., C. Ringler, G. Nelson, U. Wood-Sichra, R. Robertson, S. Wood, G. Zhe, T. Zhu, and Y. Sun.
2009. “Torrents and Trickles: Irrigation Spending Needs in Africa.” AICD Background Paper 9,
Africa Region, World Bank, Washington, DC.
Water supply and sanitation
African Ministers’ Council on Water (AMCOW). 2010. Country Status Overviews on Water Supply and Sanitation 2010. Regional Synthesis Report, August 2010, Addis Ababa
Banerjee, Sudeshna, Vivien Foster, Yvonne Ying, Heather Skilling, and Quentin Wodon. 2008a. “Cost
Recovery, Equity, and Efficiency in Water Tariffs: Evidence from African Utilities.” AICD
Working Paper 7, Africa Region, World Bank, Washington, DC.
Banerjee, Sudeshna, Heather Skilling, Vivien Foster, Cecilia Briceño-Garmendia, Elvira Morella, and
Tarik Chfadi. 2008b. “Ebbing Water, Surging Deficits: Urban Water Supply in Sub-Saharan
Africa.” AICD Background Paper 12, Africa Region, World Bank, Washington, DC.
Cain, Allan, Mary Daly, and Paul Robson. 2002. “Basic Service Provision for the Urban Poor: The
Experience of Development Workshop in Angola.” IIED Working Paper 8 on Poverty Reduction
in Urban Areas, Human Settlement Program, IIED, London, UK.
Development Workshop—Angola, 2007. Luanda Informal Water Sector Study Service Provision for the Peri-Urban Poor in Post-Conflict Angola. Draft Report, Luanda.
Keener, Sarah, Manuel Luengo, and Sudeshna Banerjee. 2009. “Provision of Water to the Poor in Africa:
Experience with Water Standposts and the Informal Water Sector.” AICD Working Paper 13,
Africa Region, World Bank, Washington, DC.
Luta Contra Pobreza Urbana (LUPP). 2007. “Community Model for Household Sanitation: Good Practice
in the Musseques of Luanda.” LUPP Good Practice Series, LuandaMorella, Elvira, Vivien Foster,
and Sudeshna Ghosh Banerjee. 2008. “Climbing the Ladder: The State of Sanitation in Sub-
Saharan Africa.” AICD Background Paper 13, Africa Region, World Bank, Washington, DC.
USAID (United States Agency for International Development). 2009. Angola: Water and Sanitation Profile, Washington DCWHO (World Health Organization) Joint Monitoring Program (JMP).
2010a. “Angola Estimates for the Use of Improved Drinking-Water Sources.”
www.wssinfo.org/resources/documents.html.
———. 2010b. “Angola Estimates for the Use of Improved Sanitation Facilities.”
www.wssinfo.org/resources/documents.html.

ANGOLA’S INFRASTRUCTURE: A CONTINENTAL PERSPECTIVE
48
World Bank. 2008. Project Appraisal Document on a Proposed Credit in the Amount of SDR 35 million (US$57.0 Million Equivalent) to the Republic of Angola for the Water Sector Institutional Development Project. Report No: 42864-A0, June 26.
Other
IMF (International Monetary Fund). 2011. Angola: Fourth Review under the Stand-By Arrangement,
Request for Waivers of Nonobservance of Performance Criteria, Request for Waivers of
Applicability of Performance Criteria, and Request for Modification of Performance Criteria.
IMF Country Report No. 11/51, February 2011, Washington DC.
World Bank. 2005. Private Solutions for Infrastructure in Angola. Public-Private Infrastructure Advisory
Facility. Washington, DC: World Bank.
———. 2007a. Angola Country Assistance Evaluation. Report No: 39829, Country Evaluation and
Regional Relations, Independent Evaluation Group, October 1.
———. 2007b. Angola: Investment Climate Assessment. Report No: 44314-AO, Regional Program for
Enterprise Development (RPED), Finance and Private Sector (AFTFP), Africa Region, October.