angular momentum of electromagnetic radiation
TRANSCRIPT

UPTEC F07 056
Examensarbete 20 pApril 2007
Angular Momentum of Electromagnetic Radiation Fundamental physics applied to the radio
domain for innovative studies of space and
Johan SjöholmKristoffer Palmer
and development of new concepts in
wireless communications

Teknisk- naturvetenskaplig fakultet UTH-enheten Besöksadress: Ångströmlaboratoriet Lägerhyddsvägen 1 Hus 4, Plan 0 Postadress: Box 536 751 21 Uppsala Telefon: 018 – 471 30 03 Telefax: 018 – 471 30 00 Hemsida: http://www.teknat.uu.se/student
Abstract
Angular Momentum of Electromagnetic Radiation
Johan Sjöholm and Kristoffer Palmer
In this diploma thesis we study the characteristics of electromagnetic fields carryingorbital angular momentum (OAM) by analyzing and utilizing results achievedin optics and then apply them to the radio domain to enable innovative radio studiesof space and the development of new concepts in wireless communications.
With the recent advent of fast digital converters it has become possible, over awide radio frequency range, to manipulate not only the modulation properties ofany given signal carried by a radio beam, but also the physical field vectors whichmake up the radio beam itself. Drawing inferences from results obtained in opticsand quantum communication research during the past 10–15 years, we extractthe core information about fields carrying orbital angular momentum. We showthat with this information it is possible to design an array of antennas which, togetherwith digital receivers/transmitters, can readily produce, under full softwarecontrol, a radio beam that carries electromagnetic orbital angular momentum, aclassical electrodynamics quantity known for a century but so far preciously littleutilized in radio, if at all. This electromagnetic field is then optimized with thehelp of various antenna array techniques to improve the radio vector field qualities.By explicit numerical solution of the Maxwell equations from first principles,using a de facto industrial standard antenna software package, we show that thefield indeed carries orbital angular momentum, and give a hint on how to detectand measure orbital angular momentum in radio beams. Finally, we discuss andgive an explanation of what this can be used for and what the future might bringin this area.
ISSN: 1401-5757, UPTEC F07 056Examinator: Tomas NybergÄmnesgranskare: Bo ThidéHandledare: Bo Thidé

DIPLOMA THESIS
ANGULAR MOMENTUM OF
ELECTROMAGNETIC RADIATIONFundamental physics applied to the radio domain
for innovative studies of space and development ofnew concepts in wireless communications
JOHAN SJÖHOLM and KRISTOFFER PALMER
Uppsala School of Engineering
andDepartment of Astronomy and Space Physics, Uppsala University, Sweden
MAY 2, 2007


CONTENTS
Contents iii
List of Figures vii
1 Introduction 1
2 Electromagnetic fields and conservation laws 52.1 Maxwell-Lorentz equations 62.2 Energy 6
2.2.1 Ohm’s law 92.3 Center of energy 92.4 Linear momentum 102.5 Angular momentum 122.6 Polarization 13
3 Optics 173.1 Formation of beams 183.2 Gaussian Beams 183.3 Laguerre-Gaussian Beams 253.4 Angular momentum of Laguerre-Gaussian beams 29
4 Angular momentum from multipoles 334.1 The wave equation 334.2 Multipole expansion 354.3 Angular Momentum of Multipole Radiation 38
iii

CONTENTS
5 Generation of an EM beam carrying OAM 415.1 The concept 415.2 The use of array factors 43
5.2.1 The location of each element 445.2.2 Array factor 455.2.3 The electric field 46
6 Simulation setup 496.1 The 4nec2 code 496.2 Grids 50
6.2.1 Equidistant radius circular grid, ERCG 506.2.2 Equidistant circular grid, EDCG 506.2.3 Planar array 516.2.4 Logarithmic spiral array 51
6.3 Elements 526.3.1 Electric dipole antennas 526.3.2 Tripole and crossed dipole antennas 52
7 Results 557.1 EM-beam with OAM 55
7.1.1 Grid 557.1.2 The relative offset in the phase between the elements 567.1.3 Intensity 567.1.4 Phase shifts in the main beam 567.1.5 The electric field 64
7.2 Multiple beam interference 647.2.1 Grid 647.2.2 The relative offset in the phase between the elements 64
7.3 Rotation of the main lobe 657.3.1 Grid 657.3.2 The relative offset in the phase between the elements 657.3.3 Intensity in the main beam 65
7.4 Five-element crossed dipole array 687.4.1 Left-hand polarization 687.4.2 Right-hand polarization 72
7.5 Ten-element crossed dipole array 737.5.1 Left-hand polarization 74
iv

7.5.2 Right-hand polarization 787.6 Five-element tripole array 80
7.6.1 Tripole compared to crossed dipole 837.6.2 Beam with orbital angular momentum produced by tripole
antennas 837.7 Ten-element tripole array 877.8 The LOIS Test Station 91
8 Discussion 958.1 Radio astronomy and space physics applications 95
8.1.1 Self-calibration of ionospherically aberrated radio signals 988.2 Communications 1008.3 Receiving 1018.4 Outlook 101
Bibliography 105
Appendices 111
A The MATLAB codes used 113A.1 Phaseplanes_4_sub_.m 113A.2 nec.m 116A.3 Phase_arrows.m 118A.4 E_field.m 120A.5 intensity.m 121A.6 Phase.m 124A.7 Evectors.m 126A.8 AngMom.m 127A.9 JzU.m 128A.10 tripole.m 130A.11 lg_beam.m 132A.12 upl.m 134A.13 makematrix.m 135
B NEC input files 137B.1 Electromagnetic beam with orbital angular momentum 137
B.1.1 L0.txt 137
v
CONTENTS
B.1.2 L1.txt 138B.1.3 L2.txt 139B.1.4 L4.txt 141
B.2 Multiple beam interference 142B.2.1 L01_L02.txt 142B.2.2 L01_L04.txt 143B.2.3 L02_L04.txt 145
B.3 Rotation of main lobe 146B.3.1 L01_L02_45deg.txt 146
B.4 Non linearly polarized beams 147B.4.1 Five element crossed dipole array 147B.4.2 Ten element crossed dipole array 154B.4.3 Tripole compared to crossed dipole 168B.4.4 Pointed tripoles 170
B.5 The LOIS Test Station 183B.5.1 LOIS_L0.txt 183B.5.2 LOIS_L1.txt 184
vi

LIST OF FIGURES
3.1 Amplitude distribution in a Gaussian beam 223.2 Intensities of Gaussian beams 243.3 Plane of constant phase in a Gaussian beam 253.4 Intensities of LG beams 283.5 Phase fronts for beams with different OAM 303.6 Phases in cross sections of beams with l = 0,1,2, and 3 31
5.1 Variation of phase with distance in an LG beam 425.2 Equal area sectors circular grid (EACG) 44
6.1 Antenna arrays used and discussed 51
7.1 Two-dimensional patterns for the fields in figure 7.2 577.2 Field gain generated by a EDCG for different values of l 587.2 Field gain generated by a EDCG for different values of l 597.3 Main lobe phase shifts for different l 607.3 Main lobe phase shifts for different l 617.4 Main lobe electric fields for different l 627.4 Main lobe electric fields for different l 637.5 Two-beam interference intensities 667.6 Rotation of the main lobe for an l = 1 and l = 2 mixed state 677.7 Electric field vectors in left-hand polarized l = 1 and l = 2 beams 707.8 Phases of left-hand polarized beam for a five-element antenna array 717.9 Phases of left-hand polarized beam for a five-element antenna array 727.10 Intensity patterns for a five-element antenna array 737.11 Intensities of an LG beam for l = 0,1,2 747.12 Jz/U in beams with different l for a five-element array 757.13 Electric field vectors in right-hand polarized l = 1 and l = 2 beams 76
vii

LIST OF FIGURES
7.14 Phases of right-hand polarized beam for a five-element antenna array 777.15 Phases of right-hand polarized beam for a five-element antenna array 787.16 Phases of left-hand polarized beams for a ten-element antenna array 797.17 Phases in right-hand polarized beams with eigenvalues going from
l = 0 to l = 4 produced by a ten-element antenna array with radiusa = λ/2 80
7.18 Intensity patterns produced by a ten-element antenna array 817.19 Jz/U in beams with different eigenvalues l for a ten-element array 827.20 Comparison of left-hand gains for dipoles and tripoles 847.21 Left-hand gain of beams produced by a five-element tripole array 867.22 Phase patterns in beams for θ0 = 10,ϕ0 = 40, l = 0,1,2 877.23 Five-element tripole array left-hand gain at θ0 = 45,ϕ0 = 0 887.24 Directivity for a five-element array for different θ0 897.25 Ten-element tripole array left-hand gain at θ0 = 45,ϕ0 = 0 907.26 Left-hand gain and phase pattern for a ten-element tripole array 917.27 The LOIS electric tripole antenna 937.28 Antenna patterns calculated for the LOIS Risinge station 94
8.1 Half-power beamwidths of a beam with eigenvalue l = 1 968.2 Radio OAM as a sensitive detector of ionospheric turbulence 978.3 Self-calibration of ionospheric intensity and phase aberrations 99
viii
1INTRODUCTION
In today’s society, electromagnetic (EM) fields are used in increasingly manydifferent contexts, ranging from fundamental research and development to com-munications and household appliances. However, there are still properties of theclassical EM field, well known already to the pioneers of electromagnetism a cen-tury ago [43], that are not yet fully utilized, either because of actuator/sensor/de-tector limitations or because of lack of familiarity with the more subtle aspectsof the electromagnetic field. One of the underutilized properties is the complete,instantaneous field vector (magnetic or electric) itself, meaning that all three spa-tial dimensions of the field vector are taken fully into account so that one canmake use of the information embedded in both the magnitude and the directionof the field vector in question. Because of the technical complexities involved,sensing of electromagnetic fields, which are three-dimensional vectorial, have tothis day typically been made with sensors capable of capturing only one or twoof the three spatial components of the field vectors (or projections of them), e.g.,radio antennas erected in one or two spatial dimensions, effectively resulting in awaste of available EM information. One obvious example being the inadequacyto sense, simultaneously, the transverse part as well as the z component of the EMfield in a beam which has a non-planar phase front.
Simple one-dimensional sensing antennas are what is typically used for pick-ing up radio and TV broadcasts on our domestic radio and TV sets but are alsoused in more demanding situations. Two-dimensional sensing of the 3D vectorfield (e.g., crossed dipole antennas) is used in many modern radio telescopes, in-cluding the LOFAR (Low Frequency Array) distributed radio telescope currently
1

CHAPTER 1. INTRODUCTION
under construction in the Netherlands, Germany and France.1 Conventional sens-ing of the radio field in two dimensions is also going to be used for the nextgeneration antennas of the planned “3D” European Incoherent Scatter (EISCAT)ionospheric radar facility;2 here “3D” does not refer to the way the EM fields ofthe radar are sensed but how the radar signals, once they have been sensed witha conventional 2D information wasting technique, will be used in attempts to es-timate the 3D plasma dynamics in the ionosphere. The Scandinavian supplementto LOFAR, LOIS (LOFAR Outrigger in Scandinavia),3 is the first space physicsradio/radar or radio astronomy facility that utilizes the entire 3D vector informa-tion embedded in the EM fields of the radio signals. Future big Earth-based radioastronomy multi-antenna telescopes such as the Square Kilometre Array (SKA),4
and the Long Wavelength Array (LWA),5 are expected to benefit significantlyfrom using the LOIS-type vector-sensing radio technology. This is even moretrue for space-based radio infrastructures such as the proposed Lunar Infrastruc-ture for Exploration (LIFE) project, which aims at building a multi-antenna radiotelescope on the far side of the moon [4, 37].
One particularly interesting property, used in modern physics, e.g., in exper-iments on trapping and manipulating of atoms, molecules, and microscopic par-ticles by the help of laser fields [16], is the electromagnetic orbital angular mo-mentum, OAM [2, 6, 15, 23, 24, 31, 44, 45]. However, while OAM has been usedto efficiently encode information for free-space communications in the optics fre-quency range [22], OAM has so far not been used to its full extent—if at all—inthe radio domain, except for some proof-of-concept experiments in the microwaverange. As will be described in this thesis, the advent of fast analog-to-digital anddigital-to-analog converters has made it possible to construct combined 3D sens-ing antenna and tri-channel digital receiver systems which can measure coher-ently the instantaneous 3D field vector, a first-order quantity, of an EM signal inthe radio domain. This new possibility enables the processing of EM field vec-tors, including OAM encoding and decoding of radio beams, with high precisionand speed under full software control. This is in contrast to optics where de-tectors are still incoherent, capable of measuring second (and sometimes higher)order field quantities only and not the field vectors themselves. In order to cover
1www.lofar.org2www.eiscat.org3www.lois-space.net4www.telescope.org5lwa.nrl.navy.mil
2

new unexplored ground and find additional uses of electromagnetic fields, thesefull vectorial properties of the EM field, and their physical encoding, have to beexplored. We think that therein lies the future for a more efficient use of elec-tromagnetic fields and improved radio methods for research and communications[8, 20]. This is what this thesis is about.
In optics, the properties of laser beams have been studied for a long time.Laser beams can contain several different types of laser modes, the Hermite-Gaussian modes are the most common. Two other modes are the Laguerre-Gaussian modes and the Bessel-Gaussian modes, but these are much less com-mon than the different Hermite-Gaussian modes. Laguerre-Gaussian laser beamscan be obtained by conversion of Hermite-Gaussian laser beams, this is done bya series of optical devices [48]. A Laguerre-Gaussian beam carries orbital angu-lar momentum [3]. In theory the orbital angular momentum can have an infinitenumber of distinct states. The number of distinct states achievable in practiceare however limited by physical issues such as the sensitivity of the devices andthe spreading of the beam. If we combine the orbital angular momentum withpolarization, the amount of distinct states can, within certain limits, be doubled.
Starting from the mathematical results obtained for the idealized par axialmodel used in optics, we translate these results into the radio domain by estimat-ing the equivalent (complex valued) currents needed to generate OAM with thehelp of radio antenna arrays. In order to test our approach, we have used thesecurrent/antenna array setups to solve the Maxwell equations from first principles,using the de facto industrial standard antenna software package Numeric Electro-magnetic Code [40]. Analyzing the radiation field vector characteristics obtainedin these accurate numerical simulations we find that the fields do indeed carryorbital angular momentum (OAM). By choosing antenna arrays that can producedifferent OAM states and combining them we have been able to reproduce, inthe radio domain, field characteristics which are very similar to those obtained inoptics, thus proving the feasibility of the LOIS radio technique.
3


2
ELECTROMAGNETIC FIELDS AND
CONSERVATION LAWS
In this chapter the basic properties of electromagnetic fields will be presented.First, the conserved quantities of motion for an electromagnetic field in vacuumwill be derived in the standard way from Maxwell-Lorentz equations. It is wellknown that conservation laws are directly related to symmetries in the dynamicequations of a physical system [29, 41] which allows for a formal, abstract ap-proach. However, we shall derive the conservation laws by using the explicit,straightforward calculations found in most standard textbooks [15, 31]. Some ofthe conserved quantities derived are vectorial in nature. Hence, they effectivelycontain three quantities. Secondly properties of polarized electromagnetic fieldswill be explained.
5

CHAPTER 2. ELECTROMAGNETIC FIELDS AND CONSERVATION LAWS
2.1 Maxwell-Lorentz equations
The equations of classical electrodynamics, on a microscopic scale, are the socalled Maxwell-Lorentz equations
∇ ·E =ρ(x, t)ε0
(2.1)
∇ ·B = 0 (2.2)
∇×E = −∂B∂t
(2.3)
∇×B = µ0j(x, t)+1c2∂E∂t
(2.4)
where ε0 is the permittivity of free space and µ0 is the permeability of vacuum, orthe magnetic constant.
The Maxwell-Lorentz equations were formulated based on empirical results[31, 49]. First one derives the static electric and magnetic field from empiricalforce equations, Coulomb’s law and Ampère’s law. This results in two time-independent, uncoupled systems of equations. By introducing a time-dependentrelationship for conservation of electric charge and the electric charges relation tothe currents in the form of the continuity equation
∂ρ(x, t)∂t
+∇ · j(x, t) = 0 (2.5)
one can obtain the Maxwell-Lorentz equations [49]. The Maxwell-Lorentz equa-tions give a classical correct picture, for both macroscopic and microscopic scales.These equations are also known as Maxwell’s microscopic equations.
2.2 Energy
The power gain of a charged particle moving with velocity v in an electromagneticfield (E,B), which gives rise to a Lorentz force F acting on the particle, is
F ·v = q(E+v×B) ·v = qv ·E (2.6)
6

2.2. ENERGY
If we can represent the total charge density as a continuous distribution of chargesand currents within a certain volume we can write
j = ρv (2.7)
q =∫
V′d3x′ ρ(x, t) (2.8)
where ρ is the charge distribution. Then equation (2.6) can then be rewritten as
F ·v =∫
V′d3x′ j ·E (2.9)
This is the total work done by the field on the moving charges. It represents aconversion of electromagnetic energy into mechanical or thermal energy. As iswell known, the total energy in a closed system is conserved. Therefore a changein the mechanical energy of the system has to be balanced with the correspond-ing rate of change in the electromagnetic field energy within the volume. UsingMaxwell’s equations we can rewrite (2.9) as
F ·v =∫
V′d3x′ ε0
(c2E · (∇×B)−E ·
∂E∂t
)(2.10)
By using the vector identity
1µ0
E ·(∇×B)=1µ0
B ·(∇×E)−1µ0∇ ·(E×B)=−
1µ0
B ·∂B∂t−
1µ0∇ ·(E×B) (2.11)
in equation (2.10), and Gauss’s theorem and then rearranging the terms, we getPoynting’s theorem
−
∫V′
d3x′ε0
2
(c2B ·
∂B∂t+E ·
∂E∂t
)=
∫V′
d3x′ j ·E+∮
S ′d2x′
1µ0
(E×B) · n (2.12)
In order for us to advance any further we need to make two assumptions:(1) The macroscopic medium is linear in its electric and magnetic properties,with negligible dispersion or losses, and (2) the total electromagnetic power forthe field is represented by
UField =
∫V′
d3x′ε0
2(E ·E+ c2 B ·B
)=
∫V′
d3x′ε0
2(E2+ c2B2) (2.13)
7

CHAPTER 2. ELECTROMAGNETIC FIELDS AND CONSERVATION LAWS
This gives us a new version of Poynting’s theorem
−∂
∂t
∫V′
d3x′ε0
2(c2B2+E2) = ∫
V′d3x′ j ·E+
∮S ′
d2x′1µ0
(E×B) · n (2.14)
If we denote the electromagnetic field energy density
u =ε0
2(E2+ c2B2) (2.15)
and define the Poynting vector S as follows
S =1µ0
E×B (2.16)
Poynting’s theorem, equation (2.14), can be rewritten as a differential continuityequation
∂u∂t+∇ ·S = −j ·E (2.17)
Assuming that no particle leaves the volume, the total work done by the fields onthe sources can be written
∂Umech
∂t=
∫V′
d3x′ j ·E (2.18)
Inserting this into equation (2.14), we obtain
∂Utot
∂t=∂
∂t
[Umech+
∫V′
d3x′ε0
2(c2B2+E2)︸ ︷︷ ︸
UField
]=
∮S ′
d2x′1µ0
(E×B) · n (2.19)
If we are looking at a closed system this equation simplifies to
Utot = constant = Umech+
∫V′
d3x′ε0
2(c2B2+E2) (2.20)
This is the law of conservation of energy alluded to earlier in this section. It clearlyshows the balance between the mechanical and electromagnetic energy and is theconsequence of the invariance of the dynamic equations describing the system(equations of motion, Maxwell-Lorentz equations) with respect to changes in thetime origin (homogeneity in time) [15].
8

2.3. CENTER OF ENERGY
2.2.1 Ohm’s law
A current density, j, can be produced in a conducting medium by applying anelectric field.1 If the current density is analytic it can be expressed in a Taylorseries. By making the simplifying assumption that the current density in the con-ducting medium is proportional to the electric field impressed upon the medium,i.e., can be approximated by the first term in this Taylor series:
j = σ(E+EEMF)
This linear approximation of the relation between the current density and the elec-tric field strength is known as Ohm’s law. Inserting this into Poynting’s theorem,equation (2.14), and rewriting we get∫
V′d3x′ j ·EEMF︸ ︷︷ ︸
Applied electric power
=
∫V′
d3x′j2
σ︸ ︷︷ ︸Joule heat
+∂
∂t
∫V′
d3x′ε0
2(c2B2+E2)︸ ︷︷ ︸
Field energy
+
∮S ′
d2x′1µo
(E×B) · n︸ ︷︷ ︸Radiated power
(2.21)
2.3 Center of energy
In analogy with the definition for the center of mass for a mechanical system, onecan define the center of energy C for EM field [15] by the formula [12]
C = X∫
V′d3x′ u =
∫V′
d3x′ (x−x0)u (2.22)
where X is the coordinate vector for the center of mass, u is the EM energy density,and x is the position vector. From equation (2.10) we see that the mechanicalpower is balanced by the power originating from the field. This means that wecan integrate with respect to time and thereby obtain the total energy in the EMfield. Combining this with the definition for the center of energy, equation (2.22),we deduce that the center of energy for the field should equal
−
∫ t
t0dt∫
V′d3x′ (x−x0) (j ·E) (2.23)
1Electric currents may also be produced by mechanical transport of electric charges due to,e.g., winds.
9

CHAPTER 2. ELECTROMAGNETIC FIELDS AND CONSERVATION LAWS
By integrating (x−x0) (j ·E) and using Maxwell’s equations we obtain the follow-ing expression
−
∫V′
d3x′ (x−x0) (j ·E) =∫
V′d3x′ ε0 (x−x0)
(c2 E · (∇×B)−E ·
∂E∂t
)(2.24)
Using the vector identity in equation (2.11) and Maxwell’s equations, we rewritethis as
−
∫V′
d3x′ (x−x0) (j ·E)
=
∫V′
d3x′ ε0(x−x0)
2∂
∂t
(c2B2+E2
)+
∫V′
d3x′ (x−x0)1µ0
[∇ · (E×B)]
(2.25)
Integrating this with respect to time we obtain the equation for the center of energyfor the field
C = X∫
V′d3x′ u =
∫V′
d3x′[ε0 (x−x0)
(c2B2+E2)− (t− t0)(E×B)
](2.26)
which is a manifestation of the equivalence of space and time.
2.4 Linear momentum
We start with the expression for the Lorentz force density, ρE+ j×B, use theMaxwell-Lorentz equations to rewrite this expression and then symmetrize it
ρE+ j×B = ε0(∇ ·E
)E+ ε0
(c2∇×B−
∂E∂t
)×B =
= ε0(∇ ·E
)E+
1µ0
(∇×B
)×B− ε0
∂E∂t×B =
= ε0(∇ ·E
)E−
1µ0
B×(∇×B
)− ε0
∂
∂t
(E×B
)+ ε0E×
∂B∂t
= ε0
[E(∇ ·E
)−E×
(∇×E
)]+
1µ0
[B(∇ ·B
)︸ ︷︷ ︸=0
− B×(∇×B
)]− ε0
∂
∂t(E×B)
(2.27)
10
2.4. LINEAR MOMENTUM
The square brackets vector components can be expressed as follows
[E(∇ ·E
)− E×
(∇×E
)]i=
12
(E ·
∂E∂xi− E ·
∂E∂xi
)+
∂
∂x j
(EiE j −
12
E ·E δi j
)(2.28)
and[B(∇ ·B
)−B×
(∇×B
)]i=
12
(B ·
∂B∂xi− B ·
∂B∂xi
)+
∂
∂x j
(BiB j −
12
B ·B δi j
)(2.29)
Now we use these two equations together with equation (2.27) and obtain
(ρE+ j×B)i−12
[ε0E ·
∂E∂xi− ε0E ·
∂E∂xi+
1µ0
B ·∂B∂xi−
1µ0
B ·∂B∂xi
]︸ ︷︷ ︸
(Fev)i
+ε0∂
∂t(E×B) =
∂
∂x j
(ε0EiE j −
ε0
2E ·E δi j +
1µ0
BiB j −1µ0
12
B ·B δi j
)︸ ︷︷ ︸
Ti j
(2.30)
Where Ti j stands for the i jth component of Maxwell’s stress tensor, T and (Fev)i
stand for the ith component of the electric volume force, Fev. This can now beexpressed as the force equation[
Fev+ ε0∂
∂t(E×B)
]i=∂Ti j
∂x j=(∇ ·T
)i (2.31)
Rewriting this equation gives us
∂Ti j
∂xi=(
Fev+1c2∂S∂t
)i
(2.32)
Where S is the Poynting vector defined in equation (2.16). If this equation isintegrated over the entire volume we retrieve∫
V′d3x′ Fev +
1c2
ddt
∫V′
d3x′ S =∮
S ′d2x′ Tn (2.33)
11

CHAPTER 2. ELECTROMAGNETIC FIELDS AND CONSERVATION LAWS
This equation is called the momentum theorem in Maxwell’s theory for fields invacuum. By using another notation we can write this as
ddt
pmech+ddt
pfield =
∮S ′
d2x′ Tn (2.34)
This means that pfield can be expressed as
pfield = ε0
∫V′
d3x′ E×B (2.35)
for the case that we are dealing with electromagnetic fields, e.g., propagating radiowaves, in vacuum.
The linear momentum conservation law (2.34) is a result of the invariance ofthe dynamic equations with respect to changes in the coordinate origin (homo-geneity in space) [15].
2.5 Angular momentum
In analogy with classical mechanics the electromagnetic angular momentum isdefined as J = (x−x0)×p. From equation (2.35) we get the linear momentumdensity. By using the definition for angular momentum we derive the equation forthe angular momentum density, M, as [31]
M = ε0 (x−x0)× (E×B). (2.36)
To retrieve the total angular momentum, J, we have to integrate over the entirevolume.
Jfield = ε0
∫V′
d3x′ (x−x0)× (E×B) (2.37)
In the case of transverse plane waves the orbital angular momentum will be zerosince the term E×B will have no components other than those along the axis ofpropagation. If E×B will have small non-zero components perpendicular to theaxis of propagation, it could yield a net total orbital angular momentum.
Both in classical mechanics and atomic physics we know that the angularmomentum can be separated into two different parts. In resemblance to Earthwhich rotates about its axis but also orbits the Sun and electrons can have both a
12

2.6. POLARIZATION
orbital angular momentum and spin. It is therefore reasonable to assume that inmany cases the angular momentum carried by the electromagnetic field radiationcan be separated into two different parts so that
J= L+S. (2.38)
where L is the orbital angular momentum and S the spin angular momentum.According to Jackson [31], expressing the magnetic field in terms of the vectorpotential the total angular momentum can be written as
Jfield =1
µ0c2
∫V
d3x
[E×A+
3
∑j=1
E j (x×∇) A j
](2.39)
The first term is identified as the spin angular momentum. The second term isidentified as the orbital angular momentum since it contains the angular momen-tum operator, Lop = −i (x×∇), well known from quantum mechanics.
Rotational invariance of the the dynamic equations (isotropy in space) mani-fests itself in the conservation law
Jtot = Jmech+Jfield (2.40)
where Jmech = (x−x0)×pmech is the mechanical angular momentum.
2.6 Polarization
Wave polarization is defined as [5] “that property of an electromagnetic wavedescribing the time-varying direction and relative magnitude of the electric-fieldvector; especially, the figure traced as a function of time by the extremity of thevector at a fixed location in space, and the sense in which it is traced, as observedalong the direction of propagation.” So by taking the curve given by the endpoint of the instantaneous electric field vector we get the polarization curve. If awave is traveling in the r direction, the polarization in the ϕθ plane is generallyan ellipse. In the special case when the length of the minor axis is equal to thatof the major axis the curve is a circle and we have circular polarization. Whenthe length of the minor axis is zero, the polarization is said to be linear. For allother cases we say that the polarization is elliptic. The difference between circularand elliptic polarization is that when having circular polarization, the magnitude
13
CHAPTER 2. ELECTROMAGNETIC FIELDS AND CONSERVATION LAWS
of the electric-field vector is constant as the electric-field vector rotates aroundthe propagation axis, and when having elliptic polarization, it varies between thelength of the minor axis and that of the major axis. The linearly polarized wavedoes not rotate around its axis at all, and the magnitude of the electric-field vectorvaries between zero and the length of the major axis.
Mathematically we use the axial ratio, AR, and tilt angle, τ, to describe thepolarization. The ratio AR is the length of the minor axis divided by the lengthof the major axis, and it attains values between 0 (linearly polarized) and 1 (cir-cularly polarized). The tilt angle is the smallest angle between the θ axis and themajor axis. This means that it falls in the interval between 0 and π/2. In general,polarized radiation is either left-hand or right-hand polarized. If E moves in aclockwise direction as the wave propagates the polarization is right-handed, if itmoves in a counter clockwise direction the polarization is left-handed. Considerthe field
Erad(t,x) = Eθ(r, t)θ+Eϕ(r, t)ϕ (2.41)
where
Eθ(r, t) = Eθ0 cos(ωt− kr+φθ) (2.42)
Eϕ(r, t) = Eϕ0 cos(ωt− kr+φϕ) (2.43)
Now, let ∆φ = φθ −φϕ. If
∆φ = nπ, n = 0,1,2,3, ... (2.44)
the wave is linearly polarized. If instead
∆φ = ±
(12+2n
)π, n = 0,1,2,3... (2.45)
or
∆φ = ±M 6=πn2, M ∈ R n = 0,1,2,3, . . . (2.46)
the wave is elliptically polarized. The plus sign corresponds to left-hand polarizedwaves and the minus sign to right-hand polarization. If, in the case of ellipticpolarization in equation (2.45) only, Eθ0 = Eϕ0, we have circular polarization.
14

2.6. POLARIZATION
The parameters AR and τ can be calculated from
AR =
[E2ϕ0+E2
θ0−
(E4ϕ0+E4
θ0+2E2ϕ0E2
θ0 cos(2∆φ)) 1
2] 1
2
[E2ϕ0+E2
θ0+(
E4ϕ0+E4
θ0+2E2ϕ0E2
θ0 cos(2∆φ)) 1
2] 1
2(2.47)
τ =π
2−
12
tan−1
[2Eϕ0Eθ0
E2ϕ0−E2
θ0cos(∆φ)
](2.48)
If τ is a multiple of π2 the equation for AR simplifies to
AR =Eϕ0
Eθ0or AR =
Eθ0
Eϕ0(2.49)
where the condition that 0 ≤ AR ≤ 1 decides which equation that is correct.For measurements made with two crossed dipoles, a useful set of parame-
ters that describes the state and degree of wave polarization is furnished by theStokes parameters [31]. For the three-dimensional vectorial electromagnetic fieldmethods described in this thesis, the generalised 3D Stokes parameters are moreconvenient [13, 14].
15


3OPTICS
It is difficult to pinpoint the first discovery of polarized light. The use of this visi-ble manifestation of the vector nature of the electromagnetic field can be trackeddown all the way to the Vikings. Erasmus Bartholinus is the one who is offi-cially recognized as the discoverer of polarization in 1669. When looking at apicture through crystal of Icelandic spar (calcium carbonate, calcite) he saw twodisplaced images. After performing some experiments he wrote a memoir on thesubject and this could be considered as the first scientific description of polarizedlight. The subject has then been studied by a number of scientist such as Huygens,Newton and Young just to mention a few.
In 1936 Beth [11] showed how the spin angular momentum of polarized lightcan exert a torque on a doubly refracting medium. With his apparatus he coulddetect and measure the torque and from this verify that the spin angular momen-tum of each photon in a beam of circularly polarized light carries the angularmomentum h. In 1950 Kastler [33], who was awarded the 1966 Nobel Prize inPhysics, pioneered techniques for transferring electromagnetic momentum fromoptical beams to atoms, thereby laying the foundation for another Nobel Prize inPhysics, awarded 1997 to Chu, Cohen-Tannoudji, and Phillips “for developmentof methods to cool and trap atoms with laser light" [16]. Allen et al. [3] showedthat waves with helical phase fronts have a well defined orbital angular momen-tum. Beams of this structure are sometimes described as optical vortices [7, 10].If the phase front of a beam is inclined, it carries orbital angular momentum whichcan be either an integer or a non-integer multiple of h [18, 47].
The mechanical effects of the orbital angular momentum of beams with anazimuthal phase term eilϕ has been experimentally verified [46]. For photons, the
17

CHAPTER 3. OPTICS
orbital angular momentum has been experimentally verified to be lh [27].
3.1 Formation of beams
A strictly transverse wave traveling in the z direction has its E and B fields trans-verse to the z axis and therefore its linear momentum is in the z direction. Fromthis we can see that it cannot have any angular momentum, given by equation(2.37), along the z axis. But if we would have a field component in the z direction,it is possible to obtain angular momentum in the z direction. In fact, a beam ofelectromagnetic radiation has this property since it consists of a superposition ofmany waves which do not all travel exactly parallel to the beam symmetry axis.Let us start by looking at such a beam, which is also a good approximation of alaser beam.
3.2 Gaussian Beams
To obtain z components in the E and B fields we can start with a vector potentialof the form [3]
A = u(x,y,z)exp(−ikz)x (3.1)
where u(x,y,z) is a function describing the field amplitude distribution. This vec-tor potential is valid for linearly polarized waves. Since we consider monochro-matic waves with frequency ω, the solutions to the time-independent wave equa-tion are also solutions to the Helmholtz equation. So to obtain u we solve theHelmholtz equation
(∇2+ k2)u(x,y,z)exp(−ikz) = 0 (3.2)
where k = 2π/λ. If we assume that the variation in x and y directions are largerthan the variation in the z direction we can neglect the ∂2/∂z2 part. Mathemati-cally, we write it as∣∣∣∣2k
∂u∂z
∣∣∣∣ ∣∣∣∣∂u2
∂z2
∣∣∣∣ (3.3)
18

3.2. GAUSSIAN BEAMS
This is called the paraxial wave approximation since it basically says that thebeam does not diverge much from the beam axis. In this approximation we findthat
∇2t u−2ik
∂
∂zu = 0 (3.4)
where ∇2t represents the transverse part of the Laplacian.
A well-known solution of the paraxial Helmholtz equation is a spherical wavegiven by
u(r) = Aexp(−ikr)
r(3.5)
where A is a constant and r the distance from the source. If we rewrite (3.5) inCartesian coordinates, we obtain
u(x,y,z) = Aexp(−ikz
√1+ x2+y2
z2
)z√
1+ x2+y2
z2
≈ Aexp(−ikz)exp
(−ik(x2+y2)
2z
)z
(3.6)
We use this approximation and try to form our Gaussian beam with the cylindricalAnsatz [32]
u(ρ,ϕ,z) = Aexp[−i× f (z)]exp(−
ikρ2
2×g(z)
)(3.7)
where ρ2 = x2 + y2 and f (z) and g(z) are analytic functions of z. The amplitudefunction u must also be a solution to the paraxial Helmholtz equation (3.4).
∇2t
[exp[−i× f (z)]exp
(−
ikρ2
2×g(z)
)]−
−2ik∂
∂z
[exp[−i× f (z)]exp
(−
ikρ2
2×g(z)
)]= 0 (3.8)
Let us start with the ∇2t term
∇2t
[exp[−i× f (z)]exp
(−
ikρ2
2×g(z)
)]=
19

CHAPTER 3. OPTICS
= exp[−i× f (z)]1ρ
∂
∂ρ
[ρ∂
∂ρexp(−
ikρ2
2×g(z)
)]=
= exp[−i× f (z)]exp(−
ikρ2
2×g(z)
)[−
2ikg(z)−
k2ρ2
g2(z)
](3.9)
and then the ∂∂z term
−2ik∂
∂z
[exp[−i× f (z)]exp
(−
ikρ2
2×g(z)
)]=
= −2ik exp[−i× f (z)]exp(−
ikρ2
2×g(z)
)[−i∂
∂zf (z)+
ikρ2
2×g2(z)∂
∂zg(z)]
(3.10)
Now we combine equations (3.9), (3.10) and (3.8) to obtain
exp[−i× f (z)]exp(−
ikρ2
2×g(z)
)×
×
[(−
2ikg(z)−
k2ρ2
g2(z)
)−2ik
(−i∂
∂zf (z)+
ikρ2
2×g2(z)∂
∂zg(z))]= 0⇔
⇔2ikg(z)+2k
∂
∂zf (z)+
k2ρ2
g2(z)
(1−
∂
∂zg(z))= 0 (3.11)
The first two terms in the left-hand member are independent of ρ, which meansthat for any ρ we can separate the equation into two new ones
2ikg(z)+2k
∂
∂zf (z) = 0 (3.12)
k2ρ2
g2(z)
(1−
∂
∂zg(z))= 0 (3.13)
which gives us
(3.13)⇒∂
∂zg(z) = 1 (3.14)
(3.12)⇒∂
∂zf (z) = −
ig(z)
(3.15)
20

3.2. GAUSSIAN BEAMS
After some further integration we obtain
g(z) = z+g0 (3.16)
f (z) = −i ln(z+g0) (3.17)
where g0 is a constant. Inserting the result into the Ansatz (3.7) we get the ex-pression
u(ρ,ϕ,z) = A1
z+g0exp(−
ikρ2
2(z+g0)
). (3.18)
Now, we examine the characteristics of the beams, and again compare themwith those of a spherical wave. The function f (z) is related to a complex phaseshift while g(z) describes the intensity variation. First, we write g(z) in terms ofthe width, w(z), and radius of curvature, R(z), measured on the beam axis [36].The width w(z) is a measure of how the electric field amplitude falls off whenmoving out from the beam axis. This falloff is Gaussian and w is the distancefrom the axis where the amplitude is 1/e of the maximum value (which is foundon the axis). So when talking about the width of a beam we do not mean therange wherein all the field distribution is located but, 1/e times of the field. Sincethe intensity, I, is proportional to E2, we see that the width of the beam containsI(1−1/e2), or 86%, of the total intensity. At z = 0 the beamwidth will be minimaland we call this value the beam waist, w0 [36].
Assume that [36]
1g(z)=
1R(z)−
iCh(w(z))
(3.19)
where C is a constant. At z = 0, the wave front is plane, so the radius of curvatureis infinite.
1R(0)
= 0. (3.20)
This means that at z = 0, we see that 1/g(z) is purely imaginary or, 1/g(z) = 1/g0.So, at z = 0 we have the equation
u(ρ,ϕ,z) = constant× exp(
ikρ2
2iC
h(w(z))
). (3.21)
21

CHAPTER 3. OPTICS
Figure 3.1: Amplitude distribution in a Gaussian beam.
Inserting ρ = w(z) and requiring that the amplitude will be 1/e of the maximumvalue gives
exp(
ikw(z)2
2iC
h(w(z))
)= exp(−1) (3.22)
which leads to
h(w(z)) = w2(z) (3.23)
C =2k=λ
π(3.24)
⇒ g(z) = z+ iπw2
0λ
(3.25)
and
1g(z)=
1R(z)− i
λ
πw2(z). (3.26)
Expressions for w and R can now be obtained
w(z) = w0
√1+(λzπw2
0
)2
(3.27)
22

3.2. GAUSSIAN BEAMS
R(z) = z
[1+(πw2
0λz
)2]. (3.28)
By choosing z = πw20/λ in equation (3.27) we get w(z) =
√2w0 which means that
at this z, the cross section of the beam is twice as large as the cross section at z= 0.We call this value of z the Rayleigh range, or zR [36]. The Rayleigh range givesinformation of the spread of the beam. A short zR means that the beam divergesrapidly.
Inserting zR in equations (3.27) and (3.28) gives us
w(z) = w0
√1+(
zzR
)2
(3.29)
R(z) = z
[1+(
zR
z
)2]. (3.30)
Now, let us use these expressions for w and R in the equation for f (z) (3.17)
f (z) = −i ln(z+g0) = −i ln(z+ izR) = −i ln(√
z2+ z2R× exp
[i arctan
(zR
z
)])=
= −i ln(√
z2+ z2R
)+ arctan
(zR
z
)(3.31)
so
exp[−i f (z)
]=
exp[−i arctan
( zRz
)]√z2+ z2
R
=w0
zRw(z)exp[−i arctan
(zR
z
)]. (3.32)
Now we can write equation (3.18) as
uG(ρ,ϕ,z)= Aw0
zRw(z)exp[−i arctan
(zR
z
)]exp
− ikρ2
2z(
1+ z2R
z2
)exp
[−
ρ2
w2(z)
](3.33)
which is the commonly used expression for a Gaussian beam. As we see in figure3.1, the intensity of such a beam is Gaussian, hence the name. Cross sections ofbeams with different w0 can be seen in figure 3.2.
23

CHAPTER 3. OPTICS
Figure 3.2: Intensities of Gaussian beams with different width param-eters w0. From top left to bottom right: w0 = 0.5λ, 1λ, 2λ and 2.5λ.Axis lengths are in wavelengths. Blue is minimum intensity and red ismaximum.
If we consider the stationary phase of the beam, in other words the imaginaryparts of the exponentials of equation (3.18) and the exp[−ikz] part from equation(3.1), and choose to look at planes of constant phase, we get
ikz+izρ2
zRkw2(z)+ i arctan
(zR
z
)= constant. (3.34)
Choosing the constant to be zero and neglecting arctan (zR/z), which is small, weget surfaces given by
z = −zρ2
zRkw2(z)(3.35)
which are parabolas looking like the one seen in figure 3.3. It is instructive tocompare this to a beam consisting of parallel transverse waves which would havephase planes perpendicular to the z axis.
kz+φ = constant⇒ z = constant. (3.36)
24

3.3. LAGUERRE-GAUSSIAN BEAMS
Figure 3.3: Plane of constant phase in a Gaussian beam. The values onthe axes are in wavelengths.
3.3 Laguerre-Gaussian Beams
In order to endow our EM beam with orbital angular momentum, let us search fora solution of the Helmholtz equation with an azimuthal e−ilϕ dependence because,according to Simpson et al. [46], such a beam will carry OAM. Let us use our uG
25

CHAPTER 3. OPTICS
as a starting point and expand it to a trial solution of the form [36]
u(ρ,ϕ,z) =C×h( ρ
w
)exp[−ilϕ
]exp[−iφ(z)
]uG(ρ,ϕ,z) = F(ρ,ϕ,z)uG(ρ,ϕ,z).
(3.37)
Inserting this into the Helmholtz equation (3.4), we find that
F∇2t uG+2[∇tF ·∇tuG]+uG∇
2t F −2ikuG
∂
∂zF −2ikF
∂
∂zuG = 0. (3.38)
From equation (3.8) we know that ∇2t uG −2ik(∂/∂z)uG = 0 which means that the
sum of the first and last term in equation (3.38) is equal to zero, so this equationbecomes
2[∇tF ·∇tuG]+uG∇2t F −2ikuG
∂
∂zF = 0
or
−2
ikρ
z(
1+ z2R
z2
) + 2ρw2(z)
∂h∂ρ+
(∂h2
∂ρ2 +1ρ
∂h∂ρ−
l2
ρ2
)−2ik
(ih∂φ
∂z+∂h∂z
)= 0.
(3.39)
After some calculations we find that
h( ρ
w
)=[√
2( ρ
w
)]l×Ll
p
(2ρ2
w2
)(3.40)
where Llp is a generalized Laguerre polynomial defined as regular solutions to the
differential equation
xd2
dx2 Llp+ (l+1− x)
ddx
Llp+ pLl
p = 0 (3.41)
where l and p are integers greater than −1. We also find that
φ(z) = (2p+ l)arctan(
zR
z
). (3.42)
26

3.3. LAGUERRE-GAUSSIAN BEAMS
So now we can write equation (3.37) as
uLGpl (ρ,ϕ,z) =Cpl
w0
zRw(z)
[√
2(
ρ
w(z)
)]|l|×L|l|p
(2ρ2
w2(z)
)exp[−ilϕ]×
×exp[−i(2p+ |l|+1)arctan
(zR
z
)]exp
− ikρ2
2z(
1+ z2R
z2
)exp
[−
ρ2
w2(z)
](3.43)
which is our final expression describing the Laguerre-Gauss (LG) beam. The rea-son for using the absolute value of l in the Laguerre polynomial and the amplitudepart is that, as stated above, the Laguerre polynomials are only defined for l > −1and that having the amplitude to the power of −l would result in infinite amplitudeas ρ→ 0, which is unphysical. In the arctan part we use it for symmetry between+l and −l. For us, the sign of l is important and therefore we need to adapt ourequations so we can use negative values of l. The coefficient Cpl is obtained byrequiring that every mode transmits the same amount of power and is given by
Cpl = A
√p!
(p+ |l|)!(3.44)
where A is a constant. Note that uLG00 = uG.
The intensity of the LG beam is proportional to the time average of the linearmomentum density, Re[ε0(E×B)], which is given by [3]
ε0
2(E∗×B+E×B∗) = iω
ε0
2(u∗∇u−u∇u∗)+ωkε0|u|2 z. (3.45)
Depending on the values of p and l the intensity profile will vary. As we cansee, setting l = 0 gives us a Gaussian intensity profile, but with higher (or lower)l values the beam intensity will exhibit rings of intensity instead of spots. Lettingp take other values than zero will give more rings (the number of intensity peaksare p+1). In figure 3.4 we can see beam cross sections with different values of pand l.
In the same manner as for the Gaussian beam, we keep the stationary phaseconstant to obtain the behavior of the phase. For the LG beam it is given by
ikz+izρ2
zRkw2(z)+ ilϕ+ i(2p+ l+1)arctan
(zR
z
)= constant. (3.46)
27

CHAPTER 3. OPTICS
Figure 3.4: Intensities of LG beams. In the top row p = 0, in the middlerow p = 1 and in the bottom row p = 2. In each row l changes from zeroto two when going from left to right.
28

3.4. ANGULAR MOMENTUM OF LAGUERRE-GAUSSIAN BEAMS
Here the phase front appearance will depend on the value of l. If l = 0 it willresemble the Gaussian beam. For higher values of l the beam will have phasefronts that look like intertwined spirals. We can also see that when moving aroundthe axis one rotation we will cross l number of planes because lϕ = 0(mod2π) willbe satisfied l times when ϕ = [0,2π[. The sign of l is also important since it willresult in a right hand spiral for negative l and left hand spirals for positive l. Thephase front for l = 0 does not rotate at all. Also note that one spiral will needl wavelengths to complete a rotation. This means that the rotation of the phasefronts will be higher for lower values of l. In figure 3.5 phase fronts for differentl are plotted. The phase fronts in the figure are created by choosing the constantin equation (3.46) to be zero and at the same time neglecting the second andfourth term in the left-hand member. The consequence is that the plots in figure3.5 give the general characteristics for a beam carrying a distinct orbital angularmomentum but with some restrictions as compared to the complete expression.Basically by neglecting the second term in equation (3.46) we fixate the radialcurvature not to be curved like the Gaussian phase front in figure 3.3. The fourthterm will generate a phase displacement but it will decrease with z and always belimited.
If we examine a cross section of the beam in a plane with constant z we seethe lϕ phase dependence where the phase changes from zero to 2π l number oftimes when we encircle the beam. This is shown in figure 3.6.
3.4 Angular momentum of Laguerre-Gaussian beams
Allen et al. [3] use the linear momentum equation (3.45) together with the lin-early polarized LG beam distribution equation (3.43) to obtain the momentumdensity (per unit power), which is directly related to the Poynting vector by c2.For simplicity, we from now denote uLG
pl by u.
pdens =Sc2 =
1c
[ρz
z2+ z2R|u|2ρ+
lkρ|u|2ϕ+ |u|2 z
]. (3.47)
So we do not have momentum only in the z direction as for a plane wave but alsoin the ρ and ϕ directions. The ρ component is always positive (for positive z whichis what we consider) and this shows that the beam spreads. The z component is the
29

CHAPTER 3. OPTICS
(a) l = 0 (b) l = 1
(c) l = 2 (d) l = 3
Figure 3.5: Phase fronts for beams with different orbital angular mo-mentum, reaching from orbital angular momentum zero in the upperleft-hand corner to an orbital angular momentum of 3 in the lower right-hand corner.
30

3.4. ANGULAR MOMENTUM OF LAGUERRE-GAUSSIAN BEAMS
Figure 3.6: Phases in cross sections of beams with l = 0 (top left) to l = 3(down right). Note how the phase changes from 0 (blue) to 2π (red) lnumber of times.
normal linear momentum of the beam and is of course also always positive. The ϕcomponent means that momentum encircles the beam axis and thus provides a netorbital angular momentum. Depending on l it is either positive or negative. Fromthis we see that the Poynting vector spirals around the z axis in a “corkscrew”fashion as the beam propagates. The time average of the angular momentumdensity is now given by
M = −zωρ|u|2ρ+
ρ
c
[z2
z2+ z2R−1]|u|2ϕ+
lω|u|2 z. (3.48)
When integrated over the beam, both the ρ and ϕ components vanish because
31

CHAPTER 3. OPTICS
of circular symmetry and the only angular momentum is in the z direction. Allenet al. [3] also point out that from equations (3.47) and (3.48) one can see thatthe ratio of angular momentum to energy is L/cp = l/ω and the ratio of angularmomentum to linear momentum is L/p = l(λ/2π). This means that the orbitalangular momentum is well-defined and proportional to l.
Allen et al. [3] also shows that when one has elliptic or circular polarization,equation (3.45) changes to
ε0
2(E∗×B+E×B∗) = iω
ε0
2(u∗∇u−u∇u∗)+ωkε0|u|2 z+ωσz
ε0
2∂|u|2
∂ρϕ (3.49)
where σz describes the polarization. For linearly polarized radiation σz = 0, andσz = 1 or −1 for left- respectively right-handed circularly polarized radiation. Thez component of M now becomes
Mz =lω|u|2+
σzr2ω
∂|u|2
∂ρ. (3.50)
If we compare equations (3.48) and (3.50) we see that while for linearly polarizedradiation the ratio of angular momentum density to energy has a well-definedunique value, the ratio of polarized radiation is dependent of the gradient of in-tensity in every point. But when integrated over the whole beam we get a simpleresult for all polarizations. For a non-linearly polarized beam the ratio of totalangular momentum to energy is J/cp = (l+σz)/ω.
32
4ANGULAR MOMENTUM FROM
MULTIPOLES
Jackson [31] shows that by using a multipole expansion of the electromagneticfields one finds that the fields obtained contain an lϕ phase dependence and thatthe angular momentum is proportional to the energy in all fields which have anl eigenvalue dependence. This can be compared to the results for the Laguerre-Gaussian beams obtained by Allen et al. [3].
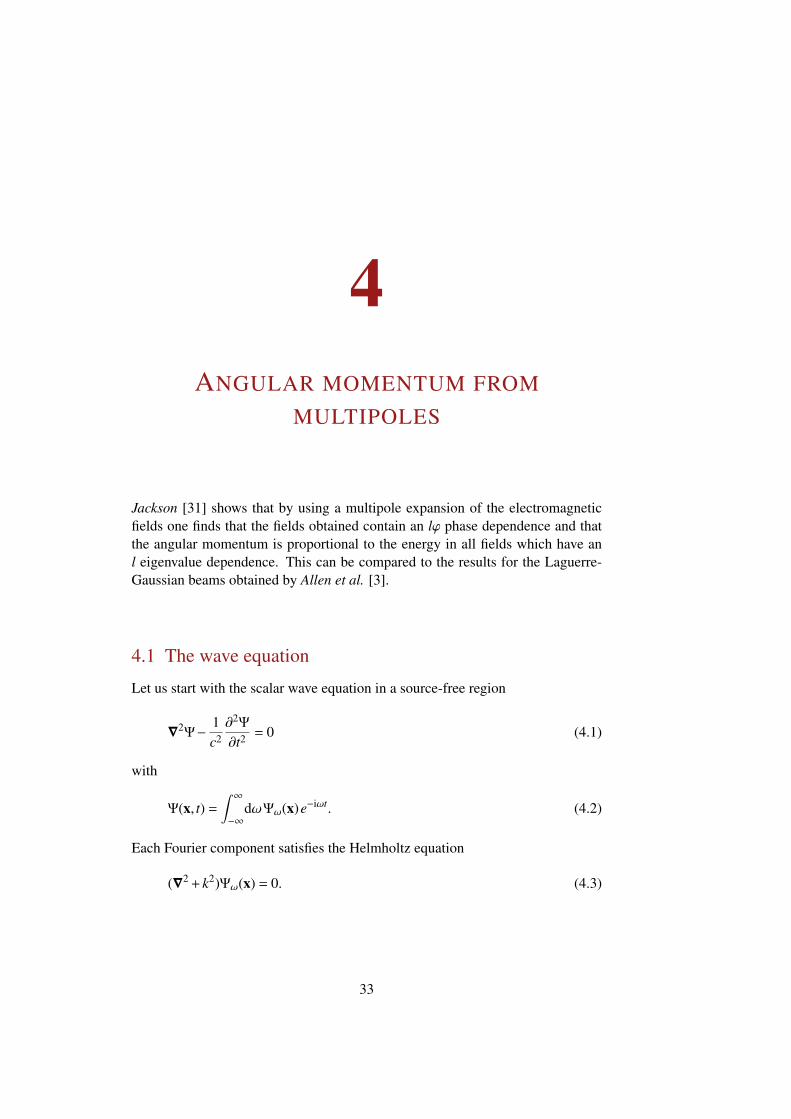
4.1 The wave equation
Let us start with the scalar wave equation in a source-free region
∇2Ψ−
1c2∂2Ψ
∂t2 = 0 (4.1)
with
Ψ(x, t) =∫ ∞−∞
dωΨω(x)e−iωt. (4.2)
Each Fourier component satisfies the Helmholtz equation
(∇2+ k2)Ψω(x) = 0. (4.3)
33

CHAPTER 4. ANGULAR MOMENTUM FROM MULTIPOLES
Using spherical coordinates and separating the radial and angular variables, wemake the Ansatz
Ψω(x) =∑m,l
fml(r)Yml(θ,ϕ). (4.4)
Starting with the radial part we find that(d2
dr2 +2r
ddr+ k2−
m(m+1)r2
)fm(r) = 0 (4.5)
where we make the substitution fm(r) = 1/√
r um(r) we get(d2
dr2 +1r
ddr+ k2−
(m+ 12 )2
r2
)um(r) = 0 (4.6)
This we recognize as the Bessel equation with v = m+1/2. The solutions for theradial functions are therefore
fml(r) =Aml
r1/2 Jm+1/2(kr)+Bml
r1/2 Nm+1/2(kr) (4.7)
where Aml and Bml are constants and Jm+1/2(kr) and Nm+1/2(kr) are Bessel func-tions of the first and second kind, respectively. When dealing with Bessel func-tions of half integer kinds it is convenient to rewrite them in terms of sphericalBessel functions or Hankel functions. The Hankel functions are given by
h(1,2)m (kr) =
( π
2kr
)1/2 [Jm+1/2(kr)± iNm+1/2(kr)
]. (4.8)
The angular part of equation (4.4) is found from
−
(1
sinθ∂
∂θ
(sinθ
∂
∂θ
)+
1sinθ
∂2
∂ϕ2
)Yml(θ,ϕ) = m(m+1)Yml(θ,ϕ) (4.9)
of which spherical harmonics are solutions given by
Yml(θ,ϕ) =
√2m+1
4π(m− l)!(m+ l)!
Plm(cosθ)eilϕ (4.10)
34

4.2. MULTIPOLE EXPANSION
where Plm(cosθ) are associated Legendre functions. Now we can write the general
solution for Ψ as
Ψ(x) =∑m,l
[A(1)
ml h(1)m (kr)+A(2)
ml h(2)m (kr)
]Yml(θ,ϕ) (4.11)
Note that equation (4.9) resembles (save a factor h) the angular momentumoperator in quantum mechanics
(Lop)2Yml = m(m+1)Yml (4.12)
and the pseudovector operator
Lop = −i(x×∇) (4.13)
of which
Lopz = −i
∂
∂ϕ(4.14)
Note that x ·Lop = 0.
4.2 Multipole expansion
We shall now use a multipole expansion for the electromagnetic fields and assumethat we have a e−iωt time dependence in a source-free region. We may then writethe Maxwell equations as
∇ ·E = 0 (4.15)
∇ ·B = 0 (4.16)
∇×E = ikcB (4.17)
∇×B = −ikc
E . (4.18)
where ω = kc. Combining equations (4.17) and (4.18), we can eliminate E andwe get
∇ ·B = 0 (4.19)
(∇2+ k2)B = 0. (4.20)
35

CHAPTER 4. ANGULAR MOMENTUM FROM MULTIPOLES
From B, the far-field E can be obtained by
E =ick∇×B (4.21)
Each Cartesian component satisfies the Helmholtz equation and can be written asan expansion in the form of equation (4.11) but they must also satisfy equations(4.15) and (4.16) for us to obtain a multipole field. Jackson [31] shows that x ·Eand x ·B satisfy the Helmholtz equation and their solutions are also given byequation (4.11). From this Jackson [31] defines a magnetic multipole field oforder (m, l) by the conditions
x ·BMml =
µ0m(m+1)k
gm(kr)Yml(θ,ϕ) (4.22)
x ·EMml = 0 (4.23)
where
gm(kr) = A(1)m h(1)
m (kr)+A(2)m h(2)
m (kr). (4.24)
Using
B = −i
kc∇×E (4.25)
we relate x ·B to E as
kcx ·B = −ix · (∇×E) = −i(x×∇) ·E = Lop ·E (4.26)
where we have used equation (4.13) for Lop. With this we now see that the electricfield from the magnetic multipole must satisfy
Lop ·EMml(r, θ,ϕ) = m(m+1)µ0cgm(kr)Yml(θ,ϕ) (4.27)
as well as equation (4.23). The operator Lop acts on the angular variables bychanging the l number just as the usual shift operators, L+ and L−, plus the Lz op-erator well-known from quantum mechanics. Remember that from equation 4.12we know that our angular momentum operator is 1/h the operator from quantummechanics, and naturally, the same goes for the shift operators and Lz. However,note that in this text l and m are interchanged for reasons to be mentioned later.Now we can write the fields from the magnetic multipole of order (m, l) as
EMml = µ0cgl(kr)LopYml(θ,ϕ) (4.28)
36

4.2. MULTIPOLE EXPANSION
and
BMml = −
ikc∇× EM
ml. (4.29)
In a similar way the fields from the electric multipole of order (m, l) are found tobe
BEml = µ0 fm(kr)LopYml(θ,ϕ) (4.30)
and
EEml =
ick∇×BE
ml (4.31)
where fm(kr) is given by the expression for gm(kr) but with other coefficients. Forconvenience Jackson [31] rewrites LopYml(θ,ϕ) in a normalized form given by
Xml(θ,ϕ) =1
√m(m+1)
LopYml(θ,ϕ) (4.32)
with the orthogonality properties∫dΩ X∗m′l′ ·Xml = δl l′δmm′ (4.33)
and ∫dΩ X∗m′l′ · (x×Xml) = 0 (4.34)
for all m,m′, l and l′.If we combine the fields from magnetic and electric multipoles, we obtain the
general solution to the Maxwell equations (4.15) to (4.18)
B = µ0 ∑m,l
(aE(m, l) fm(kr)Xml−
ik
aM(m, l)∇×gm(kr)Xml
)(4.35)
and
E = µ0 c∑m,l
(ik
aE(m, l)∇× fm(kr)Xml+aM(m, l)gm(kr)Xml
)(4.36)
37

CHAPTER 4. ANGULAR MOMENTUM FROM MULTIPOLES
where aE(m, l) and aM(m, l) are coefficients that specify the amounts of electricand magnetic multipole fields and are determined by the sources and boundaryconditions. Jackson [31] states that with the equations
µ0 aM(m, l)gm(kr) =k
√m(m+1)
∫dΩ Y∗mlx ·B (4.37)
and
µ0 caE(m, l) fm(kr) = −k
√m(m+1)
∫dΩ Y∗mlx ·E (4.38)
and the knowledge of x ·B and x ·E at two different radii, r1 and r2 say, one canobtain the multipole fields.
If we look at E and B we see that in every term they contain the sphericalharmonics, Yml(θ,ϕ), which, according to equation (4.10) include a factor eilϕ.According to [46] the field should therefore carry angular momentum in the zdirection proportional to l. This is the case if we consider our angular momen-tum operator Lz given in equation (4.14). It is now also clear why we choose tointerchange m and l; it is just to avoid confusion for the reader.
4.3 Angular Momentum of Multipole Radiation
In the far zone the multipole fields from a localized source can be seen as sphericalwaves with Hankel functions as the radial function fm(kr). If we consider fieldsfrom an electric multipole of order (m, l) the magnetic field goes as
BEml→ (−i)m+1 eikr
µ0 krLopYml (4.39)
and the electric filed is found to be
EEml = cBE
ml× x. (4.40)
From equations (4.28) and (4.29) we see that the fields from magnetic multipoleswill be similar.
38

4.3. ANGULAR MOMENTUM OF MULTIPOLE RADIATION
Let us consider one Fourier component from a superposition of electric mul-tipoles of order (m, l) where m is a single value but l may vary. According toequations (4.35) and (4.36) we may then write the fields as
Bm = µ0 ∑l
aE(m, l)Xml h(1)m (kr)e−iωt (4.41)
and
Em =ick∇×Bm. (4.42)
The time-averaged energy density is given by
u =ε0
4(E ·E∗+ c2B ·B∗
)=ε0 c2
2B ·B∗ (4.43)
where we have used that, in the far zone, the magnitude of E equals the magnitudeof cB. We can now write the differential energy in a spherical shell between r andr+dr as
dU =µ0 dr2k2 ∑
l,l′a∗E(m, l′)aE(m, l)
∫dΩ X∗ml′ ·Xml. (4.44)
Using the orthogonality of Xml from equation (4.33) we find the energy to be
dUdr=
µ0
2k2 ∑l|aE(m, l)|2 (4.45)
Jackson [31] points out that when one has both electric and magnetic multipoles ofgeneral order (m, l) the sum changes to a sum over m and l and |aE(m, l)|2 changesto |aE(m, l)|2+ |aM(m, l)|2.
The time-averaged angular momentum density is given by
M =1
2µ0 c2 Re[x×(E×B∗
)](4.46)
which, when considering electric multipoles, and using vector algebra togetherwith the the relationship between E and B, transforms into
M =1
2µ0ωRe[B∗(Lop ·B)
](4.47)
39

CHAPTER 4. ANGULAR MOMENTUM FROM MULTIPOLES
For a spherical shell between between r and r + dr the differential angular mo-mentum from the electric multipoles is
dJ =µ0 dr2ωk2 Re
[∑l,l′
a∗E(m, l′)aE(m, l)∫
dΩ (Lop ·Xml′)∗Xml
](4.48)
which, using the definition of Xml, we can write as
dJdr=
µ0
2ωk2 Re
[∑l,l′
a∗E(m, l′)aE(m, l)∫
dΩ Y∗ml′ Lop Yml
]. (4.49)
Using equation (4.14) for how Lopz acts on Yml plus the orthogonality of the spher-
ical harmonics we find that the z component of the angular momentum can bewritten as
dJz
dr=
µ0
2ωk2 ∑l
l |aE(m, l)|2. (4.50)
Combining equation (4.45) and (4.50) we see that the energy and angularmomentum is related to each other as
dJz
dr=
lω
dUdr
(4.51)
independent of r. In other words, the z component of the angular momentumfrom a multipole of order (m, l) is related to the EM field energy so that one pho-ton of energy hω carries a z component of angular momentum of magnitude lh.Comparing this with the results obtained by Allen et al. [3] which we presentedin chapter 3 we see that the results agree with each other. Furthermore, if oneconsiders two electric dipoles oscillating along the x and y axis respectively witha π/2 phase difference. This corresponds to l = ±1 [31] and from equation (4.51)we see that one photon with will carry ±h of angular momentum. Intuitively, wesee that these crossed dipoles will create a circularly polarized beam and the resultobtained agrees with what Beth [11] measured experimentally.
The multipole derivations are performed in more detail in [31].
40

5GENERATION OF AN EM BEAM
CARRYING ANGULAR MOMENTUM
In the earlier chapters the attributes of beams carrying orbital angular momentumwere established. An EM beam containing inclined phase fronts carries orbitalangular momentum [18, 47]. In this chapter an array of antennas will be designedthat generates a field that will have phase shifts that resembles the field of theLaguerre-Gaussian beam. Of course, radio beams generated by antennas willhave somewhat different properties than Laguerre-Gaussian beams generated bylasers, but close to the axis of propagation the EM field of the two beams can beexpected to be very similar, both exhibiting a relative offset in the phase of lϕ.
5.1 The concept
In a cross-section of a Laguerre-Gaussian beam, the phase, as discussed in section3.3, is not homogeneous. In figure 5.1 the cross-section of a Laguerre-Gaussianbeam is plotted. The different colors represent different offsets in the phase andthe curves represent how the phase varies over a space distance. The curves areplaced in a circle of radius 2
3λ. This will only give a schematic picture of thesituation since the phases that the curves describes will be dislocated. On theother hand, it will give a nice picture of how the phase planes occur. In figure 5.1eand figure 5.1f a more accurate plot is made. It is a little less instructive, but thephase planes are clearly visible.
41

CHAPTER 5. GENERATION OF AN EM BEAM CARRYING OAM
(a) l = 0 (b) l = 1
(c) l = 0 (d) l = 1
(e) l = 0 (f) l = 1
Figure 5.1: The cross section of the Laguerre-Gaussian beam and curvesshowing, in a schematic way, how the phase varies over a distance inspace. Subfigures (a), (c) and (e) shows a plane wave, no orbital angularmomentum. Subfigures (b), (d) and (f) show a beam carrying orbitalangular momentum (l = 1).
42

5.2. THE USE OF ARRAY FACTORS
For a Laguerre-Gaussian beam with orbital angular momentum number, l, theoffset in the phase is described by lϕ. To generate such a field we need to shiftthe phase for different elements in the antenna array that we have chosen. Thearray of antennas can have many different shapes. For simplicity, we have chosena multiple circular array.
5.2 Calculation of the electric field by the use of array factors
By using multiple elements in a geometrical configuration and controlling thecurrent and phase for each element, the electrical size of the antenna increasesand so does the performance. The new antenna system created by two or moreindividual antennas is called an antenna array. Each element does not have to beidentical but for simplification reasons they often are. To obtain the properties ofthe electric field from an array we use the array factor, AF.
The total field from an array can be calculated by a superposition of the fieldsfrom each element. However, with many elements this procedure is very unprac-tical and time consuming. By using different kinds of symmetries and identicalelements in the array, it is possible to get a much simpler expression for the totalfield. This is achieved by calculating the so called array factor, AF, which de-pends on the displacement (and shape of the array), phase, current amplitude andnumber of elements. After calculating the array factor the total field is obtainedby the pattern multiplication rule which is such that the total field is the productof the array factor and the field from one single element [5]
Etotal = Esingle element×AF (5.1)
This formula is valid for all arrays consisting of identical elements. The arrayfactor does not depend on the type of elements used, so for calculating AF it ispreferable to use point sources instead of the actual antennas. After calculatingthe AF, equation (5.1) is used to obtain the total field. It is only now that the actualelement is being used as Esingle element. Arrays can be 1D (linear), 2D (planar) or3D. In a linear array the elements are placed along a line and in a planar they aresituated in a plane.
In our case where we want to have a circular symmetry over the cross sectionwe use a circular grid. To obtain better properties we use a multiple circular gridwith equal area sectors, figure 5.2.
43

CHAPTER 5. GENERATION OF AN EM BEAM CARRYING OAM
Figure 5.2: Equal area sectors circular grid (EACG).
5.2.1 The location of each element
The surface area for each section is Ag. The location of each individual elementis described by rm and ϕn, where m denotes which ring the element is placed inand n is the location in the selected ring. M is the total number of rings and N isthe total number of elements in each ring.
a21α
2= Ag (5.2)
a22α
2−
a21α
2︸︷︷︸Ag
= Ag (5.3)
a2mα
2− (m−1)Ag = Ag (5.4)
44

5.2. THE USE OF ARRAY FACTORS
where α is the angle for the area sectors. This gives us the expression for the radiiof each subsection
am =
√mM
a (5.5)
Let rm denote the radius vector for the center of each subsection, which is thepoint where the antenna is located.
r2mα
2−
a2m−1α
2=
a2mα
2−
r2mα
2(5.6)
This gives us the following expression
rm =
√(2m−1)
2Ma (5.7)
The ϕn for the element is given by
ϕn =2πnN
(5.8)
5.2.2 Array factor
The normalized field of the array can be written as
Ek(r, θ,ϕ) =NM
∑k=1
ake−ikRk
Rk(5.9)
where Rk is the distance from the kth element to the observation point. Using thenotations given in figure 5.2, this distance can be written,
Rk = Rmn =(r2+a2
mn+2amn cosψmn)
(5.10)
For r a this expression reduces to
Rmn ' r−acosψmn = r−asinθcos(ϕ−ϕmn) (5.11)
If we assume that for the amplitude Rk ' r then we obtain the following expressionfor the electric field
Emn =e−ikr
r
M
∑m=1
N
∑n=1
amneikamn sinθcos(ϕ−ϕmn) (5.12)
45

CHAPTER 5. GENERATION OF AN EM BEAM CARRYING OAM
where amn is the excitation coefficient and can be expressed as Imneiβ which leadsto
Emn =e−ikr
r
M
∑m=1
N
∑n=1
Imnei
(kamn sinθcos(ϕ−ϕpn) + βmn
)(5.13)
In our case β will only be dependent on which n we are considering and not theradius since the phase should be equal in “beams” from the center. The variableϕ will only be dependent on n, not m. The amplitude I will be dependent of bothm and n. And finally a will only depend on m.
Emn =e−ikr
r
M
∑m=1
N
∑n=1
Imnei
(kam sinθcos(ϕ−ϕn) + βn
)(5.14)
This gives us the array factor, AF
[AF] =M
∑m=1
N
∑n=1
Imnei
(kam sinθcos(ϕ−ϕn) + βn
)(5.15)
5.2.3 The electric field
The electric field can now be calculated from equation 5.1
E =e−ik|x−x0 |
|x−x0|
M
∑m=1
N
∑n=1
Imnei
(kam sinθcos(ϕ−ϕn) + βn
)r (5.16)
Taking the phase dependent part of this expression and transforming to cylindricalcoordinates yields
M
∑m=1
N
∑n=1
Imnei(
kamρ√
ρ2+z2cos(ϕ−ϕn) + βn
)(5.17)
By looking at the properties for the wanted field it seems that by having a relativeoffset in the phase between the elements, a similar field with curved phase frontswill be generated. For a given value of l the phase should shift in steps of l2π/Nbetween each element in each ring. The phase for the element mn will then begiven by lϕm. Ideally, it should be a continuous distribution but since we are
46

5.2. THE USE OF ARRAY FACTORS
dealing with a discrete set of antennas this is not possible. Analyzing equation(5.17), with the antennas phases shifted as discussed, we confirm that a field witha offset in the phase of lϕ is indeed generated.
Using the array factor to calculate the field will give a representative pictureof what the field looks like, but approximations are made along the way. Usinga numerical solver for the field generated by the antennas will result in a moreaccurate, and realistic, picture. This is exactly what we will do in the next chapter.
47


6SIMULATION SETUP
To calculate the EM fields from first principles we use the numerical solver, 4nec2.This de facto standard program engine has proven to be highly accurate for mod-eling the electromagnetic response of general structures. In this chapter we willpresent 4nec2, the different types of antenna arrays, and the different types ofelements used in this thesis.
6.1 The 4nec2 code
As mentioned in section 5.2, using a numerical solver to calculate the fields, amore accurate picture of the situation can be obtained. We have chosen to use thede facto standard program 4nec2 written by Arie Voors [30]. The program usesdifferent versions of Numerical Electromagnetic Code (NEC) and we have usedthe Nec2dXS engine. NEC was originally developed at the Lawrence LivermoreLaboratory under sponsorship of the Naval Ocean Systems Center and the AirForce Weapons Laboratory [40]. The program uses both an electric-field integralequation (EFIE) and an magnetic-field integral equation (MFIE) to model theelectromagnetic response of general structures, each having their own advantagesdepending on the structure. The differential equations then obtained are solvednumerically by a form of the method om moments (MOM).
The first version of NEC was written in FORTRAN in the 1970’s and sincethen new versions have been developed constantly, both by professionals and am-ateurs. Nowadays there are both free and license required public versions.
49

CHAPTER 6. SIMULATION SETUP
In 4nec2 the output can be viewed as patterns in two or three dimensionsshowing power and electric field gains. In two dimensions, information suchas beamwidth and direction of maximum gain can be obtained. The output canalso be given as an ASCII file which makes it possible to write post processingprograms in, e.g., MATLAB.
6.2 Grids
6.2.1 Equidistant radius circular grid, ERCG
In section 5.2 we used a multiple circular grid, an equal area circular grid (EACG),to estimate the properties of the field generated by the antennas. When we use4nec2 we use a similar construction, the equidistant radius circular grid (ERCG),shown in figure 6.1a. The difference being that the radial distance between eachring is the same and not dependent on the area. This gives us quite a sparse arrayof antennas. The location of each element is given by rm and ϕn. The index mdenotes which ring the element is located in and n is the number for that elementin the ring. The index n runs from n = 1 to n = N, where N is the number ofelements in each ring. The index m goes from m = 1 to m = M, where M is thenumber of rings in the array.
6.2.2 Equidistant circular grid, EDCG
By using a multiple circular grid array with equidistant spacing between eachindividual antennas in each ring, one gets a more dense array, figure 6.1b. A moredense array will lead to better sensitivity. The location of each element is given byrm and ϕmn, meaning that each element can be represented by mn. Here m standsfor the numbering of the ring and n the numbering for the element in question inthat ring. The prefix n goes from n = 1 to n = Nm, where Nm is the total number ofelements in ring m. The prefix m goes from m = 1 to m = M where M is the totalnumber of rings. Using this notation for the location of the elements, means thatby “equidistant spacing” we refer to the spacing between the element mn and theelement m(n+1).
50

6.2. GRIDS
(a) ERCG (b) EDCG
(c) Plane Array (d) Logarithmic Spiral Array
Figure 6.1: Here various antenna arrays used and discussed in this thesisare shown.
6.2.3 Planar array
A planar array is an array where the elements are placed along a rectangular gridas shown in figure 6.1c. The locations of the elements are given by their Cartesiancoordinates.
6.2.4 Logarithmic spiral array
The elements can also be placed according to a logarithmic spiral, as is the casefor LOFAR [38] which can be read about in section 7.8. The location of eachelement is given by rp = aebϕp , where p stands for which “branch” we are lookingat. This type of antenna array is shown in figure 6.1d.
51

CHAPTER 6. SIMULATION SETUP
6.3 Elements
The types of grids presented in the previous section, section 6.2, can be used withdifferent types of antenna elements. In this thesis we have used electric dipole,crossed electric dipole and electric tripole antennas. The crossed electric dipoleantenna can be considered as a degenerate case of the electric tripole antenna.
6.3.1 Electric dipole antennas
The electric dipole antenna is one of the oldest, simplest and most basic antennatypes. In its simplest form it is realized as a straight linear wire of high electricconductivity. Electric dipoles can be divided into different categories dependingof their length compared to the wavelength; infinitesimal dipole antennas, wherethe length of the antenna is smaller than λ/50, small electric dipole antennas,where the length is greater than λ/50 and smaller than λ/10, finite electric dipoles,where the length is greater than λ/10, and half wave electrical dipole where thelength is equal to λ/2. In this thesis we use small and finite electric dipoles.
The radiation field Fourier amplitudes for an electric dipole is given by [49,31]
Eradω (x) = −
14πε0
ei(k|x|)
|x|(pω×k)×k (6.1)
Bradω (x) = −
ωµ0
4πei(k|x|)
| x |(pω×k) (6.2)
6.3.2 Tripole and crossed dipole antennas
The design of a tripole antenna is simple. Basically it comprises three equal dipoleantennas perpendicular to each other, having individual feeds. The midpoints ofall the three dipoles are colocated at one point i 3D space, the antenna centerpoint. With the tripole antenna it is possible to measure the complete electric fieldvector and therefore to extract all information available in a radio signal [17].
In transmitting mode it is possible to transmit a beam in any direction with adesired polarization [9]. This is accomplished by controlling the current ampli-tude and phase individually in each of the three dipole antennas. In complex form
52

6.3. ELEMENTS
the currents can be written [19]
jk = j0wk = Akeiφk (6.3)
where Ak is the amplitude and φk the phase of the current in element k.The simplest type of antenna is one where the elements are considered short
compared to the wavelength, typically less than λ/10 but larger than λ/50 [5]. TheFourier amplitude of the radiated fields in the far-field approximation for such anantenna is given by [19]
Eradω (r,ϕ,θ) =i
Lµ0ck8π
eikr
r
[−A1eiφ1(sinϕϕ− cosθcosϕθ)
+A2eiφ2(cosϕϕ+ cosθ sinϕθ)−A3eiφ3 sinθθ] (6.4)
and
Bradω (r,ϕ,θ) =− i
Lµ0k8π
eikr
rs[−A1eiφ1(sinϕϕ+ cosθcosϕθ)
+A2eiφ2(cosϕϕ− cosθ sinϕθ)+A3eiφ3 sinθθ] (6.5)
where L is the length of the antenna. In the time domain the fields are given by[19]
Erad(t,x) = −Lµ0ck8πr
([A1 sin(kr−ωt+φ1)cosθcosφ
+A2 sin(kr−ωt+φ2)(cosθ sinϕ−A3 sin(kr−ωt+φ3) sinθ]θ
+[−A1 sin(kr−ωt+φ1) sinϕ+A2 sin(kr−ωt+φ2)cosϕ
]ϕ
) (6.6)
and
Brad(t,x) =Lµ0k8πr
([−A1 sin(kr−ωt+φ1) sinϕ
+A2 sin(kr−ωt+φ2)cosϕ]θ
+[−A1 sin(kr−ωt+φ1)cosθcosϕ
−A2 sin(kr−ωt+φ2)cosθ sinϕ+A3 sin(kr−ωt+φ3) sinθ]ϕ
)(6.7)
53

CHAPTER 6. SIMULATION SETUP
In short we say that
Erad(t,x) = Eθθ+Eϕϕ (6.8)
and
Brad(t,x) = Bθθ+Bϕϕ (6.9)
Since the antenna spans 3D space, it can beam in any given direction, (θ0,ϕ0), and with any polarization but let us consider the case when the tilt angle, τ,between the major axis of the polarization ellipse and the θ axis is a multiple ofπ/2. angle τ is called the tilt angle and can be anything between 0 and π. In thiscase the complex currents in the elements will be [19]
j1 =1ax
cosθ0 cosϕ0+ isinϕ0 (6.10)
j2 =1ax
cosθ0 sinϕ0− icosϕ0 (6.11)
j3 = −1ax
sinθ0 (6.12)
where ax is the axial ratio including sign for right- or left-handed polarization. Itsvalues are between −1 and 1. When it is ±1 the polarization circular and whenit is 0 we have linear polarization. Positive ax means that the polarization is left-handed and negative ax means right-handed polarization. Note the similaritieswith σz in equation (3.49). Also note that when θ0 = 0, the element in the z di-rection should have zero current (J3 = 0) and the antenna degenerates to a crosseddipole antenna.
54

7RESULTS
Here we present a comprehensive set of modeling results for various types of an-tenna arrays and different combinations of OAM. We start off by simulating fieldswith OAM properties and linear polarization. Then we simulate fields with OAMproperties and elliptic polarization. Several types of elements are used includingtripole antennas. All the simulations are performed in the far field region.
7.1 Electromagnetic beam with orbital angular momentum
7.1.1 Grid
In this section we have used the “Equidistant circular grid” (EDCG) antenna con-figuration, shown in figure 6.1b. We have used two rings. The first ring contains8 elements and the second 16 elements. The elements used here are dipoles, withtheir orientation in the y direction, according to figure 6.1b, this yields a linearlypolarized field. The grid is placed 2.5 m over ground. The frequency used in thiscompilation is 27.3 MHz, corresponding to a vacuum wavelength of 11 m. Theradius for the inner ring is 10 m and for the outer 20 m. The circle sector distancebetween consecutive elements in each ring is 7.85 m.
55

CHAPTER 7. RESULTS
7.1.2 The relative offset in the phase between the elements
The field generated should have a relative offset in the phase of lϕ, in resemblancewith the Laguerre-Gaussian beam, where the variable l stands for the orbital an-gular momentum number of the beam. By applying this directly to the array wewill get a discrete distribution, which will introduce some physical limitations.The phase in each element will therefore be given by lϕmn, for element mn. Wehave used the x axis as reference for the angle ϕ.
7.1.3 Intensity
In figure 7.2 the fields obtained from the 4nec2 software package are shown. Fig-ure 7.2a shows the field when all the elements have the same phase. In figure 7.2b- 7.2d the fields with l = 1, l = 2 and l = 4 are shown. In figure 3.2 the intensityprofiles for Laguerre-Gaussian beams are shown for different orbital angular mo-menta. By comparing these profiles to the field obtained from 4nec2 we see aresemblance. The fields representing beams carrying OAM have a characteristicintensity minimum in the center of the beam and for higher values of l the beamwidens. This is all in agreement with the optical case. In the last figure, figure7.2d, one weakness of this array is shown. Since the inner ring only contains 8 el-ements it will yield the intensity irregularities shown, there are 8 intensity spikesshown originating from the 8 inner ring antennas. To resolve this, more anten-nas could be added in the inner ring. With 8 antennas the maximum l that couldbe identified with certainty would actually be 3, so in a way the antenna array isworking outside its bounds.
7.1.4 Phase shifts in the main beam
By post-processing the output data from 4nec2, we have obtained the phase shiftsover the generated electric fields. The main interest is the main lobe. The sidelobes can be minimized by manipulating the arrays, for instance with more rings,different distances to ground and different radii. From figure 7.1 we obtain thebeamwidth for the main lobe for each of the fields shown in figure 7.2. In figure7.3 we can the see schematic pictures of how the phase differs in the main lobe, fordifferent l. The phase is represented by the angle each arrow have, with the x axisas reference. In figure 3.6 and 5.1 cross sections for Laguerre-Gaussian beams areshown, and one can see that the phase shifts in the radio beams generated here are
56

7.1. EM-BEAM WITH OAM
(a) l = 0 (b) l = 1
(c) l = 2 (d) l = 4
Figure 7.1: Two-dimensional field gain patterns for the fields in figure7.2.
the same. In the figures one can see that the phase in the radio beams is constanton radial rays from the center of the beam, which is also the case, as one can seein figure 3.6 and 5.1, for LG beams.
57

CHAPTER 7. RESULTS
(a) l = 0
(b) l = 1
Figure 7.2: Field gain generated by a EDCG for different values of l.
58

7.1. EM-BEAM WITH OAM
(c) l = 2
(d) l = 4
Figure 7.2: Field gain generated by a EDCG for different values of l.
59
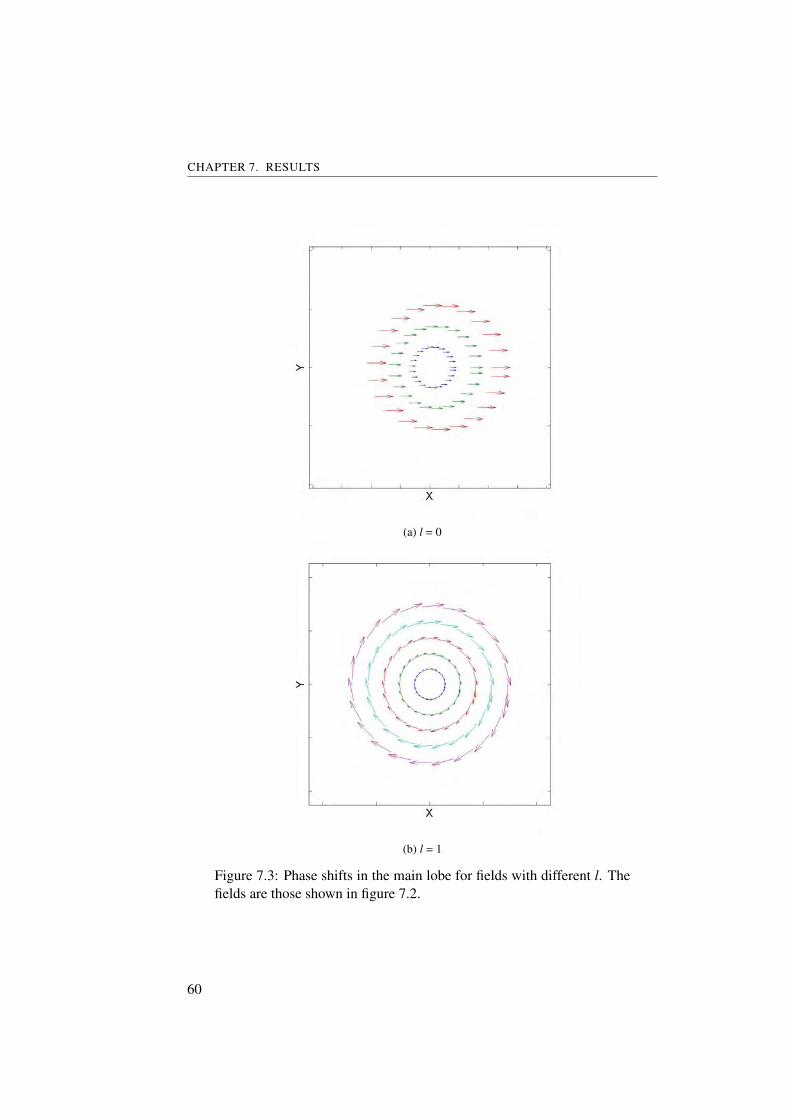
CHAPTER 7. RESULTS
(a) l = 0
(b) l = 1
Figure 7.3: Phase shifts in the main lobe for fields with different l. Thefields are those shown in figure 7.2.
60

7.1. EM-BEAM WITH OAM
(c) l = 2
(d) l = 4
Figure 7.3: Phase shifts, in the main lobe, for fields with different l. Thefields are those shown in figure 7.2.
61

CHAPTER 7. RESULTS
(a) l = 0
(b) l = 1
Figure 7.4: Electric fields in the main lobe for different l. Same fields asthose shown in figure 7.2.
62

7.1. EM-BEAM WITH OAM
(c) l = 2
(d) l = 4
Figure 7.4: The electric fields, in the main lobe, for different l. Samefields as those shown in figure 7.2.
63

CHAPTER 7. RESULTS
7.1.5 The electric field
From the output data one can also obtain the electric field. The fields are projecteddown on a plane perpendicular to the axis of propagation, 7.4. In the figure onecan see the strength of the field in each location and its direction. The strength isonly comparable to the electric field in the same ring, same color. As we hopedthe electric field is linear, meaning that the only angular momentum in these fieldwill originate from the phase shift; not the polarization.
7.2 Multiple beam interference
7.2.1 Grid
The same antenna configuration as in the previous section is used here, the socalled EDCG, shown in figure 6.1b. The inner ring contains 8 elements and theouter 16 elements. The elements used here are dipoles with a length of 1 m„orientated in the y direction according to figure 6.1b, which should yield a linearlypolarized field. The grid is placed 2.5 m over ground. The frequency used in thiscompilation is 15 MHz, corresponding to a vacuum wavelength, λ, of 20 m. Theradius for the inner ring is 10 m and for the outer 20 m. The circle sector distancebetween consecutive elements in each ring is 7.85 m, corresponding to 0.3925 λ.
7.2.2 The relative offset in the phase between the elements
To obtain interference between beams with different values of l we use an EDCGwith two rings. In the first ring, m = 1, we have a phase shift of l1ϕmn and on theouter, m = 2, we have a phase shift of l2ϕ2n. The variables l1 and l2 stands forthe relative phase offset factor for each ring, which corresponds to the l numberin the Laguerre-Gaussian beams. The x axis is used as a reference for the phaseshift. These patterns are shown in figure 7.5 for the different combinations of l1and l2. The patterns for the interference using the Laguerre-Gaussian beams arealso shown in the same figure. One can notice a distinct resemblance between theintensity for the beams generated in the optical domain and the beams generatedin the radio domain. These intensity patterns would be hard to obtain withoutthe information about beams carrying OAM. Multiple beam interference could beused to shape and direct the beam. For example the interference between l = 2
64

7.3. ROTATION OF THE MAIN LOBE
and l = 4 could be used for scanning on both sides of an object, at the same time,with one single beam.
7.3 Rotation of the main lobe
7.3.1 Grid
In this section the antenna array EDCG shown in figure 6.1b is used. We havetwo antenna rings. The first ring contains 8 elements, and the second 16 elements.The elements used here are dipoles with a length of 1 m, with orientation in the ydirection, according to figure 6.1b, which should yield a linearly polarized field.The grid is placed 2.5 m over ground. The frequency used in this compilationis 15 MHz, corresponding to a vacuum wavelength, λ, of 20 m. The radius forthe inner ring is 10 m and for the outer 20 m. The circle sector distance betweenconsecutive elements in each ring is 7.85 m, corresponding to 0.3925 λ.
7.3.2 The relative offset in the phase between the elements
Here the interference beam of l1 = 1 and l2 = 2 is used. The procedure for thiswas presented in the previous section. In the first ring we have a relative offset inthe phase of l1ϕmn and on the outer we have a offset of l2ϕmn −φ. The variable φis a rotation angle, which is varied. The variables l1 and l2 stands for the phaseshift factor for each ring, which corresponds to the orbital angular momentum inthe Laguerre-Gaussian beam. The x axis is used as a reference for the angle.
7.3.3 Intensity in the main beam
In figure 7.6 the intensity field, given by 4nec2, is shown for different φ. In thesefigures one can see how the main lobe rotates when φ is varied. This gives a wayof rotating the beam without any mechanical devices.
65

CHAPTER 7. RESULTS
(a) l = 1 and l = 2 (b) l = 1 and l = 2
(c) l = 1 and l = 4 (d) l = 1 and l = 4
(e) l = 2 and l = 4 (f) l = 2 and l = 4
Figure 7.5: The figures show the intensity for two-beam interference.The l values of the interfering beams are shown below each picture. Thepictures to the left shows the intensity pattern generated by antennasand the pictures to the right shows the intensity pattern generated byLaguerre-Gaussian beams.
66

7.3. ROTATION OF THE MAIN LOBE
(a) φ = 0 (b) φ = 45
(c) φ = 90 (d) φ = 135
(e) φ = 180 (f) φ = 225
(g) φ = 270 (h) φ = 315
Figure 7.6: Rotation of the main lobe for the mixed state l = 1 and l = 2.The phase shift for the outer ring is given by l2ϕ−φ.
67

CHAPTER 7. RESULTS
7.4 Five-element crossed dipole array
We start with an array with five small tripole elements operating at 300 MHzsituated λ/100 over perfect ground. The radius of the array circle is a = λ/5. Totransmit with the z axis as symmetry axis we use equations (6.10) to (6.12) withθ0 = 0, ϕ0 = 0 and ax=±1 to calculate the currents. To do this we use the programtripole.m which, for a circular array, calculates the phases and amplitudes in anynumber of tripole elements for all possible l, directions and polarizations. Theelement in the z direction should have zero current while the two other should haveequal amplitude but be shifted π/2 in phase. Since the current in the z directedelement is zero we can consider the antenna as two crossed dipoles, if we neglectthe small effect that the third element would still have. This effect is very smallsince the coupling between elements in the tripole is small [19]. When using anarray with N number of elements the magnitude of the highest eigenvalue , lmax,resolvable can be calculated with the equation
|lmax| <N2. (7.1)
When using an array with five elements, we should in other words be able to havevalues of l between minus two and plus two, so those values are the ones weconsider.
7.4.1 Left-hand polarization
We start with left-hand polarization i.e. ax = 1 when we calculate the currents.When plotting the electric field vector projected on a plane normal to the z axis theresults for l = 1 and l = 2 can be seen in figure 7.7. Each ring of vectors representsa step of θ = 5 and the outer ring is where θ = 60. Note that the vectors are scaledso that they do not intersect in the figure. This means that the lengths of the vectorsare not the real length representing the electric field amplitude. However, in eachindividual ring, the vectors are scaled by the same constant and their lengths canbe compared. The expected result is that when going around one ring the vectorshould complete l rotations. We see that this is true for most θ and we can alsosee that for one ϕ the vectors are in phase with each other. So it looks like thephase behavior of the beam is, as expected, depending on lϕ. This can be seenmore clearly if we instead plot the (spatial) phases of the electric field vectors infigure 7.8. Comparing the phase behavior to the pictures of the theoretical phase
68

7.4. FIVE-ELEMENT CROSSED DIPOLE ARRAY
behavior in beam cross sections from chapter 3 we see that our results are indeedvery promising, at least when θ is not too large. This is better seen in figure 7.9where the phase fronts are zoomed in so the largest θ equals 65. In these figuresthe expected result is that the phase should go from 0 (blue) to 2π (red) l timeswhen rotating a full circle.
We can also look at the intensity pattern in a plane of the beam and compareit to the results derived from the Laguerre-Gaussian beams from chapter 3. Theseare compared in figure 7.10 and 7.11. The results are very good for l = ±1 and 0but not so good for l = ±2 where there are spots rather than rings of intensity. Thisis most likely because of the small number of antenna elements in the array. Justas for the LG beam the radius of the rings (if we consider the spots in the l = 2beam as parts of a ring) increases with increasing l. The reason that the l = 0 beamhas an intensity minimum in the middle is in the MATLAB code. In reality thereis a maximum there.
As described in chapter 3, according to Allen et al. [3] the ratio of the z com-ponent of the angular momentum, Jz, to the energy, U, is proportional to l, orJz/U = (l+ ax)/ω. Calculating the time averaged ratio Jz/U for different l andplotting the results gives the points in figure 7.12. Note that our numerical cal-culations are not an integration in a volume but a summation on a surface. Thelinear dependence should however be preserved.
The result clearly shows a linear dependence, at least when we consider eitherpositive or negative l. For some reason negative values of l do not give negativevalues of Jz/U as expected and therefore this requires some further investigations.The sign of l seems to be undetectable. We can also see that the difference betweenright and left-handed polarization is very small. Looking at the equation Jz/U =(l+ ax)/ω one would expect that the difference between the two polarizationswould be on the same order as the difference between two consecutive l values.Ideally, ax = ±1 in whole the beam but generally that is only true in the directionwhere the beam is directed, here θ,ϕ = 0, but the magnitude of the mean value ofax is still about 0.55 to 0.61 in the beam. So one could expect that for l = 0, thedifference in Jz/U between right and left-hand polarization would be 2ax, aboutthe same as the difference in Jz/U between for instance l = 0 and l = 1 for one ofthe polarizations. Since this is not the case we are not sure whether the orientationof the polarization is detectable with this method. It looks like what we have issomething like Jz/U = (|l|+ |ax|)/ω.
69

CHAPTER 7. RESULTS
(a) l = 1
(b) l = 2
Figure 7.7: Electric field vectors in left-hand polarized l = 1 and l = 2beams projected onto a plane normal to the z axis. Fields created with afive-element antenna array.
70

7.4. FIVE-ELEMENT CROSSED DIPOLE ARRAY
Figure 7.8: Phases of left-hand polarized beam produced by a five-element antenna array. Eigenvalues l = −2, l = −1, l = 0, l = 1 and l = 2from top left. Value of phases are in radians going from 0 (blue) to 2π(red).
71

CHAPTER 7. RESULTS
Figure 7.9: Phases of left-hand polarized beam produced by a five-element antenna array. Eigenvalues l = −2, l = −1, l = 0, l = 1 and l = 2from top left. Value of phases are in radians going from 0 (blue) to 2π(red). Largest θ = 65.
7.4.2 Right-hand polarization
To obtain right-hand polarization we calculate the currents using ax = −1. Weonce again start with, for l = 1 and l = 2, plotting the electric field vectors ina plane normal to the z axis in figure 7.13. The angular distance between therings is as before 5 and the limits are θ = 60. Again, the length of vectors indifferent rings are scaled with different constants to prevent overlapping. Just likefor left-handed polarization the vectors complete l rotations when going aroundthe beam but they now rotate in counterclockwise direction instead of clockwise(when moving in positive ϕ direction). In figure 7.14 and 7.15 the phases areplotted. Once again we see that the phase behavior is good for not too big θ.If we compare the results for left- and right-handed polarization we see that thedirection of rotation for the phase fronts are opposite. For right-hand polarizationthe phase increases when ϕ increases for positive l, whereas the phase decreases
72

7.5. TEN-ELEMENT CROSSED DIPOLE ARRAY
Figure 7.10: Intensity patterns for a five-element antenna array. Eigen-values l = 0 (left), l = 1 (middle) and l = 2 (right). Linear scale in the toprow and dB scale in the bottom row.
with increasing ϕ for left-hand polarization.The intensity patterns turn out to be very similar to the left-hand polarized
wave intensity patterns so they are not presented here.The results for Jz/U are presented in figure 7.12 and are discussed together
with the left-hand polarized beam.
7.5 Ten-element crossed dipole array
By using ten instead of five elements we can, according to equation (7.1), use lnumbers up to four. Now we consider a circular array with radius a = λ situatedλ/10 over ground. Once again the frequency is 300 MHz and we aim the beam inthe direction where θ and ϕ both equals zero. We use the same equations as forthe five-element array to obtain the currents and phases.
73

CHAPTER 7. RESULTS
Figure 7.11: Intensities of an LG beam. Eigenvalues l = 0 (left), l = 1(middle) and l = 2 (right). Linear scale in the top row and dB scale inthe bottom row.
7.5.1 Left-hand polarization
Once again we start with ax = 1 to obtain a left-hand polarized beam and examinethe phase behavior. The results are presented in figure 7.16. The pattern looksas expected. However, we can see that there are discontinuities in most of thefigures. This is because the increase of the array radius, a, which has resulted in anarrower main lobe and more pronounced minor lobes. The phase in these minorlobes are, as we can see, shifted in the ϕ direction.
By making the array radius smaller (here equal to λ/2) we can decrease theminor lobes and increase the beamwidth of the main lobe. In figure 7.17 we seethat the phase behavior is much better. Note that these phases belong to right-handpolarized beams.
In figure 7.18 the intensity patterns of beams produced by the ten-elementarray are displayed. The patterns are as expected and as l increases we see thatthe ring radii increase. We notice that the pattern for the l = 2 beam is much better
74

7.5. TEN-ELEMENT CROSSED DIPOLE ARRAY
Figure 7.12: The ratio Jz/U in beams with different eigenvalues l pro-duced by a five-element antenna array. The left-hand polarized wave ismarked in red; right-hand polarized wave is marked in blue.
than the one obtained from the five-element array. When l increases we see thatthe intensities change from rings to spots. Once again, this is most likely an effectcaused by the limited number of antennas.
We plot the ratio Jz/U in figure 7.19. Once again we see that there seems tobe a linear dependence. However we can once again note that there appears tobe problems separating the polarizations and the signs of l. To us, a dependenceJz/U = |(|l|+ |ax|)/ω| seems to hold.
75

CHAPTER 7. RESULTS
(a) l = 1
(b) l = 2
Figure 7.13: Electric field vectors in right-hand polarized l = 1 and l = 2beams projected onto a plane normal to the z axis. Fields produced by afive-element antenna array.
76

7.5. TEN-ELEMENT CROSSED DIPOLE ARRAY
Figure 7.14: Phases of right-hand polarized beam produced by a five-element antenna array. Eigenvalues l = −2, l = −1, l = 0, l = 1 and l = 2from top left. Value of phases are in radians going from 0 (blue) to 2π(red).
77

CHAPTER 7. RESULTS
Figure 7.15: Phases of right-hand polarized beam produced by a five-element antenna array. Eigenvalues l = −2, l = −1, l = 0, l = 1 and l = 2from top left. Value of phases are in radians going from 0 (blue) to 2π(red). Largest θ = 65.
7.5.2 Right-hand polarization
To obtain right-hand polarization, we use ax = −1 in equations 6.10 to 6.12 to findthe currents.
As for the five-element array the results looks similar to the left-hand polar-ized beam (except the reverse rotations in the phase discussed in the five-elementarray section) and the only result we present in this report is therefore the ratio ofz directed angular momentum to energy found in figure 7.19 and the phase patternfrom an array with radius λ/2 in figure 7.17.
78

7.5. TEN-ELEMENT CROSSED DIPOLE ARRAY
Figure 7.16: Phases of left-hand polarized beams produced by a ten-element antenna array. Eigenvalues going from l = −4 (top left) to l = 4(bottom right). Value of phases are in radians going from 0 (blue) to 2π(red). Largest θ = 65.
79

CHAPTER 7. RESULTS
Figure 7.17: Phases in right-hand polarized beams with eigenvalues go-ing from l = 0 to l = 4 produced by a ten-element antenna array withradius a = λ/2. The value of the phases going from 0 (blue) to 2π (red).Largest θ = 65.
7.6 Five-element tripole array
When one needs to point the beam in a direction other than the z axis, a tripoleantenna is preferred. The tripole has namely the advantage that the orthogonalantenna currents can be viewed as the x, y, and z components of an antenna currentvector j. By choosing appropriate values of these three current components, theresulting j can therefore be pointed along any given direction in space. Hence,a tripole antenna with short elements approximates an electric dipole momentvector p which can be pointed in any direction. To transmit beams with differentl values, the tripole is absolutely essential since we cannot control the direction ofthe beam with dipoles or crossed dipoles which are fixed in space along a line orin a plane and still maintain the wanted lϕ phase dependence because the phase
80

7.6. FIVE-ELEMENT TRIPOLE ARRAY
Figure 7.18: Intensity patterns produced by a ten-element antenna array.In the two top rows the scale is linear. Plotted are beams with eigenvaluel going from l = 0 (first row, left) to l = 4 (second row, middle). In thetwo bottom rows the scale is in dB with the placing corresponding to thetop rows.
81

CHAPTER 7. RESULTS
Figure 7.19: The ratio Jz/U in beams with different eigenvalues l pro-duced by a ten-element antenna array. Left-hand polarized wave ismarked in red; right-hand polarized wave is marked in blue.
difference between the elements is used to direct the beam! This is of courseprovided that we do not physically move the antennas which would be extremelyunpractical. Since we want the lϕ phase dependence in the beam in a plane normalto the beam symmetry axis, we introduce a coordinate system where z′ is directedin the (θ0,ϕ0) direction and ϕ′ circles in a plane normal to z′. The desired phasedependence can then be written as lϕ′.
82

7.6. FIVE-ELEMENT TRIPOLE ARRAY
7.6.1 Tripole compared to crossed dipole
We start by comparing the five-element crossed dipole array to the tripole. Wechoose to point a left-hand circularly polarized beam in the direction (θ0 = 45,ϕ0 = 0). The only possible l value is, as mentioned, zero. In figure 7.20 wehave compared the performance of three different configurations; the five-elementcrossed dipole array, one single tripole antenna and an array of five tripole anten-nas. The beam from the crossed dipole array is pointed in the direction (θ0,ϕ0)with the phase excitation
αn = −kan sinθ0 cos(ϕn−ϕ0) (7.2)
where αn is the phase excitation in the nth element orientated at an angle ϕn.For the tripoles we use the same equation for the phase difference between theelements but we also point each element according to equations (6.10) to (6.12).
What we see is that the crossed dipole array is not even capable of producingthe maximum gain in the desired θ direction! The maximum gain, which is 4.1 dB,is instead in the θ = 26 direction while in the desired direction the gain is 3.5 dB.The tripole can, as we see in figure 7.20b point the beam in the desired directionusing only one element. To obtain higher gain and to be able to have an lϕ′
phase dependence in the beam we use an array of several antennas. With the five-element tripole array we see that we still have maximum radiation in the desireddirection and the gain is now 5.0 dB. Our conclusion is that the tripole antenna issuperior to the crossed dipole when we want to point the beam in directions otherthan vertical (θ0 = 0).
7.6.2 Beam with orbital angular momentum produced by tripole antennas
Using a five-element array with tripoles we are able to create beams with differentl directed in other directions than along the z axis. To do this we use the programtripole.m to calculate currents and phases in the elements. The currents and phasesin each tripole is first obtained by using equations (6.10) to (6.12). Then we usethe equation
αn = lϕn− k an sinθ0 cos(ϕn−ϕ0) (7.3)
to obtain the phase excitation in the nth element. We then add this phase exci-tation to each phase obtained with the equations (6.10) to (6.12). This will give
83

CHAPTER 7. RESULTS
(a) Crossed dipole array (b) Single tripole
(c) Tripole array
Figure 7.20: Left-hand gains for a five-element crossed dipole array,one single tripole and a five-element tripole array. Each configuration ispointed so that maximum radiation should occur in the (θ0 = 45, ϕ0 = 0)direction. All beams are with eigenvalue l = 0.
84

7.6. FIVE-ELEMENT TRIPOLE ARRAY
us a beam with the symmetry axis z′ in the (θ0, ϕ0) direction and an lϕ′ phasedependence where ϕ′ circles in a plane normal to z′.
We have performed these tests for two different directions, one where θ0 issmall and one with a larger θ0.
In figure 7.21 we see the results from the case where the beam symmetry axisis directed in the (θ0 = 10, ϕ0 = 40) direction. The patterns show the gain forthe desired polarization. As we can see, the pattern is very similar to the patternsshown in figures 7.2a to 7.2c but the beams are directed in an other direction.Note that the difference in similarities are also because of the difference in thebasic shape of the arrays, a better comparison would be with the patterns createdwith the five-element crossed dipole antenna but they are not presented in thisreport. If we compare figure 7.21c and 7.21d, we see that the pattern is moresymmetric in free space than when using a ground plane.
The program for plotting the phase in the beam is designed for beams pointedalong the z axis. So, from a practical point of view, other directions are morecomplicated because of how the data in NEC output files are sorted. But sinceθ0 is rather small we can use the program to look at a good approximation of thephase behavior in the beams. The result is presented in figure 7.22. We find thatthe phase behaves just as it should in all beams and we can expect them to carryorbital angular momentum.
If we point our beam with a larger angle between z and z′ we see that theresulting patterns become more unsymmetric, especially when using a groundplane. In figure 7.23 we can see the left-hand gain patterns for beams pointed inthe (θ0 = 45,ϕ0 = 0) direction. Now we find that the ground effects are largerfor all beams, and even in free space the pattern does not look good at all for thebeam with eigenvalue l = 2.
Our conclusion is that there are two main reasons why the beams becomemore unsymmetric when θ0 increases. First of all, there are effects caused by theground plane, but we have seen that even in free space the beams are deformed.If we study the array factor we find the other reason. In a beam pointed normalto the array, the array factor is, with enough elements, symmetric in each ϕ plane.That means that if we move an angle dθ from θ0 in positive or negative directionthe array factor will be equal in those two points. In mathematical terms
AF(θ0+dθ,ϕ) = AF(θ0−dθ,ϕ), (7.4)
for all ϕ.
85

CHAPTER 7. RESULTS
(a) l = 0 (b) l = 1
(c) l = 2 (d) l = 2 in free space
Figure 7.21: Left-hand gains of beams produced by a five-elementtripole array pointed in the (θ0 = 10, ϕ0 = 40) direction. The beam witheigenvalue l = 2 is shown with and without ground plane.
If we point the beam in any other direction (except multiples of θ0 = 90)the symmetry condition in equation (7.4) is generally not fulfilled, and thereforethe beams will not be as symmetric. The symmetry gets worse as θ0 increases.In figure 7.24 this can be seen for a five-element circular array pointed in threedifferent θ0 directions. In figure 7.24b we can see that for θ0 = 30 the patternis reasonably symmetric even for large dθ, but when θ0 = 45 the beam becomeless symmetric. These plots are for beams without an lϕ phase dependence. With lgreater than zero, AF is more complicated and therefore more sensitive to changesin θ.
The effect of the unsymmetric array factor can be seen if we look at our beamsproduced by tripole antennas in figure 7.20b and 7.20c. We see that the beam from
86

7.7. TEN-ELEMENT TRIPOLE ARRAY
Figure 7.22: Phase pattern approximations in beams pointed in the (θ0 =
10, ϕ0 = 40) direction. Shown are beams with eigenvalues runningfrom l = 0 (left) to l = 2 (right). The values of the phases are in radiansrunning from 0 (blue) to 2π (red). Largest θ = 65.
the array is not as symmetric as the one from the single tripole antenna.Another reason for the beam deformation is that when looking at the circular
array from a direction other than its normal it changes to an ellipse and thereforethe beam transmitted in that direction is not circularly symmetric. However, byusing an elliptic array in our numerical simulations and examining the beamscreated we have not noticed any significant difference. The elliptic array had theshape of an circle projected onto a plane at an angle 45 from the circle.
7.7 Ten-element tripole array
Just as for the crossed dipole array we double the number of elements in the arrayso that we have ten instead of five. We use ax = 1 to obtain left-hand polarizationand calculate the currents and phases using the program tripole.m. In figure 7.25we can see the left-hand gains from beams pointed in the (θ0 = 45, ϕ0 = 0)direction from two different ten-element arrays with different radii; one wherea = λ/5 and one where a = λ/2.
As expected, we find that using more elements in the array improves the pat-tern. For l = 1, the symmetry in the beam is improved a bit compared to the beamin figure 7.23d, especially when using the larger array radius. For l = 2 there is asignificant difference. When using the larger array, the pattern looks fairly sym-metric and we find a minimum in the desired direction which was not the case in
87
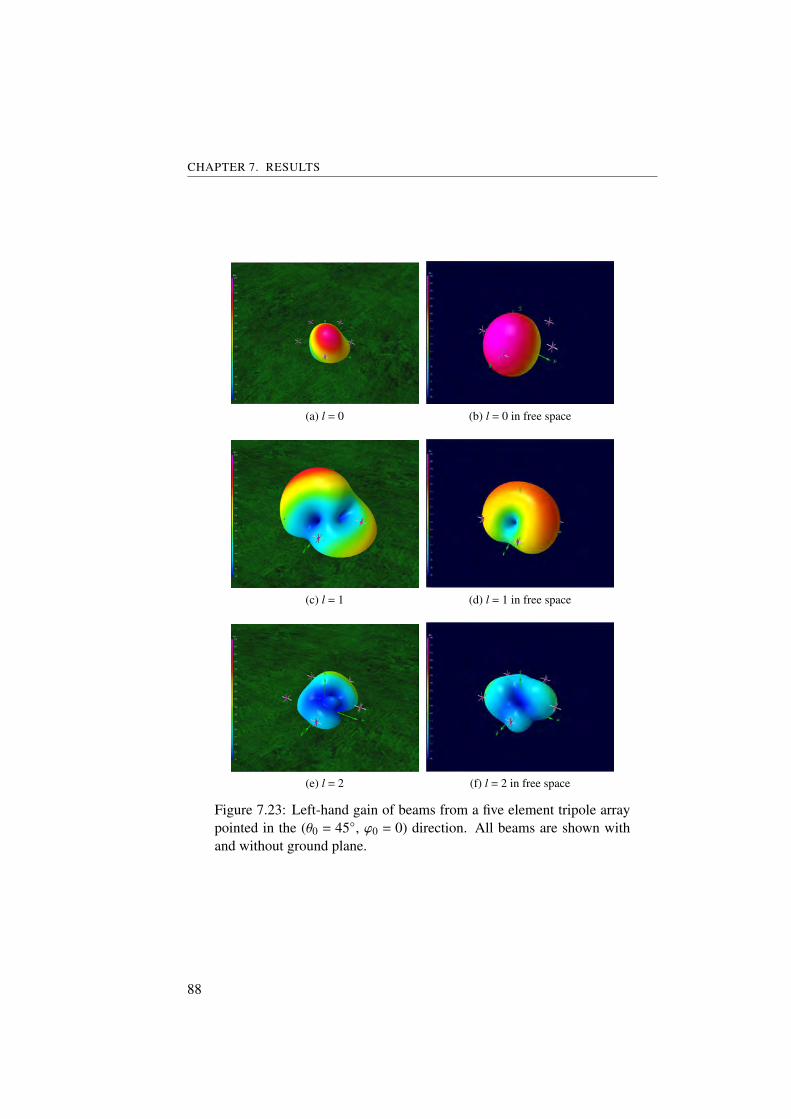
CHAPTER 7. RESULTS
(a) l = 0 (b) l = 0 in free space
(c) l = 1 (d) l = 1 in free space
(e) l = 2 (f) l = 2 in free space
Figure 7.23: Left-hand gain of beams from a five element tripole arraypointed in the (θ0 = 45, ϕ0 = 0) direction. All beams are shown withand without ground plane.
88

7.7. TEN-ELEMENT TRIPOLE ARRAY
(a) θ0 = 0 (b) θ0 = 30
(c) θ0 = 45
Figure 7.24: Directivity for a circular five-element array calculated forthree different θ0. The angle ϕ equals zero in all plots.
the five element array pattern shown in figure 7.23f. We even find that for l = 3the pattern from the ten-element array is better than from the five element arraywith l = 2.
If we point our beam with a smaller angle θ0 the pattern should be more sym-metric. In figure 7.26 the pattern for a beam with l = 4, which is the worst casescenario beam, is shown together with its phase pattern. Again, the program forplotting the phases are designed for beams pointed in the (θ0 = 0, ϕ0 = 0) direc-tion, but for small θ0 we can use it as an approximation.
What we find is that the pattern is deformed, but the basic shape is still visibleand the minimum is in the right direction. From figure 7.26b we find that there isan lϕ phase dependence in the beam, which, considering that θ0 is small, indicatesan lϕ′ phase dependence.
89

CHAPTER 7. RESULTS
(a) l = 1, a = λ/5 (b) l = 1, a = λ/2
(c) l = 2, a = λ/5 (d) l = 2, a = λ/2
(e) l = 3, a = λ/2
Figure 7.25: Left-hand gain of beams from two different ten-elementtripole arrays pointed in the (θ0 = 45, ϕ0 = 0) direction. All patternsare evaluated in free-space.
90
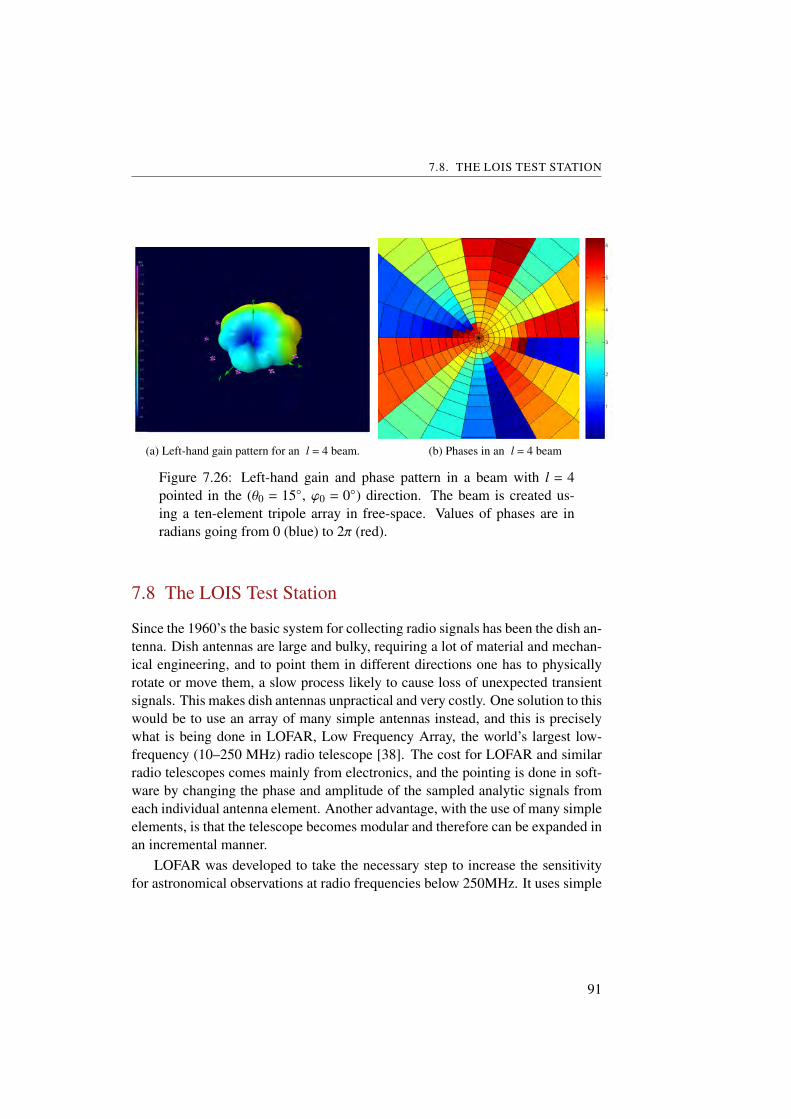
7.8. THE LOIS TEST STATION
(a) Left-hand gain pattern for an l = 4 beam. (b) Phases in an l = 4 beam
Figure 7.26: Left-hand gain and phase pattern in a beam with l = 4pointed in the (θ0 = 15, ϕ0 = 0) direction. The beam is created us-ing a ten-element tripole array in free-space. Values of phases are inradians going from 0 (blue) to 2π (red).
7.8 The LOIS Test Station
Since the 1960’s the basic system for collecting radio signals has been the dish an-tenna. Dish antennas are large and bulky, requiring a lot of material and mechan-ical engineering, and to point them in different directions one has to physicallyrotate or move them, a slow process likely to cause loss of unexpected transientsignals. This makes dish antennas unpractical and very costly. One solution to thiswould be to use an array of many simple antennas instead, and this is preciselywhat is being done in LOFAR, Low Frequency Array, the world’s largest low-frequency (10–250 MHz) radio telescope [38]. The cost for LOFAR and similarradio telescopes comes mainly from electronics, and the pointing is done in soft-ware by changing the phase and amplitude of the sampled analytic signals fromeach individual antenna element. Another advantage, with the use of many simpleelements, is that the telescope becomes modular and therefore can be expanded inan incremental manner.
LOFAR was developed to take the necessary step to increase the sensitivityfor astronomical observations at radio frequencies below 250MHz. It uses simple
91
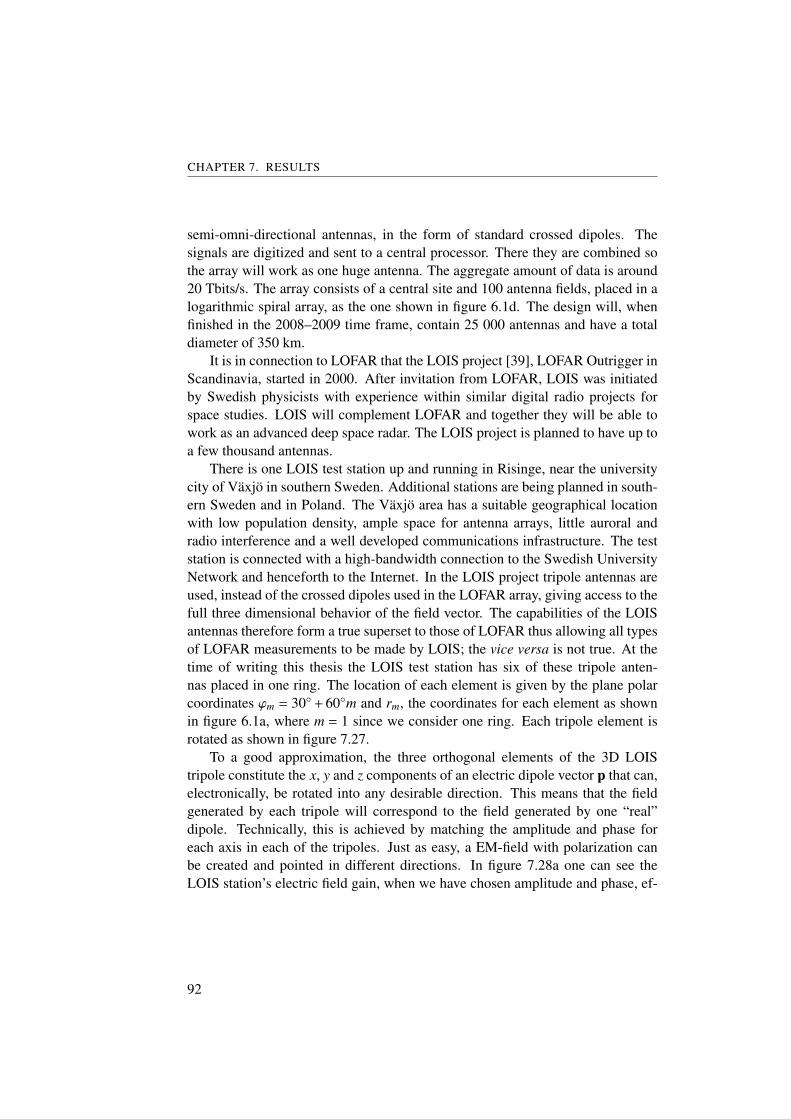
CHAPTER 7. RESULTS
semi-omni-directional antennas, in the form of standard crossed dipoles. Thesignals are digitized and sent to a central processor. There they are combined sothe array will work as one huge antenna. The aggregate amount of data is around20 Tbits/s. The array consists of a central site and 100 antenna fields, placed in alogarithmic spiral array, as the one shown in figure 6.1d. The design will, whenfinished in the 2008–2009 time frame, contain 25 000 antennas and have a totaldiameter of 350 km.
It is in connection to LOFAR that the LOIS project [39], LOFAR Outrigger inScandinavia, started in 2000. After invitation from LOFAR, LOIS was initiatedby Swedish physicists with experience within similar digital radio projects forspace studies. LOIS will complement LOFAR and together they will be able towork as an advanced deep space radar. The LOIS project is planned to have up toa few thousand antennas.
There is one LOIS test station up and running in Risinge, near the universitycity of Växjö in southern Sweden. Additional stations are being planned in south-ern Sweden and in Poland. The Växjö area has a suitable geographical locationwith low population density, ample space for antenna arrays, little auroral andradio interference and a well developed communications infrastructure. The teststation is connected with a high-bandwidth connection to the Swedish UniversityNetwork and henceforth to the Internet. In the LOIS project tripole antennas areused, instead of the crossed dipoles used in the LOFAR array, giving access to thefull three dimensional behavior of the field vector. The capabilities of the LOISantennas therefore form a true superset to those of LOFAR thus allowing all typesof LOFAR measurements to be made by LOIS; the vice versa is not true. At thetime of writing this thesis the LOIS test station has six of these tripole anten-nas placed in one ring. The location of each element is given by the plane polarcoordinates ϕm = 30 + 60m and rm, the coordinates for each element as shownin figure 6.1a, where m = 1 since we consider one ring. Each tripole element isrotated as shown in figure 7.27.
To a good approximation, the three orthogonal elements of the 3D LOIStripole constitute the x, y and z components of an electric dipole vector p that can,electronically, be rotated into any desirable direction. This means that the fieldgenerated by each tripole will correspond to the field generated by one “real”dipole. Technically, this is achieved by matching the amplitude and phase foreach axis in each of the tripoles. Just as easy, a EM-field with polarization canbe created and pointed in different directions. In figure 7.28a one can see theLOIS station’s electric field gain, when we have chosen amplitude and phase, ef-
92

7.8. THE LOIS TEST STATION
Figure 7.27: The LOIS tripole consists of three mutually orthogonal,short, active electric dipoles with co-located midpoints (feed points).Each tripole structure is mounted in a configuration that is fully sym-metric relative to the ground, with the center of the structure roughly2.5 m above ground.
fectively have a moment vector, p, in the xy plane (as for the LOFAR antennas)directed along the x axis. In figure 7.28b the same dipoles are presented but wehave a relative phase offset between the elements that would correspond to l = 1,generating a field with the characteristic minimum along the axis of propagation,the z axis.
93

CHAPTER 7. RESULTS
(a) l = 0
(b) l = 1
Figure 7.28: Antenna patterns calculated for the LOIS Risinge station, asix-element tripole test array. The elements have such a internal relativephase relationship that they comprise a single electric dipole momentvector, p, in the xy plane, directed along the x axis. In the first figure,all the elements have the same phase. In the second figure, the phasedifference between the elements corresponds to l = 1. This generates thecharacteristics of a beam carrying OAM.
94
8DISCUSSION
8.1 Radio astronomy and space physics applications
The technique of applying OAM to radio beams opens up for some very inter-esting and powerful applications. First of all, the antenna patterns produced canbe useful because of their basic shapes. If, for example, we want to observe thesolar corona but not the Sun itself, the ring pattern from a beam with OAM isideal since the intensity minimum in the center of the beam could be placed overthe sun and the rest of the beam over its corona. The pattern of a beam withOAM shown in figure 7.1 has two different beamwidths. First, we have the innerwidth, which is characterized by the angle between two points of equal gain lo-cated inside the maximum radiation angle. The other width is the angle betweentwo points of equal gain located outside the maximum radiation angle. Usingthese definitions in figure 8.1, one observes that the two half-power beamwidths,HPBW, are HPBW inner
l = 36 and HPBWouterl = 124, representing inner or outer
widths, respectively, for a beam eigenvalue l 6= 0.In a solar radio or radar experiment [34, 35] where we want to have HPBW inner
lat the solar surface, we need to find an array which can produce an l 6= 0 beam withHPBW inner
l = 0.53 (if our array is situated 1 AU from the Sun). Comparing ourpatterns in previous chapters, we find that HPBW inner
1 ≈ 3/4×HPBWl=0. Thismeans that the array size needed is about the same size as an array which canproduce an l = 0 beam with HPBW = 4/3×HPBW inner
1 = 0.71. If, for simplic-ity, we assume that the antenna array is a M×N square, we can approximate thearray size with that of linear, uniform, broadside array for which the HPBW can
95

CHAPTER 8. DISCUSSION
Figure 8.1: Half-power beamwidths of a beam with eigenvalue l = 1.
be calculated from the formula [5]
HPBW = 2[π/2− cos−1
(1.391λπNd
)](8.1)
where λ is the wavelength used, d the distance between elements and N is thenumber of elements. With HPBW = 0.71, we find that N d = 71λ. In otherwords, the size of the array is equal to 71 times the wavelength used. This meansthat if we operate at the frequency f = 10 MHz the size of the array would haveto be about 2.1 km but that for f = 100 MHz, an array size of 210 m will suffice.Similarly one could block out a star and search for weaker radio sources, such asexoplanets, near it.
The OAM radio technique may also be used in other astrophysical applica-tions as suggested by Harwit [25, 26]. To quote Harwit [25]:
“Observations of the orbital angular momentum of photons — a prop-erty of electromagnetic radiation that has come to the fore in recent
96
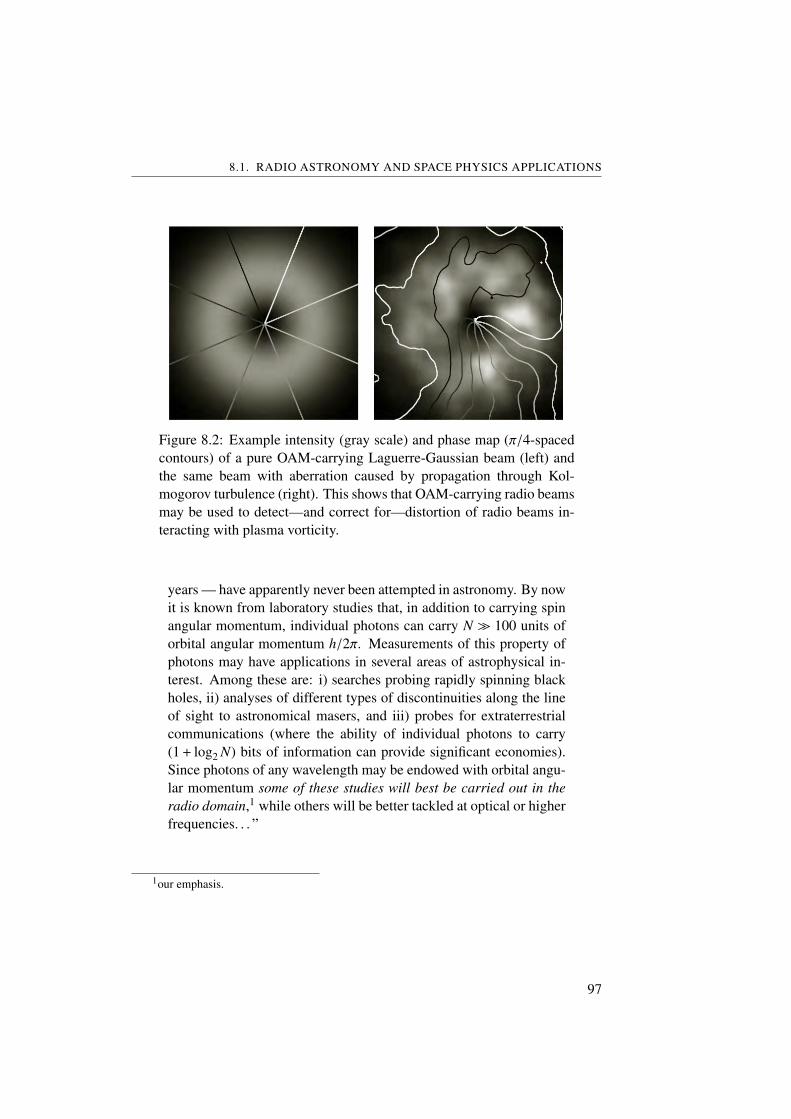
8.1. RADIO ASTRONOMY AND SPACE PHYSICS APPLICATIONS
Figure 8.2: Example intensity (gray scale) and phase map (π/4-spacedcontours) of a pure OAM-carrying Laguerre-Gaussian beam (left) andthe same beam with aberration caused by propagation through Kol-mogorov turbulence (right). This shows that OAM-carrying radio beamsmay be used to detect—and correct for—distortion of radio beams in-teracting with plasma vorticity.
years — have apparently never been attempted in astronomy. By nowit is known from laboratory studies that, in addition to carrying spinangular momentum, individual photons can carry N 100 units oforbital angular momentum h/2π. Measurements of this property ofphotons may have applications in several areas of astrophysical in-terest. Among these are: i) searches probing rapidly spinning blackholes, ii) analyses of different types of discontinuities along the lineof sight to astronomical masers, and iii) probes for extraterrestrialcommunications (where the ability of individual photons to carry(1+ log2 N) bits of information can provide significant economies).Since photons of any wavelength may be endowed with orbital angu-lar momentum some of these studies will best be carried out in theradio domain,1 while others will be better tackled at optical or higherfrequencies. . . ”
1our emphasis.
97

CHAPTER 8. DISCUSSION
That the radio OAM can be a sensitive detector of turbulence in the prop-agation medium (e.g., the turbulent ionospheric plasma for radio astronomicalsignals) should be clear from fig. 8.2 which shows the result of a numerical sim-ulation where a Laguerre-Gaussian beam propagated through Kolmogorov turbu-lence [42]. Since the total angular momentum for a given volume of the plasma(including its vorticity) and a radio beam passing through, or in any other way in-teracting with, this plasma volume is a conserved quantity. Vorticity in a mediumis a clear signature of turbulence in the same medium. Hence, the OAM ra-dio technique which measures the vorticity in radio signals for may be used tomeasure—and correct for—distortion of radio beams interacting with plasma.
8.1.1 Self-calibration of ionospherically aberrated radio signals
It is well-known among radio astronomers and space physicists that turbulencein the ionospheric layers can significantly alter the characteristics of radio sig-nals that pass through them, even if the frequency of these waves (10–100 MHz)exceed the critical frequency of the ionosphere (3–10 MHz) by quite a bit. Partof the radio signal aberration (and scintillation) are amplitude and phase changescaused by the ionospheric turbulence. The self-calibration technique, developedin the radio astronomy community, manages to reduce these aberrations signif-icantly. In this technique, a radio map of known radio objects (Cass-A, Crab,Cygn-A, etc.) are used as calibrators to iteratively adapt parameters of a model sothat the radio interferences are eliminated.
The correction algorithm used at LOFAR (and tried at LOIS), is based on anempirical model where correction parameters are applied dynamically to the raw,sampled radio signals in a control loop manner to minimize the disturbances. Theself-calibration process data can serve two purposes. It can be used for correctingsignals received so that the information about distant objects is accurate. At thesame time the self-calibration data provide valuable information about the dynam-ics of the Earth’s ionosphere, which is of high interest in space physics research[50]. Similar self-calibration techniques can be envisioned to be used to compen-sate for imperfections in satellite-based navigation systems caused by ionosphericturbulence.
For low-frequency radio telescopes such as LOFAR, the self-calibration pro-cedure must be repeated several times per minute. Figure 8.3 shows the differencebetween an un-calibrated (left) and calibrated (right) image of an astrophysical
98

8.1. RADIO ASTRONOMY AND SPACE PHYSICS APPLICATIONS
Figure 8.3: Example of how a self-calibration procedure can reduce ra-dio image aberrations caused by ionospheric intensity and phase distor-tions. The left-hand panel shows the image before the self-calibration,the right-hand panel after. The radio image data were taken at the NRL-NRAO 74 MHz Very Large Array radio telescope near Socorro, NM.We expect that a self-calibration that also corrects for polarization andvorticity distortion, based on the LOIS vectorial radio field technique,utilizing OAM, will be able to improve the results considerably, partic-ularly at low frequencies.
object observed at 74 MHz by the NRL-NROA VLA radio telescope: In the leftpanel the aberration of the ionospheric turbulence is clearly seen, while in theright panel, the self-calibration procedure has cleaned the radio image quite con-siderably.
However, also the radio beam angular momentum (wave polarization and vor-ticity), which carries important information about the radio object under study,can be significantly influenced if the beam propagates through distorting mediasuch as a turbulent ionosphere [21]. These aberrations have to be compensatedfor in order to obtain reliable data about the radio source under study. The vec-torial sensing technique developed at LOIS and described in this thesis, makes itpossible to extend the self-calibration technique to handle also vorticity distortion.
99

CHAPTER 8. DISCUSSION
8.2 Communications
In optics, the transfer of information encoded in OAM has been demonstrated inpractice. Using OAM one can use each state, in theory an infinite number of dis-crete states but in practice limited by the size of the sensor and actuator arraysand energy, to transfer information. In [22] Gibson et al. demonstrate the use of8 OAM states information transfer. The communication can be made both clas-sically and with single photons; in fact, Maxwell-Lorentz’s equations in classicalelectrodynamics [31, 49] can be considered as the quantum theory for the singlephoton [1, 28]. If the receiving device had enough resolution to distinguish be-tween 28 states, i.e., in practical terms had enough vector sensing antenna units inthe receiving array, one could encode the entire alphabet.
In the radio domain OAM can also be used to create multiple informationchannels, all using the same frequency but different l so that they, ideally, do notinterfere with each other (generalized Fresnel-Arago interference laws). This isachieved by demodulating different physical OAM states, using discrete Fouriertransform techniques, just as one demodulates different frequencies in a normalsignal. Theoretically this means that the OAM encoding technique allows fora much larger number of communication channels in each frequency band thantoday.
In optics, a beam carrying OAM has several restrictions for example the de-grading of the beam over a distance and the beam width [22]. The degrading ofthe beam could be explained by atmospheric turbulence and could be mitigatedby “adaptive optics” techniques of a similar kind as described in section 8.1.1.The beam width, in optics, scales with
√l, according to [22]. This implies that the
receiving aperture will have a physical limitation for how high OAM values it canutilize. In the radio domain, the radius seems to have a more linear relationship,and will result in a physical limitation for the arrays used, a similar restriction asfor the optics case.
One advantage of using OAM in communications, is that it is resistant toeavesdropping [22]. The OAM data is extremely difficult to recover from thescattered signals originating from the beam. Misalignment with the axis of prop-agation also presents problems for the eavesdropper in the optical domain. Inthe radio domain the misalignment to the axis will yield less problem than in theoptics case. If the direction of the of the beam is known the OAM should beobtainable even if one is misaligned from the axis of propagation.
100

8.3. RECEIVING
8.3 Receiving
To receive a radio beam, and determine the variation of the instantaneous fieldvector properties across the beam in real time, is most conveniently done with anarray of antennas. In this case, the array grid geometries shown in figure 6.1a,6.1b and 6.1d on page 51 are not very useful, unless we know that the beamcenter will coincide with the center of the array or, at least partly, remain withinthe array grid. So for receiving a beam in general, a planar array such as the oneshown in figure 6.1c, can be expected to yields an optimum result. The planararray geometry is quite simple and the calculations are therefore straightforwardcompared to the case of a circular grid, with the center of the beam displaced fromthe center of the array. If the centers would coincide between the array and thebeam, a logarithmic spiral array, such as that shown in figure 6.1d, would increasethe sensitivity of the array compared to the ERCG, shown in figure 6.1a. In theERCG the elements are fanned out in sectors from the center of the array and theinformation of the field properties in between is lost. For the logarithmic spiralarray the elements are deployed in a logarithmic spiral, so that sectors from thecenter of the array will less often contain no elements, giving a higher sensitivityfor the array. The EDCG shown in figure 6.1b also give a better behavior forbeams coinciding with the center of the array. So by comparing this array withthe logarithmic spiral array it is hard to clearly see which one will the better one.Most likely the situation will become an important issue.
For receiving beams carrying orbital angular momentum, a planar array ap-pears to be the best choice because of its simple composition of elements andgeometry.
8.4 Outlook
In this thesis we have shown the importance of further improving, and developing,the use of the properties of the EM field. Today one are aware of these attributesof the EM field but there is little, if any, use of these in todays industry. In thisthesis we have shown field gains that would have been hard to achieve without theknowledge of OAM from optics. This might be the key to the future.
We have presented results showing intensity patterns of beams with differentOAM. By mixing several OAM states one can obtain very interesting and useful
101

CHAPTER 8. DISCUSSION
beam patterns and the ability to point beams simultaneously in several directions.This is likely to have useful application in, e.g., radar and communication sys-tems. By using radar systems with OAM, one could also detect rotations of thetarget since we know that the total angular momentum consisting of the sum ofmechanical and electromagnetic angular momentum is conserved.
102

ACKNOWLEDGEMENTS
First of all we would like to thank our supervisor Professor Bo Thidé for every-thing he has done for us. His encouragement and help in finding informationis much appreciated. We are also grateful for all interesting discussions and histhorough proofreading. Secondly we would like to thank dr Jan Bergman for in-teresting inputs and help with finding information. Finally, a big thank you to allstaff at IRFU and fellow thesis workers for making our stay here so pleasant.
103

BIBLIOGRAPHY
[1] A. I. AKHIEZER AND V. B. BERSTETSKII, Quantum Electrodynamics,Monographs on Physics & Astronomy. John Wiley & Sons, New York, 1965,ISBN 978-0470018484.
[2] L. ALLEN, S. M. BARNETT, AND M. J. PADGETT, Optical Angular Momentum,IoP Publishing, Bristol, UK, 2003, ISBN 0 7503 0901 6.
[3] L. ALLEN, M. W. BEIJERSBERGEN, R. J. C. SPREEUW, AND J. P. WOERDMAN,Orbital angular momentum of light and the transformation of Laguerre-Gaussianlaser modes, Physical Review A, 45, 11 (2006), pp. 8185 – 8189.
[4] ASTRON, Lunar Infrastructure for Exploration, Web site,http://www.astron.nl/press/090306.htm.
[5] C. A. BALANIS, Antenna Theory: Analysis and Design, 3 ed., Wiley, 2005.
[6] A. O. BARUT, Electrodynamics and Classical Theory of Fields and Particles,Dover Publications, Inc., New York, NY, 1980, ISBN 0-486-64038-8.
[7] I. V. BASISTIY, M. S. SOSKIN, AND M. V. VASNETSOV, Optical wavefrontdislocation and their properties, Optics Communications, 119 (1995), pp. 604–612.
[8] S. BATTERSBY, Twisting the light away, NewScientist (12 June 2004), pp. 36–40.
[9] J. BERGMAN, Information Dense Antenna (IDA)—Technology White Paper.
[10] M. V. BERRY, Paraxial beams of spinning light, In Singular Optics (August1998), M. S. Soskin, Ed., vol. 3487, The International Society for OpticalEngineering, SPIE, pp. 6–11.
[11] R. A. BETH, Mechanical detection and measurement of the angular momentum oflight, Physical Review, 50 (1936), pp. 115–125.
[12] T. H. BOYER, Illustrations of the relativistic conservation law for the center ofenergy, American Journal of Physics, 73, 10 (October 2005), pp. 953–961.
[13] C. BROSSEAU, Fundamentals of Polarized Light: A Statistical Optics Approach,John Wiley & Sons, New York, 1998, Chapter 3.
105

BIBLIOGRAPHY
[14] T. CAROZZI, R. KARLSSON, AND J. BERGMAN, Parameters characterizingelectromagnetic wave polarization, Physical Review E, 61 (2000), pp. 2024–2028,URL: http://www.physics.irfu.se/Publications/Articles/CarozziEtAl:PRE:2000.pdf.
[15] C. COHEN-TANNOUDJI, J. DUPONT-ROC, AND G. GRYNBERG, Photons andAtoms: Introduction to Quantum Electrodynamics, Wiley-Interscience, New York,NY, 1997, Chapter 1. ISBN 0-471-18433-0.
[16] C. N. COHEN-TANNOUDJI, Manipulating atoms with photons, Journal dePhysique et le Radium, 70, 3 (July 1998), pp. 707–719, (Nobel Lecture).
[17] R. COMPTON, JR., The tripole antenna: An adaptive array with full polarizationflexibility, IEEE Transactions on Antennas and Propagation, 29, 6 (1981),pp. 944–952, URL: http://ieeexplore.ieee.org/xpl/freeabs_all.jsp?tp=&arnumber=1142690&isnumber=25617.
[18] J. COURTIAL, K. DHOLAKIA, L. ALLEN, AND M. PADGETT, Gaussian beamswith very high orbital angular momentum, Optics Communications, 144 (1997),pp. 210–213.
[19] S. ERIKSSON, Study of tripole antenna arrays for space radio research, Mastersthesis, Department of Astronomy and Space Physics, Uppsala University, Uppsala,Sweden, August 2003, UPTEC F03 062, URL: http://www.physics.irfu.se/Publications/Theses/Eriksson:MSc:2003.pdf.
[20] FOCUS, Breaking free of bits, Physical Review Letters Focus web site, URL:http://focus.aps.org/v9/st29.
[21] V. GARCÉS-CHAVÉZ, D. MCGLOIN, M. D. SUMMERS,A. FERNANDEZ-NIVES, G. C. SPALDING, G. CRISTOBAL, AND K. DHOLAKIA,The reconstruction of optical angular momentum after distortion in amplitude,phase and polarization, Journal of Optics A: Pure and Applied Optics, 6 (2004),pp. S235–S238.
[22] G. GIBSON, J. COURTIAL, M. J. PADGETT, M. VASNETSOV, V. PAS’KO, S. M.BARNETT, AND S. FRANKE-ARNOLD, Free-space information transfer usinglight beams carrying orbital angular momentum, Optics Express, 12, 22 (2004),pp. 5448–5456.
[23] R. H. GOOD, JR. AND T. J. NELSON, Classical Theory of Electric and MagneticFields, Academic Press, New York and London, 1971, ISBN 0-12-290050-2.
[24] D. J. GRIFFITHS, Introduction to Electrodynamics, Prentice Hall, Upper SaddleRiver, NJ, 1999, Chapter 8.
106

[25] M. HARWIT, Photon orbital angular momentum in astrophysics, In Bulletin of theAmerican Astronomical Society (Dec. 2003), vol. 35, The American AstronomicalSociety, p. 1246, AAS 203rd Meeting, Session 23, #23:07. URL:http://adsabs.harvard.edu/cgi-bin/nph-bib_query?bibcode=2003AAS...203.2307H&db_key=AST.
[26] M. HARWIT, Photon orbital angular momentum in astrophysics, The AstrophysicsJournal, 597, 2 (10 November 2004), URL:http://www.journals.uchicago.edu/ApJ/journal/issues/ApJ/v597n2/17268/brief/17268.abstract.html.
[27] H. HE, M. E. J. FRIESE, N. R. HECKENBERG, ANDH. RUBINSZTEIN-DUNLOP, Direct observation of transfer of angular momentumto absorptive particles from a laser beam with a phase singularity, Physical ReviewLetters, 75, 5 (1995), pp. 826–829.
[28] W. HEITLER, The Quantum Theory of Radiation, Dover Publications, New York,1984, ISBN 978-0486645582.
[29] N. H. IBRAGIMOV, A new conservation theorem, Journal of MathematicalAnalysis and Applications, in press (28 November 2006),doi:10.1016/j.jmaa.2006.10.078.
[30] ICT, NEC based antenna modeler and optimizer, Web site, URL:http://home.ict.nl/~arivoors/Home.htm.
[31] J. D. JACKSON, Classical Electrodynamics, 3 ed., John Wiley & Sons, New York,1998, ISBN 978-0471427643.
[32] R. V. JONES, The Paraxial Wave Equation Gaussian Beams in Uniform Media,Lecture notes.
[33] A. KASTLER, The optical production and the optical detection of an inequality ofpopulation of the levels of spatial quantification of atoms. Application to theexperiments of Stern and Gerlach and to magnetic resonance, Reviews of ModernPhysics, 11 (1950), pp. 255–265.
[34] M. KHOTYAINTSEV, Radar Probing of the Sun, Doctoral thesis, UppsalaUniversity (AIM Graduate Programme), Uppsala, Sweden, 4 November 2006,Abstract: http://publications.uu.se/abstract.xsql?dbid,URL: Theses/Khotyaintsev:PhD:2006.pdf.
[35] M. V. KHOTYAINTSEV, V. N. MEL’NIK, B. THIDÉ, AND O. O.KONOVALENKO, Combination scattering by anisotropic Langmuir turbulence with
107

BIBLIOGRAPHY
application to solar radar experiments, Solar Physics, 234, 1 (March 2006),pp. 169–186, URL: http://www.springerlink.com/(32qia5nrry0y0t451pw0aj45)/app/home/contribution.asp?referrer=parent&backto=issue,9,10;journal,1,433;linkingpublicationresults,1:100339,1.
[36] H. KOGELNIK AND T. LI, Laser beams and resonators, Applied Optics, 5, 10(1966), pp. 1550–1567.
[37] LIFE, Lunar Infrastructure for Exploration, Web site,http://www.beyondmoon.de.
[38] LOFAR, Low Frequency Array, Web site, http://www.lofar.org.
[39] LOIS, LOFAR Outrigger in Scandinavia, Web site,http://www.lois-space.net.
[40] NEC2, Numerical Electromagnetic Code, Version 2, Web site,http://www.nec2.org.
[41] E. NOETHER, Invariante Variationsprobleme, Nachrichten von der Gesellschaftder Wissenschaften zu Göttingen, 1, 3 (1918), pp. 235–257, English transl.:Invariant variation problems, Transp. Th. Stat. Phys., 1, 186–207 (1971).
[42] C. PATERSON, Atmospheric turbulence and orbital angular momentum of singlephotons for optical communication, Physical Review Letters, 94, 15 (2002),p. 153901.
[43] J. H. POYNTING, The wave motion of a revolving shaft, and a suggestion as to theangular momentum in a beam of circularly polarised light, Proceedings of theRoyal Society of London, 82, 557 (31 July 1909), pp. 560–567, URL:http://links.jstor.org/sici?sici=0950-1207(19090731)82%3A557%3C560%3ATWMOAR%3E2.0.CO%3B2-Z.
[44] J. SCHWINGER, L. L. DERAAD, JR., K. A. MILTON, AND W. TSAI, ClassicalElectrodynamics, Perseus Books, Reading, MA, 1998, ISBN 0-7382-0056-5.
[45] A. SHADOWITZ, The Electromagnetic Field, McGraw-Hill, Tokyo, 1975, ISBN0-07-056368-3.
[46] N. SIMPSON, K. DHOLAKI, L. ALLEN, AND M. J. PADGETT, Mechanicalequivalence of spin and orbital angular momentum of light: an optical spanner,Optics Letters, 22, 1 (1997), pp. 52–54.
108

[47] M. SOLJACIC AND M. SEGEV, Integer and fractional angular momentum borneon self-trapped necklace-ring beams, Physical Review Letters, 86 (2001), p. 420.
[48] K. SUEDA, N. M. G. MIYAJI, AND M. NAKATSUKA, Laguerre-Gaussian beamgenerated with a multilevel spiral phase plate for high intensity laser pulses, OpticsExpress, 12, 15 (2004), pp. 3548–3553.
[49] B. THIDÉ, Electromagnetic Field Theory, Upsilon Books, Uppsala, 2006, URL:http://www.plasma.uu.se/CED/Book.
[50] B. THIDÉ, E. N. SERGEEV, S. M. GRACH, T. B. LEYSER, AND T. D. CAROZZI,Competition between Langmuir and upper-hybrid turbulence in ahigh-frequency-pumped ionosphere, Physical Review Letters, 95, 25 (December15 2005), p. 255002, URL:http://link.aps.org/abstract/PRL/v95/e255002,doi:10.1103/PhysRevLett.95.255002.
109


Appendices
111


ATHE MATLAB CODES USED
A.1 Phaseplanes_4_sub_.m
% Plots the phase planes for four consecutive l values, in subfigures.% LG beam.
clear;
%----------------constants-------------------
c=1;
%-------------things to change---------------
l_start=0; %start OAMlam=1.5; %WavelengthA=0.5; %Amplitudenog=100; %t_stop=10; %Amount of timestepsz_range=2*lam; %Length of z values
%--------------------------------------------
k=2*pi/lam;w=k*c;k_vector=[1 0 0]*k;
113

APPENDIX A. THE MATLAB CODES USED
%---------vector x--------
z_value=linspace(0,z_range,nog); %z on x-axis in plotL_z=length(z_value);
r=0.5*ones(1,nog);
%----- --------- -------
t_steg=lam/(2*2*pi*c); %Not to big timesteps
t_vector=0:t_steg:t_stop;
%------------------------z_antal=z_range/lam;steg=zeros(1,z_antal); %så att den plana vågen upprepas
%då den passerar utanför bild.t=1;n=1;l=l_start;while t≤t_stop
while l≤l_start+3
if l==0 %Plane wave.clf;subplot(2,2,n);hold on;
axis([0 z_range -2 2 -2 2]);view(51,30);
axis fill;axis square;grid on;%light;
z_value_tmp=z_value; %Z_valuePHI_vector=linspace(0,2*pi,nog);L_PHI=length(PHI_vector);R=ones(1,L_PHI);[x_value y_value]=pol2cart(PHI_vector,R);temp=ones(1,L_z);
114

A.1. PHASEPLANES_4_SUB_.M
z_value=temp*w*t_vector(t)/k;clear temp;
for p=1:z_antalz_value_p=z_value+(p-1)*lam;if z_value_p≥(steg(1,p)+1)*z_range
steg(1,p)=steg(1,p)+1;end
z_value_p=z_value_p-2*steg(p)*lam;m=1;while m<L_z %Plottar Phasplanes
X=[z_value_p(m) ;z_value_p(m) ;z_value_p(m+1)...;z_value_p(m+1) ];
Y=[0 ;y_value(m) ;y_value(m+1)...;0 ];
Z=[0 ;x_value(m) ;x_value(m+1)...;0 ];
fill3(X,Y,Z,'y');m=m+1;alpha(1);
end
end %for loop
z_value=z_value_tmp;
elsesubplot(2,2,n);hold on;axis([0 z_range -2 2 -2 2]);view(51,30);
axis fill;axis square;grid on;light;material shiny;l_steg=0;while l_steg<l
temp=ones(1,L_z);PHI_start=l_steg*2*pi/l*temp;PHI_vector=PHI_start+k*z_value/l-w*t_vector(t)/l;
115

APPENDIX A. THE MATLAB CODES USED
L_PHI=length(PHI_vector);R=ones(1,L_PHI);
[x_value y_value]=pol2cart(PHI_vector,R);clear temp;
m=1;while m<L_z %%Plottar Phasplanes
X=[z_value(m) ;z_value(m) ;z_value(m+1)...;z_value(m+1) ];
Y=[0 ;y_value(m) ;y_value(m+1)...;0 ];
Z=[0 ;x_value(m) ;x_value(m+1)...;0 ];
fill3(X,Y,Z,'y')m=m+1;
endl_steg=l_steg+1;end %while l_steg...
end %else satsenl=l+1;n=n+1;
end %while l.
%Film(:,t)=getframe(gcf);hold off;n=1; %Återställning av räknaret=t+1; %Tidsstegningpause(0.1);l=l_start;
end
%movie2avi(Film,'phaseplanes_4.avi'); %For avi films.%movieview('phaseplanes_4.avi')
A.2 nec.m
% Written by Johan Sjöholm.%
116

A.2. NEC.M
% Returns the information, Theta, Phi, E_magn and phase) from 4nec2 data.%
% The Data input file is obtained from the 4nec2 outputfile with% modifications:% Only the values from "Radiation patterns" are kept.% "LINEAR", "RIGHT" and "LEFT" are replaced by appropriate amount of% spaces.
function [Phase_theta_10 Phase_phi_10]=nec_org(L,grad,step)
% L % Data file from 4nec2% grad_min % Min meassurement theta angle.% grad_max % Max Meassurement theta angle (16 24 32 45 mainlobe)% gradsteg % Resolution in 4nec2.% step % Every step'th value.
p=1;o=1;d=length(L);for l=1:d % All values in L to be analyzed
if L(l,1)==-grad % If the theta angle equals grad.if p==1
Phase_theta1=[L(l,1), L(l,2), L(l,8),L(l,9)];p=2;
elsePhase_theta1=[Phase_theta1;L(l,1), L(l,2),...
L(l,8),L(l,9)];endif o==1
Phase_phi1=[L(l,1), L(l,2), L(l,10), L(l,11)];o=2;
elsePhase_phi1=[Phase_phi1;L(l,1), L(l,2),...
L(l,10), L(l,11)];end
endend
Phase_theta(:,:)=[Phase_theta1]; %[Theta Phi%E_magn(theta) E_phase(theta)]
Phase_phi(:,:)=[Phase_phi1]; %[Theta Phi%E_magn(theta) E_phase(theta)]
117

APPENDIX A. THE MATLAB CODES USED
%___________________________ Every "step" value ___________________________
l_ph_theta=length(Phase_theta(:,1));for ten=1:step:l_ph_theta
if ten==1;Phase_theta_10(1,:)=Phase_theta(ten,:);Phase_phi_10(1,:)=Phase_phi(ten,:);
elsePhase_theta_10((ten-1)/step+1,:)=Phase_theta(ten,:);Phase_phi_10((ten-1)/step+1,:)=Phase_phi(ten,:);
endend
A.3 Phase_arrows.m
% Written by Johan Sjöholm%% This program will plot what phase arrows from 4nec2 data.
%Source files from 4nec, modified. "LINEAR", "LEFT", "RIGHT" replaced%by appropriate amount of space. Radiation patterns values are kept.%Columns as follows:
%( 1 - Theta 2 - Phi ) Angles%( 3 - Vert. DB 4 - Hor. DB 5 - Tot. DB ) Power gains%( 6 - Axial Ratio 7 - Tilt deg ) Polarization%( 8 - E_theta magnitude. 9 - Phase_theta ) E(Theta)%(10 - E_phi magnitude. 11 - Phase_phi ) E(Phi)
clear;close all;
names_of_files=['ED_r10to20_lam11_dip_L00.dat';'ED_r10to20_lam11_dip_L01.dat'; %Names of 4nec2 files'ED_r10to20_lam11_dip_L02.dat';'ED_r10to20_lam11_dip_L04.dat'];
grad_min=[4 4 4 4]; % Min meassurement theta angle.grad_max=[14 20 30 35];% Max Meassurement theta angle (ex mainlobe)grad_steg=2; % Resolution in 4nec2 file.step=4; % Every step'th value.
118

A.3. PHASE_ARROWS.M
for m=1:length(names_of_files(:,1))Data=load(names_of_files(m,:)); %Data from filefor grad=grad_min:grad_steg:grad_max %Degrees for data.
[Phase_theta_10 Phase_phi_10]=nec(Data,grad,step);% nec obtains the data from the 4nec2 output file.
% Ecos(theta)=-Ecos(theta+-180) same for phi. (For looks only)% No real change in the values of the E-field just easier to% visualize the phase.d=length(Phase_theta_10);for k=1:d
if Phase_theta_10(k,2)≥180if Phase_theta_10(k,4)>0
Phase_theta_10(k,4)=Phase_theta_10(k,4)-180;else
Phase_theta_10(k,4)=Phase_theta_10(k,4)+180;endPhase_theta_10(k,3)=Phase_theta_10(k,3)*(-1);
endif Phase_phi_10(k,2)≥90 & Phase_phi_10(k,2)<270
if Phase_phi_10(k,4)>0Phase_phi_10(k,3)=Phase_phi_10(k,3)*(-1);Phase_phi_10(k,4)=Phase_phi_10(k,4)-180;
elsePhase_phi_10(k,3)=Phase_phi_10(k,3)*(-1);Phase_phi_10(k,4)=Phase_phi_10(k,4)+180;
endend
end
% Distance between each ring:R=1; %Virtual distance just to get a feel for it.r=R.*tan(pi/180*grad).*ones(length(Phase_theta_10),1); %Placements
% Placement:[X Y]=pol2cart(pi/180.*Phase_theta_10(:,2),r);
%Since phi=theta, in our case we can use theta or phi%for the phase.CAREFUL!!!!!
% Change of coordinates:[X_th Y_th]=pol2cart(pi/180.*Phase_theta_10(:,4),1);[X_ph Y_ph]=pol2cart(pi/180.*Phase_phi_10(:,4),1);
% PLOT:figure(m)
119

APPENDIX A. THE MATLAB CODES USED
quiver (X,Y,X_ph,Y_ph,0.5); %Vector arrowshold on;ax_values=(R*tan(pi/180*grad)+0.1); %Axes valuesaxis ([-ax_values ax_values -ax_values ax_values]);axis square;xlabel('X','fontsize',24);ylabel('Y','fontsize',24);
end %GRADend %name_of_files
A.4 E_field.m
% Written by Johan Sjöholm%% This program plots what the electric field looks like from% 4nec2 data.
%Source files from 4nec, modified. "LINEAR", "LEFT", "RIGHT" replaced%by appropriate amount of space. Radiation patterns values are kept.%Columns as follows:
%( 1 - Theta 2 - Phi ) Angles%( 3 - Vert. DB 4 - Hor. DB 5 - Tot. DB ) Power gains%( 6 - Axial Ratio 7 - Tilt deg ) Polarization%( 8 - E_theta magnitude. 9 - Phase_theta ) E(Theta)%(10 - E_phi magnitude. 11 - Phase_phi ) E(Phi)
clear;close all;
names_of_files=['ED_r10to20_lam11_dip_L00.dat';'ED_r10to20_lam11_dip_L01.dat'; %Names of 4nec2 files'ED_r10to20_lam11_dip_L02.dat';'ED_r10to20_lam11_dip_L04.dat'];
grad_min=[4 4 4 4]; % Min meassurement theta angle.grad_max=[14 20 30 35]; % Max Meassurement theta angle (ex mainlobe)grad_steg=2; % Resolution in 4nec2 file.step=2; % Every step'th value to be plotted
for m=1:length(names_of_files(:,1))Data=load(names_of_files(m,:)); %Data from filefor grad=grad_min:grad_steg:grad_max %Degrees for data.
120

A.5. INTENSITY.M
[Phase_theta_10 Phase_phi_10]=nec(Data,grad,step);% nec_org can also be used here, making it general.% nec obtains the data from the 4nec2 output file.
% E_phase:E_theta=pi/180.*Phase_theta_10(:,3).*...
(cos(pi/180.*Phase_theta_10(:,4)));E_phi=pi/180.*Phase_phi_10(:,3).*...
(cos(pi/180.*Phase_phi_10(:,4)));% Distance between each ring:
R=1;z=0*ones(length(E_theta),1);rho=R.*tan(pi/180*grad).*ones(length(E_theta),1);
%Placement:X=rho.*cos(pi/180.*Phase_theta_10(:,2));Y=rho.*sin(pi/180.*Phase_theta_10(:,2));Z=z;
grad_theta=-pi/180.*Phase_theta_10(:,1);grad_phi=pi/180.*Phase_theta_10(:,2);
% Change of coordinate system:EX=E_theta.*cos(grad_phi).*cos(grad_theta)-E_phi.*sin(grad_phi);EY=E_theta.*cos(grad_theta).*sin(grad_phi)+E_phi.*cos(grad_phi);EZ=-E_theta.*sin(grad_theta);
% PLOT:figure(m)quiver3 (X,Y,Z,EX,EY,EZ,0.3); % Vector arrows.hold on;ax_values=(R*tan(pi/180*grad)+0.1); % Axes values.axis ([-ax_values ax_values -ax_values ax_values...
-ax_values ax_values]);axis square;xlabel('X','fontsize',24);ylabel('Y','fontsize',24);zlabel('Z','fontsize',24);
end %GRADend
A.5 intensity.m
% Written by Kristoffer Palmer 2007% Plots intensities in beams created with NEC% Input files should be with 5 degrees angular% resolution and theta =< 90
121

APPENDIX A. THE MATLAB CODES USED
% degrees. Input file should have columns% (theta, phi, vert. gain,% hor. gain, tot. gain, AR, tilt angle, Ethetamagn,% Ethetaphase, Ephimagn, Ephiphase)clear;c = 3e+8;e0 = 8.854e-12;% number of plotskorningar = input('number of different plots: ');T40 = 0; % needed?RES = 0; % neededfor korn = 1:korningarclear T40;clear RES;
file = input('filnamn: ','s'); %inpufileRES = load(file);
R = 1; %may changeT40 = RES;
% change to radians and fix neg.theta = pi/180*-1*T40(:,1);phi = pi/180*T40(:,2);
% extract E magnitudes and phasesEthetamagn = T40(:,8);Ethetaphase = pi/180*T40(:,9);Ephimagn = T40(:,10);Ephiphase = pi/180*T40(:,11);
%size of EEsqr = Ethetamagn.^2+Ephimagn.^2;
Int = c*e0/2*Esqr; %intesnity in each (theta,phi)
% sort values for plotingfor n = 0:72
for m = 2:19INT(n*19+m) = Int((n+1)*19-(m-2));
endend
r = R*tan(theta);
122

A.5. INTENSITY.M
for n = 1:19rs(n) = r(n);
end
RS = sort(rs);
for n = 1:18RS2(n)=RS(n);
end
for n = 1:16RS3(n) = RS2(n);
end
for m = 1:73for n = 1:16
I0(n,m) = INT((m-1)*19+n);end
end
%create mesh[rr,tt] = meshgrid(RS3,linspace(-pi,pi,73));xx = rr.*cos(tt);yy = rr.*sin(tt);
%intensity in dBI0dB = 10*log10(I0/(max(max(I0))));
%plots all beams in one plotfigure(4);subplot(korningar,2,korn*2-1);surf(xx,yy,I0'); view(2); axis([-4 4 -4 4]);shading interp; axis image; axis off;subplot(korningar,2,korn*2);surf(xx,yy,I0dB'); view(2); axis([-4 4 -4 4]);shading interp; axis image; axis off; colorbar;
%plots all beams in individual plotsfigure(5+korn);surf(xx,yy,I0'); view(2); axis([-4 4 -4 4]);shading interp; axis image;axis off;figure(15+korn);surf(xx,yy,I0dB'); view(2); axis([-4 4 -4 4]);shading interp; axis image; axis off; colorbar;
123

APPENDIX A. THE MATLAB CODES USED
end
A.6 Phase.m
% Written by Kristoffer Palmer 2007% Plots phases of polarized beams in a cross section of beams% created with NEC% Input files should be with 5 degrees angular resolution and% theta =< 90 degrees.% Input file should have columns (theta, phi, vert. gain,% hor. gain, tot. gain, AR, tilt angle, Ethetamagn, Ethetaphase,% Ephimagn, Ephiphase)clear;
korningar = input('number of different plots: ');% number of filesT40 = 0;RES = 0;for korn = 1:korningarclear T40;clear RES;
file = input('filnamn: ','s'); % load filesRES = load(file);
for g = 2:19 % skip values in center point
for n = 0:4:72 % to get square matrixT40(n/4+1,:) = RES(n*19+g,:);
end
% degrees to radianstheta = pi/180*-1*T40(:,1);phi = pi/180*T40(:,2);
% extract EEthetamagn = T40(:,8);Ethetaphase = pi/180*T40(:,9);Ephimagn = T40(:,10);Ephiphase = pi/180*T40(:,11);
% calculate theta- and phi-components with sign
124

A.6. PHASE.M
Etheta = Ethetamagn.*cos(Ethetaphase);Ephi = Ephimagn.*cos(Ephiphase);
%change to carteisan coordinatesEx = Etheta.*cos(theta).*cos(phi) - Ephi.*sin(phi);Ey = Etheta.*cos(theta).*sin(phi) + Ephi.*cos(phi);Ez = -Etheta.*cos(theta);
% calculate phase (vector direction) of electric field in xy-planefor n = 1:19if Ex(n) ≥ 0 && Ey(n) ≥ 0
PHASE(g,n) = atan(Ey(n)/Ex(n));elseif Ex(n) ≥ 0 && Ey(n) < 0
PHASE(g,n) = atan(Ey(n)/Ex(n)) + 2*pi;else
PHASE(g,n) = (pi + atan(Ey(n)/Ex(n)));%*180/pi;endend
end
%resorting for plottingfor g = 19:-1:1
PHASE2(g,:) = PHASE(20-g,:);endfor g = 19:-1:1
PHASE3(:,g) = PHASE(:,20-g);end
rr(19) = tan(86*pi/180);for n = 0:17 %17:-1:0
rr(n+1) = tan(5*n*pi/180);end
% build square mesh[RR,TT] = meshgrid(rr,phi);xx = RR.*cos(TT);yy = RR.*sin(TT);
% plot phases in subplotsfigure(4);subplot(floor((-0.1+korningar)/2)+1,2,korn,'align');surf(xx,yy,PHASE2'); view(2); axis image; axis off; colorbarfigure(5);subplot(floor((-0.1+korningar)/2)+1,2,korn,'align');
125

APPENDIX A. THE MATLAB CODES USED
surf(xx,yy,PHASE2'); view(2);axis([-tan(60*pi/180) tan(60*pi/180) -tan(60*pi/180) tan(60*pi/180)]);axis square; axis off; colorbar;ARmean = sum(RES(:,6))/1387 %return mean value of ARARh=ARmean*2*pi*3e8*6.626e-34 %
% plot each beam in separate windowfigure(5+korn);surf(xx,yy,PHASE2');axis([-tan(60*pi/180) tan(60*pi/180) -tan(60*pi/180) tan(60*pi/180)]);axis square; axis off; view(2);%180 degree rotation somtimes needed if theta is negativeend
A.7 Evectors.m
% By Kristoffer Palmer 2006% Plots E vectors in xy plane. Assumes 5 degrees angular resolution.% Input should look like input in Phase.m
clear;lambda = 1;c = 3e8;
tt = linspace(0,lambda/c,73);dt= tt(2)-tt(1);t=input('t: '); % can specify when to plot in one period (0<t<74)
file = input('filnamn: ','s');RES = load(file);%load data and store values to use
for g = 7:19 %between which theta?
for n = 0:72T40(n+1,:) = RES(n*19+g,:);
end% extract datatheta = pi/180*-1*T40(:,1);phi = pi/180*T40(:,2)+pi;
Ethetamagn = T40(:,8);
126

A.8. ANGMOM.M
Ethetaphase = pi/180*T40(:,9)+2*pi/lambda*c*tt(t);Ephimagn = T40(:,10);Ephiphase = pi/180*T40(:,11)+2*pi/lambda*c*tt(t);
%for plottingfor jogfed = 1:73
ones(jogfed) = 1;endcx = tan(theta(1))*cos(linspace(0,2*pi,73));cy = tan(theta(1))*sin(linspace(0,2*pi,73));cz = 0*linspace(0,2*pi,73);
%calculate theta- and phi-componentsEtheta = Ethetamagn.*cos(Ethetaphase);Ephi = Ephimagn.*cos(Ephiphase);
%change to carteisan coordinatesEx = Etheta.*cos(theta).*cos(phi) - Ephi.*sin(phi);Ey = Etheta.*cos(theta).*sin(phi) + Ephi.*cos(phi);Ez = -Etheta.*cos(theta);figure(2);
%plotfor j = 1:2:72
Ex(j) = 0;Ey(j) = 0;Ez(j) = 0;
endEx(73) = 0;Ey(73) = 0;Ez(73) = 0;
quiver3(cx,cy,cz,Ex,Ey,Ez,0.5); hold onview(2);%axis([-tan(60*pi/180) tan(60*pi/180) -tan(60*pi/180) tan(60*pi/180)]);axis square; axis off;
end
A.8 AngMom.m
% Written by Kristoffer Palmer 2007% calculates and plots Jz/U in beams created with NEC
127

APPENDIX A. THE MATLAB CODES USED
% (but with unknown constant in the magnitude.% Input files shold have only theta =< 90% degrees. Input file should have columns (theta, phi, vert. gain,% hor. gain, tot. gain, AR, tilt angle, Ethetamagn, Ethetaphase,% Ephimagn, Ephiphase)% For correct x axis, please give symmetric files (l=-4 to l=4% in 9 files for instance)clear;N = input('Number of files: '); %Number of filesresolution = input('Angular resolution in input file: '); %angular
% resolution in input file
for n = 1:N
file = input('filnamn: ','s'); %give name of each fileRES = load(file);
JzUU = JzU(RES,resolution); % Use function JzU
JzUUU(n) = JzUU; %stores all Jz/Uend
l = linspace(-(N-1)/2,(N-1)/2,N); %creates l interval
plot(l,JzUUU,'b'); hold on; %plots result
A.9 JzU.m
% By Kristoffer Palmer 2007% function used by program AngMom.
function f = JzU(RES,resolution)
% constants and starting valueslambda = 1; %could make input lambdac = 3e+8;e0 = 8.854e-12;Jxtot = 0;Jytot = 0;Jztot = 0;Entot = 0;
% resolutiondependent parameters
128

A.9. JZU.M
aa = 90/resolution +1; % g = 1:19bb = 360/resolution; % n = 0:72
% timestepstt = linspace(0,lambda/c,73);dt= tt(2)-tt(1);
for t = 0:dt:lambda/c %for one periodfor g = 1:aa
for n = 0:bbT40(n+1,:) = RES(n*19+g,:);
end
theta = pi/180*-1*T40(:,1);phi = pi/180*T40(:,2);
Ethetamagn = T40(:,8);Ethetaphase = pi/180*T40(:,9)+2*pi/lambda*c*t;Ephimagn = T40(:,10);Ephiphase = pi/180*T40(:,11)+2*pi/lambda*c*t;
Etheta = Ethetamagn.*cos(Ethetaphase); %EthetaEphi = Ephimagn.*cos(Ephiphase); %Ephi
Btheta = -1/c*Ephi; %create B from EBphi = 1/c*Etheta;
%change to carteisan coordinatesEx = Etheta.*cos(theta).*cos(phi) - Ephi.*sin(phi);Ey = Etheta.*cos(theta).*sin(phi) + Ephi.*cos(phi);Ez = -Etheta.*cos(theta);
Bx = Btheta.*cos(theta).*cos(phi) - Bphi.*sin(phi);By = Btheta.*cos(theta).*sin(phi) + Bphi.*cos(phi);Bz = -Btheta.*cos(theta);
% Vectors proportional to Poynting vectorSx = Ey.*Bz-Ez.*By;Sy = Ez.*Bx-Ex.*Bz;Sz = Ex.*By-Ey.*Bx;
% for calculating Jcx = cos(pi/2-theta(1))*cos(linspace(0,2*pi,bb+1));cy = cos(pi/2-theta(1))*sin(linspace(0,2*pi,bb+1));for n = 1:bb+1
129

APPENDIX A. THE MATLAB CODES USED
cz(n) = sin(pi/2-theta(1,1));end
% Calculate J in one timestepJx = e0*(cy.*Sz'-cz.*Sy');Jy = e0*(cz.*Sx'-cx.*Sz');Jz = e0*(cx.*Sy'-cy.*Sx');
% Total Jfor n = 1:bb+1
Jxtot = Jxtot + Jx(n);Jytot = Jytot + Jy(n);Jztot = Jztot + Jz(n);
end
Etot = sqrt(Ex.^2+Ey.^2+Ez.^2);Btot = sqrt(Bx.^2+By.^2+Bz.^2);
% Total energyfor n = 1:73
Entot = Entot + e0/2*(Etot(n)^2 + c^2 * Btot(n)^2);end
endendf = c/lambda*Jztot/Entot; %time average of Jz/Uend
A.10 tripole.m
% Written by Kristoffer Palmer 2007.% Calculates curents and phases for a circular tripole array.% Works for all directions, polarizations and l numbers%(if possible in theory). See report for explanation of parameters.%The program also shows the total current vectors in a 3d plot.% Red arrow indicates direction (theta0, phi0) of maximum (for l=0)% or wanted symmetry axis. Assumes that the dipole antennas in each% tripole is directed in one of x,y or z direction only.
clear;runs = input('elements: '); %number of elementstheta0 = input('theta0: '); %beam symmetry axis theta directionphi0 = input('phi0: '); %beam symmetry axis phi directiona = input('radius in wavelengths: '); %array radius
130

A.10. TRIPOLE.M
%lambda = input('wavelenght: ');l = input('l: '); %l eigenvalue usedax = input('ax: '); %ax used
% calculate currents amplitudes and phases in one pointed antennaJ1 = 1/ax*cos(theta0*pi/180)*cos(phi0*pi/180) + i*sin(phi0*pi/180);J2 = 1/ax*cos(theta0*pi/180)*sin(phi0*pi/180) - i*cos(phi0*pi/180);J3 = -1/ax*sin(theta0*pi/180);amp_x = abs(J1) % returns amplitude of x directed elementamp_y = abs(J2) % returns amplitude of y directed elementamp_z = abs(J3) % returns amplitude of z directed element
% calculate phase shift between elements in the arrayfor n = 1:runs
phiN = input('phiN: '); %angular position of each elementPHI = 180/pi*(l*phiN*pi/180-2*pi*a*sin(theta0*pi/180)...
*cos(pi/180*phiN-pi/180*phi0));
phase_x(n) = angle(J1)*180/pi + PHI;
phase_y(n) = angle(J2)*180/pi + PHI;
phase_z(n) = angle(J3)*180/pi + PHI;
%%%%%%%%%%%% for plotting "E" %%%%%%%%%%%%%%%%%%cx(n) = a*cos(pi/180*phiN);cy(n) = a*sin(pi/180*phiN);cz(n) = 0;%%%%%%%%%%%%%%%%%%%%%%%%%%%%%%%%%%%%%%%%%%%%%%%
endphase_x % returns x phasesphase_y % returns y phasesphase_z % returns z phases
%%%%%%%%%%%%%%% plot "E" %%%%%%%%%%%%%%%%%%%%%Ex = amp_x.*cos(pi/180*phase_x);Ey = amp_y.*cos(pi/180*phase_y);Ez = amp_z.*cos(pi/180*phase_z);E = sqrt(Ex(1)^2+Ey(1)^2+Ez(1)^2);
Refx = E*sin(theta0*pi/180)*cos(phi0*pi/180);Refy = E*sin(theta0*pi/180)*sin(phi0*pi/180);
131

APPENDIX A. THE MATLAB CODES USED
Refz = E*cos(theta0*pi/180);figure(8);quiver3(cx,cy,cz,Ex,Ey,Ez,0.3); hold on;quiver3(0,0,0,Refx, Refy,Refz,0.3,'r'); hold off;view(phi0+90,90-theta0)axis equal;
A.11 lg_beam.m
% By Kristoffer Palmer 2006% Simulates intensity patterns of Laguerre-Gaussian beams.% Can simulate any number of different beams interfering.
clear;% number of patternskorningar = input('give number of different plots: ');u = 0;U = 0;for korn = 1:korningarclear u;clear U;
r = linspace(0,3,100); %may change 3 to other valuez = linspace(0,2*pi,100); %phi = linspace(0,2*pi,100);
%number of beams interfering in each patternN = input('give number of beams: ');lambda = input('give wavelength: '); %wavelengthw0 = input('give beamwaist: '); %beamwaist
% constants and Rayleigh rangec = 3e+8;e0 = 8.854e-12;zr = (pi*(w0)^2)/lambda;
for q = 1:N
p(q) = input('give p: ') % eigenvalue p. Return while runingl(q) = input('give l: ') % eigenvalue l. Return while runing%argument for rotation of beam. Return while runningarg(q) = input('give argument in radians: ')
end
132
A.11. LG_BEAM.M
for q = 1:Nfor m = 1:100
for n = 1:100% use function upl for scalar wave amplitude
u(m,n,q) = upl(r(m),phi(n)+arg(q),z(1),p(q),l(q),lambda,w0);
endend
end
U(100,100) = 0; %create U matrix
for q = 1:N %add all beams
U = u(:,:,q)+U;end
%calculate momentumUc = conj(U);[Ux,Uy] = gradient(U,1/100,2*pi/100);[Ucx,Ucy] = gradient(Uc,1/100,2*pi/100);Px = i*2*pi*c/lambda*e0/2*(Uc.*Ux-U.*Ucx);Py = i*2*pi*c/lambda*e0/2*(Uc.*Uy-U.*Ucy);Pz = 2*pi*c/lambda*2*pi/lambda*e0*abs(U).^2; %neglect grad in z
% momentum vector lengthPabs = sqrt(Px.^2+Py.^2+Pz.^2);
% build mesh[rr,tt] = meshgrid(linspace(0,3,100),linspace(0,2*pi,100));xx = rr.*cos(tt);yy = rr.*sin(tt);% plot intesnityfigure(1)subplot(korningar,2,korn); %surf(xx,yy,Pabs'); view(2); axis image;; shading interp;%axis equal
%%%%%%%%%% change to max(max(Pabs)) if time, then this not needed% for n = 1:100% for m = 1:100% if Pabs(n,m) == 0% Pabs(n,m) = pi;% end% end% end
133

APPENDIX A. THE MATLAB CODES USED
% for n = 1:100% for m = 1:100% if Pabs(n,m) == pi% Pabs(n,m) = min(min(Pabs));% end% end% end
% plot linear and in dbfigure(2)subplot(korningar,2,korn);PabsdB = 10*log10(Pabs/(max(max(Pabs)))); %change to max heresurf(xx,yy,PabsdB'); view(2); axis equal; shading interp;
figure(3);subplot(korningar,2,korn*2-1);surf(xx,yy,Pabs'); view(2); axis equal; shading interp;subplot(korningar,2,korn*2);surf(xx,yy,PabsdB'); view(2); axis equal; shading interp;
% plot in individual windowsfigure(5+korn);surf(xx,yy,Pabs'); view(2); axis image;axis off; shading interp;figure(15+korn);surf(xx,yy,PabsdB'); view(2); axis image;axis off;; shading interp;
end
A.12 upl.m
% By Kristoffer Palmer 2006% Function used for finding scalar amplitude u in LG beam
function f = upl(r,phi,z,p,l,lambda,w0)
k = 2*pi/lambda;zr = (pi*(w0)^2)/lambda;w = w0*sqrt(1+(z/zr).^2);ll = abs(l); %so we can use negative lmaple('with','orthopoly'); % to use Laguerre polynomialL = mfun('L',p,ll,2*r'.^2/(w.^2)); % Laguerrepolynomial
134

A.13. MAKEMATRIX.M
f = sqrt(factorial(p)/factorial(p+ll)) * w0/(w*zr)*(r*sqrt(2)/w).^ll...
*L*exp(-r.^2/w^2)*exp(-i*k*r.^2*z/(2*(z^2+zr^2)))
*exp(-i*l*phi)*exp(i*(2*p+l+1)*atan(z/zr));end
A.13 makematrix.m
%Written by Kristoffer Palmer 2007%If NEC output is a free space file, use this program to%only save theta =< 90 degrees.clear;n=1;file = input('filnamn: ','s'); %loads free space filepellefant = load(file);%load pellefant.datfor m = 1:2701
if pellefant(m,1) > -91A(n,:) = pellefant(m,:);n=n+1;
end;end;clear m n pellefant.datutfil = input('utfil: ','s'); %give name of ouput filesave(utfil, 'A', '-ascii') %saves output file
135


BNEC INPUT FILES
B.1 Electromagnetic beam with orbital angular momentum
B.1.1 L0.txt
CEGW 9 21 -7 6.5699 2.5 -7 7.5699 2.5 1.e-3GW 10 21 -9.9289 -0.5 2.5 -9.9289 0.5 2.5 1.e-3GW 11 21 -7 -7.572 2.5 -7 -6.572 2.5 1.e-3GW 12 21 0.0711 -10.5 2.5 0.0711 -9.5 2.5 1.e-3GW 13 21 7.1422 -7.57 2.5 7.1422 -6.57 2.5 1.e-3GW 14 21 10.0711 -0.5 2.5 10.0711 0.5 2.5 1.e-3GW 15 21 7.1422 6.572 2.5 7.1422 7.572 2.5 1.e-3GW 33 21 -7.6537 17.977 2.5 -7.6537 18.977 2.5 1.e-3GW 34 21 -14.1421 13.64 2.5 -14.1421 14.64 2.5 1.e-3GW 35 21 -18.4776 7.15 2.5 -18.4776 8.15 2.5 1.e-3GW 36 21 -20 -0.5 2.5 -20 0.5 2.5 1.e-3GW 37 21 -18.5 -8.25 2.5 -18.5 -7.25 2.5 1.e-3GW 38 21 -14.1645 -14.7385 2.5 -14.1645 -13.7385 2.5 1.e-3GW 39 21 -7.65375 -18.9775 2.5 -7.65375 -17.9775 2.5 1.e-3GW 40 21 0 -20.5 2.5 0 -19.5 2.5 1.e-3GW 41 21 7.6537 -18.9776 2.5 7.6537 -17.9776 2.5 1.e-3GW 42 21 14.1421 -14.6422 2.5 14.1421 -13.6422 2.5 1.e-3GW 43 21 18.4776 -8.1536 2.5 18.4776 -7.1536 2.5 1.e-3GW 44 21 20 -0.5 2.5 20 0.5 2.5 1.e-3GW 45 21 18.5 7.25 2.5 18.5 8.25 2.5 1.e-3GW 46 21 14.1421 13.6421 2.5 14.1421 14.6421 2.5 1.e-3GW 47 21 7.6537 17.9776 2.5 7.6537 18.9776 2.5 1.e-3
137

APPENDIX B. NEC INPUT FILES
GW 48 21 0 19.5 2.5 0 20.5 2.5 1.e-3GW 16 21 0.0711 9.5 2.5 0.0711 10.5 2.5 1.e-3GE 0EX 6 9 11 0 1 0EX 6 10 11 0 1 0EX 6 11 11 0 1.002 0EX 6 12 11 0 1 0EX 6 13 11 0 1.004 0EX 6 14 11 0 1 0EX 6 15 11 0 1.003 0EX 6 16 11 0 1.001 0EX 6 33 11 0 1 0EX 6 35 11 0 1 0EX 6 36 11 0 1 0EX 6 37 11 0 1 0EX 6 38 11 0 1.002 0EX 6 39 11 0 0.997 0EX 6 40 11 0 1 0EX 6 41 11 0 0.999 0EX 6 42 11 0 1.004 0EX 6 43 11 0 1.007 0EX 6 44 11 0 1 0EX 6 45 11 0 1.007 0EX 6 46 11 0 1.002 0EX 6 47 11 0 1 0EX 6 48 11 0 1 0EX 6 34 11 0 1 0GN 1FR 0 1 0 0 27.2545455 0EN
B.1.2 L1.txt
CEGW 9 21 -7 6.5699 2.5 -7 7.5699 2.5 1.e-3GW 10 21 -9.9289 -0.5 2.5 -9.9289 0.5 2.5 1.e-3GW 11 21 -7 -7.572 2.5 -7 -6.572 2.5 1.e-3GW 12 21 0.0711 -10.5 2.5 0.0711 -9.5 2.5 1.e-3GW 13 21 7.1422 -7.57 2.5 7.1422 -6.57 2.5 1.e-3GW 14 21 10.0711 -0.5 2.5 10.0711 0.5 2.5 1.e-3GW 15 21 7.1422 6.572 2.5 7.1422 7.572 2.5 1.e-3GW 33 21 -7.6537 17.977 2.5 -7.6537 18.977 2.5 1.e-3GW 34 21 -14.1421 13.64 2.5 -14.1421 14.64 2.5 1.e-3GW 35 21 -18.4776 7.15 2.5 -18.4776 8.15 2.5 1.e-3
138

B.1. ELECTROMAGNETIC BEAM WITH ORBITAL ANGULAR MOMENTUM
GW 36 21 -20 -0.5 2.5 -20 0.5 2.5 1.e-3GW 37 21 -18.5 -8.25 2.5 -18.5 -7.25 2.5 1.e-3GW 38 21 -14.1645 -14.7385 2.5 -14.1645 -13.7385 2.5 1.e-3GW 39 21 -7.65375 -18.9775 2.5 -7.65375 -17.9775 2.5 1.e-3GW 40 21 0 -20.5 2.5 0 -19.5 2.5 1.e-3GW 41 21 7.6537 -18.9776 2.5 7.6537 -17.9776 2.5 1.e-3GW 42 21 14.1421 -14.6422 2.5 14.1421 -13.6422 2.5 1.e-3GW 43 21 18.4776 -8.1536 2.5 18.4776 -7.1536 2.5 1.e-3GW 44 21 20 -0.5 2.5 20 0.5 2.5 1.e-3GW 45 21 18.5 7.25 2.5 18.5 8.25 2.5 1.e-3GW 46 21 14.1421 13.6421 2.5 14.1421 14.6421 2.5 1.e-3GW 47 21 7.6537 17.9776 2.5 7.6537 18.9776 2.5 1.e-3GW 48 21 0 19.5 2.5 0 20.5 2.5 1.e-3GW 16 21 0.0711 9.5 2.5 0.0711 10.5 2.5 1.e-3GE 0EX 6 9 11 0 -0.71 0.707EX 6 10 11 0 -1 1.e-16EX 6 11 11 0 -0.71 -0.71EX 6 12 11 0 6.e-17 -1EX 6 13 11 0 0.71 -0.71EX 6 14 11 0 1 0EX 6 15 11 0 0.707 0.707EX 6 16 11 0 6.e-17 1.001EX 6 33 11 0 -0.38 0.926EX 6 35 11 0 -0.93 0.383EX 6 36 11 0 -1 1.e-16EX 6 37 11 0 -0.93 -0.38EX 6 38 11 0 -0.71 -0.71EX 6 39 11 0 -0.37 -0.92EX 6 40 11 0 6.e-17 -1EX 6 41 11 0 0.381 -0.92EX 6 42 11 0 0.71 -0.71EX 6 43 11 0 0.93 -0.38EX 6 44 11 0 1 0EX 6 45 11 0 0.928 0.384EX 6 46 11 0 0.707 0.707EX 6 47 11 0 0.383 0.926EX 6 48 11 0 6.e-17 1EX 6 34 11 0 -0.71 0.707GN 1FR 0 1 0 0 27.2545455 0EN
B.1.3 L2.txt
139

APPENDIX B. NEC INPUT FILES
CEGW 9 21 -7 6.5699 2.5 -7 7.5699 2.5 1.e-3GW 10 21 -9.9289 -0.5 2.5 -9.9289 0.5 2.5 1.e-3GW 11 21 -7 -7.572 2.5 -7 -6.572 2.5 1.e-3GW 12 21 0.0711 -10.5 2.5 0.0711 -9.5 2.5 1.e-3GW 13 21 7.1422 -7.57 2.5 7.1422 -6.57 2.5 1.e-3GW 14 21 10.0711 -0.5 2.5 10.0711 0.5 2.5 1.e-3GW 15 21 7.1422 6.572 2.5 7.1422 7.572 2.5 1.e-3GW 33 21 -7.6537 17.977 2.5 -7.6537 18.977 2.5 1.e-3GW 34 21 -14.1421 13.64 2.5 -14.1421 14.64 2.5 1.e-3GW 35 21 -18.4776 7.15 2.5 -18.4776 8.15 2.5 1.e-3GW 36 21 -20 -0.5 2.5 -20 0.5 2.5 1.e-3GW 37 21 -18.5 -8.25 2.5 -18.5 -7.25 2.5 1.e-3GW 38 21 -14.1645 -14.7385 2.5 -14.1645 -13.7385 2.5 1.e-3GW 39 21 -7.65375 -18.9775 2.5 -7.65375 -17.9775 2.5 1.e-3GW 40 21 0 -20.5 2.5 0 -19.5 2.5 1.e-3GW 41 21 7.6537 -18.9776 2.5 7.6537 -17.9776 2.5 1.e-3GW 42 21 14.1421 -14.6422 2.5 14.1421 -13.6422 2.5 1.e-3GW 43 21 18.4776 -8.1536 2.5 18.4776 -7.1536 2.5 1.e-3GW 44 21 20 -0.5 2.5 20 0.5 2.5 1.e-3GW 45 21 18.5 7.25 2.5 18.5 8.25 2.5 1.e-3GW 46 21 14.1421 13.6421 2.5 14.1421 14.6421 2.5 1.e-3GW 47 21 7.6537 17.9776 2.5 7.6537 18.9776 2.5 1.e-3GW 48 21 0 19.5 2.5 0 20.5 2.5 1.e-3GW 16 21 0.0711 9.5 2.5 0.0711 10.5 2.5 1.e-3GE 0EX 6 9 11 0 6.e-17 -1EX 6 10 11 0 1 0EX 6 11 11 0 6.e-17 1EX 6 12 11 0 -1 1.e-16EX 6 13 11 0 6.e-17 -1EX 6 14 11 0 1 0EX 6 15 11 0 6.e-17 1EX 6 16 11 0 -1 1.e-16EX 6 33 11 0 -0.71 -0.71EX 6 35 11 0 0.709 -0.71EX 6 36 11 0 1 0EX 6 37 11 0 0.71 0.71EX 6 38 11 0 6.e-17 1EX 6 39 11 0 -0.7 0.702EX 6 40 11 0 -1 1.e-16EX 6 41 11 0 -0.71 -0.71EX 6 42 11 0 6.e-17 -1EX 6 43 11 0 0.711 -0.71EX 6 44 11 0 1 0
140
B.1. ELECTROMAGNETIC BEAM WITH ORBITAL ANGULAR MOMENTUM
EX 6 45 11 0 0.71 0.71EX 6 46 11 0 6.e-17 1EX 6 47 11 0 -0.71 0.709EX 6 48 11 0 -1 1.e-16EX 6 34 11 0 6.e-17 -1GN 1FR 0 1 0 0 27.2545455 0EN
B.1.4 L4.txt
CEGW 9 21 -7 6.5699 2.5 -7 7.5699 2.5 1.e-3GW 10 21 -9.9289 -0.5 2.5 -9.9289 0.5 2.5 1.e-3GW 11 21 -7 -7.572 2.5 -7 -6.572 2.5 1.e-3GW 12 21 0.0711 -10.5 2.5 0.0711 -9.5 2.5 1.e-3GW 13 21 7.1422 -7.57 2.5 7.1422 -6.57 2.5 1.e-3GW 14 21 10.0711 -0.5 2.5 10.0711 0.5 2.5 1.e-3GW 15 21 7.1422 6.572 2.5 7.1422 7.572 2.5 1.e-3GW 33 21 -7.6537 17.977 2.5 -7.6537 18.977 2.5 1.e-3GW 34 21 -14.1421 13.64 2.5 -14.1421 14.64 2.5 1.e-3GW 35 21 -18.4776 7.15 2.5 -18.4776 8.15 2.5 1.e-3GW 36 21 -20 -0.5 2.5 -20 0.5 2.5 1.e-3GW 37 21 -18.5 -8.25 2.5 -18.5 -7.25 2.5 1.e-3GW 38 21 -14.1645 -14.7385 2.5 -14.1645 -13.7385 2.5 1.e-3GW 39 21 -7.65375 -18.9775 2.5 -7.65375 -17.9775 2.5 1.e-3GW 40 21 0 -20.5 2.5 0 -19.5 2.5 1.e-3GW 41 21 7.6537 -18.9776 2.5 7.6537 -17.9776 2.5 1.e-3GW 42 21 14.1421 -14.6422 2.5 14.1421 -13.6422 2.5 1.e-3GW 43 21 18.4776 -8.1536 2.5 18.4776 -7.1536 2.5 1.e-3GW 44 21 20 -0.5 2.5 20 0.5 2.5 1.e-3GW 45 21 18.5 7.25 2.5 18.5 8.25 2.5 1.e-3GW 46 21 14.1421 13.6421 2.5 14.1421 14.6421 2.5 1.e-3GW 47 21 7.6537 17.9776 2.5 7.6537 18.9776 2.5 1.e-3GW 48 21 0 19.5 2.5 0 20.5 2.5 1.e-3GW 16 21 0.0711 9.5 2.5 0.0711 10.5 2.5 1.e-3GE 0EX 6 9 11 0 -1 1.e-16EX 6 10 11 0 1 0EX 6 11 11 0 -1 1.e-16EX 6 12 11 0 1 0EX 6 13 11 0 -1 1.e-16EX 6 14 11 0 1 0EX 6 15 11 0 -1 1.e-16
141

APPENDIX B. NEC INPUT FILES
EX 6 16 11 0 1.001 0EX 6 33 11 0 6.e-17 1EX 6 35 11 0 0 -1EX 6 36 11 0 1 0EX 6 37 11 0 6.e-17 1EX 6 38 11 0 -1 1.e-16EX 6 39 11 0 0 -1EX 6 40 11 0 1 0EX 6 41 11 0 6.e-17 0.999EX 6 42 11 0 -1 1.e-16EX 6 43 11 0 0 -1.01EX 6 44 11 0 1 0EX 6 45 11 0 6.e-17 1.007EX 6 46 11 0 -1 1.e-16EX 6 47 11 0 0 -1EX 6 48 11 0 1 0EX 6 34 11 0 -1 1.e-16GN 1FR 0 1 0 0 27.2545455 0EN
B.2 Multiple beam interference
B.2.1 L01_L02.txt
CEGW 9 21 -7 6.5699 2.5 -7 7.5699 2.5 1.e-3GW 10 21 -9.9289 -0.5 2.5 -9.9289 0.5 2.5 1.e-3GW 11 21 -7 -7.572 2.5 -7 -6.572 2.5 1.e-3GW 12 21 0.0711 -10.5 2.5 0.0711 -9.5 2.5 1.e-3GW 13 21 7.1422 -7.57 2.5 7.1422 -6.57 2.5 1.e-3GW 14 21 10.0711 -0.5 2.5 10.0711 0.5 2.5 1.e-3GW 15 21 7.1422 6.572 2.5 7.1422 7.572 2.5 1.e-3GW 33 21 -7.6537 17.977 2.5 -7.6537 18.977 2.5 1.e-3GW 34 21 -14.1421 13.64 2.5 -14.1421 14.64 2.5 1.e-3GW 35 21 -18.4776 7.15 2.5 -18.4776 8.15 2.5 1.e-3GW 36 21 -20 -0.5 2.5 -20 0.5 2.5 1.e-3GW 37 21 -18.5 -8.25 2.5 -18.5 -7.25 2.5 1.e-3GW 38 21 -14.1645 -14.7385 2.5 -14.1645 -13.7385 2.5 1.e-3GW 39 21 -7.65375 -18.9775 2.5 -7.65375 -17.9775 2.5 1.e-3GW 40 21 0 -20.5 2.5 0 -19.5 2.5 1.e-3GW 41 21 7.6537 -18.9776 2.5 7.6537 -17.9776 2.5 1.e-3GW 42 21 14.1421 -14.6422 2.5 14.1421 -13.6422 2.5 1.e-3
142

B.2. MULTIPLE BEAM INTERFERENCE
GW 43 21 18.4776 -8.1536 2.5 18.4776 -7.1536 2.5 1.e-3GW 44 21 20 -0.5 2.5 20 0.5 2.5 1.e-3GW 45 21 18.5 7.25 2.5 18.5 8.25 2.5 1.e-3GW 46 21 14.1421 13.6421 2.5 14.1421 14.6421 2.5 1.e-3GW 47 21 7.6537 17.9776 2.5 7.6537 18.9776 2.5 1.e-3GW 48 21 0 19.5 2.5 0 20.5 2.5 1.e-3GW 16 21 0.0711 9.5 2.5 0.0711 10.5 2.5 1.e-3GE 0EX 6 9 11 0 -0.71 0.707EX 6 10 11 0 -1 1.e-16EX 6 11 11 0 -0.71 -0.71EX 6 12 11 0 6.e-17 -1EX 6 13 11 0 0.71 -0.71EX 6 14 11 0 1 0EX 6 15 11 0 0.709 0.709EX 6 16 11 0 6.e-17 1.001EX 6 33 11 0 -0.71 -0.71EX 6 35 11 0 0.705 -0.7EX 6 36 11 0 1 0EX 6 37 11 0 0.701 0.701EX 6 38 11 0 6.e-17 1.004EX 6 39 11 0 -0.7 0.701EX 6 40 11 0 -1 1.e-16EX 6 41 11 0 -0.7 -0.7EX 6 42 11 0 6.e-17 -1EX 6 43 11 0 0.713 -0.71EX 6 44 11 0 1 0EX 6 45 11 0 0.712 0.712EX 6 46 11 0 6.e-17 1.003EX 6 47 11 0 -0.71 0.707EX 6 48 11 0 -1 1.e-16EX 6 34 11 0 6.e-17 -1GN 1FR 0 1 0 0 14.99 0EN
B.2.2 L01_L04.txt
CEGW 9 21 -7 6.5699 2.5 -7 7.5699 2.5 1.e-3GW 10 21 -9.9289 -0.5 2.5 -9.9289 0.5 2.5 1.e-3GW 11 21 -7 -7.572 2.5 -7 -6.572 2.5 1.e-3GW 12 21 0.0711 -10.5 2.5 0.0711 -9.5 2.5 1.e-3GW 13 21 7.1422 -7.57 2.5 7.1422 -6.57 2.5 1.e-3
143

APPENDIX B. NEC INPUT FILES
GW 14 21 10.0711 -0.5 2.5 10.0711 0.5 2.5 1.e-3GW 15 21 7.1422 6.572 2.5 7.1422 7.572 2.5 1.e-3GW 33 21 -7.6537 17.977 2.5 -7.6537 18.977 2.5 1.e-3GW 34 21 -14.1421 13.64 2.5 -14.1421 14.64 2.5 1.e-3GW 35 21 -18.4776 7.15 2.5 -18.4776 8.15 2.5 1.e-3GW 36 21 -20 -0.5 2.5 -20 0.5 2.5 1.e-3GW 37 21 -18.5 -8.25 2.5 -18.5 -7.25 2.5 1.e-3GW 38 21 -14.1645 -14.7385 2.5 -14.1645 -13.7385 2.5 1.e-3GW 39 21 -7.65375 -18.9775 2.5 -7.65375 -17.9775 2.5 1.e-3GW 40 21 0 -20.5 2.5 0 -19.5 2.5 1.e-3GW 41 21 7.6537 -18.9776 2.5 7.6537 -17.9776 2.5 1.e-3GW 42 21 14.1421 -14.6422 2.5 14.1421 -13.6422 2.5 1.e-3GW 43 21 18.4776 -8.1536 2.5 18.4776 -7.1536 2.5 1.e-3GW 44 21 20 -0.5 2.5 20 0.5 2.5 1.e-3GW 45 21 18.5 7.25 2.5 18.5 8.25 2.5 1.e-3GW 46 21 14.1421 13.6421 2.5 14.1421 14.6421 2.5 1.e-3GW 47 21 7.6537 17.9776 2.5 7.6537 18.9776 2.5 1.e-3GW 48 21 0 19.5 2.5 0 20.5 2.5 1.e-3GW 16 21 0.0711 9.5 2.5 0.0711 10.5 2.5 1.e-3GE 0EX 6 9 11 0 -0.71 0.707EX 6 10 11 0 -1 1.e-16EX 6 11 11 0 -0.71 -0.71EX 6 12 11 0 6.e-17 -1EX 6 13 11 0 0.71 -0.71EX 6 14 11 0 1 0EX 6 15 11 0 0.709 0.709EX 6 16 11 0 6.e-17 1.001EX 6 33 11 0 6.e-17 1.004EX 6 35 11 0 6.e-17 -0.99EX 6 36 11 0 1 0EX 6 37 11 0 6.e-17 0.991EX 6 38 11 0 -1 1.e-16EX 6 39 11 0 6.e-17 -0.99EX 6 40 11 0 1 0EX 6 41 11 0 6.e-17 0.99EX 6 42 11 0 -1 1.e-16EX 6 43 11 0 6.e-17 -1.01EX 6 44 11 0 1 0EX 6 45 11 0 6.e-17 1.007EX 6 46 11 0 -1 1.e-16EX 6 47 11 0 6.e-17 -1EX 6 48 11 0 1 0EX 6 34 11 0 -1 1.e-16GN 1
144

B.2. MULTIPLE BEAM INTERFERENCE
FR 0 1 0 0 14.99 0EN
B.2.3 L02_L04.txt
CEGW 9 21 -7 6.5699 2.5 -7 7.5699 2.5 1.e-3GW 10 21 -9.9289 -0.5 2.5 -9.9289 0.5 2.5 1.e-3GW 11 21 -7 -7.572 2.5 -7 -6.572 2.5 1.e-3GW 12 21 0.0711 -10.5 2.5 0.0711 -9.5 2.5 1.e-3GW 13 21 7.1422 -7.57 2.5 7.1422 -6.57 2.5 1.e-3GW 14 21 10.0711 -0.5 2.5 10.0711 0.5 2.5 1.e-3GW 15 21 7.1422 6.572 2.5 7.1422 7.572 2.5 1.e-3GW 33 21 -7.6537 17.977 2.5 -7.6537 18.977 2.5 1.e-3GW 34 21 -14.1421 13.64 2.5 -14.1421 14.64 2.5 1.e-3GW 35 21 -18.4776 7.15 2.5 -18.4776 8.15 2.5 1.e-3GW 36 21 -20 -0.5 2.5 -20 0.5 2.5 1.e-3GW 37 21 -18.5 -8.25 2.5 -18.5 -7.25 2.5 1.e-3GW 38 21 -14.1645 -14.7385 2.5 -14.1645 -13.7385 2.5 1.e-3GW 39 21 -7.65375 -18.9775 2.5 -7.65375 -17.9775 2.5 1.e-3GW 40 21 0 -20.5 2.5 0 -19.5 2.5 1.e-3GW 41 21 7.6537 -18.9776 2.5 7.6537 -17.9776 2.5 1.e-3GW 42 21 14.1421 -14.6422 2.5 14.1421 -13.6422 2.5 1.e-3GW 43 21 18.4776 -8.1536 2.5 18.4776 -7.1536 2.5 1.e-3GW 44 21 20 -0.5 2.5 20 0.5 2.5 1.e-3GW 45 21 18.5 7.25 2.5 18.5 8.25 2.5 1.e-3GW 46 21 14.1421 13.6421 2.5 14.1421 14.6421 2.5 1.e-3GW 47 21 7.6537 17.9776 2.5 7.6537 18.9776 2.5 1.e-3GW 48 21 0 19.5 2.5 0 20.5 2.5 1.e-3GW 16 21 0.0711 9.5 2.5 0.0711 10.5 2.5 1.e-3GE 0EX 6 9 11 0 6.e-17 -1EX 6 10 11 0 1 0EX 6 11 11 0 6.e-17 1.004EX 6 12 11 0 -1 1.e-16EX 6 13 11 0 6.e-17 -1EX 6 14 11 0 1 0EX 6 15 11 0 6.e-17 1.003EX 6 16 11 0 -1 1.e-16EX 6 33 11 0 6.e-17 1.004EX 6 35 11 0 6.e-17 -0.99EX 6 36 11 0 1 0EX 6 37 11 0 6.e-17 0.991EX 6 38 11 0 -1 1.e-16
145

APPENDIX B. NEC INPUT FILES
EX 6 39 11 0 6.e-17 -0.99EX 6 40 11 0 1 0EX 6 41 11 0 6.e-17 0.99EX 6 42 11 0 -1 1.e-16EX 6 43 11 0 6.e-17 -1.01EX 6 44 11 0 1 0EX 6 45 11 0 6.e-17 1.007EX 6 46 11 0 -1 1.e-16EX 6 47 11 0 6.e-17 -1EX 6 48 11 0 1 0EX 6 34 11 0 -1 1.e-16GN 1FR 0 1 0 0 14.99 0EN
B.3 Rotation of main lobe
B.3.1 L01_L02_45deg.txt
CEGW 9 21 -7 6.5699 2.5 -7 7.5699 2.5 1.e-3GW 10 21 -9.9289 -0.5 2.5 -9.9289 0.5 2.5 1.e-3GW 11 21 -7 -7.572 2.5 -7 -6.572 2.5 1.e-3GW 12 21 0.0711 -10.5 2.5 0.0711 -9.5 2.5 1.e-3GW 13 21 7.1422 -7.57 2.5 7.1422 -6.57 2.5 1.e-3GW 14 21 10.0711 -0.5 2.5 10.0711 0.5 2.5 1.e-3GW 15 21 7.1422 6.572 2.5 7.1422 7.572 2.5 1.e-3GW 33 21 -7.6537 17.977 2.5 -7.6537 18.977 2.5 1.e-3GW 34 21 -14.1421 13.64 2.5 -14.1421 14.64 2.5 1.e-3GW 35 21 -18.4776 7.15 2.5 -18.4776 8.15 2.5 1.e-3GW 36 21 -20 -0.5 2.5 -20 0.5 2.5 1.e-3GW 37 21 -18.5 -8.25 2.5 -18.5 -7.25 2.5 1.e-3GW 38 21 -14.1645 -14.7385 2.5 -14.1645 -13.7385 2.5 1.e-3GW 39 21 -7.65375 -18.9775 2.5 -7.65375 -17.9775 2.5 1.e-3GW 40 21 0 -20.5 2.5 0 -19.5 2.5 1.e-3GW 41 21 7.6537 -18.9776 2.5 7.6537 -17.9776 2.5 1.e-3GW 42 21 14.1421 -14.6422 2.5 14.1421 -13.6422 2.5 1.e-3GW 43 21 18.4776 -8.1536 2.5 18.4776 -7.1536 2.5 1.e-3GW 44 21 20 -0.5 2.5 20 0.5 2.5 1.e-3GW 45 21 18.5 7.25 2.5 18.5 8.25 2.5 1.e-3GW 46 21 14.1421 13.6421 2.5 14.1421 14.6421 2.5 1.e-3GW 47 21 7.6537 17.9776 2.5 7.6537 18.9776 2.5 1.e-3GW 48 21 0 19.5 2.5 0 20.5 2.5 1.e-3
146

B.4. NON LINEARLY POLARIZED BEAMS
GW 16 21 0.0711 9.5 2.5 0.0711 10.5 2.5 1.e-3GE 0EX 6 9 11 0 -0.71 0.707EX 6 10 11 0 -1 1.e-16EX 6 11 11 0 -0.71 -0.71EX 6 12 11 0 6.e-17 -1EX 6 13 11 0 0.71 -0.71EX 6 14 11 0 1 0EX 6 15 11 0 0.709 0.709EX 6 16 11 0 6.e-17 1EX 6 33 11 0 -1 1.e-16EX 6 35 11 0 6.e-17 -0.99EX 6 36 11 0 0.707 -0.71EX 6 37 11 0 0.991 0EX 6 38 11 0 0.71 0.71EX 6 39 11 0 6.e-17 0.991EX 6 40 11 0 -0.71 0.707EX 6 41 11 0 -0.99 1.e-16EX 6 42 11 0 -0.71 -0.71EX 6 43 11 0 6.e-17 -1.01EX 6 44 11 0 0.707 -0.71EX 6 45 11 0 1.007 0EX 6 46 11 0 0.709 0.709EX 6 47 11 0 6.e-17 1.002EX 6 48 11 0 -0.71 0.707EX 6 34 11 0 -0.71 -0.71GN 1FR 0 1 0 0 14.99 0EN
B.4 Non linearly polarized beams
B.4.1 Five element crossed dipole array
Left-hand polarized, l = −2
CEGW 1 3 0.2 0.03 0.01 0.2 -0.03 0.01 1.e-3GW 2 3 0.06 0.22 0.01 0.06 0.16 0.01 1.e-3GW 3 3 -0.17 0.14 0.01 -0.17 0.08 0.01 1.e-3GW 4 3 -0.16 -0.09 0.01 -0.16 -0.15 0.01 1.e-3GW 5 3 0.06 -0.16 0.01 0.06 -0.22 0.01 1.e-3GW 6 3 0.17 -1.388e-17 9.e-3 0.23 0 9.e-3 1.e-3
147
APPENDIX B. NEC INPUT FILES
GW 7 3 0.03 0.19 9.e-3 0.09 0.19 9.e-3 1.e-3GW 8 3 -0.2 0.11 9.e-3 -0.14 0.11 9.e-3 1.e-3GW 9 3 -0.19 -0.12 9.e-3 -0.13 -0.12 9.e-3 1.e-3GW 10 3 0.03 -0.19 9.e-3 0.09 -0.19 9.e-3 1.e-3GE 0EX 0 1 2 0 1 0EX 0 2 2 0 -0.81 -0.59EX 0 3 2 0 0.309 0.95EX 0 4 2 0 0.309 -0.95EX 0 5 2 0 -0.81 0.589EX 0 6 2 0 6.e-17 1EX 0 7 2 0 0.589 -0.81EX 0 8 2 0 -0.95 0.309EX 0 9 2 0 0.95 0.309EX 0 10 2 0 -0.59 -0.81GN 1FR 0 1 0 0 300 0EN
Left-hand polarized, l = −1
CEGW 1 3 0.2 0.03 0.01 0.2 -0.03 0.01 1.e-3GW 2 3 0.06 0.22 0.01 0.06 0.16 0.01 1.e-3GW 3 3 -0.17 0.14 0.01 -0.17 0.08 0.01 1.e-3GW 4 3 -0.16 -0.09 0.01 -0.16 -0.15 0.01 1.e-3GW 5 3 0.06 -0.16 0.01 0.06 -0.22 0.01 1.e-3GW 6 3 0.17 -1.388e-17 9.e-3 0.23 0 9.e-3 1.e-3GW 7 3 0.03 0.19 9.e-3 0.09 0.19 9.e-3 1.e-3GW 8 3 -0.2 0.11 9.e-3 -0.14 0.11 9.e-3 1.e-3GW 9 3 -0.19 -0.12 9.e-3 -0.13 -0.12 9.e-3 1.e-3GW 10 3 0.03 -0.19 9.e-3 0.09 -0.19 9.e-3 1.e-3GE 0EX 0 1 2 0 1 0EX 0 2 2 0 0.31 -0.95EX 0 3 2 0 -0.81 -0.59EX 0 4 2 0 -0.81 0.587EX 0 5 2 0 0.31 0.953EX 0 6 2 0 6.e-17 1EX 0 7 2 0 0.953 0.31EX 0 8 2 0 0.587 -0.81EX 0 9 2 0 -0.59 -0.81EX 0 10 2 0 -0.95 0.31GN 1
148

B.4. NON LINEARLY POLARIZED BEAMS
FR 0 1 0 0 300 0EN
Left-hand polarized, l = 0
CEGW 1 3 0.2 0.03 0.01 0.2 -0.03 0.01 1.e-3GW 2 3 0.06 0.22 0.01 0.06 0.16 0.01 1.e-3GW 3 3 -0.17 0.14 0.01 -0.17 0.08 0.01 1.e-3GW 4 3 -0.16 -0.09 0.01 -0.16 -0.15 0.01 1.e-3GW 5 3 0.06 -0.16 0.01 0.06 -0.22 0.01 1.e-3GW 6 3 0.17 -1.388e-17 9.e-3 0.23 0 9.e-3 1.e-3GW 7 3 0.03 0.19 9.e-3 0.09 0.19 9.e-3 1.e-3GW 8 3 -0.2 0.11 9.e-3 -0.14 0.11 9.e-3 1.e-3GW 9 3 -0.19 -0.12 9.e-3 -0.13 -0.12 9.e-3 1.e-3GW 10 3 0.03 -0.19 9.e-3 0.09 -0.19 9.e-3 1.e-3GE 0EX 0 1 2 0 1 0EX 0 2 2 0 0.999 0EX 0 3 2 0 1.002 0EX 0 4 2 0 1 0EX 0 5 2 0 1.002 0EX 0 6 2 0 6.e-17 1EX 0 7 2 0 6.e-17 1.002EX 0 8 2 0 6.e-17 1EX 0 9 2 0 6.e-17 1.002EX 0 10 2 0 6.e-17 0.999GN 1FR 0 1 0 0 300 0EN
Left-hand polarized, l = 1
CEGW 1 3 0.2 0.03 0.01 0.2 -0.03 0.01 1.e-3GW 2 3 0.06 0.22 0.01 0.06 0.16 0.01 1.e-3GW 3 3 -0.17 0.14 0.01 -0.17 0.08 0.01 1.e-3GW 4 3 -0.16 -0.09 0.01 -0.16 -0.15 0.01 1.e-3GW 5 3 0.06 -0.16 0.01 0.06 -0.22 0.01 1.e-3GW 6 3 0.17 -1.388e-17 9.e-3 0.23 0 9.e-3 1.e-3GW 7 3 0.03 0.19 9.e-3 0.09 0.19 9.e-3 1.e-3GW 8 3 -0.2 0.11 9.e-3 -0.14 0.11 9.e-3 1.e-3GW 9 3 -0.19 -0.12 9.e-3 -0.13 -0.12 9.e-3 1.e-3
149

APPENDIX B. NEC INPUT FILES
GW 10 3 0.03 -0.19 9.e-3 0.09 -0.19 9.e-3 1.e-3GE 0EX 0 1 2 0 1 0EX 0 2 2 0 0.309 0.95EX 0 3 2 0 -0.81 0.589EX 0 4 2 0 -0.81 -0.59EX 0 5 2 0 0.309 -0.95EX 0 6 2 0 6.e-17 1EX 0 7 2 0 -0.95 0.31EX 0 8 2 0 -0.59 -0.81EX 0 9 2 0 0.589 -0.81EX 0 10 2 0 0.95 0.309GN 1FR 0 1 0 0 300 0EN
Left-hand polarized, l = 2
CEGW 1 3 0.2 0.03 0.01 0.2 -0.03 0.01 1.e-3GW 2 3 0.06 0.22 0.01 0.06 0.16 0.01 1.e-3GW 3 3 -0.17 0.14 0.01 -0.17 0.08 0.01 1.e-3GW 4 3 -0.16 -0.09 0.01 -0.16 -0.15 0.01 1.e-3GW 5 3 0.06 -0.16 0.01 0.06 -0.22 0.01 1.e-3GW 6 3 0.17 -1.388e-17 9.e-3 0.23 0 9.e-3 1.e-3GW 7 3 0.03 0.19 9.e-3 0.09 0.19 9.e-3 1.e-3GW 8 3 -0.2 0.11 9.e-3 -0.14 0.11 9.e-3 1.e-3GW 9 3 -0.19 -0.12 9.e-3 -0.13 -0.12 9.e-3 1.e-3GW 10 3 0.03 -0.19 9.e-3 0.09 -0.19 9.e-3 1.e-3GE 0EX 0 1 2 0 1 0EX 0 2 2 0 -0.81 0.586EX 0 3 2 0 0.309 -0.95EX 0 4 2 0 0.31 0.953EX 0 5 2 0 -0.81 -0.59EX 0 6 2 0 6.e-17 1EX 0 7 2 0 -0.59 -0.81EX 0 8 2 0 0.953 0.31EX 0 9 2 0 -0.95 0.309EX 0 10 2 0 0.586 -0.81GN 1FR 0 1 0 0 299.8 0EN
150

B.4. NON LINEARLY POLARIZED BEAMS
Right-hand polarized, l = −2
CEGW 1 3 0.2 0.03 0.01 0.2 -0.03 0.01 1.e-3GW 2 3 0.06 0.22 0.01 0.06 0.16 0.01 1.e-3GW 3 3 -0.17 0.14 0.01 -0.17 0.08 0.01 1.e-3GW 4 3 -0.16 -0.09 0.01 -0.16 -0.15 0.01 1.e-3GW 5 3 0.06 -0.16 0.01 0.06 -0.22 0.01 1.e-3GW 6 3 0.17 -1.388e-17 9.e-3 0.23 0 9.e-3 1.e-3GW 7 3 0.03 0.19 9.e-3 0.09 0.19 9.e-3 1.e-3GW 8 3 -0.2 0.11 9.e-3 -0.14 0.11 9.e-3 1.e-3GW 9 3 -0.19 -0.12 9.e-3 -0.13 -0.12 9.e-3 1.e-3GW 10 3 0.03 -0.19 9.e-3 0.09 -0.19 9.e-3 1.e-3GE 0EX 0 1 2 0 6.e-17 1EX 0 2 2 0 0.586 -0.81EX 0 3 2 0 -0.95 0.31EX 0 4 2 0 0.953 0.31EX 0 5 2 0 -0.59 -0.81EX 0 6 2 0 1 0EX 0 7 2 0 -0.81 -0.59EX 0 8 2 0 0.309 0.95EX 0 9 2 0 0.31 -0.95EX 0 10 2 0 -0.81 0.589GN 1FR 0 1 0 0 300 0EN
Right-hand polarized, l = −1
CEGW 1 3 0.2 0.03 0.01 0.2 -0.03 0.01 1.e-3GW 2 3 0.06 0.22 0.01 0.06 0.16 0.01 1.e-3GW 3 3 -0.17 0.14 0.01 -0.17 0.08 0.01 1.e-3GW 4 3 -0.16 -0.09 0.01 -0.16 -0.15 0.01 1.e-3GW 5 3 0.06 -0.16 0.01 0.06 -0.22 0.01 1.e-3GW 6 3 0.17 -1.388e-17 9.e-3 0.23 0 9.e-3 1.e-3GW 7 3 0.03 0.19 9.e-3 0.09 0.19 9.e-3 1.e-3GW 8 3 -0.2 0.11 9.e-3 -0.14 0.11 9.e-3 1.e-3GW 9 3 -0.19 -0.12 9.e-3 -0.13 -0.12 9.e-3 1.e-3GW 10 3 0.03 -0.19 9.e-3 0.09 -0.19 9.e-3 1.e-3GE 0EX 0 1 2 0 6.e-17 1
151

APPENDIX B. NEC INPUT FILES
EX 0 2 2 0 0.95 0.309EX 0 3 2 0 0.589 -0.81EX 0 4 2 0 -0.59 -0.81EX 0 5 2 0 -0.95 0.31EX 0 6 2 0 1 0EX 0 7 2 0 0.31 -0.95EX 0 8 2 0 -0.81 -0.59EX 0 9 2 0 -0.81 0.589EX 0 10 2 0 0.309 0.95GN 1FR 0 1 0 0 300 0EN
Right-hand polarized, l = 0
CEGW 1 3 0.2 0.03 0.01 0.2 -0.03 0.01 1.e-3GW 2 3 0.06 0.22 0.01 0.06 0.16 0.01 1.e-3GW 3 3 -0.17 0.14 0.01 -0.17 0.08 0.01 1.e-3GW 4 3 -0.16 -0.09 0.01 -0.16 -0.15 0.01 1.e-3GW 5 3 0.06 -0.16 0.01 0.06 -0.22 0.01 1.e-3GW 6 3 0.17 -1.388e-17 9.e-3 0.23 0 9.e-3 1.e-3GW 7 3 0.03 0.19 9.e-3 0.09 0.19 9.e-3 1.e-3GW 8 3 -0.2 0.11 9.e-3 -0.14 0.11 9.e-3 1.e-3GW 9 3 -0.19 -0.12 9.e-3 -0.13 -0.12 9.e-3 1.e-3GW 10 3 0.03 -0.19 9.e-3 0.09 -0.19 9.e-3 1.e-3GE 0EX 0 1 2 0 6.e-17 1EX 0 2 2 0 6.e-17 0.999EX 0 3 2 0 6.e-17 1.002EX 0 4 2 0 6.e-17 1EX 0 5 2 0 6.e-17 1.002EX 0 6 2 0 1 0EX 0 7 2 0 1.002 0EX 0 8 2 0 1 0EX 0 9 2 0 1.002 0EX 0 10 2 0 0.999 0GN 1FR 0 1 0 0 300 0EN
Right-hand polarized, l = 1
152

B.4. NON LINEARLY POLARIZED BEAMS
CEGW 1 3 0.2 0.03 0.01 0.2 -0.03 0.01 1.e-3GW 2 3 0.06 0.22 0.01 0.06 0.16 0.01 1.e-3GW 3 3 -0.17 0.14 0.01 -0.17 0.08 0.01 1.e-3GW 4 3 -0.16 -0.09 0.01 -0.16 -0.15 0.01 1.e-3GW 5 3 0.06 -0.16 0.01 0.06 -0.22 0.01 1.e-3GW 6 3 0.17 -1.388e-17 9.e-3 0.23 0 9.e-3 1.e-3GW 7 3 0.03 0.19 9.e-3 0.09 0.19 9.e-3 1.e-3GW 8 3 -0.2 0.11 9.e-3 -0.14 0.11 9.e-3 1.e-3GW 9 3 -0.19 -0.12 9.e-3 -0.13 -0.12 9.e-3 1.e-3GW 10 3 0.03 -0.19 9.e-3 0.09 -0.19 9.e-3 1.e-3GE 0EX 0 1 2 0 6.e-17 1EX 0 2 2 0 -0.95 0.31EX 0 3 2 0 -0.59 -0.81EX 0 4 2 0 0.586 -0.81EX 0 5 2 0 0.953 0.31EX 0 6 2 0 1 0EX 0 7 2 0 0.31 0.953EX 0 8 2 0 -0.81 0.587EX 0 9 2 0 -0.81 -0.59EX 0 10 2 0 0.31 -0.95GN 1FR 0 1 0 0 300 0EN
Right-hand polarized, l = 2
CEGW 1 3 0.2 0.03 0.01 0.2 -0.03 0.01 1.e-3GW 2 3 0.06 0.22 0.01 0.06 0.16 0.01 1.e-3GW 3 3 -0.17 0.14 0.01 -0.17 0.08 0.01 1.e-3GW 4 3 -0.16 -0.09 0.01 -0.16 -0.15 0.01 1.e-3GW 5 3 0.06 -0.16 0.01 0.06 -0.22 0.01 1.e-3GW 6 3 0.17 -1.388e-17 9.e-3 0.23 0 9.e-3 1.e-3GW 7 3 0.03 0.19 9.e-3 0.09 0.19 9.e-3 1.e-3GW 8 3 -0.2 0.11 9.e-3 -0.14 0.11 9.e-3 1.e-3GW 9 3 -0.19 -0.12 9.e-3 -0.13 -0.12 9.e-3 1.e-3GW 10 3 0.03 -0.19 9.e-3 0.09 -0.19 9.e-3 1.e-3GE 0EX 0 1 2 0 6.e-17 1EX 0 2 2 0 -0.59 -0.81EX 0 3 2 0 0.953 0.31EX 0 4 2 0 -0.95 0.309
153

APPENDIX B. NEC INPUT FILES
EX 0 5 2 0 0.589 -0.81EX 0 6 2 0 1 0EX 0 7 2 0 -0.81 0.589EX 0 8 2 0 0.309 -0.95EX 0 9 2 0 0.31 0.953EX 0 10 2 0 -0.81 -0.59GN 1FR 0 1 0 0 300 0EN
B.4.2 Ten element crossed dipole array
Left-hand polarized, l = −4, a = λ
CEGW 1 5 0.9 0.31 0.1 1 0.31 0.1 1.e-3GW 2 5 0.9 -0.31 0.1 1 -0.31 0.1 1.e-3GW 3 5 0.54 -0.81 0.1 0.64 -0.81 0.1 1.e-3GW 4 5 -0.05 -1 0.1 0.05 -1 0.1 1.e-3GW 5 5 -0.64 -0.81 0.1 -0.54 -0.81 0.1 1.e-3GW 6 5 -1 -0.31 0.1 -0.9 -0.31 0.1 1.e-3GW 7 5 -1 0.31 0.1 -0.9 0.31 0.1 1.e-3GW 8 5 -0.64 0.81 0.1 -0.54 0.81 0.1 1.e-3GW 9 5 -0.05 1 0.1 0.05 1 0.1 1.e-3GW 10 5 0.54 0.81 0.1 0.64 0.81 0.1 1.e-3GW 11 5 0 1.05 0.099 0 0.95 0.099 1.e-3GW 12 5 0.59 0.86 0.099 0.59 0.76 0.099 1.e-3GW 13 5 0.95 0.36 0.099 0.95 0.26 0.099 1.e-3GW 14 5 0.95 -0.26 0.099 0.95 -0.36 0.099 1.e-3GW 15 5 0.59 -0.76 0.099 0.59 -0.86 0.099 1.e-3GW 16 5 0 -0.95 0.099 0 -1.05 0.099 1.e-3GW 17 5 -0.59 -0.76 0.099 -0.59 -0.86 0.099 1.e-3GW 18 5 -0.95 -0.26 0.099 -0.95 -0.36 0.099 1.e-3GW 19 5 -0.95 0.36 0.099 -0.95 0.26 0.099 1.e-3GW 20 5 -0.59 0.86 0.099 -0.59 0.76 0.099 1.e-3GE 0EKEX 0 1 3 0 0.95 0.309EX 0 10 3 0 -0.59 -0.81EX 0 9 3 0 6.e-16 1EX 0 8 3 0 0.589 -0.81EX 0 7 3 0 -0.95 0.309EX 0 6 3 0 0.95 0.309EX 0 5 3 0 -0.59 -0.81
154

B.4. NON LINEARLY POLARIZED BEAMS
EX 0 4 3 0 6.e-17 1EX 0 3 3 0 0.589 -0.81EX 0 2 3 0 -0.95 0.309EX 0 13 3 0 0.309 -0.95EX 0 12 3 0 -0.81 0.589EX 0 11 3 0 1 0EX 0 20 3 0 -0.81 -0.59EX 0 19 3 0 0.309 0.95EX 0 18 3 0 0.309 -0.95EX 0 17 3 0 -0.81 0.589EX 0 16 3 0 1 0EX 0 15 3 0 -0.81 -0.59EX 0 14 3 0 0.309 0.95GN 1FR 0 1 0 0 300 0EN
Left-hand polarized, l = −3, a = λ
CEGW 1 5 0.9 0.31 0.1 1 0.31 0.1 1.e-3GW 2 5 0.9 -0.31 0.1 1 -0.31 0.1 1.e-3GW 3 5 0.54 -0.81 0.1 0.64 -0.81 0.1 1.e-3GW 4 5 -0.05 -1 0.1 0.05 -1 0.1 1.e-3GW 5 5 -0.64 -0.81 0.1 -0.54 -0.81 0.1 1.e-3GW 6 5 -1 -0.31 0.1 -0.9 -0.31 0.1 1.e-3GW 7 5 -1 0.31 0.1 -0.9 0.31 0.1 1.e-3GW 8 5 -0.64 0.81 0.1 -0.54 0.81 0.1 1.e-3GW 9 5 -0.05 1 0.1 0.05 1 0.1 1.e-3GW 10 5 0.54 0.81 0.1 0.64 0.81 0.1 1.e-3GW 11 5 0 1.05 0.099 0 0.95 0.099 1.e-3GW 12 5 0.59 0.86 0.099 0.59 0.76 0.099 1.e-3GW 13 5 0.95 0.36 0.099 0.95 0.26 0.099 1.e-3GW 14 5 0.95 -0.26 0.099 0.95 -0.36 0.099 1.e-3GW 15 5 0.59 -0.76 0.099 0.59 -0.86 0.099 1.e-3GW 16 5 0 -0.95 0.099 0 -1.05 0.099 1.e-3GW 17 5 -0.59 -0.76 0.099 -0.59 -0.86 0.099 1.e-3GW 18 5 -0.95 -0.26 0.099 -0.95 -0.36 0.099 1.e-3GW 19 5 -0.95 0.36 0.099 -0.95 0.26 0.099 1.e-3GW 20 5 -0.59 0.86 0.099 -0.59 0.76 0.099 1.e-3GE 0EKEX 0 1 3 0 0.809 0.588EX 0 10 3 0 0.309 -0.95
155

APPENDIX B. NEC INPUT FILES
EX 0 9 3 0 -1 6.e-16EX 0 8 3 0 0.31 0.953EX 0 7 3 0 0.811 -0.59EX 0 6 3 0 -0.81 -0.59EX 0 5 3 0 -0.31 0.953EX 0 4 3 0 1 0EX 0 3 3 0 -0.31 -0.95EX 0 2 3 0 -0.81 0.587EX 0 13 3 0 0.587 -0.81EX 0 12 3 0 -0.95 -0.31EX 0 11 3 0 6.e-17 1EX 0 20 3 0 0.953 -0.31EX 0 19 3 0 -0.59 -0.81EX 0 18 3 0 -0.59 0.811EX 0 17 3 0 0.953 0.31EX 0 16 3 0 0 -1EX 0 15 3 0 -0.95 0.309EX 0 14 3 0 0.586 0.81GN 1FR 0 1 0 0 300 0EN
Left-hand polarized, l = −2, a = λ
CEGW 1 5 0.9 0.31 0.1 1 0.31 0.1 1.e-3GW 2 5 0.9 -0.31 0.1 1 -0.31 0.1 1.e-3GW 3 5 0.54 -0.81 0.1 0.64 -0.81 0.1 1.e-3GW 4 5 -0.05 -1 0.1 0.05 -1 0.1 1.e-3GW 5 5 -0.64 -0.81 0.1 -0.54 -0.81 0.1 1.e-3GW 6 5 -1 -0.31 0.1 -0.9 -0.31 0.1 1.e-3GW 7 5 -1 0.31 0.1 -0.9 0.31 0.1 1.e-3GW 8 5 -0.64 0.81 0.1 -0.54 0.81 0.1 1.e-3GW 9 5 -0.05 1 0.1 0.05 1 0.1 1.e-3GW 10 5 0.54 0.81 0.1 0.64 0.81 0.1 1.e-3GW 11 5 0 1.05 0.099 0 0.95 0.099 1.e-3GW 12 5 0.59 0.86 0.099 0.59 0.76 0.099 1.e-3GW 13 5 0.95 0.36 0.099 0.95 0.26 0.099 1.e-3GW 14 5 0.95 -0.26 0.099 0.95 -0.36 0.099 1.e-3GW 15 5 0.59 -0.76 0.099 0.59 -0.86 0.099 1.e-3GW 16 5 0 -0.95 0.099 0 -1.05 0.099 1.e-3GW 17 5 -0.59 -0.76 0.099 -0.59 -0.86 0.099 1.e-3GW 18 5 -0.95 -0.26 0.099 -0.95 -0.36 0.099 1.e-3GW 19 5 -0.95 0.36 0.099 -0.95 0.26 0.099 1.e-3
156

B.4. NON LINEARLY POLARIZED BEAMS
GW 20 5 -0.59 0.86 0.099 -0.59 0.76 0.099 1.e-3GE 0EKEX 0 1 3 0 0.589 0.811EX 0 10 3 0 0.95 -0.31EX 0 9 3 0 0 -1EX 0 8 3 0 -0.95 -0.31EX 0 7 3 0 -0.59 0.811EX 0 6 3 0 0.589 0.811EX 0 5 3 0 0.95 -0.31EX 0 4 3 0 0 -1EX 0 3 3 0 -0.95 -0.31EX 0 2 3 0 -0.59 0.81EX 0 13 3 0 0.81 -0.59EX 0 12 3 0 -0.31 -0.95EX 0 11 3 0 -1 4.e-16EX 0 20 3 0 -0.31 0.95EX 0 19 3 0 0.811 0.59EX 0 18 3 0 0.811 -0.59EX 0 17 3 0 -0.31 -0.95EX 0 16 3 0 -1 1.e-16EX 0 15 3 0 -0.31 0.95EX 0 14 3 0 0.81 0.588GN 1FR 0 1 0 0 300 0EN
Left-hand polarized, l = 0, a = λ
CEGW 1 5 0.9 0.31 0.1 1 0.31 0.1 1.e-3GW 2 5 0.9 -0.31 0.1 1 -0.31 0.1 1.e-3GW 3 5 0.54 -0.81 0.1 0.64 -0.81 0.1 1.e-3GW 4 5 -0.05 -1 0.1 0.05 -1 0.1 1.e-3GW 5 5 -0.64 -0.81 0.1 -0.54 -0.81 0.1 1.e-3GW 6 5 -1 -0.31 0.1 -0.9 -0.31 0.1 1.e-3GW 7 5 -1 0.31 0.1 -0.9 0.31 0.1 1.e-3GW 8 5 -0.64 0.81 0.1 -0.54 0.81 0.1 1.e-3GW 9 5 -0.05 1 0.1 0.05 1 0.1 1.e-3GW 10 5 0.54 0.81 0.1 0.64 0.81 0.1 1.e-3GW 11 5 0 1.05 0.099 0 0.95 0.099 1.e-3GW 12 5 0.59 0.86 0.099 0.59 0.76 0.099 1.e-3GW 13 5 0.95 0.36 0.099 0.95 0.26 0.099 1.e-3GW 14 5 0.95 -0.26 0.099 0.95 -0.36 0.099 1.e-3
157

APPENDIX B. NEC INPUT FILES
GW 15 5 0.59 -0.76 0.099 0.59 -0.86 0.099 1.e-3GW 16 5 0 -0.95 0.099 0 -1.05 0.099 1.e-3GW 17 5 -0.59 -0.76 0.099 -0.59 -0.86 0.099 1.e-3GW 18 5 -0.95 -0.26 0.099 -0.95 -0.36 0.099 1.e-3GW 19 5 -0.95 0.36 0.099 -0.95 0.26 0.099 1.e-3GW 20 5 -0.59 0.86 0.099 -0.59 0.76 0.099 1.e-3GE 0EKEX 0 1 3 0 6.e-17 1EX 0 10 3 0 6.e-17 0.999EX 0 9 3 0 6.e-17 1EX 0 8 3 0 6.e-17 1EX 0 7 3 0 6.e-17 0.999EX 0 6 3 0 6.e-17 0.999EX 0 5 3 0 6.e-17 1.002EX 0 4 3 0 6.e-17 1EX 0 3 3 0 6.e-17 1EX 0 2 3 0 6.e-17 1.001EX 0 13 3 0 1.001 0EX 0 12 3 0 1 0EX 0 11 3 0 1 0EX 0 20 3 0 1.002 0EX 0 19 3 0 0.999 0EX 0 18 3 0 0.999 0EX 0 17 3 0 1 0EX 0 16 3 0 1 0EX 0 15 3 0 0.999 0EX 0 14 3 0 1 0GN 1FR 0 1 0 0 300 0EN
Left-hand polarized, l = 1, a = λ
CEGW 1 5 0.9 0.31 0.1 1 0.31 0.1 1.e-3GW 2 5 0.9 -0.31 0.1 1 -0.31 0.1 1.e-3GW 3 5 0.54 -0.81 0.1 0.64 -0.81 0.1 1.e-3GW 4 5 -0.05 -1 0.1 0.05 -1 0.1 1.e-3GW 5 5 -0.64 -0.81 0.1 -0.54 -0.81 0.1 1.e-3GW 6 5 -1 -0.31 0.1 -0.9 -0.31 0.1 1.e-3GW 7 5 -1 0.31 0.1 -0.9 0.31 0.1 1.e-3GW 8 5 -0.64 0.81 0.1 -0.54 0.81 0.1 1.e-3GW 9 5 -0.05 1 0.1 0.05 1 0.1 1.e-3
158

B.4. NON LINEARLY POLARIZED BEAMS
GW 10 5 0.54 0.81 0.1 0.64 0.81 0.1 1.e-3GW 11 5 0 1.05 0.099 0 0.95 0.099 1.e-3GW 12 5 0.59 0.86 0.099 0.59 0.76 0.099 1.e-3GW 13 5 0.95 0.36 0.099 0.95 0.26 0.099 1.e-3GW 14 5 0.95 -0.26 0.099 0.95 -0.36 0.099 1.e-3GW 15 5 0.59 -0.76 0.099 0.59 -0.86 0.099 1.e-3GW 16 5 0 -0.95 0.099 0 -1.05 0.099 1.e-3GW 17 5 -0.59 -0.76 0.099 -0.59 -0.86 0.099 1.e-3GW 18 5 -0.95 -0.26 0.099 -0.95 -0.36 0.099 1.e-3GW 19 5 -0.95 0.36 0.099 -0.95 0.26 0.099 1.e-3GW 20 5 -0.59 0.86 0.099 -0.59 0.76 0.099 1.e-3GE 0EKEX 0 1 3 0 0.31 0.953EX 0 10 3 0 0.809 0.588EX 0 9 3 0 1 0EX 0 8 3 0 0.811 -0.59EX 0 7 3 0 0.309 -0.95EX 0 6 3 0 -0.31 -0.95EX 0 5 3 0 -0.81 -0.59EX 0 4 3 0 -1 1.e-16EX 0 3 3 0 -0.81 0.587EX 0 2 3 0 -0.31 0.953EX 0 13 3 0 0.953 -0.31EX 0 12 3 0 0.587 -0.81EX 0 11 3 0 0 -1EX 0 20 3 0 -0.59 -0.81EX 0 19 3 0 -0.95 -0.31EX 0 18 3 0 -0.95 0.309EX 0 17 3 0 -0.59 0.811EX 0 16 3 0 6.e-17 1EX 0 15 3 0 0.586 0.81EX 0 14 3 0 0.952 0.309GN 1FR 0 1 0 0 300 0EN
Left-hand polarized, l = 2, a = λ
CEGW 1 5 0.9 0.31 0.1 1 0.31 0.1 1.e-3GW 2 5 0.9 -0.31 0.1 1 -0.31 0.1 1.e-3GW 3 5 0.54 -0.81 0.1 0.64 -0.81 0.1 1.e-3GW 4 5 -0.05 -1 0.1 0.05 -1 0.1 1.e-3
159

APPENDIX B. NEC INPUT FILES
GW 5 5 -0.64 -0.81 0.1 -0.54 -0.81 0.1 1.e-3GW 6 5 -1 -0.31 0.1 -0.9 -0.31 0.1 1.e-3GW 7 5 -1 0.31 0.1 -0.9 0.31 0.1 1.e-3GW 8 5 -0.64 0.81 0.1 -0.54 0.81 0.1 1.e-3GW 9 5 -0.05 1 0.1 0.05 1 0.1 1.e-3GW 10 5 0.54 0.81 0.1 0.64 0.81 0.1 1.e-3GW 11 5 0 1.05 0.099 0 0.95 0.099 1.e-3GW 12 5 0.59 0.86 0.099 0.59 0.76 0.099 1.e-3GW 13 5 0.95 0.36 0.099 0.95 0.26 0.099 1.e-3GW 14 5 0.95 -0.26 0.099 0.95 -0.36 0.099 1.e-3GW 15 5 0.59 -0.76 0.099 0.59 -0.86 0.099 1.e-3GW 16 5 0 -0.95 0.099 0 -1.05 0.099 1.e-3GW 17 5 -0.59 -0.76 0.099 -0.59 -0.86 0.099 1.e-3GW 18 5 -0.95 -0.26 0.099 -0.95 -0.36 0.099 1.e-3GW 19 5 -0.95 0.36 0.099 -0.95 0.26 0.099 1.e-3GW 20 5 -0.59 0.86 0.099 -0.59 0.76 0.099 1.e-3GE 0EKEX 0 1 3 0 -0.59 0.809EX 0 10 3 0 -0.95 -0.31EX 0 9 3 0 0 -1EX 0 8 3 0 0.953 -0.31EX 0 7 3 0 0.59 0.811EX 0 6 3 0 -0.59 0.811EX 0 5 3 0 -0.95 -0.31EX 0 4 3 0 0 -1EX 0 3 3 0 0.95 -0.31EX 0 2 3 0 0.588 0.809EX 0 13 3 0 0.809 0.588EX 0 12 3 0 -0.31 0.95EX 0 11 3 0 -1 1.e-16EX 0 20 3 0 -0.31 -0.95EX 0 19 3 0 0.811 -0.59EX 0 18 3 0 0.811 0.59EX 0 17 3 0 -0.31 0.953EX 0 16 3 0 -1 4.e-16EX 0 15 3 0 -0.31 -0.95EX 0 14 3 0 0.809 -0.59GN 1FR 0 1 0 0 300 0EN
Left-hand polarized, l = 3, a = λ
160

B.4. NON LINEARLY POLARIZED BEAMS
CEGW 1 5 0.9 0.31 0.1 1 0.31 0.1 1.e-3GW 2 5 0.9 -0.31 0.1 1 -0.31 0.1 1.e-3GW 3 5 0.54 -0.81 0.1 0.64 -0.81 0.1 1.e-3GW 4 5 -0.05 -1 0.1 0.05 -1 0.1 1.e-3GW 5 5 -0.64 -0.81 0.1 -0.54 -0.81 0.1 1.e-3GW 6 5 -1 -0.31 0.1 -0.9 -0.31 0.1 1.e-3GW 7 5 -1 0.31 0.1 -0.9 0.31 0.1 1.e-3GW 8 5 -0.64 0.81 0.1 -0.54 0.81 0.1 1.e-3GW 9 5 -0.05 1 0.1 0.05 1 0.1 1.e-3GW 10 5 0.54 0.81 0.1 0.64 0.81 0.1 1.e-3GW 11 5 0 1.05 0.099 0 0.95 0.099 1.e-3GW 12 5 0.59 0.86 0.099 0.59 0.76 0.099 1.e-3GW 13 5 0.95 0.36 0.099 0.95 0.26 0.099 1.e-3GW 14 5 0.95 -0.26 0.099 0.95 -0.36 0.099 1.e-3GW 15 5 0.59 -0.76 0.099 0.59 -0.86 0.099 1.e-3GW 16 5 0 -0.95 0.099 0 -1.05 0.099 1.e-3GW 17 5 -0.59 -0.76 0.099 -0.59 -0.86 0.099 1.e-3GW 18 5 -0.95 -0.26 0.099 -0.95 -0.36 0.099 1.e-3GW 19 5 -0.95 0.36 0.099 -0.95 0.26 0.099 1.e-3GW 20 5 -0.59 0.86 0.099 -0.59 0.76 0.099 1.e-3GE 0EKEX 0 1 3 0 -0.81 0.586EX 0 10 3 0 -0.31 -0.95EX 0 9 3 0 1 0EX 0 8 3 0 -0.31 0.953EX 0 7 3 0 -0.81 -0.59EX 0 6 3 0 0.808 -0.59EX 0 5 3 0 0.31 0.953EX 0 4 3 0 -1 6.e-16EX 0 3 3 0 0.31 -0.95EX 0 2 3 0 0.808 0.587EX 0 13 3 0 0.587 0.808EX 0 12 3 0 -0.95 0.31EX 0 11 3 0 0 -1EX 0 20 3 0 0.953 0.31EX 0 19 3 0 -0.59 0.808EX 0 18 3 0 -0.59 -0.81EX 0 17 3 0 0.953 -0.31EX 0 16 3 0 6.e-17 1EX 0 15 3 0 -0.95 -0.31EX 0 14 3 0 0.587 -0.81GN 1FR 0 1 0 0 300 0
161

APPENDIX B. NEC INPUT FILES
EN
Left-hand polarized, l = 4, a = λ
CEGW 1 5 0.9 0.31 0.1 1 0.31 0.1 1.e-3GW 2 5 0.9 -0.31 0.1 1 -0.31 0.1 1.e-3GW 3 5 0.54 -0.81 0.1 0.64 -0.81 0.1 1.e-3GW 4 5 -0.05 -1 0.1 0.05 -1 0.1 1.e-3GW 5 5 -0.64 -0.81 0.1 -0.54 -0.81 0.1 1.e-3GW 6 5 -1 -0.31 0.1 -0.9 -0.31 0.1 1.e-3GW 7 5 -1 0.31 0.1 -0.9 0.31 0.1 1.e-3GW 8 5 -0.64 0.81 0.1 -0.54 0.81 0.1 1.e-3GW 9 5 -0.05 1 0.1 0.05 1 0.1 1.e-3GW 10 5 0.54 0.81 0.1 0.64 0.81 0.1 1.e-3GW 11 5 0 1.05 0.099 0 0.95 0.099 1.e-3GW 12 5 0.59 0.86 0.099 0.59 0.76 0.099 1.e-3GW 13 5 0.95 0.36 0.099 0.95 0.26 0.099 1.e-3GW 14 5 0.95 -0.26 0.099 0.95 -0.36 0.099 1.e-3GW 15 5 0.59 -0.76 0.099 0.59 -0.86 0.099 1.e-3GW 16 5 0 -0.95 0.099 0 -1.05 0.099 1.e-3GW 17 5 -0.59 -0.76 0.099 -0.59 -0.86 0.099 1.e-3GW 18 5 -0.95 -0.26 0.099 -0.95 -0.36 0.099 1.e-3GW 19 5 -0.95 0.36 0.099 -0.95 0.26 0.099 1.e-3GW 20 5 -0.59 0.86 0.099 -0.59 0.76 0.099 1.e-3GE 0EKEX 0 1 3 0 -0.95 0.309EX 0 10 3 0 0.587 -0.81EX 0 9 3 0 6.e-17 1EX 0 8 3 0 -0.59 -0.81EX 0 7 3 0 0.95 0.309EX 0 6 3 0 -0.95 0.309EX 0 5 3 0 0.589 -0.81EX 0 4 3 0 6.e-16 1EX 0 3 3 0 -0.59 -0.81EX 0 2 3 0 0.952 0.309EX 0 13 3 0 0.309 0.952EX 0 12 3 0 -0.81 -0.59EX 0 11 3 0 1 0EX 0 20 3 0 -0.81 0.589EX 0 19 3 0 0.309 -0.95EX 0 18 3 0 0.309 0.95EX 0 17 3 0 -0.81 -0.59
162

B.4. NON LINEARLY POLARIZED BEAMS
EX 0 16 3 0 1 0EX 0 15 3 0 -0.81 0.587EX 0 14 3 0 0.309 -0.95GN 1FR 0 1 0 0 300 0EN
Right-hand polarized, l = 0, a = λ/2
CEGW 1 5 0.425 0.15 0.01 0.525 0.15 0.01 1.e-3GW 2 5 0.425 -0.15 0.01 0.525 -0.15 0.01 1.e-3GW 3 5 0.225 -0.4 0.01 0.325 -0.4 0.01 1.e-3GW 4 5 -0.05 -0.5 0.01 0.05 -0.5 0.01 1.e-3GW 5 5 -0.35 -0.4 0.01 -0.25 -0.4 0.01 1.e-3GW 6 5 -0.525 -0.15 0.01 -0.425 -0.15 0.01 1.e-3GW 7 5 -0.525 0.15 0.01 -0.425 0.15 0.01 1.e-3GW 8 5 -0.35 0.4 0.01 -0.25 0.4 0.01 1.e-3GW 9 5 -0.05 0.5 0.01 0.05 0.5 0.01 1.e-3GW 10 5 0.25 0.4 0.01 0.35 0.4 0.01 1.e-3GW 11 5 0 0.55 9.e-3 0 0.45 9.e-3 1.e-3GW 12 5 0.3 0.45 9.e-3 0.3 0.35 9.e-3 1.e-3GW 13 5 0.475 0.2 9.e-3 0.475 0.1 9.e-3 1.e-3GW 14 5 0.475 -0.1 9.e-3 0.475 -0.2 9.e-3 1.e-3GW 15 5 0.275 -0.35 9.e-3 0.275 -0.45 9.e-3 1.e-3GW 16 5 0 -0.45 9.e-3 0 -0.55 9.e-3 1.e-3GW 17 5 -0.3 -0.35 9.e-3 -0.3 -0.45 9.e-3 1.e-3GW 18 5 -0.475 -0.1 9.e-3 -0.475 -0.2 9.e-3 1.e-3GW 19 5 -0.475 0.2 9.e-3 -0.475 0.1 9.e-3 1.e-3GW 20 5 -0.3 0.45 9.e-3 -0.3 0.35 9.e-3 1.e-3GE 0EX 0 1 3 0 1 0EX 0 10 3 0 1 0EX 0 9 3 0 1 0EX 0 8 3 0 1.002 0EX 0 7 3 0 0.999 0EX 0 6 3 0 0.999 0EX 0 5 3 0 1.003 0EX 0 4 3 0 1 0EX 0 3 3 0 1 0EX 0 2 3 0 1.001 0EX 0 13 3 0 6.e-17 1.001EX 0 12 3 0 6.e-17 1EX 0 11 3 0 6.e-17 1
163

APPENDIX B. NEC INPUT FILES
EX 0 20 3 0 6.e-17 1.003EX 0 19 3 0 6.e-17 0.999EX 0 18 3 0 6.e-17 0.999EX 0 17 3 0 6.e-17 1.002EX 0 16 3 0 6.e-17 1EX 0 15 3 0 6.e-17 1EX 0 14 3 0 6.e-17 1GN 1FR 0 1 0 0 300 0EN
Right-hand polarized, l = 1, a = λ/2
CEGW 1 5 0.42 0.15 0.01 0.52 0.15 0.01 1.e-3GW 2 5 0.42 -0.15 0.01 0.52 -0.15 0.01 1.e-3GW 3 5 0.24 -0.4 0.01 0.34 -0.4 0.01 1.e-3GW 4 5 -0.06 -0.5 0.01 0.04 -0.5 0.01 1.e-3GW 5 5 -0.35 -0.4 0.01 -0.25 -0.4 0.01 1.e-3GW 6 5 -0.535 -0.15 0.01 -0.435 -0.15 0.01 1.e-3GW 7 5 -0.535 0.15 0.01 -0.435 0.15 0.01 1.e-3GW 8 5 -0.35 0.4 0.01 -0.25 0.4 0.01 1.e-3GW 9 5 -0.06 0.5 0.01 0.04 0.5 0.01 1.e-3GW 10 5 0.24 0.4 0.01 0.34 0.4 0.01 1.e-3GW 11 5 -0.01 0.55 9.e-3 -0.01 0.45 9.e-3 1.e-3GW 12 5 0.29 0.45 9.e-3 0.29 0.35 9.e-3 1.e-3GW 13 5 0.47 0.2 9.e-3 0.47 0.1 9.e-3 1.e-3GW 14 5 0.47 -0.1 9.e-3 0.47 -0.2 9.e-3 1.e-3GW 15 5 0.29 -0.35 9.e-3 0.29 -0.45 9.e-3 1.e-3GW 16 5 -0.01 -0.45 9.e-3 -0.01 -0.55 9.e-3 1.e-3GW 17 5 -0.3 -0.35 9.e-3 -0.3 -0.45 9.e-3 1.e-3GW 18 5 -0.485 -0.1 9.e-3 -0.485 -0.2 9.e-3 1.e-3GW 19 5 -0.485 0.2 9.e-3 -0.485 0.1 9.e-3 1.e-3GW 20 5 -0.3 0.45 9.e-3 -0.3 0.35 9.e-3 1.e-3GE 0EX 0 1 3 0 0.951 0.309EX 0 10 3 0 0.587 0.808EX 0 9 3 0 6.e-17 1EX 0 8 3 0 -0.59 0.808EX 0 7 3 0 -0.95 0.309EX 0 6 3 0 -0.95 -0.31EX 0 5 3 0 -0.59 -0.81EX 0 4 3 0 0 -1EX 0 3 3 0 0.587 -0.81
164

B.4. NON LINEARLY POLARIZED BEAMS
EX 0 2 3 0 0.952 -0.31EX 0 13 3 0 -0.31 0.952EX 0 12 3 0 -0.81 0.587EX 0 11 3 0 -1 1.e-16EX 0 20 3 0 -0.81 -0.59EX 0 19 3 0 -0.31 -0.95EX 0 18 3 0 0.309 -0.95EX 0 17 3 0 0.808 -0.59EX 0 16 3 0 1 0EX 0 15 3 0 0.808 0.587EX 0 14 3 0 0.588 0.809GN 1FR 0 1 0 0 300 0EN
Right-hand polarized, l = 2, a = λ/2
CEGW 1 5 0.42 0.15 0.01 0.52 0.15 0.01 1.e-3GW 2 5 0.43 -0.15 0.01 0.53 -0.15 0.01 1.e-3GW 3 5 0.24 -0.4 0.01 0.34 -0.4 0.01 1.e-3GW 4 5 -0.05 -0.5 0.01 0.05 -0.5 0.01 1.e-3GW 5 5 -0.35 -0.41 0.01 -0.25 -0.41 0.01 1.e-3GW 6 5 -0.53 -0.15 0.01 -0.43 -0.15 0.01 1.e-3GW 7 5 -0.53 0.15 0.01 -0.43 0.15 0.01 1.e-3GW 8 5 -0.34 0.41 0.01 -0.24 0.41 0.01 1.e-3GW 9 5 -0.05 0.5 0.01 0.05 0.5 0.01 1.e-3GW 10 5 0.24 0.4 0.01 0.34 0.4 0.01 1.e-3GW 11 5 0 0.55 9.e-3 0 0.45 9.e-3 1.e-3GW 12 5 0.29 0.45 9.e-3 0.29 0.35 9.e-3 1.e-3GW 13 5 0.47 0.2 9.e-3 0.47 0.1 9.e-3 1.e-3GW 14 5 0.48 -0.1 9.e-3 0.48 -0.2 9.e-3 1.e-3GW 15 5 0.29 -0.35 9.e-3 0.29 -0.45 9.e-3 1.e-3GW 16 5 0 -0.45 9.e-3 0 -0.55 9.e-3 1.e-3GW 17 5 -0.3 -0.36 9.e-3 -0.3 -0.46 9.e-3 1.e-3GW 18 5 -0.48 -0.1 9.e-3 -0.48 -0.2 9.e-3 1.e-3GW 19 5 -0.48 0.2 9.e-3 -0.48 0.1 9.e-3 1.e-3GW 20 5 -0.29 0.46 9.e-3 -0.29 0.36 9.e-3 1.e-3GE 0EX 0 1 3 0 0.809 0.588EX 0 10 3 0 -0.31 0.95EX 0 9 3 0 -1 1.e-16EX 0 8 3 0 -0.31 -0.95EX 0 7 3 0 0.809 -0.59
165

APPENDIX B. NEC INPUT FILES
EX 0 6 3 0 0.811 0.589EX 0 5 3 0 -0.31 0.953EX 0 4 3 0 -1 4.e-16EX 0 3 3 0 -0.31 -0.95EX 0 2 3 0 0.809 -0.59EX 0 13 3 0 -0.59 0.809EX 0 12 3 0 -0.95 -0.31EX 0 11 3 0 0 -1EX 0 20 3 0 0.953 -0.31EX 0 19 3 0 0.589 0.811EX 0 18 3 0 -0.59 0.809EX 0 17 3 0 -0.95 -0.31EX 0 16 3 0 0 -1EX 0 15 3 0 0.95 -0.31EX 0 14 3 0 0.588 0.809GN 1FR 0 1 0 0 300 0EN
Right-hand polarized, l = 3, a = λ/2
CEGW 1 5 0.43 0.15 0.01 0.53 0.15 0.01 1.e-3GW 2 5 0.43 -0.15 0.01 0.53 -0.15 0.01 1.e-3GW 3 5 0.24 -0.4 0.01 0.34 -0.4 0.01 1.e-3GW 4 5 -0.05 -0.5 0.01 0.05 -0.5 0.01 1.e-3GW 5 5 -0.34 -0.4 0.01 -0.24 -0.4 0.01 1.e-3GW 6 5 -0.53 -0.16 0.01 -0.43 -0.16 0.01 1.e-3GW 7 5 -0.53 0.16 0.01 -0.43 0.16 0.01 1.e-3GW 8 5 -0.35 0.41 0.01 -0.25 0.41 0.01 1.e-3GW 9 5 -0.05 0.5 0.01 0.05 0.5 0.01 1.e-3GW 10 5 0.25 0.41 0.01 0.35 0.41 0.01 1.e-3GW 11 5 0 0.55 9.e-3 0 0.45 9.e-3 1.e-3GW 12 5 0.3 0.46 9.e-3 0.3 0.36 9.e-3 1.e-3GW 13 5 0.48 0.2 9.e-3 0.48 0.1 9.e-3 1.e-3GW 14 5 0.48 -0.1 9.e-3 0.48 -0.2 9.e-3 1.e-3GW 15 5 0.29 -0.35 9.e-3 0.29 -0.45 9.e-3 1.e-3GW 16 5 0 -0.45 9.e-3 0 -0.55 9.e-3 1.e-3GW 17 5 -0.29 -0.35 9.e-3 -0.29 -0.45 9.e-3 1.e-3GW 18 5 -0.48 -0.11 9.e-3 -0.48 -0.21 9.e-3 1.e-3GW 19 5 -0.48 0.21 9.e-3 -0.48 0.11 9.e-3 1.e-3GW 20 5 -0.3 0.46 9.e-3 -0.3 0.36 9.e-3 1.e-3GE 0EX 0 1 3 0 0.588 0.809
166

B.4. NON LINEARLY POLARIZED BEAMS
EX 0 10 3 0 -0.95 0.31EX 0 9 3 0 0 -1EX 0 8 3 0 0.952 0.309EX 0 7 3 0 -0.59 0.808EX 0 6 3 0 -0.59 -0.81EX 0 5 3 0 0.953 -0.31EX 0 4 3 0 6.e-17 1EX 0 3 3 0 -0.95 -0.31EX 0 2 3 0 0.587 -0.81EX 0 13 3 0 -0.81 0.587EX 0 12 3 0 -0.31 -0.95EX 0 11 3 0 1 0EX 0 20 3 0 -0.31 0.953EX 0 19 3 0 -0.81 -0.59EX 0 18 3 0 0.808 -0.59EX 0 17 3 0 0.309 0.951EX 0 16 3 0 -1 6.e-16EX 0 15 3 0 0.31 -0.95EX 0 14 3 0 0.809 0.588GN 1FR 0 1 0 0 300 0EN
Right-hand polarized, l = 4, a = λ/2
CEGW 1 5 0.43 0.15 0.01 0.53 0.15 0.01 1.e-3GW 2 5 0.43 -0.15 0.01 0.53 -0.15 0.01 1.e-3GW 3 5 0.24 -0.4 0.01 0.34 -0.4 0.01 1.e-3GW 4 5 -0.05 -0.5 0.01 0.05 -0.5 0.01 1.e-3GW 5 5 -0.35 -0.41 0.01 -0.25 -0.41 0.01 1.e-3GW 6 5 -0.53 -0.15 0.01 -0.43 -0.15 0.01 1.e-3GW 7 5 -0.53 0.16 0.01 -0.43 0.16 0.01 1.e-3GW 8 5 -0.35 0.41 0.01 -0.25 0.41 0.01 1.e-3GW 9 5 -0.05 0.5 0.01 0.05 0.5 0.01 1.e-3GW 10 5 0.25 0.4 0.01 0.35 0.4 0.01 1.e-3GW 11 5 0 0.55 9.e-3 0 0.45 9.e-3 1.e-3GW 12 5 0.3 0.45 9.e-3 0.3 0.35 9.e-3 1.e-3GW 13 5 0.48 0.2 9.e-3 0.48 0.1 9.e-3 1.e-3GW 14 5 0.48 -0.1 9.e-3 0.48 -0.2 9.e-3 1.e-3GW 15 5 0.29 -0.35 9.e-3 0.29 -0.45 9.e-3 1.e-3GW 16 5 0 -0.45 9.e-3 0 -0.55 9.e-3 1.e-3GW 17 5 -0.3 -0.36 9.e-3 -0.3 -0.46 9.e-3 1.e-3GW 18 5 -0.48 -0.1 9.e-3 -0.48 -0.2 9.e-3 1.e-3
167

APPENDIX B. NEC INPUT FILES
GW 19 5 -0.48 0.21 9.e-3 -0.48 0.11 9.e-3 1.e-3GW 20 5 -0.3 0.46 9.e-3 -0.3 0.36 9.e-3 1.e-3GE 0EX 0 1 3 0 0.309 0.951EX 0 10 3 0 -0.81 -0.59EX 0 9 3 0 1 0EX 0 8 3 0 -0.81 0.588EX 0 7 3 0 0.309 -0.95EX 0 6 3 0 0.31 0.953EX 0 5 3 0 -0.81 -0.59EX 0 4 3 0 1 0EX 0 3 3 0 -0.81 0.588EX 0 2 3 0 0.309 -0.95EX 0 13 3 0 -0.95 0.309EX 0 12 3 0 0.587 -0.81EX 0 11 3 0 6.e-17 1EX 0 20 3 0 -0.59 -0.81EX 0 19 3 0 0.953 0.31EX 0 18 3 0 -0.95 0.309EX 0 17 3 0 0.587 -0.81EX 0 16 3 0 6.e-17 1EX 0 15 3 0 -0.59 -0.81EX 0 14 3 0 0.951 0.309GN 1FR 0 1 0 0 300 0EN
B.4.3 Tripole compared to crossed dipole
Crossed dipole array, θ0 = 45,ϕ0 = 0
CEGW 1 3 0.2 0.03 0.6 0.2 -0.03 0.6 1.e-3GW 2 3 0.06 0.22 0.6 0.06 0.16 0.6 1.e-3GW 3 3 -0.16 0.15 0.6 -0.16 0.09 0.6 1.e-3GW 4 3 -0.16 -0.09 0.6 -0.16 -0.15 0.6 1.e-3GW 5 3 0.06 -0.16 0.6 0.06 -0.22 0.6 1.e-3GW 6 3 0.17 0 0.599 0.23 0 0.599 1.e-3GW 7 3 0.03 0.19 0.599 0.09 0.19 0.599 1.e-3GW 8 3 -0.19 0.12 0.599 -0.13 0.12 0.599 1.e-3GW 9 3 -0.19 -0.12 0.599 -0.13 -0.12 0.599 1.e-3GW 10 3 0.03 -0.19 0.599 0.09 -0.19 0.599 1.e-3GW 11 3 0.201 -1.e-3 0.57 0.201 -1.e-3 0.63 1.e-3GW 12 3 0.061 0.191 0.57 0.061 0.191 0.63 1.e-3
168

B.4. NON LINEARLY POLARIZED BEAMS
GW 13 3 -0.161 0.121 0.57 -0.161 0.121 0.63 1.e-3GW 14 3 -0.161 -0.121 0.57 -0.161 -0.121 0.63 1.e-3GW 15 3 0.061 -0.191 0.57 0.061 -0.191 0.63 1.e-3GE 0EX 0 1 2 0 0.633 -0.78EX 0 2 2 0 0.969 -0.27EX 0 3 2 0 0.759 0.664EX 0 4 2 0 0.75 0.656EX 0 5 2 0 0.969 -0.27EX 0 6 2 0 0.551 0.448EX 0 7 2 0 0.192 0.684EX 0 8 2 0 -0.47 0.533EX 0 9 2 0 -0.47 0.533EX 0 10 2 0 0.192 0.684GN -1FR 0 1 0 0 299.8 0EN
Single tripole, θ0 = 45,ϕ0 = 0
CEGW 1 3 0 0.03 0 0 -0.03 0 1.e-3GW 6 3 -0.03 0 -1.e-3 0.03 0 -1.e-3 1.e-3GW 11 3 1.e-3 -1.e-3 -0.03 1.e-3 -1.e-3 0.03 1.e-3GE 0EX 0 1 2 0 -0.43 -0.91EX 0 6 2 0 0.643 -0.31EX 0 11 2 0 -0.64 0.304GN -1FR 0 1 0 0 299.8 0EN
Tripole array, θ0 = 45,ϕ0 = 0
CEGW 1 3 0.19 0.09 0.09 0.19 0.03 0.09 1.e-3GW 2 3 0 0.23 0.09 0 0.17 0.09 1.e-3GW 3 3 -0.19 0.09 0.09 -0.19 0.03 0.09 1.e-3GW 4 3 -0.12 -0.13 0.09 -0.12 -0.19 0.09 1.e-3GW 5 3 0.12 -0.13 0.09 0.12 -0.19 0.09 1.e-3GW 6 3 0.16 0.06 0.089 0.22 0.06 0.089 1.e-3GW 7 3 -0.03 0.2 0.089 0.03 0.2 0.089 1.e-3GW 8 3 -0.22 0.06 0.089 -0.16 0.06 0.089 1.e-3
169

APPENDIX B. NEC INPUT FILES
GW 9 3 -0.15 -0.16 0.089 -0.09 -0.16 0.089 1.e-3GW 10 3 0.09 -0.16 0.089 0.15 -0.16 0.089 1.e-3GW 11 3 0.191 0.059 0.06 0.191 0.059 0.12 1.e-3GW 12 3 1.e-3 0.201 0.06 1.e-3 0.201 0.12 1.e-3GW 13 3 -0.191 0.061 0.06 -0.191 0.061 0.12 1.e-3GW 14 3 -0.121 -0.161 0.06 -0.121 -0.161 0.12 1.e-3GW 15 3 0.121 -0.161 0.06 0.121 -0.161 0.12 1.e-3GE 0EX 0 1 2 0 -0.75 -0.66EX 0 2 2 0 6.e-17 -1EX 0 3 2 0 0.753 -0.67EX 0 4 2 0 0.467 -0.88EX 0 5 2 0 -0.5 -0.87EX 0 6 2 0 0.469 -0.53EX 0 7 2 0 0.706 0EX 0 8 2 0 0.472 0.532EX 0 9 2 0 0.613 0.352EX 0 10 2 0 0.614 -0.35EX 0 11 2 0 -0.47 0.526EX 0 12 2 0 -0.71 9.e-17EX 0 13 2 0 -0.47 -0.53EX 0 14 2 0 -0.61 -0.35EX 0 15 2 0 -0.61 0.353GN -1FR 0 1 0 0 299.8 0EN
B.4.4 Pointed tripoles
Five element, l = 0, θ0 = 10,ϕ0 = 40
CEGW 1 3 0.19 0.09 0.09 0.19 0.03 0.09 1.e-3GW 2 3 0 0.23 0.09 0 0.17 0.09 1.e-3GW 3 3 -0.19 0.09 0.09 -0.19 0.03 0.09 1.e-3GW 4 3 -0.12 -0.13 0.09 -0.12 -0.19 0.09 1.e-3GW 5 3 0.12 -0.13 0.09 0.12 -0.19 0.09 1.e-3GW 6 3 0.16 0.06 0.089 0.22 0.06 0.089 1.e-3GW 7 3 -0.03 0.2 0.089 0.03 0.2 0.089 1.e-3GW 8 3 -0.22 0.06 0.089 -0.16 0.06 0.089 1.e-3GW 9 3 -0.15 -0.16 0.089 -0.09 -0.16 0.089 1.e-3GW 10 3 0.09 -0.16 0.089 0.15 -0.16 0.089 1.e-3GW 11 3 0.191 0.059 0.06 0.191 0.059 0.12 1.e-3GW 12 3 1.e-3 0.201 0.06 1.e-3 0.201 0.12 1.e-3
170

B.4. NON LINEARLY POLARIZED BEAMS
GW 13 3 -0.191 0.061 0.06 -0.191 0.061 0.12 1.e-3GW 14 3 -0.121 -0.161 0.06 -0.121 -0.161 0.12 1.e-3GW 15 3 0.121 -0.161 0.06 0.121 -0.161 0.12 1.e-3GE 0EX 0 1 2 0 -0.61 0.78EX 0 2 2 0 -0.66 0.742EX 0 3 2 0 -0.83 0.553EX 0 4 2 0 -0.88 0.473EX 0 5 2 0 -0.76 0.631EX 0 6 2 0 -0.77 -0.62EX 0 7 2 0 -0.73 -0.67EX 0 8 2 0 -0.54 -0.83EX 0 9 2 0 -0.46 -0.88EX 0 10 2 0 -0.62 -0.77EX 0 11 2 0 0.171 -0.04EX 0 12 2 0 0.171 -0.02EX 0 13 2 0 0.172 0.02EX 0 14 2 0 0.174 0.02EX 0 15 2 0 0.174 3.e-3GN 2 0 0 0 13 5.e-3FR 0 1 0 0 299.8 0EN
Five element, l = 1, θ0 = 10,ϕ0 = 40
CEGW 1 3 0.19 0.09 0.09 0.19 0.03 0.09 1.e-3GW 2 3 0 0.23 0.09 0 0.17 0.09 1.e-3GW 3 3 -0.19 0.09 0.09 -0.19 0.03 0.09 1.e-3GW 4 3 -0.12 -0.13 0.09 -0.12 -0.19 0.09 1.e-3GW 5 3 0.12 -0.13 0.09 0.12 -0.19 0.09 1.e-3GW 6 3 0.16 0.06 0.089 0.22 0.06 0.089 1.e-3GW 7 3 -0.03 0.2 0.089 0.03 0.2 0.089 1.e-3GW 8 3 -0.22 0.06 0.089 -0.16 0.06 0.089 1.e-3GW 9 3 -0.15 -0.16 0.089 -0.09 -0.16 0.089 1.e-3GW 10 3 0.09 -0.16 0.089 0.15 -0.16 0.089 1.e-3GW 11 3 0.191 0.059 0.06 0.191 0.059 0.12 1.e-3GW 12 3 1.e-3 0.201 0.06 1.e-3 0.201 0.12 1.e-3GW 13 3 -0.191 0.061 0.06 -0.191 0.061 0.12 1.e-3GW 14 3 -0.121 -0.161 0.06 -0.121 -0.161 0.12 1.e-3GW 15 3 0.121 -0.161 0.06 0.121 -0.161 0.12 1.e-3GE 0EX 0 1 2 0 -0.54 -0.83EX 0 2 2 0 0.67 -0.73
171

APPENDIX B. NEC INPUT FILES
EX 0 3 2 0 0.772 0.626EX 0 4 2 0 -0.45 0.891EX 0 5 2 0 -0.99 0.047EX 0 6 2 0 -0.82 0.555EX 0 7 2 0 -0.74 -0.66EX 0 8 2 0 0.612 -0.78EX 0 9 2 0 0.89 0.428EX 0 10 2 0 0.061 0.988EX 0 11 2 0 0.174 0.02EX 0 12 2 0 0.024 0.171EX 0 13 2 0 -0.17 0.034EX 0 14 2 0 -0.07 -0.16EX 0 15 2 0 0.104 -0.14GN 1FR 0 1 0 0 299.8 0EN
Five element, l = 2, θ0 = 10,ϕ0 = 40
CEGW 1 3 0.19 0.09 0.09 0.19 0.03 0.09 1.e-3GW 2 3 0 0.23 0.09 0 0.17 0.09 1.e-3GW 3 3 -0.19 0.09 0.09 -0.19 0.03 0.09 1.e-3GW 4 3 -0.12 -0.13 0.09 -0.12 -0.19 0.09 1.e-3GW 5 3 0.12 -0.13 0.09 0.12 -0.19 0.09 1.e-3GW 6 3 0.16 0.06 0.089 0.22 0.06 0.089 1.e-3GW 7 3 -0.03 0.2 0.089 0.03 0.2 0.089 1.e-3GW 8 3 -0.22 0.06 0.089 -0.16 0.06 0.089 1.e-3GW 9 3 -0.15 -0.16 0.089 -0.09 -0.16 0.089 1.e-3GW 10 3 0.09 -0.16 0.089 0.15 -0.16 0.089 1.e-3GW 11 3 0.191 0.059 0.06 0.191 0.059 0.12 1.e-3GW 12 3 1.e-3 0.201 0.06 1.e-3 0.201 0.12 1.e-3GW 13 3 -0.191 0.061 0.06 -0.191 0.061 0.12 1.e-3GW 14 3 -0.121 -0.161 0.06 -0.121 -0.161 0.12 1.e-3GW 15 3 0.121 -0.161 0.06 0.121 -0.161 0.12 1.e-3GE 0EX 0 1 2 0 -0.26 -0.96EX 0 2 2 0 0.733 0.67EX 0 3 2 0 -0.93 -0.36EX 0 4 2 0 0.985 -0.16EX 0 5 2 0 -0.54 0.826EX 0 6 2 0 -0.95 0.273EX 0 7 2 0 0.657 -0.74EX 0 8 2 0 -0.34 0.929
172

B.4. NON LINEARLY POLARIZED BEAMS
EX 0 9 2 0 -0.18 -0.98EX 0 10 2 0 0.835 0.531EX 0 11 2 0 0.16 0.073EX 0 12 2 0 -0.17 0.024EX 0 13 2 0 0.149 -0.08EX 0 14 2 0 -0.09 0.154EX 0 15 2 0 -0.05 -0.17GN 2 0 0 0 13 5.e-3FR 0 1 0 0 299.8 0EN
Five element in free space, l = 2, θ0 = 10,ϕ0 = 40
CEGW 1 3 0.19 0.09 0.09 0.19 0.03 0.09 1.e-3GW 2 3 0 0.23 0.09 0 0.17 0.09 1.e-3GW 3 3 -0.19 0.09 0.09 -0.19 0.03 0.09 1.e-3GW 4 3 -0.12 -0.13 0.09 -0.12 -0.19 0.09 1.e-3GW 5 3 0.12 -0.13 0.09 0.12 -0.19 0.09 1.e-3GW 6 3 0.16 0.06 0.089 0.22 0.06 0.089 1.e-3GW 7 3 -0.03 0.2 0.089 0.03 0.2 0.089 1.e-3GW 8 3 -0.22 0.06 0.089 -0.16 0.06 0.089 1.e-3GW 9 3 -0.15 -0.16 0.089 -0.09 -0.16 0.089 1.e-3GW 10 3 0.09 -0.16 0.089 0.15 -0.16 0.089 1.e-3GW 11 3 0.191 0.059 0.06 0.191 0.059 0.12 1.e-3GW 12 3 1.e-3 0.201 0.06 1.e-3 0.201 0.12 1.e-3GW 13 3 -0.191 0.061 0.06 -0.191 0.061 0.12 1.e-3GW 14 3 -0.121 -0.161 0.06 -0.121 -0.161 0.12 1.e-3GW 15 3 0.121 -0.161 0.06 0.121 -0.161 0.12 1.e-3GE 0EX 0 1 2 0 -0.26 -0.96EX 0 2 2 0 0.733 0.67EX 0 3 2 0 -0.93 -0.36EX 0 4 2 0 0.985 -0.16EX 0 5 2 0 -0.54 0.826EX 0 6 2 0 -0.95 0.273EX 0 7 2 0 0.657 -0.74EX 0 8 2 0 -0.34 0.929EX 0 9 2 0 -0.18 -0.98EX 0 10 2 0 0.835 0.531EX 0 11 2 0 0.16 0.073EX 0 12 2 0 -0.17 0.024EX 0 13 2 0 0.149 -0.08EX 0 14 2 0 -0.09 0.154
173

APPENDIX B. NEC INPUT FILES
EX 0 15 2 0 -0.05 -0.17GN -1FR 0 1 0 0 299.8 0EN
Ten element, l = 1, a = λ/5, θ0 = 45,ϕ0 = 0
CEGW 1 3 0.19 0.09 0.125 0.19 0.03 0.125 1.e-3GW 2 3 0.1175 0.19 0.125 0.1175 0.13 0.125 1.e-3GW 3 3 0 0.23 0.125 0 0.17 0.125 1.e-3GW 4 3 -0.1175 0.1925 0.125 -0.1175 0.1325 0.125 1.e-3GW 5 3 -0.19 0.0925 0.125 -0.19 0.0325 0.125 1.e-3GW 6 3 0.16 0.06 0.124 0.22 0.06 0.124 1.e-3GW 7 3 0.0875 0.16 0.124 0.1475 0.16 0.124 1.e-3GW 8 3 -0.03 0.2 0.124 0.03 0.2 0.124 1.e-3GW 9 3 -0.1475 0.1625 0.124 -0.0875 0.1625 0.124 1.e-3GW 10 3 -0.22 0.0625 0.124 -0.16 0.0625 0.124 1.e-3GW 11 3 0.191 0.059 0.095 0.191 0.059 0.155 1.e-3GW 12 3 0.1185 0.161 0.095 0.1185 0.161 0.155 1.e-3GW 13 3 -1.e-3 0.201 0.095 -1.e-3 0.201 0.155 1.e-3GW 14 3 -0.1185 0.1615 0.095 -0.1185 0.1615 0.155 1.e-3GW 15 3 -0.189 0.0615 0.095 -0.189 0.0615 0.155 1.e-3GW 16 3 -0.19 -0.03 0.125 -0.19 -0.09 0.125 1.e-3GW 17 3 -0.22 -0.06 0.124 -0.16 -0.06 0.124 1.e-3GW 18 3 -0.189 -0.061 0.095 -0.189 -0.061 0.155 1.e-3GW 19 3 -0.1175 -0.13 0.125 -0.1175 -0.19 0.125 1.e-3GW 20 3 -0.15 -0.16 0.124 -0.09 -0.16 0.124 1.e-3GW 21 3 -0.1165 -0.161 0.095 -0.1165 -0.161 0.155 1.e-3GW 22 3 0 -0.17 0.125 0 -0.23 0.125 1.e-3GW 23 3 -0.03 -0.2 0.124 0.03 -0.2 0.124 1.e-3GW 24 3 1.e-3 -0.201 0.095 1.e-3 -0.201 0.155 1.e-3GW 25 3 0.1175 -0.1325 0.125 0.1175 -0.1925 0.125 1.e-3GW 26 3 0.0875 -0.1625 0.124 0.1475 -0.1625 0.124 1.e-3GW 27 3 0.1185 -0.1635 0.095 0.1185 -0.1635 0.155 1.e-3GW 28 3 0.19 -0.03 0.125 0.19 -0.09 0.125 1.e-3GW 29 3 0.16 -0.06 0.124 0.22 -0.06 0.124 1.e-3GW 30 3 0.191 -0.061 0.095 0.191 -0.061 0.155 1.e-3GE 0EKEX 0 1 2 0 -0.51 -0.87EX 0 2 2 0 0.405 -0.91EX 0 3 2 0 1.006 0EX 0 4 2 0 0.404 0.905
174

B.4. NON LINEARLY POLARIZED BEAMS
EX 0 5 2 0 -0.51 0.868EX 0 6 2 0 0.611 -0.36EX 0 7 2 0 0.645 0.288EX 0 8 2 0 4.e-17 0.711EX 0 9 2 0 -0.64 0.288EX 0 10 2 0 -0.61 -0.36EX 0 11 2 0 -0.61 0.356EX 0 12 2 0 -0.64 -0.29EX 0 13 2 0 0 -0.71EX 0 14 2 0 0.647 -0.29EX 0 15 2 0 0.611 0.358EX 0 16 2 0 -0.92 0.403EX 0 17 2 0 -0.29 -0.65EX 0 18 2 0 0.285 0.653EX 0 19 2 0 -1 0.106EX 0 20 2 0 -0.07 -0.7EX 0 21 2 0 0.075 0.709EX 0 22 2 0 -1 1.e-16EX 0 23 2 0 0.71 0EX 0 24 2 0 4.e-17 0.71EX 0 25 2 0 -1 -0.11EX 0 26 2 0 0.075 -0.71EX 0 27 2 0 -0.08 0.706EX 0 28 2 0 -0.92 -0.4EX 0 29 2 0 0.286 -0.66EX 0 30 2 0 -0.28 0.651GN -1FR 0 1 0 0 300 0EN
Ten element, l = 2, a = λ/5, θ0 = 45,ϕ0 = 0
CEGW 1 3 0.19 0.09 0.125 0.19 0.03 0.125 1.e-3GW 2 3 0.115 0.19 0.125 0.115 0.13 0.125 1.e-3GW 3 3 0 0.23 0.125 0 0.17 0.125 1.e-3GW 4 3 -0.115 0.19 0.125 -0.115 0.13 0.125 1.e-3GW 5 3 -0.19 0.09 0.125 -0.19 0.03 0.125 1.e-3GW 6 3 0.16 0.06 0.124 0.22 0.06 0.124 1.e-3GW 7 3 0.085 0.16 0.124 0.145 0.16 0.124 1.e-3GW 8 3 -0.03 0.2 0.124 0.03 0.2 0.124 1.e-3GW 9 3 -0.145 0.16 0.124 -0.085 0.16 0.124 1.e-3GW 10 3 -0.22 0.06 0.124 -0.16 0.06 0.124 1.e-3GW 11 3 0.191 0.059 0.095 0.191 0.059 0.155 1.e-3
175

APPENDIX B. NEC INPUT FILES
GW 12 3 0.116 0.161 0.095 0.116 0.161 0.155 1.e-3GW 13 3 -1.e-3 0.201 0.095 -1.e-3 0.201 0.155 1.e-3GW 14 3 -0.116 0.159 0.095 -0.116 0.159 0.155 1.e-3GW 15 3 -0.189 0.059 0.095 -0.189 0.059 0.155 1.e-3GW 16 3 -0.19 -0.035 0.125 -0.19 -0.095 0.125 1.e-3GW 17 3 -0.22 -0.065 0.124 -0.16 -0.065 0.124 1.e-3GW 18 3 -0.189 -0.066 0.095 -0.189 -0.066 0.155 1.e-3GW 19 3 -0.115 -0.135 0.125 -0.115 -0.195 0.125 1.e-3GW 20 3 -0.145 -0.165 0.124 -0.085 -0.165 0.124 1.e-3GW 21 3 -0.114 -0.166 0.095 -0.114 -0.166 0.155 1.e-3GW 22 3 0 -0.17 0.125 0 -0.23 0.125 1.e-3GW 23 3 -0.03 -0.2 0.124 0.03 -0.2 0.124 1.e-3GW 24 3 1.e-3 -0.201 0.095 1.e-3 -0.201 0.155 1.e-3GW 25 3 0.115 -0.13 0.125 0.115 -0.19 0.125 1.e-3GW 26 3 0.085 -0.16 0.124 0.145 -0.16 0.124 1.e-3GW 27 3 0.116 -0.161 0.095 0.116 -0.161 0.155 1.e-3GW 28 3 0.19 -0.035 0.125 0.19 -0.095 0.125 1.e-3GW 29 3 0.16 -0.065 0.124 0.22 -0.065 0.124 1.e-3GW 30 3 0.191 -0.066 0.095 0.191 -0.066 0.155 1.e-3GE 0EKEX 0 1 2 0 -0.22 -0.98EX 0 2 2 0 0.973 -0.21EX 0 3 2 0 6.e-17 1.006EX 0 4 2 0 -0.97 -0.2EX 0 5 2 0 0.217 -0.98EX 0 6 2 0 0.691 -0.15EX 0 7 2 0 0.146 0.691EX 0 8 2 0 -0.71 9.e-17EX 0 9 2 0 0.146 -0.69EX 0 10 2 0 0.691 0.152EX 0 11 2 0 -0.69 0.151EX 0 12 2 0 -0.15 -0.69EX 0 13 2 0 0.71 0EX 0 14 2 0 -0.15 0.694EX 0 15 2 0 -0.69 -0.15EX 0 16 2 0 1.002 -0.1EX 0 17 2 0 0.069 0.71EX 0 18 2 0 -0.07 -0.71EX 0 19 2 0 0.672 0.744EX 0 20 2 0 -0.52 0.474EX 0 21 2 0 0.529 -0.48EX 0 22 2 0 3.e-16 1EX 0 23 2 0 -0.71 3.e-16EX 0 24 2 0 0.71 0
176

B.4. NON LINEARLY POLARIZED BEAMS
EX 0 25 2 0 -0.67 0.743EX 0 26 2 0 -0.53 -0.48EX 0 27 2 0 0.527 0.476EX 0 28 2 0 -1 -0.1EX 0 29 2 0 0.07 -0.71EX 0 30 2 0 -0.07 0.707GN -1FR 0 1 0 0 300 0EN
Ten element, l = 1, a = λ/2, θ0 = 45,ϕ0 = 0
CEGW 1 3 0.475 0.185 0.125 0.475 0.125 0.125 1.e-3GW 2 3 0.295 0.435 0.125 0.295 0.375 0.125 1.e-3GW 3 3 0 0.53 0.125 0 0.47 0.125 1.e-3GW 4 3 -0.295 0.435 0.125 -0.295 0.375 0.125 1.e-3GW 5 3 -0.475 0.185 0.125 -0.475 0.125 0.125 1.e-3GW 6 3 0.445 0.155 0.124 0.505 0.155 0.124 1.e-3GW 7 3 0.265 0.405 0.124 0.325 0.405 0.124 1.e-3GW 8 3 -0.03 0.5 0.124 0.03 0.5 0.124 1.e-3GW 9 3 -0.325 0.405 0.124 -0.265 0.405 0.124 1.e-3GW 10 3 -0.505 0.155 0.124 -0.445 0.155 0.124 1.e-3GW 11 3 0.476 0.154 0.095 0.476 0.154 0.155 1.e-3GW 12 3 0.296 0.406 0.095 0.296 0.406 0.155 1.e-3GW 13 3 -1.e-3 0.501 0.095 -1.e-3 0.501 0.155 1.e-3GW 14 3 -0.296 0.404 0.095 -0.296 0.404 0.155 1.e-3GW 15 3 -0.474 0.154 0.095 -0.474 0.154 0.155 1.e-3GW 16 3 -0.475 -0.125 0.125 -0.475 -0.185 0.125 1.e-3GW 17 3 -0.505 -0.155 0.124 -0.445 -0.155 0.124 1.e-3GW 18 3 -0.474 -0.156 0.095 -0.474 -0.156 0.155 1.e-3GW 19 3 -0.295 -0.375 0.125 -0.295 -0.435 0.125 1.e-3GW 20 3 -0.325 -0.405 0.124 -0.265 -0.405 0.124 1.e-3GW 21 3 -0.294 -0.406 0.095 -0.294 -0.406 0.155 1.e-3GW 22 3 0 -0.47 0.125 0 -0.53 0.125 1.e-3GW 23 3 -0.03 -0.5 0.124 0.03 -0.5 0.124 1.e-3GW 24 3 1.e-3 -0.501 0.095 1.e-3 -0.501 0.155 1.e-3GW 25 3 0.29 -0.375 0.125 0.29 -0.435 0.125 1.e-3GW 26 3 0.26 -0.405 0.124 0.32 -0.405 0.124 1.e-3GW 27 3 0.291 -0.406 0.095 0.291 -0.406 0.155 1.e-3GW 28 3 0.475 -0.125 0.125 0.475 -0.185 0.125 1.e-3GW 29 3 0.445 -0.155 0.124 0.505 -0.155 0.124 1.e-3GW 30 3 0.476 -0.156 0.095 0.476 -0.156 0.155 1.e-3GE 0
177

APPENDIX B. NEC INPUT FILES
EKEX 0 1 2 0 -1 -0.09EX 0 2 2 0 0.544 -0.83EX 0 3 2 0 6.e-17 1.006EX 0 4 2 0 -0.54 -0.83EX 0 5 2 0 1.003 -0.09EX 0 6 2 0 0.061 -0.71EX 0 7 2 0 0.591 0.386EX 0 8 2 0 -0.71 9.e-17EX 0 9 2 0 0.591 -0.39EX 0 10 2 0 0.061 0.705EX 0 11 2 0 -0.06 0.7EX 0 12 2 0 -0.59 -0.39EX 0 13 2 0 -0.59 -0.39EX 0 14 2 0 -0.59 0.388EX 0 15 2 0 -0.06 -0.71EX 0 16 2 0 0.393 0.927EX 0 17 2 0 -0.66 0.277EX 0 18 2 0 0.657 -0.28EX 0 19 2 0 -0.05 1.002EX 0 20 2 0 -0.71 -0.03EX 0 21 2 0 0.712 0.035EX 0 22 2 0 3.e-16 1EX 0 23 2 0 -0.71 3.e-16EX 0 24 2 0 0.71 0EX 0 25 2 0 0.049 1EX 0 26 2 0 -0.71 0.035EX 0 27 2 0 0.709 -0.03EX 0 28 2 0 -0.39 0.924EX 0 29 2 0 -0.66 -0.28EX 0 30 2 0 0.654 0.277GN -1FR 0 1 0 0 300 0EN
Ten element, l = 2, a = λ/2, θ0 = 45,ϕ0 = 0
CEGW 1 3 0.475 0.185 0.125 0.475 0.125 0.125 1.e-3GW 2 3 0.295 0.435 0.125 0.295 0.375 0.125 1.e-3GW 3 3 0 0.53 0.125 0 0.47 0.125 1.e-3GW 4 3 -0.295 0.435 0.125 -0.295 0.375 0.125 1.e-3GW 5 3 -0.475 0.185 0.125 -0.475 0.125 0.125 1.e-3GW 6 3 0.445 0.155 0.124 0.505 0.155 0.124 1.e-3
178

B.4. NON LINEARLY POLARIZED BEAMS
GW 7 3 0.265 0.405 0.124 0.325 0.405 0.124 1.e-3GW 8 3 -0.03 0.5 0.124 0.03 0.5 0.124 1.e-3GW 9 3 -0.325 0.405 0.124 -0.265 0.405 0.124 1.e-3GW 10 3 -0.505 0.155 0.124 -0.445 0.155 0.124 1.e-3GW 11 3 0.476 0.154 0.095 0.476 0.154 0.155 1.e-3GW 12 3 0.296 0.406 0.095 0.296 0.406 0.155 1.e-3GW 13 3 -1.e-3 0.501 0.095 -1.e-3 0.501 0.155 1.e-3GW 14 3 -0.296 0.404 0.095 -0.296 0.404 0.155 1.e-3GW 15 3 -0.474 0.154 0.095 -0.474 0.154 0.155 1.e-3GW 16 3 -0.475 -0.125 0.125 -0.475 -0.185 0.125 1.e-3GW 17 3 -0.505 -0.155 0.124 -0.445 -0.155 0.124 1.e-3GW 18 3 -0.474 -0.156 0.095 -0.474 -0.156 0.155 1.e-3GW 19 3 -0.295 -0.375 0.125 -0.295 -0.435 0.125 1.e-3GW 20 3 -0.325 -0.405 0.124 -0.265 -0.405 0.124 1.e-3GW 21 3 -0.294 -0.406 0.095 -0.294 -0.406 0.155 1.e-3GW 22 3 0 -0.47 0.125 0 -0.53 0.125 1.e-3GW 23 3 -0.03 -0.5 0.124 0.03 -0.5 0.124 1.e-3GW 24 3 1.e-3 -0.501 0.095 1.e-3 -0.501 0.155 1.e-3GW 25 3 0.29 -0.375 0.125 0.29 -0.435 0.125 1.e-3GW 26 3 0.26 -0.405 0.124 0.32 -0.405 0.124 1.e-3GW 27 3 0.291 -0.406 0.095 0.291 -0.406 0.155 1.e-3GW 28 3 0.475 -0.125 0.125 0.475 -0.185 0.125 1.e-3GW 29 3 0.445 -0.155 0.124 0.505 -0.155 0.124 1.e-3GW 30 3 0.476 -0.156 0.095 0.476 -0.156 0.155 1.e-3GE 0EKEX 0 1 2 0 -1 -0.09EX 0 2 2 0 0.544 -0.83EX 0 3 2 0 6.e-17 1.006EX 0 4 2 0 -0.54 -0.83EX 0 5 2 0 1.003 -0.09EX 0 6 2 0 0.061 -0.71EX 0 7 2 0 0.591 0.386EX 0 8 2 0 -0.71 9.e-17EX 0 9 2 0 0.591 -0.39EX 0 10 2 0 0.061 0.705EX 0 11 2 0 -0.06 0.7EX 0 12 2 0 -0.59 -0.39EX 0 13 2 0 0.707 0EX 0 14 2 0 -0.59 0.386EX 0 15 2 0 -0.06 -0.71EX 0 16 2 0 0.393 0.927EX 0 17 2 0 -0.66 0.277EX 0 18 2 0 0.657 -0.28EX 0 19 2 0 -0.05 1.002
179

APPENDIX B. NEC INPUT FILES
EX 0 20 2 0 -0.71 -0.02EX 0 21 2 0 0.712 0.035EX 0 22 2 0 6.e-17 1EX 0 23 2 0 -0.71 9.e-17EX 0 24 2 0 0.71 0EX 0 25 2 0 0.049 1EX 0 26 2 0 -0.71 0.035EX 0 27 2 0 0.709 -0.03EX 0 28 2 0 -0.39 0.924EX 0 29 2 0 -0.66 -0.28EX 0 30 2 0 0.654 0.277GN -1FR 0 1 0 0 300 0EN
Ten element, l = 3, a = λ/2, θ0 = 45,ϕ0 = 0
CEGW 1 3 0.475 0.185 0.125 0.475 0.125 0.125 1.e-3GW 2 3 0.295 0.435 0.125 0.295 0.375 0.125 1.e-3GW 3 3 0 0.53 0.125 0 0.47 0.125 1.e-3GW 4 3 -0.295 0.435 0.125 -0.295 0.375 0.125 1.e-3GW 5 3 -0.475 0.185 0.125 -0.475 0.125 0.125 1.e-3GW 6 3 0.445 0.155 0.124 0.505 0.155 0.124 1.e-3GW 7 3 0.265 0.405 0.124 0.325 0.405 0.124 1.e-3GW 8 3 -0.03 0.5 0.124 0.03 0.5 0.124 1.e-3GW 9 3 -0.325 0.405 0.124 -0.265 0.405 0.124 1.e-3GW 10 3 -0.505 0.155 0.124 -0.445 0.155 0.124 1.e-3GW 11 3 0.476 0.154 0.095 0.476 0.154 0.155 1.e-3GW 12 3 0.296 0.406 0.095 0.296 0.406 0.155 1.e-3GW 13 3 -1.e-3 0.501 0.095 -1.e-3 0.501 0.155 1.e-3GW 14 3 -0.296 0.404 0.095 -0.296 0.404 0.155 1.e-3GW 15 3 -0.474 0.154 0.095 -0.474 0.154 0.155 1.e-3GW 16 3 -0.475 -0.125 0.125 -0.475 -0.185 0.125 1.e-3GW 17 3 -0.505 -0.155 0.124 -0.445 -0.155 0.124 1.e-3GW 18 3 -0.474 -0.156 0.095 -0.474 -0.156 0.155 1.e-3GW 19 3 -0.295 -0.375 0.125 -0.295 -0.435 0.125 1.e-3GW 20 3 -0.325 -0.405 0.124 -0.265 -0.405 0.124 1.e-3GW 21 3 -0.294 -0.406 0.095 -0.294 -0.406 0.155 1.e-3GW 22 3 0 -0.47 0.125 0 -0.53 0.125 1.e-3GW 23 3 -0.03 -0.5 0.124 0.03 -0.5 0.124 1.e-3GW 24 3 1.e-3 -0.501 0.095 1.e-3 -0.501 0.155 1.e-3GW 25 3 0.29 -0.375 0.125 0.29 -0.435 0.125 1.e-3GW 26 3 0.26 -0.405 0.124 0.32 -0.405 0.124 1.e-3
180

B.4. NON LINEARLY POLARIZED BEAMS
GW 27 3 0.291 -0.406 0.095 0.291 -0.406 0.155 1.e-3GW 28 3 0.475 -0.125 0.125 0.475 -0.185 0.125 1.e-3GW 29 3 0.445 -0.155 0.124 0.505 -0.155 0.124 1.e-3GW 30 3 0.476 -0.156 0.095 0.476 -0.156 0.155 1.e-3GE 0EKEX 0 1 2 0 -0.93 -0.39EX 0 2 2 0 0.993 -0.05EX 0 3 2 0 -1.01 1.e-16EX 0 4 2 0 0.99 0.049EX 0 5 2 0 -0.93 0.394EX 0 6 2 0 0.276 -0.65EX 0 7 2 0 0.035 0.705EX 0 8 2 0 4.e-17 -0.71EX 0 9 2 0 -0.03 0.705EX 0 10 2 0 -0.28 -0.65EX 0 11 2 0 -0.27 0.647EX 0 12 2 0 -0.04 -0.71EX 0 13 2 0 2.e-16 0.71EX 0 14 2 0 0.035 -0.71EX 0 15 2 0 0.277 0.652EX 0 16 2 0 -0.09 -1EX 0 17 2 0 0.71 -0.06EX 0 18 2 0 -0.71 0.062EX 0 19 2 0 0.839 -0.55EX 0 20 2 0 0.387 0.592EX 0 21 2 0 -0.39 -0.6EX 0 22 2 0 1 0EX 0 23 2 0 4.e-16 0.71EX 0 24 2 0 8.e-16 -0.71EX 0 25 2 0 0.838 0.548EX 0 26 2 0 -0.39 0.595EX 0 27 2 0 0.391 -0.6EX 0 28 2 0 -0.09 0.998EX 0 29 2 0 -0.72 -0.06EX 0 30 2 0 0.707 0.062GN -1FR 0 1 0 0 300 0EN
Ten element, l = 4, a = λ/2, θ0 = 15,ϕ0 = 0
CEGW 1 3 0.475 0.185 0.125 0.475 0.125 0.125 1.e-3
181

APPENDIX B. NEC INPUT FILES
GW 2 3 0.295 0.435 0.125 0.295 0.375 0.125 1.e-3GW 3 3 0 0.53 0.125 0 0.47 0.125 1.e-3GW 4 3 -0.295 0.435 0.125 -0.295 0.375 0.125 1.e-3GW 5 3 -0.475 0.185 0.125 -0.475 0.125 0.125 1.e-3GW 6 3 0.445 0.155 0.124 0.505 0.155 0.124 1.e-3GW 7 3 0.265 0.405 0.124 0.325 0.405 0.124 1.e-3GW 8 3 -0.03 0.5 0.124 0.03 0.5 0.124 1.e-3GW 9 3 -0.325 0.405 0.124 -0.265 0.405 0.124 1.e-3GW 10 3 -0.505 0.155 0.124 -0.445 0.155 0.124 1.e-3GW 11 3 0.476 0.154 0.095 0.476 0.154 0.155 1.e-3GW 12 3 0.296 0.406 0.095 0.296 0.406 0.155 1.e-3GW 13 3 -1.e-3 0.501 0.095 -1.e-3 0.501 0.155 1.e-3GW 14 3 -0.296 0.404 0.095 -0.296 0.404 0.155 1.e-3GW 15 3 -0.474 0.154 0.095 -0.474 0.154 0.155 1.e-3GW 16 3 -0.475 -0.125 0.125 -0.475 -0.185 0.125 1.e-3GW 17 3 -0.505 -0.155 0.124 -0.445 -0.155 0.124 1.e-3GW 18 3 -0.474 -0.156 0.095 -0.474 -0.156 0.155 1.e-3GW 19 3 -0.295 -0.375 0.125 -0.295 -0.435 0.125 1.e-3GW 20 3 -0.325 -0.405 0.124 -0.265 -0.405 0.124 1.e-3GW 21 3 -0.294 -0.406 0.095 -0.294 -0.406 0.155 1.e-3GW 22 3 0 -0.47 0.125 0 -0.53 0.125 1.e-3GW 23 3 -0.03 -0.5 0.124 0.03 -0.5 0.124 1.e-3GW 24 3 1.e-3 -0.501 0.095 1.e-3 -0.501 0.155 1.e-3GW 25 3 0.29 -0.375 0.125 0.29 -0.435 0.125 1.e-3GW 26 3 0.26 -0.405 0.124 0.32 -0.405 0.124 1.e-3GW 27 3 0.291 -0.406 0.095 0.291 -0.406 0.155 1.e-3GW 28 3 0.475 -0.125 0.125 0.475 -0.185 0.125 1.e-3GW 29 3 0.445 -0.155 0.124 0.505 -0.155 0.124 1.e-3GW 30 3 0.476 -0.156 0.095 0.476 -0.156 0.155 1.e-3GE 0EKEX 0 1 2 0 0.468 -0.89EX 0 2 2 0 -0.15 0.983EX 0 3 2 0 3.e-16 -1.01EX 0 4 2 0 0.148 0.98EX 0 5 2 0 -0.47 -0.89EX 0 6 2 0 0.856 0.449EX 0 7 2 0 -0.96 -0.14EX 0 8 2 0 0.97 2.e-16EX 0 9 2 0 -0.96 0.145EX 0 10 2 0 0.857 -0.45EX 0 11 2 0 -0.23 -0.12EX 0 12 2 0 0.257 0.039EX 0 13 2 0 -0.26 0EX 0 14 2 0 0.257 -0.04
182
B.5. THE LOIS TEST STATION
EX 0 15 2 0 -0.23 0.12EX 0 16 2 0 0.9 0.445EX 0 17 2 0 -0.43 0.865EX 0 18 2 0 0.116 -0.23EX 0 19 2 0 -0.9 0.449EX 0 20 2 0 -0.43 -0.86EX 0 21 2 0 0.117 0.233EX 0 22 2 0 0 -1EX 0 23 2 0 0.966 0EX 0 24 2 0 -0.26 1.e-16EX 0 25 2 0 0.895 0.448EX 0 26 2 0 -0.43 0.864EX 0 27 2 0 0.117 -0.23EX 0 28 2 0 -0.9 0.444EX 0 29 2 0 -0.43 -0.86EX 0 30 2 0 0.115 0.232GN -1FR 0 1 0 0 300 0EN
B.5 The LOIS Test Station
B.5.1 LOIS_L0.txt
CEGW 1 11 6.75 4.5 2 8.872 4.5 3.502 1.e-3GW 2 11 8.34236644 3.5820664 2.0002664 7.281 5.4188 3.5018 1.e-3GW 3 11 8.3415 5.4188 1.9994 7.281 3.582 3.5018 1.e-3GW 10 11 6.75 -4.5 2 8.872 -4.5 3.502 1.e-3GW 11 11 8.34236644 -5.4179336 2.0002664 7.281 -3.5812 3.5018 1.e-3GW 12 11 8.3415 -3.5812 1.9994 7.281 -5.418 3.5018 1.e-3GW 13 11 -1.122 -9 2 1 -9 3.502 1.e-3GW 14 11 0.47036644 -9.9179336 2.0002664 -0.591 -8.0812 3.5018 1.e-3GW 15 11 0.4695 -8.0812 1.9994 -0.591 -9.918 3.5018 1.e-3GW 16 11 -8.872 -4.5 2 -6.75 -4.5 3.502 1.e-3GW 17 11 -7.2796336 -5.4179336 2.0002664 -8.341 -3.5812 3.5018 1.e-3GW 18 11 -7.2805 -3.5812 1.9994 -8.341 -5.418 3.5018 1.e-3GW 19 11 -8.872 4.5 2 -6.75 4.5 3.502 1.e-3GW 20 11 -7.2796336 3.5820664 2.0002664 -8.341 5.4188 3.5018 1.e-3GW 21 11 -7.2805 5.4188 1.9994 -8.341 3.582 3.5018 1.e-3GW 22 11 -1.122 9 2 1 9 3.502 1.e-3GW 23 11 0.47036644 8.0820664 2.0002664 -0.591 9.9188 3.5018 1.e-3GW 24 11 0.4695 9.9188 1.9994 -0.591 8.082 3.5018 1.e-3
183

APPENDIX B. NEC INPUT FILES
GE 0EX 6 1 6 0 -2 2.e-16EX 6 2 6 0 1 0EX 6 3 6 0 1 0EX 6 10 6 0 -2 2.e-16EX 6 11 6 0 1 0EX 6 12 6 0 1 0EX 6 13 6 0 -2 2.e-16EX 6 14 6 0 1 0EX 6 15 6 0 1 0EX 6 16 6 0 -2 2.e-16EX 6 17 6 0 1 0EX 6 18 6 0 1 0EX 6 19 6 0 -2 2.e-16EX 6 20 6 0 1 0EX 6 21 6 0 1 0EX 6 22 6 0 -2 2.e-16EX 6 23 6 0 1 0EX 6 24 6 0 1 0GN 1FR 0 1 0 0 9.99333333 0EN
B.5.2 LOIS_L1.txt
CEGW 1 11 6.75 4.5 2 8.872 4.5 3.502 1.e-3GW 2 11 8.34236644 3.5820664 2.0002664 7.281 5.4188 3.5018 1.e-3GW 3 11 8.3415 5.4188 1.9994 7.281 3.582 3.5018 1.e-3GW 10 11 6.75 -4.5 2 8.872 -4.5 3.502 1.e-3GW 11 11 8.34236644 -5.4179336 2.0002664 7.281 -3.5812 3.5018 1.e-3GW 12 11 8.3415 -3.5812 1.9994 7.281 -5.418 3.5018 1.e-3GW 13 11 -1.122 -9 2 1 -9 3.502 1.e-3GW 14 11 0.47036644 -9.9179336 2.0002664 -0.591 -8.0812 3.5018 1.e-3GW 15 11 0.4695 -8.0812 1.9994 -0.591 -9.918 3.5018 1.e-3GW 16 11 -8.872 -4.5 2 -6.75 -4.5 3.502 1.e-3GW 17 11 -7.2796336 -5.4179336 2.0002664 -8.341 -3.5812 3.5018 1.e-3GW 18 11 -7.2805 -3.5812 1.9994 -8.341 -5.418 3.5018 1.e-3GW 19 11 -8.872 4.5 2 -6.75 4.5 3.502 1.e-3GW 20 11 -7.2796336 3.5820664 2.0002664 -8.341 5.4188 3.5018 1.e-3GW 21 11 -7.2805 5.4188 1.9994 -8.341 3.582 3.5018 1.e-3GW 22 11 -1.122 9 2 1 9 3.502 1.e-3GW 23 11 0.47036644 8.0820664 2.0002664 -0.591 9.9188 3.5018 1.e-3GW 24 11 0.4695 9.9188 1.9994 -0.591 8.082 3.5018 1.e-3
184
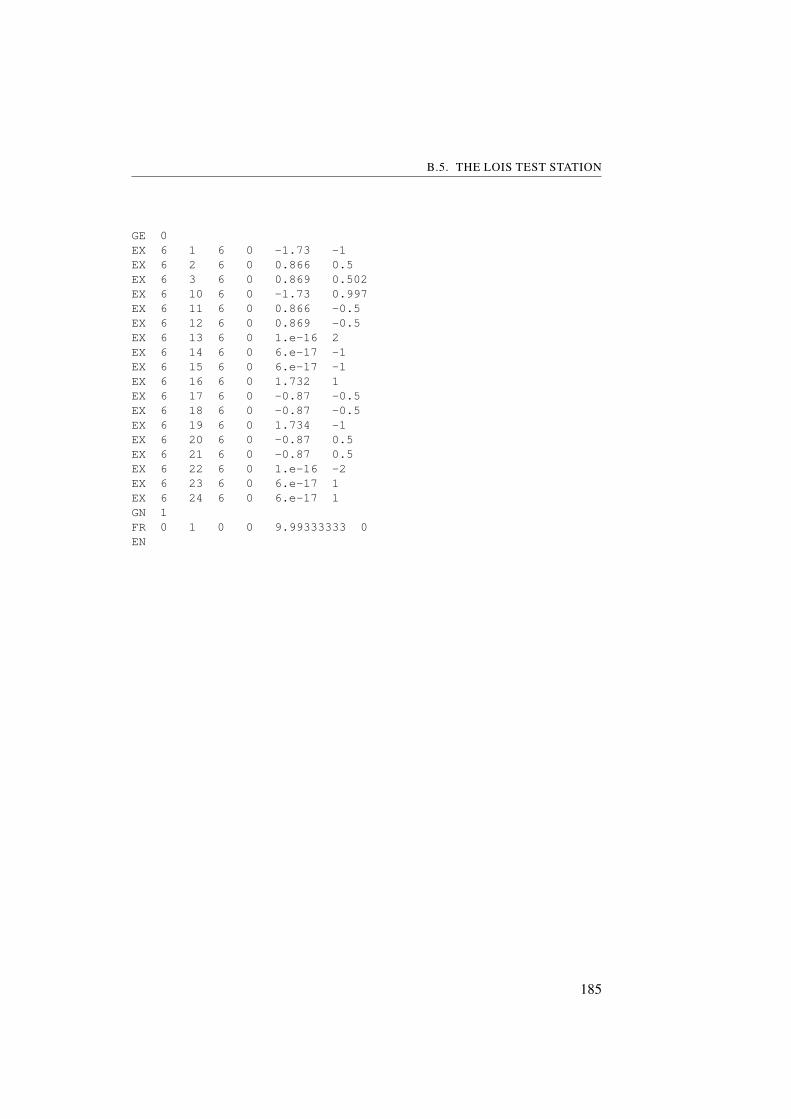
B.5. THE LOIS TEST STATION
GE 0EX 6 1 6 0 -1.73 -1EX 6 2 6 0 0.866 0.5EX 6 3 6 0 0.869 0.502EX 6 10 6 0 -1.73 0.997EX 6 11 6 0 0.866 -0.5EX 6 12 6 0 0.869 -0.5EX 6 13 6 0 1.e-16 2EX 6 14 6 0 6.e-17 -1EX 6 15 6 0 6.e-17 -1EX 6 16 6 0 1.732 1EX 6 17 6 0 -0.87 -0.5EX 6 18 6 0 -0.87 -0.5EX 6 19 6 0 1.734 -1EX 6 20 6 0 -0.87 0.5EX 6 21 6 0 -0.87 0.5EX 6 22 6 0 1.e-16 -2EX 6 23 6 0 6.e-17 1EX 6 24 6 0 6.e-17 1GN 1FR 0 1 0 0 9.99333333 0EN
185
