anheuser-busch 2004annualreport_full
TRANSCRIPT
thinkFresh
04AnnualReport
Anheuser-B
usch Com
panies, Inc.2004 Annual Report
2004
Financial Highlights . . . . . . . . . . . . . . . . . . . . . . . . . . . . . . . . . . . . . . . . . . . . . . . . . . . . . . . . . . . . . . . . . . . . . . . . . . . . . . . . . . . 1Letter to Shareholders . . . . . . . . . . . . . . . . . . . . . . . . . . . . . . . . . . . . . . . . . . . . . . . . . . . . . . . . . . . . . . . . . . . . . . . . . . . . . . . . 2Domestic Beer Operations . . . . . . . . . . . . . . . . . . . . . . . . . . . . . . . . . . . . . . . . . . . . . . . . . . . . . . . . . . . . . . . . . . . . . . . . . . 8International Beer Operations . . . . . . . . . . . . . . . . . . . . . . . . . . . . . . . . . . . . . . . . . . . . . . . . . . . . . . . . . . . . . . . . . . . . . . 14Packaging Operations . . . . . . . . . . . . . . . . . . . . . . . . . . . . . . . . . . . . . . . . . . . . . . . . . . . . . . . . . . . . . . . . . . . . . . . . . . . . . . . . 20Entertainment Operations . . . . . . . . . . . . . . . . . . . . . . . . . . . . . . . . . . . . . . . . . . . . . . . . . . . . . . . . . . . . . . . . . . . . . . . . . . 22Financial Overview . . . . . . . . . . . . . . . . . . . . . . . . . . . . . . . . . . . . . . . . . . . . . . . . . . . . . . . . . . . . . . . . . . . . . . . . . . . . . . . . . . . . 25Management’s Discussion and Analysis of Operations and Financial Condition . . . 26Management’s Responsibility for Financial Statements and
Management’s Report on Internal Control Over Financial Reporting . . . . . . . . . . . . 40Report of Independent Registered Public Accounting Firm . . . . . . . . . . . . . . . . . . . . . . . . . . 41Consolidated Financial Statements . . . . . . . . . . . . . . . . . . . . . . . . . . . . . . . . . . . . . . . . . . . . . . . . . . . . . . . . . . . . 42Notes to Consolidated Financial Statements . . . . . . . . . . . . . . . . . . . . . . . . . . . . . . . . . . . . . . . . . . . . . . . 46Financial Summaries . . . . . . . . . . . . . . . . . . . . . . . . . . . . . . . . . . . . . . . . . . . . . . . . . . . . . . . . . . . . . . . . . . . . . . . . . . . . . . . . 62Investor and Other Information . . . . . . . . . . . . . . . . . . . . . . . . . . . . . . . . . . . . . . . . . . . . . . . . . . . . . . . . . . . . . . . . . . . 68
How far can we go by innovating, challenging thestatus quo, and thinking fresh? Powerful innovationhas characterized our past. Our continued abilityto think fresh will create our future success.
© 2005 Anheuser-Busch Companies, Inc.
August A. Busch IIIChairman of the Board –
Anheuser-Busch Companies
Joined board 1963
Carlos Fernandez G.Vice Chairman of the Board and Chief Executive Officer –
Grupo Modelo, S.A. de C.V.; a Mexican company engaged inbrewing and related operations
Joined board 1996
James J. ForeseFormer Chairman and Chief Executive Officer –
IKON Office Solutions, Inc., a global business-to-businesscommunications company; Operating Partner and Chief Operating Officer of Thayer Capital Partners, a private equity investment firm
Joined board 2003
John E. JacobExecutive Vice President Global Communications –
Anheuser-Busch Companies
Joined board 1990
James R. JonesFormer U.S. Ambassador to Mexico;
Co-Chairman and Chief Executive Officer –
Manatt Jones Global Strategies, LLC, a global consulting firm;
Chairman – GlobeRanger Corporation
Joined board 1998
Charles F. KnightChairman Emeritus –
Emerson Electric Co.; a technology-based globalmanufacturing company
Joined board 1987
Vernon R. Loucks Jr.Chairman of the Board –
The Aethena Group, LLC, a health-care merchant banking firm
Joined board 1988
Vilma S. MartinezPartner –
Munger, Tolles & Olson, LLP; attorneys
Joined board 1983
William Porter PaynePartner –
Gleacher Partners, LLC, an investmentbanking and asset management firm
Joined board 1997
Joyce M. RochéPresident and Chief Executive Officer –
Girls Incorporated, a nonprofit organization
Joined board 1998
Henry Hugh SheltonFormer Chairman –
Joint Chiefs of Staff;
President, International Operations –
M.I.C. Industries, an internationalmanufacturing company
Joined board 2001
Patrick T. StokesPresident and Chief Executive Officer –Anheuser-Busch Companies
Joined board 2000
Andrew C. TaylorChairman and Chief Executive Officer –
Enterprise Rent-A-Car Company; an international car rental and related services company
Joined board 1995
Douglas A. Warner IIIFormer Chairman of the Board –
J.P. Morgan Chase & Co., an international commercial and investment banking firm
Joined board 1992
Edward E. Whitacre Jr.Chairman and Chief Executive Officer –
SBC Communications Inc.; a diversified telecommunicationscompany
Joined board 1988
Advisory Member
Bernard A. EdisonFormer President –
Edison Brothers Stores, Inc.; retail specialty stores
Joined board 1985
James B. OrthweinPartner –
Precise Capital, L.P., a privateinvestment partnership
Joined board 1963Advisory term ended April 2004
Anheuser-Busch Companies, Inc.
EPr
inte
d on
rec
ycle
d pa
per.
SITTING (LEFT TO RIGHT): William Porter Payne, Vilma S. Martinez, James B. Orthwein, Joyce M. Roché, Vernon R. Loucks Jr., Henry Hugh SheltonSTANDING (LEFT TO RIGHT): Charles F. Knight, Bernard A. Edison, Carlos Fernandez G., August A. Busch III, Patrick T. Stokes, Andrew C. Taylor, Douglas A. Warner III, John E. Jacob, James J. Forese, Edward E. Whitacre Jr., James R. Jones
Board of Directors
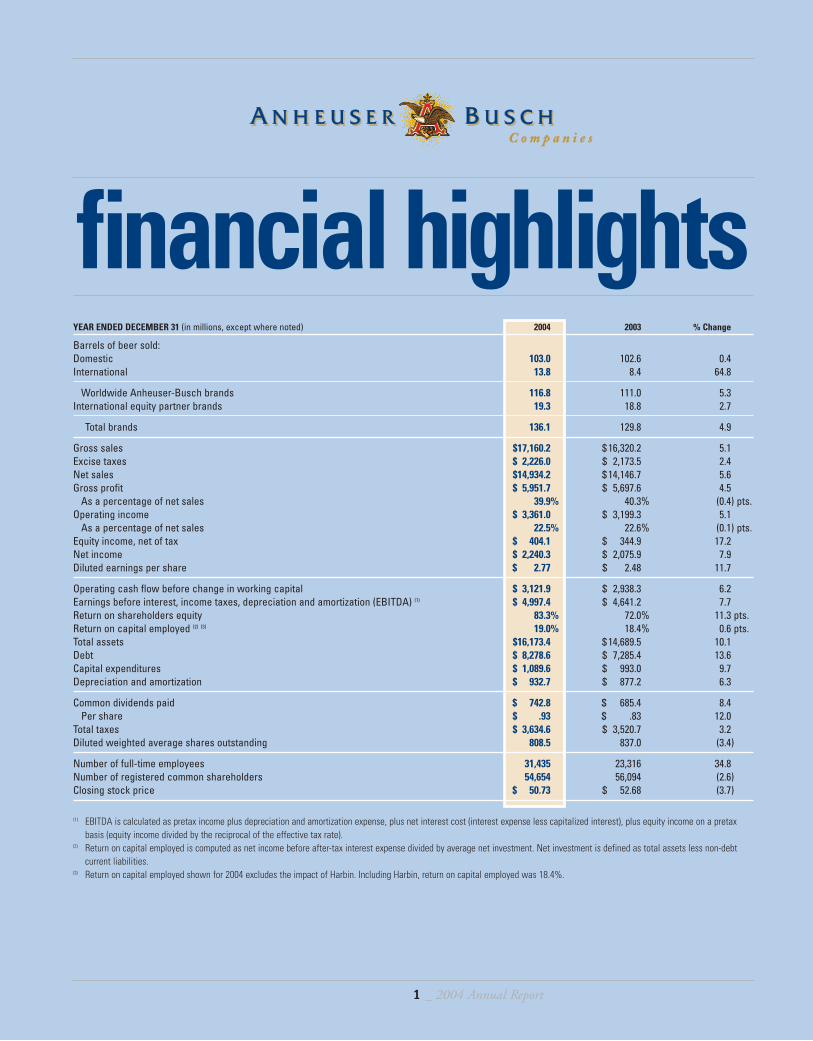
YEAR ENDED DECEMBER 31 (in millions, except where noted) 2004 2003 % Change
Barrels of beer sold:Domestic 103.0 102.6 0.4International 13.8 8.4 64.8
Worldwide Anheuser-Busch brands 116.8 111.0 5.3International equity partner brands 19.3 18.8 2.7
Total brands 136.1 129.8 4.9
Gross sales $17,160.2 $ 16,320.2 5.1Excise taxes $ 2,226.0 $ 2,173.5 2.4Net sales $14,934.2 $ 14,146.7 5.6Gross profit $ 5,951.7 $ 5,697.6 4.5
As a percentage of net sales 39.9% 40.3% (0.4) pts.Operating income $ 3,361.0 $ 3,199.3 5.1
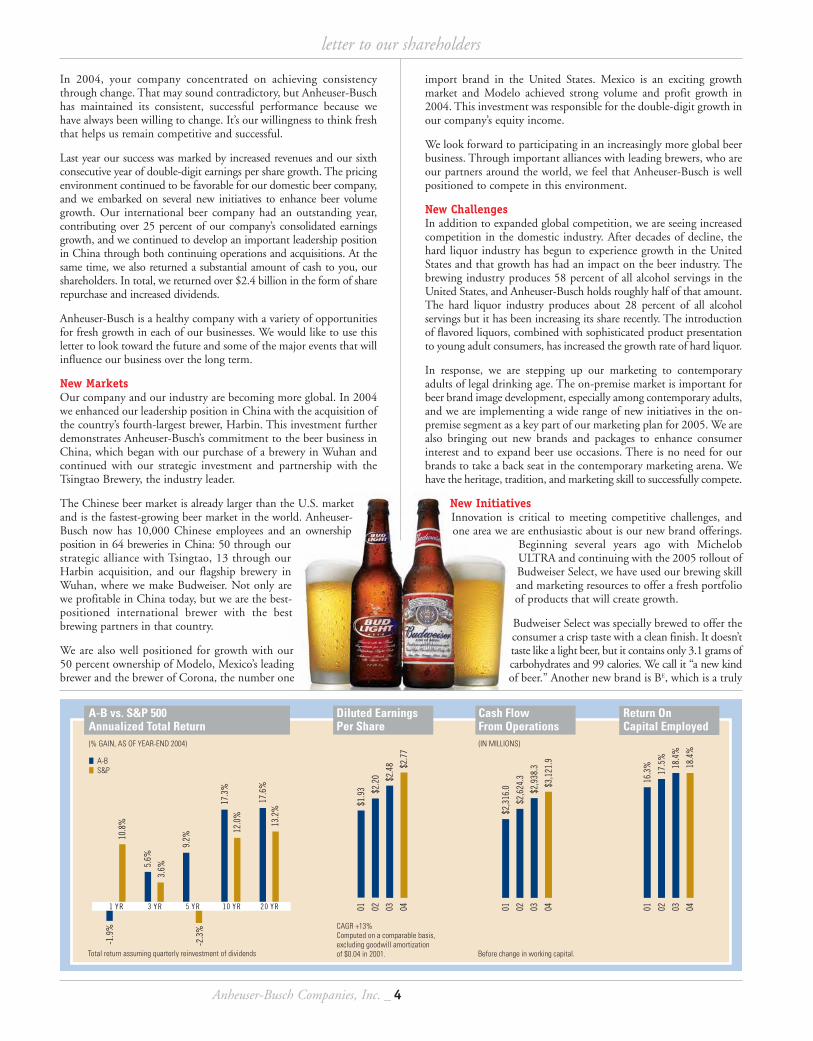
As a percentage of net sales 22.5% 22.6% (0.1) pts.Equity income, net of tax $ 404.1 $ 344.9 17.2Net income $ 2,240.3 $ 2,075.9 7.9Diluted earnings per share $ 2.77 $ 2.48 11.7
Operating cash flow before change in working capital $ 3,121.9 $ 2,938.3 6.2Earnings before interest, income taxes, depreciation and amortization (EBITDA) (1) $ 4,997.4 $ 4,641.2 7.7Return on shareholders equity 83.3% 72.0% 11.3 pts.Return on capital employed (2) (3) 19.0% 18.4% 0.6 pts.Total assets $16,173.4 $ 14,689.5 10.1Debt $ 8,278.6 $ 7,285.4 13.6Capital expenditures $ 1,089.6 $ 993.0 9.7Depreciation and amortization $ 932.7 $ 877.2 6.3
Common dividends paid $ 742.8 $ 685.4 8.4Per share $ .93 $ .83 12.0
Total taxes $ 3,634.6 $ 3,520.7 3.2Diluted weighted average shares outstanding 808.5 837.0 (3.4)
Number of full-time employees 31,435 23,316 34.8Number of registered common shareholders 54,654 56,094 (2.6)Closing stock price $ 50.73 $ 52.68 (3.7)
(1) EBITDA is calculated as pretax income plus depreciation and amortization expense, plus net interest cost (interest expense less capitalized interest), plus equity income on a pretaxbasis (equity income divided by the reciprocal of the effective tax rate).
(2) Return on capital employed is computed as net income before after-tax interest expense divided by average net investment. Net investment is defined as total assets less non-debtcurrent liabilities.
(3) Return on capital employed shown for 2004 excludes the impact of Harbin. Including Harbin, return on capital employed was 18.4%.
1 _ 2004 Annual Report
financial highlights

Hops: The spice of beer.
Clusters of conesfrom the vine-likehop plant contributetheir own specialaroma, flavor andcharacter to beer.
fresh .
3 _ 2004 Annual Report
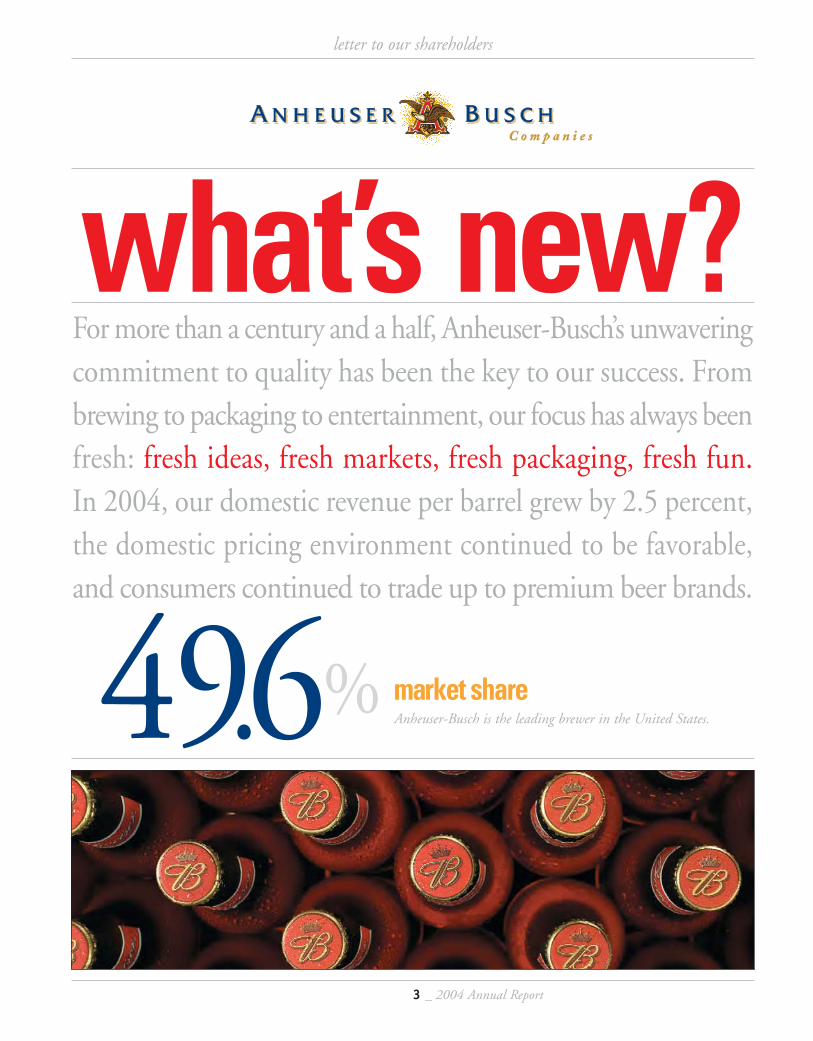
what’s new?For more than a century and a half, Anheuser-Busch’s unwaveringcommitment to quality has been the key to our success. Frombrewing to packaging to entertainment, our focus has always beenfresh: fresh ideas, fresh markets, fresh packaging, fresh fun.In 2004, our domestic revenue per barrel grew by 2.5 percent,the domestic pricing environment continued to be favorable,and consumers continued to trade up to premium beer brands.
letter to our shareholders
49.6% market shareAnheuser-Busch is the leading brewer in the United States.
Anheuser-Busch Companies, Inc. _ 4
In 2004, your company concentrated on achieving consistencythrough change. That may sound contradictory, but Anheuser-Buschhas maintained its consistent, successful performance because wehave always been willing to change. It’s our willingness to think freshthat helps us remain competitive and successful.
Last year our success was marked by increased revenues and our sixthconsecutive year of double-digit earnings per share growth. The pricingenvironment continued to be favorable for our domestic beer company,and we embarked on several new initiatives to enhance beer volumegrowth. Our international beer company had an outstanding year,contributing over 25 percent of our company’s consolidated earningsgrowth, and we continued to develop an important leadership positionin China through both continuing operations and acquisitions. At thesame time, we also returned a substantial amount of cash to you, ourshareholders. In total, we returned over $2.4 billion in the form of sharerepurchase and increased dividends.
Anheuser-Busch is a healthy company with a variety of opportunitiesfor fresh growth in each of our businesses. We would like to use thisletter to look toward the future and some of the major events that willinfluence our business over the long term.
New MarketsOur company and our industry are becoming more global. In 2004we enhanced our leadership position in China with the acquisition ofthe country’s fourth-largest brewer, Harbin. This investment furtherdemonstrates Anheuser-Busch’s commitment to the beer business inChina, which began with our purchase of a brewery in Wuhan andcontinued with our strategic investment and partnership with theTsingtao Brewery, the industry leader.
The Chinese beer market is already larger than the U.S. marketand is the fastest-growing beer market in the world. Anheuser-Busch now has 10,000 Chinese employees and an ownershipposition in 64 breweries in China: 50 through ourstrategic alliance with Tsingtao, 13 through ourHarbin acquisition, and our flagship brewery inWuhan, where we make Budweiser. Not only arewe profitable in China today, but we are the best-positioned international brewer with the bestbrewing partners in that country.
We are also well positioned for growth with our50 percent ownership of Modelo, Mexico’s leadingbrewer and the brewer of Corona, the number one
import brand in the United States. Mexico is an exciting growthmarket and Modelo achieved strong volume and profit growth in2004. This investment was responsible for the double-digit growth inour company’s equity income.
We look forward to participating in an increasingly more global beerbusiness. Through important alliances with leading brewers, who areour partners around the world, we feel that Anheuser-Busch is wellpositioned to compete in this environment.
New ChallengesIn addition to expanded global competition, we are seeing increasedcompetition in the domestic industry. After decades of decline, thehard liquor industry has begun to experience growth in the UnitedStates and that growth has had an impact on the beer industry. Thebrewing industry produces 58 percent of all alcohol servings in theUnited States, and Anheuser-Busch holds roughly half of that amount.The hard liquor industry produces about 28 percent of all alcoholservings but it has been increasing its share recently. The introductionof flavored liquors, combined with sophisticated product presentationto young adult consumers, has increased the growth rate of hard liquor.
In response, we are stepping up our marketing to contemporaryadults of legal drinking age. The on-premise market is important forbeer brand image development, especially among contemporary adults,and we are implementing a wide range of new initiatives in the on-premise segment as a key part of our marketing plan for 2005. We arealso bringing out new brands and packages to enhance consumerinterest and to expand beer use occasions. There is no need for ourbrands to take a back seat in the contemporary marketing arena. Wehave the heritage, tradition, and marketing skill to successfully compete.
New InitiativesInnovation is critical to meeting competitive challenges, andone area we are enthusiastic about is our new brand offerings.
Beginning several years ago with MichelobULTRA and continuing with the 2005 rollout ofBudweiser Select, we have used our brewing skilland marketing resources to offer a fresh portfolioof products that will create growth.
Budweiser Select was specially brewed to offer theconsumer a crisp taste with a clean finish. It doesn’ttaste like a light beer, but it contains only 3.1 grams ofcarbohydrates and 99 calories. We call it “a new kindof beer.” Another new brand is BE, which is a truly
01
$2,3
16.0
$2,6
24.3
$2,9
38.3
$3,1
21.9
02 03 04 01 02 03 04
$1.9
3 $2.2
0 $2.4
8 $2.7
7
0116
.3%
17.5
%
18.4
%
18.4
%
02 03 04
3.6%
-2.3
%
-1.9
%10
.8%
5.6%
9.2%
17.3
%12
.0%
17.6
%13
.2%
1 YR 3 YR 5 YR 10 YR 20 YR
A-B vs. S&P 500 Annualized Total Return(% GAIN, AS OF YEAR-END 2004)
A-BS&P
Diluted Earnings Per Share
Cash Flow From Operations(IN MILLIONS)
Return On Capital Employed
Total return assuming quarterly reinvestment of dividends Before change in working capital.
CAGR +13% Computed on a comparable basis, excluding goodwill amortization of $0.04 in 2001.
letter to our shareholders
unique product. It offers the taste of a flavored malt beverage with theaddition of caffeine, ginseng and guarana. It’s beer with something extra.
On the packaging side, we have many exciting initiatives. Our nationalrollout of applied plastic labels on all Bud Light bottles is more thana graphics change, it’s a new capability in packaging that allows us tomove a brand’s image upscale. This new label also gives us options inpositioning new products such as Budweiser Select.
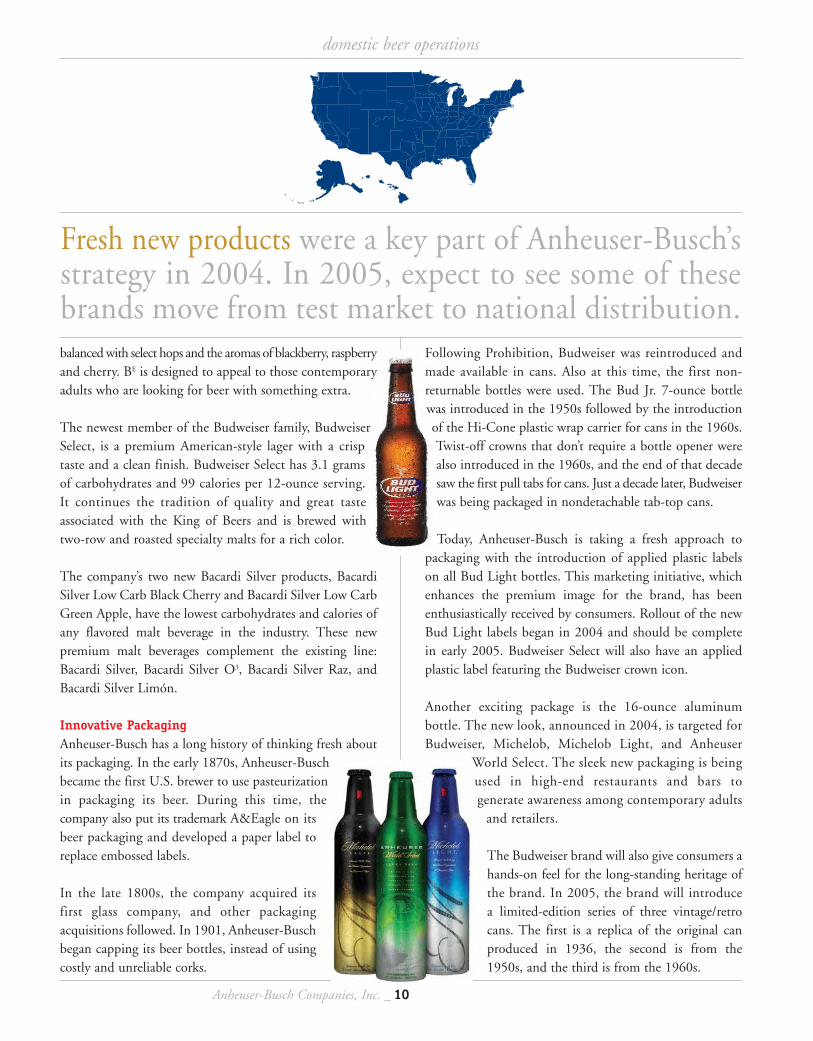
We have also introduced unique 16-ounce aluminum bottles forMichelob, Michelob Light and Anheuser World Select in a numberof markets, and consumer response has been very strong. We will beintroducing several retro-themed Budweiser can packages in 2005 duringpromotions aimed to celebrate and recall the brand’s heritage and tradition.
We have worked hard for decades, through product and packaginginnovations like these, to grow our share to roughly half of the beerindustry. And we intend to continue innovating as we look at thedomestic and global industry in a fresh new light. That’s what wemean by consistency through change.
Subsidiary StrengthOur family adventure parks are an integral part of our ability to meetand entertain consumers in a wholesome fun-filled setting. We notonly entertained 20 million people last year, but we made excellentfinancial returns despite the unprecedented series of hurricanes in thesoutheastern United States. We remember with pride the exemplaryperformance of our employees who coped with the crisis, placed apriority on safety, and got the parks back in operating order in short time.
In 2005, our adventure parks will also give us the opportunity to salutethe U.S. military. We have invited uniformed men and women andtheir families to join us free of charge at our parks. We are humblygrateful for their service and appreciate the opportunity to say thanks.
Our high-quality packaging operations offer us a competitiveedge. We make aluminum cans, lids, glass bottles, and labels,which are not only the highest quality but also help us runour breweries more efficiently. As we gain insight into thechallenges our external suppliers face, we learn how to worktoward our common benefit. By eliminating unnecessarycost in the production and logistics system, we are able toboost productivity. It also helps us in leading best practiceinitiatives when we invest in the beer business overseas.
Community StrengthIn 2004 Anheuser-Busch had numerous opportunities to workwith the communities in which we do business. The cornerstone ofthe company’s efforts is the commitment to promoting responsibledrinking among adults and to fighting abuse, including underagedrinking and drunk driving. For more than two decades, we havebeen the industry leader in these efforts.
In 2005, we will proudly celebrate our company’s 20th anniversary ofpromoting responsibility through broadcast advertising. In 1985, wewere the first alcohol beverage company to run a TV spot promotingresponsible drinking on network television. We reached anothermilestone, too: Investments in alcohol awareness initiatives by Anheuser-Busch and our wholesaler family have surpassed $500 million sincewe introduced our “Know When to Say When” campaign in 1982.
Working together with our more than 600 wholesalers nationwide,and our many partners in the areas of education, law enforcement,retailing, and parents and community groups, Anheuser-Busch hasmade a lasting contribution to helping our nation realize significantdeclines in drunk driving and underage drinking during the past twodecades. But there’s more work to be done, and we will continue toshare the message that Responsibility Matters.
In addition to these efforts, it has been a longstanding companytradition to come to the aid of our local communities in times ofcrisis. The Atlantic hurricane season was especially brutal in 2004,and Anheuser-Busch donated more than 6 million cans of drinkingwater to aid the victims of hurricanes Charley and Frances.
In response to the series of hurricanes, which caused damage acrossFlorida, the Anheuser-Busch Foundation donated $1.1 million to aidhurricane relief. Other members of our Anheuser-Busch family joinedin these efforts. Anheuser-Busch and its independent wholesalersdonated $1 million to the American Red Cross as part of a nationwideprogram called Operation Hurricane Relief.
Unfortunately, before the year was out, another disaster ofglobal proportions struck. On Dec. 26, 2004, the largest
earthquake to strike the globe since 1964 rocked the oceanfloor off the coast of Indonesia.
As a global corporate citizen, Anheuser-Busch institutedOperation Tsunami Relief. The company matched allemployee donations to the American National Red
Cross International Response Fund, and we earmarkedall employee and company gifts made to this fund for
the tsunami relief.
Anheuser-Busch has been helping communities cope with naturaldisasters since 1906. And, while we wish there was not a need for thiskind of support, we’ll always be there to provide help and assistance.
Proven Strengths, New OpportunitiesLooking forward to 2005 and beyond, we see long-term opportunitiesarising from current challenges. The long-term positives in our businessare still present. We have a favorable domestic price environment,consumers are still trading up to premium products, and capacityutilization is at a high level. The number of 21- to 27-year-oldconsumers will grow through the end of this decade. We are investingin new brands, new packages and new ways to engage our consumers.We have a lot going on . . . but we like it that way.
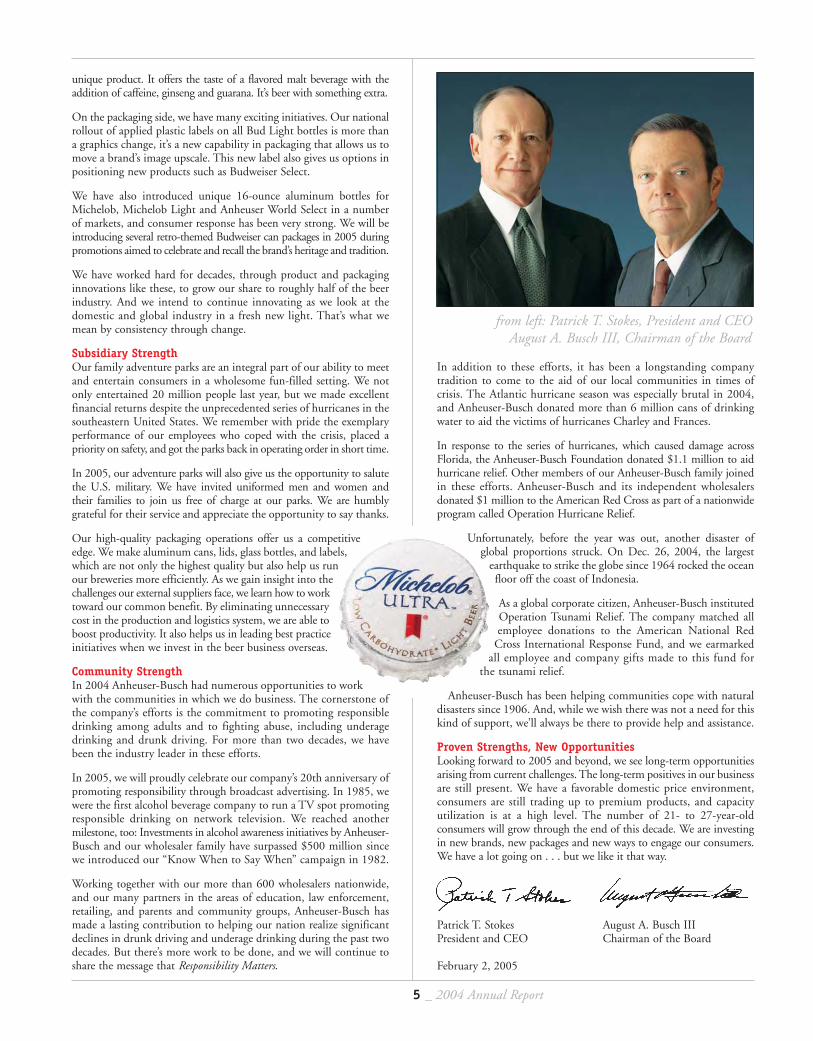
Patrick T. Stokes August A. Busch IIIPresident and CEO Chairman of the Board
February 2, 2005
from left: Patrick T. Stokes, President and CEOAugust A. Busch III, Chairman of the Board
5 _ 2004 Annual Report

Bright. Crisp. Clean. Pure.fresh .


Barley: The soul of beer.
There are two basic types of barley malt used in brewing beer – two-row, which produces a smooth, mild-taste, and six-row, which produces a crisp flavor.
fresh .
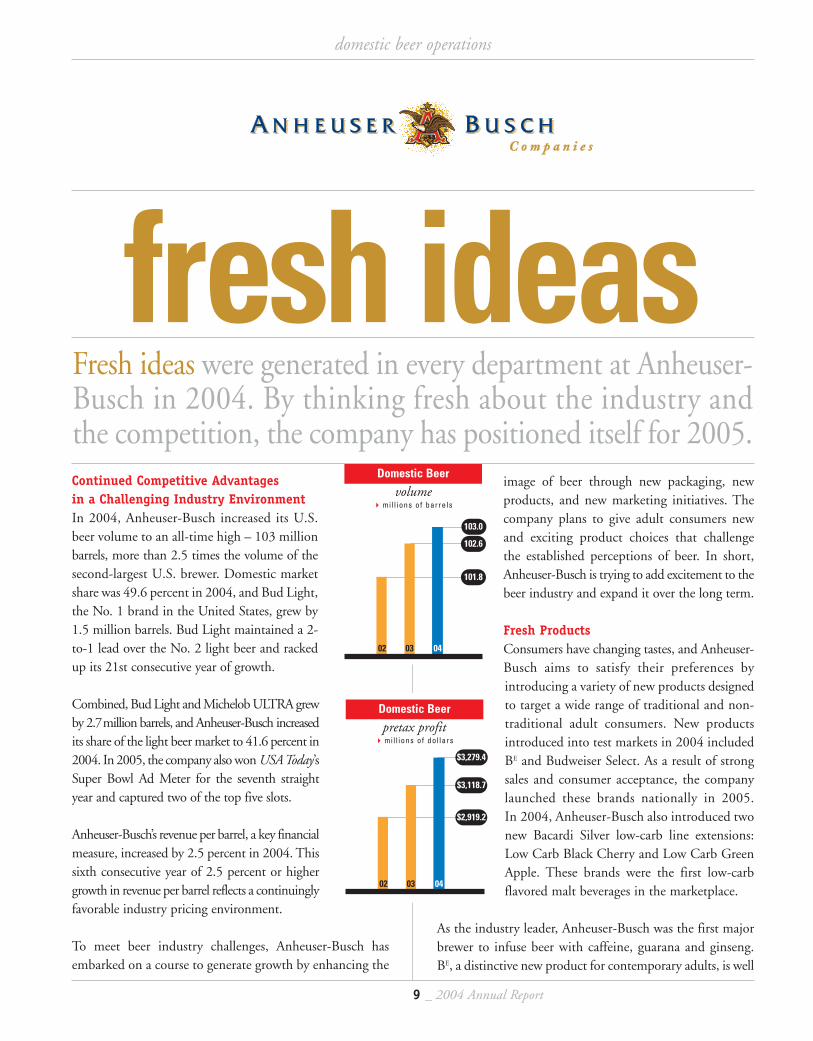
fresh ideasContinued Competitive Advantages in a Challenging Industry EnvironmentIn 2004, Anheuser-Busch increased its U.S.beer volume to an all-time high – 103 millionbarrels, more than 2.5 times the volume of thesecond-largest U.S. brewer. Domestic marketshare was 49.6 percent in 2004, and Bud Light,the No. 1 brand in the United States, grew by1.5 million barrels. Bud Light maintained a 2-to-1 lead over the No. 2 light beer and rackedup its 21st consecutive year of growth.
Combined, Bud Light and Michelob ULTRA grewby 2.7million barrels, and Anheuser-Busch increasedits share of the light beer market to 41.6 percent in2004. In 2005, the company also won USA Today’sSuper Bowl Ad Meter for the seventh straightyear and captured two of the top five slots.
Anheuser-Busch’s revenue per barrel, a key financialmeasure, increased by 2.5 percent in 2004. Thissixth consecutive year of 2.5 percent or highergrowth in revenue per barrel reflects a continuinglyfavorable industry pricing environment.
To meet beer industry challenges, Anheuser-Busch hasembarked on a course to generate growth by enhancing the
image of beer through new packaging, newproducts, and new marketing initiatives. Thecompany plans to give adult consumers newand exciting product choices that challengethe established perceptions of beer. In short,Anheuser-Busch is trying to add excitement to thebeer industry and expand it over the long term.
Fresh ProductsConsumers have changing tastes, and Anheuser-Busch aims to satisfy their preferences byintroducing a variety of new products designedto target a wide range of traditional and non-traditional adult consumers. New productsintroduced into test markets in 2004 includedBE and Budweiser Select. As a result of strongsales and consumer acceptance, the companylaunched these brands nationally in 2005.In 2004, Anheuser-Busch also introduced twonew Bacardi Silver low-carb line extensions:Low Carb Black Cherry and Low Carb GreenApple. These brands were the first low-carbflavored malt beverages in the marketplace.
As the industry leader, Anheuser-Busch was the first majorbrewer to infuse beer with caffeine, guarana and ginseng.BE, a distinctive new product for contemporary adults, is well
domestic beer operations
9 _ 2004 Annual Report
Domestic Beer
volume
02 03 04
�mil l ions of barrels
102.6
103.0
101.8
Domestic Beer
pretax profit
02 03 04
�mil l ions of dol lars
$3,118.7
$3,279.4
$2,919.2
Fresh ideas were generated in every department at Anheuser-Busch in 2004. By thinking fresh about the industry andthe competition, the company has positioned itself for 2005.
Following Prohibition, Budweiser was reintroduced andmade available in cans. Also at this time, the first non-returnable bottles were used. The Bud Jr. 7-ounce bottlewas introduced in the 1950s followed by the introductionof the Hi-Cone plastic wrap carrier for cans in the 1960s.Twist-off crowns that don’t require a bottle opener werealso introduced in the 1960s, and the end of that decadesaw the first pull tabs for cans. Just a decade later, Budweiserwas being packaged in nondetachable tab-top cans.
Today, Anheuser-Busch is taking a fresh approach topackaging with the introduction of applied plastic labelson all Bud Light bottles. This marketing initiative, whichenhances the premium image for the brand, has beenenthusiastically received by consumers. Rollout of the newBud Light labels began in 2004 and should be completein early 2005. Budweiser Select will also have an appliedplastic label featuring the Budweiser crown icon.
Another exciting package is the 16-ounce aluminumbottle. The new look, announced in 2004, is targeted forBudweiser, Michelob, Michelob Light, and Anheuser
World Select. The sleek new packaging is beingused in high-end restaurants and bars togenerate awareness among contemporary adults
and retailers.
The Budweiser brand will also give consumers ahands-on feel for the long-standing heritage ofthe brand. In 2005, the brand will introducea limited-edition series of three vintage/retrocans. The first is a replica of the original canproduced in 1936, the second is from the1950s, and the third is from the 1960s.
domestic beer operations
Fresh new products were a key part of Anheuser-Busch’sstrategy in 2004. In 2005, expect to see some of thesebrands move from test market to national distribution.balanced with select hops and the aromas of blackberry, raspberryand cherry. BE is designed to appeal to those contemporaryadults who are looking for beer with something extra.
The newest member of the Budweiser family, BudweiserSelect, is a premium American-style lager with a crisptaste and a clean finish. Budweiser Select has 3.1 gramsof carbohydrates and 99 calories per 12-ounce serving.It continues the tradition of quality and great tasteassociated with the King of Beers and is brewed withtwo-row and roasted specialty malts for a rich color.
The company’s two new Bacardi Silver products, BacardiSilver Low Carb Black Cherry and Bacardi Silver Low CarbGreen Apple, have the lowest carbohydrates and calories ofany flavored malt beverage in the industry. These newpremium malt beverages complement the existing line:Bacardi Silver, Bacardi Silver O3, Bacardi Silver Raz, andBacardi Silver Limón.
Innovative PackagingAnheuser-Busch has a long history of thinking fresh aboutits packaging. In the early 1870s, Anheuser-Buschbecame the first U.S. brewer to use pasteurizationin packaging its beer. During this time, thecompany also put its trademark A&Eagle on itsbeer packaging and developed a paper label toreplace embossed labels.
In the late 1800s, the company acquired itsfirst glass company, and other packagingacquisitions followed. In 1901, Anheuser-Buschbegan capping its beer bottles, instead of usingcostly and unreliable corks.
Anheuser-Busch Companies, Inc. _ 10
Competitive Advantages Stronger and More Important Than EverIn 2004, Anheuser-Busch was – once again – the undisputedleader of the U.S. beer industry, with 49.6 percent of themarket. Being the industry leader for more than 45 years hasallowed the company to develop strong competitive advantages.
One key advantage Anheuser-Busch has over competitiveU.S. brewers is its system of 12 breweries strategically locatedacross the country. This network not only reduces freightcosts, but also gives the company a second competitiveadvantage: the freshest beer of any major brewer. On average,Anheuser-Busch beers are 14 days fresher than thenearest competitor’s. This has led to one of the mostsuccessful consumer campaigns in the domestic beerindustry: Day Fresh Beer, beer that has been packagedand delivered for consumption on its born-on date.
A key part of Anheuser-Busch’s marketing efforts in2004 and beyond will focus on the company’sfreshness initiative. Last year, more than 5 million adultbeer drinkers tasted day-fresh Budweiser and BudLight during freshness promotions. One key event
was on Sept. 9, when Anheuser-Busch delivered Day FreshBudweiser and Bud Light to 200 cities across the UnitedStates to kick off the NFL season.
No one can match Anheuser-Busch’s product freshness andconsistency. This is a tremendous competitive advantage in thebeer industry in both the on- and off-premise marketplace.The company will continue to leverage this advantage bycommunicating the fact that fresh beer truly tastes better. Beerthat isn’t fresh tastes stale, and it has a strong aftertaste. Thehallmark of Anheuser-Busch beers are their drinkability.
Bringing America’s adults Day Fresh Beer would not bepossible without the dedication of Anheuser-Busch’swholesalers, another competitive advantage. With 69percent of Anheuser-Busch volume going through
exclusive wholesalers, Anheuser-Busch has apowerful strategic advantage that other brewerscannot come close to matching. This system,combined with additional resources the company isdevoting to the on-premise market, gives Anheuser-Busch a powerful team prepared to address on-premise challenges and to pursue new opportunities.
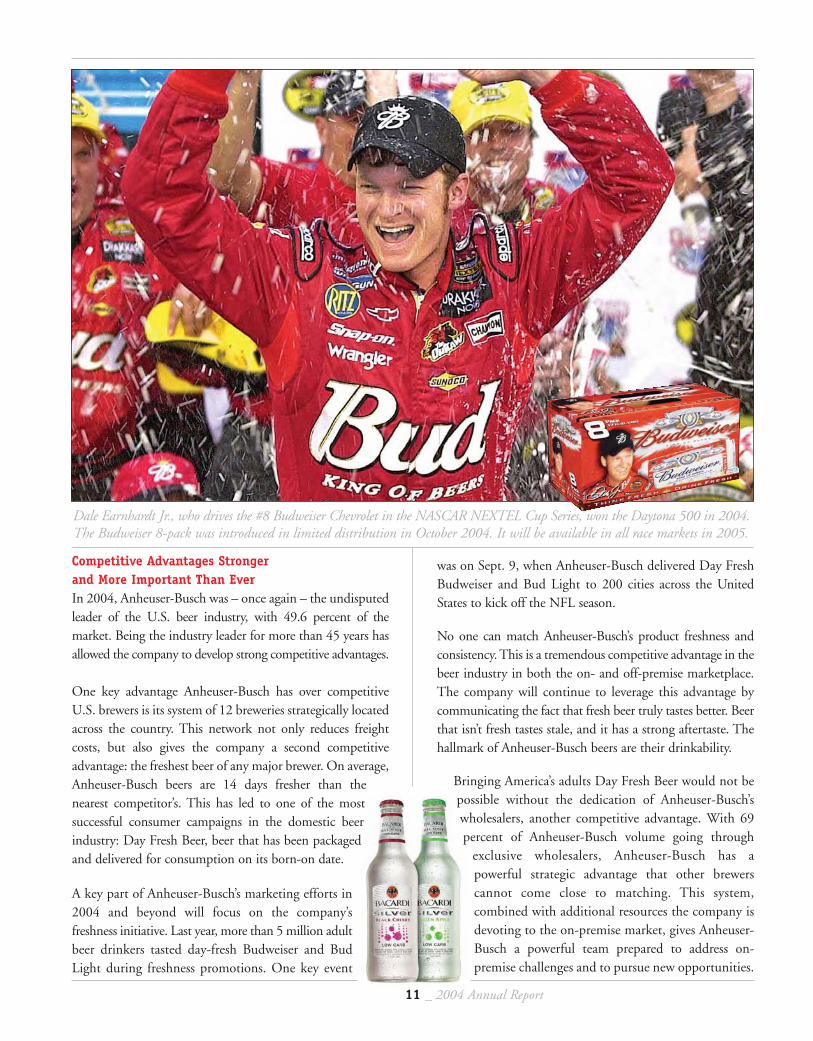
Dale Earnhardt Jr., who drives the #8 Budweiser Chevrolet in the NASCAR NEXTEL Cup Series, won the Daytona 500 in 2004.The Budweiser 8-pack was introduced in limited distribution in October 2004. It will be available in all race markets in 2005.
11 _ 2004 Annual Report

How to pour yourbeer properly.Step 1: Crack open a fresh, crisp Budweiser.
Step 2:Pour directly down the center of the glass to produce a collar offoam, which will release the properamount of carbonation.
Step 3:Enjoy the best-tasting, freshest beer available.
fresh .
Anheuser-Busch has supported about 400 community-based and national Latino organizations and special eventswith contributions of more than $45 million over the pasttwo decades. The company focuses on values that areimportant to Latinos, such as education, leadership
development, economic empowerment, public advocacy,and the arts and culture. In the last 22 years, the companyhas helped raise more than $22 million to provide morethan 18,000 college scholarships to deserving Latinos.
In the African-American market, the company’s Budweiserand Bud Light brands combined have more than 30
percent market share. Plans for this market include sports,music, and lifestyle advertising and sponsorships.
For more than a decade, Anheuser-Busch has supported thecountry’s largest annual African-American music celebration,the Budweiser Essence Music Festival. The Bud Light Loungeenlists the hottest urban and hip-hop artists to host privateparties for adult consumers in various markets. BothBudweiser and Bud Light sponsor First Fridays, the largestgatherings of African-American professionals in the UnitedStates that take place on the first Friday of each month.
Challenges Provide Fresh OpportunitiesAs always, Anheuser-Busch continues to look for fresh waysof doing business. The company will address off-premiseneeds through its Seamless Selling initiative and pursuecost reductions through the Brewery of the Future program.
Seamless Selling is an excellent example of Anheuser-Buschinnovation. By working with its wholesaler team, Anheuser-Busch is meeting the growing needs of its chain customers.Seamless Selling offers all retail customers greater valuethrough improved inventory management, data-basedselling, electronic transactions and more effective account-level planning and service.
Anheuser-Busch will continue to reduce costs throughBrewery of the Future, as it has since the program wasinstituted in 2002. This initiative is raising the efficiency andeffectiveness of overall brewing operations. For 2005,Anheuser-Busch plans to continue to maintain the high levelof quality and consistency that is a hallmark of all its brands.
In 2004, Anheuser-Busch met with its wholesalers to discussnew objectives and standards for on-premise marketing.These standards include an increase in on-premise sales callvisits and marketing activities, while maintaining a steadfastfocus on draught beer service and product quality.
The company also announced plans to fund newmarketing efforts on-premise. This initiative willinclude adding staff in key markets where on-premiseopportunities have been identified.
Further plans call for adding excitement to the company’sbrands through increased product sampling and moresupport for on-premise chain customers. This process hasalready begun in select casual dining chains.
To think fresh means to look at the marketplace differently.For Anheuser-Busch, the process began when the companystarted looking at its sales force differently. The changes toits on-premise sales force will address improved retailer service,help enhance the image of beer, and position Anheuser-Busch’sportfolio of brands as the perfect beverages for all occasions.
Fresh Marketing and SponsorshipsWhile Anheuser-Busch continued its mainstream marketingprograms in 2004, the company also mapped out plans torevitalize its ethnic marketing programs. Anheuser-Busch hasdeveloped a fresh approach to enhancing its ethnic marketleadership. For the Latino market, where Budweiser and BudLight combined have more than 40 percent market share, thecompany’s marketing plan includes television, outdoor andprint advertising, and music and sports sponsorships.
Noche de Pasion combined the hottest local and national Latinmusic acts with 3-on-3 soccer in 2004. For 2005, Esta NocheToca, a Latin version of Budweiser’s 1 Night Stand concertseries, will feature artists such as Latin Grammy-winner Bacilosin intimate settings. In addition, Anheuser-Busch’s Budweiserand Bud Light brands sponsor parties for viewing the MexicanNational Soccer Team and FIFA World CupTM Qualifier games.
Anheuser-Busch’s support for the Latino community datesback more than a century. In the 1880s, the companydelivered the first Spanish-language sales catalogs toretailers and businesses in Texas, Arizona, and NewMexico. In the late 1890s, the Escalada Brothers ofNogales, Ariz., were the company’s earliest Hispanicbusiness partners and beer distributors. Anheuser-Busch’scommitment to the Latino community is an integral partof its business tradition.
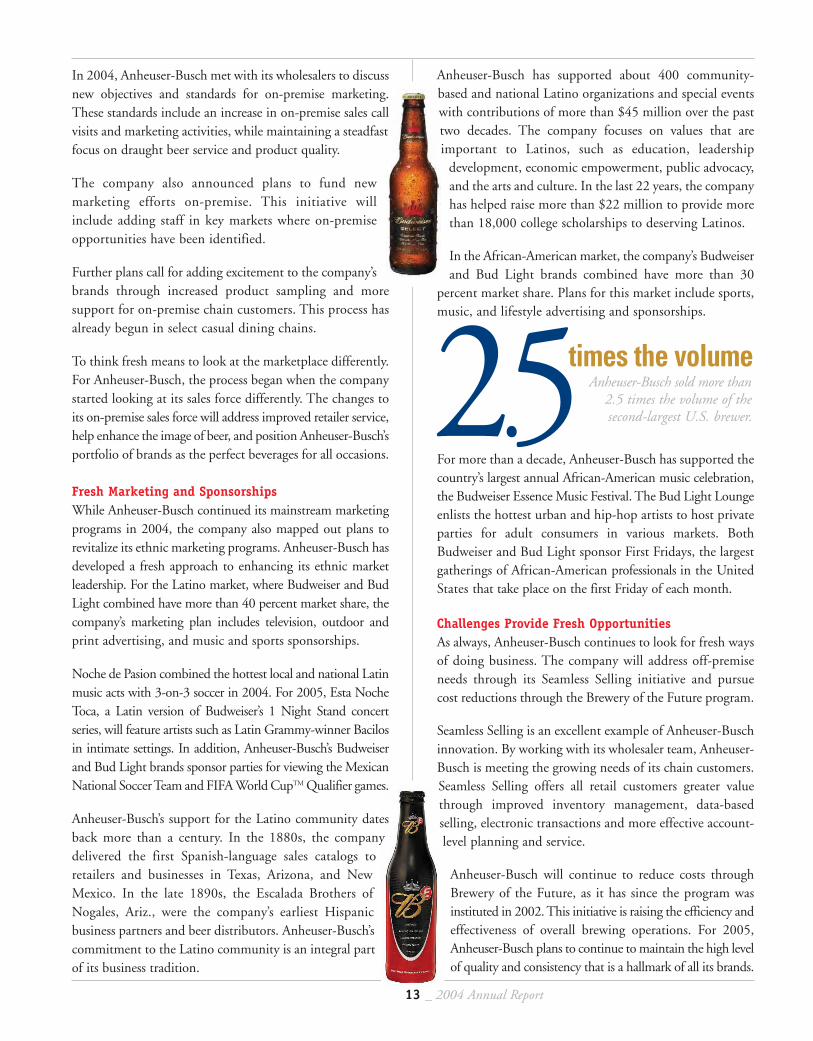
times the volumeAnheuser-Busch sold more than
2.5 times the volume of thesecond-largest U.S. brewer. 2.5
13 _ 2004 Annual Report

Rice: Provides Budweiser with its characteristic
lightness, crispness, and refreshing taste.
fresh .
Thinking Fresh Through Global ExpansionIn 2004, Anheuser-Busch relied on its proventwo-prong international growth strategy toexpand the Budweiser brand globally whilestrengthening its equity partnerships withleading brewers in key markets around theworld. In the United Kingdom and China,Anheuser-Busch brands are brewed andsold by company-owned operations. In Mexicoand China, equity partnerships with GrupoModelo of Mexico and Tsingtao BreweryCompany Ltd. continue to thrive.
Over the past five years, international operations havemore than tripled net income, to $485 million in 2004.This includes income from equity investment partners.
Anheuser-Busch had an excellent year in 2004 as it expandedin China with the acquisition of the Harbin Brewing Group.Although expansion in China was a focal point in 2004,other international markets, such as the United Kingdomand Canada turned in an excellent performance.
China: Fresh Look at an Ancient LandAnheuser-Busch continues to develop animportant leadership position in China, theworld’s largest beer market by volume and thefastest-growing beer market. During the pastfive years, China has accounted for a thirdof the world’s beer volume growth. Last yearin China, Anheuser-Busch showed over 10percent volume growth.
Anheuser-Busch entered China in 1993 withthe purchase of a 5 percent equity stake inTsingtao Brewery as part of its initial public
offering of shares on the Hong Kong stock exchange. In1995, Anheuser-Busch acquired a brewery in Wuhan, whereBudweiser is still brewed and packaged. Since 1995,capacity expansions of 2 million barrels have increased thebrewery capacity by almost four times. Anheuser-Buschdistributes Budweiser through a network of more than 100independent wholesalers to more than 40 major markets inChina from this single site. This makes it unique amongbrewers in China; others typically use numerous production
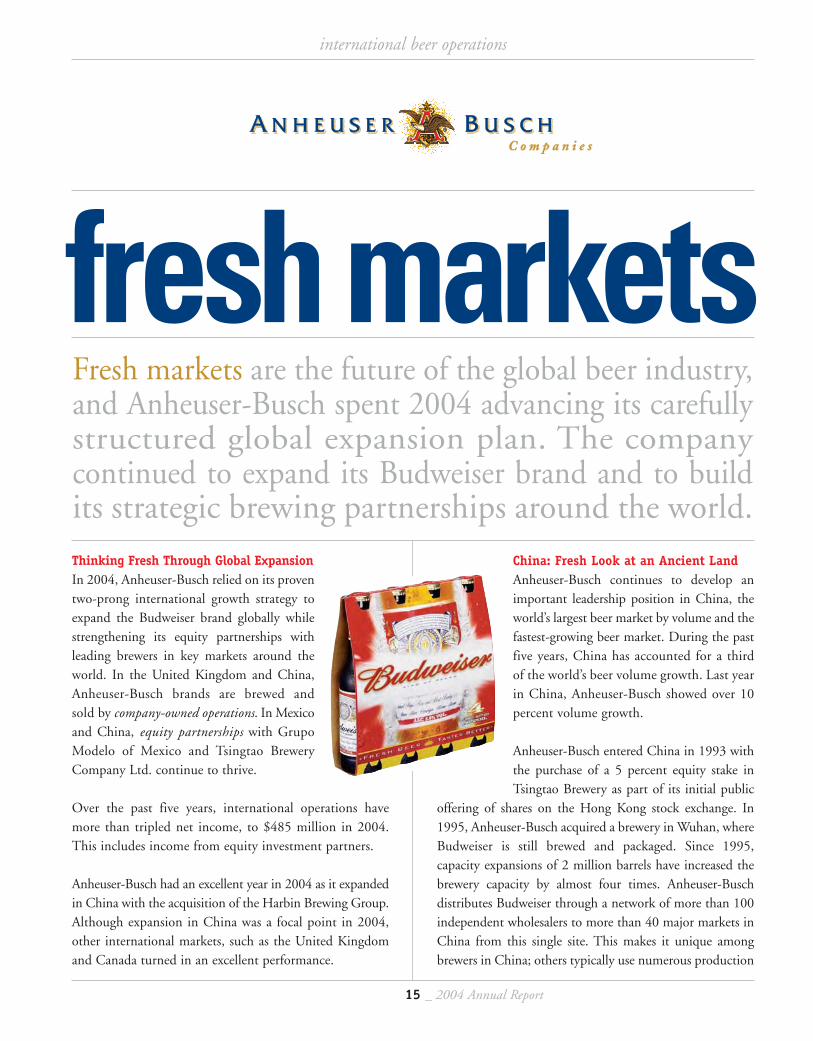
fresh marketsFresh markets are the future of the global beer industry,and Anheuser-Busch spent 2004 advancing its carefullystructured global expansion plan. The companycontinued to expand its Budweiser brand and to buildits strategic brewing partnerships around the world.
international beer operations
15 _ 2004 Annual Report
sites to support distribution. Anheuser-Buschis thinking fresh about distribution in Chinaby adapting its highly effective, U.S.-stylewholesaler distribution model to market anddistribute Budweiser locally there.
Anheuser-Busch-owned operations in China becameprofitable in 2001. Since then, China has beenthe leading contributor to volume and profitgrowth for international operations. At the endof 2004, brewing capacity at Wuhan stood at2.7 million barrels. In order to provide for growth,an additional 700,000 barrels of expansion isexpected to be completed by the end of 2005.
In 2002, Anheuser-Busch formed a strategicalliance with Tsingtao, the leading national brewerin China with a 13 percent market share. Tsingtao competesin all segments of the Chinese beer market. It has a leadingposition in the premium-priced beer segment and a growingpresence in the super-premium beer category.
Under this strategic alliance, Anheuser-Busch has acquiredstock and convertible debentures that represent 9.9 percenteconomic ownership in Tsingtao, with an agreement to eventuallyacquire 27 percent economic interest. The two companiescontinue to think fresh by sharing best practices in brewing,sales and marketing, finance, and human resources. The bestpractices efforts are enhanced by Anheuser-Busch employeeswho work side by side with their Tsingtao counterparts.
In 2004, Anheuser-Busch acquired the HarbinBrewery Group, for a total cost of $694 million.Harbin, the No. 4 brewer in China, has a 5percent share of the Chinese beer market.Established in 1900, the Harbin BreweryGroup is the oldest brewer in China.
Harbin is located in the northeast region ofChina. The company has a strong position inthis region, which has the highest per capitabeer consumption in China. Harbin competesin all segments of the Chinese beer market,but it sells most of its volume in the popular-priced beer segment.
Anheuser-Busch’s strategic alliance with Tsingtao,its Harbin acquisition, and its Budweiser operations
complement each other and enable the company to competeeffectively in all segments across China. China is an importantfocus for the company due to its size, its continued growthpotential, and its expanding personal income levels, which shouldincreasingly enable consumers to trade up to premium brands.
The Chinese beer market today is similar to the U.S. beermarket in the 1950s. Brewers are consolidating and brands aremoving from a local focus to regional and national distribution.Just as the United States did more than 50 years ago, Chinatoday is experiencing many changes in a period of rapidlyrising per capita income. There has also been a significantpopulation shift from rural to urban and suburban areas.
international beer operations
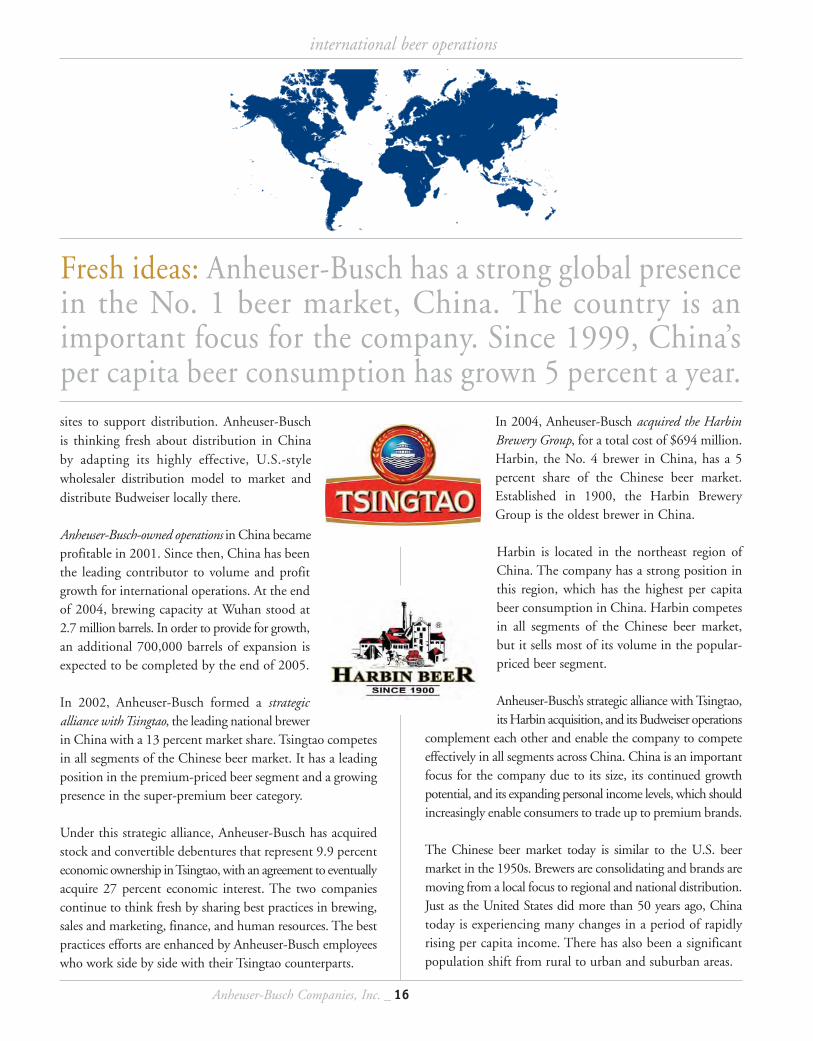
Fresh ideas: Anheuser-Busch has a strong global presencein the No. 1 beer market, China. The country is animportant focus for the company. Since 1999, China’sper capita beer consumption has grown 5 percent a year.
Anheuser-Busch Companies, Inc. _ 16
17 _ 2004 Annual Report
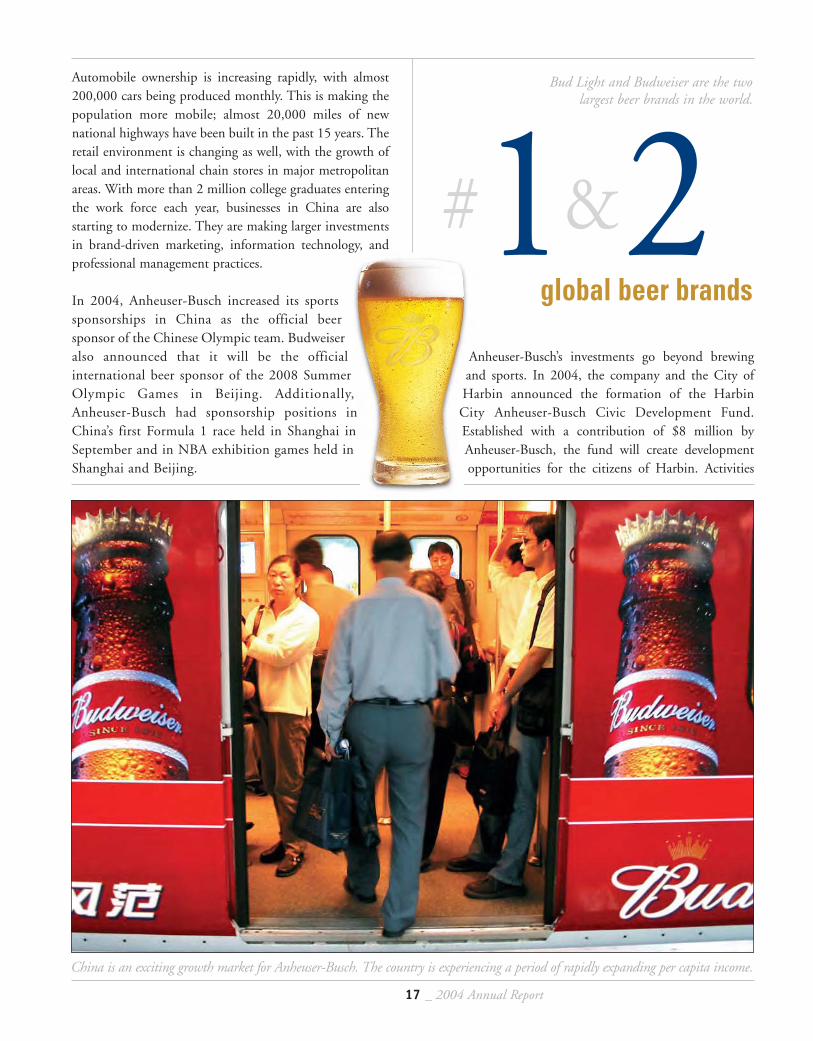
Automobile ownership is increasing rapidly, with almost200,000 cars being produced monthly. This is making thepopulation more mobile; almost 20,000 miles of newnational highways have been built in the past 15 years. Theretail environment is changing as well, with the growth oflocal and international chain stores in major metropolitanareas. With more than 2 million college graduates enteringthe work force each year, businesses in China are alsostarting to modernize. They are making larger investmentsin brand-driven marketing, information technology, andprofessional management practices.
In 2004, Anheuser-Busch increased its sportssponsorships in China as the official beersponsor of the Chinese Olympic team. Budweiseralso announced that it will be the officialinternational beer sponsor of the 2008 SummerOlympic Games in Beijing. Additionally,Anheuser-Busch had sponsorship positions inChina’s first Formula 1 race held in Shanghai inSeptember and in NBA exhibition games held inShanghai and Beijing.
Anheuser-Busch’s investments go beyond brewingand sports. In 2004, the company and the City ofHarbin announced the formation of the HarbinCity Anheuser-Busch Civic Development Fund.Established with a contribution of $8 million byAnheuser-Busch, the fund will create developmentopportunities for the citizens of Harbin. Activities
global beer brands
Bud Light and Budweiser are the twolargest beer brands in the world.
China is an exciting growth market for Anheuser-Busch. The country is experiencing a period of rapidly expanding per capita income.
1&2#
will include the funding of an annual business investmentconference to draw potential investors to the region,educational and training programs, and an annual beerfestival to promote the City of Harbin and the surroundingarea as a popular tourist destination.
After devoting 10 years of fresh thinking toChina, Anheuser-Busch is well positionedthere. The company will capitalize onthe substantial long-term growthopportunities in the Chinese beermarket with its own operationsand its strategic partnership withthe Tsingtao Brewery.
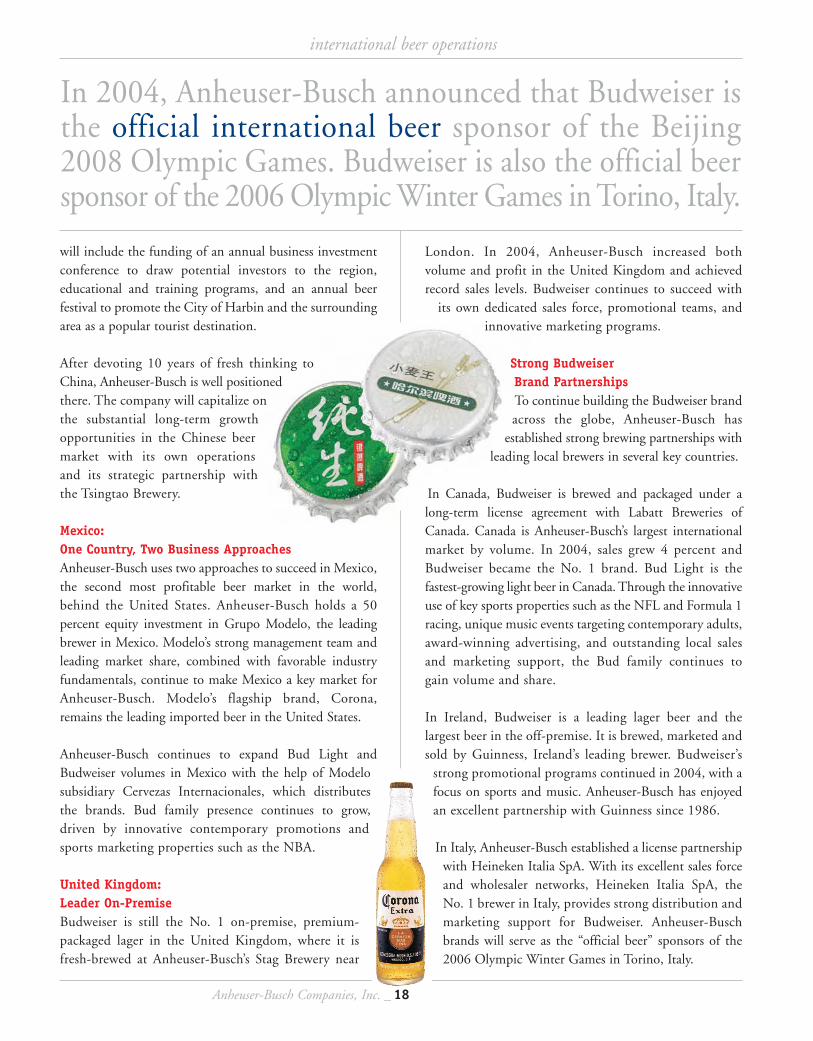
Mexico: One Country, Two Business ApproachesAnheuser-Busch uses two approaches to succeed in Mexico,the second most profitable beer market in the world,behind the United States. Anheuser-Busch holds a 50percent equity investment in Grupo Modelo, the leadingbrewer in Mexico. Modelo’s strong management team andleading market share, combined with favorable industryfundamentals, continue to make Mexico a key market forAnheuser-Busch. Modelo’s flagship brand, Corona,remains the leading imported beer in the United States.
Anheuser-Busch continues to expand Bud Light andBudweiser volumes in Mexico with the help of Modelosubsidiary Cervezas Internacionales, which distributesthe brands. Bud family presence continues to grow,driven by innovative contemporary promotions andsports marketing properties such as the NBA.
United Kingdom: Leader On-PremiseBudweiser is still the No. 1 on-premise, premium-packaged lager in the United Kingdom, where it isfresh-brewed at Anheuser-Busch’s Stag Brewery near
London. In 2004, Anheuser-Busch increased bothvolume and profit in the United Kingdom and achievedrecord sales levels. Budweiser continues to succeed with
its own dedicated sales force, promotional teams, andinnovative marketing programs.
Strong Budweiser Brand PartnershipsTo continue building the Budweiser brandacross the globe, Anheuser-Busch has
established strong brewing partnerships withleading local brewers in several key countries.
In Canada, Budweiser is brewed and packaged under along-term license agreement with Labatt Breweries ofCanada. Canada is Anheuser-Busch’s largest internationalmarket by volume. In 2004, sales grew 4 percent andBudweiser became the No. 1 brand. Bud Light is thefastest-growing light beer in Canada. Through the innovativeuse of key sports properties such as the NFL and Formula 1racing, unique music events targeting contemporary adults,award-winning advertising, and outstanding local salesand marketing support, the Bud family continues togain volume and share.
In Ireland, Budweiser is a leading lager beer and thelargest beer in the off-premise. It is brewed, marketed andsold by Guinness, Ireland’s leading brewer. Budweiser’s
strong promotional programs continued in 2004, with afocus on sports and music. Anheuser-Busch has enjoyedan excellent partnership with Guinness since 1986.
In Italy, Anheuser-Busch established a license partnershipwith Heineken Italia SpA. With its excellent sales forceand wholesaler networks, Heineken Italia SpA, theNo. 1 brewer in Italy, provides strong distribution andmarketing support for Budweiser. Anheuser-Buschbrands will serve as the “official beer” sponsors of the2006 Olympic Winter Games in Torino, Italy.
international beer operations
In 2004, Anheuser-Busch announced that Budweiser isthe official international beer sponsor of the Beijing2008 Olympic Games. Budweiser is also the official beersponsor of the 2006 Olympic Winter Games in Torino, Italy.
Anheuser-Busch Companies, Inc. _ 18
19 _ 2004 Annual Report
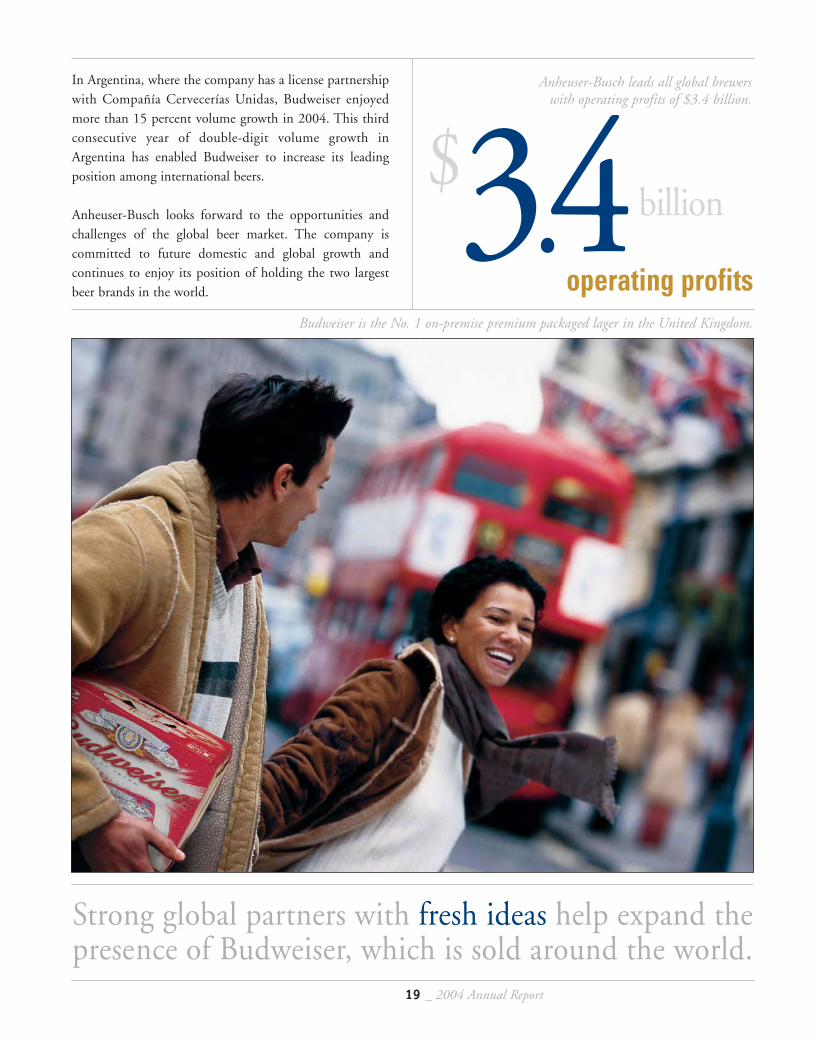
3.4billion
Strong global partners with fresh ideas help expand thepresence of Budweiser, which is sold around the world.
operating profits
Anheuser-Busch leads all global brewerswith operating profits of $3.4 billion.
$
Budweiser is the No. 1 on-premise premium packaged lager in the United Kingdom.
In Argentina, where the company has a license partnershipwith Compañía Cervecerías Unidas, Budweiser enjoyedmore than 15 percent volume growth in 2004. This thirdconsecutive year of double-digit volume growth inArgentina has enabled Budweiser to increase its leadingposition among international beers.
Anheuser-Busch looks forward to the opportunities andchallenges of the global beer market. The company iscommitted to future domestic and global growth andcontinues to enjoy its position of holding the two largestbeer brands in the world.

The Anheuser-Busch PackagingGroup produced more than
25 billion cans in 2004.
fresh fact.
30 Years of Innovation and Fresh IdeasThe Anheuser-Busch Packaging Group (ABPG) celebratedits 30th anniversary in 2004. Back in 1974, Anheuser-Busch began to look at packaging in a fresh new way. Forthree decades, ABPG has supplied packaging innovationwhile maintaining focus on its mission: to provide a secureand dependable source of high-quality, low-cost packagingmaterials to Anheuser-Busch and other customers.
Metal Container Corporation (MCC)Since 1974, MCC has sold more than 370 billion cans and385 billion lids. In 2004, more than 25 billion cans and28 billion lids were produced for both Anheuser-Busch andthe soft drink industry. MCC supplies more than 60 percentof Anheuser-Busch’s cans and 75 percent of its lids.
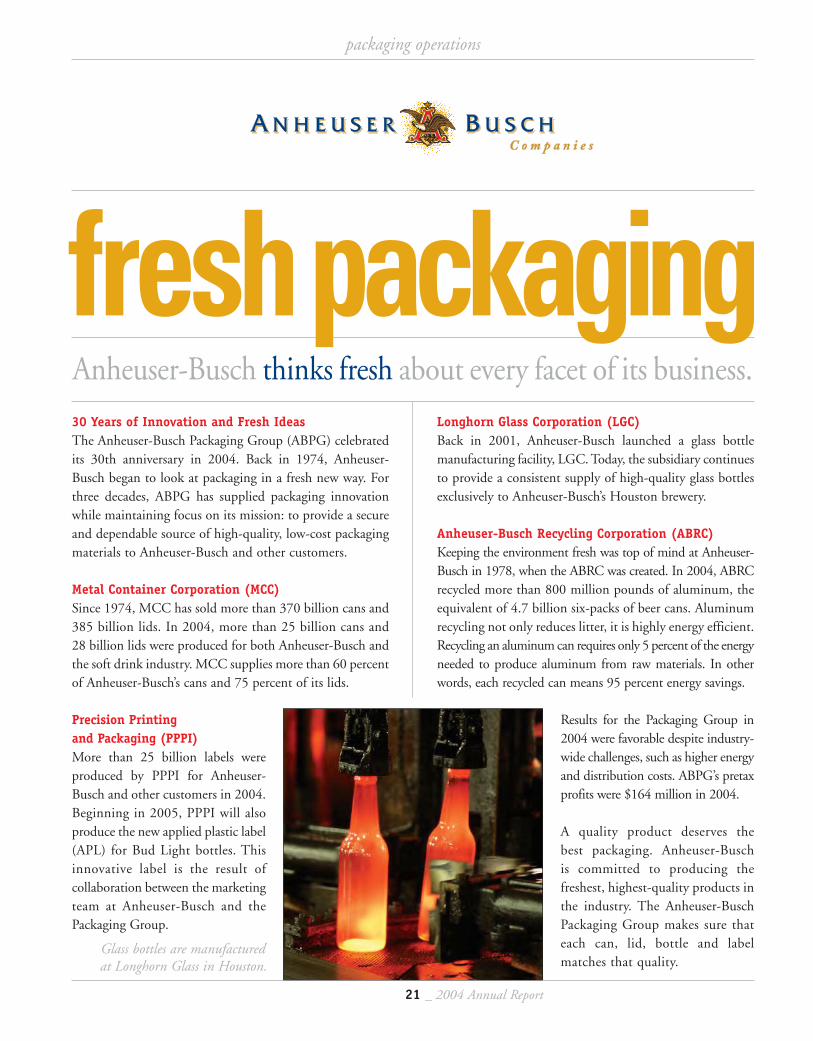
Precision Printing and Packaging (PPPI)More than 25 billion labels wereproduced by PPPI for Anheuser-Busch and other customers in 2004.Beginning in 2005, PPPI will alsoproduce the new applied plastic label(APL) for Bud Light bottles. Thisinnovative label is the result ofcollaboration between the marketingteam at Anheuser-Busch and thePackaging Group.
Longhorn Glass Corporation (LGC)Back in 2001, Anheuser-Busch launched a glass bottlemanufacturing facility, LGC. Today, the subsidiary continuesto provide a consistent supply of high-quality glass bottlesexclusively to Anheuser-Busch’s Houston brewery.
Anheuser-Busch Recycling Corporation (ABRC)Keeping the environment fresh was top of mind at Anheuser-Busch in 1978, when the ABRC was created. In 2004, ABRCrecycled more than 800 million pounds of aluminum, theequivalent of 4.7 billion six-packs of beer cans. Aluminumrecycling not only reduces litter, it is highly energy efficient.Recycling an aluminum can requires only 5 percent of the energyneeded to produce aluminum from raw materials. In otherwords, each recycled can means 95 percent energy savings.
Results for the Packaging Group in2004 were favorable despite industry-wide challenges, such as higher energyand distribution costs. ABPG’s pretaxprofits were $164 million in 2004.
A quality product deserves thebest packaging. Anheuser-Buschis committed to producing thefreshest, highest-quality products inthe industry. The Anheuser-BuschPackaging Group makes sure thateach can, lid, bottle and labelmatches that quality.
packaging operations
freshpackaging
21 _ 2004 Annual Report
Anheuser-Busch thinks fresh about every facet of its business.
Glass bottles are manufactured at Longhorn Glass in Houston.

The first hippo born at Busch Gardens Tampa Bay
swimming and bonding with its mother.
Last year more than 700 animals –many threatened and endangered – were rescued by BEC.
fresh delivery.
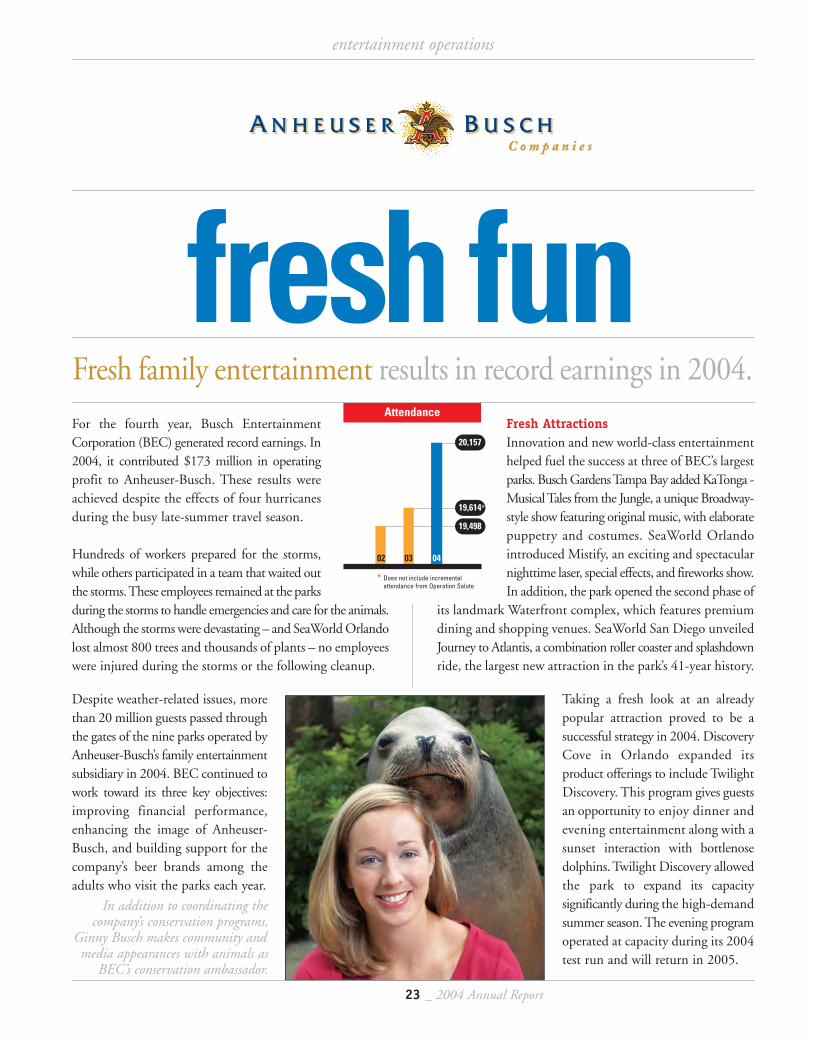
fresh funFor the fourth year, Busch EntertainmentCorporation (BEC) generated record earnings. In2004, it contributed $173 million in operatingprofit to Anheuser-Busch. These results wereachieved despite the effects of four hurricanesduring the busy late-summer travel season.
Hundreds of workers prepared for the storms,while others participated in a team that waited outthe storms. These employees remained at the parksduring the storms to handle emergencies and care for the animals.Although the storms were devastating – and SeaWorld Orlandolost almost 800 trees and thousands of plants – no employeeswere injured during the storms or the following cleanup.
Despite weather-related issues, morethan 20 million guests passed throughthe gates of the nine parks operated byAnheuser-Busch’s family entertainmentsubsidiary in 2004. BEC continued towork toward its three key objectives:improving financial performance,enhancing the image of Anheuser-Busch, and building support for thecompany’s beer brands among theadults who visit the parks each year.
Fresh AttractionsInnovation and new world-class entertainmenthelped fuel the success at three of BEC’s largestparks. Busch Gardens Tampa Bay added KaTonga -Musical Tales from the Jungle, a unique Broadway-style show featuring original music, with elaboratepuppetry and costumes. SeaWorld Orlandointroduced Mistify, an exciting and spectacularnighttime laser, special effects, and fireworks show.In addition, the park opened the second phase of
its landmark Waterfront complex, which features premiumdining and shopping venues. SeaWorld San Diego unveiledJourney to Atlantis, a combination roller coaster and splashdownride, the largest new attraction in the park’s 41-year history.
Taking a fresh look at an alreadypopular attraction proved to be asuccessful strategy in 2004. DiscoveryCove in Orlando expanded itsproduct offerings to include TwilightDiscovery. This program gives guestsan opportunity to enjoy dinner andevening entertainment along with asunset interaction with bottlenosedolphins. Twilight Discovery allowedthe park to expand its capacitysignificantly during the high-demandsummer season. The evening programoperated at capacity during its 2004test run and will return in 2005.
entertainment operations
In addition to coordinating thecompany’s conservation programs,
Ginny Busch makes community andmedia appearances with animals as
BEC’s conservation ambassador.
23 _ 2004 Annual Report
Attendance
02 03 04
* Does not include incremental attendance from Operation Salute
20,157
19,614*
19,498
Fresh family entertainment results in record earnings in 2004.
By focusing on fresh new rides and attractions, whileproviding educational entertainment, BEC is poised for 2005.
Anheuser-Busch Companies, Inc. _ 24
In 2005, DarKastle, an immersive ride attraction based onthe story of Germany’s King Ludwig, will debut at BuschGardens Williamsburg. SheiKra, a roller coaster thatfeatures two 90-degree dives – the first of its kind in NorthAmerica – will open in spring 2005 at Busch GardensTampa Bay. BEC will also provide fresh, innovative animalentertainment, including Blue Horizons, a new dolphinshow at SeaWorld Orlando and a new sea lion and ottershow at SeaWorld San Diego and SeaWorld San Antonio.
Supporting Anheuser-BuschBEC parks also support Anheuser-Busch by showcasingthe company’s beer brands to adult guests. Beer samplingat Anheuser-Busch Hospitality Centers reaches millionsof adult guests each year. Hospitality Centers informconsumers of Anheuser-Busch’s commitment to alcoholawareness and education efforts, including programsdesigned to fight underage drinking and drunk driving. Inaddition, five of the company’s theme parks maintainBudweiser Beer Schools for adult visitors.
Conservation and Environmental StewardshipAnheuser-Busch’s long tradition of environmental stewardshipbegan even before the company opened the gates to its firsttheme park. The company’s commitment to conservationwas formalized in 2003 with the creation of the SeaWorld &Busch Gardens Conservation Fund, a nonprofit foundationthat supports wildlife and habitat conservation, education,research, and animal rescue worldwide. In 2004, the fundmade more than 50 grants totaling $500,000.
In 2005, guests will be able to help protect the environment attwo BEC parks. Busch Gardens Tampa and SeaWorld Orlandoare opening Xcursions stores – environmentally themed gift shops.Sales of products will directly benefit the Conservation Fund.
OutlookA continuing improvement in the tourism economy, particularlyfrom key international markets such as the United Kingdom,combined with new attractions and hopefully a return tonormal weather patterns will likely see Busch Entertainmentagain exceed attendance, revenue and profit expectations in 2005.
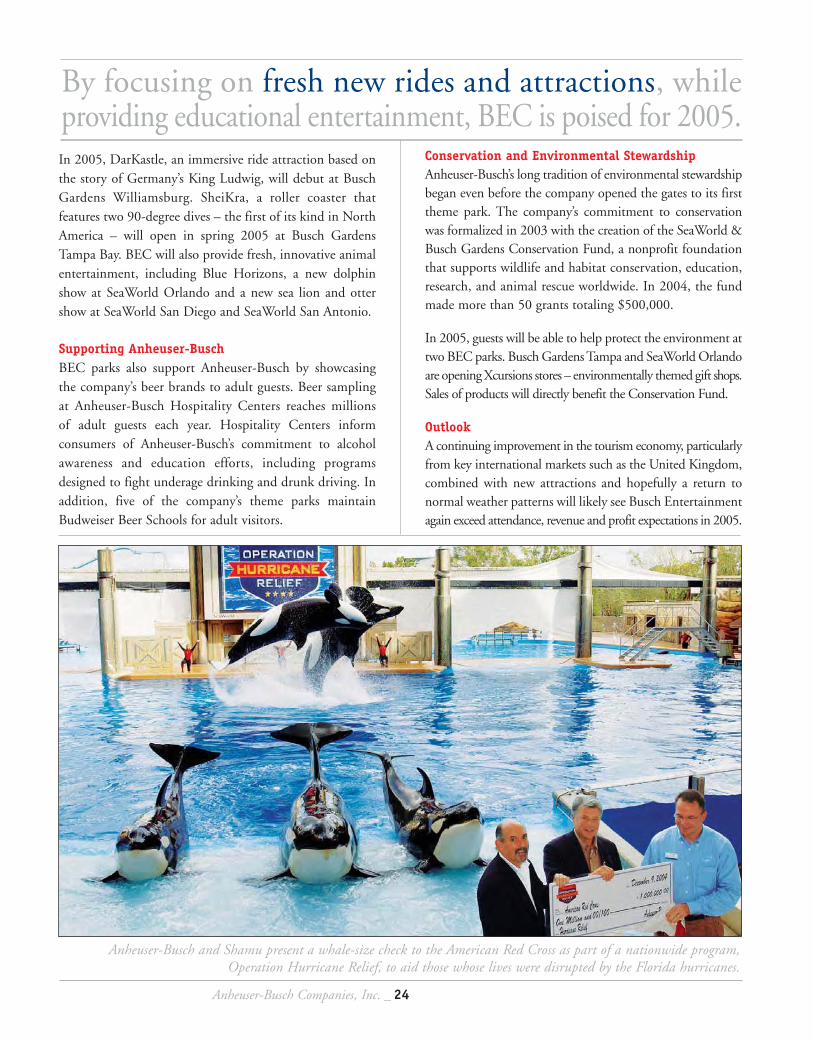
Anheuser-Busch and Shamu present a whale-size check to the American Red Cross as part of a nationwide program,Operation Hurricane Relief, to aid those whose lives were disrupted by the Florida hurricanes.
25 _ 2004 Annual Report
financial overviewManagement’s Discussion and Analysis of Operations and Financial Condition . . . 26
Management’s Responsibility for Financial Statements and Management’s Report on Internal Control Over Financial Reporting . . . . . . . . 40
Report of Independent Registered Public Accounting Firm . . . . . . . . . . . . . . . . . . . . . . . 41
Consolidated Balance Sheet . . . . . . . . . . . . . . . . . . . . . . . . . . . . . . . . . . . . . . . . . . . . . . . . . . . . . . . . . . . . . 42
Consolidated Statement of Income . . . . . . . . . . . . . . . . . . . . . . . . . . . . . . . . . . . . . . . . . . . . . . . . . . . . 43
Consolidated Statement of Changes in Shareholders Equity . . . . . . . . . . . . . . . . . . . . . . 44
Consolidated Statement of Cash Flows . . . . . . . . . . . . . . . . . . . . . . . . . . . . . . . . . . . . . . . . . . . . . . . 45
Notes to Consolidated Financial Statements . . . . . . . . . . . . . . . . . . . . . . . . . . . . . . . . . . . . . . . . . 46
Financial Summary — Operations . . . . . . . . . . . . . . . . . . . . . . . . . . . . . . . . . . . . . . . . . . . . . . . . . . . . . 62
Financial Summary — Balance Sheet and Other Information . . . . . . . . . . . . . . . . . . . . 64
2004
Anheuser-Busch Companies, Inc. _ 26
Introduction
This discussion summarizes the significant factors affecting theconsolidated operating results, financial condition, liquidity,and cash flows of Anheuser-Busch Companies, Inc., for thethree-year period ended December 31, 2004. This discussionshould be read in conjunction with the consolidated financialstatements and notes to the consolidated financial statementsincluded in this annual report.
This discussion contains forward-looking statementsregarding the company’s expectations concerning its futureoperations, earnings and prospects. On the date the forward-looking statements are made, the statements represent thecompany’s expectations, but the company’s expectationsconcerning its future operations, earnings and prospects maychange. The company’s expectations involve risks anduncertainties (both favorable and unfavorable) and are based onmany assumptions that the company believes to be reasonable,but such assumptions may ultimately prove to be inaccurate orincomplete, in whole or in part. Accordingly, there can be noassurances that the company’s expectations and the forward-looking statements will be correct. Important factors that couldcause actual results to differ (favorably or unfavorably) from theexpectations stated in this discussion include, among others,changes in the pricing environment for the company’sproducts; changes in U.S. demand for malt beverage products,including as a result of changes in U.S. demand for otheralcohol beverages; changes in consumer preference for thecompany’s malt beverage products; regulatory or legislativechanges, including changes in beer excise taxes at either thefederal or state level and changes in income taxes; changes inthe litigation to which the company is a party; changes in rawmaterials prices; changes in packaging materials costs; changesin interest rates; changes in foreign currency exchange rates;unusual weather conditions that could impact beerconsumption in the United States; changes in attendance and consumer spending patterns for the company’s theme park operations; changes in demand for aluminum beveragecontainers; changes in the company’s international beerbusiness or in the beer business of the company’s internationalequity partners; changes in the company’s credit ratingresulting from future acquisitions or divestitures; and the effectof stock market conditions on the company’s share repurchaseprogram. Anheuser-Busch disclaims any obligation to updateany of these forward-looking statements.
Objectives
Anheuser-Busch remains focused on its three core objectivesdesigned to enhance shareholder value:
d Increasing domestic beer segment volume and per barrelprofitability that, when combined with continued marketshare growth, will provide the base for long-term double-digit earnings per share growth and improvement in returnon capital employed.
d Increasing international beer segment profit growth.Anheuser-Busch has made significant marketing investmentsto build recognition of its Budweiser brands outside theUnited States and owns and operates breweries in China,including Harbin Brewery Group, acquired in 2004, and inthe United Kingdom. The company also has a 50% equityposition in Grupo Modelo, Mexico’s largest brewer andproducer of the Corona brand, and a 9.9% equity positionin Tsingtao, the largest brewer in China and producer of theTsingtao brand, with an agreement to eventually acquire a27% economic interest.
d Continued growth in profit and free cash flow in thepackaging and entertainment segments. Packagingoperations provide significant efficiencies, cost savings, and quality assurance for domestic beer operations.Entertainment operations enhance the company’s corporateimage by showcasing Anheuser-Busch’s heritage, values andcommitment to quality and social responsibility toapproximately 20 million visitors annually.
Operating Results
Anheuser-Busch achieved increased sales and earnings for 2004,with consolidated net sales increasing 5.6% and reportedearnings per share increasing 11.7%. All major businesssegments contributed to the sales and profit growth for theyear. Earnings per share for 2004 benefited from certain one-time items: a $.015 per share gain in the first quarter from thesale of commodity hedges; a $.018 per share gain in the fourthquarter on sale of the company’s equity investment inCompañía Cervecerías Unidas S.A. (CCU); and a fourth-quarter deferred income tax benefit of $.012 per share relatedto the company’s Modelo investment, from a reduction inMexican corporate income tax rates. None of these one-timeitems impact sales, gross profit, or operating income. Excludingthese items, earnings per share increased 10.1% versus 2003.
Management’s Discussion and Analysis of Operations and Financial ConditionAnheuser-Busch Companies and Subsidiaries
Anheuser-Busch had another year of solid growth in earningsper share and expects earnings per share growth in the 6% to9% range for 2005 compared with 2004, excluding the one-time items in 2004 and including the impact of expensingstock options, as shown below. The company will beginexpensing stock options when it adopts FAS 123R, “Share-Based Payment,” effective January 1, 2005, and willretrospectively apply the standard to all prior periods.Anheuser-Busch continues to target double-digit earnings per share growth over the longer term.
Earnings Per ShareProjected 2005 2004 Increase
Excluding one-time items $2.73
Adoption of FAS 123R (.15)
Basis for comparison $2.74 to $2.81 $2.58 6% to 9%
Comparisons of key operating results for the last three yearsare summarized in the following tables. Effective in the firstquarter of 2002, the company ceased amortizing all goodwillwhen it adopted FAS No. 142, “Goodwill and OtherIntangible Assets.” Operating results for 2004, 2003 and 2002 are therefore presented on a consistent basis; they do not reflect any goodwill amortization expense.
Under FAS 142, Anheuser-Busch was not permitted torestate the results of operations for 2001 to exclude theearnings impact of goodwill amortization. The inclusion ofgoodwill amortization expense in 2001 results makes directcomparisons between 2002 and 2001 difficult. For the clearestunderstanding of the company’s operations, all discussion ofoperating results for 2002 versus 2001 is therefore based on the 2001 results provided on a comparable basis, excluding the impact of goodwill amortization.
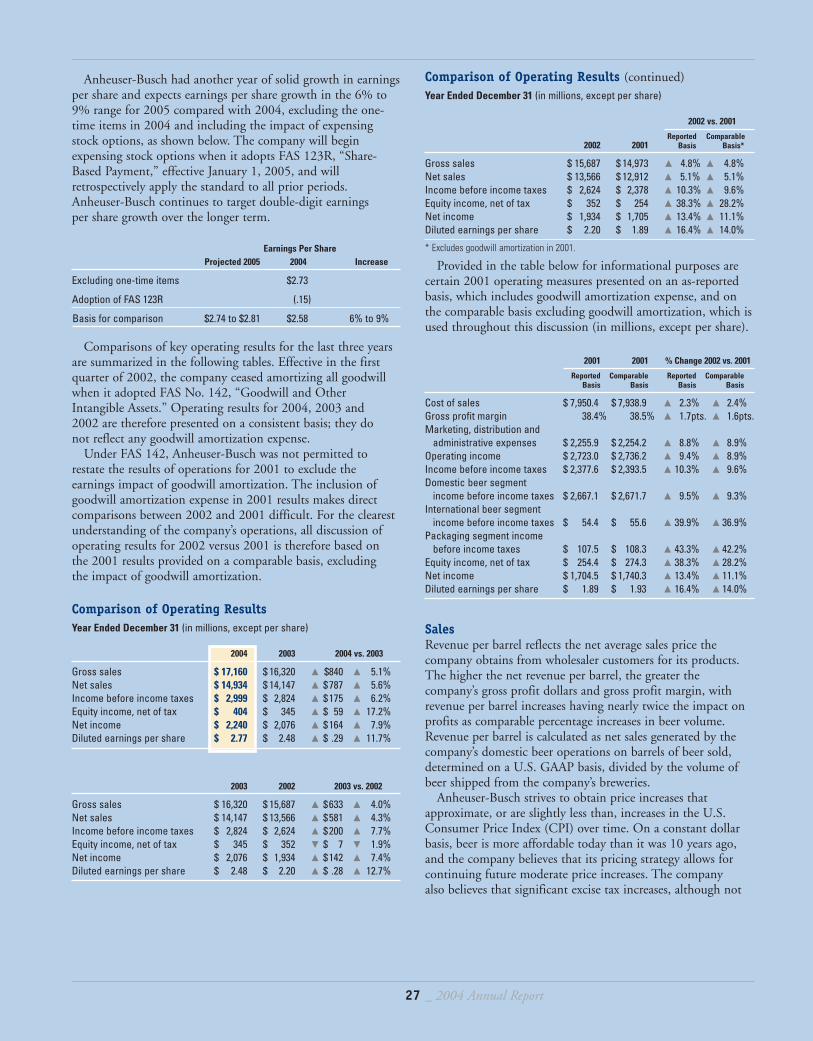
Comparison of Operating Results Year Ended December 31 (in millions, except per share)
2004 2003 2004 vs. 2003
Gross sales $ 17,160 $ 16,320 m $840 m 5.1%Net sales $ 14,934 $ 14,147 m $787 m 5.6%Income before income taxes $ 2,999 $ 2,824 m $175 m 6.2%Equity income, net of tax $ 404 $ 345 m $ 59 m 17.2%Net income $ 2,240 $ 2,076 m $164 m 7.9%Diluted earnings per share $ 2.77 $ 2.48 m $ .29 m 11.7%
2003 2002 2003 vs. 2002
Gross sales $ 16,320 $ 15,687 m $633 m 4.0%Net sales $ 14,147 $ 13,566 m $581 m 4.3%Income before income taxes $ 2,824 $ 2,624 m $200 m 7.7%Equity income, net of tax $ 345 $ 352 . $ 7 . 1.9%Net income $ 2,076 $ 1,934 m $142 m 7.4%Diluted earnings per share $ 2.48 $ 2.20 m $ .28 m 12.7%
Comparison of Operating Results (continued)Year Ended December 31 (in millions, except per share)
2002 vs. 2001
Reported Comparable2002 2001 Basis Basis*
Gross sales $ 15,687 $ 14,973 m 4.8% m 4.8%Net sales $ 13,566 $ 12,912 m 5.1% m 5.1%Income before income taxes $ 2,624 $ 2,378 m 10.3% m 9.6%Equity income, net of tax $ 352 $ 254 m 38.3% m 28.2%Net income $ 1,934 $ 1,705 m 13.4% m 11.1%Diluted earnings per share $ 2.20 $ 1.89 m 16.4% m 14.0%
* Excludes goodwill amortization in 2001.
Provided in the table below for informational purposes arecertain 2001 operating measures presented on an as-reportedbasis, which includes goodwill amortization expense, and onthe comparable basis excluding goodwill amortization, which isused throughout this discussion (in millions, except per share).
2001 2001 % Change 2002 vs. 2001
Reported Comparable Reported ComparableBasis Basis Basis Basis
Cost of sales $ 7,950.4 $ 7,938.9 m 2.3% m 2.4%Gross profit margin 38.4% 38.5% m 1.7pts. m 1.6pts.Marketing, distribution and
administrative expenses $ 2,255.9 $ 2,254.2 m 8.8% m 8.9%Operating income $ 2,723.0 $ 2,736.2 m 9.4% m 8.9%Income before income taxes $ 2,377.6 $ 2,393.5 m 10.3% m 9.6%Domestic beer segment
income before income taxes $ 2,667.1 $ 2,671.7 m 9.5% m 9.3%International beer segment
income before income taxes $ 54.4 $ 55.6 m 39.9% m 36.9%Packaging segment income
before income taxes $ 107.5 $ 108.3 m 43.3% m 42.2%Equity income, net of tax $ 254.4 $ 274.3 m 38.3% m 28.2%Net income $ 1,704.5 $ 1,740.3 m 13.4% m 11.1%Diluted earnings per share $ 1.89 $ 1.93 m 16.4% m 14.0%
SalesRevenue per barrel reflects the net average sales price thecompany obtains from wholesaler customers for its products.The higher the net revenue per barrel, the greater thecompany’s gross profit dollars and gross profit margin, withrevenue per barrel increases having nearly twice the impact onprofits as comparable percentage increases in beer volume.Revenue per barrel is calculated as net sales generated by thecompany’s domestic beer operations on barrels of beer sold,determined on a U.S. GAAP basis, divided by the volume ofbeer shipped from the company’s breweries.
Anheuser-Busch strives to obtain price increases thatapproximate, or are slightly less than, increases in the U.S.Consumer Price Index (CPI) over time. On a constant dollarbasis, beer is more affordable today than it was 10 years ago,and the company believes that its pricing strategy allows forcontinuing future moderate price increases. The company also believes that significant excise tax increases, although not
27 _ 2004 Annual Report
Anheuser-Busch Companies, Inc. _ 28
expected, could disrupt the current favorable industry pricingenvironment because tax increases could trigger retail beer priceincreases in excess of the CPI. The cost of such increases wouldbe borne directly by consumers.
Anheuser-Busch reports domestic beer sales volume based on beer sales to the company’s network of independentwholesalers. Higher beer sales-to-wholesalers volume willincrease gross profit dollars and potentially increase gross profit margin. Wholesaler sales-to-retailers volume is a leadingindicator of demand for the company’s products at the retaillevel. Higher wholesaler sales-to-retailers require increased beersales-to-wholesalers to meet ongoing demand.
Domestic beer volume represents Anheuser-Busch brandsproduced and shipped within the United States. Internationalbeer volume consists of brands produced overseas by company-owned operations in China and the United Kingdom andunder various license and contract-brewing agreements, plusexports from the company’s U.S. breweries to markets aroundthe world. Worldwide beer volume is composed of domesticvolume and international volume. International equity partnerbrands volume represents the company’s ownership percentageshare of volume in its foreign equity partner Grupo Modelo,reported on a one-month-lag basis, and it also includesAnheuser-Busch’s pro rata share in the beer volume of CCU for all years shown. The company sold its equity interest inCCU in November 2004. Total brands combines worldwidevolume with international equity partner brands volume.
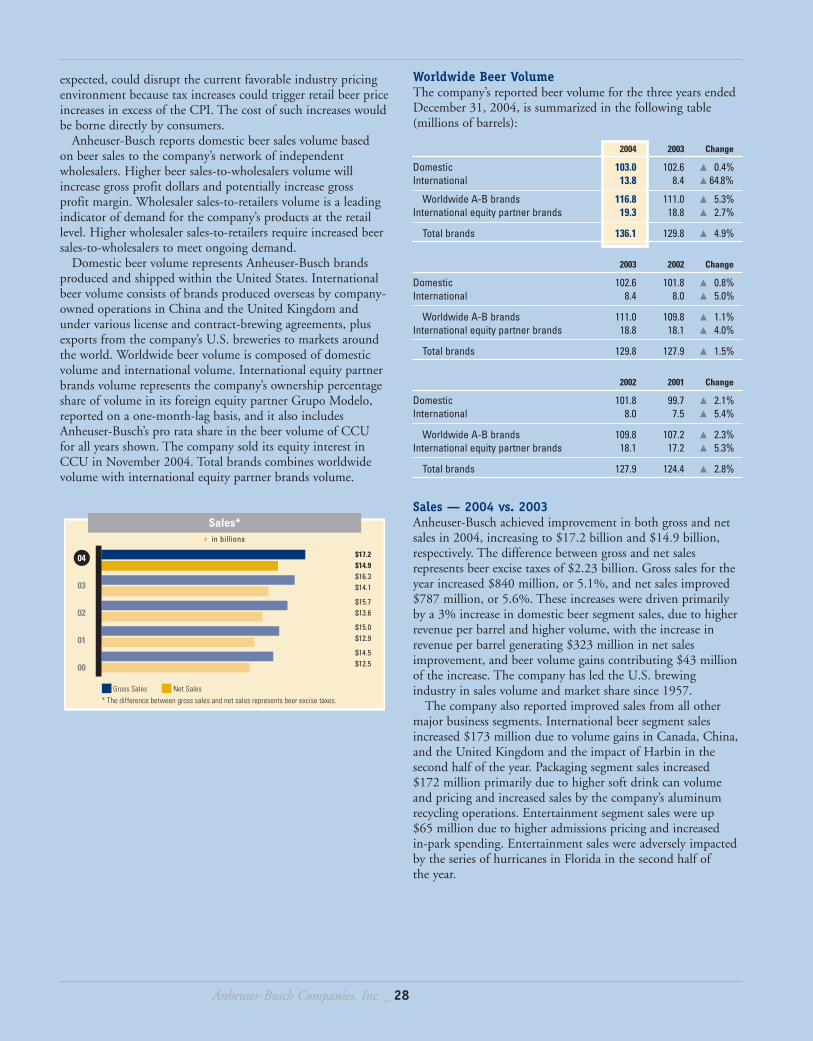
Sales*in billions
Gross Sales Net Sales* The difference between gross sales and net sales represents beer excise taxes.
04
03
02
01
00
$17.2 $14.9$16.3$14.1 $15.7$13.6 $15.0$12.9 $14.5$12.5
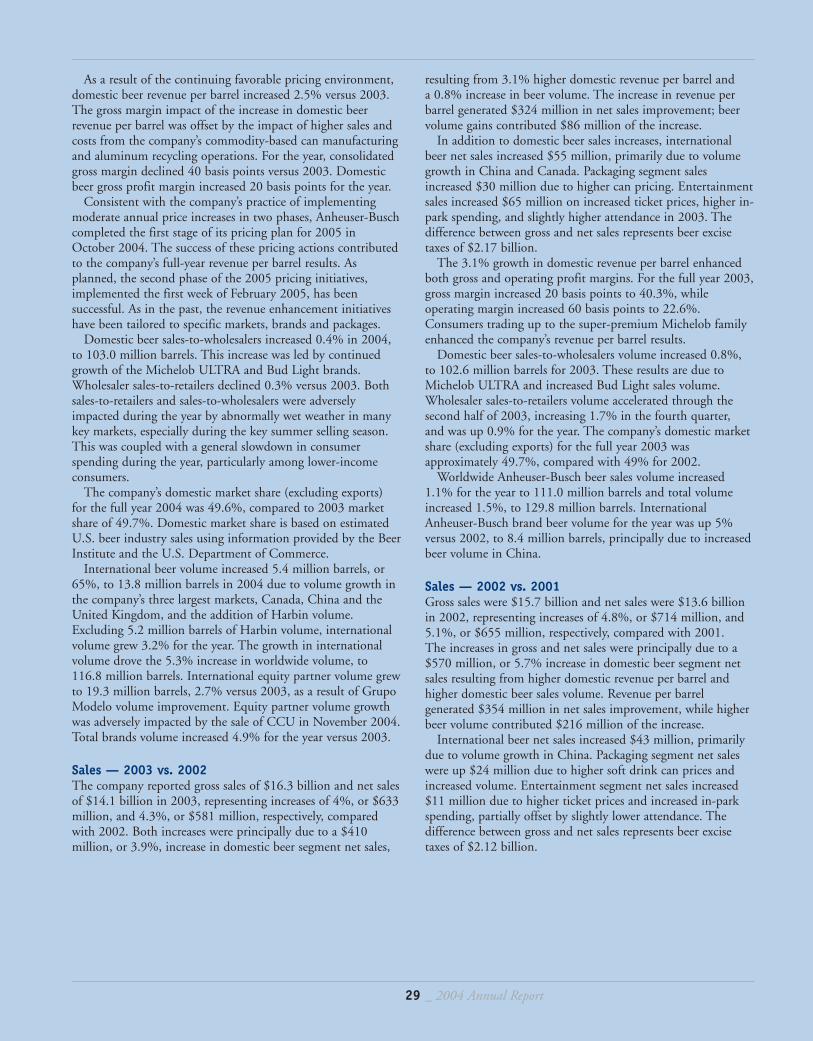
Worldwide Beer Volume The company’s reported beer volume for the three years endedDecember 31, 2004, is summarized in the following table(millions of barrels):
2004 2003 Change
Domestic 103.0 102.6 m 0.4%International 13.8 8.4 m 64.8%
Worldwide A-B brands 116.8 111.0 m 5.3%International equity partner brands 19.3 18.8 m 2.7%
Total brands 136.1 129.8 m 4.9%
2003 2002 Change
Domestic 102.6 101.8 m 0.8%International 8.4 8.0 m 5.0%
Worldwide A-B brands 111.0 109.8 m 1.1%International equity partner brands 18.8 18.1 m 4.0%
Total brands 129.8 127.9 m 1.5%
2002 2001 Change
Domestic 101.8 99.7 m 2.1%International 8.0 7.5 m 5.4%
Worldwide A-B brands 109.8 107.2 m 2.3%International equity partner brands 18.1 17.2 m 5.3%
Total brands 127.9 124.4 m 2.8%
Sales — 2004 vs. 2003Anheuser-Busch achieved improvement in both gross and netsales in 2004, increasing to $17.2 billion and $14.9 billion,respectively. The difference between gross and net salesrepresents beer excise taxes of $2.23 billion. Gross sales for theyear increased $840 million, or 5.1%, and net sales improved$787 million, or 5.6%. These increases were driven primarilyby a 3% increase in domestic beer segment sales, due to higherrevenue per barrel and higher volume, with the increase inrevenue per barrel generating $323 million in net salesimprovement, and beer volume gains contributing $43 millionof the increase. The company has led the U.S. brewingindustry in sales volume and market share since 1957.
The company also reported improved sales from all othermajor business segments. International beer segment salesincreased $173 million due to volume gains in Canada, China,and the United Kingdom and the impact of Harbin in thesecond half of the year. Packaging segment sales increased $172 million primarily due to higher soft drink can volumeand pricing and increased sales by the company’s aluminumrecycling operations. Entertainment segment sales were up $65 million due to higher admissions pricing and increased in-park spending. Entertainment sales were adversely impactedby the series of hurricanes in Florida in the second half of the year.
As a result of the continuing favorable pricing environment,domestic beer revenue per barrel increased 2.5% versus 2003.The gross margin impact of the increase in domestic beerrevenue per barrel was offset by the impact of higher sales andcosts from the company’s commodity-based can manufacturingand aluminum recycling operations. For the year, consolidatedgross margin declined 40 basis points versus 2003. Domesticbeer gross profit margin increased 20 basis points for the year.
Consistent with the company’s practice of implementingmoderate annual price increases in two phases, Anheuser-Buschcompleted the first stage of its pricing plan for 2005 inOctober 2004. The success of these pricing actions contributedto the company’s full-year revenue per barrel results. Asplanned, the second phase of the 2005 pricing initiatives,implemented the first week of February 2005, has beensuccessful. As in the past, the revenue enhancement initiativeshave been tailored to specific markets, brands and packages.
Domestic beer sales-to-wholesalers increased 0.4% in 2004,to 103.0 million barrels. This increase was led by continuedgrowth of the Michelob ULTRA and Bud Light brands.Wholesaler sales-to-retailers declined 0.3% versus 2003. Bothsales-to-retailers and sales-to-wholesalers were adverselyimpacted during the year by abnormally wet weather in manykey markets, especially during the key summer selling season.This was coupled with a general slowdown in consumerspending during the year, particularly among lower-incomeconsumers.
The company’s domestic market share (excluding exports)for the full year 2004 was 49.6%, compared to 2003 marketshare of 49.7%. Domestic market share is based on estimatedU.S. beer industry sales using information provided by the BeerInstitute and the U.S. Department of Commerce.
International beer volume increased 5.4 million barrels, or65%, to 13.8 million barrels in 2004 due to volume growth inthe company’s three largest markets, Canada, China and theUnited Kingdom, and the addition of Harbin volume.Excluding 5.2 million barrels of Harbin volume, internationalvolume grew 3.2% for the year. The growth in internationalvolume drove the 5.3% increase in worldwide volume, to116.8 million barrels. International equity partner volume grewto 19.3 million barrels, 2.7% versus 2003, as a result of GrupoModelo volume improvement. Equity partner volume growthwas adversely impacted by the sale of CCU in November 2004.Total brands volume increased 4.9% for the year versus 2003.
Sales — 2003 vs. 2002The company reported gross sales of $16.3 billion and net salesof $14.1 billion in 2003, representing increases of 4%, or $633million, and 4.3%, or $581 million, respectively, comparedwith 2002. Both increases were principally due to a $410million, or 3.9%, increase in domestic beer segment net sales,
resulting from 3.1% higher domestic revenue per barrel and a 0.8% increase in beer volume. The increase in revenue perbarrel generated $324 million in net sales improvement; beervolume gains contributed $86 million of the increase.
In addition to domestic beer sales increases, internationalbeer net sales increased $55 million, primarily due to volumegrowth in China and Canada. Packaging segment salesincreased $30 million due to higher can pricing. Entertainmentsales increased $65 million on increased ticket prices, higher in-park spending, and slightly higher attendance in 2003. Thedifference between gross and net sales represents beer excisetaxes of $2.17 billion.
The 3.1% growth in domestic revenue per barrel enhancedboth gross and operating profit margins. For the full year 2003,gross margin increased 20 basis points to 40.3%, whileoperating margin increased 60 basis points to 22.6%.Consumers trading up to the super-premium Michelob familyenhanced the company’s revenue per barrel results.
Domestic beer sales-to-wholesalers volume increased 0.8%,to 102.6 million barrels for 2003. These results are due toMichelob ULTRA and increased Bud Light sales volume.Wholesaler sales-to-retailers volume accelerated through thesecond half of 2003, increasing 1.7% in the fourth quarter, and was up 0.9% for the year. The company’s domestic marketshare (excluding exports) for the full year 2003 wasapproximately 49.7%, compared with 49% for 2002.
Worldwide Anheuser-Busch beer sales volume increased1.1% for the year to 111.0 million barrels and total volumeincreased 1.5%, to 129.8 million barrels. InternationalAnheuser-Busch brand beer volume for the year was up 5%versus 2002, to 8.4 million barrels, principally due to increasedbeer volume in China.
Sales — 2002 vs. 2001Gross sales were $15.7 billion and net sales were $13.6 billionin 2002, representing increases of 4.8%, or $714 million, and5.1%, or $655 million, respectively, compared with 2001. The increases in gross and net sales were principally due to a$570 million, or 5.7% increase in domestic beer segment netsales resulting from higher domestic revenue per barrel andhigher domestic beer sales volume. Revenue per barrelgenerated $354 million in net sales improvement, while higherbeer volume contributed $216 million of the increase.
International beer net sales increased $43 million, primarilydue to volume growth in China. Packaging segment net saleswere up $24 million due to higher soft drink can prices andincreased volume. Entertainment segment net sales increased$11 million due to higher ticket prices and increased in-parkspending, partially offset by slightly lower attendance. Thedifference between gross and net sales represents beer excisetaxes of $2.12 billion.
29 _ 2004 Annual Report
Anheuser-Busch Companies, Inc. _ 30
Domestic beer revenue per barrel grew 3.5% for 2002,reflecting a favorable domestic pricing environment and theintroductions of Michelob ULTRA and Bacardi Silver.Excluding favorable mix, domestic revenue per barrel increased2.8% for the year. The increases in revenue per barrel enhancedboth gross and operating profit margins, which improved 160basis points and 80 basis points, respectively, in 2002 versusthe prior year.
Domestic beer sales-to-wholesalers volume increased 2.1%versus 2001, to 101.8 million barrels. This increase was led byBud family sales, as well as the introductions of Bacardi Silverand Michelob ULTRA. Wholesaler sales-to-retailers volumewas up 1.6% for the year. The company’s domestic marketshare for 2002 (excluding exports) was 49% versus 2001market share of 48.7%.
Worldwide Anheuser-Busch beer sales volume increased2.3% in 2002, to 109.8 million barrels. Total beer sales volumewas 127.9 million barrels in 2002, up 2.8% versus 2001.International Anheuser-Busch brand beer volume for 2002 was8.0 million barrels, an increase of 5.4% versus 2001. During2002, Canada, China, and the United Kingdom allexperienced volume growth.
Cost of Sales
The company continuously strives to reduce costs throughoutits system. Brewery modernizations have yielded long-termsavings through reduced beer packaging and shipping costs andreduced maintenance costs. The company’s focused productionmethods and wholesaler support distribution centersconcentrate small-volume brand and package production atthree breweries to create production efficiencies, reduce costs,and enhance responsiveness to changing consumer brand andpackage preferences. The company also works to reducedistribution costs for its products through better systemwidecoordination with its network of independent wholesalers.
Cost of sales was $9.0 billion for 2004, an increase of $533 million, or 6.3%, compared with 2003. The increase incost of sales is due to higher costs for all of the company’smajor business segments. The increase in domestic beer costs is due to increased costs for brewing and packaging materials,costs associated with increased beer volume, and higher utilitycosts. International beer experienced higher costs associatedwith increased beer volume plus the impact of incremental cost of sales associated with Harbin volume. Packaging operationsincurred higher aluminum costs and entertainment operationsincurred higher park operating expenses, including hurricanecleanup costs in the third quarter. Consolidated gross profitmargin decreased 40 basis points, to 39.9%, due primarily to a 20 basis point gross margin increase from domestic beeroperations being more than offset by higher sales and costsfrom the company’s commodity-based can manufacturing andaluminum recycling operations.
Cost of sales was $8.4 billion in 2003, an increase of $318million, or 3.9%, compared with 2002. The increase is due tohigher costs in the domestic beer segment, attributable to costsassociated with higher beer sales volume, higher productioncosts primarily resulting from increased brewing and packagingmaterials, and higher utilities costs. Brewing and packagingmaterials costs and utilities were higher in the second half of2003 than experienced in the first half of the year. Cost of salesfor international beer operations also increased due to costsassociated with increased beer volume, while theme park andpackaging operations and the company’s commodity recyclingbusiness all experienced increased cost of sales. Gross profit as apercentage of net sales was 40.3% for the year, an increase of20 basis points versus 2002.
Cost of sales was $8.13 billion in 2002, an increase of $192 million, or 2.4% versus 2001. The increase in 2002 wasdue primarily to higher domestic beer segment costs, driven by costs associated with higher beer volume of $78 million,partially offset by lower brewing materials, aluminum andenergy costs. Cost of sales also increased in the internationalbeer segment, due to costs associated with increased beervolume and in the packaging and entertainment businesses.Gross profit as a percentage of sales was 40.1%, an increase of160 basis points versus 2001, reflecting higher domestic beermargins generated by improved pricing and favorable costs.
Marketing, Distribution andAdministrative Expenses
Advertising and promotional activities for its beer brands andtheme park operations are important elements of Anheuser-Busch’s strategy, and represent significant annual expenditures.The company employs a variety of national, regional and localmedia outlets in its promotional efforts, including television,radio, print and outdoor advertising, and event sponsorships.
Marketing, distribution and administrative expenses were$2.59 billion in 2004, an increase of $92 million, or 3.7%,compared with 2003. The increase is principally due toincreased international beer marketing and distribution costs,higher entertainment advertising costs, increased marketingcosts associated with the Olympics, higher domestic beerdistribution costs from owning an additional wholesaleoperation, and higher corporate expenses due primarily tohigher employee benefits costs.
Marketing, distribution and administrative expenses for 2003 were $2.50 billion, an increase of $43 million, or 1.7%, compared with 2002. This increase is principally due to marketing costs related to Michelob ULTRA, increasedcompany-owned wholesale beer distribution costs, higherinternational beer marketing costs in Europe and China, andincreased theme park advertising costs. Partially offsetting theseincreases were lower domestic beer segment legal costs andreduced administrative expenses for the entertainment segment.
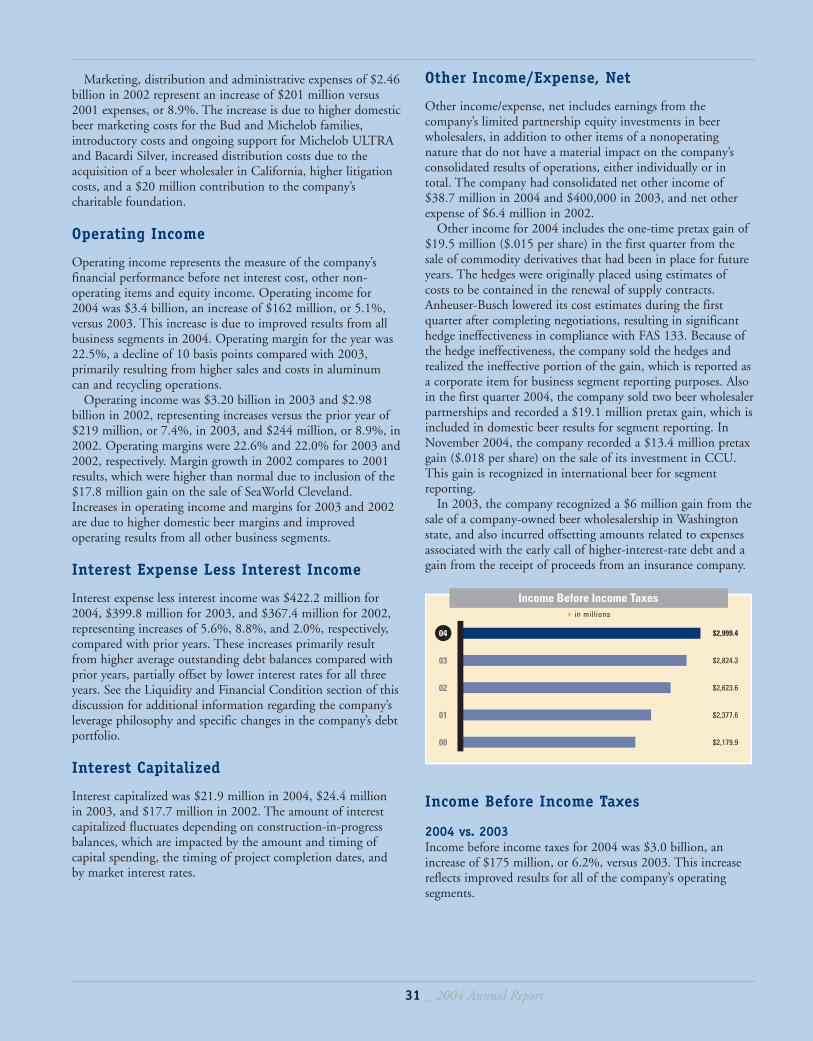
Marketing, distribution and administrative expenses of $2.46billion in 2002 represent an increase of $201 million versus2001 expenses, or 8.9%. The increase is due to higher domesticbeer marketing costs for the Bud and Michelob families,introductory costs and ongoing support for Michelob ULTRAand Bacardi Silver, increased distribution costs due to theacquisition of a beer wholesaler in California, higher litigationcosts, and a $20 million contribution to the company’scharitable foundation.
Operating Income
Operating income represents the measure of the company’sfinancial performance before net interest cost, other non-operating items and equity income. Operating income for2004 was $3.4 billion, an increase of $162 million, or 5.1%,versus 2003. This increase is due to improved results from allbusiness segments in 2004. Operating margin for the year was22.5%, a decline of 10 basis points compared with 2003,primarily resulting from higher sales and costs in aluminumcan and recycling operations.
Operating income was $3.20 billion in 2003 and $2.98billion in 2002, representing increases versus the prior year of$219 million, or 7.4%, in 2003, and $244 million, or 8.9%, in2002. Operating margins were 22.6% and 22.0% for 2003 and2002, respectively. Margin growth in 2002 compares to 2001results, which were higher than normal due to inclusion of the$17.8 million gain on the sale of SeaWorld Cleveland.Increases in operating income and margins for 2003 and 2002are due to higher domestic beer margins and improvedoperating results from all other business segments.
Interest Expense Less Interest Income
Interest expense less interest income was $422.2 million for2004, $399.8 million for 2003, and $367.4 million for 2002,representing increases of 5.6%, 8.8%, and 2.0%, respectively,compared with prior years. These increases primarily resultfrom higher average outstanding debt balances compared withprior years, partially offset by lower interest rates for all threeyears. See the Liquidity and Financial Condition section of thisdiscussion for additional information regarding the company’sleverage philosophy and specific changes in the company’s debtportfolio.
Interest Capitalized
Interest capitalized was $21.9 million in 2004, $24.4 million in 2003, and $17.7 million in 2002. The amount of interestcapitalized fluctuates depending on construction-in-progressbalances, which are impacted by the amount and timing ofcapital spending, the timing of project completion dates, andby market interest rates.
Other Income/Expense, Net
Other income/expense, net includes earnings from thecompany’s limited partnership equity investments in beerwholesalers, in addition to other items of a nonoperatingnature that do not have a material impact on the company’sconsolidated results of operations, either individually or intotal. The company had consolidated net other income of$38.7 million in 2004 and $400,000 in 2003, and net otherexpense of $6.4 million in 2002.
Other income for 2004 includes the one-time pretax gain of$19.5 million ($.015 per share) in the first quarter from thesale of commodity derivatives that had been in place for futureyears. The hedges were originally placed using estimates ofcosts to be contained in the renewal of supply contracts.Anheuser-Busch lowered its cost estimates during the firstquarter after completing negotiations, resulting in significanthedge ineffectiveness in compliance with FAS 133. Because ofthe hedge ineffectiveness, the company sold the hedges andrealized the ineffective portion of the gain, which is reported asa corporate item for business segment reporting purposes. Alsoin the first quarter 2004, the company sold two beer wholesalerpartnerships and recorded a $19.1 million pretax gain, which isincluded in domestic beer results for segment reporting. InNovember 2004, the company recorded a $13.4 million pretaxgain ($.018 per share) on the sale of its investment in CCU.This gain is recognized in international beer for segmentreporting.
In 2003, the company recognized a $6 million gain from thesale of a company-owned beer wholesalership in Washingtonstate, and also incurred offsetting amounts related to expensesassociated with the early call of higher-interest-rate debt and again from the receipt of proceeds from an insurance company.
Income Before Income Taxes
2004 vs. 2003Income before income taxes for 2004 was $3.0 billion, anincrease of $175 million, or 6.2%, versus 2003. This increasereflects improved results for all of the company’s operatingsegments.
$2,999.4
$2,824.3
$2,623.6
$2,377.6
$2,179.9
Income Before Income Taxesin millions
04
03
02
01
00
31 _ 2004 Annual Report
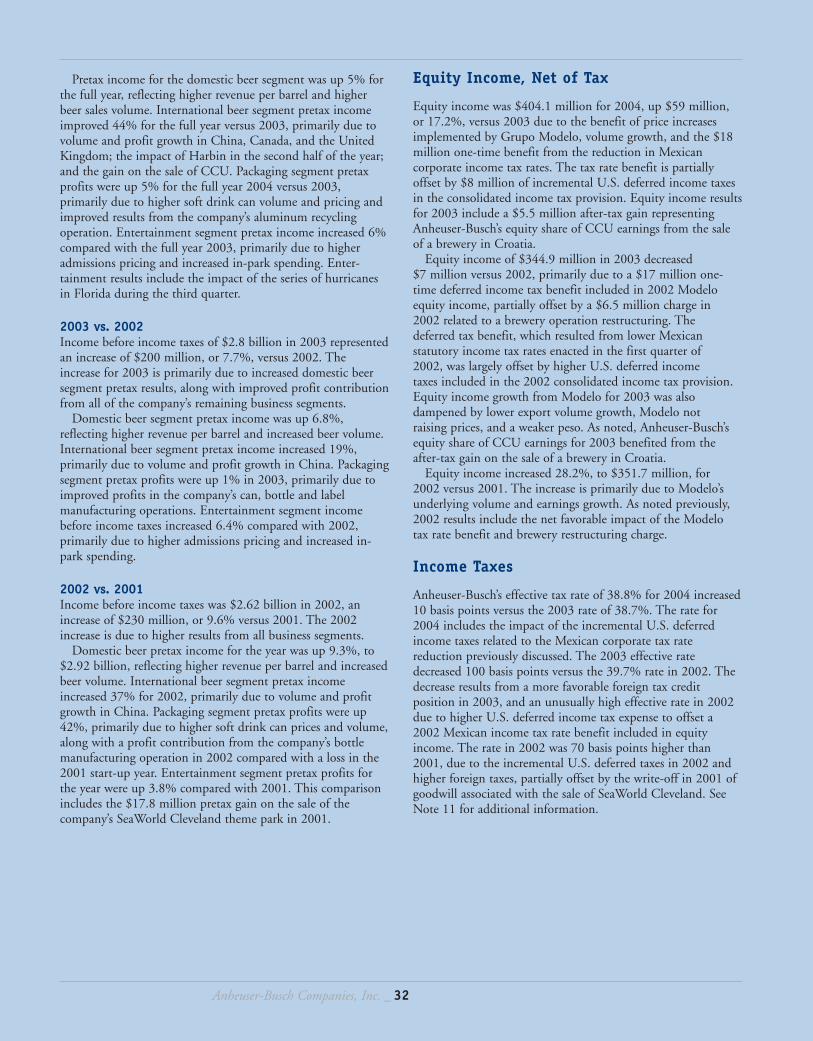
Anheuser-Busch Companies, Inc. _ 32
Pretax income for the domestic beer segment was up 5% forthe full year, reflecting higher revenue per barrel and higherbeer sales volume. International beer segment pretax incomeimproved 44% for the full year versus 2003, primarily due tovolume and profit growth in China, Canada, and the UnitedKingdom; the impact of Harbin in the second half of the year;and the gain on the sale of CCU. Packaging segment pretaxprofits were up 5% for the full year 2004 versus 2003,primarily due to higher soft drink can volume and pricing andimproved results from the company’s aluminum recyclingoperation. Entertainment segment pretax income increased 6%compared with the full year 2003, primarily due to higheradmissions pricing and increased in-park spending. Enter-tainment results include the impact of the series of hurricanesin Florida during the third quarter.
2003 vs. 2002Income before income taxes of $2.8 billion in 2003 representedan increase of $200 million, or 7.7%, versus 2002. Theincrease for 2003 is primarily due to increased domestic beersegment pretax results, along with improved profit contributionfrom all of the company’s remaining business segments.
Domestic beer segment pretax income was up 6.8%,reflecting higher revenue per barrel and increased beer volume.International beer segment pretax income increased 19%,primarily due to volume and profit growth in China. Packagingsegment pretax profits were up 1% in 2003, primarily due toimproved profits in the company’s can, bottle and labelmanufacturing operations. Entertainment segment incomebefore income taxes increased 6.4% compared with 2002,primarily due to higher admissions pricing and increased in-park spending.
2002 vs. 2001Income before income taxes was $2.62 billion in 2002, anincrease of $230 million, or 9.6% versus 2001. The 2002increase is due to higher results from all business segments.
Domestic beer pretax income for the year was up 9.3%, to$2.92 billion, reflecting higher revenue per barrel and increasedbeer volume. International beer segment pretax incomeincreased 37% for 2002, primarily due to volume and profitgrowth in China. Packaging segment pretax profits were up42%, primarily due to higher soft drink can prices and volume,along with a profit contribution from the company’s bottlemanufacturing operation in 2002 compared with a loss in the2001 start-up year. Entertainment segment pretax profits forthe year were up 3.8% compared with 2001. This comparisonincludes the $17.8 million pretax gain on the sale of thecompany’s SeaWorld Cleveland theme park in 2001.
Equity Income, Net of Tax
Equity income was $404.1 million for 2004, up $59 million,or 17.2%, versus 2003 due to the benefit of price increasesimplemented by Grupo Modelo, volume growth, and the $18million one-time benefit from the reduction in Mexicancorporate income tax rates. The tax rate benefit is partiallyoffset by $8 million of incremental U.S. deferred income taxesin the consolidated income tax provision. Equity income resultsfor 2003 include a $5.5 million after-tax gain representingAnheuser-Busch’s equity share of CCU earnings from the saleof a brewery in Croatia.
Equity income of $344.9 million in 2003 decreased $7 million versus 2002, primarily due to a $17 million one-time deferred income tax benefit included in 2002 Modeloequity income, partially offset by a $6.5 million charge in 2002 related to a brewery operation restructuring. The deferred tax benefit, which resulted from lower Mexicanstatutory income tax rates enacted in the first quarter of 2002, was largely offset by higher U.S. deferred income taxes included in the 2002 consolidated income tax provision.Equity income growth from Modelo for 2003 was alsodampened by lower export volume growth, Modelo not raising prices, and a weaker peso. As noted, Anheuser-Busch’sequity share of CCU earnings for 2003 benefited from theafter-tax gain on the sale of a brewery in Croatia.
Equity income increased 28.2%, to $351.7 million, for 2002 versus 2001. The increase is primarily due to Modelo’sunderlying volume and earnings growth. As noted previously,2002 results include the net favorable impact of the Modelotax rate benefit and brewery restructuring charge.
Income Taxes
Anheuser-Busch’s effective tax rate of 38.8% for 2004 increased10 basis points versus the 2003 rate of 38.7%. The rate for2004 includes the impact of the incremental U.S. deferredincome taxes related to the Mexican corporate tax ratereduction previously discussed. The 2003 effective ratedecreased 100 basis points versus the 39.7% rate in 2002. Thedecrease results from a more favorable foreign tax creditposition in 2003, and an unusually high effective rate in 2002due to higher U.S. deferred income tax expense to offset a2002 Mexican income tax rate benefit included in equityincome. The rate in 2002 was 70 basis points higher than2001, due to the incremental U.S. deferred taxes in 2002 andhigher foreign taxes, partially offset by the write-off in 2001 ofgoodwill associated with the sale of SeaWorld Cleveland. SeeNote 11 for additional information.
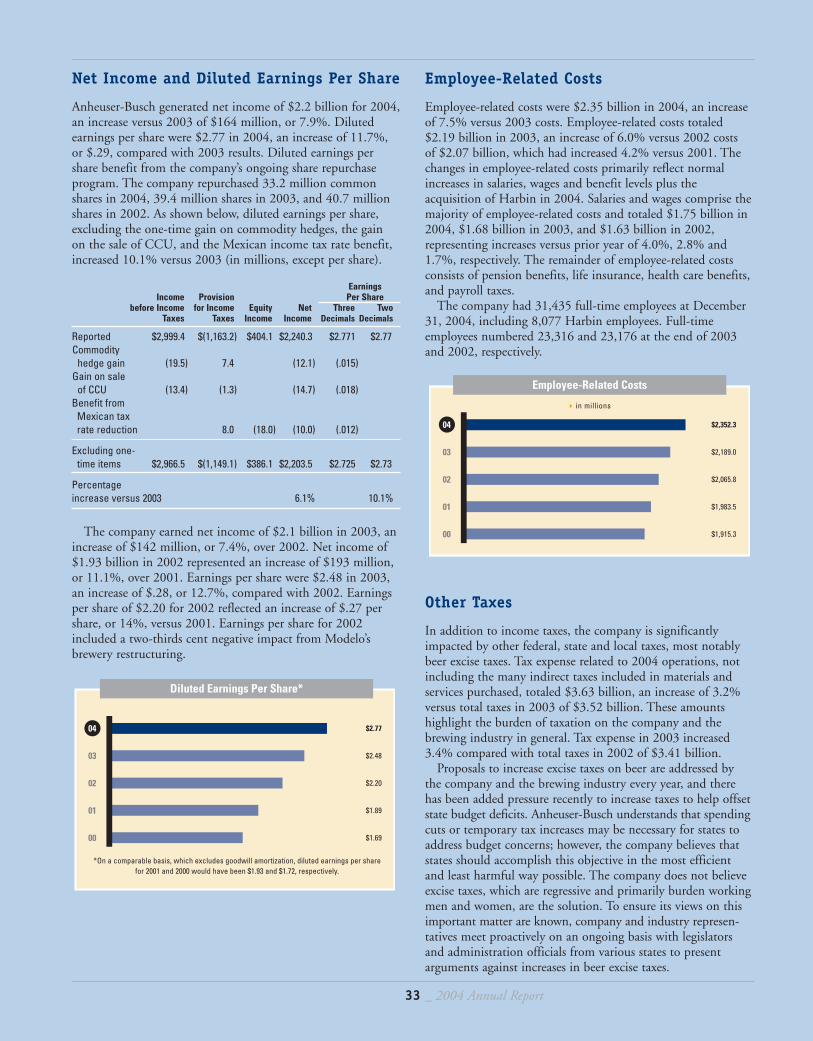
Net Income and Diluted Earnings Per Share
Anheuser-Busch generated net income of $2.2 billion for 2004,an increase versus 2003 of $164 million, or 7.9%. Dilutedearnings per share were $2.77 in 2004, an increase of 11.7%,or $.29, compared with 2003 results. Diluted earnings pershare benefit from the company’s ongoing share repurchaseprogram. The company repurchased 33.2 million commonshares in 2004, 39.4 million shares in 2003, and 40.7 millionshares in 2002. As shown below, diluted earnings per share,excluding the one-time gain on commodity hedges, the gain on the sale of CCU, and the Mexican income tax rate benefit,increased 10.1% versus 2003 (in millions, except per share).
EarningsIncome Provision Per Share
before Income for Income Equity Net Three TwoTaxes Taxes Income Income Decimals Decimals
Reported $2,999.4 $(1,163.2) $404.1 $2,240.3 $2.771 $2.77Commodity
hedge gain (19.5) 7.4 (12.1) (.015)Gain on sale
of CCU (13.4) (1.3) (14.7) (.018)Benefit from
Mexican tax rate reduction 8.0 (18.0) (10.0) (.012)
Excluding one-time items $2,966.5 $(1,149.1) $386.1 $2,203.5 $2.725 $2.73
Percentage increase versus 2003 6.1% 10.1%
The company earned net income of $2.1 billion in 2003, anincrease of $142 million, or 7.4%, over 2002. Net income of$1.93 billion in 2002 represented an increase of $193 million,or 11.1%, over 2001. Earnings per share were $2.48 in 2003,an increase of $.28, or 12.7%, compared with 2002. Earningsper share of $2.20 for 2002 reflected an increase of $.27 pershare, or 14%, versus 2001. Earnings per share for 2002included a two-thirds cent negative impact from Modelo’sbrewery restructuring.
$2.77
$2.48
$2.20
$1.89
$1.69
04
03
02
01
00
Diluted Earnings Per Share*
*On a comparable basis, which excludes goodwill amortization, diluted earnings per share for 2001 and 2000 would have been $1.93 and $1.72, respectively.
Employee-Related Costs
Employee-related costs were $2.35 billion in 2004, an increaseof 7.5% versus 2003 costs. Employee-related costs totaled$2.19 billion in 2003, an increase of 6.0% versus 2002 costs of $2.07 billion, which had increased 4.2% versus 2001. Thechanges in employee-related costs primarily reflect normalincreases in salaries, wages and benefit levels plus theacquisition of Harbin in 2004. Salaries and wages comprise themajority of employee-related costs and totaled $1.75 billion in2004, $1.68 billion in 2003, and $1.63 billion in 2002,representing increases versus prior year of 4.0%, 2.8% and1.7%, respectively. The remainder of employee-related costsconsists of pension benefits, life insurance, health care benefits,and payroll taxes.
The company had 31,435 full-time employees at December31, 2004, including 8,077 Harbin employees. Full-timeemployees numbered 23,316 and 23,176 at the end of 2003and 2002, respectively.
Other Taxes
In addition to income taxes, the company is significantlyimpacted by other federal, state and local taxes, most notablybeer excise taxes. Tax expense related to 2004 operations, notincluding the many indirect taxes included in materials andservices purchased, totaled $3.63 billion, an increase of 3.2%versus total taxes in 2003 of $3.52 billion. These amountshighlight the burden of taxation on the company and thebrewing industry in general. Tax expense in 2003 increased3.4% compared with total taxes in 2002 of $3.41 billion.
Proposals to increase excise taxes on beer are addressed by the company and the brewing industry every year, and therehas been added pressure recently to increase taxes to help offsetstate budget deficits. Anheuser-Busch understands that spendingcuts or temporary tax increases may be necessary for states toaddress budget concerns; however, the company believes thatstates should accomplish this objective in the most efficient and least harmful way possible. The company does not believeexcise taxes, which are regressive and primarily burden workingmen and women, are the solution. To ensure its views on thisimportant matter are known, company and industry represen-tatives meet proactively on an ongoing basis with legislatorsand administration officials from various states to presentarguments against increases in beer excise taxes.
$2,352.3
$2,189.0
$2,065.8
$1,983.5
$1,915.3
in millions
04
03
02
01
00
Employee-Related Costs
33 _ 2004 Annual Report
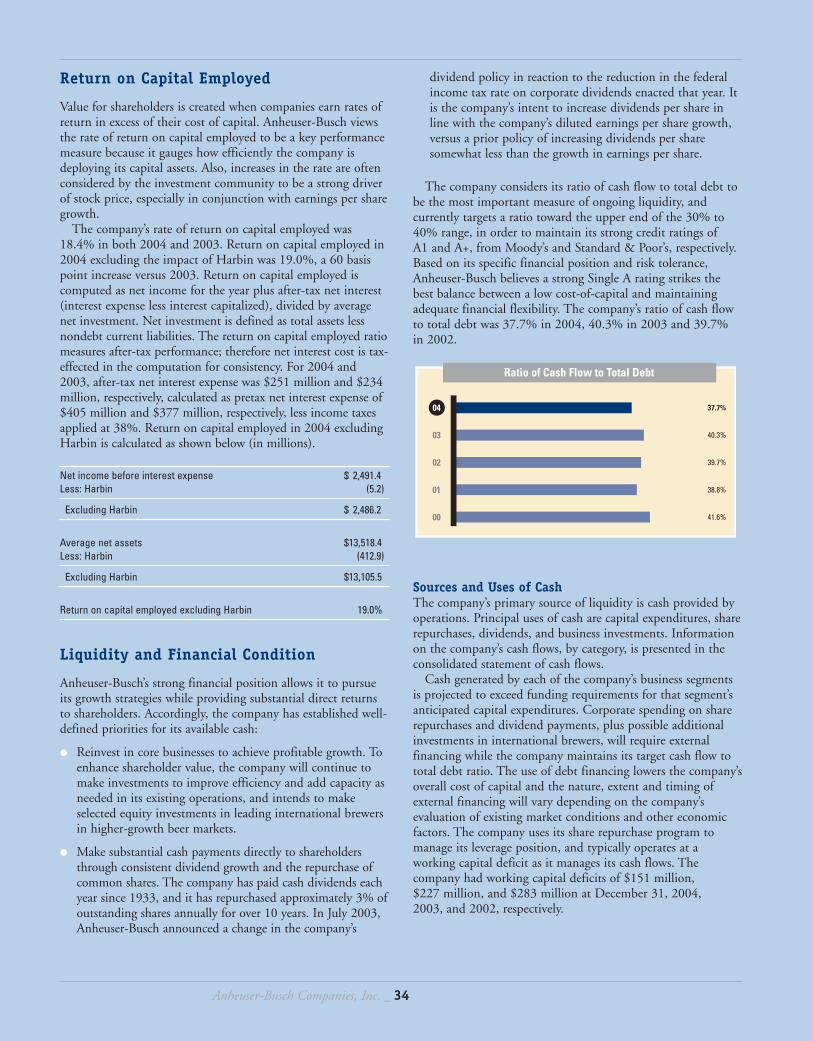
Anheuser-Busch Companies, Inc. _ 34
Return on Capital Employed
Value for shareholders is created when companies earn rates ofreturn in excess of their cost of capital. Anheuser-Busch viewsthe rate of return on capital employed to be a key performancemeasure because it gauges how efficiently the company isdeploying its capital assets. Also, increases in the rate are oftenconsidered by the investment community to be a strong driverof stock price, especially in conjunction with earnings per sharegrowth.
The company’s rate of return on capital employed was18.4% in both 2004 and 2003. Return on capital employed in2004 excluding the impact of Harbin was 19.0%, a 60 basispoint increase versus 2003. Return on capital employed iscomputed as net income for the year plus after-tax net interest(interest expense less interest capitalized), divided by averagenet investment. Net investment is defined as total assets lessnondebt current liabilities. The return on capital employed ratiomeasures after-tax performance; therefore net interest cost is tax-effected in the computation for consistency. For 2004 and2003, after-tax net interest expense was $251 million and $234million, respectively, calculated as pretax net interest expense of$405 million and $377 million, respectively, less income taxesapplied at 38%. Return on capital employed in 2004 excludingHarbin is calculated as shown below (in millions).
Net income before interest expense $ 2,491.4Less: Harbin (5.2)
Excluding Harbin $ 2,486.2
Average net assets $13,518.4Less: Harbin (412.9)
Excluding Harbin $13,105.5
Return on capital employed excluding Harbin 19.0%
Liquidity and Financial Condition
Anheuser-Busch’s strong financial position allows it to pursueits growth strategies while providing substantial direct returnsto shareholders. Accordingly, the company has established well-defined priorities for its available cash:
d Reinvest in core businesses to achieve profitable growth. Toenhance shareholder value, the company will continue tomake investments to improve efficiency and add capacity asneeded in its existing operations, and intends to makeselected equity investments in leading international brewersin higher-growth beer markets.
d Make substantial cash payments directly to shareholdersthrough consistent dividend growth and the repurchase ofcommon shares. The company has paid cash dividends eachyear since 1933, and it has repurchased approximately 3% ofoutstanding shares annually for over 10 years. In July 2003,Anheuser-Busch announced a change in the company’s
dividend policy in reaction to the reduction in the federalincome tax rate on corporate dividends enacted that year. Itis the company’s intent to increase dividends per share inline with the company’s diluted earnings per share growth,versus a prior policy of increasing dividends per sharesomewhat less than the growth in earnings per share.
The company considers its ratio of cash flow to total debt tobe the most important measure of ongoing liquidity, andcurrently targets a ratio toward the upper end of the 30% to40% range, in order to maintain its strong credit ratings of A1 and A+, from Moody’s and Standard & Poor’s, respectively.Based on its specific financial position and risk tolerance,Anheuser-Busch believes a strong Single A rating strikes thebest balance between a low cost-of-capital and maintainingadequate financial flexibility. The company’s ratio of cash flowto total debt was 37.7% in 2004, 40.3% in 2003 and 39.7%in 2002.
Sources and Uses of CashThe company’s primary source of liquidity is cash provided byoperations. Principal uses of cash are capital expenditures, sharerepurchases, dividends, and business investments. Informationon the company’s cash flows, by category, is presented in theconsolidated statement of cash flows.
Cash generated by each of the company’s business segmentsis projected to exceed funding requirements for that segment’santicipated capital expenditures. Corporate spending on sharerepurchases and dividend payments, plus possible additionalinvestments in international brewers, will require externalfinancing while the company maintains its target cash flow tototal debt ratio. The use of debt financing lowers the company’soverall cost of capital and the nature, extent and timing ofexternal financing will vary depending on the company’sevaluation of existing market conditions and other economicfactors. The company uses its share repurchase program tomanage its leverage position, and typically operates at aworking capital deficit as it manages its cash flows. Thecompany had working capital deficits of $151 million, $227 million, and $283 million at December 31, 2004, 2003, and 2002, respectively.
37.7%
40.3%
39.7%
38.8%
41.6%
Ratio of Cash Flow to Total Debt
04
03
02
01
00
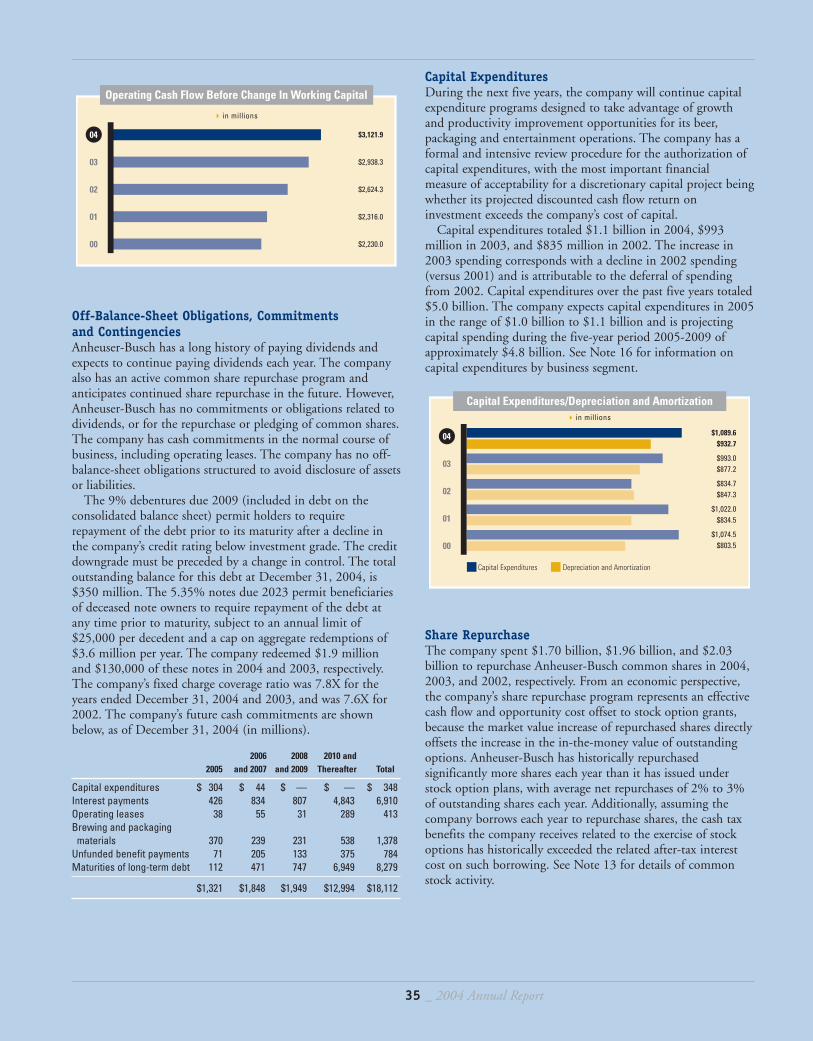
Off-Balance-Sheet Obligations, Commitments and ContingenciesAnheuser-Busch has a long history of paying dividends andexpects to continue paying dividends each year. The companyalso has an active common share repurchase program andanticipates continued share repurchase in the future. However,Anheuser-Busch has no commitments or obligations related todividends, or for the repurchase or pledging of common shares.The company has cash commitments in the normal course ofbusiness, including operating leases. The company has no off-balance-sheet obligations structured to avoid disclosure of assetsor liabilities.
The 9% debentures due 2009 (included in debt on theconsolidated balance sheet) permit holders to requirerepayment of the debt prior to its maturity after a decline inthe company’s credit rating below investment grade. The creditdowngrade must be preceded by a change in control. The totaloutstanding balance for this debt at December 31, 2004, is$350 million. The 5.35% notes due 2023 permit beneficiariesof deceased note owners to require repayment of the debt atany time prior to maturity, subject to an annual limit of$25,000 per decedent and a cap on aggregate redemptions of$3.6 million per year. The company redeemed $1.9 millionand $130,000 of these notes in 2004 and 2003, respectively.The company’s fixed charge coverage ratio was 7.8X for theyears ended December 31, 2004 and 2003, and was 7.6X for2002. The company’s future cash commitments are shownbelow, as of December 31, 2004 (in millions).
2006 2008 2010 and2005 and 2007 and 2009 Thereafter Total
Capital expenditures $ 304 $ 44 $ — $ — $ 348Interest payments 426 834 807 4,843 6,910Operating leases 38 55 31 289 413Brewing and packaging
materials 370 239 231 538 1,378Unfunded benefit payments 71 205 133 375 784Maturities of long-term debt 112 471 747 6,949 8,279
$1,321 $1,848 $1,949 $12,994 $18,112
$3,121.9
$2,938.3
$2,624.3
$2,316.0
$2,230.0
in millions
04
03
02
01
00
Operating Cash Flow Before Change In Working Capital
35 _ 2004 Annual Report
Capital ExpendituresDuring the next five years, the company will continue capitalexpenditure programs designed to take advantage of growthand productivity improvement opportunities for its beer,packaging and entertainment operations. The company has aformal and intensive review procedure for the authorization ofcapital expenditures, with the most important financialmeasure of acceptability for a discretionary capital project beingwhether its projected discounted cash flow return oninvestment exceeds the company’s cost of capital.
Capital expenditures totaled $1.1 billion in 2004, $993million in 2003, and $835 million in 2002. The increase in2003 spending corresponds with a decline in 2002 spending(versus 2001) and is attributable to the deferral of spendingfrom 2002. Capital expenditures over the past five years totaled$5.0 billion. The company expects capital expenditures in 2005in the range of $1.0 billion to $1.1 billion and is projectingcapital spending during the five-year period 2005-2009 ofapproximately $4.8 billion. See Note 16 for information oncapital expenditures by business segment.
Share RepurchaseThe company spent $1.70 billion, $1.96 billion, and $2.03billion to repurchase Anheuser-Busch common shares in 2004,2003, and 2002, respectively. From an economic perspective,the company’s share repurchase program represents an effectivecash flow and opportunity cost offset to stock option grants,because the market value increase of repurchased shares directlyoffsets the increase in the in-the-money value of outstandingoptions. Anheuser-Busch has historically repurchasedsignificantly more shares each year than it has issued understock option plans, with average net repurchases of 2% to 3%of outstanding shares each year. Additionally, assuming thecompany borrows each year to repurchase shares, the cash taxbenefits the company receives related to the exercise of stockoptions has historically exceeded the related after-tax interestcost on such borrowing. See Note 13 for details of commonstock activity.
Capital Expenditures/Depreciation and Amortizationin millions
04
03
02
01
00
$1,089.6$932.7 $993.0$877.2 $834.7$847.3
$1,022.0$834.5
$1,074.5$803.5
Capital Expenditures Depreciation and Amortization
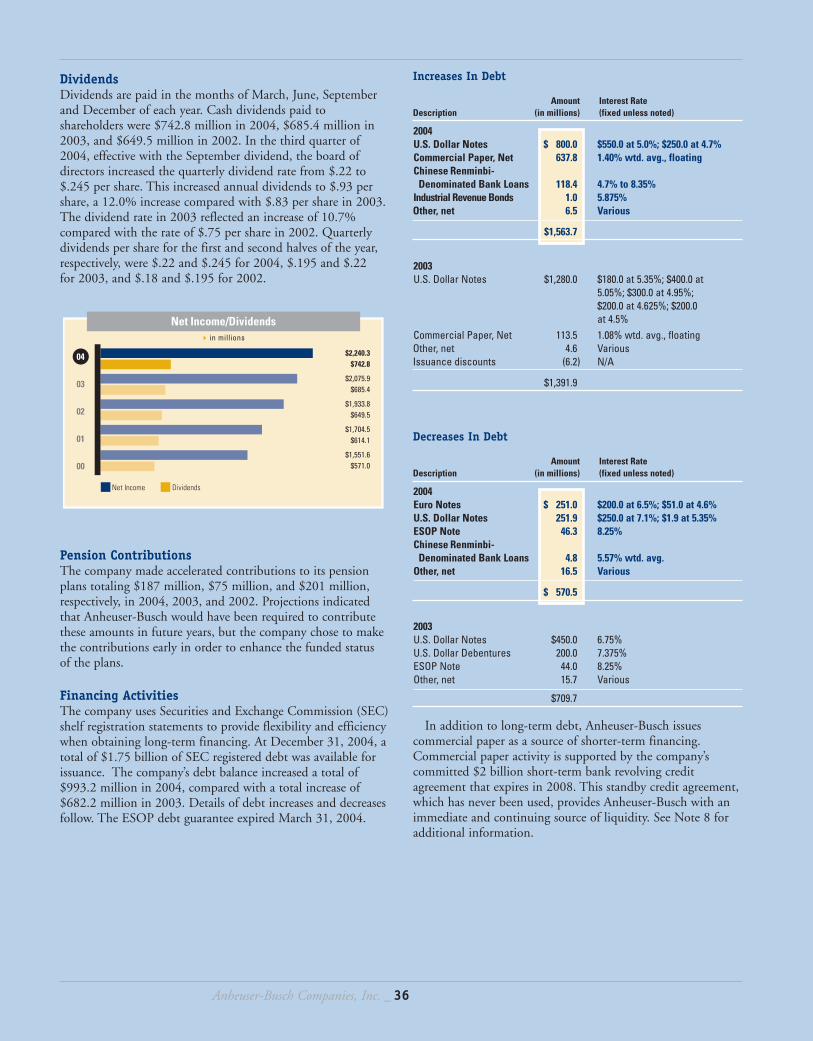
Anheuser-Busch Companies, Inc. _ 36
DividendsDividends are paid in the months of March, June, Septemberand December of each year. Cash dividends paid toshareholders were $742.8 million in 2004, $685.4 million in2003, and $649.5 million in 2002. In the third quarter of2004, effective with the September dividend, the board ofdirectors increased the quarterly dividend rate from $.22 to$.245 per share. This increased annual dividends to $.93 pershare, a 12.0% increase compared with $.83 per share in 2003.The dividend rate in 2003 reflected an increase of 10.7%compared with the rate of $.75 per share in 2002. Quarterlydividends per share for the first and second halves of the year,respectively, were $.22 and $.245 for 2004, $.195 and $.22 for 2003, and $.18 and $.195 for 2002.
Pension ContributionsThe company made accelerated contributions to its pensionplans totaling $187 million, $75 million, and $201 million,respectively, in 2004, 2003, and 2002. Projections indicatedthat Anheuser-Busch would have been required to contributethese amounts in future years, but the company chose to makethe contributions early in order to enhance the funded status of the plans.
Financing ActivitiesThe company uses Securities and Exchange Commission (SEC)shelf registration statements to provide flexibility and efficiencywhen obtaining long-term financing. At December 31, 2004, atotal of $1.75 billion of SEC registered debt was available forissuance. The company’s debt balance increased a total of$993.2 million in 2004, compared with a total increase of$682.2 million in 2003. Details of debt increases and decreasesfollow. The ESOP debt guarantee expired March 31, 2004.
Net Income/Dividendsin millions
Net Income Dividends
04
03
02
01
00
$2,240.3$742.8
$2,075.9$685.4
$1,933.8$649.5
$1,704.5$614.1
$1,551.6$571.0
Increases In Debt
Amount Interest Rate Description (in millions) (fixed unless noted)
2004U.S. Dollar Notes $ 800.0 $550.0 at 5.0%; $250.0 at 4.7%Commercial Paper, Net 637.8 1.40% wtd. avg., floatingChinese Renminbi-
Denominated Bank Loans 118.4 4.7% to 8.35% Industrial Revenue Bonds 1.0 5.875%Other, net 6.5 Various
$1,563.7
2003U.S. Dollar Notes $1,280.0 $180.0 at 5.35%; $400.0 at
5.05%; $300.0 at 4.95%; $200.0 at 4.625%; $200.0 at 4.5%
Commercial Paper, Net 113.5 1.08% wtd. avg., floatingOther, net 4.6 VariousIssuance discounts (6.2) N/A
$1,391.9
Decreases In Debt
Amount Interest Rate Description (in millions) (fixed unless noted)
2004Euro Notes $ 251.0 $200.0 at 6.5%; $51.0 at 4.6%U.S. Dollar Notes 251.9 $250.0 at 7.1%; $1.9 at 5.35%ESOP Note 46.3 8.25%Chinese Renminbi-
Denominated Bank Loans 4.8 5.57% wtd. avg. Other, net 16.5 Various
$ 570.5
2003U.S. Dollar Notes $450.0 6.75%U.S. Dollar Debentures 200.0 7.375%ESOP Note 44.0 8.25% Other, net 15.7 Various
$709.7
In addition to long-term debt, Anheuser-Busch issuescommercial paper as a source of shorter-term financing.Commercial paper activity is supported by the company’scommitted $2 billion short-term bank revolving creditagreement that expires in 2008. This standby credit agreement,which has never been used, provides Anheuser-Busch with animmediate and continuing source of liquidity. See Note 8 foradditional information.
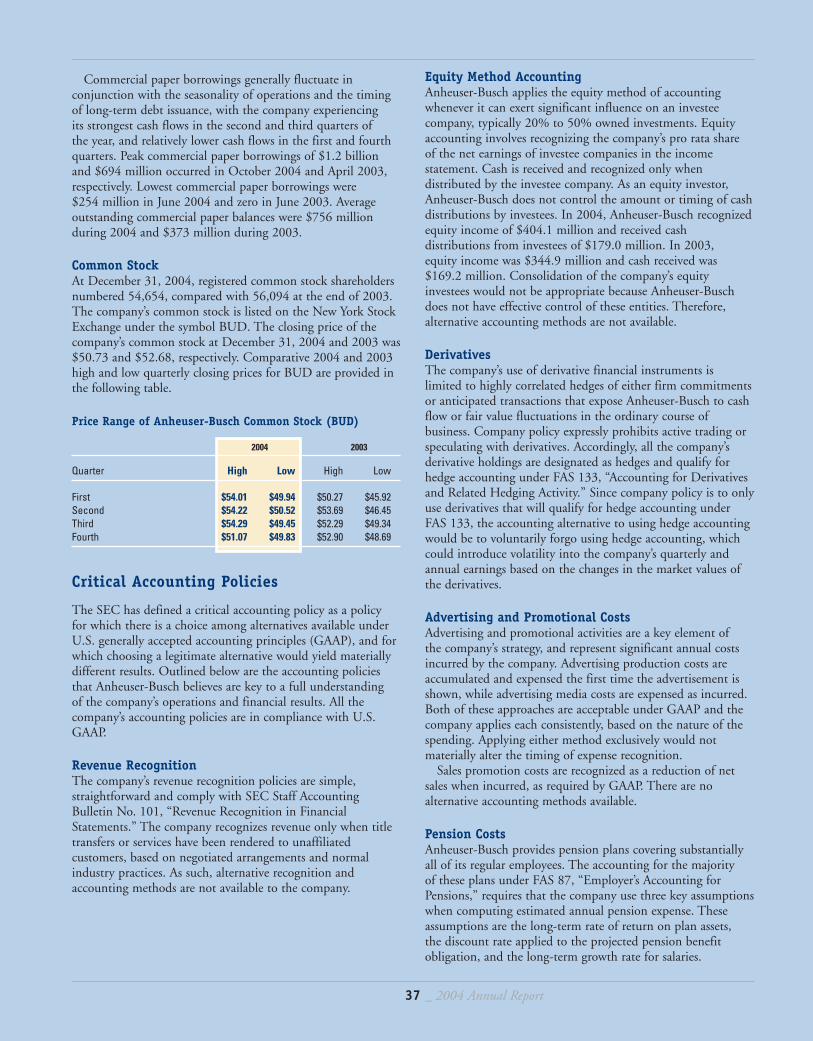
Equity Method Accounting Anheuser-Busch applies the equity method of accountingwhenever it can exert significant influence on an investeecompany, typically 20% to 50% owned investments. Equityaccounting involves recognizing the company’s pro rata share of the net earnings of investee companies in the incomestatement. Cash is received and recognized only whendistributed by the investee company. As an equity investor,Anheuser-Busch does not control the amount or timing of cashdistributions by investees. In 2004, Anheuser-Busch recognizedequity income of $404.1 million and received cashdistributions from investees of $179.0 million. In 2003, equity income was $344.9 million and cash received was$169.2 million. Consolidation of the company’s equityinvestees would not be appropriate because Anheuser-Buschdoes not have effective control of these entities. Therefore,alternative accounting methods are not available.
Derivatives The company’s use of derivative financial instruments is limited to highly correlated hedges of either firm commitmentsor anticipated transactions that expose Anheuser-Busch to cashflow or fair value fluctuations in the ordinary course ofbusiness. Company policy expressly prohibits active trading orspeculating with derivatives. Accordingly, all the company’sderivative holdings are designated as hedges and qualify forhedge accounting under FAS 133, “Accounting for Derivativesand Related Hedging Activity.” Since company policy is to onlyuse derivatives that will qualify for hedge accounting underFAS 133, the accounting alternative to using hedge accountingwould be to voluntarily forgo using hedge accounting, whichcould introduce volatility into the company’s quarterly andannual earnings based on the changes in the market values ofthe derivatives.
Advertising and Promotional CostsAdvertising and promotional activities are a key element of the company’s strategy, and represent significant annual costsincurred by the company. Advertising production costs areaccumulated and expensed the first time the advertisement isshown, while advertising media costs are expensed as incurred.Both of these approaches are acceptable under GAAP and thecompany applies each consistently, based on the nature of thespending. Applying either method exclusively would notmaterially alter the timing of expense recognition.
Sales promotion costs are recognized as a reduction of netsales when incurred, as required by GAAP. There are noalternative accounting methods available.
Pension CostsAnheuser-Busch provides pension plans covering substantiallyall of its regular employees. The accounting for the majority of these plans under FAS 87, “Employer’s Accounting forPensions,” requires that the company use three key assumptionswhen computing estimated annual pension expense. Theseassumptions are the long-term rate of return on plan assets, the discount rate applied to the projected pension benefitobligation, and the long-term growth rate for salaries.
37 _ 2004 Annual Report
Commercial paper borrowings generally fluctuate inconjunction with the seasonality of operations and the timingof long-term debt issuance, with the company experiencing its strongest cash flows in the second and third quarters of the year, and relatively lower cash flows in the first and fourthquarters. Peak commercial paper borrowings of $1.2 billionand $694 million occurred in October 2004 and April 2003,respectively. Lowest commercial paper borrowings were $254 million in June 2004 and zero in June 2003. Averageoutstanding commercial paper balances were $756 millionduring 2004 and $373 million during 2003.
Common StockAt December 31, 2004, registered common stock shareholdersnumbered 54,654, compared with 56,094 at the end of 2003.The company’s common stock is listed on the New York StockExchange under the symbol BUD. The closing price of thecompany’s common stock at December 31, 2004 and 2003 was$50.73 and $52.68, respectively. Comparative 2004 and 2003high and low quarterly closing prices for BUD are provided inthe following table.
Price Range of Anheuser-Busch Common Stock (BUD)
2004 2003
Quarter High Low High Low
First $54.01 $49.94 $50.27 $45.92Second $54.22 $50.52 $53.69 $46.45Third $54.29 $49.45 $52.29 $49.34Fourth $51.07 $49.83 $52.90 $48.69
Critical Accounting Policies
The SEC has defined a critical accounting policy as a policy for which there is a choice among alternatives available underU.S. generally accepted accounting principles (GAAP), and forwhich choosing a legitimate alternative would yield materiallydifferent results. Outlined below are the accounting policiesthat Anheuser-Busch believes are key to a full understanding of the company’s operations and financial results. All thecompany’s accounting policies are in compliance with U.S.GAAP.
Revenue Recognition The company’s revenue recognition policies are simple,straightforward and comply with SEC Staff AccountingBulletin No. 101, “Revenue Recognition in FinancialStatements.” The company recognizes revenue only when titletransfers or services have been rendered to unaffiliatedcustomers, based on negotiated arrangements and normalindustry practices. As such, alternative recognition andaccounting methods are not available to the company.
Anheuser-Busch Companies, Inc. _ 38
Of the three key assumptions, only the discount rate isdetermined by observable market pricing, and it is based oninterest rates for high-quality, long-term corporate debt. Thediscount rate used to value the company’s pension obligation atany year-end is used for expense calculations the next year —e.g., the December 31, 2004, rate is being used for 2005expense calculations. For the rates of return on plan assets andsalary growth, the company uses estimates based on experienceas well as future expectations. Due to the long-term nature ofpension liabilities, Anheuser-Busch attempts to choose rates forthese assumptions that will have long-term applicability. SeeNote 6 for information on the impact of a 1% change in keypension assumptions.
Retiree Medical CostsAnheuser-Busch provides health care coverage for most of itsretirees after they achieve certain age and years of servicerequirements. Under FAS 106, “Employers’ Accounting forPostretirement Benefits Other than Pensions,” the company isrequired to estimate the discount rate and future health carecost inflation rate in order to determine annual retiree healthcare expense and value the related health care liability on thebalance sheet. The company uses health care inflation ratesrecommended by its actuarial consultants each year. See Note 6for information on the impact of a 1% change in the assumeddiscount rate and health care inflation rate on annual retireemedical expense and the company’s accrued health careliability.
Risk Management
Through its operations, Anheuser-Busch is exposed to foreigncurrency exchange, interest rate, and commodity price risks.These exposures primarily relate to beer sales to foreigncustomers, foreign currency denominated capital purchases,royalty receipts from foreign license and contract brewers,acquisition of raw materials from both domestic and foreignsuppliers, and changes in interest rates. The company usesderivative financial instruments, including forward exchangecontracts, futures contracts, swaps, and purchased options andcollars to manage certain of these exposures. Changes inunderlying market conditions during 2004, including changesin interest rates, U.S. dollar foreign currency exchange rates,and certain commodity prices, have not had a material impacton Anheuser-Busch’s risk profile. There have been nosignificant changes in the types of derivative instruments usedto hedge the company’s exposures.
Anheuser-Busch has well-established policies and proceduresgoverning the use of derivatives. The company hedges onlyfirm commitments or anticipated transactions in the ordinarycourse of business and corporate policy prohibits the use ofderivatives for speculation, including the sale of freestandinginstruments. The company neither holds nor issues financialinstruments for trading purposes. Specific hedging strategiesused depend on several factors, including the magnitude andvolatility of the exposure, the cost and availability ofappropriate hedging instruments, the anticipated time horizon,the commodity basis exposure, the opportunity cost, and the
nature of the underlying hedged item. The company’s overallrisk management goal is to strike a balance between managingits exposures to market volatility while obtaining the mostfavorable transaction costs possible. The company monitors theeffectiveness of its hedging structures, based either on cashoffset between changes in the value of the underlying hedgedexposure and changes in the fair value of the derivative, or bymeasuring the ongoing correlation between the price of theunderlying hedged exposure and the pricing upon which thederivative is based. The fair value of derivatives is the amountthe company would pay or receive if terminating any contracts.
Derivatives are either exchange-traded instruments that arehighly liquid, or over-the-counter instruments transacted withhighly rated financial institutions. Bilateral collateral postingarrangements are in place with all over-the-counter derivativescounterparties. Counterparties are required to post collateral to Anheuser-Busch when they reach specified unfavorable fair-value thresholds, which are based on their credit ratings fromMoody’s and Standard & Poor’s, respectively, as follows (inmillions):
Counterparties rated at least A2 or A $30Counterparties rated A3 and A- $15Counterparties rated below A3 or A- $0
The same collateral posting thresholds apply to Anheuser-Busch and its credit ratings, if the fair value position isunfavorable to the company. All collateral is cash, U.S. Treasurysecurities, or letters of credit. At December 31, 2004, thecompany held zero counterparty collateral and had noneoutstanding. Given the company’s derivatives portfolio, currentmarket prices for derivatives held and the company’s creditrating, material funding needs arising from the company’scollateral arrangements are not expected.
Following is a sensitivity analysis indicating potentialunfavorable changes in the fair value of the company’sderivative holdings under certain market movements for thelast two years, as discussed below (in millions).
2004 2003
Foreign Currency Risk — Forwards and Options $0.4 $0.4Interest Rate Risk — Interest Rate Swaps $0.2 $0.5Commodity Price Risk — Futures, Swaps and Options $9.3 $4.5
The company uses value-at-risk (VAR) analysis for foreigncurrency and interest rate derivatives exposures, and sensitivityanalysis for commodity price exposures. VAR forecasts fairvalue changes using a Monte Carlo statistical simulation modelthat incorporates historical correlations among variouscurrencies and interest rates. The VAR model assumes that thecompany could liquidate its currency and interest rate positionsin a single day (one-day holding period). The volatility figuresprovided represent the maximum one-day loss the companycould experience on each portfolio at a 95% confidence level,based on market history and current conditions. Sensitivityanalysis reflects the impact of a hypothetical 10% adversechange in the market price for the company’s underlying priceexposures.
39 _ 2004 Annual Report
The volatility of foreign currencies, interest rates, andcommodity prices is dependent on many factors that cannotbe forecasted with accuracy. Therefore, changes in fair valueover time could differ substantially from the illustration.Additionally, the preceding derivatives volatility analysisignores changes in the value of the underlying hedgedtransactions, although the company expects offsetting impactsbetween changes in derivative values and changes in thepricing of the underlying hedged transactions. The averagedaily change in fair value for interest rate swaps in 2004 was$200,000, with a computed one-day high of $6.2 million anda one-day low of zero. The average daily change in fair valuefor foreign exchange derivatives in 2004 was $110,000, with acomputed one-day high of $420,000 and a one-day low ofzero. Average daily changes for foreign exchange derivatives arecomputed as the monthly variance in fair value divided by thenumber of business days in the month.
Anheuser-Busch’s exposure to interest rate volatility relatedto its outstanding debt is low, because the companypredominantly issues fixed-rate debt. At December 31, 2004,fixed-rate debt with an average maturity of 16 yearsrepresented 84% of the company’s outstanding debt. Assumingthe percentage of floating-rate debt at year-end remainsconstant in 2005, and including the impact of existing fixed-to-floating interest rate swaps, an immediate 100 basis points(1.0 percentage point) increase in interest rates would result inincremental interest expense of approximately $13 million overthe course of the full year.
Other Matters
Fair Value of Modelo InvestmentThe economic benefit of the company’s Modelo investmentcan be measured in two ways: through equity income, whichrepresents Anheuser-Busch’s pro rata share in the net earningsof Modelo, and by the excess of the fair market value of theinvestment over its cost. The excess of fair value over thecompany’s cost, based on Grupo Modelo’s closing stock priceon the Mexican stock exchange at December 31, 2004, was$4.2 billion. Although this amount is appropriately notreflected in the company’s income statement or balance sheet,it represents economic value to Anheuser-Busch and itsshareholders.
Agreement With TeamstersIn December 2003, employees represented by theInternational Brotherhood of Teamsters overwhelminglyapproved a new five-year labor contract covering approx-imately 7,500 employees at the company’s 12 U.S. breweries.The contract agreement, which runs through February 28,2009, calls for wage increases of $.65 per hour in year one,$.60 per hour in years two, three and four, and $.55 cents per hour in year five. The agreement maintains a health carepackage with no employee-paid premiums in company-sponsored plans and also includes total pension increases of14% for defined benefit plans. By ratifying the contract on
the first vote and having results submitted to the company by December 2, 2003, the Teamsters-represented employeesreceived a renewal of Anheuser-Busch’s commitment to keepall 12 breweries open throughout the life of the new agree-ment, provided there are no new or increased federal or stateexcise taxes or other unforeseen extraordinary events whichnegatively impact the company’s business. Concurrent with the contract signing, the company recognized in the fourthquarter 2003 a $7 million expense related to a one-timesigning bonus and accelerated merit increase.
Wholesaler AcquisitionIn October 2003, the company purchased the assets of a beer wholesale operation in Pomona, Calif. for $84 million inAnheuser-Busch common stock and cash. Included in thepurchase were cash and other working capital of $22 million,fixed and other long-term assets of $21 million, and productdistribution rights of $41 million. See Notes 5 and 9 foradditional information.
Certifications and GovernanceThe company has included the required CEO and CFOcertifications regarding the quality of the company’s publicdisclosure as exhibits to its 2004 annual report on Form 10-Kfiled with the SEC. Also, a CEO certification regarding thecompany’s compliance with corporate governance listingstandards has been submitted to the New York StockExchange, as required by its listing rules. Available free ofcharge on the company’s Web site, www.anheuser-busch.com,are charters for all standing committees of the board ofdirectors (including audit, compensation and corporategovernance); codes of business conduct for directors, officersand employees; and Anheuser-Busch’s corporate governanceguidelines.
Environmental IssuesThe company is strongly committed to environmentalprotection. Its Environmental Management System providesspecific guidance for how the environment must be factoredinto business decisions and mandates special consideration ofenvironmental issues in conjunction with other business issueswhen any of the company’s facilities or business units plancapital projects or changes in processes. Anheuser-Busch alsoencourages its suppliers to adopt similar environmentalmanagement practices and policies.
The company is subject to federal, state and localenvironmental protection laws and regulations and is operatingwithin such laws or is taking action aimed at assuringcompliance with such laws and regulations. Compliance withthese laws and regulations is not expected to materially affectthe company’s competitive position. It is the opinion ofmanagement that potential costs, either individually or in theaggregate, related to any federal or state designated cleanupsites for which Anheuser-Busch has been identified as aPotentially Responsible Party will not materially affect thecompany’s financial position, results of operations, or liquidity.
Anheuser-Busch Companies, Inc. _ 40
Management’s Responsibility for Financial Statements
The company’s financial statements are prepared and presentedin accordance with accounting principles generally accepted inthe United States. The management of Anheuser-Busch isresponsible for the preparation and presentation of the financialstatements and other financial information included in thisannual report, including the reasonableness of estimates andjudgments inherent in the preparation of the financialstatements.
The board of directors is responsible for ensuring theindependence and qualifications of audit committee membersunder applicable New York Stock Exchange and Securities andExchange Commission standards. The audit committee consistsof five nonmanagement directors and oversees the company’sfinancial reporting and internal controls system and meets withmanagement, the independent auditors and the internalauditors periodically to review auditing and financial reportingmatters. The audit committee is solely responsible for theselection and retention of the company’s independent auditors,subject to shareholder approval. The audit committee held sixmeetings during 2004 and its report for 2004 can be found inthe company’s proxy statement.
In addition to the audits of the company’s internal controlover financial reporting and management’s assessment ofinternal control over financial reporting,PricewaterhouseCoopers LLP, is also responsible for auditingthe company’s financial statements in accordance with thestandards of the Public Company Accounting Oversight Board,and expressing an opinion as to whether the financialstatements fairly present, in all material respects, the company’sfinancial position, operating results, cash flows, and changes inshareholders equity.
Management’s Report on Internal Control Over Financial Reporting
It is also management’s responsibility to establish andmaintain adequate internal control over financial reporting, as such term is defined by the U.S. Securities and ExchangeCommission. Under the supervision and with the participationof management, including the chief executive officer and chieffinancial officer, the company conducted an assessment of theeffectiveness of its internal control over financial reportingbased on the framework set forth in Internal Control —Integrated Framework issued by the Committee of SponsoringOrganizations of the Treadway Commission (COSO). Thecompany’s internal control over financial reporting is a process designed to provide reasonable assurance regarding the reliability of the company’s financial reporting and thepreparation of financial statements for external purposes inaccordance with generally accepted accounting principles.
Based on the company’s evaluation under the COSOframework, Anheuser-Busch management concluded that thecompany’s internal control over financial reporting was effectiveas of December 31, 2004. The company’s internal control overfinancial reporting, and management’s assessment of the effectiveness of the company’s internal control over financialreporting as of December 31, 2004, have both been audited byPricewaterhouseCoopers LLP, an independent registered publicaccounting firm, as stated in its report.
Management’s Responsibility for Financial Statements andManagement’s Report on Internal Control Over Financial ReportingAnheuser-Busch Companies and Subsidiaries
To the Shareholders and Board of Directors of Anheuser-Busch Companies, Inc.
We have completed an integrated audit of Anheuser-BuschCompanies, Inc.’s 2004 consolidated financial statements andof its internal control over financial reporting as of December31, 2004 and audits of its 2003 and 2002 consolidatedfinancial statements in accordance with the standards of thePublic Company Accounting Oversight Board (United States).Our opinions, based on our audits, are presented below.
Consolidated Financial StatementsIn our opinion, the accompanying consolidated balance sheets,and the related consolidated statements of income, changes inshareholders equity, and cash flows, present fairly, in allmaterial respects, the financial position of Anheuser-BuschCompanies, Inc. and its subsidiaries (the “Company”) atDecember 31, 2004 and 2003, and the results of theiroperations and their cash flows for each of the three years inthe period ended December 31, 2004 in conformity withaccounting principles generally accepted in the United States of America. These financial statements are the responsibility ofthe Company’s management. Our responsibility is to express anopinion on these financial statements based on our audits. Weconducted our audits of these statements in accordance withthe standards of the Public Company Accounting OversightBoard (United States). Those standards require that we planand perform the audit to obtain reasonable assurance aboutwhether the financial statements are free of materialmisstatement. An audit of financial statements includesexamining, on a test basis, evidence supporting the amountsand disclosures in the financial statements, assessing theaccounting principles used and significant estimates made bymanagement, and evaluating the overall financial statementpresentation. We believe that our audits provide a reasonablebasis for our opinion.
Internal Control Over Financial ReportingAlso, in our opinion, management’s assessment, included in theaccompanying Management’s Report on Internal Control OverFinancial Reporting, that the Company maintained effectiveinternal control over financial reporting as of December 31,2004, based on criteria established in Internal Control —Integrated Framework issued by the Committee of SponsoringOrganizations of the Treadway Commission (COSO), is fairlystated, in all material respects, based on those criteria.Furthermore, in our opinion, the Company maintained, in allmaterial respects, effective internal control over financialreporting as of December 31, 2004, based on criteriaestablished in Internal Control — Integrated Framework issuedby the COSO. The Company’s management is responsible for maintaining effective internal control over financial reporting
and for its assessment of the effectiveness of internal controlover financial reporting. Our responsibility is to expressopinions on management’s assessment and on the effectivenessof the Company’s internal control over financial reportingbased on our audit. We conducted our audit of internal controlover financial reporting in accordance with the standards of thePublic Company Accounting Oversight Board (United States).Those standards require that we plan and perform the audit toobtain reasonable assurance about whether effective internalcontrol over financial reporting was maintained in all materialrespects. An audit of internal control over financial reportingincludes obtaining an understanding of internal control overfinancial reporting, evaluating management’s assessment,testing and evaluating the design and operating effectiveness ofinternal control, and performing such other procedures as weconsider necessary in the circumstances. We believe that ouraudit provides a reasonable basis for our opinions.
A company’s internal control over financial reporting is aprocess designed to provide reasonable assurance regarding thereliability of financial reporting and the preparation of financialstatements for external purposes in accordance with generallyaccepted accounting principles. A company’s internal controlover financial reporting includes those policies and proceduresthat (i) pertain to the maintenance of records that, inreasonable detail, accurately and fairly reflect the transactionsand dispositions of the assets of the company; (ii) providereasonable assurance that transactions are recorded as necessaryto permit preparation of financial statements in accordancewith generally accepted accounting principles, and that receiptsand expenditures of the company are being made only inaccordance with authorizations of management and directors of the company; and (iii) provide reasonable assuranceregarding prevention or timely detection of unauthorizedacquisition, use, or disposition of company assets that couldhave a material effect on the financial statements.
Because of its inherent limitations, internal control overfinancial reporting may not prevent or detect misstatements.Also, projections of any evaluation of effectiveness to futureperiods are subject to the risk that controls may becomeinadequate because of changes in conditions, or that the degreeof compliance with the policies or procedures may deteriorate.
St. Louis, MO February 23, 2005
41 _ 2004 Annual Report
Report of Independent Registered Public Accounting FirmAnheuser-Busch Companies and Subsidiaries
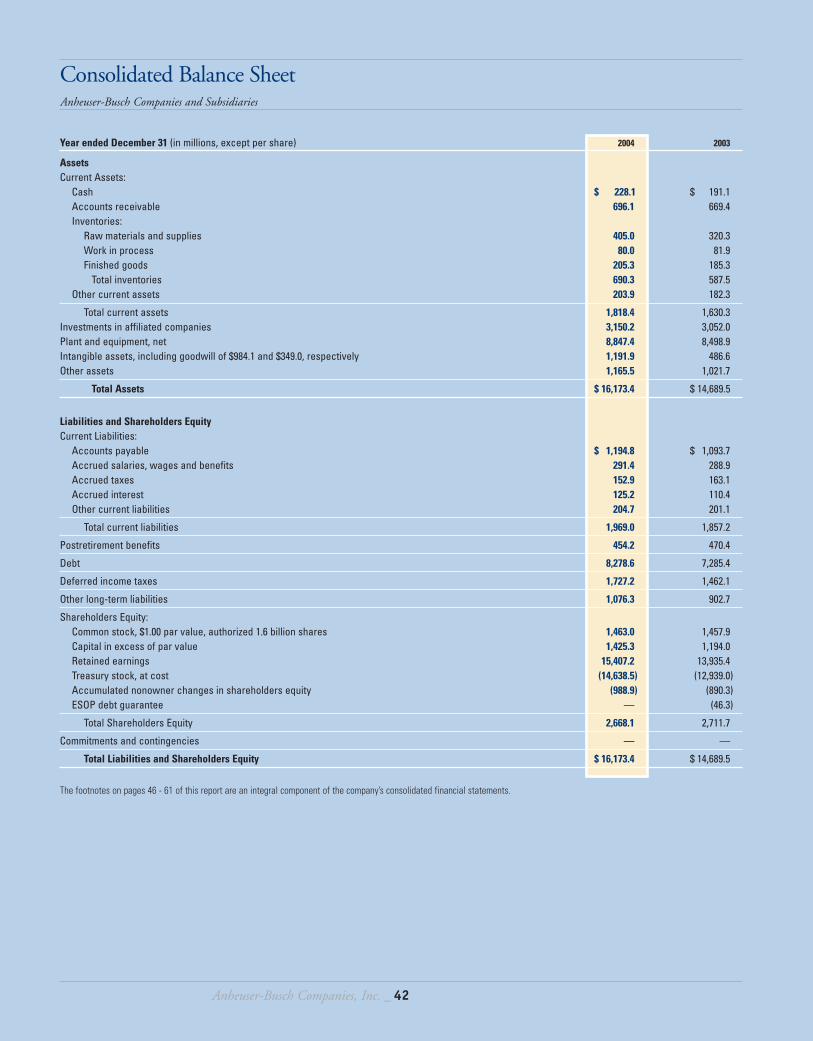
Anheuser-Busch Companies, Inc. _ 42
Year ended December 31 (in millions, except per share) 2004 2003
AssetsCurrent Assets:
Cash $ 228.1 $ 191.1Accounts receivable 696.1 669.4Inventories:
Raw materials and supplies 405.0 320.3Work in process 80.0 81.9Finished goods 205.3 185.3
Total inventories 690.3 587.5Other current assets 203.9 182.3
Total current assets 1,818.4 1,630.3Investments in affiliated companies 3,150.2 3,052.0Plant and equipment, net 8,847.4 8,498.9Intangible assets, including goodwill of $984.1 and $349.0, respectively 1,191.9 486.6Other assets 1,165.5 1,021.7
Total Assets $ 16,173.4 $ 14,689.5
Liabilities and Shareholders EquityCurrent Liabilities:
Accounts payable $ 1,194.8 $ 1,093.7Accrued salaries, wages and benefits 291.4 288.9Accrued taxes 152.9 163.1Accrued interest 125.2 110.4Other current liabilities 204.7 201.1
Total current liabilities 1,969.0 1,857.2
Postretirement benefits 454.2 470.4
Debt 8,278.6 7,285.4
Deferred income taxes 1,727.2 1,462.1
Other long-term liabilities 1,076.3 902.7
Shareholders Equity:Common stock, $1.00 par value, authorized 1.6 billion shares 1,463.0 1,457.9Capital in excess of par value 1,425.3 1,194.0Retained earnings 15,407.2 13,935.4Treasury stock, at cost (14,638.5) (12,939.0)Accumulated nonowner changes in shareholders equity (988.9) (890.3)ESOP debt guarantee — (46.3)
Total Shareholders Equity 2,668.1 2,711.7
Commitments and contingencies — —
Total Liabilities and Shareholders Equity $ 16,173.4 $ 14,689.5
The footnotes on pages 46 - 61 of this report are an integral component of the company’s consolidated financial statements.
Consolidated Balance SheetAnheuser-Busch Companies and Subsidiaries
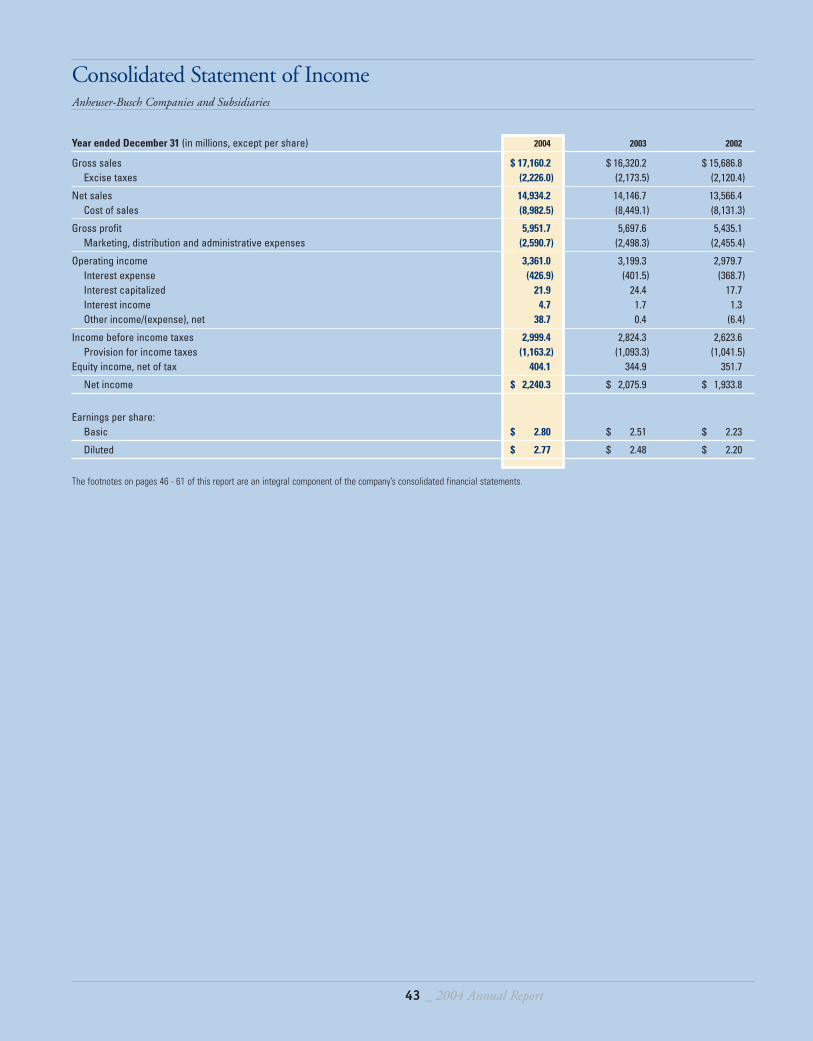
43 _ 2004 Annual Report
Year ended December 31 (in millions, except per share) 2004 2003 2002
Gross sales $ 17,160.2 $ 16,320.2 $ 15,686.8Excise taxes (2,226.0) (2,173.5) (2,120.4)
Net sales 14,934.2 14,146.7 13,566.4Cost of sales (8,982.5) (8,449.1) (8,131.3)
Gross profit 5,951.7 5,697.6 5,435.1Marketing, distribution and administrative expenses (2,590.7) (2,498.3) (2,455.4)
Operating income 3,361.0 3,199.3 2,979.7Interest expense (426.9) (401.5) (368.7)Interest capitalized 21.9 24.4 17.7Interest income 4.7 1.7 1.3Other income/(expense), net 38.7 0.4 (6.4)
Income before income taxes 2,999.4 2,824.3 2,623.6Provision for income taxes (1,163.2) (1,093.3) (1,041.5)
Equity income, net of tax 404.1 344.9 351.7
Net income $ 2,240.3 $ 2,075.9 $ 1,933.8
Earnings per share:Basic $ 2.80 $ 2.51 $ 2.23
Diluted $ 2.77 $ 2.48 $ 2.20
The footnotes on pages 46 - 61 of this report are an integral component of the company’s consolidated financial statements.
Consolidated Statement of IncomeAnheuser-Busch Companies and Subsidiaries
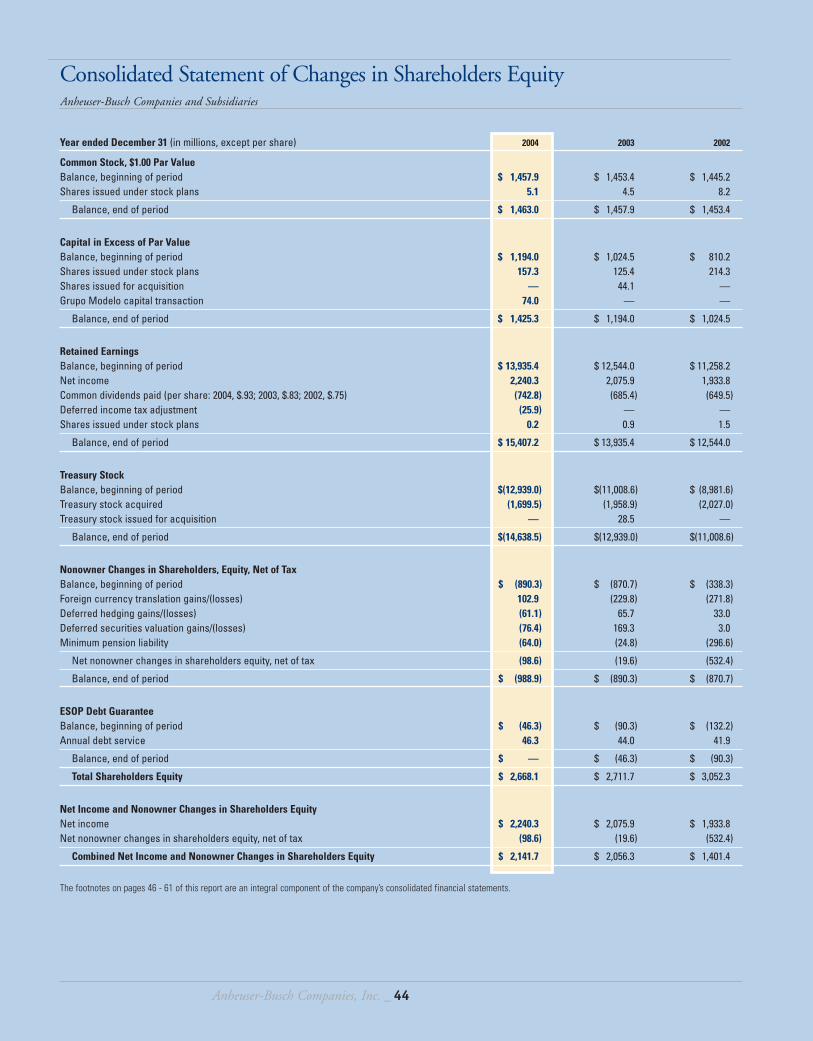
Anheuser-Busch Companies, Inc. _ 44
Year ended December 31 (in millions, except per share) 2004 2003 2002
Common Stock, $1.00 Par ValueBalance, beginning of period $ 1,457.9 $ 1,453.4 $ 1,445.2Shares issued under stock plans 5.1 4.5 8.2
Balance, end of period $ 1,463.0 $ 1,457.9 $ 1,453.4
Capital in Excess of Par ValueBalance, beginning of period $ 1,194.0 $ 1,024.5 $ 810.2Shares issued under stock plans 157.3 125.4 214.3Shares issued for acquisition — 44.1 —Grupo Modelo capital transaction 74.0 — —
Balance, end of period $ 1,425.3 $ 1,194.0 $ 1,024.5
Retained Earnings Balance, beginning of period $ 13,935.4 $ 12,544.0 $ 11,258.2Net income 2,240.3 2,075.9 1,933.8Common dividends paid (per share: 2004, $.93; 2003, $.83; 2002, $.75) (742.8) (685.4) (649.5)Deferred income tax adjustment (25.9) — —Shares issued under stock plans 0.2 0.9 1.5
Balance, end of period $ 15,407.2 $ 13,935.4 $ 12,544.0
Treasury StockBalance, beginning of period $(12,939.0) $(11,008.6) $ (8,981.6)Treasury stock acquired (1,699.5) (1,958.9) (2,027.0)Treasury stock issued for acquisition — 28.5 —
Balance, end of period $(14,638.5) $(12,939.0) $(11,008.6)
Nonowner Changes in Shareholders, Equity, Net of TaxBalance, beginning of period $ (890.3) $ (870.7) $ (338.3)Foreign currency translation gains/(losses) 102.9 (229.8) (271.8)Deferred hedging gains/(losses) (61.1) 65.7 33.0Deferred securities valuation gains/(losses) (76.4) 169.3 3.0Minimum pension liability (64.0) (24.8) (296.6)
Net nonowner changes in shareholders equity, net of tax (98.6) (19.6) (532.4)
Balance, end of period $ (988.9) $ (890.3) $ (870.7)
ESOP Debt GuaranteeBalance, beginning of period $ (46.3) $ (90.3) $ (132.2)Annual debt service 46.3 44.0 41.9
Balance, end of period $ — $ (46.3) $ (90.3)
Total Shareholders Equity $ 2,668.1 $ 2,711.7 $ 3,052.3
Net Income and Nonowner Changes in Shareholders EquityNet income $ 2,240.3 $ 2,075.9 $ 1,933.8Net nonowner changes in shareholders equity, net of tax (98.6) (19.6) (532.4)
Combined Net Income and Nonowner Changes in Shareholders Equity $ 2,141.7 $ 2,056.3 $ 1,401.4
The footnotes on pages 46 - 61 of this report are an integral component of the company’s consolidated financial statements.
Consolidated Statement of Changes in Shareholders EquityAnheuser-Busch Companies and Subsidiaries
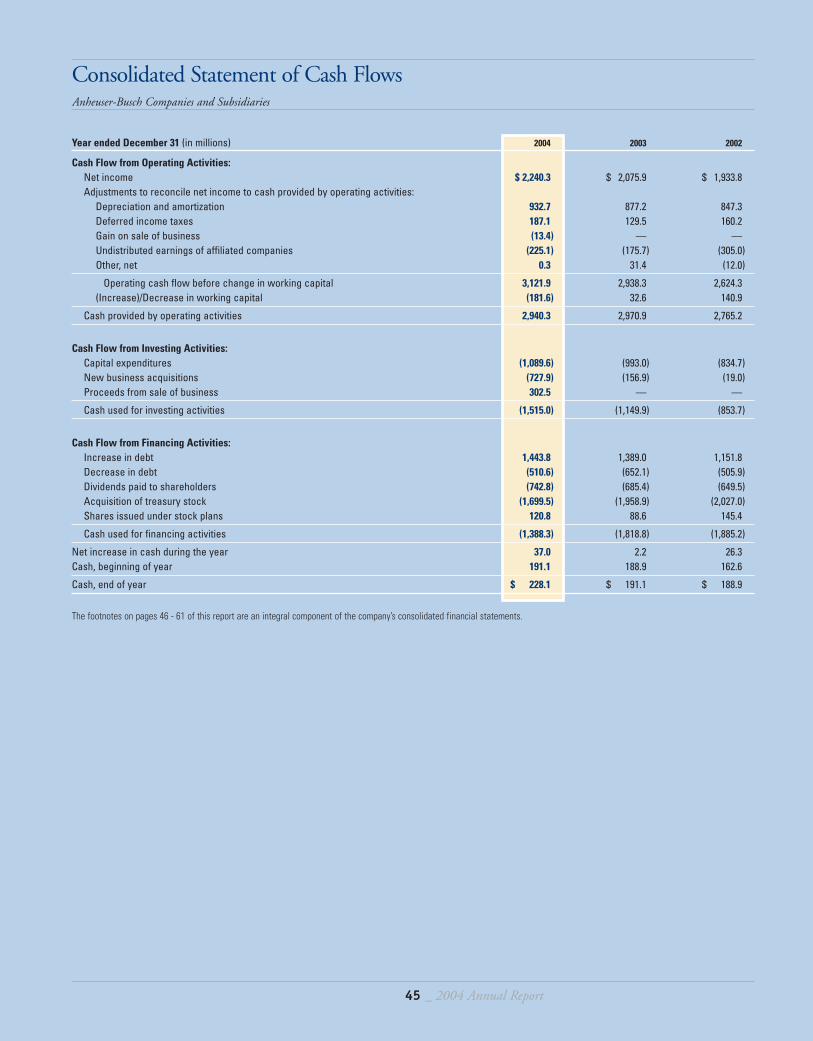
45 _ 2004 Annual Report
Year ended December 31 (in millions) 2004 2003 2002
Cash Flow from Operating Activities:Net income $ 2,240.3 $ 2,075.9 $ 1,933.8Adjustments to reconcile net income to cash provided by operating activities:
Depreciation and amortization 932.7 877.2 847.3Deferred income taxes 187.1 129.5 160.2Gain on sale of business (13.4) — —Undistributed earnings of affiliated companies (225.1) (175.7) (305.0)Other, net 0.3 31.4 (12.0)
Operating cash flow before change in working capital 3,121.9 2,938.3 2,624.3(Increase)/Decrease in working capital (181.6) 32.6 140.9
Cash provided by operating activities 2,940.3 2,970.9 2,765.2
Cash Flow from Investing Activities:Capital expenditures (1,089.6) (993.0) (834.7)New business acquisitions (727.9) (156.9) (19.0)Proceeds from sale of business 302.5 — —
Cash used for investing activities (1,515.0) (1,149.9) (853.7)
Cash Flow from Financing Activities:Increase in debt 1,443.8 1,389.0 1,151.8Decrease in debt (510.6) (652.1) (505.9)Dividends paid to shareholders (742.8) (685.4) (649.5)Acquisition of treasury stock (1,699.5) (1,958.9) (2,027.0)Shares issued under stock plans 120.8 88.6 145.4
Cash used for financing activities (1,388.3) (1,818.8) (1,885.2)
Net increase in cash during the year 37.0 2.2 26.3Cash, beginning of year 191.1 188.9 162.6
Cash, end of year $ 228.1 $ 191.1 $ 188.9
The footnotes on pages 46 - 61 of this report are an integral component of the company’s consolidated financial statements.
Consolidated Statement of Cash FlowsAnheuser-Busch Companies and Subsidiaries
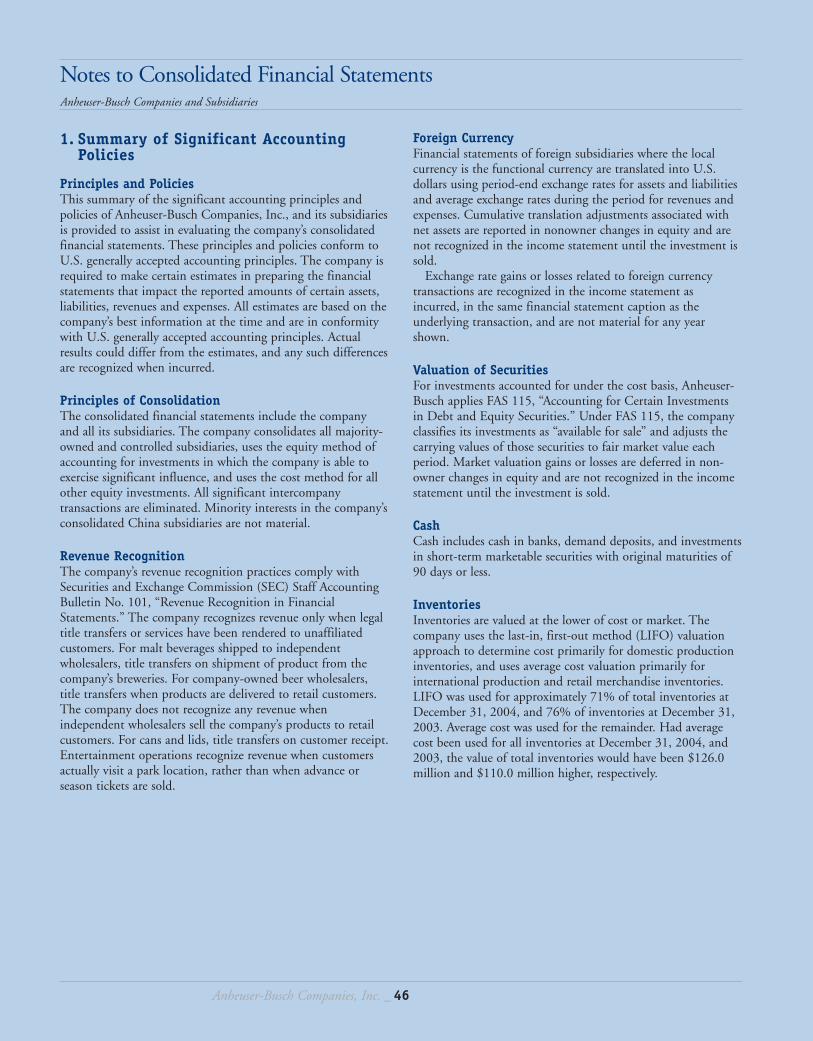
Anheuser-Busch Companies, Inc. _ 46
1. Summary of Significant Accounting Policies
Principles and PoliciesThis summary of the significant accounting principles andpolicies of Anheuser-Busch Companies, Inc., and its subsidiariesis provided to assist in evaluating the company’s consolidatedfinancial statements. These principles and policies conform toU.S. generally accepted accounting principles. The company isrequired to make certain estimates in preparing the financialstatements that impact the reported amounts of certain assets,liabilities, revenues and expenses. All estimates are based on thecompany’s best information at the time and are in conformitywith U.S. generally accepted accounting principles. Actualresults could differ from the estimates, and any such differencesare recognized when incurred.
Principles of ConsolidationThe consolidated financial statements include the companyand all its subsidiaries. The company consolidates all majority-owned and controlled subsidiaries, uses the equity method ofaccounting for investments in which the company is able toexercise significant influence, and uses the cost method for allother equity investments. All significant intercompanytransactions are eliminated. Minority interests in the company’sconsolidated China subsidiaries are not material.
Revenue RecognitionThe company’s revenue recognition practices comply withSecurities and Exchange Commission (SEC) Staff AccountingBulletin No. 101, “Revenue Recognition in FinancialStatements.” The company recognizes revenue only when legaltitle transfers or services have been rendered to unaffiliatedcustomers. For malt beverages shipped to independentwholesalers, title transfers on shipment of product from thecompany’s breweries. For company-owned beer wholesalers,title transfers when products are delivered to retail customers.The company does not recognize any revenue whenindependent wholesalers sell the company’s products to retailcustomers. For cans and lids, title transfers on customer receipt.Entertainment operations recognize revenue when customersactually visit a park location, rather than when advance orseason tickets are sold.
Foreign CurrencyFinancial statements of foreign subsidiaries where the localcurrency is the functional currency are translated into U.S.dollars using period-end exchange rates for assets and liabilitiesand average exchange rates during the period for revenues andexpenses. Cumulative translation adjustments associated withnet assets are reported in nonowner changes in equity and arenot recognized in the income statement until the investment issold.
Exchange rate gains or losses related to foreign currencytransactions are recognized in the income statement asincurred, in the same financial statement caption as theunderlying transaction, and are not material for any yearshown.
Valuation of SecuritiesFor investments accounted for under the cost basis, Anheuser-Busch applies FAS 115, “Accounting for Certain Investmentsin Debt and Equity Securities.” Under FAS 115, the companyclassifies its investments as “available for sale” and adjusts thecarrying values of those securities to fair market value eachperiod. Market valuation gains or losses are deferred in non-owner changes in equity and are not recognized in the incomestatement until the investment is sold.
CashCash includes cash in banks, demand deposits, and investmentsin short-term marketable securities with original maturities of90 days or less.
InventoriesInventories are valued at the lower of cost or market. Thecompany uses the last-in, first-out method (LIFO) valuationapproach to determine cost primarily for domestic productioninventories, and uses average cost valuation primarily forinternational production and retail merchandise inventories.LIFO was used for approximately 71% of total inventories atDecember 31, 2004, and 76% of inventories at December 31,2003. Average cost was used for the remainder. Had averagecost been used for all inventories at December 31, 2004, and2003, the value of total inventories would have been $126.0million and $110.0 million higher, respectively.
Notes to Consolidated Financial StatementsAnheuser-Busch Companies and Subsidiaries
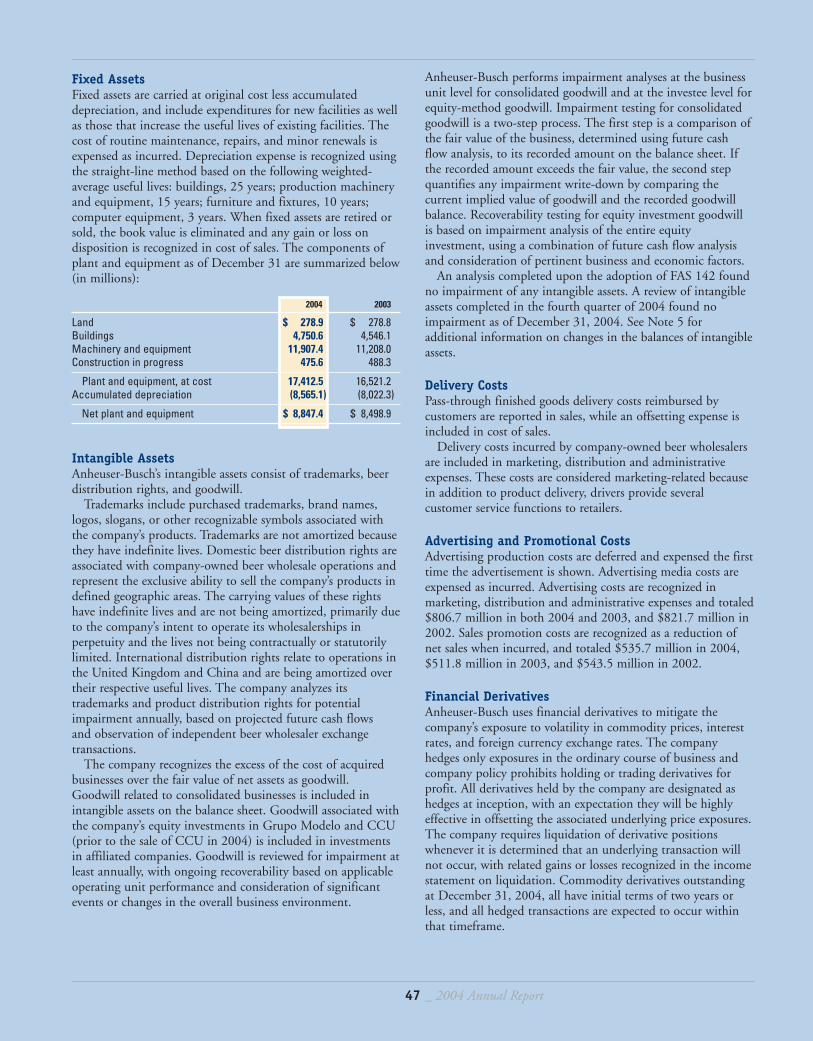
Anheuser-Busch performs impairment analyses at the businessunit level for consolidated goodwill and at the investee level forequity-method goodwill. Impairment testing for consolidatedgoodwill is a two-step process. The first step is a comparison ofthe fair value of the business, determined using future cashflow analysis, to its recorded amount on the balance sheet. Ifthe recorded amount exceeds the fair value, the second stepquantifies any impairment write-down by comparing thecurrent implied value of goodwill and the recorded goodwillbalance. Recoverability testing for equity investment goodwillis based on impairment analysis of the entire equityinvestment, using a combination of future cash flow analysisand consideration of pertinent business and economic factors.
An analysis completed upon the adoption of FAS 142 foundno impairment of any intangible assets. A review of intangibleassets completed in the fourth quarter of 2004 found noimpairment as of December 31, 2004. See Note 5 foradditional information on changes in the balances of intangibleassets.
Delivery CostsPass-through finished goods delivery costs reimbursed bycustomers are reported in sales, while an offsetting expense isincluded in cost of sales.
Delivery costs incurred by company-owned beer wholesalersare included in marketing, distribution and administrativeexpenses. These costs are considered marketing-related becausein addition to product delivery, drivers provide severalcustomer service functions to retailers.
Advertising and Promotional CostsAdvertising production costs are deferred and expensed the firsttime the advertisement is shown. Advertising media costs areexpensed as incurred. Advertising costs are recognized inmarketing, distribution and administrative expenses and totaled$806.7 million in both 2004 and 2003, and $821.7 million in2002. Sales promotion costs are recognized as a reduction ofnet sales when incurred, and totaled $535.7 million in 2004,$511.8 million in 2003, and $543.5 million in 2002.
Financial DerivativesAnheuser-Busch uses financial derivatives to mitigate thecompany’s exposure to volatility in commodity prices, interestrates, and foreign currency exchange rates. The companyhedges only exposures in the ordinary course of business andcompany policy prohibits holding or trading derivatives forprofit. All derivatives held by the company are designated ashedges at inception, with an expectation they will be highlyeffective in offsetting the associated underlying price exposures.The company requires liquidation of derivative positionswhenever it is determined that an underlying transaction willnot occur, with related gains or losses recognized in the incomestatement on liquidation. Commodity derivatives outstandingat December 31, 2004, all have initial terms of two years orless, and all hedged transactions are expected to occur withinthat timeframe.
47 _ 2004 Annual Report
Fixed AssetsFixed assets are carried at original cost less accumulateddepreciation, and include expenditures for new facilities as wellas those that increase the useful lives of existing facilities. Thecost of routine maintenance, repairs, and minor renewals isexpensed as incurred. Depreciation expense is recognized usingthe straight-line method based on the following weighted-average useful lives: buildings, 25 years; production machineryand equipment, 15 years; furniture and fixtures, 10 years;computer equipment, 3 years. When fixed assets are retired orsold, the book value is eliminated and any gain or loss ondisposition is recognized in cost of sales. The components ofplant and equipment as of December 31 are summarized below(in millions):
2004 2003
Land $ 278.9 $ 278.8Buildings 4,750.6 4,546.1Machinery and equipment 11,907.4 11,208.0Construction in progress 475.6 488.3
Plant and equipment, at cost 17,412.5 16,521.2Accumulated depreciation (8,565.1) (8,022.3)
Net plant and equipment $ 8,847.4 $ 8,498.9
Intangible AssetsAnheuser-Busch’s intangible assets consist of trademarks, beerdistribution rights, and goodwill.
Trademarks include purchased trademarks, brand names,logos, slogans, or other recognizable symbols associated withthe company’s products. Trademarks are not amortized becausethey have indefinite lives. Domestic beer distribution rights areassociated with company-owned beer wholesale operations andrepresent the exclusive ability to sell the company’s products indefined geographic areas. The carrying values of these rightshave indefinite lives and are not being amortized, primarily dueto the company’s intent to operate its wholesalerships inperpetuity and the lives not being contractually or statutorilylimited. International distribution rights relate to operations inthe United Kingdom and China and are being amortized overtheir respective useful lives. The company analyzes itstrademarks and product distribution rights for potentialimpairment annually, based on projected future cash flows and observation of independent beer wholesaler exchangetransactions.
The company recognizes the excess of the cost of acquiredbusinesses over the fair value of net assets as goodwill.Goodwill related to consolidated businesses is included inintangible assets on the balance sheet. Goodwill associated withthe company’s equity investments in Grupo Modelo and CCU(prior to the sale of CCU in 2004) is included in investmentsin affiliated companies. Goodwill is reviewed for impairment atleast annually, with ongoing recoverability based on applicableoperating unit performance and consideration of significantevents or changes in the overall business environment.
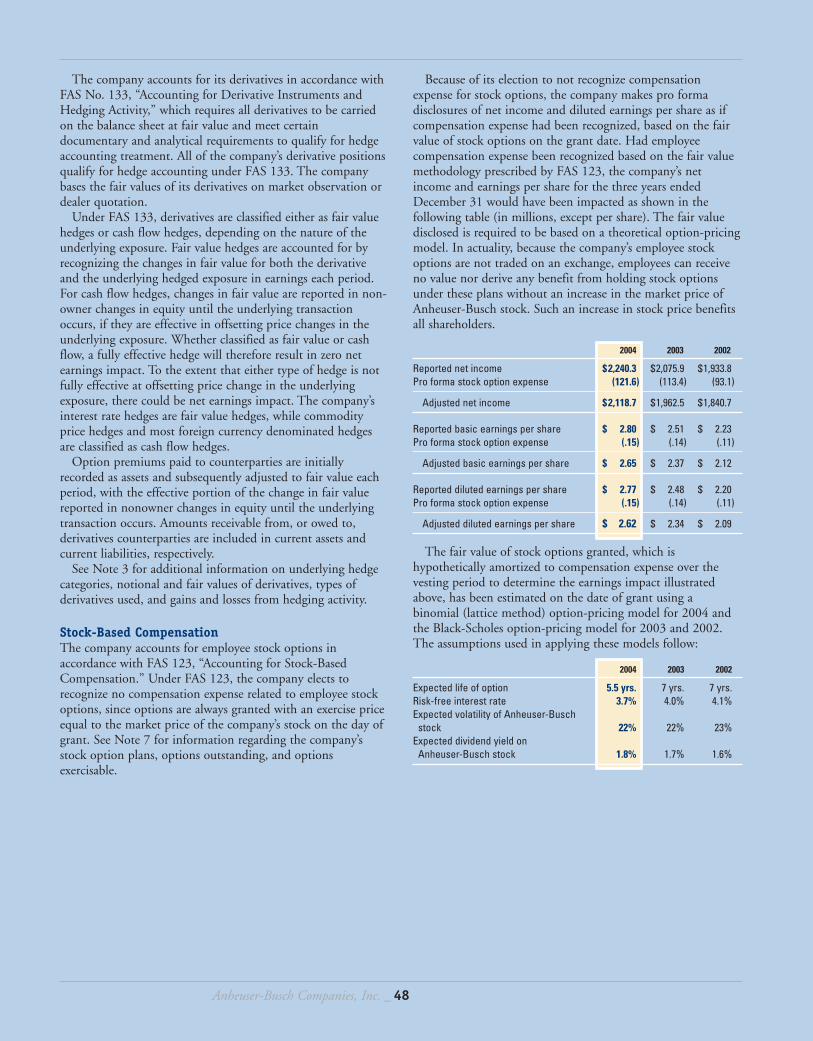
Anheuser-Busch Companies, Inc. _ 48
The company accounts for its derivatives in accordance withFAS No. 133, “Accounting for Derivative Instruments andHedging Activity,” which requires all derivatives to be carriedon the balance sheet at fair value and meet certaindocumentary and analytical requirements to qualify for hedgeaccounting treatment. All of the company’s derivative positionsqualify for hedge accounting under FAS 133. The companybases the fair values of its derivatives on market observation ordealer quotation.
Under FAS 133, derivatives are classified either as fair valuehedges or cash flow hedges, depending on the nature of theunderlying exposure. Fair value hedges are accounted for byrecognizing the changes in fair value for both the derivative and the underlying hedged exposure in earnings each period.For cash flow hedges, changes in fair value are reported in non-owner changes in equity until the underlying transactionoccurs, if they are effective in offsetting price changes in theunderlying exposure. Whether classified as fair value or cashflow, a fully effective hedge will therefore result in zero netearnings impact. To the extent that either type of hedge is notfully effective at offsetting price change in the underlyingexposure, there could be net earnings impact. The company’sinterest rate hedges are fair value hedges, while commodityprice hedges and most foreign currency denominated hedgesare classified as cash flow hedges.
Option premiums paid to counterparties are initiallyrecorded as assets and subsequently adjusted to fair value eachperiod, with the effective portion of the change in fair valuereported in nonowner changes in equity until the underlyingtransaction occurs. Amounts receivable from, or owed to,derivatives counterparties are included in current assets andcurrent liabilities, respectively.
See Note 3 for additional information on underlying hedgecategories, notional and fair values of derivatives, types ofderivatives used, and gains and losses from hedging activity.
Stock-Based CompensationThe company accounts for employee stock options inaccordance with FAS 123, “Accounting for Stock-BasedCompensation.” Under FAS 123, the company elects torecognize no compensation expense related to employee stockoptions, since options are always granted with an exercise priceequal to the market price of the company’s stock on the day ofgrant. See Note 7 for information regarding the company’sstock option plans, options outstanding, and optionsexercisable.
Because of its election to not recognize compensationexpense for stock options, the company makes pro formadisclosures of net income and diluted earnings per share as ifcompensation expense had been recognized, based on the fairvalue of stock options on the grant date. Had employeecompensation expense been recognized based on the fair valuemethodology prescribed by FAS 123, the company’s netincome and earnings per share for the three years endedDecember 31 would have been impacted as shown in thefollowing table (in millions, except per share). The fair valuedisclosed is required to be based on a theoretical option-pricingmodel. In actuality, because the company’s employee stockoptions are not traded on an exchange, employees can receiveno value nor derive any benefit from holding stock optionsunder these plans without an increase in the market price ofAnheuser-Busch stock. Such an increase in stock price benefitsall shareholders.
2004 2003 2002
Reported net income $2,240.3 $2,075.9 $1,933.8Pro forma stock option expense (121.6) (113.4) (93.1)
Adjusted net income $2,118.7 $1,962.5 $1,840.7
Reported basic earnings per share $ 2.80 $ 2.51 $ 2.23Pro forma stock option expense (.15) (.14) (.11)
Adjusted basic earnings per share $ 2.65 $ 2.37 $ 2.12
Reported diluted earnings per share $ 2.77 $ 2.48 $ 2.20Pro forma stock option expense (.15) (.14) (.11)
Adjusted diluted earnings per share $ 2.62 $ 2.34 $ 2.09
The fair value of stock options granted, which ishypothetically amortized to compensation expense over thevesting period to determine the earnings impact illustratedabove, has been estimated on the date of grant using abinomial (lattice method) option-pricing model for 2004 andthe Black-Scholes option-pricing model for 2003 and 2002.The assumptions used in applying these models follow:
2004 2003 2002
Expected life of option 5.5 yrs. 7 yrs. 7 yrs.Risk-free interest rate 3.7% 4.0% 4.1%Expected volatility of Anheuser-Busch
stock 22% 22% 23%Expected dividend yield on
Anheuser-Busch stock 1.8% 1.7% 1.6%
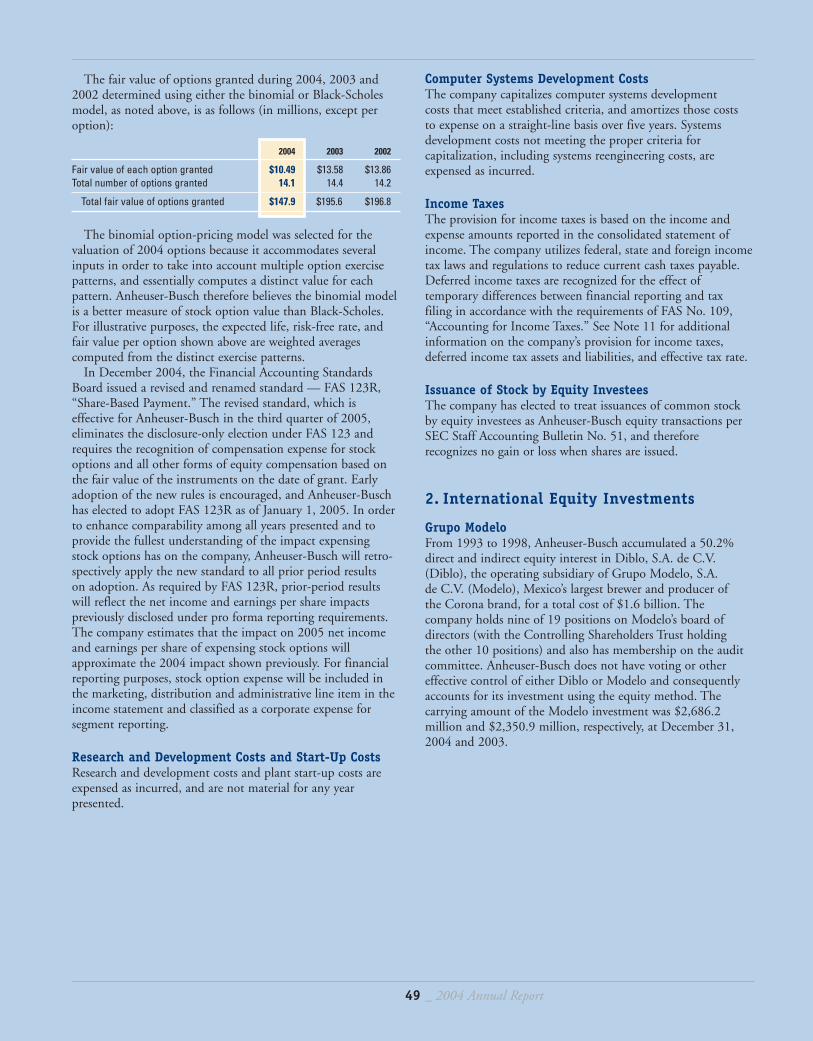
Computer Systems Development CostsThe company capitalizes computer systems development costs that meet established criteria, and amortizes those costs to expense on a straight-line basis over five years. Systemsdevelopment costs not meeting the proper criteria forcapitalization, including systems reengineering costs, areexpensed as incurred.
Income TaxesThe provision for income taxes is based on the income andexpense amounts reported in the consolidated statement ofincome. The company utilizes federal, state and foreign incometax laws and regulations to reduce current cash taxes payable.Deferred income taxes are recognized for the effect oftemporary differences between financial reporting and tax filing in accordance with the requirements of FAS No. 109,“Accounting for Income Taxes.” See Note 11 for additionalinformation on the company’s provision for income taxes,deferred income tax assets and liabilities, and effective tax rate.
Issuance of Stock by Equity InvesteesThe company has elected to treat issuances of common stockby equity investees as Anheuser-Busch equity transactions perSEC Staff Accounting Bulletin No. 51, and thereforerecognizes no gain or loss when shares are issued.
2. International Equity Investments
Grupo ModeloFrom 1993 to 1998, Anheuser-Busch accumulated a 50.2%direct and indirect equity interest in Diblo, S.A. de C.V.(Diblo), the operating subsidiary of Grupo Modelo, S.A. de C.V. (Modelo), Mexico’s largest brewer and producer of the Corona brand, for a total cost of $1.6 billion. Thecompany holds nine of 19 positions on Modelo’s board ofdirectors (with the Controlling Shareholders Trust holding the other 10 positions) and also has membership on the auditcommittee. Anheuser-Busch does not have voting or othereffective control of either Diblo or Modelo and consequentlyaccounts for its investment using the equity method. Thecarrying amount of the Modelo investment was $2,686.2million and $2,350.9 million, respectively, at December 31,2004 and 2003.
49 _ 2004 Annual Report
The fair value of options granted during 2004, 2003 and2002 determined using either the binomial or Black-Scholesmodel, as noted above, is as follows (in millions, except peroption):
2004 2003 2002
Fair value of each option granted $10.49 $13.58 $13.86Total number of options granted 14.1 14.4 14.2
Total fair value of options granted $147.9 $195.6 $196.8
The binomial option-pricing model was selected for thevaluation of 2004 options because it accommodates severalinputs in order to take into account multiple option exercisepatterns, and essentially computes a distinct value for eachpattern. Anheuser-Busch therefore believes the binomial modelis a better measure of stock option value than Black-Scholes.For illustrative purposes, the expected life, risk-free rate, andfair value per option shown above are weighted averagescomputed from the distinct exercise patterns.
In December 2004, the Financial Accounting StandardsBoard issued a revised and renamed standard — FAS 123R,“Share-Based Payment.” The revised standard, which iseffective for Anheuser-Busch in the third quarter of 2005,eliminates the disclosure-only election under FAS 123 andrequires the recognition of compensation expense for stockoptions and all other forms of equity compensation based onthe fair value of the instruments on the date of grant. Earlyadoption of the new rules is encouraged, and Anheuser-Buschhas elected to adopt FAS 123R as of January 1, 2005. In orderto enhance comparability among all years presented and toprovide the fullest understanding of the impact expensing stock options has on the company, Anheuser-Busch will retro-spectively apply the new standard to all prior period results on adoption. As required by FAS 123R, prior-period resultswill reflect the net income and earnings per share impactspreviously disclosed under pro forma reporting requirements.The company estimates that the impact on 2005 net incomeand earnings per share of expensing stock options willapproximate the 2004 impact shown previously. For financialreporting purposes, stock option expense will be included inthe marketing, distribution and administrative line item in theincome statement and classified as a corporate expense forsegment reporting.
Research and Development Costs and Start-Up CostsResearch and development costs and plant start-up costs areexpensed as incurred, and are not material for any yearpresented.
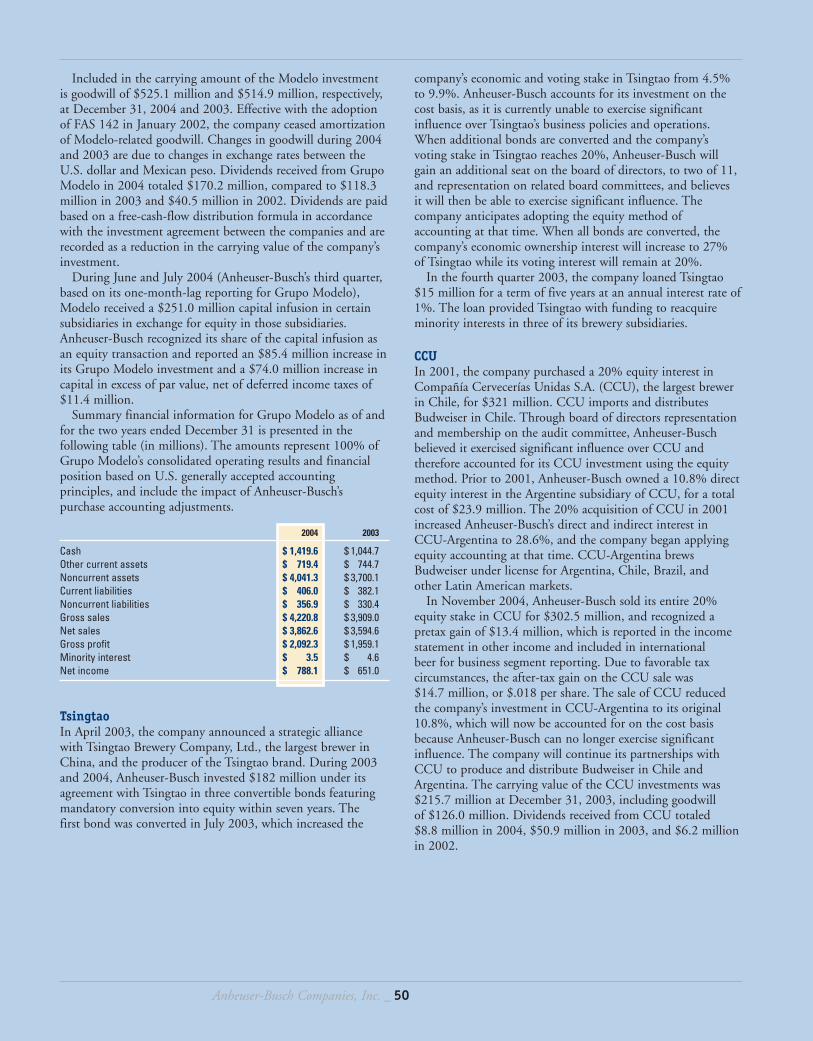
Anheuser-Busch Companies, Inc. _ 50
company’s economic and voting stake in Tsingtao from 4.5%to 9.9%. Anheuser-Busch accounts for its investment on thecost basis, as it is currently unable to exercise significantinfluence over Tsingtao’s business policies and operations.When additional bonds are converted and the company’svoting stake in Tsingtao reaches 20%, Anheuser-Busch willgain an additional seat on the board of directors, to two of 11,and representation on related board committees, and believesit will then be able to exercise significant influence. Thecompany anticipates adopting the equity method ofaccounting at that time. When all bonds are converted, thecompany’s economic ownership interest will increase to 27%of Tsingtao while its voting interest will remain at 20%.
In the fourth quarter 2003, the company loaned Tsingtao$15 million for a term of five years at an annual interest rate of1%. The loan provided Tsingtao with funding to reacquireminority interests in three of its brewery subsidiaries.
CCUIn 2001, the company purchased a 20% equity interest inCompañía Cervecerías Unidas S.A. (CCU), the largest brewerin Chile, for $321 million. CCU imports and distributesBudweiser in Chile. Through board of directors representationand membership on the audit committee, Anheuser-Buschbelieved it exercised significant influence over CCU andtherefore accounted for its CCU investment using the equitymethod. Prior to 2001, Anheuser-Busch owned a 10.8% directequity interest in the Argentine subsidiary of CCU, for a totalcost of $23.9 million. The 20% acquisition of CCU in 2001increased Anheuser-Busch’s direct and indirect interest inCCU-Argentina to 28.6%, and the company began applyingequity accounting at that time. CCU-Argentina brewsBudweiser under license for Argentina, Chile, Brazil, and other Latin American markets.
In November 2004, Anheuser-Busch sold its entire 20%equity stake in CCU for $302.5 million, and recognized apretax gain of $13.4 million, which is reported in the incomestatement in other income and included in international beer for business segment reporting. Due to favorable taxcircumstances, the after-tax gain on the CCU sale was $14.7 million, or $.018 per share. The sale of CCU reducedthe company’s investment in CCU-Argentina to its original10.8%, which will now be accounted for on the cost basisbecause Anheuser-Busch can no longer exercise significantinfluence. The company will continue its partnerships withCCU to produce and distribute Budweiser in Chile andArgentina. The carrying value of the CCU investments was$215.7 million at December 31, 2003, including goodwill of $126.0 million. Dividends received from CCU totaled $8.8 million in 2004, $50.9 million in 2003, and $6.2 millionin 2002.
Included in the carrying amount of the Modelo investmentis goodwill of $525.1 million and $514.9 million, respectively,at December 31, 2004 and 2003. Effective with the adoptionof FAS 142 in January 2002, the company ceased amortizationof Modelo-related goodwill. Changes in goodwill during 2004and 2003 are due to changes in exchange rates between theU.S. dollar and Mexican peso. Dividends received from GrupoModelo in 2004 totaled $170.2 million, compared to $118.3million in 2003 and $40.5 million in 2002. Dividends are paidbased on a free-cash-flow distribution formula in accordancewith the investment agreement between the companies and arerecorded as a reduction in the carrying value of the company’sinvestment.
During June and July 2004 (Anheuser-Busch’s third quarter,based on its one-month-lag reporting for Grupo Modelo),Modelo received a $251.0 million capital infusion in certainsubsidiaries in exchange for equity in those subsidiaries.Anheuser-Busch recognized its share of the capital infusion asan equity transaction and reported an $85.4 million increase inits Grupo Modelo investment and a $74.0 million increase incapital in excess of par value, net of deferred income taxes of$11.4 million.
Summary financial information for Grupo Modelo as of andfor the two years ended December 31 is presented in thefollowing table (in millions). The amounts represent 100% ofGrupo Modelo’s consolidated operating results and financialposition based on U.S. generally accepted accountingprinciples, and include the impact of Anheuser-Busch’spurchase accounting adjustments.
2004 2003
Cash $ 1,419.6 $ 1,044.7Other current assets $ 719.4 $ 744.7Noncurrent assets $ 4,041.3 $ 3,700.1Current liabilities $ 406.0 $ 382.1Noncurrent liabilities $ 356.9 $ 330.4Gross sales $ 4,220.8 $ 3,909.0Net sales $ 3,862.6 $ 3,594.6Gross profit $ 2,092.3 $ 1,959.1Minority interest $ 3.5 $ 4.6Net income $ 788.1 $ 651.0
TsingtaoIn April 2003, the company announced a strategic alliancewith Tsingtao Brewery Company, Ltd., the largest brewer inChina, and the producer of the Tsingtao brand. During 2003and 2004, Anheuser-Busch invested $182 million under itsagreement with Tsingtao in three convertible bonds featuringmandatory conversion into equity within seven years. The first bond was converted in July 2003, which increased the
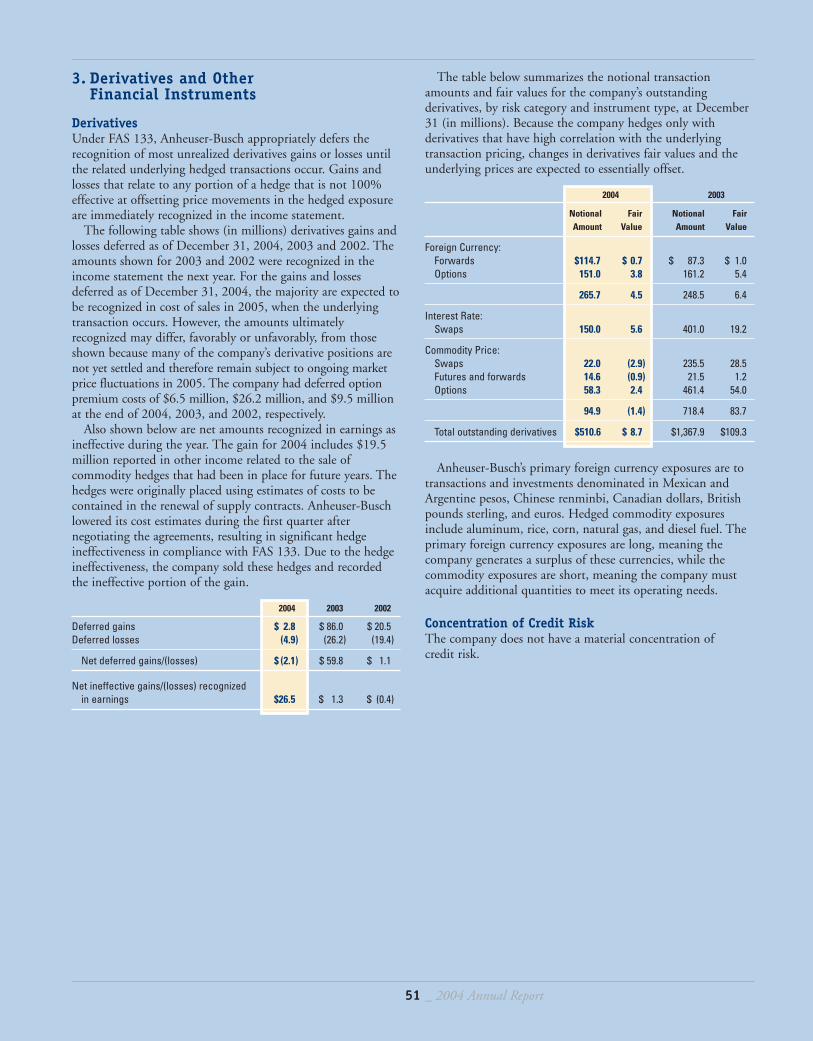
51 _ 2004 Annual Report
3. Derivatives and Other Financial Instruments
DerivativesUnder FAS 133, Anheuser-Busch appropriately defers therecognition of most unrealized derivatives gains or losses untilthe related underlying hedged transactions occur. Gains andlosses that relate to any portion of a hedge that is not 100%effective at offsetting price movements in the hedged exposureare immediately recognized in the income statement.
The following table shows (in millions) derivatives gains andlosses deferred as of December 31, 2004, 2003 and 2002. Theamounts shown for 2003 and 2002 were recognized in theincome statement the next year. For the gains and lossesdeferred as of December 31, 2004, the majority are expected tobe recognized in cost of sales in 2005, when the underlyingtransaction occurs. However, the amounts ultimatelyrecognized may differ, favorably or unfavorably, from thoseshown because many of the company’s derivative positions arenot yet settled and therefore remain subject to ongoing marketprice fluctuations in 2005. The company had deferred optionpremium costs of $6.5 million, $26.2 million, and $9.5 millionat the end of 2004, 2003, and 2002, respectively.
Also shown below are net amounts recognized in earnings asineffective during the year. The gain for 2004 includes $19.5million reported in other income related to the sale ofcommodity hedges that had been in place for future years. Thehedges were originally placed using estimates of costs to becontained in the renewal of supply contracts. Anheuser-Buschlowered its cost estimates during the first quarter afternegotiating the agreements, resulting in significant hedgeineffectiveness in compliance with FAS 133. Due to the hedgeineffectiveness, the company sold these hedges and recordedthe ineffective portion of the gain.
2004 2003 2002
Deferred gains $ 2.8 $ 86.0 $ 20.5Deferred losses (4.9) (26.2) (19.4)
Net deferred gains/(losses) $ (2.1) $ 59.8 $ 1.1
Net ineffective gains/(losses) recognized in earnings $26.5 $ 1.3 $ (0.4)
The table below summarizes the notional transactionamounts and fair values for the company’s outstandingderivatives, by risk category and instrument type, at December31 (in millions). Because the company hedges only withderivatives that have high correlation with the underlyingtransaction pricing, changes in derivatives fair values and theunderlying prices are expected to essentially offset.
2004 2003
Notional Fair Notional FairAmount Value Amount Value
Foreign Currency:Forwards $114.7 $ 0.7 $ 87.3 $ 1.0Options 151.0 3.8 161.2 5.4
265.7 4.5 248.5 6.4
Interest Rate: Swaps 150.0 5.6 401.0 19.2
Commodity Price:Swaps 22.0 (2.9) 235.5 28.5Futures and forwards 14.6 (0.9) 21.5 1.2Options 58.3 2.4 461.4 54.0
94.9 (1.4) 718.4 83.7
Total outstanding derivatives $510.6 $ 8.7 $1,367.9 $109.3
Anheuser-Busch’s primary foreign currency exposures are totransactions and investments denominated in Mexican andArgentine pesos, Chinese renminbi, Canadian dollars, Britishpounds sterling, and euros. Hedged commodity exposuresinclude aluminum, rice, corn, natural gas, and diesel fuel. Theprimary foreign currency exposures are long, meaning thecompany generates a surplus of these currencies, while thecommodity exposures are short, meaning the company mustacquire additional quantities to meet its operating needs.
Concentration of Credit RiskThe company does not have a material concentration of credit risk.
Anheuser-Busch Companies, Inc. _ 52
Nonderivative Financial InstrumentsNonderivative financial instruments included in the balancesheet are cash, accounts receivable, accounts payable, and long-term debt. Accounts receivable include allowances for doubtfulaccounts of $12.5 million and $6.6 million, at December 31,2004 and 2003, respectively. The fair value of long-term debt,excluding commercial paper, and estimated based on futurecash flows discounted at interest rates currently available to thecompany for debt with similar maturities and characteristics,was $7.7 billion and $7.2 billion at December 31, 2004 and2003, respectively.
4. Harbin Group Acquisition
During the second quarter 2004, the company initiated atender offer for all the outstanding shares of Harbin BreweryGroup, the fourth-largest brewer in China, and completed thepurchase by the end of July 2004. Anheuser-Busch beganincluding operating results for Harbin in the company’sconsolidated results on a one-month-lag basis beginning withthe third quarter of 2004. Harbin results are not material tothe company’s operations for any period shown.
Anheuser-Busch paid a total of $694 million for one billionoutstanding shares representing 100% of Harbin, with thepurchase price allocated as shown below (in millions).
Description Allocation
Working capital deficit $ (27.9)Property, plant and equipment 173.1Identifiable intangible assets 59.8Goodwill 613.8Long-term debt assumed (118.4)Net other liabilities (6.6)
$ 693.8
An independent appraiser performed the valuation ofacquired assets and liabilities. Identifiable intangible assetsconsist of trademarks valued at $44.4 million and a wholesalerdistribution network valued at $15.4 million. The Harbin debtassumed is a portfolio of small-scale renminbi-denominatedloans with a weighted average interest rate of 5.57% andmaturities ranging from 2005 through 2009, with the majoritydue in 2005. None of the Harbin goodwill is deductible for taxpurposes.
5. Intangible Assets
Upon adoption of FAS 142 in 2002, the company reclassifiedout of goodwill, purchased beer distribution rights that metspecific criteria for distinct asset recognition. The company alsoreclassified into goodwill certain miscellaneous intangible assetsthat did not meet the criteria for separate asset recognition.The following table shows the activity in goodwill and beerdistribution rights since the adoption of FAS 142 (in millions).
BeerDistribution
Trademarks Goodwill Rights
Balance at December 31, 2001 $ — $1,256.9 $ —Reclassification on adoption of FAS 142 — (151.4) 158.9
Domestic beer wholesaler acquisition — — 13.6
Amortization of international distribution rights — — (0.8)
Foreign currency translation and other — (80.1) 2.0
Balance at December 31, 2002 — 1,025.4 173.7
Domestic beer wholesaler acquisition — — 47.3
Domestic beer wholesaler disposition — — (1.0)
Amortization of international distribution rights — — (0.8)
Foreign currency translation and other — (35.5) 2.1
Balance at December 31, 2003 — 989.9 221.3
Domestic beer wholesaler acquisition — — 10.6
Disposition of domestic beer wholesaler equity investment — — (40.1)
Domestic beer wholesaler purchase price allocation — 21.2 —
Harbin acquisition 44.4 613.8 15.4CCU disposition — (126.0) —Amortization of international distribution rights — — (1.8)
Foreign currency translation and other — 10.3 1.5
Balance at December 31, 2004 $44.4 $1,509.2 $206.9
The international beer distribution rights have a combinedgross cost of $45.5 million and a remaining unamortizedbalance of $37.1 million at December 31, 2004. Rights in theUnited Kingdom are being amortized over a contractual life of32 years, through 2029 while the rights in China are beingamortized over seven years, through 2011. The companyexpects amortization expense of approximately $3 million peryear related to international distribution rights over the nextfive years.
53 _ 2004 Annual Report
The following table provides a reconciliation between thefunded status of single-employer defined benefit plans and theprepaid pension cost asset recorded on the balance sheet for thetwo years ended December 31 (in millions):
2004 2003
Funded status — plan assets (less than) projected benefit obligation $ (705.9) $(640.5)
Unrecognized net actuarial loss 1,087.3 964.2Unamortized prior service cost 146.4 113.2
Prepaid pension cost asset $ 527.8 $ 436.9
The following tables present changes in the projected benefit obligation, changes in the fair value of plan assets, and a comparison of plan assets and the accumulated benefitobligation for single-employer defined benefit plans for the two years ended December 31 (in millions):
2004 2003
Projected benefit obligation, beginning of year $2,575.6 $2,323.6Service cost 86.6 74.7Interest cost 159.2 151.9Plan amendments 56.1 13.3Actuarial loss 183.4 175.4Foreign currency translation 4.1 4.0Benefits paid (171.0) (167.3)
Projected benefit obligation, end of year $2,894.0 $2,575.6
2004 2003
Fair value of plan assets, beginning of year $1,935.1 $1,731.7 Actual return on plan assets 211.8 272.6Employer contributions 210.0 95.7Foreign currency translation 2.2 2.4Benefits paid (171.0) (167.3)
Fair value of plan assets, end of year $2,188.1 $1,935.1
2004 2003
Plans with assets in excess of accumulated benefit obligation:Accumulated benefit obligation $ — $ (91.6) Plan assets — 94.6
Assets exceeding accumulated benefit obligation — 3.0
Plans with accumulated benefit obligationin excess of assets:Accumulated benefit obligation (2,622.0) (2,250.1)Plan assets 2,150.8 1,840.5
Accumulated benefit obligation exceeding assets (471.2) (409.6)
Net excess accumulated benefit obligation $ (471.2) $ (406.6)
6. Retirement Benefits
Pension PlansThe company has pension plans covering substantially all of its regular employees. Total pension expense for the three yearsended December 31 is presented in the following table (inmillions). Contributions to multiemployer plans in which thecompany and its subsidiaries participate are determined inaccordance with the provisions of negotiated labor contracts,based on employee hours or weeks worked. Pension expenserecognized for multiemployer and defined contribution plansequals required cash contributions for all years shown.
2004 2003 2002
Single-employer defined benefit plans $118.6 $ 73.7 $43.5Multiemployer plans 16.8 16.8 16.9Defined contribution plans 18.9 18.4 17.8
Total pension expense $154.3 $108.9 $78.2
Net annual pension expense for single-employer definedbenefit plans was composed of the following for the three yearsended December 31 (in millions):
2004 2003 2002
Service cost (benefits earned during the year) $ 86.6 $ 74.7 $ 66.7
Interest cost on projected benefit obligation 159.2 151.9 143.6
Assumed return on plan assets (189.2) (188.9) (194.5)Amortization of prior service cost and net actuarial losses 62.0 36.0 27.7
Net annual pension expense $ 118.6 $ 73.7 $ 43.5
The key actuarial assumptions used in determining theannual pension expense and funded status for single-employerdefined benefit plans for the three years ended December 31follow. The measurement date for the company’s pensionaccounting is October 1.
2004 2003 2002
Annual expense:Discount rate 6.25% 6.75% 7.25%Long-term rate of return on plan assets 8.50% 8.50% 9.25%Wtd. avg. rate of compensation increase 4.25% 4.25% 4.75%
Funded status:Discount rate 6.0% 6.25% 6.75%Wtd. avg. rate of compensation increase 4.25% 4.25% 4.75%
Following is a summary of the impact on 2005 annualpension expense of a 1% change in actuarial assumptions (inmillions). Brackets indicate annual pension expense would bereduced. Modification of these assumptions does not impactthe company’s pension funding requirements.
Impact of Impact of Assumption 2005 Rate 1% Increase 1% Decrease
Long-term asset return 8.50% $(23.1) $ 23.1Discount rate 6.0% $(28.1) $ 30.5Salary growth rate 4.25% $ 21.0 $(18.6)
Anheuser-Busch Companies, Inc. _ 54
Recognition of a minimum pension liability in nonownerchanges in equity is necessary whenever the accumulatedpension benefit obligation exceeds plan assets. Recording aminimum pension liability has no impact on the results ofoperations or cash flows. Summarized in the following table arethe components of the company’s minimum pension liabilityfor the two years ended December 31 (in millions):
2004 2003
Minimum pension liability — domestic plans $(961.7) $(807.9) Minimum pension liability — equity investments (42.4) (31.9)Intangible asset — unrecognized prior service costs 150.8 112.2Deferred income taxes 336.3 274.6
Net minimum pension liability $(517.0) $(453.0)
Required funding for the company’s defined benefit pensionplans is determined in accordance with guidelines set forth inthe federal Employee Retirement Income Security Act(ERISA). The company will make required pensioncontributions totaling $64 million for all plans in 2005.Additional contributions to enhance the funded status ofpension plans can be made at the company’s discretion, andAnheuser-Busch made accelerated contributions of $187million, $75 million and $201 million in 2004, 2003 and2002, respectively. Following is information regarding theallocation of the company’s pension plan assets as of December31, 2004 and 2003, target allocation for 2005, and weighted-average expected long-term rates of return by asset category.
Percentage of Percentage of Target Asset Wtd Avg ExpectedPlan Assets at Plan Assets at Allocation for Long-Term
Asset Category Dec. 31, 2003 Dec. 31, 2004 2005 Rate of ReturnEquity securities 69% 69% 68% 10.0%Debt securities 27% 27% 27% 5.0%Real estate 4% 4% 5% 7.0%
Total 100% 100% 100% 8.5%
Target asset allocations are intended to achieve a desired totalasset return over the long term, with an acceptable level of riskin the shorter term. Risk is measured in terms of likelyvolatility of annual investment returns, pension expense, andfunding requirements. Expected returns, risk, and correlationamong asset classes are based on historical data and investmentadvisor input.
The assumed rate of return is consistent with Anheuser-Busch’s long-term investment return objective, which enablesthe company to provide competitive and secure employeeretirement pension benefits. The company desires to minimizeunfunded pension liabilities, while balancing expected long-term returns and short-term volatility.
The company assumes prudent levels of risk to meet overallpension investment goals. Risk levels are managed throughformal and written investment guidelines. Portfolio risk ismanaged by having well-defined long-term strategic assetallocation targets. The company avoids tactical asset allocationand market timing and has established disciplined rebalancingpolicies to ensure asset allocations remain close to targets. Thecompany’s asset allocations are designed to provide broadmarket diversification, which reduces exposure to individualcompanies, industries and sectors of the market and reducesoverhead costs. With the exception of the U.S. government andits agencies, investment exposure to any single entity is limitedto a maximum 5% of any single fund. Pension assets do notinclude any direct investment in Anheuser-Busch debt orequity securities.
Options and futures are used to hedge exposure to foreigncurrency denominated stocks and securitize cash in investmentportfolios. By policy, derivatives used must be simple structureswith high liquidity and be either exchange-traded or executedwith highly-rated counterparties. Leveraged transactions, shortselling, illiquid derivative instruments, and margin transactionsare prohibited.
Postretirement Health Care and Insurance BenefitsThe company provides certain health care and life insurancebenefits to eligible retired employees. Participants must have 10years of continuous service after reaching age 45 to becomeeligible for retiree health care benefits. Employees becomeeligible for full retiree health care benefits after achievingspecific age and total years of service requirements, based onhire date.
Net periodic postretirement benefits expense for companyhealth care and life insurance plans was comprised of thefollowing for the three years ended December 31 (in millions).During 2004, Anheuser-Busch began recognizing the estimatedimpact of the Medicare Prescription Drug Improvement andModernization Act of 2003, which provides federal paymentsto sponsors of retiree health care plans, such as Anheuser-Busch. As a result of the Act, the company’s accumulatedpostretirement benefits obligation was reduced $40.1 millionon adoption, which is accounted for as an actuarial gain andamortized over the remaining service life of participatingemployees. Additionally, applying the Act reduced retireehealth care expense by $7.3 million in 2004.
2004 2003 2002
Service cost $ 22.3 $ 19.7 $ 19.8Interest cost on accumulated
postretirement benefits obligation 34.8 37.9 33.0Amortization of prior service benefit (11.4) (11.5) (11.6)Amortization of actuarial loss/(gain) 4.2 2.3 (3.6)
Net periodic postretirementbenefits expense $ 49.9 $ 48.4 $ 37.6
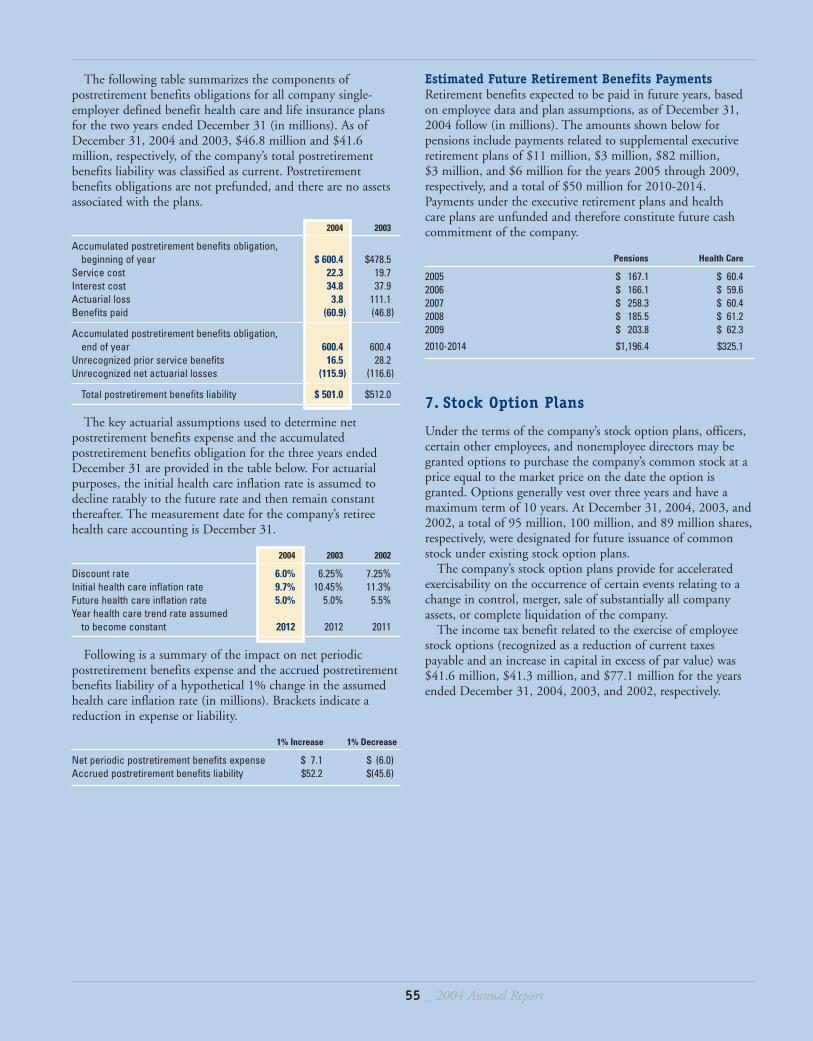
55 _ 2004 Annual Report
Estimated Future Retirement Benefits PaymentsRetirement benefits expected to be paid in future years, basedon employee data and plan assumptions, as of December 31,2004 follow (in millions). The amounts shown below forpensions include payments related to supplemental executiveretirement plans of $11 million, $3 million, $82 million, $3 million, and $6 million for the years 2005 through 2009,respectively, and a total of $50 million for 2010-2014.Payments under the executive retirement plans and health care plans are unfunded and therefore constitute future cashcommitment of the company.
Pensions Health Care
2005 $ 167.1 $ 60.42006 $ 166.1 $ 59.62007 $ 258.3 $ 60.42008 $ 185.5 $ 61.22009 $ 203.8 $ 62.3
2010-2014 $1,196.4 $325.1
7. Stock Option Plans
Under the terms of the company’s stock option plans, officers,certain other employees, and nonemployee directors may begranted options to purchase the company’s common stock at aprice equal to the market price on the date the option isgranted. Options generally vest over three years and have amaximum term of 10 years. At December 31, 2004, 2003, and2002, a total of 95 million, 100 million, and 89 million shares,respectively, were designated for future issuance of commonstock under existing stock option plans.
The company’s stock option plans provide for acceleratedexercisability on the occurrence of certain events relating to achange in control, merger, sale of substantially all companyassets, or complete liquidation of the company.
The income tax benefit related to the exercise of employeestock options (recognized as a reduction of current taxespayable and an increase in capital in excess of par value) was$41.6 million, $41.3 million, and $77.1 million for the yearsended December 31, 2004, 2003, and 2002, respectively.
The following table summarizes the components ofpostretirement benefits obligations for all company single-employer defined benefit health care and life insurance plansfor the two years ended December 31 (in millions). As ofDecember 31, 2004 and 2003, $46.8 million and $41.6million, respectively, of the company’s total postretirementbenefits liability was classified as current. Postretirementbenefits obligations are not prefunded, and there are no assetsassociated with the plans.
2004 2003
Accumulated postretirement benefits obligation, beginning of year $ 600.4 $478.5
Service cost 22.3 19.7Interest cost 34.8 37.9Actuarial loss 3.8 111.1Benefits paid (60.9) (46.8)
Accumulated postretirement benefits obligation,end of year 600.4 600.4
Unrecognized prior service benefits 16.5 28.2Unrecognized net actuarial losses (115.9) (116.6)
Total postretirement benefits liability $ 501.0 $512.0
The key actuarial assumptions used to determine netpostretirement benefits expense and the accumulatedpostretirement benefits obligation for the three years endedDecember 31 are provided in the table below. For actuarialpurposes, the initial health care inflation rate is assumed todecline ratably to the future rate and then remain constantthereafter. The measurement date for the company’s retireehealth care accounting is December 31.
2004 2003 2002
Discount rate 6.0% 6.25% 7.25%Initial health care inflation rate 9.7% 10.45% 11.3%Future health care inflation rate 5.0% 5.0% 5.5%Year health care trend rate assumed
to become constant 2012 2012 2011
Following is a summary of the impact on net periodicpostretirement benefits expense and the accrued postretirementbenefits liability of a hypothetical 1% change in the assumedhealth care inflation rate (in millions). Brackets indicate areduction in expense or liability.
1% Increase 1% Decrease
Net periodic postretirement benefits expense $ 7.1 $ (6.0)Accrued postretirement benefits liability $52.2 $(45.6)
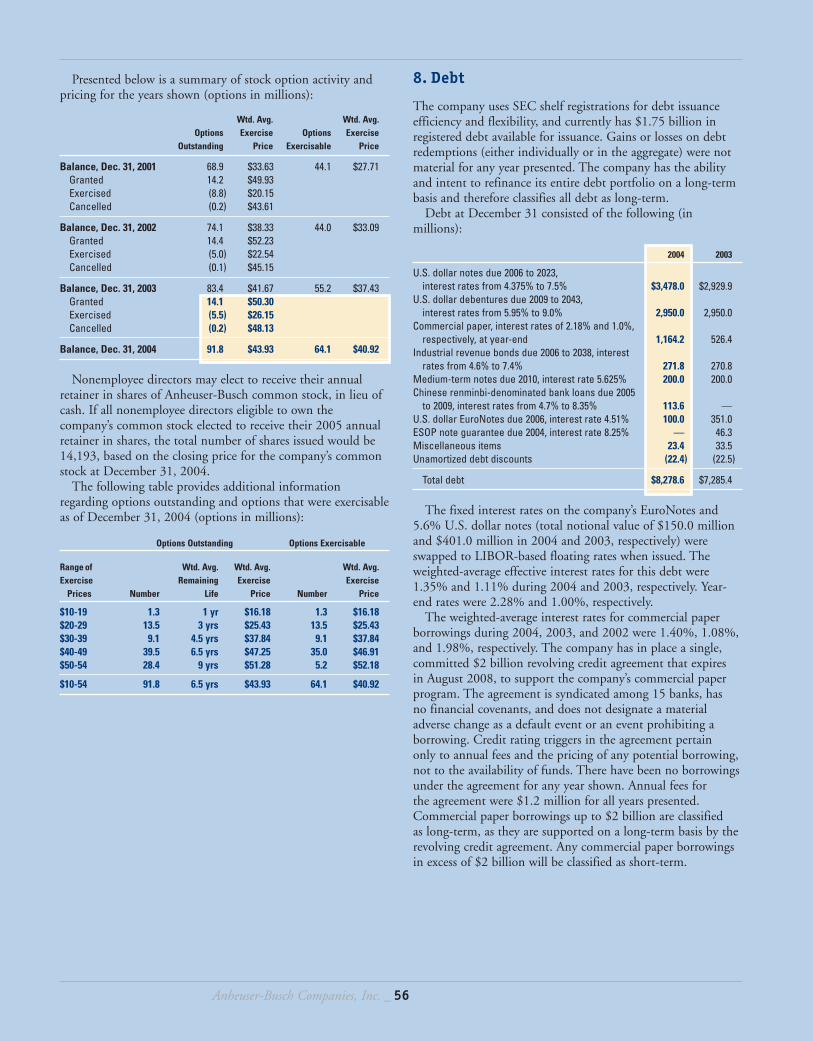
Anheuser-Busch Companies, Inc. _ 56
8. Debt
The company uses SEC shelf registrations for debt issuanceefficiency and flexibility, and currently has $1.75 billion inregistered debt available for issuance. Gains or losses on debtredemptions (either individually or in the aggregate) were notmaterial for any year presented. The company has the abilityand intent to refinance its entire debt portfolio on a long-termbasis and therefore classifies all debt as long-term.
Debt at December 31 consisted of the following (inmillions):
2004 2003
U.S. dollar notes due 2006 to 2023, interest rates from 4.375% to 7.5% $3,478.0 $2,929.9
U.S. dollar debentures due 2009 to 2043, interest rates from 5.95% to 9.0% 2,950.0 2,950.0
Commercial paper, interest rates of 2.18% and 1.0%, respectively, at year-end 1,164.2 526.4
Industrial revenue bonds due 2006 to 2038, interest rates from 4.6% to 7.4% 271.8 270.8
Medium-term notes due 2010, interest rate 5.625% 200.0 200.0Chinese renminbi-denominated bank loans due 2005
to 2009, interest rates from 4.7% to 8.35% 113.6 —U.S. dollar EuroNotes due 2006, interest rate 4.51% 100.0 351.0ESOP note guarantee due 2004, interest rate 8.25% — 46.3Miscellaneous items 23.4 33.5Unamortized debt discounts (22.4) (22.5)
Total debt $8,278.6 $7,285.4
The fixed interest rates on the company’s EuroNotes and5.6% U.S. dollar notes (total notional value of $150.0 millionand $401.0 million in 2004 and 2003, respectively) wereswapped to LIBOR-based floating rates when issued. Theweighted-average effective interest rates for this debt were1.35% and 1.11% during 2004 and 2003, respectively. Year-end rates were 2.28% and 1.00%, respectively.
The weighted-average interest rates for commercial paperborrowings during 2004, 2003, and 2002 were 1.40%, 1.08%,and 1.98%, respectively. The company has in place a single,committed $2 billion revolving credit agreement that expires in August 2008, to support the company’s commercial paperprogram. The agreement is syndicated among 15 banks, has no financial covenants, and does not designate a materialadverse change as a default event or an event prohibiting aborrowing. Credit rating triggers in the agreement pertain only to annual fees and the pricing of any potential borrowing,not to the availability of funds. There have been no borrowingsunder the agreement for any year shown. Annual fees for the agreement were $1.2 million for all years presented.Commercial paper borrowings up to $2 billion are classified as long-term, as they are supported on a long-term basis by therevolving credit agreement. Any commercial paper borrowingsin excess of $2 billion will be classified as short-term.
Presented below is a summary of stock option activity andpricing for the years shown (options in millions):
Wtd. Avg. Wtd. Avg.Options Exercise Options Exercise
Outstanding Price Exercisable Price
Balance, Dec. 31, 2001 68.9 $33.63 44.1 $27.71Granted 14.2 $49.93Exercised (8.8) $20.15Cancelled (0.2) $43.61
Balance, Dec. 31, 2002 74.1 $38.33 44.0 $33.09Granted 14.4 $52.23Exercised (5.0) $22.54Cancelled (0.1) $45.15
Balance, Dec. 31, 2003 83.4 $41.67 55.2 $37.43Granted 14.1 $50.30Exercised (5.5) $26.15Cancelled (0.2) $48.13
Balance, Dec. 31, 2004 91.8 $43.93 64.1 $40.92
Nonemployee directors may elect to receive their annualretainer in shares of Anheuser-Busch common stock, in lieu ofcash. If all nonemployee directors eligible to own thecompany’s common stock elected to receive their 2005 annualretainer in shares, the total number of shares issued would be14,193, based on the closing price for the company’s commonstock at December 31, 2004.
The following table provides additional informationregarding options outstanding and options that were exercisableas of December 31, 2004 (options in millions):
Options Outstanding Options Exercisable
Range of Wtd. Avg. Wtd. Avg. Wtd. Avg.Exercise Remaining Exercise Exercise
Prices Number Life Price Number Price
$10-19 1.3 1 yr $16.18 1.3 $16.18$20-29 13.5 3 yrs $25.43 13.5 $25.43$30-39 9.1 4.5 yrs $37.84 9.1 $37.84$40-49 39.5 6.5 yrs $47.25 35.0 $46.91$50-54 28.4 9 yrs $51.28 5.2 $52.18
$10-54 91.8 6.5 yrs $43.93 64.1 $40.92
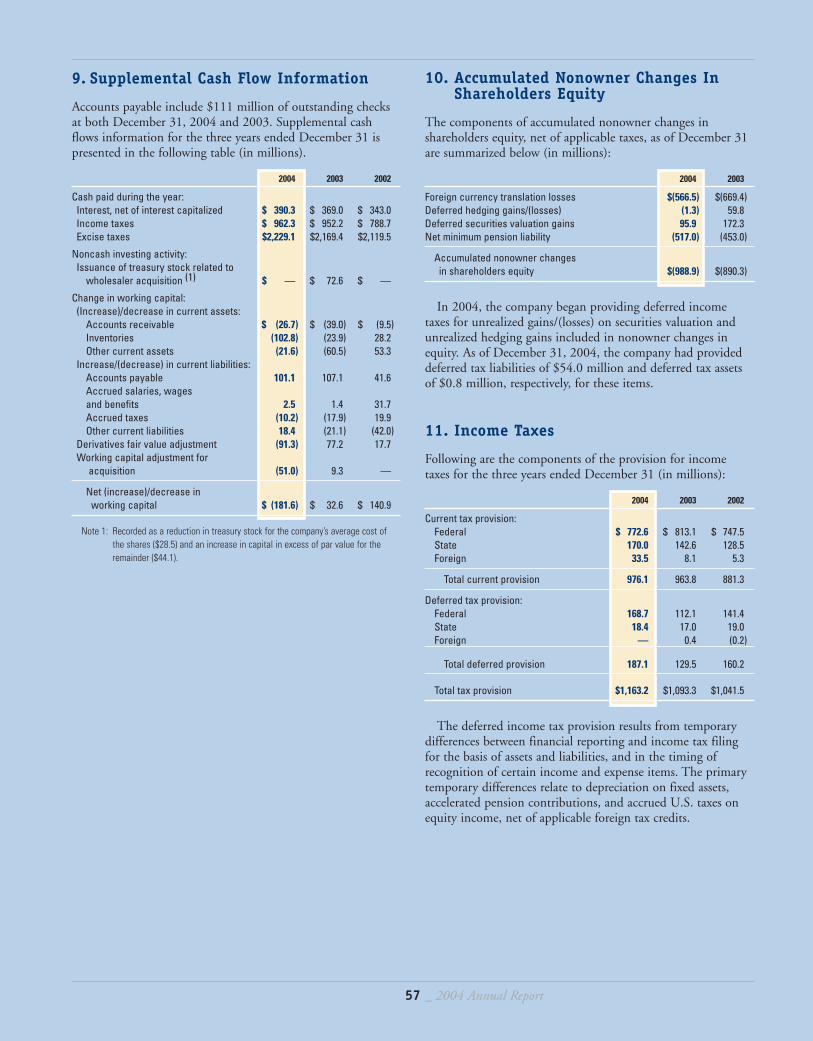
57 _ 2004 Annual Report
9. Supplemental Cash Flow Information
Accounts payable include $111 million of outstanding checksat both December 31, 2004 and 2003. Supplemental cashflows information for the three years ended December 31 ispresented in the following table (in millions).
2004 2003 2002
Cash paid during the year:Interest, net of interest capitalized $ 390.3 $ 369.0 $ 343.0Income taxes $ 962.3 $ 952.2 $ 788.7Excise taxes $2,229.1 $2,169.4 $2,119.5
Noncash investing activity:Issuance of treasury stock related to
wholesaler acquisition (1) $ — $ 72.6 $ —
Change in working capital:(Increase)/decrease in current assets:
Accounts receivable $ (26.7) $ (39.0) $ (9.5)Inventories (102.8) (23.9) 28.2Other current assets (21.6) (60.5) 53.3
Increase/(decrease) in current liabilities:Accounts payable 101.1 107.1 41.6Accrued salaries, wages and benefits 2.5 1.4 31.7Accrued taxes (10.2) (17.9) 19.9Other current liabilities 18.4 (21.1) (42.0)
Derivatives fair value adjustment (91.3) 77.2 17.7Working capital adjustment for
acquisition (51.0) 9.3 —
Net (increase)/decrease in working capital $ (181.6) $ 32.6 $ 140.9
Note 1: Recorded as a reduction in treasury stock for the company’s average cost of the shares ($28.5) and an increase in capital in excess of par value for theremainder ($44.1).
10. Accumulated Nonowner Changes In Shareholders Equity
The components of accumulated nonowner changes inshareholders equity, net of applicable taxes, as of December 31are summarized below (in millions):
2004 2003
Foreign currency translation losses $(566.5) $(669.4)Deferred hedging gains/(losses) (1.3) 59.8Deferred securities valuation gains 95.9 172.3Net minimum pension liability (517.0) (453.0)
Accumulated nonowner changes in shareholders equity $(988.9) $(890.3)
In 2004, the company began providing deferred incometaxes for unrealized gains/(losses) on securities valuation andunrealized hedging gains included in nonowner changes inequity. As of December 31, 2004, the company had provideddeferred tax liabilities of $54.0 million and deferred tax assetsof $0.8 million, respectively, for these items.
11. Income Taxes
Following are the components of the provision for incometaxes for the three years ended December 31 (in millions):
2004 2003 2002
Current tax provision:Federal $ 772.6 $ 813.1 $ 747.5State 170.0 142.6 128.5Foreign 33.5 8.1 5.3
Total current provision 976.1 963.8 881.3
Deferred tax provision:Federal 168.7 112.1 141.4State 18.4 17.0 19.0Foreign — 0.4 (0.2)
Total deferred provision 187.1 129.5 160.2
Total tax provision $1,163.2 $1,093.3 $1,041.5
The deferred income tax provision results from temporarydifferences between financial reporting and income tax filingfor the basis of assets and liabilities, and in the timing ofrecognition of certain income and expense items. The primarytemporary differences relate to depreciation on fixed assets,accelerated pension contributions, and accrued U.S. taxes onequity income, net of applicable foreign tax credits.
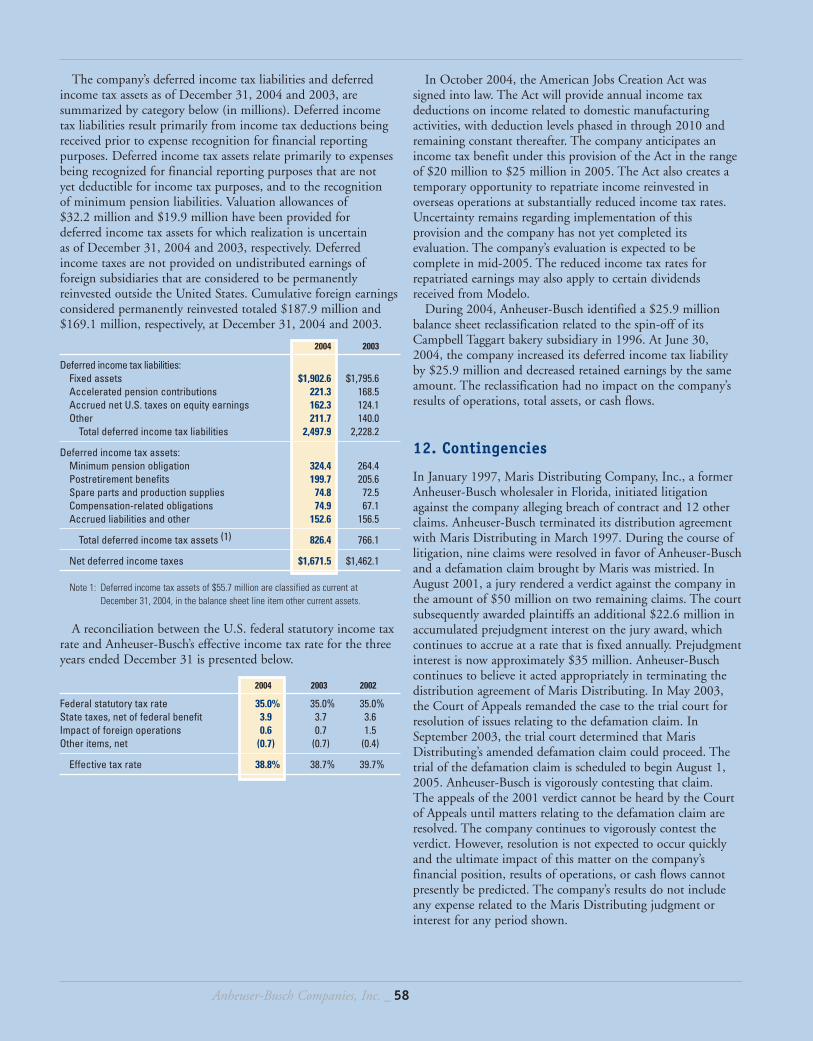
Anheuser-Busch Companies, Inc. _ 58
In October 2004, the American Jobs Creation Act wassigned into law. The Act will provide annual income taxdeductions on income related to domestic manufacturingactivities, with deduction levels phased in through 2010 andremaining constant thereafter. The company anticipates anincome tax benefit under this provision of the Act in the rangeof $20 million to $25 million in 2005. The Act also creates atemporary opportunity to repatriate income reinvested inoverseas operations at substantially reduced income tax rates.Uncertainty remains regarding implementation of thisprovision and the company has not yet completed itsevaluation. The company’s evaluation is expected to becomplete in mid-2005. The reduced income tax rates forrepatriated earnings may also apply to certain dividendsreceived from Modelo.
During 2004, Anheuser-Busch identified a $25.9 millionbalance sheet reclassification related to the spin-off of itsCampbell Taggart bakery subsidiary in 1996. At June 30, 2004, the company increased its deferred income tax liabilityby $25.9 million and decreased retained earnings by the sameamount. The reclassification had no impact on the company’sresults of operations, total assets, or cash flows.
12. Contingencies
In January 1997, Maris Distributing Company, Inc., a formerAnheuser-Busch wholesaler in Florida, initiated litigationagainst the company alleging breach of contract and 12 otherclaims. Anheuser-Busch terminated its distribution agreementwith Maris Distributing in March 1997. During the course oflitigation, nine claims were resolved in favor of Anheuser-Buschand a defamation claim brought by Maris was mistried. InAugust 2001, a jury rendered a verdict against the company inthe amount of $50 million on two remaining claims. The courtsubsequently awarded plaintiffs an additional $22.6 million inaccumulated prejudgment interest on the jury award, whichcontinues to accrue at a rate that is fixed annually. Prejudgmentinterest is now approximately $35 million. Anheuser-Buschcontinues to believe it acted appropriately in terminating thedistribution agreement of Maris Distributing. In May 2003,the Court of Appeals remanded the case to the trial court forresolution of issues relating to the defamation claim. InSeptember 2003, the trial court determined that MarisDistributing’s amended defamation claim could proceed. Thetrial of the defamation claim is scheduled to begin August 1,2005. Anheuser-Busch is vigorously contesting that claim. The appeals of the 2001 verdict cannot be heard by the Courtof Appeals until matters relating to the defamation claim areresolved. The company continues to vigorously contest theverdict. However, resolution is not expected to occur quicklyand the ultimate impact of this matter on the company’sfinancial position, results of operations, or cash flows cannotpresently be predicted. The company’s results do not includeany expense related to the Maris Distributing judgment orinterest for any period shown.
The company’s deferred income tax liabilities and deferredincome tax assets as of December 31, 2004 and 2003, aresummarized by category below (in millions). Deferred income tax liabilities result primarily from income tax deductions beingreceived prior to expense recognition for financial reportingpurposes. Deferred income tax assets relate primarily to expensesbeing recognized for financial reporting purposes that are not yet deductible for income tax purposes, and to the recognition of minimum pension liabilities. Valuation allowances of $32.2 million and $19.9 million have been provided for deferred income tax assets for which realization is uncertain as of December 31, 2004 and 2003, respectively. Deferredincome taxes are not provided on undistributed earnings offoreign subsidiaries that are considered to be permanentlyreinvested outside the United States. Cumulative foreign earningsconsidered permanently reinvested totaled $187.9 million and$169.1 million, respectively, at December 31, 2004 and 2003.
2004 2003
Deferred income tax liabilities:Fixed assets $1,902.6 $1,795.6Accelerated pension contributions 221.3 168.5Accrued net U.S. taxes on equity earnings 162.3 124.1Other 211.7 140.0
Total deferred income tax liabilities 2,497.9 2,228.2
Deferred income tax assets:Minimum pension obligation 324.4 264.4Postretirement benefits 199.7 205.6Spare parts and production supplies 74.8 72.5Compensation-related obligations 74.9 67.1Accrued liabilities and other 152.6 156.5
Total deferred income tax assets (1) 826.4 766.1
Net deferred income taxes $1,671.5 $1,462.1
Note 1: Deferred income tax assets of $55.7 million are classified as current at December 31, 2004, in the balance sheet line item other current assets.
A reconciliation between the U.S. federal statutory income taxrate and Anheuser-Busch’s effective income tax rate for the threeyears ended December 31 is presented below.
2004 2003 2002
Federal statutory tax rate 35.0% 35.0% 35.0%State taxes, net of federal benefit 3.9 3.7 3.6Impact of foreign operations 0.6 0.7 1.5Other items, net (0.7) (0.7) (0.4)
Effective tax rate 38.8% 38.7% 39.7%
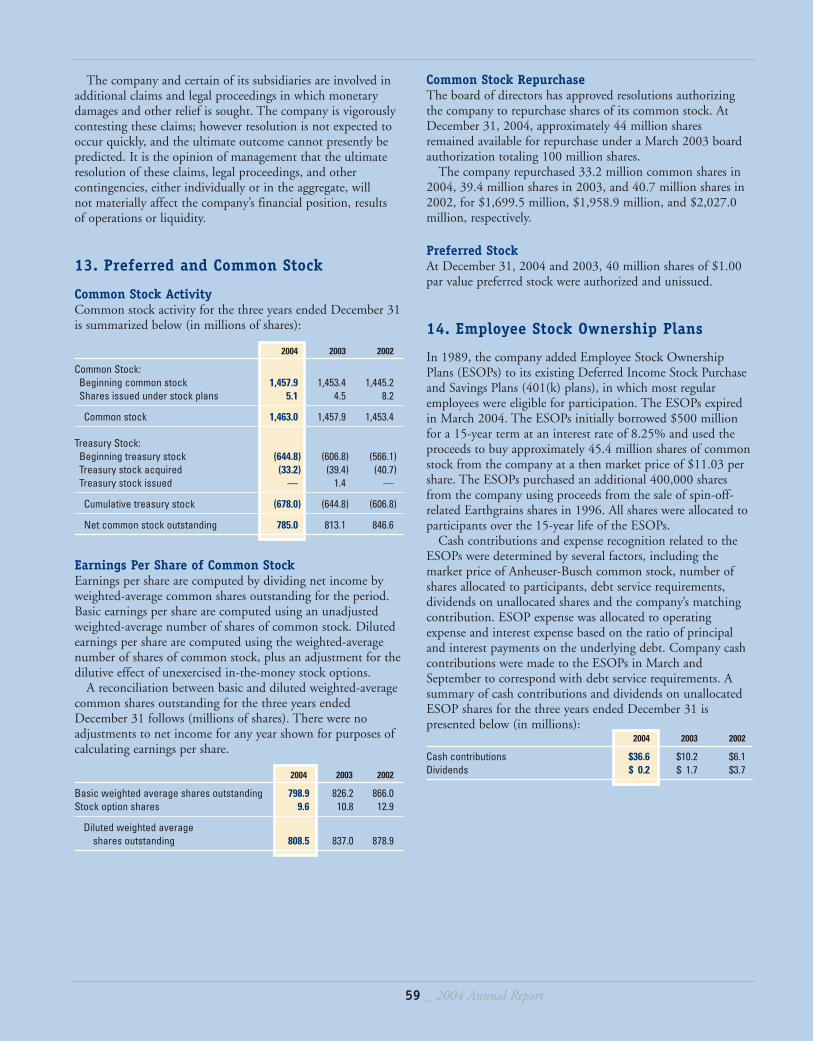
59 _ 2004 Annual Report
Common Stock RepurchaseThe board of directors has approved resolutions authorizingthe company to repurchase shares of its common stock. AtDecember 31, 2004, approximately 44 million sharesremained available for repurchase under a March 2003 boardauthorization totaling 100 million shares.
The company repurchased 33.2 million common shares in2004, 39.4 million shares in 2003, and 40.7 million shares in2002, for $1,699.5 million, $1,958.9 million, and $2,027.0million, respectively.
Preferred StockAt December 31, 2004 and 2003, 40 million shares of $1.00par value preferred stock were authorized and unissued.
14. Employee Stock Ownership Plans
In 1989, the company added Employee Stock OwnershipPlans (ESOPs) to its existing Deferred Income Stock Purchaseand Savings Plans (401(k) plans), in which most regularemployees were eligible for participation. The ESOPs expiredin March 2004. The ESOPs initially borrowed $500 millionfor a 15-year term at an interest rate of 8.25% and used theproceeds to buy approximately 45.4 million shares of commonstock from the company at a then market price of $11.03 pershare. The ESOPs purchased an additional 400,000 sharesfrom the company using proceeds from the sale of spin-off-related Earthgrains shares in 1996. All shares were allocated toparticipants over the 15-year life of the ESOPs.
Cash contributions and expense recognition related to theESOPs were determined by several factors, including themarket price of Anheuser-Busch common stock, number ofshares allocated to participants, debt service requirements,dividends on unallocated shares and the company’s matchingcontribution. ESOP expense was allocated to operatingexpense and interest expense based on the ratio of principaland interest payments on the underlying debt. Company cashcontributions were made to the ESOPs in March andSeptember to correspond with debt service requirements. Asummary of cash contributions and dividends on unallocatedESOP shares for the three years ended December 31 ispresented below (in millions):
2004 2003 2002
Cash contributions $36.6 $10.2 $6.1Dividends $ 0.2 $ 1.7 $3.7
The company and certain of its subsidiaries are involved inadditional claims and legal proceedings in which monetarydamages and other relief is sought. The company is vigorouslycontesting these claims; however resolution is not expected tooccur quickly, and the ultimate outcome cannot presently bepredicted. It is the opinion of management that the ultimateresolution of these claims, legal proceedings, and othercontingencies, either individually or in the aggregate, will not materially affect the company’s financial position, results of operations or liquidity.
13. Preferred and Common Stock
Common Stock ActivityCommon stock activity for the three years ended December 31is summarized below (in millions of shares):
2004 2003 2002
Common Stock:Beginning common stock 1,457.9 1,453.4 1,445.2Shares issued under stock plans 5.1 4.5 8.2
Common stock 1,463.0 1,457.9 1,453.4
Treasury Stock:Beginning treasury stock (644.8) (606.8) (566.1)Treasury stock acquired (33.2) (39.4) (40.7)Treasury stock issued — 1.4 —
Cumulative treasury stock (678.0) (644.8) (606.8)
Net common stock outstanding 785.0 813.1 846.6
Earnings Per Share of Common StockEarnings per share are computed by dividing net income byweighted-average common shares outstanding for the period.Basic earnings per share are computed using an unadjustedweighted-average number of shares of common stock. Dilutedearnings per share are computed using the weighted-averagenumber of shares of common stock, plus an adjustment for thedilutive effect of unexercised in-the-money stock options.
A reconciliation between basic and diluted weighted-averagecommon shares outstanding for the three years endedDecember 31 follows (millions of shares). There were noadjustments to net income for any year shown for purposes ofcalculating earnings per share.
2004 2003 2002
Basic weighted average shares outstanding 798.9 826.2 866.0Stock option shares 9.6 10.8 12.9
Diluted weighted average shares outstanding 808.5 837.0 878.9
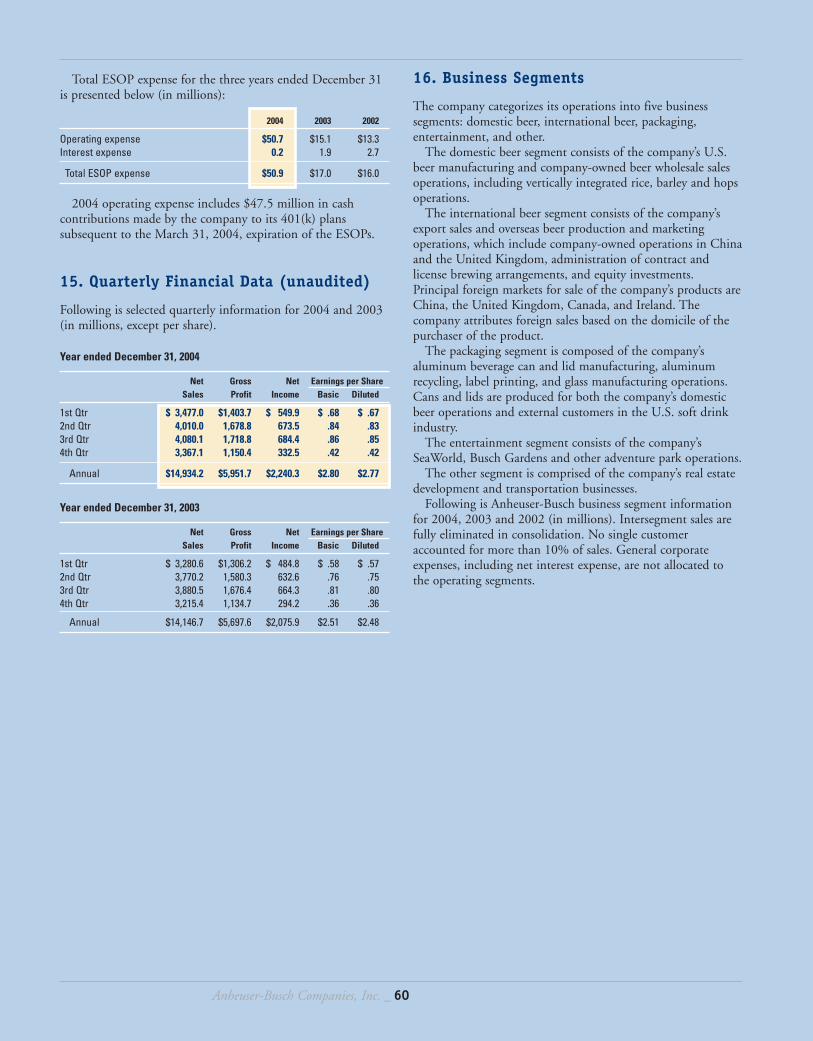
Anheuser-Busch Companies, Inc. _ 60
16. Business Segments
The company categorizes its operations into five businesssegments: domestic beer, international beer, packaging,entertainment, and other.
The domestic beer segment consists of the company’s U.S.beer manufacturing and company-owned beer wholesale salesoperations, including vertically integrated rice, barley and hopsoperations.
The international beer segment consists of the company’sexport sales and overseas beer production and marketingoperations, which include company-owned operations in Chinaand the United Kingdom, administration of contract andlicense brewing arrangements, and equity investments.Principal foreign markets for sale of the company’s products areChina, the United Kingdom, Canada, and Ireland. Thecompany attributes foreign sales based on the domicile of thepurchaser of the product.
The packaging segment is composed of the company’saluminum beverage can and lid manufacturing, aluminumrecycling, label printing, and glass manufacturing operations.Cans and lids are produced for both the company’s domesticbeer operations and external customers in the U.S. soft drinkindustry.
The entertainment segment consists of the company’sSeaWorld, Busch Gardens and other adventure park operations.
The other segment is comprised of the company’s real estatedevelopment and transportation businesses.
Following is Anheuser-Busch business segment informationfor 2004, 2003 and 2002 (in millions). Intersegment sales arefully eliminated in consolidation. No single customeraccounted for more than 10% of sales. General corporateexpenses, including net interest expense, are not allocated tothe operating segments.
Total ESOP expense for the three years ended December 31is presented below (in millions):
2004 2003 2002
Operating expense $50.7 $15.1 $13.3Interest expense 0.2 1.9 2.7
Total ESOP expense $50.9 $17.0 $16.0
2004 operating expense includes $47.5 million in cashcontributions made by the company to its 401(k) planssubsequent to the March 31, 2004, expiration of the ESOPs.
15. Quarterly Financial Data (unaudited)
Following is selected quarterly information for 2004 and 2003(in millions, except per share).
Year ended December 31, 2004
Net Gross Net Earnings per ShareSales Profit Income Basic Diluted
1st Qtr $ 3,477.0 $1,403.7 $ 549.9 $ .68 $ .672nd Qtr 4,010.0 1,678.8 673.5 .84 .833rd Qtr 4,080.1 1,718.8 684.4 .86 .854th Qtr 3,367.1 1,150.4 332.5 .42 .42
Annual $14,934.2 $5,951.7 $2,240.3 $2.80 $2.77
Year ended December 31, 2003
Net Gross Net Earnings per ShareSales Profit Income Basic Diluted
1st Qtr $ 3,280.6 $1,306.2 $ 484.8 $ .58 $ .572nd Qtr 3,770.2 1,580.3 632.6 .76 .753rd Qtr 3,880.5 1,676.4 664.3 .81 .804th Qtr 3,215.4 1,134.7 294.2 .36 .36
Annual $14,146.7 $5,697.6 $2,075.9 $2.51 $2.48
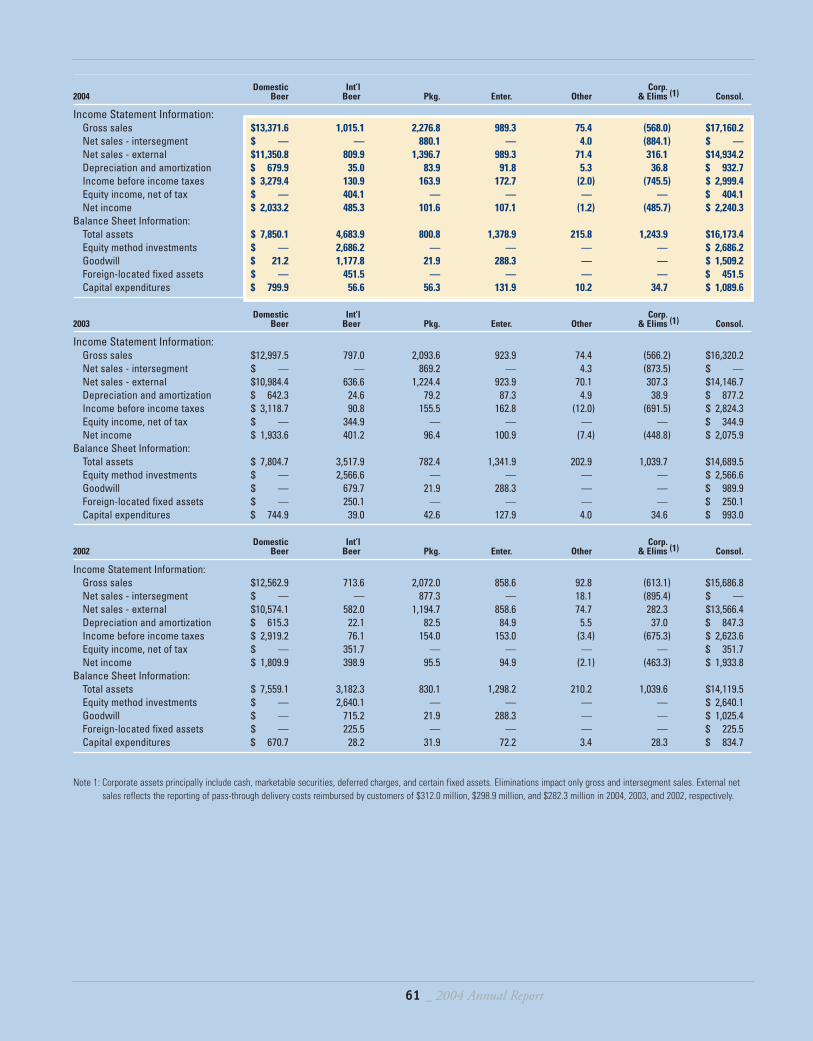
61 _ 2004 Annual Report
Domestic Int’l Corp.2004 Beer Beer Pkg. Enter. Other & Elims (1) Consol.
Income Statement Information:Gross sales $13,371.6 1,015.1 2,276.8 989.3 75.4 (568.0) $17,160.2Net sales - intersegment $ — — 880.1 — 4.0 (884.1) $ —Net sales - external $11,350.8 809.9 1,396.7 989.3 71.4 316.1 $14,934.2Depreciation and amortization $ 679.9 35.0 83.9 91.8 5.3 36.8 $ 932.7Income before income taxes $ 3,279.4 130.9 163.9 172.7 (2.0) (745.5) $ 2,999.4Equity income, net of tax $ — 404.1 — — — — $ 404.1Net income $ 2,033.2 485.3 101.6 107.1 (1.2) (485.7) $ 2,240.3
Balance Sheet Information:Total assets $ 7,850.1 4,683.9 800.8 1,378.9 215.8 1,243.9 $16,173.4Equity method investments $ — 2,686.2 — — — — $ 2,686.2Goodwill $ 21.2 1,177.8 21.9 288.3 — — $ 1,509.2Foreign-located fixed assets $ — 451.5 — — — — $ 451.5Capital expenditures $ 799.9 56.6 56.3 131.9 10.2 34.7 $ 1,089.6
Domestic Int’l Corp.2003 Beer Beer Pkg. Enter. Other & Elims (1) Consol.
Income Statement Information:Gross sales $12,997.5 797.0 2,093.6 923.9 74.4 (566.2) $16,320.2Net sales - intersegment $ — — 869.2 — 4.3 (873.5) $ —Net sales - external $10,984.4 636.6 1,224.4 923.9 70.1 307.3 $14,146.7Depreciation and amortization $ 642.3 24.6 79.2 87.3 4.9 38.9 $ 877.2Income before income taxes $ 3,118.7 90.8 155.5 162.8 (12.0) (691.5) $ 2,824.3Equity income, net of tax $ — 344.9 — — — — $ 344.9Net income $ 1,933.6 401.2 96.4 100.9 (7.4) (448.8) $ 2,075.9
Balance Sheet Information:Total assets $ 7,804.7 3,517.9 782.4 1,341.9 202.9 1,039.7 $14,689.5Equity method investments $ — 2,566.6 — — — — $ 2,566.6Goodwill $ — 679.7 21.9 288.3 — — $ 989.9Foreign-located fixed assets $ — 250.1 — — — — $ 250.1Capital expenditures $ 744.9 39.0 42.6 127.9 4.0 34.6 $ 993.0
Domestic Int’l Corp.2002 Beer Beer Pkg. Enter. Other & Elims (1) Consol.
Income Statement Information:Gross sales $12,562.9 713.6 2,072.0 858.6 92.8 (613.1) $15,686.8Net sales - intersegment $ — — 877.3 — 18.1 (895.4) $ —Net sales - external $10,574.1 582.0 1,194.7 858.6 74.7 282.3 $13,566.4Depreciation and amortization $ 615.3 22.1 82.5 84.9 5.5 37.0 $ 847.3Income before income taxes $ 2,919.2 76.1 154.0 153.0 (3.4) (675.3) $ 2,623.6Equity income, net of tax $ — 351.7 — — — — $ 351.7Net income $ 1,809.9 398.9 95.5 94.9 (2.1) (463.3) $ 1,933.8
Balance Sheet Information:Total assets $ 7,559.1 3,182.3 830.1 1,298.2 210.2 1,039.6 $14,119.5Equity method investments $ — 2,640.1 — — — — $ 2,640.1Goodwill $ — 715.2 21.9 288.3 — — $ 1,025.4Foreign-located fixed assets $ — 225.5 — — — — $ 225.5Capital expenditures $ 670.7 28.2 31.9 72.2 3.4 28.3 $ 834.7
Note 1: Corporate assets principally include cash, marketable securities, deferred charges, and certain fixed assets. Eliminations impact only gross and intersegment sales. External netsales reflects the reporting of pass-through delivery costs reimbursed by customers of $312.0 million, $298.9 million, and $282.3 million in 2004, 2003, and 2002, respectively.
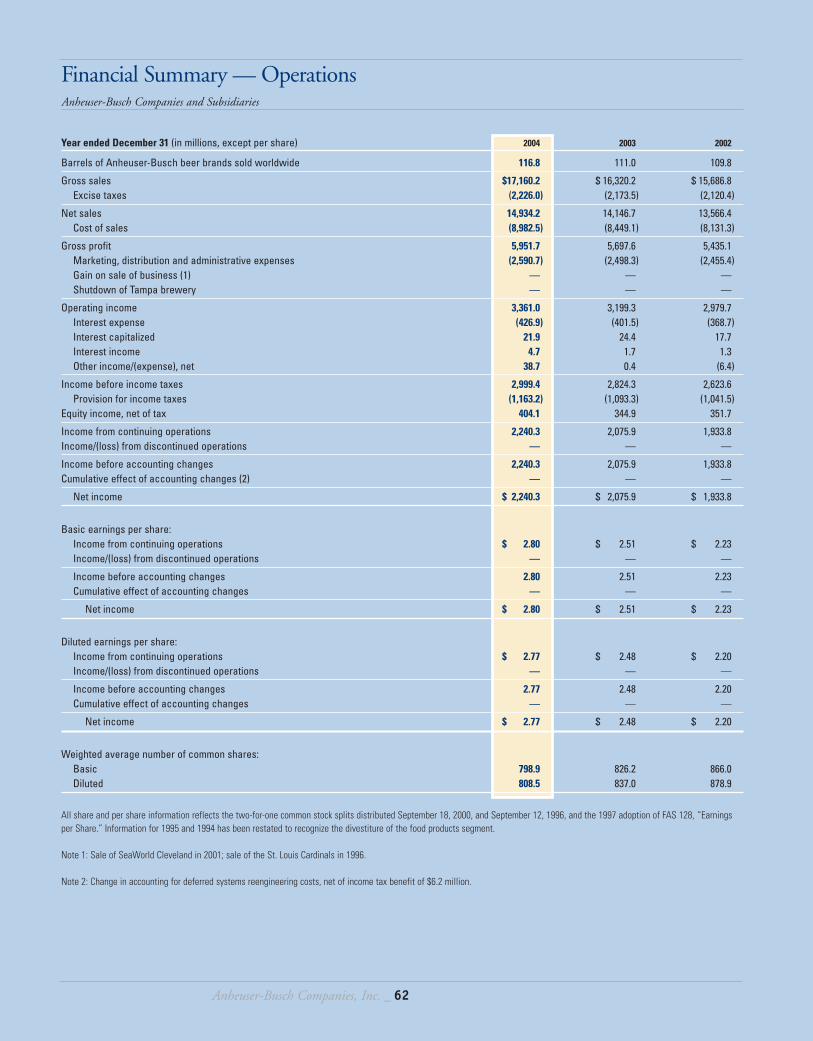
Anheuser-Busch Companies, Inc. _ 62
Year ended December 31 (in millions, except per share) 2004 2003 2002
Barrels of Anheuser-Busch beer brands sold worldwide 116.8 111.0 109.8
Gross sales $17,160.2 $ 16,320.2 $ 15,686.8Excise taxes (2,226.0) (2,173.5) (2,120.4)
Net sales 14,934.2 14,146.7 13,566.4Cost of sales (8,982.5) (8,449.1) (8,131.3)
Gross profit 5,951.7 5,697.6 5,435.1Marketing, distribution and administrative expenses (2,590.7) (2,498.3) (2,455.4)Gain on sale of business (1) — — —Shutdown of Tampa brewery — — —
Operating income 3,361.0 3,199.3 2,979.7Interest expense (426.9) (401.5) (368.7)Interest capitalized 21.9 24.4 17.7Interest income 4.7 1.7 1.3Other income/(expense), net 38.7 0.4 (6.4)
Income before income taxes 2,999.4 2,824.3 2,623.6Provision for income taxes (1,163.2) (1,093.3) (1,041.5)
Equity income, net of tax 404.1 344.9 351.7
Income from continuing operations 2,240.3 2,075.9 1,933.8Income/(loss) from discontinued operations — — —
Income before accounting changes 2,240.3 2,075.9 1,933.8Cumulative effect of accounting changes (2) — — —
Net income $ 2,240.3 $ 2,075.9 $ 1,933.8
Basic earnings per share:Income from continuing operations $ 2.80 $ 2.51 $ 2.23Income/(loss) from discontinued operations — — —
Income before accounting changes 2.80 2.51 2.23Cumulative effect of accounting changes — — —
Net income $ 2.80 $ 2.51 $ 2.23
Diluted earnings per share:Income from continuing operations $ 2.77 $ 2.48 $ 2.20Income/(loss) from discontinued operations — — —
Income before accounting changes 2.77 2.48 2.20Cumulative effect of accounting changes — — —
Net income $ 2.77 $ 2.48 $ 2.20
Weighted average number of common shares:Basic 798.9 826.2 866.0Diluted 808.5 837.0 878.9
All share and per share information reflects the two-for-one common stock splits distributed September 18, 2000, and September 12, 1996, and the 1997 adoption of FAS 128, ”Earningsper Share.” Information for 1995 and 1994 has been restated to recognize the divestiture of the food products segment.
Note 1: Sale of SeaWorld Cleveland in 2001; sale of the St. Louis Cardinals in 1996.
Note 2: Change in accounting for deferred systems reengineering costs, net of income tax benefit of $6.2 million.
Financial Summary — OperationsAnheuser-Busch Companies and Subsidiaries
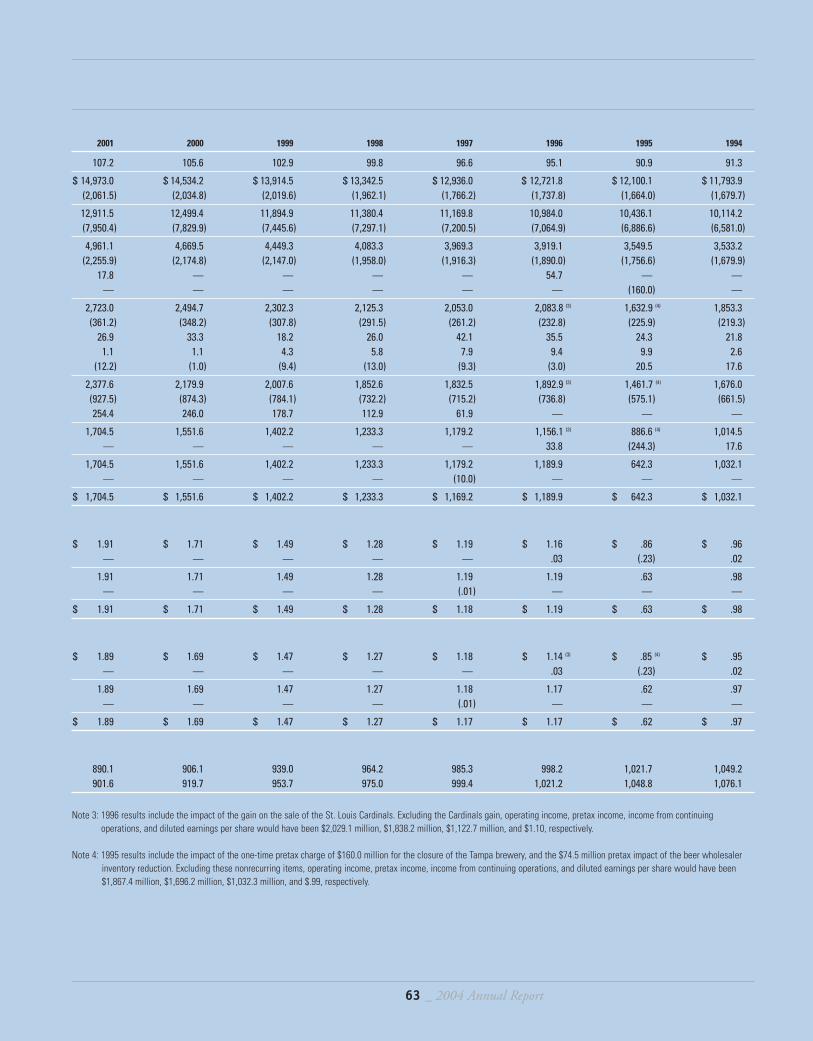
2001 2000 1999 1998 1997 1996 1995 1994
107.2 105.6 102.9 99.8 96.6 95.1 90.9 91.3
$ 14,973.0 $ 14,534.2 $ 13,914.5 $ 13,342.5 $ 12,936.0 $ 12,721.8 $ 12,100.1 $ 11,793.9(2,061.5) (2,034.8) (2,019.6) (1,962.1) (1,766.2) (1,737.8) (1,664.0) (1,679.7)
12,911.5 12,499.4 11,894.9 11,380.4 11,169.8 10,984.0 10,436.1 10,114.2(7,950.4) (7,829.9) (7,445.6) (7,297.1) (7,200.5) (7,064.9) (6,886.6) (6,581.0)
4,961.1 4,669.5 4,449.3 4,083.3 3,969.3 3,919.1 3,549.5 3,533.2(2,255.9) (2,174.8) (2,147.0) (1,958.0) (1,916.3) (1,890.0) (1,756.6) (1,679.9)
17.8 — — — — 54.7 — —— — — — — — (160.0) —
2,723.0 2,494.7 2,302.3 2,125.3 2,053.0 2,083.8 (3) 1,632.9 (4) 1,853.3(361.2) (348.2) (307.8) (291.5) (261.2) (232.8) (225.9) (219.3)
26.9 33.3 18.2 26.0 42.1 35.5 24.3 21.81.1 1.1 4.3 5.8 7.9 9.4 9.9 2.6
(12.2) (1.0) (9.4) (13.0) (9.3) (3.0) 20.5 17.6
2,377.6 2,179.9 2,007.6 1,852.6 1,832.5 1,892.9 (3) 1,461.7 (4) 1,676.0(927.5) (874.3) (784.1) (732.2) (715.2) (736.8) (575.1) (661.5)254.4 246.0 178.7 112.9 61.9 — — —
1,704.5 1,551.6 1,402.2 1,233.3 1,179.2 1,156.1 (3) 886.6 (4) 1,014.5— — — — — 33.8 (244.3) 17.6
1,704.5 1,551.6 1,402.2 1,233.3 1,179.2 1,189.9 642.3 1,032.1— — — — (10.0) — — —
$ 1,704.5 $ 1,551.6 $ 1,402.2 $ 1,233.3 $ 1,169.2 $ 1,189.9 $ 642.3 $ 1,032.1
$ 1.91 $ 1.71 $ 1.49 $ 1.28 $ 1.19 $ 1.16 $ .86 $ .96— — — — — .03 (.23) .02
1.91 1.71 1.49 1.28 1.19 1.19 .63 .98— — — — (.01) — — —
$ 1.91 $ 1.71 $ 1.49 $ 1.28 $ 1.18 $ 1.19 $ .63 $ .98
$ 1.89 $ 1.69 $ 1.47 $ 1.27 $ 1.18 $ 1.14 (3) $ .85 (4) $ .95— — — — — .03 (.23) .02
1.89 1.69 1.47 1.27 1.18 1.17 .62 .97— — — — (.01) — — —
$ 1.89 $ 1.69 $ 1.47 $ 1.27 $ 1.17 $ 1.17 $ .62 $ .97
890.1 906.1 939.0 964.2 985.3 998.2 1,021.7 1,049.2901.6 919.7 953.7 975.0 999.4 1,021.2 1,048.8 1,076.1
Note 3: 1996 results include the impact of the gain on the sale of the St. Louis Cardinals. Excluding the Cardinals gain, operating income, pretax income, income from continuingoperations, and diluted earnings per share would have been $2,029.1 million, $1,838.2 million, $1,122.7 million, and $1.10, respectively.
Note 4: 1995 results include the impact of the one-time pretax charge of $160.0 million for the closure of the Tampa brewery, and the $74.5 million pretax impact of the beer wholesalerinventory reduction. Excluding these nonrecurring items, operating income, pretax income, income from continuing operations, and diluted earnings per share would have been$1,867.4 million, $1,696.2 million, $1,032.3 million, and $.99, respectively.
63 _ 2004 Annual Report
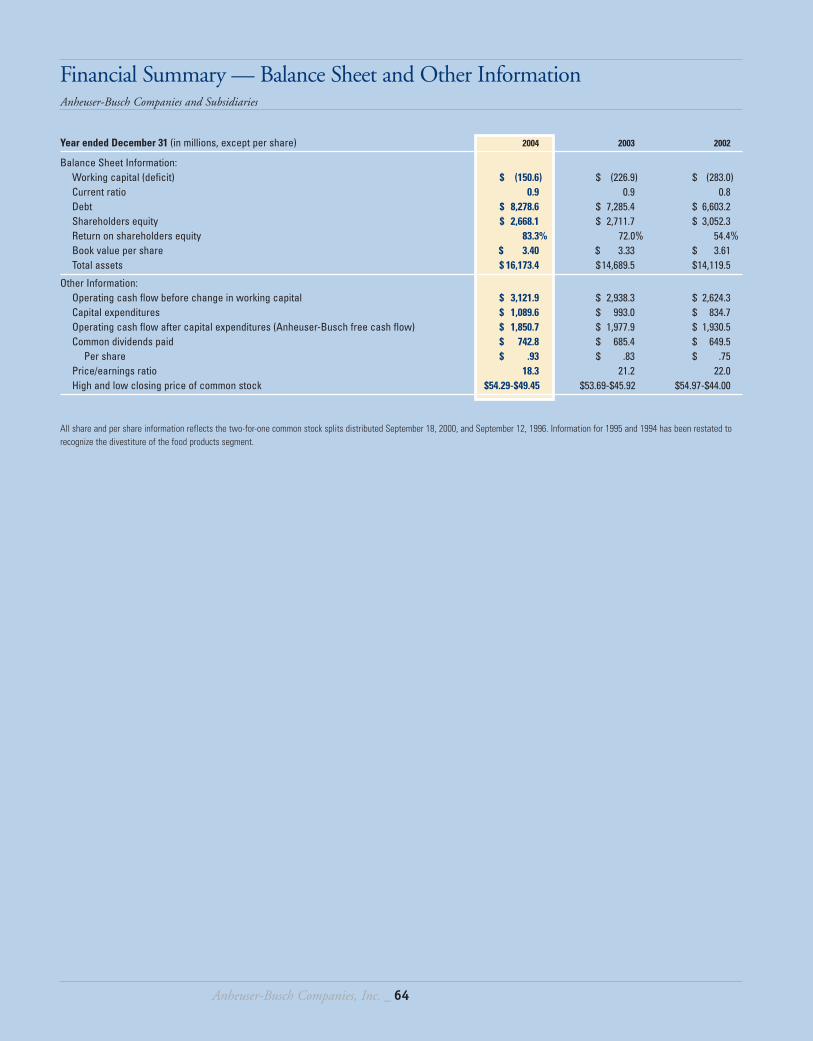
Anheuser-Busch Companies, Inc. _ 64
Year ended December 31 (in millions, except per share) 2004 2003 2002
Balance Sheet Information:Working capital (deficit) $ (150.6) $ (226.9) $ (283.0)Current ratio 0.9 0.9 0.8Debt $ 8,278.6 $ 7,285.4 $ 6,603.2Shareholders equity $ 2,668.1 $ 2,711.7 $ 3,052.3Return on shareholders equity 83.3% 72.0% 54.4%Book value per share $ 3.40 $ 3.33 $ 3.61Total assets $ 16,173.4 $14,689.5 $14,119.5
Other Information:Operating cash flow before change in working capital $ 3,121.9 $ 2,938.3 $ 2,624.3Capital expenditures $ 1,089.6 $ 993.0 $ 834.7Operating cash flow after capital expenditures (Anheuser-Busch free cash flow) $ 1,850.7 $ 1,977.9 $ 1,930.5Common dividends paid $ 742.8 $ 685.4 $ 649.5
Per share $ .93 $ .83 $ .75Price/earnings ratio 18.3 21.2 22.0High and low closing price of common stock $54.29-$49.45 $53.69-$45.92 $54.97-$44.00
All share and per share information reflects the two-for-one common stock splits distributed September 18, 2000, and September 12, 1996. Information for 1995 and 1994 has been restated torecognize the divestiture of the food products segment.
Financial Summary — Balance Sheet and Other InformationAnheuser-Busch Companies and Subsidiaries
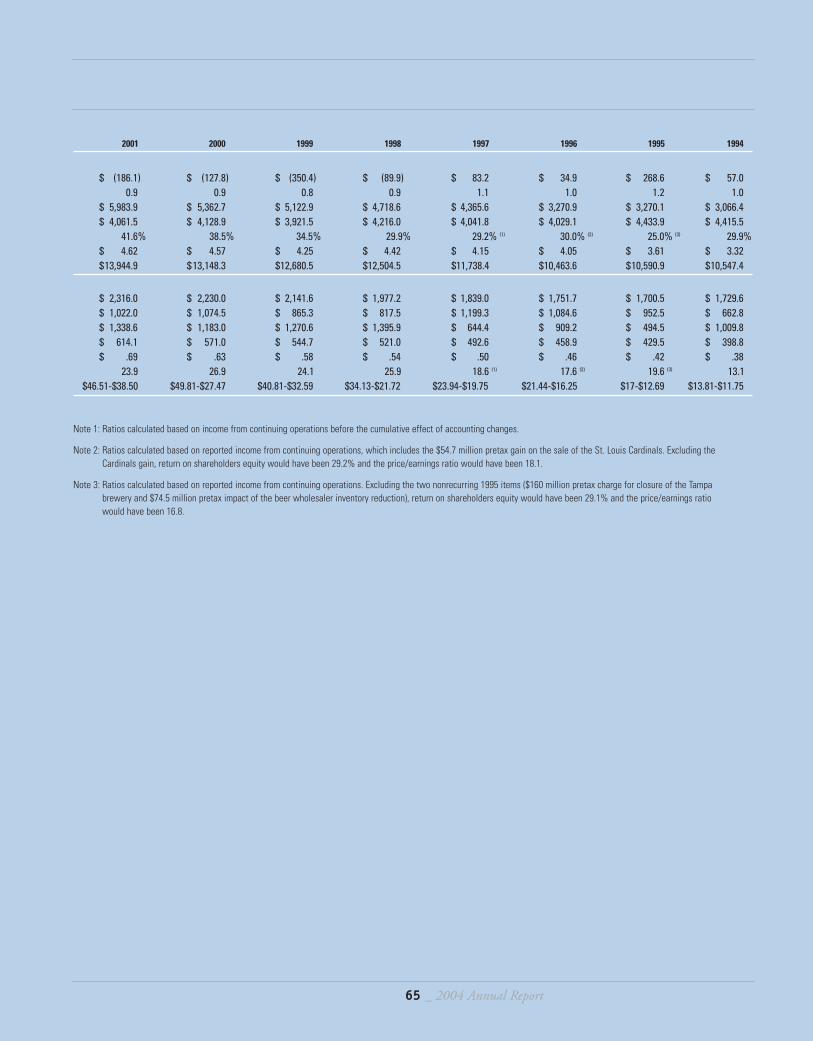
2001 2000 1999 1998 1997 1996 1995 1994
$ (186.1) $ (127.8) $ (350.4) $ (89.9) $ 83.2 $ 34.9 $ 268.6 $ 57.00.9 0.9 0.8 0.9 1.1 1.0 1.2 1.0
$ 5,983.9 $ 5,362.7 $ 5,122.9 $ 4,718.6 $ 4,365.6 $ 3,270.9 $ 3,270.1 $ 3,066.4$ 4,061.5 $ 4,128.9 $ 3,921.5 $ 4,216.0 $ 4,041.8 $ 4,029.1 $ 4,433.9 $ 4,415.5
41.6% 38.5% 34.5% 29.9% 29.2% (1) 30.0% (2) 25.0% (3) 29.9%$ 4.62 $ 4.57 $ 4.25 $ 4.42 $ 4.15 $ 4.05 $ 3.61 $ 3.32$13,944.9 $13,148.3 $12,680.5 $12,504.5 $11,738.4 $10,463.6 $10,590.9 $10,547.4
$ 2,316.0 $ 2,230.0 $ 2,141.6 $ 1,977.2 $ 1,839.0 $ 1,751.7 $ 1,700.5 $ 1,729.6$ 1,022.0 $ 1,074.5 $ 865.3 $ 817.5 $ 1,199.3 $ 1,084.6 $ 952.5 $ 662.8$ 1,338.6 $ 1,183.0 $ 1,270.6 $ 1,395.9 $ 644.4 $ 909.2 $ 494.5 $ 1,009.8$ 614.1 $ 571.0 $ 544.7 $ 521.0 $ 492.6 $ 458.9 $ 429.5 $ 398.8$ .69 $ .63 $ .58 $ .54 $ .50 $ .46 $ .42 $ .38
23.9 26.9 24.1 25.9 18.6 (1) 17.6 (2) 19.6 (3) 13.1$46.51-$38.50 $49.81-$27.47 $40.81-$32.59 $34.13-$21.72 $23.94-$19.75 $21.44-$16.25 $17-$12.69 $13.81-$11.75
Note 1: Ratios calculated based on income from continuing operations before the cumulative effect of accounting changes.
Note 2: Ratios calculated based on reported income from continuing operations, which includes the $54.7 million pretax gain on the sale of the St. Louis Cardinals. Excluding the Cardinals gain, return on shareholders equity would have been 29.2% and the price/earnings ratio would have been 18.1.
Note 3: Ratios calculated based on reported income from continuing operations. Excluding the two nonrecurring 1995 items ($160 million pretax charge for closure of the Tampa brewery and $74.5 million pretax impact of the beer wholesaler inventory reduction), return on shareholders equity would have been 29.1% and the price/earnings ratio would have been 16.8.
65 _ 2004 Annual Report
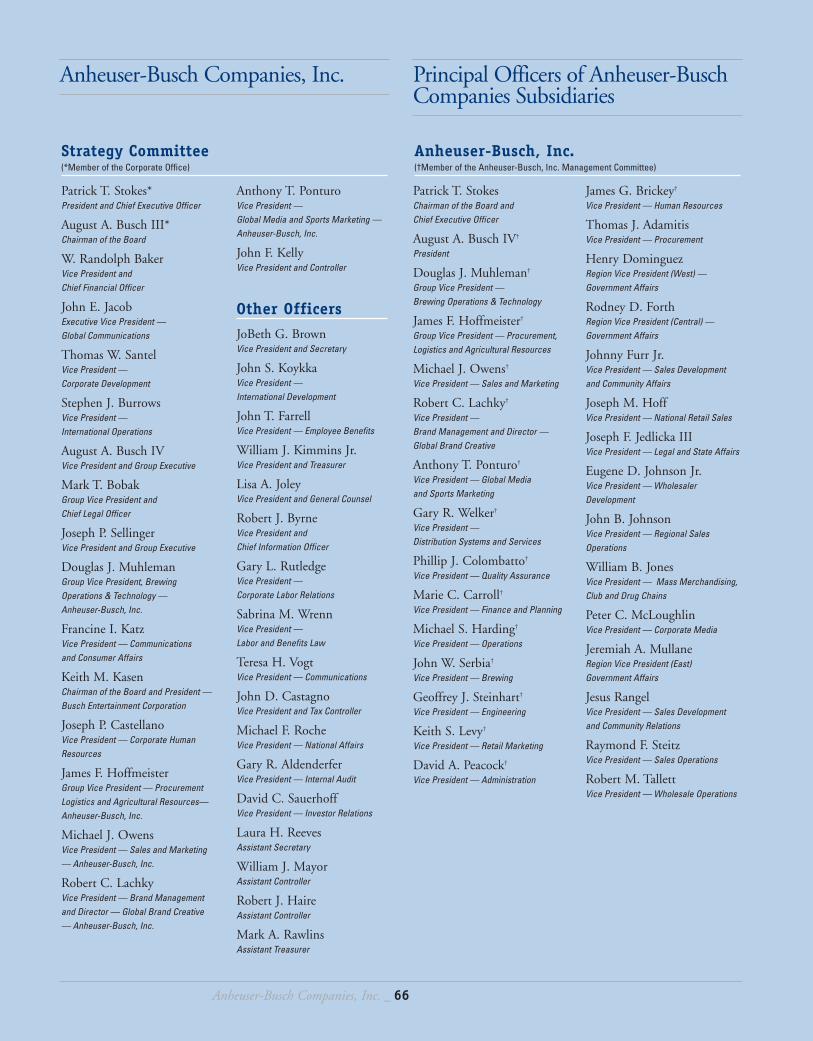
Patrick T. StokesChairman of the Board and Chief Executive Officer
August A. Busch IV†
President
Douglas J. Muhleman†
Group Vice President — Brewing Operations & Technology
James F. Hoffmeister†
Group Vice President — Procurement,Logistics and Agricultural Resources
Michael J. Owens†
Vice President — Sales and Marketing
Robert C. Lachky†
Vice President — Brand Management and Director —Global Brand Creative
Anthony T. Ponturo†
Vice President — Global Media and Sports Marketing
Gary R. Welker†
Vice President — Distribution Systems and Services
Phillip J. Colombatto†
Vice President — Quality Assurance
Marie C. Carroll†
Vice President — Finance and Planning
Michael S. Harding†
Vice President — Operations
John W. Serbia†
Vice President — Brewing
Geoffrey J. Steinhart†
Vice President — Engineering
Keith S. Levy†
Vice President — Retail Marketing
David A. Peacock†
Vice President — Administration
James G. Brickey†
Vice President — Human Resources
Thomas J. AdamitisVice President — Procurement
Henry DominguezRegion Vice President (West) —Government Affairs
Rodney D. ForthRegion Vice President (Central) —Government Affairs
Johnny Furr Jr.Vice President — Sales Developmentand Community Affairs
Joseph M. HoffVice President — National Retail Sales
Joseph F. Jedlicka IIIVice President — Legal and State Affairs
Eugene D. Johnson Jr.Vice President — WholesalerDevelopment
John B. JohnsonVice President — Regional SalesOperations
William B. JonesVice President — Mass Merchandising,Club and Drug Chains
Peter C. McLoughlinVice President — Corporate Media
Jeremiah A. MullaneRegion Vice President (East)Government Affairs
Jesus RangelVice President — Sales Developmentand Community Relations
Raymond F. SteitzVice President — Sales Operations
Robert M. TallettVice President — Wholesale Operations
Anheuser-Busch Companies, Inc.
Strategy Committee (*Member of the Corporate Office)
Anheuser-Busch, Inc. (†Member of the Anheuser-Busch, Inc. Management Committee)
Principal Officers of Anheuser-BuschCompanies Subsidiaries
Anheuser-Busch Companies, Inc. _ 66
Patrick T. Stokes*President and Chief Executive Officer
August A. Busch III*Chairman of the Board
W. Randolph BakerVice President and Chief Financial Officer
John E. JacobExecutive Vice President — Global Communications
Thomas W. SantelVice President — Corporate Development
Stephen J. BurrowsVice President — International Operations
August A. Busch IVVice President and Group Executive
Mark T. BobakGroup Vice President and Chief Legal Officer
Joseph P. SellingerVice President and Group Executive
Douglas J. MuhlemanGroup Vice President, BrewingOperations & Technology — Anheuser-Busch, Inc.
Francine I. KatzVice President — Communications and Consumer Affairs
Keith M. KasenChairman of the Board and President —Busch Entertainment Corporation
Joseph P. CastellanoVice President — Corporate HumanResources
James F. HoffmeisterGroup Vice President — ProcurementLogistics and Agricultural Resources—Anheuser-Busch, Inc.
Michael J. OwensVice President — Sales and Marketing— Anheuser-Busch, Inc.
Robert C. LachkyVice President — Brand Managementand Director — Global Brand Creative— Anheuser-Busch, Inc.
Anthony T. PonturoVice President — Global Media and Sports Marketing —Anheuser-Busch, Inc.
John F. KellyVice President and Controller
Other OfficersJoBeth G. BrownVice President and Secretary
John S. KoykkaVice President — International Development
John T. FarrellVice President — Employee Benefits
William J. Kimmins Jr.Vice President and Treasurer
Lisa A. JoleyVice President and General Counsel
Robert J. ByrneVice President and Chief Information Officer
Gary L. RutledgeVice President — Corporate Labor Relations
Sabrina M. WrennVice President — Labor and Benefits Law
Teresa H. VogtVice President — Communications
John D. CastagnoVice President and Tax Controller
Michael F. RocheVice President — National Affairs
Gary R. AldenderferVice President — Internal Audit
David C. SauerhoffVice President — Investor Relations
Laura H. ReevesAssistant Secretary
William J. MayorAssistant Controller
Robert J. HaireAssistant Controller
Mark A. RawlinsAssistant Treasurer
67 _ 2004 Annual Report
Busch EntertainmentCorporation
Keith M. KasenChairman of the Board and President
Damon H. AndrewVice President — Safety and ParkOperations
Bradley F. AndrewsVice President— Zoological Operations
Karen L. BrandingVice President — Adventure CampBusiness
Robin D. CarsonVice President — Marketing
Michael R. CatcottVice President — Merchandise
Stephen M. FreinVice President — Planning andDevelopment
David J. GrabeVice President — Finance
David L. HammerVice President — Human Resources
David R. SmithVice President — Entertainment
David C. WhiteVice President — Culinary Operations
James R. YustVice President — Engineering andCreative Development
Busch Properties, Inc.
W. Randolph BakerChairman of the Board and President
Joseph DuranteExecutive Vice President and Managing Director — Kingsmill Resort
William B. VolivaExecutive Vice President — Kingsmill on the James
John C. Martz Jr.Vice President — Corporate Real Estate
William F. BrownVice President — Busch Corporate Centers
William J. NasonVice President — Finance and Administration
ManufacturersRailway Company; St. Louis RefrigeratorCar Company
Kurt R. AndrewPresident and Chief Executive Officer
Barbara J. HouseworthVice President and Treasurer
Anheuser-BuschInternational, Inc.
Patrick T. StokesChairman of the Board
Stephen J. BurrowsChief Executive Officer and President
John S. KoykkaExecutive Vice President — StrategicPlanning and Business Development
John J. Hanichak IIIVice President — Field Operations
Mark F. SchummVice President — China BusinessDevelopment
Larry D. BaumannVice President — Finance
David A. RenaudVice President and Chief FinancialOfficer of Anheuser-Busch China
James E. SchobelSenior Vice President — Legal Affairs
Alejandro M. StrauchVice President and Regional Director—Central and South America
Pedro L. SoaresVice President — Mexico
Andrew J. DayVice President and Managing Director — Europe
Martin D. CargasVice President — Government Affairs
Y.R. ChengVice President and Managing Director— Greater China
Y.J. ChengVice President — Production andTechnology — China
Kevin N. Weishaar Vice President — International Business Development
Wholesaler EquityDevelopment Corp.
David A. PeacockChairman of the Board and Chief Executive Officer
Anthony J. ShortPresident
Busch AgriculturalResources, Inc.
James F. HoffmeisterChairman of the Board and Chief Executive Officer
Stephen D. MalinPresident
Richard R. EmersonVice President — Operations
Thomas M. WoodVice President — Technical andInternational Operations
Thomas L. TangaroVice President — Staff Operations
Anheuser-BuschPackaging Group, Inc.
Joseph P. SellingerChairman of the Board, Chief Executive Officer, and President
Kirk NorrisGroup Vice President — Operations
Tony BhallaExecutive Vice President and Chief Operating Officer — Metal Container Corporation
Lise A. HerrenExecutive Vice President and Chief Operating Officer —Anheuser-Busch Recycling, Precision Printing and Packaging, Eagle Packaging
Anheuser-Busch Companies, Inc. _ 68
Investor Information
World HeadquartersOne Busch PlaceSt. Louis, Mo. 63118314-577-2000
General Information by Phone (toll-free)800-DIAL-BUD (800-342-5283)
Annual MeetingWednesday, April 27, 2005, 10 a.m.Kingsmill, Va.
Transfer Agent, Registrar and Dividend Payments Mellon Investor Services LLC85 Challenger Rd., Overpeck CentreRidgefield Park, N.J. 07660888-213-0964www.melloninvestor.com
Dividend Reinvestment PlanThe company’s Dividend ReinvestmentPlan allows shareholders to reinvestdividends in Anheuser-Busch Companiescommon stock automatically, regularlyand conveniently — without servicecharges or brokerage fees. In addition,participating shareholders maysupplement the amount invested withvoluntary cash investments on the samecost-free basis. Plan participation isvoluntary and shareholders may join orwithdraw at any time. For moreinformation, contact Mellon InvestorServices (address above).
Stock Exchange ListingsNew York, London, Swiss
Traded on These ExchangesBoston, Chicago, Cincinnati, Pacific, Philadelphia
Ticker Symbol: BUDNewspaper Listing: AnheuserB
Independent RegisteredPublic Accounting FirmPricewaterhouseCoopers LLP800 Market StreetSt. Louis, MO 63101
Trustee for Debentures and NotesThe JPMorgan Chase Bank InstitutionalTrust Services4 New York Plaza, 15th FloorNew York, N.Y. 10004800-275-2048
Trustee for IndustrialRevenue BondsThe Bank of New York Trust Company, N.A. 911 Washington Ave.Lammert Building, Suite 300St. Louis, Mo. 63101800-208-2197
DividendsDividends are normally paid in themonths of March, June, September and December. Dividends may beelectronically deposited into an accountat the shareholder’s financial institution.Please contact Mellon Investor Servicesfor details.
Other InformationYou may obtain, at no charge, a copy ofthe Anheuser-Busch Companies AnnualReport to the Securities and ExchangeCommission (Form 10-K) by writing to theVice President and Secretary’s Office atour world headquarters, accessing theInternet at www.anheuser-busch.com, orby calling 800-DIAL-BUD. The companyalso provides copies of its SEC quarterlyreports on Forms 10-Q, other reports onForms 8-K, earnings press releases,proxy statements, and corporategovernance information free of charge at www.anheuser-busch.com.
For information about Anheuser-Busch’sefforts to enhance shareholder valuethrough community support, you mayrequest a complimentary copy of our“Making Friends … Making a Differ-ence” brochure by writing to BusinessCommunications at our worldheadquarters, by accessing the Internetat www.anheuser-busch.com, or bycalling 800-DIAL-BUD.
Selected Anheuser-Busch Internet Addresseswww.anheuser-busch.com (corporate, financial and investorinformation)
www.budweiser.com (brand and sponsorship information;Budweiser merchandise)
www.budlight.com (brand and sponsorship information; Bud Light merchandise)
www.beeresponsible.com (Consumer Awareness and Education)
www.budweisertours.com (brewery tour information; the brewing process)
www.grantsfarm.com (Grant’s Farm tour information)
www.buschgardens.com (Busch Gardens information)
www.seaworld.com (SeaWorld information)
www.discoverycove.com (Discovery Cove information)
Anheuser-Busch, Inc.Leading U.S. brewer and industry leadersince 1957; produces approximately 30beers and three nonalcohol brews at 12 U.S. breweries
Anheuser-BuschInternational, Inc.Develops Anheuser-Busch brandsoutside the United States and invests inleading brewers in growth markets
Anheuser-Busch Packaging Group, Inc.Produces aluminum cans/lids, metalizedand paper labels, glass bottles, andcrown and closure liner material;recycles aluminum beverage containers;operates 15 U.S. plants
Busch Agricultural Resources, Inc.Produces and enhances the quality ofraw materials for Anheuser-Busch, Inc.
Busch EntertainmentCorporationOne of the largest U.S. theme parkoperators, with nine parks throughoutthe country
Busch Properties, Inc.A real estate development company with resort, residential and commercialproperties in selected areas of thecountry
Manufacturers Railway CompanyProvides terminal rail-switching servicesto St. Louis industries and operatestrucking subsidiaries
Wholesaler EquityDevelopment CorporationShares equity positions with qualifiedpartners in Anheuser-Busch, Inc.distributorships while they build towardtotal ownership
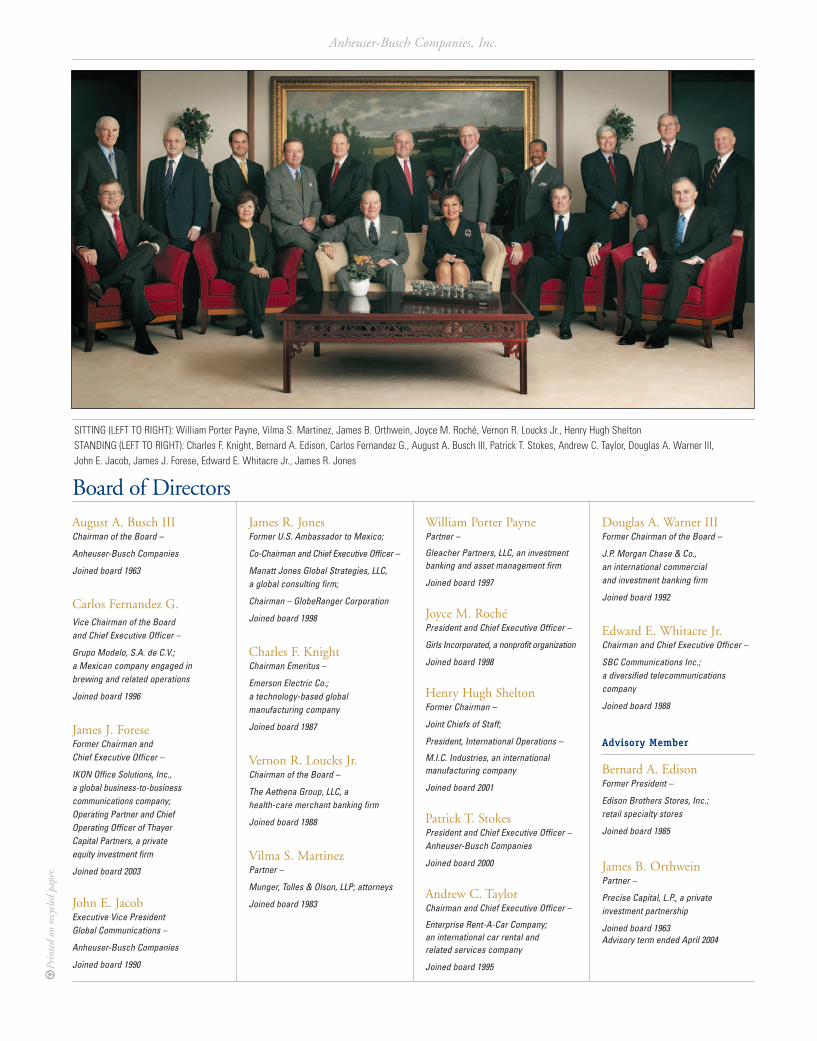
2004
Financial Highlights . . . . . . . . . . . . . . . . . . . . . . . . . . . . . . . . . . . . . . . . . . . . . . . . . . . . . . . . . . . . . . . . . . . . . . . . . . . . . . . . . . . 1Letter to Shareholders . . . . . . . . . . . . . . . . . . . . . . . . . . . . . . . . . . . . . . . . . . . . . . . . . . . . . . . . . . . . . . . . . . . . . . . . . . . . . . . . 2Domestic Beer Operations . . . . . . . . . . . . . . . . . . . . . . . . . . . . . . . . . . . . . . . . . . . . . . . . . . . . . . . . . . . . . . . . . . . . . . . . . . 8International Beer Operations . . . . . . . . . . . . . . . . . . . . . . . . . . . . . . . . . . . . . . . . . . . . . . . . . . . . . . . . . . . . . . . . . . . . . . 14Packaging Operations . . . . . . . . . . . . . . . . . . . . . . . . . . . . . . . . . . . . . . . . . . . . . . . . . . . . . . . . . . . . . . . . . . . . . . . . . . . . . . . . 20Entertainment Operations . . . . . . . . . . . . . . . . . . . . . . . . . . . . . . . . . . . . . . . . . . . . . . . . . . . . . . . . . . . . . . . . . . . . . . . . . . 22Financial Overview . . . . . . . . . . . . . . . . . . . . . . . . . . . . . . . . . . . . . . . . . . . . . . . . . . . . . . . . . . . . . . . . . . . . . . . . . . . . . . . . . . . . 25Management’s Discussion and Analysis of Operations and Financial Condition . . . 26Management’s Responsibility for Financial Statements and
Management’s Report on Internal Control Over Financial Reporting . . . . . . . . . . . . 40Report of Independent Registered Public Accounting Firm . . . . . . . . . . . . . . . . . . . . . . . . . . 41Consolidated Financial Statements . . . . . . . . . . . . . . . . . . . . . . . . . . . . . . . . . . . . . . . . . . . . . . . . . . . . . . . . . . . . 42Notes to Consolidated Financial Statements . . . . . . . . . . . . . . . . . . . . . . . . . . . . . . . . . . . . . . . . . . . . . . . 46Financial Summaries . . . . . . . . . . . . . . . . . . . . . . . . . . . . . . . . . . . . . . . . . . . . . . . . . . . . . . . . . . . . . . . . . . . . . . . . . . . . . . . . 62Investor and Other Information . . . . . . . . . . . . . . . . . . . . . . . . . . . . . . . . . . . . . . . . . . . . . . . . . . . . . . . . . . . . . . . . . . . 68
How far can we go by innovating, challenging thestatus quo, and thinking fresh? Powerful innovationhas characterized our past. Our continued abilityto think fresh will create our future success.
© 2005 Anheuser-Busch Companies, Inc.
August A. Busch IIIChairman of the Board –
Anheuser-Busch Companies
Joined board 1963
Carlos Fernandez G.Vice Chairman of the Board and Chief Executive Officer –
Grupo Modelo, S.A. de C.V.; a Mexican company engaged inbrewing and related operations
Joined board 1996
James J. ForeseFormer Chairman and Chief Executive Officer –
IKON Office Solutions, Inc., a global business-to-businesscommunications company; Operating Partner and Chief Operating Officer of Thayer Capital Partners, a private equity investment firm
Joined board 2003
John E. JacobExecutive Vice President Global Communications –
Anheuser-Busch Companies
Joined board 1990
James R. JonesFormer U.S. Ambassador to Mexico;
Co-Chairman and Chief Executive Officer –
Manatt Jones Global Strategies, LLC, a global consulting firm;
Chairman – GlobeRanger Corporation
Joined board 1998
Charles F. KnightChairman Emeritus –
Emerson Electric Co.; a technology-based globalmanufacturing company
Joined board 1987
Vernon R. Loucks Jr.Chairman of the Board –
The Aethena Group, LLC, a health-care merchant banking firm
Joined board 1988
Vilma S. MartinezPartner –
Munger, Tolles & Olson, LLP; attorneys
Joined board 1983
William Porter PaynePartner –
Gleacher Partners, LLC, an investmentbanking and asset management firm
Joined board 1997
Joyce M. RochéPresident and Chief Executive Officer –
Girls Incorporated, a nonprofit organization
Joined board 1998
Henry Hugh SheltonFormer Chairman –
Joint Chiefs of Staff;
President, International Operations –
M.I.C. Industries, an internationalmanufacturing company
Joined board 2001
Patrick T. StokesPresident and Chief Executive Officer –Anheuser-Busch Companies
Joined board 2000
Andrew C. TaylorChairman and Chief Executive Officer –
Enterprise Rent-A-Car Company; an international car rental and related services company
Joined board 1995
Douglas A. Warner IIIFormer Chairman of the Board –
J.P. Morgan Chase & Co., an international commercial and investment banking firm
Joined board 1992
Edward E. Whitacre Jr.Chairman and Chief Executive Officer –
SBC Communications Inc.; a diversified telecommunicationscompany
Joined board 1988
Advisory Member
Bernard A. EdisonFormer President –
Edison Brothers Stores, Inc.; retail specialty stores
Joined board 1985
James B. OrthweinPartner –
Precise Capital, L.P., a privateinvestment partnership
Joined board 1963Advisory term ended April 2004
Anheuser-Busch Companies, Inc.E
Prin
ted
on r
ecyc
led
pape
r.
SITTING (LEFT TO RIGHT): William Porter Payne, Vilma S. Martinez, James B. Orthwein, Joyce M. Roché, Vernon R. Loucks Jr., Henry Hugh SheltonSTANDING (LEFT TO RIGHT): Charles F. Knight, Bernard A. Edison, Carlos Fernandez G., August A. Busch III, Patrick T. Stokes, Andrew C. Taylor, Douglas A. Warner III, John E. Jacob, James J. Forese, Edward E. Whitacre Jr., James R. Jones
Board of Directors

thinkFresh
04AnnualReport
Anheuser-B
usch Com
panies, Inc.2004 Annual Report