animal cognition meets ecosystem 08 ecology: the …eprints.lincoln.ac.uk/23685/1/23685 soldati,...
TRANSCRIPT
08 Fall
Animal Cognition Meets Ecosystem Ecology: the Impact of Cognition
on Seed Dispersal
Francesca Soldati
Doctor of Philosophy
2015
Animal Cognition Meets Ecosystem Ecology: the Impact of Cognition on Seed Dispersal
Francesca Soldati
A thesis submitted in partial fulfilment of the requirements of the University of Lincoln for the
degree of Doctor of Philosophy
This research programme was carried out in collaboration with the
School of Life Sciences
August 2015

II
Abstract
Seed dispersal by endozoochory is important for the maintenance of plant
populations and biodiversity. As a result, understanding the impact that
frugivores’ activities have on seed dispersal is essential in order to better
understand plant population dynamics. One factor that is known to affect an
animal’s behaviour, yet has received little attention in this context, is animal
cognition i.e. whether the information animals learn and remember affects where
they access fruit and deposit seeds. Therefore, the aim of this thesis was to
address how animal learning and memory affects the seed dispersal process, using
two key approaches – experimental tests of frugivore cognition, and a model
paramaterised to examine the consequences of different cognitive abilities on seed
dispersal. Three questions were investigated:
(1) The “where?” - whether the ability of frugivores to relocate previously
visited food sources impacts upon their movements and, as a consequence, on
plants’ seed shadows. The spatial learning and memory of red-footed tortoises
was tested using an egocentric task. Tortoises were able to navigate efficiently in
the environment, and remembered the spatial location of food for at least two
months. A seed dispersal model designed to test whether frugivores with different
spatial memory skills differently affect plants’ seed shadow, suggested that
animals with long spatial memory relocate more efficiently food sources than
animals’ with shorter memory. As a consequence, animals with longer memory
survived longer, dispersed a bigger amount of seeds, and moved less at random
around the environment, all of which lead to different spatial distribution of
deposited seeds.
(2) The “What?” - whether seed dispersers’ discriminatory skills and
memory affects their choice of fruit. Tortoises’ ability to discriminate between
quantity and quality of food was tested. They were able to successfully
discriminate between the visual cues indicating different types of food and
remembered the task for at least 18 months. A seed dispersal model designed to

II
investigate whether the memory of quality and quantity of food affects seed
dispersal showed that the ability to discriminate between the features of fruits and,
in particular, the memory of those, allows animals to base their foraging decision
on previous learned experiences, significantly increasing the amount of seed
dispersed from the preferred fruit.
(3) The “When?” - whether the ability to anticipate events, such as food
availability, and learn about plants fruiting cycles affects plants’ seed shadows.
Tortoises’ anticipatory skills were tested on a 24 h cycle. They were able to
anticipate food delivery, showing an increase in activity immediately prior the
scheduled food delivery time. A seed dispersal model designed to test the impact
of timing on dispersal showed that animals that are able to anticipate cycles equal
to or longer than plants’ fruiting cycle readily relocate food, survive longer and
disperse more seeds than those with memory that doesn’t last as long as a fruiting
cycle.
Finally, I present a model parameterised with red-footed tortoise cognitive
data, with the aim to test one of the characteristics that makes tortoises unusual as
seed dispersal vectors: the use of gaps in the forest. The results suggest that the
active use of gaps enhances the probability of seed deposition in gaps and
deforested areas, making tortoises a possible reforestation “tool”.
I have demonstrated that the study of frugivores’ cognition can help to
build more reliable predictions of seed dispersal by endozoochory: cognition is
probably the most effective way to understand and predict an animal’s choices
and movements around the environment. Future research should incorporate
cognition in the study seed dispersal via endozoochory to have more reliable
predictions of plant dynamics.

III
TABLE OF CONTENTS 1. GENERAL INTRODUCTION .................................................................................... 1
1.1 SEED DISPERSAL DEFINITION, IMPORTANCE AND THEORIES ................................. 11.1.1 Seed dispersal theories ............................................................................................. 3
1.2 MECHANISMS OF SEED DISPERSAL ............................................................................ 71.2.1 Explosive seed dispersal ........................................................................................... 71.2.2 Seed dispersal by abiotic agent: wind and water ..................................................... 81.2.3 Seed dispersal by biotic agent: animals ................................................................... 9
1.2.3.1 Uptake: finding and eating the fruit ............................................................................................... 111.2.3.2 Transport ........................................................................................................................................ 121.2.3.3 Deposition ...................................................................................................................................... 131.2.3.4 Diplochory: seed dispersal does not stop with the primary vector ................................................ 14
1.3 THE IMPORTANCE OF REPTILES AS SEED DISPERSERS ............................................. 151.3.1 Seed dispersal by snakes ........................................................................................ 171.3.2 Seed dispersal by crocodilians ............................................................................... 181.3.3 Seed dispersal by lizards ........................................................................................ 191.3.4 Seed dispersal by chelonians .................................................................................. 20
1.3.4.1 Tortoises as dispersal vectors in tropical environments: the role of the red-footed tortoise ......... 211.4 THE IDEA: INTRODUCING ANIMAL COGNITION TO THE SEED DISPERSAL PROCESS . 24
1.4.1 Why what animals choose to eat impacts on seed dispersal .................................. 251.4.2 Food motivation and choice in animals ................................................................. 261.4.3 Food quantity as motivation for food choice .......................................................... 281.4.4 Why spatial learning might influence seed dispersal ............................................. 301.4.5 Animal spatial learning .......................................................................................... 31
1.4.5.1 Saptial learning in the red-footed tortoise ..................................................................................... 361.4.6 Why anticipatory behaviour might influence seed dispersal .................................. 391.4.7 Do animals perceive the passage of time? ............................................................. 401.4.8 The impact of memory on seed dispersal ............................................................... 43
1.5 MODEL SPECIES ....................................................................................................... 461.6 PHD AIMS AND OUTLINE ......................................................................................... 48
2. WHERE? ...................................................................................................................... 502.1 EXPERIMENT 1. SPATIAL MEMORY IN TORTOISES: CAN TORTOISES REMEMBER WHERE TO FIND FOOD? .................................................................................................. 50
2.1.1 Introduction ............................................................................................................ 502.1.2 Method .................................................................................................................... 54
2.1.2.1 Apparatus ....................................................................................................................................... 552.1.2.2 Habituation phase .......................................................................................................................... 552.1.2.3 Training phase ............................................................................................................................... 562.1.2.4 Two months retention test ............................................................................................................. 572.1.2.5 Re-training ..................................................................................................................................... 582.1.2.6 Eight months retention test ............................................................................................................ 582.1.2.7 Data analysis .................................................................................................................................. 58
2.1.3 Results ..................................................................................................................... 592.1.3.1 Training ......................................................................................................................................... 592.1.3.2 Two months retention test ............................................................................................................. 602.1.3.3 Re-training ..................................................................................................................................... 602.1.3.4.Eight months retention test ............................................................................................................ 61
2.1.4 Discussion ............................................................................................................... 622.1.5 Implication for seed dispersal ................................................................................ 64
2.5 CREATING PREDICTION: INTRODUCING SPATIAL MEMORY IN SEED DISPERSAL MODEL ........................................................................................................................... 66
2.5.1 Why use a model? ................................................................................................... 662.5.2 Mechanistic model for seed dispersal by wind ....................................................... 672.5.3 Model for seed dispersal by animals ...................................................................... 68

IV
2.5.4 Method .................................................................................................................... 702.5.5.1 The animal ..................................................................................................................................... 712.5.5.2 Perception, memory and assessment of habitat quality ................................................................. 712.5.5.3 Movement ...................................................................................................................................... 732.5.5.4 Feeding, gut passage and seed dispersal ........................................................................................ 742.5.5.5 Parameterising the model .............................................................................................................. 752.5.5.6.Data analysis .................................................................................................................................. 77
2.5.5 Hypothesis tested .................................................................................................... 792.5.6 Results ..................................................................................................................... 81
2.5.6.1 H1: Total amount of seeds dispersed in the environment .............................................................. 812.5.6.2 H2: individual amount of seeds dispersed from the two plants ..................................................... 822.5.6.3 H3: Long dispersal distance ........................................................................................................... 85
2.5.6.3.1 In landscape with unlimited availability of resources ................................................... 852.5.6.3.2. In landscape with limited availability of resources ...................................................... 87
2.5.6.4 H4 - H5: Proportion of landscape travelled .................................................................................... 882.5.6.5 H6: Animal survival rate ................................................................................................................ 90
2.5.7 Discussion and impacts on seed dispersal ............................................................. 922.6 GENERAL DISCUSSION ............................................................................................. 96
3. WHAT? ........................................................................................................................ 993.1 EXPERIMENT 3: MOTIVATION AND FOOD CHOICE IN CHELONOIDIS CARBONARIA .... 99
3.1.1 Introduction ............................................................................................................ 993.1.2 Method .................................................................................................................. 102
3.1.2.1 Phase One .................................................................................................................................... 1023.1.2.2 Habituation phase ........................................................................................................................ 1033.1.2.3 Phase One Training ..................................................................................................................... 1033.1.2.4 Phase One Test ............................................................................................................................ 1053.1.2.5 Phase two ..................................................................................................................................... 1053.1.2.6 Phase Two Training ..................................................................................................................... 1063.1.2.7 Phase Two Test ............................................................................................................................ 1063.1.2.8 Statistical analysis ....................................................................................................................... 107
3.1.3 Results ................................................................................................................... 1073.1.3.1 Phase One .................................................................................................................................... 1073.1.3.2 Phase Two ................................................................................................................................... 108
3.1.4 Discussion ............................................................................................................ 1093.1.5 Implications for seed dispersal ............................................................................. 111
3.2 EXPERIMENT 4: MEMORIES OF QUANTITY AND QUALITY ..................................... 1123.2.1 Introduction .......................................................................................................... 1123.2.2 Method .................................................................................................................. 115
3.2.2.1 Pre-test ......................................................................................................................................... 1153.2.2.2.Test .............................................................................................................................................. 1153.2.2.3 Data analysis ................................................................................................................................ 116
3.2.3 Results ................................................................................................................... 1173.2.4 Discussion ............................................................................................................. 1183.2.5 Implication for seed dispersal .............................................................................. 119
3.3. EXPERIMENT 5. CREATING PREDICTION WITH A SEED DISPERSAL MODEL: HOW MEMORIES OF DIFFERENT QUANTITY AND QUALITY OF FOOD IMPACT ON SEED DISPERSAL ................................................................................................................... 120
3.3.1 Introduction .......................................................................................................... 1203.3.2 Quantity model: Hypothesis tested and predictions ............................................. 1213.3.3 Method .................................................................................................................. 1223.3.4 Results ................................................................................................................... 124
3.3.4.1 H1: Total amount of seeds dispersed in the environment ............................................................ 1243.3.4.2 H2: individual amount of seeds dispersed from the two plants ................................................... 1253.3.4.3 H3: Long distance dispersal ......................................................................................................... 1263.3.4.4 H4: Proportion of landscape travelled .......................................................................................... 1283.3.4.5 H5: Animals’ survival .................................................................................................................. 129
3.3.5 Discussion ............................................................................................................. 1323.3.6 Quality model: introduction, hypothesis tested and predictions .......................... 1333.3.7 Method .................................................................................................................. 1363.3.8 Results ................................................................................................................... 138

V
3.3.8.1 H1: Total amount of seeds dispersed in the environment ............................................................ 1383.3.8.2 H2: Different amount of seeds dispersed from each of the plants ............................................... 1403.3.8.3 H3: Inequality of seed removal in environments of different qualities ........................................ 1413.3.8.4 H4: Long distance dispersal ......................................................................................................... 1423.3.8.5 H5: Proportion of landscape travelled .......................................................................................... 1433.3.8.6 H6: Animals’ survival .................................................................................................................. 144
3.3.9 Discussion ............................................................................................................. 1443.3.10. Quantity and Quality model: Introduction, hypothesis tested and predictions . 1463.3.11 Method ................................................................................................................ 1473.3.12 Results ................................................................................................................. 148
3.3.12.1 H1: Total amount of seeds dispersed in environment ................................................................ 1483.3.12.2 H2: Amount of seeds dispersed from the two plants ................................................................. 149
3.3.13 Discussion ........................................................................................................... 1543.4 GENERAL DISCUSSION ........................................................................................... 154
4. WHEN? ...................................................................................................................... 1574.1 EXPERIMENT 6: FOOD ANTICIPATORY BEHAVIOUR IN THE RED-FOOTED TORTOISE .................................................................................................................................... 157
4.1.1 Introduction .......................................................................................................... 1574.1.2 Method .................................................................................................................. 160
4.1.2.1 Training ....................................................................................................................................... 1614.1.2.2 Test 1, do tortoises posses anticipatory skills? ............................................................................ 1624.1.2.3 Control Test 1, cue conflict test ................................................................................................... 1654.1.2.4 Control Test 2, no visual cue test ................................................................................................ 1664.1.2.5 Control Test 3, extinction ............................................................................................................ 1674.1.2.6 Data analysis ................................................................................................................................ 169
4.1.2.6.1 Anticipatory activity .................................................................................................... 1694.1.2.6.2 Control Test 1, cue conflict test ................................................................................. 1704.1.2.6.3 Control Test 2, no visual cues test .............................................................................. 1714.1.2.6.4 Extinction, tortoises’ activity after the food delivery time was changed .................... 172
4.1.3 Results ................................................................................................................... 1734.1.3.1 Anticipatory activity .................................................................................................................... 1734.1.3.2 Control Test 1: cue conflict test ................................................................................................... 1744.1.3.3 Control Test 2: no visual cue ....................................................................................................... 1764.1.3.4 Extinction: tortoises’ activity after that the food delivery time was changed ............................. 177
4.1.4 Discussion ............................................................................................................. 1784.1.5 Implications for seed dispersal ............................................................................. 181
4.2 EXPERIMENT 7. CREATING PREDICTIONS: HOW PERCEIVING CYCLES IMPACTS UPON SEED DISPERSAL. ......................................................................................................... 183
4.2.1 Introduction .......................................................................................................... 1834.2.2 Method .................................................................................................................. 1864.2.3 Results ................................................................................................................... 187
4.2.3.1 H1: Total amount of seed dispersed in the environment .............................................................. 1874.2.3.2 H2: Animals’ survival .................................................................................................................. 189
4.2.4 Discussion ............................................................................................................. 1904.3 GENERAL DISCUSSION ........................................................................................... 192
5. SEED DISPERSAL IN FOREST GAPS ................................................................. 1945.1 EXPERIMENT 8. DO TORTOISES INCREASE SEED DISPERSAL IN FOREST GAPS? ..... 194
5.1.1 Introduction .......................................................................................................... 1945.1.2 Method .................................................................................................................. 197
5.1.2.1 Animals that use gaps .................................................................................................................. 1975.1.2.2 Landscape .................................................................................................................................... 1985.1.2.3 Data analysis ................................................................................................................................ 199
5.1.3 Results ................................................................................................................... 2005.1.4 Discussion ............................................................................................................. 202
6. GENERAL DISCUSSION ........................................................................................ 2056.1 SUMMARY OF FINDINGS, IMPLICATIONS AND FUTURE DIRECTIONS ...................... 205
6.1.1 Where? The impact on spatial learning on seed dispersal ................................... 2056.1.2 What? How animals feeding choices affect seed dispersal .................................. 209

VI
6.1.3 When? How anticipatory behaviour impact on seed dispersal ............................ 2126.1.4 Tortoises’ model ................................................................................................... 214
6.2 CONCLUSION ......................................................................................................... 215REFERENCES .............................................................................................................. 217
VII
FIGURES
Figure Title Page
1.1 Hypothetical model of seed recruitment versus distance from parental tree
4
1.2 Cycle of seed dispersal by endozoochory 10
2.1 Experiment 1: Y- maze diagram 56
2.2 Experiment 1: Number of tortoises that performed correctly in the first test trial in the two tests
62
2.3 Experiment1: correlation between test trial and re-training trials 62
2.4 Experiment 2: Total amount of seeds dispersed per timestep by animals with different memory in different landscape
82
2.5 Experiment 2: Difference of seeds dispersed from the individual plants in different landscapes by animals with different memory
84
2.6 Experiment 2: seed dispersal distance of the focal plant in environment with unlimited food availability
86
2.7 Experiment 2: Seed dispersal distance (median) of the focal plant at different memory in environment with unlimited food availability
86
2.8 Experiment 2: Seed dispersal distance of the non-focal plant at different memory in environment with unlimited food availability
87
2.9 Experiment 2: Seed dispersal distance of the focal plant at different memory in environment with limited food availability
88
2.10 Experiment 2: Examples of landscape travelled by an animal with low memory (a) and with high memory (b) in landscape with unlimited resources availability
89
2.11 Experiment 2: Proportion of landscape travelled by animals with different memory in environment with limited food availability
90
2.12 Experiment 2: Survivorship rate at different memory in landscape with unlimited resources availability
91
2.13 Experiment 2: Survivorship rate at different memory in landscape with limited resources availability
92
VIII
3.1 Experiment 3: Experimental setup of Phase One 105
3.2 Experiment 3: Tortoises’ correct choices when the stimuli associated to different amount of food (5mm3; 5mm3) or different types of food (mango; apple) were located at the same distance
108
3.3 Experiment 3: Tortoises’ correct choices when the stimuli associated to different amount of food or different types of food were located at different distances
109
3.4 Experiment 4: Tortoises’ correct choices after 18 months retention time in the quantity and quality discrimination test
117
3.5 Experiment 5: Total amount of seeds dispersed by animals with different memory in environment that provides different total quantity of food.
124
3.6 Experiment 5: Total amount of seeds dispersed in environment with limited food availability at different memory
125
3.7 Experiment 5: Difference of seeds dispersed from the plants in landscape with unlimited and limited food availability at different memory and different quantity values of the trees
127
3.8 Experiment 5: Proportion of landscape travelled per timestep in environment with limited food availability at different memory
129
3.9 Experiment 5: Survivorship of animals with different memory in environment with low, medium and high total quantity of food
131
3.10 Experiment 5: Total amount of seeds dispersed at different memory in environment that provides different total quality of food and unlimited and limited resources availability
139
3.11 Experiment 5: Difference of seeds dispersed from the individual plants in landscape with unlimited food availability at different memory and different quality ratio of the trees
141
3.12 Experiment 5: Difference of seeds dispersed from the two plants according to the quality ratio of the trees in environment with low, medium and high total quality
143
3.13 Experiment 5: Relation between the total amount of seeds dispersed in the environment per timestep and the predictors
148
3.14 Experiment 5: Total amount of seeds dispersed at different memory different quantity and different quality of the environment
151

IX
3.15 Experiment 5: Relation between the difference of seeds dispersed from the plants per timestep in the environment and the predictors
152
3.16 Experiment 5: Difference of seeds dispersed from the plants at different memory different quantity and quality ratio of the trees in landscape with limited food availability
153
4.1 Experiment 6: Example of pre-training set up 161
4.2 Experiment 6: Experimental arena 164
4.3 Experiment 6: Experimental scheme 168
4.4 Experiment 6: Tortoises percentage of activity in the first three days of training and the last three days of training
174
4.5 Experiment 6: Tortoises percentage of activity in the cue conflict test and training
175
4.6 Experiment 6: Percentage of times tortoises approaches the correct cue during the test and the training, and latency of response to the visual cue during the test and the test
176
4.7 Experiment 6: Tortoises percentage of activity in the no visual cue test and the training
177
4.8 Experiment 6: Tortoises percentage of activity in the first three and the last three days after the food delivery time was change
178
4.9 Experiment 7: Effects of memory on the amount of seeds dispersed per timestep at plant cycle lengths from 1 to 100 timesteps
188
4.10 Experiment 7: Effects of memory on the amount of seeds dispersed per timestep at different plant cycle lengths
188
4.11 Experiment 7: Survivorship of animals with different memory in environment with different plants’ cycle length
189
5.1 Experiment 8: Amount of seeds disperse in the gap relative to the gap size by animals that use gaps and animals that do not use gap in two different landscape
200
5.2 Experiment 8: Maps of close canopy forest and deforested environment with seed shadows and movements of animals.
202

X
TABLES
TABLE1COSTSOFTHESEEDDISPERSALBYENDOZOOCHORY(ADAPTEDFROMBONTEETAL.,2011)..........11
TABLE2INDIVIDUALDATAOFTRAININGSANDTESTS.............................................................................................59
TABLE3OVERVIEWOFMODELPARAMETERS...........................................................................................................76
TABLE4INDIVIDUAL DATA OF QUANTITY AND QUALITY DISCRIMINATION TEST.................................118
TABLE5LISTOFTHEPARAMETERSUSEDINTHEQUANTITYMODEL.................................................................123
TABLE6LISTOFTHEPARAMETERSUSEDINTHEQUALITYMODEL....................................................................137
TABLE7LISTOFTHEPARAMETERSUSEDINTHEQUANTITY-QUALITYMODEL................................................147
TABLE8TIME,COLOUROFTHECUEANDSUBJECTORDERSCHEDULEDFORTHE24HCYCLE........................163
TABLE9.LISTOFTHEPARAMETERSUSEDINTHEMODEL...................................................................................186
TABLE10LISTOFTHEPARAMETERSUSEDINTHETORTOISES’MODEL............................................................199

XI
ACKNOWLEDGEMENTS
Firstly, I would like to express my sincere gratitude to my supervisors Dr.
Anna Wilkinson, Dr. Tom Pike, Dr. Oliver Burman and Dr. Libby John for all
their support and guidance throughout my Ph.D. Their precious advice helped me
in all the time of research and writing of this thesis. I would like to thank Bill
Hayes for his helpful suggestions for preparing jellies and measuring their nutrient
content, and Ana Mariscal for sharing with me data about forest gaps. I’m also
grateful to my fellow colleagues for the stimulating discussions, support and for
all the fun we have had in the last years. Of course, a special thank goes to the
tortoises that put a lot of effort in participating in my experiments for a small
piece of strawberry, and all the people that helped me taking care of them.
Last but not least, I would like to thank and my family members for
supporting me, although they have not yet figured out exactly what I’m doing, and
my beloved friends. A special thank goes to my husband to be there in the good
and bad times, cheering me up when nothing made sense.

XII
Declaration
I declare that no material contained in the thesis has been used in any other submission for an academic award at this or any other institution.
I declare that the thesis is all my own original work, except where otherwise
indicated.
Conference presentations/proceedings:
Soldati, F., Pike, T., Burman, O., John, L. and Wilkinson, A. (2013) What shall I eat? Parameters affecting food choice in red-footed tortoises. Poster presentation at INTECOL, British Ecological Society, London, UK.
Pike, T. Soldati, F.,Wilkinson, A., Burman, O., John L. (2013) How does seed disperser knowledge impact plant dispersal? INTECOL, British Ecological Society, London, UK.
Soldati, F., Pike, T., Burman, O., John, L. and Wilkinson, A. (2013) Trade-off between distance travelled and food choice in red-footed tortoise. Association for the Study of Animal Behaviour, Lincoln, UK.
Soldati, F., Pike, T., Burman, O., John, L. and Wilkinson, A. (2012) Animal cognition meets ecosystem ecology. Poster presentation at Student Conference on Ecology and Evolution (EGI), Oxford, UK.

XIII
Publications plan and authors’ contribution.
1. Soldati, F., John, L., Pike, T., Burman, O., Wilkinson, A. “ Relative memory of food quantity in red-footed tortoise”.
This paper will include the results of experiment 3 and 4 described in chapter 3. Authors’ contribution: Experimental design: F.S. Experimental design revision: A.W., T.P., O.B., L.J. Experiment execution and data collection: F.S. Data analysis: F.S. Paper writing: F.S. Paper revision: A.W., T.P., O.B., L.J.
2. John, L., Soldati, F., Pike, T., Burman, O., Wilkinson, A. “The impact of animal cognition on seed dispersal”.
This paper is meant to be a review, which underlines how the cognitive skills of animals can benefit the seed dispersal process. It will include part of the concepts explained in the introduction. Authors’ contribution: Paper writing: F.S. and L.J. Paper revision: A.W., T.P., O.B.
3. Soldati, F., John, L., Burman, O., Wilkinson, A., Pike, T. “Introducing cognition in seed dispersal model: the effect of memory on plant seed shadow”.
This paper will present the results of the seed dispersal model described in chapter 2. Authors’ contribution: Model design: T.P. Model partial modifications and application: F.S. Data analysis: F.S. Paper writing: F.S. Paper revision: A.W., T.P., O.B., L.J.
4. Soldati, F., John, L., Pike, T., Burman, O., Wilkinson, A. “Dinner is served: anticipatory skills in red-footed tortoise”.
This paper will include the results of experiment 6 described in chapter 4.
XIV
Authors’ contribution: Experimental design: F.S. Experimental design revision: A.W., T.P., O.B., L.J. Experiment execution and data collection: F.S. Data analysis: F.S. Paper writing: F.S. Paper revision: A.W., T.P., O.B., L.J.
5. Soldati, F., John, L., Pike, T., Burman, O., Wilkinson, A. “Where is my food? Spatial learning in red-footed tortoise”.
This paper will include the results of experiment 1 described in chapter 2. Authors’ contribution: Experimental design: F.S. Experimental design revision: A.W., T.P., O.B., L.J. Experiment execution and data collection: F.S. Data analysis: F.S. Paper writing: F.S. Paper revision: A.W., T.P., O.B., L.J.
1
CHAPTER 1
1. GENERAL INTRODUCTION
1.1 Seed dispersal definition, importance and theories
Seed dispersal is defined as all the mechanisms that provide the movement
and/or transport, of seeds away from the parental plant. More precisely, according
to the definition of Howe and Smallwood (1982), a propagule is the unit of a
plant that is actually dispersed, and dispersal is referred as the departure of a
propagule from the parental plant. Seed rain is defined as the flux of seeds from
reproductive plants, without considering space explicitly (Nathan and Muller-
Landau, 2000), while the spatial distribution of seeds dispersed from a single
plant is referred as seed shadow (Nathan and Muller-Landau, 2000).
The consequences and benefits of dispersal to plants are many: (1) it is the
only way to colonize new favourable habitat (Howe and Smallwood, 1982; Marsh
et al., 2004; Schupp et al., 2010), (2) it can provide an escape from predation and
competition, at the parental site (Nathan and Muller-Landau, 2000), (3) it affects
the rate of gene flow (Ouborg at al., 1999) and (4) it is the only possibility, other
than adaptation, that organisms have to resist to climate change and habitat
fragmentation (Ronce, 2001). The possibility of dispersal in different areas is
essential to guarantee intra and inter-species diversity, decreasing the probability
2
of extinction of a species and maintaining ecosystem biodiversity (Frankham et
al., 2002, Leimu et al., 2010). Thus, the seed dispersal process impacts on the
structure and fitness of plant populations (Willson and Traveset, 2000).
For these reasons, seed dispersal is considered a key ecosystem process
because it defines the future structure of plant communities (Howe and
Smallwood, 1982). The resulting seed shadow, in fact, not only determines the
potential area of plant recruitment, but it impacts on subsequent processes, such as
predation, competition and reproduction of the future adult plants (Nathan and
Muller-Landau, 2000). In a comprehensive review Schupp et al. (2010) showed
that seed dispersal is central in many ecological aspects: understanding plants’
gene flow (Jordano et al., 2007), and metapopulation dynamics (Spiegel and
Nathan, 2007), plant population dynamics (Jordano and Herrera, 1995; Schupp
and Fuentes, 1995; Beckage and Clark, 2003; Ness et al., 2006), community
structure (Levin et al., 2003; Levine and Murrell, 2003; Howe and Miriti, 2004),
plant migration in response to historic and future climate change (Ibáñez et al.,
2006), evolutionary trade-offs (Clark et al., 2004), structure of interaction
networks (Bascompte and Jordano, 2007), maintenance of biodiversity
(Bascompte and Jordano, 2007), structuring of species–area curves (Rosindell and
Cornell, 2009), ecological consequences of habitat fragmentation (Cordeiro and
Howe, 2003), weed invasions (Buckley et al., 2006), ecological restoration
(Nuttle and Haefner, 2007), the effectiveness of corridors for conservation (Levey
et al., 2005), and more. Because of the many ecological questions touched by seed
dispersal, the awareness of the importance of this process for the ecosystem is in
constant growth.

3
However, seed dispersal is an extremely complex process and it comes
with several costs to the plant (Bonte et al., 2011) in terms of energy, time, risk
and opportunity (D’ hondt, 2011). The energetic cost refers to the expenditure for
the construction of special dispersal organs and tissue, such as wings for wind
seed dispersal or fleshy fruits for endozoochory (Bonte et al., 2011). Time cost
refers to the time invested in dispersal that cannot be invested in other activities
and the possibility of longer dormancy period that seeds might encounter in
deposition sites (Bonte et al., 2011); the cost of risk encompasses the risk of
mortality and damage that seeds might suffer at each stage of the seed dispersal
process, and the cost of opportunity refers to the possible loss of the advantages of
the natal environment when colonising a new one (D’hondt, 2011; Bonte et al.,
2011).
1.1.1 Seed dispersal theories
Three main theories attempt to explain the principal reasons why seed
dispersal has evolved, and which are the conditions that improve seed dispersal
outcome, i.e. increased probability of seed survival and seedling establishment:
the “escape hypothesis”; the “colonization hypothesis”; and “the directed
dispersal hypothesis”.
1. Escape hypothesis: this first hypothesis, also known as Janzen-Connell
hypothesis (Janzen, 1970; Connell, 1971), suggests that the survival rate of
seeds increases proportionally with the distance from the parental plant at
which the seed is deposited. The higher mortality near the parental plant is
due to: (1) the higher chances for seeds to be eaten by seed predators, such
4
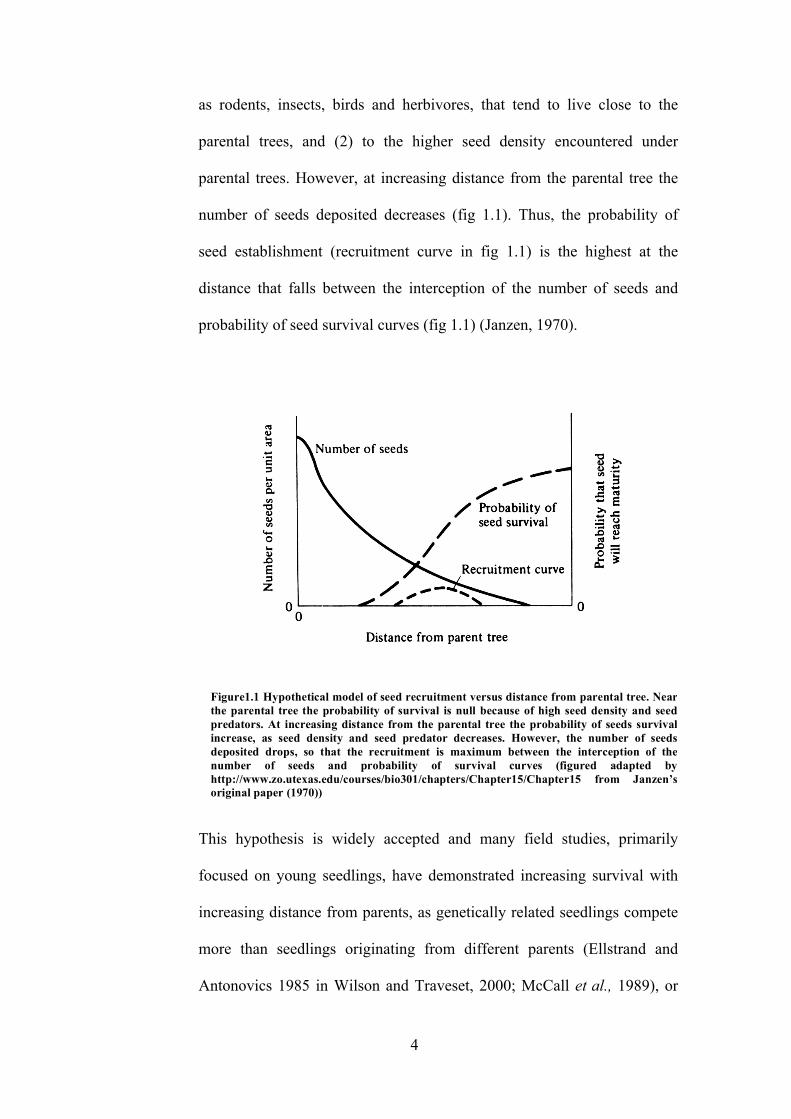
as rodents, insects, birds and herbivores, that tend to live close to the
parental trees, and (2) to the higher seed density encountered under
parental trees. However, at increasing distance from the parental tree the
number of seeds deposited decreases (fig 1.1). Thus, the probability of
seed establishment (recruitment curve in fig 1.1) is the highest at the
distance that falls between the interception of the number of seeds and
probability of seed survival curves (fig 1.1) (Janzen, 1970).
This hypothesis is widely accepted and many field studies, primarily
focused on young seedlings, have demonstrated increasing survival with
increasing distance from parents, as genetically related seedlings compete
more than seedlings originating from different parents (Ellstrand and
Antonovics 1985 in Wilson and Traveset, 2000; McCall et al., 1989), or
Figure1.1 Hypothetical model of seed recruitment versus distance from parental tree. Near the parental tree the probability of survival is null because of high seed density and seed predators. At increasing distance from the parental tree the probability of seeds survival increase, as seed density and seed predator decreases. However, the number of seeds deposited drops, so that the recruitment is maximum between the interception of the number of seeds and probability of survival curves (figured adapted by http://www.zo.utexas.edu/courses/bio301/chapters/Chapter15/Chapter15 from Janzen’s original paper (1970))

5
decreasing density of propagules, as competition among seeds is lower at
lower density (e.g. Gilbert et al., 1994; Harms et al., 2000; Swamy and
Terborgh, 2010; Schupp and Jordano, 2010). The high mortality of the
offspring near its parental trees opens up spaces for other plant species that
otherwise would be excluded by the intense competition from the seeds of
nearby plants (Howe and Miriti, 2000). This results in the enhancement of
species coexistence and species richness (Harms et al., 2000; Schupp and
Jordano, 2010). Another way plants have to escape predation is dispersal
in time (Guzmán and Stevenson, 2011). This refers to the mechanisms that
cause seeds to be deposited with a delay in relation to the fruiting period
of a plant. Seed dispersers that have long gut passage time provide this,
such as chelonians, which have a gut retention time that ranges between 4
and 28 days (Strong, 2005). Seed dispersal in time was demonstrated to
decrease the risk of density-responsive predation that occurs during the
fruiting period (Guzmán and Stevenson, 2011).
2. Colonization hypothesis: this hypothesis suggests that occupying new,
favourable habitats, might be the major advantage of seed dispersal (Howe
and Smallwood, 1982). This is because (1) parental plants have low
chances to replace themselves in situ for the reasons explained in the
escape hypothesis, and (2) seeds that are disseminated as widely as
possible increase their chances of finding new areas with optimal
conditions and less competition, thus increasing plants’ fitness. This
strategy is thought to be advantageous, for example, for plants whose
requirements for establishment are met in scattered locations, such as tree-

6
fall gaps or fallen logs (Sargent, 1995; Wilson and Traveset, 2000) in
comparison to less “exigent” plants, such as shade tolerant plants.
However, there are no direct tests of this hypothesis in forests, but it has
been explored experimentally (Clark et al., 2004). Results showed that
seeds’ colonization widely varies among species and also between
individuals of the same species, making difficult to confirm this
hypothesis (Clark et al., 2004).
3. Directed dispersal hypothesis: this hypothesis is valid for dispersal via
zoochory only, as it suggests that plants aim to ensure that diaspores reach
deposition sites especially suitable for establishment and survival (Howe
and Smallwood, 1982; Wenny, 2001). Thus, it requires that dispersal
agents (animals) take the seeds to non-random places (Howe and
Smallwood, 1982). Typical examples of directed dispersal are given by
scatter-hoarding animals (Vander Wall, 2010), some species of fruit eating
birds (Wenny and Levey, 1998; Wenny, 2001), ants (Ohkawara et al.,
1997) and frugivorous reptiles that use treefall gaps (see chapter 5).
However, plants rely on more than one animal, and often on more than one
dispersal agent to ensure dispersal of their seeds, suggesting that directed
dispersal is not the primary advantage of seed dispersal (Wenny, 2001).
Of course, these hypotheses are not mutually exclusive. According to the species
and the environmental situation under investigation, one can be more
advantageous than the other, but it is likely that most of the plants benefit from all

7
of them (Wenny, 2001). Seeds must be dispersed in order to increase plants
fitness and plants would be better benefitted by dispersal agents that provide long
dispersal distance in favourable sites. Thus, the effectiveness of seed dispersal, i.e.
seed dispersal events resulting in the successful establishment of new individuals
(Schupp, 1993), relies mostly on the mechanism and dispersal vector adopted by
the plant (Schupp et al., 2010).
1.2 Mechanisms of seed dispersal
In order to achieve effective dispersal (sensu Schupp et al., 2010), plants
have evolved different seed dispersal mechanisms, which involve different
dispersal vectors; these can be abiotic, such as wind and water, and biotic, such as
animals (Nathan et al., 2008). According to the strategy adopted, seeds have
evolved different characteristics to better serve the purpose. To follow, a brief
description of the seed dispersal mechanisms, particular attention will be given to
seed dispersal by endozoochory as it is the process this thesis is focused on.
1.2.1 Explosive seed dispersal
Explosive seed dispersal is the mechanism according to which seeds are
discharged by the rupture of the fruit due by elastic contractions of its tissues
(Garrison et al., 2000). This mechanism is regulated by humidity and temperature;
when the pod containing the seeds dries, it breaks releasing the seeds in the
environment. This mechanism is used for example by plants of the family
Geraniaceae, Fabaceae and Brassicaceae. The distance at which the seeds are

8
launched after the explosion can reach up to half a metre (Evangelista et al.,
2011). Thus, a relatively small distance compared to other dispersal means (see
below). Nonetheless, it is common that plants that primarily use explosive
dispersal also rely on insects, in particular ants, for secondary dispersal, ensuring
that the seeds are transported farther away and buried in an appropriate microsite
(Willson, 1993; Narbona et al., 2005). The advantage of explosive dispersal is
that the plant does not require a primary dispersal vector, however, the seed
dispersal distances reached by this process are very short in comparison to the
ones reached by other mechanisms explained below.
1.2.2 Seed dispersal by abiotic agent: wind and water
Seed dispersal by abiotic agents is a mechanism adopted by vast range of
plants, from grasses to trees. It depends mainly on winds and/or currents of water.
This kind of dispersal can lead to longer dispersal distance compared to the
explosive strategy, however the range of distances that could be reached vary
significantly according to the configuration of landscape and meteorological
conditions encountered, thus abiotic vectors might be more efficient in certain
types of environments than others (Nathan et al., 2008). Seeds dispersed by wind
are often light and may have wing-like or hairy structures that allow them to be
lifted and pushed by air. A typical example is give by the dandelion seeds
(Hampe, 2004). Ocean currents appear to be the most efficient water dispersal
vector in terms of distance. Although this process might take a very long time
(from days to months), it can transport seeds at hundreds of kilometres of distance
from the starting point. This mechanism requires seeds to have structures that

9
allow them to float and to survive for months in water. A typical example is given
by coastal plants, such as the coconut tree (Thiel and Haye, 2006).
Plants using abiotic dispersal vectors may benefit of long dispersal
distances, which depend on the structures of the seed and the strength of the flow,
however, currents and winds often maintain a consistency in their flow,
consequently decreasing the chances of plants to colonize new areas, and
increasing seed deposition in high seed density areas (Nathan et al., 2008).
1.2.3 Seed dispersal by biotic agent: animals
Seed dispersal by animals (zoochory) is probably the most complicated
dispersal mechanism studied. Unlike dispersal by abiotic factors, zoochory relies
on animal behaviour, which results from internal and external stimuli that might
be difficult to predict (Russo et al., 2006; Cousens et al., 2010). Zoochory
mechanisms can be classified into two main categories: epizoochory and
endozoochory. The first refers to the transport of the seeds on the outside of
vertebrate animals. Seeds that adopt this mechanism are well exposed on stems
and tend to have hairs and spikes able to anchor themselves to the fur and hooves
of mammals (Couvreur et al., 2004a). This allows seeds to be transported and
deposited at distances that vary according to the disperser dimensions and the
adhesive propriety of the seed itself, but that can commonly reach 100 meters
from the parental plant (Couvreur et al., 2004b; 2008). Endozoochory refers to the
transport of the seeds inside vertebrates, thus it requires the disperser to ingest the
seed. Plants in the tropical regions mostly adopt this seed dispersal mechanism, in
fact between 50 to 90% of shrubs and trees species rely on fruit-eating vertebrates

10
for dispersal (Fleming et al., 1987). This process requires an active uptake of the
seeds by the dispersal vector and, to be successful, the seeds have to survive three
key stages: uptake, transport (in the gut) and deposition (fig 1.2). Each stage of
this process encompasses costs for plants, which are described in table 1.
Figure 1.2 Cycle of seed dispersal by endozoochory. The boxes indicates seeds dispersal pattern, while the processes are indicated in italic font. In red are indicated the stages that are mainly controlled by animals. The dashed line indicates the possibility of secondary dispersal by a different dispersal vector (figure adapted from Wang and Smith, 2002)
Adultplantdistribution
Fruitavailability
Seeduptake
Seeddeposition
Seedlingdistribution
Juvenileplantdistribution
Fruit production
Fruit removal
Seed transfer
Secondary dispersal
Germination
Seedling establishment

11
Table 1 Costs of the seed dispersal by endozoochory (adapted from Bonte et al., 2011)
Phase Cost Causes
Fruit production Energetic cost Metabolic investment in the production of fleshy fruits.
Fruit removal Risk cost Mortality and damage due to fruit predation.
Seed uptake Risk cost Seed mortality during ingestion due to animals’ chewing.
Seed transfer Risk cost Seed mortality due to animals’ digestive process.
Seed deposition Opportunity and risk cost
Mortality due to poor quality habitat.
Post transfer predation.
Germination Time and risk cost Possible longer dormancy period because of the conditions of the new area.
Herbivory on young seedlings.
Seedling establishment Opportunity cost Lesser habitat quality
1.2.3.1 Uptake: finding and eating the fruit
The first step of endozoochory is the ingestion of the seed by the animal.
At this stage it is essential that plants attract and motivate dispersal vectors to
ingest their seeds (this topic will be extensively discussed in section 1.5.2 and
chapter 3). To this purpose, seeds are wrapped in a nutritious and fleshy product,
the fruit, often externally characterised by bright colours and scents. The pulp of
the fruit contains nutrients such as water, fat, sugar, protein and minerals, thus it
represents an excellent food source for animals (Fleming and Kress, 2011; Cazetta
et al., 2009), at a level that some species are now defined as frugivores, as their
diet is composed of more than 70% fruit. This category includes species of
tropical birds, mammals, and reptiles. Seeds can have different shapes and sizes

12
and they are commonly protected by a lignified layer endocarp. During uptake,
seeds may encounter their first cause of mortality due to animal chewing.
Mortality rate depends on both seeds (characteristics of the endocarp) and animal
species (teeth) and can range from 0 to more than 50% (Traveset, 1998; Cosyns et
al., 2005). At this stage, seed dispersal effectiveness, i.e. the actual number of
seeds that will successfully establish, is generally enhanced by (1) an abundant
seed uptake, because the bigger the number of seeds dispersed, the bigger are the
chances that part of them would end in favourable areas (Schupp et al., 2010), (2)
a fast seed removal, as it decreases the chances that fruit would be eaten by seed
predators or remain under the parental tree (Schupp et al., 2010) and (3) low
mortality due to animal chewing.
1.2.3.2 Transport
The transport of the seed by endozoochory is carried out inside the gut of
the seed disperser. This phase determines the dispersal distance from the parental
plant (e.g. Cain et al., 2000; Jordano et al., 2007; Nathan et al., 2008). As we saw
in the previous section (1.2), seeds increase their chances of survival at increasing
distances from the parental trees, in particular if they are deposited at a distance
where the recruitment is the highest (see figure 1.1, section 1.2) (Janzen, 1970).
The dispersal distance is calculated by the gut retention time multiplied by the
daily distance travelled by the animal (Nathan et al., 2008). Therefore, the most
efficient disperser would, hypothetically, be an animal with slow digestion, that
travels long distances every day. However, there is a trade-off between the gut
passage time and the viability of seeds after gut passage (Traveset, 1998): the

13
longer the seeds stay in the gut, the greater are the chances that seeds would be
damaged by digestion processes. Although many factors contribute to seed
viability after gut passage, including the features of the digestive tract of the
disperser, the characteristics of the seeds (e.g. thickness and size of seed coat), the
amount and type of food ingested along with the fruit (see Traveset, 1998 for a
complete review); the rate of seed viability after defecation is commonly used to
measure the efficiency of the seed disperser (Schupp et al., 2010). The distance
travelled by frugivores varies substantially among species (e.g. Jordano et al.,
2007; Wotton and Kelly, 2011) and is impacted by the distribution of resources in
the environment, as animals tend to be attracted and spend longer time in areas
where the resources are abundant (Russo et al., 2006). The quality of the
movement, other than the distance, is also important, as it affects the shape of the
seed shadow of trees and the local density of seeds: for example, an animal that is
very active, but moves always in the same area, would provide a smaller and more
dense seed shadow than an animal that is less active but moves in many directions
(Wescott and Graham, 2000; Clark et al., 2005; Di Fiore and Suarez, 2007). How
frugivores’ movements affect seed dispersal will be discussed in more in depth in
section 1.5.4.
1.2.3.3 Deposition
The site where the seed is deposited is important, as it influences the
chances of seedling establishment and future fitness of the plant (Shupp et al.,
2010). The microsite is defined as an environmental area suitable for the seed
establishment of a given species (Nathan and Muller-Landau, 2000). The quality

14
of the deposition site depends on to the distance from a conspecific, habitat
variability and competition with neighbouring plants (Schupp et al., 2010). It
could range from small scale, for example the advantages received from seed
burial (Strong and Fragoso, 2006; Vander Wall, 2010), to large scale, as the
consequence for dispersal in close canopy in comparison to gaps in the forest
(Herrera et al., 1994; Wenny and Levey, 1998). The success of this phase depends
mostly on the animals’ use of the environment and/or its defecation behaviour
(Nathan et al., 2008). Tapirs (Tapirus terrestris), for example, defecate in
dedicated latrines, resulting in areas far from the parental trees where seed density
is high (Fragoso et al., 2003). Reptiles tend to use forests gaps more than other
frugivore species, because of their thermoregulatory needs (Greenberg, 2001)
favouring the establishment of pioneer species (Popma et al., 1988). However,
despite the numerous studies on seedling survival and germination after gut
passage time in laboratory settings (e.g. Traveset et al., 2001; Cosyns et al., 2005;
Mancilla-Leytón et al., 2011) precise data in nature on post-dissemination stages
of seed dispersal are lacking. Thus, the link between seed dispersers’ activity and
the actual quality of deposition sites is not clear (Schupp et al., 2010).
1.2.3.4 Diplochory: seed dispersal does not stop with the primary vector
In the previous sections, the principal mechanisms that plants adopt to
disperse their seeds have been briefly explained. However, even if they are
generally divided into three disjointed categories, studies have shown that this
should not be the case: the seeds’ complete journey does not always end after the
primary dispersal vector, and, in most cases, it relies on more than one mechanism

15
(e.g. Nathan et al., 2008; Traveset et al., 2014). Seeds primarily dispersed by
wind can successively be transported by water (Hampe, 2004) or animals
(Tackenberg et al., 2006). Seeds transported by endozoochory can receive a
second passage from animals that feed on faeces of the primary disperser, such as
insects (Christianini and Oliveira, 2010). All the mechanisms that provide
secondary seed dispersal go under the definition of diplochory (for a complete
review see Vander Wall and Longland, 2004). Although it is a topic that has
received less attention than primary dispersal due mostly to logistical challenges
(Traveset et al., 2014), diplochory could reshape the seed shadow of trees
increasing significantly the dispersal distance and transporting seeds to more
favourable germination sites (Vander Wall and Longland, 2004; Traveset et al.,
2014). Ants and dung beetles, for example, tend to bury the seeds offering them
more protection than if they were exposed on the soil (Vander Wall and Longland,
2004; Narbona et al., 2005). Thus, diplochory should receive bigger attention in
the future to complete the seed dispersal loop.
1.3 The importance of reptiles as seed dispersers
Seed dispersal by reptiles, or saurochory, has received less attention than
endozoochory processes performed by mammals and birds. This is the case (e.g.
crocodile, Platt et al., 2013), because reptiles are considered mainly carnivorous,
e.g. only 1% of lizards are known to be totally herbivorous (Cooper and Vitt,
2002), thus their role in seed dispersal has been poorly investigated. However,
recent investigations have shown that many species of reptiles complement their
diet with nectar and fruits: 34 species of lizards (Olesen and Valido, 2003,

16
Godínez-Álvarez, 2004), 13 crocodylia species (Platt et al., 2013), and one
species of snake (Engel, 1997) have been observed eating fruits. Chelonians are
an exception among Reptilia, since 25% of them are recognised as herbivorous
(King, 1996 in Olesen and Valido, 2003) thus, they have received more attention
as seed dispersers. It is believed that reptiles played an essential role as dispersers
for the first angiosperms with fleshy fruits that appeared on earth, as mammals
were still not present, and nowadays it is estimated that saurochory represents the
1% of all endozoochory (Olesen and Valido, 2003). Therefore, it is a topic that
deserves attention, in particular, for two aspects that make this mechanism very
peculiar: (1) studies revealed that saurochory plays an essential role in
environment where the big dispersers are missing, e.g. in insular contexts (Olesen
and Valido, 2003). A recent study on seed disperser-plant interactions in the
Galapagos, for example, showed that reptiles were surprisingly important in this
role, as the 50% of plant-reptiles interaction lead to seed dispersal events, in
comparison with the 16% reported for birds (Heleno et al., 2011). (2) Reptiles are
able to provide excellent seed deposition microsites. They are ectothermic
animals, thus they are forced to visit places exposed to the sun, such as tree-fall
gaps in the forest, and they tend to rest in cover shelters under rocks or dead
wood. Both conditions are excellent for the seeds because in the first case they
would have the advantage of solar radiations; in the second case seeds would
receive protection from grazing herbivores.

17
1.3.1 Seed dispersal by snakes
Seed dispersal by snakes is a phenomenon that has not been well
documented. From the few studies that have reported snakes eating fruits (see
Engel, 1997), it seems like direct ingestion of fruits is triggered by the infestation
of the pulp by insect larvae (Mookerjee, 1946; Pope, 1961 in Engel 1997).
Otherwise, the presence of fruit in snakes’ stomachs, might be due simply to the
ingestion of prey that had been feeding on fruit, thus it is possible that snakes act
indirectly as secondary dispersers. Foraging habits apart, a factor that might
represent a problem for the seeds ingested by snakes is the extremely powerful
digestive juices in their stomach. Engel (1997) addressed the question of whether
seeds are able to survive gut passage in snakes. He fed five snakes of four
different species (Rhamphiophis rubropunctatus, Rhamphiophis oxyhyncus, Naja
mossambica, Bitis arietans) with dead rats containing a known amount of seeds.
Then he analysed the seeds in the faeces and he surprisingly found that two of the
five species of seeds fed to the snakes, one hard coated and one soft coated seed,
were viable. However, the germination time was longer than if the same seeds
were ingested by bushbaby or planted directly from the fruits. The gut passage
time ranged from two to 14 days, as found for most of reptiles. Thus, snakes can
potentially contribute to seed dispersal, however the extent and how often this
phenomenon would happen in nature is unclear. Further investigation is needed to
clarify and evaluate the role of snakes as seed dispersers.

18
1.3.2 Seed dispersal by crocodilians
A recent review on the foraging habits of crocodilia was made in 2013
(Platt et al., 2013). In this review the authors included information collected from
papers and from field data regarding the stomach contents of the American
alligators (Alligator missisipiensis) given by the Luisiana Department of Wildlife
and Fishery. Results showed that the 72.2% of crocodylia species, had fruits in
their diet. In the majority of cases, data did not report if the individuals ingested
directly the fruit, or if the presence of seeds in their stomach and faeces was the
results of a secondary ingestion as in the case of snakes (Nogales et al., 1998;
Platt et al., 2013).
However, Platt and colleagues hypothesized that alligators might ingest
seeds on purpose, for the same reason that they ingest small rocks. There was no
evidence of frugivory in crocodylia, however, the authors suggested that these
reptiles could potentially act as good seed disperser as they do not chew the food
(Cleuren and De Vree, 2000), which would result in no damage for seeds during
ingestion process, and their daily movements can be extensive. This, combined
with a gut passage time above four days on average (Davenport et al., 1990),
would provide long dispersal distances, but no real data are available to verify
these assumptions. Faeces were found at basking sites, in particular, Crocodylus
siamensis faeces were found along seasonally exposed lake margins and on mats
of floating vegetation (Casas-Andreu and Quiroz 2003), all of which represent
good deposition microsites. All these characteristics would make crocodylia
excellent seed dispersers. However, the pH of their stomach is highly acidic and
the muscular action of the stomach walls is strong, thus the condition of seeds

19
after gut passage is uncertain. A recent study (Rosenblatt et al., 2014) looked
particularly into this matter, investigating seeds of pond-apple tree viability after
gut passage in the stomach of Alligator mississippiensis. Results were not
positive, as seeds were found to be incapable of germination, suggesting that
alligators act like seed predators rather than seed dispersers. However, one study
is not enough to evaluate the role that these reptiles play on seed dispersal. Seeds
of different species should be tested, before drawing definite conclusions.
1.3.3 Seed dispersal by lizards
The majority of the studies on seed dispersal by lizards, and saurochory in
general, takes place on islands (Olesen and Valido, 2003). Populations of lizards
on islands are found to have bigger fruit and nectar components in their diet,
compared to lizards on the mainland (Olesen and Valido, 2003). It has been
hypothesized that this is due to the combination of two phenomena: the scarcity of
arthropods and lower predation risks (Olesen and Valido, 2003; Gódinez-Alvarez,
2004). The shortage of insects in insular ecosystems might have driven
competition for food between lizards forcing them to expand their diet (the same
situation has been observed in desert environment (Brown, 1991;Whiting and
Greff, 1997). At the same time, it is generally recognized that frugivory and/or
herbivory are associated with larger body size, because of the adaptations of the
digestive tract necessary to digest plant material (Cooper and Vitt, 2002, Herrel et
al., 2004). Larger body equates to bigger visibility to predators, but in
environments where predators are almost absent this increase in size does not
represent a substantial risk for the animal. Moreover, the fact that on islands there

20
are no native mammals and fewer birds in comparison to the mainland, has
opened a niche that has been occupied by these reptiles (MacArthur et al., 1972).
In general, studies on frugivorous lizards agree that they represent good
seed dispersers; these reptiles ingest a good amount of seeds of different plants,
cause little or no damage to the seeds during the ingestion and digestion
processes, and provide good deposition microsites. More rare are data on lizard
movements, which leaves uncertain their contribution for long distance dispersal
(Valido and Nogales, 1994, Nogales et al., 1998, Godinez-Alvarez, 2004, Nogales
et al., 2012). Just to give some numbers, a study on 441 faeces of the lizard
Gallotia galloti, in the Canary Island, revealed that they contained 1526 seeds.
According to the plant species, seeds experienced low or no effect at all on their
germination rate after gut passage, with less then 3% of damaged seeds reported
(Valido and Nogales, 1994).
1.3.4 Seed dispersal by chelonians
As already mentioned, chelonians have received more attention in the
evaluation of their contribution as dispersers, because of the substantial number of
species, on either islands and mainland, that are known to be highly frugivorous
or herbivorous. In many ecosystems the interaction of turtles with plants is so
important that they have gained the title of “ecosystem engineers” (Griffiths et
al., 2010). For example, the gopher tortoise Gopherus polyphemus contributes to
seed dispersal, nutrient cycling and maintenance of habitat heterogeneity of the
North American grasslands and forests (Birkhead et al., 2005; Means, 2006); and
terrapins (Rhinnoclemmys funerea) are important in the seed dispersal of aquatic

21
plants (Moll and Jansen, 1995). On islands the dispersal services of tortoises are
so fundamental that the areas where they have become extinct are facing serious
problems of habitat loss. For example, on the Mascarenes Islands, the loss of the
giant tortoise Cylindrapsis sp., has caused the degeneration of the native grassland
community and plants with large fruits have suffered a decrease in dispersal and
fitness (Griffiths et al., 2010). To overcome the lack of dispersal, non-indigenous
tortoises (Aldabrachelys gigantea and Astrochelys radiate) with similar habits to
the extinct indigenous ones were introduced in a process defined as “taxon
substitution” (Hansen et al., 2010), with an attempt to recreate the lost interaction
and restore lost vegetation. The introduced tortoises helped to restore the endemic
fauna by grazing preferentially on the faster growing exotic plants. This reduced
the reproduction of faster growing plants and, as a consequence, the endemic
plants had less competition and time to re-establish. Moreover, tortoises
consumed and dispersed the large seeds whose dispersal had been limited since
the extinction of the previous species (Griffiths et al., 2010). This attempt at
species translocation is not an isolated case; a similar approach has also been
employed in Indian Ocean Island (Jones, 2002) and in North America, but with
the attempt to re-establish the indigenous tortoise population (Tuberville et al.,
2005).
1.3.4.1 Tortoises as dispersal vectors in tropical environments: the role of the
red-footed tortoise
Frugivorous tortoises are considered important seed dispersers in tropical
environments (e.g. Moll and Jansen, 1995; Varela and Bucher, 2002; Liu et al.,

22
2004, Strong and Fragoso 2006, Jerozolimski et al., 2009, Blake et al., 2012). I
will discuss the reasons why, by focusing on the red-footed tortoise (Chelonoidis
carbonaria), as it is the experimental model used in this thesis, but they can be
applied to other tropical species (e.g. Chelonoidis denticulata, Rhinnoclemmys
annulata).
The red- footed tortoise inhabits the South American forest from Panama
to the east part of Brazil. Despite its highly frugivorous diet, it has received little
attention as potential seed disperser. To date only two studies have examined its
role as seed disperser, one in 2006 by Strong and Fragoso and the other in 2011
by Wang et al. From these studies the judgement of red-footed tortoise as a
disperser is positive. As first, tortoises do not chew their food. This means that
they swallow pulp and entire seeds without damaging them. Moreover, tortoises’
digestive processes do not damage seeds: studies reported between 90 and 100%
of viability of seeds in the faeces of red-footed tortoise (Strong and Fragoso,
2006, Wang et al., 2011). They eat a variety of different fruits at the same time
(Moskovitz and Bjorndal, 1990). This results in faeces presenting a mixture of
seeds of different species that will be deposited together, reducing the intra-
specific competition during the establishment phase of seedlings. Tortoises feed
on the ground, thus they help remove fruits discarded by other frugivores species,
such as birds and monkeys (Strong and Fragoso, 2006), that otherwise would
suffer a higher risk of mortality due to the proximity of the parental tree (see 1.2).
More importantly, red-footed tortoises provide also secondary dispersal of seeds
as their diet includes the faeces of other dispersers (Moskovitz and Bjorndal,
1990; Merchan et al., 1998). Thus, they participate to re-shape the seed shadow of
trees. As explained in the section 1.2, essential for the quality of seed dispersal, is

23
the distance at which seeds are going to be deposited from the parental plant. For
this to be maximized, seed dispersers should travel long distances and have,
ideally, a long gut retention time. Red footed tortoises do not excel in activity and
daily movement, their average movement is between five to 22 meters per hour,
but there have been documented cases in which tortoises travelled at 200 m per
hour (Moskovitz and Kiester, 1987). However, they possess a very slow
metabolism, on average four days (Strong and Fragoso, 2006), that allows
tortoises to disperse seeds at an average distance of 100m from the parental tree,
with peaks calculated around 600m (Strong and Fragoso, 2006). In addition, the
length of the gut passage of the tortoises provides dispersal in time, decreasing
seed predation risk (Guzmán and Stevenson, 2011). Tortoises spend their resting
time hidden in tight burrows covered by leaves, preferably in tree-fall gaps, or
under dead wood. They use these places as shelter also when they are flooded and
muddy (Moskovitz, 1985). These conditions make these sites excellent deposition
microsites, where the chances of seed establishment are high (Strong and Fragoso,
2006). Often, more than one tortoise uses the same burrow; this contributes to
enhance the variety of seeds deposited in the same site (Moskovitz, 1985). Like
all the reptiles, red-footed tortoise are ectothermic animals, thus they need an
external heat source to regulate their body temperature. For this reason they spend
time in forest gaps, which are rarely used by other seed dispersers, such as birds
and mammals, because they are open areas where the predation risk is higher.
Gaps are excellent deposition microsites, in particular for gap-dependent pioneer
species such as Genipa Americana (De Souza et al., 1999), because they are the
rare areas in the forest where the sunrays hit directly the soil (De Souza et al.,
1999; Strong and Fragoso, 2006).

24
In summary, reptiles cover an important role as seed dispersers, in
particular for their peculiar use of tree-fall gaps and shelters that provides
excellent deposition microsites for seeds. The attempts to define the role of
reptiles as seed dispersers are substantially increasing, however, little is still
known about two classes, snakes and crocodylia, while it seems well recognized
that lizards, and in particular tortoises, provide essential dispersal services,
especially in an insular context, where their services are not easily replaceable by
non analogous animals.
1.4 The idea: introducing animal cognition to the seed dispersal
process
In the previous sections, it was explained how the acquisition and
transport of seeds suitable microsites is essential for successful endozoochory. To
date, research on frugivores has focused mainly on their behavioural ecology,
assessing their quality as dispersers on the basis of the number of fruit species
eaten, the number of seeds processed, the amount of viable seeds contained in
faeces and the estimation of long seed dispersal distance combining together data
on animal daily movement and gut retention time (e.g. Schupp, 1993; Link and Di
Fiore, 2006; Strong and Fragoso, 2006; Jerozolimski et al., 2009). However, these
studies tend to describe the seed dispersal phenomena without considering the
cognitive skills behind the decision making process of the animals, i.e. whether
what animals learn and remember impacts upon where they access fruit and

25
deposit seeds (Corlett, 2011). Animals are likely to use a multitude of cognitive
skills for successful foraging: it would be adaptive to be able to learn about cues
in order to identify fruits, to use remote environmental stimuli to locate potential
food sources in time and space, to be able to discriminate between samples in
order to select edible or better fruits in terms of quantity and quality. Further,
short and long-term spatial memory is likely to be important to be able to relocate
food sources. Thus, an integrative approach in the analysis of frugivores’
cognitive skills may reveal impacts on seed dispersal otherwise difficult to
discover, helping, for example, to predict animals’ foraging decision or movement
patterns. Therefore, this thesis aims to combine the ecological concepts of seed
dispersal with a cognitive approach, in order to examine the impact that learning
and memory play on frugivores’ foraging behavior, and the consequent impact
upon seed dispersal.
1.4.1 Why what animals choose to eat impacts on seed dispersal
Understanding frugivores’ foraging behavior, in particular under choice
situation, e.g. how they select fruits, is essential to comprehend the seed dispersal
process. According to Schupp et al. (2010), the quality of a seed disperser, in
terms of amount of seeds dispersed from an individual plant, is calculated by
multiplying the amount of seeds that the animal removes every foraging bout by
the number of times the animal visits the same plant. This implies that if animals
are motivated to forage and return to feed from the same food source, then this
would enhance the seed removal process and increase a plants fitness. But what
26
motivates animals to choose some fruits instead of others and to visit a particular
plant multiple times?
1.4.2 Food motivation and choice in animals
In his recent review, Corlett (2011) described how seed dispersers might
use a multitude of physiological (e.g innate appetite for deficient nutrients) and
cognitive skills in order to make their food choices. The preference for a fruit
could be driven by its traits, such as colour, scent and shape. Many studies have
devoted attention to how these traits can be used as indicators of nutrient content
and ripeness of fruits (e.g. Schaefer et al., 2003; Schaefer et al., 2004; Cazetta et
al., 2009; Schaefer, 2011; Cazetta et al., 2012) and cognitive studies have
confirmed that animals possess the discriminatory skills - i.e. ability to detect
specific features of an object in order to recognize and categorize it (Wilkinson
and Huber, 2012) - to discriminate successfully on the basis of these cues (e.g.
mammals discrimination of colours: Kelber, 2007; Dominy et al., 2003; shape:
Gosset and Roeder, 2000; smells: Hübener and Laska, 2001; and textures: Dominy
et al., 2001; visual discrimination in fish: Colwill et al., 2005; visual
discrimination in reptiles - brightness, colour and shape - reviewed in Burghardt,
1977; olfactory and visual discrimination in insects: Balkenius et al., 2006). Thus,
it is generally accepted that perceptual features of fruit play a fundamental role in
attracting frugivores and are used by animals to select the best products (Schaefer
et al., 2004).
After eating a fruit and moving away from the food source, the decision to
eat that fruit again could depend on its taste (Yarmolinsky et al., 2009; Zhao et al.,

27
2010) and digestive feedback (Yearsley et al., 2006; Werner et al., 2008).
However, this information it is not enough to explain what motivates an animal to
choose certain fruits: in their natural environment. Frugivores show a very mixed
diet (Moskovits, and Bjorndal, 1990; Guzmán and Stevenson, 2008) and it is
difficult to find a correlation between fruit eaten and animals’ fruit preferences
reported in experiments (Carlo and Morales, 2008). To explain this, a first
hypothesis states that frugivores respond to their nutritional needs (Murphy and
King, 1987), tending to balance their nutrient intake, such as minerals, protein and
vitamins (McCaughey and Tordoff, 2002). Thus, their choice of fruit would be
driven by innate appetites for nutrients and not exclusively by their preferences
(Murphy and King, 1987). A second hypothesis relies on the optimal foraging
theory, according to which animals adjust their behavior in relation to the cost and
benefits associated with a food source (Kacelnik and Houston, 1984; Pyke, 1984).
In this scenario, the quantity and quality of food obtained at each foraging event
(benefits) and other factors (costs), such as the proximity of the food source to the
current position of the animal (Levey et al., 1984), the ability of the animal to
relocate the food source (Di fiore and Suarez, 2007), food accessibility, location in
relation to other food sources and predation risk, can alter fruit preferences
(Kacelnik and Bateson, 1996; Kacelnik et al., 2013). This is supported, for
example, by studies on tanagers (Mitrospingus cassinii, Habia fuscicauda,
Ramphocelus passerinii, Tachyphonus. delatrii) and manakins (Pipra mentalis,
Manacus candei) that change their likelihood of feeding on less preferred food
when the distance between perches increases (Levey et al., 1984); steller’s Jays
(Cyanocitta stelleri) that modify their food choice depending on the presence of
other conspecifics in the feeding area (Bekoff et al., 1999), and chaffinches

28
(Fringilla coelebs) that choose less cryptic seeds in environment where the
predation risk is higher (Jones et al., 2006). All these features affect animal
motivation to return to certain food sources, thus, they should be taken into
account when considering seed dispersal. Plants that offer the biggest benefits
associated with the lowest costs are the most likely to receive more visits and have
more seeds dispersed than plants with higher costs. Thus, when evaluating seed
dispersal, both benefits and costs should be taken into account to have a more
reliable prediction of the number of visits to a plant and the amount of seeds
dispersed.
1.4.3 Food quantity as motivation for food choice
Food quantity is another important indicator of the nutritional value
(benefit) of food source, however it has received less attention than quality as
parameter for food choice in an ecological context. Together with quality, the
amount of food gained by animals has proved to be one of the major factors that
impact upon their growth and fitness (Pyke, 1984; Guisande, 2000; Cruz-Rivera
and Hay, 2000). This implies that animals would be advantaged if they were able
to determine food patches with the largest amount of food (Dehaene, 1997). The
ability to discriminate between food quantities has been explored and
demonstrated in a variety of taxa (mammals: Ward and Smuts, 2007; Beran, 2008;
fish: Addessi et al., 2008; birds: Al Aïn et al., 2009; amphibians: Krusche et al.,
2010), although very little is known about this ability in reptiles. Most of the
research on this topic has focused on numerical discrimination, an ability that
many animals have been shown to possess (Agrillo et al., 2007; Addessi et al.,

29
2008; Al Aïn et al., 2009). Fewer studies have focused on the ability to
discriminate between different volumes of food (Boysen et al., 2001; Stevens et
al., 2007; Beran, 2008), but this skill is likely to be adaptive as a larger volume of
food is potentially indicative of a higher amount of calories, and by choosing it,
animals could maximise the mass of food obtained at one time (Mahamane et al.,
2014). Chimpanzees (Pan troglodytes), for example, are biased towards sets of
food that include the largest item even if the total amount of food is smaller than
the alternative sets of food offered to them (e.g. Boysen et al., 2001; Beran, 2008).
However, when the items were replaced by symbols, so that the subjects could not
see the relative sizes, chimpanzee were able to choose the total biggest amount of
food without being biased by its volume (Silberburg and Fujita, 1996). Beran
(2008) suggested that this inclination towards larger items could be ancestral and
adaptive because larger items equate generally to more food. There is evidence
that other species tend to maximize their food intake by preferentially selecting
food of a larger size when foraging (Bern, 1990; Kaufman et al., 1996).
Carnivourous lizards (Varanus albigularis), for example, showed a bias towards
larger snails even if the associated handling cost made them less profitable than the
smaller ones (Kaufman et al., 1996). Therefore, food quantity might be a strong
motivator in animals’ food choice and this should be considered in the context of
seed dispersal. The question whether frugivores choose plants that presents bigger
amount of fruits when foraging in their natural environment and the consequence
for seed dispersal will be investigated in chapter 3.

30
1.4.4 Why spatial learning might influence seed dispersal
As described in the section 1.2 and 1.3, two of the most important features
of seed dispersal are the dispersal distance achieved from the parental tree and the
deposition site (Schupp et al., 2010). For plants that rely on animals as dispersal
vectors, these features depend mostly on animals’ movement behaviour (Howe
and Smallwood, 1982). Ecological studies tend to create a dispersal curves by
combining together data on daily animal movement and gut passage time, the so-
called dispersal kernel (Wescott et al., 2005). This is a probability density
function, which describes the probability of seed deposition at a certain distance
from the parental plant (Nathan et al., 2008). In this way, researchers are able to
estimate how far away the seeds could be deposited from the parental tree, but
without having a clear idea of where the seed is going to be deposited.
Knowing whether and which paths animals are likely to take can help to
predict the distance and quality of the deposition sites, allowing more precise
estimations of seed shadow and seedling establishment (Wang and Smith, 2002).
Whether seed dispersers move at random or follow specific patterns of movement
would impact differently on the seed shadow of a tree: random movements, for
example, might increase the chances of a frugivore to explore new environments
and find new food sources enhancing, as a consequence, the probability that seeds
would be transported and deposited in new areas. The seed-shadow created in this
case would be unpredictable (Boyer and López-Corona, 2009). Non-random
movement, i.e. the animals is able to orientate itself in space and thus can relocate
food sources previously used in the environment, would result in a very different
seed dispersal pattern: if frugivores frequently visit the same areas and follow the

31
same paths, the resulting seed shadow would be less spread than the one
originated by random movement, creating areas where the density of seeds might
be high (Boyer and López-Corona, 2009). For example, Di Fiore and Suarez
(2007) found that over eight years, spider monkeys (Ateles belzebuth) and woolly
monkeys (Lagothrix poeppigii) tended to follow repeatedly the same path
between fruit trees when foraging. The authors also examined the seed shadow
produced by these frugivores and suggested that their movement behaviour
limited the dispersal of seeds to specific areas. As a result, seed density would
increase in those areas. A similar example is given by Tamarins (Saguinus
fuscicollis weddelli) that seem to be able to visit food sources in a spatially
efficient manner, reducing the distance between foraging points by visiting the
feeding sites in progression. The authors suggest that they maintain some form of
internal representation of either the specific or relative locations of the fruit trees
to one another (Porter and Garber, 2013). If this is the case, the resulting seed
shadow of trees would be predictable, and create areas with high seed density
along the paths connecting food sources used by tamarins.
Therefore, knowing about animals’ spatial learning skills and
understanding how these might influence their movements through the
environment would help to predict the structure of future plant communities.
1.4.5 Animal spatial learning
Animals have evolved a multitude of different strategies in order to
navigate in the environment. A first simple approach is represented by the use of
scent trails. This technique consists in releasing pherormones in the environment

32
that can be perceived by individuals of the same species (Karlson and Lüsher,
1959; Pearce, 1997). The use of scent trails was well-evaluated among insects
(e.g. Calenbuhr and Deneubourg, 1992; Billen and Morgan, 1998; Jarau et al.,
2004) and mammals (Skagen et al., 1999; Kozakiewicz and Kozakiewicz, 2004;
Porter et al., 2007) and it serves multiple purposes: it could be use to sign the
pathway that leads to a food source, to mark territories and to signal the presence
of mate or competitors. Typical examples are given by ants, which use chemicals
signals for marking the route from the food to the nest so that other members of
the colony can forage from it (Leuthold, 1975; Beckers et al., 1989; Calenbuhr
and Deneubourg, 1992), and rats that use pherormones to relocate food sources in
the dark, when other navigation mechanisms are not possible (Lavenex and
Schenk, 1998). Moreover, they tend to adjust their spatial preferences according
to the presence of the scent of competitors (Wallace et al., 2002a; Roberts et al.,
2002). This navigation strategy is proved to be efficient as it successfully allows
animals to relocate food sources in the environment without the necessity of
learning and memorizing the path or the features of the landscape that leads to
them. However, it does not allow flexibility in the movement of the animals,
which cannot deviate from the scented path. The seed shadow resulting from seed
dispersers that use this mechanism would be confined to specific areas. As a
consequence the resulting deposition sites would be characterised by high seed
density, which in turn would decrease the survival rate of seeds.
There are other orientation strategies that allow more flexibility in the
choice of path to reach the goal. These rely on the spatial learning and memory
skills of the animal. The information regarding how to relocate a relevant place
can be coded in two different ways: (1) in relation to the animal’s position, or

33
egocentric coding; (2) independent to the animal’s position, or exocentric coding
(Benhamou et al., 1990). In the first case animals process the path to arrive to the
goal location with the information provided by their own movement such as
direction and turns. In the second case animals process the information provided
by landmarks, i.e. an object(s) or feature(s) in the landscape that it is easily
recognizable, and used to individuate the location of the goal (Benhamou et al.,
1990).
An example of an egocentric strategy, that does not require the use of
environmental landmarks, is defined as dead reckoning or path integration. This
navigation strategy allows animals to keep track of its position by taking into
account the distance travelled and the changes in direction that have been made
(Pearce, 1997; Biegler, 2000; Etienne and Jeffery, 2004). This strategy is usually
adopted by animals that live in environments that do not provide visual
landmarks, such as deserts (desert ants: Wehner and Srinivasan, 1981; Collet and
Collet 2000; Wehner et al., 2006). Path integration has been extensively studied in
rats (for a review see Whishaw et al., 2001, Wallace et al., 2002b) and geese (Von
Saint Paul, 1982). It seems that path integration is always active and used to
compute the position of the animal constantly. The information collected is then
used in case the landmarks in the landscape were removed or not possible to be
used, e.g. in total darkness (e.g. Von Saint Paul, 1982; Benhamou, 1997;
Shettleworth and Sutton, 2005). Path integration allows animals to return
successfully to the starting point using also alternative trajectories than the initial
one (Wehner and Flatt, 1972; Shettleworth and Sutton, 2005), e.g. returning
straight to a starting point after a wandering outward journey (Etienne and Jeffery,
2004). Therefore, it allows more flexibility in reaching a goal, than the use of

34
scent trails. However, animals that use this strategy are not able to orientate unless
they themselves get to a location (Gallistel, 1990). The seed shadows resulting
from path integration would be more spread than the one created by scent trail
strategy, as animals can undertake new routes to return to the starting point.
Strategies that allow much greater flexibility in the movements are those
that involve the use of landmarks, because they allow the animal to orientate from
different starting points (Chamizo, 2003). Studies have shown that animals can
learn about landmarks present in the environment as they move through it and
they are able to build associations between the stimuli and the position of the goal,
so that they can eventually use landmarks to navigate towards, for example, a
food source (Kelly and Gibson, 2007). If a single feature is located immediately
by the goal it is defined as a beacon. Animals learn very quickly to derive the
direction of food in respect to this single landmark, without encoding others cues
presented in the environment (Robert and Pierce, 1999). The use of a beacon
allows the animals flexibility in the route to reach the goal. They are not forced to
follow a specific path, but, once they have recognized the visual cues, they can
orientate and arrive at the goal no matter the starting point. This kind of spatial
learning has been verified in various species of birds (Watanabe, 2005; Flores-
Abreu et al., 2012), mammals (Pearce et al., 2001), reptiles (Holtzman et al.,
1999; Lopez et al., 2000; 2001) and fish (Odling-Smee and Braithwaite, 2003).
Thus, beacon learning seems to be a skill spread among taxa. This might indicate
that this navigation strategy is broadly applicable in a variety of environments as
long as they contain stable beacons in order to work effectively (Biegler and
Morris, 1996). The good flexibility offered by beacon navigation might allow
seeds to be dispersed in new areas. However, when animals learned to derive the
35
fastest direction towards the goal from the cue, they tend to follow this most
convenient route (Di Fiore and Suarez, 2007). If this is the case, then the resulting
seed shadows would be restricted to specific areas creating deposition sites with
high seed density.
When multiple stimuli are provided without a beacon, animals learn to use
vectors based on individual cues to define the position of the goal (Chamizo et al.,
1985; Collet et al., 1986; Pearce, 1997). If the position of landmarks is changed,
studies showed that animals are also able to detect the geometric information of
the shape of the experimental arena and use them to define the location of the goal
(Cheng, 1986; Margulles and Gallistel, 1988; Sovrano et al., 2002; Pearce et al.,
2001). A navigation strategy that implies the learning and use of multiple
landmarks is referred as the cognitive map (O’keefe and Nadel, 1978). The
cognitive map can be operationally defined as novel route construction that cannot
be explained by orienting either by pure path integration or by the use of beacons
coincident with the goal (Jacobs and Schenk, 2003). It suggests that animals are
able to create a map-like representation of the environment, in which landmarks
and places are defined in relation to each other rather than to the body of the
animal (Robert and Pierce, 1999). This characteristic would allow animals to
navigate flexibly to a goal location from familiar or novel positions with equal
capacity (Morris, 1981), and to orient efficiently to every place represented on the
map (Pearce, 1997). This allows animals to detour around obstacles (Chapuis and
Scardigli, 1993) or take short cuts (Chapuis, 1987). Cognitive maps were
identified in mammals (e.g. Chapuis, 1987; Gallistel, 1990; Bovet, 1992), birds
(Bingman, 1992; Prior et al., 2002) and, recently, reptiles (chelonians showed
map-like behaviour: Salas et al., 2003; Lopez et al., 2000, 2001; Wilkinson, 2007;

36
2009). This navigation strategy might be advantageous in an environment where
cues are multiple and constantly changing, such as rainforests. Studies on
primates in the wild are trying to understand whether this is actually the strategy
that they use to move efficiently between food sources (Garber, 1989; Di Fiore
and Suarez, 2007; Janmaat and Chancellor, 2010; Janmaat et al., 2013). The seed
dispersal patterns resulting from the use of cognitive map could be potentially
more beneficial to plant dynamics compared to other learning strategies. Thanks
to the flexibility and the possibility to make novel short-cuts provided by the
cognitive map, animals would have a greater probability of visiting new areas,
expanding the seed shadow of plants and increasing their chances to colonize new
patches. This would decrease the possibility of high density seed areas being
formed, resulting in reduced competition between seedlings.
How frugivores’ spatial learning can impact upon seed dispersal will be
further discussed in chapter 2.
1.4.5.1 Saptial learning in the red-footed tortoise
The first study that investigated red-footed tortoise spatial cognition was
carried on in 2007 (Wilkinson et al., 2007). A single exemplar of Chelonoidis
carbonaria was tested in a 8 radial-arm maze, the same type used with rats (Olton
and Samuelson, 1976). The red-footed tortoise was found to be able to perform in
the maze above chance and the navigation strategy used did not appear to be the
result of a stereotyped response strategy, according to which the animal chooses
always the next arm of the one previously visited, nor guided by odour cues
provided by the food, or scent trails left by the animal. Thus, these first

37
preliminary results revealed that tortoises are potentially able to learn about
spatial location and remember about places recently visited, but the mechanisms
underneath this ability were not determined. A proposed hypothesis was that the
tortoise was able to use external-maze cues to orientate and navigate efficiently in
the maze.
This hypothesis was explored in a subsequent study (Wilkinson et al.,
2009), in which the same tortoise was tested in the maze previously described, but
this time, in order to control for the external cues, the maze was totally
surrounded by a black curtain, so that the subject could not use any of the visual
cues offered by the testing room. Attached to the curtain was a set of geometrical
shapes that the tortoise could use as cues and whose position could be
manipulated by the experimenter. Like in the previous experiment, the tortoise
showed an above chance performance in the maze, but this time it adopted a
response-based strategy, according to which the subject entered one arm away
from the previous arm visited. This strategy was independent of the extra-maze
cues provided and surprisingly different from the one emerged in the study of
2007. Once the curtains were removed, so that the tortoise was allowed to use all
the visual cues provided by the training-room, results showed that the tortoise had
apparently reverted to its strategy as in the study of 2007. This means that the
response-based strategy was probably adopted by the tortoise because of the
shortage of visual cues provided. These results suggest that the red-footed tortoise
is able to use more than one strategy to successfully navigate in the environment,
and more importantly, they may be able to adapt the strategy according to what it
is available in the environment. In 2012 (Mueller-Paul et al., 2012) the same
experiment as in 2007 and 2009 was repeated with more subjects, four, in order to

38
try to generalise the results observed. All of the four tortoises performed above
chance, three of them adopting response-based strategy described above with or
without the availability of visual cues, and one acting similar to what was
observed in 2009, thus changing navigation strategy according to the availability
of cues.
The spatial learning skills of the red-footed tortoise were successively
tested using a touchscreen (Mueller-Paul et al., 2014). Previous studies involving
this apparatus showed that there are similarities between spatial learning
performance in the 2D representation of a screen and in a 3D arena (Cheng et al.,
2006), thus it is commonly used to investigate mechanisms that regulate spatial
learning. Two red-footed tortoises took part in the study. They were initially
trained to choose between a right or left stimuli (both identical in appearance) that
appeared on the touchscreen. Once the subjects had learned the task, they were
tested in an arena where the cues appearance and location replicated those used in
the computer simulation. Tortoises chose preferentially the cue on the side that
they had learned on the computer screen. This indicated that tortoises were able to
transfer the learning from 2D to a 3D environment. Then, the same subjects
received a reversal training in the arena. Once they reached the learning threshold,
they were tested on the touch screen. Tortoises chose preferentially the side they
had been previously trained during the initial touchscreen training and not the one
learned during the reversal task in the arena. In this case, tortoises showed the
ability to differentiate the information learned according to the specific context.
Finally, the subjects were tested once again in the arena, where their side
preference was reverted to the one learned during the reversal training phase,
confirming that the tortoises were able to differentiate between the context and

39
apply the information learned to the correct situation. Thus, the results of this
study showed that tortoises are potentially able to transfer knowledge in different
contexts, and also to differentiate between contexts, retrieving information from
the external environment and applying what they specifically learned in it. These
findings have important implications translatable to a natural setting. Red-footed
tortoises are potentially able to apply the information that they have learned in a
specific environment to a new area or a new context, thus navigating efficiently in
environments never previously explored, and, at the same time, remain able to
retrieve the initial knowledge in case they have to face a situation that they had
already encountered, e.g. a visit to an environment that already has been explored.
1.4.6 Why anticipatory behaviour might influence seed dispersal
Plants, as for all the living organisms, follow a reproductive cycle. They
do not produce fruits throughout the whole year, but in specific period/s according
to the species and bio-geographical region they inhabit (Momose, 2004). For
example, plants in the temperate zone usually follow a seasonal cycle producing
fruits exclusively during one season of the year, while some plants species in the
tropical zone, can produce fruits multiple times during a year (see Moskovitz and
Bjorndal, 1990; Momose, 2004; Chapman et al., 2005). In all environments, plant
fruiting cycles are not random but follow specific time intervals over the year
(Moskovitz and Bjorndal, 1990; Momose, 2004). This means that a productive
and non-productive period of a plant can be potentially predicted and anticipated.
It could be hypothesized that being able to learn about plants’ fruiting cycle length
and to anticipate the next fruiting period, would be an advantage for frugivores.

40
This would allow them to enhance their foraging activity by avoiding visiting
plants without fruits and directing their foraging towards more profitable areas of
the landscape. This skill would be particularly helpful, for example, during
periods of fruit shortage in the rainforest, such as in months when only 0.2% of
plants carry fruits (Chapman et al., 2005; Janmaat et al., 2014). The anticipation
of fruiting events would be advantageous also to plants, as they would receive fast
seed removal when the fruits are ready to be eaten, decreasing the chances that
fruits would be consumed by seed predators or remain under the parental tree.
Nectarivores, such as hummingbirds, for example, tend to revisit flowers at the
same rate as they re-fill with nectar, suggesting that they learn about the nectar
production time interval and synchronise their foraging with it (Henderson et al.,
2006). This allows them to save energy otherwise wasted in visiting empty
flowers. However, to my knowledge, it is still unclear whether frugivores are
actually able to anticipate the time and duration of the presence of ripe fruits on
trees.
1.4.7 Do animals perceive the passage of time?
Animals’ ability to perceive the passage of time is a topic that has aroused
interest for many years. There are two main approaches for attempting to address
the issue: (1) the physiological approach, which deals with the mechanisms that
animals evolved in order to perceive environmental cycles and adjust their
behaviour accordingly (Dibner et al., 2010), and (2) the cognitive approach,
which tries to understand the learning processes behind these behavioural changes
and their implications (For a comprehensive review see Roberts, 2002).
41
Physiological studies have revealed that animals are sensitive of time.
Rhythmic processes in organisms from bacteria to human are regulated by self-
sustained oscillators, which allow animals to perceive cycles. These are defined as
cyclic accumulation of proteins that determine the expression or repression of
specific genes that cause changes in the body temperature and/or hormones
concentration. (Hardin et al., 1990; Sehgal, 1995; Kondo and Ishiura, 2000;
Gachon et al., 2004; McClung, 2006). Among these, the most popular is the
circadian clock, which has been found in all the organisms that can perceive light.
This mechanism regulates many vital processes, that are based approximately on a
24 h cycle, such as sleep-awake cycles and part of the endocrine system (Pearce,
1997; Roberts, 2002; Gachon et al., 2004). There is evidence that animals are able
to perceive rhythms with shorter periods of length, from seconds up to 20 h,
called ultradian cycles (e.g, heartbeat frequencies) and longer rhythms, defined as
intradian cycles that range from 30 hours to decades (e.g. mating cycles), by using
different oscillators (Gachon et al., 2004). However, the fact that animals are
sensitive to time does not explicitly mean that they have a concept of time that
allows them to view their memories of past events as having occurred at different
points over an extended duration (Roberts, 2002). This requires the cognitive
approach, which aims to understand how animals’ perception of time might be
used to anticipate future events, in order to ensure the right adaptive response.
Interval timing, is the perception, estimation and discrimination of
durations in the range of seconds-to-minutes-to-hours (Buhusi and Meck, 2005).
In order to time these intervals, animals have a pacemaker accumulator
(Treisman, 1963) that emits pulses at constant rate and allows to compare between
elapsed and remembered intervals of time (Church et al., 1994; Crystal, 2001).

42
Interval timing has been demonstrated in fish (Carassius auratus) (Drew et al.,
2005), birds (Sturnus vulgaris) (Bateson and Kalcenik, 1997), rodents, in
particular in rats (Rattus norvegicus) (Crystal, 2001; Buhusi et al., 2002; Gallistel
et al., 2004), and primates (Macaca mulatta) (Gribova et al., 2002). It is essential,
for example, for motor control and speech generation (Buhusi and Meck, 2005).
Pavlov was the first to investigate interval timing (Roberts, 2002), giving a dog
food at regular intervals of 30 minutes. As response the dog was observed to
salivate few minutes prior the food delivery. Similar results were found in pigeons
and rats, which learned to press a lever only after a scheduled time prior to food
delivery (Crystal, 2001).
As regard circadian cycles, apparently the physiological changes in these
oscillators act as retrieval cues that awake animals’ memory about, for example,
the location of food sources (Roberts, 1998; Roberts, 2002). As a consequence,
animals might use circadian cues to anticipate where to find food at a given time
of the day (Roberts, 2002). Oystercatchers (Haematopodidae longirostris), for
example, were observed to visit mud flats at a precise time every day in order to
feed on molluscs that are only available for a small window of time (Daan and
Koene, 1981); garden warblers (Sylvia borin) were able to choose correctly
between four chambers that offered food at different times of the day (Biebach et
al., 1989); pigeons (Columbia livia) were observed to gather in two outdoor lunch
areas just before the arrival of people (Wilkie et al., 1996). Therefore, the ability
to anticipate where the food is going to be located in the environment would help
animals to forage more efficiently, saving time otherwise spent in looking for new
food sources. In controlled environments, the standard experimental procedure to
examine whether animals can predict a certain event on a circadian cycle is to

43
provide them with food once a day at a fixed time. Restricting feeding schedules
has been shown to restore circadian locomotor activity (Stephan et al., 1979) and
create the so called “food anticipatory activity” that is an increase in activity,
generally accompanied by an increase in body temperature, in the hour before
food delivery (e.g. Stephan et al., 1979; Mistlberger, 1993; Mistlberger, 2009;
Waitt et al., 2001; Feillet et al., 2006; Pendergast et al., 2009). Social animals,
such as macaques, also showed an increase in aggressiveness prior to food
delivery (Waitt et al., 2001), suggesting that the ability to anticipate events in
animals that live in groups and/or feed on the same food sources can increase the
competition for resources. This might imply that the ability to anticipate food
availability is essential when the competition for resources is high, because
animals without anticipatory skills would risk finding no food available.
Animals’ ability to anticipate food delivery events will be discussed
further in chapter 4, focusing in particular on the advantages that this skill would
bring to frugivores and the consequences of such an ability on seed dispersal.
1.4.8 The impact of memory on seed dispersal
Memory is involved in the storage and recovery of information. Therefore,
the study of animal memory could allow us to understand how information
acquired at a particular time might influence animal behaviour (Pearce, 1997).
Memory can be distinguished into short and long-term, semantic and episodic
memory. I will focus here only on the first two, as the cognitive abilities
mentioned in the previous sections (discrimination skills, spatial learning and
anticipatory events) require these types of memory.

44
According to Pearce (1997) short-term memory lasts a brief period of time
and concerns information about the immediate past, therefore it could help
animals to remember which food sources have been recently exploited. Thus,
short-term memory could be the incentive that makes animals move away from a
particular plant, favouring the dispersal of seeds away from the parental tree, or
return to the same place if the food source is not yet depleted. Cognitive studies
using the radial arm maze have shown how rats are able to visit each arm of the
maze in order to collect food, avoiding arms previously visited on a given trial
(Olton and Samuelson, 1976; Olton et al., 1977). This implies that rats are able to
remember the spatial location of the arms recently visited, enhancing their
efficiency in locating the arms that contain food. Similar results were also found
in tortoises (Chelonoidis carbonaria) (Wilkinson et al., 2007) and birds
(Manorina melanocephala) (Sulikowski and Burke, 2007) suggesting that this
skill may be adaptive and spread across different taxa.
Long-term memory lasts greater periods of time and is responsible for the
duration of information retention (Pearce, 1997). How long the memories are
retained varies among species and according to different tasks and consolidation
processes (McCaugh, 2000). To give some examples, pigeons (Columba livia)
proved to be excellent in discriminating among 320 pictures after a two year period
(Vaughan and Greene, 1984), scatter-hoarding animals are superb in spatial
memory tasks, remembering the location of hundreds of caches after several months
(Smulders, 2006; Roth et al., 2012), and territorial sea lions (Eumetopias jubatus)
remember their rivals over multiple breeding seasons and discriminate between
them and novel ‘intruders’ (Gisiner, 1985).
45
As regards frugivores, to my knowledge, there is a lack of information about
whether frugivores’ memory of the features of the fruits would affect their future
foraging choices, or whether frugivores possess any memory regarding plants
fruiting cycles, that might help them to anticipate the presence of ripe fruits.
However, there is increasing attention on their spatial memory retention capabilities
(Di Fiore and Suarez, 2007; Normand et al., 2009; Noser and Byrne, 2010; Jaanmat
and Chancellor, 2010). It might be hypothesised that longer memories about the
spatial location of resources are adaptive, because they would enhance the
efficiency of animals’ foraging, in particular for animals that, like frugivores, rely
on food sources that are to some extent predictable: remembering where fruit trees
are located would allow them to save energy otherwise spent in the search for fruit.
This explains the recent increasing attention on frugivores spatial memory retention
capabilities (Di Fiore and Suarez, 2007; Normand et al., 2009; Noser and Byrne,
2010; Jaanmat and Chancellor, 2010; Janmaat et al., 2013). Knowing if a seed
disperser regularly returns to an individual fruit tree or consumes fruit from a
number of different trees randomly encountered during foraging, would impact very
differently on dispersal dynamics of a tree population (Jordano et al., 2007). Boyer
(2009) produced a model to investigate this question. The model assumed that
foragers knew the environment and retained spatial memory of this environment
and, thus, tended to visit the best patches more frequently. Memory-based ranging
behaviour generated highly heterogeneous seed deposition patterns, in comparison
to a random model, due to the increased probability of seed removal and deposition
in the areas more frequented by frugivores. However, improved memory comes
with a cost (Mary and Kawecki, 2005), thus spatial memory skills might reflect
other necessity of the animals or the seasonality of food availability.

46
How frugivores’ memory skills would impact on their spatial learning,
choice of food and anticipatory activity will be tested using a seed dispersal model,
in chapter 2, 3 and 4. The results will be further discussed with particular focus on
the impact that memory might have on seed dispersal.
1.5 Model species
For the purposes of this thesis, the frugivore red-footed tortoise (Chelonoidis
carbonaria), was chosen as a model. This species was selected for two main
reasons:
1. It is considered an important seed disperser in its ecosystem (Moskovitz
and Bjorndal, 1990; Strong and Fragoso, 2006; Jerozolimsky et al.,
2009).
2. It is a long-lived animal, thus its foraging choices could have long-term
impacts on plant structure in the ecosystem that they inhabit.
The study of the cognitive skills of the red-footed tortoise has recent history
and now the cognitive skill of this reptile have never been considered in the
evaluation of the species as a seeds disperser. However, studying the cognitive
skills of the red-footed tortoise give us important information about how they
might locate and choose between food sources and move in the space, information
that might be crucial in understanding the quantity and quality of its seed dispersal
performance. For example, cognitive studies on spatial learning, revealed that red-
footed tortoise is able to navigate in an environment using more than one

47
technique, being able to adopt a cognitive map-like strategy, learning about visual
cues or adopting an response-based strategy to navigate a eight radial arm maze
(Wilkinson et al., 2007; 2009). This plasticity allowed the tortoise to reduce the
errors in solving the task and be a more efficient forager. More recently, the same
species showed to be capable of solving an egocentric spatial task (Mueller-Paul
et al., 2014). It can be assumed that tortoises would show the same plasticity in
their natural environment. In particular, the maze experiment (Wilkinson et al.,
2007; 2009) showed that C. carbonaria is able to remember and tend to avoid
places in which the food sources have been recently depleted. This is very
important in an ecological setting because it means that potentially tortoises
would avoid returning to a tree recently visited, and that they would be motivated
to move farther from the plant looking for other food sources. This behaviour
would increase the chances that the seeds would be deposited far from the
parental tree.
However, research focused in understanding the cognitive processes that
regulate the foraging activity of red-footed tortoise, and reptiles in general, is
lacking. Whether they learn to use visual cues to discriminate between different
food qualities and quantities would provide information about how they might
select food; investigating their long term memory in spatial and discriminatory
tasks would provide important information about how long they will be able to
use the information previously learned in order to produce faster and more
efficient foraging decisions; no information is available about whether reptiles are
able to time and anticipate events, but this is likely to increase the foraging
efficiency of the frugivores reptile species that rely on food sources predictable in
time. For this reasons, these questions will be investigated in this thesis.

48
1.6 PhD aims and outline
The aim of the present PhD was to investigate the impact of seed
dispersers’ cognition on seed dispersal, with a particular focus on:
1. The “where?”: How spatial learning and memory affects frugivores’
ability to navigate in the environment and to locate previously visited
food sources.
Understanding the strategies used by animals to move in space will
provide important information regarding their movement patterns and,
as a consequence, the shape of the seed shadow. This question will be
investigated in chapter 2.
2. The “what?”: How seed dispersers’ discriminatory skills and memory
affects their choice of fruit, in particular by focusing on their ability to
discriminate the quantity and quality of food.
Understanding food preferences will provide information about which
plants in a landscape are likely to attract more frugivores and receive
higher seed removal than its neighbours. This question will be
investigated in chapter 3.
3. The “when?”: Does the ability to anticipate events and learn about
cycles affect seed dispersal?
Understanding if seed dispersers are potentially able to predict the
fruiting cycle of plants will provide important information about fruit
removal rate. This question will be investigated in chapter 4.

49
Chapter 5 presents a seed dispersal model parameterised specifically with red-
footed tortoise ecological and cognitive data. This model aimed to test the impact
of frugivores that use forest gaps on seed dispersal. The results of these chapters
will be summarised and put in perspective in chapter 6, in which the main
findings and the broader implications of the thesis will be further discussed.

50
CHAPTER 2
2. WHERE?
2.1 Experiment 1. Spatial memory in tortoises: can tortoises
remember where to find food?
2.1.1 Introduction
As mentioned in the introduction (section 1.4.5) animals are able to learn
about information regarding their own movement and/or features of the
environment that can be use as landmarks to orientate. The memory of what they
have learned would then further enhance their ability to successfully navigate in
the landscape and to relocate relevant resources. Spatial memory has been
investigated in a variety of animals (primates: Di Fiore and Suarez, 2007;
Normand et al., 2009; Noser and Byrne, 2010; Jaanmat and Chancellor, 2010;
Janmaat et al., 2013; elephants: Hart et al., 2008; rodents: Oldon and Samuelson,
1976; Morris, 1984; birds: Clayton and Krebs, 1994; Clayton and Krebs, 1995;
Smulders et al., 2010; Flores-Abreu et al., 2012); here I will focus on chelonians
as they are the model species for this thesis.
51
Compared with other cognitive skills, there is a surprising amount of
research investigating chelonians spatial memory. Sea turtles, for example, are
able to return to specific foraging and/or nesting areas at two to four years
intervals (for a review see Lohmann et al., 2008). Turtles were showed to follow
remarkably similar paths (Broderick et al., 2007), however, how they relocate
specific areas after so much time is still uncertain. It appears that they are able to
maintain the direction using a magnetic compass (Lohmann and Lohmann, 1993),
which allows them to distinguish among the different magnetic fields
corresponding to different oceanic regions (Lohmann et al., 2001), and derive
directional information from the movements of the waves (Wyneken et al., 1990;
Lohman et al., 1995). Once arrived in proximity to the goal, turtles may use other
perceptual cues, such as scent and sounds, to identify with precision the final
location (Luschi et al., 2001). Nest site fidelity has also been observed in terrapins
(Chrysemys picta marginata), who are able to retain memory of a specific
location for 6 months to a year, but how they do this remains unknown (Rowe et
al., 2005; Mitrus, 2006). In laboratory studies, terrapins (Clemmys insculpta)
demonstrated to be able to navigate a multiunit maze (Tinklepaugh, 1932). More
recently, the terrapin Pseudemys scripta was showed to be excellent in navigation
based on cue learning, solving a T-maze (López et al., 2000) and a water-maze
(López et al., 2001) using multiple or single visual landmarks. The authors
suggested that terrapins rely on visual cue to orientate using a cognitive map
strategy similar to that postulated for mammals and birds (Wilkinson and Huber,
2012). Gopher tortoises (Gopherus polyphemus) are able to relocate the native
burrows that they tend to re-use as shelter, in the year after they have hatched
(Pike, 2005). The author does not offer any suggestion about the possible

52
mechanism used, however, tortoises were able to relocate the burrows also after
rainy days, which changed the exterior aspect of the nest (Pike, 2005). This
suggests that tortoises might have learned about landmarks in the surrounding of
the burrows or used a path integration strategy to successfully relocate it. Recent
work with red-footed tortoise has shown that they are able to solve an 8 radial
arms maze by remembering the arms that they had previously visited - where the
food had already been consumed - with or without (using a turn-by-one strategy)
the presence of visual cues, suggesting the use of multiple processes to control
their navigation (Wilkinson et al., 2007; 2009; Mueller-Paul et al., 2012). The
same species was successful in learning an egocentric spatial task, in which the
subject had to choose between a left or right option on a touch screen, and
performed it correctly after a period of over two months (Mueller-Paul et al.,
2014).
According to these findings, spatial memory, i.e. memory responsible for
relocate previous location and navigate throughout the environment (Astur et al.,
2002), seems to be widely spread among chelonians species, thus it is likely to be
adaptive. Corlett (2011) hypothesized that the ability to remember the location of
resources in the environment, such as food and water, would be an advantage for
the animals, as long as the efficiency gained in foraging overcomes the cost
associated to the retaining of information (Mary and Kawecki, 2005). Red-footed
tortoise inhabits an environment where plants fruit periodically throughout the
year. For example, the family Annonaceae (Annona sp.) produce fruits every two
months, while plants of the family Sapotaceae (Ecclinusa sp.) and Passifloraceae
(Passiflora coccinea) have a single fruiting period per year, with a gap of eight
months in which they do not produce fruit (Moskovitz and Bjorndal, 1990).

53
Therefore, it would be adaptive for tortoises to be able to retain the information
about the location of fruiting plants for prolonged periods, in order to efficiently
revisit places where the probability of finding food is higher. Although in the
habitat of red-footed tortoises, the Amazonian rainforest, trees of different species
produce fruits in different periods of the year (Moskovitz and Bjorndal, 1990),
thus food is, to a certain extent, always available, the competition for fruit is
extremely high due to the large number of animals (from birds to primates, to
small rodents and insects) that rely on them as a primary food source (Fleming,
1979). Thus, the ability to relocate fruiting plants and remember where they are
for period of time, that covers at least one fruiting cycle, would be advantageous.
As mentioned above, tortoises are capable of different navigation
strategies, that involves or not the use of cues (López et al., 2000; 2001;
Wilkinson et al., 2007; 2009; Mueller-Paul et al., 2012). In the general
introduction (section 1.4.2) it was mentioned that the choice of navigation strategy
could depend on the characteristics of the environment where the animal lives.
The South American rainforest is an environment that suffers many changes: for
example, the fast growth of opportunistic plants after the rainy season can modify
the aspects of stable cues, or tree fall events can open gaps that would change the
appearance of large areas in the forest. Thus, an egocentric strategy that doesn’t
require the use of stable landmarks could be a good choice to orientate in such a
changing environment. In Mueller-Paul et al. (2014) red-footed tortoises were
able to solve an egocentric task, however this consisted of a simple left or right
choice. Therefore, it is necessary to further investigate the navigation ability of
tortoises without the use of visual cues using a more complex task.

54
For these reasons, in the experiment to follow, the spatial memory of C.
carbonaria were tested in an environment, a double Y-shaped maze, where no
visual stimuli were provided in order to investigate the ability of tortoises to learn
a route that leads to food, relying exclusively on their memory about the path in
relation to what learned. After which their spatial long-term memory was tested,
to explore whether they were able to remember the direction learned after a time
interval of two and eight months.
2.1.2 Method
Fifteen tortoises took part in the experiment: eight of them were adults
with carapace length between (17.3-21.4 cm), one medium size (carapace length=
12.8 cm) and six juveniles with carapace length that ranges between 7.7 and 9.3
cm. Two of the adult tortoises were experimentally naïve, while all the other
subjects had taken part in other cognitive studies (e.g. spatial cognition
(Wilkinson et al., 2007; 2009; Mueller-Paul et al., 2014), social cognition
(Wilkinson et al., 2010a,b), visual cognition (Wilkinson et al., 2013)). When the
tortoises were not taking part in the experiment, they were housed in three
different pens according to their size. The adults were housed in a big open top
enclosure of 4x3 m. The medium size tortoise was housed in an enclosure of 1 x
1.5m together with another medium size tortoise that didn’t take part in the
experiment. The juveniles were housed all together also in an enclosure of 1
x1.5m. Each enclosure contained water ad libitum, shelters, hot spot with heat and
UV lamps. The lights were kept on a 12 hour cycle (from 7am to 7pm); the soil
was covered with bark that was damped once a day. The temperature of the room

55
was kept between 27 and 30 degree. Tortoises were not food deprived but were
fed after the completion of the daily training, with a variety of fresh fruits and
vegetables.
2.1.2.1 Apparatus
The maze was a double Y-shaped maze (fig 2.1). All the arms of the maze
had the same dimensions (30cm width, 35cm length). The internal part of the
maze was completely covered by a yellow plastic in order to remove any possible
visual cues and ensure ease of cleaning. All the arms therefore looked identical to
each other. Yellow was chosen, because it was different from the colour of the
walls of the enclosures where the tortoises were usually housed and also different
from any other maze in which the tortoises has previously been tested.
2.1.2.2 Habituation phase
Tortoises were individually introduced into the maze for a period of 20
minutes twice a day for two consecutive days. During this time, they were free to
explore the maze with no restrictions. On the third day 8 pieces of food were
scattered throughout the arena. This was continued until the tortoise ate at least 5
pieces of food. Upon reaching this criterion the tortoise was considered habituated
and ready to start the training phase. The maze was cleaned between habituation
trials, in order to remove any scent trace left by other tortoises. All the fifteen
subjects ate the food in the maze on the third habituation day, thus they all rapidly
proceeded to the training phase.

56
2.1.2.3 Training phase
Four different paths were possible in the maze; in order to eliminate
possible bias, the goal direction assigned to the tortoises was counterbalanced
across individual. Four subjects were randomly assigned to the directions left-left,
right-right, left-right and three subjects to the direction right-left. At the beginning
of a trial a tortoise was placed in the starting arm (fig 2.1) enclosed by a cage, so
that the tortoises could see through but could not move around the maze. Once
they had looked at both sides, the cage was removed and the trial started.
Tortoises were given two minutes (from when they started walking) to solve the
task and reach the correct arm. A choice was considered made when both front
legs of the tortoise passed a line (indicated on the outside of the maze) 15cm
inside each arm. If the tortoise reached the correct location, the trial ended and the
35cm
30cm
15cm line
Starting arm
Cage
Figure 2. 1 Representation of the maze used in the long- term memory experiment. The black point indicates the starting point. Blue arrows indicate one of the four possible paths.

57
tortoise was rewarded with a small piece of favoured food (e.g. strawberry,
dandelion, mango) dropped inside the goal arm after the choice was made. If the
choice was incorrect, i.e. the tortoise entered in one of the three wrong arms, the
tortoise was removed from the arena without any reward. If the tortoise did not
start moving within three minutes of being released then it was removed from the
arena and the trial was repeated later. If the subject did not complete the task in
the two minutes allowed, it was removed from the maze and the trial was repeated
later. The experimenter was in the room for the duration of the experiment, and
was positioned behind the starting point of the maze thus, I could not be seen by
the tortoises while they were performing the task. The maze was cleaned at the
end of each trial in order to remove any possible scent cues. In between the trials,
the maze was rotated in different directions (chosen at random), so that tortoises
could not use extera-maze cues from the test room to orientate. A session was
composed by 15 trials. When a subject reached the learning threshold of 12
correct trials over the last 15 trials (80%) three times in the last five training
sessions, the task was considered learned. If an individual did not reach the
criterion after completing 250 trials it was excluded from the experiment. This
maximum threshold corresponded to five times the number of trials needed to
learn the task of the best performer among the subjects - 50 trials.
2.1.2.4 Two months retention test
After reaching the learning threshold, the tortoises were not exposed to the
apparatus for a period of two months. After this period of time the tortoises were
given six consecutive trials, in which they were asked to complete exactly the

58
same task as during training except that the tortoises did not receive differential
feedback.
2.1.2.5 Re-training
Once the test was completed, tortoises were re-trained on the same
direction on which they were initially trained and tested. The procedure followed
and the learning criteria were exactly the same as in the initial training.
2.1.2.6 Eight months retention test
This test was identical to the first test, except that it took place eight
months after retraining. A total of nine subjects were tested; one had to be
excluded due to a health issue.
2.1.2.7 Data analysis
The analysis was performed with the software R, version 3.0.2. Data from
the test trials were analysed on an individual level using a binomial test, in which
the number of correct trials were compared to chance (0.25). Also for the group
analysis a binomial test was performed, this time entering the number of
individual that performed above chance as success, and the total number of
subjects tested as total events. Moreover, the number of trials needed to reach the

59
learning criterion in the initial and re-training were compared using a Wilcoxon-
paired test.
2.1.3 Results
2.1.3.1 Training
Three tortoises were excluded in the early stage of the training because
they constantly refused to move; two of them were far from reaching the learning
criterion after 250 trials, thus were excluded. A total of ten tortoises, from the
initial fifteen, successfully completed the training and proceeded to the test phase.
Individuals varied in how quickly they learned the task (table 2); the average
number of trials needed to reach the learning criterion was 129.8 (SD ± 55.27;
range 50-215 trials).
Table 2 Individual data of trainings and tests
Tortoise First training
1st Test Binomial test
Second training
2nd Test Binomial test
Anton 130 3 p = 0.17 53 5 p < 0.01 Margot 155 5 p < 0.01 45 1 p = 1 Otis 95 2 p = 0.64 96 0 p = 0.34 Timothy 120 2 p = 0.64 236 0 p = 0.34 Esme 114 4 p = 0.037 45 3 p = 0.17 Aldos 60 0 p = 0.34 201 1 p = 1 Betty 149 4 p = 0.037 70 / / Darwin 215 4 p = 0.037 59 4 p = 0.037 Savina 50 4 p = 0.037 45 3 p = 0.17 T19 210
2 p = 0.064 76 2 p = 0.64
Table 2. Number of trials to reach the learning criterion in the initial (first training) and re-training (second training) and number of correct trials performed in the tests after 2 months (1st test) and 8 months retention time interval (2nd test), with corresponding binomial tests for each tortoise. The numbers in bold in the test one and two indicate the subjects that performed correctly the first test trial. The ‘/’ indicates that the tortoise did not participate to the test.

60
2.1.3.2 Two months retention test
After two months of no interactions with the maze the binomial test
revealed that five tortoises performed above the expected chance in the test
(binomial test: p= 0.03). However, at a group level, the performance of the
tortoises was not different than what would be expected by chance (binomial test:
p= 0.13), suggesting that tortoises were not able to remember the direction to
follow in the maze. However, this result could be caused to the procedure of the
test itself: tortoises in fact were not rewarded even if they were making the correct
choice. Although this is necessary - during the test the animals should not be
reinforced, because then their memory would not be tested - it could discourage
the animal toward the correct choice. Thus, the data concerning only the first trial
of the test were analysed, as its outcome is not affected by the absence of the
reward, entering in the binomial test the number of tortoises that performed
correctly in first test trial as “success” (table 2). In this case, results revealed that
tortoises performed above chance at group level (binomial test: p = 0.019) (fig.
2.2), suggesting that they were able to remember and choose the correct path in
the maze after two months retention time. The performance in the test was not
correlated to the number of trials that tortoises needed to learn the task (r= 0.09,
df= 8, p= 0.38).
2.1.3.3 Re-training
Once again, tortoises varied in how quickly they re-learned the task (table
2). The average number of trials used in the re-training in order to reach the
learning criterion was 92.6 (SD± 68.80, range 45-236). A Wilcoxon test revealed

61
no significant difference in tortoises’ performance during the initial training and
the re-training (Wilcoxon test: p= 0.32). However, considering only the tortoises
that performed correctly in the first test trial, results show that they were able to
reach the learning criterion significantly faster than in the initial training
(Wilcoxon test: p< 0.031). A correlation was found between the number of
correct trials performed in the test and the total number of trials employed in the
re-training (r= 0.58, df= 8, p= 0.01), therefore the better the tortoise performed in
the test, the smaller number of trials they needed to reach the learning criterion in
the re-training (fig 2.3).
2.1.3.4.Eight months retention test
9 subjects were tested after 8 months retention time. At individual level,
two tortoises performed above chance in the test (table 2)(binomial test: p< 0.01
and p= 0.037). At a group level, a total of four subjects performed correctly the
first test trial, and the binomial test revealed that their performance was not
different from what expected by chance (p= 0.24) (fig 2.2), suggesting that
tortoises failed in remembering the task after eight months in which they were not
exposed to the maze.

62
2.1.4 Discussion
The results suggest that tortoises are able to learn a path without the help
of any visual cues, remembering the sequence of turns required to get to the
reward. Thus, tortoises were able to orientate and navigate the maze using an
egocentric strategy, according to which the subject functions as its own central
point of reference, and the animals remember the sequence of motor movement
necessary to reach the goal, e.g. turn left, turn left (Carrillo-Mora et al., 2009;
Rosati et al., 2014). Moreover, red-footed tortoises were able to remember the
path learned after a retention time interval of two months. The results support the
findings of Mueller-Paul et al. (2014) where tortoises successfully learned an
egocentric spatial task and remembered it for over two months. This means that in
their natural environment red-footed tortoise would be able to relocate trees for all
0
1
2
3
4
5
6
7
8
9
10
testone testtwo
Nºoftortoisesthatperform
edcorrectlythe
3irsttesttrial
Figure 2.2 Number of tortoises that performed correctly in the first test trial in the two tests (test one= 2 months retention interval; test two= 8 months retention interval). The red line indicates the chance levels, 2.5 in test one (n subjects= 10) and in test two (n subjects = 9).
Nº of correct trials in test one
Nº o
f tri
als d
urin
g th
e re
-tra
inin
g Figure 2.3 The number of correct trials performed in test one (2 months retention interval) and the number of trials needed to reach the learning criterion during the re-training.

63
the length of the fruiting period, which is usually between two and three months
(Moskovitz and Bjorndal, 1990), but also between fruiting periods. This ability
would help tortoises to visit more frequently areas in which the probability of
finding food is higher. This is in line with the hypothesis of Corlett (2011), who
suggested that the most efficient foraging strategy of frugivores would be to
return to the location recently visited for the duration of tropical fruit crop.
Tortoises’ performances in the test were not related to the amount of trials needed
to learn the task, suggesting that the individual learning skills did not have any
kind of influence on their memory. It is interesting to notice that the two subjects
that needed the greater number of trials to reach the learning criterion (Darwin
and T19) were naïve to cognitive experiments, suggesting that previous
experience counts. This implies that, in a natural scenario, young tortoises would
be less efficient than older ones in relocating food or navigating around the
environment, because they have to build their own experience. Tortoises that
performed above chance in the test at the individual level were able to re-learn the
task faster than in the initial training, providing further evidence that they actually
remembered the location of the goal arm. However, tortoises failed in
remembering the correct path after a retention time interval of eight months. The
poorer performance in the second test could be due to the navigation strategy they
were “forced” to use to solve the task. Tortoises are highly visual, with the ability
to discriminate shapes and colours in stationary stimuli (Burghardt, 1977; Arnold
and Neumeyer, 1987). Therefore, it is plausible that if they had been allowed to
use visual cues to orientate, they would have retained the spatial information for
longer time. For example, Davis and Burghart (2012) found that terrapins were
able to remember a visual task for up to two years. In the experiment that will be
64
presented in the next chapter, red-footed tortoises proved to excel in remembering
an association learned after a period of 18 months. Thus, it could be suggested
that for longer retention time intervals, tortoises need some additional cues in
order to successfully remember a location.
Further study is needed to understand the mechanisms tortoises rely on to
use spatial information in their natural habitat, bearing in mind that foraging on
spatially fixed food sources could have influenced the evolution of their spatial
memory skills. Studies on primates often suggest that the evolution of cognitive
skills is due to their complex social interactions (de Waal 1982; Byrne and Whiten
1988). However, a recent study on lemurs (Rosati et al., 2014) found that the most
frugivorous species tested presented the most accurate spatial memory, in
particular comparison with folivores species. Tortoises are solitary animals,
although they can learn from conspecifics (Wilkinson et al., 2010b), their learning
skills depend mostly on their own experience. Therefore, ecological factors may
be important predictors of animal cognition and should be incorporated in
cognitive studies in order to understand the evolution of particular cognitive
mechanisms.
2.1.5 Implication for seed dispersal
The results of the spatial memory experiment have important implications
for seed dispersal: the fact that they were able to remember the location of food
for a period of two months, which is equivalent to the duration of the production
of fruit of some tropical plants (Moskovitz and Bjorndal, 1990), might suggest
that tortoises have the capacity to re-visit food sources previously encountered

65
instead of looking always for new ones (Lohmann et al., 2008). This would lead
to an increase in their foraging efficiency, as showed in the study of Di Fiore and
Suarez, 2007. As a consequence, spatial memory skills would increase the
chances that seeds would be eaten and dispersed by a legitimate seed disperser,
decreasing the possibility that seeds would be eaten by seed predators, or simply
left under the parental plant where the mortality may be higher (Schupp et al.,
2010). Moreover, it could be hypothesized that if plants produce fruit at smaller
time intervals (e.g. every one-two months), it could probably invest less in
attractiveness because it can rely on the memory of the dispersal vectors,
however, to my knowledge, whether this correlation exists, has not yet been
investigated. In contrast, plants that produce fruits only once a year should invest
more resources in producing signals, such as bright coloured fruits with strong
scent, because after such a long period of time it is more likely that animals would
forgot about their location. Moreover, in the case that frugivores would return to
the plant at regular intervals, they wouldn’t find food. This could extinguish their
behaviour, making the animal lose interest in that specific tree. Therefore, it
would be interesting look at plant signals in relation to their fruiting time and the
memory of the principal disperser.

66
2.5 Creating prediction: introducing spatial memory in seed
dispersal model
2.5.1 Why use a model?
Models simulate aspects of the real world and are used as instruments to
test and explore the implications of hypotheses, or exploring preliminary ideas,
with the aim to support or disprove them (Weiner and Conte, 1981). They are
used mainly when empirical studies are not possible, time consuming and demand
considerable human resources, or to make predictions about the evolution of an
environment in a long-term scale. For these reasons, models have recently been
employed in the study of seed dispersal and their use is constantly increasing:
field data on seed dispersal are essential but very scarce and approximate, in
particular concerning long dispersal distance (Cain et al., 2000). Models provide
partial solution to this problem allowing to test and to predict the potential
outcome of seed dispersal events on a long-term scale. Genetic methods provide
precise information about the movement and establishment of seeds using genetic
markers (Nathan et al., 2003). However, this method provides a good estimation
of effective dispersal, considering only the seeds that are successfully established
(Cain et al., 2000), but without giving information about the dispersal mechanism
per se, e.g. which factors influence the shape of the seed shadow. Moreover, it
requires the collection of numerous samples and extensive and expensive
laboratory work (Nathan et al., 2003). Another method, which achieves the
similar results to the genetic one, but that is broadly applicable, is the use of
biological markers, such as stable isotope, that can be sprayed on the plants during

67
their flowering stage (Carlo et al., 2009). The advantage of this method is that it is
faster and cheaper than the genetic one, but it allows to follow up a maximum of
three enriched plants, therefore it cannot be employed in studies that want to
measure the dispersal of many individuals from the same site (Carlo et al., 2009).
As for the genetic method, using biological marker is useful to quantify the
microhabitats where seeds are deposited and grow but it does not provide any
information about the journey of the seeds. Thus, the two most precise methods to
estimate seed dispersal effectiveness do not allow predicting how the seed shadow
would suffer in case of the removal or changes of the seed dispersal agent, e.g.
animals or wind. In order to determine the flexibility and to fully understand the
seed dispersal process, it is necessary to know and predict how the factors that
affect it behave in the ecosystem. This is one of the reasons why mechanistic
models are a very useful in this discipline, as they aim to explain the probability
distributions of seeds, instead of only the density of the seeds deposited in relation
to the distance as in the empirical models (Bullock and Clarke, 2000). Thus,
potentially they could give better insights into the dynamic of plant populations.
2.5.2 Mechanistic model for seed dispersal by wind
Models of seed dispersal by wind have proven to be reliable, providing
progress in understanding and predicting the outcomes of this mechanism (Greene
and Johnson 1989, Bullock and Clarke 2000, Nathan et al., 2001). This assessed
reliability is due to the fact that simulations of wind dispersal are parameterised
with information on abiotic factors, such as weather condition, wind speeds, seed
departure height, which follow physical laws, thus, are easily predictable. An

68
example is given by Nathan et al (2001), who developed a model which
incorporates the full natural variation of the factors that play a role in wind
dispersal. They validated their model with field data collected using seed traps
and found the prediction of the model accounted for the 83 to 90% of variation
observed in the data set. A second example is represented by a model on
secondary dispersal by wind that considered the traits of seeds, wind conditions
and obstacles to seed movement, and explained between the 70-77% of dispersal
over 25m (Schurr et al., 2005). Therefore, by knowing accurately the habitat
traits, seeds characteristics and main wind condition of a particular environment,
is it now possible to achieve good approximation of the seed shadow of trees that
use wind, or other abiotic factors, as a dispersal vector. Thus, a reliable model is a
powerful instrument, not only because it allows saving years of data collection in
the field, but also because it overcomes the context-specificity of the empirical
data (Cousens et al., 2010) and offers the possibility to accurately simulate what
would happen if the variables that affect seed dispersal, e.g. wind strength, are
suffering changes, or to test how the environment would react in extreme
conditions.
2.5.3 Model for seed dispersal by animals
Mechanistic models of endozoochory are far more challenging than those
that model abiotic dispersal. Having animals as dispersal vectors adds degrees of
complexity primarily due to the fact that animal decision-making and movements
are not easily predictable and difficult to quantify (Russo et al., 2006). Multiple
factors impact on animals’ behaviour, decisions and movement, such as predation

69
risk, distribution of resources (food, water and shelter), the presence of mating
partners, intra and inter-specific interactions (Boinski and Garber 2000, Westcott
and Graham 2000, Russo et al., 2006), but also the cognitive skills of the animal,
all of which can differ radically from one species to another. As a result, despite
the numerous researches on this topic, the ability to predict dispersal pattern by
animals remains undefined (Cousens et al., 2010). The common method to
simulate animals movements is usually represented by constrained random walks
(Turchin, 1998; D’hondt, 2012), which means that the animal moves at random in
the environment but preferring some part of the landscape over other, e.g. areas
with food or favourite vegetation type. Thus, this preference drives movement
toward what is perceived as the better part of the landscape. Despite constrained
random walks representing a good approximation of what an animal might do,
they are far from being accurate. Knowing precisely how animals use the
environment and how they move around it would help to predict the position and
quality of the deposition sites, allowing more precise estimations of seedling
establishment (Wang and Smith, 2002). To date models of endozoochory have
taken into account how the distribution of food or other resources (Aparicio et al.,
2013), behavioural traits of the animal, such as use of home ranges (Holbrook et
al., 2002), resting sites (Russo et al., 2006), lek sites, diurnal habits (Westcott et
al., 2005) and social interactions (Beecham and Farnsworth, 1998) impact on the
use of space by animals. From these studies, it has been recognised that non-
random movements driven by behavioural habits (Beecham and Farnsworth,
1998) influence dispersal curves and deposition patterns (Schupp et al., 2002).
For example, the consideration of seed dispersers’ resting sites or use of latrines,
led to the prediction that areas with high seed density, therefore with high

70
seedling mortality, can occur also far from the parental trees (Russo and
Augspurger, 2004; Russo et al., 2006), or plants in aggregation suffer a better
seed removal than isolated ones (Carlo and Morales, 2008). A step that could
bring these studies further would be to investigate what determines the behaviour
of the animals, instead of limiting the simulation to the simple behaviour of the
animal in a case of study (Cousens et al., 2010). As explained in the first section
of this chapter, cognition could be the key that would bring a deeper
understanding how animals impact on seed dispersal. To date only a couple of
studies in the literature attempted in using cognition to model animal movement
(Boyer and Walsh, 2010; Avgar et al., 2013), showing that spatial memory can
affect the trajectory of the animal around the environment, resulting in non-
random movement. However, they did not extend the concept to investigate the
consequences of memory on seed dispersal.
For this reason I introduced animal cognition in seed dispersal model. In
particular, in this chapter, I focused on determine how different spatial memory
skills would affect quantitative and qualitative the seed shadows of trees.
2.5.4 Method
This model is based on the perception and memory-based movement
model described by Avgar et al. (2013) and the seed dispersal model of D’hondt
and Hoffmann (2011).

71
2.5.5.1 The animal
Consider an animal characterised by a single parameter, state 𝑠
(0 ≤ 𝑠 ≤ 1), which equate to hunger; when 𝑠 is low the animal is considered to be
relatively hungry, and when 𝑠 is high the animal is relatively sated. During each
of 𝑇 discrete time steps 𝑡 (𝑡 = 1, 2,… ,𝑇) this animal moves stochastically
around a landscape in state-dependent manner, during which it ingests, defecates
and disperses seeds.
2.5.5.2 Perception, memory and assessment of habitat quality
The animal moves around stochastically in a landscape, 𝐴, modelled as a
heterogeneous hexagonal grid of cells, 𝑖 (Avgar et al., 2013). Each cell is
characterised by its spatial coordinates and the values of two habitat components,
the background landscape (𝐴!,!) and the vegetative landscape (𝐴!,!), each taking
values in the range [0,1]. Higher values are more attractive to the animal (for
example indicating more food, preference for landscape features such as shelter)
and lower values less attractive (for instance, less food, un-preferred habitat type).
The animal is assumed to assess the quality of surrounding cells using sensory
information, which attenuates with distance (perception) and accumulates over
time (memory). At time step 𝑡 the animal’s perception, 𝑝 (0 ≤ 𝑝 ≤ 1), of cell 𝑖
for a given layer 𝑗 of the landscape is

72
𝑝!,!,! = 𝐴!,!𝑒!!!! , (1)
where 𝑑 is the (hexagonal) Manhattan distance from the animal’s current location
to cell 𝑖, and 𝛼 (𝛼 > 0) is the sensory attenuation coefficient. The term 𝑒!!!!
therefore describes the proportion of information perceived at distance 𝑑; when
𝑑 = 0 (i.e., cell 𝑖 is occupied by the animal) the animal has perfect perception,
with the proportion of information perceived declining exponentially with
increasing 𝑑. This sensory information is subsequently committed to the animal’s
memory, 𝑚 (0 ≤ 𝑚 ≤ 1), which decays with time such that
𝑚!,!,! = 𝑝!,!,! + 1− 𝑒!!!! 𝑚!,!,!!!𝑒!! , (2)
where 𝛽 (𝛽 ≥ 0) is the memory decay coefficient, which models the proportion
of information retained in the memory. When 𝛽 = ∞, decay is instantaneous and
so the animal has no memory other than what can be currently perceived; when
𝛽 = 0, there is no decay and the animal retains in its memory all previously
perceived information; when 0 < 𝛽 < ∞ memory decays exponentially over time.
The subjective quality 𝑞 (0 ≤ 𝑞 ≤ 1) of different locations in the landscape is a
function of the perceived and/or memorised habitat characteristics, the animal’s
current state and its travelling propensity, modelled here as 𝑒!!!!, where the
‘friction’ coefficient 𝛾 (𝛾 ≥ 0) (sensu Avgar et al,. 2013) models how far the
animal is willing or able to travel by reducing the attractiveness of all landscape
features as a function of distance. State affects the relative importance given to

73
each landscape layer, such that for low values of 𝑠 higher relative importance is
given to the vegetation (food-containing) layer, and when 𝑠 is high greater relative
importance is given to the background layer. The subjective quality of a cell is
therefore given by
𝑞!,! = 𝑚!,!,!𝑠! +𝑚!,!,! 1− 𝑠! 𝑒!!!! . (3)
When applied to all cells, the resulting map is the subjective landscape; the
landscape as it is viewed from the perspective of the animal at a particular point in
space and time (Avgar et al., 2013).
2.5.5.3 Movement
At each time step the animal can choose to either remain in its current cell,
or move to one of the six (equidistant) adjacent cells. Specifically, animal
movement behaviour was modelled as a series of discrete probabilistic decisions,
based on attraction to specific cells within the animal’s subjective landscape: the
preference for remaining in the current cell, 𝑘, is given by 𝑞!,!; the preference for
moving to a particular adjacent cell is given as the maximum value of all cells in
the subjective landscape within a 60° cone centred on the direction of that cell. To
ensure a correlated random walk in relatively homogeneous landscapes, these
preferences are then multiplied by the probability of moving in a given direction
drawn from a von Mises distribution with a mean direction (𝜇!), which is equal

74
to the current direction of travel, and concentration parameter 𝜅! . These
combined preferences are then re-scaled so they sum to unity, giving the
probability of moving (or otherwise) to a given cell.
2.5.5.4 Feeding, gut passage and seed dispersal
Having entered a cell, the animal will feed if that cell contains vegetation.
The amount of food consumed, 𝑓, is proportional to the value of the vegetative
layer of the occupied cell, 𝑘, scaled by the state of the animal at the previous time
step (such that relatively hungry animals will eat proportionally more than
relatively sated animals)
𝑓! = 𝐴!,! 1− 𝑠!!! . (4)
It is assumed that all ingested food contains seeds, and that these are added to the
animal’s ‘gut matrix’, 𝐆 = [𝑔!] (sensu D’hondt and Hoffmann 2011), where 𝑔!
holds information on the amount of seeds ingested at each time step. For
simplicity, it is assumed that the proportion of seeds ingested, and their
probability of being destroyed through destruction and/or digestion, is fixed; the
number of viable seeds available for excretion when the animal defecates is
therefore directly proportional to the total amount of food eaten (i.e. 𝑓!~𝑔!).
At each time step, the animal defecates with a probability drawn from a
cumulative lognormal probability density function, defined by 𝜇! and 𝜎!, such

75
that the probability of defecation increases with time since the last defecation
event (D’hondt and Hoffmann 2011). Such a distribution has been shown to
provide good fits to empirical gut passage data (e.g. Rawsthorne et al., 2009;
D’hondt and Hoffmann 2011). If there are seeds present in the gut at the time of
defecation, a proportion of these are excreted. This proportion is determined by
the time that has passed since their ingestion, modelled as the cumulative
lognormal probability density function defined by 𝜇! and 𝜎!.
Food consumption also affects the animal’s state. State decreases over time as a
function of the hunger coefficient 𝜆 (0 ≤ 𝜆 ≤ 1), which encapsulates the non-
linear relationship between food intake and hunger, and increases as a function of
food consumed, scaled by the satiation coefficient 𝜅 (0 ≤ 𝜅 ≤ 1), such that
𝑠! = 𝜆𝑠!!! + 𝜅𝑓! . (5)
2.5.5.5 Parameterising the model
A 1600 cell landscape grid, characterised by randomly generated patchy
habitat quality, ranging in value between 0 and 1. The vegetative layer contained
2 randomly placed plants, each occupying a single cell with a value of 1
(maximum attraction). One of the plants is considered the “focal plant” which the
animal knows, because its location in the grid coincides with the starting point of
the animal, while the other, the unknown plant, is located at a random distance
from the focal tree.

76
The state of the animal is initially set to 0.5 (alpha is fixed at 0.5). The value of
the parameter β was varied at random using the matlab function randel(0.99,1)
where (β = ∞) indicates no memory and (β = 0) complete memory. Animal
memory is initially set to 0 (i.e., when 𝑡 = 1, 𝑚!,!,!!! = 0 in eq. 2). The animal is
introduced in the landscape in the same hexagon of one of the two plants, selected
at random. This starting position was chosen, otherwise substantial part of the
simulation was employed initially by the animal to locate the plants in the
landscape. Animals were assumed to have died when their state dropped below a
threshold (set at 0.001). The model was run over 10,000 time steps and replicated
1000 times.
Table 3 Overview of model parameters.
Parameter Values explored
𝛼: sensory attenuation coefficient 0.5
𝛽: memory decay coefficient Drawn from an exponential logarithm distribution (0.99,1)
𝛾: friction coefficient 0.07
𝜅: satiation coefficient 0.1
𝜆: hunger coefficient 0.99
𝜇! and 𝜎! : parameters of the cumulative lognormal probability density function describing the probability of defecation
4; 0.2
𝜇! and 𝜎!: parameters of the cumulative lognormal probability density function describing the probability of seed excretion
1; 0.2
𝑇 10,000
𝜅! : concentration parameter for von Mises distribution
1.83
Death threshold 0.001
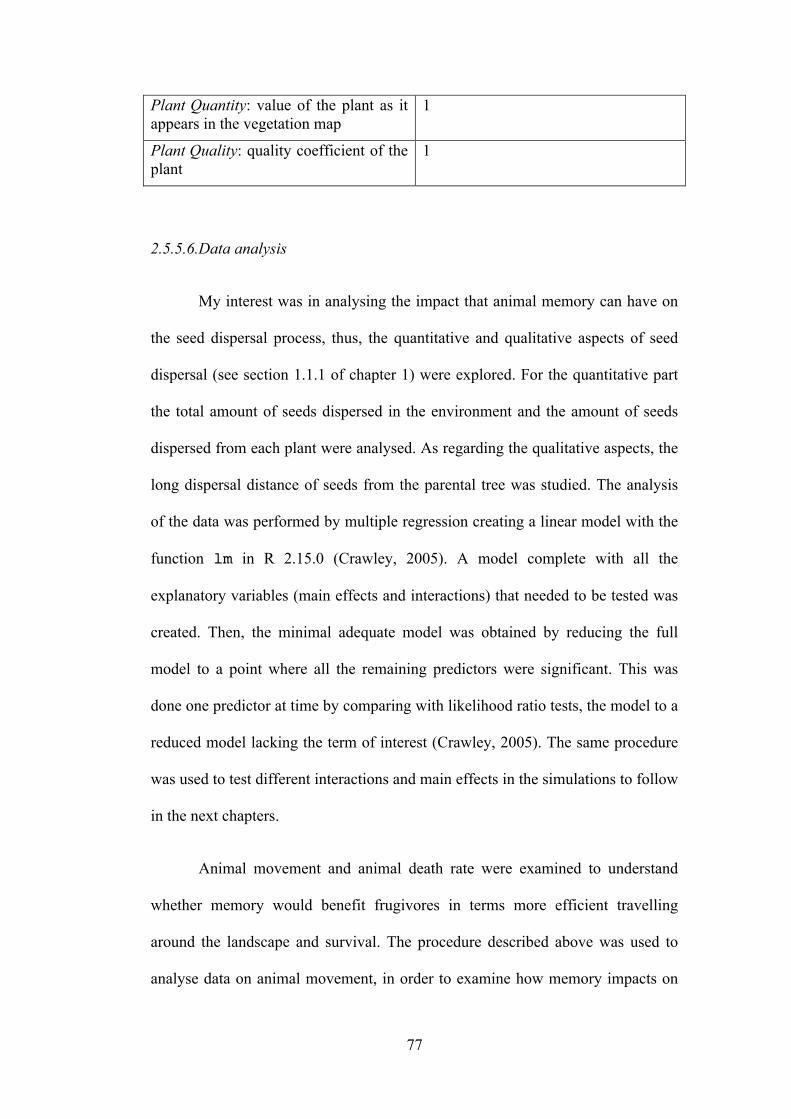
77
Plant Quantity: value of the plant as it appears in the vegetation map
1
Plant Quality: quality coefficient of the plant
1
2.5.5.6.Data analysis
My interest was in analysing the impact that animal memory can have on
the seed dispersal process, thus, the quantitative and qualitative aspects of seed
dispersal (see section 1.1.1 of chapter 1) were explored. For the quantitative part
the total amount of seeds dispersed in the environment and the amount of seeds
dispersed from each plant were analysed. As regarding the qualitative aspects, the
long dispersal distance of seeds from the parental tree was studied. The analysis
of the data was performed by multiple regression creating a linear model with the
function lm in R 2.15.0 (Crawley, 2005). A model complete with all the
explanatory variables (main effects and interactions) that needed to be tested was
created. Then, the minimal adequate model was obtained by reducing the full
model to a point where all the remaining predictors were significant. This was
done one predictor at time by comparing with likelihood ratio tests, the model to a
reduced model lacking the term of interest (Crawley, 2005). The same procedure
was used to test different interactions and main effects in the simulations to follow
in the next chapters.
Animal movement and animal death rate were examined to understand
whether memory would benefit frugivores in terms more efficient travelling
around the landscape and survival. The procedure described above was used to
analyse data on animal movement, in order to examine how memory impacts on

78
the way that animals explore the landscape. The analysis of data concerning the
death rate of animals with different memory followed a different procedure. Since
in the simulation some animals died before reaching 10000 timesteps, while in
other iterations the animal survived for all the 10000 timestep, and it is unknown
when they would perish, an exponential survival model with a censoring indicator
(=status) was used for this purpose. To perform the analysis, a value of 1 was
assigned to the animals that died before the 10000 timesteps to indicate that the
response was a time at death. A value of 0 was given to the individual that
completed the 10000 time steps, thus still alive at the end of the simulation. To
perform the analysis the function survreg in the package survival of R 2.15.0
was used (Crawley, 2007). In the null model the time of death with the respective
status was entered as dependent variable, memory of the animal and plant distance
were entered as fixed terms. The distribution was specified as “exponential”. The
procedure to test the significance of the interactions and main effects, followed
the same steps as above: a second model lacking the term of interest was created
and compared with the null model using likelihood ratio tests. Once the model
that best described the data was found (all the included terms/ covariates were
significant), the same model was fitted with other distribution (extreme, gaussian,
logistic). Once again, these models were compared with ANOVA and the
resulting one with the smallest residual variance was chosen as the best fit for the
data (Crawley, 2007).
79
2.5.5 Hypothesis tested
The model aims to test the impact of spatial memory on seed dispersal and
how this might interact with the distance between the plants. In this section,
simulations of two different landscapes are compared. These were parameterized
in exactly the same way (see the method) with the only difference that in one
model the availability of food in the landscape was unlimited, thus no matter how
many times the animal fed on a plant, the food was never depleted or decreased
(the value of the plant was fixed at the maximum value, 1, see method). The
second model, simulated an environment where the availability of food was
limited, thus where the food could be depleted; every time an animal fed on a
plant, the value of that plant was decreased by the amount eaten, until complete
depletion (value of the plant reaches 0, see method).
The following hypothesis were tested:
H1: The memory of the frugivore predicts the total amount of seeds dispersed in
the environment.
H2: The interaction between memory and the distance among the plants predicts
the total amount of seeds dispersed in the landscape.
H3: The interaction between memory and the distance among the plants explains
the amount of seeds dispersed by each plant.
H4: The interaction between memory and the distance among the plants predicts
the long distance dispersal of the individual plant.

80
H5: The interaction between memory and the distance among the plants explains
the proportion of landscape travelled by the animals.
H6: Memory predicts the time of death of the animals.
The predictions are that (1) animals with higher spatial memory (slow
memory decay, β→ 0, see method) would disperse a larger amount of seeds than
animals with lower spatial memory (fast memory decay, β → ∞), (2) in particular
in landscape where plants are located at farther distance from each other, because
only animals with memory would be able to remember and re-locate both plants.
Moreover, (3) animals with higher memory would disperse seeds from both plants
evenly, because they would remember the location of both trees and forage from
them equally, in particular when these are located farther apart. For the same
reason, (4) animals with higher memory would dispersed the seeds closer to the
parental trees, because they would go to forage more often than an animal with
lower memory, increasing the probability that the seed ingested would be
deposited closer to the parental tree. If plants are located a larger distance, then
the dispersal distance should increase because animals would travel more between
the two food sources. (5) Animals with high memory would travel less around the
landscape than animals with no memory, because their movement would be less
random and more directed towards the food sources and the proportion of
landscape travelled would be bigger when plants are further away because the
animals would have to travel more distance to forage. At last, (6) animals with
high memory would live longer than animals with low memory, because they are
better in locating food.

81
2.5.6 Results
2.5.6.1 H1: Total amount of seeds dispersed in the environment
First, the impact of memory on the total amount of seeds dispersed in the
environment was analysed. In a landscape where the availability of food was
unlimited, results showed that the number of seeds dispersed followed an
exponential curve characterised by a flat line at the lower values of memory
followed by an exponential increase starting at a value of memory 0.8 (fig 2.4a).
This implies that only high levels of memory make a true difference in the amount
of seeds dispersed in the environment, while lower and intermediate degrees of
memory offer approximately the same results. Animals with the highest memory
visited the plants more often (focal plant: mean number of visits = 137.67, sd =
77.55; non-focal plant: mean number of visits = 129.42, sd = 68.39) than animals
with low memory (focal plant: mean number of visits = 67.38, sd = 65.32; non-
focal plant: mean number of visits = 64.48, sd = 68.54) (t(1.26)=15.08, p= 0.02).
In environments with limited availability of food, the same trend as before
was found (fig 2.4b), but this time the exponential increase is not appreciable
because the total amount of seeds available in the landscape is limited. In this case
as well, animals with higher memory resulted more efficient in finding the plants
(focal plant: mean number of visits = 44.6, sd = 22.94; non-focal plant: mean
number of visits = 42.28, sd = 23.71), than animals with lower memory (focal
plant: mean number of visits = 27.05, sd = 23.06; non-focal plant: mean number
of visits = 27.87, sd = 24.06) (t(1.36)= 14.27, p=0.02).

82
The total amount of seeds dispersed in the environment was not affected
by the interaction between memory and distance between the plants in either type
of landscape.
2.5.6.2 H2: individual amount of seeds dispersed from the two plants
The impact of animals with different memories on the quantity of seeds
dispersed from the two trees was analysed, in order to examine whether memory
would favour seed dispersal of the known plant or provide equal dispersal from
both trees.
The amount of seeds dispersed from the two plants is affected by the
interaction between the memory of the animal and the distance between the plants
Figure 2.4 a) Total amount of seeds dispersed per timestep in environment with unlimited resources by animal with different memory (0= low memory; 1= high memory). b) Total amount of seeds dispersed per timestep in environment with limited resources by animal with different memory (0= low memory; 1= high memory). The red lines indicate the standard deviation.
0.0 0.2 0.4 0.6 0.8 1.0
0e+00
2e-04
4e-04
6e-04
8e-04
1e-03
memory
tota
l am
ount
of s
eeds
dis
pers
ed p
er ti
mes
tep
0.0 0.2 0.4 0.6 0.8 1.0
0.0000
0.0005
0.0010
0.0015
0.0020
0.0025
0.0030
0.0035
memory
tota
l am
ount
of s
eeds
dis
pers
ed p
er ti
mes
tep
a b

83
(F (1, 997)= 11.86, p< 0.001) in landscape with unlimited availability of food (fig
2.5a). Memory determines the difference in the amount of seed dispersed from the
two plants, in particular when the trees are located at a larger distance from each
other.
As expected, if animals were able to remember the location of both trees,
they fed from them at similar rate, favouring a more uniform removal of seeds
from the plants when these were located further apart. However, when the trees
were close together, the level of memory had no effect on the relative amount of
seeds dispersed from the two plants. This might be due to the fact animals have
perception (explained in the method, section 2.5.4) allows them to use
information from the surrounding environment within a certain distance. Thus, if
the distance between the plants is smaller than animal’s perception, the effect of
memory is null.
The same results were found in landscapes where the availability of food
was limited. An interaction was found between the distance between the plants
and animal memory (F (1,997)= 7.12, p< 0.01) (fig 2.5b). In this case the
difference of seeds dispersed from the two plants is even smaller, reaching almost
zero, because the food sources could be depleted, and animals with high memory
tended to consume all the food available in the landscape.

84
Figure 2.5 a) Difference of seeds dispersed from the plants in landscape with unlimited food sources at different memory (0= low memory; 1=high memory) and distance between the plants. b) Difference of seeds dispersed from the plants in the landscape with deplorable food sources at different memory (0= low memory; 1=high memory) and distance between the plants. Each point indicates one model iteration (N=1000). The line indicates the average amount of seeds dispersed per timestep ± SE. The perceptual map illustrates the amount of landscape (light hexagons) perceived by the animal.
Diff
eren
ce o
f see
ds
Diff
eren
ce o
f see
ds
Diff
eren
ce o
f see
ds
Distance between the plants
memory
Distance between the plants (10 to 20)
Diff
eren
ce o
f see
ds
disp
erse
d pe
r tim
este
p D
iffer
ence
of s
eeds
di
sper
sed
per t
imes
tep
Distance between the plants (20 to 30)
Distance between the plants (30 to 40)
Distance between the plants (40 to 52)
memory memory
memory memory
Distance between the plants (1 to 10)
p< 0.01 p= 0.03
p= 0.15 p= 0.92 p= 0.07
Perceptual map
a
0e+00
2e−04
4e−04
6e−04
0.00 0.25 0.50 0.75 1.00beta
DiffS
eeds
Tim
e
plantDist (0 to 10)
0e+00
2e−04
4e−04
6e−04
0.00 0.25 0.50 0.75 1.00beta
DiffS
eeds
Tim
e
plantDist (10 to 20)
0e+00
2e−04
4e−04
6e−04
0.00 0.25 0.50 0.75 1.00beta
DiffS
eeds
Tim
eplantDist (20 to 30)
0e+00
2e−04
4e−04
6e−04
0.00 0.25 0.50 0.75 1.00beta
DiffS
eeds
Tim
e
plantDist (30 to 40)
0e+00
2e−04
4e−04
6e−04
0.00 0.25 0.50 0.75 1.00beta
DiffS
eeds
Tim
e
plantDist (40 to 51)
Distance between the plants (0 to 10)
Distance between the plants (10 to 20)
Distance between the plants (20 to 30)
Distance between the plants (30 to 40)
Distance between the plants (40 to 51)
Diff
eren
ce o
f see
ds
disp
erse
d pe
r tim
este
p D
iffer
ence
of s
eeds
di
sper
sed
per t
imes
tep
memory memory
memory memory memory
p= 0.11 P< 0.001
p= 0.11 p< 0.001 p< 0.001
Perceptual map
b)

85
2.5.6.3 H3: Long dispersal distance
Another important aspect of seed dispersal is the distance to which the
seeds are dispersed from the parental tree. According to the Janzen-Connell
hypothesis (1970), the further the seeds are deposited from the parental plant the
higher is their chance of survival. Therefore, I looked at the seed dispersal
distances from animals with different memory.
2.5.6.3.1 In landscape with unlimited availability of resources
Focal plant: as regard the focal plant, no interaction was found between
animals’ memory and distance between the plants (F(1, 973)= 0.032, p= 0.864).
The simulation showed that animals with low memory dispersed seeds at farther
distance from the parental tree than animals with high memory (F (1, 973)= 17.97,
p< 0.001). Figure 2.6a, shows that the majority of seeds dispersed by animal with
high memory is deposited at less than five hexagons of distance from the parental
and decrease almost to zero at a distance of fifteen hexagons. Animals with low
memory (fig 2.6b) instead, disperse a higher amount of seeds at a distance of
seven hexagons from the parental plant and provide dispersal events at fifteen and
above. This might be due to the fact that, as showed previously, animals with
higher memory tend to visit the plants more often than animals without memory,
thus increasing the chances that the seed would be deposited closer to the parental
tree. However, the significance level might be due to the large sample size
analysed. In fact, looking at figure 2.7, the distribution of the data looks quite
uniform and the linear correlation coefficient approaches the zero (r= 0.017).

86
Non-focal plant: an interaction between memory and distance between plants
was found (F (1, 974)= 7, p< 0.01), in which the seed dispersal distance was lower
at higher memory when plants were close together (Fig 2.8).
Prob
abili
ty d
ensi
ty
Seed dispersal distance (nº of hexagons) Seed dispersal distance (nº of hexagons)
Figure 2.6 Seed dispersal distance of the focal plant provided by animals with high memory (a) and low memory (b) in environment with unlimited food availability.
a) b)
memory
Long
dis
tanc
e di
sper
sal o
f the
foca
l pla
nt
Figure 2.7 Seed dispersal distance (median) at different memory (0= low memory; 1=high memory) of the focal plant in environment with unlimited food availability. Each point indicates one model iteration (N=1000). The line indicates the average amount of seeds dispersed per timestep ± SE.

87
2.5.6.3.2. In landscape with limited availability of resources
Focal plant: no interaction was found between animals’ memory and distance
between the plants (F (1,973)= 1.63, p= 0.201). In this case the data shows that
animal with more memory disperse seeds closer to the parental plant (F (1,973)=
9.11, p< 0.01), however the linear correlation coefficient approaches zero (r=
0.008) (fig 2.9).
0
5
10
15
20
0.00 0.25 0.50 0.75 1.00beta
med
ian2
plantDist (1 to 10)
0
5
10
15
20
0.00 0.25 0.50 0.75 1.00beta
med
ian2
plantDist (10 to 20)
0
5
10
15
20
0.00 0.25 0.50 0.75 1.00beta
med
ian2
plantDist (20 to 30)
0
5
10
15
20
0.00 0.25 0.50 0.75 1.00beta
med
ian2
plantDist (30 to 40)
0
5
10
15
20
0.00 0.25 0.50 0.75 1.00beta
med
ian2
plantDist (40 to 52)
Distance between the plants (1 to 10)
Distance between the plants (10 to 20)
Distance between the plants (20 to 30)
Distance between the plants (30 to 40)
Distance between the plants (40 to 52)
memory memory memory
memory memory
Long
dis
tanc
e di
sper
sal n
on -
foca
l pla
nt
Long
dis
tanc
e di
sper
sal n
on -
foca
l pla
nt
p= 0.02 p= 0.07 p= 0.25
p= 0.91 p= 0.46
Figure 2.8 Seed dispersal distance of the non-focal plant in landscape with unlimited availability of resources at different memory (0= low memory; 1=high memory) and distance between plants. Each point indicates one model iteration (N=1000). The line indicates the average amount of seeds dispersed per timestep ± SE.

88
Non-focal plant: no interaction was found between animals’ memory and
distance between the plants (F (1, 974)= 0.086, p= 0.769). Memory does not seem
to affect the seed dispersal distance of the non-focal plant (F (1, 974)=3.61, p=
0.057).
2.5.6.4 H4 - H5: Proportion of landscape travelled
The proportion of landscape travelled was not affected by the interaction between
memory and distance between the plants (F (1, 997)= 0.93, p= 0.33) and the
proportion of landscape travelled by the animals was not related to the memory (F
(1, 998)= 0.003, p= 0.956) in landscape with unlimited food availability. What
makes the difference is that animals with higher memory tended to revisit more
memory
Long
dis
tanc
e di
sper
sal o
f the
foca
l pla
nt
Figure 2.9 Seed dispersal distance at different memory (0= low memory; 1=high memory) of the focal plant in landscape with limited availability of food. Each point indicates one model iteration (N=1000). The line indicates the average amount of seeds dispersed per timestep ± SE.

89
often part of the landscape where the plants are located (Fig 2.10). Thus, even if
there is no difference in the amount of landscape explored, memory “constrains”
frugivores in certain areas of the environment making their movement less
random, and more directed towards the plants.
In landscapes with limited food availability no interaction was found between
memory and distance between the plants (F (1, 998)= 2.10, p= 0.147), but the
proportion of landscape travelled is higher with higher memory (F (1, 998)=
15.97, p< 0.001) (Fig 2.11). This is probably due to the fact that as the resources
are depleted, the plant itself becomes less attractive for the animal. Thus,
movements of animals with memory are less constrained by the location of the
trees, and are therefore prone to explore other parts of the landscape. At the same
time, the knowledge of the location of the food source prevents the animal from
Figure 2.10 Examples of landscape travelled by an animal with low memory (a) and with high memory (b) in landscape with unlimited resources availability. In a) and b) the location of the plant is the same. The red ‘x’ indicates the plants. The different shades of grey indicate the number of time that the animal visited the hexagon, the lighter the more the animal visited the hexagon.
a) b)
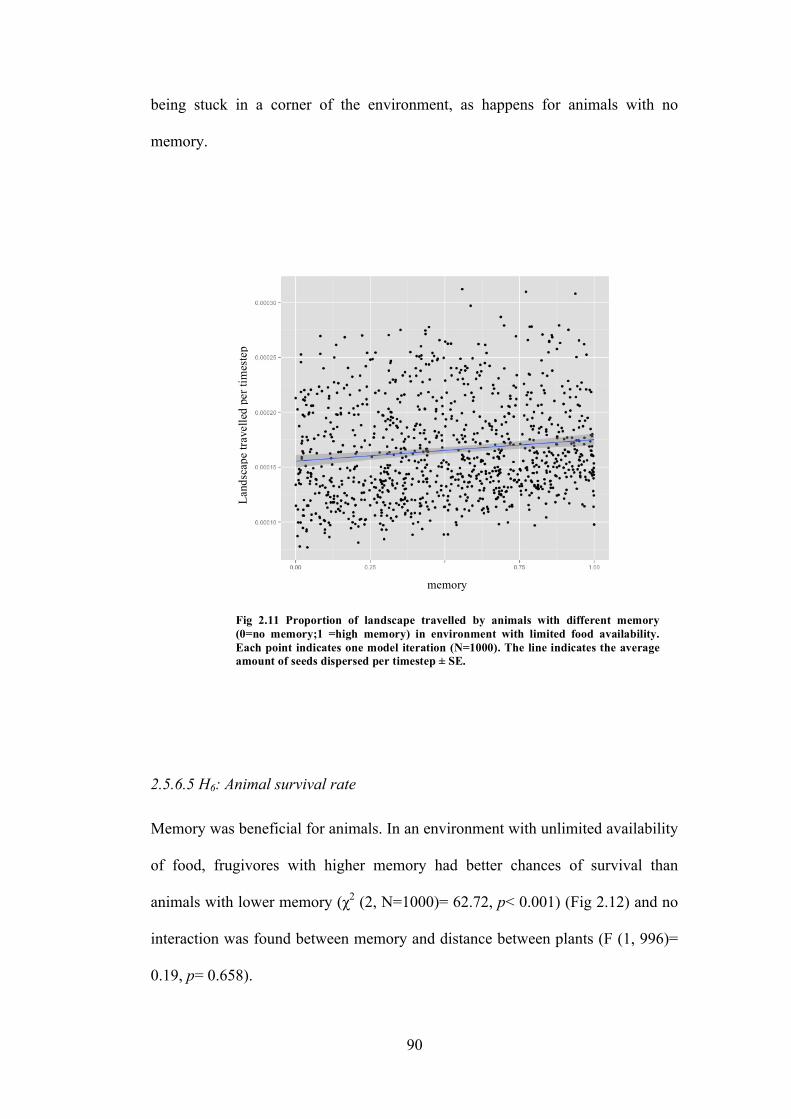
90
being stuck in a corner of the environment, as happens for animals with no
memory.
2.5.6.5 H6: Animal survival rate
Memory was beneficial for animals. In an environment with unlimited availability
of food, frugivores with higher memory had better chances of survival than
animals with lower memory (χ2 (2, Ν=1000)= 62.72, p< 0.001) (Fig 2.12) and no
interaction was found between memory and distance between plants (F (1, 996)=
0.19, p= 0.658).
Fig 2.11 Proportion of landscape travelled by animals with different memory (0=no memory;1 =high memory) in environment with limited food availability. Each point indicates one model iteration (N=1000). The line indicates the average amount of seeds dispersed per timestep ± SE.
memory
Land
scap
e tra
velle
d pe
r tim
este
p

91
In an environment with limited food availability, the mortality of the animal is
higher in general due to the depletion of the food, which is close to complete
depletion when animals posses high memory. Death rate of animals was not
affected by the interaction between memory and distance between the plants (F (1,
996)= 4.48, p= 0.061), but memory was significant as main effect (χ2 (2,
Ν=1000)= 10.09, p< 0.05). Figure 2.13 shows that this time memory is a
disadvantage for the animal, as animals that possess higher memory die faster
than animals with low memory. This maybe due to the fact that they are better at
finding food, and therefore they rapidly depleted the resources.
Figure 2.12 Survivorship rate at different memory (0=low memory; 1= high memory) in landscape with unlimited resources availability. The legend on the bottom- left indicates the range of the values of memory in which the data were grouped exclusively for a clearer representation (0-0.1= low memory; 0.9-1= high memory).

92
2.5.7 Discussion and impacts on seed dispersal
The model showed how spatial memory could affect the seed shadow in
terms of seed dispersal quantity and quality. As regards quantity, as expected
animals with better spatial memory were able to relocate the plant more efficiently
than animals with lower memory. As a consequence, the amount of seeds
removed from the plant and dispersed in the environment, was higher for animals
with higher memory. It is worth noting that this increase in the amount of seeds
dispersed was not linear, but exponential, so that animals able to retain the
information for a shorter time provide the same results as animals that have no
memory, and suggesting that exclusively long-term spatial memory could make a
big difference in the removal rate of fruits from plants.
Figure 2.13 Survivorship rate at different memory (0=low memory; 1= high memory) in landscape with limited resources availability. The legend on the top-right indicates the range of the values of memory in which the data were grouped exclusively for a clearer representation (0-0.1= low memory; 0.9-1= high memory).
93
Spatial memory was also beneficial in providing a more even distribution
of fruit removal from different trees. This depended both on memory, and on the
spatial configuration of the plants in the landscape: when plants were close
together, memory did not play a role in the inequality of seeds dispersed from
trees, which received approximately equal visits. Differences become apparent
when the plants were located further away from each other. In this case, animals
that were able to remember the location of both trees in the environment tended to
visit both plants equally, dispersing a similar amount of seeds from either plants,
while animals with low memory visited preferentially one plant over the other
causing inequality of fruit removal. This could be due to the fact that when the
plants are distant from each other, they cannot both be perceived at the same time,
because they are at a distance bigger than the perception field of the animal. As a
consequence, only animals that remember the location of both plants forage
successfully from either of them. Another explanation is that, once the animal is
satiated, it tends to move away from the plant (see method). Once this happens the
animal tends to explore the environment until it is hungry again. At this point for
animals that are able to remember the location of both trees the choice of one of
them would be equal to the 50%, while for animals that have no spatial memory,
the choice of the tree would depend on the proximity of the trees to their
trajectory, and it is more likely that the closest plant would be the one on which
the animals were previously foraging. These results suggest that, if animals’
memory skills would not be considered, the spatial conformation of plants would
be essential, as the equality of seed removal would depend on the distance
between the plants. This is in line with what was found by Carlos and Morales
(2008) who investigated the effect of plant aggregation on fruit removal using a

94
model simulation. Their study showed that as fruiting plants become aggregated,
inequalities in fruit-removal rates increase and seed dispersal distance decreases.
Both of these processes could help create and maintain plant aggregation and
affect genetic structuring. This is the case, for example, for Miconia fosteri and
Miconia serrulata trees and their main dispersers (Pipridae sp.) in the tropical wet
forest of Ecuador (Blendinger et al., 2008). The model described in this chapter
brings these findings a step forward, as it shows that animals’ spatial memory
skills could reduce the effect of distance between the plants, removing the
inequality of seed removal between aggregates of plants and isolated trees:
animals with high memory were in fact feeding from both trees in the landscape
equally, no matter how far apart they were located.
As regards seed dispersal quality, the dispersal distances at which the seeds
were deposited were examined. Not surprisingly, results showed that animals with
better spatial memory skills deposited the seeds closer to the parental plant. This
is a direct consequence of the fact that they were able to relocate the plant more
efficiently than animals with poor memory, increasing the probability that the
seeds were deposited closer to their parental tree. In this case memory could be
disadvantageous for the plants (Janzen, 1970, Cain et al., 2000, Schupp et al.,
2010). However, it is possible that this aspect would be rectified in nature thanks
to secondary dispersal events.
Memory was an advantage for animals since it allowed them to forage more
efficiently directing their movement towards the food sources and decreasing their
randomness of movement. This implies that animals with better spatial memory
skills tend to explore the environment differently than animals that move at

95
random, by visiting preferentially the area of the environment in the proximity of
the plants. As consequence, this behaviour would lead to aggregation in the
deposition patterns of seeds. This finding is supported with an empirical study on
spatial memory in primates (Di Fiore and Suarez, 2007) in which it was found that
the repetition of routes between trees results in spots with high seed density.
Although this phenomenon makes, to a certain extent, the shape of the seed
shadow predictable, it is not advantageous for plants: aggregations of seeds,
particularly if they are of the same species, increases competition among seedlings
and results in higher mortality (Shupp et al., 2010). Thus, as regard dispersal
distances and deposition patterns, animals that move at random in the
environment would provide a better service to plants, allowing them higher
chances to colonize new areas. Our results are in line to what found by Boyer and
Walsh (2010) who suggest that stochastic decisions of animals are still playing a
crucial role for the organisms and the environment, as the model they proposed
showed that excessive memory could prevent animals from exploring the
environment and produce very predictable movements with repeated visits to the
same sites (Boyer and Walsh, 2010). Thus, random searches are essential to
promote variability in seed dispersal.
Unsurprisingly, better ability in relocating food sources allows animals to live
longer. Approximately the 90% of the population with high memory survived for
all the duration of the simulation, while for animals with low memory the number
decreased at the 50%. However, in the environment where the food sources are
depletable, the model shows that animals with higher memory die faster, as their
ability to successfully relocate fruiting plants plays against them, making them
consume all the available food in a shorter time. However, this situation is

96
unlikely to be found in nature, where the animals can move to other areas that
provide food.
In conclusion, our model showed that trading off between random and
memory-based decisions can bring advantages and disadvantages to plants and
animals, but most important, that different cognitive skills produce different
effects on seed dispersal. What it is sure is that knowledge about the cognition of
frugivores could be an effective way to predict more precisely animal choices and
movements and the consequences of seed dispersal for ecosystem and
communities.
2.6 General discussion
The results of the spatial memory experiment have important implications
for seed dispersal: first of all the findings suggest that tortoises tend to visit food
sources previously encountered instead of looking always for new ones,
enhancing their foraging efficiency. For example, Di Fiore and Suarez (2007),
showed this to be the case in spider (Atheles belzebuth) and woolly monkeys
(Lagothrix poeppigii), which follow repeatedly feeding routes. Tortoises were to
remember the location of food for a period of two months, which is equivalent to
the duration of the production of fruit of some tropical plants (Moskovitz and
Bjorndal, 1990). Moreover, they proved to be able to adopt a large variety of
navigation strategies thus they are likely to be able to orientate in a variety of
settings. This plasticity may be advantageous for tortoises, because it would allow
them to relocate food sources even in case of changes in the environment, and

97
also for the plant, because it would increase the probability that the fruit would be
removed by a disperser instead of seed predators. Moreover, it would increase the
chances that the tortoises would choose a different path to reach the food
locations, which would avoid the creation of aggregates of deposited seeds, as it
happens with primates (Di Fiore and Suarez, 2007). However, studies on the
movement of the red-footed tortoise in the field did not report trajectories
undertaken by these animals, but only daily activities patterns (Moskovitz, 1987;
Jerozolimski, 2009; Montaño et al., 2013). Thus, to date, there is not enough
information available to confirm whether C.carbonaria actually uses its potential
to relocate food sources in its own environment. To my knowledge, evidence of
the use of spatial memory skills to relocate fruiting trees in the wild comes
exclusively from studies on primates (e.g. Janmaat et al., 2010; Di Fiore and
Suarez, 2007; Janmaat et al., 2013).
More information about frugivores spatial memory skills are essential
because, as highlighted by the seed dispersal model, there is the evidence that
animals with different spatial memory skills bring different kind of services to the
seed dispersal processes. Thus, knowing for how long an animal is able to
remember the location of a food source, would give us the possibility to predict
which type of impact it would have on seed dispersal in its natural environment.
The model was designed to test exclusively the effect of long-term memory on the
seed shadow of trees, thus it deliberately represented a simple environment with
no other factors than memory affecting the movement of the animals. I am aware
than in natural environment the location of food is not the only variable to
consider in order to predict where an animal would go, but it wanted to explore
how considering animal cognition in mechanistic models would improve the

98
accuracy of the results. As suggested by Cousens et al., 2010, the possible key to
a deeper understanding of seed dispersal by endozoochory would be to address
the attention on what determines the behaviour of the animals, instead of limiting
the simulation to a behaviour of the vector in a specific case of study. Thus, it can
be concluded that better knowledge about the spatial memory of frugivores will
definitely help to create more reliable predictions about the seed shadow of trees.

99
CHAPTER 3
3. WHAT?
3.1 Experiment 3: motivation and food choice in Chelonoidis
carbonaria
3.1.1 Introduction
As explained in the general introduction, perceived quality and quantity of
food are two of the benefits that are likely to motivate frugivores to choose some
fruit instead of others. From the point of view of the plant, animals’ motivation to
feed on its fruits would increase the amount of seeds removed and dispersed,
which is translated into an increase in the plant’s fitness (see chapter 1 section
1.4.2).
Summarising what was mentioned in section 1.4.2 about animals’
perception of food quality, in a controlled environment where the costs associated
with the food sources are negligible, this could depend on its taste (Yarmolinsky
et al., 2009; Zhao et al., 2010) and digestive feedback (Yearsley et al., 2006;
Werner et al., 2008), which may or may not be related to the nutritional content of
the fruit. Reptiles, as with many other species investigated, have food preferences
that might be based on the content of phosphorus, minerals and the ratio between

100
calcium and phosphorus (Moskovitz and Bjorndal, 1990). This means that in a
scenario in which they are allowed to choose between different types of food, they
eat first the preferred ones (e.g. Squamata: Christian et al., 1984; Duarte da
Rocha, 1989; Godínez-Álvarez, 2004; Chelonia; Grassman and Owen, 1982;
Moskovitz and Bjorndal 1990; Rall and Fairall, 1993; Crocodilya: Borteiro et al.,
2009; In particular food preferences of red-footed tortoises are described in
Moskovitz and Bjorndal, 1990). Thus, from point of view of a plant, being
preferred by frugivores is an advantage because it means having more chances to
have the fruits quickly removed. For example, Vilà and D’Antonio (1998) showed
that, in northern California, plants with the preferred fruits (Carpobrotus edulis)
receive a faster fruit removal than the less preferred Carpobrotus chilensis.
Nonetheless, the total fruit removal at the end of the season was approximately
the same for both species. However, studies show that animals’ fruit preference
might change according to the cost associated with accessing the food source,
such as distance from the individual (Levey et al., 1984), or the presence of
predators (Kacelnik et al., 2013) etc (see 1.4.2). This implies that it is necessary to
evaluate both the costs and benefits associated to a particular food source, in order
to have a better indication of what impact there might be on the foraging decision
of the animals and the strength of the motivation of the animals to choose and
feed on particular fruits.
Food quantity, as mentioned in the general introduction (section 1.4.3), is
another important benefit, other than quality, of a food source, as it contributes to
the growth and fitness of animals (Pyke, 1984; Guisande, 2000; Cruz-Rivera and
Hay, 2000). Therefore animals able to determine food patches with the largest
amount of food would be advantaged (Dehaene, 1997). Quantity discrimination, is
101
an ability possessed by a variety of taxa (mammals: Addessi et al., 2008, Ward
and Smuts, 2007; birds: Al Aïn et al., 2009; amphibians: Krusche et al., 2010),
however, it has not been yet investigated in reptiles. An interesting outcome of
quantity discrimination studies is that animals seem to be biased towards items
larger in volume, even when the alternative choice has a bigger total amount of
food but split in smaller parts (e.g. Boysen et al., 2001; Beran, 2008). However,
this effect disappears when items are replaced by symbols (Silberburg and Fujita,
1996). Thus, it looks like animals have an innate response to larger volumes of
food (Kaufman et al., 1996; Beran, 2008). It could be hypothesised that
preferentially choosing foods that are larger in volume might be adaptive, as it
maximizes the amount of food gained for every foraging bout (Pyke, 1984). This
leads to the question as to whether frugivores would be more motivated to forage
from plants that offer larger amounts of smaller fruits or fewer fruits that are
larger in size. Sallabanks (1993) observed that American robins (Turdus
migratorius) tend to have a hierarchical choice of food when foraging, selecting,
at first, shrubs with the biggest amount of fruits and then choosing among fruits
according to their size by favouring the largest ones. Another study on the fruit
size of the plant Ocotea tenera showed that between plants of the same species
the ones with greater than average sized fruits received more visits from birds, and
as a consequence a higher fruit removal rate, than plants with smaller fruits
(Wheelright, 1993). Thus, if this tendency of selecting large size fruit between the
plants of the same species is spread among frugivores, it might be hypothesized
that plants that produce larger fruits would attract more seed dispersers and have
higher fruit removal rate than plants with smaller fruits.
The aim of the present study was, therefore, to test whether a species of

102
reptile, the red-footed tortoise, was able to discriminate between different volumes
of food. This would (1) contribute to the literature on animal quantity
discrimination, adding information about reptiles, and (2) investigate whether
frugivores, other than primates and birds, tend to choose fruits of bigger size. In
order to avoid the possibility that the choice of tortoises was biased by the view of
larger volumes of food, as in the case of chimpanzee (Beran, 2008), tortoises were
not allowed to directly see (or smell) the food, but the different rewards were
replaced by coloured cues (see the methods 3.1.2). Moreover, to evaluate the
relative potency of tortoises’ choice, the cues were presented at different distances
from the tortoises. Distance represents a cost associated to the food, as it is
proportional to calories consumed, and could alter the choice of food of
individuals: birds, for example, chose to feed from the less preferred fruit when
closer to them, even if the preferred one was available but further away (Levey et
al., 1984). As a further control, the same procedure was repeated using two
different perceived qualities of food.
3.1.2 Method
3.1.2.1 Phase One
Subjects were four captive juvenile red-footed tortoises with carapace
length between 7.7 and 9.3 cm. When the tortoises were not occupied in the
experiment, they were housed all together in an enclosure of 1m x 1.5m with
water ad libitum, shelters and a hot spot with heat and a UV lamp. The lights were
kept on a 12 hour cycle; the substrate was covered with bark that was damped
once a day. The temperature of the room was kept between 27 and 30 degrees ºC.

103
Tortoises were fed once a day after the completion of their daily training, with a
variety of fresh fruits, excluding mango and apples, that were used as rewards
during the experiment.
Tortoises were trained and tested in an experimental arena measuring 1m x
1m, with the floor entirely covered by sand (5cm deep) in order to increase their
difficulty to walk. The arena was located in the same room where the tortoises
were housed.
3.1.2.2 Habituation phase
Each subject was habituated to the arena prior the start of the experiment.
Tortoises were individually introduced in the experimental arena for a period of
20 minutes two times on two consecutive days. During this time, they were free to
explore the environment with no restrictions. On the third day, eight pieces of
food were scattered throughout the arena. If the tortoise ate at least five pieces of
food it was considered habituated and ready to start the training phase. In the
opposite case, the tortoises received further habituation sessions as necessary.
3.1.2.3 Phase One Training
The reward used in this phase was mango jelly. This was made by mixing
mango juice with powdered agar in a 100:1 ratio. The same batch was used
throughout to control for biases due to texture or ripeness of fruit. In this way, the
quality of the reward was kept constant throughout the experiment.

104
The tortoises were trained to associate two different coloured stimuli to
two different quantities of food reward (counterbalanced across individuals). The
stimuli were laminated sheets (10.5 x 14.85 cm) of two different colours,
turquoise and purple. Previous research has shown that tortoises are able to
discriminate between these colours (Burghardt, 1977). The rewards differed in
quantity (cubes with side length of 5mm3 and 3mm3) but not in quality (all
mango). During the training phase a single stimulus was presented to the tortoise
at a distance of 30, 60 or 90 cm from the starting position and to the left, right or
middle relative to the starting point. This provided the tortoises with experience of
distance, position and reward type prior to testing. At the start of each trial the
tortoise was placed in the arena inside a small cage to allow it to observe the
stimulus. Once the tortoise had oriented towards the stimulus for at least five
seconds it was released. A choice was considered as an approach to within 3cm
the stimulus, with the head turned towards it. After a choice was made a piece of
mango jelly was dropped in a transparent bowl positioned in front of stimulus and
the trial ended. Tortoises were removed from the arena as soon as they had eaten
the jelly. The subjects had one minute to complete the trial starting from their first
movement. If they did not complete the trial within this time period they where
removed from the arena and the trial was repeated after two minutes. If they did
not move, they were removed from the arena after five minutes, and the trial was
repeated after two minutes. The arena was cleaned and the sand substrate mixed
between each trial to remove possible scent traces left between trials. Tortoises
received one training session per day, which consisted of six trials. After the
completion of 72 trials (four for each stimulus and position) the subjects
proceeded to the test phase.

105
3.1.2.4 Phase One Test
During testing both stimuli (turquoise/purple) were presented at the same
time; each stimulus could be located at 30, 60 or 90 cm, either to the left or to the
right of the starting point (Fig. 3.1a, b). Therefore 18 stimuli combinations were
possible. As during training, tortoises were introduced into the arena inside a
small cage to ensure that they had time to visualize both stimuli prior to release.
When the tortoise approached one of the two stimuli, it was rewarded with the
corresponding reward, and removed from the arena as soon as it had consumed
the jelly. In all other ways the tests were the same as the training trials. Each
tortoise completed 90 test trials (five trials for each combination of distances).
3.1.2.5 Phase two
Six captive juvenile red-footed tortoises (four of them were the same
tortoises as were used in the phase one) with carapace length between 7.7 and 9.3
cm, were used in this phase of the experiment.
Figure 3.1. Experimental setup of Phase One: examples of possible combination of distances of the stimuli. In (a) the stimuli are locate at the same distance (60 cm) from the starting point. In (b) the stimuli are located at different distances (30cm, purple; 90cm, turquoise) from the starting point. In this example the tortoise had the combination turquoise= cube with side length of 5mm3 of mango jelly and purple= cube with side length of 3mm3 of mango jelly.
(a) (b)

106
3.1.2.6 Phase Two Training
Two different rewards were used in this phase: mango jelly and apple
jelly, made following the same procedure described above. Before starting the
experiment, preference tests were given, in which the jellies were presented to
each tortoise on two petri dishes at a distance of 20cm one left and one right at
random in three different occasions. All tortoises ate the mango jelly first, and
approached the apple jelly once the mango was finished. Mango jelly was
therefore considered to be the preferred reward. The arena and the procedure of
the training and test phase were exactly the same as in the phase one. However,
the tortoises were trained to associate two novel stimuli of different colours (blue
and orange) to two different reward types (counterbalanced across individuals).
The rewards, therefore, differed in perceived quality (mango or apple jelly) but
not in quantity, as the rewards were always cubes with side length of 5mm3.
3.1.2.7 Phase Two Test
The test performed was exactly the same as in phase one, but using the
colour stimuli indicating mango and apple jelly.
The experimenter was in the test room during the whole duration of
training and testing of phase one and two, located exactly behind starting point of
the tortoises. Training and test trials were recorded with a camcorder (Canon
Legria) located on the left of the experimenter (fig. 3.1)

107
3.1.2.8 Statistical analysis
To investigate the choice of the tortoises and whether distance impacted
upon choice of food of the tortoises a generalized linear model with a poisson
error distribution was used, using the glmer function in R 2.15.0. For Phase One
the volume of jelly (cubes with side length of 5mm3/3mm3) and the interaction
between the volume of jelly and position (distance of the stimulus from the
starting point, 30/60/90 cm) were entered as fixed factors and subject identity as a
random effect. Significance was assessed by comparing the full model to a
reduced model lacking the term of interest using likelihood ratio tests (Crawley,
2005). The same statistical analysis was applied to data collected during the Phase
Two. This time, the fixed factors were the type of jelly (apple/mango) and the
interaction between type of jelly and the position of the stimulus.
3.1.3 Results
3.1.3.1 Phase One
The tortoises were able to learn the association between colour of the
stimuli and volume of jelly, showing a strong preference for the stimulus
associated with the larger volume of food when both stimuli were located at the
same distance from the starting point (Fig. 3.2a) or the stimulus for the largest
volume was closer (χ2(1) = 15.50, p < 0.001) (Fig. 3.3a, b). The tortoises
continued to choose the largest reward even when the stimulus was the furthest
(90cm) from the starting point (χ2(1) = 4.00, p = 0.04; Fig. 3.3c, d). The position
of the stimuli did not influence choice of tortoises (interaction: χ2(2) = 1.33, p =
0.51).

108
3.1.3.2 Phase Two
As expected, tortoises showed a strong preference for mango jelly when
both stimuli were located at the same distance (Fig. 3.2b) and when mango was
closer to the starting point than apple (χ2 (1)= 12.76, p < 0.001) (Fig. 3.3a, b).
However, unlike Phase One, when the stimulus for mango jelly was farther than
for apple (Fig. 3.3c, d), the tortoises’ preference for mango dropped to chance
(χ2(1)= 0.14, p = 0.71). The position of the stimulus of the preferred reward
influenced the choice of the tortoises (interaction: χ2(2)= 15.00, p < 0.001).
0
2
4
6
8
10
12
30cm 60cm 90cm
numbe
rofcorrectcho
ices
Distance
Mango Apple
0
2
4
6
8
10
12
30cm 60cm 90cm
numbe
rofcorrectcho
ices
Distance
5mm 3mm
*** *** ***
*** *** **
Figure 3.2 Tortoises’ mean ± SD correct choices when (a) the stimuli associated to different amount of food (cubes with side length of 5mm3 and 3mm3) or (b) different types of food (mango; apple) were located at the same distance. Asterisks indicate significant differences between groups: ** p< 0.01, *** p< 0.001.
a) b)

109
3.1.4 Discussion
This experiment revealed that a species of reptile can discriminate between
different amounts of food: tortoises preferentially approached the stimulus
associated with the larger volume of food, regardless of distance. This supports
the hypothesis, introduced in section 1.5.3, that the ability to discriminate between
a) b)
c) d)
0
2
4
6
8
10
12
5mm-3mm mango-apple
numberofcorrectchoices
30cm 90cm
0
2
4
6
8
10
12
5mm-3mm mango-apple
numberofcorrectchoices
60cm 90cm
0
2
4
6
8
10
12
5mm-3mm mango-apple
numberofcorrectchoices
90cm 30cm
0
2
4
6
8
10
12
5mm-3mm mango-apple
numberofcorrectchoices
90cm 60cm
***
*** ***
*** ***
Figure 3.3. Tortoises’ mean ± SD correct choices when the stimuli were located at different distances. In (a) and (b) the stimuli associated to the preferred rewards (mango or cube with side length of 5mm3 of food) were closer; in (c) and (d) the stimuli associated to the preferred rewards were farther away. Asterisks indicate significant differences between the groups: * p< 0.05, ** p< 0.01, ***p<0.001.
a) b)
c) d)
110
volumes and the preference for larger ones evolved early in the evolutionary scale
(Boysen et al., 2001; Beran, 2008), or evolved independently multiple times,
suggesting that this skill is adaptive and perhaps used by animals in order to
optimise their foraging efficiency.
Tortoises also showed interesting differences in choice behaviour when
presented with different quality or quantity of reward. The results showed that
their preference for the larger amount of food remained unaltered over distance,
whilst their choice of mango changed and dropped to chance when it was located
further away than the apple jelly. Similar results were observed in birds, which
have been shown to change their food preferences with an increased distance to
the preferred fruit (Levey et al., 1984). This suggests that larger amounts of food
exert a stronger response compared to a preferred type of food, as tortoises
overcame the cost of distance in order to obtain more food but they did not do the
same for the preferred food. These findings are in line with what has been found
in lizards (Kaufman et al., 1996), which chose the largest snail in spite of the
higher handling cost.
However, this behaviour could depend on the quality of the particular
reward used: even though mango was strongly preferred to apple when they were
located at the same distance, it may be that this preference was not a sufficiently
strong incentive for tortoises to incur the cost of walking the extra distance. So,
the possibility that different types of reward might influence tortoise behaviour
differently cannot be excluded. It seems therefore that the red-footed tortoise is
able to consider more than one parameter at time when foraging, and to modulate
its decisions according to cost (distance) and the benefits (reward) it can obtain.

111
Moreover, results imply that tortoises were able to learn the association
between a visual cue and the corresponding quantity or quality of food. During
the experiment the subjects received the reward only after choosing the stimulus,
therefore they learned what the colour indicates and their choice was not biased
by the view or smell of food. Thus, they were able to use visual stimuli to infer
information about food sources and then choose between them. This implies also
that tortoises are able to determine the value of food items from distance, which
would improve their foraging strategy (Pyke, 1984).
3.1.5 Implications for seed dispersal
The results of this experiment could have important implications for seed
dispersal: first of all, it could be expected that, among plants of the same species,
tortoises would direct their foraging towards trees that produce bigger fruits, as
they showed good ability to discriminate between quantities and they preferred
the largest one. This agrees with what found in Wheelwright (1993): data in the
field showed that among plants of the same species (Ocotea tenera), the one with
larger fruit were visited more frequently by birds and had a faster fruit removal
rate than the ones with small fruit. Thus, the volume of fruits seems to be an
important parameter in the selection process of fruit by frugivores, impacting on
the probability of a fruit of being eaten.
Second, the results support the hypothesis that the location of food sources
with respect to other fruiting plants may influence the success of fruit removal
(Levey et al., 1984; Fragoso et al., 2003; Hampe et al., 2008). High perceived
quality plants and/or plants with bigger size fruits (preferred plants) are likely to
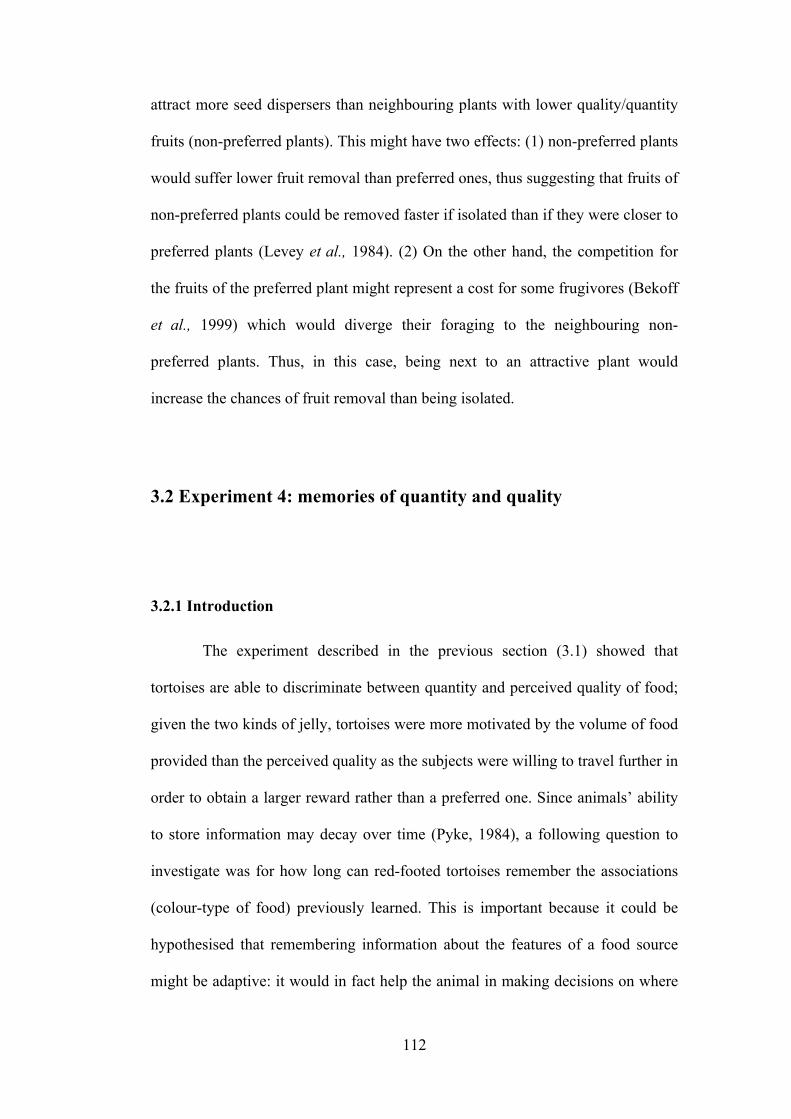
112
attract more seed dispersers than neighbouring plants with lower quality/quantity
fruits (non-preferred plants). This might have two effects: (1) non-preferred plants
would suffer lower fruit removal than preferred ones, thus suggesting that fruits of
non-preferred plants could be removed faster if isolated than if they were closer to
preferred plants (Levey et al., 1984). (2) On the other hand, the competition for
the fruits of the preferred plant might represent a cost for some frugivores (Bekoff
et al., 1999) which would diverge their foraging to the neighbouring non-
preferred plants. Thus, in this case, being next to an attractive plant would
increase the chances of fruit removal than being isolated.
3.2 Experiment 4: memories of quantity and quality
3.2.1 Introduction
The experiment described in the previous section (3.1) showed that
tortoises are able to discriminate between quantity and perceived quality of food;
given the two kinds of jelly, tortoises were more motivated by the volume of food
provided than the perceived quality as the subjects were willing to travel further in
order to obtain a larger reward rather than a preferred one. Since animals’ ability
to store information may decay over time (Pyke, 1984), a following question to
investigate was for how long can red-footed tortoises remember the associations
(colour-type of food) previously learned. This is important because it could be
hypothesised that remembering information about the features of a food source
might be adaptive: it would in fact help the animal in making decisions on where

113
to go foraging, without the necessity to re-evaluate the food sources every
foraging event and reducing the risk to re-visit food sources that do not offer
satisfying food.
Long-term memory in visual discrimination tasks has been investigated in
a variety of species; for example pigeons remembered 800 different pictures for a
period of 5 years (Fagot and Cook, 2006), sea lions were able to solve a visual
task after a 10 year interval (Reichmuth-Kastak and Schusterman, 2002) and
elephants were successful in a discrimination task after a lag of 8 years (Stevens,
1978). This cognitive ability in chelonians was recently investigated in terrapins
(Pseudemys nelsoni and Trachemys scripta) which were able to discriminate
between a black and white bottle, one of which was associated with food, and
remember this visual task for a 3.5 months retention period (Davis and Burghardt,
2012). Long-term memory of Pseudemys nelsoni, was proven to be longer than
that, considering that they remembered the motor action to solve a specific task
after two years retention time (Davis and Burghardt, 2007). Other examples of
how some species of Chelonians excel in long-term spatial memory were
mentioned in chapter 2 (Rowe et al., 2005; Mitrus, 2006; Wilkinson et al., 2007;
2009; Muller-Paul et al., 2014).
As regards frugivores, whether their motivation to visit certain food
sources is maintained thanks to their long-term memory skills, would impact
differently on seed dispersal. The experiment 3 showed how being motivated
from particular fruit traits (in this case the volume of food) might potentially
affect the fruit removal rate from different trees impacting also on the
neighbouring plants (Levey et al., 1984; Fragoso et al., 2003; Hampe et al.,
2008). Going a step further, these foraging events would impact on plant

114
dynamics differently if they were constantly repeated, due to the fact that
frugivores remember and decide to forage from a specific tree, or if they were the
result of a single random event, in the case that animals do not remember
information about fruits, thus foraging on the same plant only when occasionally
re-encountered in the environment (Boyer and López-Corona, 2009).
Therefore, the long-term memory of red-footed tortoise regarding the
association between a visual cue and type of food (quantity and perceived quality)
was investigated after a retention time interval of 18 months, thus for a period
longer than a fruiting season (Moskovitz and Bjorndal, 1990). It must be
underlined that usually, in visual discrimination studies, the animals learn to
associate a positive stimulus with the food, while nothing to the negative stimulus,
thus the subjects have a strong motivation to learn and remember the correct
association, otherwise they would not receive any reward (Fagot and Cook, 2006;
Davis and Burghardt, 2007; 2012). In experiment 3, both visual cues provided the
tortoises with food, thus it might be expected that their motivation in
remembering which cue was providing the better reward might be less strong,
because the subject received a reward no matter its choice. Moreover, the few
studies in literature that investigated the ability of animals to remember the mental
representation of quantity, limited the retention time from few seconds (Ward and
Smuts, 2007; Mahamane et al., 2014) to minutes (Beran and Beran, 2004). Thus,
to my knowledge, this is the first study that tests long-term memory of mental
representation of quantity and perceived quality in reptiles over such a long time
interval.

115
3.2.2 Method
3.2.2.1 Pre-test
The same tortoises that took part in the experiment described in the
previous section (3.1), took part in this experiment. A week before the scheduled
date of the test, each tortoise received a pre-test session, during which they had to
approach a visual cue in order to gain a reward. This procedure was performed to
ensure that the subjects habituated again to the experimental environment and
associated the environment with the task of approaching a cue to receive food.
The pre-test took place in the same arena, with the surface covered by sand, where
the tortoises performed the previous experiments (section 3.1). The procedure was
exactly the same as described in phase one of experiment 3 (section 3.1.2). The
only difference was the reward, which consisted in a small piece of dandelion, and
the visual cue, which was a yellow cylinder. The reward and the visual stimulus
used were different to those used during the training and test in experiment 1
(section 3.1.2) in order not to give the tortoises any additional training, thus not
affecting the performance of the tortoises during the test. The pre-test ended when
the tortoises complete a session of six consecutive correct trials, i.e. the subject
approached the cue.
3.2.2.2.Test
After 18 months from the last day of the previous quantity and quality test
respectively (section 3.1.2), tortoises were tested in a two choice task. Both tests
for quantity and quality long-term memory discrimination were performed in the

116
same way. The visual stimuli (turquoise and purple for quantity and orange and
blue for the perceived quality) were located in the arena at the same distance,
60cm from the starting point, one left and one right at random. As during the
initial training (phase one, section 3.1.2.1), tortoises were introduced into the
arena in a small cage and they were released after they looked at both stimuli, to
be sure that they were aware of both choices. Then, they had one minute to
approach one of the two stimuli. When a choice was made, with the tortoise was
at 3cm distance from the cue looking towards it, the subject was removed from
the arena without receiving any reward in order to not effectively re-train. After
two minutes the next trial started. The test consisted of one session of six
consecutive trials. As the stimuli were presented at the same distance, so the cost
of distance was null, I expected that if the tortoises remembered the association
visual cue- type of food, they would have chosen the visual cue indicating the
preferred reward above chance. If tortoises did not remember the association
visual cue- type of food, I expected their performance to be at random.
3.2.2.3 Data analysis
The data were analysed using the 1-sample Poisson rate test using Minitab
17. This test is used to estimate whether the rate of occurrence of an event differs
from a reference value. Thus, the number of choices of the bigger amount of food
for the quantity test, and the choices of mango for the quality test, were
introduced as the success events. Since for each trial the probability of being
successful was 0.5, and tortoises received a total of six trials, the reference value
was set as three. The alternative hypothesis tested was that the rate of occurrence

117
of the success was greater than the hypothesized rate of occurrence (i.e., > 3).
3.2.3 Results
Tortoises successfully remembered the association between the visual cue
and the quantity of the reward by choosing above chance the stimulus that
represented the large amount of mango (1-sample poisson rate: p= 0.037; Fig.
3.4a). Also regarding the perceived quality tortoises showed to possess long-term
memory, choosing above chance the cue associated to the mango reward rather
than apple (1-sample poisson rate, p= 0.028; Fig. 3.4b). In table 4 are reported the
individual choices during the quantity and quality test.
0
1
2
3
4
5
6
7
mango apple
numberofcorrectchoices
0
1
2
3
4
5
6
7
5mm 3mm
numberofcorrectchoices
Figure 3.4 Tortoises’ mean ± SD correct choices after 18 months retention time in the quantity (a) and quality (b) discrimination test. The asterisk indicates the significant differences between the groups, *p<0.05
a) b)
* *

118
Table 4 Individual data of quantity and quality discrimination test.
3.2.4 Discussion
Red-footed tortoises remembered the association between a visual
stimulus and the amount and/or perceived quality of food associated to it after a
retention time of 18 months. This supports the hypothesis in Davis and Burghardt
(2012) that suggested that long-term memory in chelonian should be adaptive,
maybe because of their longevity, and they are potentially excellent models for
the study of animal memory. The present results add a piece more to the study of
animal long-term memory, as it showed that tortoises were able to remember the
association between visual cue-feature of the food, instead of exclusively visual
cue – food (Fagot and Cook, 2006; Davis and Burghardt, 2012). This means that
the type of reward motivates the animal in the selection of food sources in a way
that could be comparable to the presence or absence of food and prove that
tortoises are able of memories of feeding experience (Ban et al., 2014). A next
step would be to investigate how tortoises use other features, such as scent or
Quantity test Quality Test
Subject 5mm3 Mango 3mm3 Mango Mango Apple
Esme 6 0 5 1 Quinn 5 1 5 1
Timothy 6 0 4 2 Marshall 2 4 3 3
Russell / / 5 1 Margot / / 5 1
Table 4. Tortoises’ choices during the quantity and quality discrimination tasks; Dashes indicate that the tortoise did not participate to the experiment.

119
texture, to select fruit as common among primates (Dominy, 2004) and to verify
which feature would be retained for longer time.
3.2.5 Implication for seed dispersal
These findings have potentially a large impact upon the seed dispersal
process. As first, since tortoises remembered the different feature of the food
sources, it could be claimed that plants that provide more satisfying fruits, not
only would receive more visits from frugivores, but they would also have assured
their visits after long periods of time (Di Fiore and Suarez, 2007; Ban et al.,
2014). Janmaat et al. (2010), for example, observed that mangabeys (Lophocebus
albigena johnstonii) rely on memory to re-locate fig trees over a period of six
years, finding fig trees more efficiently in previously known areas than in newly
explored areas. Eighteen months is a time interval longer than the fruiting interval
of the majority of plants species in red-footed tortoise habitat (Moskovitz and
Bjorndal, 1990), thus tortoises are potentially able to remember the quality of a
food source between fruiting periods.
As was mentioned in the introduction (3.2.1), whether fruit removal is the
result of random or constantly repeated events, would have different long-term
impacts on seed dispersal (see Boyer and López-Corona, 2009). For example, it
could be hypothesized that if fruit removal was solely due to an animal that passes
randomly through an area and forages from the resources available at the time, the
animal would probably forage first from what it perceived as preferred food, then
maybe on other neighbouring plants until it gets satiated, because it will not know
when it would be the next time it would feed. On the contrary, it could be

120
hypothesised that if the animal remembers the quality of one or more food sources
in the environment it wouldn’t probably choose to forage from the less preferred
plants of the patch, but it would move to the next preferred food source. Ban et al.
(2014) found that chimpanzee directed their foraging towards preferred fruiting
trees ignoring closer but less preferred fruits. If this is true, the hypothesis
mentioned in section 3.1.5, i.e. the location of food sources with respect to other
fruiting plants may influence the success of fruit removal (Levey et al., 1984;
Fragoso et al., 2003; Hampe et al., 2008), would be still valid for animals that are
new to the area or that do not possess good memory.
3.3. Experiment 5. Creating prediction with a seed dispersal
model: how memories of different quantity and quality of food
impact on seed dispersal
3.3.1 Introduction
In the previous sections (3.1 and 3.2) it was shown that tortoises were able
to learn the association between a colour and different quantity and perceived
quality of food, discriminate among them and remember what they have learned
for a long period of time (18 months). Then, the possible impacts that these
cognitive skills might bring on seed dispersal process were discussed. In this
section I present a seed dispersal model which aims to investigate the effects that
the cognitive skills tested in the experiment in 3.1 and 3.2 might have on seed
dispersal in environment with plants that offers different food quantity (section

121
3.3.2). different food quality (section 3.3.3) and different quantity and quality
combined (section 3.3.4). The model was built in the same way as for the model
in chapter 2 (section 2.3) with small changes that are explained in each of the
corresponding sections.
3.3.2 Quantity model: Hypothesis tested and predictions
The aim of the present model was to verify how the memory of the animal
would affect its choices in an environment where the food sources differ in
quantity, and how this, in turn, affects the seed dispersal pattern. In particular the
following hypotheses were tested:
H1: The interaction between memory and the total quantity of food provided by
the plants, predicts the total amount of seeds dispersed in the landscape.
H2: The interaction between memory and the difference in quantity of food
provided by each of the two plants predicts the amount of seeds dispersed by
each plant.
H3: The interaction between memory and the quantity value of the plant explains
the long distance dispersal of the individual plant.
H4: The interaction between memory and the total quantity of food predicts the
proportion of landscape travelled by the animals.
H5: The interaction between memory and the total quantity of food explains the
time of death of the animals.
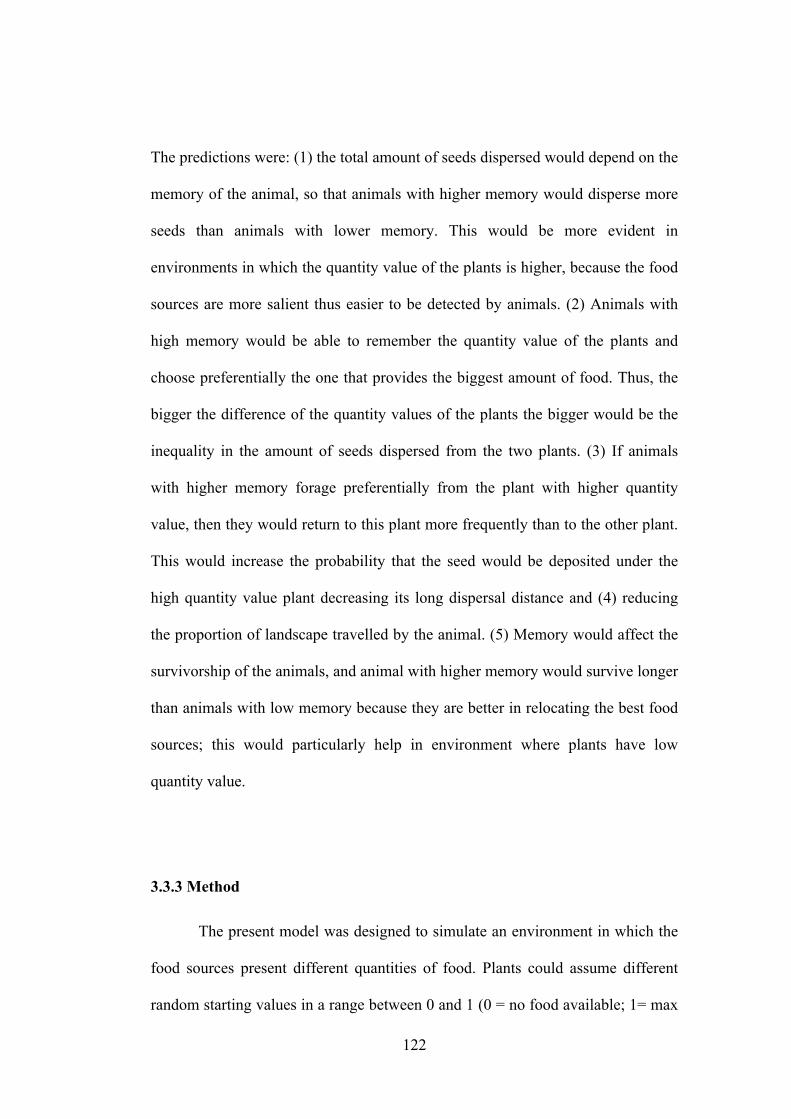
122
The predictions were: (1) the total amount of seeds dispersed would depend on the
memory of the animal, so that animals with higher memory would disperse more
seeds than animals with lower memory. This would be more evident in
environments in which the quantity value of the plants is higher, because the food
sources are more salient thus easier to be detected by animals. (2) Animals with
high memory would be able to remember the quantity value of the plants and
choose preferentially the one that provides the biggest amount of food. Thus, the
bigger the difference of the quantity values of the plants the bigger would be the
inequality in the amount of seeds dispersed from the two plants. (3) If animals
with higher memory forage preferentially from the plant with higher quantity
value, then they would return to this plant more frequently than to the other plant.
This would increase the probability that the seed would be deposited under the
high quantity value plant decreasing its long dispersal distance and (4) reducing
the proportion of landscape travelled by the animal. (5) Memory would affect the
survivorship of the animals, and animal with higher memory would survive longer
than animals with low memory because they are better in relocating the best food
sources; this would particularly help in environment where plants have low
quantity value.
3.3.3 Method
The present model was designed to simulate an environment in which the
food sources present different quantities of food. Plants could assume different
random starting values in a range between 0 and 1 (0 = no food available; 1= max

123
quantity of food). The salience of each tree in the landscape is reflected by its
value because, as described in the method in chapter 2, section 2, the animal in the
model is more attracted by spatial locations with higher values. Therefore, the
higher is the value of the plant, the more the animal would be attracted by it. As
for the seed dispersal model in chapter 2, two landscapes were simulated for
comparison: one with unlimited food sources and one with limited food sources.
Table 5 List of the parameters used in the quantity model
Parameter Values explored
𝛼: sensory attenuation coefficient 0.5
𝛽: memory decay coefficient Drawn from an exponential logarithm distribution (0.99,1)
𝛾: friction coefficient 0.07
𝜅: satiation coefficient 0.1
𝜆: hunger coefficient 0.99
𝜇! and 𝜎! : parameters of the cumulative lognormal probability density function describing the probability of defecation
4; 0.2
𝜇! and 𝜎! : parameters of the cumulative lognormal probability density function describing the probability of seed excretion
1; 0.2
𝑇 10,000
𝜅!: concentration parameter for von Mises distribution
1.83
Deaththreshold 0.001
PlantQuantity:valueoftheplantasitappearsinthevegetationmap
Uniform random numbers in the range [0, 1]
Plant Quality: quality coefficient of theplant
1

124
Tota
l am
ount
of s
eeds
dis
pers
ed p
er ti
mes
tep
Tota
l am
ount
of s
eeds
dis
pers
ed p
er ti
mes
tep
Tota
l am
ount
of s
eeds
dis
pers
ed p
er ti
mes
tep
3.3.4 Results
3.3.4.1 H1: Total amount of seeds dispersed in the environment
The total amount of seeds dispersed was affected by the interaction
between the memory of the animal and the total quantity of food provided in the
landscape in environments with unlimited food availability (F(1,996)= 14.29, p<
0.001): animals with high memory disperse more seeds than animals with low
memory, and the amount of seeds dispersed increases with the increase of food
availability in the environment (fig.3.5).
Figure 3.5 Total amount of seeds dispersed by animals with different memory (0= low memory, 1= high) in environment that provides different total quantity of food. Each point indicates one model iteration (N=1000). The line indicates the average amount of seeds dispersed per timestep ± SE.
This interaction loses significance in landscapes in which the food availability is
limited (F(1,997)= 1.61, p= 0.2), but memory remains significant as a main effect
(F(1, 997)= 79.75, p< 0.001). Figure 3.6 shows that animals with higher memory
Environment with low quantity of food
Environment with medium quantity of food
Environment with high quantity of food

125
Figure 3.6 Total amount of seeds dispersed in environment with limited food availability at different memory (0= low memory, 1= high memory). Each point indicates one model iteration (N=1000). The line indicates the average amount of seeds dispersed per timestep ± SE.
disperse more seeds than animals with lower memory, but the total amount of
seeds dispersed by animals with different memory is similar because the resources
are limited.
3.3.4.2 H2: individual amount of seeds dispersed from the two plants
The different amount of seeds dispersed from the two plants was analysed
in order to investigate if the plant that with higher quantity value would receive an
advantage in terms of amount of seeds dispersed. Results showed that animals
with higher memory visited higher value plants more often, creating as a
consequence a bigger inequality in the amount of seeds dispersed from the two
plants; this interaction between animal memory and the different values of the
plants was significant in the landscape with unlimited (F(1, 997)= 21.49, p<
0.001) and limited (F(1, 997)= 12.54, p< 0.001) food availability. This means that
Tota
l am
ount
of s
eeds
dis
pers
ed p
er ti
mes
tep

126
in environments in which the quantity of food provided by the food sources is
highly different, animals with memory are able to take advantage of the most
productive tree by foraging preferentially from it and producing a bigger
inequality in the amount of seeds dispersed from the trees. When the plants are
quantitatively equivalent the preference for one plant disappears and the
inequality in the amount of seeds dispersed from the plants tend to be reduced, in
particular by animals with high memory. Animals with low memory, on the
contrary, seem to behave in the same way no matter the quantitative difference of
the plants (fig 3.7a). The same results were obtained in environment with limited
food availability (fig. 3.7b).
3.3.4.3 H3: Long distance dispersal
The long distance dispersal of the plants with the highest and lowest
quantity values was analysed. Since animals with high memory choose
preferentially the plant with higher quantity values, the expectation was that the
seeds of the preferred tree would have shorter dispersal distances than these of the
other tree in the landscape, because the animal would spend more time around it.
However, the interaction between memory of the animal and quantity value of the
plant did not affect the dispersal distance of seeds (F(1, 989)= 0.002, p= 0.964).
Memory was the only factor affecting the dispersal distance of the plants in both
type of landscapes (unlimited food availability: memory F(1, 989)= 20.43, p<
0.001); fruit quantity (F(1, 989)= 3.75, p= 0.053); limited food availability:
memory (F(1, 987)= 8.11, p< 0.01); food quantity (F(1, 989)= 0.33, p= 0.562)).

127
As in the previous model (chapter 2), results showed that the higher the memory
of the animal the closer to the parental tree seeds were deposited.
Figure 3.7 a) Difference of seeds dispersed from the plants in landscape with unlimited food availability at different memory (0= low memory; 1=high memory) and different quantity values of the trees. b) Difference of seeds dispersed from the plants in the landscape with limited food availability at different memory (0= low memory; 1=high memory) and different quantity values of the trees. Each point indicates one model iteration (N=1000). The line indicates the average difference of seeds dispersed from the two plants per timestep ± SE.
Low difference of quantity values of the plants (from 0.0018 to 0.281)
High difference of quantity values of the plants (from 0.2815 to 0.9566)
Diff
eren
ce o
f see
ds d
ispe
rsed
from
the
two
plan
ts p
er
times
tepp
Diff
eren
ce o
f see
ds d
ispe
rsed
from
the
two
plan
ts p
er
times
tep
a) D
iffer
ence
of s
eeds
dis
pers
ed fr
om th
e tw
o pl
ants
per
tim
este
p
Diff
eren
ce o
f see
ds d
ispe
rsed
from
the
two
plan
ts p
er
times
tep
Low difference of quantity values of the plants (from 0.00028 to 0.2944)
High difference of quantity values of the plants (from 0.2951 to 0.9726) b)

128
3.3.4.4 H4: Proportion of landscape travelled
The proportion of landscape travelled by the animals was not affected by
the interaction between memory and the quantity of food provided in the
environment (F(1, 992)= 0.058, p= 0.808). Animals’ movement was influenced
exclusively by the distance from each other at which plants were located in
landscape with unlimited food availability. In the same way, the interaction was
not significant in an environment with limited food availability (F(1, 992)= 0.09,
p= 0.764), but there, memory influenced the distance travelled as animals with
higher cognitive skills travelled more than animals with lower memory (F(1,996)=
33.9, p< 0.001) (fig. 3.8). This might be due to the limited amount of resources
that pushed the animals with memory to move more between trees: seed
dispersers in the model are more attracted by hexagons of the map with higher
values. When the plants are depleted, their map-value decreases, thus the higher
value plant, after being consumed, would become the lower value plant. This
would make the animals move away from it and prefer the other tree. When part
of this tree is consumed, the values of the plants would be exchanged again. This
process might make the animals with memory move more. The same would not
happen with animals with lower memory because they would forget the values of
the plants very quickly, thus their foraging strategy and movement would be
unaffected.

129
3.3.4.5 H5: Animals’ survival
Animal survival was affected by the interaction between memory and the
total quantity of food provided by the environment, in landscape with unlimited
food availability (χ2(7, N=1000)=24.97, p< 0.001) (fig 3.9). Animals with higher
memory survive longer than animals with lower memory and this effect is
enhanced in environments that offer a bigger total amount of food, where animals
with high memory almost never die (fig 3.9c). This depends on the fact that in
environment with higher quantity values, plants (or at least one of them) are more
salient than in landscape with low quantity values.
In environments with limited food availability the interaction between
animal memory and the total amount of food provided was not significant (χ2(7,
Prop
ortio
n of
land
scap
e tra
velle
d pe
r tim
este
p
Figure 3.8 Proportion of landscape travelled per timestep in environment with limited food availability at different memory (0= low memory, 1= high memory). Each point indicate one model iteration (N= 1000). The line indicates the average proportion of landscape travelled per timestep ± SE.

130
N=1000)=, p= 0.085). The total quantity of food provided in the environment
resulted to be the most relevant factor influencing death rate (χ2(7, N=1000)=
24.97, p< 0.001), so that in an environment with less food available animals die
sooner and, as found in the model in chapter 2, memory could actually be a
disadvantage (χ2(7, N=1000)= 119.24, p< 0.01) because the ability to relocate
food sources efficiently allows animals to consume the food available more
quickly.
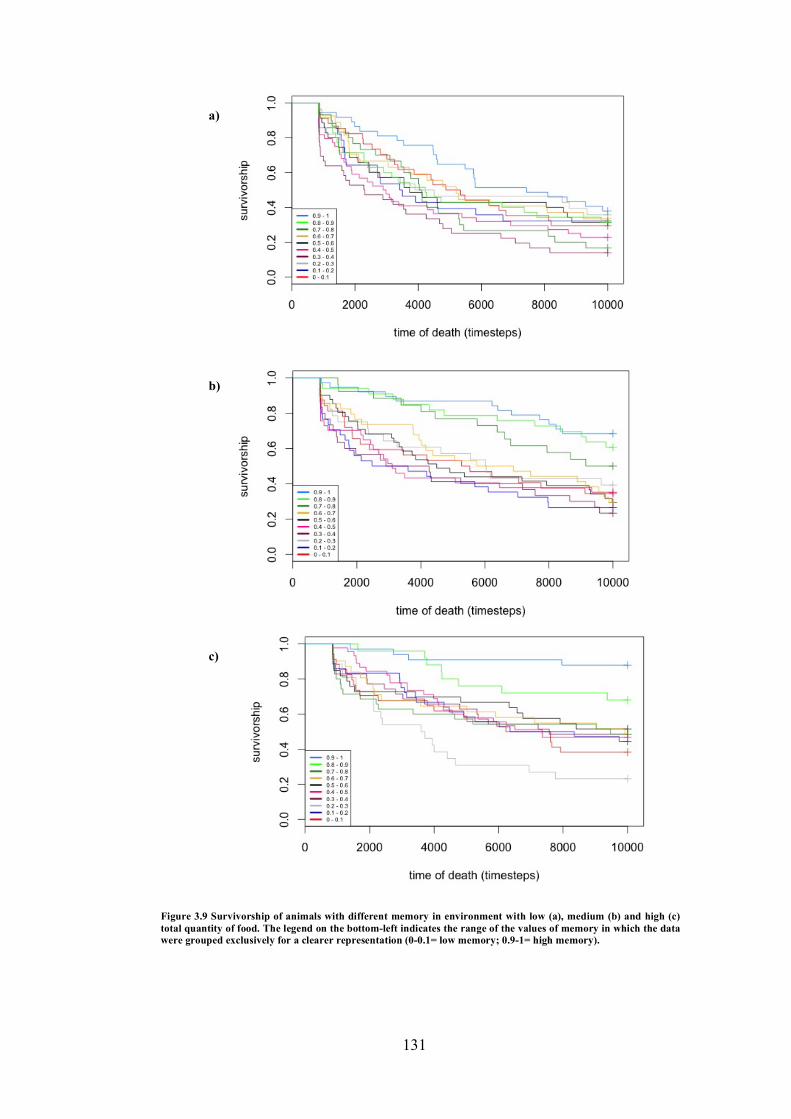
131
b)
c)
a)
Figure 3.9 Survivorship of animals with different memory in environment with low (a), medium (b) and high (c) total quantity of food. The legend on the bottom-left indicates the range of the values of memory in which the data were grouped exclusively for a clearer representation (0-0.1= low memory; 0.9-1= high memory).
132
3.3.5 Discussion
The present model showed that the quantity of food provided by plants is
an important factor in seed removal by frugivores. The amount of seeds dispersed
increased when plants in the landscape had higher quantity values. This happened
in the model because quantity is a salient feature that could be perceived by the
animals, with the result that the higher the quantity value of a plant the more the
animals were attracted by it. This is in line with what is found in nature, where the
number of frugivores seems to be closely linked with local abundance of fruit
(Rey, 1995; Tellería and Pérez-Tris, 2003; Tellería et al., 2008; Gleditsch and
Carlo, 2011). Moreover, results support those found in other seed dispersal
models (Carlo and Morales, 2008; Boyer and López-Corona, 2009), which
analysed the neighbouring effect of plants on seed dispersal. The more attractive
the composition of a patch in the environment, the more plants in it would have
chances of dispersal (Carlo and Morales, 2008). Thus, as mentioned in 3.1.5,
having high food quantity, or a salient feature that attracts animals, could be
beneficial not only for the tree itself but also for the neighbouring plants.
However, the model presented in this section, showed that these results might be
very different depending on the memory skills of the animals: the amount of seeds
dispersed in the environment increased exponentially at higher level of memory,
showing that the ability to not only perceive, but remember, the location of food
sources and base the foraging decision according to previous experiences could
increase significantly fruit removal rate. Moreover, memory is the factor that
regulates the inequality of dispersal from trees with different quantity values.
When the plants have similar values, animals with memory tend to disperse the
same amount of seeds from the both plants in the environment (as in the model

133
presented in chapter 2). On the contrary, when the plants differ in value, animals
with memory tend to increase the inequality of seeds dispersed from the trees.
This does not happen with animals that have no memory and rely exclusively on
their perception.
As also found in the model in chapter 2, high memory provides the plants
with shorter seed dispersal than animals with low memory, due to the fact that
their movements are driven by the location of food. Carlos and Morales (2008)
found that the location of good patches in the environment would affect animals’
movements and seed distribution. The present results are in line with these
findings, however, once again, these are strengthened by the degree of memory of
the animals. The quantity of food available in the environment interacts with
memory and, as expected, animals with higher memory survive longer thanks to
their ability to relocate food. In landscape with limited food, animals with high
memory deplete faster all the resources in the environment, dying sooner than
animals with less memory. However, this situation is unlikely to happen in nature,
as an animal can normally move to another area once they have consumed the
resources in the patch previously used for foraging.
3.3.6 Quality model: introduction, hypothesis tested and predictions
The previous model (3.3.1) showed that whether animals remember the
quantity of resource that a plants offer impacts differently on seed dispersal than if
they have no knowledge and thus forage at random. Quantity was a salient feature
of the plants, thus animals could perceive it. In this section I therefore present the
results of a model in which plants present different qualities of food, a non-salient
134
feature. In a scenario where an inexperienced frugivorous encounters for the first
time a fruit, it might not be possible for it to know about the quality of the fruit
only by its external features. The animal must eat the fruit first and only then,
according to its taste and digestive feedback, the animal will categorise the fruit as
good or bad (Sclafani, 1995). As for the previous model with plants of different
quantitative value, the aim was to verify how the memory of the animal would
affect its choices in an environment where the food sources differ in quality, and
how this, in turn, affects the seed dispersal pattern. In particular the following
hypothesis were tested:
H1: The interaction between memory and total quality of the environment predicts
the total amount of seeds dispersed (Total quality value of the environment=
sum of the quality of the two plants).
H2: The interaction between memory and ratio of the quality of the plants predicts
the individual amount of seeds dispersed from the two plants.
H3: There is a three way interaction between memory, ratio of the quality of the
plants and total quality of the environment that predicts the individual amount
of seeds dispersed from the two plants.
H4: The interaction between memory and quality of the plant predicts the long
distance seed dispersal of the two plants.
H5: The interaction between memory and quality of the environment explains the
proportion of landscape travelled by the animal.
H6: The interaction between memory and quality of the environment explains the
survivorship of the animals.

135
The predictions are: (1) there is an interaction between memory and total quality
of the environment so that the total amount of seeds dispersed would depend on
the memory of the animal (animals with higher memory would disperse more
seeds than animals with lower memory); this would be more evident in
environment in which the total quality is low, because, there, animals would have
to forage more times because they receive fewer calories for each foraging bouts
than in environments where the plants have higher quality values. More foraging
bouts equals to more seeds ingested and dispersed. Thus, in lower quality
environments the amount of seeds dispersed would be bigger than in environment
with high quality value. (2) Animals with high memory would be able to
remember the quality of the plants and choose preferentially the one that provides
better quality food. Thus, the lower the ratio of the quality of the plants (the more
they differ in quality) the bigger will be the difference in the individual amount of
seeds dispersed from the two plants. (3) Animals with more memory would forage
preferentially from the plant with higher quality values, therefore they would
return to this plant more frequently than to the other plant, as a consequence the
probability that the seed would be deposited under the high quality plant would
increase, decreasing its long distance dispersal. (4) The proportion of landscape
travelled should be higher for animals with high memory in environments where
the total quality is higher. As mentioned above, when the resources have better
quality values the animal should forage less frequently, because it receives more
“calories” when eating, thus it would have more time to move far from the plant
and explore more of the landscape. (5) Animals would survive longer if they have
more memory, because they are better at relocating plants; this would be
particularly helpful in low quality environments.

136
3.3.7 Method
The model simulated an environment in which the food sources are
qualitatively different. In the model, plants assume different random quality
values in a range between 0 and 1, where 0 represents null quality and 1
maximum quality. The quality value of the plant cannot be perceived (in advance
of eating) by the animal, but it can be remembered: both plants in the environment
are perceived in the same way as they both have a quantitative value of 1 (value of
the hexagons containing the plants); when the animal eats for the first time, it
would associate to the plant which it is feeding from a quality value of 1
(maximum quality). This is because the animal considers the first tree as the best
in the environment, as it is the only one the animal has sampled, and it has no
previous experience of other types of food. When the animal finds and forages
from the second plant, the quality values are then re-assessed: the tree with the
higher quality value would assume a value of 1, while the second tree would
assume a value equal to the ratio of the two values (minimum quality value
divided by the maximum quality value). In this way, the values of the plants are
relative to each other. For example, if one plant in the environment has a quality
of 0.2, when the animal forages from this for the first time, it would perceive the
plant to have a value of 1. Once the forager finds the second plant with a quality
value of 0.8, this new plant would now assume a coefficient of 1, while the
previous tree gains a coefficient of 0.25 (min quality/ max quality= 0.2/0.8). The
quality coefficients are multiplied with the values in the memory map
corresponding to the location of the plants, so that the memory of the tree of
higher quality would remain the same (because plants with higher quality have a
coefficient of one), while the memory of the second plant will be reduced. The

137
quality of the plant affects the state of the animal, so that every time that the
animal feeds, the amount of food eaten is multiplied by the quality value of the
tree that it is foraging from.
As for the previous model, two landscapes were simulated for comparison: one
with unlimited food sources and one with limited food sources.
Table 6 List of the parameters used in the quality model
Parameter Values explored
𝛼: sensory attenuation coefficient 0.5
𝛽: memory decay coefficient Drawn from an exponential logarithm distribution (0.99,1)
𝛾: friction coefficient 0.07
𝜅: satiation coefficient 0.1
𝜆: hunger coefficient 0.99
𝜇! and 𝜎! : parameters of the cumulative lognormal probability density function describing the probability of defecation
4; 0.2
𝜇! and 𝜎! : parameters of the cumulative lognormal probability density function describing the probability of seed excretion
1; 0.2
𝑇 10,000
𝜅!: concentration parameter for von Mises distribution
1.83
Deaththreshold 0.001
Plant Quantity: value of the plant as itappearsinthevegetationmap
1
PlantQuality:qualitycoefficientoftheplant
Uniform random numbers in the range [0, 1]

138
3.3.8 Results
3.3.8.1 H1: Total amount of seeds dispersed in the environment
The total amount of seeds dispersed in the environment was affected by
the interaction between memory of the animal and the total quality of the
environment in landscape with unlimited (F(1,996)= 12.88, p< 0.001) and limited
(F(1,996)=7.02, p< 0.01) food availability. Animals with higher memory
dispersed more seeds than animals with lower memory, in particular in
environments with a low total quality of food. This is due to the fact that, in low
quality environments, the animals are less satiated every time they feed, therefore
they have to forage more than they do in a comparison with high quality
environment. As a consequence they ingest and disperse more seeds (fig. 3.10).

139
Environment with low total quality of food
Environment with medium total quality of food
Environment with high total quality of food
Tota
l am
ount
of s
eeds
dis
pers
ed p
er ti
mes
tep
Tota
l am
ount
of s
eeds
dis
pers
ed p
er ti
mes
tep
Tota
l am
ount
of s
eeds
dis
pers
ed p
er ti
mes
tep
a)
Environment with low total quality of food
Environment with medium total quality of food
Environment with high total quality of food
Tota
l am
ount
of s
eeds
dis
pers
ed p
er ti
mes
tep
Tota
l am
ount
of s
eeds
dis
pers
ed p
er ti
mes
tep
Tota
l am
ount
of s
eeds
dis
pers
ed p
er ti
mes
tep
b)
Figure 3.10 a) Total amount of seeds dispersed at different memory (0= low memory, 1= high memory) in environment that provides different total quality of food and unlimited resources. b) Total amount of seeds dispersed at different memory (0= low memory, 1= high memory) in environment that provides different total quality of food and limited resources. Each point indicates one model iteration (N= 1000). The line indicates the average amount of seeds dispersed per timestep ± SE.

140
3.3.8.2 H2: Different amount of seeds dispersed from each of the plants
The different amount of seeds dispersed from the two plants was analysed
in order to understand if the plant that invested in higher quality food, would
receive in exchange an individual advantage in seed dispersal terms. This was the
case, and enhanced by the memory of the animals: the difference of seeds
dispersed from the two plants was affected by the interaction between the memory
of the seed disperser and the ratio between the quality values of the plants
(F(1,995)=9.48, p< 0.01; fig 3.11) in an environment with unlimited food
availability. This means that animals with high memory remember which plant
offers the best quality of food and forage preferentially from it. Figure 3.11 shows
that this interaction seems to acquire more importance when the ratio of the
quality is between 0.33 and 0.67, thus when a plant has a quality value, which is
approximately the double of the other. When the quality ratio is low (big
difference in plants’ values) the inequality in the individual amount of seeds
dispersed is the same at every memory. This might happen because, when plants
are very different from each other, the higher number of time the animals have to
forage could mask the effect of memory. When the ratio is high, thus plants are
similar in value, animals with memory tend to feed from both plant equally (as
seen in model in chapter 2).

141
In an environment with limited food availability the above interaction is no longer
significant (F(1,995)= 2.50, p= 0.114). This happens because once the animals
have depleted all the food provided by one plant, they are forced to forage from
the other.
3.3.8.3 H3: Inequality of seed removal in environments of different qualities
From the results obtained until now, it looks that the amount of seeds
dispersed is bigger in poor quality environment (with low total quality) because
the animals are forced to forage more frequently, and for the plants that provides
the best quality of fruits. A question that arises was if in high quality environment
Quality ratio
Quality ratio (0.33- 0.67)
Quality ratio (0.67- 0.99)
Diff
eren
ce o
f see
ds d
ispe
rsed
from
the
two
plan
ts p
er ti
mes
tep
Diff
eren
ce o
f see
ds d
ispe
rsed
from
the
two
plan
ts p
er ti
mes
tep
Diff
eren
ce o
f see
ds d
ispe
rsed
from
the
two
plan
ts p
er ti
mes
tep
Quality ratio (0.001- 0.33)
Figure 3.11 Difference of seeds dispersed from the plants in landscape with unlimited food availability at different memory (0= low memory; 1=high memory) and different quality ratio of the trees. Each point indicates one model iteration (N= 1000). The line indicates the average difference of seeds dispersed from the two plants per timestep ± SE.

142
the individual quality of the tree matters in animal choice of food source. Thus,
the three way interaction between the total quality of the environment, animal
memory and the ratio of the plants’ quality values was examined. This was
significant (F(1,991)=32.99, p< 0.001), because in low quality environments the
individual quality of the plant is essential in determining animal food choice:
when plants present very different quality values the difference of seeds dispersed
is higher, than if the plants have similar value (high ratio). On the contrary, in
high quality environments the individual value of the trees loses importance and
seeds are dispersed evenly from both trees (fig.3.12). This is enhanced at higher
memory. The same results were found in the landscape with limited food
availability (interaction: F(1,984)=13.48, p< 0.001).
3.3.8.4 H4: Long distance dispersal
The long dispersal distances of seeds of the plants with the highest and
lowest quality values ware analysed. The same prediction as for the quantity
model was made, that the preferred tree would suffer shorter dispersal distance
because the animals would spend more time around it. However, long dispersal
distance was not affected by the interaction between memory and the quality
value of the plants (F(1,1843)= 1.75, p=0.19). Memory (F(1,1843)= 44.10, p<
0.001) and distance between the plants (F(1, 1843)=21.96, p< 0.001) were the two
main effects that influenced the dispersal distance of seeds from the parental tree.
As in the previous model in chapter 2, the higher the memory, the shorter the
distance from the parental plant at which the seeds were deposited. The same was
found in landscape with limited food availability (F(1, 1843)= 18.12, p< 0.001).

143
Quality ratio Quality ratio Quality ratio
3.3.8.5 H5: Proportion of landscape travelled
The proportion of landscape travelled by the animals was not affected by
the interaction between memory and the total quality of the environment
(unlimited food: F(1,992)=1.22, p= 0.27; limited food: (F(1,992)= 1.59, p<
0.207). The landscape travelled was affected exclusively by the distance between
the plants and this was verified in landscapes with unlimited (F(1,992)= 45.33, p<
0.001) and limited (F(1,992)= 3.62, p= 0.05) food availability.
Environment with low total quality of food
Environment with medium total quality of food
Environment with high total quality of food
Diff
eren
ce o
f see
ds d
ispe
rsed
from
the
two
plan
ts p
er ti
mes
tep
Diff
eren
ce o
f see
ds d
ispe
rsed
from
the
two
plan
ts p
er ti
mes
tep
Diff
eren
ce o
f see
ds d
ispe
rsed
from
the
two
plan
ts p
er ti
mes
tep
Figure 3.12 Difference of seeds dispersed from the two plants according to the quality ratio of the trees in environment with low, medium and high total quality. Each point indicates one model iteration (N= 1000). The line indicates the average difference of seeds dispersed from the two plants per timestep ± SE.

144
3.3.8.6 H6: Animals’ survival
The death rate of the animals was not affected by the interaction between
animal memory and the total quality of the environment in landscape with
unlimited food availability (χ2(1, N= 1000)= 1.54, p< 0.123). Memory as a main
effect influenced the survivorship of the seed dispersers (χ2(1, N= 1000)= 97.44,
p< 0.01), and, as expected, animals with higher cognitive skills were able to
survive longer than animals with lower cognitive skills. Memory affected the
death rate of animals in landscape with limited food resources as well (χ2(1, N=
1000)= 26.53, p< 0.001) but as in the previous models, in limited environments,
animals with higher memory died at similar rates to animals with low memory.
3.3.9 Discussion
As for the previous model (3.3.2), results of the present model confirmed
predictions by showing that the quality of the food sources is an important feature
to attract frugivores and interacts with animals’ memory affecting the total
amount of seeds dispersed in the environment, the inequality of seeds removal
from the two plants and the rate of survivorship of the animals. As mentioned for
the model on quantity, these results support the finding of Carlos and Morales
(2008), according to which the features and aggregation of plants would influence
seed removal patterns, adding the information that this effect might be enhanced
by the memory of seed dispersers. In particular, in the present model the quality
of fruits was not a salient feature, because the animals couldn’t perceive it, but
only remember it after foraging from the plant. Thus, in this case, memory can
structure the outcome of seed dispersal favouring the dispersal of the better food

145
source. For example, chimpanzees in the wild seem able to remember the location
of preferred trees even when these are outside their perception field (Ban et al.,
2014) avoiding low quality food sources even if they are closer (Glander, 1978).
This leads to an increase of seed dispersal of plants that offer fruits of better
quality.
The model also suggests that the total quality of the plants in the
environment affects the removal rate. If plants provide highly energetic resources,
the animals forage fewer times, ingesting in consequence fewer seeds, because
they are satiated by a smaller amount of fruits. On the contrary if plants in the
landscape are low in quality, the animal has to forage more times in order to get
satiated, ingesting and dispersing a bigger amount of seeds. To compensate for the
reduced foraging in high quality environments, a strategy could be to increase the
amount of seeds provided in high quality fruit, so that even if the number of fruits
eaten is lower, the amount of seeds ingested and dispersed will remain high.
However, to my knowledge, no studies investigate the existence of a trade-off
between calories provided and quantity of seeds in a fruit. Studies focus mainly
on the trade off between size of seeds-number of seeds and relate these features to
the co-evolutionary pressure from the main seed disperser (Levey, 1987; Parciak,
2002), or to the success of establishment after deposition (Schupp, 1995; Turnbull
et al., 1999).
As in the previous models (section 3.3.2 and chapter 2) the long dispersal
distance of seeds depended exclusively on animals’ memory, regardless of the
quality of the plant. Thus, once again the model underlines how the ability of

146
animals to remember the location of the food sources plays a fundamental role in
the outcome of seed dispersal.
3.3.10. Quantity and Quality model: Introduction, hypothesis tested and
predictions
In the previous models, the effects of animals with different memory in
environments with different quantity or different quality of food were investigated
separately. The present model combined these two features together. The aim of
the present model was to investigate how the memory of the animal would affect
its choices in environments where the food sources differs in quality and quantity,
and how this, in turn, affects seed dispersal. The following hypothesis were tested:
H1: The three way interaction between memory, quality of the environment and
quantity provided in the environment predicts the total amount of seeds
dispersed in the landscape (quality of the environment = sum of the quality of
the two plants; quantity of the environment = sum of the quantity of the two
plants)
H2: The three way interaction between memory, ratio of the quality value of plants
and difference of quantity values of plants explains the inequality of seeds
dispersed from the two plants.

147
The predictions are: (1) as in the previous model, memory plays an important role
in the amount of seeds dispersed. However, this would be lower in environments
that offer higher quality of food because, in these landscapes, the animal can
forage less as it receives a bigger amount of “calories” at every foraging bout and
the resources are less salient (low quantity value) because they would be more
difficult to be detected by the animals. (2) Animals with high memory would
increase the inequality of the seeds dispersed from the two plants in the landscape
when the ratio of the quality is lower (the plants are very different in quality) and
the difference of the quantity of the plants is bigger.
3.3.11 Method
The method was the same as in chapter 2, with the difference that both the
quality and quantity of plants were assigned a random value as described in
sections 3.3.3 and 3.3.7. The model was run for 10 000 iteration, instead of the
usual 1000, to better identify the possible interactions between parameters.
Table 7 List of the parameters used in the quantity-quality model
Parameter Values explored
𝛼: sensory attenuation coefficient 0.5
𝛽: memory decay coefficient Drawn from an exponential logarithm distribution (0.99,1)
𝛾: friction coefficient 0.07
𝜅: satiation coefficient 0.1
𝜆: hunger coefficient 0.99
𝜇! and 𝜎! : parameters of the cumulative lognormal probability density function describing the probability of defecation
4; 0.2
𝜇! and 𝜎! : parameters of the cumulative lognormal probability density function describing the probability of seed excretion
1; 0.2

148
𝑇 10,000
𝜅!: concentration parameter for von Mises distribution
1.83
Deaththreshold 0.001
PlantQuantity:valueoftheplantasitappearsinthevegetationmap
Uniform random numbers in the range [0, 1]
PlantQuality:qualitycoefficientoftheplant
Uniform random numbers in the range [0, 1]
3.3.12 Results
3.3.12.1 H1: Total amount of seeds dispersed in environment
The relationship between the total amount of seeds dispersed in the
environment and the predictors as main effects were observed (fig. 3.13). The
effect of animal memory and the sum of plant qualities were better explained by a
quadratic curve, thus a quadratic term was used in the statistical model.
memory quality of the environment
quantity of the environment distance between the plants
Tota
l am
ount
of s
eeds
dis
pers
ed
per t
imes
tep
Tota
l am
ount
of s
eeds
dis
pers
ed p
er
times
tep
Tota
l am
ount
of s
eeds
di
sper
sed
per t
imes
tep
Tota
l am
ount
of s
eeds
dis
pers
ed
per t
imes
tep
Figure 3.13 Relation between the total amount of seeds dispersed in the environment per timestep and the predictors.

149
As expected, the interaction between memory and the total quantity and quality of
food provided in the environment affected the total amount of seeds dispersed in
the environment (F(1, 9991)= 5.24, p= 0.02). Animals with high memory
dispersed more seeds than animals with low memory and the total amount of
seeds that they dispersed was higher in environments in which the plants had
lower quality of food and the resources were more salient (higher quantity value)
(fig 3.14). The same interaction was found to be significant in an environment
where the food availability was limited (F(1, 9984)= 44.23, p< 0.001). Data in
either landscape followed the same trend, thus, to avoid redundancy, figure 3.14
shows only the data from environment with unlimited food availability.
3.3.12.2 H2: Amount of seeds dispersed from the two plants
Once again, the relations between the difference of seeds dispersed from
the two plants and the explanatory variables tested were observed (fig. 3.15).
Animals’ memory and ratio between the qualities of the plants were entered into
the model as quadratic terms.
Opposite to the predictions, the amount of seeds dispersed from the plants was not
affected by the interaction between memory, difference between the quantity of
the plants and different ratio of the plants in landscape with unlimited food
availability (F(1,9988)= 2.08, p< 0.149). The difference of seeds dispersed from
the two plants was influenced by the interaction between memory and the ratio
between plants’ quality (F(1,9988)= 70.71, p< 0.001) as found in the previous
model investigating quality. The interaction between memory and difference
quantity of the plants, was not significant (F(1, 9989)= 3.5, p= 0.06). This means

150
that animals with memory are able to remember the information on the quality of
the plants and use this more than the salience of the tree to decide which food
sources to forage from.

151
memory memory memory
Tota
l am
ount
of s
eeds
dis
pers
ed p
er ti
mes
pep
Quantity of the environment (0-0.8)
Quantity of the environment (0.8-1.19)
Quantity of the environment (1.19-1.98)
a)
memory memory memory
Tota
l am
ount
of s
eeds
dis
pers
ed p
er ti
mes
pep
Quantity of the environment (0-0.8)
Quantity of the environment (0.8-1.19)
Quantity of the environment (1.19-1.98)
b)
Tota
l am
ount
of s
eeds
dis
pers
ed p
er ti
mes
pep
Quantity of the environment (0-0.8)
Quantity of the environment (0.8-1.19)
Quantity of the environment (1.19-1.98)
c)
Figure 3.14. Total amount of seeds dispersed at different memory (0= low memory, 1=high memory), different quantity and different quality of the environment. (a) quality value= 0-0.66; (b) quality value= 0.66-1.32; (c) quality value= 1.32- 1.99. Each point indicates one model iteration (N= 10000). The line indicates the average amount of seeds dispersed per timestep ± SE.

152
In environments in which the food availability is limited, where plants could be
depleted, the aforementioned three way interaction affected the amount of seeds
dispersed from the two plants (F(1, 9984)= 13.78, p< 0.001). Seeds are dispersed
more unevenly in environments where the food sources differ in quantity and
quality, and this is amplified by animals’ memory. Figure 3.16 shows that at
higher memory the difference of seeds dispersed increase. This increase is more
evident when the difference of the quantity values of the plants is higher.
Moreover, the difference of the seeds dispersed from the plants, is higher at lower
ratio of the quality of the plants (fig. 3.16a).
memory quality ratio
difference of the quantity Distance between the plants
Diff
eren
ce o
f see
ds d
ispe
rsed
from
the
plan
ts p
er ti
mes
tep
Diff
eren
ce o
f see
ds d
ispe
rsed
from
the
plan
ts p
er ti
mes
tep
Figure 3.15 Relation between the difference of seeds dispersed from the plants per timestep in the environment and the predictors.

153
Difference of quantity values of the plants (0-0.26)
memory memory memory
D
iffer
ence
of s
eeds
dis
pers
ed fr
om to
the
plan
ts
Difference of quantity values of the plants (0.26-0.58)
Difference of quantity values of the plants (0.58-0.99)
a)
memory memory memory
D
iffer
ence
of s
eeds
dis
pers
ed fr
om to
the
plan
ts
Difference of quantity values of the plants (0-0.26)
Difference of quantity values of the plants (0.26-0.58)
Difference of quantity values of the plants (0.58-0.99)
b)
memory memory memory
D
iffer
ence
of s
eeds
dis
pers
ed fr
om to
the
plan
ts
Difference of quantity values of the plants (0-0.26)
Difference of quantity values of the plants (0.26-0.58)
Difference of quantity values of the plants (0.58-0.99)
c)
Figure 3.16. Difference of seeds dispersed from the plants at different memory (0=low memory, 1=high memory), different quantity and quality ratio of the trees: (a) quality ratio= 0- 0.33;(b) quality ratio= 0.33- 0.66;(c) quality ratio=0.66- 0.99; in landscape with limited food availability. Each point indicates one model iteration (N=10000). The line indicates the average difference of seeds dispersed per timestep ± SE.

154
3.3.13 Discussion
This last model showed once again how memory is important in the seed
dispersal outcome of plants with different quality and quantity of food. In
particular, it showed how both the availability of resources and memory impacts
upon the total amount of seed dispersed. Results showed that in environment with
low quality plants, a salient feature like quantity of food is essential to increase
the fruit removal rate. While in environment high in quality, the quantity of fruit
provided is less relevant because the animal get satiated with a smaller amount of
food. This is supported by the fact that the inequality of the seed dispersed from
the two plants depended exclusively on the interaction between memory and the
quality of the tree. This means that, potentially, if animals are able to remember
the quality of a fruit this would be more important that the salience of the fruit
itself.
3.4 General discussion
In this chapter it was explained how an animals’ motivation toward certain
types of food, and in particular the ability to remember about features of food
sources previously visited, leads to an increase in seed dispersal of the preferred
plant. Experiment 2 showed how tortoises were able to discriminate between
quantity and perceived quality of food by using visual cues and showed a bigger
motivation for larger amounts of food rather than preferred ones. To follow,
experiment 3 showed the ability of red-footed tortoise to remember the visual task
previously learned after a period of 18 months. This simple experiment showed

155
how even after one year and a half the motivation for the preferred food remained
unaltered. The information collected in experiments 2 and 3 were subsequentially
used to create a model with the aim of investigating how memory would impact
seed removal and dispersal from plants of different quantity and quality of fruit.
The biggest finding was that the memory skills of the animals are actually what
impact the most in the seed dispersal process: the model showed that only the
preference for a certain type of food would result in a much less efficient seed
removal if the animal would not possess a good memory to remember about the
best food sources (Corlett, 2011). Thus, the repetition of an event, e.g. foraging
multiple times from certain patch instead of others, might be one of the process
that constitute an advantage for a plant in terms seed removal. This is in line with
the results found by Boyer and López-Corona (2009). Carlos and Morales (2008)
and Aparicio et al. (2013), suggested that the rate of seed removal depends in
particular on the number of frugivores present in a certain area. This is certainly
true, but results of the model presented in this chapter suggest that plants in an
environment with fewer seed dispersers equipped with high memory skills might
receive the same fruit removal services as if they were in environment with a
larger number of frugivores with lower memory skills. Memory also contributes
to the animals’ survival, as it allows them to locate more efficiently food sources
in the environment thereby avoiding starvation. Therefore, although long-term
memory has been proven to represent a cost for the animals (Merry and Kawecki,
2005), results of this chapter suggest it is a cost worth taking, as it enhances
animals foraging ability, increases their survivorship and decreases the costs
associated with the searching for good food sources. The empirical experiment
supports this, as it showed that tortoises remember exactly the features indicative

156
of the quantity and quality of food after 18 months, thus suggesting that
frugivores do invest in this kind of memory.
However, from the plants’ point of view, as seen also in the model in
chapter 2, memory brings also disadvantages in terms of long dispersal distance,
as animals with higher memory tend to disperse seeds closer to the parental plant
where the mortality is potentially higher (Janzen, 1970), and reducing the
possibility to colonise new habitat (Howe and Smallwood, 1982). Thus, it looks
that the best strategy for a plant would be to attract as many different seed
dispersers as possible, in terms of behaviour and cognitive skills, in order to
receive different benefits from all of them. This is probably the reason why plants
invest so much in colourful signals and scent of fruits (Schaefer et al., 2004;
Cazetta et al., 2009) as the salience of a fruit in the environment remains the best
way for plants to be noticed by multiple dispersers (Schaefer et al., 2004).

157
CHAPTER 4
4. WHEN?
4.1 Experiment 6: food anticipatory behaviour in the red-footed
tortoise
4.1.1 Introduction
In the general introduction (chapter 1, section 1.4.6-1.4.7), it has been
introduced the debate about how animals might perceive the passage of time and
how they might use this skill to anticipate future events. Moreover, how
anticipatory skills might lead to an increase of seed dispersal has been briefly
presented.
As mentioned, the ability to time and anticipate predictable and stable
events might be particularly important for animals that forage on food sources that
are predictable in time and space, such as these available to nectarivores and
frugivores (Henderson et al., 2006). Being able, for example, to predict when a
tree would produce fruit and for how long these would be on the plant would be a
great advantage for the animal; it would be able, in fact, to direct its foraging
towards productive food sources, reducing the cost associated to the visits of non-

158
productive sites (Wilkie et al., 1996). Hummingbirds (Selasphorus rufus), for
instance, are able to remember the refill time of nectar in different flowers
(Henderson et al., 2006): artificial flowers of two different colours were created;
one refilled with a sucrose solution every 10 minutes, while the other every 20
minutes. Hummingbirds visited the ‘10 minute’ flowers more often than the ‘20
minute’ flowers, and the visits approximately matched the refill time. The authors
suggested that hummingbirds perceived the amount of time passed after their last
visit to the flowers, thereby avoiding non-rewarded food sources (Henderson et
al., 2006). Such a capability seems to be spread among animals (see section
1.4.7), as honey bees (Apis mellifera) have been observed to schedule their
foraging flights in anticipation of the time of the day in which the concentration of
nectars was at its peak (Corbet and Delfosse, 1984) so as pigeons, mice and
monkeys were observed to gather in places where the food was regularly provided
just before the food delivery time (Daan and Koene, 1981; Biebach et al., 1989;
Wilkie et al., 1996; Waitt et al. 2001; Roberts, 2002; Mistlberger, 2009)
The lack of fruit – frugivorous specialization causes high competition
among frugivores species (Gautier-Hion et al., 1985). A major overlap in the fruit
diet of frugivores was in fact found in both close and distant related taxa
(Fleming, 1979; Gautier-Hion et al., 1985). Therefore, the ability to anticipate the
fruiting period might allow animals to get to the plant first. This would increase
their chances of actually finding food and/or getting priority access in
environments where the food is limited. In particular, the replacement of
harvested fruit is about every one-two days (Howe and Vande Kerckhove, 1979;
Chapman et al., 2005), thus it is essential to know whether frugivores are
prompted by their own circadian oscillators to revisit fruiting trees every 24 hour

159
cycle. If this is the case, the plant would have assured seed dispersers during its
fruiting period. However, to my knowledge, no studies have investigated
anticipatory abilities in frugivores other than primates and birds (Waitt et al.,
2001; Feeney et al., 2011), despite other animals being important seed dispersers,
such as reptiles. Many studies have investigated the physiological mechanisms
behind circadian systems of reptiles, e.g. pineal complex, retina and lateral eye
(for a review see Tosini et al., 2001), however, none of these explored whether
reptiles use their circadian ability to anticipate events. Therefore, the first aim of
the present experiment was to verify whether the frugivorous red-footed tortoise is
able to anticipate food delivery on a 24 hour cycle, and whether it expresses it in
the same way as mammals, i.e. increasing its activity around one hour prior the
food delivery time (see introduction, section 1.5.5). The prediction was that, after
a testing period, during which the food was delivered at fixed time, if tortoises
had learned to anticipate the food delivery time, a significant interaction between
tortoises activity in the first and last days of testing should be found. This would
indicate that activity of tortoises increased before their food delivery time in the
last testing days in comparison with the first ones, when they were not yet familiar
with the task.
However, plants do not produce fruit continuously, thus once the fruiting
period has ended, it is important for animals to stop returning to the same tree, as
it is not productive anymore, and search in the environment for more profitable
food sources. This means that frugivores must extinguish their circadian
anticipatory activity rapidly once the reward is no longer provided in order to
switch quickly to more favourable resources (Saunders, 2002; Tautz, 2008; Moore
et al., 2011). It was hypothesised that a rapid extinction of the circadian

160
anticipatory activity might be adaptive since most natural food sources are
ephemeral (Moore et al., 2011). Extinction time in honey bees, for example, was
observed to vary according to the experience of the individual, such that
inexperienced bees stopped returning to the non productive food sources after less
than 3 days, while the more experienced ones continued visiting the flower at the
same time of the day until 5 days after the nectar production was stopped (Moore
et al., 2011). The second aim of the present experiment was therefore to
investigate the extinction time of the circadian anticipatory activity in the red-
footed tortoise. I expected that, in case of quick extinction, in the week after the
food delivery time was changed (see method), tortoises’ activity would return to
that seen in the beginning of the testing.
4.1.2 Method
Eleven captive adult tortoises were used in the experiment with carapace
lengths between 16.7 and 24 cm (mean= 20.14 cm). Tortoises were housed
together in a single enclosure measuring 4m x 3m and containing water ad
libitum, shelters and hot spots with heat and UV lamp; the floor was covered with
soil and bark and was dampened once a day. The temperature of the room was
kept between 27 and 30 ºC, with humidity between the 70 and 80%. Tortoises
were fed once a day during the experiment (see below). A week prior the
beginning of the experiment, the lights of the room were synchronized with the
UV lights in the enclosure and set up to a 12 h cycle, with lights on from 7am to
7pm.

161
4.1.2.1 Training
Prior the beginning of the experiment, tortoises were trained to associate a
specific colour cue to a food reward. During the training phase red-footed
tortoises were trained in an experimental arena measuring 1m x 1m, with the floor
entirely covered by bark. The arena was located in the same room where the
tortoises were housed. Each subject was habituated to the arena prior the start of
the experiment with the same procedure as in chapter 2, section 2.3. Eleven
different colours were used, so that each tortoise had one rewarding colour (S+)
and ten non-rewarding colours (S-) (table 8). Subjects were pre-trained in a two
choice task in which they had to choose between the respective S+ and one of the
randomly selected S- cues. Both cues were located in the experimental arena at
the same distance from the starting point (~1 m) one left and one right with side
chosen at random (fig 4.1).
Fig. 4.1 Example of training set up. In this instance the tortoise had to approach the S+ cue positioned in the left side of the arena in order to get a reward.
S+ S-
162
The tortoise had one minute to approach the S+ stimulus from when it was
introduced in the arena. The choice was considered made when the tortoise was
within 10 cm distance in front of the stimulus and looking toward it. No food was
in the arena during the trial to prevent tortoises using olfactory cues. In case of a
correct choice, the tortoise was rewarded immediately with a piece of their
preferred food (strawberry, mango or dandelion) dropped in front of the cue.
When an incorrect choice was made, the tortoise was removed from the arena and
held in a cardboard box (30 x 50cm) until the beginning of the subsequent trial
(between 30 to 60 seconds after). This was equivalent to a “time out” used in
operant studies (Thompson and Moerschbaecher, 1978). The tortoises were given
one session of 15 trials per day. The training continued until each subject reached
the learning criterion of 13 correct trials over the last 15 trials (80%) in three
consecutive sessions (Lopez, 2001). Once all the subjects had reached the
criterion the experiment started.
4.1.2.2 Test 1, do tortoises posses anticipatory skills?
The aim of the experiment was to test whether tortoises express
anticipatory behaviours in respect to temporally fixed food delivery events. The
food was delivered at intervals of 24 hours (table 8). The training took place in the
same enclosure where the tortoises were housed, therefore no habituation was
needed (fig 4.2). Every day the experimenter followed a regular routine: at 9am
the shelter in the enclosure was closed in order to keep the tortoises in a visible
space throughout the duration of the experiment, and the video camera was
switched on. Then tortoises were given a warm bath, approximately one minute

163
long, in order to increase their activity. Tortoises were bathed following a specific
order, which was the same order followed for the food delivery time during the
experiment (table 8). Each tortoise had a different feeding time, one every 15
minutes (table 8). Because tortoises were housed all together in the experimental
arena, this avoided the possibility that the subjects might learn the time of food
delivery by copying the behaviour of other individuals. At the established time,
one of the 11 coloured cues was presented in the arena, in the right or the left side
of the enclosure (table 8; fig 4.2).
Table 8 Time, colour of the cue and subject order scheduled for the 24h cycle
7am lights on; 9am camera on Food delivery Time
Colour Tortoise Side of the enclosure
9.45am Yellow 1. Moses Right 10.00am Blue 2. Wilhelmina Left 10.15am Green 3. Aldos Right 10.30am Purple 4. Betty Left 10.45am Tourquoise 5. Alexandra Right 11.00am Orange 6. Savina Left 11.15am Pink 7. Patty Right 11.30am Brown 8. Darwin Left 11.45am White 9. Mozart Right 12.00am Red 10. Seisou Left 12.15am Black 11. T19 Right
4.30pm camera off; 7pm lights off
The tortoise pre-trained to approach that colour cue had two minutes to reach the
stimulus. In order to define the choice of tortoises, the cue was located over a
black rubber mat (50 x 70 cm), where a white line marked at 10 cm around the
cue defined the ”choice area” (fig 4.2). When the tortoise entered the choice area
with its head (fig 4.2), it was removed from the enclosure and fed in an external
cardboard box. This was to avoid the possibility that the vision or smell of food
could attract the other subjects at the wrong time.

164
Tortoises received their daily regular amount of food, ~150g of mixed fresh fruit
and vegetable. The cue remained in the arena for a total of three minutes and then
was removed. If the tortoise did not pay attention to the stimulus (e.g. it was
sleeping or it was oriented in a completely different direction) after two minutes
from the established food delivery time, the individual was carried to a distance of
1m from the stimulus (the same distance at which the tortoises were trained to
approach the stimulus during the pre-training phase). At this point the tortoise had
one minute (as in the pre-training) to go toward the cue and reach the choice area.
If this happened, the tortoise was removed from the enclosure and fed as
Fig 4.2 Experimental arena. The figure shows tortoise number 10, which is responding correctly to its visual cue presented on the left side of the arena.
water
stimulus
left choice area
shelter (blocked during the training/tests)
heat spot
right choice area

165
described above. If it still did not approach the stimulus, it did not receive food for
the day and it was left in the arena. In case the tortoise did not approach the
stimulus for three consecutive days, on the third day it was removed from the
enclosure at the appropriate time, the cue was transferred in the external box and
the tortoise was fed in proximity of the stimulus. This assured that all the
individuals maintained a normal bodyweight whilst remaining motivated. The
tortoise remained in the feeding box until food delivery time of the next
individual, i.e. 15 minutes after. When the next stimulus was introduced in the
enclosure, the exact same procedure as described above was repeated for the
respective tortoise. Once the subject was removed from the enclosure to be fed,
the previous tortoise was reintroduced in the arena. This was repeated for every
tortoise every morning. The 24 hours feeding cycle continued until 65 consecutive
days of test had been completed. The test was constantly recorded from 9am until
4.30pm using a wide-angled camera (GoPro, HERO3+, quality of the video
720p60 fps) installed on the wall at the left side of the enclosure. Following test 1
tortoises were given three control tests in order to assess whether they learned to
anticipate food delivery time or whether their behaviour was a response to other
cues, such as the visual cue introduced in the arena or the movements of the
experimenter in the room.
4.1.2.3 Control Test 1, cue conflict test
This control test aimed to determine whether tortoises actually learned the
food delivery time or if they were responding exclusively to the visual cue. To
assess this issue the visual stimuli were presented in a different, random, order

166
than used during the test 1, so that the usual combination between time and colour
was uncoupled. The general procedure was the same as described for “test 1”
except that the experimenter did not interfere in instances where the tortoises did
or did not respond to the colour cue or time. Thus, tortoises were not removed
from the arena and did not receive any reward. The control test 1 was repeated
three times separated by three days of training (during which the procedure was
exactly as in test 1) in-between each control test day (fig 4.3). If the tortoises did
not rely on the visual stimuli, I would not expect any difference in the activity
pattern between the control test and training days.
4.1.2.4 Control Test 2, no visual cue test
This control test aimed to determine the impact of colour cue and the
events related to the introduction of it in the arena (e.g. the movement of the
experimenter) on tortoises anticipatory behaviour. During this control test
tortoises received the initial bath, then no visual cue was presented and the
experimenter did not go close to the arena at any time. Tortoises were not
removed from the arena at the corresponding food delivery time and did not
receive any reward. The control test was repeated three times separated by three
days of training (as above) in-between each control test day (fig 4.3). The
prediction was that if tortoises rely exclusively on temporal cue to anticipate the
food delivery time, I would not expect any difference in the activity pattern
between the test and training days.

167
4.1.2.5 Control Test 3, extinction
This control test aimed to determine whether tortoises extinguished their
anticipatory activity rapidly after a change in the food delivery time. After the
completion of the second test, the behaviour of the tortoises was recorded for the
subsequent six days. During this period the lights and the camera were switched
on and off at the same time as during the previous parts of the experiment.
However, the food delivery cycle and regular procedure were stopped: tortoises
did not receive the bath at 9.00 am, the visual stimuli were not presented in the
arena and tortoises were fed all together after 1.30 pm (fig 4.3). If tortoises
extinguished their anticipatory behaviour, I expected a change in their activity in
the week after the food delivery time was modified.

168
Fig. 4.3 Experimental scheme
Training
Test1 • 65days
Cueconclicttest
• 1sttestday• Training(3days)• 2ndtestday• Training(3days)• 3rdtest
Training • 3days
Novisualcuetest
• 1sttestday• training(3days)• 2ndtestday• training(3days)• 3rdtestday
Extinctiontest • 6days

169
4.1.2.6 Data analysis
4.1.2.6.1 Anticipatory activity
In order to investigate whether tortoises learned to anticipate their food
delivery time, the activity of the tortoises during the first and last three days of
test 1 was compared: the videos of three days of the first week of test 1 and three
days in the last week of test 1 were analysed. The activity (walking or still) of
each tortoise was registered for every minute of each video. This means that the
videos were stopped every minute and it was registered whether each tortoise was
walking or still in this precise instant. Then, the frequency (total number of time
each tortoise was active) of the activity of the tortoises during the experiment was
used for the analysis. The anticipatory response is commonly measured as an
increase of animals’ activity in the hour prior the food delivery time (see
introduction, section 1.5.5). For the analysis, the frequency of the activity of
tortoises during the 74 minutes prior to the food delivery time was used. This time
period was chosen because tortoises had different food delivery time during the
morning and 74 minutes resulted to be the longest time period at which it was
possible to normalise the data.
For the statistical analysis the data were divided in five groups (bins)
representing a period of 15 minutes each, so that bin number 1 contained the data
regarding the activity (frequency) of all the tortoises during the 15 minutes before
their food delivery time and so on, until bin number 5 that contained data from 74
to 60 minutes before tortoises’ food delivery time. A generalised linear model,
function glmer in lme4 package (Bates, 2010) of R (R Core Team, 2013) with a
binomial error, was used to look whether the activity of tortoises was affected by

170
the interaction between the training period (first and last days of test 1) and the
part of the day (the five bins), which were entered into the model as fixed effects.
The day and subjects were entered as random terms. P-values were then obtained
by likelihood ratio tests of the full model with the effect in question against the
model without the effect in question (Crawley, 2007) and adjusted using
Bonferroni correction.
4.1.2.6.2 Control Test 1, cue conflict test
The videos of the three control test days and the three training days
preceding each test day were analysed and data regarding the activity of the
tortoises (frequency) evaluated in the same way as described in the previous
paragraph, i.e. looking at whether the tortoises’ activity was affected by the
interaction between training / control test periods and the time before the food
delivery (five bins). The cue conflict test was designed to test whether the
tortoises were actually able to anticipate the food delivery time or if they were
responding exclusively to the visual cue exposed in the arena at the food delivery
time. If the tortoises did not rely on the visual stimuli, it was expected a non-
significant interaction. For the analysis, the training days preceding each control
test day were used instead of the last days of test 1, because the control test might
have affected the behaviour of tortoises. As further control, the last days of test 1
(before the beginning of the control test) and the training days preceding the
control test days were analysed to determine whether the cue conflict test did not
have any kind of impact on the behaviour of the tortoises. This was performed in
the same way as described the above section (4.1.2.6.1).

171
Moreover, it was also analysed the number of times each tortoise
responded to the correct cue and the latencies of their response, i.e. interval of
time from the introduction of the cue in the arena to the moment in which the
respective tortoise started to walk towards it, during the training and test days. If
tortoises anticipate the food delivery time using exclusively temporal cues, the
prediction was that they would not respond to the colour cue when it was
introduced at the “wrong” time. If tortoises exclusively used the visual cue as a
signal for food delivery, then it would be expected that they would respond to the
colour cue no matter the time that it was introduced in the arena and with the same
latency of response as in the training. If tortoises were using both temporal and
visual cues to anticipate the food delivery event, it would be predicted that
tortoises would be more active around the usual food delivery time and if they
respond to the visual cue, the latency of the response would be longer than in the
training, because, since the cue was introduced at a different time, tortoises should
not expect it. In case the tortoises did not approach the cue, a latency of two
minutes, i.e. the amount of time the cue was exposed in the arena, was assigned
for the analysis.
4.1.2.6.3 Control Test 2, no visual cues test
During the second control test, no visual cues were presented in the arena.
This control test aimed to test whether the absence of cues would affect the
activity of the tortoises. Once again it was verified whether tortoises’ activity
patterns during the control test days and the days of training preceding each
control test day were affected by the interaction between training/ control test

172
period and the time before the food delivery (bins). If tortoises did not rely on
cues and external daily events the interaction would not be significant, thus the
activity patterns during the control test and training would be same. For the reason
explained above, a comparison between the last days of test 1 and the training
after the beginning of the no cue test was also made to test whether during the
training, tortoises were behaving as they were before starting the tests. The
statistical analysis was made using the same method as described above.
4.1.2.6.4 Extinction, tortoises’ activity after the food delivery time was changed
As mentioned in the methods, the recordings of the activities of tortoises
continued for six days after the end of the “no visual cue” test. In this period food
was provided after 1.30pm, tortoises did not receive their morning bath at 9.00am
and the visual cues were not presented. The videos were analysed to investigate
the activity pattern of tortoises once the food was not on a scheduled time
anymore. The information was extracted from the videos in the same way as for
the videos of training and tests. For the analysis, the data were divided in two
periods of three days in order to maintain consistency with the analysis performed
for the previous training and tests, so that the first three days after the change in
food delivery time constitute the “period 1” and the following three days the
“period 2”. Then, the interaction between (period 1) / (period 2) and the time of
the day (bins) were analysed, using a generalised linear mixed model as described
above. If tortoises extinguished their anticipatory behaviour quickly, three days or
less, the interaction would be significant, indicating a difference in the activity
patterns between period1 and period2. The opposite results could indicate that

173
tortoises are not able of extinguish a learned behaviour, or, more likely, that they
need more than three days to modify their behaviour after an environmental
change.
4.1.3 Results
Three subjects were excluded from the data analysis because, although
they successfully reached the learning criterion during the initial training phase,
they never completed the task (i.e. they never reached the stimulus) during the
test. Thus, data of a total from eight subjects were analysed.
4.1.3.1 Anticipatory activity
As predicted, an interaction between the period of test 1 (first three days
and last three days) and the time to food delivery was found (χ2 (1)= 43.70, p<
0.001) (fig 4.4). The activity of the tortoises was found to be higher from 44
minutes before the food delivery time in the last test days than in the first ones (-
44 to -30: χ2 (1)= 19.36, p< 0.001; -39 to -15: χ2 (1)= 16.62, p< 0.001, -14 to 0: χ2
(1)= 26.32, p< 0.001). Moreover, it was observed that the activity of tortoises did
not change throughout the morning in the first test days (χ2 (1)= 1.13, p= 0.24)
while it did in the last ones (χ2 (1)= 72.83, p< 0.001) increasing towards the food
delivery time (fig 4.4).

174
Figure 4.4 Tortoises percentage of activity in the first three days of test 1 (black) and the last three days of test 1 (white). P-values are reported as Bonferroni adjusted values. Asterisks indicate significance differences between the bins ** p<0.01.
0
10
20
30
40
50
60
70
80
-74to-60 -59to-45 -44to-30 -29to-15 -14to0
activity%
timebeforefooddelivery(minutes)
4.1.3.2 Control Test 1: cue conflict test
The activity that the tortoises showed during the training preceding the
control test days was not significantly different from the activity showed during
the last test 1 days before the control test was started (interaction: χ2 (1)= 2.66, p=
0.1027). Thus, we use the data of the training preceding the control test days to
compare the activity of tortoises during the control test. An interaction was found
between the periods (control test and training) and time to food delivery (χ2 (1)=
4.53, p= 0.03). This is probably due the fact that tortoises were slightly less active
44 and 14 minutes before food delivery during the control test. However, no
significant difference in activity was found between control test and training time
before food delivery time (bins) (fig 4.5). The activity of tortoises followed the
same patterns as during training being higher from 59 minutes before food
delivery time than 74 minutes before (Fig 4.5).
** **
**
Food delivery

175
0102030405060708090100
-74to-60 -59to-45 -44to-30 -29to-15 -14to0
activity%
timebeforefooddelivery(minutes)
During the cue conflict test, in which the visual stimuli were presented at a
different time than usual, tortoises visited their own visual cue significantly less
than during the training trials (χ2 (1)=6.67, p= 0.009) (fig 4.6a). However, once
the tortoises realised that the visual cue was in the arena, the latency of response
to the correct colour was the same as in the training (χ2 (1)= 0.7854, p= 0.38) (fig
4.6b).
Figure 4.5 Tortoises percentage of activity in the cue conflict test (orange) and training (green).
Food delivery

176
Figure 4.6. a) Percentage of times tortoises approaches the correct cue during the control test (grey) and the training (blue). b) Mean ± SE latency (in seconds) of response to the visual cue during the control test (grey) and the test (blue). Asterisks indicate significance difference between the groups **p<0.01
a) b)
0
5
10
15
20
25
test training
latency(seconds)
0
20
40
60
80
100
test training
percentageofapproaches
4.1.3.3 Control Test 2: no visual cue
An interaction was found between the activity of tortoises during the
training preceding the no visual cue test days and the last days of test 1 before the
control test was started (χ2 (1)= 5.1995, p= 0.02). This might be due to the fact
that tortoises were slightly less active in the 39 minutes before the food delivery
time during the training preceding the control test days. Therefore, the data of the
training before the control test was started were used to compare the activity of
tortoises during the test. No interaction was found between the period (test and
training) and time to food delivery (χ2 (1)= 2.1461, p= 0.1429), suggesting that the
trend of the activity of the tortoises followed the same pattern as in the training,
increasing toward the food delivery time. However, the tortoises’ activity was
significantly lower throughout all the periods of time (bins) before food delivery
during the test than during the training (-74 to -60: χ2 (1)= 9.63, p< 0.001; -59 to -
45 χ2 (1)= 32.45, p< 0.001; -44 to -30: χ2 (1)= 19.05, p< 0.001; -39 to -15: χ2 (1)=
28.31, p< 0.001, -14 to 0: χ2 (1)= 42.24, p< 0.001) (fig 4.7).
**

177
0
10
20
30
40
50
60
70
80
-74to-60 -59to-45 -44to-30 -29to-15 -14to0
activity(%
)
timebeforefooddelivery(minutes)
4.1.3.4 Extinction: tortoises’ activity after that the food delivery time was changed
An interaction between Period1 and Period2 was found (χ2 (1)= 39.31, p<
0.001), suggesting that the activity of tortoises was different during these two
periods of time. As shown in figure 4.8, in Period1 the activity of the tortoises
varies among the different time of the morning (bins) (χ2 (1)= 47.39, p< 0.001),
being higher between 74 and 60 minutes prior the experimental food delivery
time, then decreases gradually and increase again in the 14 minutes before the
learned food delivery time. In Period2 tortoises activity differ over time as well
(χ2 (1)= 10.04, p< 0.01) but it follows a linear horizontal pattern as was observed
at the very beginning of the experiment (black bars in Fig 4.4).
Figure 4.7. Tortoises percentage of activity in the no visual cue test (yellow) and the training (purple). P-values are reported as Bonferroni adjusted values. Asterisks indicate significance differnces between the bins **p<0.001
**
** **
**
**
Food delivery

178
4.1.4 Discussion
Results showed that tortoises learned to anticipate food delivery time and
they expressed it in the same way as mammals increasing their activity in the hour
before the food delivery event (e.g. Waitt et al., 2001; Roberts, 2002; Smarr et al.,
2014). Tortoises were able to adapt their behaviour according to their food
delivery schedule, probably using the cues provided by circadian oscillators to
indicate when the food was delivered (Roberts, 2002). This was evident from the
difference in the activity patterns between the beginning and the end of the test 1:
when the experiment first started, tortoises’ activity was the same throughout all
the morning; after two months (65 trials) the activity patterns changed, increasing
towards the food delivery time.
The “cue conflict test” confirmed that the behaviour of tortoises was not
solely the result of a response to the visual cues that were introduced in the arena
Figure 4.8. Tortoises percentage of activity in the first three days after the food delivery time was changed (period1, blue) and the last three days after the food delivery time was change (period2, green). The lines underline the different trends of the data in the two periods: curve for the data of period1 (solid line), while horizontal for the data of period2 (dotted line).
0102030405060708090100
-74to-60 -59to-45 -44to-30 -29to-15 -14to0
activity%
time(minutes)beforefooddelivery
179
at the feeding time: when the order of the cues was swapped, tortoises showed the
same activity pattern as during training, suggesting that they used temporal cue.
However, if they saw the stimulus in the arena, they tended to respond to it with
the same latency as during the training. What has to be underlined is that during
the training, tortoises never missed their visual cue as they learned at what time to
expect it. During the cue conflict test, tortoises visited their stimulus significantly
less than in the training, presumably due to the fact that they were not looking for
it because they did not expect it at a different time of the day. These results
suggest that tortoises learned to use both temporal (circadian oscillators) and
visual cues and combined the information of these together to achieve better
accuracy in identifying food delivery time. The use of more than one type of cue
could be adaptive, because in case of sudden changes, the animal can rely on more
than one stimulus to reach a goal (Patterson and Rose 1992; Candolin, 2002,
Spottiswoode and Steven, 2010). Thus this suggests that tortoises are potentially
able to cope with environmental changes. During the “no visual cue” test, in
which the coloured cues and the cues provided by the experimenter were
removed, tortoises showed an overall decrease in their activity, but, again, the
activity pattern throughout the morning was the same as in the training, increasing
towards the time of food delivery. This suggests that tortoises’ activity was
affected by the events that happened around them, such as the experimenter’s
movements or the colour cues, but their absence did not disrupt their time
schedule.
As mentioned in the introduction (section 4.1) plants produce fruit for
limited periods (Moskovits and Bjorndal, 1990), thus is very important that
frugivores switch rapidly to other productive plants once the one they were

180
foraging from is not productive anymore (Moore et al., 2011). Data collected after
the end of the experiment, when the food was no longer delivered at the
established time, suggested that tortoises extinguished their food anticipatory
activity after a period of three days. This is in line to what has been found in
honey bees (Moore et al., 2011), supporting the hypothesis that a quick extinction
of this ability might be adaptive (Moore et al., 2011). Results showed a peak in
the activity of tortoises 74 minutes before the food delivery time in period1; this
might be due to the fact that tortoises were expecting the morning bath that they
were used to receive during the training. This behaviour also disappeared in
period2, confirming the fact that tortoises had extinguished what they had learned
during the training (Bouton, 1994).
In summary, red-footed tortoises were able to anticipate an event,
demonstrating that they are potentially able to learn about time intervals and to
return to a food source every 24 hours. However, from the present experiment it is
not clear what specific cue or combination of cues triggered their timing
mechanism, that means what they used as a landmark to start “counting” the
passage of time (e.g the switch on of the lights, the morning bath, the food
delivery). Further research is, therefore, necessary to understand more details
about how this species perceives the passage of time, looking for example at
shorter or longer intervals than the 24 hours cycle or altering the light cycle, and
how it might use this skill at its own advantage in its natural environment.

181
4.1.5 Implications for seed dispersal
The results of this experiment have important implications for seed
dispersal. The data suggest that a frugivorous species is potentially able to
anticipate the availability of food that follows a fixed diurnal cycle. This would
bring advantage to the animals themselves, that would enhance their foraging
efficiency, as they would know when to have the best chance to find food at a
given time (Henderson et al., 2006). Knowing this, the animal might control its
energy expenditure during the day, being more active at the time of food delivery
and resting in the other part of the day. Thus being able to anticipate an event
would enable energetically optimal searching for food (Moore et al., 2011).
Anticipatory skills would lead to an increase in the seed removal rate of the
plants, and a consequent decrease of the chances that seed predators would eat
their fruit.
The cue conflict test and the no cue test in the experiment gave us
important information regarding the possibility that tortoises might combine
together information deriving from different environmental stimuli other than the
ones given by internal circadian oscillators to perceive the passage of time. In
particular, during the no cue test, the overall activity of tortoises dropped. This
suggests that the tortoises might have learned about events that were happening in
the environment, such as the movement of the experimenter. This is important
because it suggests that tortoises might be able to learn about a range of salient
environmental cues, such as the presence of flower or the raise in temperature, as
indication of imminent presence of food. A study of Janmaat et al. (2006),
suggests that gray cheeked mangabeys (Lophocebus albigena johnstonii) tended

182
to revisit fruiting trees more frequently after warm periods than after cold ones:
high temperatures increase the ripeness of fruits, thus the authors suggested that
mangabays use this variable to decide when and where to forage. Honey bees also
showed to present food anticipatory activity according to the weather conditions
(Moore et al., 2011). If animals are able to use weather as a cue to anticipate
presence of food, in this case ripe fruits or nectar, it means that they would be able
to reach the food source first defeating competitors, or get there at same time, in
case competitors possess the same cognitive skill, increasing their chances to
actually find food. Plants in turn, would have guaranteed that fruits would be
exploited by frugivores at the right time preventing fruits from falling and laying
under the parental tree where the mortality rate is generally higher (Janzen, 1970).
Therefore, anticipatory skills would improve seed removal and increase the
quantity of seeds dispersed by legitimate seed dispersers, enhancing the
reproductive success of trees.

183
4.2 Experiment 7. Creating predictions: how perceiving cycles
impacts upon seed dispersal.
4.2.1 Introduction
In experiment 6 tortoises were shown to be able to anticipate events on a
24 h cycle, and the advantages that this skill might bring to frugivores and plants
were discussed. In particular, it was suggested that the ability to anticipate the
presence of food in a particular area would enhance the fruit removal rate by
dispersers, preventing seeds from remaining under the parental plants or being
eaten by seed predators. Thus, anticipatory behaviours in animals may bring
benefits to the seed dispersal process that can potentially last during the entire
fruiting period of the plant, as animals tend to extinguish their anticipatory
activity only when the food is not available anymore (Saunders, 2002; Tautz,
2008; Moore et al., 2011).
However, as mentioned in the introduction of this chapter (section 4.1),
plant fruiting period/s are not continuous but follow a regular cycle (Moskovitz
and Bjorndal, 1990). Therefore, a step forward would be to know if frugivores are
able to learn and remember about cycles longer than the 24 hours cycle tested in
experiment 6, because this might allow animals to anticipate seasonal fruiting
periods of different plants. This ability might be adaptive because it would allow
frugivores to know where to find food in the environment according to the period
of the year, providing, in turn, an efficient seed removal service to the plant.
184
However, to my knowledge, few studies have investigated anticipation of events
for periods longer than 24 hours (Gallistel, 1990).
An example that demonstrates how this anticipatory skill could be
beneficial for seed dispersal, is the synchronised cycles of migratory birds and
plants fruiting periods in the Mediterranean region (Peñuelas et al., 2002). In this
area numerous species of plants and migratory birds have synchronised their life
cycles, so that birds gained the advantage of finding abundant food supplies once
they arrive in the region, while plants gained an abundant and fast seed removal.
However, the global warming of the last 25 years had appeared to cause plants to
produce fruit nine days earlier than usual and a delay of the arrival of the
migratory birds of 15 days. As a consequence, there has been a decoupling of
species interactions corresponding to a decrease on both birds and plants’ fitness.
The birds in fact did not find enough food once they had arrived at the destination,
while plants suffered a decrease in seed dispersal (Peñuelas et al., 2002).
Considering the small percentage of seeds that survive after dispersal (Schupp,
1988; Andersen, 1999; Crawley, 2000), a small change in the amount of seeds
dispersed could have a major impact on plants’ fitness.
This example demonstrates the major impact that frugivores can have on
seed dispersal if they are able to anticipate the fruiting period of plants, as they
would potentially bring the same advantages brought by the synchronization of
plants and animals cycles described above. Therefore, in this section, it will be
presented a seed dispersal model to test this hypothesis, by simulating an
environment with periodic food availability and verifying whether animals with a
memory as long as, or longer than, the fruiting cycle of trees would actually bring

185
to plants more seed dispersal benefits than animals that have no memory about
plants’ fruiting cycle.
In particular the hypothesis tested were:
H1: The interaction between animal memory and plants’ cycle length predicts the
total amount of seeds dispersed in the environment.
H2: The interaction between animal memory and plants’ cycle length predicts the
survivorship of the animals.
The predictions are that (1) animals with memory that lasts an equal or longer
amount of time than plants’ cycle length would be able to more successfully
relocate the plants when they are fruiting compared to animals with memory
shorter than the fruiting cycle of plants, thereby dispersing more seeds. However,
if the plant fruiting cycle were longer than the memory retention of the animal, the
beneficial effect of memory would gradually decrease until having long-term
memory would no longer affect the quantity of seeds dispersed in the
environment. (2) The same effect was expected for animals’ survival, so that
animals with memory equal or longer than plants’ cycle length would survive
longer than animals with shorter memory. At plants’ cycle length longer than
animals memory I expect that memory would no longer predict animals’ survival
rate.

186
4.2.2 Method
The method of the model is the same as described in chapter 2, section 2.2.
The only difference is that the plants appear in the environment at different
random cycle lengths (from 1 to 400, SD± 10 timesteps) in every run of the
model. This means that if, for example, the plants have a cycle length equal to 1,
the tree would appear in the environment every timestep, while if they have a
cycle length of 350, the plant would appear in the environment every 350 (±10)
timesteps. These cycle lengths were chosen because animals with memory close
to 1 (high memory) have a complete memory decay around the amount of 350
timesteps, thus their memory is slightly shorter than the maximum cycle that can
be assumed by plants. The memory decay of animals with lower memory follows
an exponential logarithmic distribution; so that memory of 0.5 value will be
extinguished in about 50 timesteps and so on until animals with memory close to
0 have an instantaneous memory decay.
Table 9 . List of the parameters used in the model
Parameter Values explored
𝛼: sensory attenuation coefficient 0.5
𝛽: memory decay coefficient Drawn from an exponential logarithm distribution (0.99,1)
𝛾: friction coefficient 0.07
𝜅: satiation coefficient 0.1
𝜆: hunger coefficient 0.99
𝜇! and 𝜎! : parameters of the cumulative lognormal probability density function describing the probability of defecation
4; 0.2
𝜇! and 𝜎! : parameters of the cumulative lognormal probability density function describing the probability of seed excretion
1; 0.2
𝑇 10,000

187
𝜅!: concentration parameter for von Mises distribution
1.83
Death threshold 0.001
Plant Quantity: value of the plant as it appears in the vegetation map
1
Plant Quality: quality coefficient of the plant
1
Plant cycle length 1 to 400 timesteps
4.2.3 Results
4.2.3.1 H1: Total amount of seed dispersed in the environment
The interaction between animals’ memory and the length of the plants’
cycle affected the total amount of seeds dispersed in the environment (F(1,995)=
8.87, p< 0.01). Figure 4.9 shows that, when the plant cycle is from 1 to 100
timesteps long, the shape of the data follows an exponential curve. The amount of
seeds increases exponentially at the higher level of memory. For cycle lengths
longer than 100 timesteps, the effect of memory decreases but still animals with
more memory provide a better seed dispersal service, until, at a cycle length
longer than 300 timesteps, the amount of seeds dispersed becomes the same no
matter the level of memory (F(1,996)= 1.57, p< 0.21) (Fig 4.10).

188
Plant cycle length 1-100 timesteps Plant cycle length 100-200 timesteps
Plant cycle length 300-400 timesteps Plant cycle length 200-300 timesteps
Tota
l am
ount
of s
eeds
dis
pers
ed p
er ti
mes
tep
Tota
l am
ount
of s
eeds
dis
pers
ed p
er ti
mes
tep
Figure 4.10 Effects of memory on the amount of seeds dispersed per timestep at different plant cycle lengths. The dots represent each model run. The blue line indicates the average amount of seeds dispersed.
Fig 4.9 Effects of memory on the amount of seeds dispersed per timestep at plant cycle lengths from 1 to 100 timesteps. The dots represent each model run. The line delineates the exponential trend of the data.
memory
Tota
l am
ount
of s
eed
disp
erse
d
Plant cycle length 1-100 timesteps
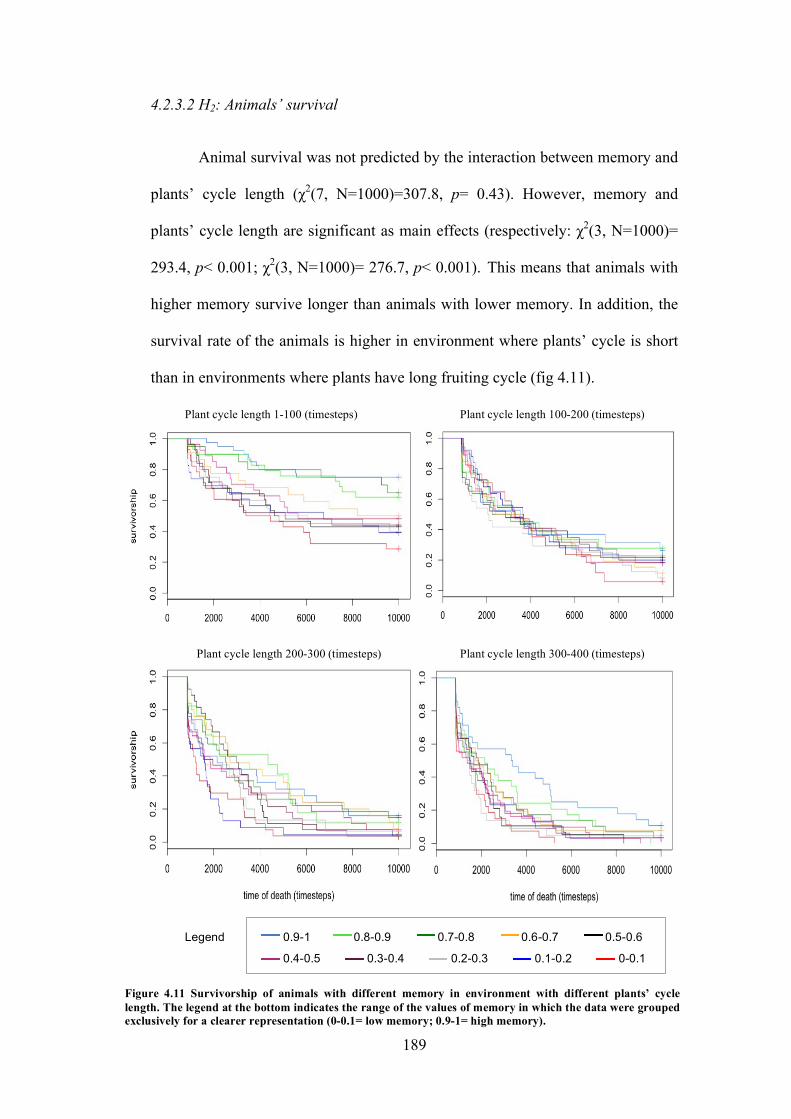
189
4.2.3.2 H2: Animals’ survival
Animal survival was not predicted by the interaction between memory and
plants’ cycle length (χ2(7, N=1000)=307.8, p= 0.43). However, memory and
plants’ cycle length are significant as main effects (respectively: χ2(3, N=1000)=
293.4, p< 0.001; χ2(3, N=1000)= 276.7, p< 0.001). This means that animals with
higher memory survive longer than animals with lower memory. In addition, the
survival rate of the animals is higher in environment where plants’ cycle is short
than in environments where plants have long fruiting cycle (fig 4.11).
0.9-1 0.8-0.9 0.7-0.8 0.6-0.7 0.5-0.6
0.4-0.5 0.3-0.4 0.2-0.3 0.1-0.2 0-0.1
Legend
Plant cycle length 1-100 (timesteps) Plant cycle length 100-200 (timesteps)
Plant cycle length 200-300 (timesteps) Plant cycle length 300-400 (timesteps)
Figure 4.11 Survivorship of animals with different memory in environment with different plants’ cycle length. The legend at the bottom indicates the range of the values of memory in which the data were grouped exclusively for a clearer representation (0-0.1= low memory; 0.9-1= high memory).

190
4.2.4 Discussion
Plants follow fruiting cycles that have different length according to the
species (Moskovitz and Bjorndal, 1990; Peñuelas et al., 2002). The model
presented here aimed to compare between the different amount of seeds dispersed
by animals that can remember about a plant’ s cycle and those animals that
cannot. From the results it is clear that animal that posses longer memory are able
to disperse more seeds than animals with lower memory when the plants’ cycle
length is under 200 timesteps. However, when the plants’ cycles is longer than
200 timesteps and so longer than animals’ memory, the benefits brought by
memory decrease until they disappear entirely, leaving the amount of seed
dispersed subject to random events. Thus, these results underline the importance
that animals’ memory about fruiting cycle might have in enhancing the seed
dispersal process, as well the potential vulnerability if animals memory is
disrupted. As mentioned previously, a contemporary problem faced by many
ecosystems is that plants are suffering changes in their flowering and fruiting
cycles as a consequence of changes in temperature and precipitations (Sillet et al.,
2000; Peñuelas et al., 2002) causing a decoupling of species interactions, such
that plants are losing pollinators and seed dispersers, while foragers are losing
their food supplies (Fitter et al., 1995; Peñuelas et al., 2002). Thus, knowing more
about animals’ ability to learn and anticipate infradian cycle (longer than 24h)
could provide some insight to support this issue. The model showed also that
animals with longer memory are able to survive longer than animals with shorter
memory in every scenario, as was found as well in the models in the previous
chapters. However, no interaction between memory and plants’ cycle length was
found, in fact, despite the memory level, the survival rate drops accordingly to the

191
plants’ cycle length (fig 4.11). This means that, memory has an effect on survival
rate also when the plant cycle length is longer than memory itself. This might be
due to the fact that they tend to explore the environment less at random than
animals with low memory (see chapter 2), thus they have higher chances to be
close to the location where the plant will “appear” and find it once it is fruiting.
From the results of the model it could be hypothesised that plants that
present shorter fruiting cycles received more dispersal benefits than plants with
longer cycles; in fact plants with cycles shorter than 100 timesteps had a larger
amount of seeds dispersed even from animals with lower memory. Thus, plants
that present fruits more than once in a year would receive a double advantage:
firstly, by producing more fruit, the total amount of seed dispersed would be
bigger than from producing fruit only once per year. Secondly, plants with shorter
cycles would have more probability to be revisited by animals with or without
memory, which would again increase the amount of seed dispersed. However,
producing fruit is costly (Snow et al., 1989; Ashman, 1994) and also from the
frugivores point of view, long-term memory encompasses a cost (Mary and
Kawecki, 2005). As a consequence, field and cognitive studies might reveal that
retaining information about the location of plants that have long fruiting cycles
might not be an advantage, in particular in environments where plants with short
fruiting cycle are also present. Probably, returning to the same food source every
24 h until the food is not available and then switch rapidly to a new one, as seen in
the previous experiment (section 4.1), might be the most convenient strategy for
frugivores.

192
4.3 General discussion
In this chapter it was explained how frugivores’ ability of anticipating
events and plant fruiting cycles might impact upon seed dispersal. In experiment
6, the ability of the tortoise C. carbonaria to anticipate food delivery on a 24 hour
cycle was investigated; tortoises developed a food anticipatory activity, as was
shown in mammals and birds (Stephan, 1979; Mistlberger, 1993; Mistlberger,
2009; Waitt et al., 2001; Pendergast et al., 2009), meaning that they were able to
anticipate the food delivery time on a circadian cycle. Then, the hypothesis that
anticipating fruiting periods of trees after longer periods of time than 24 hours
would lead to an increase in the amount of seed dispersed from plants was tested
in a seed dispersal model (experiment 7). Results of the model showed that, as
predicted, animals that have memory at least as long as the plant cycle are able to
disperse significantly bigger amount of seeds from plants than animals with no
memory. Moreover, memory allows animals to survive longer also in
environment where plants’ fruiting cycles are longer than animals’ memory itself,
therefore memory, despite its cost (Mary and Kawecki, 2005), may represent an
evolutionary advantage.
The results of this chapter underline the importance that perceiving the
passage of time in order to anticipate fruiting events on a daily and seasonal scale
would have on seed dispersal by substantially increase the amount and rate of
seed removal from plants. However, in literature the debate about animal
sensitivity of the passage of time, in particular for periods longer than 24h, is still
open: although animals posses long-term memory for specific tasks (e.g spatial
memory, see chapter 2 and discriminatory skills, see chapter 3) it is difficult to
193
define whether they possess a concept of time that allows them to use their
memories of past events to make long-term future decisions, e.g. where to find
food in three months (Roberts, 2002). More information about how animals might
achieve long-term anticipatory skills is needed to define with more precision the
effects that frugivores might have on plant fitness.

194
CHAPTER 5
5. SEED DISPERSAL IN FOREST GAPS
5.1 Experiment 8. Do tortoises increase seed dispersal in forest
gaps?
5.1.1 Introduction
In the previous chapters the cognitive abilities of tortoises were examined
and it was tested how different lengths and types of memory would impact upon
seed dispersal using seed dispersal models. In this chapter it will be presented a
seed dispersal model parameterised specifically with the data on red-footed
tortoises’ cognition collected in the previous chapters with the aim to test one of
the characteristics that makes tortoises unusual as seed dispersal vectors: the use
of gaps in the forest.
Red-footed tortoises, are considered good seed dispersers for multiple
reasons: they eat a large variety of fruit (Moskovitz and Bjorndal, 1990; Strong
and Fragoso 2006; Wang, 2011), they swallow the seeds minimising the chances
of damaging them (Moskovitz and Bjorndal, 1990; Strong and Fragoso 2006),
seed viability after the gut passage is very high (between 91% and 100 %, Strong
and Fragoso 2006) and, although daily movements are relatively limited
195
(average= 57m ± 102m; Strong and Fragoso, 2006), their gut retention time is
long (1.6 to 6.6 days, Moskovits 1985; Strong and Fragoso 2006), which results in
a respectable dispersal distance (average 174m, Moskovitz and Kiester, 1987;
Jerozolimski et al., 2009). In particular, one characteristic makes this tortoise, and
other frugivores reptiles, unique as seed dispersers: the active use of gaps in the
forest (Greenberg, 2001). Gaps are defined as “canopy openings extending
through all levels down to an average height of 2 m above ground” (Brokaw, 1982
in Popma et al., 1988). Thus, gaps are holes in the foliage, created by trees or
branch falls, which create spots in the forest where light can directly reach the
soil. Reptiles need direct sunlight and warm spots to thermo-regulate; these are
provided by forest gaps. There is evidence that the abundant light and availability
of bare ground in newly formed gaps positively influenced reptile abundance in
forest environments, which is the 3% higher than in closed canopy areas
(Mushinsky, 1985; Greenberg, 2001). From many plants’ perspective, gaps
represent good deposition site as they offer light and a lower competition for
resources than the closed canopy areas. For example, forest gaps favour the
establishment of seedlings of shade-intolerant plants and the achievement of the
mature stage of shade-tolerant plants, which persist beneath the forest canopy as
suppressed juveniles until they receive more light (Shupp et al., 1989). Thus, gaps
have an important function for the regeneration of tropical rain forest plants
(Denslow 1980; Popma et al., 1988; Karsten et al., 2013). However, the arrival of
seeds in gaps, in particular if large in size, is rare (Howe and Miriti, 2004). This
happens because gaps do not offer advantages for non-reptilian frugivores, which
tend to avoid them, in particular if recently created (Schupp et al., 1989). Newly
formed gaps do not offer fruits for frugivores, they do not offer protection from

196
predators as they are open areas (Snow and Snow, 1986; Schupp et al., 1989) and
they do not offer branches that can be used by birds and monkeys as perches
(Schupp et al., 1989; Bélisle et al., 2001). As a result, only the edges of the gaps
are likely to receive high seed deposition as the animals can find refuge from
predators in the nearby canopy (Snow and Snow, 1986; Schupp et al., 1989). The
same situation is even more extreme in areas disturbed by humans’ activity, such
as deforested areas, which suffer very low seed deposition due to rare visits by
frugivores (Howe and Miriti, 2004). Deforested areas are usually larger than
naturally formed forest gaps, and the lack of endozoochory events there is even
more severe. This limits the possibility of reforestation of such areas, and affects
the dispersal of primary forest species with large seeds (Turner and Corlett, 1996),
which results in a preponderance of small-seeded pioneer species (Wunderle,
1997). One solution to this problem consists in planting perches in the centre of
deforested areas in order to attract birds and promote seed dispersal (Miriti, 1998;
Holl 1999) with the aim to accelerate the growth of corridors, which, in turns,
would attract more frugivores (Howe and Mitiri, 2004). However, wind and
reptiles may be the major cause of seed dispersal in gaps and deforested areas
(Kimmins, 1987; Schupp et al., 1989). As a consequence, frugivorous reptiles are
likely to be important resources, as they are among the few dispersers that directly
deposit seeds in gaps helping the forest restoration process. Despite the
importance of the issue, to my knowledge, no studies have directly investigated
the impact of reptiles upon seed dispersal in tropical forests’ gaps.
Therefore, this chapter aims to test the impact of red-footed tortoises on seed
dispersal in forest gaps. Two different types of environments were simulated: the
first represents a closed canopy forest with occasional gaps; the second simulates

197
an environment with wide deforested areas. As a control, the same simulation was
then repeated with a modelled animal with the same cognitive and ecological
characteristics of a red-footed tortoise, but that behave like other non-reptilian
frugivores, which means not being attracted by gaps, but visiting them only by
chance. I predict that animals that actively use gaps, as red-footed tortoise, would
deposit more seeds in the gaps in both types of environments; in particular I
expect that the amount of seeds dispersed in gaps is predicted by the interaction
between the type of animal and type of landscape.
5.1.2 Method
The structure of the model is exactly the same as described in chapter 2.
However, the cognitive abilities of the animal were parameterised using data
collected in the previous experiments with red-footed tortoises (table 10). The
landscapes were modified as described below.
5.1.2.1 Animals that use gaps
Animals’ movements, perception, memory, feeding, gut passage and seed
dispersal functioned in the same way as described in chapter 2. However, in this
model memory has a fix value (0.99) instead of covering a range (from 0 to 1).
The value of memory chosen is close to one, which means almost perfect
memory. This because each model run has 10000 timesteps; assuming that (1) a
timestep corresponds to a minute of time, (2) that tortoises move exclusively
during the day (12 hours) (Moskovitz and Bjorndal, 1990) and (3) tortoises are

198
active on average the 50% of the day (Guzman and Stevenson, 2008), 10000
timesteps would be equivalent to one month of tortoise activity. The literature and
experiments 1 and 4 (respectively chapters 2 and 3) showed that tortoises retain
spatial information for at least two months and visual information for much
longer, over a year. For this reason the memory was set as perfect (0.99).
5.1.2.2 Landscape
Two types of landscape were simulated: closed canopy and deforested
environment. Gaussian random landscapes (1000 for the close canopy and 1000
for the deforested environment) of dimension 100 x 100 hexagons, were created
using the function gstat in R setting the range= 3 for the close canopy and
range= 6 for the deforested environment (Crawley, 2007), and then uploaded
to MATLAB. Every hexagon of the landscape is equivalent to one metre of land,
thus the total dimension corresponds to a plot of forest of one hectare. This
measure was chosen because it contains the possible landscape travelled by red-
footed tortoises in a month (Guzmán and Stevenson, 2008). Dimensions and
frequency of gaps in the closed canopy landscape, and the proportion of areas
occupied by adult plants (30%), were simulated according to data collected in a
neotropical rain forest located between Esmeraldas and Imbabura Provinces in
Ecuador (79º 02' 756'' West, 0º 20' 867'' north) by Ana Mariscal and colleagues
(unpublished data). The shapes and sizes of the deforested areas in the deforested
landscapes were simulated at random. The hexagons forming the gaps had a value
of 1 (maximum attractiveness); the hexagons occupied by plants had a random
value between 0 to 1; all the other hexagons had a value of 0 (minimum

199
attractiveness). The fruiting plants in each landscape were equivalent to the 30%
of the canopy and located at random in the landscape, but not inside the gaps (fig
5.2).
In the control environment, with animals visiting the forest gaps by
chance, the values of the gaps were changed to 0 (instead of 1 as previously
explained). In this way, to the eyes of the animal, gaps had the same attractiveness
as the other part of the landscape not covered by plants.
Table 10 List of the parameters used in the tortoises’ model
Parameter Values explored
𝛼: sensory attenuation coefficient 0.5
𝜷: memory decay coefficient Fixed value= 0.99
𝛾: friction coefficient 0.07
𝜅: satiation coefficient 0.1
𝜆: hunger coefficient 0.99
𝜇! and 𝜎! : parameters of the cumulative lognormal probability density function describing the probability of defecation
4; 0.2
𝜇! and 𝜎! : parameters of the cumulative lognormal probability density function describing the probability of seed excretion
1; 0.2
𝑇 10,000
𝜅!: concentration parameter for von Mises distribution
1.83
Deaththreshold 0.001
Landscapesize 100 x 100
PlantQuantity:valueoftheplantasitappearsinthevegetationmap
Random value from 0 (min quantity) to 1 (max quantity)
5.1.2.3 Data analysis
Data were analysed by creating a linear model (function lm in R, Crawley,
2005) to test whether the amount of seeds dispersed in the gaps was predicted by

200
the interaction between the animal (gap user or random gap user) and the type of
landscape (closed canopy or deforested), which were entered as fix terms. To
assess the p-value, this model was compared with an equal model without the
interaction with likelihood ratio tests.
5.1.3 Results
As predicted, the proportion of seeds deposited in the gaps and deforested
areas was affected by the interaction between the animal (gap user or random gap
user) and type of environment (closed canopy or deforested environment) (F(3,
3996)= 6643, p< 0.001) (Fig 5.1), so that the amount of seeds dispersed in the
gaps is higher in closed canopy forests inhabited by animals that use gaps.
Landscape type Closed canopy forest
Deforested landscape
Animal that uses gaps Animal that uses gaps by chance
Am
ount
of s
eed
in g
aps/
gap
s si
ze
Fig 5.1 Amount of seeds dispersed in the gaps relative to the gaps size by animals that actively use gaps and animals that use gaps by chance (control) ± SD in two different landscapes.

201
Figure 5.2 shows an example of the types of landscape (closed canopy (a)
and deforested environment (b)) with animals that use gaps (a1,b1) and use gaps
by chance (a2, b2). The movement map shows how animals that use gaps travel
more inside gaps than the control animals. This is particularly visible in the
deforested landscapes, in which it is evident that control animals tend limit their
movements to the edges of the deforested areas, while animals that use gaps
explore also the centre of them. As a consequence the seed shadow resulting from
animals that uses gaps is spread also throughout the deforested areas.
Landscape map Gaps map Seed shadow map Movement map
Landscape map Gaps map Seed shadow map Movement map
a1)
a2)

202
5.1.4 Discussion
This chapter presented a model parameterised with red-footed tortoise
data, with the aim to test the impact that frugivorous reptiles may have on the seed
dispersal, in particular in terms of depositing seeds in forest gaps and deforested
areas. The results showed that an animals with the cognitive ability and behaviour
(use of gaps) of a red-footed tortoise would disperse significantly more seeds in
gaps and deforested areas than animals that visit these only by chance (control).
The first thing to be noticed is that, according to the model, both types of
animals (gap user and control) disperse more seeds in gaps inside the closed
canopy forest than in deforested areas. This probably happens, because plants
Landscape map Gaps map Seed shadow map Movement map
Landscape map Gaps map Seed shadow map Movement map b2)
b1)
Fig 5.2 Maps of closed canopy forest (a1, a2) and deforested environment (b1, b2) with seed shadows and movements of animals that use gaps (a1, b1) and that use gaps at random (a2, b2). The white part in the gaps map indicate the gaps; the white dots in the landscape maps indicate the plants; the white dots in the seed shadow maps indicates the seed dispersed; the white part in the movement maps indicate animals’ movements.

203
surround them, thus the animal can forage frequently and then go back to the gap,
or simply comes across the gap while foraging. This does not happen in
deforested environments in which the deforested area is concentrated in a
particular part of the landscape creating areas totally isolated from vegetation. In
these cases, it can be noticed that the control animals tend to randomly visit the
edges of deforested areas. As a consequence seeds are dispersed on the edges but
there are not dispersal events in the centre of the deforested site. This prediction
of the model is in line with what found in Schupp et al. (1989) who suggested that
frugivores tend to stay at the edges of areas with no vegetation in order to have
easy refuge from predators given by the proximity of the canopy. These results
could have a major impact on deforestation strategies: it might be suggested that
by removing trees in smaller patches with closer edges, instead of a single area
with a very wide extension, would help a faster reforestation afterward.
The model also highlights the active role played by animals that use gaps
in the restoration of forest: the simulation shows how they travel and deposit
seeds even in the middle of deforested areas. This would have a major influence
on the probability of seedling establishment in the central areas of gaps, which
would lead to the creation of corridors, which would encourage other frugivores
to travel in those areas. As a result, the amount of seeds deposited would increase
creating a positive feedback on frugivores’ arrival. Thus, tortoises could
potentially provide the same reforestation advantages brought by human
intervention described in the introduction (Schupp et al., 1989; Howe and Mitiri,
2004). This suggests that frugivorous reptiles can potentially make a difference in
the reforestation process: the active transportation of seeds into gaps and
deforested areas would speed up the closure these sites, with a direct action,

204
actively depositing seeds, and also by indirect action, as the establishment of
juvenile plants (maturing gap) is enough to attract more birds and primates
frugivores (Popma et al., 1988; Schupp et al., 1989).
These findings add further evidence to the idea that red-footed tortoises
are important dispersers in their habitat (Moskovitz and Bjorndal, 1990; Strong
and Fragoso 2006; Wang et al., 2011). Not only do they possess cognitive skills
that potentially allow them to discriminate and locate food sources in space time,
all of which brings seed dispersal benefits (as described in chapters 2,3 and 4),
but, because of their thermo-regulatory needs, they also use gaps which could be
key in processes such as forest regeneration.

205
CHAPTER 6
6. GENERAL DISCUSSION
6.1 Summary of findings, implications and future directions
Seed dispersal by endozoochory is a complicated mechanism. Many
studies have analysed the ecological aspects of it (e.g. Schupp, 1993; Link and Di
Fiore, 2006; Strong and Fragoso, 2006; Jerozolimski et al., 2009), however, the
influence of learning and cognition on animal decision-making have been poorly
explored. Animals are likely to use a multitude of cognitive skills for successful
foraging, which in turn could affect where they access food and disperse seeds.
Thus, in this thesis, I investigated the impact of animal learning and memory on
the seed dispersal process.
6.1.1 Where? The impact on spatial learning on seed dispersal
The first question I investigated in chapter 2 was whether the ability of
frugivores to relocate food sources in the environment impacts upon the seed
shadow of a plant. Knowing whether an animal is able to relocate food sources in
space would provide information about which paths animals are likely to take, and
can help to predict the distance and quality of seed deposition sites (Wang and
Smith, 2002).

206
Therefore, I investigated the spatial learning and memory of a frugivorous
model species, the red-footed tortoise, in a spatial egocentric task (experiment 1).
The results add important information to the literature about spatial navigation
and memory of chelonians: red footed tortoises was able to relocate a food source
in space, and remembered the correct location of food after two months retention
time interval. This suggests that the red-footed tortoise is potentially able to return
to a food source previously visited for the duration of tropical fruit crop, which is
about two-three months (Moskovitz and Bjorndal, 1990; Chapman et al., 2005).
However, the subjects failed to solve the same task after 8 months retention time
interval. This can have two explanations: (1) as long-term memory is a cost (Mary
and Kawecki, 2005), tortoises retain spatial information only for a period that is
advantageous, such as the length of a fruit crop (Moskovitz and Bjorndal, 1990;
Chapman et al., 2005), as there is no benefit in returning to a food source that has
been depleted. (2) Tortoises failed in the task because they did not have any visual
cues that might have helped them to remember the location of food after such a
long time. Tortoises excel in visual tasks (Burghardt, 1977), and previous studies
showed that they can use landmarks to orientate (Lopez et al., 2001; Wilkinson et
al., 2009). Thus, it is possible that in environments that provide many visual cues,
such as the tropical forest, tortoises would be able to relocate food sources for
longer periods than two months.
In order to verify whether frugivores with different spatial memory skills
impact differently on seed dispersal I used a seed dispersal model. As expected,
results showed that animals with different memory skills provide different seed
dispersal services. In particular frugivores with longer spatial memory (slower
memory decay) were able to relocate more efficiently the food sources in the

207
environment than animals with shorter memory (faster memory decay). As a
consequence, animals with longer spatial memory: (1) disperse a bigger amount
of seeds in the environment; (2) provide a more even distribution of fruit removal
from different trees in the landscape; (3) travel less randomly around the
environment; (4) provide shorter seed dispersal distance; and (5) survive longer
than animals with shorter memory. These results imply that cognition plays an
important role in seed dispersal. They show that the ability of an animal to
efficiently relocate a plant alters the seed shadow of that plant. This adds
information to the previous seed dispersal literature that has only considered the
physiological and/or behavioural features of the animal when evaluating their
potential as a disperser (Schupp, 1993; Link and Di Fiore, 2006; Strong and
Fragoso, 2006; Russo et al., 2006; Jerozolimski et al., 2009). For example,
animals of bigger size are usually considered able to bring seed further away from
the parental tree than smaller animals because they usually travel greater daily
distances (Nathan et al., 2008; Wotton and Kelly, 2012). However, this might not
be true because if big size animals tend to often re-visit the same food sources
thanks to their spatial memory ability, the dispersal distances at which they will
deposit the seeds might be shorter than the ones provided by smaller animals that
posses shorter memory and, thus, travel more randomly in the environment.
Therefore, results suggest that the incorporation of spatial cognitive skills in the
evaluation of plants’ seed shadow might bring different results than expected by
using the common methods used in endozoochory studies, i.e. combining together
the daily distance travelled by the animals and the gut retention time (e.g. Schupp,
1993; Link and Di Fiore, 2006; Strong and Fragoso, 2006).

208
Therefore, more information about frugivores’ spatial memory skills are
essential, because there is the evidence that animals with different spatial memory
skills bring different kind of services to the seed dispersal processes, and knowing
for how long an animal is able to remember the location of a food source, would
give us the possibility to predict the impact it would have on seed dispersal.
Many questions remain open regarding the cognitive aspects that might
influence the seed dispersal process. Experiment 1 could be extended, testing
tortoises in more complicated spatial learning tasks to understand more in depth
the mechanisms behind their navigation skills. In particular it would be interesting
to verify whether tortoises are able to optimize the route between food sources
and also to reorganize their path according to the position of the best food source.
This particular skill has been investigated in different animal species (birds: Gill
1988; primates: Cramer and Gallistel 1997; Di Fiore and Suarez 2007; bees:
Lihoreau et al., 2011; rodents: Reid and Reid 2005) but not in reptiles, and
revealed to be adaptive since allows animals to undertake the shortest possible
route to visit multiple resources, saving therefore energy (Lihoreau et al., 2011).
This information would help to potentially predict the route of tortoises once the
position of food sources is known: if tortoises prioritize high quality food patches
by starting to forage from them, this means that the location of high quality
resources could influence the fruit removal sequence and rate in a determined
area. Moreover, knowing if tortoises establish a preferred route would potentially
allow predicting defecation sites and, consequently, seed deposition patterns.
However, this approach has its limits: although experiments in laboratory are
essential to understand the mechanisms that regulate animals’ decision process,
they are far from the possible scenarios found in nature. As a consequence,

209
although cognitive studies reveal the potential of animals’ skills, this not
necessarily means that animals use these skills in their natural environment. Thus,
it is essential to add to the laboratory findings observations in the wild. The use of
radio-tracking techniques would be useful to test whether red-footed tortoises tend
to return to the same food sources regularly between fruiting seasons. To date
tracking data on red-footed tortoises’ movements provide information about the
distance travelled per day (Strong and Fragoso, 2006; Gùzman and Stevenson,
2008; Montaño et al., 2013), without giving detailed information about the
direction of the movement, and in particular about the conformation of the
landscape and plants of the areas visited more frequently (if any). However, such
information would be useful to validate the seed dispersal model comparing it
with the actual movement of tortoises and defecation pattern.
6.1.2 What? How animals feeding choices affect seed dispersal
The third chapter of the thesis investigated whether frugivores’
discriminatory skills and memory affect their choice of fruit. Red-footed tortoises
were tested in a two choice task in which they had to choose between stimuli
representing different quantities or qualities of food located at different distances
(experiment 3). In the next experiment (experiment 4), the tortoises were tested in
the same task after a retention time interval of 18 months, in order to investigate
their long-term memory in a discrimination task. Tortoises were able to
successfully discriminate between the visual cues indicating different types of
food, and they included the cost (distance) in the decision process: they chose
larger over smaller quantities no matter the distance, but only chose preferred over

210
non-preferred food when this was closer or at equal distance. This suggests that
some characteristics of food can motivate frugivores to choose a certain food
source more than others. The tortoises were, in fact, willing to make a greater
effort to have a larger quantity of food than a preferred one. Moreover, tortoises
retained the information about the food quality and quantity for a period of 18
months, remembering the association of the visual cue – and reward type. This
suggests that frugivores can remember features indicating the presence of a food
source for substantial periods of time. Thus, this might affect their long-term
foraging decisions, which may result in different seed dispersal effects.
A seed dispersal model designed to test the extent of memory of
discriminatory skills on the seed dispersal was presented (experiment 5). Results
showed that quality and quantity are important features in influencing animal’s
foraging choice, as it preferred to forage from the plant in the environment that
was offering the better food. However, results were very different depending on
the memory skills of the animals: (1) the amount of seeds dispersed in the
environment increased exponentially at higher level of memory, showing that the
ability to remember the features of the food sources, and base the foraging
decision on previous learned experiences, significantly increased fruit removal
rate of the preferred fruit. (2) Only animals with longer memory produced an
inequality in the amount of seeds dispersed from the two plants in the
environment. This means that only animals that actually remember about the
differences between the food sources were able to produce a significant difference
in terms of seed removal, favouring the higher values plants. (3) For the same
reasons as in chapter 2, animals with longer memory dispersed the seeds at shorter

211
distances from the parental plant than animals with shorter memory, they also
survived longer.
These findings show, once again, how information about the cognition of
frugivores adds a further step in the understanding of animals foraging decisions
and seed dispersal. Without memory the animal would be forced to gain
experience about the food at every feeding event, thus, establishing its choices on
its perception of food rather than its experience of food. This would be time
consuming for the animal, and affect seed dispersal: the model showed that plants
that offer the preferred food would receive higher seed removal rate only if
frugivores remember about their features. In the opposite case - frugivores do not
remember about the food of the plant previously visited - the removal rate would
depend on the chances of an animal to encounter and feed on the plants. In this
scenario, the location of the plants in respect to other food sources (Carlos and
Morales, 2008) and their attractiveness (colours and scents) (Schaefer et al., 2004)
would play a much more essential role.
Thus, further research regarding what motivates frugivores to choose
certain fruits instead of other, and how long they remember about it, is essential to
understand their foraging activity and the consequent removal rate. Experiment 3
and 4 could be extended by looking at factors, other than food itself, that might
attract frugivores. In particular, it would be interesting to test whether tortoises
might use acoustic cues, as well as olfactory ones, to locate food sources.
Tortoises are ground dwelling animals, therefore it might be possible that they use
monkeys and birds’ vocalization or the noise of a fallen fruit, to locate potential
food sources. Monkeys usually forage in groups, moving trees branches and

212
discarding some fruits (Janson, 1990; Suarez, 2014). Their foraging behaviour is
likely to create valuable food sources on the ground that can be used by other
animals. Plants would also benefit from this behaviour because their seeds would
be removed from under parental trees, where the mortality is higher, and their
seed shadow would be expanded.
6.1.3 When? How anticipatory behaviour impact on seed dispersal
Chapter 4 examined whether frugivores’ ability to anticipate events, such
as food availability, would benefit seed dispersal and improve the foraging
efficiency of animals: plants would receive fast seed removal when the fruits are
ready to be eaten and frugivores would avoid visiting plants without fruits,
directing their foraging towards profitable areas of the landscape.
Therefore, the ability of the red-footed tortoise to anticipate food delivery
time was tested on a 24h cycle (experiment 6). Then, the hypothesis that the
ability to anticipate fruiting periods of plants can increase the amount of seeds
dispersed in the environment and the foraging efficiency of frugivores was tested
using the seed dispersal model (experiment 7).
Tortoises were able to successfully anticipate the food delivery event on a
24 h cycle. Their activity increased in the hour prior the scheduled food delivery
time. This behaviour extinguished in three days after food was presented at a
different time, showing strong evidence of behavioural flexibility. This is likely to
be adaptive as it prevents tortoises to return to the same food source once it is
depleted (Moore et al., 2011). Results of the model suggested that if animals have
a memory that is at least long as the duration of a plant fruiting cycle, they would

213
increase exponentially the amount of seed dispersed in the environment. This
means that a long-term anticipatory skill would increase animals’ efficiency in
finding food. However, the survival rate of animals was due to memory in the
same way as in the models explained in the previous chapters, meaning that
animals with longer memory survive longer thanks to their better ability of re-
locating the food sources, but this did not interact with the length of plant cycle.
Results of chapter 4 suggests that whether frugivores use their anticipatory
skills to plan their foraging would have big impact on the amount of seed removal
from plants. Animals able to anticipate plants’ fruiting periods are better in
relocating the plant when it is fruiting, and these non-random feeding events (1)
increase the number of seeds dispersed in the environment, and (2) allow the
prediction of frugivores movements. As a consequence, it might be possible to
predict how the seed shadow of plants varies according to the different fruiting
seasons of plants. However, although it is known that frugivores have the
potential to anticipate food delivery events (e.g. frugivores primates and birds:
Waitt et al., 2001; Feeney et al., 2011, and the present study on red-footed
tortoise) whether they possess a “time map” of the fruiting periods of different
plants in the environment they inhabit is unknown. A study on garden warblers
showed that they were able of anticipating food delivery events in different
rooms, where food was available at different time of the day - but always on 24h
cycle - thereby being in the right position at the right moment (Biebach et al.,
1989). Thus, it might be possible that frugivores possess the same skill, thus being
potentially able to anticipate different fruiting period of plants and directing their
foraging accordingly.
214
Further studies are necessary to understand about anticipatory skills of
frugivores, in particular as regard periods that are longer than 24 h cycle, as the
intervals between plants’ fruiting cycle can be several months long (Moskovitz
and Bjonrdal, 1990). Experiment 6 could be extended testing the anticipatory skill
of tortoises, and/or other frugivores, on food delivery cycles longer than 24 h, for
example delivering a particularly preferred type of food in a specific location once
a week, in order to verify whether they are able of anticipating events on a long
time scale, in order to understand if the hypothesis tested in the model
(experiment 7) would actually be possible.
6.1.4 Tortoises’ model
Chapter 5 presented a model parameterised with red-footed tortoise data.
The models in the previous chapters showed the impact that animals with
different range of memory would have on seed dispersal. This last model wanted
to test one of the characteristics that makes tortoises unusual as seed dispersal
vectors: the use of gaps in the forest. Specifically, the aim was to test the seed
dispersal impact of frugivores that actively use gaps in different types of
environment, i.e. closed canopy and deforested landscape, in comparison with
frugivores that use gap only by chance (experiment 8).
The results showed that animals that use gaps, such as tortoises, disperse a
significantly greater number of seeds in forest gaps, in both closed canopy and
deforested environments, than animals that visit gaps at random. These results
suggest that tortoises might potentially be used in the restoration of the
environments, in particular the ones that suffered deforestation. Reforestation of

215
large areas disturbed by humans’ activity is often dispersal limited: most plant
species are very slow to arrive, partially because of the absence of seed dispersers
in those areas (Howe and Miriti, 2004). A common solution adopted by human to
overcome dispersal limitation in deforested areas is to place perches in fields to
attract birds and their loads of seeds (Miriti 1998, Holl 1999), or to plant short-
lived trees to encourage shade-tolerant tree seedlings and suppress competition
from grasses (Hooper et al., 2002). These precautions promote the movements of
pollinators and dispersal agents in deforested areas (Tewksbury et al., 2002)
favoring the arrival of seeds through frugivores, and accelerating the growth of
buffers and corridors that have a positive feedback on further frugivores arrival
(Howe and Miriti, 2004). Tortoises, because of their thermoregulatory needs, are
more prone than other seed disperser species to visit areas without any forest
cover. This behaviour would potentially deliver the same advantages brought by
human intervention. Thus they might be use as reforestation tool.
6.2 Conclusion
This thesis took a first step in exploring whether understanding the cognitive
mechanisms underlying frugivores’ foraging behaviour would bring new insight,
and help to build more reliable predictions of seed dispersal by endozoochory.
The results obtained indicate that cognition is an important factor in the
understanding of seed dispersal process. The cognitive approach could, in fact,
provide new insights in the study of seed dispersal. As stated by Cousens et al.,
2010, the possible key to a deeper understanding of seed dispersal by
endozoochory is to address the attention on what determines the behaviour of the

216
animals, instead of limiting the simulation to a behaviour of the vector in a
specific case of study, as usually done in this work. This thesis looked into this
hypothesis concluding that an examination of the cognitive processes underneath
frugivores’ foraging behaviour might lead to predictions about seed dispersal that
would not be discovered only from the analysis of animal behaviour. Thus,
cognition, informed by behavioural ecology, is probably the most effective way to
understand and predict an animal’s choices and movements around the
environment, therefore additional research in this direction is essential to fully
understand the seed dispersal process by endozoochory.

217
REFERENCES
Addessi, E., Crescimbene, L. and Visalberghi, E. (2008) Food and token quantity discrimination in capuchin monkeys (Cebus apella). Animal Cognition, 11: 275 - 282.
Agrillo, C., Dadda, M., and Bisazza, A. (2007) Quantity discrimination in female mosquitofish. Animal Cognition, 10: 63 - 70.
Al Aïn, S., Giret, N., Grand, M., Kreuitzer, M., and Bovet, D. (2009) The discrimination of discrete and continuous amounts in African grey parrots (Psittacus erithacus). Animal Cognition, 12: 145 - 154.
Andersen, E. (1999) Seed dispersal by monkeys and the fate of dispersed seeds in a peruvian rain forest. Biotropica, 31: 145 - 158.
Aparicio, A., Berens, D.G., Müller, J.and Farwing, N. (2013) Resources determine frugivore assemblages and fruit removal along an elevation gradient. Acta Oecologica, 52: 45 - 49.
Arnold K, Neumeyer C (1987) Wavelength discrimination in the turtle Pseudemys scripta elegans. Vision Research, 27: 1501 - 1511.
Ashman, T.L. (1994) A dynamic perspective on the physiological cost of reproduction in plants. The American Naturalist, 144: 300 - 316.
Astur, R., Taylor, L., Namelak, A.N., Philpott, L. and Sutherland, R.J. (2002) Humans with hippocampus damage display severe spatial memory impairments in a virtual Morris water task. Behavioural Brain Research, 132: 77 - 84.
Avgar, T. Deardon, R. and Fryxell, J. M. (2013) An empirically parameterized individual based model of animal movement, perception, and memory. Ecological Modelling, 251: 158 - 172.
Balkenius, A., Rosén, W. and Balkenius, A.K. (2006) The relative importance of olfaction and vision in a diurnal and a nocturnal hawkmoth. Journal of Comparative Physiology A, 192: 431 - 437.
Ban, S. D., Boesch, C. and Janmaat, K.R. L. (2014) Taï chimpanzees anticipate revisiting high-valued fruit trees from further distances. Animal cognition, 17: 1353 - 364.
Bascompte, J. and Jordano, P. (2007) Plant–animal mutualistic networks: the architecture of biodiversity. Annual Review of Ecology Evolution and Systematics, 38: 567 - 593.

218
Bates, D.M. (2010) lme4: mixed effect modelling with R. Springer http://www.wordlatex.com/static/templates/pdf/book_B.pdf
Bateson, M. and Kacelnik, A. (1997) Starling’s preferences for predictable and unpredictable delays to food. Animal Behaviour, 53: 1129 - 1142.
Beckage, B. and Clark, J.S. (2003) Seedling survival and growth of three forest tree species: the role of spatial heterogeneity. Ecology, 84: 1849 -1861.
Beckers, R., Goss, S., Deneubourg, J. L. and Pasteels, J. M. (1989) Colony Size, Communication and Ant Foraging Strategy. Psyche: A Journal of Entomology, 96: 239 - 256.
Beecham, J.A. and Farnsworth, K.D. (1998) Animal foraging from an individual perspective: an object orientated model. Ecological Modelling, 113: 41 - 156.
Bekoff, M., Allen, C. and Grant, M.C. (1999) Feeding decisions by steller’s jays (cyanocitta stelleri): the utility of a logistic regression model for analyses of where, what, and with whom to eat. Ethology, 105: 393 -406.
Bélisle, M., Desrochers, A. and Fortin M.J. (2001) Influence of forest cover on the movements of forest birds: a homing experiment. Ecology, 82: 1893 - 1904.
Benhamou, S., Sauvé, J.P. and Bovet, P. (1990) Spatial memory in large scale movements: Efficiency and limitation of the egocentric coding process. Journal of Theoretical Biology, 145: 1 - 12.
Benhamou, S. (1997) On systems of reference involved in spatial memory. Behavioural Processes, 40: 149 - 163.
Beran, M. J., and Beran, M. M. (2004). Chimpanzees remember the results of one-by-one addition of food items to sets over extended time periods. Psychological Science, 15: 94 - 99.
Beran, M. J., Evans, T. A. and Harris, E. H. (2008) Perception of food amounts by chimpanzees based on the number, size, contour length and visibility of items. Animimal Behaviour, 75: 1793 - 1802.
Bern, L. (1990) Size-related discrimination of nutritive and inert particles by freshwater zooplankton. Journal of Plankton Research. 12: 1059 - 1067.
Biebach, H., Gordijn, M., and Krebs, J. R. (1989) Time-and-place learning by garden warblers, Sylvia borin. Animal Behaviour, 37: 353 - 360.
Biegler, R. (2000) Possible uses of path integration in animal navigation. Animal Learning & Behavior, 28: 257 - 277.

219
Biegler, R. and Morris, R.G.M. (1996) Landmark stability: studies exploring whether the perceived stability of the environment influences spatial representation. The Journal of Experimental Biology, 199: 187 - 193.
Billen, J. and Morgan, D. (1998) Pheromone communication in social insects: sources and secretions. In: Pheromone communication in social insects. Pp. 3-33. R.K. Vander Meer, M.D. Breed, K.E. Espelie and M.L. Winston (eds.). Westview Press.
Bingman, V.P. (1992) The importance of comparative studies and ecological validity for understanding hippocampal structure and cognitive function. Hippocampus, 2: 213 - 220.
Birkhead, R.D., Guyer, C., Hermann, S.M. and Michener, W.K. (2005) Patterns of folivory and seed ingestion by gopher tortoises (Gopherus polyphemus) in a southeastern pine savanna. American Midland Naturalist, 154: 143 - 151.
Blake, S., Wikelski, M., Cabrera, F., Guezou, A., Silva, M., Sadeghayobi, E., Yackulic, C.B. and Jaramillo, P. (2012) Seed dispersal by Galápagos tortoises. Journal of Biogeography, 39: 1961 - 1972.
Blendinger, P.G., Loiselle, B.A., Blake, J.G. (2008) Plot size, plant aggregation and microhabitat type affect fruit removal by birds from individual melastome plants in the Upper Amazon. Oecologia, 273 - 283.
Boinski, S. and Garber, P.A. (2000) On the move: how and why animals travel in groups. University of Chicago Press, Chicago, Illinois, USA.
Bonte, D, Van Dyck, H., Bullok, J.M., Coulon, A., Delgado, M et al. (2011) Cost of Dispersal. Biological Reviews, 87: 290 - 312.
Borteiro, C., Gutiérrez, F., Tedros, A. and Kolenc F. (2009) Food habits of the Broad-snouted Caiman (Caiman latirostris: Crocodylia, Alligatoridae) in northwestern Uruguay. Studies on neotopical fauna and environments, 44: 31 - 36.
Bovet, J. (1992) Mammals. In: Animal Homing, pp 321 - 361. Papi, F. (ed), Chapman and Hall, London.
Bouton, M. E. (1994) Conditioning, remembering, and forgetting. Journal of Experimental Psychology: Animal Behavior Processes, 20: 219 - 231.
Broderick, A.C., Coyne, M.S., Fuller,W.J., Glen, F. and Godley, B.J. (2007) Fidelity and overwintering of sea turtles. Proceeding of the Royal Society B. 274: 1533 - 1538.
Brokaw, N.V.L. (1982) The definition of treefall gap and its effect on measures of forest dynamics. Biotropica, 11:158 - 160.

220
Brown, G.W. (1991) Ecological feeding analysis of South-eastern Australian scincids (Reptilia: Lacertilia). Australian Journal of Zoology, 39: 9 - 29.
Boyer, D., and López-Corona, O. (2009) Self-organization, scaling and collapse in a coupled automaton model of foragers and vegetation resources with seed dispersal. Journal of Physics A: Mathematical and Theoretical, 42: 43014.
Boyer, D. and Walsh, P. (2010) Modelling the mobility of living organisms in heterogeneous landscapes: does memory improve foraging success? Philosophical Transactions. Series A, Mathematical, Physical, and Engineering Sciences, 368: 5645 - 59.
Boysen, S. T., Berntson, G. G. and Mukobi, K. L. (2001) Size matters: impact of item size and quantity on array choice by chimpanzees (Pan troglodytes). Journal of Comparative Psychology, 115: 106 - 110.
Buckley, Y.M., Anderson, S., Catterall, C.P., Corlett, R.T., Engel, T., Gosper, C.R., Nathan, R., Richardson, D.M., Setter, M., Spiegel, O. et al. (2006) Management of plant invasions mediated by frugivore interactions. Journal of Applied Ecology, 43: 848 - 857.
Buhusi, C. V., Sasaki, A. and Meck, W. H. (2002) Temporal integration as a function of signal and gap intensity in rats (Rattus norvegicus) and pigeons (Columba livia). Journal of Comparative Psychology, 116: 381 -390.
Buhusi, C.V. and Meck, W.H. (2005) What makes us tick? Functional and neural mechanisms of interval timing. Nature Reviews. Neuroscience, 6: 755 - 765.
Bullock, J.M. and Clarke, R.T. (2000) Long distance seed dispersal by wind: measuring and modelling the tail of the curve. Oecologia, 124: 506 - 521.
Burghardt, G. M. (1977) Learning processes in reptiles. In: Biology of the reptilian, pp. 555 - 681. C. Gans and D. W. Tinkle (eds.). London: Academic Press.
Byrne, R.W. and Whiten, A.W. (1988) Machiavellian intelligence: social expertise and the evolution of intellect in monkeys, apes, and humans. Clarendon Press, Oxford.
Cain, M.L., Milligan, B.G. and Strand, A.E. (2000) Long-distance seed dispersal in plant populations. American Journal of Botany, 87: 1217 -1227.
Calenbuhr, V. and Deneubourg, J.L. (1992) A Model for Osmotropotactic Orientation (I). Journal of Theoretical Biology, 158: 359 - 393.
Candolin, U. (2002) The use of multiple cues in mate choice. Biological Reviews, 78: 575 - 595.

221
Carlo, T.A. and Morales, J.M. (2008) Inequalities in fruit-removal and seed dispersal: consequences of bird behaviour, neighbourhood density and landscape aggregation. Journal of Ecology, 96: 609 - 618.
Carlo, T.A., Tewksbury, J.J and del Río, C.M. (2009) A new method to track seed dispersal and recruitment using ¹⁵N isotope enrichment. Ecology, 12: 3516 - 3525.
Carrillo-Mora, P., Giordano, M. and Santamaría, A. (2009) Spatial memory: theoretical basis and comparative review on experimental methods in rodents. Behavioural Brain Research, 203: 151 - 164.
Casas-Andreu, G. and Quiroz, G.B. (2003) Hábitos alimenticios de Crocodylus acutus (Reptilia: Crocodylidae) determinados por el análisis de sus excretas en la costa de Jalisco, México. Anales del Instituto de Biología, Universidad Nacional Autónoma de México, Serie Zoología, 74: 35 - 42. Castilla.
Cazetta, E. Schaefer, H.M. and Galetti, M. (2007) Why are fruits colorful? The relative importance of achromatic and chromatic contrasts for detection by birds. Evolutionary Ecology, 23:233 - 244.
Cazetta, E., Schaefer, H.M. and Galetti, M. (2009) Why are fruits colorful? The relative importance of achromatic and chromatic contrasts for detection by birds. Evolutionary Ecology, 23:233 - 244.
Cazetta, E., Galetti, M., Rezende, E.L. and Schaefer, H.M. (2012) On the reliability of visual communication in vertebrate-dispersed fruits. Journal of Ecology, 100: 277 - 286.
Chamizo, V., Sterio, D. and Mackintosh, N.J. (1985) Blocking and overshadowing between intra-maze and extra-maze cues: A test of the independence of locale and guidance learning. Quarterly Journal of Experimental Psychology, 37B: 235 - 253.
Chamizo, V.D. (2003) Acquisition of knowledge about spatial location: Assessing the generality of the mechanism of learning. The Quarterly Journal of Experimental Psychology, 56B: 102 - 113.
Chapman, C.A., Chapman, L.J., Struhsaker, T.T., Zanne, A.E., Clark, C.J. and Poulsen, J.R. (2005) A long-term evaluation of fruiting phenology: importance of climate change. Journal of Tropical Ecology, 21: 31- 45.
Chapuis, N., Durup, M. and Thinus-blanc, C. (1987) The role of exploratory experience in a shortcut task by golden hamsters Mesocricetus auratus. Animal Learning and Behaviour, 15: 174 - 178.
Chapuis, N. and Scardigli, P. (1993) Shortcut ability in hamsters (Mesocricetus auratus): the role of environmental and kinesthetic information. Animal Learning and Behaviour, 21: 255 - 265.
222
Cheng, K. (1986) A purely geometric module in the rat’s spatial rep- resentation. Cognition, 23: 149 - 178.
Cheng, K., Spetch, M.L., Kelly, D.M. and Bingman, V.P. (2006) Small-scale spatial cognition in pigeons. Behavioural processes, 72: 115 - 127.
Christian, K. A., Tracy, C. R. and Porter, W. P. (1984) Diet, Digestion, and Food Preferences of Galapagos Land Iguanas. Herpetologica, 40: 205 - 212.
Christianini, A.V. and Oliveira, P.S. (2010) Birds and ants provide complementary seed dispersal in a neotropical savanna. Journal of Ecology, 98: 573 - 582.
Church, R.M., Meck, W.H. and Gibbon, J. (1994) Applications of scalar timing theory to individual trials. Journal of Experimental Psychology: Animal Behavioural Processes, 20: 135 - 155.
Clark, J.S., LaDeau, S. and Ibáñez, I. (2004) Fecundity of trees and the colonization–competition hypothesis. Ecological Monographs, 74: 415 - 442.
Clark, C. J., Poulsen, J. R., Bolker, B. M., Connor, E. F. and Parker, V. T. (2005) Comparative seed shadows of bird-, monkey-, and wind-dispersed trees. Ecology, 86: 2684 - 2694.
Clayton, N. S., and Krebs, J. R. (1994) Memory for spatial and object- specific cues in food-storing and non-storing birds. Journal of Comparative Physiology A, 174: 371 - 379.
Clayton, N. S., and Krebs, J. R. (1995) Memory in food storing birds: from behavior to brain. Current Opinion in Neurology, 5: 149 - 154.
Cleuren, J. and De Vree, F. (2000). Feeding in crocodilians. In Feeding: form, function, and evolution in tetrapod vertebrates, pp. 337 - 358. Schwenk, K. (Ed.). San Diego: Academic Press.
Collett, T. S., Cartwright, B. A. and Smith, B.A. (1986) Landmark learning and visuo-spatial memories in gerbils. Journal of Comparative Physiology A, 158: 835 - 851.
Collet, T.S. and Collet, M. (2000) Path integration in insects. Current Opinion in Neurobiology, 10: 757 - 762.
Colwill, R.M., Raymond, M.P., Ferreira, L. and Escudero, H. (2005) Visual discrimination learning in zebrfish (Dario rerio). Behavioural Processes, 70:19 - 31.
Connell, J.H. (1971) On the role of natural enemies in preventing competitive exclusion in some marine animals and in rain forest trees. In: Den Boer PJ,

223
Gradwell G, eds. Dynamics of populations. Wageningen, the Netherlands: PUDOC, 298 - 312.
Cooper,W.E. and Vitt, L.J. (2002) Distribution, extent, and evolution of plant consumption by lizards. Journal of Zoology, 257: 487 - 517.
Corbet, S.A., Delfosse, E.S. (1984) Honeybees and the nectar of Echium plantagineum L. in southeastern Australia. Journal of Comparative Physiology A: Neuroethology, Sensory, Neural, and Behavioral Physiology, 9: 125 - 139.
Cordeiro, N.J. and Howe, H.F. (2003) Forest fragmentation severs mutualism between seed dispersers and an endemic African tree. Proceedings of the National Academy of Sciences, USA, 100: 14052 -14056.
Corlett, R.T. (2011) How to be a frugivore (in a changing world). Acta oecologica, 37, 674 - 681.
Cosyns, E., Delporte, A., Lens, L. and Hoffmann, M. (2005) Germination success of temperate grass and species after passage through ungulate and rabbit guts. Journal of Ecology, 93: 353 - 361.
Cousens, R.D., Hill, J., French, K. and Bishop, I.D. (2010) Towards better prediction of seed dispersal by animals. Functional Ecology, 24: 1163 - 1170.
Couvreur, M., Vandenberghe, B., Verheyen, K., and Hermy, M. (2004)a. An experimental assessment of seed adhesivity on animal furs. Seed Science Research, 14: 147 - 159.
Couvreur, M., Christiaen, B.,Verheyen, K. and Hermy, M. (2004)b. Large herbivores as mobile links between isolated nature reserves through adhesive seed dispersal. Applied Vegetation Science, 7: 229 - 236.
Couvreur, M.,Verheyen, K., Vellend, M., Lamoot, I., Cosyns, E. and Hoffmann, M. (2008) Epizoochory by large herbivores: merging data with models. Basic and Applied Ecology, 9: 204 - 212.
Cramer, A.E. and Gallistel, C.R. (1997) Vervet monkeys as travelling salesmen. Nature, 387: 464.
Crawley, M.J. (2000) Seeds predators and plant population dynamics. In: Seeds: the ecology of regeneration in plant communities. 2nd Edition. M.Fenner (Ed.). CABI, London.
Crawley, M. J. (2005) Statistics: An Introduction Using R. West Sussex: Wiley.
Crawley, M. J. (2007) The R Book. West Sussex: Wiley.

224
Cruz-Rivera, E. and Hay, M.E. (2000) Can quantity replace quality? Food choice, compensatory feeding, and fitness of marine mesograzers. Ecology, 81: 201-219.
Crystal, J.D. (2001) Nonlinear time perception. Behavioural Processes, 55: 35 - 49.
Daan, S., and Koene, P. (1981) On the timing of foraging flights by oystercatchers, Haematopus ostralegus, on tidal mudflats. Netherlands Journal of Sea Research, 15: 1 - 22.
Davenport, J., Grove, D.J., Cannon, J., Ellis, T.R. and Stables, R. (1990) Food capture, appetite, digestion rate and efficiency in hatchling and juvenile Crocodylus porosus. Journal of Zoology, 220: 569 - 592.
Davis, K. M., and Burghardt, G. M. (2007) Training and long-term memory of a novel food 443 acquisition task in a turtle (Pseudemys nelsoni). Behavioural Processes, 27: 225 - 230.
Davis, K. M., and Burghardt, G. M. (2012) Long-term retention of visual tasks by two species of emydid turtles, Pseudemys nelsoni and Trachemys scripta. Journal of Comparative Psychology, 126: 213 - 223.
Dehaene, S. (1997) The number sense. New York: Oxford University Press.
Denslow, J.S. (1980) Gap partitioning among tropical rainforest trees. Biotropica, 12: 47 - 55.
De Souza, A.F., Deandrade, A.C.S., Ramos, F.R., Loureiro, A.B. (1999) Ecophysiology and morphology of seed germination of the Neotropical lowland tree Genipa americana (Rubiaceae). Journal of Tropical Ecology, 15: 667 - 680.
De Waal, F.B.M. (1982) Chimpanzee politics: power and sex among apes. Harper & Row, New York.
D’hondt, B. (2011) The fate of seeds in dispersal through ungulates – costs and benefits to dry-fruited plants. Unpublished PhD Thesis, University of Gent.
D’hondt, B., and Hoffmann, M. (2011) A reassessment of the role of simple seed traits in survival following herbivore ingestion. Plant Biology, 13: 118 - 124.
D’hondt, B., D’hondt, S., Bonte, S., Brys, R. and Hoffmann, M. (2012) A data-driven simulation of endozoochory by ungulates illustrates directed dispersal. Ecological Modelling, 230: 114 - 122.

225
Dibner, C., Schibler, U. and Albrecht, U. (2010) The mammalian circadian timing system: organization and coordination and peripheral clocks. Annual Review of Physiology, 72: 517 - 549.
Di Fiore, A. and Suarez, S.A. (2007) Route-based travel and shared routes in sympatric spider and woolly monkeys: cognitive and evolutionary implications. Animal Cognition, 10: 317 - 329.
Dominy, N.J., Lucas, P.W., Osorio, D. and Yamashita, N. (2001) The sensory ecology of primate food perception. Evolutionary Anthropology, 10: 171 - 186.
Dominy, N.J., Garber, P.A., Bicca-Marques, J.C. and Azevedo-Lopes, M.A. (2003) Do female tamarins use visual cues to detect fruit rewards more successfully than do males? Animal Behaviour, 66: 829 - 837.
Dominy, N.J. (2004) Fruits, fingers, and fermentation: The sensory cues available to foraging primates. Integrative and Comparative Biology, 44: 295 - 303.
Drew, M.R., Zupan, B., Cooke, A., Couvillon, P.A. and Balsam, P.D. (2005) Temporal control of conditioned responding in goldfish. Journal of Experimental Psychology: Animal Behavioural Processes, 31: 31 - 39.
Duarte da Rocha, C.F. (1989) Diet of a Tropical Lizard (Liolaemus lutzae) of Southeastern Brazil. Journal of Herpetology, 23: 292 - 294.
Ellstrand, N.C. and Antonovics, J. (1985) Experimental studies of the evolutionary significance of sexual reproduction. II. A test of the density dependent selection hypothesis. Evolution, 39: 657 - 666.
Engel, T.R. (1997) Seed dispersal and plant regeneration by snakes? Ecotropica, 3:33 - 41.
Etienne, A.S. and Jeffery, K.J. (2004) Path integration in mammals. Hippocampus, 14: 180 - 192.
Evangelista, D., Hotton, S. and Dumais, J. (2011) The mechanics of explosive dispersal and self-burial in the seeds of the filaree, Erodium cicutarium (Geraniaceae). The Journal of experimental biology, 214: 521 -529.
Fagot, J., and Cook, R. G. (2006). Evidence for large long-term memory in baboons and pigeons and its implications for learning and the evolution of cognition. Proceeding of the National Academy of Science of the United States of America, 103: 17564 - 17567.
Feeney, M. C., Roberts, W. A., Sherry, D. F. (2011) Mechanisms of what-where-when memory in black-capped chickadees (Poecile atricapillus): Do chickadees remember "when"? Journal of comparative psychology, 125: 308 - 316.

226
Feillet, C. A., Ripperger, J. A., Magnone, M. C., Dulloo, A., Albrecht, U., and Challet, E. (2006) Lack of food anticipation in Per2 mutant mice. Current Biology, 16: 2016 - 2022.
Fitter, A.H., Fitter, S.R.S., Harris, I.T.B and Williamson, M.H. (1995) Relationship between first flowering date and temperature in the flora of a locality in central Engalnd. Functional Ecology, 9: 55 - 60.
Fleming, T.H. (1979) Do tropical frugivores compete for food? American Zoo1ogist, 19:1157 - 1172.
Fleming, T. H., Breitwisch, R. and Whitesides, G. H. (1987) Patterns of tropical vertebrate frugivore diversity. Annual Review of Ecology and Systematics, 18: 91 - 109.
Fleming, T.H. and Kress, J.W. (2011) A brief history of fruits and frugivores. Acta Oecologica, 37: 521 - 530.
Flores-Abreu, I.N., Hurly, A.T. and Healy, S. D. (2012) One-trial spatial learning: wild hummingbirds relocate a reward after a single visit. Animal Cognition, 15: 631 - 637.
Fragoso, J.M.V., Silvius, K.M. and Correa, J.A. (2003) Long-distance seed dispersal by tapirs increases seed survival and aggregates tropical trees. Ecology, 84: 1998 - 2006.
Frankham, R., Ballou, J.D. and Briscoe D.A. (2002) Introduction to Conservation Genetics. Cambridge University Press. Cambridge, UK.
Gachon, F., Nagoshi, E., Brown, S. A., Ripperger, J., Schibler, U. (2004) The mammalian circadian timing system: from gene expression to physiology. Chromosoma, 113: 103 - 112.
Gallistel, C.R. (1990) The organization of learning. Cambridge, MA: Bradford Books/MIT Press.
Gallistel, C.R., King, A. and McDonald, R. (2004) Sources of variability and systematic error in mouse timing behavior. Journal of Experimental Psychology: Animal Behavioural Processes, 30: 3 - 16.
Garber, P.A. (1989) Role of spatial memory in primate foraging patterns: Saguinus mystax and Saguinus fuscicollis. American Journal of Primatology, 19: 203 - 216.
Garrison, W. J., Miller, G. L. and Raspet, R. (2000). Ballistic seed projection in two herbaceous species. American Journal of Botany, 87:1257 - 1264.

227
Gautier-Hion, A., Duplantier, J.M., Quris, R., Feer, F., Sourd, C. et al., (1985) Fruit characters as a basis of fruit choice and seed dispersal in a tropical forest vertebrate community. Oecologia, 65: 324 - 337.
Giladi, I. (2006) Choosing benefits or partners: a review of the evidence for the evolution of myrmecochory. Oikos,112: 481- 492.
Gilbert, G.S., Foster, R.B. and Hubbell, S.P. (1994) Density and distance to adult effects of a canker disease of trees in a moist tropical forest. Oecologia, 98: 100 - 108.
Gill, F.B. (1988) Trapline foraging by hermit hummingbirds: competition for an undefended, renewable resource. Ecology, 69: 1933 - 1942.
Gisiner, R.C. (1985) Male territoriality and reproductive behavior in the Steller sea lion, Eumetopias jubatus. Unpublished PhD thesis, University of California Santa Cruz.
Glander, K. (1978) Howling monkey feeding behavior and plant secondary compounds: a study of strategies. In: The ecology of arboreal folivores. Montgomery G (Ed.). The symposia of the National Zoological Park, Smithsonian Institution, Washington, pp 561 - 574.
Gleditsch, J.M. and Carlo, T.A. (2011) Fruit quantity of invasive shrubs predicts the abundance of common native avian frugivores in central Pennsylvania. Diversity Distribution, 17: 244 - 253.
Godínez-Álvarez, H. (2004) Pollination and seed dispersal by lizards: a review. Revista Chilena de Historia Natural, 77: 569 - 577.
Gosset, D. and Roeder, J.J. (2000). Colour and shape discrimination in black lemurs (Eulemur macaco). Folia primatologica, 71: 173 - 176.
Grassman, M. A. and Owens, D. W. (1982) Development and Extinction of Food Preferences in the Loggerhead Sea Turtle, Caretta caretta. Copeia, 4:965 - 969.
Greenberg, C.H. (2001) Response of reptile and amphibian communities to canopy gaps created by wind disturbance in the southern Appalachians. Forest Ecology and Management, 148:135 - 144.
Greene, D. F., and Johnson. E.A. (1989) A model of wind dispersal of winged or plumed seeds. Ecology, 70: 339 - 347.
Gribova, A., Donchin, O., Bergman, H., Vaadia, E. and Cardoso de Oliveira, S. (2002) Timing of bimanual movements in human and non-human primates in relation to neuronal activity in primary motor cortex and supplementary motor area. Experimental Brain Research, 146: 322 -335.

228
Griffiths, C.J., Jones, C.G., Hansen, D.M., Puttoo, M., Tatayah, R.V., Müller, C.B. and Harris, S. (2010) The use of extant non-indigenous tortoises as a restoration tool to replace extinct ecosystem engineers. Restoration Ecology, 18: 1 - 7.
Guisande, C., Riveiro, I. and Maneiro, I. (2000) Comparisons among the amino acid composition of females, eggs and food to determine the relative importance of food quantity and food quality to copepod reproduction. Marine Ecology Progressive Serie, 202: 135 - 142.
Guzmán, A. and Stevenson, P.R. (2008) Seed dispersal, habitat selection and movement patterns in the Amazonian tortoise, Geochelone denticulata. Amphibia–Reptilia, 29, 463 - 472.
Guzmán, A. and Stevenson, P.R. (2011) A new hypothesis for the importance of seed dispersal in time. Revista de Biologia Tropical, 59: 1795 -1803.
Hampe, A. (2004) Extensive hydrochory uncouples spatiotemporal patterns of seedfall and seedling recruitment in a ‘bird-dispersed’ riparian tree. Journal of Ecology, 92: 797 - 807.
Hampe, A., García-Castaño, J.L., Schupp, E.W. and Jordano, P. (2008) Spatio-temporal dynamics and local hotspots of initial recruitment in vertebrate-dispersed trees. Journal of Ecology, 96: 668 - 678.
Hansen, D.M., Donlan, C. J., Griffiths, C.J. and Campbell, K.J. (2010) Ecological history and latent conservation potential: Large and giant tortoises as a model for taxon substitutions. Ecography, 33:272 - 284.
Hardin, P.E., Hall, J.C. and Rosbash, M. (1990) Feedback of the drosophila period gene product on circadian cycling of its messenger RNA levels. Nature, 343: 536 – 540.
Harms, K.E. et al. (2000) Pervasive density-dependent recruitment enhances seedling diversity in a tropical forest. Nature, 404: 493 - 495.
Hart, B.L., Hart, L.A., and Pinter-Wollman, N. (2008) Large brains and cognition: Where do elephants fit in? Neuroscience and Biobehavioral Reviews, 32: 86 - 98.
Heleno, R., Blake, S., Jaramillo, P., Traveset, A., Vargas, P. and Nogales, M. (2011) Frugivory and seed dispersal in the Galapagos: what is the state of the art? Integrative Zoology, 6:110 - 128.
Henderson, J.Hurly, T.A., Bateson, M. and Healy, S. D. (2006) Timing in free-living rufous hummingbirds, Selasphorus rufus. Current biology, 16: 512 - 515.
Herrel, A., Vanhooydonck, B., Joachim, R., Irschick, D.J. (2004) Frugivory in polychrotid lizards: effect of body size. Oecologia, 140: 160 -168.

229
Herrera, C.M., Jordano, P., López-Soria, L. and Amat, J.A. (1994) Recruitment of a mast-fruting, bird-dispersed tree: bridging frugivore activity and seedling establishment. Ecological Monographs, 64: 315 - 344.
Holbrook, K.M., Smith, T.B., and Hardesty, B.D. (2002) Implications of long distance movements of frugivorous rain forest hornbills. Ecography, 25: 745 - 749.
Holl, K.D. (1999) Factors limiting tropical rain forest regeneration in abandoned pasture: Seed rain, seed germination, microclimate and soil. Biotropica, 31: 229 - 242.
Holtzman, D. A., Harris, T. W., Aranguren, G., and Bostocks, E. (1999). Spatial Learning of an escape task by young corn snakes (Elaphe guttata guttata). Animal Behaviour. 57: 51 - 60.
Hooper, E., Condit, R. and Legendre, P. (2002) Responses of 20 native tree species to reforestation strategies for abandoned pastures in Panama. Ecological Applications, 12: 1626 - 1641.
Howe, H.F. and Vande Kerckhove, G.A.V. (1979) Fecundity and seed dispersal of a tropical tree. Ecology, 60: 180 - 189.
Howe, H.F. and Smallwood, J. (1982) Ecology of seed dispersal. Annual Review of Ecological System, 13: 201 - 228.
Howe, H.F and Miriti, M.N. (2000) No question: seed dispersal matters. Trends in Ecology and Evolution, 15: 434 - 436.
Howe, H.F. and Miriti, M.N. (2004) When seed dispersal matters. BioScience, 54: 651 - 660.
Hübener, F., Laska, M. (2001) A two-choice discrimination method to assess olfactory performance in pigtailed macaques, Macaca nemestrina. Psychology and Behavior, 72: 511 - 519.
Ibáñez, I., Clark, J.S., Dietze, M.C., Feeley, K., Hersh, M., LaDeau, S., McBride, A., Welch, N.E. and Wolosin, M.S. (2006) Predicting biodiversity change: outside the climate envelope, beyond the species-area curve. Ecology, 87: 1896 -1906.
Jacobs, L.F. and Schenk, F. (2003) Unpacking the Cognitive Map: The Parallel Map Theory of Hippocampal Function. Psychological Review, 110: 285- 315.
Janmaat, K.R.L., Byrne, R.W., and Zuberbuhler, K. (2006) Primates take weather into account when searching for fruits. Current Biology, 16: 1232 - 1237.
230
Janmaat K.R.L. and Chancellor, R. (2010) Exploring new areas. How important is long-term spatial memory for mangabey (Lophocebus albigena johnstonii) foraging efficiency. International Journal of Primatology, 31: 863 - 866.
Janmaat, K.R.L. Ban, S.D. and Boesch, C. (2013) Chimpanzees use long-term spatial memory to monitor large fruit trees and remember feeding experiences across seasons. Animal Behaviour, 6: 1183 - 1205.
Janmaat, K.R.L., Polansky, L., Dagui Ban, S. and Boesch, C. (2014) Wild chimpanzee plan their breakfast time, type and location. Proceedings of the National Academia of Sciences, 111:16343 - 16348.
Janson, C.H. (1990) Social correlates of individual spatial choice in foraging groups of brown capuchin monkeys, Cebus apella. Animal Behaviour, 40: 910 - 921.
Janzen, D.H. (1970) Herbivores and the number of tree species in tropical forests. American Naturalist, 104: 501 - 528.
Jarau, S., Hrncir, M., Zucchi, R. and Barth, F. G. (2004) A stingless bee uses labial gland secretions for scent trail communication (Trigona recursa Smith 1863). Journal of Comparative Physiology A: Neuroethology, Sensory, Neural, and Behavioral Physiology, 190: 233 - 239.
Jerozolimski, A., Ribeiro, M.B.N. and Martins, M. (2009) Are tortoises important seed dispersers in Amazonian forests? Oecologia, 161: 517 - 528.
Jones, C.G. (2002) Reptiles and amphibians. In: Handbook of ecological restoration. M. R., Perrow and A. J., Davy (eds.), Cambridge Univ. Press, pp. 355 - 375.
Jones, K.A., Krebs, J.R. and Whittingham, M.J. (2006) Interaction between seed crypsis and habitat structure influence patch choice in a granivorous bird, the chaffinch Fringilla coelebs. Journal of Avian Biology, 37: 413 - 418.
Jordano, P., and Herrera, C.M. (1995) Shuffling the offspring: uncoupling and spatial discordance of multiple stages in vertebrate seed dispersal. Ecoscience, 2: 230 - 237.
Jordano P., García C., Godoy J.A. and García-Castaño J.L. (2007) Differential contribution of frugivores to complex seed dispersal patterns. Proceedings of the National Academy of Sciences, USA 104: 3278 - 3282.
Kacelnik, A. and Houston, A.I. (1984) Some effects of energy cost on foraging strategies. Animal Behaviour, 32: 609 - 614.
Kacelnik, A. and Bateson, M. (1996) Risky theories – the effect of variance on foraging decisions. American Zoologist, 36: 402 - 434.

231
Kacelnik, A., Krebs, J.R. and Ens, B. (2013) Foraging in a changing environment: an experiment with starlings (Sturnus vulgaris). In: Foraging: quantitative analysis of behaviour. M.L. Commons, A. Kalcenik, S.J., Shettleworth. (eds.). Lawrence Erlbaum Associates, New Jersey.
Karlson, P. and Lüsher, M. (1959) Pheromones: a new term for a class of biologically active substances. Nature (London), 183: 55 - 56.
Karsten, R.J., Jovanovic, M., Meilby, H. Perales, E. and Reynel, C. (2013) Regeneration in canopy gaps of tierra-firme forest in the Peruvian Amazon: Comparing reduced impact logging and natural, unmanaged forests. Forest Ecology and Management, 310: 663 - 671.
Kaufman, J. D., Burghardt, G. M. and Phillips, J. A. (1996) Sensory cues and foraging decisions in a large carnivorous lizard, Varanus albigularis. Animal Behaviour, 52: 727 - 736.
Kelber, A., Vorobyev, M., Osorio, D. (2007) Animal colour vision-behavioural tests and physiological concepts. Biological Reviews, 78: 81 -118.
Kelly, D.M. and Gibson, B.M. (2007) Spatial navigation: spatial learning in real and virtual environments. Comparative Cognition and Behavior Reviews, 2: 111 - 124.
Kimmins, J.P. (1987) Forest Ecology. MacMillan, New York.
King, G. (1996) Reptiles and Herbivory, Chapman & Hall, London.
Kondo, T. and Ishiura, M. (2000) The circadian clock of cyanobacteria. BioEssays, 22: 10 - 15.
Kozakiewicz, M. and Kozakiewicz, A. (2004) Chemical information, scent trails and spatial behaviour of small forest rodents. A review. Electronical Journal of PolishAgricoltural Universities. Series Biology, 7: 2.
Krusche, P., Uller C. and Dicke, U. (2010) Quantity discrimination in salamanders. Journal of Experimental Biology, 213: 1822 - 1828.
Lavenex, P. and Schenk, F. (1998) Olfactory traces and spatial learning in rats. Animal Behaviour, 56:1129 - 1136.
Leimu, Vergeer, P., Angeloni, F., and Ouborg, N.J. (2010) Habitat fragmentation, climate change and inbreeding in plants. Annals of the New York Academy of Sciences, 1195: 84 - 98.
Levey, D. J., Moermond, T. C. and Sloan Denslow, J. (1984) Fruit choice in neotropical birds: the effect of distance between fruits on preference patterns. Ecology, 65: 844 - 850.
Levey, D. J. (1987) Seed size and fruit-handling techniques of avian frugivores. American Naturalist, 129:471 - 485.
232
Levey, D.J., Bolker, B.M., Tewksbury, J.J., Sargent, S. and Haddad, N.M. (2005) Effects of landscape corridors on seed dispersal by birds. Science, 309: 146 - 148.
Levin, S.A., Muller-Landau, H.C., Nathan, R. and Chave, J. (2003) The ecology and evolution of seed dispersal: a theoretical perspective. Annual Review of Ecology Evolution and Systematics, 34: 575 - 604.
Levine, J.M. and Murrell, D.J. (2003) The community-level consequences of seed dispersal patterns. Annual Review of Ecology Evolution and Systematics, 34: 549 - 574.
Leuthold, R.H. (1975) Orientation mediated by pheromones in social insects. In: Pheromones and Defensive Secretions in Social Insects. Noirot, C., Howse, P. E. and Le Masne, J. (eds.). University of Dijon Press, Dijon.
Liu, H. Platt, S.G., and Borg, C.K. (2004) Seed dispersal by the Florida box turtle (Terrapene carolina bauri) in pine rockland forests of the lower Florida Keys, United States. Oecologia, 138: 539 - 546.
Lihoreau, M., Chittka, L. and Raine, N.E. (2011) Trade-off between travel distance and prioritization of high-reward sites in traplining bumblebees. Functional Ecology 25: 1284 - 1292.
Link, A. and Di Fiore, A. (2006) Seed dispersal by spider monkeys and its importance in the maintenance of neotropical rain-forest diversity. Journal of Tropical Ecology, 22: 235 - 246.
Lohmann, K.J. and Lohmann, C.M.F. (1993) A light-independent magnetic compass in the leatherback sea turtle. The Biological Bulletin, 185: 149 - 151.
Lohmann, K.J., Swartz, A.W. and Lohmann, C.M.F. (1995) Perception of ocean wave direction by sea turtles. Journal of Experimental Biology, 198: 1079 - 1085.
Lohmann, K., Luschi, P. and Hays, G. (2008) Goal navigation and island finding in sea turtles. Journal of Experimental Marine Biology and Ecology, 356: 83 - 95.
López, J.C., Rodrfguez, F., Gomez, Y., Broglio, C., and Salas, C. (2000) Place and cue learning in turtles. Animal learning & behavior, 28: 360 - 372.
López, J.C., Gómez, Y., Rodríguez, F., Broglio, C., Vargas, J. P., and Salas, C. (2001) Spatial learning in turtles. Animal Cognition, 4: 49 - 59.
López, J. C., Vargas, J. P., Gómez, Y., and Salas, C. (2003) Spatial and non spatial learning in turtles: The role of the medial cortex. Behavioural Brain Research, 143: 109 - 120.

233
Luschi, P., Åkesson, S., Broderick, A.C., Glen, F., Godley, B.J., Papi, F. and Hays, G.C. (2001) Testing the navigational abilities of ocean migrants: displacement experiments on green sea turtles (Chelonia mydas). Behavioural Ecology and Sociobiology, 50: 528 - 534.
MacArthur, R.H., Diamond, J.M. and Karr, J.R. (1972) Density compensation in island faunas. Ecology, 53: 330 - 342.
Mahamane, S., Grunig, K. L., Baker, J., Young, J. K. and Jordan, K. E. (2014) Memory-Based Quantity Discrimination in Coyotes (Canis latrans). Animal Behaviour and Cognition, 1: 341 - 351.
Mancilla-Leytón, J.M., Fernández-Alés, R. and Mártin Vicente, A. (2011) Plant-ungulate interaction: goat gut passage effect on survival and germination of Mediterranean shrubs seeds. Journal of Vegetation Science, 22: 1031 - 1037.
Margules, J. and Gallistel, C.R. (1988) Heading in the rat: Determination by environmental shape. Animal Learning & Behavior, 16: 404 - 410.
Marsh, D. M., Thakur, K. A. Bulka, K. C. and Clarke, L. B. (2004) Dispersal and colonization through open fields by a terrestrial, woodland salamander. Ecology, 85: 3396 - 3405.
Mary, F. and Kawacki, T.J. (2005) A cost of long-term memory in drosophila. Science, 308: 1148.
McCall, C., Mitchell-Olds, T. and Waller, D.M. (1989) Fitness consequences of outcrossing in Impatiens capiensis: test of the frequency- dependent and sib-competition models. Evolution, 43: 1074 - 1084.
McCaugh, J. (2000) Memory – a century of consolidation. Science, 287: 248 - 251.
McCaughey, S.A. and Tordoff, M.G. (2002) Magnesium appetite in the rat. Appetite, 38: 29 - 38.
McClung, C.R. (2006) Plant circadian rhythm. The Plant Cell, 18: 792 -803.
Means, D.B. (2006) Vertebrate faunal diversity of longleaf pine ecosystems. In: The longleaf pine ecosystem: ecology, silviculture, and restoration. S., Jose, E.J. Jokela and D.L. Miller (eds.). Springer, pp. 157-213.
Merchan, M., Fidalgo, A.M. and Perez, C. (1998) "Biology, Distribution and Conservation of the Redfoot Tortoise Geochelone carbonaria. Reptilia, 2: 30 - 38.
Miriti, M.N. (1998) Regeneracao florestal em pastagens abandonadas na Amazonia Central: Competicao, predação, e dispersao de sementes. Pp: 179 – 191. In Floresta Amazonica: Dinamica, Regeneracao e Manejo. Gascon, C.,
234
Nepstad, D., Moutinho, P. (eds.). Manaus (Brazil): Instituto Nacional de Pesquisa da Amazonia.
Mistlberger, R. E. (1993) Circadian properties of anticipatory activity to restricted water access in suprachiasmatic-ablated hamsters. The American Journal of Physiology, 264: R22 - R29.
Mistlberger, R. E. (2009) Food-anticipatory circadian rhythms: Concepts and methods. European Journal of Neuroscience, 30: 1718 - 1729.
Mitrus, S. (2006) Fidelity to nesting area of the European pond turtle, Emys orbicularis (Linnaeus, 1758). Belgian Journal of Zoology, 136: 25 -30.
Moll, D. and Jansen, K.P. (1995) Evidence for a role in seed dispersal by two tropical herbivorous tortoises. Biotropica, 27: 121 - 127.
Momose, K. (2004) Plant reproductive interval and population density in aseasonal tropics. Ecological Research, 19: 245 - 253.
Montaño, F. R.R., Cuéllar, E., Fitzgerald, L.A., Soria, F., Mendoza, F., Peña, R., Dosapey T., Deem S.L. and Noss, A.J. (2013) Ranging patterns by the red-footed tortoise - Geochelone carbonaria (Testudines: Testudinidae) - in the Bolivian Chaco. Ecología en Bolivia, 48: 17 - 30.
Mookerjee, D. (1946) Mango fruit on the menu of the common python (Phyton molurus). Journal of Bombay Natural History Society, 46: 733.
Moore, D., Van Nest, B.N. and Seier, E. (2011) Diminishing returns: The influence of experience and environment on time-memory extinction in honey bee foragers. Journal of Comparative Physiology A: Neuroethology, Sensory, Neural, and Behavioral Physiology, 197: 641 -651.
Morris, R.G.M. (1981) Spatial localization does not require the presence of local cues. Learning and Motivation, 12: 239 - 260.
Morris, R. (1984) Developments of water-maze procedure for studying spatial learning in the rat. Journal of Neurosciences Methods, 11, 47 - 60.
Moskovits, D.K. (1985) The behavior and ecology of the two Amazonian tortoises, Geochelone carbonaria and Geochelone denticulata, in northwestern Brasil. PhD. Dissertation. University of Chicago, Illinois
Moskovits, D.K. and Kiester A.R. (1987) and ranging behaviour of the two Amazonian tortoises, Geochelone carbonaria and Geochelone denticulata, in north-western. Functional Ecology, 3: 203 - 214.
Moskovits, D.K. and Bjorndal, K.A. (1990) Diet and food preferences of the tortoises Geochelone carbonaria and G. denticulata in northwestern Brazil. Herpetologica, 46: 207 - 218.

235
Mueller-Paul, J., Wilkinson, A., Hall and G., Huber, L. (2012) Radial-arm maze behavior of the red-footed tortoise (Geochelone carbonaria). Journal of Comparative Psychology, 126: 305 - 317.
Mueller-Paul, J., Wilkinson, A., Aust, U., Steurer, M., Hall, G. and Huber, L. (2014) Touchscreen performance and knowledge transfer in the red-footed tortoise (Chelonoidis carbonaria). Behavioural Processes, 106: 187 - 192.
Murphy, M.E. and King, J.R. (1987) Dietary discrimination by molting white-crowned sparrows given diets differing only in sulphur amino acid concentrations. Physiological Zoology, 60: 279 - 289.
Mushinsky, H.R., (1985) Fire and the Florida sandhill herpetofaunal community: with special attention to responses of Cnemidophorus sexlineatus. Herpetologica, 41: 333 - 342.
Narbona, E., Arista, M. and Ortiz, P. L. (2005) Explosive seed dispersal in two perennial Mediterranean Euphorbia species (Euphorbiaceae). American Journal of Botany, 92: 510 - 516.
Nathan, R. and Muller-Landau, H.C. (2000) Spatial patterns of seed dispersal, their determinants and consequences for recruitment. Trends in ecology & evolution, 15: 278 - 285.
Nathan, R. (2001) The challenges of studying dispersal. Trends in Ecology and Evolution, 16, 481 - 483.
Nathan, R., Perry, G., Cronin, J.T., Strand, A.E. and Cain, M.L. (2003) Methods for estimating long-distance dispersal. Oikos, 103: 261 - 273.
Nathan, R., Schurr, F., Spiegel, O., Steinitz, O., Trakhtenbrot, A. and Tsoar, A. (2008) Mechanisms of long-distance seed dispersal. Trends in ecology & evolution, 23: 638 - 647.
Ness, J.H., Morris, W.F., Bronstein, J.L. (2006) Integrating quality and quantity of mutualistic service to contrast ant species protecting Ferocactus wislizeni. Ecology, 87: 912 - 921.
Nogales, M., Delgado, J. and Medina, F. (1998) Shrikes, lizards and Lycium intricatum (Solanaceae) fruits: a case of indirect seed dispersal on an oceanic island. Journal of Ecology, 86: 866 - 871.
Nogales, M., Heleno, R., Traveset, A. and Vargas, P. (2012) Evidence for overlooked mechanisms of long-distance seed dispersal to and between oceanic islands. New Phytologist, 194: 313 - 317.
Normand, E., Ban, S.D. and Boesch, C. (2009) Forest chimpanzees (Pan troglodytes verus) remember the location of numerous fruit trees. Animal cognition, 12: 797 - 807.

236
Noser, R. and Byrne, R.W. (2010) How do wild baboons (Papio ursinus) plan their routes? Travel among multiple high-quality food sources with inter-group competition. Animal Cognition, 13: 145 - 155.
Nuttle, T. and Haefner, J.W. (2007) Design and validation of a spatially explicit simulation model for bottomland hardwood forests. Ecological Modelling, 200: 20 - 32.
Odling-Smee, L. and Braithwaite, V.A. (2003) The influence of habitat stability on landmark use during spatial learning in the three-spined stickleback. Animal Behaviour, 65: 701 - 707.
Ohkawara, K., Ohara, M. and Higashi, S. (1997) The evolution of ant-dispersal in a spring-ephemeral Corydalis ambigua (Papaveraceae): Timing of seed-fall and effects of ants and ground beetles. Ecography, 20: 217 - 223.
O’Keefe, J. and Nadel, L. (1978) The hippocampus as a cognitive map. London: Oxford UP.
Olesen, J.M. and Valido, A (2003) Lizards as pollinators and seed dispersers: an island phenomenon. Trends in Ecology & Evolution, 18: 177 - 181.
Olton. D.S, and Samuelson, R.J. (1976) Remembrance of places passed: Spatial memory in rats. Journal of Experimental Psychology: Animal Behavior Processes, 2: 97 - 116.
Olton, D.S., Collison, C. and Wertz, M. (1977) Spatial memory and radial arm maze performance of rats. Learning and Motivation, 8: 289 - 314.
Ouborg, N. J., Piquot, Y. and Van Groenendael, J. M. (1999) Population genetics, molecular markers and the study of dispersal in plants. Journal of Ecology, 87: 551 - 568.
Parciak, W. (2002) Environmental variation in seed number, size, and dispersal of a fleshy fruited plant. Ecology, 83: 780 - 793.
Patterson, T.A. and Rose, S.P. (1992) Memory in the chick: Multiple cues, distinct brain locations. Behavioral Neuroscience, 3: 465 - 470.
Pearce, J.M. Animal Learning and Cognition. An Introduction. 2 edition (1997) Psychology press Ltd, East Sussex, UK.
Pearce, J., Ward-Robinson, J., Good, M., Fussell, C. and Aydin, A. (2001) Influence of a beacon on spatial learning based on the shape of the test environment. Journal of Experimental Psychology: Animal Behavior Processes, 27: 329 - 344.
Pendergast, J.S., Nakamura, W., Friday, R.C., Hatanaka, F., Takumi, T. and Yamazaki, S. (2009) Robust food anticipatory activity in BMAL1-deficient mice. PLoS ONE, 4: e4860

237
Peñuelas, J. Filella, I. and Comas, P. (2002) Changed plant and animal life cycles from 1952-2000 in the Mediterranean region. Global Change Biology, 8: 531 - 544.
Pike, D.A. (2005) Spatial learning in a hatchling chelonian Gopherus polyphemus. Florida Scientist, 68: 267 - 271.
Platt, S.G., Elsey, R.M., Liu, H., Rainwater, T.R., Nifong, J.C., Rosenblatt, M.R., Heithaus, M.R. and Mazzotti, F.J. (2013) Frugivory and seed dispersal by crocodilians: an overlooked form of saurochory? Journal of Zoology, 291: 87 - 89.
Pope, C.H. (1961) The giant snakes. Routledge & Kegan Paul: London.
Popma, J., Bongers, F., Martínez-Ramos, M. and Veneklaas, E. (1988) Pioneer species distribution in treefall gaps in Neotropical rain forest; a gap definition and its consequences. Journal of Tropical Ecology, 4: 77 -88.
Porter, L.M., Craven, B., Khan, M.R., Chang, S., Kang, I. et al.(2007) Mechanism of scent-tracking in humans. Nature Neuroscience, 10: 27 - 29.
Porter, L.M. and Garber, P.A. (2013) Foraging and spatial memory in wild weddell’s saddleback tamarins (Saguinus fuscicollis weddelli) when moving between distant and out-of-sight goals. International Journal of Primatology, 34: 30 - 48.
Prior, H., Lingenauber, F., Nitschke, J., Güntürkün, O. (2002) Orientation and lateralized cue use in pigeons navigating a large indoor environment. Journal of Experimental Biology, 205: 1795 - 1805.
Pyke, G. (1984) Optimal Foraging Theory: A Critical Review. Annual Review of Ecology and Systematics, 15: 523 - 575.
Rall, M. and Fairall, N. (1993) Diets and food preferences of two South African tortoises Geochelone pardalis and Psammobates oculifer. South African Journal of Wildlife, 23: 63 - 70.
Rawsthorne, J., Roshier, D.A. and Murphy, S.R. (2009) A simple parametric method for reducing sample sizes in gut passage time trials. Ecology, 90: 2328 - 2331.
Reichmuth-Kastak, C., and Schusterman, R. J. (2002) Long-term memory for concepts in a California sea lion (Zalophus californianus). Animal Cognition, 5: 225 - 232.
Reid, R.A. and Reid, A.K. (2005) Route finding by rats in an open arena. Behavioural Processes, 68: 51 - 67.

238
Rey, P.J. (1995) Spatiotemporal variation in fruit and frugivorous bird abundance in olive orchards. Ecology, 76: 1625 - 1635.
Roberts, W. A. (1998) Principles of animal cognition. Boston: McGraw- Hill.
Roberts, A. D. L., and Pearce, J. (1999) Blocking in the Morris swimming pool. Journal of Experimental Psychology: Animal Behavior Processes, 25: 225 - 235.
Roberts, W. (2002) Are animals stuck in time? Psychological bulletin, 128: 473 - 489.
Ronce, O. (2001) Understanding plant dispersal and migration. Trends in Ecology & Evolution, 16: 663 - 664.
Rosati, A.G., Rodriguez, K. and Hare, B. (2014) The ecology of spatial memory in four lemurs species. Animal cognition,17: 947 - 961.
Rosenblatt, A.E., Scott, Z., Heithaus, M.R., Mazzotti, F.J. (2014) Are seeds consume by crocodialian viable? A test of the crocodilian saurochory hypothesis. Southeastern Naturalist, 13: 26 - 29.
Rosindell, J. and Cornell, S.J. (2009) Species-area curves, neutral models, and long-distance dispersal. Ecology, 90: 1743 - 1750.
Roth, T.C., La Dage, L.D. and Pravosudov, V.V. (2012) Evidence for long-term spatial memory in a parid. Animal Cognition, 15: 149 -154.
Rowe, J.W., Coval, K.A. and Dugan, M.R. (2005) Nest placement, nest-site fidelity and nesting movements in midland painted turtles (Chrysemys picta marginata) on Beaver Island, Michigan. The American Midland Naturalist Journal, 154: 383 - 397.
Russo, S.E., and Augspurger, C.K. (2004) Aggregated seed dispersal by spider monkeys limits recruitment to clumped patterns in Virola calophylla. Ecology Letters, 7:1058 - 1067.
Russo, S.E., Portnoy, S. and Augspurger, C.K. (2006) Incorporating animal behaviour into seed dispersal models: implications for seed shadows. Ecology, 87: 3160 - 3174.
Salas, C., Broglio, C. and Rodríguez, F. (2003) Evolution of forebrain and spatial cognition in vertebrates: conservation across diversity. Brain and Behavioural Evolution, 62:72 - 82.
Sallabanks, R. (1993) Hierarchical mechanisms of fruit selection by an avian frugivore. Ecology, 74: 1326 - 1336.
Sargent, S. (1995) Seed fate in a tropical mistletoe: The importance of host twig size. Functional Ecology, 9: 197 - 204.

239
Saunders, D.S. (2002) Insect clocks. Elsevier Press, Boston.
Schaefer, H.M., Schmidt, V. and Winkler, H. (2003) Testing the defence trade-off hypothesis: how content of nutrient and secondary compound affect fruit removal. Oikos, 102: 318 - 328.
Schaefer, H.M., Schaefer, V. and Levey, D. (2004) How plant-animal interactions signal new insights in communication. Trends in Ecology & Evolution, 19: 577 - 584.
Schaefer, H.M. (2011) Why fruits go to the dark side. Acta Oecologica, 37: 604 - 610.
Schupp, E.W., Howe, H.F., Augspurger, C.K. and Levey, D.J. (1989) Arrival and survival in tropical treefall gaps. The Ecological Society of America, 70: 562 - 564.
Schupp, E. W. (1988) Factors affecting post-dispersal seed survival in a tropical forest. Oecologia, 76: 525 - 530.
Schupp, E.W. (1993) Quantity, quality and the effectiveness of seed dispersal by animals. Vegetatio, 107/ 108: 15 - 29.
Schupp, E.W. and Fuentes, M. (1995) Spatial patterns of seed dispersal and the unification of plant population ecology. Écoscience, 2: 267 - 275.
Schupp, E.W., Milleron, T., Russo, S.E. (2002) Dissemination limitation and the origin and maintenance of species-rich tropical forests. In: Seed dispersal and frugivory: ecology, evolution and conservation. Levey D.J., Silva W.R., Galetti M. (eds.). Wallingford, UK: CAB International, pp. 19 - 33.
Schupp, E.W. and Jordano, P. (2010) The full path of Janzen-Connell effects: genetic tracking of seeds to adult plant recruitment. Molecular ecology, 19: 3953 - 3955.
Schupp, E.W., Jordano, P., Gómez, J.M. (2010) Seed dispersal effectiveness revisited: a conceptual review. New Phytologist, 188: 333 - 353.
Schurr, F.M., Bond, W.J., Midgley, G.F. and Higgins, S.I. (2005) A mechanistic model for secondary seed dispersal by wind and its experimental validation. Journal of Ecology, 93: 1017 - 1028.
Sclafani, A. (1995) How food preferences are learned: laboratory animal models. Proceedings of the Nutrition Society, 54: 419 - 427.
Sehgal, A. (1995) Genetic dissection of the circadian clock: a timeless story. Semininars in Neurosciences, 7: 27 - 35.

240
Shettleworth S.J and Sutton, J.E. (2005) Multiple systems for spatial learning: dead reckoning and beacon homing in rats. Journal of Experimental Psychology. Animal Behavior Processes, 31: 125 - 141.
Silberburg, A., and Fujita, K. (1996) Pointing at smaller food amounts in an analogue of Boysen and Bemtson's (1995) procedures. Journal of the Experimental Analysis of Behavior, 66: 143 - 147.
Sillet, T.S., Holmes, R.T., and Sherry, T.W. (2000) Impacts of a global climate cycle on population dynamics of a migratory songbird. Science, 288: 2040 - 2041.
Skagen, S., Stanley, T. and Dillon, B. (1999) Do mammalian predators follow human scent trails in the shortgrass prairie? Wilson Bull, 111: 415 - 420.
Smarr, B.L., Jennings, K. J., Driscoll, J.R. and Kriegsfel d, L. J. (2014) A time to remember: The role of circadian clocks in learning and memory. Behavioral neuroscience, 128: 283 - 303.
Smulders, T.V. (2006) A multi-disciplinary approach to understanding hippocampal function in food-hoarding birds. Reviews in the Neurosciences, 17: 53 - 69.
Smulders, T.V., Gould, K.L and Leaver, L.A. (2010) Using ecology to guide the study of cognitive and neuronal mechanisms of different aspects of spatial memory in food-hoarding animals. Philosophical Transaction B, 365: 883 - 900.
Snow, D.W. and Snow, B.K. (1986) Some aspects of avian frugivory in a north temperate area relevant to tropical forest. In: Frugivory and seed dispersal. Pp 159-164. A. Estrada and T. H. Fleming (eds.). Dr. W. Junk, The Hague, The Netherlands.
Snow, A.A. and Whigham, D.F. (1989) Costs of flower and fruit production in Tipularia discolor Orchidaceae). Ecology, 70: 1286 - 1293.
Sovrano, V. A., Bisazza, A. and Vallortigara, G. (2002) Modularity and spatial reorientation in a simple mind: Encoding of geometric and non geometric properties of a spatial environment by fish. Cognition, 85: B51-B59.
Spiegel, O. and Nathan, R. (2007) Incorporating dispersal distance into the disperser effectiveness framework: frugivorous birds provide complementary dispersal to plants in a patchy environment. Ecology Letters, 10: 718 - 728.
Spottiswoode, C.N. and Steven, M. (2010) Visual modeling shows that avian host parents use multiple visual cues in rejecting parasitic eggs. Proceedings of the National Academy of Sciences of the United States of America, 107: 8672 - 8676.
241
Spiegel, O. and Nathan, R. (2007) Incorporating dispersal distance into the disperser effectiveness framework: frugivorous birds provide complementary dispersal to plants in a patchy environment. Ecology Letters, 10: 718 - 728.
Stephan, F. K., Swann, J. M., and Sisk, C. L. (1979) Entrainment of circadian rhythms by feeding schedules in rats with suprachiasmatic lesions. Behavioral & Neural Biology, 25: 545 - 554.
Stevens, V. J. (1978) Basic operant research in the zoo. In: Behavior of captive wild animals. H. Markowitz and V. J. Stevens (eds.). Chicago, IL: Nelson-Hall.
Stevens, J. R., Wood, J. N. and Hauser, M. D. (2007) When quantity trumps number: discrimination experiments in cotton-top tamarins (Saguinus oedipus) and common marmosets (Callithrix jacchus). Animal Cognition, 10: 429 - 37.
Strong, J.M. (2005) Seed dispersal and the ecological implications of hunting Geochelone carbonaria and Geochelone denticulada in Northwestern Brazil. Master Thesis, State University of New York, USA.
Strong, J.N. and Fragoso, J.M.V. (2006) Seed Dispersal by Geochelone carbonaria and Geochelone denticulata in Northwestern Brazil. Biotropica, 38: 683 - 686.
Suarez, S.A. (2014) Ecological factors predictive of wild spider monkey (Ateles belzebuth) foraging decisions in Yasuní, Ecuador. American Journal of Primatology, 76: 1185 - 1195.
Sulikowski, D. and Burke, D. (2007) Food specific spatial memory biases in an omnivorous bird. Biology Letters, 3: 245 - 248.
Swamy, V. and Terborgh, J.W. (2010) Distance-responsive natural enemies strongly influence seedling establishment patterns of multiple species in an Amazonian rain forest. Journal of Ecology, 98: 1096 - 1107.
Tackenberg, O., Römermann, C., Thompson, K., and Poschlod, P. (2006) What does diaspore morphology tell us about external animal dispersal? Evidence from standardized experiments measuring seed retention on animal-coats. Basic and Applied Ecology, 7: 45 - 58.
Tautz, J. (2008) The buzz about bees. Springer, Berlin.
Tellería, J.L. and Pérez-Tris, J. (2003) Seasonal distribution of a migratory bird: effects of local and regional resource tracking. Journal of Biogeography, 30: 1583 - 1591.
Tellería, J.L., Ramírez, A. and Pérez-Tris, J. (2008) Fruit tracking between sites and years by birds in mediterranean wintering grounds. Ecography, 31: 381 - 388.

242
Tewksbury, J.J., Levey, D.J., Haddad, N.M., Sargent, S., Orrock, J.L., Weldon, A., Danielson, B.J., Brinkerhoff, J., Damschen, E.I. and Townsend, P. (2002) Corridors affect plants, animals and their interactions in fragmented landscapes. Proceedings of the National Academy of Sciences, 99: 12923 - 12926.
Thiel, M. and Haye, P.A. (2006) The ecology of rafting in the marine environment. III. Biogeographical and evolutionary consequences. Oceanography and Marine Biology, 44: 323 - 429.
Tinklepaugh, O.L. (1932) Maze learning of a turtle. Journal of Comparative Psychology, 13: 201 - 206.
Tosini, G., Bertolucci, C. and Foà, A. (2001) The circadian system in reptiles: a multioscillatory and multiphotoreceptive system. Physiology and Behavior, 72: 461 - 471.
Traveset, A. (1998) Effect of seed passage through vertebrate frugivores' guts on germination: a review. Perspectives in Plant Ecology, Evolution and Systematics, 1: 151 - 190.
Traveset, A., Riera, N. and Mas, R.E. (2001) Passage through bird guts causes interspecific differences in seed germination characteristics. Functional Ecology, 15: 669 - 675.
Traveset, A., Heleno, R. and Nogales, M. (2014) The ecology of seed dispersal. R.S. Gallagher(ed). In: Seeds: The Ecology of Regeneration in Plant Communities, 3rd Edition.
Treisman, M. (1963) Temporal discrimination and the indifference interval. Implications for a model of the ‘internal clock’. Psychological Monograph, 77: 1 - 31.
Tuberville, T.D., Clarck, E.E., Buhlmann, K.A. and Gibbons, W. (2005) Translocation as a conservation tool: site fidelity and movement of repatriated gopher tortoises (Gopherus polyphemus). Animal Conservation, 8: 349 - 358.
Turchin, P., 1998. Quantitative Analysis of Movement: Measuring and Modelling Population Redistribution in Animals and Plants. Sinauer Assoc, Sunderland, MA.
Turnbull, L. A., Rees, M. and Crawley, M.J. (1999) Seed mass and the competition/colonization trade-off: a sowing experiment. Journal of Ecology, 87: 899 - 912.
Turner, I.M. and Corlett, R.T. (1996) The conservation value of small, isolated fragments of lowland tropical rain forest. Trends in Ecology and Evolution, 11: 330 - 333.

243
Vander Wall, S.B. (2010) How plants manipulate the scatter-hoarding behaviour of seed-dispersing animals. Philosophical transactions of the Royal Society of London. Series B, Biological sciences, 365: 989 - 987.
Vander Wall, S.B. and Longland, W.S. (2004) Diplochory: are two seed dispersers better than one? Trends in Ecology & Evolution, 19: 155 - 161.
Valido, A. and Nogales, M. (1994) Frugivory and seed dispersal by the lizard Gallotia galloti (Lacertidae) in a xeric habitat of the Canary Islands. OIKOS, 70:403 - 411.
Varela, R.O. and Bucher, E.H. (2002) Seed dispersal by Chelonoidis chilensis in the Chaco dry woodland of Argentina. Journal of Herpetology, 36:137 - 140.
Vaughan W. Jr. and Greene, S.L. (1984) Pigeon visual memory capacity. Journal of Experimental Psychology: Animal Behavior Processes, 10: 256 - 271.
Vilà, M and D’Antonio, C.M. (1998) Fruit choice and seed dispersal of invasive vs non invasive carpobrotus (Aizoaceae) in Costal California. Ecology, 79: 1053 - 1060.
Von Saint Paul, U. (1982) Do geese use path integration for walking home? Avian navigation, 298 - 307.
Wallace, D.G., Gorny, B. and Whishaw, I.Q. (2002a) Rats can track odors, other rats, and themselves: Implications for the study of spatial behaviour. Behavioural Brain Research, 131: 185 - 192.
Wallace, D.G., Hines, D.J., Pellis, S.M. and Whishaw, I.Q. (2002b) Vestibular information is required for dead reckoning in the rat. Journal of Neuroscience, 22: 10009 - 10017.
Wang, B.C. and Smith, T.B. (2002) Closing the seed dispersal loop. Trends in Ecology and Evolution, 17: 379 - 386.
Wang, E., Donatti, C.I, Ferreira, V.L., Raizer, J. and Himmelstein, J. (2011) Food Habits and Notes on the Biology of Chelonoidis carbonaria (Spix 1824) (Testudinidae, Chelonia) in the Southern Pantanal, Brazil. South American Journal of Herpetology, 6: 11 - 19.
Waitt, C. and Buchanan-smith, H. M. (2001) What time is feeding? How delays and anticipation of feeding schedules affect stump-tailed macaque behaviour. Applied Animal Behaviour Science, 75: 75 - 85.
Ward, C. and Smuts, B. B. (2007) Quantity-based judgments in the domestic dog (Canis lupus familiaris). Animal Cognition. 10: 71 - 80.

244
Watanabe, S. (2005) Strategies of spatial learning for food storing in scrub jays. Journal of Ethology, 2:181 - 187.
Wehner, R. and Flatt, I. (1972) The visual orientation of desert ants, Cataglyphis bicolor, by means of terrestrial cues. In: Information Processing in the Visual System of Arthropod, pp 295 - 302. R. Wehner (ed.). Springer Berlin Heidelberg.
Wehner, R. and Srinivasan, M.V. (1981) Searching behaviour of desert ants, genus Cataglyphis (Formicidae, Hymenoptera). Journal of comparative Physiology, 142: 315 - 338.
Wehner, R., Boyer, M., Loertscher, F., Sommer, S. and Menzi, U. (2006) Ants navigation: one-way routes rather than maps. Current Biology, 16: 75 - 79.
Weiner, J. and Conte, P.T. (1981) Dispersal and neighborhood in an annual plant competition model. Ecological modelling, 13: 131 - 147.
Wenny, D. (2001) Advantages of seed dispersal: A re-evaluation of directed dispersal. Evolutionary Ecology Research, 3: 51 - 74.
Wenny, D.G. and Levey, D. J. (1998) Directed seed dispersal by bellbirds in a tropical cloud forest. Proceedings of the National Academy of Sciences of the United States of America, 95: 6204 - 6207.
Werner, S.J., Kimball, B.A. and Provenza, F.D. (2008) Food color, flavor, and conditioned avoidance among red-winged blackbirds. Physiology & Behavior, 93: 110 - 117.
Wescott, D.A. and Graham, D.L. (2000) Patterns of movement and seed dispersal of a tropical frugivore. Oecologia, 122: 249 - 257.
Westcott, D.A., Bentrupperbaümer, J., Bradford, M.G. and McKeown, A. (2005) Incorporating patterns of disperser behaviour into models of seed dispersal and its effects on estimated dispersal curves. Oecologia, 146: 57 - 67.
Wheelwright, N.T. (1993) Fruit size in a tropical tree species: variation, preference by birds, and hieritability. Vegetatio, 107/108: 163 - 174.
Whiting, M.J. and Greff, J.M. (1997) Facultative frugivory in the Cape Flat lizard, Platysaurus capensis (Sauria: Cordylidae). Copeia 4: 811 - 818.
Whishaw, I.Q., Hines, D.J. and Wallace, D.G. (2001) Dead reckoning (path integration) requires the hippocampal formation: Evidence from spontaneous exploration and spatial learning tasks in light (allothetic) and dark (idiothetic) tests. Behavioural Brain Research, 127: 49 - 69.
Willson, M. F. (1993) Dispersal mode, seed shadows, and colonization patterns. Vegetatio, 107/108: 261 - 280.

245
Willson, M. F. and Traveset, A. (2000) The ecology of seed dispersal. In: Fenner, M. (ed.): Seeds: the ecology of regeneration in plant communities. 2nd ed. CABI Publishing, Wallingford, pp 85 - 110.
Wilkie, D. M., Carr, J. A. R., Siegenthaler, A., Lenger, B., Liu, M., and Kwok, M. (1996) Field observations of time–place behaviour in scavenging birds. Behavioural Processes, 38: 77 - 88.
Wilkinson, A., Chan, H. and Hall, G. (2007) Spatial learning and memory in the tortoise (Geochelone carbonaria). Journal of Comparative Psychology, 121: 412 - 418.
Wilkinson, A., Coward, S. and Hall, G (2009) Visual and response-based navigation in the tortoise (Geochelone carbonaria). Animal Cognition, 12: 779 - 787.
Wilkinson, A., Mandl, I., Bugnyar, T., and Huber, L. (2010)a Gaze following in the red-footed tortoise (Geochelone carbonaria). Animal Cognition, 13: 765 - 769.
Wilkinson, A., Kuenstner, K., Mueller, J., and Huber, L. (2010)b Social learning in a nonsocial reptile. Biology Letters, 6: 614 - 616.
Wilkinson, A. and Huber, L. (2012) Cold-blooded cognition: Reptilian Cognitive Abilities. In K.T. Shackelford and J. Vonk (eds). The Oxford Handbook of Comparative Evolutionary Psychology. Oxford library of Psychology. Chapter 8.
Wilkinson, A., Mueller-Paul, J. and Huber, L. (2013) Picture-object recognition in the tortoise Chelonoidis carbonaria. Animal Cognition, 16: 99 - 107.
Wotton, D.M. and Kelly, D. (2011) Do larger frugivores move seed further? Body size, seed dispersal distance, and a case study of a large, sedentary pigeon. Journal of Biogeography, 39: 1973 - 1983.
Wunderle Jr, J.M. (1997) The role of animal seed dispersal in accelerating forest regeneration on degraded tropical lands. Forest Ecology and Management, 99: 223 - 235.
Wyneken, J., Salmon, M. and Lohmann, K.J. (1990) Orientation by hatchling loggerhead sea turtles (Caretta caretta L.) in a wave tank. Journal of Experimental Marine Biology and Ecology, 139: 43 - 50.
Yarmolinsky, D.A., Zuker, C.S. and Ryba, N.J.P. (2009) Common sense about taste: from mammals to insects. Cell, 139: 234 - 244.
Yearsley, J.M., Villalba, J.J., Gordon, I.J., Kyriazakis, I., Speakman, J.R., Tolkamp, B.J., Illius, A.W. and Duncan, A.J. (2006) A theory of associating

246
food types with their postingestive consequences. American Naturalist, 167: 705 - 716.
Zhao, H., Zhou, Y., Pinto, C.M., Charles-Dominique, P.C., Galindo-González, J., Zhang, S. and Zhang, J. (2010) Evolution of sweet taste receptor gene Tas1r2 in bats. Molecular Biology and Evolution, 27: 2642 -2650.