ank sirna knockdown optimization, western assay, flow results kristen lee 5/4/2010
TRANSCRIPT
ANK siRNA knockdownOptimization, Western assay, Flow Results
Kristen Lee5/4/2010

ANK colocalizes to the primary cilia in MC3T3s (acetylated alpha tubulin)

ANK colocalizes to the basal body complex in MC3T3s (gamma tubulin)

ANK colocalizes to the primary cilia/basal body in MC3T3s (Transfected ANKH-3XFLAG)

siRNA Optimization
• 24 well plate1:1 ratio of Lipo2000:BLOCK-it Fluorescent Oligo was strongest (but I forgot to take BF pictures, no idea if cells were alive/dead)
• 100mm dish (checked live:dead ratio):
+a growth control (No Lipo2000, no siRNA)+a negative control (No Lipo2000, 600pmol siRNA) 1:1 ratio confirmed
600 pmol siRNA Fluor Control (no siRNA)
30uL Lipo2000 (recommended)
15uL Lipo 2000
5uL Lipo 2000

Optimization Procedure• Plated 200,000 cells/slide at Day 0 (I would adjust to 80,000-100,000 cells/slide
next time)
• Transfect siRNA 6 hours following cell adhesion to fibronectin-coated glass slides (1mL media)– Lipofectamine 2000 and siRNA complex formation in Reduced Serum OptiMEM (2ul in
100ul OptiMEM for each, then complex)– MC3T3s in supplemented alphaMEM growth media (but no antibiotics)
• Removal of transfection reagent after 6 hours– Incubate in MC3T3 supplemented alphaMEM growth media initially, ~few hours (no
antibiotics, 10mL)– Replace with MC3T3 supplemented alphaMEM growth media +P-S (10mL)
• (Wash with PBS 3-4 times if bacteria infection is suspected)
• Flow/cell lysis with RIPA buffer for Western assay blot at Day 1-Day 4 following transfection

30 uL Lipo 2000
15 uLLipo 2000
5 uL
600pmol_duplicate
-200,000 cells/slide
~40% confluency
Experimental Slides (4x)Day 0

15 uL
30 uL
5 uL
Control Slides (4x) Day 0No siRNA
No siRNA
No
Lipo
200
0
600pmol siRNA
No
Lipo
200
0
Growth Control
Reagent Control

Experimental Slides 48 hours
30 uL Lipo 2000
15 uL Lipo 2000
5 uL Lipo 2000
10x BF: 1/3s exposure 10x Fl: 4s exposure
All negative controls have this same (lack of) fluorescence

BLOCK-it Optimization Result
• 1:1 Lipofectamine 2000:BLOCK-it Oligo yields strongest uptake– 30 uL Lipo 2000+ 30uL(600pmol) siRNA in 100mL dishes
• The addition of 30 uL Lipofectamine 2000 slowed cell replication compared to lower levels and the negative control– Little difference between 15 uL and 5 uL in affecting cell growth and
Oligo uptake
• siRNA-mediated transfection was applied on cells and cultured for an additional Day 1-4– Protein lysates were collected for Western Blots

Western Blot optimization: Equal application of protein

• ANKH (54 kDA):• 15 sec exposure• 5% non-fat milk• 1:500 rabbit anti-ANKH IgG• 1:5000 goat anti-rabbit IgG
• Actin (42 kDA) :• 1 sec exposure• 5% BSA• 1:1,000 anti-actin Ig2A• 1:30,000 goat anti-mouse Ig
Ladd
er
WT
MC3
T3
WT
C3H
WT
IMCD
250 kDa
150 kDa
100 kDa
75 kDa
50 kDa
37 kDa
25 kDa
20 kDa
15 kDa10 kDa
DM
P1
prot
ein
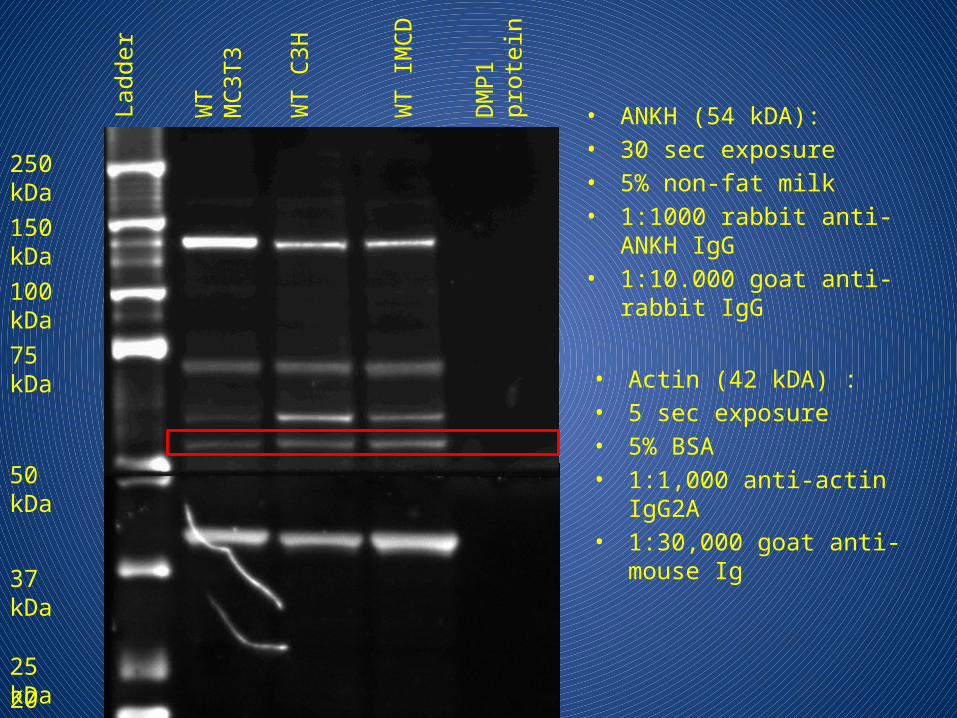
• ANKH (54 kDA):• 30 sec exposure• 5% non-fat milk• 1:1000 rabbit anti-ANKH IgG• 1:10.000 goat anti-rabbit IgG
• Actin (42 kDA) :• 5 sec exposure• 5% BSA• 1:1,000 anti-actin IgG2A• 1:30,000 goat anti-mouse Ig
Ladd
er
WT
MC3
T3
WT
C3H
WT
IMCD
250 kDa
150 kDa
100 kDa
75 kDa
50 kDa
37 kDa
25 kDa20 kDa
DM
P1
prot
ein

Western Blot for ANKH
• Used Day 1-4 post-transfection incubated cells
• For ANKH– 1:500 primary antibody– 1:5,000 secondary
Ponceau S ANK knockdown

Ladd
er
WT
MC3
T3
250 kDa
150 kDa
100 kDa
75 kDa
50 kDa
ANK
KD D
ay 1
ANK
KD D
ay 2
ANK
KD D
ay 3
ANK
KD D
ay 4
scra
mbl
e D
ay 1
scra
mbl
e D
ay 2
scra
mbl
e D
ay 3
scra
mbl
e D
ay 4
37 kDa• ANKH (54 kDA):• 30 sec exposure• 5% non-fat milk• 1:500 rabbit anti-ANKH IgG• 1:5,000 goat anti-rabbit IgG
• Actin (42 kDA):• 30 sec exposure• 5% BSA• 1:1,000 mouse anti-actin IgG2A• 1:10,000 goat anti-mouse Ig
25 kDa20 kDa

Ladd
er
WT
MC3
T3
250 kDa
150 kDa
100 kDa
75 kDa
50 kDa
ANK
KD D
ay 1
ANK
KD D
ay 2
ANK
KD D
ay 3
ANK
KD D
ay 4
scra
mbl
e D
ay 1
scra
mbl
e D
ay 2
scra
mbl
e D
ay 3
scra
mbl
e D
ay 4
• ANKH (54 kDA):• 60 sec exposure• 5% non-fat milk• 1:500 rabbit anti-ANKH IgG• 1:5,000 goat anti-rabbit IgG
• Actin (42 kDA):• 60 sec exposure• 5% BSA• 1:1,000 mouse anti-actin IgG2A• 1:10,000 goat anti-mouse Ig

Western blot result:
• SC antibody is crap• Try different antibody that has much better
data for ANKH detection, although it has a nonspecific band
Santa Cruz biotechnology