ankit sood
TRANSCRIPT

8/7/2019 ANKIT SOOD
http://slidepdf.com/reader/full/ankit-sood 1/15
ANNEXTURE
SECTION NO: V8001
COURSE NAME: M.B.A (TOURISM & HOSPITALITY)
STUDENTS ROLL NO: A-06(ANKIT SOOD)
TEACHERS NAME: Avinash Kaur
I HEARBY DECLARE THAT THIS PROJECT THAT IS BEING UNDERTAKEN BY ME IS
COMPLETELY WORKED UPON BY ME AND HAVNT BEEN COPIED FROM
ANYWERE EXCEPT FROM THE ACKNOLEDGMENT OF THE GENUINE SOURCES.
THIS PROJECT CAN BE EVALUATED BY ANYBODY WHENEVER WATED AND I
HAVE NO OBJECTION FOR THIS VERY ACT.
TOPIC: State Bank of India
TEACHERS SIGNATURE.
MARKS OBTAINED:
EVALUATERS COMMENTS:
SBI Introduction
8/7/2019 ANKIT SOOD
http://slidepdf.com/reader/full/ankit-sood 2/15
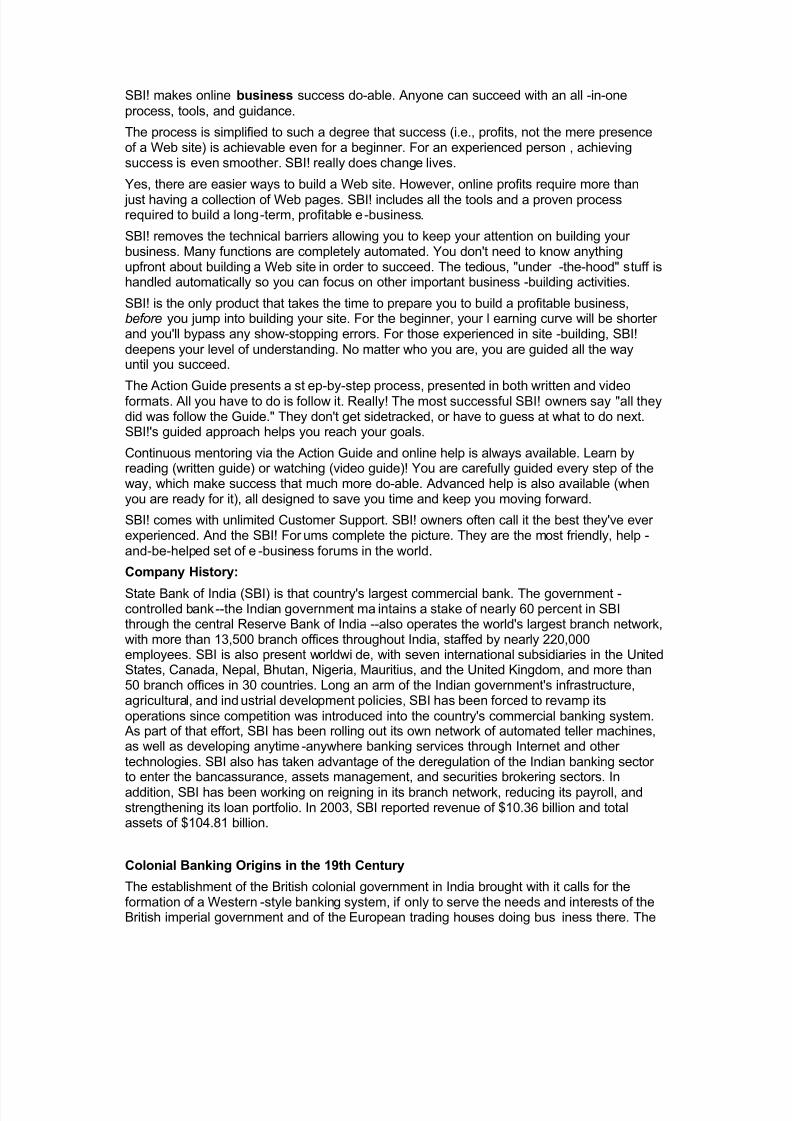
SBI! makes online business success do-able. Anyone can succeed with an all -in-oneprocess, tools, and guidance.
The process is simplified to such a degree that success (i.e., profits, not the mere presenceof a Web site) is achievable even for a beginner. For an experienced person , achievingsuccess is even smoother. SBI! really does change lives.
Yes, there are easier ways to build a Web site. However, online profits require more than
just having a collection of Web pages. SBI! includes all the tools and a proven processrequired to build a long-term, profitable e -business.
SBI! removes the technical barriers allowing you to keep your attention on building your business. Many functions are completely automated. You don't need to know anythingupfront about building a Web site in order to succeed. The tedious, "under -the-hood" stuff ishandled automatically so you can focus on other important business -building activities.
SBI! is the only product that takes the time to prepare you to build a profitable business,before you jump into building your site. For the beginner, your l earning curve will be shorter and you'll bypass any show-stopping errors. For those experienced in site -building, SBI!deepens your level of understanding. No matter who you are, you are guided all the wayuntil you succeed.
The Action Guide presents a st ep-by-step process, presented in both written and videoformats. All you have to do is follow it. Really! The most successful SBI! owners say "all theydid was follow the Guide." They don't get sidetracked, or have to guess at what to do next.SBI!'s guided approach helps you reach your goals.
Continuous mentoring via the Action Guide and online help is always available. Learn byreading (written guide) or watching (video guide)! You are carefully guided every step of theway, which make success that much more do-able. Advanced help is also available (whenyou are ready for it), all designed to save you time and keep you moving forward.
SBI! comes with unlimited Customer Support. SBI! owners often call it the best they've ever experienced. And the SBI! For ums complete the picture. They are the most friendly, help -and-be-helped set of e -business forums in the world.
Company History:
State Bank of India (SBI) is that country's largest commercial bank. The government -controlled bank--the Indian government ma intains a stake of nearly 60 percent in SBIthrough the central Reserve Bank of India --also operates the world's largest branch network,with more than 13,500 branch offices throughout India, staffed by nearly 220,000employees. SBI is also present worldwi de, with seven international subsidiaries in the UnitedStates, Canada, Nepal, Bhutan, Nigeria, Mauritius, and the United Kingdom, and more than50 branch offices in 30 countries. Long an arm of the Indian government's infrastructure,agricultural, and ind ustrial development policies, SBI has been forced to revamp itsoperations since competition was introduced into the country's commercial banking system.As part of that effort, SBI has been rolling out its own network of automated teller machines,as well as developing anytime -anywhere banking services through Internet and other technologies. SBI also has taken advantage of the deregulation of the Indian banking sector to enter the bancassurance, assets management, and securities brokering sectors. Inaddition, SBI has been working on reigning in its branch network, reducing its payroll, andstrengthening its loan portfolio. In 2003, SBI reported revenue of $10.36 billion and totalassets of $104.81 billion.
Colonial Banking Origins in the 19th Century
The establishment of the British colonial government in India brought with it calls for theformation of a Western -style banking system, if only to serve the needs and interests of theBritish imperial government and of the European trading houses doing bus iness there. The
8/7/2019 ANKIT SOOD
http://slidepdf.com/reader/full/ankit-sood 3/15
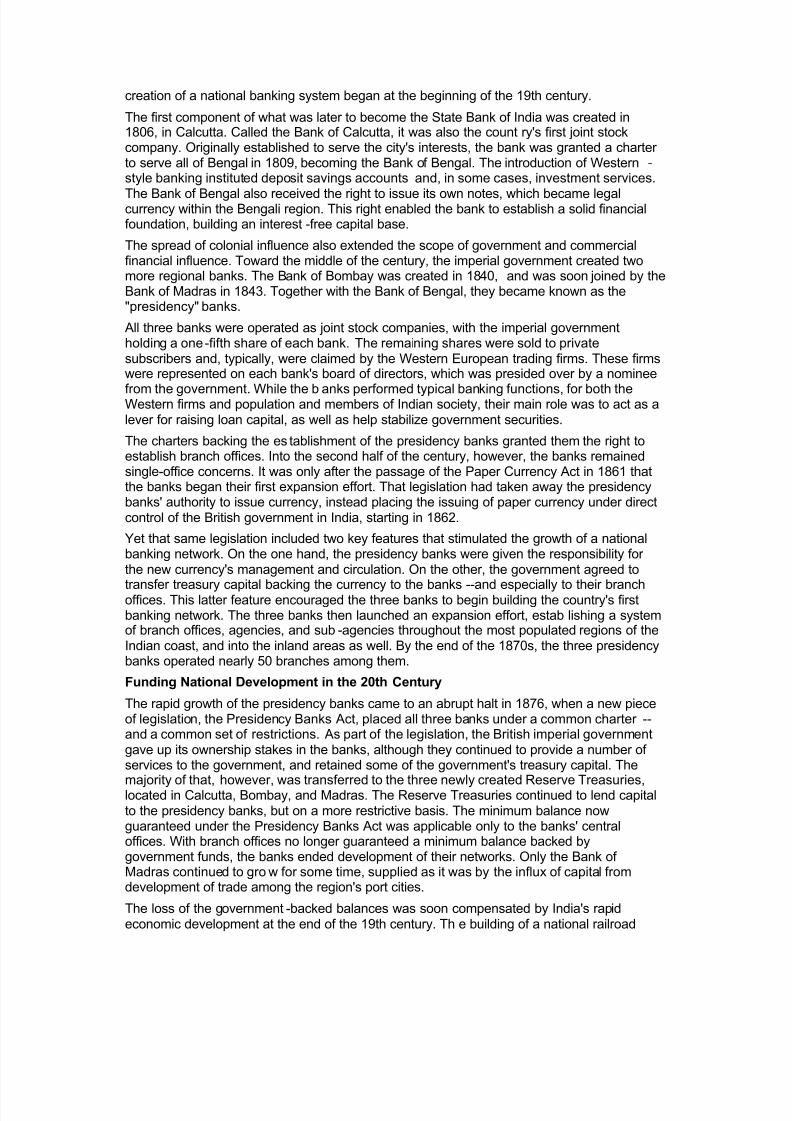
creation of a national banking system began at the beginning of the 19th century.
The first component of what was later to become the State Bank of India was created in1806, in Calcutta. Called the Bank of Calcutta, it was also the count ry's first joint stockcompany. Originally established to serve the city's interests, the bank was granted a charter to serve all of Bengal in 1809, becoming the Bank of Bengal. The introduction of Western -style banking instituted deposit savings accounts and, in some cases, investment services.
The Bank of Bengal also received the right to issue its own notes, which became legalcurrency within the Bengali region. This right enabled the bank to establish a solid financialfoundation, building an interest -free capital base.
The spread of colonial influence also extended the scope of government and commercialfinancial influence. Toward the middle of the century, the imperial government created twomore regional banks. The Bank of Bombay was created in 1840, and was soon joined by theBank of Madras in 1843. Together with the Bank of Bengal, they became known as the"presidency" banks.
All three banks were operated as joint stock companies, with the imperial governmentholding a one-fifth share of each bank. The remaining shares were sold to privatesubscribers and, typically, were claimed by the Western European trading firms. These firmswere represented on each bank's board of directors, which was presided over by a nominee
from the government. While the b anks performed typical banking functions, for both theWestern firms and population and members of Indian society, their main role was to act as alever for raising loan capital, as well as help stabilize government securities.
The charters backing the es tablishment of the presidency banks granted them the right toestablish branch offices. Into the second half of the century, however, the banks remainedsingle-office concerns. It was only after the passage of the Paper Currency Act in 1861 thatthe banks began their first expansion effort. That legislation had taken away the presidencybanks' authority to issue currency, instead placing the issuing of paper currency under directcontrol of the British government in India, starting in 1862.
Yet that same legislation included two key features that stimulated the growth of a nationalbanking network. On the one hand, the presidency banks were given the responsibility for the new currency's management and circulation. On the other, the government agreed to
transfer treasury capital backing the currency to the banks --and especially to their branchoffices. This latter feature encouraged the three banks to begin building the country's firstbanking network. The three banks then launched an expansion effort, estab lishing a systemof branch offices, agencies, and sub -agencies throughout the most populated regions of theIndian coast, and into the inland areas as well. By the end of the 1870s, the three presidencybanks operated nearly 50 branches among them.
Funding National Development in the 20th Century
The rapid growth of the presidency banks came to an abrupt halt in 1876, when a new pieceof legislation, the Presidency Banks Act, placed all three banks under a common charter --and a common set of restrictions. As part of the legislation, the British imperial governmentgave up its ownership stakes in the banks, although they continued to provide a number of services to the government, and retained some of the government's treasury capital. The
majority of that, however, was transferred to the three newly created Reserve Treasuries,located in Calcutta, Bombay, and Madras. The Reserve Treasuries continued to lend capitalto the presidency banks, but on a more restrictive basis. The minimum balance nowguaranteed under the Presidency Banks Act was applicable only to the banks' centraloffices. With branch offices no longer guaranteed a minimum balance backed bygovernment funds, the banks ended development of their networks. Only the Bank of Madras continued to gro w for some time, supplied as it was by the influx of capital fromdevelopment of trade among the region's port cities.
The loss of the government -backed balances was soon compensated by India's rapideconomic development at the end of the 19th century. Th e building of a national railroad

8/7/2019 ANKIT SOOD
http://slidepdf.com/reader/full/ankit-sood 4/15
network launched the country into a new era, seeing the rise of cash -crop farming, a miningindustry, and widespread industrial development. The three presidency banks took activeroles in financing this development. The b anks also extended their range of services andoperations, although for the time being were excluded from the foreign exchange market.
By the beginning of the 20th century, India's banking industry boasted a host of new arrivals,and particularly foreign banks authorized to exchange currency. The growth of the banking
sector, and the development of indigenous banks, in turn created a need for a larger "bankers' bank." At the same time, the Indian government had outgrown its colonialbackground and now requ ired a more centralized banking institution. These factors led to thedecision to merge the three presidency banks into a new, single and centralized bankinginstitution, the Imperial Bank of India.
Created in 1921, the Imperial Bank of India appeared to inaugurate a new era in India'shistory--culminating in its declaration of independence from the British Empire. The ImperialBank took on the role of central bank for the Indian government, while acting as a bankers'bank for the growing Indian banking se ctor. At the same time, the Imperial Bank, which,despite its role in the government financial structure remained independent of thegovernment, carried on its own commercial banking operations.
In 1926, a government commission recommended the creation of a true central bank. While
some proposed converting the Imperial Bank into a central banking organization for thecountry, the commission rejected this idea and instead recommended that the Imperial Bankbe transformed into a purely commercial banking ins titution. The government took up thecommission's recommendations, drafting a new bill in 1927. Passage of the new legislationdid not occur until 1935, however, with the creation of the Reserve Bank of India. That banktook over all central banking functi ons.
The Imperial Bank then converted to full commercial status, which accordingly allowed it toenter a number of banking areas, such as currency exchange and trustee and estatemanagement, from which it had previously been restricted. Despite the loss o f its role as agovernment banking office, the Imperial Bank continued to provide banking services to theReserve Bank, particularly in areas where the Reserve Bank had not yet established offices.At the same time, the Imperial Bank retained its position as a bankers' bank.
Into the early 1950s, the Imperial Bank grew steadily, dominating the Indian commercialbanking industry. The bank continued to build up its assets and capital base, and alsoentered a new phase of national expansion. By the middle of the 1950s, the Imperial Bankoperated more than 170 branch offices, as well as 200 sub -offices. Yet the bank, like most of the colonial government, focused primarily on the country's urban regions.
By then, India had achieved its independence from Britain . In 1951, the new governmentlaunched its first Five Year Plan, targeting in particular the development of the country's ruralareas. The lack of a banking infrastructure in these regions led the government to develop astate-owned banking entity to fill the gap. As part of that process, the Imperial Bank wasnationalized and then integrated with other existing government -owned bankingcomponents. The result was the creation of the State Bank of India, or SBI, in 1955.
The new state-owned bank now control led more than one-fourth of India's total banking
industry. That position was expanded at the end of the decade, when new legislation waspassed providing for the takeover by the State Bank of eight regionally based, government -controlled banks. As such the Banks of Bikaner, Jaipur, Idnore, Mysore, Patiala, Hyderabad,Saurashtra, and Travancore became subsidiaries of the State Bank. Following the 1963merger of the Bikaner and Jaipur banks, their seven remaining subsidiaries were convertedinto associate banks.
In the early 1960s, the State Bank's network already contained nearly 500 branches andsub-offices, as well as the three original head offices inherited from the presidency bank era.Yet the State Bank now began an era of expansion, acting as a motor for India's industrialand agricultural development, that was to transform it into one of the world's largest financial
8/7/2019 ANKIT SOOD
http://slidepdf.com/reader/full/ankit-sood 5/15
networks. Indeed, by the early 1990s, the State Bank counted nearly 15,000 branches andoffices throughout India, giving it the world's single largest branch network.
SBI played an extremely important role in developing India's rural regions, providing thefinancing needed to modernize the country's agricultural industry and develop new irrigationmethods and cattle breeding techniques, and backing the creation of dairy farming, as wellas pork and poultry industries. The bank also provided backing for the development of the
country's infrastructure, particularly on a local level, where it provided credit coverage anddevelopment assistance to villages. The nationalization of the banking sector itself, an eventthat occurred in 1969 under the government led by Indira Gandhi, gave SBI new prominenceas the country's leading bank.
Even as it played a primary role in the Indian government's industrial and agriculturaldevelopment policies, SBI continued to develop its commercial banking operations. In 1972,for example, the bank began offering merchant banking services. By the mid -1980s, thebank's merchant banking operations had grown sufficiently to support the creation of adedicated subsidiary, SBI Capital Markets, in 1986. The following year, the companylaunched another subsidiary, SBI Home Finance, in a collaboration with the H ousingDevelopment Finance Corporation. Then in the early 1990s, SBI added subsidiaries SBIFactors and Commercial Services, and then launched institutional investor services.
Competitor in the 21st Century SBI was allowed to dominate the Indian banking sector for more than two decades. In theearly 1990s, the Indian government kicked off a series of reforms aimed at deregulating thebanking and financial industries. SBI was now forced to brace itself for the arrival of a newwave of competitors eager to enter the fast -growing Indian economy's commercial bankingsector. Yet years as a government -run institution had left SBI bloated --the civil-servantstatus of its employees had encouraged its payroll to swell to more than 230,000. Thebureaucratic nature o f the bank's management left little room for personal initiative, nor incentive for controlling costs.
The bank also had been encouraged to increase its branch network, with little concern for profitability. As former Chairman Dipankar Baku told the Bank er in the early 1990s: "In theaftermath of bank nationalisation everyone lost sight of the fact that banks had to be
profitable. Banking was more to do with social policy and perhaps that was relevant at thetime. For the last two decades the emphasis was on physical expansion."
Under Baku, SBI began retooling for the new competitive environment. In 1994, the bankhired consulting group McKinsey & Co. to help it restructure its operations. McKinsey thenled SBI through a massive restructuring effort that l asted through much of the decade andinto the beginning of the next, an effort that helped SBI develop a new corporate culturefocused more on profitability than on social and political policy. SBI also stepped up itsinternational trade operations, such a s foreign exchange trading, as well as corporatefinance, export credit, and international banking.
SBI had long been present overseas, operating some 50 offices in 34 countries, includingfull-fledged subsidiaries in the United Kingdom, the United States , and elsewhere. In 1995the bank set up a new subsidiary, SBI Commercial and International Bank Ltd., to back its
corporate and international banking services. The bank also extended its internationalnetwork into new markets such as Russia, China, and So uth Africa.
Back home, in the meantime, SBI began addressing the technology gap that existedbetween it and its foreign -backed competitors. Into the 1990s, SBI had yet to establish anautomated teller network; indeed, it had not even automated its informa tion systems. SBIresponded by launching an ambitious technology drive, rolling out its own ATM network,then teaming up with GE Capital to issue its own credit card. In the early 2000s, the bankbegan cross-linking its banking network with its ATM network and Internet and telephoneaccess, rolling out "anytime, anywhere" banking access. By 2002, the bank had succeededin networking its 3,000 most profitable branches.
8/7/2019 ANKIT SOOD
http://slidepdf.com/reader/full/ankit-sood 6/15
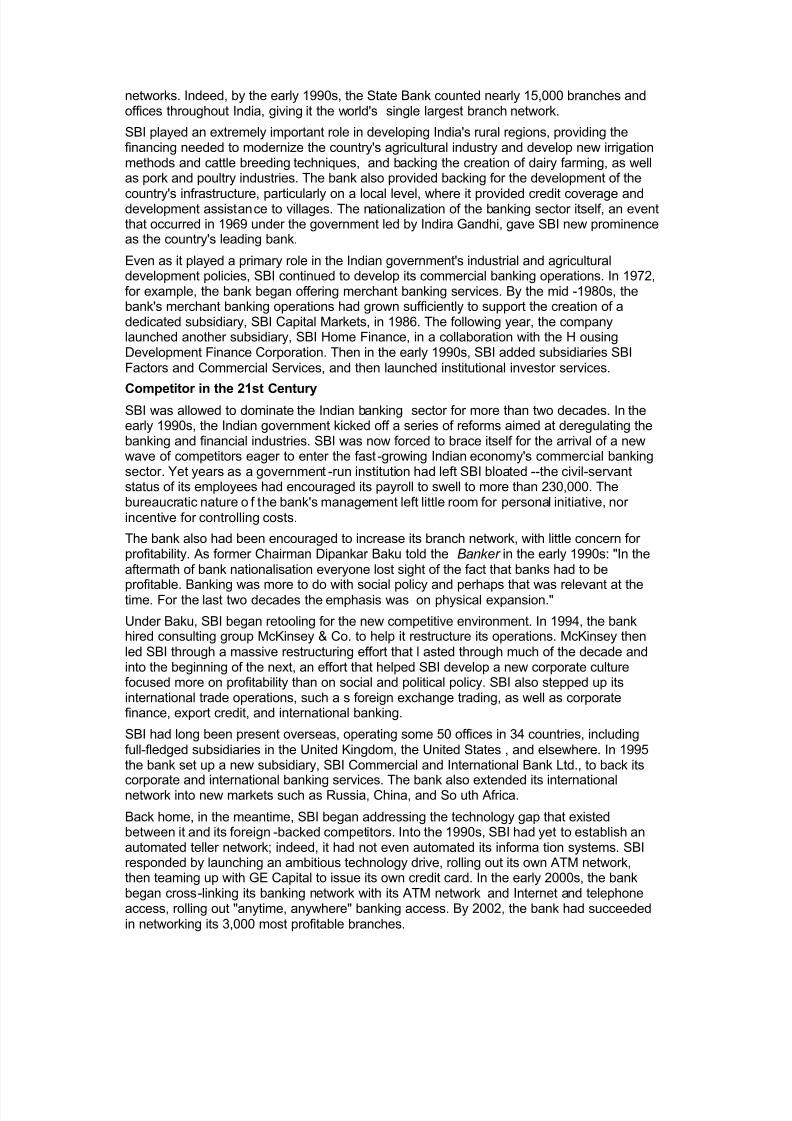
The implementation of new technology helped the bank achieve strong profit gains into theearly years of the new century. SBI also adopted new human resources and retirementpolicies, helping trim its payroll by some 20,000, almost entirely through voluntary retirementin a country where joblessness remained a decided problem.
By the beginning of 2004, SBI appeared to be well on its way to meeting the challengesoffered by the deregulated Indian banking sector. In a twist, the bank had become an
aggressor into new territories, launching its own line of bancassurance products, and alsoinitiating securities brokering services. In the meantime, SBI continued its technology rollout,boosting the number of networked branches to more than 4,000 at the end of 2003. SBIpromised to remain a central figure in the Indian banking sector as it entered its thirdcentury.
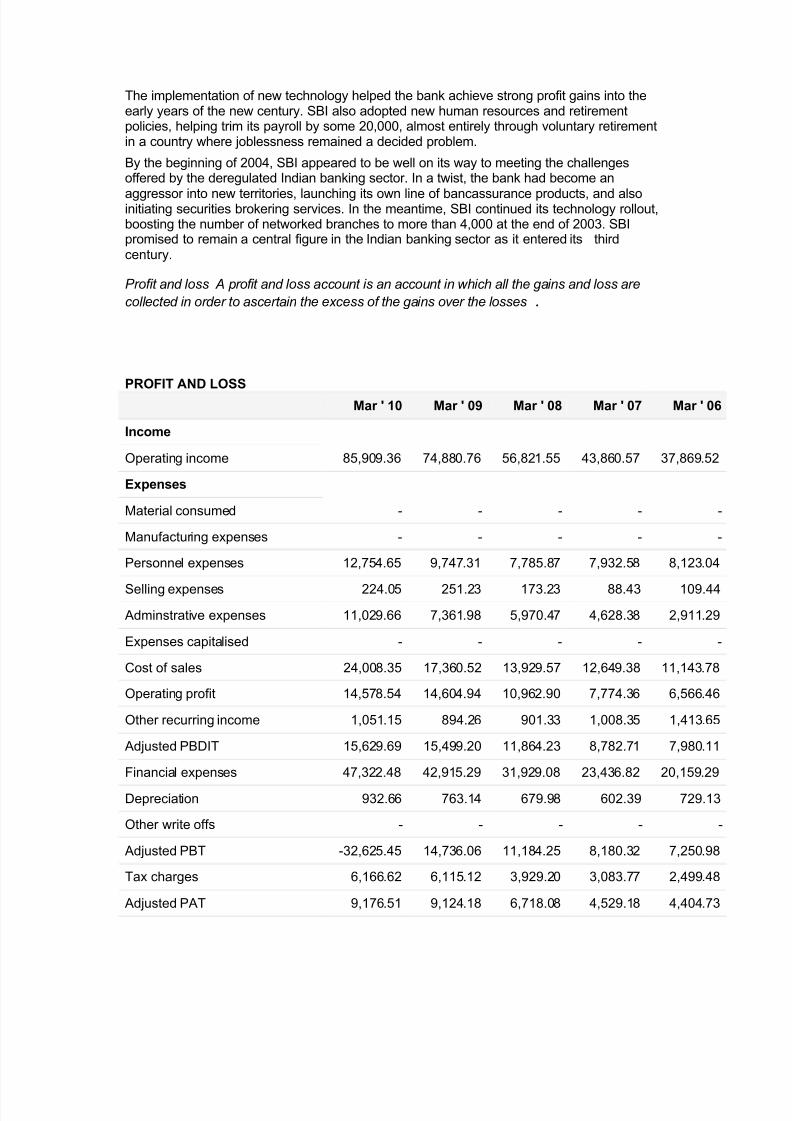
P rofit and l oss A profit and l oss acc ount is an acc ount i n whi ch all t he gai ns and l oss are
c oll ec ted i n or d er to asc ert ai n t he ex c ess of t he gai ns over t he l osses .
PROFIT AND LOSS
Mar ' 10 Mar ' 09 Mar ' 08 Mar ' 07 Mar ' 06
Income
Operating income 85,909.36 74,880.76 56,821.55 43,860.57 37,869.52
Expenses
Material consumed - - - - -
Manufacturing expenses - - - - -
Personnel expenses 12,754.65 9,747.31 7,785.87 7,932.58 8,123.04
Selling expenses 224.05 251.23 173.23 88.43 109.44
Adminstrative expenses 11,029.66 7,361.98 5,970.47 4,628.38 2,911.29
Expenses capitalised - - - - -
Cost of sales 24,008.35 17,360.52 13,929.57 12,649.38 11,143.78
Operating profit 14,578.54 14,604.94 10,962.90 7,774.36 6,566.46
Other recurring income 1,051.15 894.26 901.33 1,008.35 1,413.65
Adjusted PBDIT 15,629.69 15,499.20 11,864.23 8,782.71 7,980.11
Financial expenses 47,322.48 42,915.29 31,929.08 23,436.82 20,159.29
Depreciation 932.66 763.14 679.98 602.39 729.13
Other write offs - - - - -
Adjusted PBT -32,625.45 14,736.06 11,184.25 8,180.32 7,250.98
Tax charges 6,166.62 6,115.12 3,929.20 3,083.77 2,499.48
Adjusted PAT 9,176.51 9,124.18 6,718.08 4,529.18 4,404.73
8/7/2019 ANKIT SOOD
http://slidepdf.com/reader/full/ankit-sood 7/15
Mar ' 10 Mar ' 09 Mar ' 08 Mar ' 07 Mar ' 06
Non recurring items -10.46 -2.95 11.04 12.13 1.94
Other non cash adjustments - - - - -
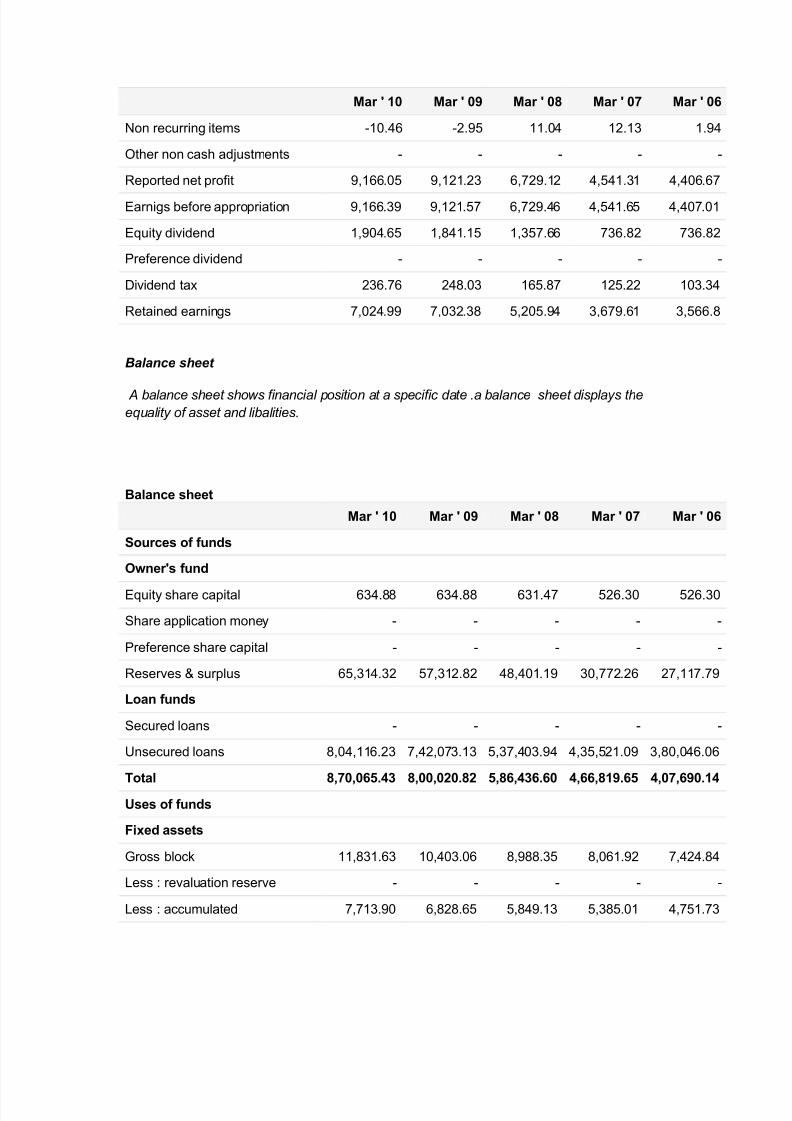
Reported net profit 9,166.05 9,121.23 6,729.12 4,541.31 4,406.67
Earnigs before appropriation 9,166.39 9,121.57 6,729.46 4,541.65 4,407.01
Equity dividend 1,904.65 1,841.15 1,357.66 736.82 736.82
Preference dividend - - - - -
Dividend tax 236.76 248.03 165.87 125.22 103.34
Retained earnings 7,024.99 7,032.38 5,205.94 3,679.61 3,566.8
Balance sheet
A balanc e sheet show s fi nanc i al position at a spec ifi c date .a balanc e sheet d isplay s t he equal it y of asset and l ibal ities.
Balance sheet
Mar ' 10 Mar ' 09 Mar ' 08 Mar ' 07 Mar ' 06
Sources of funds
Owner's fund
Equity share capital 634.88 634.88 631.47 526.30 526.30
Share application money - - - - -
Preference share capital - - - - -
Reserves & surplus 65,314.32 57,312.82 48,401.19 30,772.26 27,117.79
Loan funds
Secured loans - - - - -
Unsecured loans 8,04,116.23 7,42,073.13 5,37,403.94 4,35,521.09 3,80,046.06
Total 8,70,065.43 8,00,020.82 5,86,436.60 4,66,819.65 4,07,690.14
Uses of funds
Fixed assets
Gross block 11,831.63 10,403.06 8,988.35 8,061.92 7,424.84
Less : revaluation reserve - - - - -
Less : accumulated 7,713.90 6,828.65 5,849.13 5,385.01 4,751.73
8/7/2019 ANKIT SOOD
http://slidepdf.com/reader/full/ankit-sood 8/15
Mar ' 10 Mar ' 09 Mar ' 08 Mar ' 07 Mar ' 06
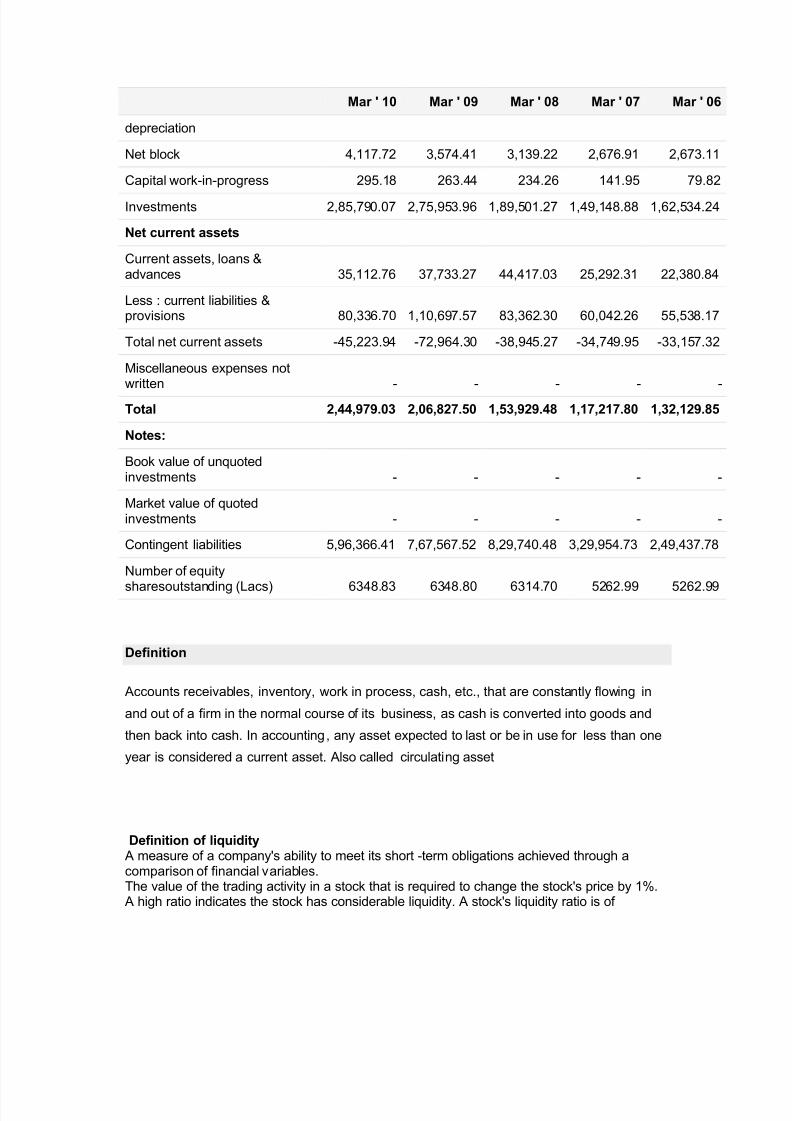
depreciation
Net block 4,117.72 3,574.41 3,139.22 2,676.91 2,673.11
Capital work-in-progress 295.18 263.44 234.26 141.95 79.82
Investments 2,85,790.07 2,75,953.96 1,89,501.27 1,49,148.88 1,62,534.24
Net current assets
Current assets, loans &advances 35,112.76 37,733.27 44,417.03 25,292.31 22,380.84
Less : current liabilities &provisions 80,336.70 1,10,697.57 83,362.30 60,042.26 55,538.17
Total net current assets -45,223.94 -72,964.30 -38,945.27 -34,749.95 -33,157.32
Miscellaneous expenses notwritten - - - - -
Total 2,44,979.03 2,06,827.50 1,53,929.48 1,17,217.80 1,32,129.85
Notes:
Book value of unquotedinvestments - - - - -
Market value of quotedinvestments - - - - -
Contingent liabilities 5,96,366.41 7,67,567.52 8,29,740.48 3,29,954.73 2,49,437.78
Number of equity
sharesoutstanding (Lacs) 6348.83 6348.80 6314.70 5262.99 5262.99
Definition
Accounts receivables, inventory, work in process, cash, etc., that are constantly flowing in
and out of a firm in the normal course of its business, as cash is converted into goods and
then back into cash. In accounting, any asset expected to last or be in use for less than one
year is considered a current asset. Also called circulating asset
Definition of liquidityA measure of a company's ability to meet its short -term obligations achieved through acomparison of financial variables.The value of the trading activity in a stock that is required to change the stock's price by 1%.A high ratio indicates the stock has considerable liquidity. A stock's liquidity ratio is of
8/7/2019 ANKIT SOOD
http://slidepdf.com/reader/full/ankit-sood 9/15
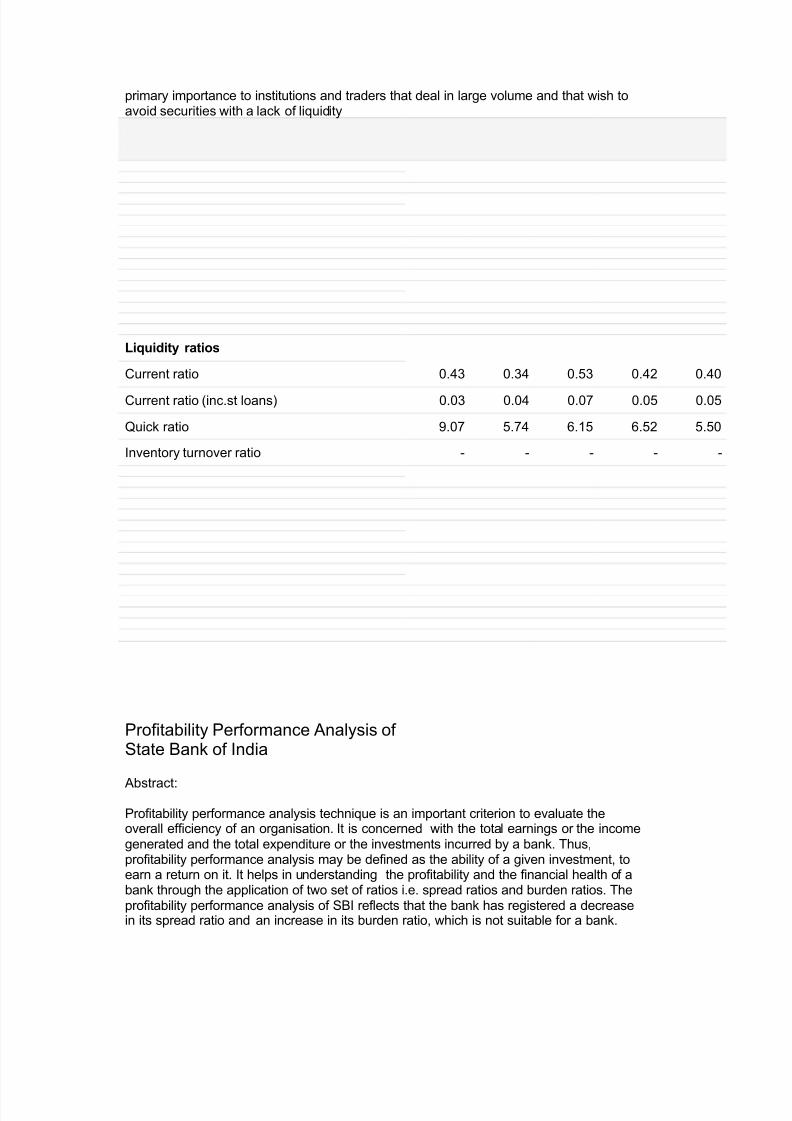
primary importance to institutions and traders that deal in large volume and that wish toavoid securities with a lack of liquidity
Liquidity ratios
Current ratio 0.43 0.34 0.53 0.42 0.40
Current ratio (inc.st loans) 0.03 0.04 0.07 0.05 0.05
Quick ratio 9.07 5.74 6.15 6.52 5.50
Inventory turnover ratio - - - - -
Profitability Performance Analysis of State Bank of India
Abstract:
Profitability performance analysis technique is an important criterion to evaluate theoverall efficiency of an organisation. It is concerned with the total earnings or the incomegenerated and the total expenditure or the investments incurred by a bank. Thus,profitability performance analysis may be defined as the ability of a given investment, toearn a return on it. It helps in understanding the profitability and the financial health of abank through the application of two set of ratios i.e. spread ratios and burden ratios. Theprofitability performance analysis of SBI reflects that the bank has registered a decreasein its spread ratio and an increase in its burden ratio, which is not suitable for a bank.
8/7/2019 ANKIT SOOD
http://slidepdf.com/reader/full/ankit-sood 10/15
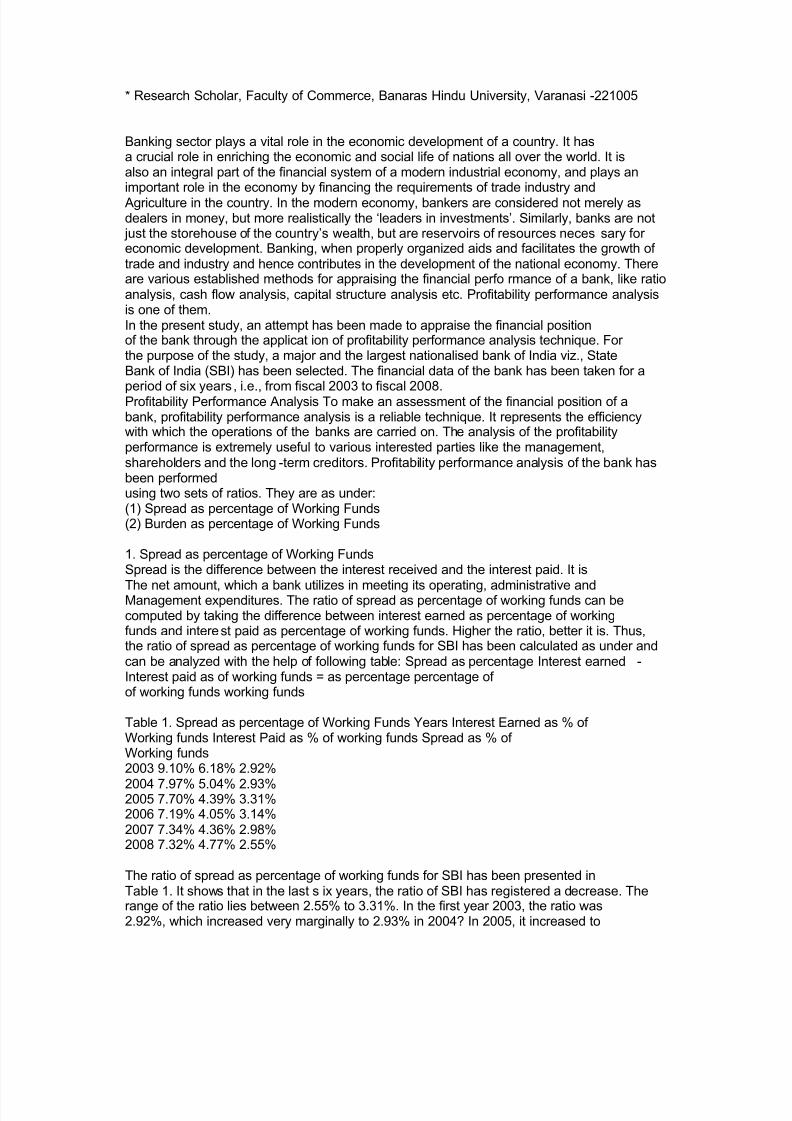
* Research Scholar, Faculty of Commerce, Banaras Hindu University, Varanasi -221005
Banking sector plays a vital role in the economic development of a country. It hasa crucial role in enriching the economic and social life of nations all over the world. It isalso an integral part of the financial system of a modern industrial economy, and plays animportant role in the economy by financing the requirements of trade industry andAgriculture in the country. In the modern economy, bankers are considered not merely asdealers in money, but more realistically the µleaders in investments¶. Similarly, banks are notjust the storehouse of the country¶s wealth, but are reservoirs of resources neces sary for economic development. Banking, when properly organized aids and facilitates the growth of trade and industry and hence contributes in the development of the national economy. Thereare various established methods for appraising the financial perfo rmance of a bank, like ratioanalysis, cash flow analysis, capital structure analysis etc. Profitability performance analysisis one of them.In the present study, an attempt has been made to appraise the financial positionof the bank through the applicat ion of profitability performance analysis technique. For the purpose of the study, a major and the largest nationalised bank of India viz., StateBank of India (SBI) has been selected. The financial data of the bank has been taken for a
period of six years , i.e., from fiscal 2003 to fiscal 2008.Profitability Performance Analysis To make an assessment of the financial position of abank, profitability performance analysis is a reliable technique. It represents the efficiencywith which the operations of the banks are carried on. The analysis of the profitabilityperformance is extremely useful to various interested parties like the management,shareholders and the long -term creditors. Profitability performance analysis of the bank hasbeen performedusing two sets of ratios. They are as under:(1) Spread as percentage of Working Funds(2) Burden as percentage of Working Funds
1. Spread as percentage of Working FundsSpread is the difference between the interest received and the interest paid. It is
The net amount, which a bank utilizes in meeting its operating, administrative andManagement expenditures. The ratio of spread as percentage of working funds can becomputed by taking the difference between interest earned as percentage of workingfunds and interest paid as percentage of working funds. Higher the ratio, better it is. Thus,the ratio of spread as percentage of working funds for SBI has been calculated as under andcan be analyzed with the help of following table: Spread as percentage Interest earned -Interest paid as of working funds = as percentage percentage of of working funds working funds
Table 1. Spread as percentage of Working Funds Years Interest Earned as % of Working funds Interest Paid as % of working funds Spread as % of Working funds2003 9.10% 6.18% 2.92%
2004 7.97% 5.04% 2.93%2005 7.70% 4.39% 3.31%2006 7.19% 4.05% 3.14%2007 7.34% 4.36% 2.98%2008 7.32% 4.77% 2.55%
The ratio of spread as percentage of working funds for SBI has been presented inTable 1. It shows that in the last s ix years, the ratio of SBI has registered a decrease. Therange of the ratio lies between 2.55% to 3.31%. In the first year 2003, the ratio was2.92%, which increased very marginally to 2.93% in 2004? In 2005, it increased to
8/7/2019 ANKIT SOOD
http://slidepdf.com/reader/full/ankit-sood 11/15
3.31%. But after that it start ed declining. In 2006, the ratio decreased to 3.14%, whereas in2007 it decreased to 2.98%. In the last year 2008, it came down to 2.55%. Therefore, in thelast six years, the ratio has decreased from 2.92% to 2.55%, recording an overall decreaseof 0.37%. It shows that an increase has been observed in the first three years only, whereasa consistent decrease has been observed in the last three years. It indicates that theperformance of SBI in terms of spread ratio has been deteriorated. Statistical analys is showsthat the average ratio of spread as percentage of working funds for SBI is 2.97%, with a S.D.and dispersion (C.V.) of 0.23 and 7.74% respectively indicating a high consistency in theratio.
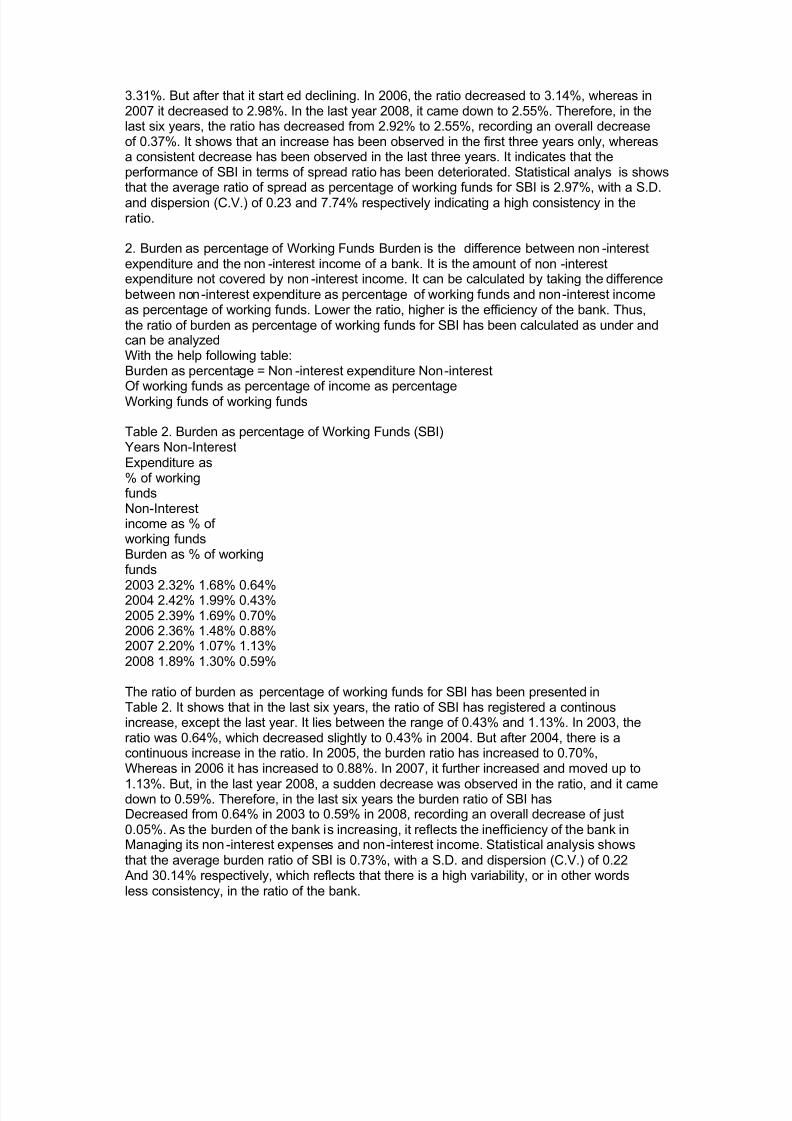
2. Burden as percentage of Working Funds Burden is the difference between non -interestexpenditure and the non -interest income of a bank. It is the amount of non -interestexpenditure not covered by non -interest income. It can be calculated by taking the differencebetween non-interest expenditure as percentage of working funds and non-interest incomeas percentage of working funds. Lower the ratio, higher is the efficiency of the bank. Thus,the ratio of burden as percentage of working funds for SBI has been calculated as under andcan be analyzedWith the help following table:Burden as percentage = Non -interest expenditure Non-interest
Of working funds as percentage of income as percentageWorking funds of working funds
Table 2. Burden as percentage of Working Funds (SBI)Years Non-InterestExpenditure as% of workingfundsNon-Interestincome as % of working fundsBurden as % of workingfunds
2003 2.32% 1.68% 0.64%2004 2.42% 1.99% 0.43%2005 2.39% 1.69% 0.70%2006 2.36% 1.48% 0.88%2007 2.20% 1.07% 1.13%2008 1.89% 1.30% 0.59%
The ratio of burden as percentage of working funds for SBI has been presented inTable 2. It shows that in the last six years, the ratio of SBI has registered a continousincrease, except the last year. It lies between the range of 0.43% and 1.13%. In 2003, theratio was 0.64%, which decreased slightly to 0.43% in 2004. But after 2004, there is acontinuous increase in the ratio. In 2005, the burden ratio has increased to 0.70%,Whereas in 2006 it has increased to 0.88%. In 2007, it further increased and moved up to
1.13%. But, in the last year 2008, a sudden decrease was observed in the ratio, and it camedown to 0.59%. Therefore, in the last six years the burden ratio of SBI hasDecreased from 0.64% in 2003 to 0.59% in 2008, recording an overall decrease of just0.05%. As the burden of the bank is increasing, it reflects the inefficiency of the bank inManaging its non -interest expenses and non-interest income. Statistical analysis showsthat the average burden ratio of SBI is 0.73%, with a S.D. and dispersion (C.V.) of 0.22And 30.14% respectively, which reflects that there is a high variability, or in other wordsless consistency, in the ratio of the bank.
8/7/2019 ANKIT SOOD
http://slidepdf.com/reader/full/ankit-sood 12/15
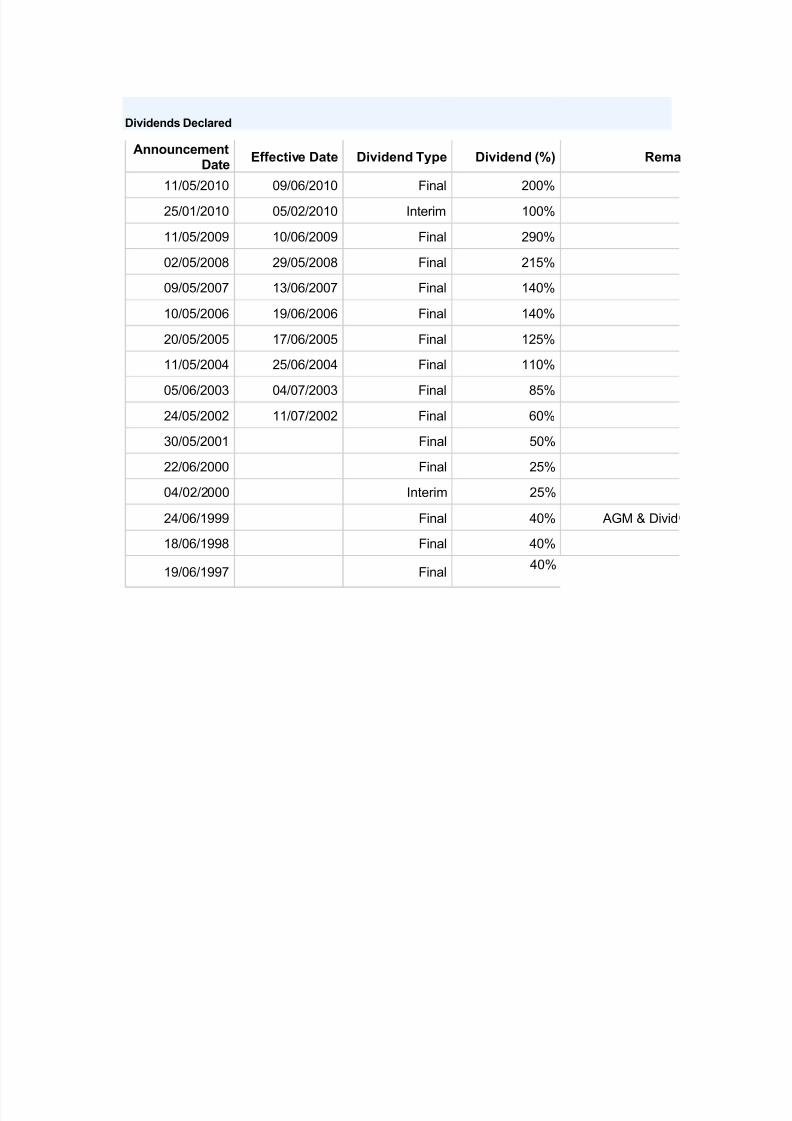
Dividends Declared
AnnouncementDate
Effective Date Dividend Type Dividend (%) Rema
11/05/2010 09/06/2010 Final 200%
25/01/2010 05/02/2010 Interim 100%
11/05/2009 10/06/2009 Final 290%
02/05/2008 29/05/2008 Final 215%
09/05/2007 13/06/2007 Final 140%
10/05/2006 19/06/2006 Final 140%
20/05/2005 17/06/2005 Final 125%
11/05/2004 25/06/2004 Final 110%
05/06/2003 04/07/2003 Final 85%
24/05/2002 11/07/2002 Final 60%
30/05/2001 Final 50%
22/06/2000 Final 25%
04/02/2000 Interim 25%
24/06/1999 Final 40% AGM & Divid
18/06/1998 Final 40%
19/06/1997 Final40%

8/7/2019 ANKIT SOOD
http://slidepdf.com/reader/full/ankit-sood 13/15
Annual Reports of SBI
TABLE: 1Statement of Working Capital (SBI Factors Ltd) (Amount in Crs)Items 1991- 1992- 1993- 1994- 1995- 1996- 1997- 1998- 1999- 2000-92 93 94 95 96 97 98 99 00 01
Currentassetssundry Debt 5.69 31.88 28.15 64.09 91.43 92.92 117.17 132.3 137.7 133.14ors (19.7) (93.) (75.02) (99.47) (96.06) (98.77) (8.95) (99) (98.58) (97.30)Loans and 3.34 2.00 4.09 0.11 0.70 0.51 0.82 0.81 1.36 3.05Advances (11.6) (5.89) (10.09) (0.17) (0.73) (0.54) (0.69) (.60) (0.97) (2.22)Cash&bank 1.7 .05 5.22 0.11 3.05 0.64 0.42 0.64 0.62 0.64balances (5.90) (0.14) (13.91) (0.17) (3.20) (0.68) (0.35) (0.47) (0.44) (0.46)Other curre 18.04 0.06 0.12nt assets (62.70) (0.15) (0.18)Total 28.77 33.93 37.52 64.43 95.18 94.07 118.41 133.8 139.69 136.83CurrentliabilitiesAmount due 1.80 10.69 14.36 27.85 49.41 34.49 46.54 43.02 42.77 42.36
for debts (80.40) (98.50) (89.58) (92.83) (95.62) (93.16) (99.72) (95.4) (99.23) (99.55)purchasedSundry 0.27 0.03 0.15 0.15 0.10 0.19 0.08 0.15 0.32 0.12creditors (11.73) (0.27) (0.93) (0.50) (0.19) (0.51) (0.17) (0.74) (0.28)Other 0.16 0.13 0.14 0.05 0.30 0.13 0.05 0.03 0.01 0.07liabilities (6.95) (1.19) (0.87) (0.16) (0.58) (0.35) (0.10) (.06) (0.02) (0.16)Provisions 0.09 1.38 1.95 1.86 2.21 1.87(0.82) (8.60) (6.50) (3.59) (5.96) (4.1)Total 2.27 10.8 16.03 30 51.67 37.02 46.67 45.07 43.10 42.55current (100) (100) (100) (100) (100) (100) (100) (100) (100) (100)liabilitiesNetWorking 26.47 23.08 21.49 34.43 43.51 57.05 71.74 45.07 96.59 94.28capital
S our c e: Annual Reports of SBI Factors Ltd.be concluded that the sundry debtorsand amount due to creditors are threemajor components of current assetsand current liabilities respectively indetermining the size of working capital.The working capital ratio of canbank factors is higher then SBI factors.It implies that the ability of thecanbank factors to settle the liabilitiesis higher then SBI factors. The Acidtest ratio of Canbank Factors is higher then SBI Factors. Thus it indicates thatthe higher liquidity is maintained in
canbank factors than SBI factors. Theworking capital turnover of SBI factorsis higher then canbank factors.Thus it indicates that, to generate thesale of one rupee lesser amount is requiredin canbank factors then SBI fac-TABLE: 2Statement of Working Capital (CAN BANK FACTORS LTD.) (Amount in Crs)Items 1991- 1992- 1993- 1994- 1995- 1996- 1997- 1998- 1999- 2000-
92 93 94 95 96 97 98 99 00 01
8/7/2019 ANKIT SOOD
http://slidepdf.com/reader/full/ankit-sood 14/15
Current
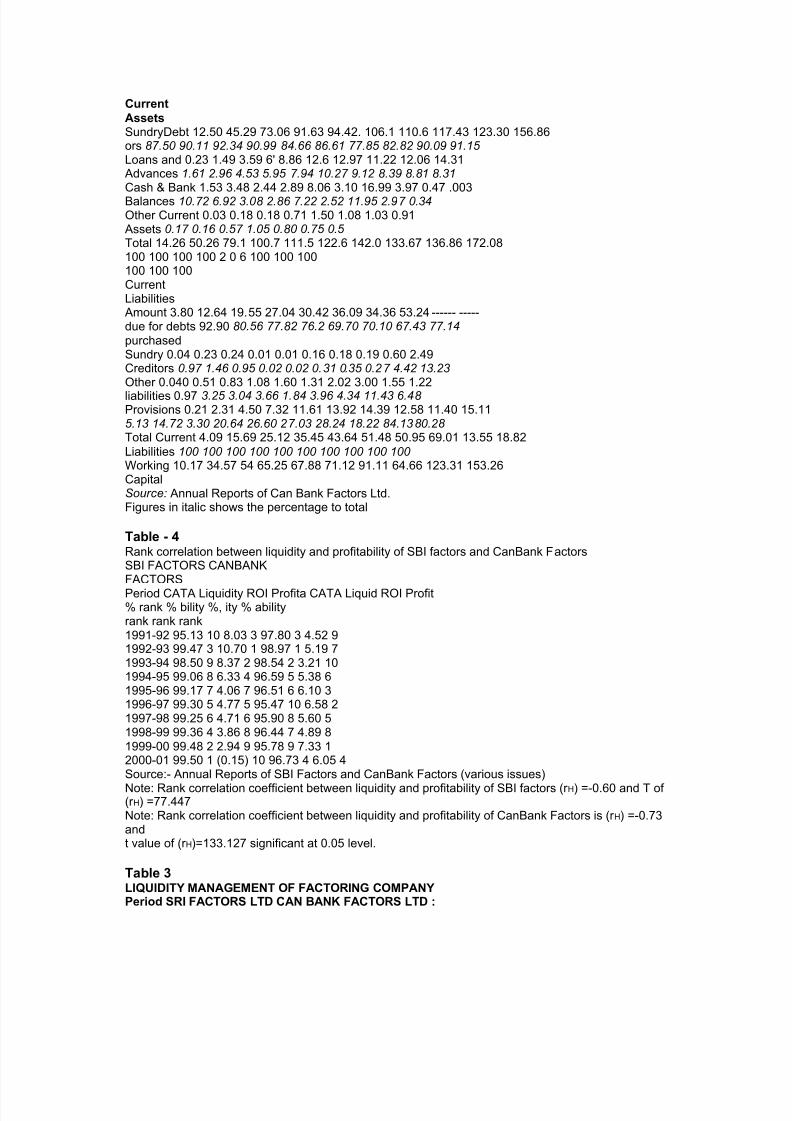
AssetsSundryDebt 12.50 45.29 73.06 91.63 94.42. 106.1 110.6 117.43 123.30 156.86ors 87 .50 90.11 92.34 90.99 8 4.66 8 6.61 77 .8 5 8 2.8 2 90.09 91.15 Loans and 0.23 1.49 3.59 6' 8.86 12.6 12.97 11.22 12.06 14.31Advances 1.61 2.96 4.53 5.95 7 .94 10.2 7 9.12 8 .39 8 .8 1 8 .31Cash & Bank 1.53 3.48 2.44 2.89 8.06 3.10 16.99 3.97 0.47 .003Balances 10.7 2 6.92 3.0 8 2.8 6 7 .22 2.52 11.95 2.97 0.34Other Current 0.03 0.18 0.18 0.71 1.50 1.08 1.03 0.91Assets 0.17 0.16 0.5 7 1.05 0.8 0 0.7 5 0.5 Total 14.26 50.26 79.1 100.7 111.5 122.6 142.0 133.67 136.86 172.08100 100 100 100 2 0 6 100 100 100100 100 100CurrentLiabilitiesAmount 3.80 12.64 19.55 27.04 30.42 36.09 34.36 53.24 ------ -----due for debts 92.90 8 0.56 77 .8 2 7 6.2 69.7 0 7 0.10 6 7 .43 77 .14
purchasedSundry 0.04 0.23 0.24 0.01 0.01 0.16 0.18 0.19 0.60 2.49Creditors 0.97 1.46 0.95 0.02 0.02 0.31 0.35 0.2 7 4.42 13.23Other 0.040 0.51 0.83 1.08 1.60 1.31 2.02 3.00 1.55 1.22
liabilities 0.97 3.25 3.04 3.66 1.8 4 3.96 4.34 11.43 6.48 Provisions 0.21 2.31 4.50 7.32 11.61 13.92 14.39 12.58 11.40 15.115.13 14.7 2 3.30 20.64 26.60 2 7 .03 2 8 .24 18 .22 8 4.138 0.2 8 Total Current 4.09 15.69 25.12 35.45 43.64 51.48 50.95 69.01 13.55 18.82Liabilities 100 100 100 100 100 100 100 100 100 100 Working 10.17 34.57 54 65.25 67.88 71.12 91.11 64.66 123.31 153.26CapitalS our c e: Annual Reports of Can Bank Factors Ltd.Figures in italic shows the percentage to total
Table - 4Rank correlation between liquidity and profitability of SBI factors and CanBank FactorsSBI FACTORS CANBANKFACTORS
Period CATA Liquidity ROI Profita CATA Liquid ROI Profit% rank % bility %, ity % abilityrank rank rank1991-92 95.13 10 8.03 3 97.80 3 4.52 91992-93 99.47 3 10.70 1 98.97 1 5.19 71993-94 98.50 9 8.37 2 98.54 2 3.21 101994-95 99.06 8 6.33 4 96.59 5 5.38 61995-96 99.17 7 4.06 7 96.51 6 6.10 31996-97 99.30 5 4.77 5 95.47 10 6.58 21997-98 99.25 6 4.71 6 95.90 8 5.60 51998-99 99.36 4 3.86 8 96.44 7 4.89 81999-00 99.48 2 2.94 9 95.78 9 7.33 12000-01 99.50 1 (0.15) 10 96.73 4 6.05 4Source:- Annual Reports of SBI Factors and CanBank Factors (various issues)
Note: Rank correlation coefficient between liquidity and profitability of SBI factors (r H) =-0.60 and T of (r H) =77.447Note: Rank correlation coefficient between liquidity and profitability of CanBank Factors is (r H) =-0.73andt value of (r H)=133.127 significant at 0.05 level.
Table 3LIQUIDITY MANAGEMENT OF FACTORING COMPANYPeriod SRI FACTORS LTD CAN BANK FACTORS LTD :

8/7/2019 ANKIT SOOD
http://slidepdf.com/reader/full/ankit-sood 15/15
WCR ACR WTR CATR DTR WCR ACR WTR CATR DTR
91-92 12.2 3.21 1.11 95.13 --- 0.28 3.41 ---- 97.8 ----92-93 3.10 0.29 5.18 86.75 5.85 3.20 3.10 4.69 98.97 5.61
93-94 2.34 2.08 7.56 83.86 5.41 0.31 3.00 5.82 98.54 5.3194-95 2.14 2.14 5.88 95.45 4.39 2.83 2.66 7.28 96.59 5.7695-96 1.84 1.82 9.97 99.24 5.58 2.55 2.34 7.26 96.51 5.294.32 1.90 5.94 92.08 5.30 1.83 2.90 6.26 97.68 5.49
96-97 2.53 2.52 7.67 99.30 4.75 2.38 2.12 6.69 95.47 4.7497-98 2.43 2.42 6.42 99.25 4.38 2.78 2.50 5.13 95.90 4.3198-99 2.96 2.95 10.46 99.36 3.78 2.70 2.52 8.98 96.44 4.1299-00 3.24 3.2 5.35 99.48 3.83 10.19 9.14 5.13 95.78 4.1900-01 3.21 3.14 7.95 99.50 5.53 9.14 8.38 5.78 96.73 4.092.80 2.8 4 7.57 99.37 4.45 5.43 4.93 6.34 96.06 4.29
Grand 3.59 2.37 6.75 95.72 4.87 3.63 3.91 6.30 96.87 4.89MeanSource:- Annual Repots of SBI andCanBankFactors (various issues)WCR- Working Capital Ratio CATR- Current Asset Total Assets RatioDTR- Debtor Turnover Ratio WCT - Working Capital Turnover ATR - Acid Test RatioWCR, DTR, ATR, and WCT are expressed in no. of times whereas CATR is expressed in percentage