análisis de alérgenos en alimentos y piensos - · pdf fileintroduction 3 . 5.1....
TRANSCRIPT

Automatic extraction platforms using the Lysis Buffer 1 + RNase
for Food ID and the PrepSEQ® Nucleic Acid Extraction Kit
Validation report
1/34

1. Contents
2. Purpose 2 3. References 2 4. Definitions 2 5. Introduction 3 5.1. Type of sample to be analyses 3 5.2. Quantity of sample to be analysed 13 5.3. Expected yield of DNA 14 6. Validation Assay 15 6.1. Repeatability and reproducibility 15 6.2. Matrix effect 18 6.3. Evaluation of DNA quality 20 6.4. Recovery tests 24 7. Comparative analyses between different extraction protocols 30 8. Conclusions 34
2. Purpose The present report is intended to define the methodology used to validate both, BeadRetrieverTM System and MagMaxTM Express 96 automatic extractions and the quantification stage for whole DNA obtained from raw materials, foodstuffs and feeds using the Lysis Buffer 1 + RNase for Food ID (Part No. A24401; Life TechnologiesTM) and the PrepSEQ® Nucleic Acid Extraction Kit (Part No. 4400793; Life TechnologiesTM). 3. References Guideline UNE-EN ISO/IEC 17025:2005 Guideline UNE-EN ISO/IEC 21571:2005 4. Definitions
Validation: Confirmation by examination and the provision of objective evidence to demonstrate compliance with certain requirements for the expected specific use (ISO 17025) Repeatability: Precision under conditions in which the results of a measurement are obtained using the same method, by the same operative, and using the same measurement instrument. Reproducibility: Precision under conditions in which the results of a measurement are obtained using the same method and same measurand, but with different operatives and different measurement instruments. Precision: The degree of concordance between the results of independently obtained measurements under the conditions established. Recovery tests: Tests that involve adding a known quantity of DNA obtained from a standard sample to a food/feed matrix in order to verify that the DNA added is recovered after the extraction procedure used. The aim of the recovery tests is to highlight the matrix effect and to verify the appropriateness of the procedure.
2/34
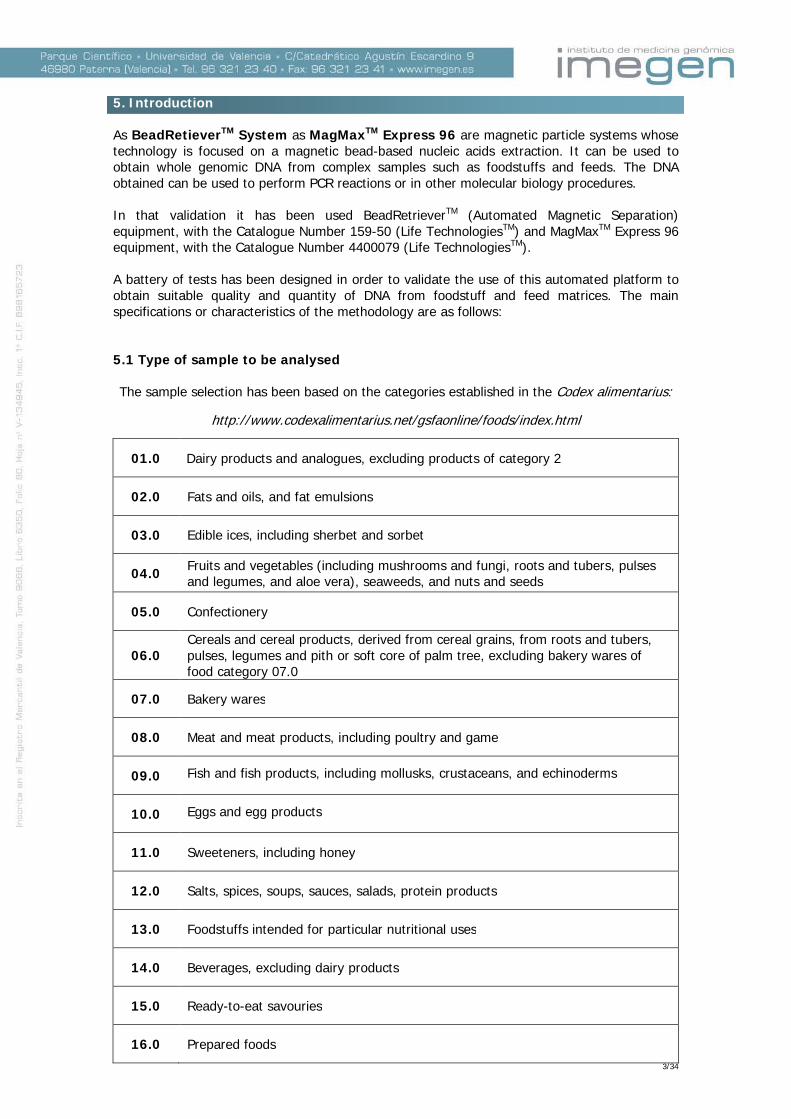
5. Introduction As BeadRetieverTM System as MagMaxTM Express 96 are magnetic particle systems whose technology is focused on a magnetic bead-based nucleic acids extraction. It can be used to obtain whole genomic DNA from complex samples such as foodstuffs and feeds. The DNA obtained can be used to perform PCR reactions or in other molecular biology procedures. In that validation it has been used BeadRetrieverTM (Automated Magnetic Separation) equipment, with the Catalogue Number 159-50 (Life TechnologiesTM) and MagMaxTM Express 96 equipment, with the Catalogue Number 4400079 (Life TechnologiesTM). A battery of tests has been designed in order to validate the use of this automated platform to obtain suitable quality and quantity of DNA from foodstuff and feed matrices. The main specifications or characteristics of the methodology are as follows: 5.1 Type of sample to be analysed The sample selection has been based on the categories established in the Codex alimentarius:
http://www.codexalimentarius.net/gsfaonline/foods/index.html
01.0 Dairy products and analogues, excluding products of category 2
02.0 Fats and oils, and fat emulsions
03.0 Edible ices, including sherbet and sorbet
04.0 Fruits and vegetables (including mushrooms and fungi, roots and tubers, pulses and legumes, and aloe vera), seaweeds, and nuts and seeds
05.0 Confectionery
06.0 Cereals and cereal products, derived from cereal grains, from roots and tubers, pulses, legumes and pith or soft core of palm tree, excluding bakery wares of food category 07.0
07.0 Bakery wares
08.0 Meat and meat products, including poultry and game
09.0 Fish and fish products, including mollusks, crustaceans, and echinoderms
10.0 Eggs and egg products
11.0 Sweeteners, including honey
12.0 Salts, spices, soups, sauces, salads, protein products
13.0 Foodstuffs intended for particular nutritional uses
14.0 Beverages, excluding dairy products
15.0 Ready-to-eat savouries
16.0 Prepared foods
3/34
According the Codex alimentarius, there are 16 food categories. Most of the samples used in that validation project have been bought in a food supermarket. In case of samples, which are difficult to find in a supermarket, we obtained them directly from specific providers. This validation report has been designed in two general steps:
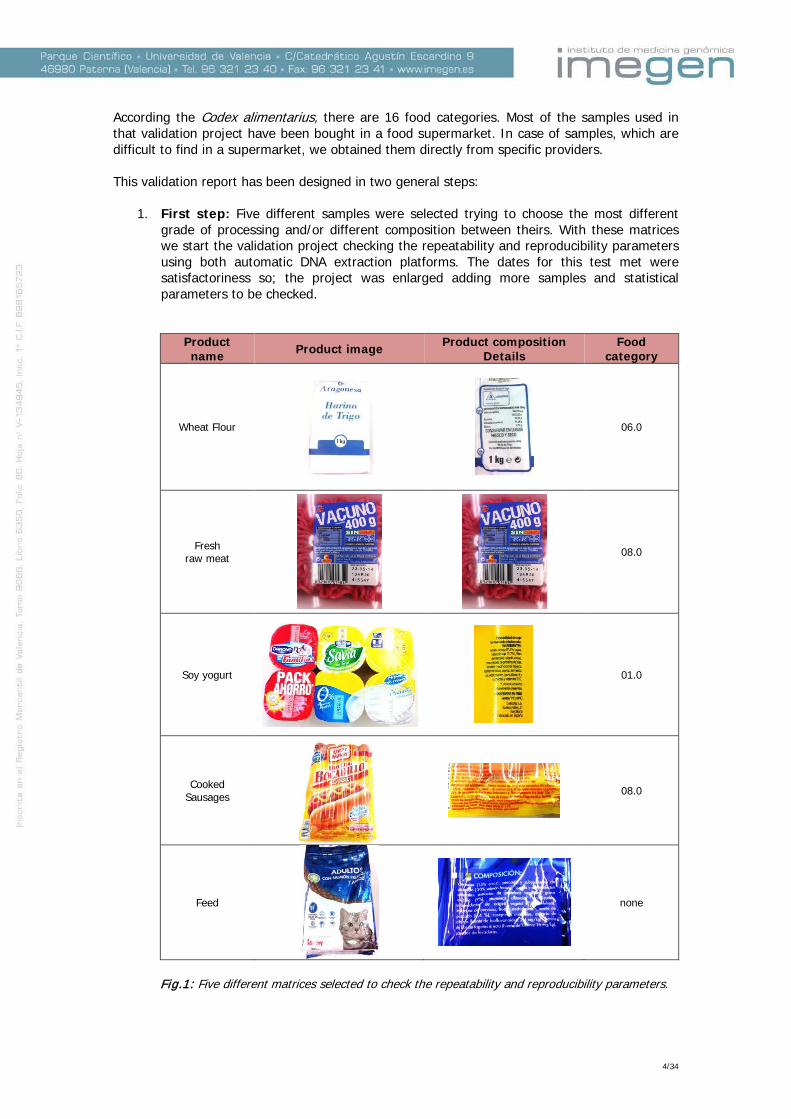
1. First step: Five different samples were selected trying to choose the most different grade of processing and/or different composition between theirs. With these matrices we start the validation project checking the repeatability and reproducibility parameters using both automatic DNA extraction platforms. The dates for this test met were satisfactoriness so; the project was enlarged adding more samples and statistical parameters to be checked.
Product name Product image Product composition
Details Food
category
Wheat Flour
06.0
Fresh raw meat
08.0
Soy yogurt
01.0
Cooked Sausages
08.0
Feed
none
Fig.1: Five different matrices selected to check the repeatability and reproducibility parameters.
4/34

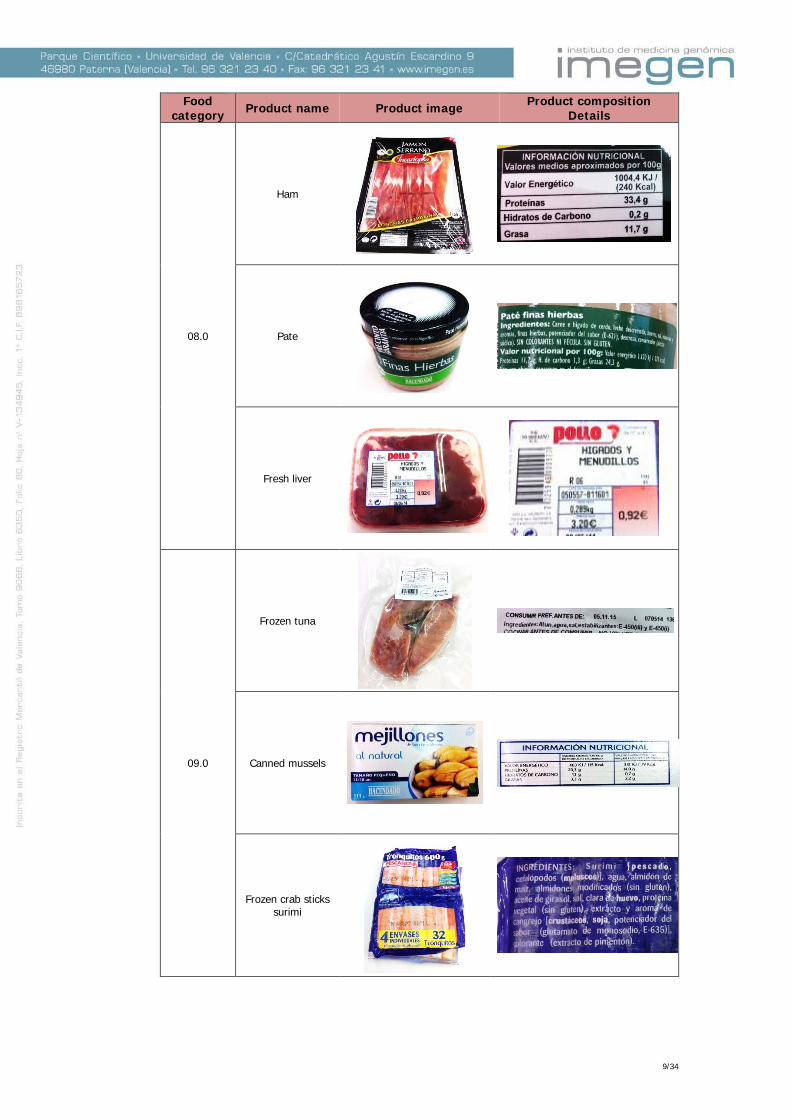
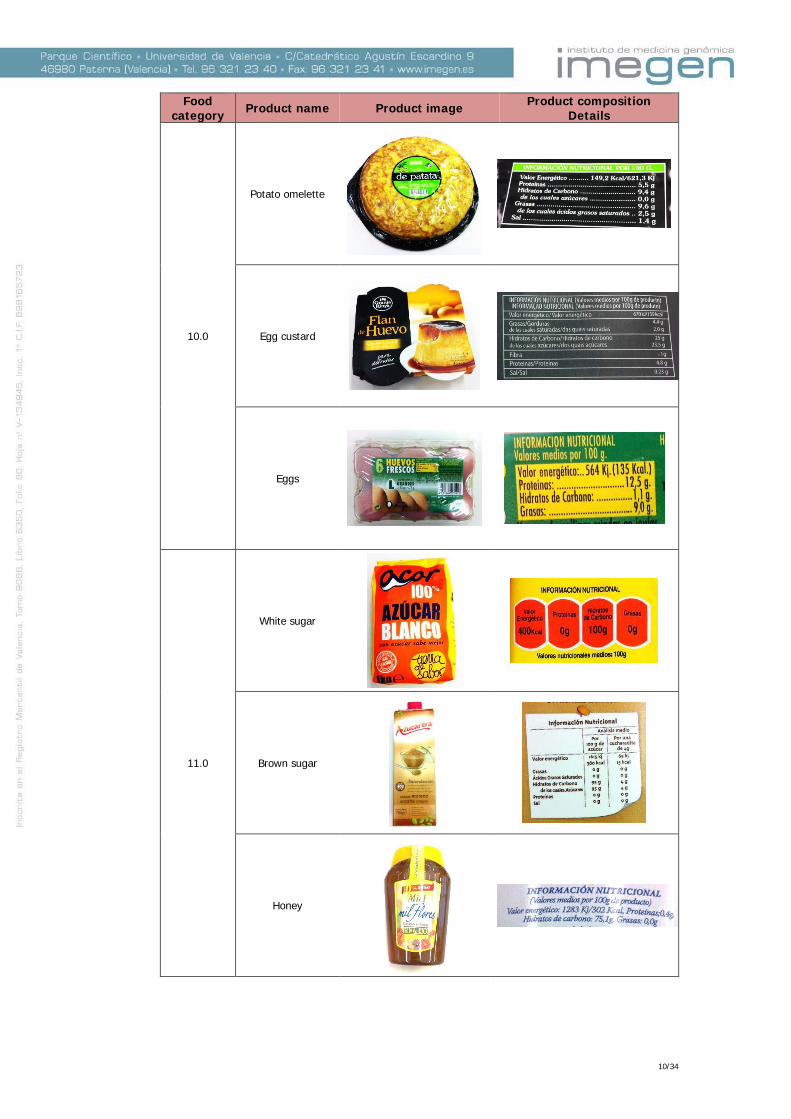
2. Second step: Three different samples included in each of the categories in the Codex
alimentarius (48 matrices) were selected to assess the effect of the matrix on the yield of the extraction process. Three new products were added to the category 6 due to the heterogeneity of the matrices belonging from this category so, 51 samples were selected and included into this validation study.
Food category Product name Product image Product composition
Details
01.0
Yogurt with cereals
Chocolate milkshake
Cheese
02.0
Olive oil
Butter
Margarine
5/34

Food category Product name Product image Product composition
Details
03.0
Strawberry ice cream
Frozen lemonade
Chufa sedge beverage
04.0
Frozen mixed vegetables
Soy beans
Fresh Kiwi
6/34

Food category Product name Product image Product composition
Details
05.0
Cocoa cream
Sweets
Cocoa powder
06.0
Cooked corn flour
Corn
Macaroni
7/34

Food category Product name Product image Product composition
Details
06.0
Corn starch
Breakfast cereals
Soy lecithin
07.0
Bread
Biscuits
Cupcakes
8/34
Food category Product name Product image Product composition
Details
08.0
Ham
Pate
Fresh liver
09.0
Frozen tuna
Canned mussels
Frozen crab sticks surimi
9/34
Food category Product name Product image Product composition
Details
10.0
Potato omelette
Egg custard
Eggs
11.0
White sugar
Brown sugar
Honey
10/34
Food category Product name Product image Product composition
Details
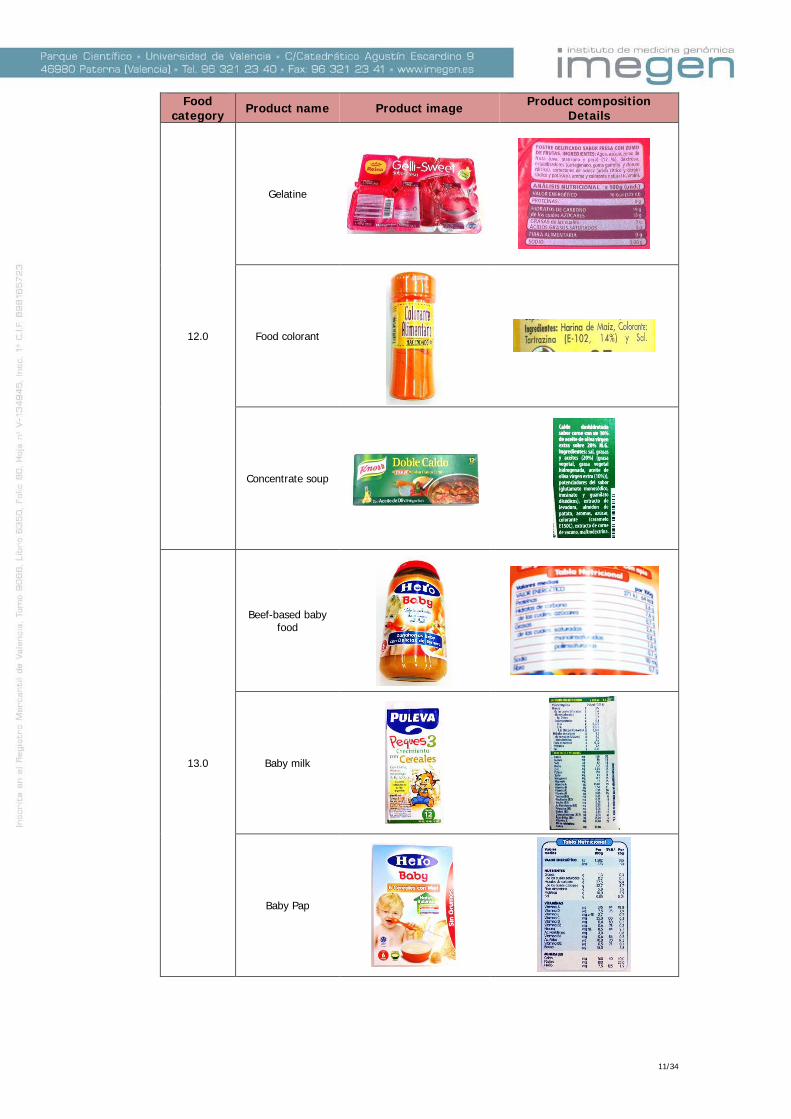
12.0
Gelatine
Food colorant
Concentrate soup
13.0
Beef-based baby food
Baby milk
Baby Pap
11/34

Food category Product name Product image Product composition
Details
14.0
Peach juice
Coffee
Beer
15.0
Fried maize
Fried Potatoes
Peanuts
12/34

Food category Product name Product image Product composition
Details
16.0
Cooked canned lentils
Frozen Spinach lasagne
Cooked rice
Fig.2: A total of fifty one samples were selected to perform this DNA extraction validation project.
5.2 Quantity of sample to be analysed Whenever it is possible, all tests included in this validation report have been designed using the same parameters than in manual DNA extraction procedures (GMO extraction kit from LifeTechnologies cat. number: 4466336). This strategy allows users to use manual or automatic DNA extraction platforms depending on their needs, employing very similar procedures. The following table shows the quantity of Lysis Buffer 1 and food/feed samples to be added using the recommendations included in the user manual of the GMO extraction kit (LifeTechnologies cat. number: 4466336).
Quantity of sample Lysis Buffer 1 Product type
20 g 30 mL Seeds
10 g 20 mL Flour, semolina, baked goods, meats, fish, snacks, manufactured products, etc.
10 g 30 mL Feed and soy beans
5 g 40 mL Cocoa, soy flour
10 mL 20 mL Oils, fats, butters
10 mL 10 mL Dairy products, fruit juices, ice cream, alcoholic drinks
Table 1: Recommended quantity of Lysis Buffer 1 and sample to be analysed, depending on its nature.
13/34

In points 6.1 and 6.2 it is specified the amount of each matrix that it has been weighed for each test. 5.3 Expected yield of DNA The DNA extraction yield strongly depends on the degree of processing of the matrix analysed. Thus, those samples submitted to more extreme physicochemical processes will provide a lower yield of DNA after the extraction process. All samples were selected between a wide and representative range of commercial products. The following table shows the expected DNA yields depending on the analysed samples:
Product Type Expected yield ng/µL
Starch 0-10 Sauces 0-25
Flavours, colorants 0-25 Soups, concentrates 0-25
Flour, pasta 50-100 Grits 25-100 Seeds 50-100 Sugars 0-10
Meats products, fish, coated products 50-100 Salads, rice dishes, frozen food 5-100
Baked goods 25-100 Preserves 5-50 Soy flour 50-100
Cocoa derivatives 0-50 Soy lecithin 0-10
Oils, fats, butter 0-10 Alcoholic beverages 0-10
Snacks 5-100 Breakfast cereals 0-25 Prepared Foods 5-100
Feed 50-100 Soy drinks 25-100
Dairy products, fruit juices, sweets 0-100
Table 2: Expected DNA yields depending on the type of sample analysed, together with recommended elution volumes
14/34

6. Validation Assay This report summarizes the results obtained during validation of the DNA extraction and quantification stage when using the BeadRetrieverTM System or MagMaxTM Express 96 together with the Lysis Buffer 1 + RNase for Food ID and the PrepSEQ® Nucleic Acid Extraction Kit. As mentioned in the introduction chapter, this validation report has been designed in two general and sequential steps. For the step one five different samples were selected trying to choose the most different grade of processing and/or different composition between theirs. With these matrices we start the validation project checking the repeatability and reproducibility parameters. The successful of this first step lead to the step two of the project in which more samples and statistical parameters to be checked were added. See below the criteria and the results obtained after checking the main statistical parameters: 6.1. Repeatability and reproducibility The five different matrices selected based on the grade of processing and/or different composition between theirs were the follow:
Matrices selected
Wheat Flour
Raw meat
Soy yogurt
Cooked Sausages
Feed
The DNA extraction procedure used for this validation project is the recommended by the Lysis Buffer 1 + RNase for Food ID kit's manufacturer, Part. Nº: A24401. See below the main steps of the protocol from the chapter 5 of that user manual.
Protocol
1. The corresponding amount of each homogenised sample was weight (grinder was used to homogenize samples when it was necessary) into a 50 mL tube and the amount of Lysis buffer 1 depending of the kind of sample was added:
Matrices selected Sample used Lysis Buffer 1 used
Wheat Flour 20 g 10 ml
Raw meat 20 g 10 ml
Soy yogurt 10 g 10 ml
Cooked Sausages 20 g 10 ml
Feed 10 g 30 ml
2. The tube containing RNase was shaked, and 5 µL to the tube containing sample + Lysis buffer 1 was added. Except for feed or soy products which it was necessary to add 20 µL.
3. Each tube with parafilm® was sealed and incubated at 65ºC for 30 minutes whilst shaking. An orbital incubator was used for this step.
15/34
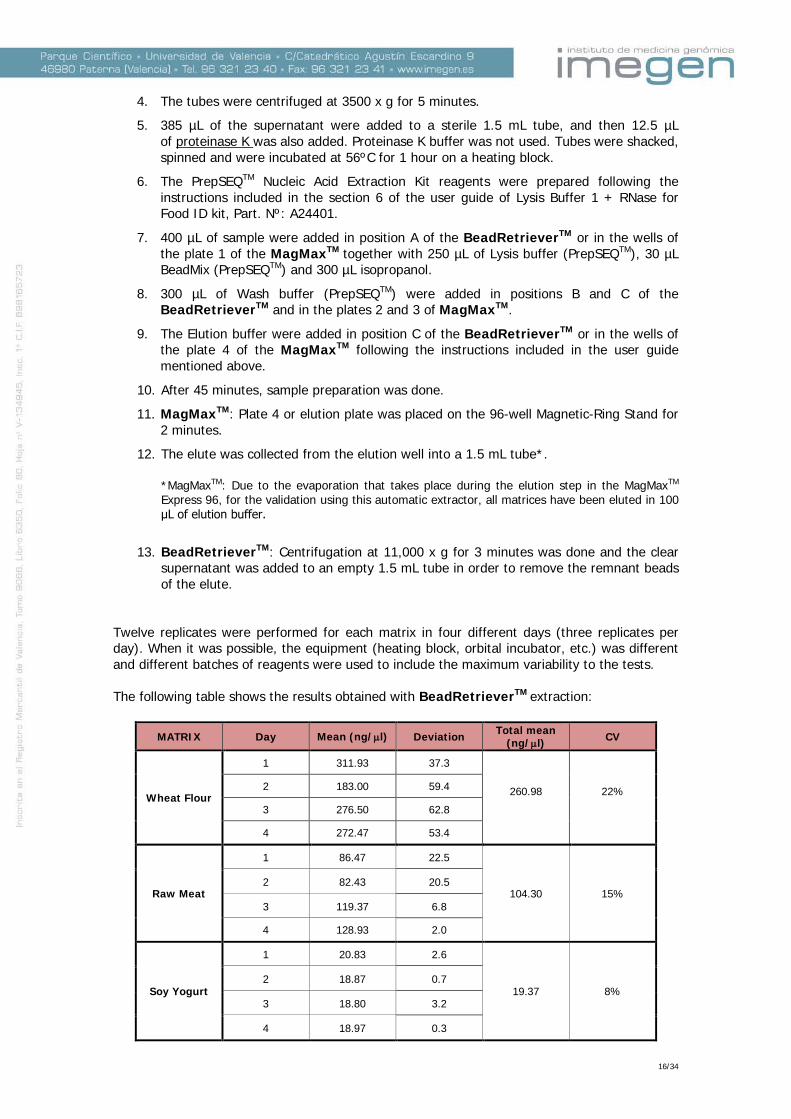
4. The tubes were centrifuged at 3500 x g for 5 minutes.
5. 385 µL of the supernatant were added to a sterile 1.5 mL tube, and then 12.5 µL of proteinase K was also added. Proteinase K buffer was not used. Tubes were shacked, spinned and were incubated at 56ºC for 1 hour on a heating block.
6. The PrepSEQTM Nucleic Acid Extraction Kit reagents were prepared following the instructions included in the section 6 of the user guide of Lysis Buffer 1 + RNase for Food ID kit, Part. Nº: A24401.
7. 400 µL of sample were added in position A of the BeadRetrieverTM or in the wells of the plate 1 of the MagMaxTM together with 250 µL of Lysis buffer (PrepSEQTM), 30 µL BeadMix (PrepSEQTM) and 300 µL isopropanol.
8. 300 µL of Wash buffer (PrepSEQTM) were added in positions B and C of the BeadRetrieverTM and in the plates 2 and 3 of MagMaxTM.
9. The Elution buffer were added in position C of the BeadRetrieverTM or in the wells of the plate 4 of the MagMaxTM following the instructions included in the user guide mentioned above.
10. After 45 minutes, sample preparation was done.
11. MagMaxTM: Plate 4 or elution plate was placed on the 96-well Magnetic-Ring Stand for 2 minutes.
12. The elute was collected from the elution well into a 1.5 mL tube*. *MagMaxTM: Due to the evaporation that takes place during the elution step in the MagMaxTM Express 96, for the validation using this automatic extractor, all matrices have been eluted in 100 μL of elution buffer.
13. BeadRetrieverTM: Centrifugation at 11,000 x g for 3 minutes was done and the clear supernatant was added to an empty 1.5 mL tube in order to remove the remnant beads of the elute.
Twelve replicates were performed for each matrix in four different days (three replicates per day). When it was possible, the equipment (heating block, orbital incubator, etc.) was different and different batches of reagents were used to include the maximum variability to the tests. The following table shows the results obtained with BeadRetrieverTM extraction:
MATRIX Day Mean (ng/µl) Deviation Total mean (ng/µl) CV
Wheat Flour
1 311.93 37.3
260.98
22%
2 183.00 59.4
3 276.50 62.8
4 272.47 53.4
Raw Meat
1 86.47 22.5
104.30 15% 2 82.43 20.5
3 119.37 6.8
4 128.93 2.0
Soy Yogurt
1 20.83 2.6
19.37 8% 2 18.87 0.7
3 18.80 3.2
4 18.97 0.3
16/34
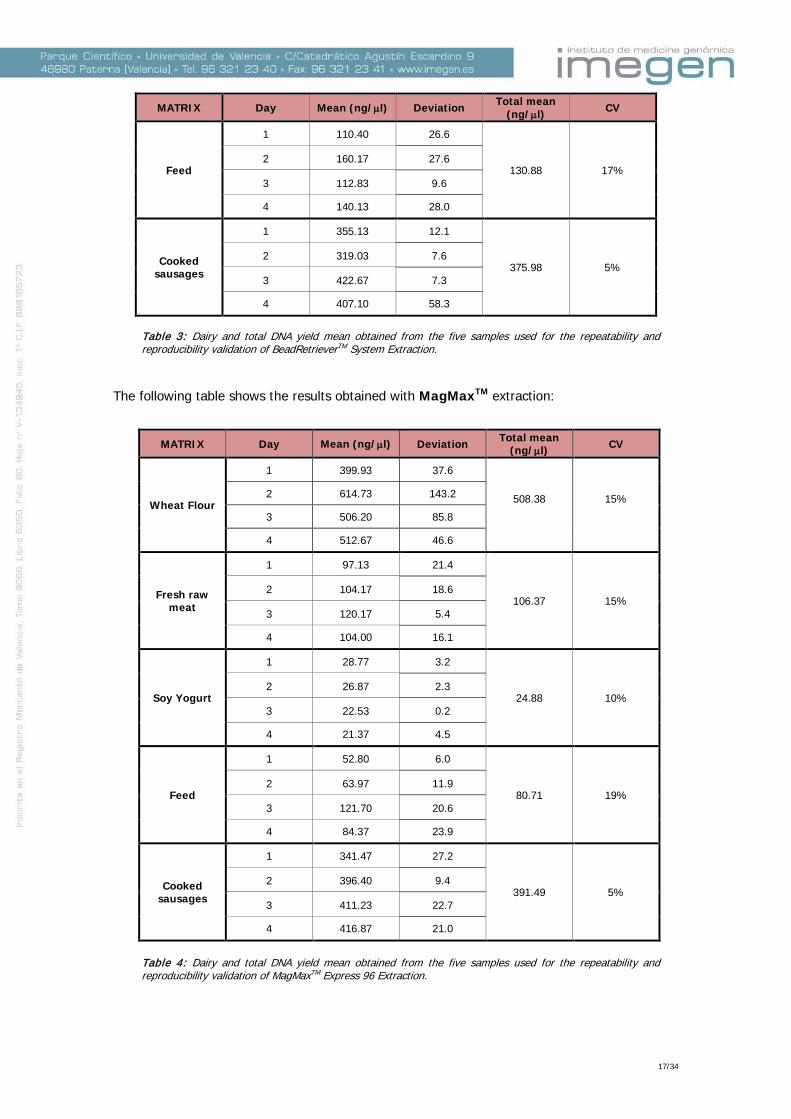
MATRIX Day Mean (ng/µl) Deviation Total mean (ng/µl) CV
Feed
1 110.40 26.6
130.88 17% 2 160.17 27.6
3 112.83 9.6
4 140.13 28.0
Cooked sausages
1 355.13 12.1
375.98 5% 2 319.03 7.6
3 422.67 7.3
4 407.10 58.3
Table 3: Dairy and total DNA yield mean obtained from the five samples used for the repeatability and reproducibility validation of BeadRetrieverTM System Extraction.
The following table shows the results obtained with MagMaxTM extraction:
Table 4: Dairy and total DNA yield mean obtained from the five samples used for the repeatability and reproducibility validation of MagMaxTM Express 96 Extraction.
MATRIX Day Mean (ng/µl) Deviation Total mean (ng/µl) CV
Wheat Flour
1 399.93 37.6
508.38
15%
2 614.73 143.2
3 506.20 85.8
4 512.67 46.6
Fresh raw meat
1 97.13 21.4
106.37 15% 2 104.17 18.6
3 120.17 5.4
4 104.00 16.1
Soy Yogurt
1 28.77 3.2
24.88 10% 2 26.87 2.3
3 22.53 0.2
4 21.37 4.5
Feed
1 52.80 6.0
80.71 19% 2 63.97 11.9
3 121.70 20.6
4 84.37 23.9
Cooked sausages
1 341.47 27.2
391.49 5% 2 396.40 9.4
3 411.23 22.7
4 416.87 21.0
17/34
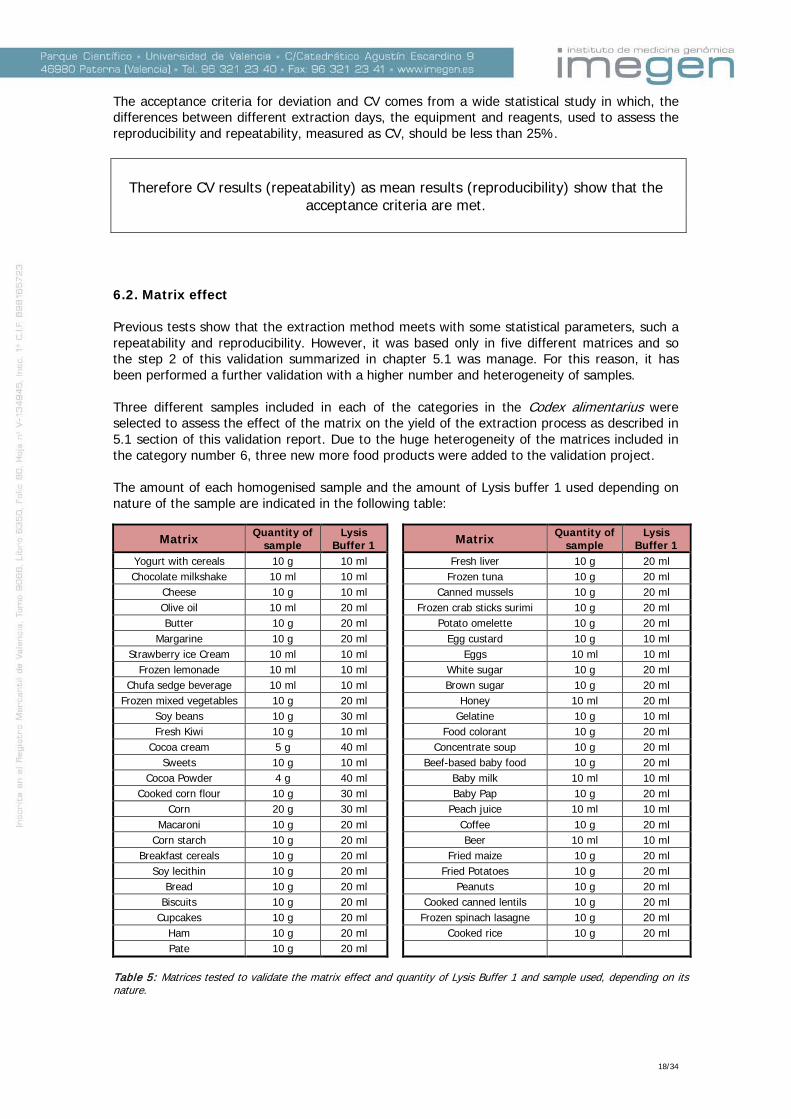
The acceptance criteria for deviation and CV comes from a wide statistical study in which, the differences between different extraction days, the equipment and reagents, used to assess the reproducibility and repeatability, measured as CV, should be less than 25%.
Therefore CV results (repeatability) as mean results (reproducibility) show that the
acceptance criteria are met.
6.2. Matrix effect Previous tests show that the extraction method meets with some statistical parameters, such a repeatability and reproducibility. However, it was based only in five different matrices and so the step 2 of this validation summarized in chapter 5.1 was manage. For this reason, it has been performed a further validation with a higher number and heterogeneity of samples. Three different samples included in each of the categories in the Codex alimentarius were selected to assess the effect of the matrix on the yield of the extraction process as described in 5.1 section of this validation report. Due to the huge heterogeneity of the matrices included in the category number 6, three new more food products were added to the validation project. The amount of each homogenised sample and the amount of Lysis buffer 1 used depending on nature of the sample are indicated in the following table:
Matrix Quantity of sample
Lysis Buffer 1 Matrix Quantity of
sample Lysis
Buffer 1 Yogurt with cereals 10 g 10 ml Fresh liver 10 g 20 ml Chocolate milkshake 10 ml 10 ml Frozen tuna 10 g 20 ml
Cheese 10 g 10 ml Canned mussels 10 g 20 ml Olive oil 10 ml 20 ml Frozen crab sticks surimi 10 g 20 ml Butter 10 g 20 ml Potato omelette 10 g 20 ml
Margarine 10 g 20 ml Egg custard 10 g 10 ml Strawberry ice Cream 10 ml 10 ml Eggs 10 ml 10 ml
Frozen lemonade 10 ml 10 ml White sugar 10 g 20 ml Chufa sedge beverage 10 ml 10 ml Brown sugar 10 g 20 ml
Frozen mixed vegetables 10 g 20 ml Honey 10 ml 20 ml Soy beans 10 g 30 ml Gelatine 10 g 10 ml Fresh Kiwi 10 g 10 ml Food colorant 10 g 20 ml
Cocoa cream 5 g 40 ml Concentrate soup 10 g 20 ml Sweets 10 g 10 ml Beef-based baby food 10 g 20 ml
Cocoa Powder 4 g 40 ml Baby milk 10 ml 10 ml Cooked corn flour 10 g 30 ml Baby Pap 10 g 20 ml
Corn 20 g 30 ml Peach juice 10 ml 10 ml Macaroni 10 g 20 ml Coffee 10 g 20 ml
Corn starch 10 g 20 ml Beer 10 ml 10 ml Breakfast cereals 10 g 20 ml Fried maize 10 g 20 ml
Soy lecithin 10 g 20 ml Fried Potatoes 10 g 20 ml Bread 10 g 20 ml Peanuts 10 g 20 ml
Biscuits 10 g 20 ml Cooked canned lentils 10 g 20 ml Cupcakes 10 g 20 ml Frozen spinach lasagne 10 g 20 ml
Ham 10 g 20 ml Cooked rice 10 g 20 ml Pate 10 g 20 ml
Table 5: Matrices tested to validate the matrix effect and quantity of Lysis Buffer 1 and sample used, depending on its nature.
18/34
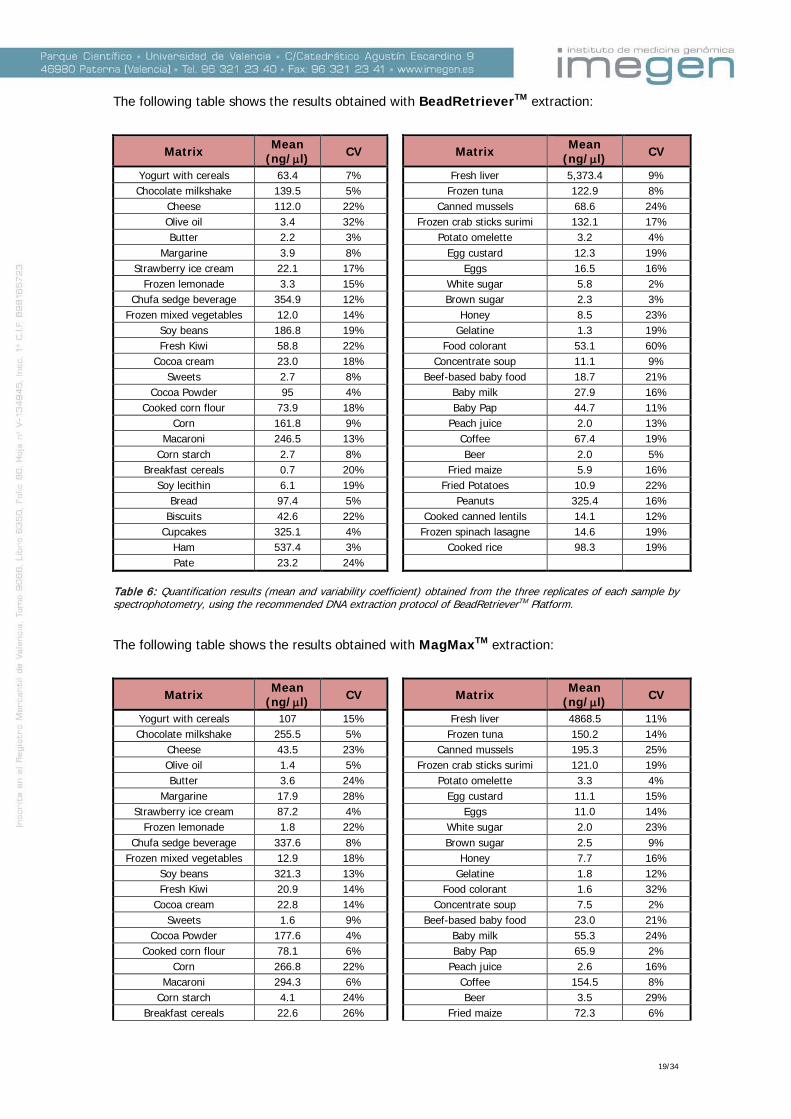
The following table shows the results obtained with BeadRetrieverTM extraction:
Matrix Mean (ng/µl) CV Matrix Mean
(ng/µl) CV
Yogurt with cereals 63.4 7% Fresh liver 5,373.4 9% Chocolate milkshake 139.5 5% Frozen tuna 122.9 8%
Cheese 112.0 22% Canned mussels 68.6 24% Olive oil 3.4 32% Frozen crab sticks surimi 132.1 17% Butter 2.2 3% Potato omelette 3.2 4%
Margarine 3.9 8% Egg custard 12.3 19% Strawberry ice cream 22.1 17% Eggs 16.5 16%
Frozen lemonade 3.3 15% White sugar 5.8 2% Chufa sedge beverage 354.9 12% Brown sugar 2.3 3%
Frozen mixed vegetables 12.0 14% Honey 8.5 23% Soy beans 186.8 19% Gelatine 1.3 19% Fresh Kiwi 58.8 22% Food colorant 53.1 60%
Cocoa cream 23.0 18% Concentrate soup 11.1 9% Sweets 2.7 8% Beef-based baby food 18.7 21%
Cocoa Powder 95 4% Baby milk 27.9 16% Cooked corn flour 73.9 18% Baby Pap 44.7 11%
Corn 161.8 9% Peach juice 2.0 13% Macaroni 246.5 13% Coffee 67.4 19%
Corn starch 2.7 8% Beer 2.0 5% Breakfast cereals 0.7 20% Fried maize 5.9 16%
Soy lecithin 6.1 19% Fried Potatoes 10.9 22% Bread 97.4 5% Peanuts 325.4 16%
Biscuits 42.6 22% Cooked canned lentils 14.1 12% Cupcakes 325.1 4% Frozen spinach lasagne 14.6 19%
Ham 537.4 3% Cooked rice 98.3 19% Pate 23.2 24%
Table 6: Quantification results (mean and variability coefficient) obtained from the three replicates of each sample by spectrophotometry, using the recommended DNA extraction protocol of BeadRetrieverTM Platform. The following table shows the results obtained with MagMaxTM extraction:
Matrix Mean (ng/µl) CV Matrix Mean
(ng/µl) CV
Yogurt with cereals 107 15% Fresh liver 4868.5 11% Chocolate milkshake 255.5 5% Frozen tuna 150.2 14%
Cheese 43.5 23% Canned mussels 195.3 25% Olive oil 1.4 5% Frozen crab sticks surimi 121.0 19% Butter 3.6 24% Potato omelette 3.3 4%
Margarine 17.9 28% Egg custard 11.1 15% Strawberry ice cream 87.2 4% Eggs 11.0 14%
Frozen lemonade 1.8 22% White sugar 2.0 23% Chufa sedge beverage 337.6 8% Brown sugar 2.5 9%
Frozen mixed vegetables 12.9 18% Honey 7.7 16% Soy beans 321.3 13% Gelatine 1.8 12% Fresh Kiwi 20.9 14% Food colorant 1.6 32%
Cocoa cream 22.8 14% Concentrate soup 7.5 2% Sweets 1.6 9% Beef-based baby food 23.0 21%
Cocoa Powder 177.6 4% Baby milk 55.3 24% Cooked corn flour 78.1 6% Baby Pap 65.9 2%
Corn 266.8 22% Peach juice 2.6 16% Macaroni 294.3 6% Coffee 154.5 8%
Corn starch 4.1 24% Beer 3.5 29% Breakfast cereals 22.6 26% Fried maize 72.3 6%
19/34
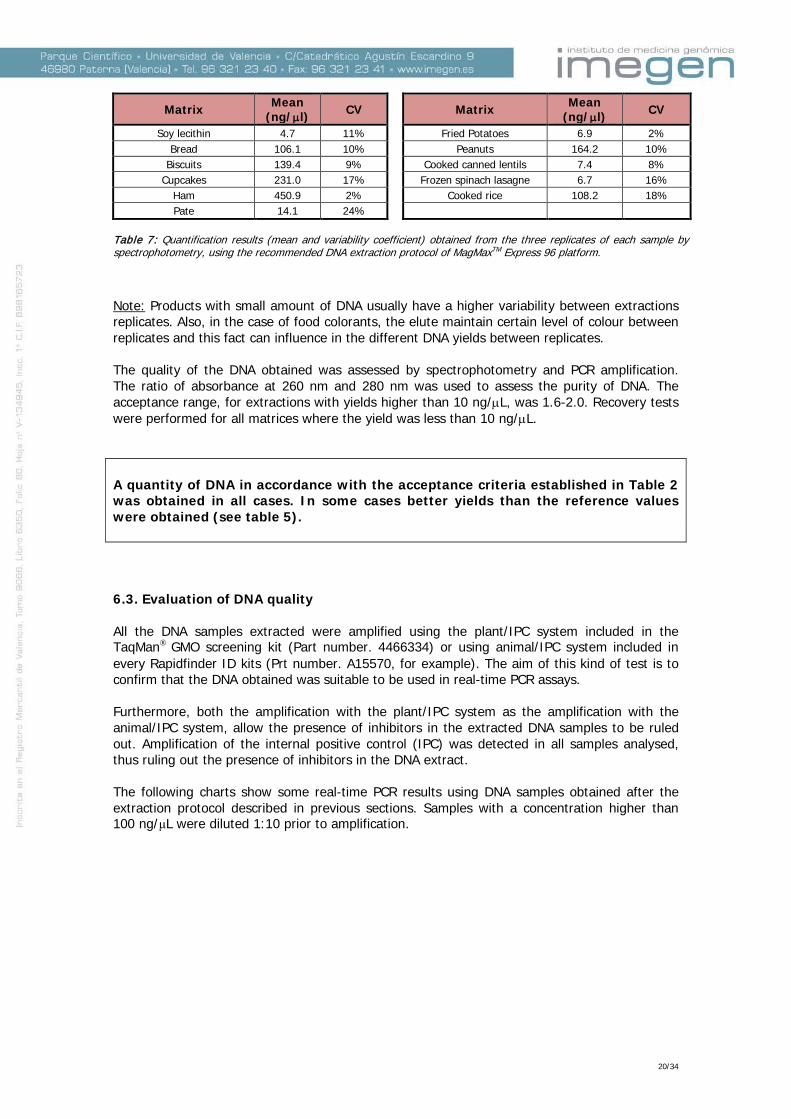
Matrix Mean (ng/µl) CV Matrix Mean
(ng/µl) CV
Soy lecithin 4.7 11% Fried Potatoes 6.9 2% Bread 106.1 10% Peanuts 164.2 10%
Biscuits 139.4 9% Cooked canned lentils 7.4 8% Cupcakes 231.0 17% Frozen spinach lasagne 6.7 16%
Ham 450.9 2% Cooked rice 108.2 18% Pate 14.1 24%
Table 7: Quantification results (mean and variability coefficient) obtained from the three replicates of each sample by spectrophotometry, using the recommended DNA extraction protocol of MagMaxTM Express 96 platform. Note: Products with small amount of DNA usually have a higher variability between extractions replicates. Also, in the case of food colorants, the elute maintain certain level of colour between replicates and this fact can influence in the different DNA yields between replicates. The quality of the DNA obtained was assessed by spectrophotometry and PCR amplification. The ratio of absorbance at 260 nm and 280 nm was used to assess the purity of DNA. The acceptance range, for extractions with yields higher than 10 ng/µL, was 1.6-2.0. Recovery tests were performed for all matrices where the yield was less than 10 ng/µL. A quantity of DNA in accordance with the acceptance criteria established in Table 2 was obtained in all cases. In some cases better yields than the reference values were obtained (see table 5). 6.3. Evaluation of DNA quality All the DNA samples extracted were amplified using the plant/IPC system included in the TaqMan® GMO screening kit (Part number. 4466334) or using animal/IPC system included in every Rapidfinder ID kits (Prt number. A15570, for example). The aim of this kind of test is to confirm that the DNA obtained was suitable to be used in real-time PCR assays. Furthermore, both the amplification with the plant/IPC system as the amplification with the animal/IPC system, allow the presence of inhibitors in the extracted DNA samples to be ruled out. Amplification of the internal positive control (IPC) was detected in all samples analysed, thus ruling out the presence of inhibitors in the DNA extract. The following charts show some real-time PCR results using DNA samples obtained after the extraction protocol described in previous sections. Samples with a concentration higher than 100 ng/μL were diluted 1:10 prior to amplification.
20/34
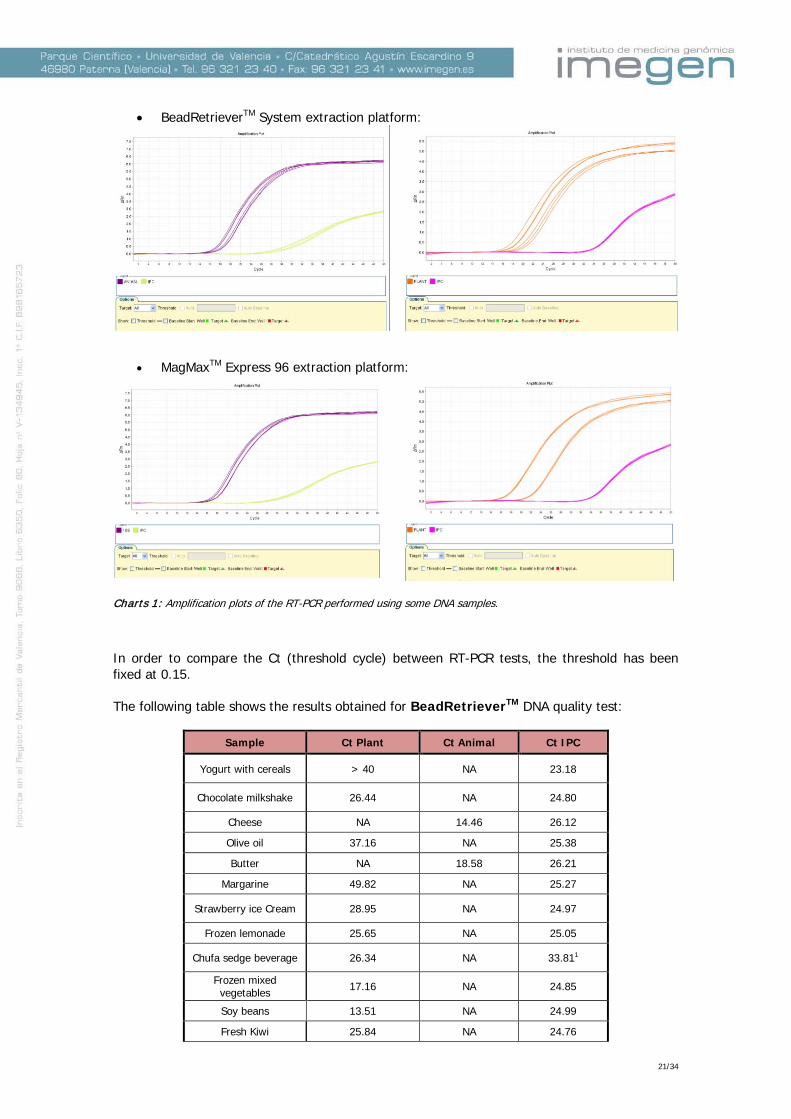
• BeadRetrieverTM System extraction platform:
• MagMaxTM Express 96 extraction platform:
Charts 1: Amplification plots of the RT-PCR performed using some DNA samples.
In order to compare the Ct (threshold cycle) between RT-PCR tests, the threshold has been fixed at 0.15. The following table shows the results obtained for BeadRetrieverTM DNA quality test:
Sample Ct Plant Ct Animal Ct IPC
Yogurt with cereals > 40 NA 23.18
Chocolate milkshake 26.44 NA 24.80
Cheese NA 14.46 26.12
Olive oil 37.16 NA 25.38
Butter NA 18.58 26.21
Margarine 49.82 NA 25.27
Strawberry ice Cream 28.95 NA 24.97
Frozen lemonade 25.65 NA 25.05
Chufa sedge beverage 26.34 NA 33.811
Frozen mixed vegetables 17.16 NA 24.85
Soy beans 13.51 NA 24.99
Fresh Kiwi 25.84 NA 24.76
21/34

Sample Ct Plant Ct Animal Ct IPC
Cocoa cream 23.65 NA 24.68
Sweets 31.82 NA 25.13
Cocoa Powder 19.74 NA 24.46
Cooked corn flour 15.82 NA 33.082
Corn 13.31 NA 25.27
Macaroni 15.38 NA 25.18
Corn starch 23.41 NA 24.96
Breakfast cereals 36.55 NA 25.14
Soy lecithin 32.34 NA 25.01
Bread 17.99 NA 33.271
Biscuits 18.85 NA 25.12
Cupcakes 17.26 NA 25.37
Ham NA 8.21 29.632
Pate NA 12.78 26.85
Fresh liver NA 3.61 39.692
Frozen tuna NA 9.38 27.23
Canned mussels NA 25.57 27.931
Frozen surimi crab sticks NA 10.44 26.76
Potato omelette 26.55 NA 25.28
Egg custard NA 19.40 26.71
Eggs NA 19.91 26.82
White sugar 36.87 NA 25.15
Brown sugar 37.11 NA 25.07
Honey 30.84 NA 25.03
Gelatine NA 20.94 26.44
Food colorant 25.00 NA 25.39
Concentrate soup NA 20.89 26.40
Beef based baby food 33.29 NA 33.501
Baby milk 33.45 NA 25.70
Baby Pap 19.59 NA 25.02
Peach juice 33.73 NA 25.19
Coffee 34.65 NA 25.25
Beer 35.48 NA 25.21
Fried maize 24.82 NA 26.86
Fried Potatoes 18.89 NA 33.491
Peanuts 12.83 NA 25.00
Cooked canned lentils 33.38 NA 24.91
Frozen spinach lasagne 20.55 NA 24.79
Cooked rice 19.40 NA 24.57
Table 8: Ct obtained in the RT-PCR assays using DNA samples extracted with BeadRetrieverTM System Extraction.
22/34
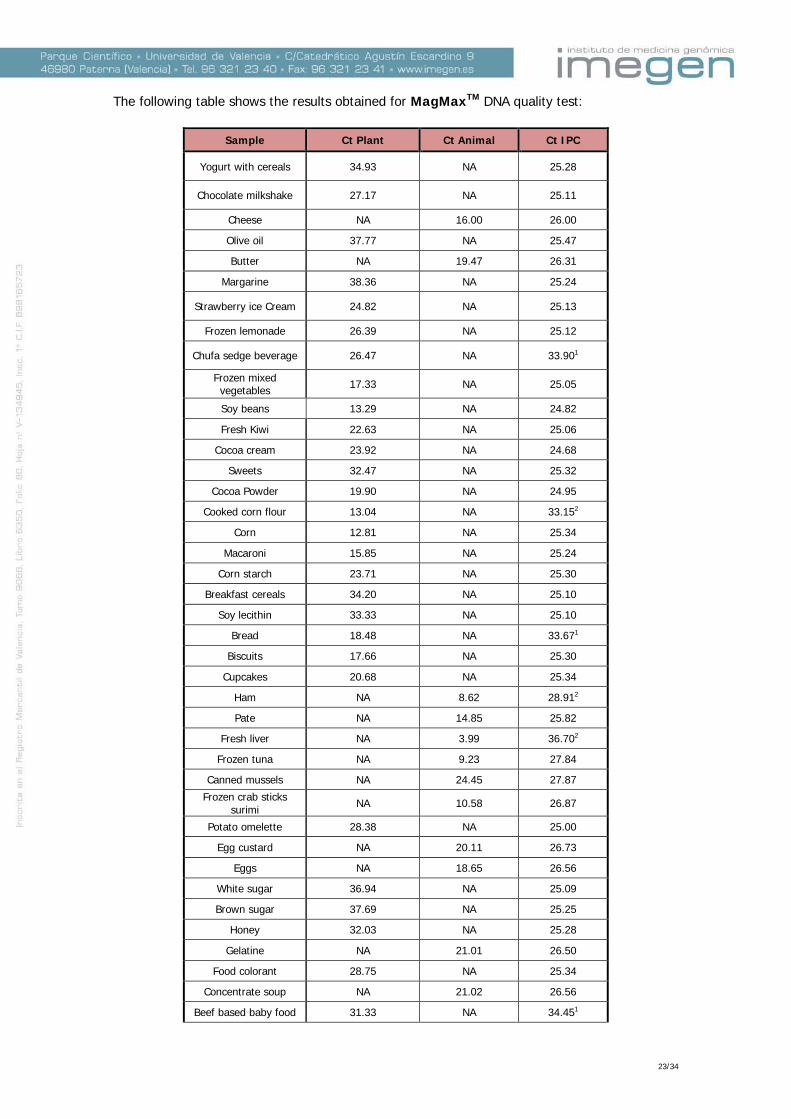
The following table shows the results obtained for MagMaxTM DNA quality test:
Sample Ct Plant Ct Animal Ct IPC
Yogurt with cereals 34.93 NA 25.28
Chocolate milkshake 27.17 NA 25.11
Cheese NA 16.00 26.00
Olive oil 37.77 NA 25.47
Butter NA 19.47 26.31
Margarine 38.36 NA 25.24
Strawberry ice Cream 24.82 NA 25.13
Frozen lemonade 26.39 NA 25.12
Chufa sedge beverage 26.47 NA 33.901
Frozen mixed vegetables 17.33 NA 25.05
Soy beans 13.29 NA 24.82
Fresh Kiwi 22.63 NA 25.06
Cocoa cream 23.92 NA 24.68
Sweets 32.47 NA 25.32
Cocoa Powder 19.90 NA 24.95
Cooked corn flour 13.04 NA 33.152
Corn 12.81 NA 25.34
Macaroni 15.85 NA 25.24
Corn starch 23.71 NA 25.30
Breakfast cereals 34.20 NA 25.10
Soy lecithin 33.33 NA 25.10
Bread 18.48 NA 33.671
Biscuits 17.66 NA 25.30
Cupcakes 20.68 NA 25.34
Ham NA 8.62 28.912
Pate NA 14.85 25.82
Fresh liver NA 3.99 36.702
Frozen tuna NA 9.23 27.84
Canned mussels NA 24.45 27.87
Frozen crab sticks surimi NA 10.58 26.87
Potato omelette 28.38 NA 25.00
Egg custard NA 20.11 26.73
Eggs NA 18.65 26.56
White sugar 36.94 NA 25.09
Brown sugar 37.69 NA 25.25
Honey 32.03 NA 25.28
Gelatine NA 21.01 26.50
Food colorant 28.75 NA 25.34
Concentrate soup NA 21.02 26.56
Beef based baby food 31.33 NA 34.451
23/34

Table 9: Ct obtained in the RT-PCR assays using DNA samples extracted with MagMaxTM Express 96 Extraction.
Notes:
1 Partial or total inhibition of the DNA amplification. 2 The delayed IPC Ct observed in these cases is due to the presence of a large amount of plant/animal DNA present in the reaction which quickly consumes the reaction reagents, resulting in a late detection of the IPC amplification. In these cases, it is possible to reduce that effect diluting the DNA before performing again the RT-PCR or repeating the DNA extraction protocol decreasing the amount of initial sample.
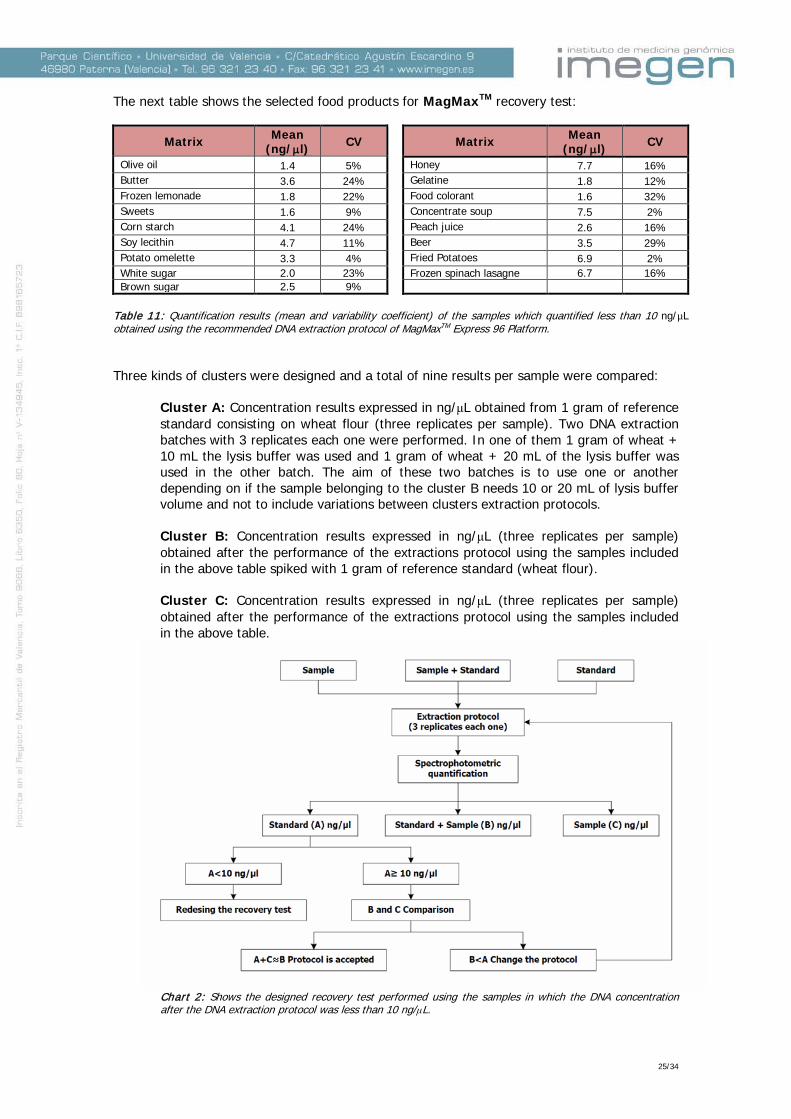
6.4. Recovery tests The aim of the recovery tests is to highlight the matrix effect and to verify the appropriateness of the DNA extraction procedure. The performance of recovery test made us possible to confirm that the low DNA quantification after the use of the extraction protocol is due to the low amount of DNA in the sample instead of some compounds of the sample, like fat and others, to be inhibiting partially or totally the DNA extraction. To perform the recovery tests, the samples were selected in base of the yield obtained after the DNA extraction protocol (less than 10 ng/µL). The next table shows the selected food products for BeadRetrieverTM recovery test:
Matrix Mean (ng/µl) CV Matrix Mean
(ng/µl) CV
Olive oil 3.4 32% Potato omelette 3.2 4% Butter 2.2 3% Brown sugar 2.3 3%
Margarine 3.9 8% Honey 8.5 23% Frozen lemonade 3.3 15% Gelatine 1.3 19%
Sweets 2.7 8% Peach juice 2.0 13% Corn starch 2.7 8% Beer 2.0 5%
Breakfast cereals 0.7 20% Fried maize 5.9 16% Soy lecithin 6.1 19% White Sugar 5.8 2%
Table 10: Quantification results (mean and variability coefficient) of the samples which quantified less than 10 ng/µL obtained using the recommended DNA extraction protocol of BeadRetrieverTM Platform.
Sample Ct Plant Ct Animal Ct IPC
Baby milk 30.65 NA 24.88
Baby Pap 19.12 NA 25.01
Peach juice 32.48 NA 25.21
Coffee 34.15 NA 25.37
Beer 38.44 NA 25.22
Fried maize 23.85 NA 26.17
Fried Potatoes 19.94 NA 33.471
Peanuts 14.34 NA 25.18
Cooked canned lentils 34.79 NA 24.81
Frozen spinach lasagne 20.88 NA 24.91
Cooked rice 20.46 NA 24.72
24/34
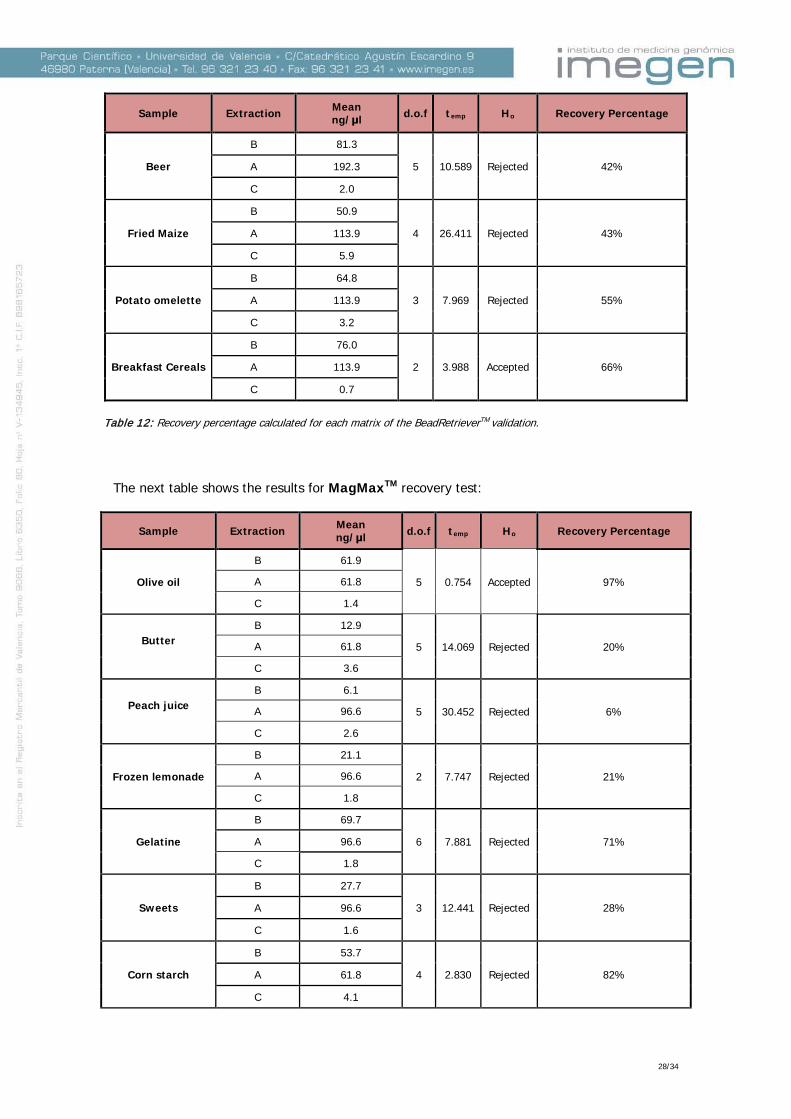
The next table shows the selected food products for MagMaxTM recovery test:
Matrix Mean (ng/µl) CV Matrix Mean
(ng/µl) CV
Olive oil 1.4 5% Honey 7.7 16% Butter 3.6 24% Gelatine 1.8 12% Frozen lemonade 1.8 22% Food colorant 1.6 32% Sweets 1.6 9% Concentrate soup 7.5 2% Corn starch 4.1 24% Peach juice 2.6 16% Soy lecithin 4.7 11% Beer 3.5 29% Potato omelette 3.3 4% Fried Potatoes 6.9 2% White sugar 2.0 23% Frozen spinach lasagne 6.7 16% Brown sugar 2.5 9%
Table 11: Quantification results (mean and variability coefficient) of the samples which quantified less than 10 ng/µL obtained using the recommended DNA extraction protocol of MagMaxTM Express 96 Platform. Three kinds of clusters were designed and a total of nine results per sample were compared:
Cluster A: Concentration results expressed in ng/μL obtained from 1 gram of reference standard consisting on wheat flour (three replicates per sample). Two DNA extraction batches with 3 replicates each one were performed. In one of them 1 gram of wheat + 10 mL the lysis buffer was used and 1 gram of wheat + 20 mL of the lysis buffer was used in the other batch. The aim of these two batches is to use one or another depending on if the sample belonging to the cluster B needs 10 or 20 mL of lysis buffer volume and not to include variations between clusters extraction protocols. Cluster B: Concentration results expressed in ng/μL (three replicates per sample) obtained after the performance of the extractions protocol using the samples included in the above table spiked with 1 gram of reference standard (wheat flour). Cluster C: Concentration results expressed in ng/μL (three replicates per sample) obtained after the performance of the extractions protocol using the samples included in the above table.
Chart 2: Shows the designed recovery test performed using the samples in which the DNA concentration after the DNA extraction protocol was less than 10 ng/μL.
25/34

The recovery percentage has been calculated with the mean of the three extractions for each cluster (individual dates not shown). To study if the sum of A and C means are statically equal to B mean, or conversely, if there are differences between the quantification results obtained for the clusters because of the influence of matrix properties in the extraction procedure, the following tests of hypotheses were proposed:
0
1
::
A C B
A C B
H m m mH m m m
+ =+ ≠
Where Xm is the population mean Regarding to the variance distributions we assume the worst case, that is, the variance of the three methods may be different. We also assume that the distribution of the sample means of the three procedures is approximately normal. Thus, two-tailed T-student test has been raised to the means comparison, assuming that in both populations the variances are different:
22 2
( )A C Bemp
CA B
A C B
X X Xtss s
n n n
+ −=
+ +
Where XX is the sample mean, 2Xs is the sample variance and Xn is the sample size.
empt values have been calculated and compared with the corresponding
/ 2gltα
value:
• α, which is a probability of error type I and determine the probability of rejecting the null hypotheses, being it true. In the statistical analyses this probability has been fixed, being equal to 5%.
• the degrees of freedom, which can be calculated with the following formula:
12
.. 22222
2222
−
+−+
+
++
=
B
B
B
BA
C
C
A
A
B
B
C
C
A
A
nnS
nnnS
nS
nS
nS
nS
fod
D.o.f to be taken into consideration shall be the nearest integer number.
After the statistical analyses it will be:
Accepted that A+C = B if / 2
emp glt tα≤, i.e. the low recovery is due to the low DNA
content of the matrix (no inhibition of recovery by the matrix).
Rejected that A+C = B if / 2
emp glt tα>, i.e. the matrix inhibits, totally or partially, the
DNA recovery.
26/34

The next table shows the results for BeadRetrieverTM recovery test:
Sample Extraction Mean ng/μl d.o.f temp Ho Recovery Percentage
Olive oil
B 107.2
6 2.193 Accepted 88% A 113.9
C 3.4
Butter
B 30.3
5 19.912 Rejected 26% A 113.9
C 2.2
Peach juice
B 192.3
4 19.240 Rejected 3% A 5.5
C 2.0
Margarine
B 5.2
4 43.163 Rejected 4% A 113.9
C 3.9
Frozen lemonade
B 40.0
3 6.645 Rejected 21% A 192.3
C 3.3
Gelatine
B 58.5
5 13.153 Rejected 30% A 192.3
C 1.3
Sweets
B 32.7
4 16.445 Rejected 17% A 192.3
C 2.7
Corn Starch
B 116.2
4 0,348 Accepted 99% A 113.9
C 2.7
Soy Lecithin
B 228.4
3 -1.167 Accepted 115% A 192.3
C 6.1
White Sugar
B 67.0
5 12.375 Rejected 56% A 113.9
C 5.8
Brown Sugar
B 52.6
3 9,050 Rejected 45% A 113.9
C 2.3
Honey
B 38.4
3 13.586
32% A 113.9 Rejected
C 8.5
27/34
Sample Extraction Mean ng/μl d.o.f temp Ho Recovery Percentage
Beer
B 81.3
5 10.589
42% A 192.3 Rejected
C 2.0
Fried Maize
B 50.9
4 26.411
43% A 113.9 Rejected
C 5.9
Potato omelette
B 64.8
3 7.969
55% A 113.9 Rejected
C 3.2
Breakfast Cereals
B 76.0
2 3.988 Accepted 66% A 113.9
C 0.7
Table 12: Recovery percentage calculated for each matrix of the BeadRetrieverTM validation.
The next table shows the results for MagMaxTM recovery test:
Sample Extraction Mean ng/μl d.o.f temp Ho Recovery Percentage
Olive oil
B 61.9
5 0.754 Accepted 97% A 61.8
C 1.4
Butter
B 12.9
5 14.069 Rejected 20% A 61.8
C 3.6
Peach juice
B 6.1
5 30.452 Rejected 6% A 96.6
C 2.6
Frozen lemonade
B 21.1
2 7.747 Rejected 21% A 96.6
C 1.8
Gelatine
B 69.7
6 7.881 Rejected 71% A 96.6
C 1.8
Sweets
B 27.7
3 12.441 Rejected 28% A 96.6
C 1.6
Corn starch
B 53.7
4 2.830 Rejected 82% A 61.8
C 4.1
28/34

Sample Extraction Mean ng/μl d.o.f temp Ho Recovery Percentage
Soy lecithin
B 105.7
3 -0.522 Accepted 104% A 96.6
C 4.7
White sugar
B 25.2
6 12.671 Rejected 40% A 61.8
C 2.0
Brown sugar
B 28.1
5 8.374 Rejected 41% A 61.8
C 2.5
Honey
B 26.0
5 15.497 Rejected 37% A 61.8
C 7.7
Beer
B 53.8
6 12.642 Rejected 54% A 96.6
C 3.5
Potato omelette
B 37.5
5 10.008 Rejected 58% A 61.8
C 3.3
Frozen Spinach lasagne
B 79.6
6 -0.636 Accepted 107% A 61.8
C 6.7
Concentrate soup
B 52.4
6 4.593 Rejected 77% A 61.8
C 7.5
Food colorant
B 1.2
4 24.799 Rejected 2% A 61.8
C 1.6
Fried Potatoes
B 196.4
2 -6.160 Rejected 275% A 61.8
C 6.9
Table 13: Recovery percentage calculated for each matrix of the MagMaxTM validation.
A high fat content in the samples or very acidic samples may interfere with the magnetic performance of the DNA extraction. In some cases, even when the statistical test rejects the null hypothesis, the amount of DNA obtained could be enough to perform the following molecular tests, PCR and others. If the amount of DNA obtained using one extraction protocol is not enough to perform the following tests it would be necessary to change the protocol conditions or test another protocols based on other technologies like silica based protocols, etc. Other matrix, whose null hypothesis is also rejected, has a very low DNA content, but the recovery percentage is high; in these cases, although the protocol was modified, the yield would not change so much (for example: concentrate soup with a recovery percentage of 77%).
29/34
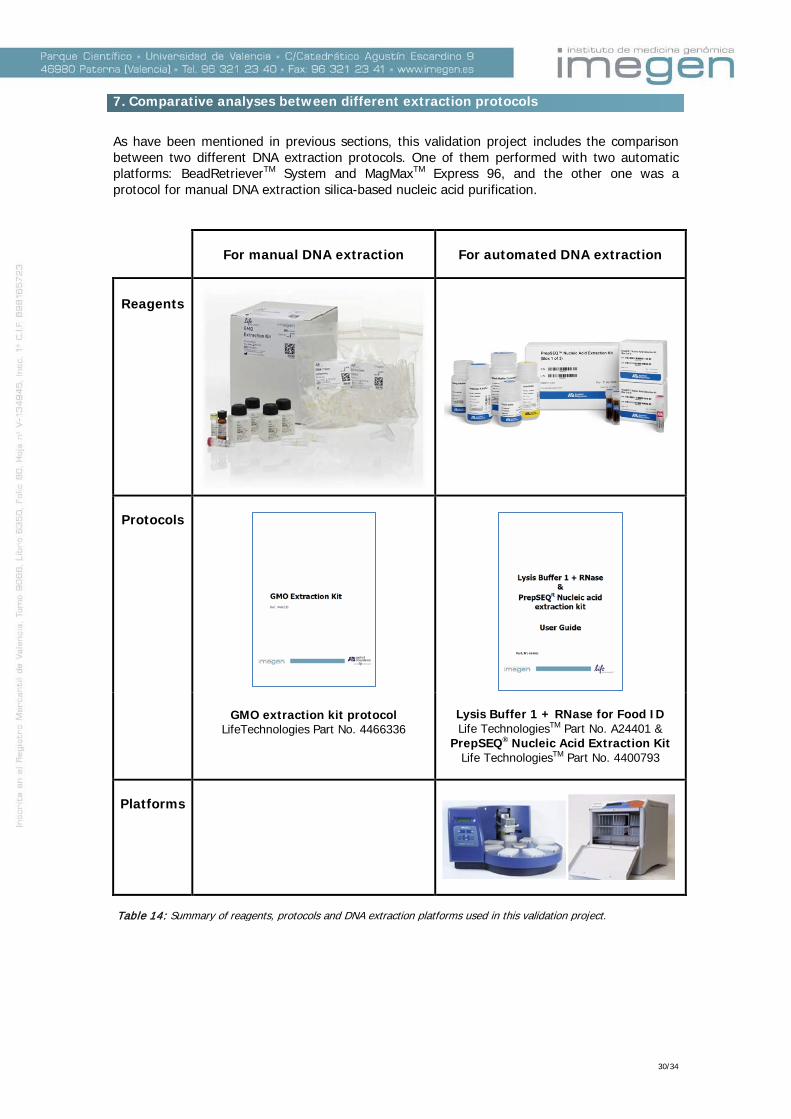
7. Comparative analyses between different extraction protocols
As have been mentioned in previous sections, this validation project includes the comparison between two different DNA extraction protocols. One of them performed with two automatic platforms: BeadRetrieverTM System and MagMaxTM Express 96, and the other one was a protocol for manual DNA extraction silica-based nucleic acid purification.
For manual DNA extraction For automated DNA extraction
Reagents
Protocols
GMO extraction kit protocol LifeTechnologies Part No. 4466336
Lysis Buffer 1 + RNase for Food ID Life TechnologiesTM Part No. A24401 &
PrepSEQ® Nucleic Acid Extraction Kit Life TechnologiesTM Part No. 4400793
Platforms
Table 14: Summary of reagents, protocols and DNA extraction platforms used in this validation project.
30/34
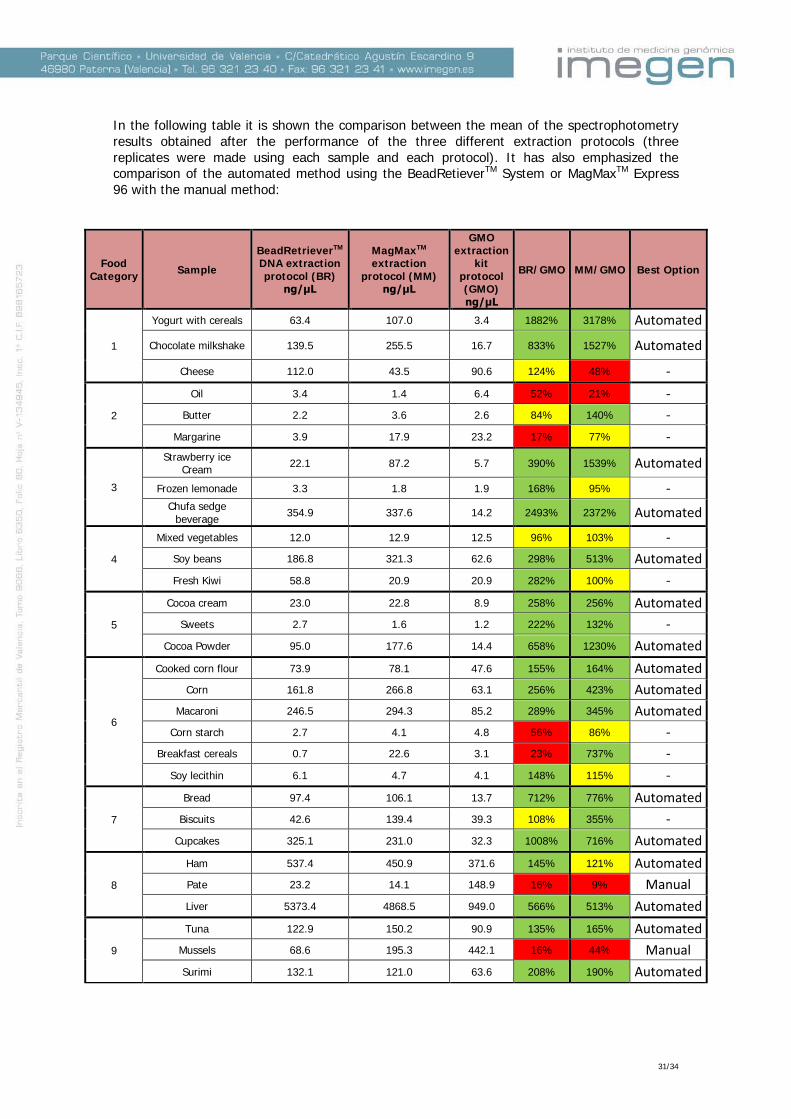
In the following table it is shown the comparison between the mean of the spectrophotometry results obtained after the performance of the three different extraction protocols (three replicates were made using each sample and each protocol). It has also emphasized the comparison of the automated method using the BeadRetieverTM System or MagMaxTM Express 96 with the manual method:
Food Category Sample
BeadRetrieverTM DNA extraction protocol (BR)
ng/μL
MagMaxTM extraction
protocol (MM) ng/μL
GMO extraction
kit protocol (GMO) ng/μL
BR/GMO MM/GMO Best Option
1
Yogurt with cereals 63.4 107.0 3.4 1882% 3178% Automated
Chocolate milkshake 139.5 255.5 16.7 833% 1527% Automated
Cheese 112.0 43.5 90.6 124% 48% -
2
Oil 3.4 1.4 6.4 52% 21% - Butter 2.2 3.6 2.6 84% 140% -
Margarine 3.9 17.9 23.2 17% 77% -
3
Strawberry ice Cream 22.1 87.2 5.7 390% 1539% Automated
Frozen lemonade 3.3 1.8 1.9 168% 95% - Chufa sedge
beverage 354.9 337.6 14.2 2493% 2372% Automated
4
Mixed vegetables 12.0 12.9 12.5 96% 103% - Soy beans 186.8 321.3 62.6 298% 513% Automated Fresh Kiwi 58.8 20.9 20.9 282% 100% -
5
Cocoa cream 23.0 22.8 8.9 258% 256% Automated Sweets 2.7 1.6 1.2 222% 132% -
Cocoa Powder 95.0 177.6 14.4 658% 1230% Automated
6
Cooked corn flour 73.9 78.1 47.6 155% 164% Automated Corn 161.8 266.8 63.1 256% 423% Automated
Macaroni 246.5 294.3 85.2 289% 345% Automated Corn starch 2.7 4.1 4.8 56% 86% -
Breakfast cereals 0.7 22.6 3.1 23% 737% - Soy lecithin 6.1 4.7 4.1 148% 115% -
7
Bread 97.4 106.1 13.7 712% 776% Automated Biscuits 42.6 139.4 39.3 108% 355% -
Cupcakes 325.1 231.0 32.3 1008% 716% Automated
8
Ham 537.4 450.9 371.6 145% 121% Automated Pate 23.2 14.1 148.9 16% 9% Manual Liver 5373.4 4868.5 949.0 566% 513% Automated
9
Tuna 122.9 150.2 90.9 135% 165% Automated Mussels 68.6 195.3 442.1 16% 44% Manual Surimi 132.1 121.0 63.6 208% 190% Automated
31/34

Food Category Sample
BeadRetrieverTM DNA extraction protocol (BR)
ng/μL
MagMaxTM extraction
protocol (MM) ng/μL
GMO extraction
kit protocol (GMO) ng/μL
BR/GMO MM/GMO Best Option
10
Potato omelette 3.2 3.3 5.7 56% 58% Manual Egg custard 12.3 11.1 2.5 484% 436% Automated
Eggs 16.5 11.0 29.0 57% 38% -
11
Sugar 5.8 2.0 1.9 300% 103% - Brown sugar 2.3 2.5 4.0 57% 62% Manual
Honey 8.5 7.7 5.5 154% 140% -
12
Gelatine 1.3 1.8 9.6 14% 18% Manual Food colorant 53.1 1.6 20138.6 0%* 0%*
Concentrate soup 11.1 7.5 26.8 41% 28% Manual
13
Beef baby food 18.7 23.0 34.0 55% 68% - Follow-on baby milk 27.9 55.3 14.3 195% 386% Automated
Baby Pap 44.7 65.9 29.4 152% 224% Automated
14
Peach juice 2.0 2.6 9.7 21% 27% Manual Coffee 67.4 154.5 89.6 75% 172% - Beer 2.0 3.5 2.8 71% 124% -
15
Fried maize 5.9 72.3 43.5 13% 166% - Fried Potatoes 10.9 6.9 46.8 23% 15% Manual
Peanuts 325.4 164.2 221.6 147% 74% -
16
Cooked lentils 14.1 7.4 4.4 323% 169% Automated Spinach lasagne 14.6 6.7 26.9 54% 25% Manual
Prepared rice 86.0 108.2 21.7 454% 500% Automated
Table 15: Results comparison between different extraction protocols.
*Note: The elute obtained from this sample using the manual DNA extraction method was orange so, the value of the spectrophotometric quantification was unreliable.
Matrices which DNA extraction is better with the automated procedure (>125%).
Matrices which automated DNA extraction is similar to manual procedure (75%-125%)
Matrices which DNA extraction is better with manual procedure (<75%)
In the “best option” column of the table 15 is shown which of the procedures automated or manual are the best option depending of the food analized. In the cases in which only one of the automatic platforms is statistically better than the manual platform or there are not significant differences between the three protocols, no best option has been shown (-). The statistic test that has been raised to the means comparison is the two-tailed T-student test. It has been assumed that, in data populations the variances are different and it has been fixed the probability of error type I (error of first kind) α (probability of rejecting the null hypothesis when it is true), being equal to 5%.
32/34
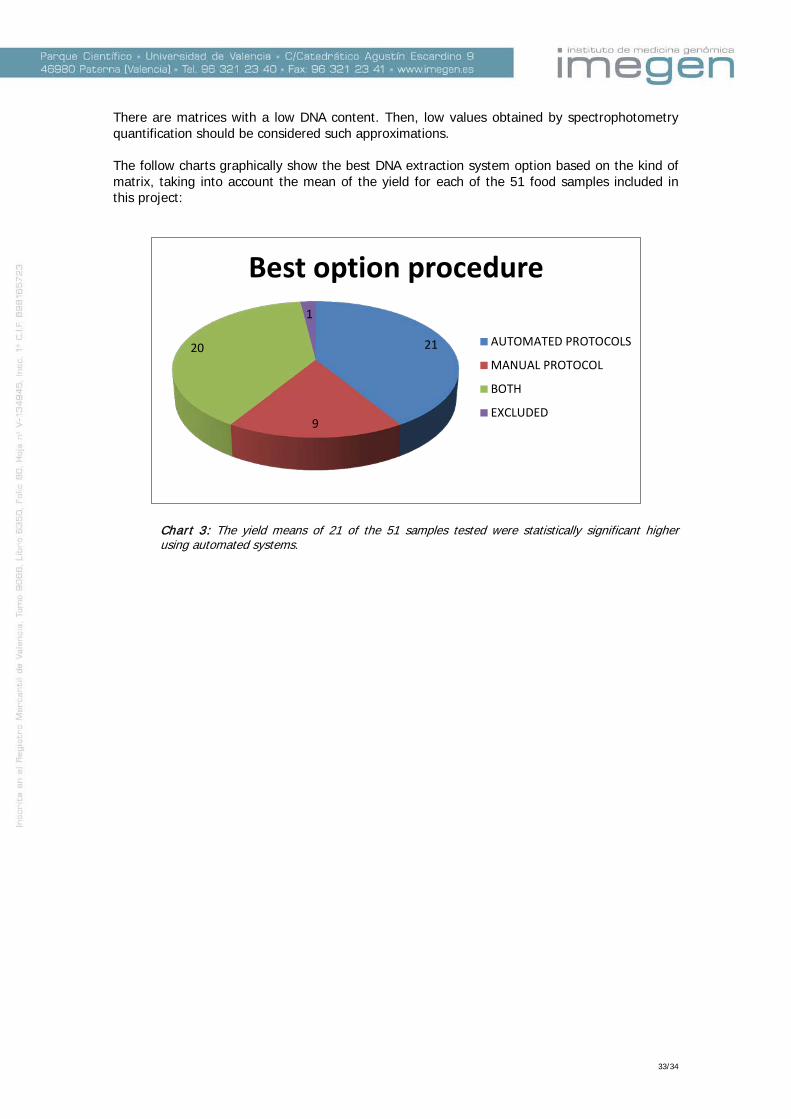
There are matrices with a low DNA content. Then, low values obtained by spectrophotometry quantification should be considered such approximations. The follow charts graphically show the best DNA extraction system option based on the kind of matrix, taking into account the mean of the yield for each of the 51 food samples included in this project:
Chart 3: The yield means of 21 of the 51 samples tested were statistically significant higher using automated systems.
21
9
20
1
Best option procedure
AUTOMATED PROTOCOLS
MANUAL PROTOCOL
BOTH
EXCLUDED
33/34

8. Conclusions
1. According to the coefficient of variation (CV) and means results obtained using a wide range of food samples, the extraction protocol based on the use of Lysis Buffer 1 + RNase for Food ID together with PrepSEQ® Nucleic Acid Extraction Kit is repeatable and reproducible.
2. Total inhibition has not been observed. DNA obtained from sample matrices has been amplifiable although, partial inhibition has been observed in some of the cases.
3. For most of the samples, higher yields were obtained using automated DNA extraction systems in comparison with the manual DNA extraction method.
4. In case of fats and samples in which pH is extreme, interfere with the magnetic
performance of the extraction have were seen. Therefore, we recommend the use of manual protocols with this kind of samples.
5. Automated DNA extraction systems avoid inhibition and quantification problems
derivate from samples with coloured ingredients.
The data reported confirm that the BeadRetrieverTM System and MagMaxTM Express 96 automatic extractor platforms, together with the Lysis Buffer 1 + RNase for Food ID and the PrepSEQ® Nucleic Acid Extraction Kit (Applied Biosystems), applied to different food and feed samples produces DNA of suitable quality and quantity for subsequent PCR-based detection and quantification applications, like genetically modified organism or species identification and quantification.
34/34