anne arundel community college / fy 2018 … arundel community college/ fy 2018 ... anne arundel...
TRANSCRIPT
A N N E A R U N D E L C O M M U N I T Y C O L L E G E / F Y 2 0 1 8
Annual Budget

ANNE ARUNDEL COMMUNITY COLLEGE / FY 2018 ANNUAL BUDGET
1
Board of Trustees Anne Arundel Community College’s governing board is comprised of eight trustees who are appointed by the governor with Maryland Senate advice and consent. Trustees serve a term of six years with the exception of the student trustee, who serves for one year.
Student Member Selection – The college seeks applications each spring for the student member of the board of trustees. Applicants are interviewed by a committee of students and staff. The committee recommends the candidate to the AACC president, who sends the candidate’s name to the governor’s office for appointment.
2017-2018 Board of TrusteesLawrence W. Ulvila, Jr., chair
Sandra E. Moore, vice chair
Nyia Curtis, student member
Paula J. Darrah, J.D.*
Rev. Dr. Diane R. Dixon-Proctor
Walter J. Hall
James H. Johnson Jr., Ph.D.*
Jerome W. Klasmeier*
Executive Leadership Dr. Dawn Lindsay, Ed.D., president
Melissa A. Beardmore, CPA, vice president, Learning Resources Management
Michael H. Gavin, Ph.D., vice president, Learning
Felicia L. Patterson, vice president, Learner Support Services
*Budget Committee member

2
G O V E R N M E N T F I N A N C E O F F I C E R S A S S O C I A T I O N
Distinguished Budget Presentation
Award
PRESENTED TO
ANNE ARUNDEL COMMUNITY COLLEGE
MARYLAND
FOR THE FISCAL YEAR BEGINNING
JULY 1, 2016

ANNE ARUNDEL COMMUNITY COLLEGE / FY 2018 ANNUAL BUDGET
3
TABLE OF CONTENTS
PRESIDENT’S LETTER .......................................................................................................................5
FY2018 EXECUTIVE SUMMARY ...................................................................................................6
INPUTS TO BUDGET PROCESS ...................................................................................................10Guiding Principles ............................................................................................................................................................................ 10
Financial Policies and Procedures ................................................................................................................................................. 11
Environmental Assessment ........................................................................................................................................................... 14
AACC Overview .................................................................................................................................................................................14
Community Overview ....................................................................................................................................................................... 15
Organization Chart ............................................................................................................................................................................18
Organization Descriptions ...............................................................................................................................................................19
Long Term Financial Planning .......................................................................................................................................................22
Facilities Planning ............................................................................................................................................................................25
Enrollment Planning........................................................................................................................................................................29
Key Performance Indicators ............................................................................................................................................................ 31
Comprehensive Program Review .................................................................................................................................................. 32
DEFINE GOALS IDENTIFY GAPS ................................................................................................. 34Planning and Institutional Goals ...................................................................................................................................................34
Strategic Planning and Budgeting Process .................................................................................................................................35
Strategic Planning and Institutional Goals .................................................................................................................................36
College Wide Goals ........................................................................................................................................................................37
Strategic Plan ....................................................................................................................................................................................38
Team Strategic Goals ..................................................................................................................................................................... 40
DEVELOP STRATEGIES TO CLOSE GAPS .................................................................................. 42Institutional Priorities ..................................................................................................................................................................... 42
College Plan .......................................................................................................................................................................................43
4
PRIORITIZE SPENDING AND RESOURCE ALLOCATION ..................................................... 45The Budget Process .........................................................................................................................................................................45
Budget Calendar .............................................................................................................................................................................. 46
Planning Calendar ...........................................................................................................................................................................47
Budget Assumptions ...................................................................................................................................................................... 48
Financial Plan - Revenue and Expenditure Summary .............................................................................................................. 50
Prioritize Spending ...........................................................................................................................................................................57
Sunset Programs ............................................................................................................................................................................... 57
Finding Efficiencies ........................................................................................................................................................................... 57
FY2018 Schedule of Budgeted Revenue and Expenditures by Fund. ....................................................................................59
Operating Fund by Functional Area ............................................................................................................................................. 59
Operating Fund by Object Summary ...........................................................................................................................................60
Other Funds Summary ......................................................................................................................................................................61
Auxiliary Fund by Division .............................................................................................................................................................. 62
Enterprise Fund by Division ............................................................................................................................................................ 63
Restricted Fund by Division ............................................................................................................................................................64
Summary all Funds ............................................................................................................................................................................ 65
GASB 45 Trust / Tuition Stabilization Fund .............................................................................................................................. 65
Capital Budget ....................................................................................................................................................................................66
AACC Assessment Process ...........................................................................................................................................................74
Fund Definitions ...............................................................................................................................................................................75
Functional Expense Definitions .....................................................................................................................................................75
Glossary of Terms ............................................................................................................................................................................76
Table of Contents (Continued)

ANNE ARUNDEL COMMUNITY COLLEGE / FY 2018 ANNUAL BUDGET
5
A LETTER FROM THE PRESIDENT
October 17, 2017
Members of the college community,
I am pleased to present the fiscal year 2018 budget in support of the college’s strategic plan FY2017-2020: Engagement Matters: Pathways to Completion, which focuses on creating the ideal conditions for student success. The goals and objectives of the strategic plan are designed to transform our college, ensuring students find a welcoming and supportive environment that best positions them for success. Three overarching goals support the student journey, “Engagement and Entry”, “Progress” and “Completion.”
Through a comprehensive budgeting process, AACC’s annual operating budget is both realistic and forward-thinking, and will help us achieve the objectives while adhering to a strong commitment to academic excellence. This is the fundamental foundation upon which our work and continued reputation as a college of distinction is built.
Extensive research and data supports the most effective way to ensure students complete their certificate or degree is through the establishment of strong and meaningful relationships with faculty and staff; thus the focus on “engagement.” The goal is to be “student ready,” to meet all students “where they are” as they begin their educational journey at AACC.
Institutional policies, procedures and resources are continually evaluated to ensure equity, so that every student is provided with the opportunity and resources to complete their educational goals and improve their lives.
As always, I am grateful for the faculty and staff at Anne Arundel Community College and for the community support from our neighbors and partners in the region. Thank you for everything you do to help our students find success through their journey at AACC.
Dr. Dawn Lindsay President, Anne Arundel Community College

6
FY 2018 EXECUTIVE SUMMARYThe College’s FY 2018 budget was developed with focus on funding student completion initiatives that support the goals contained in our strategic plan, on strengthening the college’s investment in faculty and staff, and securing funding for a new Health Sciences and Biology building.
Anne Arundel Community College is undergoing an educational and operational transformation supported by the strategic plan: Engagement Matters: Pathways to Completion (FY 2017–FY 2020). The college is shifting from its traditional focus on access to a broader focus on both access and completion, creating ideal conditions to ensure that every student who comes to AACC has an equal opportunity to achieve their educational goals and earn family-sustaining wages.
The college continues to face resource challenges due to declining enrollment and state support while balancing the rising cost of programs with the need to maintain affordable access to education. As a result, reallocations and identified cost savings and efficiencies continued to play a key role in developing funding solutions for the FY 2018 budget.
The FY 2018 budget was approved by the Anne Arundel County Council on June 14, 2017, as follows:
Operating Fund $114,191,000
Auxiliary, Enterprise, Restricted Fund $42,028,000
Capital – FY 2018 only $14,865,000
Total All Funds $171,084,000

ANNE ARUNDEL COMMUNITY COLLEGE / FY 2018 ANNUAL BUDGET
7
Revenue Budget by Fund TypeThe annual budget is prepared using the cash plus encumbrances basis of accounting. This method of accounting differs from the presentation in the college’s annual audited financial statements, which are prepared in accordance with U.S. generally accepted accounting principles (GAAP) and the accrual basis of accounting. The primary differences between the college's budgetary accounting basis and GAAP are the timing of the recording of expenditures and that certain encumbered amounts are reflected as expenditures for budget purposes. In addition the utilization of fund balance (the college's Tuition Stabilization Fund) is reflected as a revenue source for budget purposes.
The operating budget is structurally balanced. In order to balance the operating budget a transfer of $3,203,600 from the tuition stabilization fund has been budgeted in FY 2018, funding 2.8 percent of the operating budget. The tuition stabilization fund is a one-time funding source; however the college has historically underspent the approved appropriation due to timing of initiatives and cost containment activity implemented during the year, making this a relatively stable source of funding for a small percentage of the overall budget.
Operating Fund - This represents a modest $426,100 increase over the FY 2017 budget. The state appropriation is budgeted to increase $470,400 due to a one-time grant awarded for keeping tuition below a 2 percent increase. State aid under the Cade funding formula is flat from the FY 2017 budget. State funding also includes $200,000 for AACC at Arundel Mills, which is the base funding level for regional higher education centers. The county appropriation, excluding debt service, is budgeted to increase by $1,600,000 or 4 percent. AACC’s board of trustees approved a $2 tuition and $1 educational service fee rate increase offsets enrollment declines, resulting in an overall budgeted decrease of $1,487,000 for tuition and fee revenue. The FY 2018 budget includes an approved 2 percent compensation pool, a 2 percent adjunct rate increase and a 0.5 percent market rate adjustment pool in support of the college’s effort to maintain a high quality workforce and align salaries with market rates. Salary increases are supported by an increase in county funding. As a result of reallocations the college was able to fund several initiatives that will allow us to make strategic investments in support of student completion and bring these initiatives to scale, such as increasing support services in advising and student orientation and creating an assistant dean position in the School of Liberal Arts to provide oversight of the Transfer Studies degree program. However, due to funding challenges the college was not able to fund $2,247,000 of essential technology needs to ensure that students have access to current equipment. Funding for these necessary upgrades will need to be reallocated during the year if and when projected cost savings are identified.
Auxiliary, Enterprise, Restricted Fund – The FY 2018 expenditure budget for the auxiliary, enterprise and restricted fund total $42,028,000. This represents an overall 7 percent decrease from the FY 2017 budget.
AUXILIARY E NTE RPRISE RESTRIC TE D TOTAL
Revenue 8,777,000 11,602,000 21,515,000 41,894,000
Expenditures 8,431,000 12,082,000 21,515,000 42,028,000
Surplus / (Deficit) 346,000 (480,000) - (134,000)
Operating
Auxiliary
Enterprise
Restricted
Capital
9%
12%
7%
5%
67%
8
• Auxiliary Fund – Auxiliary activity consists of bookstore, dining services and the child development center. Auxiliary fund revenues are budgeted to decrease 6 percent from the FY 2017 budget. Effective with the FY 2018 budget, dining services has been outsourced reducing the budgeted revenue and expense, while at the same time increasing the surplus. In addition, bookstores sales are budgeted to decrease 11 percent as a result of the enrollment declines the college has experienced over the past few years. The FY 2018 budgeted surplus for the auxiliary fund is $346,000, a 37 percent decrease from the FY 2017 budget primarily due to declining margins in the bookstore as operating efficiencies are outpaced by enrollment declines and increasing access to low-cost or no-cost textbooks.
• Enterprise Fund – Enterprise activity is primarily contract training. Enterprise fund revenues are budgeted to increase 4 percent from the FY 2017 budget. The enterprise fund is responsible for covering the lease costs associated with the Center for Cyber and Professional Training location. This location gives the college surplus space for both cyber and corporate level training activities. However the cost of the space does create fiscal challenges for the operations, and the college continues to explore ways to enhance productivity of the space. The FY 2018 budgeted deficit for the enterprise fund is $480,000 a 2.5 percent improvement over the FY 2017 budgeted deficit primarily due to an increase in budgeted contract activity.
• Restricted Fund – These are funds restricted by donors or other outside agencies for specific purposes. The restricted fund budget decreased $3,110,000 or 13 percent from the FY 2017 budget largely due to reductions in financial aid programs and federal and state grants where the college is the fiscal agent. Fifty-eight percent of the restricted fund budget is financial aid.
• Capital Budget – With the FY 2018 capital budget, the college received $13,040,000 in state and county funding to support its number one capital priority, the Health Sciences and Biology building. This multi-year project includes a significant transformation of the Arnold campus and has a total projected cost of $116,952,000 that will be funded through state and county support through FY 2021.
• Challenges – Funding of the operating budget consists of three funding streams: the college, primarily through tuition and fee revenue; state appropriations; and county appropriations. With the enrollment decline from the peak in FY 2011 modest tuition increases have not kept pace with declining enrollment. At the state level the appropriation funding formula has been altered seven times since 2008 reducing the annual state aid allocation to community colleges. The challenges with tuition and fee revenue and state appropriations have caused an increasing reliance on county funding, with the county funding share of the operating budget increasing from 33 percent in FY 2011 to 37 percent in the FY 2018 budget. To balance declining resources with increasing program costs, the college has held critical position recruitments and used reallocations to fund high priority strategic and operational initiatives, which result in continued reductions in resources, both human and fiscal, for existing programs. To address these challenges the college implemented cost containment strategies that have saved $28,610,778 since 2011. The college continues to review operations to improve efficiencies or improve performance outcomes in order ensure the most efficient use of available resources. In FY 2017 the college completed a LEAN re-engineering and process review of the application to first time in the classroom experience of students. This re-engineering and process review was conducted by one of the strategic planning work teams and facilitated recommendations for improving the student experience while at the same time improving the efficiency of operations. The college has also created an office of enrollment management and strategy focused on planning, research and institutional assessment to identify and support initiatives designed to help the college meet its enrollment goals and activity planned in the strategic plan.

ANNE ARUNDEL COMMUNITY COLLEGE / FY 2018 ANNUAL BUDGET
9

10
INPUTS TO BUDGET PROCESS
FY 2018 Budget Development Guiding Principles • Clear and open communication to stakeholders.
• A long-term perspective inclusive of resource allocations to support the attainment of the strategic plan goals and maintaining affordability for our students.
• Data utilization and monitoring to evaluate operations and the efficient allocation of resources across all funds.
• Reallocation of existing resources and cost efficiencies to support the highest priority requests.
• Small tuition and fee increases while maximizing enrollment.
• Revenue diversification and expansion/cost containment.
• Responsible use of TSF to balance the budget.
• Proactive in addressing past and current Other Post-Employment Benefit costs.

ANNE ARUNDEL COMMUNITY COLLEGE / FY 2018 ANNUAL BUDGET
11
Financial Policies and ProceduresBudget PreparationPursuant to the Maryland Annotated Code, Education Article Section 16-301 the college is required to prepare an annual budget.
(a) Preparation – Each year, the board of trustees and the president of each community college shall prepare and submit to the county governing body or, in the case of a regional community college, the county governing body of each county that supports the regional community college:
1. An operating budget; and
2. A capital budget; and
3. If required by local law, charter or regulation, a long-term capital improvement program.
(b) Contents of operating budget – The operating budget shall show:
1. All revenues estimated for the next fiscal year classified by funds and sources of income, including:
i. Any funds from federal, State, and local sources; and
ii. Any surpluses
Debt Service Pursuant to the Maryland Annotated Code, Education Article Section 16-305 the college is authorized to incur debt only for the purpose provided by this section.
This debt policy is intended to meet the needs of the college, promote continued sound financial management and be consistent with all applicable state and local laws and applicable college policies.
• The college shall only borrow money and incur debt for the purposes provided by the Maryland Annotated Code, Education Article Section 16-302.
• The college shall only borrow money and incur long-term debt from the purposes provided above when it is in the best interest of the college.
• All multi-year financing agreements for the purchases provided by the Maryland Annotated Code, Education Article Section 16-302 shall include a provision allowing cancellation by the Board of Trustees at the end of the fiscal year if sufficient funds are not appropriated to fund the agreement in subsequent years.
• The college shall not use variable rate debt instruments but rather fixed rate instruments in all financing agreements entered into pursuant to this policy.
• The college shall maintain open communication and full disclosure with appropriate bond rating agencies and external financial auditors concerning its financial condition.
Under these provisions, the college is limited to debt associated with leases as budgeted in the operating fund.
Tuition Stabilization FundRecognizing the importance of carrying an appropriate level of tuition stabilization fund, Anne Arundel Community College maintains between 5 percent and 10 percent of its current fiscal year total budgeted expenditures as its tuition stabilization fund. The college administration annually will make recommendations to the Board of Trustees in the use of any tuition stabilization fund over this percent as a part of the regular budget development process. This policy and process ensures that the college will maintain a strong, conservative financial position and flexibility to meet future institutional needs while at the same time preserving the appropriate level of Board of Trustees’ financial oversight and control.

12
Tuition PolicyStudents at Anne Arundel Community College are charged tuition according to their residence for tuition purposes and are classified as one of the following:
• in-county residents (a resident of Anne Arundel County);
• out-of-county, in-state residents, i.e., residents of other Maryland counties or Baltimore City; or
• out-of-state residents (a resident of a state other than Maryland or a foreign country).
Students have the responsibility to provide appropriate documentation to establish residency for tuition purposes.
Students shall be considered “in-county” or “out-of-county, in-state” residents of Maryland for tuition purposes if:
• they maintain their legal domicile there for or a period of not less than three months before the starting date of the session for which they enroll; or
• if another person or persons maintaining legal domicile in Maryland had contributed more than one-half of the student’s financial support during the most recent completed tax year; or
• they are receiving an Edward T. Conroy Memorial Scholarship from the Maryland Higher Education Commission.
Tuition for members of the United States Armed Forces, their spouses and dependent children:
• Students who are members of the United States Armed Forces, regardless of domicile, duty station or residence, will be classified as “in-county” residents for tuition purposes.
• Students who are a spouse or dependent child of a member of the United States Armed Forces who resides in Anne Arundel County will be classified as “in-county” residents for tuition purposes regardless of the length of residency;
• Students who are the spouse or dependent child of a member of the United States Armed Forces who resides in Maryland, outside of Anne Arundel County, will be classified as “out of county, in state” residents for tuition purposes regardless of the length of residency;
• Students who are the spouse or dependent child of a member of the United States Armed Forces whose domicile or duty station changes from an in-state location to a
• location outside of the state of Maryland will be classified as “out-of-county, in-state” residents for tuition purposes as long as they remain continuously enrolled.
• Students who are discharged United State Armed Forces qualified veterans who graduated from a Maryland high school will be classified as “out-of-county, in-state” residents for tuition purposes, even if residing outside the state of Maryland.
• Students who are receiving Montgomery or Post-9/11 GI Bill educational benefits who enroll within three years of discharge and their spouse or dependent children who enroll within three years of the qualified veteran’s (transferor’s) discharge will be classified as either “in county,” if a resident of Anne Arundel County, or “out-of-county, in-state,” even if residing outside the state of Maryland, for tuition purposes.
• Students receiving a Fry Scholarship will be classified as either “in county” if a resident of Anne Arundel County or “out-of-county, in-state,” even if residing outside the state of Maryland, for tuition purposes
Students who are Anne Arundel County public school teachers who enroll in a course required for employment are classified as “in-county resident” for tuition purposes even if residing outside of Anne Arundel County.

ANNE ARUNDEL COMMUNITY COLLEGE / FY 2018 ANNUAL BUDGET
13
Long-Term Financial Planning Long-term financial planning combines financial forecasting with strategic planning to ensure that resources are aligned with strategic goals and support long- term sustainability. As part of the budget development process a long-term financial plan will be created. The long-term financial plan will include scenarios five years into the future. The document is intended to provide general information and facilitate informed, long-term, strategic financial planning in the development of both revenue and expenditure goals. The long-term financial plan will be updated as needed throughout the budget development process and forecast enrollment, revenue, expenditures and changes in fund balance for the operating and capital fund. The long-term financial plan will start with baseline assumptions adjusted for one-time revenue sources or expenditure cuts. Revenue and expenditure assumptions will be developed based on analysis of on-going trends and spending patterns. The capital budget will be developed based on inputs from the 10-year Facilities Master Plan.
Asset Maintenance and ReplacementAsset maintenance and replacement supports student success, accommodates current and new instructional delivery and technology, encourages sustainable practices, provides sustainable buildings, strives for consistency, and helps maximize college enrollments and the efficient use of space. Maintenance and replacement plans for assets are prioritized during the budget development process in accordance with overall goals and objectives to maintain expected level of service for students, faculty, staff and visitors. A multiyear capital budget is prepared annually as part of the budget development process and demonstrates the needs of the college for repair and replacement of capital assets in order to continue to provide services that contribute to public health, safety and quality of life.
Monitoring Revenue and ExpendituresFunds must be spent in accordance with college policy and procedures. Individuals with budgetary responsibility are charged with properly monitoring the budget and resources under their control to ensure that activity is in support of the college’s mission and that expenditures do not exceed appropriation authority.
Operating Fund - The budget office is responsible for preparing monthly projections to monitor enrollment, revenue and expenditures compared to the budget. Adjustments are made as needed to offset any declines in revenue as a result of declining enrollment or rescission of state funding. If expenditures are projected to exceed the functional area appropriation, the college looks to control expenditures by cost containment initiatives in order to stay within the budget appropriation.
Auxiliary Enterprise Fund - Services operate on a self-supporting basis. The budget office prepares quarterly projections to monitor revenue and expenses compared to the budget.
Restricted Fund - The accounting department is responsible for preparing monthly reconciliations and financial reports as required by the funding agencies. This process ensures that expenditures do not exceed the funding authorization and ensures that reimbursement is received from the funding source.
Capital Fund – The budget office is responsible for preparing a monthly reconciliation to ensure that expenditures do not exceed the county and state expense appropriation and calculate the authorized revenue reimbursement.
14
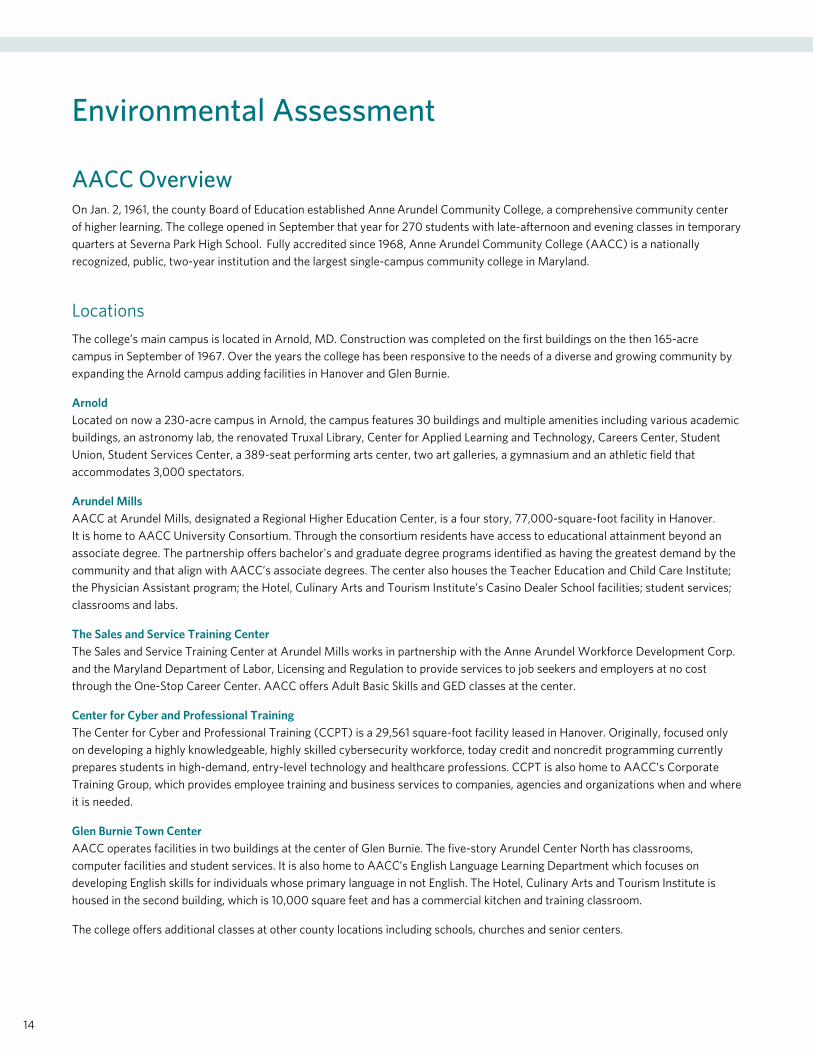
Environmental Assessment
AACC OverviewOn Jan. 2, 1961, the county Board of Education established Anne Arundel Community College, a comprehensive community center of higher learning. The college opened in September that year for 270 students with late-afternoon and evening classes in temporary quarters at Severna Park High School. Fully accredited since 1968, Anne Arundel Community College (AACC) is a nationally recognized, public, two-year institution and the largest single-campus community college in Maryland.
LocationsThe college’s main campus is located in Arnold, MD. Construction was completed on the first buildings on the then 165-acre campus in September of 1967. Over the years the college has been responsive to the needs of a diverse and growing community by expanding the Arnold campus adding facilities in Hanover and Glen Burnie.
Arnold Located on now a 230-acre campus in Arnold, the campus features 30 buildings and multiple amenities including various academic buildings, an astronomy lab, the renovated Truxal Library, Center for Applied Learning and Technology, Careers Center, Student Union, Student Services Center, a 389-seat performing arts center, two art galleries, a gymnasium and an athletic field that accommodates 3,000 spectators.
Arundel Mills AACC at Arundel Mills, designated a Regional Higher Education Center, is a four story, 77,000-square-foot facility in Hanover. It is home to AACC University Consortium. Through the consortium residents have access to educational attainment beyond an associate degree. The partnership offers bachelor's and graduate degree programs identified as having the greatest demand by the community and that align with AACC’s associate degrees. The center also houses the Teacher Education and Child Care Institute; the Physician Assistant program; the Hotel, Culinary Arts and Tourism Institute’s Casino Dealer School facilities; student services; classrooms and labs.
The Sales and Service Training Center The Sales and Service Training Center at Arundel Mills works in partnership with the Anne Arundel Workforce Development Corp. and the Maryland Department of Labor, Licensing and Regulation to provide services to job seekers and employers at no cost through the One-Stop Career Center. AACC offers Adult Basic Skills and GED classes at the center.
Center for Cyber and Professional Training The Center for Cyber and Professional Training (CCPT) is a 29,561 square-foot facility leased in Hanover. Originally, focused only on developing a highly knowledgeable, highly skilled cybersecurity workforce, today credit and noncredit programming currently prepares students in high-demand, entry-level technology and healthcare professions. CCPT is also home to AACC’s Corporate Training Group, which provides employee training and business services to companies, agencies and organizations when and where it is needed.
Glen Burnie Town Center AACC operates facilities in two buildings at the center of Glen Burnie. The five-story Arundel Center North has classrooms, computer facilities and student services. It is also home to AACC’s English Language Learning Department which focuses on developing English skills for individuals whose primary language in not English. The Hotel, Culinary Arts and Tourism Institute is housed in the second building, which is 10,000 square feet and has a commercial kitchen and training classroom.
The college offers additional classes at other county locations including schools, churches and senior centers.

ANNE ARUNDEL COMMUNITY COLLEGE / FY 2018 ANNUAL BUDGET
15
Community OverviewIn 1650 the Maryland General Assembly created Anne Arundel County and named it after Lady Anne Arundell, the wife of Cecilius Calvert, founder and first Lord Proprietor of the colony Province of Maryland.
Currently over half a million people call Anne Arundel County home and the county continues to attract businesses and new residents because of its central location between Baltimore, and Washington D.C.; its proximity to Annapolis, the state capital; and the natural beauty and recreational opportunities offered by its 533 miles of shoreline.
The following chart illustrates the population demographics of the county. This information is taken from the U.S. Department of Commerce 2010 census and July 1, 2016, estimate.
Census Estimate
4/1/10 7/1/16 AACC
Population 537,656 568,346
Female 50.6% 50.5% 60.0%
Male 49.4% 49.5% 40.0%
White 75.4% 75.2% 60.1%
Black or African American 15.5% 17.2% 16.8%
Hispanic or Latino 6.1% 7.5% 6.6%
Asian 3.4% 4.0% 3.8%
Native Hawaiian or Pacific Islander 0.1% 0.1% 0.3%
Multi-Race 2.9% 3.0% 3.7%
High school graduate or higher, % of persons age 25+ 2011-2015 91.6%
Bachelors degree or higher, % of persons age 25+ 2011-2015 38.3%
Median household income (in 2015 dollars) 2011-2015 89,680
Persons on poverty, percent 6%
Median value owner occupied housing units 2011-2015 $334,100
Owner occupied housing unit rate 2011-2015 74.0%
The unemployment rate in Anne Arundel County is 3.80 percent as of June 2017, with job growth of 1.38 percent. Future job growth over the next 10 years is predicted to be 38.76 percent.
The region that Anne Arundel County is located in consists of Baltimore, Anne Arundel, Howard, Carroll, Hartford, and Cecil Counties and Baltimore City. However, being adjacent to Montgomery and Prince Georges counties, Anne Arundel County is also considered to be a part of the larger Washington metropolitan area. Both regions are heavily represented by government (military) organizations, their contractors, as well as health care and professional and scientific services. The estimated number of jobs in the Baltimore region in 2016 and projected change by 2020 are presented in the table "Industry in the Region." These industries provide over 1.2 million jobs. Also, most of them will create the largest demand for workers in the next four years. In total, the projected job demand in the top 10 largest industries in the region is approximately 40,000 jobs. In addition, arts and entertainment, management of companies, and transportation and warehousing are also projected to grow in the nearest years.

16
2002
200,000
210,000
220,000
230,000
240,000
250,000
260,000
270,000261,203
272,253
282,492
280,000
290,000
300,000
310,000
2003 2004 2005 2006 2007 2008 2009 2010 2011 2012 2013 2014 2ndQTR2015
Resident Employment
In Place Employment
295,599 with est. NSA jobs
268,409Recession Ends
1st Quarter 2009
226,4049Recession Ends
1st Quarter 2009201,417
260,599
Note: NSA reports 40,000 jobs in the greater Fort Meade area; estimate 35,000+ within the immediate environs of Fort Meade.
Industry in the Region
Regional 2016 Jobs
Regional 2016-2020
change
County 2016 Jobs
County 2016 –2020
change
Government 286,080 3,981 93,391 2605
Health Care and Social Assistance 215,893 13,057 30,234 3138
Retail Trade 142,127 (515) 33,586 840
Professional, Scientific, and Technical Services 123,098 9,962 26,272 2397
Accommodation and Food Services 112,871 3,981 29,069 1976
Administrative and Support and Waste Management and Remediation Services 91,688 3,604 18,180 1131
Construction 86,432 (953) 19,644 527
Other Services (except Public Administration) 66,587 2,375 13,800 697
Educational Services 62,502 4,594 4,033 529
Manufacturing 59,483 (4,983) 12,007 (779)
The same industries represent the top industries in Anne Arundel County. The only exception is transportation and warehousing which replaces educational services on the list. The government industry, specifically the National Security Agency and Fort George G. Meade, campuses, is the largest employer in the county – about 40,000 people are employed by companies and organizations that are located on those campuses and associated with its activities. Other economic drivers and employment hubs in the local area are the North County Industrial Zone, BWI Airport area, Arundel Mills, two regional hospitals, and the city of Annapolis. An estimated 159,000 jobs are created within these zones.
Some of the high-growth industries have the highest concentration of employees in Anne Arundel County compared to the national trends, and include government; professional, scientific, and technical services; construction; accommodation and food services; and transportation and warehousing.
Below is a graph of employment trends per Anne Arundel County Workforce Development Corporation (AAWDC):

ANNE ARUNDEL COMMUNITY COLLEGE / FY 2018 ANNUAL BUDGET
17
18
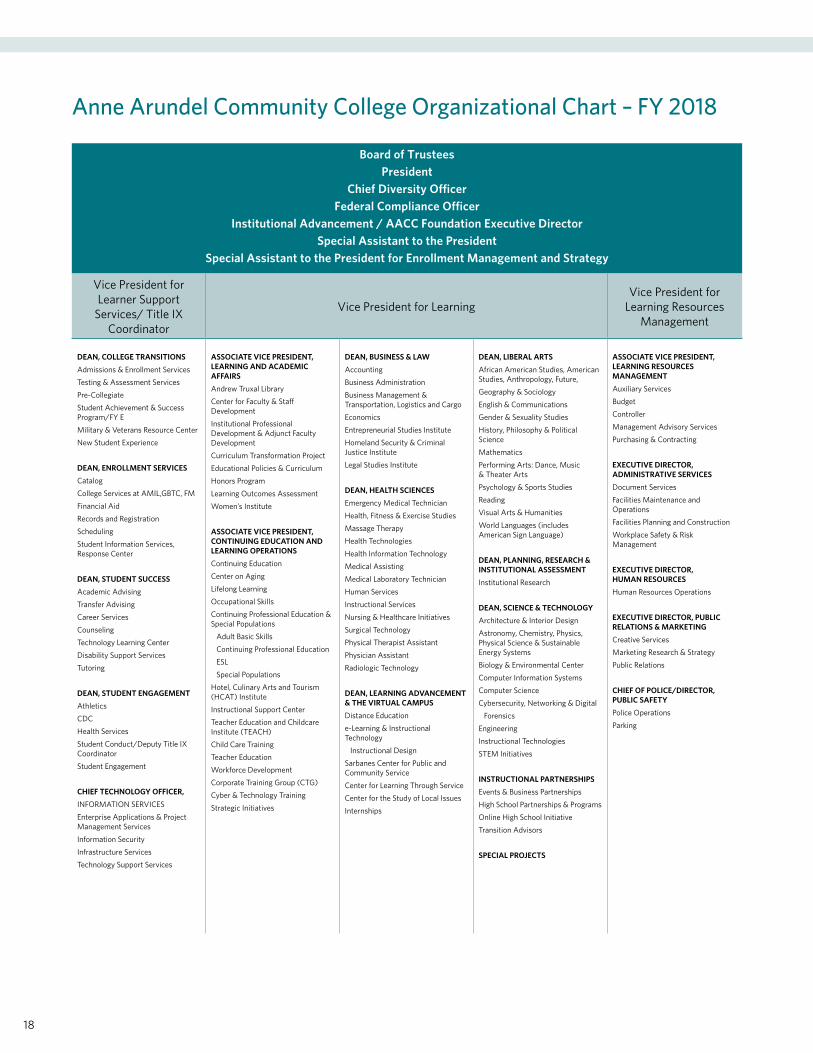
Anne Arundel Community College Organizational Chart – FY 2018
Board of Trustees President
Chief Diversity Officer Federal Compliance Officer
Institutional Advancement / AACC Foundation Executive Director Special Assistant to the President
Special Assistant to the President for Enrollment Management and Strategy
Vice President for Learner Support
Services/ Title IX Coordinator
Vice President for LearningVice President for
Learning Resources Management
DEAN, COLLEGE TRANSITIONSAdmissions & Enrollment ServicesTesting & Assessment ServicesPre-CollegiateStudent Achievement & Success Program/FY E Military & Veterans Resource CenterNew Student Experience
DEAN, ENROLLMENT SERVICESCatalog College Services at AMIL,GBTC, FM Financial Aid Records and Registration SchedulingStudent Information Services, Response Center
DEAN, STUDENT SUCCESSAcademic AdvisingTransfer AdvisingCareer ServicesCounselingTechnology Learning CenterDisability Support ServicesTutoring
DEAN, STUDENT ENGAGEMENTAthleticsCDCHealth ServicesStudent Conduct/Deputy Title IX CoordinatorStudent Engagement
CHIEF TECHNOLOGY OFFICER, INFORMATION SERVICES Enterprise Applications & Project Management ServicesInformation SecurityInfrastructure ServicesTechnology Support Services
ASSOCIATE VICE PRESIDENT, LEARNING AND ACADEMIC AFFAIRSAndrew Truxal LibraryCenter for Faculty & Staff DevelopmentInstitutional Professional Development & Adjunct Faculty DevelopmentCurriculum Transformation ProjectEducational Policies & CurriculumHonors ProgramLearning Outcomes Assessment Women’s Institute
ASSOCIATE VICE PRESIDENT, CONTINUING EDUCATION AND LEARNING OPERATIONSContinuing EducationCenter on AgingLifelong LearningOccupational SkillsContinuing Professional Education & Special Populations Adult Basic Skills Continuing Professional Education ESL Special PopulationsHotel, Culinary Arts and Tourism (HCAT) InstituteInstructional Support CenterTeacher Education and Childcare Institute (TEACH)Child Care TrainingTeacher EducationWorkforce DevelopmentCorporate Training Group (CTG)Cyber & Technology TrainingStrategic Initiatives
DEAN, BUSINESS & LAWAccountingBusiness Administration Business Management & Transportation, Logistics and Cargo EconomicsEntrepreneurial Studies InstituteHomeland Security & Criminal Justice Institute Legal Studies Institute
DEAN, HEALTH SCIENCESEmergency Medical TechnicianHealth, Fitness & Exercise StudiesMassage TherapyHealth TechnologiesHealth Information TechnologyMedical AssistingMedical Laboratory TechnicianHuman ServicesInstructional ServicesNursing & Healthcare InitiativesSurgical TechnologyPhysical Therapist AssistantPhysician AssistantRadiologic Technology
DEAN, LEARNING ADVANCEMENT & THE VIRTUAL CAMPUSDistance Educatione-Learning & Instructional Technology Instructional DesignSarbanes Center for Public and Community ServiceCenter for Learning Through ServiceCenter for the Study of Local IssuesInternships
DEAN, LIBERAL ARTSAfrican American Studies, American Studies, Anthropology, Future, Geography & SociologyEnglish & CommunicationsGender & Sexuality StudiesHistory, Philosophy & Political ScienceMathematicsPerforming Arts: Dance, Music & Theater ArtsPsychology & Sports StudiesReadingVisual Arts & HumanitiesWorld Languages (includes American Sign Language)
DEAN, PLANNING, RESEARCH & INSTITUTIONAL ASSESSMENTInstitutional Research
DEAN, SCIENCE & TECHNOLOGYArchitecture & Interior DesignAstronomy, Chemistry, Physics, Physical Science & Sustainable Energy Systems Biology & Environmental CenterComputer Information SystemsComputer ScienceCybersecurity, Networking & Digital ForensicsEngineeringInstructional TechnologiesSTEM Initiatives
INSTRUCTIONAL PARTNERSHIPSEvents & Business PartnershipsHigh School Partnerships & ProgramsOnline High School InitiativeTransition Advisors
SPECIAL PROJECTS
ASSOCIATE VICE PRESIDENT, LEARNING RESOURCES MANAGEMENT Auxiliary ServicesBudget ControllerManagement Advisory ServicesPurchasing & Contracting
EXECUTIVE DIRECTOR, ADMINISTRATIVE SERVICES Document ServicesFacilities Maintenance and OperationsFacilities Planning and Construction Workplace Safety & Risk Management
EXECUTIVE DIRECTOR, HUMAN RESOURCES Human Resources Operations
EXECUTIVE DIRECTOR, PUBLIC RELATIONS & MARKETING Creative ServicesMarketing Research & StrategyPublic Relations
CHIEF OF POLICE/DIRECTOR, PUBLIC SAFETYPolice OperationsParking

ANNE ARUNDEL COMMUNITY COLLEGE / FY 2018 ANNUAL BUDGET
19
Organization Descriptions Office of the PresidentThe president is the designated representative of the board of trustees, and is the chief executive officer of the college. The president has the ultimate administrative responsibility for all aspects of the college, which includes providing leadership and direction for the strategic planning and goal setting process and setting administrative policies and procedures. The president serves as the liaison among the various organizations within the college’s governance system. Dr. Dawn Lindsay became the college's sixth president on Aug. 1, 2012. The following offices report to the president:
• Diversity – The chief diversity officer is responsible for reviewing college policies and procedures, monitoring college practices, and counseling employees, supervisors and students regarding nondiscrimination, diversity and inclusivity.
• Institutional Advancement – The executive director of institutional advancement is responsible for the development and expansion of private and public sector resource development and serves as the executive director of the Anne Arundel Community College Foundation, Inc.
Sponsored Programs – Reports to the executive director of Institutional Advancement and is responsible for grant development.
• Special Assistant to the President for Enrollment Management and Strategy - Responsible for identification and support of initiatives that help the college meet its enrollment goals.
Vice President for LearningThe vice president for Learning reports to the president and is responsible for providing leadership and oversight for all academic and instructional programs and personnel. In addition, the vice president is responsible for implementing the college’s academic plan for both credit and continuing education programs, comprehensive program reviews, strategic planning and institutional research, faculty hiring, promotion and tenure, and for providing leadership and direction to academic administrators to obtain their participation in the college’s strategic planning process. The Division of Learning comprises two instructional areas, five schools under academic deans, the planning and research office, and office of instructional partnerships as follows:
• Instructional Areas
Learning and Academic Affairs – The associate vice president for Learning and Academic Affairs is responsible for providing leadership and oversight for special instructional programs such as honors, learning outcomes assessment and academic initiatives, which include faculty placement, professional development and oversight of library operations. The associate vice president for Learning and Academic Affairs is the chair of the committee on Educational Policies and Curriculum.
Learning Advancement and the Virtual Campus – The dean for Learning Advancement and the Virtual Campus is responsible for providing leadership and oversight for distance learning and instructional technology and is also responsible for the Sarbanes Center for Public and Community Service.

20
• Schools Each dean is responsible for providing leadership and oversight for their instructional area. These duties include accreditation oversight; monitoring national, regional and local trends to ensure instructional programs address the needs of the public; and developing, implementing and administering administrative policies and procedures. In addition the dean is responsible for administering a program of recruitment, retention, evaluation, supervision and professional development for faculty and staff assigned to their school.
Liberal Arts – The programs offered through the School of Liberal Arts build general knowledge and a strong foundation in higher education through English and literature, languages, philosophy, history, geography, psychology and sociology, math, visual and theater arts, dance and music, as well as concentrations in a number of core disciplines. Many of the state-required general education courses that can be transferred to four-year schools are offered through the School of Liberal Arts.
Science and Technology - The School of Science and Technology offers programs that help students prepare for exciting careers or continued studies in many STEM-related fields. Departments and programs include biology, chemistry, physics, physical sciences, astronomy, engineering, architecture and computer technology.
Health Sciences - The School of Health Sciences prepares students for high-demand jobs in health care through a variety of degree and certificate health care programs. Departments and programs include: emergency medical technician, paramedic, medical assisting, ECG-IV therapy, healthcare delivery systems, health information technology, medical coding, medical laboratory technician, physical therapist assistant, radiologic technology, nursing, licensed practical nursing, surgical technology, physician assistant, addiction counseling, human services, veterans counseling, health, fitness and exercise studies, personal trainer, massage therapy and public health.
Business and Law - The School of Business and Law prepares students to enter the workforce or transfer to four-year schools. Departments and programs include: business management (including transportation, logistics and cargo security), accounting, entrepreneurial studies, economics, homeland security and criminal justice, and legal studies. The dean of Business and Law is also the college's Federal Compliance Officer and reports to the president in this role.
Continuing Education and Workforce Development – The School of Continuing Education and Workforce Development is led by the associate vice president of CEWD and learning operations responsible for planning, development, implementation and support of open enrollment and contract noncredit and selected credit course areas including community education and extended learning credit programs offered to the general public, special populations and targeted audiences within Anne Arundel Community College. The associate vice president supervises continuing professional education; hotel, culinary arts and tourism; instructional support services; integrated reading/english as a second language; lifelong learning; teacher and child care education; computer/technology training; occupational skills; and corporate training and performance improvement.
• Planning, Research and Institutional Assessment – The dean of Planning, Research and Institutional Assessment is responsible for directing and overseeing all aspects of a comprehensive planning, research and assessment program to ensure institutional effectiveness, including the management of the college strategic planning process. The dean is also responsible for providing information and analyses to assist college decision making.
• Office of Instructional Partnerships - is responsible for managing early college programs and partnerships that include dual enrollment offered on-site at the high schools, proficiency and articulated credit, and the development of plans of study aligning high school and college curriculum. In addition, the department facilitates and manages partnerships between AACC and AACPS staff, faculty and counselors, identifies opportunities for expanding instructional partnerships and provides supervision and direction for AACC transition advisors housed on-site at area high schools. The department also manages the articulation process and procedures for all transfer agreements between AACC and four-year colleges and universities. The Anne Arundel Community College Regional Higher Education Center, a consortium of five area colleges that offer both bachelor's and graduate degrees on-site at an AACC location, fall under the supervision and management of the Office of Instructional Partnerships.

ANNE ARUNDEL COMMUNITY COLLEGE / FY 2018 ANNUAL BUDGET
21
Vice President for Learner Support ServicesThe vice president for Learner Support Services reports to the president and is responsible for providing leadership and oversight of information technology, enrollment services, and all student and academic support services.
• Information Services – The chief technology officer is responsible for administering and directing the operations of information technology, including institutional and learning technologies, telecommunication services, security and oversight over resources to instructional and administrative users.
• College Transitions – The dean of college transitions is responsible for directing the admissions and enrollment operations of the college, including new student orientation, testing and student success programs such as student achievement and success program (SASP).
• Enrollment Services – The dean of Enrollment Services is responsible for directing the administrative operations of records and registration, financial aid and student information services.
• Student Success - The dean of Student Success is responsible for a continuum of supports including academic planning for program completion and transfer, early and frequent academic alerts and referrals, tutoring and technology assistance, personal and career counseling, disability support services, and employment services.
• Student Engagement-The dean of Student Engagement is responsible for providing leadership and strategic direction for the following programs and activities: athletics, behavior intervention, child development center, emergency funding, health services, sexual misconduct prevention education including Title IX, student activities, student conduct and student organizations.
Vice President for Learning Resources ManagementThe vice president for Learning Resources Management reports to the president and is responsible for providing leadership and oversight of the administrative operations of the college. These operations include human resources, public relations and marketing, finance and accounting, auxiliary services, budget, procurement, facilities and capital development, public safety and police.
• Human Resources – The executive director of human resources is responsible for the management of the office of human resources, including recruitment of faculty and staff, job classifications, compensation, benefits administration, performance evaluations, training and development and employee relations.
• Finance – The associate vice president learning resources management is responsible for the business and financial resources office, auxiliary services, budget, management advisory services, procurement and for ensuring that the college complies with any state and federal financial reporting requirements.
• Administrative Services – The executive director of administrative services is responsible for facilities and capital development to include risk management, facilities management, capital development and space development/management, the executive director of administrative services is also responsible for the office of document services which includes central receiving, mail services, print shop, copy services and records management.
• Public Relations and Marketing – The executive director of public relations and marketing manages the college’s external relations activities and acts as a liaison to state, county and local elected and appointed officials as well as for associations and communities that interact with the college. The executive director of public relations and marketing is also responsible for the creation, development and implementation of the college’s marketing directive and focus.
• Public Safety and Police – The chief of police/public safety has the authority to exercise police powers on campus property and shall act as the college’s law enforcement liaison with external law enforcement and public safety agencies. In addition the chief of police shall provide the leadership to develop, plan, implement, direct and maintain a comprehensive public safety operation to ensure a safe environment for learning and working, oversee college emergency and parking management operations and for ensuring the college complies with any state and federal reporting requirement.
22
Long Term Financial Planning
The multi-year budget planning tool begins with the current FY 2017 projection. This projection is for illustrative and planning purposes only and does not reflect actual budget requests for future years. This document is intended to provide general information to facilitate informed long term planning in the development of both revenue and expenditure goals. As you will see the FY 2017 projection and FY 2018 projection have several one-time revenue sources and or expenditure cuts. Assuming the revenue and expense assumptions remain during the FY 2018 budget development process, the significant Tuition Stabilization Fund (TSF) contribution and the forward funding and deferral of PC and AV equipment replacement, result in a significant projected tuition and fee increase for FY 2019. The FY 2018 projection will be adjusted as the college continues its budgeting process.
Basic assumptions used each year FY 2019 through FY 2022:
Revenue Assumptions:1. 2% increase in State and County funding. The FY 2018 one time funds for keeping the tuition rate below 2% has been reversed
in 2019. This is conservative in relation to the average increase received from the County from 2008 through 2017 and consistent with the projected increase included in the County’s five year projections. However State funding has only increased an average of 1% per year over the same time period. As a result, the State funding assumptions will continue to be monitored and assessed in future analysis to determine if the current assumptions are reasonable over the long-term.
a. 1% increase in State funding represents approximately $290k.
b. 1% increase in County funding represents approximately $404k.
2. The role that tuition and fees will play in funding operations will be higher than historical experience, changing the mix of funding percentages between State and tuition and fees, the TSF or the County. The average increase in total tuition and fee revenue from 2008 through projected 2018 is 2% per year
a. Flat enrollment has been used in the scenario presented – A 1% change is FTE represents approximately +/- $400k.
b. T&F rate increase – a $1 increase represents approximately $300K.
Given the significance of tuition and fees on the overall revenue budget in terms of both total dollars and the percentage of total revenue, any enrollment declines require greater support from the other funding sources to combat the revenue decline (based on 2017 projections a 2% decline in tuition and fees revenue requires a 2.7% increase in State aid or a 2% increase in County aid to offset the revenue loss).
3. 2% increase in other income
4. The tuition stabilization fund will be able to continue to support the operating budget at approximately $2-3 million per year (approximately 2% of the annual operating expenditures). However these funds are not an appropriate funding source for reoccurring expenses and are better suited for onetime expenditures and should be considered as a potential funding source for the funding of the OPEB Trust. The use of the TSF in the long-term funding of operations limits the availability for year-end spending.

ANNE ARUNDEL COMMUNITY COLLEGE / FY 2018 ANNUAL BUDGET
23
Expenditure Assumptions:5. Salaries – 2 percent increase each year
6. Benefits – 2.5 percent increase each year
7. Other Operating Expense – No increase in other operating expenses based on recent budgeting and spending patterns. Funding of maintenance of operation initiatives are projected to come from reallocations. New positions and onetime expenditures are only included in the New Strategic Plan Initiatives noted below.
a. 1 percent increase in salaries and benefits represents approximately $930k
b. 1 percent increase in other operating expenses represents approximately $210k
New Strategic Plan Initiatives:8. $431K for five new positions per year adjusted for salary increases each year going forward. From 2012-2017, the average
number of new FTE has been eight per year, which represents under 1 percent of the total positions budgeted at the college.
9. $500K is included each year for one-time, nonreoccurring initiatives; this amount is based on the FY 2015 budget requests for nonreoccurring initiatives as we have not included new funding for strategic requests since FY 2015 (requests have been funded through reallocations in the FY 2017 budget and FY 2018 proposal).
10. $2.34 million is added back to the FY 2019 and FY 2020 base projection for PC and AV replacement. This amount is reduced to $1.44 million in years 2021 and beyond. For several years the most critical PC and AV items have been addressed with strategic year-end spending, however the amount of deferrals continues to grow, causing an additional $900K in funding needs in 2019 and 2020 beyond the long-term annualized projected needs.

24
FY 2018 Budget as submitted to County Executive
Multi Year Budget Planning Tool - As of 2/14/17
Enrollment 100.0% State Revenue 102% 102% Other Income 102% TSF approx. $2-3 mill
SA/Athletic Fee $2/$1 Salaries 102% 102.5% Operating Exp 100% Lab / Furn 100%
TOTAL FTE ENROLLMENT 11,653 11,653 11,653 11,653 11,653 11,653
Actual Projected as of 12/31/16
$2 Tuit/$1 Fee Budget Request
$13 Tuit/$0 Fee Projection
$4 Tuit/$0 Fee Projection
$0 Tuit/$0 Fee Projection
$4 Tuit/$0 Fee Projection
$4 Tuit/$0 Fee Projection
FY2016 FY2017 FY2018 FY2019 FY2020 FY2021 FY2022 FY2023
Revenue
State of Maryland 29,005,571 29,094,012 $29,430,200 $29,580,000 $30,171,600 $30,775,032 $31,390,533.00 $32,018,343
Anne Arundel County 38,387,700 40,387,700 42,387,700 43,235,454 44,100,163 44,982,166 45,881,810 46,799,446
Anne Arundel Community College
Tuition and Fees 39,069,371 37,646,103 38,703,000 42,440,000 43,580,000 43,580,000 44,724,000 45,883,000
Other Income 561,237 544,615 576,400 587,928 599,687 611,680 623,914 636,392
Tuition Stabilization (622,857) (504,228) 3,203,600 3,257,128 3,097,503 3,208,549 3,107,111 3,023,060
Auxiliary Transfer 431,653 450,000 250,000 250,000 250,000 250,000 250,000 250,000
Enterprise Transfer - - - - - - -
Total Anne Arundel Community College 39,439,404 38,136,490 42,733,000 46,535,056 47,527,190 47,650,229 48,705,025 49,792,452
Total Operating Revenue 106,832,675 107,618,202 114,550,900 119,350,510 121,798,953 123,407,427 125,977,368 128,610,241
Operating Expenditures by Object Code
Salaries and Benefits 89,063,102 89,688,648 93,510,568 95,900,378 98,348,820 100,857,294 103,427,235 106,060,108
Contracted Services 9,454,070 9,433,441 10,153,680 10,403,680 10,403,680 10,403,680 10,403,680 10,403,680
Supplies and Materials 2,419,144 2,248,484 2,736,475 2,736,475 2,736,475 2,736,475 2,736,475 2,736,475
Communications 996,200 997,845 1,264,901 1,264,901 1,264,901 1,264,901 1,264,901 1,264,901
Other Charges 1,010,004 1,122,115 1,805,882 1,805,882 1,805,882 1,805,882 1,805,882 1,805,882
Utilities 2,063,027 2,666,000 2,733,416 2,733,416 2,733,416 2,733,416 2,733,416 2,733,416
Insurance 748,294 718,288 855,350 855,350 855,350 855,350 855,350 855,350
Furniture and Equipment 1,078,834 743,381 1,490,628 3,650,428 3,650,429 2,750,429 2,750,429 2,750,429
Total Operating Expenditures 106,832,675 107,618,202 114,550,900 119,350,510 121,798,953 123,407,427 125,977,368 128,610,241
Net Surplus / (Deficit) $ - $ - $ - $ - $ - $ - $ - $ -
This projection is for illustrative and planning purposes only and does not reflect actual budget requests for future years.
PC and AV replacement of $2.34 million added back to the FY 2019 and FY 2020 base budget. $1.44 million in years 2021 and beyond.
5 new positions in FY 2019 and every year going forward plus $500,000 for one time initiatives in support of the strategic plan.

ANNE ARUNDEL COMMUNITY COLLEGE / FY 2018 ANNUAL BUDGET
25
Facilities Planning
Every five years, the Facilities Planning and Construction department uses data from an environmental scan from the college’s academic plan and from a facilities assessment to update AACC’s 10-year Facilities Master Plan for capital improvement. These regular updates take into account emerging issues and opportunities, trends in higher education and the college’s strategic direction. The Facilities Master Plan priorities include facilities development that provides for student success, accommodates current and new instructional delivery and technology, encourages sustainable practices, provides sustainable buildings, strives for consistency, and helps maximize college enrollments and the efficient use of space. The board of trustees approved the most recent Facilities Master Plan in January 2016. Once approved by the board of trustees, the Facilities Master Plan provides direction for phasing and construction costs used to develop AACC’s capital requests. Below is a list of opportunities identified in the most recent master plan:
Near-Term Opportunities • Install informal learning spaces throughout campus.
• Improve space utilization campuswide.
• Raze outdated and under-utilized structures.
• Provide contemporary and competitive space for Health Sciences programs.
• Provide new labs for biology.
• Create more parking for visitors.
Midterm Opportunities • Renovate Careers Center to expand Math department and classrooms.
• Expand Child Development Center and CDC labs.
• Update and provide more space for the physical sciences.
• Improve arrival sequence to campus.
• Renovate Florestano Allied Health Building.
Long-Term Opportunities • Complete the relocation of Ring Road to allow for future expansion of the core campus.
• Renovate and expand the Student Services Center and Student Union.
• Renovate Dining Hall.

26
Project No. Project Name Construction
Cost Quantity Unit Cost
Professional Fees,
Equipment, Construction
Contingencies
Total Project Costs
2016 Dollars
Estimated Year of
Mid-Point Construction
Total Project Cost w/
Escalation
Total Project Cost by Term w/ Escalation
NEAR-TERM (1-5 Years) $129,256,226
N1 Learning Landscape Improvements Campuswide $1,000,000 20 $50,000 $200,000 $1,200,000 2018 $1,349,837
N2 Relocate the Modular Building $810,000 18,000 $45 $97,200 $907,200 2017 $981,228
N3 Construct Health Science and Biology Building* $86,428,000 172,856 $500 $17,285,600 $103,713,600 2019 $121,330,243
N3.1 Raze Pool and Install Gym Facade $560,000 14,000 $40 $84,000 $644,000 2019 $753,389
N3.2 Raze Schwartz and Relocate Classrooms $348,800 13,952 $25 $69,760 $418,560 2019 $489,389
N3.3 Partial Relocation of Ring Road $2,800,000 70,000 40$ $560,000 $3,360,000 2019 $3,930,728
N3.4 Campus Entrance Monument Signs $300,000 1 $60,000 $360,000 2019 $421,149
MID-TERM (6-8 Years) $110,603,360 $129,256,226 $51,114,654
M1 Partial Renovation of Careers Center $1,530,320 6,956 $220 $306,064 $1,186,384 2021 $2,234,242
M2 Renovate and Expand Child Development Center $1,967,550 13,117 $150 $393,510 $2,361,060 2022 $2,987,494
M3 Renovate Dragun and Expand Physical Sciences $22,613,522 73,678 $325 $4,522,704 $27,136,227 2022 $34,335,984
M4 Campus Gateway Improvements Along College Parkway $660,000 2 $330,000 $132,000 $792,000 2023 $1,042,218
M5 Renovate Florestano $6,658,600 33,293 $200 $1,331,720 $7,990,320 2023 $10,514,716
LONG-TERM (8+ YEARS) $40,115,991 $51,114,654 $46,432,949
L1 Complete Relocation of Ring Road** $14,400,000 360,000 $40 $2,880,000 $17,280,000 2024 $23,648,873
L1.1 Raze Johnson Building $282,850 11,314 $25 $56,570 $339,420 2024 $464,520
L2 Renovate and Expand Student Services Center $5,559,180 25,269 $220 $1,111,836 $6,671,016 2025 $9,494,936
L3 Renovate Dining Hall $5,400,000 18,000 $300 $1,350,000 $6,750,000 2027 $10,391,315
Ongoing Campus Infrastructure Upgrades $2,000,000 2021 $2,433,306
$33,040,436 $46,432,949
GRAND TOTAL $11,318,822 $30,440,964 $183,759,787 $226,803,829 $226,803,829
All estimates are in 2016 dollars and account for escalation. *Preconstruction will include Projects N3.1 – N3-4
**Preconstruction will include Project L1.1
Facilities Planning Cost Summary

ANNE ARUNDEL COMMUNITY COLLEGE / FY 2018 ANNUAL BUDGET
27
2014 Facilities Assessment In 2014 a Facilities Condition Assessment was conducted by EMG Corp. to capture the campus’ current building and site conditions in preparation for the Facilities Master Plan. Detailed reviews for 27 of AACC’s 35 owned and leased properties were conducted. Information shown herein collates results from these assessments and current space data.
Ratings System Each building assessed as part of the 2014 Facilities Condition Assessment was rated as good, fair or poor. EMG Corp. used the following definitions to explain each rating:
• Good - Satisfactory as-is. Requires only routine maintenance during the assessment period. Repair or replacement may be required due to a system’s estimated useful life.
• Fair - Satisfactory as-is. Repair or replacement is required due to current physical condition and/or estimated remaining useful life.
• Poor - Immediate repair, replacement or significant maintenance is required.
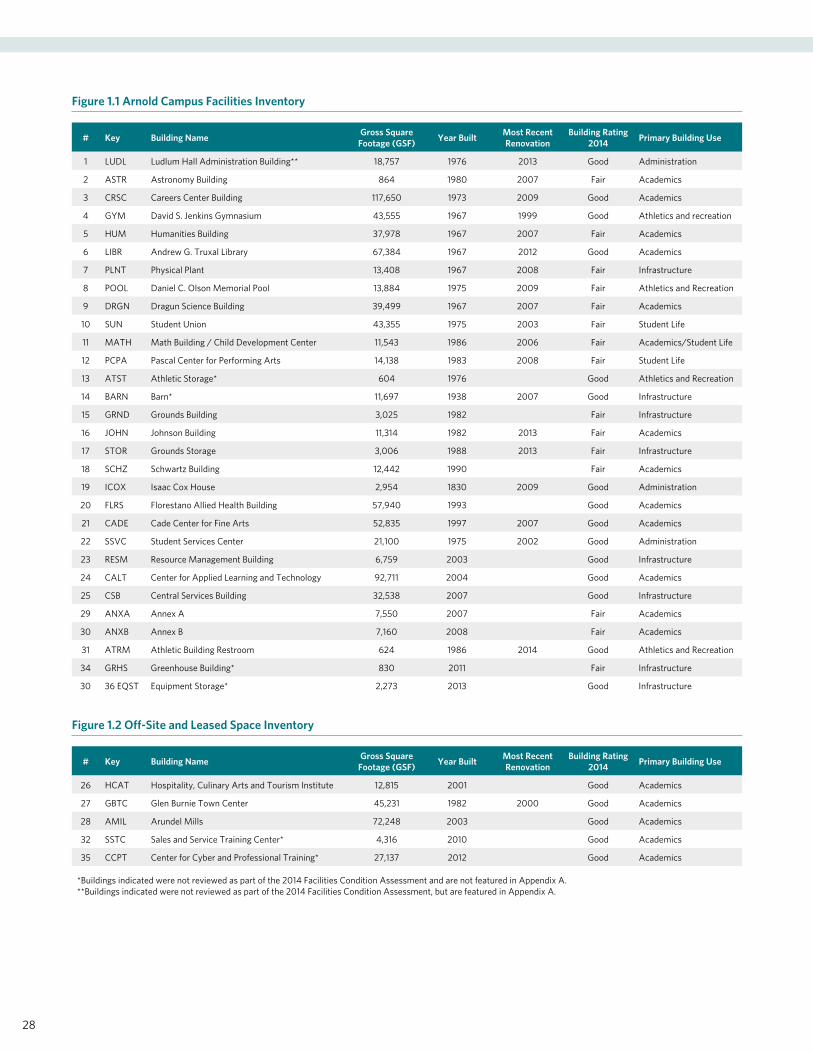
28
Figure 1.1 Arnold Campus Facilities Inventory
# Key Building Name Gross Square Footage (GSF) Year Built Most Recent
RenovationBuilding Rating
2014 Primary Building Use
1 LUDL Ludlum Hall Administration Building** 18,757 1976 2013 Good Administration
2 ASTR Astronomy Building 864 1980 2007 Fair Academics
3 CRSC Careers Center Building 117,650 1973 2009 Good Academics
4 GYM David S. Jenkins Gymnasium 43,555 1967 1999 Good Athletics and recreation
5 HUM Humanities Building 37,978 1967 2007 Fair Academics
6 LIBR Andrew G. Truxal Library 67,384 1967 2012 Good Academics
7 PLNT Physical Plant 13,408 1967 2008 Fair Infrastructure
8 POOL Daniel C. Olson Memorial Pool 13,884 1975 2009 Fair Athletics and Recreation
9 DRGN Dragun Science Building 39,499 1967 2007 Fair Academics
10 SUN Student Union 43,355 1975 2003 Fair Student Life
11 MATH Math Building / Child Development Center 11,543 1986 2006 Fair Academics/Student Life
12 PCPA Pascal Center for Performing Arts 14,138 1983 2008 Fair Student Life
13 ATST Athletic Storage* 604 1976 Good Athletics and Recreation
14 BARN Barn* 11,697 1938 2007 Good Infrastructure
15 GRND Grounds Building 3,025 1982 Fair Infrastructure
16 JOHN Johnson Building 11,314 1982 2013 Fair Academics
17 STOR Grounds Storage 3,006 1988 2013 Fair Infrastructure
18 SCHZ Schwartz Building 12,442 1990 Fair Academics
19 ICOX Isaac Cox House 2,954 1830 2009 Good Administration
20 FLRS Florestano Allied Health Building 57,940 1993 Good Academics
21 CADE Cade Center for Fine Arts 52,835 1997 2007 Good Academics
22 SSVC Student Services Center 21,100 1975 2002 Good Administration
23 RESM Resource Management Building 6,759 2003 Good Infrastructure
24 CALT Center for Applied Learning and Technology 92,711 2004 Good Academics
25 CSB Central Services Building 32,538 2007 Good Infrastructure
29 ANXA Annex A 7,550 2007 Fair Academics
30 ANXB Annex B 7,160 2008 Fair Academics
31 ATRM Athletic Building Restroom 624 1986 2014 Good Athletics and Recreation
34 GRHS Greenhouse Building* 830 2011 Fair Infrastructure
30 36 EQST Equipment Storage* 2,273 2013 Good Infrastructure Figure 1.2 Off-Site and Leased Space Inventory
# Key Building Name Gross Square Footage (GSF) Year Built Most Recent
RenovationBuilding Rating
2014 Primary Building Use
26 HCAT Hospitality, Culinary Arts and Tourism Institute 12,815 2001 Good Academics
27 GBTC Glen Burnie Town Center 45,231 1982 2000 Good Academics
28 AMIL Arundel Mills 72,248 2003 Good Academics
32 SSTC Sales and Service Training Center* 4,316 2010 Good Academics
35 CCPT Center for Cyber and Professional Training* 27,137 2012 Good Academics
*Buildings indicated were not reviewed as part of the 2014 Facilities Condition Assessment and are not featured in Appendix A. **Buildings indicated were not reviewed as part of the 2014 Facilities Condition Assessment, but are featured in Appendix A.

ANNE ARUNDEL COMMUNITY COLLEGE / FY 2018 ANNUAL BUDGET
29
ENROLLMENT PLANNINGOur StudentsAACC serves approximately 46,000 students who will enroll in more than 2,800 courses, both credit and noncredit, in more than 100 areas of study. The college also offers extensive lifelong learning opportunities and noncredit continuing professional education courses to a diverse population seeking career training or retraining, working to boost basic skills, or pursuing new areas of interest. The college is increasingly diverse, with more than one third of credit students identifying themselves as members of a minority ethnicity. By gender, females make up 60 percent of the student population and 43 percent of the credit student population. The majority of AACC’s student population attends part time, comprising 71.9 percent of enrolled credit students in fall 2016. Of credit students, 36.9 percent are 25 years of age or older, 56 percent work more than 20 hours per week, and 32.6 percent received some form of loans, scholarships and/or need-based financial aid. Most of our county’s public high school students, about 65 percent, who enroll in Maryland higher education institutions come to AACC. The college’s fall-to-fall retention is 63 percent for fall 2017 a 2 percent increase from 61 percent in fall 2016. The college has been actively looking at initiatives to increase retention and educate students to the value of obtaining an associate degree or certificate.
Enrollment TrendsConsistent with the national trend, the college's enrollment has been challenged as it continues to follow the inverse relationship with employment and improvements in the economy. The college has experienced enrollment declines since FY 2011, resulting in an FTE decrease of 25 percent with the FY 2018 budget. One driver of enrollment is the county unemployment rate and as the county unemployment rate continues to decrease, so has college enrollments, with the largest declines in the 40–49 age group.
Enrollment PlanningThe office of enrollment management and strategy has designed a four-step enrollment plan to address enrollment issues and grow enrollment through review and implementation of strategies from application to retention and monitoring of selective operational tactics regarding enrollment and collegewide initiatives.
Anne Arundel County and National Unemployment Rates; AACC End of Term Credit FTE Actuals
3.3% 4.0%
6.6% 7.0% 6.7% 6.5% 6.2% 5.3%
4.7% 3.9% 3.5%
0%
2%
4%
6%
8%
10%
0
1000
2000
3000
4000
5000
2006 2007 2008 2009 2010 2011 2012 2013 2014 2015 2016 A
nne
Aru
ndel
Cou
nty
Une
mpl
oym
ent R
ate
Fall
FTE
Fall FTE and Anne Arundel County Unemployment Rate
EOT Credit FTE Actual Anne Arundel County Unemployment Rate
Credit Headcount by Age Group
Credit Total FY 2012 FY 2013 FY 2014 FY 2015 FY 2016 FY 20172016-17 change
<20 6,023 6,070 6,017 5,587 5,750 5,583 -2.90%
20-24 8,192 7,880 7,377 7,055 6,609 6,321 -4.40%
25-29 3,681 3,464 3,189 3,118 2,938 2,798 -4.80%
30-39 3,805 3,575 3,165 2,847 2,704 2,571 -4.90%
40-49 2,434 2,225 1,872 1,587 1,414 1,291 -8.70%
50+ 1,945 1,872 1,689 1,511 1,380 1,344 -2.60%
Total 25,941 26,080 23,309 21,705 20,795 19,908 -4.30%
30
Hea
dcou
nt
10,000
8,000
6,000
4,000
2,000
0Apr 23 May 8 May 23 Jun 7
Day of Registration (2017)
Jun 22 Jul 7 Jul 22 Aug 6 Aug 21
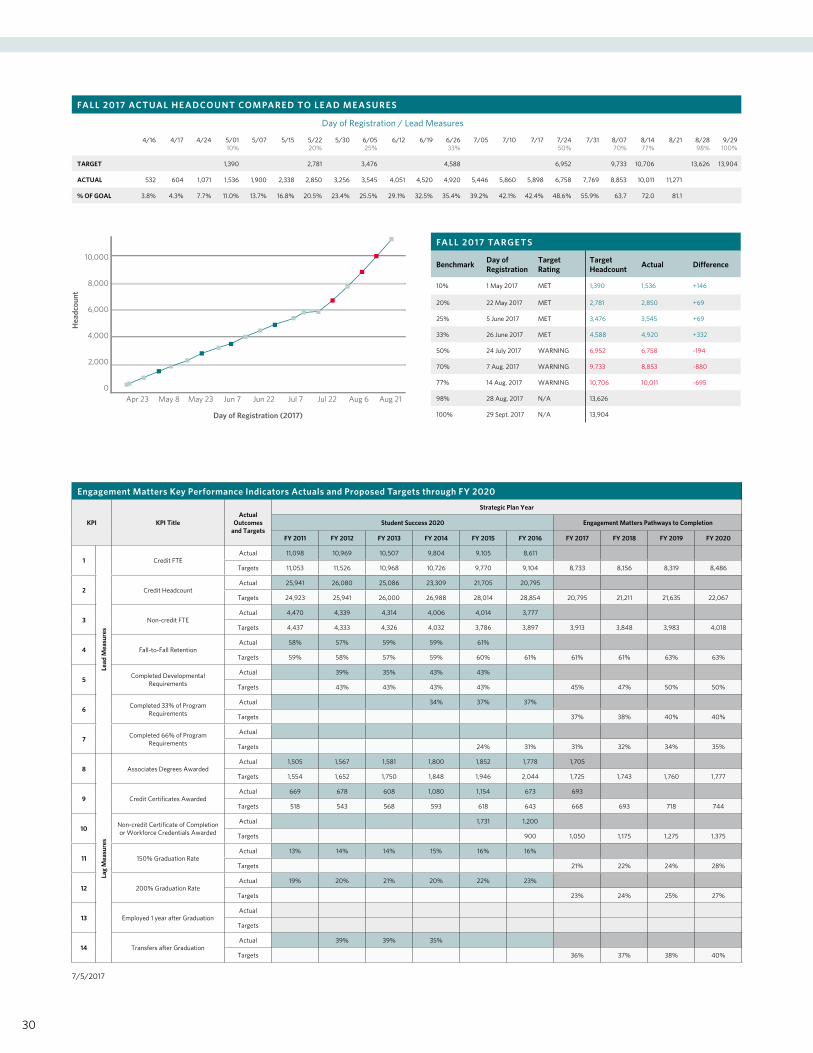
FALL 2017 AC TUAL H E ADCOU NT COM PARE D TO LE AD M E A SU RES
Day of Registration / Lead Measures
4/16 4/17 4/24 5/01 10%
5/07 5/15 5/22 20%
5/30 6/05 25%
6/12 6/19 6/26 33%
7/05 7/10 7/17 7/24 50%
7/31 8/07 70%
8/14 77%
8/21 8/28 98%
9/29 100%
TARGET 1,390 2,781 3,476 4,588 6,952 9,733 10,706 13,626 13,904
ACTUAL 532 604 1,071 1,536 1,900 2,338 2,850 3,256 3,545 4,051 4,520 4,920 5,446 5,860 5,898 6,758 7,769 8,853 10,011 11,271
% OF GOAL 3.8% 4.3% 7.7% 11.0% 13.7% 16.8% 20.5% 23.4% 25.5% 29.1% 32.5% 35.4% 39.2% 42.1% 42.4% 48.6% 55.9% 63.7 72.0 81.1
FALL 2017 TARG E T S
Benchmark Day of Registration
Target Rating
Target Headcount Actual Difference
10% 1 May 2017 MET 1,390 1,536 +146
20% 22 May 2017 MET 2,781 2,850 +69
25% 5 June 2017 MET 3,476 3,545 +69
33% 26 June 2017 MET 4,588 4,920 +332
50% 24 July 2017 WARNING 6,952 6,758 -194
70% 7 Aug. 2017 WARNING 9,733 8,853 -880
77% 14 Aug. 2017 WARNING 10,706 10,011 -695
98% 28 Aug. 2017 N/A 13,626
100% 29 Sept. 2017 N/A 13,904
Engagement Matters Key Performance Indicators Actuals and Proposed Targets through FY 2020
KPI KPI TitleActual
Outcomes and Targets
Strategic Plan Year
Student Success 2020 Engagement Matters Pathways to Completion
FY 2011 FY 2012 FY 2013 FY 2014 FY 2015 FY 2016 FY 2017 FY 2018 FY 2019 FY 2020
1 Credit FTEActual 11,098 10,969 10,507 9,804 9,105 8,611
Targets 11,053 11,526 10,968 10,726 9,770 9,104 8,733 8,156 8,319 8,486
2 Credit HeadcountActual 25,941 26,080 25,086 23,309 21,705 20,795
Targets 24,923 25,941 26,000 26,988 28,014 28,854 20,795 21,211 21,635 22,067
3 Non-credit FTEActual 4,470 4,339 4,314 4,006 4,014 3,777
Targets 4,437 4,333 4,326 4,032 3,786 3,897 3,913 3,848 3,983 4,018
4 Fall-to-Fall RetentionActual 58% 57% 59% 59% 61%
Targets 59% 58% 57% 59% 60% 61% 61% 61% 63% 63%
5 Completed Developmental Requirements
Actual 39% 35% 43% 43%
Targets 43% 43% 43% 43% 45% 47% 50% 50%
6 Completed 33% of Program Requirements
Actual 34% 37% 37%
Targets 37% 38% 40% 40%
7 Completed 66% of Program Requirements
Actual
Targets 24% 31% 31% 32% 34% 35%
8 Associates Degrees AwardedActual 1,505 1,567 1,581 1,800 1,852 1,778 1,705
Targets 1,554 1,652 1,750 1,848 1,946 2,044 1,725 1,743 1,760 1,777
9 Credit Certificates AwardedActual 669 678 608 1,080 1,154 673 693
Targets 518 543 568 593 618 643 668 693 718 744
10 Non-credit Certificate of Completion or Workforce Credentials Awarded
Actual 1,731 1,200
Targets 900 1,050 1,175 1,275 1,375
11 150% Graduation RateActual 13% 14% 14% 15% 16% 16%
Targets 21% 22% 24% 28%
12 200% Graduation RateActual 19% 20% 21% 20% 22% 23%
Targets 23% 24% 25% 27%
13 Employed 1 year after GraduationActual
Targets
14 Transfers after GraduationActual 39% 39% 35%
Targets 36% 37% 38% 40%
Lead
Mea
sure
sLa
g M
easu
res
7/5/2017

ANNE ARUNDEL COMMUNITY COLLEGE / FY 2018 ANNUAL BUDGET
31
Key Performance Indicators This strategic plan is the catalyst for embracing a cyclical, ongoing process that uses data to inform decisions regarding overall direction and college performance. The key performance indicators (KPIs) are designed to provide a dashboard on rates of progression and completion for large groups of students. By focusing the entire college on the KPIs, the emphasis is to make systemic changes involving multiple, coordinated reforms in policy and practice, aimed at benefiting large numbers of students, rather than focusing energies on smaller-scale interventions that have little chance of moving the needle on student completion. Regular monitoring of the KPIs by college leadership allows us to predict whether the completion goals will be met and to identify areas where improvements or adjustments are needed. Frequent and facilitated sessions provide us with the structured time for reflection, review of progress, and an evidence-based process for communicating the need for change or midcourse corrections. In order to improve performance, we must focus on a combination of LEAD and LAG measures. LEAD measures are those predictive KPIs that allow us to influence the future. Examples of LEAD measures are those associated with enrollment and retention that help predict our likely success in reaching completion goals. Completion goals are LAG measures, outcomes that are essential for charting progress, but not helpful when attempting to influence change real-time.
The college’s strategic plan has 14 institutional KPIs, which are used to measure student and institutional performance. A central tenant of this plan is to use data to measure and also to act. As a result, dashboards allow for visualization of progress toward the goals, and to act accordingly if midcourse corrections are warranted. KPIs are disaggregated, including by race/ethnicity so that equity disparities are routinely monitored and acted upon.
INSTITUTIONAL K E Y PE RFOR M ANCE IN DIC ATOR S
L AG M E A SU RES LE AD M E A SU RES
Associate Degrees Awarded Credit FTE
Credit Certificates Awarded Credit Headcount
Gainful Employment Non-Credit Credentials Awarded Noncredit FTE
150 percent Graduation Rate Fall-to-Fall Retention
200 percent Graduation Rate Completed Developmental Requirements
Employed One Year after Graduation Completed 33 percent of program requirements
Transfers after Graduation Completed 66 percent of program requirements

32
Anne Arundel Community College Comprehensive Program Review Process (AY17 and forward)
• December – February
Program review scorecard, narrative and action plan are distributed to program chairs, directors or coordinators and deans by December.
Program chairs, directors, or coordinators write comprehensive program review and discuss with Dean.
• July – August
VP for Learning, AVPs, and Director of LOA review comprehensive course/program reports.
Report links and recommendations are entered into the Course/Program Review Tracking spreadsheet and Action Plan template by Director of LOA.
Comments and suggested revisions are shared with department chairs/directors.
Comprehensive course/program review meetings are scheduled
• No Later than March 15
Following dean approval, final comprehensive program review report is submitted to instructional data specialist by March 15.
Deans submit a 2-year interim report following up on action items from previous comprehensive program review.
• September – December
Comprehensive course/program review meetings are conducted March 15 through June 15
IDS captures program action items and enters them into program review spreadsheet
Next-year course/program review cycle is reviewed and revised with Deans and finalized by the Director of LOA, copy to Administrative Assistant to the VP for Learning.
Scorecards are generated in November – December.
Final schedule sent to Deans, Department chairs/Directors, Dean data scorecards are created and uploaded to G-drive by December 30.
Comprehensive Program Review All AACC programs undergo a comprehensive program review process on a staggered four-year cycle so that about 25 percent of all programs are reviewed each year. Upon completion of the four-year cycle, every program that the college offers will have been reviewed, and the cycle begins again. Through the program review process, action plans for correcting declines are created. Every program also completes an interim two-year “check-in” report where updates on action plans are provided.

ANNE ARUNDEL COMMUNITY COLLEGE / FY 2018 ANNUAL BUDGET
33
AY2016-2017 COMPREHENSIVE PROGRAM REVIEW TEMPLATE
Program Name: SAMPLE AAS This template provides the data for use in writing your comprehensive program review, including your program data, as well as the college total/average for the purpose of comparison. The highlighted boxes indicate where your program data fall on the rubric. After reviewing the data, please complete the Program Review Narrative form in the second tab. Note that some questions do not require a response if the program is meeting/exceeding expectations. Also note that your responses to the last question in each section will be used to populate your program action plan in the third tab. A glossary is provided in the fifth tab.
Program Code: AAS.SAMPLE.SAMPLE
Metric College Total/ Average Program Data Needs Discussion Meets Expectations Exceeds Expectations
Program Continuation & Completion
Fall 2015-to-Fall 2016 Continuation 32.0% 56.0% Below College Average Equal to College Average Above College Average
3-Year Change in Fall-to-Fall Continuation +3.1% +4.5% Below College Average Equal to College Average Above College Average
# of Awards- AY 2016 1852 deg 10 < 10% of program headcount 10%-20% of program headcount > 20% of program headcount
3-Year Change in # of Awards +18.2% +17.6% Below College Average Equal to College Average Above College Average
Racial Equity in Awards
Black -8.2% Black -8.2% Program Gaps > College Gaps Program Gaps Equal to College Gaps Program Gaps < College Gaps
Hispanic -6.8% Hispanic -6.8% Program Gaps > College Gaps Program Gaps Equal to College Gaps Program Gaps < College Gaps
Class Equity in Awards PELL -15% -15.0% Program Gaps > College Gaps Program Gaps Equal to College Gaps Program Gaps < College Gaps
Avg Credits Earned in AY 19 20.0 <20 20-24 >24
Course Success
Program Foundational Course: SAM-111
AY 2015 Course Success 75.60% 72.50% <70% 70% to 75% >75%
3-Year Change in Course Success 3.20% 5.60% No change or decrease .01%-2% increase >2% increase
AY 2015 Course Withdrawal 12.80% 13.80% >15% 10%-15% <10%
Racial Equity in Course Success
Black -8.2% Black -8.2% Program Gaps > College Gaps Program Gaps Equal to College Gaps Program Gaps < College Gaps
Hispanic -6.8% Hispanic -6.8% Program Gaps > College Gaps Program Gaps Equal to College Gaps Program Gaps < College Gaps
Class Equity in Course Success PELL -15% -15.0% Program Gaps > College Gaps Program Gaps Equal to College Gaps Program Gaps < College Gaps
Program Critical Course: SAM-111
AY 2015 Course Success 75.60% 72.50% <70% 70% to 75% >75%
3-Year Change in Course Success 3.20% 5.60% No change or decrease .01%-2% increase >2% increase
AY 2015 Course Withdrawal 12.80% 13.80% >15% 10%-15% <10%
Racial Equity in Course Success
Black -8.2% Black -8.2% Program Gaps > College Gaps Program Gaps Equal to College Gaps Program Gaps < College Gaps
Hispanic -6.8% Hispanic -6.8% Program Gaps > College Gaps Program Gaps Equal to College Gaps Program Gaps < College Gaps
Class Equity in Course Success PELL -15% -15.0% Program Gaps > College Gaps Program Gaps Equal to College Gaps Program Gaps < College Gaps
Program Headcount
AY 2016 Program Headcount 13,119 49 <50 50-100 >100
3-Year Change in Program Headcount -14.30% +1.8% No change or decrease .01%-2% increase >2% increase
Value Added
Labor Market Growth Forecast Sector: SAMPLE 10% 15% Decrease 0%-5% growth >5% growth
Transfer Rate
Program Outcomes Assessment
Measurement of Program Outcomes <75% of outcomes measured 75%-99% of outcomes measured All outcomes measured
Quality of Program OutcomesProgram outcomes not
measurable/do not capture scope of program
Wording of program outcomes needs some revision
Have measurable program outcomes capturing scope of
program
Use of Program Outcomes Assessment Findings Results not analyzed
Analysis completed; no recommendations made and/or
disseminated
Analysis w/ recommendations made, disseminated, and
implemented

34
DEFINE GOALS IDENTIFY GAPS
Planning and Institutional Goals
Anne Arundel Community College Mission*With learning as its central mission, Anne Arundel Community College responds to the needs of our diverse community by offering high quality, affordable, accessible and innovative lifelong learning opportunities.
Anne Arundel Community College Vision*Anne Arundel Community College is a premier learning community that transforms lives to create an engaged and inclusive society.
Anne Arundel Community College PhilosophyAnne Arundel Community College strives to embody the basic convictions of our country’s democratic ideal: that individuals be given full opportunity to discover and develop their talents and interests; to pursue their unique potentials; and to achieve an intellectually, culturally and economically satisfying relationship with society.
*Approved by the board of trustees on June 14, 2016

ANNE ARUNDEL COMMUNITY COLLEGE / FY 2018 ANNUAL BUDGET
35
Strategic Planning and Budgeting Process
The strategic planning process spans a five-year period, with a single year, the planning year for the new strategic plan, overlapping with the final year of the previous strategic plan.
STR ATEG IC PL AN NING PROCESS
FY 2016 FY 2017 FY 2018 FY 2019 FY 2020
Conclusion of current plan and p lanning for next strategic plan
Planning and implementation
Implementation Implementation and planning for next
strategic plan
Conclusion of current plan
As part of the ongoing cycle of the strategic plan, the strategic planning council (SPC) will make resource recommendations to the president/vice presidents (PVP) for implementation of initiatives from the strategic plan. PVP will take all of these recommendations into consideration when making decisions about how to allocate resources to best reach the goals and KPI targets. This cyclical process, outlined below, melds with the new Middle States Commission on Higher Education’s standard VI which states: “The institution’s planning processes, resources, and structures are aligned with each other and are sufficient to fulfill its mission and goals, to continuously assess and improve its programs and services, and to respond effectively to opportunities and challenges.”
MISSION
Integrated Planning, Budgeting and Assessment
Adjustments Made Annually Based on KPIs
Strategic and Operational Activities Identified
Strategic Plan Approved by Board of Trustees Every 4 Years
Budget Approved Annually by PVP, Board of Trustees and County Council
Multi-year College Plan Developed and Approved by PVP (Reviewed and Adjusted Quarterly)
KPIs Reviewed Quarterly to Ensure Activities Lead to Improvement
Activities Prioritized Each Year of Strategic Plan by PVP
How do we measure success?
How do we get there?
How can we improve?
Where do we want to go?

36
Strategic Planning and Institutional Goals Engagement Matters Pathways to Completion | Strategic Plan 2017-2020
Overview of AACC’s Strategic PlanAnne Arundel Community College has always embraced strategic planning as the means to fully realizing our mission and vision. The college adopted a new strategic plan in FY 2017, Engagement Matters: Pathways to Completion (FY 2017-2020). Planning for the new strategic plan was guided by 10 key principles:
• Data Driven – informed by assessment and benchmark.
• Focus – clear goals and finite number of strategies.
• Structure – easy to understand, simplicity, clarity.
• Cross-Divisional – assumes meaning across all areas and drives daily work.
• Process – aligns division plans to the strategic plan and facilitates direction to the college.
• Communication – is clear and consistent.
• Leadership- is cohesive and committed.
• Resources – aligned and supportive of strategic efforts.
• Community – stakeholder needs are reflected.
• Student Focused – grounded in the needs of our students.
Strategic planning is guided by the Strategic Planning Council (SPC), which provides recommendations to the president in the area of short-term and long-term planning and serves as a communication link to employee constituency groups, and ultimately the board of trustees. The SPC is cross-divisional representing all constituency groups and all functions of the college. In April 2016, SPC approved Engagement Matters for consideration by the board of trustees, who in June 2016 approved the plan. Engagement Matters focuses on creating the ideal conditions to ensure that more students complete educational goals and earn family sustaining wages. The strategic plan has three institutional goals and nine objectives that support student pathways from initial connection to completion. The overall purpose of Engagement Matters is to: Increase completion by transforming the culture of the institution to ensure equity and that the college remains student-ready and committed to academic excellence. The three Engagement Matters goals are:
• Goal 1: Engagement and Entry – Increase engagement of all students through a collegewide emphasis on equity, student success and academic excellence.
• Goal 2: Progress – Increase progress of all students through a collegewide emphasis on equity, student success and academic excellence.
• Goal 3: Completion – Increase completion of all students through a collegewide emphasis on equity, student success and academic excellence.
All the goals and objectives in the plan support activities that have a role in strengthening interventions and pathways for students as they strive toward completion of a degree or certificate, with an emphasis on learning.
The strategic plan is strongly rooted in national research and best practices and reflects the student journey through the key milestones of engagement, entry, progress and completion. This guided pathways approach aims to provide better structure through intentional programming and interventions that will help all students through each milestone. The college is pursuing this plan while adhering to its mission’s central tenet of committing to academic excellence. That is the fundamental foundation

ANNE ARUNDEL COMMUNITY COLLEGE / FY 2018 ANNUAL BUDGET
37
upon which the work and continued reputation as a college of distinction is built. Engagement Matters emphasizes the need to be “student-ready,” evidencing a commitment to meet all students where they are as they start their educational journey at AACC. Equity is also placed front and center in the plan as we must provide equitable opportunities for all students. Permeating every goal is a commitment to examine institutional policies, procedures and resources providing all students with the opportunity to progress to degree completion, to transfer to a four-year institution, or to find a career associated with their degree. To help guide our work, AACC has adapted Achieving the Dream’s statement on equity: “Equity is grounded in the principle of fairness. Equity refers to ensuring that each student receives what they need to be successful through the intentional design of the college experience.” Equity is not the same as equality. Equity does not treat everyone the same. Equity delivers individualized resources to individualized need. And it does so as a result of designing inescapable experiences for students.
As this strategic plan is a living document, changes will occur periodically in response to internal and external forces. What will remain constant is the college’s commitment to decisions and actions that will ensure successful implementation of the plan.
Collegewide GoalsUnder each Engagement Matters goal are objectives (listed below) which form the framework for the institutional strategic objectives.
• 1.1 Engage all students from entry to the first day in class.
• 1.2 Improve recruitment and entry experience for students to increase enrollment.
• 1.3 Engage internal and community stakeholders to increase college readiness.
• 2.1 Increase student engagement with faculty, staff, and resources by leveraging technology.
• 2.2 Focus on teaching excellence to implement collegewide professional development opportunities.
• 2.3 Scale up and develop programs collegewide to increase progress toward completion.
• 3.1 Use data regarding entry, progress and completion to scale programs that advance students toward completion, transfer, licensure, certification and/or job placement.
• 3.2 Build internal bridges to fulfill and operationalize a continuum of learning.
• 3.3 Build a community of inclusive excellence that promotes success for all students.

38
STRATEGIC PLAN
Engagement Matters: Pathways to Completion
INSTITUTIONAL GOAL: Increase completion by transforming the culture of the institution to ensure equity and that the college remains student-ready and committed to academic excellence.
OBJECTIVES:
1.1 Engage all students from entry to the first day in class.
• Implement mandatory new student orientation.
• All award-seeking students will complete an academic plan prior to registration.
• Implement academic areas of focus.
1.2 Improve recruitment and entry experience for students to increase enrollment.
• Re-engineer application and registration processes.
• Overhaul and re-launch college website.
• Identify and implement a plan that results in an increase in the number of nontraditional age students who apply and enroll.
1.3 Engage internal and community stakeholders to increase college readiness.
• Expand and enhance dual enrollment offerings with Anne Arundel County Public Schools.
• Scale Accuplacer preparation programs to reduce number of developmental courses needed by incoming students.
• Secure external resources that support student success initiatives.
ENGAGEMENT AND ENTRY
Increase connection and enrollment of all students
through a collegewide emphasis on equity, student
success and academic excellence.
GOAL 1:

ANNE ARUNDEL COMMUNITY COLLEGE / FY 2018 ANNUAL BUDGET
39
OBJECTIVES: 3.1 Use data regarding entry, progress and completion to scale programs that advance students toward completion, transfer, licensure, certification and/or job placement.
• Develop, implement, and scale collegewide programs to track post-completion placement.
3.2 Build internal bridges to fulfill and operationalize a continuum of learning.
• Develop credit on-ramps for students exiting noncredit programs.
3.3 Build a community of inclusive excellence that promotes success for all students.
• Establish a collegewide framework that intentionally addresses issues of diversity, equity and inclusion.
OBJECTIVES: 2.1 Increase student engagement with faculty, staff and resources by leveraging technology.
• Implement and use student planning module to increase (1) use of academic plans and (2) student engagement with faculty, staff and resources, and (3) career exploration opportunities.
• Redesign the faculty referral and early alert system.
2.2 Focus on teaching excellence to implement collegewide professional development opportunities.
• Eradicate achievement gaps at the course level.
• Increase gatekeeper course success rates.
2.3 Scale up and develop programs collegewide to increase progress toward completion.
• Implement developmental education pathways.
• Scale Student Achievement and Success Program (SASP).
COMPLETIONIncrease completion
of all students through a collegewide emphasis
on equity, student success and academic
excellence.
GOAL 3:
PROGRESS
Increase progress of all students through
a collegewide emphasis on equity, student
success and academic excellence.
GOAL 2:
ANNE ARUNDEL COMMUNITY COLLEGE / FY 2018 ANNUAL BUDGET

40
Team Strategic Goals In FY 2017, 20 teams comprised of over 250 faculty and staff volunteered to transform the culture of AACC to ensure equity, increase engagement of students in their academic success, provide timely supports, and promote academic excellence.
Each of the 20 teams was provided with a template for the implementation plans that outlined the charge, team membership, important activities to include in consideration of the charge, how success will be measured, closing equity gaps, budget implications, and a timeline. Teams met regularly during the year to review research and best practices on subject areas, hear presentations about current practices, conduct surveys and reach consensus on recommendations. The Engagement Matters Oversight Team (EMOT) comprised of cross-college leadership received the recommendations after the president and vice presidents had reviewed the team reports. The first team implementation plan was received by EMOT in January 2017. By July 2017, all 20 team plans were completed. Fiscal Year 2019 will see the implementation of a transformed student experience utilizing high-impact practices, beginning for a cohort of new students in fall 2018.
The institutional strategic objectives/team goals under the strategic plan are as follows:
• Team 1 - New Student Onboarding Experience
• Team 2 - Academic Planning
• Team 3 - Areas of Academic Focus
• Team 4 - Reengineer Application to Registration & Payment Processes
• Team 5 - Overhaul and Relaunch College Website
• Team 6 - Nontraditional Age Student Enrollment
• Team 7 - Dual Enrollment
• Team 8 - Scale ACCUPLACER Preparation Programs & Multiple Measures
• Team 9 - Secure External Resources that Support Student Success Initiatives
• Team 10 - Student Planning
• Team 11 - Academic Advising Model
• Team 12 - Career Exploration
• Team 13 - Redesign the Faculty Referral & Early Alert System
• Team 14 - Eradicate Achievement Gaps at Course Level
• Team 15 - Increase Gateway Course Success Rates
• Team 16 - Developmental Education Pathways
• Team 17 - Scale SASP
• Team 18 - Tracking Completion & Post-Completion
• Team 19 - Credit On-Ramps
• Team 20 - Equity, Diversity and Inclusion

ANNE ARUNDEL COMMUNITY COLLEGE / FY 2018 ANNUAL BUDGET
41
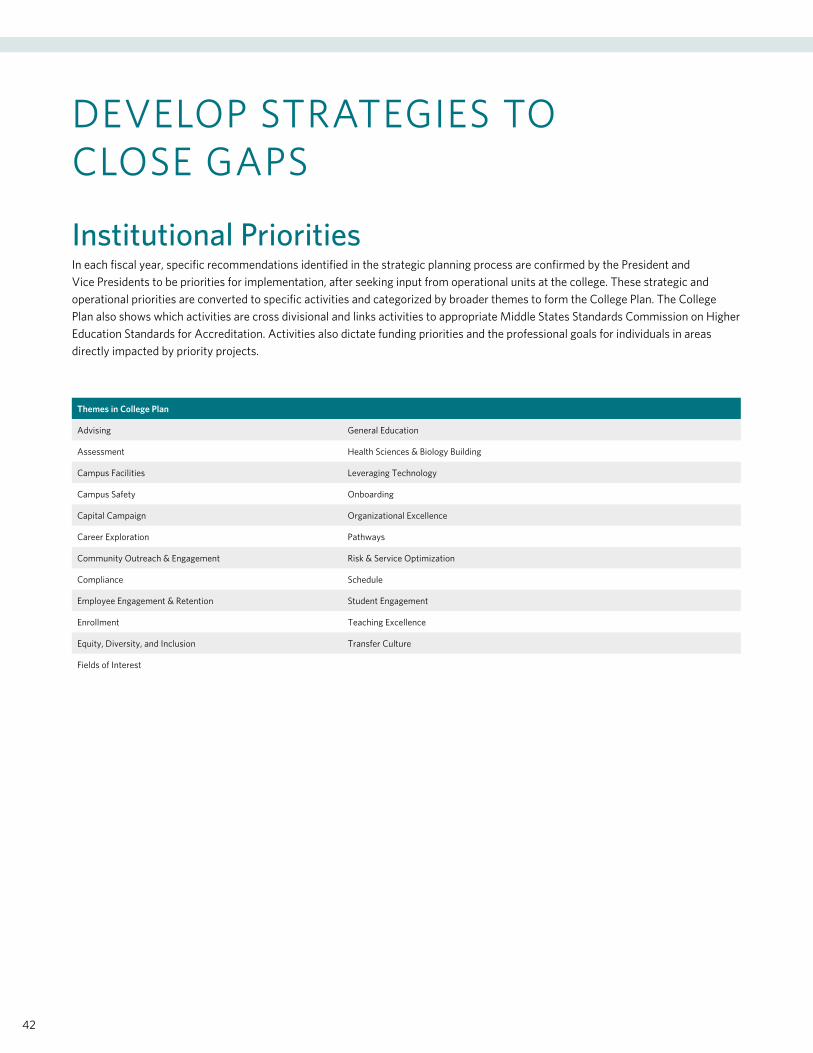
42
DEVELOP STRATEGIES TO CLOSE GAPS
Institutional PrioritiesIn each fiscal year, specific recommendations identified in the strategic planning process are confirmed by the President and Vice Presidents to be priorities for implementation, after seeking input from operational units at the college. These strategic and operational priorities are converted to specific activities and categorized by broader themes to form the College Plan. The College Plan also shows which activities are cross divisional and links activities to appropriate Middle States Standards Commission on Higher Education Standards for Accreditation. Activities also dictate funding priorities and the professional goals for individuals in areas directly impacted by priority projects.
Themes in College Plan
Advising General Education
Assessment Health Sciences & Biology Building
Campus Facilities Leveraging Technology
Campus Safety Onboarding
Capital Campaign Organizational Excellence
Career Exploration Pathways
Community Outreach & Engagement Risk & Service Optimization
Compliance Schedule
Employee Engagement & Retention Student Engagement
Enrollment Teaching Excellence
Equity, Diversity, and Inclusion Transfer Culture
Fields of Interest

ANNE ARUNDEL COMMUNITY COLLEGE / FY 2018 ANNUAL BUDGET
43
College Plan College leadership prioritized team recommendations and along with prioritized operational initiatives were combined into the FY 2018-FY 2020 college plan. Successful completion of the activities in the college plan will be the roadmap the college follows to ensure our strategic goals are achieved and that students complete their educational goals and earn family sustaining wages.
Item # Operational (O) or Strategic (S)
EM Objective Number
Middle States Standard Theme Activity FY Start FY Due
1 S 1.3 Standard VI Capital Campaign Oversee College’s capital campaign to help AACC achieve strategic outcomes FY18 FY20
2 S 3.3 Standard VII Equity, Diversity, and Inclusion Define the role of the Diversity Committee, its leadership, membership and reporting lines FY18 FY18
3 S 3.3 Standard VII Equity, Diversity, and Inclusion
Establish a goal for the campus with regard to diversity, equity and inclusion, and assign CDO tasks to accomplish that goal, to include any committees or surveys that must be overseen by the CDO; ensure this work includes faculty, staff and students
FY18 FY18
4 S 3.3 Standard II Equity, Diversity, and Inclusion Establish a bias response team FY18 FY18
5 S 3.3 Standard VI Equity, Diversity, and Inclusion Identify resourced to implement a diversity plan FY18 FY18
6 S 3.3 Standard VII Equity, Diversity, and Inclusion Identify policies that need to be developed and/or communicated in a streamlined fashion FY19 FY19
7 S 3.3 Standard V Equity, Diversity, and Inclusion Recommend required professional development for employees with regard to diversity FY20 FY 20
8 S 3.1 Standard IV Assessment Implement new procedures to repeatedly use data for decision-making FY18 FY18
9 O Standard V Assessment Implement a new course and program outcomes assessment process FY18 FY18
10 S 3.1 Standard V Career Exploration Redesign the Sarbanes Center FY19 FY19
11 O Standard III Community Outreach & Engagement Pursue and establish new partnerships at AMIL FY18 FY20
12 S 3.1 Standard III Community Outreach & Engagement
Intentionally design a structure of service learning and internships to become the common experience for students on their pathways to completion FY19 FY 20
13 S 3.3 Standard VII Community Outreach & Engagement Establish AACC's academic excellence as a resource for the entire county FY18 FY 20
14 S 1.3 Standard III Enrollment Continue to implement strategic dual enrollment program FY18 FY20
15 S 3.2 and 1.2 Standard III Enrollment Implement new Prior Learning Assessments for relevant programs FY18 FY 20
16 S 3.2 and 1.2 Standard IV Enrollment With the goal of expanding options for students, review all standardized Prior Learning Assessment Tests (CLEP, UExcel, DSST) for their suitability for earning college credit at AACC. FY18 FY 20
17 O Enrollment Identify strategies to increase enrollment at satellite locations and online FY18 FY19
18 O Enrollment Explore the development of new programs in Health and Data Analytics FY18 FY 20
19 S 3.3 Standard III Equity, Diversity, and Inclusion Redesign the processes by which diversity courses are assigned in programs FY18 FY19
20 S 3.3 Equity, Diversity, and Inclusion Expand Meeting of the Minds FY19 FY19
21 O Equity, Diversity, and Inclusion
Implement intentional discussions with faculty about lowering the cost of textbooks with action plans submitted by departments FY18 FY18
22 S 1.1 Standard III Fields of Interest Design and implement a freshman seminar course FY18 FY19
23 S 1.1 Standard IV Fields of Interest Implement Fields of Interest FY18 FY18
24 S 1.1 Standard IV Fields of Interest Provide structure to Transfer Studies students through the Asst. Dean of Liberal Arts FY19 FY20
25 S 1.1 Standard IV Fields of Interest Assign areas of interest a faculty liaison to increase student engagement FY18 FY18
26 O Standard V General Education Complete the General Education review FY18 FY19
27 O Standard VI (and recommendation) HS & Bio Explore the full-time to part-time faculty ratio in support of student success and anticipation of the new Health
Sciences building FY18 FY 20
28 S 1.1 Standard III Leveraging Technology Ensure all faculty have a Canvas Shell and Online Gradebook FY18 FY18
29 S 1.1 Standard III Leveraging Technology Ensure all faculty communicate with students prior to class FY18 FY18
30 S 2.1 Standard IV Leveraging Technology Increase faculty use of the faculty referral system FY18 FY18
31 O Standard III Organizational Excellence Implement a learning college for chairs FY18 FY18
32 O Standard VI Organizational Excellence Work toward operational efficiencies in scheduling and staffing FY18 FY20
33 S 2.3 Standard IV Pathways Implement developmental pathways FY18 FY19
34 S 3.2 Standard III Pathways Implement pathways and articulations between non-credit and credit programming FY18 FY20
35 S 3.1 Standard IV Schedule Create a culture in Learning that develops scheduling focused on completion FY18 FY19
36 O Standard III Schedule Implement new parameters for a course schedule. FY18 FY19
37 S 2.2 Standard V Teaching Excellence Implement four scaled professional development opportunities focused on increasing engagement with students FY18 FY18
38 S 2.2 Standard V (and Recommendation) Teaching Excellence Create a process to evaluate teaching effectiveness of adjuncts FY18 FY18
39 S 2.2 Standard V (and Recommendation) Teaching Excellence Implement a redesigned promotion process for adjuncts FY18 FY19
40 S 2.2 Standard V Teaching Excellence Implement full scale changes in pedagogy in 20 high enrolled/low success courses FY18 FY 20
41 S 2.2 Standard V (and Recommendation) Teaching Excellence Implement a learning college for adjuncts FY18 FY19
42 S 3.3 and 2.2 Standard V Teaching Excellence Engage TFO in a conversation and later implement a new evaluation process to focus on innovation, learning, and equity FY18 FY19
43 O Standard V (and recommendation) Teaching Excellence Implement an adjunct evaluation process FY19 FY19
44 S 3.1 Standard III Transfer Culture Create and implement a process to show transfer pathways to students in the catalog FY18 FY 20
45 S 3.1 Standard V Transfer Culture Emphasize transfer and/or work post completion in programming FY20 FY 20
46 O Standard VI Campus Facilities Update the Facilities Master Plan FY21 FY21

44
Item # Operational (O) or Strategic (S)
EM Objective Number
Middle States Standard Theme Activity FY Start FY Due
47 O Standard VI Campus Facilities Submit state-required Part I & II study for the Dragun building renovation & addition FY19 FY19
48 O Standard VI Campus Safety Develop a comprehensive training program for emergency management FY18 FY18
49 O Community Outreach & Engagement Launch community magazine FY18 FY18
50 O Community Outreach & Engagement Explore public relations opportunities to further the college's presence in the community FY18 FY18
51 O Standard II EE Engagement & Retention Create a centralized employee handbook by combining existing documents, as appropriate FY18 FY18
52 O Standard V EE Engagement & Retention Implement LEAD fundamentals program and revise curriculum for LEAD 2.0 FY18 FY18
53 O Enrollment Develop marketing strategies for off-site locations FY18 FY18
54 S 1.1 Standard IV Fields of Interest Update college marketing and communication materials to reflect fields of interest FY18 FY18
55 O Standard VI HS & Bio Facilitate the completion of the HS&Biology building FY18 FY22
56 O Organizational Excellence Conduct and RFP for a payroll/HR/benefits admin system FY18 FY18
57 O Organizational Excellence Implement new payroll/HR/benefits admin system FY19 FY20
58 O Standard VI Organizational Excellence Review & assess current business model, understand fiscal & academic requirements & review best practices to revise our business model FY18 FY20
59 O Organizational Excellence Replace walk-up copier fleet FY18 FY18
60 O Organizational Excellence Assess custodial services model & recommend a sustainable multi-year plan to provide services to the college FY18 FY18
61 O Standard I Organizational Excellence Update the college's values FY18 FY18
62 S 1.1 Standard IV Student Engagement Recommend and create relevant communications necessary for a successful implementation of a new student experience in fall 2018. FY18 FY18
63 S 2.1 Standard IV Advising Expand the use of technology and online (virtual) advising opportunities FY18 FY18
64 S 1.1 Standard IV Advising Develop a process to assign students to advisors based within their field of interest. FY18 FY18
65 O Standard IV Advising Scale Student Achievement and Success Program (SASP) FY19 FY20
66 O Standard V Assessment Conduct program review in four LSS departments FY18 FY18
67 O Standard II Campus Safety Conduct sexual assault climate survey FY18 FY18
68 S 3.1 Standard IV Career ExplorationEstablish clear and distinct student pathways for career activities that impact career choice/ major selection at point of entry from activities focused on assisting students with gaining meaningful workplace experiences (service learning/ internships) and employment
FY18 FY18
69 O Standard II Compliance Implement US Department of Education Gainful Employment regulations FY18 FY18
70 S 1.2 Standard IV Enrollment Identify, [devise], and implement a plan that results in an increase concerning the number of non-traditional [and intergenerational] age students who apply and enroll at AACC. FY18 FY18
71 O Enrollment Review, devise and implement proven strategies intended to improve enrollment status of AACC students from application, acceptance, to registration. FY18 FY18
72 O Enrollment Advise, implement, and oversee Boomerang 2.0 initiatives (three sessions) and CCSSE endeavors aimed to improve AACC enrollment and retention college-wide. FY18 FY18
73 O Enrollment Build and expand AACC scholarship opportunities for Anne Arundel County citizens to achieve personal academic completion (graduation) goals. FY18 FY18
74 S 1.1 Standard IV Fields of Interest Embed fields of interest into the new student onboarding experience FY18 FY18
75 S 1.1 Standard IV Fields of Interest Develop strategies and activities to ensure fields of interest are embedded in the new student onboarding experience FY18 FY18
76 O General Education Recreate all degree programs in Colleague and in the catalog to reflect General Education curriculum. FY19 FY19
77 S 2.1 Standard IV Leveraging Technology Complete and deploy Degree Audit (Student Progress tracking) changes initiated in FY17 and continue to resolve foundational process challenges for a successful implementation of Student Planning in 2019 FY18 FY18
78 S 2.1 Standard IV Leveraging Technology Assess the system enhancement to the early alert/faculty referral system FY19 FY20
79 S 1.2 Standard II Leveraging Technology Design a solution for streamlining the Student Account Creation and Password Management process. FY18 FY18
80 S Leveraging Technology Secure Transcript Software FY19 FY19
81 S 1.1 Standard IV Onboarding Develop and implement an intentionally designed and comprehensive multi-phased first year onboarding experience to provide information and engagement opportunities at appropriate milestones for direct entry students FY18 FY20
82 S 1.1 Standard IV Onboarding Require all direct entry students to participate in a mandatory, face to face new student orientation session, contextualized by a field of interest. FY18 FY18
83 S 2.3 Standard IV Onboarding Develop an implementation plan for the student placement scheme using multiple measures FY18 FY19
84 S 1.3 Standard IV Onboarding Develop and implement Accuplacer Prep rollout initiative including video and messaging strategies FY18 FY18
85 S 2.2 Standard V Organizational Excellence Provide IPD training for faculty on the various learner support services available to students which will culminate in a Student Development certificate FY18 FY18
86 S 1.1 Standard III Pathways Establish process to award certificate and degree upon completion of required courses. FY18 FY19
87 O Standard VI Risk & Service Optimization Conduct a comprehensive review of Information Technology Services across the college FY18 FY18
88 O Standard III Risk & Service Optimization
Upgrade all computer labs, smart rooms and offices to Windows 10 and Office 2016 to ensure delivery of supported and secure services to the college. FY19 FY19
89 O Risk & Service Optimization
Develop security standards for implementation, training and instructions for Office365 OneDrive usage for faculty and staff as a college approved cloud storage medium. FY19 FY19
90 O Standard III Schedule Facilitate the development of a student-centered class schedule. FY18 FY19
91 O Standard III Schedule Increase enrollment in summer terms by reconsidering delivery and messaging FY18 FY18
92 O Schedule Support, review and implement a centralized AACC Scheduling Plan (including new hire, procedures, and protocols). FY19 FY19
93 O Standard IV Student Engagement Further develop and enhance Athletics as a hub for effective student engagement efforts and activities. FY18 FY18
94 O Standard V Student Engagement Establish Student Development and Learning Outcomes for educational purposeful activities that support student engagement efforts. FY19 FY20
95 O Standard II Student Engagement Establish an Office of Community Standards designed to enhance education to our campus community on expectations for student rights and responsibilities. FY19 FY20
96 O Student Engagement Establish and integrate a comprehensive Student Wellness model. FY19 FY20
97 O Standard IV Student EngagementExpand and scale emergency support efforts and programs (i.e., Helplink, Food Pantry) to support students in need and address barriers to student success (e.g., gaps in funding, food insecurity, financial illiteracy, transportation limitations, etc.)
FY18 FY19
97 S 1.1 Standard IV Student Engagement Recommend and create relevant communications necessary for a successful implementation of a new student experience in fall 2018. FY 18 FY 18

ANNE ARUNDEL COMMUNITY COLLEGE / FY 2018 ANNUAL BUDGET
45
PRIORITIZE SPENDING AND RESOURCE ALLOCATION
The Budget Process Operating Budget DevelopmentThe annual planning and budget development process is the vehicle through which the college identifies and evaluates programs and the allocation of resources necessary to operate during the fiscal year. At Anne Arundel Community College, the budget development process begins with an assessment of departmental activities according to the college's strategic priorities, and the development of budgetary requirements to support the strategies. In order to properly assess a department’s true budgetary needs, it is often necessary to undertake a thorough, multiyear departmental expenditure analysis. The purpose of this comparative analysis is to document budgetary shortfalls, identify potential efficiencies, and provide documentation to support critical staffing and operating expense budgetary requests. This is done upon request of the administration and has been primarily focused on operation and maintenance of plant and information services. Anne Arundel Community College uses a modified incremental budget approach to budgeting. This means that departments retain their prior year base budgets with minor adjustments from year to year. Minor adjustments are usually in the form of cuts for nonrecurring initiatives such as funds for equipment and furniture approved in a prior fiscal year. The College emphasizes growth by substitution. Reallocations from identified efficiencies are the primary sources for funding needs of any type. Once reallocation opportunities have been identified, departments can begin to assess their operational and strategic funding needs. Meanwhile the college’s leadership group reviews and approves assumptions used to build the compensation and benefit budget, as well as all other institutional base adjustments for expenses such as insurance, utilities, employee and dependent waivers, legal fees, etc.
As part of the planning process, departments are required to link budget requests in support of the strategic plan to the institution’s specific goal within the strategic plan. Budgets are approved based on their strategic priority and fund availability. To ensure resources are allocated to the fund initiatives that are most impactful, all budget requests promoted to college leadership are assigned a priority of high, medium or low. Throughout the budget development process, college leadership reprioritizes based on available resources. At the end of the budget cycle, the planning information captured as part of the budget development process is reviewed and evaluated as part of the comprehensive collegewide assessment of the success of the activities implemented in response to the strategic plan.
Throughout the budget development process the college leadership and the board of trustees Budget Committee provide feedback on preliminary budget assumptions and potential scenarios. Once the budget review process is complete the budget is submitted to the board of trustees Budget Committee for review and comment. After incorporating the feedback into the budget, the Budget Committee then recommends the college's budget to the board of trustees. Upon approval by the board of trustees the final budget proposal is submitted to the county executive for consideration and inclusion in the overall county budget appropriation. The county executive submits the overall county budget inclusive of the college's budget to the Anne Arundel County Council for consideration and final appropriation. Upon final appropriation by the county council, the budget office makes any necessary adjustments mandated by the county and posts the approved budget to the general ledger for the beginning of the new fiscal year. Approval by the county council appropriates the college’s annual budget by functional area.
Budget Amendments after AdoptionIf expenditures are projected to exceed the functional area appropriation, a quarterly transfer request is submitted to the county executive, the transfer request details the approved budget by fund and functional area, and the requested change to the budget. The county executive then submits the transfer request to the county council for approval. Once the transfer is approved by the county council, the budget office posts the budget adjustment to the general ledger.

46
Capital Budget DevelopmentDuring the budget development process, the college also prepares a capital budget for submission and approval by the state and county legislatures. The capital budget is a multiyear construction and major renovation plan supported by county and state funding. Funding appropriated for the capital budget is a separate pool of funds and cannot be used to fund operating budget initiatives. All projects financed with capital funds must have at least a 15-year useful life as they are financed at the county and state level by issuing bonds.
Each year, 15 of the 16 state community colleges submit their two-part capital requests to the Maryland Community College Facilities Planners Council (MCCFPC) for approval. The MCCFPC assists the college presidents in prioritizing the requests on a statewide basis through the Maryland Association of Community Colleges. Once prioritized, requests are sent to the Maryland Higher Education Commission, the Department of Budget and Management, and the Department of General Services, and then passed on to the governor and state legislature for approval. Generally, the state provides 50 percent of the funding for design and construction contracts as well as for eligible furniture/fixture/equipment costs. To be eligible for state funding, a community college or the college’s local government must commit to fund the remaining 50 percent. In recent years, AACC’s inability to secure local government commitment for funding has adversely affected the college’s position in the state funding queue, which has in turn resulted in delays in the implementation of the college’s Facilities Master Plan. The county government also provides 100 percent funding for smaller improvement and maintenance projects, such as replacement of the college’s parking, road and sidewalk areas.
Fiscal Year 2018 Budget Calendar - Critical Deadlines for Planning and Budgeting Development
WHEN WHO WHAT
October 3, 2016 Budget Office to Departments FY 2018 Budget Instructions and Base Budget Reports Available
October 4 – October 13, 2016 Cost Center Managers, Assistants, Deans and Directors Budget Development Training Sessions
**October 14, 2016 (Level 1 Freeze Date) Cost Center Managers (Level 1) to Deans and Directors (Level 2) Operational Maintenance and Enhancement Requests,
Strategic New Initiatives, Reallocations
**October 14, 2016 Cost Center Managers (Level 1) to Deans and Directors (Level 2) Inter-Departmental Reallocations to be Processed as Institutional Base Adjustments (Excel form)
**October 28, 2016 (Level 2 Freeze Date) Deans and Directors (Level 2) to VP Offices (Level 3) Operational Maintenance and Enhancement Requests,
Strategic New Initiatives, Reallocations
**October 28, 2016 Deans and Directors (Level 2) to VP Offices (Level 3) Inter-Departmental Reallocations to be Processed as Institutional Base Adjustments (Excel form)
October 31, 2016 SEM to Budget Office First Draft FTE Report for FY 2018
October 31, 2016 VP Offices to Budget Office Reallocations including Inter-Departmental Reallocations to be Processed as Institutional Base Adjustments (Excel form)
October 31, 2016 AVP Office to Budget Office New and Revised Lab Fee Requests
November 4, 2016 Budget Office to VP Offices FY 2018 First Draft Budget Request. First Draft Revenue Model, Institutional Base Adjustments and Reallocations to Base Budget
November 11, 2016 (Level 3 Freeze Date) VP Offices to Budget Office Approved Operational Maintenance and Enhancement Requests,
Strategic New Initiatives
December 2, 2016 HR, IS and Campus Development to Budget Office Vetted HR, Technology and Facility Project Components
December 5, 2016 Department and/or VP Offices to Budget Office Efficiency and Cost Savings Report
December 9, 2016 Budget Office to VP Office
FY 2018 Second Draft Budget Request. Approved Revenue Model, Institutional Base Adjustments, Operational Maintenance and Enhancement Requests, Strategic New Initiative Requests, Reallocations to Base Budget, and Vetted Components
January 6, 2017 VP Offices to Budget Office FY 2018 Approved Budget Request
Late January or early February, 2017 BOT & VP Group BOT Budget Workshop
February 28, 2017 BOT BOT Approve Budget in Public Session
March 1, 2017 President/Budget Office to County Executive and Budget Office Submit BOT Approved FY 2018 Operating and Capital Budget Request to County Executive
March 2017 PVP Group/Budget Office to County Budget Office Present BOT Approved FY 2018 Operating and Capital Budget Request to County Executive
April 2017 BOT & VP Group to County Council Present FY 2018 Operating and Capital Budget Request
June 2017 County Council Final Approval of FY 2018 Operating and Capital Budget
June 2017 VP Offices Communicate Approved FY 2018 Operating and Capital Budget to Divisions
**Intra-divisional deadline may exist prior to this date

ANNE ARUNDEL COMMUNITY COLLEGE / FY 2018 ANNUAL BUDGET
47
Planning Calendar
The following chart depicts the planning and budget development activities that must occur in a single fiscal year.
KEY: Strategic Planning Operational Planning Budget Planning
Planning and budget development tasks June July Aug. Sept. Oct. Nov. Dec. Jan. Feb. Mar. Apr. May June July
PVP and SPC monitor lead and lag measure for KPIs and strategic activities (corrective actions taken as necessary)
Continuous Monitoring
PVP monitors operational activities (corrective actions taken as necessary) Continuous Monitoring
Units identify operational activities and submit to VP
Recommendations to PVP for new strategic activities prioritized for upcoming budget cycle
PVP approval of strategic activities and resource allocations
PVP assigns each strategic activity to appropriate division/work team for implementation
PVP each assemble annual division activity plans (ADAPs) — operational and strategic activities combined for their division
Review of ADAPs to identify any overlap
PVP approval of all ADAPs
ADAPs from each division combined to form annual college plan
Budget instructions and base budget reports available
Strategic work teams establish goals for assigned strategic activities and begin implementation
1st quarter divisional reports due
Update on strategic plan to board of trustees
First draft budget request and revenue models
Second draft budget request
2nd quarter divisional reports due
PVP approves budget request
BOT budget workshop
BOT approval of FY operating and capital budgets
Budget presentations to county executive
3rd quarter divisional reports due
Budget presentations to county council
Update on strategic plan to board of trustees
Budget approved by county council
4th quarter/final divisional reports due
KPI annual report (KPI-AR) - summary of strategic plan accomplishments distributed
48
FY 2018 Budget AssumptionsBudget Development Priorities • Attract and retain quality faculty and staff.
• Legal and regulatory compliance.
• Information technology.
• Strategic initiatives.
• Health Sciences and Biology Building.
Revenue Assumptions:• State – Base Cade funding at $28.8 million, flat from the FY 2017 budget. State funding also includes $200k for base RHEC
funding, and an additional $470k anticipated in tuition affordability funding for keeping the tuition rate increase below 2 percent.
• County – The county budget consists of two funding sources - $48.3 million general fund appropriation and $1.7 million in VLT funds. 2018 represents a 4 percent or $1.6 million increase from the prior year and is consistent with the funding increase received in FY 2017 from the county. The county's five-year funding projections project growth at 2 percent per year.
• Tuition and Fees
Enrollment – FY 2018 FTE projection is flat from 2017 projections as of Jan. 30, 2017.
Tuition and Fee Rates – Tuition and fee rates are developed with the guiding principle of small incremental growth to avoid large spikes in any one year while maximizing enrollment. In addition, the governor has provided a one-time grant to institutions that keep tuition at or below a 2 percent increase.
• Tuition Stabilization Fund and Other Revenue Contribution
TSF – With the primary purpose of the fund to manage revenue shortfalls and other one-time expenditures, the fund will be maintained at an appropriate level to provide reasonable fiscal security for unanticipated revenue shortfalls, while at the same time does not become so large as to create unintended cuts from the County.
Auxiliary and Enterprise contributions – Anticipating declining contributions from auxiliary due to declining enrollment, and no enterprise contribution anticipated for FY 2018.
Expenditure Assumptions:• Institutional Base Adjustments
Reversal of one time FY 2017 budget requests.
PC/AV replacement – anticipated that a portion will be funded through year-end spending and allocation of the tuition affordability grant.
Faculty and Staff Compensation – Attempting to continue to address compensation to ensure competitive salaries for our faculty and staff. The compensation philosophy was recently approved by the board and the FY 2018 request will attempt to align the budget request with the philosophy approved by providing:
• Faculty 2 percent compensation pool.
• Faculty 0.5 percent compression adjustment pool.
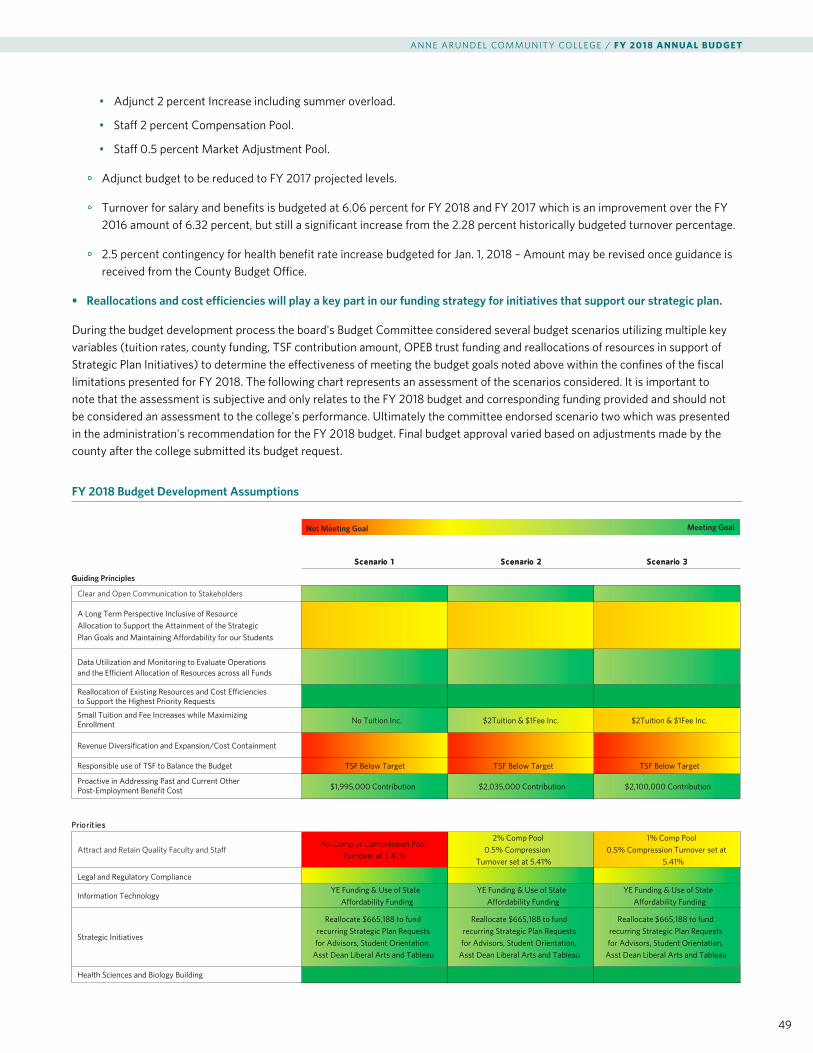
ANNE ARUNDEL COMMUNITY COLLEGE / FY 2018 ANNUAL BUDGET
49
• Adjunct 2 percent Increase including summer overload.
• Staff 2 percent Compensation Pool.
• Staff 0.5 percent Market Adjustment Pool.
Adjunct budget to be reduced to FY 2017 projected levels.
Turnover for salary and benefits is budgeted at 6.06 percent for FY 2018 and FY 2017 which is an improvement over the FY 2016 amount of 6.32 percent, but still a significant increase from the 2.28 percent historically budgeted turnover percentage.
2.5 percent contingency for health benefit rate increase budgeted for Jan. 1, 2018 – Amount may be revised once guidance is received from the County Budget Office.
• Reallocations and cost efficiencies will play a key part in our funding strategy for initiatives that support our strategic plan.
During the budget development process the board's Budget Committee considered several budget scenarios utilizing multiple key variables (tuition rates, county funding, TSF contribution amount, OPEB trust funding and reallocations of resources in support of Strategic Plan Initiatives) to determine the effectiveness of meeting the budget goals noted above within the confines of the fiscal limitations presented for FY 2018. The following chart represents an assessment of the scenarios considered. It is important to note that the assessment is subjective and only relates to the FY 2018 budget and corresponding funding provided and should not be considered an assessment to the college's performance. Ultimately the committee endorsed scenario two which was presented in the administration's recommendation for the FY 2018 budget. Final budget approval varied based on adjustments made by the county after the college submitted its budget request.
Not Meeting Goal Meeting Goal
SScceennaarriioo 11 SScceennaarriioo 22 SScceennaarriioo 33
GGuiding Principles
Clear and Open Communication to Stakeholders
A Long Term Perspective Inclusive of Resource Allocation to Support the Attainment of the Strategic Plan Goals and Maintaining A�ordability for our Students
Data Utilization and Monitoring to Evaluate Operations and the Ecient Allocation of Resources across all Funds
Reallocation of Existing Resources and Cost Eciencies to Support the Highest Priority Requests
Small Tuition and Fee Increases while Maximizing Enrollment No Tuition Inc. $2Tuition & $1Fee Inc. $2Tuition & $1Fee Inc.
Revenue Diversification and Expansion/Cost Containment
Responsible use of TSF to Balance the Budget TSF Below Target TSF Below Target TSF Below Target
Proactive in Addressing Past and Current Other Post-Employment Benefit Cost $1,995,000 Contribution $2,035,000 Contribution $2,100,000 Contribution
PPrriioorriitt iieess
Attract and Retain Quality Faculty and Sta�No Comp or Compression Pool
Turnover at 5.41%
2% Comp Pool 0.5% Compression
Turnover set at 5.41%
1% Comp Pool 0.5% Compression Turnover set at
5.41%
Legal and Regulatory Compliance
Information Technology YE Funding & Use of State
A�ordability Funding YE Funding & Use of State
A�ordability Funding YE Funding & Use of State
A�ordability Funding
Strategic Initiatives
Reallocate $665,188 to fund recurring Strategic Plan Requests for Advisors, Student Orientation,
Asst Dean Liberal Arts and Tableau
Reallocate $665,188 to fund recurring Strategic Plan Requests for Advisors, Student Orientation,
Asst Dean Liberal Arts and Tableau
Reallocate $665,188 to fund recurring Strategic Plan Requests for Advisors, Student Orientation,
Asst Dean Liberal Arts and Tableau
Health Sciences and Biology Building
FY 2018 Budget Development Assumptions

50
Financial Plan - Revenue and Expenditure SummaryOperating Fund The operating fund is the main fund of the college. The funding model consists of three partners with each partner contributing approximately a third of the funding. The operating revenue fund sources are as follows:
State Aid State aid is based on the Sen. John A. Cade funding formula (the Cade formula) which is set by the state as part of its budget process and based on a formula that ties a percentage of the annual state aid allocated per full-time equivalent (FTE) at the four- year public colleges and universities to the state aid granted per FTE to community colleges. Also included as part of the state budget is funding for the AACC Regional Higher Education Center. This funding is part of the governor’s budget and is managed through the Maryland Higher Education Commission (MHEC). Funding in the FY 2018 budget for state aid is $28,800,000 under Cade funding, $200,000 in Regional Higher Education Center funding and $470,400 due to a one-time grant awarded for keeping tuition below a 2 percent increase for a total state aid budget of $29,470,400.
County SupportUnder Title 16, Subtitle 3, Section 35(d) of the Education Article, Annotated Code of Maryland, the county must share in the cost of operating the college. As a minimum funding guideline, the county is required to maintain the level of funding of the current fiscal year into the next fiscal year in order for the college to receive an increase in state funding. Approval by the county council appropriates the college’s annual support by July 1 of each year.
Funding Source Actual FY 2011
Actual FY 2012
Actual FY 2013
Actual FY 2014
Actual FY 2015
Actual FY 2016
Budget FY 2017
Budget FY 2018
FY 11-18 Change
State $26,874,288 $27,464,155 $27,473,716 $28,411,392 $28,995,325 $29,005,571 $29,000,000 $29,470,400 10%
County $33,822,700 $28,556,400 $32,047,700 $35,137,700 $37,637,700 $38,387,700 $40,987,700 $41,987,700 24%
Total $60,696,988 $56,020,555 $59,521,416 $59,521,416 $67,393,271 $67,393,700 $71,458,100 $71,458,100 18%
Over the past seven years, combined state and county funding has increased 18 percent or on average of 2.6 percent per year, with county support increases averaging 3.4 percent per year.
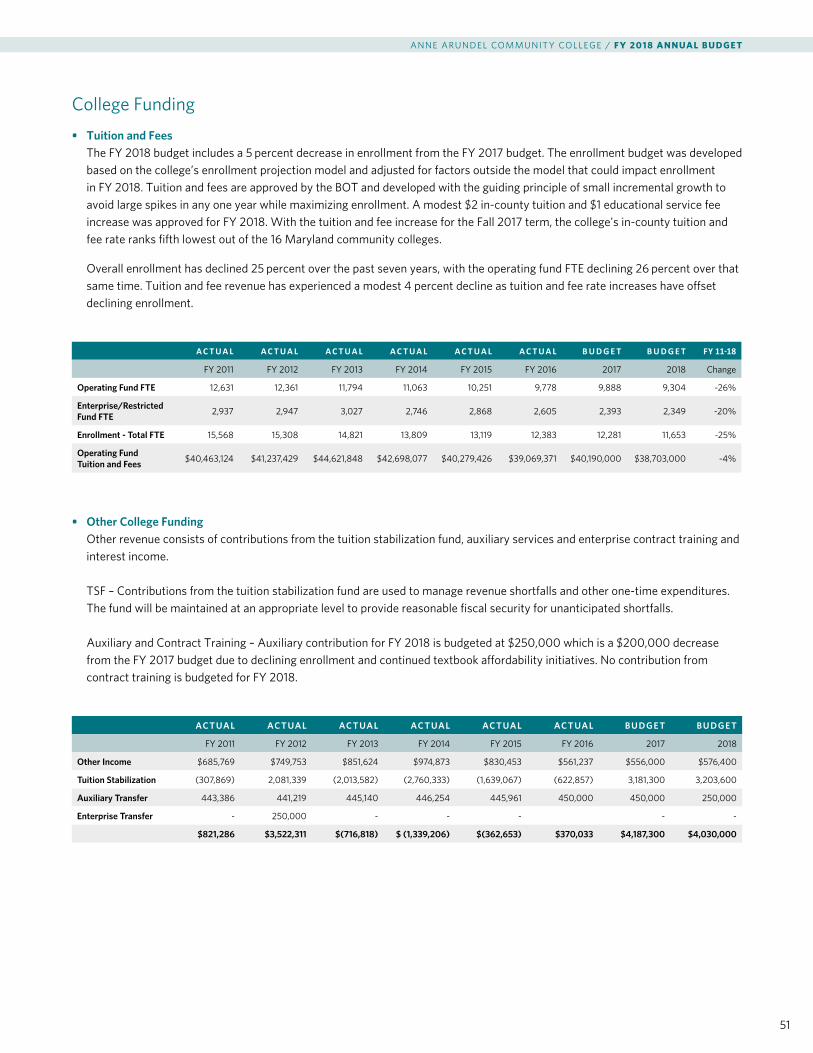
ANNE ARUNDEL COMMUNITY COLLEGE / FY 2018 ANNUAL BUDGET
51
College Funding• Tuition and Fees
The FY 2018 budget includes a 5 percent decrease in enrollment from the FY 2017 budget. The enrollment budget was developed based on the college’s enrollment projection model and adjusted for factors outside the model that could impact enrollment in FY 2018. Tuition and fees are approved by the BOT and developed with the guiding principle of small incremental growth to avoid large spikes in any one year while maximizing enrollment. A modest $2 in-county tuition and $1 educational service fee increase was approved for FY 2018. With the tuition and fee increase for the Fall 2017 term, the college's in-county tuition and fee rate ranks fifth lowest out of the 16 Maryland community colleges.
Overall enrollment has declined 25 percent over the past seven years, with the operating fund FTE declining 26 percent over that same time. Tuition and fee revenue has experienced a modest 4 percent decline as tuition and fee rate increases have offset declining enrollment.
A C T U A L A C T U A L A C T U A L A C T U A L A C T U A L A C T U A L B U D G E T B U D G E T FY 11-18
FY 2011 FY 2012 FY 2013 FY 2014 FY 2015 FY 2016 2017 2018 Change
Operating Fund FTE 12,631 12,361 11,794 11,063 10,251 9,778 9,888 9,304 -26%
Enterprise/Restricted Fund FTE 2,937 2,947 3,027 2,746 2,868 2,605 2,393 2,349 -20%
Enrollment - Total FTE 15,568 15,308 14,821 13,809 13,119 12,383 12,281 11,653 -25%
Operating Fund Tuition and Fees $40,463,124 $41,237,429 $44,621,848 $42,698,077 $40,279,426 $39,069,371 $40,190,000 $38,703,000 -4%
• Other College Funding Other revenue consists of contributions from the tuition stabilization fund, auxiliary services and enterprise contract training and interest income. TSF – Contributions from the tuition stabilization fund are used to manage revenue shortfalls and other one-time expenditures. The fund will be maintained at an appropriate level to provide reasonable fiscal security for unanticipated shortfalls. Auxiliary and Contract Training – Auxiliary contribution for FY 2018 is budgeted at $250,000 which is a $200,000 decrease from the FY 2017 budget due to declining enrollment and continued textbook affordability initiatives. No contribution from contract training is budgeted for FY 2018.
AC TUAL AC TUAL AC TUAL AC TUAL AC TUAL AC TUAL B U DG E T B U DG E T
FY 2011 FY 2012 FY 2013 FY 2014 FY 2015 FY 2016 2017 2018
Other Income $685,769 $749,753 $851,624 $974,873 $830,453 $561,237 $556,000 $576,400
Tuition Stabilization (307,869) 2,081,339 (2,013,582) (2,760,333) (1,639,067) (622,857) 3,181,300 3,203,600
Auxiliary Transfer 443,386 441,219 445,140 446,254 445,961 450,000 450,000 250,000
Enterprise Transfer - 250,000 - - - - -
$821,286 $3,522,311 $(716,818) $ (1,339,206) $(362,653) $370,033 $4,187,300 $4,030,000

52
Operating Revenue Budget by Percentage
100%
80%
60%
40%
20%
0%26%
FY2011Actual
Operating Revenue Budget by Percentage
FY2012Actual
FY2013Actual
FY2014Actual
FY2015Actual
FY2016Actual
FY2017Budget
27% 26% 26% 27% 27% 25%
33% 28% 30% 33% 35% 36% 36%
AACC
County
State
41% 45% 44% 41% 38% 37% 39%
FY2018Budget
26%
37%
37%
Salary and BenefitsSalary and benefits make up approximately 82 percent of the operating budget for the college. The FY 2018 budget of $93,110,568 is flat from the FY 2017 budget due to turnover offsetting to a 2 percent salary pool increase for faculty, and staff and an additional 0.5 percent salary pool to address market rate and compression adjustments. The base budget for compensation is calculated for each position, including vacant positions, based on the approved salary in the current fiscal year, vacant positions are budgeted at the previous incumbent’s salary. The base budget for benefits is calculated for each position based on the current benefit selections. Benefits for vacant positions are calculated by using the average of the plans chosen by current employees. As every position will not be filled all year, the college budgets for turnover, which is a negative expense. The turnover percentage for FY 2018 is 6.06 percent up from a historical budget rate of 2.28 percent. The higher turnover rate results in staffing challenges as vacancies need to be held open longer in order to meet the turnover budget. As part of FY 2018 budget development, the college undertook a review of vacant positions and eght were reallocated into new positions to better serve the college. Four full-time and one part-time position were eliminated as the activity the position supported no longer exists.
The college has taken a proactive approach regarding faculty and staff compensation and has just completed a comprehensive assessment and review of its compensation systems to ensure that faculty and staff salaries are in-line with market rates based on competencies such as education, experience, managerial responsibility, independent judgment and physical demands. Recommendations for market and compression adjustments will be implemented in a phased-in approach.
Operating Expenses Operating expenses are all expenses other than salary and benefits. The budget for other operating expenses increased 1 percent from the FY 2017 budget due to $470,400 tied to the allocation of the one-time state grant funding toward essential technology initatives.
Operating expenditures have increased 3 percent from FY 2011 compared to the FY 2018 budget which is less than 0.5 percent per year. Overall actual expenditures have decreased by $2.6 million from FY 2011 to FY 2016 as a result of implementing cost efficiencies and the deferral of essential technology upgrades.
Actual Actual Actual Actual Actual Actual Budget Budget FY 11-18
FY 2011 FY 2012 FY 2013 FY 2014 FY 2015 FY 2016 FY 2017 FY 2018 Change
Salary and Benefits
81,579,555 82,824,211 81,602,234 83,569,666 86,940,163 89,063,102 92,957,540 93,110,568 14%
Operating Expense
20,403,843 17,956,084 21,824,212 21,338,297 19,609,635 17,769,573 20,807,460 21,080,532 3%
Total Expenditures
101,983,398 100,780,295 103,426,446 104,907,963 106,549,798 106,832,675 113,765,000 114,191,100 12%
-1% 3% 1% 2% 0% 6% 0%

ANNE ARUNDEL COMMUNITY COLLEGE / FY 2018 ANNUAL BUDGET
53
Total Employee Count
EMPLOYEE FTE BY CATEGORY
FY 2011 Actual
FY 2012 Actual
FY 2013 Actual
FY 2014 Actual
FY 2015 Actual
FY 2016 Actual
FY 2017 Actual
FY 2018 Budget
% of Total
Full-Time Faculty 272.00 272.00 277.00 278.00 279.00 279.00 279.00 277.00 13%
Part-time Faculty 1,215.00 1,201.00 1,197.00 1,105.00 1,006.00 1,004.00 1,026.00 1,125.00 54%
Administrators 65.00 62.00 63.00 67.00 67.00 71.00 74.00 75.00 4%
Professional and Support Staff 558.26 564.26 579.01 600.55 616.32 613.05 616.05 590.75 28%
Contractual Positions 42.75 47.50 46.83 49.36 37.51 31.00 30.00 29.85 1%
Total Employee FTE 2,153.01 2,146.76 2,162.84 2,099.91 2,005.83 1,998.05 2,025.05 2,097.60 100%
EMPLOYEE FTE BY FUNCTIONAL AREA
FY 2011 Actual
FY 2012 Actual
FY 2013 Actual
FY 2014 Actual
FY 2015 Actual
FY 2016 Actual
FY 2017 Actual
FY 2018 Budget
% of Total
Instruction 1,714.43 1,703.78 1,714.76 1,638.78 1,536.81 1,530.17 1,548.17 1,630.02 76%
Academic Support 127.30 128.30 128.80 135.30 136.80 139.30 141.30 141.30 7%
Student Services 97.38 100.88 102.88 109.18 117.68 115.18 121.18 119.68 6%
Plant 70.00 69.00 67.00 66.00 62.00 61.00 61.00 61.00 3%
Institutional Support 143.90 144.80 149.40 150.65 152.55 152.40 153.40 145.60 8%
Total Employee FTE 2,153.01 2,146.76 2,162.84 2,099.91 2,005.83 1,998.05 2,025.05 2,097.60 100%
In FY 2018 the college funded 12 new operating positions through reallocation as follows:
• Assistant Dean Liberal Arts.
• AVP LSS.
• Coordinator Inclusive Excellence.
• Program Pathways Specialist.
• 5 Academic Advisors.
• Instructional Specialist – Engineering.
• Emergency Management Commander.
• STEM Internship and Job Developer.
These positions were funded through reallocation of eight existing vacancies and identified cost savings. In addition three full-time and one part-time position in support of the pool were eliminated due to the closing of the pool and the scheduled demolition in preparation for the new Heath Sciences and Biology building. As part of the master plan study, the pool was identified as an underutilized resource and the space reallocated to allow for construction of the Health Science and Biology building.
In addition, several retirements in auxiliary services allowed for a reorganization of the bookstore and outsourcing of dining services, resulting in the elimination of 4 additional positions.
Below is a summary of the FY 2018 budget initiatives:
FY 2017 Base Budget $113,765,000
Reductions:
Salary savings FY 17 new hires (926,635)
Adjunct faculty savings (332,871)
Eliminate pool operating costs (265,612)
Cost savings on contracts (90,000)
One-time items FY 2017 initiatives (88,730)
Total Reductions (1,703,848)
Base adjustments:
Health insurance contingency (2.5%) 276,386
Health insurance 211,692
Miscellaneous 41,704
Retirement fee increase 11,394
Chargeback adjustment (30,000)
Revenue offsets (72,682)
Turnover adjustment (867,205)
Total Base Budget Adjustments (428,711)
Compensation adjustments:
2% salary pool faculty and staff 1,344,701
2% adjunct rate increase and lab loading 300,284
0.5% Compression and market adjustment pool-faculty and staff 335,624
Faculty and staff promotions 107,650
Total compensation adjustments 2,088,259
Essential technology upgrades 470,400
Total FY 2018 Base Budget $114,191,100
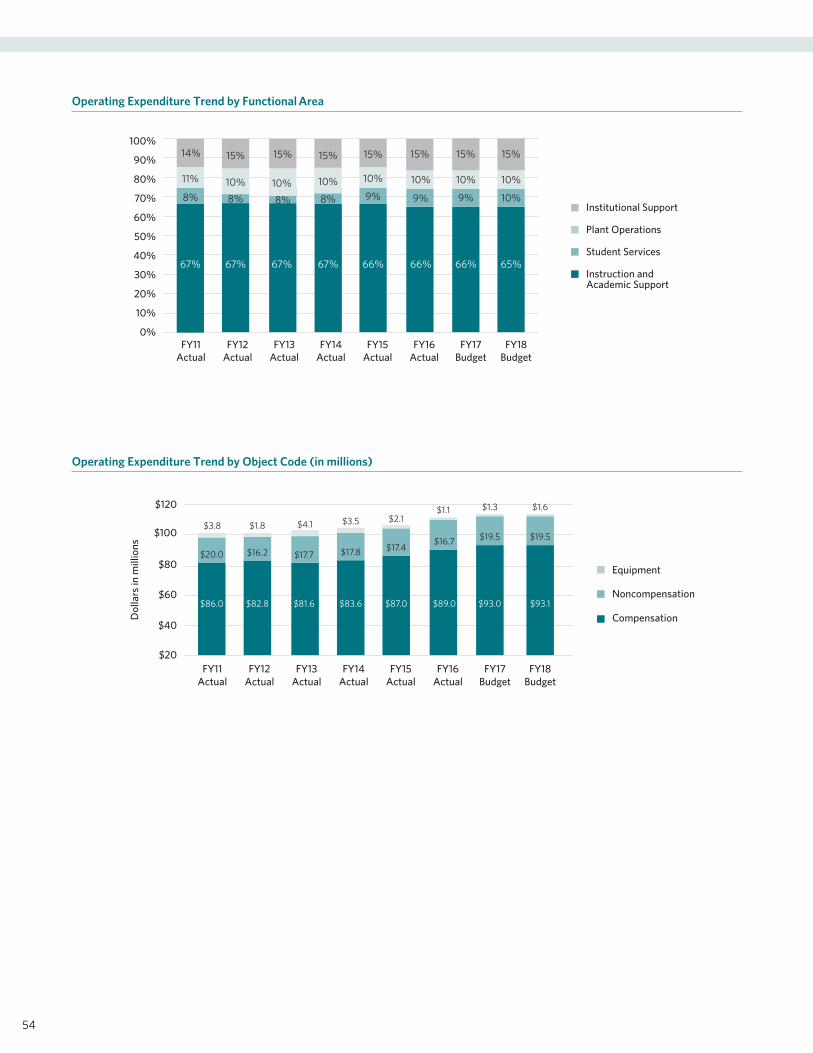
54
Operating Expenditure Trend by Functional Area
100%
90%
80%
60%
40%
20%
70%
50%
30%
10%
0%FY11
Actual
Operating Expenditure Trend by Functional Area
FY12Actual
FY13Actual
FY14Actual
FY15Actual
FY16Actual
FY17Budget
Institutional Support
14% 15% 15% 15% 15% 15% 15%
10%11% 10% 10% 10% 10% 10%
8%8% 8% 8% 9% 9% 9%
67%67% 67% 67% 66% 66% 66%
FY18Budget
15%
10%
10%
65%
Plant Operations
Student Services
Instruction and Academic Support
Operating Expenditure Trend by Object Code (in millions)
$120
$100
$80
$60
$40
$20FY11
Actual
Operating Expenditure Trend by Object Code
FY12Actual
FY13Actual
FY14Actual
FY15Actual
FY16Actual
FY17Budget
Equipment
Noncompensation
Compensation
$3.8 $1.8 $4.1 $3.5 $2.1$1.1 $1.3
$16.2$20.0 $17.7 $17.8 $17.4$16.7 $19.5
$82.8$86.0 $81.6 $83.6 $87.0 $89.0 $93.0
FY18Budget
$1.6
$19.5
$93.1
Dol
lars
in m
illio
ns

ANNE ARUNDEL COMMUNITY COLLEGE / FY 2018 ANNUAL BUDGET
55
Auxiliary, Enterprise, Restricted FundAuxiliary and enterprise revenues are generated from fees for services such as bookstore sales and contract workforce development training. Restricted fund revenues consist mainly of financial aid, federal and state grants.
Auxiliary FundWith continued difficulty managing an in house fiscally sustainable dining services operations, and two key retirements, effective July 1, 2018 the college has outsourced its catering and main servery operations. This is a continuation of the success experienced with outsourcing of two of our dining services kiosks in 2014. The new operations are structured similar to the kiosk outsourcing arrangements, where the college receives a commission on all sales, and the outside vendor provides a necessary service to our students, faculty and staff.
Enterprise Fund Declining contract training activity, from the original projections related to the Center for Cyber and Professional Training have stressed the enterprise fund operating profitability over the past few years. As a result, the Contract Training Group has continued to examine program offerings in an attempt to improve the locations fiscal performance. In FY 2017 several new programs in health services were introduced at the location and in FY 2018, Pharmacy Technician and Nursing Assistant programs will launch at the site. Transitioning these programs to non credit and at this location help meet the demand of the area at an accelerated pace compared to the traditional credit program. In addition a new nail technician program will be launched in FY 2018, again responding to labor market needs within the region.
Restricted FundThe restricted fund consists of federal and state grants as well as scholarships and financial aid where the college is the fiscal agent. In FY 2017 the college had 3,636 Pell Grant recipients and beginning in FY 2018 the college will be implementing year-round Pell. In FY 2017 $1,877,995 was distributed as scholarships. Of that amount, $822,003 was from the AACC Foundation, Inc.
Capital FundConsistent with the college’s FY 2016 facilities master plan, the capital priority for FY 2018 was funding to begin the design and construction of a new 175,210 GSF facility to house the School of Health Sciences. The building will house 21 programs of study and the department of biology, which is part of the School of Science and Technology. The purpose of the project is to provide a state-of-the-art Health Sciences and Biology facility on the Arnold campus that has sufficient space to accommodate current and projected enrollments for the entire School of Health Sciences and the department of biology. The new facility will include new academic support, administrative study, collaboration and student space, and will be located to serve as the anchor of a new science quad on the Arnold campus. The total budget for this project is $116,952,000, with $13,040,000 approved for design in FY 2018 and projected completion in FY 2021.
As existing capital projects are repair and maintenance related there is no impact on the operating budget for current capital projects. There will be an impact on the FY2021 budget when construction is completed on the Health Sciences and Biology building. As part of the FY2019 budget development long –term planning process the college will address funding for increased operational costs associated with this capital project.
Deferred maintenance is defined as the upkeep of buildings and equipment postponed from an entity’s normal operating budget cycle due to a lack of funds. AACC currently has a backlog of deferred maintenance totaling $8,849,433. The college requested $3,825,000 in county funding for repair and maintenance related projects, but the county was only able to fund $1,825,000 leaving an unfunded balance of $2,000,000. This funding shortfall will require additional monitoring to ensure the college can address critical deferred maintenance needs and maintain an appropriate level of operations.

56
Tuition Stabilization Fund (TSF)This is the college fund balance and represents net assets adjusted for long-term obligations and assets to determine current assets available for operations. The board of trustees has established a policy to maintain between 5 percent and 10 percent of its current fiscal year total budgeted expenditures as its TSF which is $7,810,955-$15,621,910 for FY 2018. However during the FY 2018 budget development process, the Board authorized a slightly lower projected balance for FY 2018 at $5,092,548, or 3 percent of total budgeted expenditures. This lower balance reflects the administration and board's desire to maintain an appropriate level of reserve, while at the same time make strides toward funding the pther post-employment benefit obligation noted below.
Other Post-Employment Benefits (OPEB) Under Governmental Accounting Standards, the college and other governmental entities are required to recognize the cost of OPEB, throughout an employee’s employment cycle. This is in contrast to the previous practice of recognizing the expense at the time of payment, which is typically several years after the benefits are earned. For example, during the current year an employee will earn benefits that will be paid in future periods. Under the current standard, the college will estimate the value of those future benefits and recognize that expense in proportion to the percentage earned in the current year. Under the previous standard, the college would not recognize any additional expenses until the employee retired and started receiving the specific benefit or insurance coverage. The current standard requires the college to estimate the benefit obligation and disclose the facts associated with that obligation. It does not require the college to fund the liability, or modify any of the existing benefits. The standard gives the college the opportunity and tools to examine current benefits and the costs associated with those benefits and determine if the current benefit structure is appropriate and reasonable in light of current trends and the strategic plan of the institution. This standard brings OPEB in line with the matching concept, by recording the expenses in the year earned by the employee. Similar to the pension funding model, the college will record expenses based on the services rendered by employees today that will require future cash flows. Late in FY 2015, the county council passed a bill establishing the Retiree Health Benefits Trust among the county, college and library effective July 1, 2015. The allocation of funding and the establishment of the trust allows the college to take full advantage of the institutional reserves and continue to seek county support for college priorities including a long-term funding solution for the OPEB obligation. The college board and leadership continue to discuss with the county executive and county budget office appropriate levels of support going forward. For FY 2018 the college has budgeted an OPEB contribution of $2,035,000. The proposed FY 2018 amount does not completely fund the anticipated FY 2018 expense.
Debt Service$7,079,200 has been approved as part of the county’s FY 2018 budget for funding of the college’s debt service. This represents the current year cash flow relating to bonds issued by the county for funding of capital projects which benefit of the college. This debt service is not the responsibility of the college.
In accordance with the Maryland annotated code, education article, section 16-305 the college is generally limited to the use of debt for the leasing of personal property. The college has entered into an installment purchase contract for photocopying equipment expiring in FY 2021, FY 2018 principal and interest is $56,575. Outside of insignificant leasing activity noted above, the college has not issued and has no intention of issuing any debt.
Financial SustainabilityThe college’s financial outlook is stable. Operating appropriations from the State of Maryland and Anne Arundel County account for over half of the college’s annual operating revenue with capital support from the State and County allowing the college to expand without issuing debt. The challenge of several years of enrollment declines have reduced tuition and fee revenue resulting in very thin cash flow however the college will continue to adjust its expenses to compensate for ongoing modest enrollment declines. It is assumed that state and county appropriations will be at least flat, that there will be no further deterioration of unrestricted liquidity, and that the college will not issue any debt.
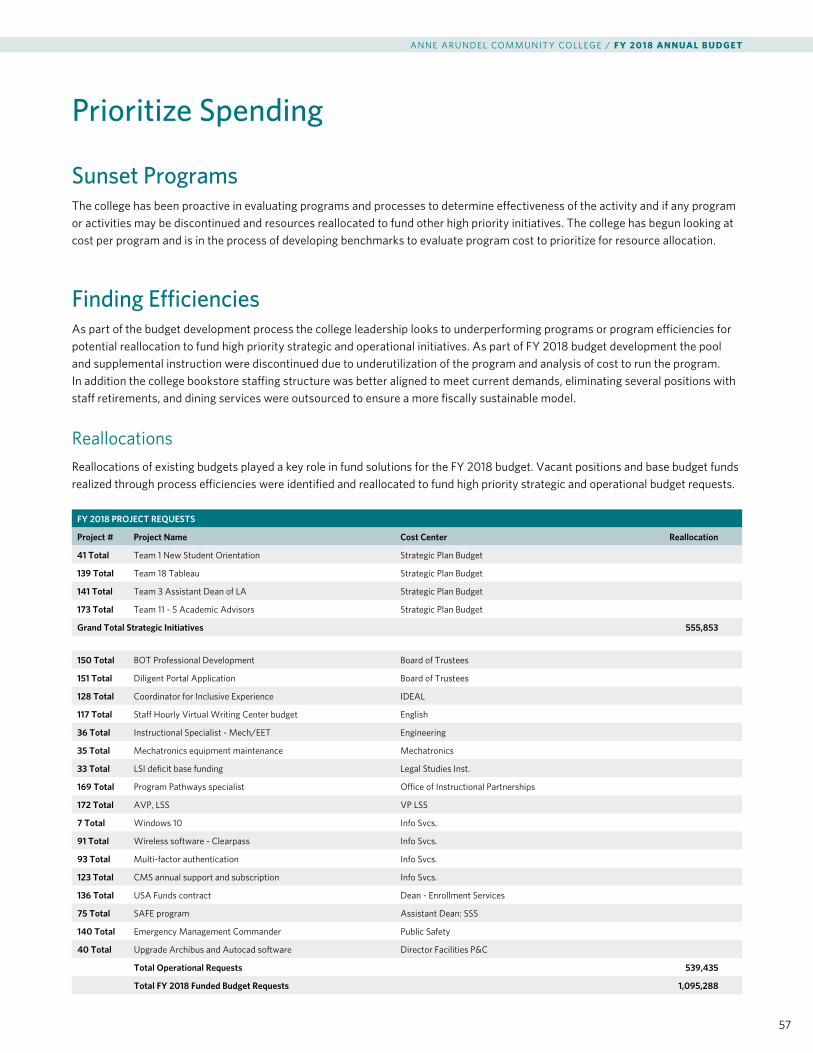
ANNE ARUNDEL COMMUNITY COLLEGE / FY 2018 ANNUAL BUDGET
57
Prioritize Spending
Sunset ProgramsThe college has been proactive in evaluating programs and processes to determine effectiveness of the activity and if any program or activities may be discontinued and resources reallocated to fund other high priority initiatives. The college has begun looking at cost per program and is in the process of developing benchmarks to evaluate program cost to prioritize for resource allocation.
Finding EfficienciesAs part of the budget development process the college leadership looks to underperforming programs or program efficiencies for potential reallocation to fund high priority strategic and operational initiatives. As part of FY 2018 budget development the pool and supplemental instruction were discontinued due to underutilization of the program and analysis of cost to run the program. In addition the college bookstore staffing structure was better aligned to meet current demands, eliminating several positions with staff retirements, and dining services were outsourced to ensure a more fiscally sustainable model.
Reallocations Reallocations of existing budgets played a key role in fund solutions for the FY 2018 budget. Vacant positions and base budget funds realized through process efficiencies were identified and reallocated to fund high priority strategic and operational budget requests.
FY 2018 PROJECT REQUESTS
Project # Project Name Cost Center Reallocation
41 Total Team 1 New Student Orientation Strategic Plan Budget
139 Total Team 18 Tableau Strategic Plan Budget
141 Total Team 3 Assistant Dean of LA Strategic Plan Budget
173 Total Team 11 - 5 Academic Advisors Strategic Plan Budget
Grand Total Strategic Initiatives 555,853
150 Total BOT Professional Development Board of Trustees
151 Total Diligent Portal Application Board of Trustees
128 Total Coordinator for Inclusive Experience IDEAL
117 Total Staff Hourly Virtual Writing Center budget English
36 Total Instructional Specialist - Mech/EET Engineering
35 Total Mechatronics equipment maintenance Mechatronics
33 Total LSI deficit base funding Legal Studies Inst.
169 Total Program Pathways specialist Office of Instructional Partnerships
172 Total AVP, LSS VP LSS
7 Total Windows 10 Info Svcs.
91 Total Wireless software - Clearpass Info Svcs.
93 Total Multi-factor authentication Info Svcs.
123 Total CMS annual support and subscription Info Svcs.
136 Total USA Funds contract Dean - Enrollment Services
75 Total SAFE program Assistant Dean: SSS
140 Total Emergency Management Commander Public Safety
40 Total Upgrade Archibus and Autocad software Director Facilities P&C
Total Operational Requests 539,435
Total FY 2018 Funded Budget Requests 1,095,288

58
Cost Containment ReportingEvery year, departments are asked to examine their activities to identify and report cost efficiencies achieved during the prior fiscal year. Cost containment efforts are included in the Performance Accountability Report (PAR) submitted to MHEC every year. Below is the cost containment report submitted for FY 2017.
Cost Containment Cost containment efforts are pervasive throughout Anne Arundel Community College. During the budget process, cost center managers identify and report cost containment efforts for the prior year using a form provided in the "Guide for Budgeting for Institutional Effectiveness." The college continually reviews current operations to identify areas where costs can be reduced and administrative processes can be made more efficient.
COST CONTAINMENT
Cost Savings
Negotiated Contract Savings $1,082,726
Utility Consortium Electric Rate Savings 170,000
Bookstore Reorganization 116,972
Purchase of Refurbished Equipment 65,324
Use of In-house Labor instead of Outside Contractors 56,600
Reduce Virtual Campus Workshops and Peer Mentoring 56,365
Reduction in Costs due to Equipment Upgrades 8,193
Trade in Savings 1,100
Cost Savings Total $1,557,280
COST AVOIDANCE
Redeploy Existing Equipment $28,934
Use of Donated Equipment 4,400
Cost Avoidance Total $33,334
REVENUE ENHANCEMENT
New Grant Funding Sources $453,045
Athletic Team Fundraising 29,000
Administer Test/Certifications for Other Schools 85,000
Electric Demand Reduction Refund 23,709
Electric Car Charging 525
Recycle Rebates 145
Revenue Enhancement Total $591,424
FY 2017 Cost Containment Total $2,182,038
LEANThis project sought to completely reengineer the application to classroom experience and to improve the process from the student value perspective. The goal was to provide students a clear pathway to achieve their goals, streamline required processes and eliminate unnecessary steps. The project began with training in LEAN principles for the project team, as well as directors and managers that oversee the primary operations involved. All current processes were mapped to identify pain points and identify possible efficiencies. The team gathered and analyzed data from the ERP system to substantiate perceived issues experienced by students and to provide a baseline on which to judge process improvements. The team recommended 22 process modifications and improvements, which were forwarded to the Engagement Matters Oversight Team. These recommendations have been deployed to the various departments to implement.

ANNE ARUNDEL COMMUNITY COLLEGE / FY 2018 ANNUAL BUDGET
59
Operating Fund by Functional Area
F Y 2016 F Y 2017 F Y 2018 %CHANG E $CHANG E
Actual Budget Budget FY 17/FY 18 FY 17/FY 18
Revenue
State of Maryland
Cade Funding $28,715,483 $28,800,000 $29,270,400 2% $470,400
Regional Higher Ed. Center Funding 290,088 200,000 200,000 0% -
Total State of Maryland Revenue $29,005,571 $29,000,000 $29,470,400 2% $470,400
Anne Arundel County $38,387,700 $40,387,700 $41,987,700 4% 1,600,000
Anne Arundel Community College
Tuition and Fees $39,069,371 $40,190,000 $38,703,000 -4% $(1,487,000)
Other Income 561,237 556,000 576,400 4% 20,400
Tuition Stabilization Fund Transfer (622,857) 3,181,300 3,203,600 1% 22,300
Auxiliary Fund Transfer 431,653 450,000 250,000 -44% (200,000)
Enterprise Fund Transfer - - - 0% -
Total Anne Arundel Community College $39,439,404 $44,377,300 $42,733,000 -4% $(1,644,300)
Total Revenue $106,832,675 $113,765,000 $114,191,100 0% $426,100
Expenditures by Functional Area
Instruction $58,878,656 $57,343,500 $56,811,800 -1% $(531,700)
Academic Support 15,350,804 17,072,400 17,273,300 1% 200,900
Student Services 9,784,144 10,564,400 11,128,600 5% 564,200
Plant Operations & Maintenance 10,266,407 11,263,700 11,264,100 0% 400
Institutional Support 16,552,664 17,521,000 17,713,300 1% 192,300
Total Expenditures by Functional Area $106,832,675 $113,765,000 $114,191,100 0% $426,100
Operating Fund Net Surplus / (Deficit) $ - $ - $ - 0% $ -
FY2018 Schedule of Budgeted Revenue and Expenditures by Fund

60
Operating Fund by Object Summary, Fiscal Year 2017
F Y 2016 F Y 2017 F Y 2018 %CHANG E $CHANG EActual Budget Budget FY 17/FY 18 FY 17/FY 18
Expenditures by Object SummarySalaries and Benefits $89,063,102 $92,957,540 $93,110,568 0% $153,028 Contracted Services 9,454,070 10,068,905 10,036,480 0% (32,425)Supplies and Materials 2,419,144 2,793,732 2,736,475 -2% (57,257)Communications 1,000,337 1,292,091 1,264,901 -2% (27,190)Other Charges 1,005,867 1,807,002 1,805,882 0% (1,120)Utilities 2,063,027 2,733,416 2,733,416 0% - Insurance 748,294 857,150 855,350 0% (1,800)Furniture and Equipment 1,078,834 1,255,164 1,648,028 31% 392,864 Total Expenditures by Object Summary $106,832,675 $113,765,000 $114,191,100 0% $426,100
Instruction SummarySalaries and Benefits $52,386,389 $54,369,892 $53,688,379 -1% $(681,513)Contracted Services 396,261 701,664 633,600 -10% (68,064)Supplies and Materials 1,280,805 1,650,989 1,590,482 -4% (60,507)Communications 2,228 9,879 5,379 0% (4,500)Other Charges 507,731 587,697 590,581 0% 2,884 Furniture and Equipment 305,242 23,379 303,379 1198% 280,000 Total Instruction $54,878,656 $57,343,500 $56,811,800 -1% $(531,700)
Academic Support SummarySalaries and Benefits $11,741,773 $12,503,973 $12,612,873 1% $108,900 Contracted Services 2,701,695 2,796,721 2,732,421 -2% (64,300)Supplies and Materials 293,703 311,830 313,380 0% 1,550 Other Charges 168,154 487,891 472,491 -3% (15,400)Furniture and Equipment 445,479 971,985 1,142,135 18% 170,150 Total Academic Support $15,350,804 $17,072,400 $17,273,300 1% $200,900
Student Services SummarySalaries and Benefits $8,151,148 $8,726,844 $9,287,544 6% $560,700 Contracted Services 1,102,046 1,063,923 1,067,923 0% 4,000 Supplies and Materials 66,001 111,993 111,493 0% (500)Communications 200,478 175,500 175,500 0% - Other Charges 253,815 473,140 473,140 0% - Furniture and Equipment 10,656 13,000 13,000 0% - Total Student Services $9,784,144 $10,564,400 $11,128,600 5% $564,200
Plant Operations and MaintenanceSalaries and Benefits $4,344,762 $4,685,615 $4,604,727 -2% $(80,888)Contracted Services 2,992,052 3,061,337 3,153,175 3% 91,838 Supplies and Materials 533,798 411,038 412,038 0% 1,000 Communications 13,194 17,000 17,000 0% - Other Charges 13,474 27,451 27,451 0% - Utilities 2,063,027 2,733,416 2,733,416 0% - Insurance 229,946 251,650 249,850 -1% (1,800)Furniture and Equipment 76,154 76,193 66,443 -13% (9,750)Total Plant Operations and Maintenance $10,266,407 $11,263,700 $11,264,100 0% $400
Institutional Support SummarySalaries and Benefits $12,439,030 $12,671,216 $12,917,045 2% $245,829 Contracted Services 2,262,016 2,445,260 2,449,361 0% 4,101 Supplies and Materials 244,837 307,882 309,082 0% 1,200 Communications 784,437 1,089,712 1,067,022 -2% (22,690)Other Charges 62,693 230,823 242,219 5% 11,396 Insurance 518,348 605,500 605,500 0% - Furniture and Equipment 241,303 170,607 123,071 -28% (47,536)Total Institutional Support $16,552,664 $17,521,000 $17,713,300 1% $192,300

ANNE ARUNDEL COMMUNITY COLLEGE / FY 2018 ANNUAL BUDGET
61
Other Funds Summary
F Y 2016 F Y 2017 F Y 2018 %CHANG E $CHANG E
Actual Budget Budget FY 17/FY 18 FY 17/FY 18
Revenue by Fund
Auxiliary
Sales & Services $8,466,079 $9,370,000 $8,777,000 -6% $(593,000)
Transfer (to)/from Tuition Stabilization Fund 61,804 (102,000) (96,000) -6% 6,000
Transfer (to)/from Operating Fund (431,653) (450,000) (250,000) -44% 200,000
Transfer (to)/from Enterprise 4,864 - - 0% -
Total Auxiliary Revenue $8,101,094 $8,818,000 $8,431,000 -4% $(387,000)
Enterprise
Sales & Services $9,128,938 $11,126,500 $11,602,000 4% $475,500
Transfer (to)/from Tuition Stabilization Fund (1,838) 492,000 480,000 -2% (12,000)
Transfer (to)/from Operating Fund - - - 0% -
Transfer (to)/from Auxiliary (4,864) - - 0% -
Total Enterprise Revenue $9,122,236 $11,618,500 $12,082,000 4% $463,500
Restricted Fund Revenues $18,340,529 $24,625,000 $21,515,000 -13% $(3,110,000)
Total Revenue $35,563,859 $45,061,500 $42,028,000 -7% $(3,033,500)
Expenditures by Fund
Auxiliary Sales & Services $8,101,094 $8,818,000 $8,431,000 -4% $(387,000)
Enterprise Sales & Services 9,122,236 11,618,500 12,082,000 4% 463,500
Restricted Fund 18,340,529 24,625,000 21,515,000 -13% (3,110,000)
Total Expenditures by Fund $35,563,859 $45,061,500 $42,028,000 -7% $(3,033,500)
Net Surplus / (Deficit) $ - $ - $ - 0% $ -

62
Auxiliary Fund by Division
F Y 2016 F Y 2017 F Y 2018 % CHANG E $ CHANG E
Actual Budget Budget FY 17/FY 18 FY 17/FY 18
Revenue
Athletics* $323,520 $- $- n/a $-
Child Development Center 455,687 441,500 445,843 1% 4,343
College Bookstore 6,362,578 6,665,284 5,920,564 -11% (744,720)
Facilities Use (Events) 193,130 204,673 212,550 4% 7,877
Food/Dining Services 1,120,437 1,045,201 192,417 -82% (852,784)
Other 10,727 6,200 6,200 0% -
County Appropriation Authority Adjustment - 1,007,142 1,999,426 99% 992,284
Total Revenue $8,466,079 $9,370,000 $8,777,000 -6% $(593,000)
Expenditures
Athletics* $389,276 $- $- n/a $-
Child Development Center 428,951 395,000 444,745 13% 49,745
College Bookstore 6,188,570 6,400,302 5,847,109 -9% (553,193)
Facilities Use (Events) 90,240 94,641 90,241 -5% (4,400)
Food/Dining Services 994,907 919,595 43,779 -95% (875,816)
Other 9,150 5,500 5,500 0% -
County Appropriation Authority Adjustment - 1,002,962 1,999,626 99% 996,664
Total Expenditures $8,101,094 $8,818,000 $8,431,000 -4% $(387,000)
Auxiliary Fund Net Surplus / (Deficit)
Athletics* $(65,756) $- $-
Child Development Center 26,736 46,500 1,098
College Bookstore 174,008 264,982 73,455
Facilities Use (Events) 102,890 110,032 122,309
Food/Dining Services 125,530 125,606 148,638
Miscellaneous 1,577 700 700
County Appropriation Authority Adjustment - 4,180 (200)
Total Net Surplus / Deficit) $364,985 $552,000 $346,000 -37% $(206,000)
* Effective with the FY 2017 budget athletic team expenses have been reclassified to the operating fund under student services as these activities do not meet the criteria of an auxiliary fund that is essentially self-supporting. Athletic fundraising activity has also been reclassified to the restricted fund as restricted gifts.
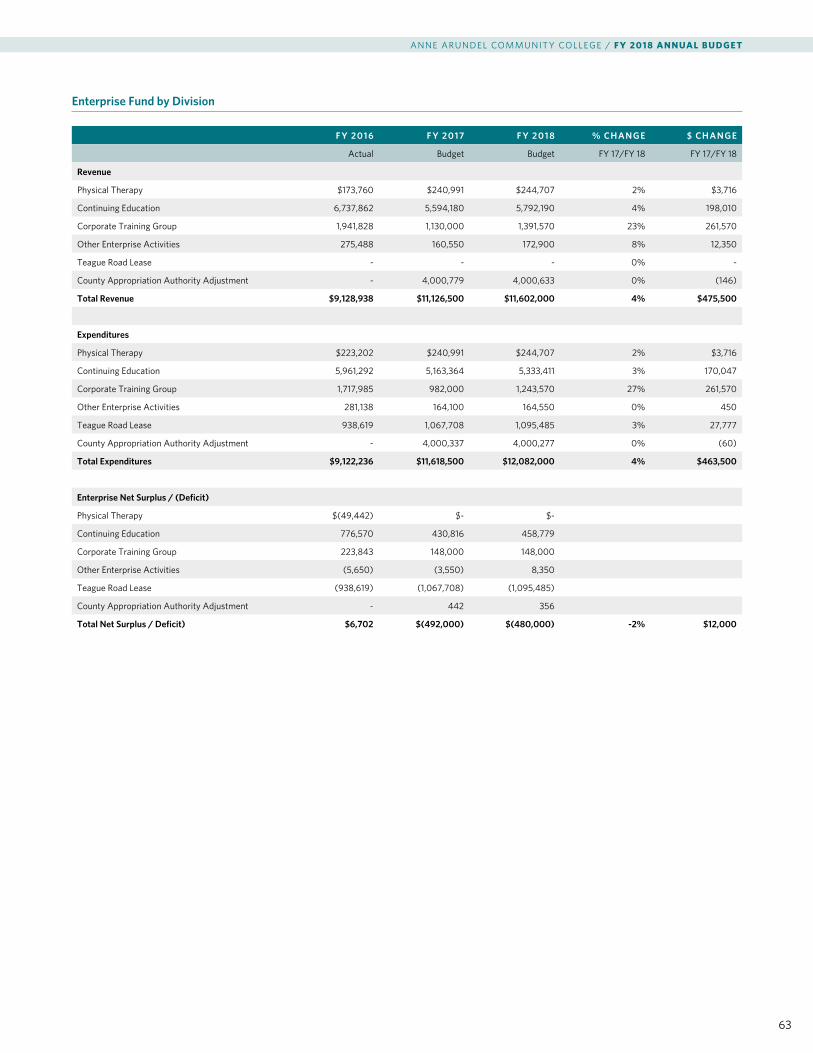
ANNE ARUNDEL COMMUNITY COLLEGE / FY 2018 ANNUAL BUDGET
63
F Y 2016 F Y 2017 F Y 2018 % CHANG E $ CHANG E
Actual Budget Budget FY 17/FY 18 FY 17/FY 18
Revenue
Physical Therapy $173,760 $240,991 $244,707 2% $3,716
Continuing Education 6,737,862 5,594,180 5,792,190 4% 198,010
Corporate Training Group 1,941,828 1,130,000 1,391,570 23% 261,570
Other Enterprise Activities 275,488 160,550 172,900 8% 12,350
Teague Road Lease - - - 0% -
County Appropriation Authority Adjustment - 4,000,779 4,000,633 0% (146)
Total Revenue $9,128,938 $11,126,500 $11,602,000 4% $475,500
Expenditures
Physical Therapy $223,202 $240,991 $244,707 2% $3,716
Continuing Education 5,961,292 5,163,364 5,333,411 3% 170,047
Corporate Training Group 1,717,985 982,000 1,243,570 27% 261,570
Other Enterprise Activities 281,138 164,100 164,550 0% 450
Teague Road Lease 938,619 1,067,708 1,095,485 3% 27,777
County Appropriation Authority Adjustment - 4,000,337 4,000,277 0% (60)
Total Expenditures $9,122,236 $11,618,500 $12,082,000 4% $463,500
Enterprise Net Surplus / (Deficit)
Physical Therapy $(49,442) $- $-
Continuing Education 776,570 430,816 458,779
Corporate Training Group 223,843 148,000 148,000
Other Enterprise Activities (5,650) (3,550) 8,350
Teague Road Lease (938,619) (1,067,708) (1,095,485)
County Appropriation Authority Adjustment - 442 356
Total Net Surplus / Deficit) $6,702 $(492,000) $(480,000) -2% $12,000
Enterprise Fund by Division

64
F Y 2016 F Y 2017 F Y 2018 % CHANG E $ CHANG E
Actual Budget Budget FY 17/FY 18 FY 17/FY 18
Revenue
Federal $2,632,300 $1,600,000 $1,300,000 -19% $(300,000)
State 1,320,366 1,515,000 1,400,000 -8% (115,000)
Other 186,108 95,000 200,000 111% 105,000
Scholarships 1,718,856 2,115,000 1,800,000 -15% (315,000)
Restricted Gifts 215,442 300,000 315,000 5% 15,000
Financial Aid 12,267,457 15,000,000 12,500,000 -17% (2,500,000)
County Appropriation Authority Adjustment - 4,000,000 4,000,000 0% -
Total Revenue $18,340,529 $24,625,000 $21,515,000 -13% $(3,110,000)
Expenditures
Federal $2,632,300 $1,600,000 $1,300,000 -19% $(300,000)
State 1,320,366 1,515,000 1,400,000 -8% (115,000)
Other 186,108 95,000 200,000 111% 105,000
Scholarships 1,718,856 2,115,000 1,800,000 -15% (315,000)
Restricted Gifts 215,442 300,000 315,000 5% 15,000
Financial Aid 12,267,457 15,000,000 12,500,000 -17% (2,500,000)
County Appropriation Authority Adjustment - 4,000,000 4,000,000 0% -
Total Expenditures $18,340,529 $24,625,000 $21,515,000 -13% $(3,110,000)
Restricted Fund Net Surplus / (Deficit)
Federal $- $- $-
State - - -
Other - - -
Scholarships - - -
Restricted Gifts - - -
Financial Aid - - -
County Appropriation Authority Adjustment - - -
Total Net Surplus / Deficit) $- $- $- 0% $-
Restricted Fund by Division

ANNE ARUNDEL COMMUNITY COLLEGE / FY 2018 ANNUAL BUDGET
65
OPE R ATINGFU N D
AUXILIARY FU N D
E NTE RPRISE FU N D
RESTRIC TE D FU N D
C APITALFU N D
TOTAL F Y 2018B U DG E T
Revenue
State of Maryland $29,470,400 $- $- $- $6,520,000 $35,990,400
Anne Arundel County 41,987,700 - - - 8,345,000 50,332,700
Anne Arundel Community College 39,529,400 8,777,000 11,602,000 - - 59,908,400
Tuition Stabilization Fund 3,203,600 (346,000) 480,000 - - 3,337,600
Restricted Grants / Gifts - - - 21,515,000 - 21,515,000
Total Revenue $114,191,100 $8,431,000 $12,082,000 $21,515,000 $14,865,000 $171,084,100
Expenditures
Instruction $56,811,800 $3,500 $10,864,715 $3,286,084 $- $70,966,099
Academic Support 17,273,300 2,000 - 78,080 - 17,353,380
Student Services 11,128,600 444,745 121,800 18,091,045 - 29,786,190
Plant Operations & Maintenance 11,264,100 - 991,158 47,308 14,865,000 27,167,566
Institutional Support 17,713,300 7,980,755 104,327 12,483 - 25,810,865
Total Expenditures $114,191,100 $8,431,000 $12,082,000 $21,515,000 $14,865,000 $171,084,100
Net Surplus / (Deficit) $- $- $- $- $- $-
GASB 45/Tuition Stabilization Fund
F Y 2016 F Y 2017 F Y 2018 % CHANG E $ CHANG E
Actual Budget Budget FY 18/FY 17 FY 18/FY 17
GASB 45
Beginning Liability $33,792,000 $32,826,000 $35,605,576 8% $2,779,576
GASB 45 Expense $5,269,000 $4,123,000 $4,853,000 18% $730,000
Retiree Paygo (1,385,000) (1,491,795) (1,597,660) 7% (105,865)
OPEB Trust Transfer (4,850,000) (625,000) (2,035,000) 226% (1,410,000)
Net Liability Increase (Decrease) $(966,000) $2,006,205 $1,220,340 -39% $(785,865)
Ending Liability $32,826,000 $34,832,205 $36,825,916 6% $1,993,711
Tuition Stabilization Fund
Beginning Balance $16,318,773 $12,064,025 $10,715,148 -11% $(1,348,877)
Operating Net Surplus / (Deficit) 622,857 (3,181,300) (3,203,600) 1% (22,300)
Auxiliary / Enterprise Net Surplus / (Deficit) (59,969) (390,000) (384,000) -2% 6,000
Audited Financial Statement Rec. Item 41,702 - - 0% -
Capital Budget Usage (9,338) (500,105) - -100% 500,105
OPEB Trust Transfer (4,850,000) (625,000) (2,035,000) 226% (1,410,000)
Ending Balance $12,064,025 $7,367,620 $5,092,548 -31% $(2,275,072)
Summary All Funds

66
FY 2018 Capital Budget Request
N UM B E R PROJ EC T N UM B E R PRIOR F Y 2018 F Y 2019 F Y 2020 F Y 2021 F Y 2022 F Y 202 3 TOTAL
NEW CONSTRUCTION PROJECTS
1 Health Sciences and Biology Building J5697 - 13,040,000 45,474,000 45,474,000 12,964,000 - - 116,952,000
2 Relocate Modular Building J5644 1,746,000 - - - - - - -
Subtotal 1,746,000 13,040,000 45,474,000 45,474,000 12,964,000 - - 116,952,000
RENOVATION PROJECTS
Subtotal - - - - - - - -
REPAIRS, REPLACEMENTS & IMPROVEMENTS
3 Campus Improvements J4412 10,165,000 825,000 825,000 825,000 700,000 700,000 700,000 4,575,000
4 Building Controls/CADE J5645 275,000 - - - - - - -
5 Walkways, Roads and Parking Lots J5408 5,250,000 - - - - - - -
6 Systemics J5407 7,585,000 1,000,000 - - - - - 1,000,000
7 Information Technology Enhancement J5510 3,000,000 - - - - - - -
Subtotal 26,275,000 1,825,000 825,000 700,000 700,000 700,000 700,000 5,575,000
County Executive Approved AACC CAPITAL BUDGET 28,021,000 14,865,000 46,299,000 46,174,000 13,664,000 700,000 700,000 122,527,000

ANNE ARUNDEL COMMUNITY COLLEGE / FY 2018 ANNUAL BUDGET
67
Capital Budget Program – Health Sciences and Biology Building
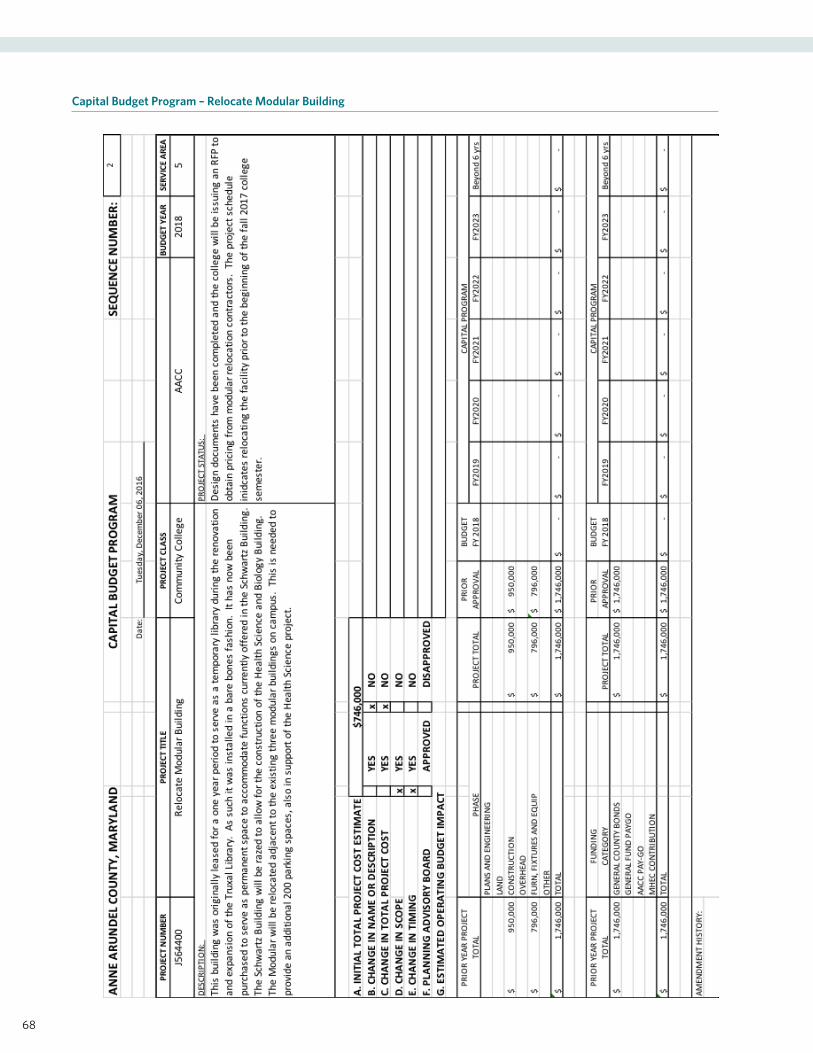
68
Capital Budget Program – Relocate Modular Building
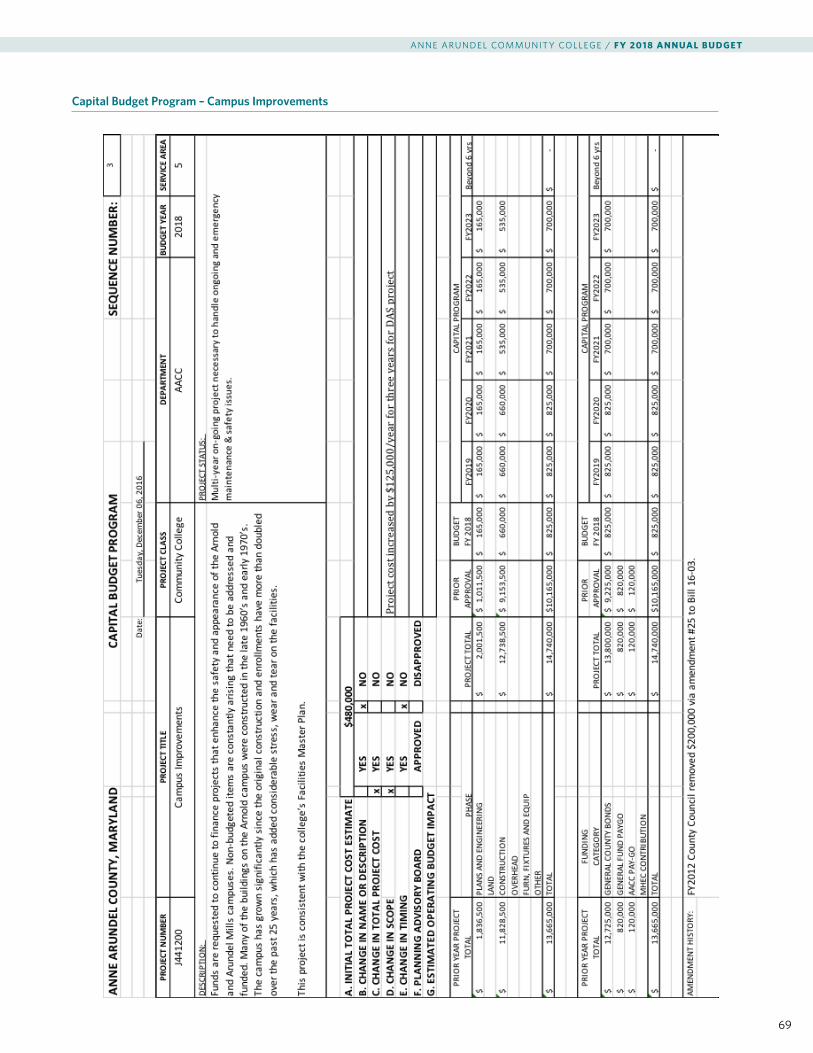
ANNE ARUNDEL COMMUNITY COLLEGE / FY 2018 ANNUAL BUDGET
69
Capital Budget Program – Campus Improvements

70
Capital Budget Program – Building Controls / CADE

ANNE ARUNDEL COMMUNITY COLLEGE / FY 2018 ANNUAL BUDGET
71
Capital Budget Program – Walkways, Roads and Parking Lots

72
Capital Budget Program – Systemics
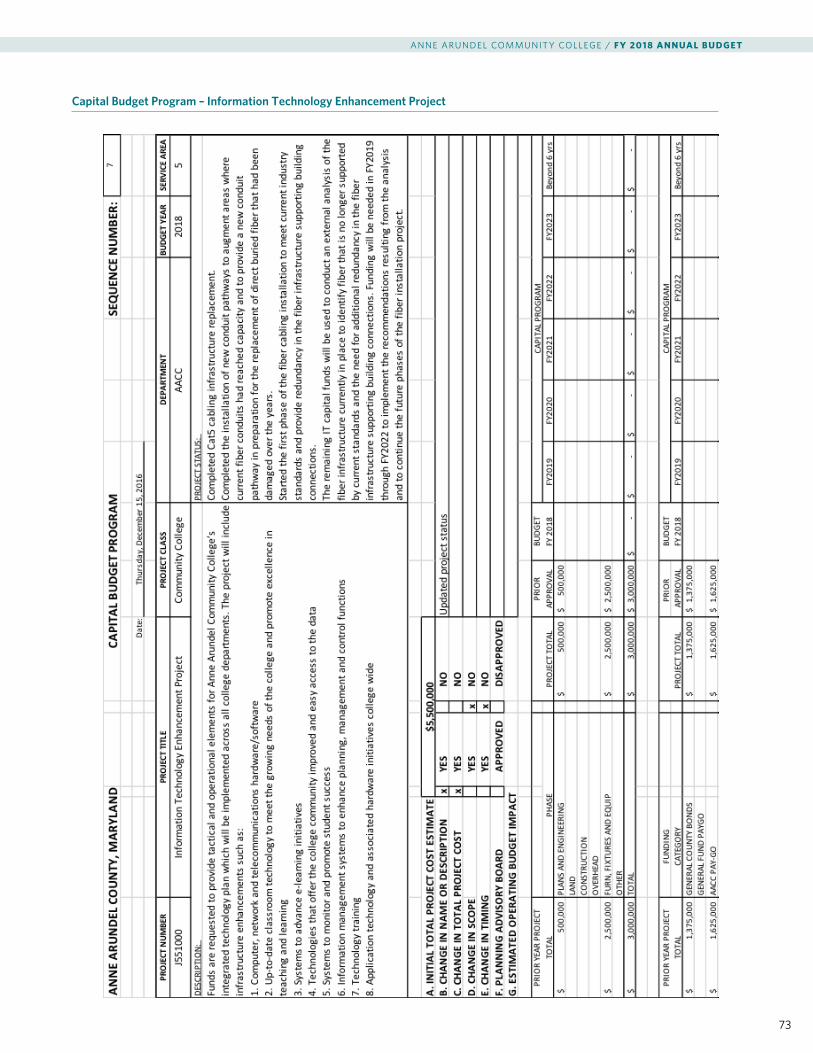
ANNE ARUNDEL COMMUNITY COLLEGE / FY 2018 ANNUAL BUDGET
73
Capital Budget Program – Information Technology Enhancement Project
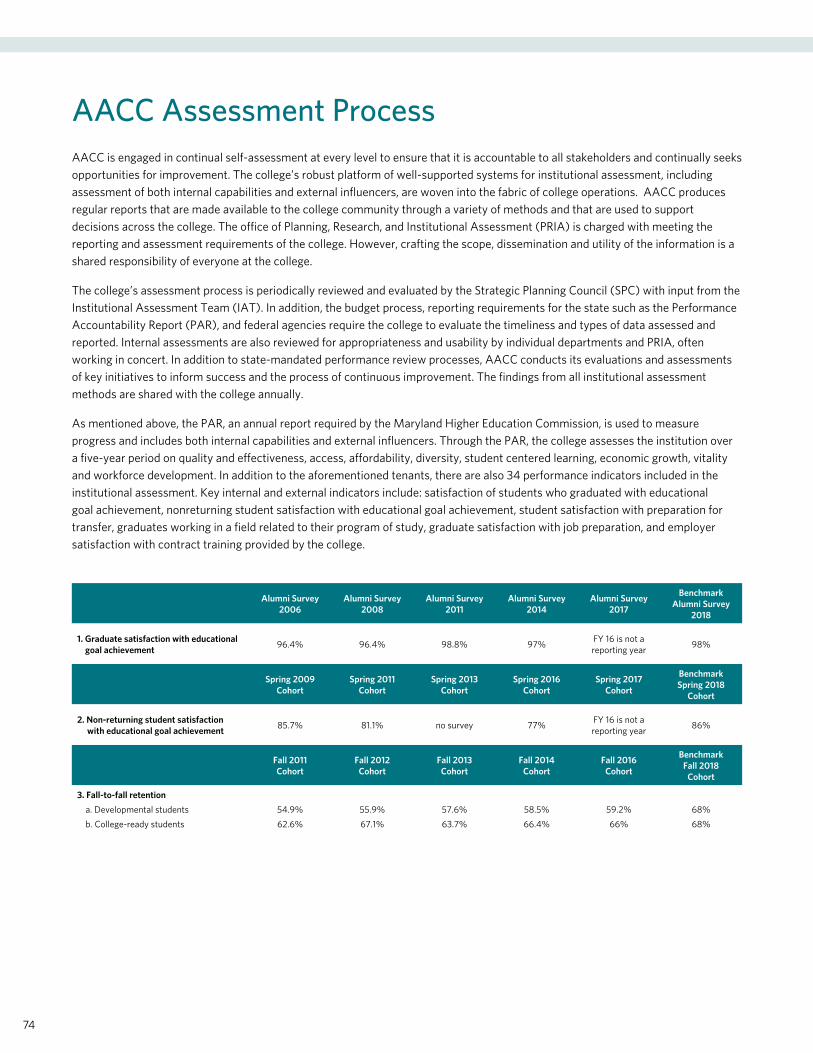
74
AACC Assessment Process AACC is engaged in continual self-assessment at every level to ensure that it is accountable to all stakeholders and continually seeks opportunities for improvement. The college’s robust platform of well-supported systems for institutional assessment, including assessment of both internal capabilities and external influencers, are woven into the fabric of college operations. AACC produces regular reports that are made available to the college community through a variety of methods and that are used to support decisions across the college. The office of Planning, Research, and Institutional Assessment (PRIA) is charged with meeting the reporting and assessment requirements of the college. However, crafting the scope, dissemination and utility of the information is a shared responsibility of everyone at the college.
The college’s assessment process is periodically reviewed and evaluated by the Strategic Planning Council (SPC) with input from the Institutional Assessment Team (IAT). In addition, the budget process, reporting requirements for the state such as the Performance Accountability Report (PAR), and federal agencies require the college to evaluate the timeliness and types of data assessed and reported. Internal assessments are also reviewed for appropriateness and usability by individual departments and PRIA, often working in concert. In addition to state-mandated performance review processes, AACC conducts its evaluations and assessments of key initiatives to inform success and the process of continuous improvement. The findings from all institutional assessment methods are shared with the college annually.
As mentioned above, the PAR, an annual report required by the Maryland Higher Education Commission, is used to measure progress and includes both internal capabilities and external influencers. Through the PAR, the college assesses the institution over a five-year period on quality and effectiveness, access, affordability, diversity, student centered learning, economic growth, vitality and workforce development. In addition to the aforementioned tenants, there are also 34 performance indicators included in the institutional assessment. Key internal and external indicators include: satisfaction of students who graduated with educational goal achievement, nonreturning student satisfaction with educational goal achievement, student satisfaction with preparation for transfer, graduates working in a field related to their program of study, graduate satisfaction with job preparation, and employer satisfaction with contract training provided by the college.
Alumni Survey 2006
Alumni Survey 2008
Alumni Survey 2011
Alumni Survey 2014
Alumni Survey 2017
Benchmark Alumni Survey
2018
1. Graduate satisfaction with educational goal achievement 96.4% 96.4% 98.8% 97% FY 16 is not a
reporting year 98%
Spring 2009 Cohort
Spring 2011 Cohort
Spring 2013 Cohort
Spring 2016 Cohort
Spring 2017 Cohort
Benchmark Spring 2018
Cohort
2. Non-returning student satisfaction with educational goal achievement 85.7% 81.1% no survey 77% FY 16 is not a
reporting year 86%
Fall 2011 Cohort
Fall 2012 Cohort
Fall 2013 Cohort
Fall 2014 Cohort
Fall 2016 Cohort
Benchmark Fall 2018
Cohort
3. Fall-to-fall retention a. Developmental students b. College-ready students
54.9% 62.6%
55.9% 67.1%
57.6% 63.7%
58.5% 66.4%
59.2% 66%
68% 68%

ANNE ARUNDEL COMMUNITY COLLEGE / FY 2018 ANNUAL BUDGET
75
Fund DefinitionsThe college’s fund structure is the method used to budget the college’s activity by its source in order to ensure it is properly spent and accounted for. The college’s fund structure is based largely on concepts and principles contained in Governmental Accounting and Financial Reporting. Fund accounting principles used in higher education require that income be reported based on funding source and expenditures based on function or use.
Operating (Fund 10) The current operating budget accounts are unrestricted funds that are expended to perform the primary objectives of the college as designated and approved by the college's board of trustees. The current operating budget is funded by contributions from the county and state and from revenues generated by tuition and fees and the tuition stabilization fund.
Auxiliaries (Fund 11) Activities related to the furnishing of goods or services to students, faculty, staff, or incidentally to the general public, and charges a fee directly related to, although not necessarily equal to, the cost of goods or services. (Bookstore, Dining Services, events and child care center).
Auxiliary Enterprise (Fund 12) Activities of the college that are managed essentially as, and intended to be, self supporting; meet the geographic and public service needs of the region; whose customers are NOT primarily students, faculty or staff and; are generally related to the college's mission of teaching and learning.
Designated Funds (Fund 14) Internally designated funds collected from students, faculty, staff, or incidentally from the general public, for a specified purpose which may or may not be fulfilled within the fiscal year. This fund is not part of the budget appropriation approved by the Anne Arundel County Council.
Operating Enterprise (Fund 15) Activities of the college that are managed essentially as, and intended to be, self-supporting; whose customers ARE primarily students and; are generally related to the college's mission of teaching and learning.
Grant Funds: (Funds 20-22) Grant accounts are set up each time the college receives funds for a gift or restricted purpose based on a proposal submitted to an organization.
Scholarships / Financial Aid (Funds 23-25) Funds restricted to provide financial support for students.
Agency Funds: (Funds 40-43) Agency accounts are those held by the college as custodian or fiscal agent for the Student Government Association and other miscellaneous agencies. These funds are not part of the budget appropriation approved by the Anne Arundel County Council.
Plant Funds: (Funds 60-61) Funds received by the college from the county and state for building construction and major repairs and maintenance of infrastructure.
Retiree Health Benefits Trust Fund This fiduciary fund accounts for the activity of the “other post-employee benefits” (OPEB). College contributions to the OPEB liability are housed in this trust.
Functional Expense DefinitionsInstruction (Function 1) This functional area includes expense for all activities that are part of an institution’s instruction program, teaching and learning.
Academic Support (Function 4) This functional area of expenditures includes support services for the institution’s primary mission of instruction.
Student Services (Function 5) This functional area includes expenses for offices of admissions and the registrar, and activities with the primary purpose of contributing to students’ emotional and physical well-being and intellectual, cultural and social development outside the context of a formal instruction program.
Operation and Maintenance of Plant (Function 6) This functional area includes all expenses for the administration, supervision, operation, maintenance, preservation and protection of the institution’s physical plant.
Institutional Support (Function 7) This functional area includes expense for central executive-level activities concerned with management and long-range planning for the entire institution, such as the governing board, planning and programming operations, legal services, fiscal operations, community and alumni relations.

76
Glossary of TermsAccount: A 15 digit number that records the balance of receipts and disbursements.
Accrual Basis of Accounting: The basis of accounting in which transactions are recognized in the fiscal year when they occur, regardless of when cash is received or disbursed. Revenue is recognized in the fiscal year when earned, and expenditures are recognized in the fiscal year when goods/services are received.
Achieving the Dream (AtD): A national initiative of more than 160 participating community colleges committed to improving the success of students. Key areas of emphasis include success of developmental students, success of all students in college-level courses, persistence/retention of students and completion.
Allocation: A distribution of funds, or an expenditure limit established for an organizational unit or function.
Appropriation: The amount of spending for a program legally authorized by the county council. Operating budget appropriations are made for one fiscal year and any unobligated funds lapse.
Authorized Positions: The number of full-time equivalent employees authorized in the budget. The number of authorized positions includes vacant positions
Auxiliary Fund: Activities of the college that are managed essentially as, and are intended to be, self-supporting; meet the geographic and public service needs of the region; whose customers are NOT primarily students, faculty or staff; and are generally related to the college's mission of teaching and learning.
Balanced Budget: A budget in which revenues are equal to expenditures, thus neither a budget surplus or deficit exists.
Budget: A plan of operation for a specific period of time expressed in financial terms. A budget expresses the operating plan in terms of the costs of activities to be undertaken to achieve specific goals and objectives. A traditional budget expresses the plan in terms of the costs of the goods or services to be used to perform specific functions.
Budget Calendar: The schedule of key dates or milestones the college follows in preparation and adoption of the budget.
Budget Year: The fiscal year beginning July 1 and ending June 30
Cade Funding Formula: It is the state of Maryland’s method for calculating the primary amount of state funding for community colleges. The base amount for calculation the Cade funding formula is the prior year’s final appropriation level for most University System of Maryland institutions.
Capital Budget: A plan of proposed capital expenditures and the means of financing them. The capital budget is enacted as part of the adopted budget approved by the county council.
Capital Expenditure: Expenditure for the acquisition or construction of buildings or other fixed assets, or for other tangible assets with a useful life of at least 15 years.
Contractual Positions: The number of full time equivalent employees working under employment contracts. The college uses contractual employees for tasks of limited duration.
Current Year: A term designating the operations of the present fiscal period, as opposed to the past or future periods (i.e., the time period we are in now).
Debt Service: Funds for the retirement of bonds and notes covering payments of principal and interest.
Encumbrance: An obligation placed on an appropriation to pay for goods or services which have been ordered by means of contracts, salary commitments, etc., but not yet received.
EPMT: Enrollment Planning Management Team. College committee responsible for monitoring and strategic management of enrollment.
Expenditure: Generally, this term designates the amount of an appropriation used for goods and services whether paid or unpaid, including expenses, provisions for debt retirement not reported as a liability of the fund from which retired, and capital outlays where the accounts are kept on an accrual basis or a modified accrual basis.
Facilities Master Plan: Required to be prepared every five years, this capital facilities plan includes an inventory of existing facilities and a forecast of future needs, proposed locations, and capacities for new or expanded facilities.
Fiscal Year (FY ): A 12-month accounting period that varies from the calendar year and the federal fiscal year. For the college, the fiscal year runs from July 1 through the following June 30. It is the period during which obligations are incurred, encumbrances are made and appropriations are expended.

ANNE ARUNDEL COMMUNITY COLLEGE / FY 2018 ANNUAL BUDGET
77
Full Time Equivalent (FTE): A method of calculating employment, workloads student enrollments. For example, one student FTE is calculated based on 30 credit hours. Faculty FTE is based on teaching a 30 credit load and staff FTE is based on the share of a full 2,080–hour year.
Functional Expense: A grouping of similar expenditure items by activity that forms the basis of appropriations and records of expenditures. The county council approves the college’s budget by functional area.
Fund: A legal entity that provides for the segregation of money or other resources of the college for specific activities or obligations in accordance with specific restrictions or limitations. A separate set of accounts must be maintained for each fund to show its assets, liabilities, reserves and fund balance, as well as its income and expenditures. The assets of a fund may also be placed into separate accounts to provide for limitations on specified fund income or expenditures.
Fund Balance: Excess of the assets of a fund over its liabilities.
Generally Accepted Accounting Principles (GAAP): The accounting principles, rules, conventions and procedures that are used for accounting and financial reporting. GAAP for governments are set by the Governmental Accounting Standards Board (GASB), the accounting and financial reporting standards setting body for state and local governments.
Grants: Funds disbursed by federal, state or private agencies to the college for specific purposes.
Key Performance Indicators: Performance measures to show progress toward the accomplishment of objectives. Measures describe effectiveness, efficiencies and output of programs.
Maintenance of Effort Requirement: In order to be eligible for any new state funding, the county must maintain the prior level of funding to the college.
Maryland Higher Education Commission (MHEC): Maryland’s higher education coordinating board responsible for establishing statewide policies for Maryland public and private colleges and universities and for-profit career schools. MHEC also administers state financial aid programs that affect students on a statewide basis.
Memorandum of Understanding: A nonlegally binding document, a MOU is the same as a letter of intent.
Object Class: A grouping of similar expenditure items that form the basis of appropriations and records of expenditures.
Operating Budget: A plan for the yearly distribution of college resources for the ongoing unrestricted activities of the college. Funding for the operating budget consists principally of tuition and fees, and state and county appropriations.
Plant Funds: Funds received by the college from the county and state for building construction and major repairs and maintenance of infrastructure.
Projections: Estimates of outlays or receipts compared to budget. Projections are generally intended to indicate the budgetary implications of continuing or proposing programs or policies.
Regional Higher Education Center (RHEC): A location through consortium partnerships which provides undergraduate, graduate and professional certification course.
Restricted Fund: Funds that may be used by the college only for restricted purposes. These consist principally of grants and donations.
Strategic Planning: Is a process that defines the college's direction and basis for making decisions on the allocation of resources.
Turnover Expectancy: An amount calculated to determine the savings projected to occur due to personnel vacancies.
VLT Funds: Provides for 1.5 percent of the proceeds from Video Lottery Terminals (slots) to be distributed in targeted areas surrounding Maryland casinos.

78