annex h - continuity of government - city of pleasanton
TRANSCRIPT

APPLIED AND ENVIRONMENTAL MICROBIOLOGY,0099-2240/00/$04.0010
Aug. 2000, p. 3574–3585 Vol. 66, No. 8
Copyright © 2000, American Society for Microbiology. All Rights Reserved.
Spatial and Temporal Variations in Chitinolytic Gene Expression andBacterial Biomass Production during Chitin Degradation
ACE M. BATY III,1,2 CALLIE C. EASTBURN,1,2 SOMKIET TECHKARNJANARUK,2
AMANDA E. GOODMAN,3 AND GILL G. GEESEY1,2*
Department of Microbiology,1 and Center for Biofilm Engineering,2 Montana State University,Bozeman, Montana 59717, and School of Biological Sciences, The Flinders
University of South Australia, Adelaide, South Australia 5001, Australia3
Received 30 December 1999/Accepted 4 May 2000
Growth of the chitin-degrading marine bacterium S91 on solid surfaces under oligotrophic conditions wasaccompanied by the displacement of a large fraction of the surface-derived bacterial production into the flow-ing bulk aqueous phase, irrespective of the value of the surface as a nutrient source. Over a 200-h period ofsurface colonization, 97 and 75% of the bacterial biomass generated on biodegradable chitin and a nonnutri-tional silicon surface, respectively, detached to become part of the free-living population in the bulk aqueousphase. Specific surface-associated growth rates that included the cells that subsequently detached from thesubstrata varied depending on the nutritional value of the substratum and during the period of surface col-onization. Specific growth rates of 3.79 and 2.83 day21 were obtained when cells first began to proliferate ona pure chitin film and a silicon surface, respectively. Later, when cell densities on the surface and detachedcells as CFU in the bulk aqueous phase achieved a quasi-steady state, specific growth rates decreased to 1.08and 0.79 day21 on the chitin and silicon surfaces, respectively. Virtually all of the cells that detached fromeither the chitin or the silicon surfaces and the majority of cells associated with the chitin surface over the200-h period of surface colonization displayed no detectable expression of the chitin-degrading genes chiA andchiB. Cells displaying high levels of chiA-chiB expression were detected only on the chitin surface and then onlyclustered in discrete areas of the surface. Surface-associated, differential gene expression and displacement ofbacterial production from surfaces represent adaptations at the population level that promote efficient utili-zation of limited resources and dispersal of progeny to maximize access to new sources of energy and main-tenance of the population.
In the marine environment, hydrolysis of particulate organicmatter (POM) to low-molecular-weight dissolved organic mat-ter (DOM) is mediated primarily by ectohydrolytic enzymesproduced by particle-associated bacteria (25). While some ofthe DOM derived from POM hydrolysis is respired as CO2, aportion is used for new bacterial production (BP) (53). It hasalso been hypothesized that a significant portion of the DOMderived from enzymatic attack of POM by POM-associatedbacteria supports maintenance and reproduction of free-livingbacteria in the pelagic marine environment (3, 9). In fact,POM-associated bacteria are thought to provide more DOMfor production of the free-living bacterial populations than forproduction of POM-associated populations (4, 20, 45, 51).However, detachment of POM-derived cells could lead tooverestimation of dissolved organic carbon-derived, free-livingBP. Jacobsen and Azam (23) reported that bacteria associatedwith copepod fecal pellets were displaced into the surroundingwater during fecal pellet degradation. While these researchersrecognized the potential importance of detachment as a pro-cess that contributes to free-living BP, the magnitude of thisprocess is currently unknown for the pelagic marine environ-ment.
In the pelagic marine environment, bacterial degradation ofdetrital POM is carried out under conditions of constant flowas the detrital POM sinks through the water column (1). TheDOM generated by ectoenzymatic attack of POM that is dis-
placed into the surrounding seawater is quickly diluted as aresult of particle sinking. Thus, free-living bacteria in the bulkseawater are likely to encounter this DOM at much lowerconcentrations than are cells that remain associated with thePOM surface. The extent to which this influences bacterialgrowth and production in these different compartments of thewater column is not clearly understood.
In order to gain a better understanding of the relative im-portance of free-living and particle-associated populations tototal BP and how particle-associated BP changes during POMdegradation, it is necessary to determine the extent of bacterialdetachment from POM during the degradation process. Bac-terial cells produced on POM that subsequently detach andbecome part of the free-living population must be distin-guished from BP contributed by the free-living bacterial pop-ulation growing on the POM-derived DOM displaced into thebulk aqueous phase.
In this investigation, solid chitin, an important form of POMin the pelagic marine environment (18), was used as the pri-mary source of carbon, nitrogen, and energy in a systemdesigned to study particle-associated BP. Chitin is a high-molecular-weight biopolymer of b-1,4-linked N-acetyl-D-glu-cosamine and is utilized by organisms that produce extracellu-lar chitinase enzymes. Bacteria are the principal mediators ofchitin degradation (18), and since chitin is an insolublebiopolymer, the bacterial populations that contribute to thedissolution of this material are primarily surface associated.The chitin-degrading marine bacterium Pseudoalteromonasstrain S91 was employed in this study to determine surface-associated BP from chitin degradation. In order to determinewhich cells were involved in chitin degradation, a strain of S91
* Corresponding author. Mailing address: Center for Biofilm Engi-neering, 366 EPS Building, Montana State University, Bozeman, MT59717. Phone: (406) 994-3820. Fax: (406) 994-1855. E-mail: [email protected].
3574
on April 3, 2019 by guest
http://aem.asm
.org/D
ownloaded from

that produces green fluorescent protein (GFP) when chitin-degrading genes are expressed was used (6). This approachpermitted the determination of POM-associated BP and thefate of the surface-associated bacterial population during thedegradation of chitin. It also permitted the establishment ofthe relationship between BP and chitinase gene expressionwithin the surface-associated cell population.
MATERIALS AND METHODS
Bacterial strains and media. The study employed Pseudoalteromonas sp. strainS91, which was constructed to report the expression of chitinase genes throughfluorescence from GFP during the degradation of solid chitin. Strain S91 wasderived from the wild-type strain S9, described previously (22). Strain S91 con-tained the pDSK519 plasmid carrying a complete chitinase gene (chiA) and atruncated chitin binding gene (chiB) interrupted by the insertion of a functionalcopy of the GFP gene (gfp) (26). In this configuration, the gfp gene is under thecontrol of both the chiA and chiB promoters. A set of fully functional chiA-chiBgenes resides on the chromosome (47, 48, 49). The plasmid confers kanamycinresistance on strain S91, which is otherwise resistant to streptomycin.
Bacterial cultivation. Cultures of S91 were prepared as described previously(6). Cells were cultured in defined seawater solution containing N-acetyl-b-D-glucosamine (GlcNAc) as the sole carbon, nitrogen, and energy source whenup-expression of genes involved in chitin degradation was desired (6). Starved-cell suspensions were prepared from glutamate-grown cultures (6). CFU weremonitored daily during the 400-h starvation period by plate counts on MB2216agar (Difco, Detroit, Mich.) after incubation of plates for 24 h at 20°C.
Substratum preparation. Thin films of pure chitin served as the only addedsources of carbon, nitrogen, and energy during chitin degradation. Silicon cou-pons, 1 by 1 cm square and 1.5 mm thick (Harrick Scientific, Ossining, N.Y.),were used as nonnutritional controls. The methods used in the preparation ofpure chitin thin films were adapted from previously published methods forspin-casting chitin films from chitosan solutions (5, 6, 38, 40). Details of prepa-ration and characteristics of the chitin thin films used in this study are describedelsewhere (6). The pen from a Loligo species of squid was used as a substratumin studies to compare the behavior of bacterial cells on chitin thin films with thebehavior of cells on a natural form of chitin. Squid pen chitin consists of ap-proximately 40% chitin and 60% protein (19). Squid pens were dissected andstored at 240°C. Prior to use, the squid pens were sterilized by autoclaving indefined seawater solution, cut into 1- by 1-cm squares, and rinsed in 70% ethanolbefore use.
Laminar flow cell (LFC) preparation. An LFC was used to observe bacterialattachment, reproduction, and detachment during chitin degradation duringexposure to constantly flowing defined seawater solution as described previously(6). Three separate LFCs were used to monitor surface-associated bacterialactivity. The first LFC contained two silicon coupons with spun-cast chitin thinfilms prepared as described previously (6). This LFC was used to evaluatebacterial activity during the degradation of pure chitin. The second LFC con-tained two clean silicon coupons, which served as nonnutritional control surfaces.The third LFC contained two 1-cm2 strips of natural squid pen chitin in place ofthe silicon coupons. The LFCs were set up as previously described (6). The strictcleaning procedure described previously (6) was used for all containers andsurfaces to which the bulk aqueous phase was exposed in order to minimize theintroduction of chemical contaminants that might support bacterial growth.
LFC operation. The LFCs containing the bare silicon and chitin-coated siliconcoupons were inoculated with the 400-h, starved-cell suspension (3.2 3 106 CFUml21) from the continuously stirred tank reactor (CSTR) to promote bacterialcolonization of the coupon surfaces as described previously (6). A second 400-hstarved-cell suspension (2.3 3 106 CFU ml21) in another CSTR was used toinoculate the LFC containing squid pen chitin. All three LFCs were inoculatedfor a period of 1 h at a flow rate of 0.5 ml min21. After inoculation, the LFCswere fed sterile defined seawater solution containing kanamycin and streptomy-cin but no added carbon, nitrogen, or energy sources equilibrated to 18°C at acontinuous flow rate of 0.5 ml min21 for an additional 199 h as describedpreviously (6). This flow rate mimics the conditions at the surface of a particlethat is sinking through the water column of the ocean (1). At this flow rate, theresidence time of the aqueous phase in the LFC was 55 s. Since this residencetime is much less than the generation time of S91, growth of free-living cells inthe bulk aqueous phase during the time that it passed through the LFC wasinsignificant.
Flow cell hydrodynamics. The average fluid velocity and Reynolds number(Re) experienced by the attached bacteria were calculated from the fluid flowrate and LFC geometry. Re was calculated based on the relationship describedin equation 1,
Re 5 SDe z V z r
m D (1)
where De is a characteristic length that depends on the system geometry, V is thefluid velocity, r is the density of the fluid, and m is the absolute viscosity (31). Dewas calculated based on the equation for a full-flowing rectangular conduit in
cross section. The density and kinematic viscosity of the defined seawater solu-tion were used to calculate the absolute viscosity (m) using equation 2,
m 5 ~0.01 z n z r! (2)
where n is the kinematic viscosity in centipoise and r is the density in grams percubic centimeter (55).
The shear stress at the point of cell attachment was calculated using the equa-tion for parabolic flow velocity between two plates as described by equation 3,
v 5 Vmax F1 2 S xyD
2G (3)
where x is the distance from the centerline of the flow cell in centimeters and yis 1/2 the flow channel height in centimeters (43). The shear stress (t) was cal-culated by substituting equation 3 into equation 4 and solving to yield equation 5.
t 5 2m zdvdx
(4)
t 5 2m z Vmax
xy2 (5)
The units were converted to piconewtons per square micrometer and representthe shear stress at the surface of the silicon and chitin coupons in the LFCs.
Microscopy and image analysis. Images of total S91 cells associated with thepure chitin and silicon surfaces were obtained every 10 min during the 1-hinoculation of the LFCs; 1, 2, 3, 5, 7, and 11 h after switching to sterile definedseawater solution; and every 12 h thereafter for the remainder of the 200-hexperiment using reflected differential interference contrast (DIC) microscopy asdescribed previously (6). Images of GFP-fluorescing, surface-associated cellsup-expressed for chiA-chiB genes were obtained by epifluorescence microscopyfor the same field of view used to image total cells by DIC as described previously(6). To compare relative fluorescence intensities (RFIs) of cells in differentimages, all images obtained by epifluorescence microscopy were captured at anexposure of 6 s using a gain of 4 and analyzed with Image-Pro Plus software(Media Cybernetics, Silver Spring, Md.). The only image manipulation per-formed on the DIC images was a background correction and in a few cases minoradjustment of the gray-scale contrast. No image manipulations were performedon the epifluorescence images. The software was used to count individual cells inall images using manually adjusted threshold values for each individual image.The intensity of GFP fluorescence was measured using Image-Pro Plus softwareby measuring the relative luminosity of chiA-chiB-gfp-expressing cells in eachimage. A minimum of six random fields (n 5 6) on both coupons in each flow cellwere imaged using both DIC and epifluorescence microscopy for every timepoint. Total surface-associated cell density, percentages of total cells up-ex-pressed for chiA-chiB-gfp, and luminosity of cells up-expressed for chiA-chiB-gfpare presented as means 6 standard deviations.
Detachment rate. The rate of detachment of surface-derived bacterial cells wasdetermined from the number of CFU recovered from 2 to 5 ml of effluentcollected from the LFCs over a 4- to 10-min period at times over the 200-h periodof surface colonization when microscopic images were obtained for the surfacepopulation. CFU were determined as described above for the starved-cell sus-pension. The rate of cell detachment at each sampling time was calculated asdescribed by equation 6,
CFU min21 5 ~Ne!t 5 n ~Vt 5 n 2 1!/tn 2 1 (6)
where (Ne)t 5 n is the CFU per milliliter of effluent at sampling time n, Vt 5 n 2 1 isthe volume in milliliters passing through the LFC since the previous samplingtime n 2 1, and tn 2 1 is the time in minutes elapsed since the previous samplingtime n 2 1. The percentage of the total surface-derived bacteria that detachedfollowing LFC inoculation was determined at various times postinoculation byequation 7,
% D 5 ~Ne!t 5 n ~Vt 5 n 2 1!/@Ns! 1 S~Ne!t 5 n ~Vt 5 n 2 1!] 3 100 (7)
where Ns is the number of cells on the surface and all other terms are defined asin equation 6 above. Since detached cells were enumerated by CFU instead oftotal direct counts, moribund and viable but nonculturable cells in the detachedpopulation were not taken into account in the detachment rate calculation.Therefore, the detachment rates calculated from the data represent a minimumsurface-associated bacterial detachment rate and are referred to as such.
Growth of bacterial cells in the bulk aqueous phase. The extent to whichDOM, released by the surface-associated bacterial population, supported growthof cells in the bulk aqueous phase after detachment from the chitin surface wasdetermined during chitin degradation. Effluent (5 to 10 ml) from the chitin LFCwas sampled at 50, 65, 78, 90, 102, 114, 126, 138, and 150 h postinoculation. Netgrowth of the free-living population on surface-derived DOM present in eachsample was determined from plate counts obtained after further sample incuba-tion in batch for 0, 24, 48, and 72 h at 20°C. CFU were determined as describedabove for the starved-cell suspension. The effluent of LFCs containing baresilicon coupons in place of the chitin-coated coupons was monitored for CFU to
VOL. 66, 2000 BACTERIAL FATE DURING CHITIN DEGRADATION 3575
on April 3, 2019 by guest
http://aem.asm
.org/D
ownloaded from

account for any growth derived from sources of DOM other than chitin degra-dation products.
Flow cytometric analysis. The level of chiA-chiB expression by cells thatdetached from the surfaces over time was quantified by flow cytometric analysisusing a Becton Dickinson FACSCalibur as previously described (6). Detachedcells were partitioned on the basis of their RFI into one of three levels ofchiA-chiB expression; no expression (1 to 10 RFI units), low-level expression (10to 100 RFI units), and high-level expression (30 to 300 RFI units). There wassome overlap in the fluorescence intensity histograms between the low and highlevels of expression. These ranges were chosen to capture all of the cells asso-ciated with these subpopulations.
Surface-associated bacterial growth rate. The growth rate of bacteria on thesurfaces was calculated for two time intervals during chitin degradation. Oneinterval (20 and 70 h postinoculation) coincided with the time of initial prolif-eration of bacteria on the surface. The other interval (100 and 200 h postinocu-lation) coincided with the time over which surface-associated bacterial cell den-sities and cell detachment rates remained fairly constant. The specific growthrate, k, was calculated over each of these time intervals from the increase in totalsurface-associated bacteria over that time interval plus the sum of the CFUobtained from all samples of LFC effluent collected during the same time inter-val. Specific growth rates associated with the squid pen chitin surface could notbe determined, as surface-associated cells could not be accurately enumerateddue to excessive surface roughness and autofluorescence of the natural chitinsubstratum. Since detached cells were enumerated by CFU instead of total directcounts, the growth rates calculated from the data, like the detachment ratesdescribed above, represent a minimum surface-associated bacterial specificgrowth rate and are referred to as such.
Bacterial biomass calculation. Cell biomass (milligrams of C cell21) wasestimated from surface-associated cells in images of chitin and silicon surfacesand from detached cells collected on polycarbonate membranes (0.2-mm poresize; Nuclepore) following filtration of the LFC effluent. Images were capturedwith a Photometrics Imagepoint cooled charge-coupled device camera (Photo-metrics, Tucson, Ariz.), acquired at a magnification of 31,000, and resolved with32 bits of memory per pixel. The length and width of 40 randomly chosenbacteria in each of five captured images (n 5 200) of the surface-associatedbacterial population were obtained for this population of cells using Image-ProPlus software (Media Cybernetics). The length and width of detached bacteriarecovered on the polycarbonate membranes were obtained in a similar manner.The volume of cells of the surface-associated and detached populations wascalculated from cell dimensions obtained from each population using equation 8,
v 5 Sw2 zp
4D z ~l 2 w! 1 Sp zw3
6 D (8)
where v is cell volume and l and w are cell length and width, respectively (13). Amean cell volume 6 1 standard deviation was then calculated for the surface-associated and detached cell populations. Mean cell volume was then convertedto mean cell carbon using equation 9,
C 5 0.12 z V 0.72 (9)
where V is the volume in cubic micrometers and C is in picograms of carbon percell (36). Total surface-associated bacterial biomass was calculated by multiply-ing the mean carbon content of a surface-associated cell by the number of totalsurface-associated cells present at the end of the 200-h experiment. Total bio-mass of the detached bacterial population was calculated by multiplying themean carbon content of the detached cell population by the total CFU presentin the entire volume of LFC effluent discharged from the LFC over the 200-hexperiment. Total surface-derived bacterial biomass was calculated as the sum ofthe total surface-associated and total detached bacterial biomass. Since detachedcells were enumerated by CFU instead of total direct counts, the total detachedbacterial biomass and total surface-derived bacterial biomass calculated from thedata represent minimum values and are referred to as such.
BP. BP by the surface-associated population on the 2-cm2 coupon surface areain the LFCs was calculated from the total surface-derived cell biomass producedover the 200-h experiment. This area-based production value (milligrams of Cper square centimeter per hour) was converted to the more commonly encoun-tered volume-based production value (milligrams of C per cubic meter per day)by replacing the area over which surface-derived cell biomass was generated withthe volume of the bulk aqueous phase that passed through the LFCs over the200-h experiment. Since detached cells were enumerated by CFU instead of totaldirect counts, the total detached BP and total surface-derived BP calculated fromthe data represent minimum values and are referred to as such.
RESULTS
Characteristics of starved population of S91. A culture ofS91 suspended in defined seawater solution containing noadded organic carbon, nitrogen, or energy sources in a CSTRachieved a stable cell density of 4 3 106 CFU ml21 between170 and 400 h of starvation (data not shown). During this time,
the cells decreased in size and transformed from rods to coc-coid forms. Cells of S91 displayed no detectable GFP fluores-cence and hence no detectable chiA-chiB expression at anytime during the 400-h period of starvation, based on epifluo-rescence microscopic examination of cells recovered from thestarvation medium. Flow cytometric analysis of the starved-cellsuspension revealed a distribution of RFIs among cells in thepopulation that was similar to that displayed by a glutamate-grown culture of S91 (Fig. 1). In contrast, cells cultured inGlcNAc-containing medium displayed a range of RFIs thatwere approximately an order of magnitude higher than thoseof starved-cell suspension or glutamate-grown cultures (Fig. 1).
Surface colonization. Prior to exposure to the starved-cellsuspension, the surface of the chitin thin film was opticallysmooth and nonfluorescent (Fig. 2a and b). Both the chitin andsilicon surfaces were rapidly colonized upon exposure to aflowing suspension of starved cells, accumulating 7.4 3 105 and5.6 3 105 cells cm22, respectively, within a 1-h period (Fig. 3).On the chitin surface, cell densities achieved a plateau at 7.1 3106 cells cm22 after 80 to 100 h, while on the silicon surface,they achieved a plateau at 2.2 3 106 cells cm22 after 120 h.These results demonstrate that the chitin surface supplied es-sential nutrients for attached cell growth and replication thatwere not available on the silicon surface. However, cells thatattached to the nonnutritional silicon surface were still able togrow and replicate, presumably utilizing the trace amounts ofnutrients present as contaminants in the sterile defined seawa-ter solution that flowed continuously across the coupon sur-face.
Chitinase gene expression of surface-associated bacteria.Upon initial attachment to the chitin or silicon surfaces, cellsdisplayed no GFP fluorescence, indicating that detectable up-
FIG. 1. Histograms of RFI from GFP reporting expression of chiA-chiBgenes in a population of S91 cells starved for 400 h in defined seawater solution(a), growing as a batch culture in defined seawater solution supplemented withglutamate (b), growing as a batch culture in defined seawater solution supple-mented with GlcNAc (c), recovered in the effluent from the LFC containingsilicon surfaces 96.5 h postinoculation (d), recovered in the effluent from theLFC containing pure chitin surfaces 96.5 h postinoculation (e), and recovered inthe effluent from the LFC containing pure chitin surfaces 200 h postinoculation(f). Each histogram is based on evaluation of 5 3 105 cells.
3576 BATY ET AL. APPL. ENVIRON. MICROBIOL.
on April 3, 2019 by guest
http://aem.asm
.org/D
ownloaded from

FIG. 2. DIC (left panels) and epifluorescence (right panels) photomicrographs of clean, sterile chitin thin film surface (a and b), silicon surface 96.5 h postinocu-lation (c and d), pure chitin surface 96.5 h postinoculation (e and f), and pure chitin surface 200 h postinoculation (g and h).
VOL. 66, 2000 BACTERIAL FATE DURING CHITIN DEGRADATION 3577
on April 3, 2019 by guest
http://aem.asm
.org/D
ownloaded from

expression of the chiA-chiB genes was not required for initialadhesion of cells to the substratum. However, some cells on thechitin and silicon surfaces displayed GFP fluorescence 7 and21 h postinoculation, respectively (Fig. 4a). The population ofcells up-expressed for chiA-chiB on the silicon surface dis-played a mean relative luminosity from GFP fluorescence of28.6 6 2.6 for the duration of the 200-h study (Fig. 4b). Overmost areas of the chitin surface, cells that were up-expressedfor chiA-chiB displayed a mean relative luminosity from GFPfluorescence of 35.9 6 0.8 (Fig. 4b). The level of chiA-chiBexpression among cells associated with most areas of the chitinsurface is difficult to distinguish from that of cells expressingthese genes on the silicon surface (Fig. 2c through f). Thisrange of relative luminosity will be equated with low-levelchiA-chiB expression.
Beginning at 60 h postinoculation, some areas of the chitinsurface display clusters of cells with higher relative luminositythan those described above (Fig. 2g and h), averaging 117.5 69.5 between 80 and 200 h postinoculation (Fig. 4b). Ninety-three percent of the cells in these clusters displayed this highrelative luminosity (Fig. 4a). Thus, expression of chiA-chiB wassignificantly higher in cells in these clusters than in cells asso-ciated with the silicon surface or other areas of the chitinsurface. This higher relative luminosity will be equated withhigh-level chiA-chiB expression. The density of cells in areas ofthe chitin surface where high-level expression occurred was notsignificantly different from that in surrounding areas of thesurface where low-level expression was observed (Fig. 2g andh). At 96.5 h postinoculation, 37% of the total cells on thechitin surface expressed chiA-chiB at one of these levels, while60% of the total cells on the silicon surface displayed low-levelchiA-chiB expression (Fig. 4a). At no time during the 200-hstudy did any cells associated with the silicon surface displaythe high-level expression seen in clusters on the pure chitinsurface. Thus, three subpopulations of cells were resolved onthe chitin surface, based on levels of expression of chiA-chiBgenes: one subpopulation that displayed no detectable ex-
pression, a second displaying low-level expression, and athird displaying a high level of expression. In contrast, onlytwo subpopulations were resolved on the silicon surface basedon levels of chiA-chiB expression; one subpopulation display-ing no detectable expression and a second displaying low-levelexpression.
Clusters of cells displaying high-level expression varied insize from 308 to 49,125 mm2; the mean area of these clusterswas 4,845 mm2. At the end of the 200-h experiment, clusters ofcells displaying high-level expression covered approximately20% of the total surface area of the chitin coupons. In areplicate experiment, the clusters of cells displaying high-levelexpression covered approximately 16% of the total surfacearea of the chitin coupons.
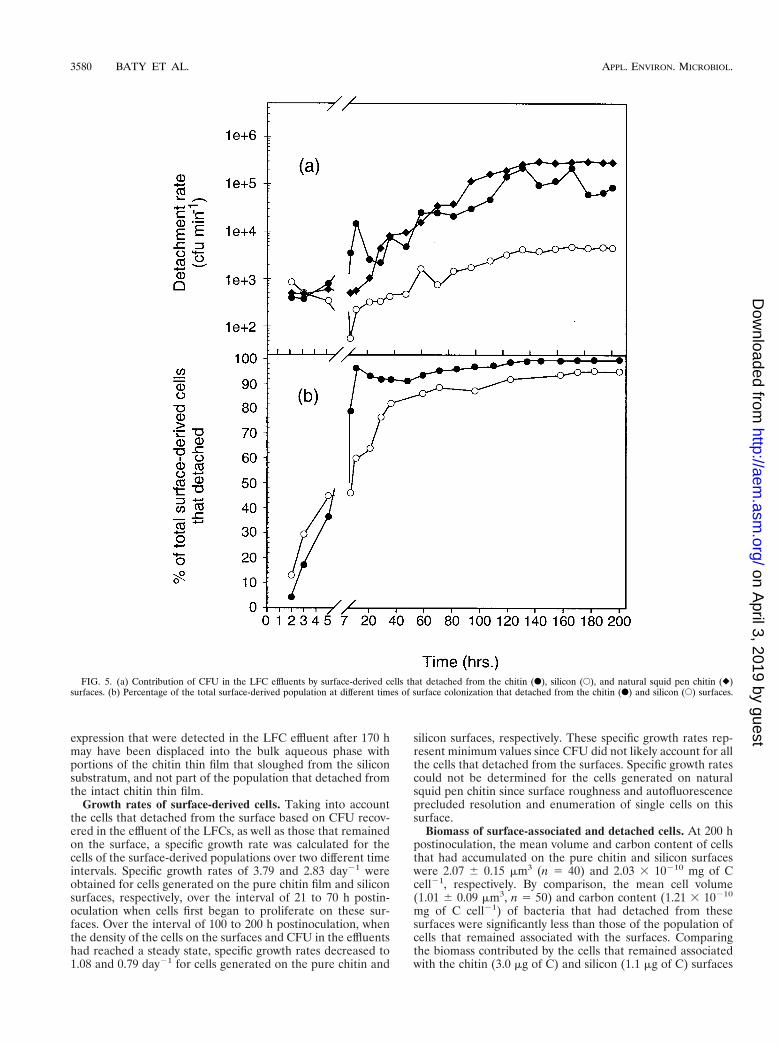
Detachment. Rates of cell detachment from the pure chitinfilm, natural squid pen, and silicon surfaces, based on CFUrecovered in LFC effluent, varied over the period of surfacecolonization. Cells of S91 detached from the pure chitin filmsand natural squid pen chitin surfaces at similar rates over theduration of the 200-h experiment (Fig. 5a). Detachment rateswere lower on the silicon surface than on the chitin surfaces,however. Detachment rates on the pure chitin surface dis-played the greatest increase during the time at which the cellsaccumulated most rapidly on that surface. The highest celldetachment rate was observed at 130 h postinoculation on allthree surfaces (Fig. 5a). The detachment rate from the naturalsquid pen chitin and silicon surfaces remained at the maximumvalue for the remainder of the 200-h experiment, whereas therate of cell detachment from the pure chitin film fluctuatedover the 130- to 200-h interval (Fig. 5a). The detachment ratesreported here likely underestimate the actual detachment ratessince bacterial density determinations based on CFU did nottake into account those cells that became moribund or non-culturable under the conditions employed in this study follow-ing detachment.
Within 7 h of LFC inoculation, the percentage of surface-generated cells that detached from either the chitin or the
FIG. 3. Total cell densities on silicon surface (E), in areas of a pure chitin surface lacking clusters of cells displaying high-level chiA-chiB expression (F), and inareas of a pure chitin surface within clusters of cells displaying high-level chiA-chiB expression (�) following inoculation of LFCs with starved-cell suspension (verticaldashed line). Vertical solid bars represent 1 standard deviation around the mean (n 5 6 for each data point).
3578 BATY ET AL. APPL. ENVIRON. MICROBIOL.
on April 3, 2019 by guest
http://aem.asm
.org/D
ownloaded from

silicon surfaces and were recovered as CFU in the bulk aque-ous phase exceeded that which remained on the surface (Fig.5b). No aggregation of cells was observed in effluent samples.The percentage of the total surface-generated cells that de-tached from the natural squid pen chitin surface could not becalculated, since the cells that remained associated with thesurface could not be resolved. At 130 h postinoculation, 97.3and 87.1% of the total cells generated on the pure chitin andsilicon surfaces, respectively, had detached into the bulk aque-ous phase (Fig. 5b). These percentages represent a minimumsince not all the cells that detached were likely to have pro-duced a CFU. Thus, the vast majority of surface-derived cells,regardless of the nutritional value of the surface, were dis-placed from the surface into the bulk aqueous phase over the200-h experiment.
chiA-chiB gene expression in detached cells. Flow cytometricanalysis of effluent samples from both the silicon and pure
chitin surfaces revealed that the population of detached cellsdisplayed a range of RFIs from GFP fluorescence that wasapproximately the same as that observed for starved cells andcells cultured on glutamate, indicating that they were not ex-pressing chiA-chiB (Fig. 1). The vast majority of cells thatdetached from either the pure chitin or the silicon surface overthe entire 200-h period of surface colonization were down-expressed for chiA-chiB (Fig. 6). Some cells displaced from thepure chitin surface after 170 h of surface colonization dis-played a higher level of fluorescence than those cells displacedfrom the surface at earlier times, suggesting a higher level ofchiA-chiB gene expression (Fig. 1f). The appearance of cellsdisplaying the higher level of fluorescence in the effluent of thechitin LFC after 170 h, coincided with an apparent deteriora-tion and sloughing of portions of the pure chitin thin film fromthe coupon surface, presumably related to the biodegradationprocess. Thus, cells displaying the higher level of chiA-chiB
FIG. 4. (a) Percentage of total surface-associated cells up-expressed for chiA-chiB on a silicon surface (E) and on the pure chitin surface in areas outside clustersof cells displaying high-level expression (F) and within clusters of cells displaying high-level expression (�). (b) Relative luminosity of cells displaying different levelsof chiA-chiB gene expression. The vertical dashed line identifies the time at which the feed to the LFCs was switched from the starved-cell suspension to the steriledefined seawater solution. Vertical solid bars represent 1 standard deviation around the mean (n 5 6 for each data point).
VOL. 66, 2000 BACTERIAL FATE DURING CHITIN DEGRADATION 3579
on April 3, 2019 by guest
http://aem.asm
.org/D
ownloaded from
expression that were detected in the LFC effluent after 170 hmay have been displaced into the bulk aqueous phase withportions of the chitin thin film that sloughed from the siliconsubstratum, and not part of the population that detached fromthe intact chitin thin film.
Growth rates of surface-derived cells. Taking into accountthe cells that detached from the surface based on CFU recov-ered in the effluent of the LFCs, as well as those that remainedon the surface, a specific growth rate was calculated for thecells of the surface-derived populations over two different timeintervals. Specific growth rates of 3.79 and 2.83 day21 wereobtained for cells generated on the pure chitin film and siliconsurfaces, respectively, over the interval of 21 to 70 h postin-oculation when cells first began to proliferate on these sur-faces. Over the interval of 100 to 200 h postinoculation, whenthe density of the cells on the surfaces and CFU in the effluentshad reached a steady state, specific growth rates decreased to1.08 and 0.79 day21 for cells generated on the pure chitin and
silicon surfaces, respectively. These specific growth rates rep-resent minimum values since CFU did not likely account for allthe cells that detached from the surfaces. Specific growth ratescould not be determined for the cells generated on naturalsquid pen chitin since surface roughness and autofluorescenceprecluded resolution and enumeration of single cells on thissurface.
Biomass of surface-associated and detached cells. At 200 hpostinoculation, the mean volume and carbon content of cellsthat had accumulated on the pure chitin and silicon surfaceswere 2.07 6 0.15 mm3 (n 5 40) and 2.03 3 10210 mg of Ccell21, respectively. By comparison, the mean cell volume(1.01 6 0.09 mm3, n 5 50) and carbon content (1.21 3 10210
mg of C cell21) of bacteria that had detached from thesesurfaces were significantly less than those of the population ofcells that remained associated with the surfaces. Comparingthe biomass contributed by the cells that remained associatedwith the chitin (3.0 mg of C) and silicon (1.1 mg of C) surfaces
FIG. 5. (a) Contribution of CFU in the LFC effluents by surface-derived cells that detached from the chitin (F), silicon (E), and natural squid pen chitin (})surfaces. (b) Percentage of the total surface-derived population at different times of surface colonization that detached from the chitin (F) and silicon (E) surfaces.
3580 BATY ET AL. APPL. ENVIRON. MICROBIOL.
on April 3, 2019 by guest
http://aem.asm
.org/D
ownloaded from

at the end of the 200-h experiment to that contributed by thecells as CFU that had detached from the chitin (92.2 mg of C)and silicon (3.2 mg of C) surfaces over the 200-h experimentindicates that the detached cell population contributed thebulk of the surface-generated bacterial biomass in the system.This conclusion holds in spite of the smaller cell size andunderestimation of total detached cells by the CFU enumera-tion method.
BP. BP was determined on the basis of (i) cell biomass thatremained associated with the chitin thin film and silicon sur-faces at the end of the 200-h experiment, (ii) cell biomass thathad detached from the surfaces over the duration of the 200-hexperiment, and (iii) the combined biomass of cells that re-mained associated with the surfaces after 200 h and the cellsthat detached from the surfaces over the 200-h experiment(Table 1). The 55.3-s residence time of the bulk aqueous phaseflowing through the LFCs was much less than the generationtime of S91. Therefore, BP contributed by the detached cells,during the short time that they resided in the LFCs as a free-living population, was insignificant compared to the BP comingoff the surface during that time.
While surface-retained BP on the chitin surface was nearlythree times that on the silicon surface, surface-derived BP thatdetached from the chitin surface was nearly 30 times the BPthat detached from the silicon surface (Table 1). Interestingly,
BP that detached from the natural squid pen chitin was overtwice that which had detached from the pure chitin film. Totalchitin thin film-derived BP was 22 times the total silicon sur-face-derived BP after the 200-h incubation (Table 1). The totalsurface-derived and detached BP values for both chitin andsilicon surfaces represent conservative estimates since they donot include that portion of the BP that had detached but failedto form a CFU. A minimum of 96.8 and 75% of the totalsurface-derived BP from the chitin and silicon surfaces, respec-tively, was displaced into the bulk seawater solution. Thus,irrespective of the nutritional value of the surface, and despitethe conservative estimate of the number of cells that detachedfrom the surfaces, the majority of the BP produced on the sur-faces was displaced into the surrounding bulk aqueous phase.
BP by free-living cell population. Once the cells detachedfrom the chitin or silicon surface and became part of thefree-living population, they did not contribute detectable BP inthe effluent based on CFU recovered over a 72-h period fol-lowing detachment. In fact, incubation of this population ofcells in the seawater solution in which they were displacedresulted in a reduction in CFU over time (Fig. 7). A reductionin CFU was observed in effluents collected at every samplingperiod from 0 to 150 h postinoculation (Fig. 7). The decreasein CFU in the LFC effluents over the 72-h period followingsurface detachment resembled the decrease in CFU during theearly stages of starvation of the LFC inoculum following re-suspension of a glutamate-grown culture of S91 in definedseawater solution (Fig. 7).
Hydrodynamic conditions. The 0.5-ml min21 flow rate of thedefined seawater solution through each LFC during the sur-face-associated cell growth and detachment corresponded to afluid flow velocity of 75 m day21. When crystal violet wasinjected into the LFCs at this flow rate, it moved in a plug flowmanner with a Re of 1.30, suggesting laminar flow of theaqueous phase across the coupons. The shear stress experi-enced by the bacteria at the surface under these conditions wasequivalent to 0.004 pN of force mm22.
DISCUSSION
The cell density and cell morphology of a 400-h starvedpopulation of S91 resembled the density and cell morphologyof natural bacterial populations in the pelagic marine environ-ment (14, 15, 34, 50, 54). Thus, the physiological state of thecells used to inoculate the surfaces of the model system mayhave resembled that of natural bacterial populations colonizingPOM in the pelagic marine environment. The rapid attach-ment of starved cells of S91 to the chitin and silicon surfacesand subsequent growth and replication on these surfaces areconsistent with behavior displayed by free-living, starved cellsof other marine bacteria that have been exposed to surfaces inoligotrophic environments (33). Growth of cells on the non-nutritional silicon surface was most likely the result of surface-associated cell scavenging and utilization of trace contaminants
FIG. 6. Percentage of total cells that detached from the pure chitin (top) andsilicon (bottom) surfaces that displayed no expression (F), 1 to 10 RFI units),low-level expression (E), 10 to 100 RFI units), and high-level expression (�, 30to 300 RFI units) of chiA-chiB genes.
TABLE 1. Surface-derived BP
Surface BP that remained associated withsurfacea (mg of C m23 day21)
BP displaced from the surfaceb
(mg of C m23 day21)Total surface-derived BP
(mg of C m23 day21)% Total surface-derived
BP that detached
Silicon 0.024 0.072 0.096 75Chitin 0.068 2.060 2.128 96.8Squid pen chitin NDc 4.17 ND ND
a Based on total cells attached to 2.0 cm2 of surface at 200 h postinoculation and the total volume of seawater that passed through the LFCs over the 200-h period.b Based on CFU recovered from effluent samples collected over entire 200-h period.c ND, not determined.
VOL. 66, 2000 BACTERIAL FATE DURING CHITIN DEGRADATION 3581
on April 3, 2019 by guest
http://aem.asm
.org/D
ownloaded from

of DOM in the defined seawater solution that flowed contin-uously across the coupon surface.
Chitinases possess chitin-binding domains that aid in bind-ing the enzyme to its substrate (39). These chitin-binding do-mains may also serve to anchor the cell to the chitin surface(38). That cells, upon initial attachment to either chitin orsilicon surfaces, displayed no detectable GFP fluorescenceand, hence, were not expressing chiA-chiB suggests that theproducts of these genes are not required for establishment ofinitial interactions between the cell and substratum, even whenthe substratum is pure chitin. However, the observed low-levelexpression of chiA-chiB genes following cell attachment toboth the silicon and chitin surfaces is consistent with previousstudies suggesting that expression of these genes was a surface-controlled response, independent of the presence of chitin.
The properties of a solid surface that affect gene expressionhave not been identified (10, 37, 44, 52, 57). Since chitin is oneof the primary organic carbon and nitrogen sources in the
pelagic marine environment, cells possessing chitinase genesmay express these genes at a low level following contact withany solid surface to synthesize “sensing levels” of enzymes (6,56). When a chitin surface is encountered, the small quantityof enzyme produced could generate sufficient amounts ofGlcNAc or chitin oligomers, which, upon uptake by the cells,may promote higher levels of chiA-chiB expression, as wasobserved in cells on some areas of the chitin surface but not incells on the silicon surface.
An unanticipated result of the present study was the dis-placement of the majority of the surface-derived BP as free-living cells to the bulk aqueous phase, regardless of thenutritional value of the surface. Even using the conservativemeasure of CFU to assess the number of surface-derived cellsdisplaced into the bulk aqueous phase, the fraction of the totalsurface-derived BP displaced from the chitin and silicon sur-faces over a 200-h period was 97 and 75%, respectively. Jacob-sen and Azam (23) found that as much as 90% of bacteria
FIG. 7. CFU recovered from effluents of chitin- and silicon-containing LFCs at various times postinoculation after incubation as a batch culture at 20°C for 0, 24,48, and 72 h. CFU recovered following exposure of a glutamate-grown culture of S91 to unsupplemented defined seawater solution for 0, 24, 48, and 72 h are presentedfor comparison (S).
3582 BATY ET AL. APPL. ENVIRON. MICROBIOL.
on April 3, 2019 by guest
http://aem.asm
.org/D
ownloaded from

produced by cells attached to copepod fecal pellets were re-covered in the surrounding water. They hypothesized that theprogeny of dividing cells leave the fecal pellet during the divi-sion cycle.
While hydrodynamic forces exerted over the surface of nat-ural detrital POM during settling through the water columnwill vary as a consequence of complex geometry, those forcesexerted upon the bacteria associated with the pure chitin andsilicon surfaces by the flowing bulk aqueous phase were rela-tively constant in LFCs. The 0.004-pN mm22 shear stress cal-culated for cells associated with surfaces exposed to a bulkaqueous phase flow rate of 0.5 ml min21 approximates theshear stress at a point perpendicular to the flow of seawateracross a particle sinking at a rate of 75 m day21. This sinkingvelocity is very similar to the mean sinking velocity (74 6 39 mday21) of particles ranging from 2.4 to 75 mm in diameter offthe coast of southern California (1). Thus, the shear stressexperienced by bacteria attached to natural POM in the watercolumn of the ocean approximates that experienced by thesurface-associated cells in LFCs in the present study.
It is difficult to assess the significance of shear stress for theprocess of bacterial cell detachment from a surface. However,a study evaluating the effect of shear stress on the adhesion ofStaphylococcus epidermidis to a variety of materials includingglass, siliconizedglass,plasma-conditionedglass, titanium, stain-less steel, and Teflon suggested that shear stresses rangingfrom 0.2 to 1.0 pN mm22 had little effect on the detachmentrate of the surface-colonizing bacteria (32). Thus, the shearstress of 0.004 pN mm22 calculated for cells of S91 attached tosurfaces exposed to flowing seawater in the present study likelyrepresents a negligible force for these bacteria.
In the absence of a significant shear stress, the cells them-selves may have controlled their displacement from the sur-faces by a yet-unknown mechanism of detachment. The higherdetachment rates that were consistently observed over thestudy period for the chitin-associated population than forthe silicon-associated population may involve a chitin-specificdeadhesion process similar to that described for the marinechitin degrader Vibrio furnissii (56). The deadhesion displayedby progeny of cells of this bacterium during chitin utilizationwas proposed to promote colonization of new surfaces (56).Cells of another marine vibrio, MH3, associate with a surfaceonly long enough to scavenge and metabolize surface-boundfatty acids before detachment (21). Detachment of S91 cellsfrom either the chitin or silicon surfaces was not likely theresult of space limitation, since detachment occurred even atearly periods of cell accumulation on these surfaces when largeareas of the surface remained unoccupied.
Jacobsen and Azam (23) recognized that detachment ofPOM-associated bacteria contributes to an underestimation ofPOM-derived BP and a corresponding overestimation of BP bythe free-living bacterial population when conventional meth-ods are used to determine BP in water samples collected fromthe environment. Methods of assessing BP in natural waters,such as those involving [3H]thymidine or [3H]leucine incorpo-ration, assume that detachment of cells from POM is insignif-icant over the period of sample incubation (11, 12, 16, 27, 41).Results based on these approaches typically indicate thatPOM-associated BP is a small or insignificant fraction of thetotal BP in the system, with the free-living bacterial populationalways contributing the bulk of the BP (2, 20, 25, 51). Unfor-tunately, a simple means of assessing the displacement of par-ticle-associated bacteria during determination of BP in watersamples obtained from the environment does not exist at thepresent time.
By utilizing a model system that accounted for the surface-
associated BP that was subsequently displaced into the bulkaqueous phase, it was possible in the present study to demon-strate quantitatively the contribution of the displaced BP to thesurface-derived BP. That the displaced BP represented thebulk of the surface-derived BP supports the suggestion thatdetachment of POM-associated bacteria during determinationof BP can result in errors in assignment of the bacterial pop-ulations responsible for the BP in the system when approachesthat do not account for the displacement of cells from onephase to another are employed (23). Thus, existing methods ofBP determination should be modified or new methods shouldbe developed to account for not only detachment of bacteriafrom POM but also attachment of free-living bacteria to POMduring BP determinations. The results also suggest that, inorder to gain a better understanding of the dynamics of bac-terial processes associated with POM degradation, it may benecessary to evaluate both detachment and BP nondestruc-tively in real time, or at least at intervals which capture thesignificant changes in the rates of these processes during POMdegradation.
On the basis of biomass calculations derived from measure-ments of cell dimensions, total biomass produced on the purechitin surface was 40% greater than the estimated availablecarbon in the chitin thin films. The factors likely responsiblefor this discrepancy are the empirically derived factors forconverting cell volume to biomass used in this study and theuncertainty of the thickness of the chitin thin films. The carboncontent per volume can vary widely in marine bacteria (7, 17,28, 29, 30). Since this was not determined in our study, theconversion factors may be inaccurate. Film thickness may varyas much as 30 to 40% when the casting temperature varies by5°C, due to temperature-induced changes in the viscosity of thechitosan solution. Since temperature was not controlled duringthe casting of the films, estimated carbon content may be off byas much as 30 to 40%. Theoretically, these uncertainties can beminimized in future experiments, permitting an accurate de-termination of the efficiency of bacterial conversion of chitin tobiomass in this model system.
Calculations based on the rates of POM-associated BP ob-tained by methods that do not account for bacterial detach-ment predict that it would take months to years for the bacteriaretained on the particle to consume the carbon load of theparticle (12, 24). This low rate of conversion of detrital partic-ulate organic carbon to particle-associated BP cannot accountfor the observed rapid disappearance of these particles withdepth, a phenomenon referred to as the “particle decomposi-tion paradox” (24). One explanation that has been proposed isthat POM-associated bacteria generate more DOM from thehydrolysis of POM than they can utilize, resulting in the releaseof DOM into the bulk aqueous phase for utilization by free-living bacteria (3, 9, 46). An alternative explanation may bethat some POM-associated bacteria generate more DOM fromthe hydrolysis of POM than they themselves can utilize, andthe excess is utilized by other POM-associated bacteria for BP,a significant portion of which becomes detached to becomepart of the free-living bacterial population.
Two surface-associated subpopulations were described withrespect to chitinase gene expression: one comprised of cellsup-expressed for chiA-chiB and one composed of cells down-expressed for these genes. These results are consistent withthose of a previous study that monitored only chiA gene ex-pression (6). Like the detached cells that displayed no detect-able chiA gene expression in a previous study (6), the cells thatdetached from the surfaces in this study displayed no detect-able chiA or chiB gene expression. Thus, in spite of the factthat chiA and chiB are each under the control of their own
VOL. 66, 2000 BACTERIAL FATE DURING CHITIN DEGRADATION 3583
on April 3, 2019 by guest
http://aem.asm
.org/D
ownloaded from

promoters (48), they appear to be coregulated in the surface-associated population. The evidence supporting the existenceof chiA-up- and -down-expressed subpopulations, which alsoapplies to chiA-chiB-up- and -down-expressed subpopulations,is presented elsewhere (6).
As was shown to be the case for a significant portion of cellsup-expressed for chiA (6), a comparable portion of the cellsup-expressed for chiA-chiB in the present study are also likelyto be synthesizing and excreting active chitinase enzymes. Onthe chitin surface, the amount of BP supported by chitin deg-radation products created by the chitinase-producing subpopu-lation corresponds roughly to that represented by the differ-ence in total surface-derived BP on the chitin and siliconsurfaces (2.03 mg of C m23 day21). The surface-associated BPsupported by chitin degradation products was 0.044 mg of Cm23 day21 (Table 1), and the chiA-chiB-up-expressed sub-population represented 37% of the total chitin surface-associ-ated population during the time that BP achieved a quasi-steady state. Thus, the chiA-chiB-up-expressed subpopulationaccounted for only 0.02 mg of C m23 day21, or approximately1% of the total surface-derived BP attributable to that derivedfrom the chitin degradation products they generated. Thesecalculations suggest that the chiA-chiB-up-expressed subpopu-lation must have produced a large excess of chitin degradationproducts to support production of their chiA-chiB-down-ex-pressed neighbors on the surface.
The means by which the chiA-chiB-down-expressed cellsgain access to the soluble chitin degradation products remainsto be determined. The matrix of extracellular polymeric sub-stances excreted by surface-associated bacterial populationsmay play a role in this regard by impeding displacement ofsoluble chitin degradation products as well as chitinase enzymemolecules from the substratum surface to the flowing bulkaqueous phase. Channels and pores in the extracellular poly-meric substance matrix near the substratum could then serve asconduits for transfer of soluble chitin degradation products tonearby cells that are not producing chitinase.
The present study also suggests that the DOM generated bythe chitinase-active, surface-associated population supportedno significant BP by the free-living population relative to thatgenerated by the surface-associated population. No new BP,based on CFU, was detected in the LFC effluent containing thedetached cells over a 72-h period of batch incubation, regard-less of when detachment occurred during the period of surfacecolonization. In fact, the decrease in CFU over the 72-h incu-bation of all effluent samples and the smaller size of cells in thedetached population than in the population that remainedsurface associated suggest that, once the cells became part ofthe free-living population, any DOM that they utilized was notsufficient to prevent many from entering a moribund, noncul-turable or starvation state. Thus, the bulk of the surface-gen-erated DOM that was utilized for BP supported surface pop-ulation growth rather than growth of the free-living populationin the model system employed in this study.
In summary, differential expression of chitinase genes amongcells of this surface-associated bacterial population supportsthe idea that the chitin surface-associated subpopulation ofcells, whose chiA-chiB genes are up-expressed, produces moresoluble chitin degradation product than they can utilize andthat the excess supports production of the surface-associatedsubpopulation of cells down-expressed for chiA-chiB. This thenpermits two energy-demanding activities (ectoenzyme produc-tion and BP) to proceed simultaneously but partitioned amongdifferent cells within a population of surface-associated bacte-ria (Fig. 8). Such altruistic behavior of cells in a bacterial pop-ulation may be an adaptive response to conserve energy in
oligotrophic environments such as the ocean which, when co-ordinated with a process like detachment for dispersal ofthe surface-generated BP, optimizes exposure to the widelydispersed, newly formed detrital POM in the pelagic watercolumn for colonization and, ultimately, maintenance of thepopulation. Other types of bacteria also appear to distributedifferent physiological activities among different members ofthe population as a means to enhance survival of the popula-tion as a whole (8, 42).
ACKNOWLEDGMENTS
We gratefully acknowledge Sandra Kurk at the Department of Vet-erinary Molecular Biology of Montana State University for her help inflow cytometric analysis. We also recognize Samuel Hudson at NorthCarolina State University for sharing his expertise in the preparation ofchitin films.
Part of this work was supported by The Flinders University of SouthAustralia and the Australian Research Council. Somkiet Techkarnja-naruk was supported by a Royal Thai Government Scholarship. Thiswork was sponsored by the National Science Foundation under grantOCE 9720151 and the National Institutes of Health under grantS10RR11877 and under the National Science Foundation cooperativeagreement EEC 8907039.
REFERENCES
1. Alldredge, A. L., and C. Gotschalk. 1988. In situ settling behavior of marinesnow. Limnol. Oceanogr. 33:339–351.
2. Alldredge, A. L., J. J. Cole, and D. A. Caron. 1986. Production of hetero-trophic bacteria inhabiting macroscopic organic aggregates (marine snow)from surface waters. Limnol. Oceanogr. 31:68–78.
3. Azam, F. 1998. Microbial control of oceanic carbon flux: the plot thickens.Science 280:694–696.
4. Azam, F., and R. Hodson. 1977. Size distribution and activity of marinemicroheterotrophs. Limnol. Oceanogr. 22:492–501.
5. Bae, H., and S. M. Hudson. 1997. The cooperative binding behavior ofsodium dodecyl sulfate to crosslinked chitosan films. J. Appl. Polymer Sci.:Part A Polymer Chem. 35:3755–3765.
FIG. 8. Schematic representation of the pathway involved in the degradationof detrital POM and resulting production of surface-derived microbial biomassbased on results obtained using a model system. Starved cells of Pseudoaltero-monas sp. strain S91 attach to a surface and form two subpopulations: one whosechitin-degrading genes become up-expressed and another whose chitin-degrad-ing genes remain down-expressed. The former, through chitinase production andexcretion, supplies the latter with soluble chitin degradation products for bacte-rial production at the surface. Progeny detach from the surface and disseminateinto the bulk aqueous phase to seek out new detrital POM to repeat the cycle.
3584 BATY ET AL. APPL. ENVIRON. MICROBIOL.
on April 3, 2019 by guest
http://aem.asm
.org/D
ownloaded from

6. Baty, A. M., III, C. C. Eastburn, Z. Diwu, S. Techkarnjanaruk, A. E. Good-man, and G. G. Geesey. 2000. Differentiation of chitinase-active and non-chitinase-active subpopulations of a marine bacterium during chitin degra-dation. Appl. Environ. Microbiol. 66:3566–3573.
7. Bjornsen, P. K., and J. Kuparinen. 1991. Determination of bacterioplanktonbiomass, net production and growth efficiency in the Southern Ocean. Mar.Ecol. Prog. Ser. 71:185–194.
8. Caldwell, D. E., G. M. Wolfaardt, D. R. Korber, and J. R. Lawrence. 1997.Do bacterial communities transcend darwinism? Adv. Microb. Ecol. 15:105–191.
9. Cho, B. C., and F. Azam. 1988. Major role of bacteria in biogeochemicalfluxes in the ocean’s interior. Nature 332:441–443.
10. Davies, D. G., and G. G. Geesey. 1995. Regulation of the alginate biosyn-thesis gene algC in Pseudomonas aeruginosa during biofilm development incontinuous culture. Appl. Environ. Microbiol. 61:860–867.
11. Ducklow, H. W., and D. L. Kirchman. 1983. Production and fate of bacteriain the oceans. Bioscience 33:494–499.
12. Ducklow, H. W., D. L. Kirchman, and G. T. Rowe. 1982. Production andvertical flux of attached bacteria in the Hudson River Plume of the NewYork Bight as studied with floating sediment traps. Appl. Environ. Micro-biol. 43:769–776.
13. Felip, M., B. Sattler, R. Psenner, and J. Catalan. 1995. Highly active micro-bial communities in the ice and snow cover of high mountain lakes. Appl.Environ. Microbiol. 61:2394–2401.
14. Fuhrman, J. A. 1981. Influence of method on the apparent size distributionof bacterioplankton cells: epifluorescence microscopy compared to scanningelectron microscopy. Mar. Ecol. Prog. Ser. 5:103–106.
15. Fuhrman, J. A., and F. Azam. 1980. Bacterioplankton secondary productionestimates for coastal waters of British Columbia, Antarctica, and California.Appl. Environ. Microbiol. 39:1085–1095.
16. Fuhrman, J. A., and F. Azam. 1982. Thymidine incorporation as a measureof heterotrophic bacterioplankton production in marine surface waters: eval-uation and field results. Mar. Biol. 66:109–120.
17. Fukuda, R., H. Ogawa, T. Nagata, and I. Koike. 1998. Direct determinationof carbon and nitrogen contents of natural bacterial assemblages in marineenvironments. Appl. Environ. Microbiol. 64:3352–3358.
18. Gooday, G. W. 1990. The ecology of chitin degradation. Adv. Microb. Ecol.11:387–430.
19. Gooday, G. W. 1990. Physiology of microbial degradation of chitin andchitosan. Biodegradation 1:177–190.
20. Griffith, P., F. Shiah, K. Gloersen, H. W. Ducklow, and M. Fletcher. 1994.Activity and distribution of attached bacteria in Chesapeake Bay. Mar. Ecol.Prog. Ser. 108:1–10.
21. Hermansson, M., and K. C. Marshall. 1985. Utilization of surface localizedsubstrate by non-adhesive marine bacteria. Microb. Ecol. 11:91–105.
22. Humphrey, B., S. Kjelleberg, and K. C. Marshall. 1983. Responses of marinebacteria under starvation conditions at a solid-water interface. Appl. Envi-ron. Microbiol. 45:43–47.
23. Jacobsen, J. T., and F. Azam. 1984. Role of bacteria in copepod fecal pelletdecomposition: colonization, growth rates and remineralization. Bull. Mar.Sci. 35:495–502.
24. Karl, D. M., G. A. Knaur, and J. H. Martin. 1988. Downward flux ofparticulate organic matter in the ocean: a particle decomposition paradox.Nature 332:438–441.
25. Karner, M., and G. J. Herndl. 1992. Extracellular enzymatic activity andsecondary production in free-living and marine snow associated bacteria.Mar. Biol. 113:341–347.
26. Keen, N. T., S. Tamaki, D. Kobayashi, and D. Trollinger. 1988. Improvedbroad host range plasmids for DNA cloning in gram-negative bacteria. Gene70:191–197.
27. Kirchman, D. L., H. W. Ducklow, and R. Mitchell. 1982. Estimates ofbacterial growth from changes in uptake rates and biomass. Appl. Environ.Microbiol. 44:1296–1307.
28. Kogure, K., and I. Koike. 1987. Particle counter determination of bacterialbiomass in seawater. Appl. Environ. Microbiol. 53:274–277.
29. Kroer, N. 1994. Relationships between biovolume and carbon and nitrogencontent of bacterioplankton. FEMS Microbiol. Ecol. 13:217–224.
30. Lee, S., and J. A. Fuhrman. 1987. Relationships between biovolume andbiomass of naturally derived marine bacterioplankton. Appl. Environ. Mi-crobiol. 53:1298–1303.
31. Lindeburg, M. R. 1992. Fluid properties, p. 14.1–14.2. In M. R. Lindeburg
(ed.), Engineer in training reference manual, 8th ed. Professional Publica-tions, Belmont, Calif.
32. Linton, C. J., A. Sherriff, and M. R. Millar. 1999. Use of a modified Robbinsdevice to directly compare the adhesion of Staphylococcus epidermidisRP62A to surfaces. J. Appl. Microbiol. 86:194–202.
33. Marshall, K. C. 1988. Adhesion and growth of bacteria at surfaces in oligo-trophic habitats. Can. J. Microbiol. 34:503–506.
34. Marshall, K. C., R. Stout, and R. Mitchell. 1971. Selective sorption ofbacteria from seawater. Can. J. Microbiol. 17:1413–1416.
35. Montgomery, M. T., and D. L. Kirchman. 1993. Role of chitin-bindingproteins in the specific attachment of the marine bacterium Vibrio harveyi tochitin. Appl. Environ. Microbiol. 59:373–379.
36. Norland, S. 1993. The relationship between biomass and volume of bacteria,p. 303–307. In P. F. Kemp, B. F. Sherr, E. B. Sherr, and J. J. Cole (ed.),Handbook of methods in aquatic microbial ecology. Lewis Publishers, BocaRaton, Fla.
37. O’Toole, G. A., and R. Kolter. 1998. Initiation of biofilm formation inPseudomonas fluorescens WCS365 proceeds via multiple, convergent signal-ing pathways: a genetic analysis. Mol. Microbiol. 28:449–461.
38. Qin, Y. 1993. The chelating properties of chitosan fibers. J. Appl. PolymerSci. 49:727–731.
39. Raikhel, N. V., H. I. Lee, and W. F. Broekaert. 1993. Structure and functionof chitin binding proteins. Annu. Rev. Plant Mol. Biol. 44:591–615.
40. Rathke, T. D., and S. M. Hudson. 1994. Review of chitin and chitosan as fiberand film formers. J. Mater. Sci.: Rev. Macromol. Chem. Phys. C34:375–437.
41. Reimann, B., and R. T. Bell. 1990. Advances in estimating bacterial biomassand growth in aquatic systems. Arch. Hydrobiol. 25:385–402.
42. Shapiro, J. A. 1998. Thinking about bacterial populations as multicellularorganisms. Annu. Rev. Microbiol. 52:81–104.
43. Siedlecki, K. J. 1995. Interactions between the pathogenic yeast Candidaalbicans and poly(vinyl chloride), p. 33–37. M.S. thesis. Montana State Uni-versity, Bozeman.
44. Silverman, M., R. Belas, and M. Simon. 1984. Genetic control of bacterialadhesion, p. 95–107. In K. C. Marshall (ed.), Microbial adhesion and aggre-gation. Dahlein Conference, Springer-Verlag, New York, N.Y.
45. Simon, M., A. L. Alldredge, and F. Azam. 1990. Bacterial carbon dynamics onmarine snow. Mar. Ecol. Prog. Ser. 51:201–213.
46. Smith, D. C., M. Simon, A. L. Alldredge, and F. Azam. 1992. Intense hydro-lytic enzyme activity on marine aggregates and implications for rapid particledissolution. Nature 359:139–141.
47. Stretton, S., S. Techkarnjanaruk, A. M. McLennan, and A. E. Goodman.1998. Use of green fluorescent protein to tag and investigate gene expressionin marine bacteria. Appl. Environ. Microbiol. 64:2554–2559.
48. Techkarnjanaruk, S., and A. E. Goodman. 1999. Multiple genes involved inchitin degradation from the marine bacteria Pseudoalteromonas sp. strainS91. Microbiology 145:925–934.
49. Techkarnjanaruk, S., S. Pongpattanakitshote, and A. E. Goodman. 1997.Use of a promoterless lacZ gene insertion to investigate chitinase geneexpression in the marine bacterium Pseudoalteromonas sp. strain S9. Appl.Environ. Microbiol. 63:2989–2996.
50. Torrella, F., and R. Y. Morita. 1981. Microcultural study of the bacterial sizechanges and microcolony and ultramicrocolony formation by heterotrophicbacteria in seawater. Appl. Environ. Microbiol. 41:518–527.
51. Turley, C. M., and P. J. Mackie. 1994. Biogeochemical significance of at-tached and free living bacteria and the flux of particles in the NE AtlanticOcean. Mar. Ecol. Prog. Ser. 115:191–203.
52. Van Loosdrecht, M. C. M., J. Lyklema, W. Norde, and A. J. B. Zehnder.1990. Influence of interfaces on microbial activity. Microbiol. Rev. 54:75–87.
53. Vetter, Y. A., and J. W. Deming. 1999. Growth rates of marine bacterialisolates on particulate organic substrates solubilized by freely released ex-tracellular enzyme. Microb. Ecol. 37:86–94.
54. Watson, S. W., T. J. Novitsky, H. L. Quinby, and F. W. Valois. 1977. Deter-mination of bacteria number and biomass in the marine environment. Appl.Environ. Microbiol. 33:940–946.
55. Weast, R. C. 1987. CRC handbook of chemistry and physics, 68th ed., p.D-250. CRC Press, Inc., Boca Raton, Fla.
56. Yu, C., A. M. Lee, B. L. Bassler, and S. Roseman. 1991. Chitin utilization bymarine bacteria. A physiological function for bacterial adhesion to immobi-lized carbohydrates. J. Biol. Chem. 266:24260–24267.
57. Zhang, J. P., and S. Normark. 1996. Induction of gene expression in Esch-erichia coli after pilus-mediated adherence. Science 273:1234–1236.
VOL. 66, 2000 BACTERIAL FATE DURING CHITIN DEGRADATION 3585
on April 3, 2019 by guest
http://aem.asm
.org/D
ownloaded from