annexe e sociology and institutional development
TRANSCRIPT

Annexe E Sociology and Institutional Development
E - (i)
Annexe E Sociology and Institutional Development
Contents
Page
E.1 Socio-economic Survey ......................................................................................... E - 1
E.1.1 Introduction ............................................................................................. E - 1
E.1.2 Fact Findings ........................................................................................... E - 2
E.1.3 Recommendations .................................................................................... E - 7
E.2 Rapid Rural Appraisal (RRA) ............................................................................... E - 9
E.2.1 Introduction ............................................................................................. E - 9
E.2.2 Fact Findings ........................................................................................... E - 10
E.3 Project Cycle Management (PCM) ....................................................................... E - 11
E.3.1 Introduction ............................................................................................. E - 11
E.3.2 Presentation Material ............................................................................... E - 11
E.3.3 Workshop Outputs ................................................................................... E - 11
E.4 Institutional Development / Organizational Strengthening (ID/OS) ..................... E - 11
E.4.1 Introduction ............................................................................................. E - 11
E.4.2 Results - contents & basic findings............................................................ E - 12
E.4.3 Conclusion ............................................................................................... E - 16
E.5 Organizational Capacity (F/S Area) ...................................................................... E - 17
Table
Table E.5.1 Organizational Capacity (F/S Area)
Figure
Figure E.3.1 Problem Tree

E - 1
E.1 Socio-economic survey
E.1.1 Introduction
(1) Objectives of socio-economic survey
The objectives of socio-economic survey, in this context, are:
To understand the present condition of socio-economy and agricultural activity in the
communities using water from Khettara in Tafilalet area, and
To identify problems and needs of the communities for agriculture and rural development.
(2) Survey Area
The survey area is the communities using water from Khettara in Tafilalet area shown in the table below.
Survey Area
Zone Province Rural Commune No. of Khettara
No. of Community(with irrigated area using Khettara water)
Irrigated Area (ha) Population
A Errachidia Mellab, F. Soufli, Ferkia oulia, Assoul, Ait hani, Amellago, Tadighouste, Ghris soufli, Aghbalou,
71 60 1,460 31,543
B Figuig Beni-Tadjit, Bouanane, Chouater
16 12 435 7,520
C Errachidia Municipality of Boudnib
8 8 367 5,221
D Errachidia Fezna, Jorf, A.S. Gheris,
59 19 4,342 34,880
E Errachidia A.S. Ziz, Sifa 25 2 538 5,110
F Errachidia Beni-M’hamed, Sfalat, Rissani, Taouz
33 18 2,193 20,345
G Errachidia M’Cissi, Alnif, Hsia 96 61 3,412 30,750
Total 308 180 12,747 135,369
(3) Methodology
The socio-economic survey consists of four (4) components, as mentioned below.
- Collection of existing information/data on socio-economic condition and agriculture activity
- Collection of additional information/data by carrying out interview and questionnaire surveys
- Compilation and analysis of information/data, and
- Preparation of survey reports.
E - 2
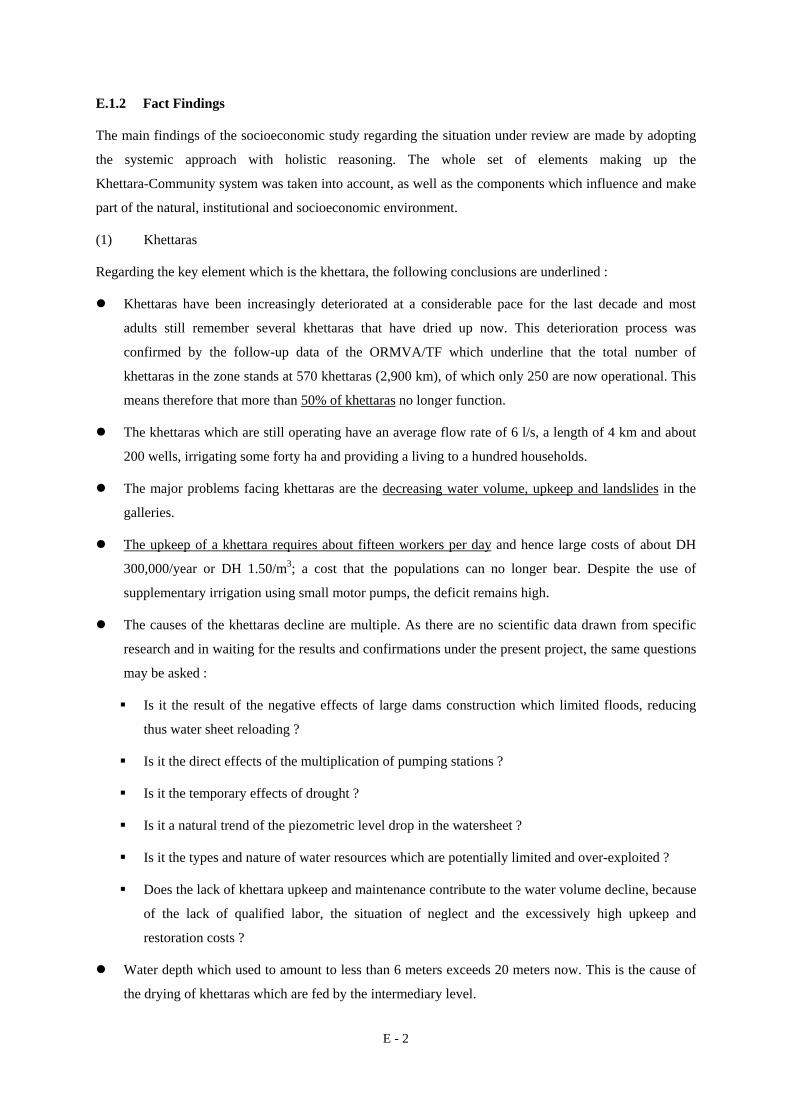
E.1.2 Fact Findings
The main findings of the socioeconomic study regarding the situation under review are made by adopting
the systemic approach with holistic reasoning. The whole set of elements making up the
Khettara-Community system was taken into account, as well as the components which influence and make
part of the natural, institutional and socioeconomic environment.
(1) Khettaras
Regarding the key element which is the khettara, the following conclusions are underlined :
Khettaras have been increasingly deteriorated at a considerable pace for the last decade and most
adults still remember several khettaras that have dried up now. This deterioration process was
confirmed by the follow-up data of the ORMVA/TF which underline that the total number of
khettaras in the zone stands at 570 khettaras (2,900 km), of which only 250 are now operational. This
means therefore that more than 50% of khettaras no longer function.
The khettaras which are still operating have an average flow rate of 6 l/s, a length of 4 km and about
200 wells, irrigating some forty ha and providing a living to a hundred households.
The major problems facing khettaras are the decreasing water volume, upkeep and landslides in the
galleries.
The upkeep of a khettara requires about fifteen workers per day and hence large costs of about DH
300,000/year or DH 1.50/m3; a cost that the populations can no longer bear. Despite the use of
supplementary irrigation using small motor pumps, the deficit remains high.
The causes of the khettaras decline are multiple. As there are no scientific data drawn from specific
research and in waiting for the results and confirmations under the present project, the same questions
may be asked :
Is it the result of the negative effects of large dams construction which limited floods, reducing
thus water sheet reloading ?
Is it the direct effects of the multiplication of pumping stations ?
Is it the temporary effects of drought ?
Is it a natural trend of the piezometric level drop in the watersheet ?
Is it the types and nature of water resources which are potentially limited and over-exploited ?
Does the lack of khettara upkeep and maintenance contribute to the water volume decline, because
of the lack of qualified labor, the situation of neglect and the excessively high upkeep and
restoration costs ?
Water depth which used to amount to less than 6 meters exceeds 20 meters now. This is the cause of
the drying of khettaras which are fed by the intermediary level.

E - 3
The rehabilitation of old oases has become a must due to both their socioeconomic role and their
environmental and strategic function in fighting :
poverty
marginalization
migration
illegal emigration
sand silting
desertification
(2) Experience in khettara rehabilitation
According to the SWOT method (Strengths, Weaknesses, Opportunities & Threats Analysis), we have
studied the rehabilitation experiences of some khettaras in the zone, using the participatory evaluation
approach.
According to this evaluation, the first lessons must be drawn in order to avoid past errors. To this end, it is
necessary to :
- Involve the populations as early as the first stage of design, in addition to implementation and upkeep;
- Design mobile elements with a bottom shaped like a reversed “U”, so as to enable their adjustment
according to the lowering of the khettara water flow;
- Enlarge the sizes of galleries to enable the passage and movements of workers during cleaning and
upkeep operations;
- Have the association of agricultural water users organized at a size and a basic scale that matches exactly
the zone of the area irrigated by each khettara separately. This is useful in that it makes it possible to
secure the commitment, involvement and participation of a homogeneous group with a shared interest
around their khettara, rather than one or two representatives per khettara gathered since the beginning
with other foreign members …
(3) Population
The population may be characterized by the three following features :
Berber-speaking populations in two-thirds of cases and Arabic-speaking population mainly in plains.
In general, the former have tribe names starting with “Ait…” (folk of…), while the names of the
latter’s tribes start with the prefix “Oulad…” (Sons of …).
Populations pertaining to various ethnic origins, namely :
The Amazigh or the tribes of the ancient nomads and warriors: Aït Atta ; Aït Marghad ; Aït
H’diddou ;…

E - 4
The Arab tribes: Arab Sabbah ;…Oulad Ghanam ; Oulad H’ssine ;… (Residents of oases and
sedentary farmers) ;
Chorfa ; Mourabitine ;… (Religious) ;
Jews; (traders and craftsmen) ;
Negroes; Hartani or former slaves who constituted the main work force during the digging and
upkeep of khettaras.
The douar as a social unit representing either the lineage or extended family, or meaning the name of a
locality that is less significant than the ksar which is the housing unit or agglomeration of gathered
houses. Besides, there are other important units, such as the irrigated perimeter which may coincide
with the name of the khettara or not. It is worth recalling that there may be various situations : a ksar
possessing several khettaras and several perimeters; one perimeter with several khettaras and several
ksars, and one khettara with several perimeters that may belong to several ksars…
The majority of heads of agricultural holdings are aged above 50. Two thirds of them are illiterate and one
third practice a related activity or a mixture of activities.
Most unschooled young boys (2 to 3 per family) leave their community and go to a city for a short duration
to seek a seasonal job opportunity. One of ten of them emigrates to a foreign country.
Agricultural work and khettara upkeep is unvalued by the youth who see their future rivaled by other
systems such as pumping stations which are affordable for families who benefit by remittances from their
relatives abroad. They are more interested in working in other cities of Morocco. The same applies to
school because of unemployment among degree holders.
The population explosion was confirmed by the official statistics (see annexes). The survey and the
participatory diagnoses revealed that even with rural migration, these regions witness an accelerated
population growth. The improvement of health conditions have reduced child mortality, while the birth
rate is maintained at levels which exceed the national average (0.3%). Accordingly, nomad and
semi-nomad populations are increasingly settling, often near oasis agglomerations.
(4) Organization, water rights & khettara management
The traditional management system of khettaras, formerly well-established through customary laws
refereed to as « water rights », provided for the distribution of the obligations to supply services.
Those entitled to or owners of the khettara water are the co-inheritors or descendants of the families who
have dug the khettara initially and whose share of water corresponds to the share of participation to the
works, depending on the size of labor involved. Others have acquired water rights by purchasing or renting
them.
E - 5
The management of this irrigation water is carried out by referring to the customary law (orf) of which the
main principles remain similar all over the zone but which show some specific features from a locality to
another.
The basic share is the nouba or turn which amounts to 12 or 24 hours. Each lineage is owner of a certain
number of turns depending on their significance and their wealth, especially the number of working arms.
Within the turn and among the co-inheritors and acquirers of water rights by purchase or rent, water is
distributed into a number of hours which generally represents a multiple of 3 hours called tagourte in
Berber or « water hand ».
The organization and management of irrigation and upkeep works are the tasks vested with the committee
made up of four members called m’zarig and chaired by the cheikh of the khettara (leader) who holds this
position for one year in general. Each basic lineage is represented by a member. A water guardian
supervises the distribution of the water turns : the beginning, the end, the duration and the succession in the
use of water for irrigation.
The participation to upkeep works is distributed according to the significance of water hours possessed by
each owner of the khettara water. It is made in kind by contributing a number of « arms » to the works and
by providing a weekly money contribution.
This law and organization is respected by the parties involved under the supervision of the khettara leader
(cheikh). Any violation or breach is redressed by a penalty determined according to the extent of the
breach (n’zoul or n’saf meaning « sentence » or « justice »).
Khettaras are more than just a technique for water acquisition. Their importance is social, cultural and
economic, all at the same time. The ksar populations grant a sacred value to khettaras, comparable to that
of koranic schools, religious brotherhoods and mosques. The destruction of a khettara or profanation is
unacceptable.
Social relations are heavily marked by the relations with this resource : water owners, non-owners and
users. The economic role of khettaras is a vital one.
The distribution of khettara water is subject to a number of traditions and customary laws. It is sold and
bought. It is subject to accurate and delicate measures entrusted with specialists (keyyal el-ma, el hassab,
chouhoud [respectively water harvester, appraiser, witnesses]). It has its own instruments, measurement
units and archives (zemam el Khttatiter). Vocabulary is rich with technical, legal and agronomic terms
related to khettaras. All this socio-cultural heritage, subject to the pride of oasis societies, is disappearing
along with the technique of khettaras.
This technique is indeed efficient but its social cost is a high one. It is based on the exploitation of a servile
and hard labor. It is also fragile : landslides, harms caused by floods, the decrease in water volume… The
system of water allotment is very complex and causes losses in the network. Water is very coveted and
causes conflicts.
E - 6
(5) Land ownership patterns
The most important land ownership pattern is the melk. This status which originates from the Moslem law
corresponds to the private property in Roman law with only the two first levels which are fructus, usus but
not the third one abusus. This means that the owner posses the right of use, selling and inheritance but can
never abuse, i.e. not to destroy the resource of which the true owner is God while man is only the person
who should look after its good exploitation and sustainability, its reproduction and development in general.
Land plots irrigated with lasting waters have generally the melk status. Water can be associated or the
property may be separated from the land ownership, as well as the ownership of palm trees.
The registration of the melk rights is traditionally carried out in documents by a notary of Moslem law or
recognized and preserved according to the customary law with an oral deed based on the testimony of
twelve men.
The lands which are not irrigated in a perennial way but only through floods spreading two to three times
per season are generally part of collective lands depending on the work capacity of each household.
Owned irrigated and exploited lands amount to an average of 0.8 ha with a margin that ranges from a few
square meters to some hectares. The non-irrigated area may be two to three times larger.
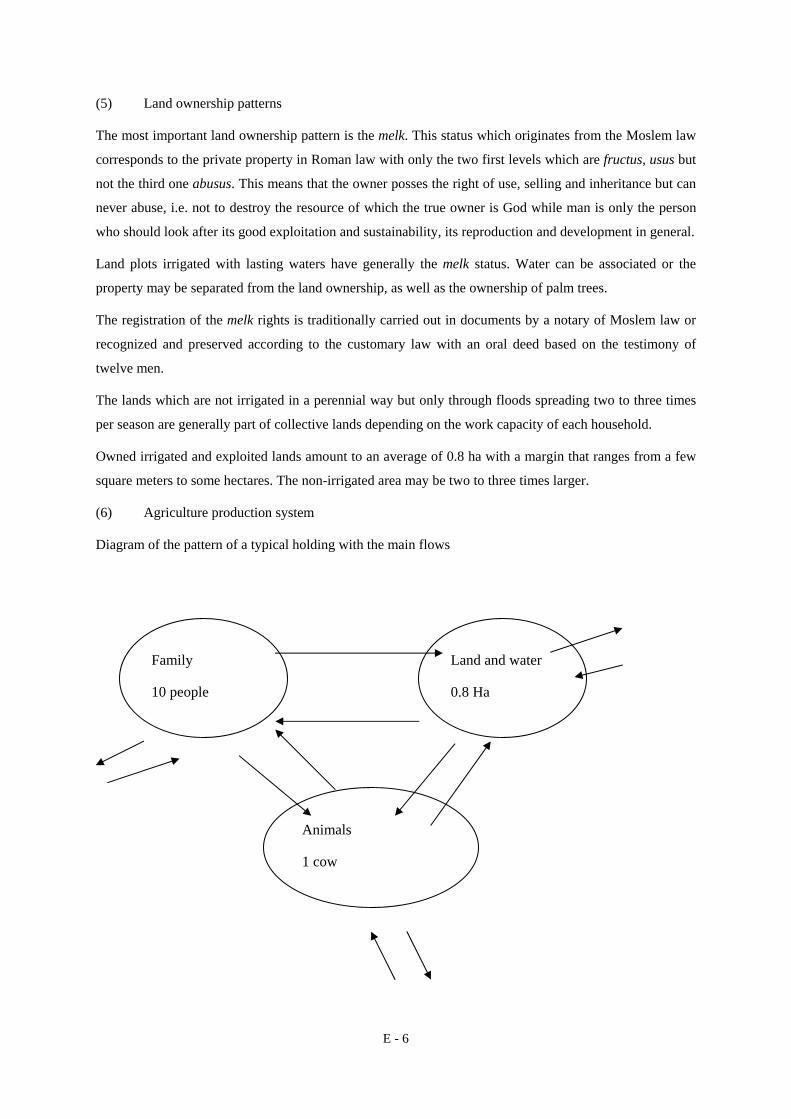
(6) Agriculture production system
Diagram of the pattern of a typical holding with the main flows
Family
10 people
Land and water
0.8 Ha
Animals
1 cow
E - 7
(7) Marketing and supplies purchasing
The three main functions of the market which are marketing, procurement and employment show a
malfunction which hampers any economic dynamics. Among the main constraints identified during the
study, it is worth mentioning the following :
Difficulties of access and land locking ;
Lack of transportation means ;
Lack of organization of producers/sellers ;
Negligence with respect to quality ;
Lack of packaging and storage facilities ;
Lack of capital ;
Lack of opportunities and dynamics ;
Low level of promoting local and regional specific features (biological agriculture; agritourism ;
label ; fairs ; exhibitions ; advertisement campaign ; information ; social mobilization;…)
E.1.3 Recommendations
Working out priority eligibility criteria for khettara rehabilitation by integrating socioeconomic
criteria, based on the indicators of the situation described under the present study. Among such
criteria, it is worth mentioning the following :
• The significance of water volume evolution ;
• The size of the area irrigated by the waters of khettaras essentially ;
• The number of beneficiaries of the khettara waters ;
• The use of khettara waters, besides irrigation, for purposes of human and animal drinking ;
• The non existence of other irrigation systems ;
• The dynamism and operation of traditional irrigation management organizations ;
• The willingness to contribute to the costs : investment and rehabilitation works ;
• The willingness to set up water users associations locally and networks thereof regionally ;
• The commitment and involvement for upkeep, the handling of management of the implemented
works and equipments.
Integrating other community development and supportive measures in order to succeed the
revitalization of the community life around the rehabilitation of khettaras, through the following :

E - 8
• Actions regarding women’s development by attempting to meet their needs and practical
problems with the view to improve their material conditions, especially the promotion of
activities likely to better their socioeconomic situation through empowerment;
• Integrating other categories of people who do not benefit directly from khettara waters but who
have other interests related to the development of community life, such as the category of young
unemployed people. Other measures in this respect may include the setting up of associations, the
training of youth, access to micro-credit for the promotion of other production activities,
para-agricultural trade and agritourism (cooperatives for the genetic improvement of the Daman
sheep species, bee-keeping cooperatives, cottage industry cooperatives, self-catering cottages in
oases, cooperatives for inputs procurement, product packaging cooperatives, transportation
cooperatives, equipment maintenance cooperatives, rural facilitation and assistance cooperatives,
literacy, agro-industrial sub-contracting for oil, mills, textile…).
Regarding the facilities and khettara rehabilitation, it is advisable to take into account the failures and
successes of previous experiences and to draw lessons by :
• Involving the population in the early stages of problems identification, using the participatory
diagnosis approach;
• Promoting the water users associations per khettara and subsequently encouraging the networking
of such associations into a regional federation;
• Taking into account, regarding development works, the size of galleries needed for upkeep works
and the possibility of adjusting to change and lowering the level from upstream toward
downstream;
• Setting up groups of young people and promoting qualified work in the area of khettara upkeep,
as well as subsidized enterprises for related works such as digging, construction of wells,
cleaning, coating of seguias…
Concerning the institutional framework and water rights, customary laws must be reviewed and
negotiations should be supported by involving and mobilizing officials and representatives as valid
interlocutors for the amendment of the said laws and rights governing the exploitation and
management of khettara waters and their environment :
• Negotiate and manage conflicts arising between neighboring communities in order to consider the
possibility of digging wells at the lateral level and upstream;
• Ban the digging of boreholes and pumping stations within the feeding and drainage area of
khettaras (locally, it is admitted that the influence radius be about 50 to 100 meters, but studies in
Algeria have proved that the influence aureole has a radius of about 500 m ;
Harmonize the deepening of wells located within the same zone of influence in order to avoid the race to
deepening which may cause the drainage of the neighboring khettaras water (see the case of the Siffa
E - 9
khettara).
E.2 Rapid Rural Appraisal (RRA)
E.2.1 Introduction
(1) Objective
The objective of RRA is to understand actual life style and social system in a village using Khettara. Main
issues be observed are as follows.
- Daily life of people and seasonal change
- Movement of people
- Main actors in a village and their relations
- Gender difference
(2) Method
RRA is a survey method which is applied to collect general information on life style of people and also
social system in a village (usually in a short time period). The priority is given to observe reality of people
rather than collect detailed data or information. It is composed of several different tools including
interviews and group works (drawing chart, diagram, etc.). Several tools are selected and used according to
the survey objectives.
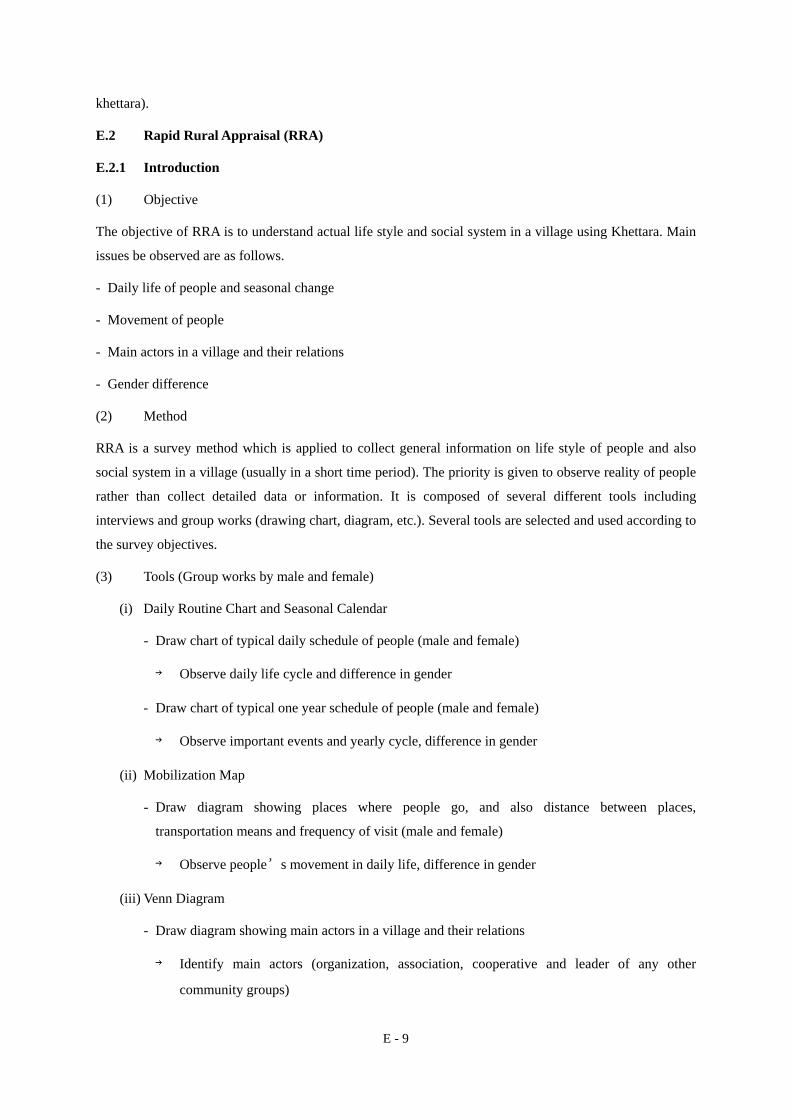
(3) Tools (Group works by male and female)
(i) Daily Routine Chart and Seasonal Calendar
- Draw chart of typical daily schedule of people (male and female)
→ Observe daily life cycle and difference in gender
- Draw chart of typical one year schedule of people (male and female)
→ Observe important events and yearly cycle, difference in gender
(ii) Mobilization Map
- Draw diagram showing places where people go, and also distance between places,
transportation means and frequency of visit (male and female)
→ Observe people’s movement in daily life, difference in gender
(iii) Venn Diagram
- Draw diagram showing main actors in a village and their relations
→ Identify main actors (organization, association, cooperative and leader of any other
community groups)

E - 10
(iv) Discussion with participants with using above mentioned outputs
- Different roles by gender
- Decision making process (in a village and at home)
(4) Place
Kssar : Tizougaghine – Commune rurale : Ferkla Essouflia
E.2.2 Fact Findings
Following gender difference is observed in the outputs (Daily Routine, Seasonal Calendar, Mobilization
Map) of RRA in Tizougaghine Village.
(1) Daily Routine
- Men are mainly engaged in agriculture works and livestock feeding
- Women are engaged in various works including preparation of meals, cleaning of house, laundry,
drawing water, collecting of firewood, adult education etc., and burden of agriculture work is
less than that of men.
(2) Seasonal Calendar
- Women made very simple Seasonal Calendar concerning agriculture activity and festival as
important events.
- Men made Seasonal Calendar with more activities such as maintenance work of khettara,
seasonal work in a big city and schooling.
- Women also pointed out that wool spinning is one of the important activity in summer.
(3) Mobilization Map
- Biggest difference between men and women in Mobilization Map is seasonal work in big city
for men.
- Both men and women go to town nearby (Tinejdad) for souk, post office, hospital, etc., but
frequency of visit is less for women since women usually need permission from her husband to
go out and visit town.
- Men draw school in Tinejdad but women did not include this on the map. According to a
hearing at primary school in a village, no women go to secondary school in Tinejdad because of
the far distance.
(4) Other information obtained by interview to women
- Women can only go out from home when husband allows.
- Parents usually decide husband for daughter and daughter cannot make any objection.

E - 11
- Only men have a right to use money.
→ Women usually think present condition is a little sad but basically accept it, since it is the
tradition and normal in the village.
E.3 Project Cycle Management (PCM) Workshop
E.3.1 Introduction
In cooperation with ORMVA/TF, JICA Study Team held Project Cycle Management (PCM) seminar and
workshop in order to facilitate understanding on the technique.
(1) What is PCM?
PCM (Project Cycle Management) is a
project management method developed by
USAID (U.S.A), GTZ (German) and
FASID (Japan). It is composed with three
component, “Participatory Planning”,
“Implementation”, and “Evaluation”.
PCM uses Project Design Matrix (PDM)
as a core tool for continuous project
management.
(2) Participants for the seminar and workshop
Counter part of JICA Study Team:
Mr. Mohammed HARRAS, Mr. Hssain RAHAOUI, Mr. Moulay Lhssan SOSSEY, Mr. Mohamed SAADA,
Ms. Bouchra MOUMEN, Mr. Hassan MAAROUF, Mr. Abdeslam KHARDI, Mr. Ali OUBERHOU, Ms.
Zahra AIT BELLA, Mr. Brahim AAKOUB.
E.3.2 Presentation Material
See Databook (PowerPoint file).
E.3.3 Workshop Outputs
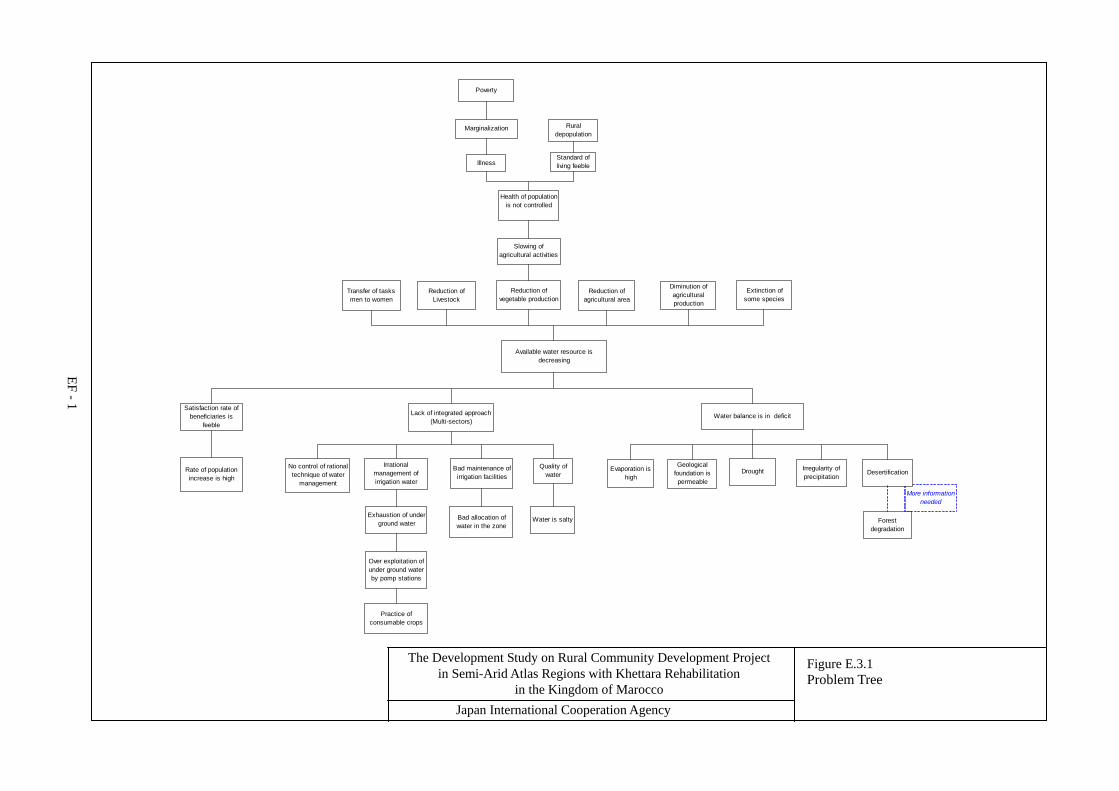
Participants discussed and prepared “Problem Tree” on Khettara village as an output of the workshop.
Problem Tree prepared by participants is attached hereinafter (See Figure E.3.1).
E.4 Institutional Development/ Organizational Strengthening (ID/OS)
E.4.1 Introduction
The ID/OS workshop was organized on 19-20 February 2004, with the participation of 15 members of
ParticipatoryPlanning
ImplementationEvaluation
PDM
E - 12
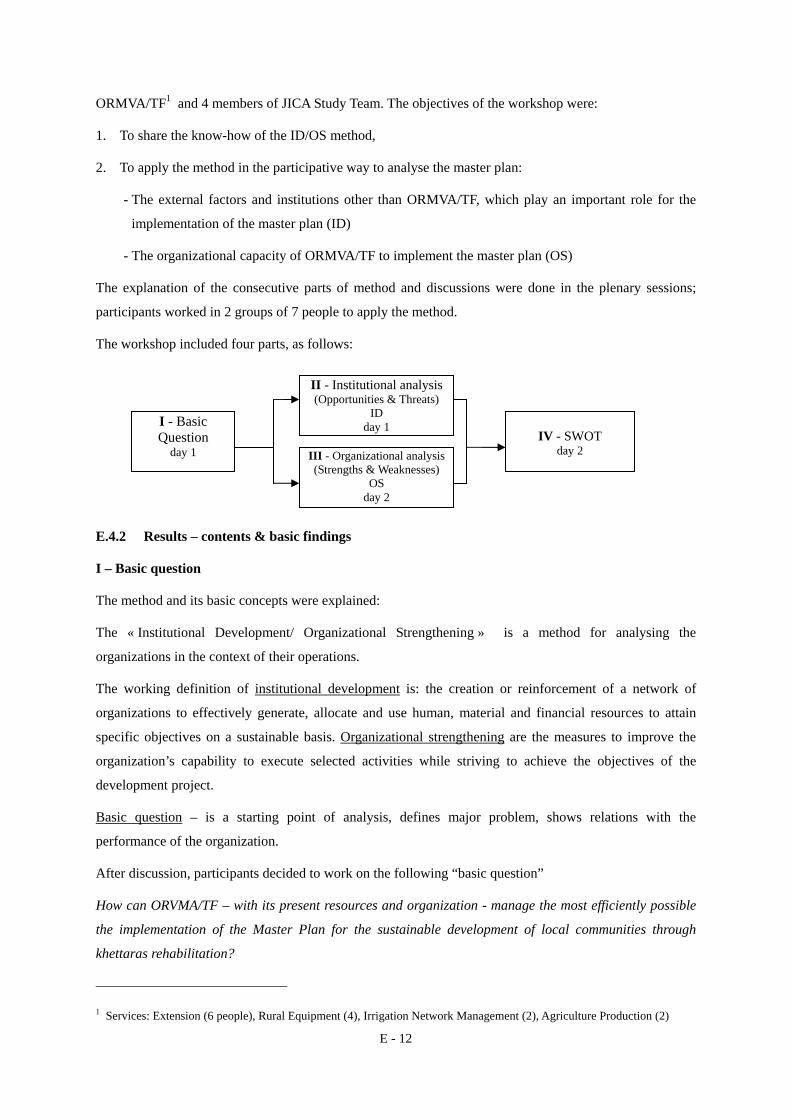
ORMVA/TF1 and 4 members of JICA Study Team. The objectives of the workshop were:
1. To share the know-how of the ID/OS method,
2. To apply the method in the participative way to analyse the master plan:
- The external factors and institutions other than ORMVA/TF, which play an important role for the
implementation of the master plan (ID)
- The organizational capacity of ORMVA/TF to implement the master plan (OS)
The explanation of the consecutive parts of method and discussions were done in the plenary sessions;
participants worked in 2 groups of 7 people to apply the method.
The workshop included four parts, as follows:
E.4.2 Results – contents & basic findings
I – Basic question
The method and its basic concepts were explained:
The « Institutional Development/ Organizational Strengthening » is a method for analysing the
organizations in the context of their operations.
The working definition of institutional development is: the creation or reinforcement of a network of
organizations to effectively generate, allocate and use human, material and financial resources to attain
specific objectives on a sustainable basis. Organizational strengthening are the measures to improve the
organization’s capability to execute selected activities while striving to achieve the objectives of the
development project.
Basic question – is a starting point of analysis, defines major problem, shows relations with the
performance of the organization.
After discussion, participants decided to work on the following “basic question”
How can ORVMA/TF – with its present resources and organization - manage the most efficiently possible
the implementation of the Master Plan for the sustainable development of local communities through
khettaras rehabilitation?
1 Services: Extension (6 people), Rural Equipment (4), Irrigation Network Management (2), Agriculture Production (2)
II - Institutional analysis (Opportunities & Threats)
ID day 1
III - Organizational analysis (Strengths & Weaknesses)
OS day 2
IV - SWOT
day 2
I - Basic Question
day 1
E - 13
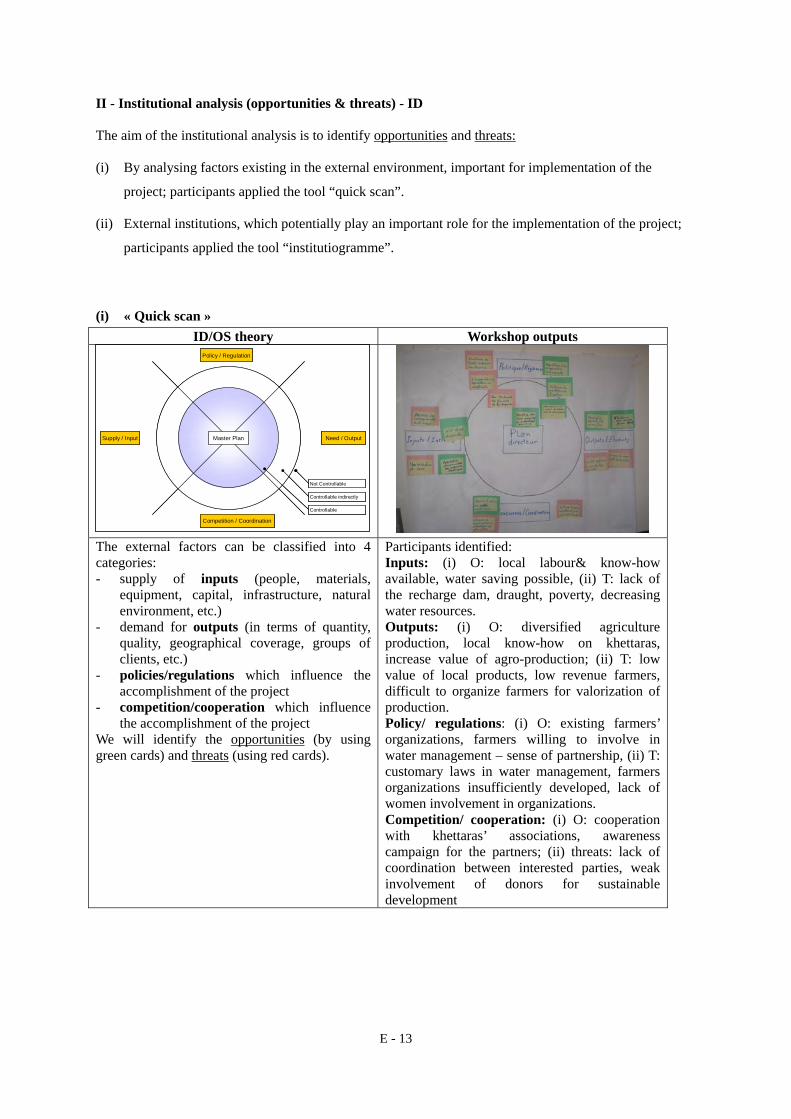
II - Institutional analysis (opportunities & threats) - ID
The aim of the institutional analysis is to identify opportunities and threats:
(i) By analysing factors existing in the external environment, important for implementation of the
project; participants applied the tool “quick scan”.
(ii) External institutions, which potentially play an important role for the implementation of the project;
participants applied the tool “institutiogramme”.
(i) « Quick scan » ID/OS theory Workshop outputs
The external factors can be classified into 4 categories: - supply of inputs (people, materials,
equipment, capital, infrastructure, natural environment, etc.)
- demand for outputs (in terms of quantity, quality, geographical coverage, groups of clients, etc.)
- policies/regulations which influence the accomplishment of the project
- competition/cooperation which influence the accomplishment of the project
We will identify the opportunities (by using green cards) and threats (using red cards).
Participants identified: Inputs: (i) O: local labour& know-how available, water saving possible, (ii) T: lack of the recharge dam, draught, poverty, decreasing water resources. Outputs: (i) O: diversified agriculture production, local know-how on khettaras, increase value of agro-production; (ii) T: low value of local products, low revenue farmers, difficult to organize farmers for valorization of production. Policy/ regulations: (i) O: existing farmers’ organizations, farmers willing to involve in water management – sense of partnership, (ii) T: customary laws in water management, farmers organizations insufficiently developed, lack of women involvement in organizations. Competition/ cooperation: (i) O: cooperation with khettaras’ associations, awareness campaign for the partners; (ii) threats: lack of coordination between interested parties, weak involvement of donors for sustainable development
Need / Output
Policy / Regulation
Competition / Coordination
Master PlanSupply / Input
Not Controllable
Controllable indirectly
Controllable
Need / Output
Policy / Regulation
Competition / Coordination
Master PlanSupply / Input
Not Controllable
Controllable indirectly
Controllable
E - 14
(ii) Institutiogramme ID/OS theory Workshop outputs
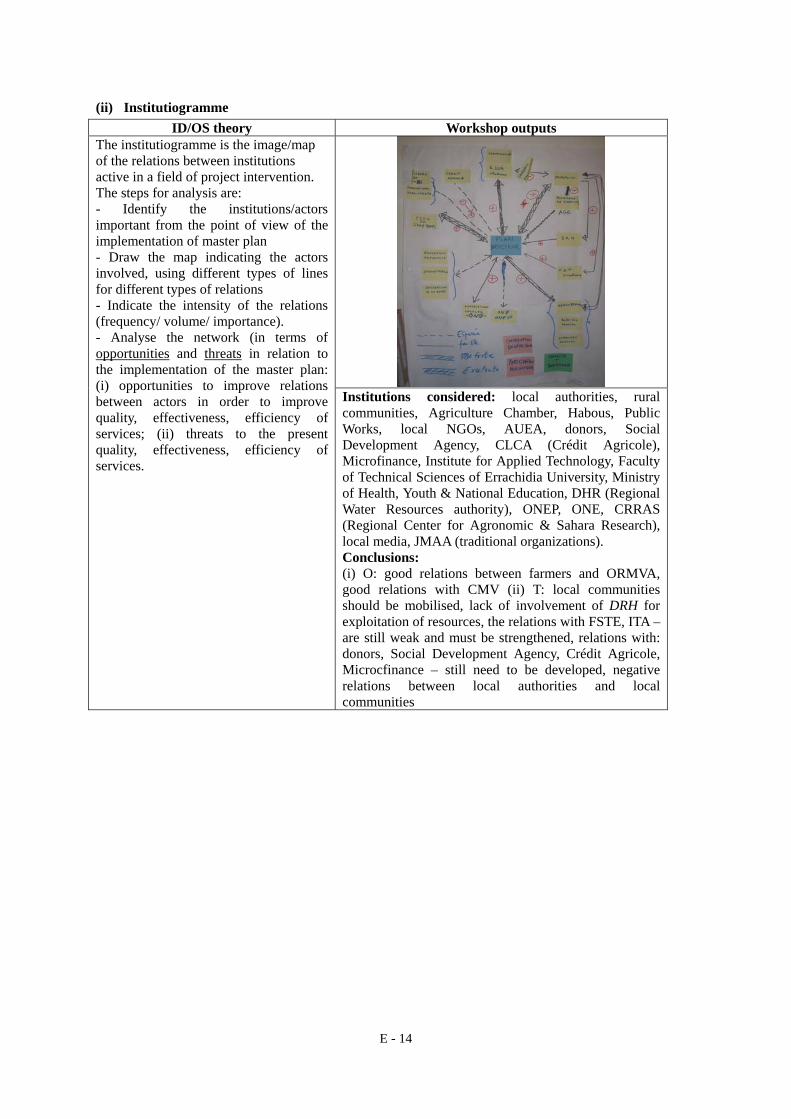
The institutiogramme is the image/map of the relations between institutions active in a field of project intervention. The steps for analysis are: - Identify the institutions/actors important from the point of view of the implementation of master plan - Draw the map indicating the actors involved, using different types of lines for different types of relations - Indicate the intensity of the relations (frequency/ volume/ importance). - Analyse the network (in terms of opportunities and threats in relation to the implementation of the master plan: (i) opportunities to improve relations between actors in order to improve quality, effectiveness, efficiency of services; (ii) threats to the present quality, effectiveness, efficiency of services.
Institutions considered: local authorities, rural communities, Agriculture Chamber, Habous, Public Works, local NGOs, AUEA, donors, Social Development Agency, CLCA (Crédit Agricole), Microfinance, Institute for Applied Technology, Faculty of Technical Sciences of Errachidia University, Ministry of Health, Youth & National Education, DHR (Regional Water Resources authority), ONEP, ONE, CRRAS (Regional Center for Agronomic & Sahara Research), local media, JMAA (traditional organizations). Conclusions: (i) O: good relations between farmers and ORMVA, good relations with CMV (ii) T: local communities should be mobilised, lack of involvement of DRH for exploitation of resources, the relations with FSTE, ITA – are still weak and must be strengthened, relations with: donors, Social Development Agency, Crédit Agricole, Microcfinance – still need to be developed, negative relations between local authorities and local communities
E - 15
III - Organizational Analysis (strengths & weaknesses) - OS
The organizational analysis concentrates on identifying strengths and weaknesses of the organization
actually implementing the project.
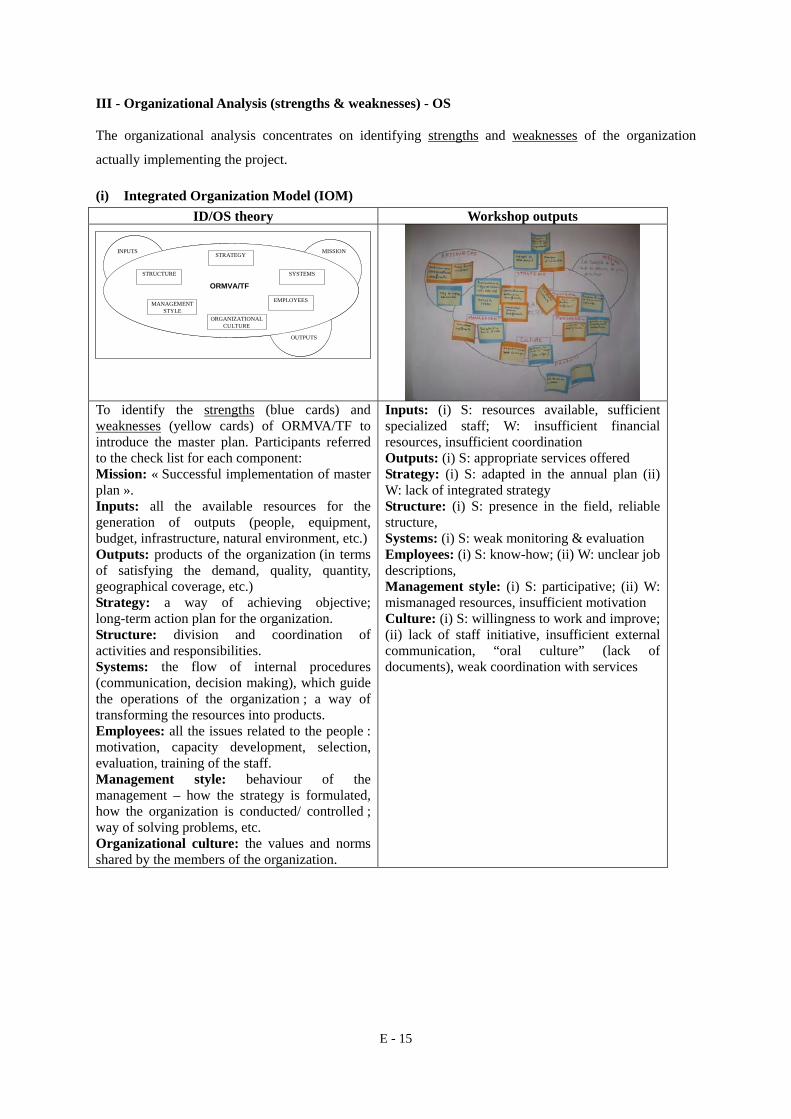
(i) Integrated Organization Model (IOM) ID/OS theory Workshop outputs
To identify the strengths (blue cards) and weaknesses (yellow cards) of ORMVA/TF to introduce the master plan. Participants referred to the check list for each component: Mission: « Successful implementation of master plan ». Inputs: all the available resources for the generation of outputs (people, equipment, budget, infrastructure, natural environment, etc.)Outputs: products of the organization (in terms of satisfying the demand, quality, quantity, geographical coverage, etc.) Strategy: a way of achieving objective; long-term action plan for the organization. Structure: division and coordination of activities and responsibilities. Systems: the flow of internal procedures (communication, decision making), which guide the operations of the organization ; a way of transforming the resources into products. Employees: all the issues related to the people : motivation, capacity development, selection, evaluation, training of the staff. Management style: behaviour of the management – how the strategy is formulated, how the organization is conducted/ controlled ; way of solving problems, etc. Organizational culture: the values and norms shared by the members of the organization.
Inputs: (i) S: resources available, sufficient specialized staff; W: insufficient financial resources, insufficient coordination Outputs: (i) S: appropriate services offered Strategy: (i) S: adapted in the annual plan (ii) W: lack of integrated strategy Structure: (i) S: presence in the field, reliable structure, Systems: (i) S: weak monitoring & evaluation Employees: (i) S: know-how; (ii) W: unclear job descriptions, Management style: (i) S: participative; (ii) W: mismanaged resources, insufficient motivation Culture: (i) S: willingness to work and improve; (ii) lack of staff initiative, insufficient external communication, “oral culture” (lack of documents), weak coordination with services
STRUCTURE
STRATEGY
SYSTEMS
MANAGEMENT STYLE
EMPLOYEES
MISSIONINPUTS
OUTPUTS
ORGANIZATIONAL CULTURE
ORMVA/TFSTRUCTURE
STRATEGY
SYSTEMS
MANAGEMENT STYLE
EMPLOYEES
MISSIONINPUTS
OUTPUTS
ORGANIZATIONAL CULTURE
ORMVA/TF

E - 16
IV – SWOT
ID/OS theory Workshop outputs
Referring to the (I) basic question, (II) institutional analysis, and (III) organizational analysis participants select three most important: opportunities, threats, strengths and weaknesses, and fill in the SWOT matrix. Than, analyse using following criteria: - Can this strength help to use the opportunity
or fight the threat; - Can this weakness hamper the use of
opportunity or make the threat more serious.
S: (1) strong organization in the field (CMV) and know-how, good reputation, group spirit// (2) good organization structure, know-how of employees, available resources W: (1) lack of financial resources, lack of coordination and weak planning, lack of monitoring & evaluation system// (2) lack of integrated strategy, bad distribution of tasks, mismanaged resources. O: (1) Diversified agriculture production, existing traditional organizations, existing formal associations// (2) good relations ORMVA-beneficiaries, farmers organizations, possibility for valorization of production T: (1) Scarce water resources, weak coordination and involvement of donors, weak involvement of people (weak revenue, life standards)// (2) draught, financing, poverty.
E.4.3 Conclusion
From the SWOT analysis the participants drew following conclusions for institutional
development/organizational strengthening:
(1) Through utilizing ORMVA/TF’s competences and reputation – to mobilize the civil society (with
different forms of organizations) and to sustain the diversification of agriculture production in order to
overcome existing threats and consolidate implementation of master plan for khettaras rehabilitation.
(2) ORMVA must develop integrated strategy.
(3) ORMVA must capitalize its know-how, optimize the use of available resources through better
tasks/job-descriptions.
(4) Necessity for better management of scarce resources (water in particular) in the region.
(5) Necessity to attract donors for the improvement of farmers’ income.
It must be stressed that the main aim of the workshop was to transfer the know-how on the method –
therefore the time for and the quality of analysis were naturally limited.
3
2
1
WEAKNESSES
3
2
1
STRENGTHS
321321
THREATSOPPORTUNITIES
3
2
1
WEAKNESSES
3
2
1
STRENGTHS
321321
THREATSOPPORTUNITIES
E - 17
According to the evaluation questioners – the participants found the method of ID/OS useful for their work,
simple and effective, and appreciated participative “learning by doing” approach. They appreciated
opportunity for the debate and exchange of ideas in the structured and logical way.
The participants judged all the introduced tools of ID/OS method as useful – and mostly appreciated the
IOM, regarding it as a means to improve the management of the organization.
Most expressed the interest in organizing the ID/OS workshop for the analytic purpose – but suggested
inviting the participants from other parts of the organization (not only Study Team counterparts).2
E.5 Organizational Capacity (F/S Area)
See Table E.5.1
2 Detailed materials on ID/OS were transferred to one person, who might eventually take a role of facilitator for the internal workshops for ORMVA/TF

Tables


Figures
EF - 1
The Development Study on Rural Community Development Project in Semi-Arid Atlas Regions with Khettara Rehabilitation
in the Kingdom of Marocco Japan International Cooperation Agency
Figure E.3.1 Problem Tree
Ruraldepopulation
Marginalization
Standard ofliving feeble
Health of populationis not controlled
Illness
Slowing ofagricultural activities
Diminution ofagriculturalproduction
Extinction ofsome species
Reduction ofagricultural area
Available water resource isdecreasing
Irregularity ofprecipitation
DroughtGeological
foundation ispermeable
Water balance is in deficit
More informationneeded
Desertification
Forestdegradation
Reduction ofvegetable production
Reduction ofLivestock
Transfer of tasksmen to women
Evaporation ishigh
Quality ofwater
Bad maintenance ofirrigation facilities
Irrationalmanagement ofirrigation water
No control of rationaltechnique of water
management
Rate of populationincrease is high
Satisfaction rate ofbeneficiaries is
feeble
Lack of integrated approach(Multi-sectors)
Exhaustion of underground water
Bad allocation ofwater in the zone
Water is salty
Over exploitation ofunder ground waterby pomp stations
Practice ofconsumable crops
Poverty

Annexe F Rural Infrastructures

F - (i)
Annexe F Rural Infrastructures
Contents
Page F.1 Administration of ORMVA/TF......................................................................................... F - 1 F.2 Roads ............................................................................................................................... F - 2 F.3 Water Supply .................................................................................................................... F - 2 F.4 Electric Power Supply ...................................................................................................... F - 5 F.5 Telecommunications ......................................................................................................... F - 6 F.6 Facilities for Health and Hygiene ..................................................................................... F - 6 F.7 Education .......................................................................................................................... F - 7
Tables Table F.1.1 Socio Data (Summary of Whole Study Area) Table F.1.2 Socio Data (Summary of Khettara Zone) Table F.1.3 Socio Data (Summary of Communes excluding Khettara Zone) Table F.1.4 Socio Data (Summary of Municipalities excluding Khettara Zone) Table F.1.5 Socio Data (By Khettara Zoning) Table F.1.6 Socio Data (Municipality excluding Khettara Zone) Table F.1.7 Socio Data (Communes excluding Khettara Zone) Table F.2.1 List of National and Regional Roads in Errachidia Province Table F.3.1 Present Situation of Potable Water Supply in the Province of Errachidia Table F.4.1 Electric Power Supply Table F.6.1 Sanitary Infrastructures and Projects in the Province of Errachidia Table F.7.1 Socio-Data (Preliminary School) Table F.7.2 Secondary and High Schools Table F.7.3 Proportion of Students
Figures Figure F.1.1 Jurisdictional Boundary of the ORMVA/TF Figure F.2.1 Road Network in Errachidia Figure F.3.1 Water Supply Network

F - 1
F.1 Administration of ORMVA/TF
Administrative jurisdiction of the ORMVA/TF is as follows:
Administrative jurisdiction of the ORMVA/TF
Province Cercle Municipality Rural Commune Sub-Division/ CMV of ORMVA/TF
Goulmima - Melaab, Ferkla Soufla, Ferkla El Oulia, Tadighoust, Gheris Essoufli, Aghbalou N’Kerdous
Sub-Division: Goulmima CMV: 704 712 713 720 720 722
Errachidia
Assoul - Assoul, Ait Hani, Amellagou CMV: 714
Figuig Beni-Tadjit - Beni-Tadjit, Bouanane, Ain Chouater
Sub-Division: Beni Tadjit CMV: 707 710 709
Errachidia - Boudenib -
Sub-Division: Errachidia CMV: 702 706 711 719
Errachidia Erfoud Jorf Fezna, Arab Sebbah Gheris Sifa, Arab Sebbah Ziz Alnif, M’ssici, H’ssyia
Sub-Division: Erfoud CMV: 703 705 716 717 718 (Alnif)
Errachidia Rissani - Rissani, Essfalat, Bni M’Hamed Sijilmassa, Taouz
Errachidia Imilchil CMV: 715
Errachidia Rich
Sub-Division: Rich CMV: 701 708 721
The jurisdictional boundary mentioned above is shown on Figure F.1.1. Socio data, such as population,
education, economic parameter (type of economic activity, unemployment rate) are tabulated in Table F.1.1
to F.1.7, with drawing a clear distinction between khettara zone and others.

F - 2
F.2 Roads
The Ministry of Equipment and Transports is mainly responsible for the road construction and
maintenance in the country.
The Rural Roads Project for Morocco aims to increase rural populations' access to roads, especially in the
more disadvantaged provinces, by supporting a national program of road improvements and through
strengthening institutional capacity. The two components of this project are: (1) rehabilitation and/or
upgrading of about 625 kilometers of rural roads, and (2) institutional development to: (a) develop
monitoring and evaluation (M&E) of accessibility targets and execution of the Second National Program of
Rural Roads (and roads improved outside this program) at the provincial and communal level, and
disseminate the M&E information to further sectoral integration of rural development programs and
strengthen local participation; (b) formulate recommendations for improving management of local rural
roads to help the communes and provinces prepare to take over their maintenance; and (c) strengthen the
capabilities of the Directorate of Roads for social and environmental assessments. This component will
also include identification by the Provincial Directorates of Public Works (DPEs) together with specialized
agencies, of local development opportunities stemming from improved accessibility, and assistance to the
local communities.
Morocco extended rural roads network to reach 9,276 km in 2004, comprising of construction of 5,209 km
and revamped 4,067 km of rural roads as part of the National Program of Rural Roads (PNRR). The
following are the road inventiory in the Province of Errachidia:
Road Inventory in the Province of Errachidia
Total lemgth Paved road
(%)
Feeder road
(%)
National roads 593.9 km 534.9 km
(90 %)
59.0 km
(10 %)
Provincial roads 491.3 km 306.8 km
(62 %)
184.5 km
(38 %)
Rural roads 802.0 km 78.2 km
(10 %)
723.8 km
(90 %)
Source: Information from Delegation de l'équippement, Errachidia
Road network in and around the Province of Errachidia is enumerated in Table F.2.1 and illustrated in
Figure F.2.1.
F.3 Water Supply
The ONEP is responsible for potable water supply in the Province of Errachidia. At present, the ONEP
supplies water to 13 villages, Errachidia, Erfoud, Goulmima, Rich, Rissani, El Kheng, Aoufous, Tinejdad,
Jorf, Boudenib, Gourrama, ksars located at the Ziz valley and the Tafilalet plain. Total service population

F - 3
is about 400,000 in which about 180,000 has water supply service through common faucets. The service
covers all urban areas in which 84 % is individual service connection and remaining 16 % is through
common faucets. In the rural areas, the service area has extended to 83 % in the Province of Errachidia.
More than 280 ksars have a service by the ONEP, in which 20 % is individual service connection and
remaining 80 % is through common faucets.
Service Area for Potable Water Supply
Service areas Administrations Commune rurals
Connection in urban areas
(Population 153,725 habitants in 1994)
ONEP Errachidia - Erfoud - Goulmima
Administrative center
Rich - Jorf - Boudenib - Tinejdad and My Ali Chérif
Connection in rural areas
(Population 194,862 habitants in 1994)
ONEP Ziz valley (Commune rural: Aoufous - Errteb - M'daghra - LKheng)
Tafilalet plain (Commune rural: Essfalet - Essifa - Beni M'hamed Sijilmassa, Aârab Sebbah Ziz - Aârab Sebbah Ghriss)
Goulmima (Commune rural: Ghriss Ouloui, Ghriss Essoufli
Administrative center
Ksars: El Kheng - Gourrama - Aoufous (center)
Tinejdad (Commune rural: Ferkla Oulia, Ferkla Essoufla, Mellaab)
Tadighoust
Jorf (Commune rural: Fezna)
Merzouga (Commune rural: Ettaous)
Boudenib (Commune rural: Oued Naâm)
Source: ONEP (Errachidia province)
In the frame work for the water resources development, various governmental agencies have intervened for
the potable water supply scheme, such as the DGH (Direction Générale de l'Hydraulique), the ONEP
(office National de l'Eau Potable).
The water supply network has significantly extended during the period of 1985 to 2001 in the Errachidia
province. The total amount of the investment was 430 MDH with 146 MDH during 2000 to 2001. The
following two large scale projects were realized in the recent decade:
First project: Pilot project in the national level, potable water supply for the urban and rural areas,
Errachidia, Erfoud, Aoufous, Rissani and neighboring villages. Total investment cost
was 180 MDH from 1985 to 1989 by financial assistance of the IBRD1 and PNUD2.
1 IBRD (International Bank for Reconstruction and Development) 2 PNUD (Programme des National Unies pour ke Developpment)

F - 4
1 st phase: AEP3 (PWS) of Errachidia and Erfoud (operated in 1985)
- Two (2) well sites in the Hassan Addakhil dam with yield of 200 lit/sec.
- Installation of 78 km pipe line
- Reservoir construction (Storage volume: 5,000 m3)
2 nd phase: AEP (PWS) of Rissani from the reservoir of Erfoud (operated in 1987)
- Installation of 21 km pipe line
- Reservoir construction (Storage volume: 5,000 m3)
3 rd phase: Connection to 237 villages (operated in 1989)
- Installation of 190 km channeling
- Construction of 6 reservoirs (Volume: 200 m3 each)
- Construction of 205 public faucets
Second project: Water supply for Goulmima, Tinejdad and neighboring villages. Total amount of 75
MDH financed by the Europian Union and KFW4 from 1993 to 2001.
1 st phase: AEP (PWS) of Goulmima (operated in 1993)
- One (1) well site with yield of 50 lit/sec.
- Installation of 18.5 km pipe line
- Construction of two (2) reservoirs (Storage volume: 500 m3 and 1,000 m3)
2 nd phase: AEP (PWS) of Tinejdad (operated in 1996)
- One (1) well site with yield of 30 lit/sec.
- Installation of 20 km pipeline
- Construction of one (1) reservoir (Storage volume: 2,000 m3 (50% completion))
3 rd phase: AEP (PWS) population of 44 ksars in rural and riverside zone of Goulmima and Tinejdad
(operated in 2001)
- Installation of 90 km pipeline
- Construction of two (2) reservoirs (Storage volume: 2,000 m3 (completion) and 120 m3 )
In addition to the above, some rehabilitation projects were launched during 1990s in Rich, Goulmima,
Tinejdad as well as an ectension of the distribution network in Errachidia, Erfoud, Aoufous and Rissani.
The ONEP holds up his project target, "water for everybody", and further projects in Tadighoust,
3 AEP (Alimentation en Eau Potable), PWS: (Potable Water Supply) 4 KFW (German Cooperation Agency)
F - 5
Merzouga - Taous and Alnif have been launched since 2002. The project in Tadighoust was started in
2002 with financial assistance of USAID. The project consists of rehabilitation of wells, existing
reservoir and distribution network for 20 km long and 750 connections. The project in Merzouga
financed by the BID consists of pipeline installation for 57 km long and construction of 300 m3 reservoir.
Water supply network is shown on Figure F.3.1, and present situation of the water supply plan is in Table
F.3.1. .
F.4 Electric Power Supply
Electrification in the rural areas is one of the most important policies. The ONE is responsible for electric
supply in nation wide since 1963. The main missions of the ONE consist:
1) to answer the needs of the electricity in the country,
2) to manage and develop the power transportation,
3) to plan, intensify and generalize the extension to the rural areas,
4) to work for the promotion and the development of the renewable enegies, and of a more general
way,
5) to manage the global demand of the electric energy.
The ONE controls 26 electric hydro plants (1,265 MW), 5 thermal stations (2,574 MW), 7 power stations
with gas and diesel engines (784 MW) and wind power generation (54 MW), and their total generated
output is estimated at about 4,508 MW in September 2004. Among these electric generation, the thermal
power plant of Jorf Lasfar of 1,320 MW as well as wind power generation of 50 MW are exploited by
private concession.
The transportation network covers large part of the country with power lines of 400 kV, 225 kV, 150 kV
and 60 kV. The total length is about 17,107 km, otherwise power line is interconnected with the Algerian
network by two lines 225 kV and the Spanish network by 400 kV two submarine cables. The distribution
network of the ONE consists of 36,955 km tension and 92,130 km low tension cables.
The Decentralized Energy National Program (PNED), which aimed at electrification via renewable energy
sources, was launched in 1993. In addition, the Global Regional Electrification program (PERG:
Programme d'Electrification Rurale Global), which integrated efforts under the aforementioned PERG, was
approved by the Council of the Government in August 1995 and has implemented in 1996. The PERG
aimed at electrification of 35,000 villages and 12 millions citizens in the rural areas by the year 20007 and
it targets the completion of the rural electrification in the whole nation, 91 % to the existing grid networks
and 7 % mainly by means of photovoltaic (solar generation).
By the end of 2004, 17,208 villages have been electrified since the launching of the PERG in 1996, which
opened the accessibility to 1,176,954 houses and 7,650,000 inhabitants. The rate of the electrification has
satisfactorily proceeded since 18 % in 1995, 50 % in 2001 and 72 % 2004.
F - 6
Table F.4.1 shows electrification records under the PERG in the Province of Errachidia.
F.5 Telecommunications
(1) Telephone
The Maroc Telecom operates exclusively both the domestic telephone and the international long-distance
telephone in the country as a state-operated public corporation under the Ministry of Post, Telephone and
Telegraph.
The Maroc telecom provides various services kinds of telecommunication services to the public, such as
normal telephone, internet as well as domestic satellite communication. The normal telephone networks
are digitized nearly nation-wide and the Maroc telecom is expanding digital high speed communication
networks such as ISDN (Integrated Service Digital Network), which has been already available in
Errachidia.
(2) Mobile telephone service
Three groups, the Maroc telecom, meditel and a consortium of several enterprises, operate mobile
telephone service on Morocco. The Maroc telecom is the largest operator among those enterprises,
selling 111,371 of the GSM (Global system of mobile communications) hand hold terminals as of end of
1998.
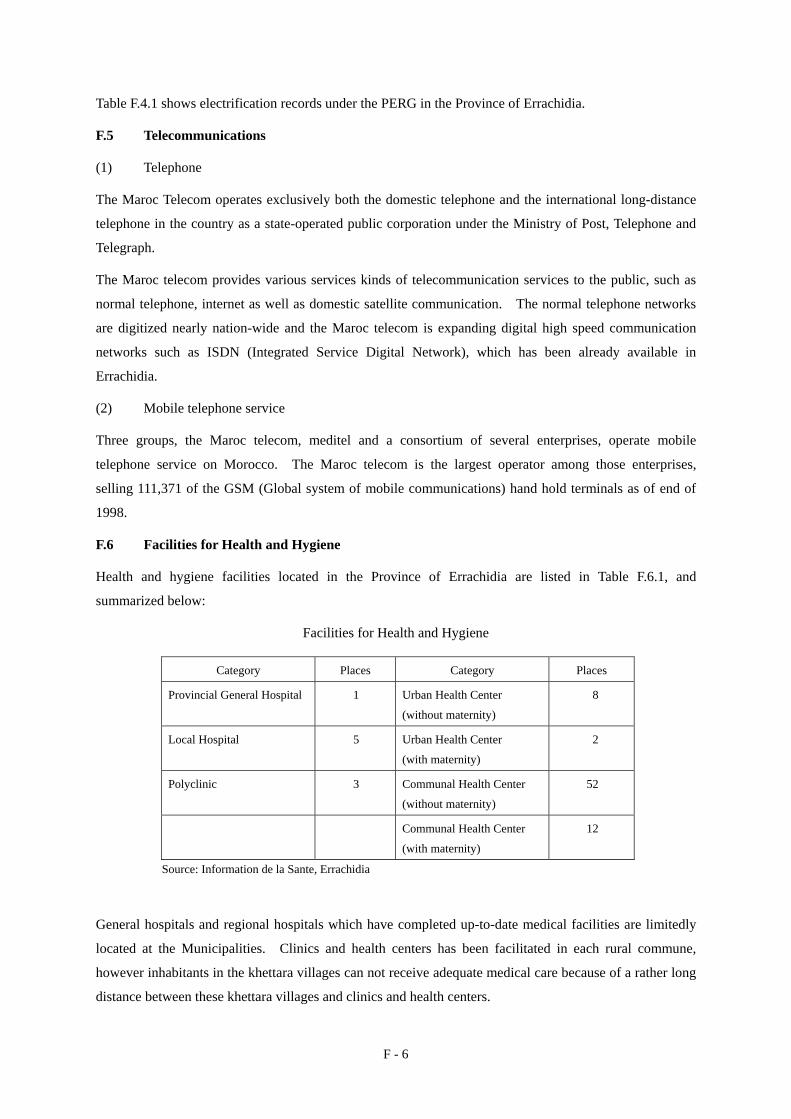
F.6 Facilities for Health and Hygiene
Health and hygiene facilities located in the Province of Errachidia are listed in Table F.6.1, and
summarized below:
Facilities for Health and Hygiene
Category Places Category Places
Provincial General Hospital 1 Urban Health Center
(without maternity)
8
Local Hospital 5 Urban Health Center
(with maternity)
2
Polyclinic 3 Communal Health Center
(without maternity)
52
Communal Health Center
(with maternity)
12
Source: Information de la Sante, Errachidia
General hospitals and regional hospitals which have completed up-to-date medical facilities are limitedly
located at the Municipalities. Clinics and health centers has been facilitated in each rural commune,
however inhabitants in the khettara villages can not receive adequate medical care because of a rather long
distance between these khettara villages and clinics and health centers.
F - 7
F.7 Education
The following are schools located at the Province of Errachidia.
1) Preliminary school : 566 schools 98,158 pupils
2) Secondary school : 49 schools 32,407 students
3) High school : 19 schools 13,566 students
Preliminary schools have established in almost all ksars in the Province of Errachidia. While, secondary
schools have established one to two schools in the commune rural in average. As the distance to the
secondary schools are too far, especially in the rural areas, it causes decline of the rate of entering to the
secondary schools.
Rate of entering to the high schools was declined to 30 % of that of the secondary schools. Information
on education is shown on Table F.7.1 to F.7.3.

Tables

FT - 1
Table F.1.1 Socio Data (Summary of Whole Study Area)
SUMMARY Whole Area
Whole Area
Number of Household
Population Marriage Status (over 15 yrs old)
Ave. Age for Marriage Ave. Birth per female
Number % of Male
% of Female
% of under 15 yrs
% of 15 yrs to 59 yrs
% of over 60 yrs
% of Student (6 to 14 yrs)
Single Married Widow / divorced
Total Male Female
TOTAL / AVERAGE 80,464 546,328 50.01 49.99 41.00 52.63 6.36 24.31 34.10 56.60 9.30 24.84 27.59 22.22 4.25
Whole Area
Illiteracy Rate (%) School Attendance (%) (8 to 13 yrs)
Economically Active Rate (%) Unemployment Rate (%) Type of Economical Activity
Total Population (over 10 yrs)
Male Female Total Male Female Total Male Female Total Male Female Salaried Employee
Independent Business
House Keeping
Others
TOTAL / AVERAGE 54.10 36.02 71.46 69.71 81.24 57.65 26.40 43.96 9.05 16.20 15.59 26.40 48.10 31.69 17.68 2.30
Whole Area
Number of Room in a House Ownership of House Type of House Availability of Utility
Home Facility
1 to 2 3 4 more than 5
Number of People in One Room
Privately Owned
Rented Public House (Rent Free)
Apartment
Traditional/Contem
porary House
Frugal House
Rural House
Electricity Water Supply
Bath / Shower
Toilet
TOTAL / AVERAGE 27.02 26.91 22.16 23.91 1.89 79.80 10.76 9.44 1.88 25.14 1.05 68.54 52.03 35.48 14.63 57.70
FT - 2
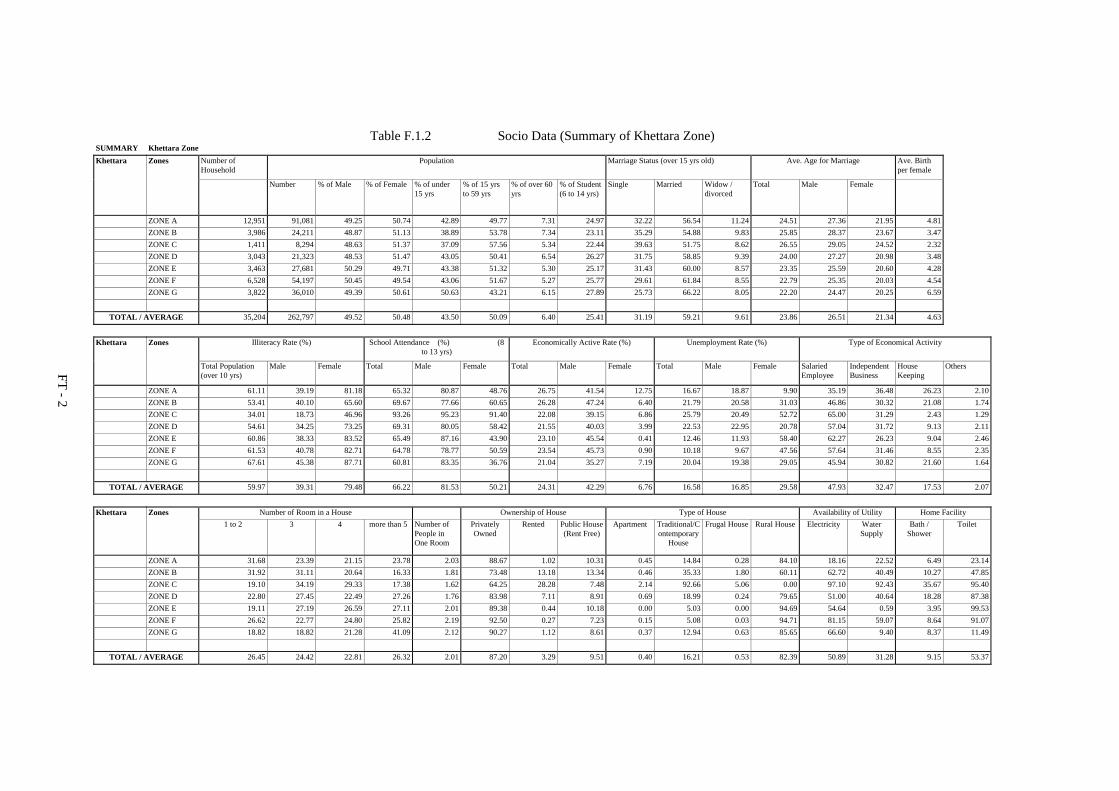
Table F.1.2 Socio Data (Summary of Khettara Zone) SUMMARY Khettara Zone Khettara Zones Number of
Household Population Marriage Status (over 15 yrs old) Ave. Age for Marriage Ave. Birth
per female
Number % of Male % of Female % of under 15 yrs
% of 15 yrs to 59 yrs
% of over 60 yrs
% of Student (6 to 14 yrs)
Single Married Widow / divorced
Total Male Female
ZONE A 12,951 91,081 49.25 50.74 42.89 49.77 7.31 24.97 32.22 56.54 11.24 24.51 27.36 21.95 4.81 ZONE B 3,986 24,211 48.87 51.13 38.89 53.78 7.34 23.11 35.29 54.88 9.83 25.85 28.37 23.67 3.47 ZONE C 1,411 8,294 48.63 51.37 37.09 57.56 5.34 22.44 39.63 51.75 8.62 26.55 29.05 24.52 2.32 ZONE D 3,043 21,323 48.53 51.47 43.05 50.41 6.54 26.27 31.75 58.85 9.39 24.00 27.27 20.98 3.48 ZONE E 3,463 27,681 50.29 49.71 43.38 51.32 5.30 25.17 31.43 60.00 8.57 23.35 25.59 20.60 4.28 ZONE F 6,528 54,197 50.45 49.54 43.06 51.67 5.27 25.77 29.61 61.84 8.55 22.79 25.35 20.03 4.54 ZONE G 3,822 36,010 49.39 50.61 50.63 43.21 6.15 27.89 25.73 66.22 8.05 22.20 24.47 20.25 6.59
TOTAL / AVERAGE 35,204 262,797 49.52 50.48 43.50 50.09 6.40 25.41 31.19 59.21 9.61 23.86 26.51 21.34 4.63
Khettara Zones Illiteracy Rate (%) School Attendance (%) (8 to 13 yrs)
Economically Active Rate (%) Unemployment Rate (%) Type of Economical Activity
Total Population (over 10 yrs)
Male Female Total Male Female Total Male Female Total Male Female Salaried Employee
Independent Business
House Keeping
Others
ZONE A 61.11 39.19 81.18 65.32 80.87 48.76 26.75 41.54 12.75 16.67 18.87 9.90 35.19 36.48 26.23 2.10 ZONE B 53.41 40.10 65.60 69.67 77.66 60.65 26.28 47.24 6.40 21.79 20.58 31.03 46.86 30.32 21.08 1.74 ZONE C 34.01 18.73 46.96 93.26 95.23 91.40 22.08 39.15 6.86 25.79 20.49 52.72 65.00 31.29 2.43 1.29 ZONE D 54.61 34.25 73.25 69.31 80.05 58.42 21.55 40.03 3.99 22.53 22.95 20.78 57.04 31.72 9.13 2.11 ZONE E 60.86 38.33 83.52 65.49 87.16 43.90 23.10 45.54 0.41 12.46 11.93 58.40 62.27 26.23 9.04 2.46 ZONE F 61.53 40.78 82.71 64.78 78.77 50.59 23.54 45.73 0.90 10.18 9.67 47.56 57.64 31.46 8.55 2.35 ZONE G 67.61 45.38 87.71 60.81 83.35 36.76 21.04 35.27 7.19 20.04 19.38 29.05 45.94 30.82 21.60 1.64
TOTAL / AVERAGE 59.97 39.31 79.48 66.22 81.53 50.21 24.31 42.29 6.76 16.58 16.85 29.58 47.93 32.47 17.53 2.07
Khettara Zones Number of Room in a House Ownership of House Type of House Availability of Utility Home Facility 1 to 2 3 4 more than 5 Number of
People in One Room
Privately Owned
Rented Public House (Rent Free)
Apartment Traditional/Contemporary
House
Frugal House Rural House Electricity Water Supply
Bath / Shower
Toilet
ZONE A 31.68 23.39 21.15 23.78 2.03 88.67 1.02 10.31 0.45 14.84 0.28 84.10 18.16 22.52 6.49 23.14 ZONE B 31.92 31.11 20.64 16.33 1.81 73.48 13.18 13.34 0.46 35.33 1.80 60.11 62.72 40.49 10.27 47.85 ZONE C 19.10 34.19 29.33 17.38 1.62 64.25 28.28 7.48 2.14 92.66 5.06 0.00 97.10 92.43 35.67 95.40 ZONE D 22.80 27.45 22.49 27.26 1.76 83.98 7.11 8.91 0.69 18.99 0.24 79.65 51.00 40.64 18.28 87.38 ZONE E 19.11 27.19 26.59 27.11 2.01 89.38 0.44 10.18 0.00 5.03 0.00 94.69 54.64 0.59 3.95 99.53 ZONE F 26.62 22.77 24.80 25.82 2.19 92.50 0.27 7.23 0.15 5.08 0.03 94.71 81.15 59.07 8.64 91.07 ZONE G 18.82 18.82 21.28 41.09 2.12 90.27 1.12 8.61 0.37 12.94 0.63 85.65 66.60 9.40 8.37 11.49
TOTAL / AVERAGE 26.45 24.42 22.81 26.32 2.01 87.20 3.29 9.51 0.40 16.21 0.53 82.39 50.89 31.28 9.15 53.37
FT - 3
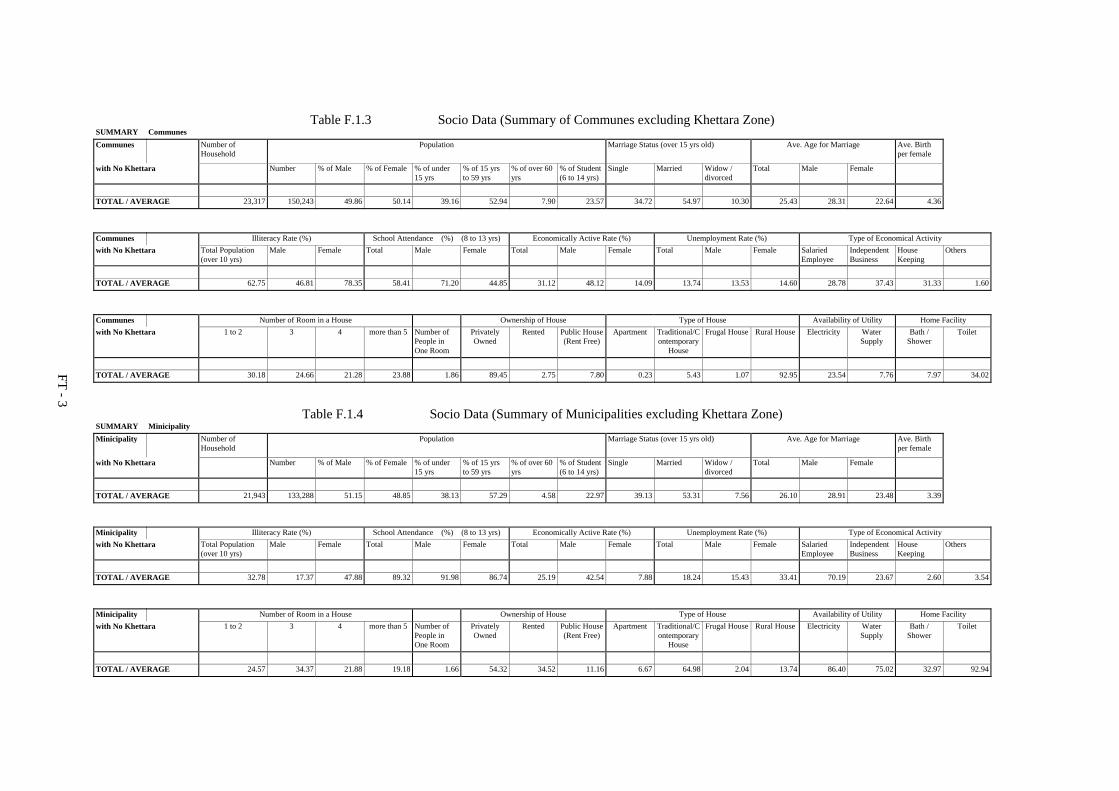
Table F.1.3 Socio Data (Summary of Communes excluding Khettara Zone)
SUMMARY Communes Communes Number of
Household Population Marriage Status (over 15 yrs old) Ave. Age for Marriage Ave. Birth
per female
with No Khettara Number % of Male % of Female % of under 15 yrs
% of 15 yrs to 59 yrs
% of over 60 yrs
% of Student (6 to 14 yrs)
Single Married Widow / divorced
Total Male Female
TOTAL / AVERAGE 23,317 150,243 49.86 50.14 39.16 52.94 7.90 23.57 34.72 54.97 10.30 25.43 28.31 22.64 4.36
Communes Illiteracy Rate (%) School Attendance (%) (8 to 13 yrs) Economically Active Rate (%) Unemployment Rate (%) Type of Economical Activity with No Khettara Total Population
(over 10 yrs) Male Female Total Male Female Total Male Female Total Male Female Salaried
Employee Independent Business
House Keeping
Others
TOTAL / AVERAGE 62.75 46.81 78.35 58.41 71.20 44.85 31.12 48.12 14.09 13.74 13.53 14.60 28.78 37.43 31.33 1.60
Communes Number of Room in a House Ownership of House Type of House Availability of Utility Home Facility with No Khettara 1 to 2 3 4 more than 5 Number of
People in One Room
Privately Owned
Rented Public House (Rent Free)
Apartment Traditional/Contemporary
House
Frugal House Rural House Electricity Water Supply
Bath / Shower
Toilet
TOTAL / AVERAGE 30.18 24.66 21.28 23.88 1.86 89.45 2.75 7.80 0.23 5.43 1.07 92.95 23.54 7.76 7.97 34.02
Table F.1.4 Socio Data (Summary of Municipalities excluding Khettara Zone) SUMMARY Minicipality Minicipality Number of
Household Population Marriage Status (over 15 yrs old) Ave. Age for Marriage Ave. Birth
per female
with No Khettara Number % of Male % of Female % of under 15 yrs
% of 15 yrs to 59 yrs
% of over 60 yrs
% of Student (6 to 14 yrs)
Single Married Widow / divorced
Total Male Female
TOTAL / AVERAGE 21,943 133,288 51.15 48.85 38.13 57.29 4.58 22.97 39.13 53.31 7.56 26.10 28.91 23.48 3.39
Minicipality Illiteracy Rate (%) School Attendance (%) (8 to 13 yrs) Economically Active Rate (%) Unemployment Rate (%) Type of Economical Activity with No Khettara Total Population
(over 10 yrs) Male Female Total Male Female Total Male Female Total Male Female Salaried
Employee Independent Business
House Keeping
Others
TOTAL / AVERAGE 32.78 17.37 47.88 89.32 91.98 86.74 25.19 42.54 7.88 18.24 15.43 33.41 70.19 23.67 2.60 3.54
Minicipality Number of Room in a House Ownership of House Type of House Availability of Utility Home Facility with No Khettara 1 to 2 3 4 more than 5 Number of
People in One Room
Privately Owned
Rented Public House (Rent Free)
Apartment Traditional/Contemporary
House
Frugal House Rural House Electricity Water Supply
Bath / Shower
Toilet
TOTAL / AVERAGE 24.57 34.37 21.88 19.18 1.66 54.32 34.52 11.16 6.67 64.98 2.04 13.74 86.40 75.02 32.97 92.94

FT - 4
Table F.1.5 Socio Data (By Khettara Zoning) Zone A (1/4) Province Cercle Commune Number of
Household Population Marriage Status (over 15 yrs old) Ave. Age for Marriage Ave. Birth
per female
Number % of Male % of Female % of under 15 yrs
% of 15 yrs to 59 yrs
% of over 60 yrs
% of Student (6 to 14 yrs)
Single Married Widow / divorced
Total Male Female
Errachidia Goulmima Melaab 1,929 14,604 48.88 51.12 47.74 44.89 7.37 26.93 28.09 60.19 11.72 23.20 26.35 20.50 5.84
Ferkla Essoufla 1,558 12,653 48.42 51.58 42.60 51.94 5.46 23.81 33.49 58.24 8.27 24.17 26.51 21.75 4.19
Ferkla El oulia 2,586 18,889 49.08 50.92 42.73 50.49 6.78 25.81 33.90 55.25 10.86 24.95 27.70 22.35 4.85
Assoul Assoul 1,239 8,062 49.46 50.53 41.11 50.47 8.40 24.31 32.04 53.95 14.01 24.42 27.56 21.35 4.72
Ait Hani 1,482 9,054 49.72 50.27 45.02 47.47 7.22 25.10 28.47 58.29 13.24 24.50 28.05 21.45 5.28
Amellagou 812 5,090 51.57 48.43 36.34 54.86 8.79 22.70 37.14 49.98 12.87 25.78 28.51 22.90 3.39
Goulmima Tadighoust 1,265 7,959 46.10 53.90 38.18 51.48 10.32 22.78 35.27 52.71 12.02 26.26 28.56 24.75 4.44
Gheriss Essoufli 935 6,521 48.46 51.54 39.78 52.83 7.40 24.88 37.50 52.42 10.09 26.05 28.39 23.80 4.05
Agh. N'Kerdous 1,145 8,249 53.13 46.87 45.55 48.03 6.41 25.41 27.90 62.01 10.09 22.76 26.09 20.30 5.25
TOTAL / AVERAGE 12,951 91,081 49.25 50.74 42.89 49.77 7.31 24.97 32.22 56.54 11.24 24.51 27.36 21.95 4.81
Province Cercle Commune Illiteracy Rate (%) School Attendance (%) (8 to 13 yrs) Economically Active Rate (%) Unemployment Rate (%) Type of Economical Activity
Total Population (over 10 yrs)
Male Female Total Male Female Total Male Female Total Male Female Salaried Employee
Independent Business
House Keeping
Others
Errachidia Goulmima Melaab 64.80 42.58 84.60 58.62 75.72 38.46 18.77 33.42 4.76 21.44 20.70 26.38 46.58 38.68 14.32 0.43
Ferkla Essoufla 48.63 20.57 74.57 72.04 86.29 58.00 23.25 43.30 4.44 20.23 21.32 10.34 55.06 30.35 8.75 5.84
Ferkla El oulia 55.07 35.13 73.33 79.14 86.90 70.49 22.28 38.58 6.57 22.43 24.13 12.77 41.60 37.07 18.33 3.00
Assoul Assoul 61.70 37.41 85.97 65.28 82.67 44.96 33.97 45.96 22.23 8.92 13.03 0.60 18.00 35.04 46.34 0.62
Ait Hani 82.31 68.56 95.50 37.62 57.56 17.57 34.02 50.06 18.16 7.97 10.43 1.25 15.78 42.63 40.60 1.00
Amellagou 61.95 40.00 84.38 63.49 82.38 40.86 41.04 45.51 36.27 9.69 16.77 0.22 14.90 40.50 44.29 0.31
Goulmima Tadighoust 60.74 40.18 77.96 74.16 90.29 55.27 22.05 39.71 6.94 16.41 19.42 1.71 38.17 43.41 17.10 1.33
Gheriss Essoufli 52.37 28.80 73.57 73.56 86.50 61.64 25.73 42.71 9.77 22.67 23.69 17.36 30.82 40.07 24.73 4.38
Agh. N'Kerdous 70.49 47.32 89.95 51.77 77.25 29.42 37.99 44.71 32.07 6.49 11.78 0.00 21.02 23.30 55.68 0.00
TOTAL / AVERAGE 61.11 39.19 81.18 65.32 80.87 48.76 26.75 41.54 12.75 16.67 18.87 9.90 35.19 36.48 26.23 2.10
Province Cercle Commune Number of Room in a House Ownership of House Type of House Availability of Utility Home Facility
1 to 2 3 4 more than 5 Number of People in One Room
Privately Owned
Rented Public House (Rent Free)
Apartment Traditional/Contemporary
House
Frugal House Rural House Electricity Water Supply
Bath / Shower
Toilet
Errachidia Goulmima Melaab 27.72 23.06 22.28 26.94 2.07 88.57 2.08 9.35 0.00 13.51 0.00 86.49 26.42 59.84 5.70 29.02
Ferkla Essoufla 22.73 18.51 23.70 35.06 1.96 89.61 0.00 10.39 0.00 27.51 0.32 71.84 2.26 0.97 4.19 27.42
Ferkla El oulia 17.60 22.00 26.00 34.40 1.73 87.10 0.40 12.50 2.00 28.80 0.00 69.20 25.50 32.27 13.15 37.05
Assoul Assoul 48.85 27.65 14.75 8.75 2.30 86.51 3.26 10.23 0.00 3.69 0.00 96.31 36.24 23.85 8.26 9.17
Ait Hani 49.79 25.31 16.60 8.30 2.12 88.84 0.41 10.74 0.00 2.47 0.00 97.53 6.58 0.41 1.23 5.35
Amellagou 46.70 25.13 16.50 11.68 2.18 91.33 1.02 7.65 0.00 1.52 2.03 96.19 25.76 8.08 8.84 12.63
Goulmima Tadighoust 32.39 25.91 19.43 22.27 1.73 88.21 1.22 10.57 0.00 9.27 0.00 90.32 0.40 36.55 5.62 15.26
Gheriss Essoufli 10.50 25.11 26.94 37.44 1.67 89.77 0.93 9.30 0.45 11.82 0.00 87.73 18.92 0.90 3.15 31.53
Agh. N'Kerdous 54.75 23.53 15.38 6.33 2.82 90.83 0.46 8.72 0.00 6.22 1.33 89.78 17.98 2.63 2.19 14.91
TOTAL / AVERAGE 31.68 23.39 21.15 23.78 2.03 88.67 1.02 10.31 0.45 14.84 0.28 84.10 18.16 22.52 6.49 23.14
FT - 5
Zone B (2/4) Province Cercle Commune Number of
Household Population Marriage Status (over 15 yrs old) Ave. Age for Marriage Ave. Birth
per female
Number % of Male % of Female % of under 15 yrs
% of 15 yrs to 59 yrs
% of over 60 yrs
% of Student (6 to 14 yrs)
Single Married Widow / divorced
Total Male Female
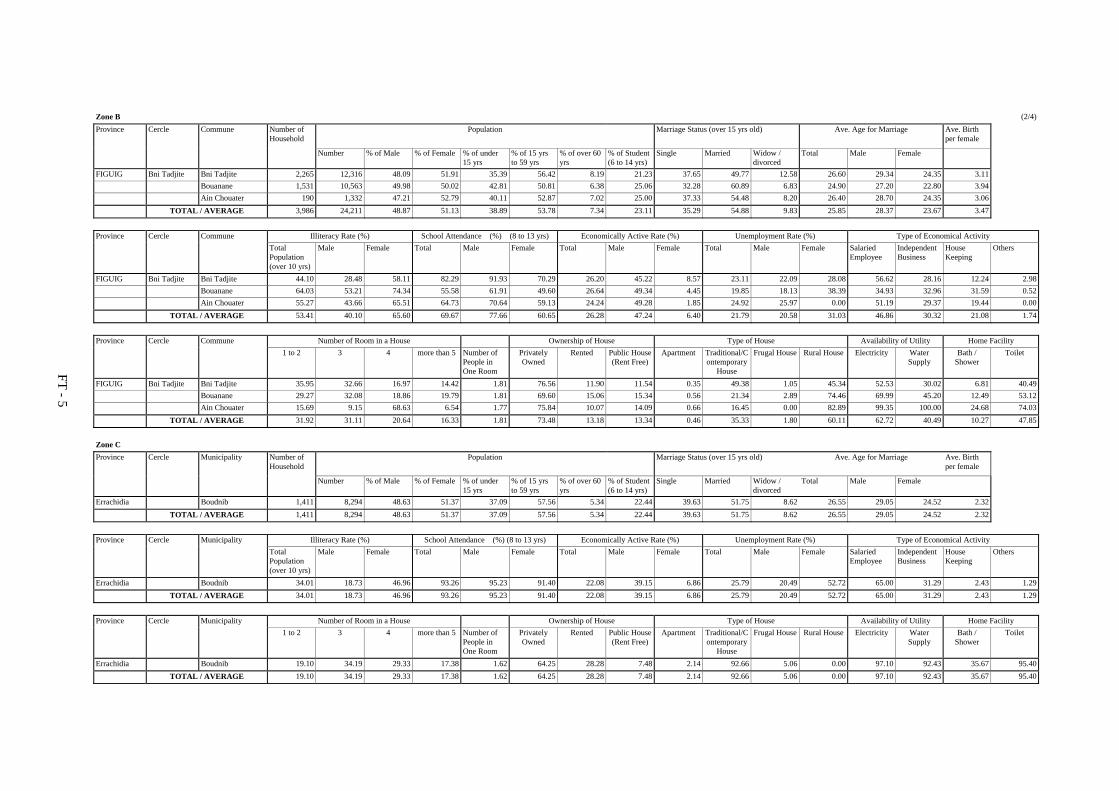
FIGUIG Bni Tadjite Bni Tadjite 2,265 12,316 48.09 51.91 35.39 56.42 8.19 21.23 37.65 49.77 12.58 26.60 29.34 24.35 3.11 Bouanane 1,531 10,563 49.98 50.02 42.81 50.81 6.38 25.06 32.28 60.89 6.83 24.90 27.20 22.80 3.94 Ain Chouater 190 1,332 47.21 52.79 40.11 52.87 7.02 25.00 37.33 54.48 8.20 26.40 28.70 24.35 3.06 TOTAL / AVERAGE 3,986 24,211 48.87 51.13 38.89 53.78 7.34 23.11 35.29 54.88 9.83 25.85 28.37 23.67 3.47
Province Cercle Commune Illiteracy Rate (%) School Attendance (%) (8 to 13 yrs) Economically Active Rate (%) Unemployment Rate (%) Type of Economical Activity Total
Population (over 10 yrs)
Male Female Total Male Female Total Male Female Total Male Female Salaried Employee
Independent Business
House Keeping
Others
FIGUIG Bni Tadjite Bni Tadjite 44.10 28.48 58.11 82.29 91.93 70.29 26.20 45.22 8.57 23.11 22.09 28.08 56.62 28.16 12.24 2.98 Bouanane 64.03 53.21 74.34 55.58 61.91 49.60 26.64 49.34 4.45 19.85 18.13 38.39 34.93 32.96 31.59 0.52 Ain Chouater 55.27 43.66 65.51 64.73 70.64 59.13 24.24 49.28 1.85 24.92 25.97 0.00 51.19 29.37 19.44 0.00 TOTAL / AVERAGE 53.41 40.10 65.60 69.67 77.66 60.65 26.28 47.24 6.40 21.79 20.58 31.03 46.86 30.32 21.08 1.74
Province Cercle Commune Number of Room in a House Ownership of House Type of House Availability of Utility Home Facility 1 to 2 3 4 more than 5 Number of
People in One Room
Privately Owned
Rented Public House (Rent Free)
Apartment Traditional/Contemporary
House
Frugal House Rural House Electricity Water Supply
Bath / Shower
Toilet
FIGUIG Bni Tadjite Bni Tadjite 35.95 32.66 16.97 14.42 1.81 76.56 11.90 11.54 0.35 49.38 1.05 45.34 52.53 30.02 6.81 40.49 Bouanane 29.27 32.08 18.86 19.79 1.81 69.60 15.06 15.34 0.56 21.34 2.89 74.46 69.99 45.20 12.49 53.12 Ain Chouater 15.69 9.15 68.63 6.54 1.77 75.84 10.07 14.09 0.66 16.45 0.00 82.89 99.35 100.00 24.68 74.03 TOTAL / AVERAGE 31.92 31.11 20.64 16.33 1.81 73.48 13.18 13.34 0.46 35.33 1.80 60.11 62.72 40.49 10.27 47.85
Zone C Province Cercle Municipality Number of
Household Population Marriage Status (over 15 yrs old) Ave. Age for Marriage Ave. Birth
per female
Number % of Male % of Female % of under 15 yrs
% of 15 yrs to 59 yrs
% of over 60 yrs
% of Student (6 to 14 yrs)
Single Married Widow / divorced
Total Male Female
Errachidia Boudnib 1,411 8,294 48.63 51.37 37.09 57.56 5.34 22.44 39.63 51.75 8.62 26.55 29.05 24.52 2.32 TOTAL / AVERAGE 1,411 8,294 48.63 51.37 37.09 57.56 5.34 22.44 39.63 51.75 8.62 26.55 29.05 24.52 2.32
Province Cercle Municipality Illiteracy Rate (%) School Attendance (%) (8 to 13 yrs) Economically Active Rate (%) Unemployment Rate (%) Type of Economical Activity Total
Population (over 10 yrs)
Male Female Total Male Female Total Male Female Total Male Female Salaried Employee
Independent Business
House Keeping
Others
Errachidia Boudnib 34.01 18.73 46.96 93.26 95.23 91.40 22.08 39.15 6.86 25.79 20.49 52.72 65.00 31.29 2.43 1.29 TOTAL / AVERAGE 34.01 18.73 46.96 93.26 95.23 91.40 22.08 39.15 6.86 25.79 20.49 52.72 65.00 31.29 2.43 1.29
Province Cercle Municipality Number of Room in a House Ownership of House Type of House Availability of Utility Home Facility 1 to 2 3 4 more than 5 Number of
People in One Room
Privately Owned
Rented Public House (Rent Free)
Apartment Traditional/Contemporary
House
Frugal House Rural House Electricity Water Supply
Bath / Shower
Toilet
Errachidia Boudnib 19.10 34.19 29.33 17.38 1.62 64.25 28.28 7.48 2.14 92.66 5.06 0.00 97.10 92.43 35.67 95.40 TOTAL / AVERAGE 19.10 34.19 29.33 17.38 1.62 64.25 28.28 7.48 2.14 92.66 5.06 0.00 97.10 92.43 35.67 95.40

FT - 6
Zone D (3/4) Province Cercle Commune Number of
Household Population Marriage Status (over 15 yrs old) Ave. Age for Marriage Ave. Birth
per female
Number % of Male % of Female % of under 15 yrs
% of 15 yrs to 59 yrs
% of over 60 yrs
% of Student (6 to 14 yrs)
Single Married Widow / divorced
Total Male Female
Errachidia Arfoud fezna 560 4,120 46.94 53.06 43.40 49.95 6.65 25.71 33.63 58.32 8.05 23.76 25.90 21.50 3.06 Jorf (municipality 1,864 12,143 48.09 51.91 43.10 50.25 6.65 26.32 31.04 58.73 10.22 24.32 28.15 21.11 3.10 Arab. Se. Ghriss 619 5,060 50.88 49.12 42.65 51.15 6.18 26.59 31.91 59.57 8.51 23.41 26.26 20.26 4.74 TOTAL / AVERAGE 3,043 21,323 48.53 51.47 43.05 50.41 6.54 26.27 31.75 58.85 9.39 24.00 27.27 20.98 3.48
Province Cercle Commune Illiteracy Rate (%) School Attendance (%) (8 to 13 yrs) Economically Active Rate (%) Unemployment Rate (%) Type of Economical Activity Total
Population (over 10 yrs)
Male Female Total Male Female Total Male Female Total Male Female Salaried Employee
Independent Business
House Keeping
Others
Errachidia Arfoud fezna 57.70 40.02 73.01 66.13 80.12 53.57 24.02 39.27 10.53 17.35 19.08 11.63 45.08 34.14 18.38 2.41 Jorf (municipality 50.96 29.72 69.56 72.21 79.25 65.34 19.65 37.68 2.95 28.68 28.86 26.59 56.70 34.33 6.36 2.60 Arab. Se. Ghriss 60.85 40.41 82.31 64.95 81.93 45.77 24.11 46.28 1.15 11.97 11.91 14.28 67.60 23.47 8.23 0.70 TOTAL / AVERAGE 54.61 34.25 73.25 69.31 80.05 58.42 21.55 40.03 3.99 22.53 22.95 20.78 57.04 31.72 9.13 2.11
Province Cercle Commune Number of Room in a House Ownership of House Type of House Availability of Utility Home Facility 1 to 2 3 4 more than 5 Number of
People in One Room
Privately Owned
Rented Public House (Rent Free)
Apartment Traditional/Contemporary
House
Frugal House Rural House Electricity Water Supply
Bath / Shower
Toilet
Errachidia Arfoud fezna 17.87 23.19 27.76 31.18 1.69 86.31 3.04 10.65 1.52 9.89 0.00 88.21 55.30 2.65 10.61 96.59 Jorf (municipality 21.96 28.59 21.74 27.72 1.53 81.83 10.77 7.40 0.43 25.79 0.43 73.02 70.25 69.92 25.56 80.34 Arab. Se. Ghriss 28.85 28.20 20.00 22.95 2.35 87.25 1.63 11.11 0.65 10.10 0.00 88.60 1.29 1.29 7.07 96.78 TOTAL / AVERAGE 22.80 27.45 22.49 27.26 1.76 83.98 7.11 8.91 0.69 18.99 0.24 79.65 51.00 40.64 18.28 87.38
Zone E Province Cercle Commune Number of
Household Population Marriage Status (over 15 yrs old) Ave. Age for Marriage Ave. Birth
per female
Number % of Male % of Female % of under 15 yrs
% of 15 yrs to 59 yrs
% of over 60 yrs
% of Student (6 to 14 yrs)
Single Married Widow / divorced
Total Male Female
Errachidia Arfoud Arab. Se. Ziz 2,436 18,522 50.74 49.26 42.95 51.85 5.20 24.81 31.84 59.15 9.01 23.76 26.14 20.70 3.98 Essifa 1,027 9,159 49.39 50.61 44.24 50.26 5.49 25.91 30.60 61.73 7.67 22.53 24.48 20.40 4.89 TOTAL / AVERAGE 3,463 27,681 50.29 49.71 43.38 51.32 5.30 25.17 31.43 60.00 8.57 23.35 25.59 20.60 4.28
Province Cercle Commune Illiteracy Rate (%) School Attendance (%) (8 to 13 yrs) Economically Active Rate (%) Unemployment Rate (%) Type of Economical Activity Total
Population (over 10 yrs)
Male Female Total Male Female Total Male Female Total Male Female Salaried Employee
Independent Business
House Keeping
Others
Errachidia Arfoud Arab. Se. Ziz 58.52 34.10 83.86 66.64 89.91 42.12 23.12 45.08 0.51 13.42 12.60 87.28 64.81 23.84 8.18 3.16 Essifa 65.59 46.89 82.82 63.17 81.61 47.50 23.07 46.48 0.22 10.52 10.57 0.00 57.13 31.05 10.78 1.04 TOTAL / AVERAGE 60.86 38.33 83.52 65.49 87.16 43.90 23.10 45.54 0.41 12.46 11.93 58.40 62.27 26.23 9.04 2.46
Province Cercle Commune Number of Room in a House Ownership of House Type of House Availability of Utility Home Facility 1 to 2 3 4 more than 5 Number of
People in One Room
Privately Owned
Rented Public House (Rent Free)
Apartment Traditional/Contemporary
House
Frugal House Rural House Electricity Water Supply
Bath / Shower
Toilet
Errachidia Arfoud Arab. Se. Ziz 20.75 29.05 25.31 24.90 1.97 87.45 0.42 12.13 0.00 5.39 0.00 94.19 39.00 0.41 3.32 100.00 Essifa 15.79 23.44 29.19 31.58 2.08 93.27 0.48 6.25 0.00 4.29 0.00 95.71 86.26 0.95 5.21 98.58 TOTAL / AVERAGE 19.11 27.19 26.59 27.11 2.01 89.38 0.44 10.18 0.00 5.03 0.00 94.69 54.64 0.59 3.95 99.53
FT - 7
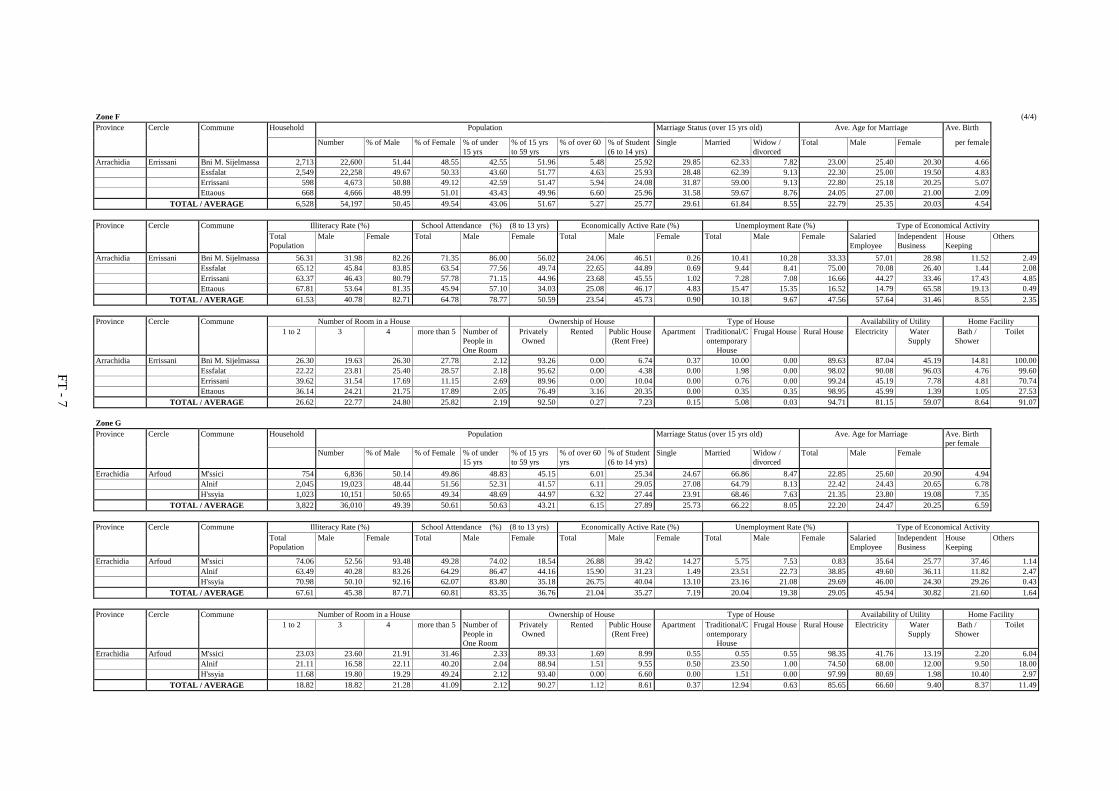
Zone F (4/4) Province Cercle Commune Household Population Marriage Status (over 15 yrs old) Ave. Age for Marriage Ave. Birth
Number % of Male % of Female % of under 15 yrs
% of 15 yrs to 59 yrs
% of over 60 yrs
% of Student (6 to 14 yrs)
Single Married Widow / divorced
Total Male Female per female
Arrachidia Errissani Bni M. Sijelmassa 2,713 22,600 51.44 48.55 42.55 51.96 5.48 25.92 29.85 62.33 7.82 23.00 25.40 20.30 4.66 Essfalat 2,549 22,258 49.67 50.33 43.60 51.77 4.63 25.93 28.48 62.39 9.13 22.30 25.00 19.50 4.83 Errissani 598 4,673 50.88 49.12 42.59 51.47 5.94 24.08 31.87 59.00 9.13 22.80 25.18 20.25 5.07 Ettaous 668 4,666 48.99 51.01 43.43 49.96 6.60 25.96 31.58 59.67 8.76 24.05 27.00 21.00 2.09 TOTAL / AVERAGE 6,528 54,197 50.45 49.54 43.06 51.67 5.27 25.77 29.61 61.84 8.55 22.79 25.35 20.03 4.54
Province Cercle Commune Illiteracy Rate (%) School Attendance (%) (8 to 13 yrs) Economically Active Rate (%) Unemployment Rate (%) Type of Economical Activity Total
Population Male Female Total Male Female Total Male Female Total Male Female Salaried
Employee Independent Business
House Keeping
Others
Arrachidia Errissani Bni M. Sijelmassa 56.31 31.98 82.26 71.35 86.00 56.02 24.06 46.51 0.26 10.41 10.28 33.33 57.01 28.98 11.52 2.49 Essfalat 65.12 45.84 83.85 63.54 77.56 49.74 22.65 44.89 0.69 9.44 8.41 75.00 70.08 26.40 1.44 2.08 Errissani 63.37 46.43 80.79 57.78 71.15 44.96 23.68 45.55 1.02 7.28 7.08 16.66 44.27 33.46 17.43 4.85 Ettaous 67.81 53.64 81.35 45.94 57.10 34.03 25.08 46.17 4.83 15.47 15.35 16.52 14.79 65.58 19.13 0.49 TOTAL / AVERAGE 61.53 40.78 82.71 64.78 78.77 50.59 23.54 45.73 0.90 10.18 9.67 47.56 57.64 31.46 8.55 2.35
Province Cercle Commune Number of Room in a House Ownership of House Type of House Availability of Utility Home Facility 1 to 2 3 4 more than 5 Number of
People in One Room
Privately Owned
Rented Public House (Rent Free)
Apartment Traditional/Contemporary
House
Frugal House Rural House Electricity Water Supply
Bath / Shower
Toilet
Arrachidia Errissani Bni M. Sijelmassa 26.30 19.63 26.30 27.78 2.12 93.26 0.00 6.74 0.37 10.00 0.00 89.63 87.04 45.19 14.81 100.00 Essfalat 22.22 23.81 25.40 28.57 2.18 95.62 0.00 4.38 0.00 1.98 0.00 98.02 90.08 96.03 4.76 99.60 Errissani 39.62 31.54 17.69 11.15 2.69 89.96 0.00 10.04 0.00 0.76 0.00 99.24 45.19 7.78 4.81 70.74 Ettaous 36.14 24.21 21.75 17.89 2.05 76.49 3.16 20.35 0.00 0.35 0.35 98.95 45.99 1.39 1.05 27.53 TOTAL / AVERAGE 26.62 22.77 24.80 25.82 2.19 92.50 0.27 7.23 0.15 5.08 0.03 94.71 81.15 59.07 8.64 91.07
Zone G Province Cercle Commune Household Population Marriage Status (over 15 yrs old) Ave. Age for Marriage Ave. Birth
per female
Number % of Male % of Female % of under 15 yrs
% of 15 yrs to 59 yrs
% of over 60 yrs
% of Student (6 to 14 yrs)
Single Married Widow / divorced
Total Male Female
Errachidia Arfoud M'ssici 754 6,836 50.14 49.86 48.83 45.15 6.01 25.34 24.67 66.86 8.47 22.85 25.60 20.90 4.94 Alnif 2,045 19,023 48.44 51.56 52.31 41.57 6.11 29.05 27.08 64.79 8.13 22.42 24.43 20.65 6.78 H'ssyia 1,023 10,151 50.65 49.34 48.69 44.97 6.32 27.44 23.91 68.46 7.63 21.35 23.80 19.08 7.35 TOTAL / AVERAGE 3,822 36,010 49.39 50.61 50.63 43.21 6.15 27.89 25.73 66.22 8.05 22.20 24.47 20.25 6.59
Province Cercle Commune Illiteracy Rate (%) School Attendance (%) (8 to 13 yrs) Economically Active Rate (%) Unemployment Rate (%) Type of Economical Activity Total
Population Male Female Total Male Female Total Male Female Total Male Female Salaried
Employee Independent Business
House Keeping
Others
Errachidia Arfoud M'ssici 74.06 52.56 93.48 49.28 74.02 18.54 26.88 39.42 14.27 5.75 7.53 0.83 35.64 25.77 37.46 1.14 Alnif 63.49 40.28 83.26 64.29 86.47 44.16 15.90 31.23 1.49 23.51 22.73 38.85 49.60 36.11 11.82 2.47 H'ssyia 70.98 50.10 92.16 62.07 83.80 35.18 26.75 40.04 13.10 23.16 21.08 29.69 46.00 24.30 29.26 0.43 TOTAL / AVERAGE 67.61 45.38 87.71 60.81 83.35 36.76 21.04 35.27 7.19 20.04 19.38 29.05 45.94 30.82 21.60 1.64
Province Cercle Commune Number of Room in a House Ownership of House Type of House Availability of Utility Home Facility 1 to 2 3 4 more than 5 Number of
People in One Room
Privately Owned
Rented Public House (Rent Free)
Apartment Traditional/Contemporary
House
Frugal House Rural House Electricity Water Supply
Bath / Shower
Toilet
Errachidia Arfoud M'ssici 23.03 23.60 21.91 31.46 2.33 89.33 1.69 8.99 0.55 0.55 0.55 98.35 41.76 13.19 2.20 6.04 Alnif 21.11 16.58 22.11 40.20 2.04 88.94 1.51 9.55 0.50 23.50 1.00 74.50 68.00 12.00 9.50 18.00 H'ssyia 11.68 19.80 19.29 49.24 2.12 93.40 0.00 6.60 0.00 1.51 0.00 97.99 80.69 1.98 10.40 2.97 TOTAL / AVERAGE 18.82 18.82 21.28 41.09 2.12 90.27 1.12 8.61 0.37 12.94 0.63 85.65 66.60 9.40 8.37 11.49

FT - 8
Table F.1.6 Socio Data (Municipality excluding Khettara Zone)
Minicipality Province Minicipality Number of
Household Population Marriage Status (over 15 yrs old) Ave. Age for Marriage Ave. Birth
per female
Number % of Male % of Female % of under 15 yrs
% of 15 yrs to 59 yrs
% of over 60 yrs
% of Student (6 to 14 yrs)
Single Married Widow / divorced
Total Male Female
Errachidia Errich 2,577 13,952 49.80 50.20 38.80 56.51 4.68 23.41 39.12 52.52 8.36 26.75 29.74 24.20 2.93
Errachidia 10,454 62,542 52.68 47.32 35.08 60.79 4.13 21.27 43.46 49.94 6.60 27.10 29.64 24.60 3.25
Tinejdad 908 5,755 48.57 51.43 40.17 54.57 5.26 24.15 36.68 53.93 9.38 25.22 28.30 22.57 4.39
Goulmima 2,392 14,026 48.10 51.90 39.69 54.32 5.99 23.49 37.21 52.66 10.12 26.29 29.27 23.75 3.41
Arfoud 2,813 18,563 49.82 50.18 39.83 54.73 5.45 24.49 35.17 56.46 8.37 25.17 28.44 22.30 3.68
Moulay Ali Cherif 2,799 18,450 51.47 48.53 44.44 51.72 3.84 26.11 30.65 62.49 6.86 23.26 26.21 20.40 3.58
TOTAL / AVERAGE 21,943 133,288 51.15 48.85 38.13 57.29 4.58 22.97 39.13 53.31 7.56 26.10 28.91 23.48 3.39
Province Minicipality Illiteracy Rate (%) School Attendance (%) (8 to 13 yrs) Economically Active Rate (%) Unemployment Rate (%) Type of Economical Activity
Total Population (over 10 yrs)
Male Female Total Male Female Total Male Female Total Male Female Salaried Employee
Independent Business
House Keeping
Others
Errachidia Errich 34.17 18.97 48.75 87.72 90.80 84.81 23.39 41.15 5.77 20.39 17.79 38.80 69.19 25.84 2.30 2.67
Errachidia 28.74 15.71 41.76 91.69 92.77 90.61 27.70 44.86 10.43 18.87 15.06 35.34 76.90 18.91 0.96 3.22
Tinejdad 33.92 15.28 51.05 87.26 89.55 84.84 21.60 38.47 5.66 16.86 15.11 28.14 63.16 30.33 2.14 4.37
Goulmima 36.52 17.60 54.06 89.27 93.27 85.35 22.93 39.09 7.95 20.06 17.68 30.90 65.43 26.94 6.11 1.51
Arfoud 33.79 16.78 49.92 87.74 91.53 84.02 23.07 40.27 6.01 17.92 16.08 30.18 66.47 25.37 3.57 4.60
Moulay Ali Cherif 41.20 22.87 60.20 84.77 90.46 79.45 23.02 41.89 3.37 13.85 12.64 29.60 57.78 31.86 4.89 5.47
TOTAL / AVERAGE 32.78 17.37 47.88 89.32 91.98 86.74 25.19 42.54 7.88 18.24 15.43 33.41 70.19 23.67 2.60 3.54
Province Minicipality Number of Room in a House Ownership of House Type of House Availability of Utility Home Facility
1 to 2 3 4 more than 5 Number of People in One Room
Privately Owned
Rented Public House (Rent Free)
Apartment Traditional/Contemporary
House
Frugal House Rural House Electricity Water Supply
Bath / Shower
Toilet
Errachidia Errich 28.04 35.90 22.31 13.75 1.65 56.03 29.78 14.18 2.11 66.56 0.23 30.08 79.50 59.16 26.40 83.70
Errachidia 26.77 36.23 23.01 13.99 1.72 48.68 40.32 11.00 9.71 79.86 3.29 5.27 89.78 77.26 34.21 94.63
Tinejdad 12.79 24.35 25.93 36.92 1.30 65.47 23.43 11.10 4.92 70.06 0.34 24.13 65.16 78.94 33.30 80.94
Goulmima 24.19 32.77 20.29 22.75 1.64 60.82 24.70 14.48 3.88 71.84 3.29 20.24 83.04 66.08 36.84 87.64
Arfoud 17.17 30.17 22.84 29.81 1.50 62.57 27.44 9.99 7.68 9.46 0.72 0.22 86.55 81.00 45.77 97.58
Moulay Ali Cherif 25.87 35.47 16.72 21.95 1.77 55.39 36.52 8.09 1.44 62.39 0.07 35.52 89.20 78.97 17.81 97.28
TOTAL / AVERAGE 24.57 34.37 21.88 19.18 1.66 54.32 34.52 11.16 6.67 64.98 2.04 13.74 86.40 75.02 32.97 92.94

FT - 9
Table F.1.7 Socio Data (Communes excluding Khettara Zone) Commune (1/2) Province Cercle Commune Household Population Marriage Status (over 15 yrs old) Ave. Age for Marriage Ave. Birth
Number % of Male % of Female % of under 15 yrs
% of 15 yrs to 59 yrs
% of over 60 yrs
% of Student (6 to 14 yrs)
Single Married Widow / divorced
Total Male Female per female
Errachidia Goulmima Ghr. El Ouloui 1,438 10,958 50.07 49.93 40.45 53.02 6.52 24.36 37.76 52.41 9.82 25.65 28.78 22.27 4.21 Errachidia Errteb 1,748 12,131 49.77 50.23 35.75 56.29 7.96 22.90 36.41 55.93 7.66 25.51 28.12 22.76 3.09 Aoufous 1,955 12,946 49.88 50.12 36.51 54.14 9.34 23.92 36.45 53.51 10.04 26.23 29.15 23.11 2.68 Lkheng 2,026 13,075 48.32 51.68 37.58 53.86 8.56 24.72 39.47 51.96 8.57 27.17 30.05 24.74 3.57 Ouad Naam 1,041 6,729 47.16 52.84 35.98 53.51 10.51 21.73 38.83 49.92 11.25 26.63 28.77 24.82 2.88 Chorfa M'Daghra 1,667 12,207 50.03 49.97 37.49 56.04 6.47 23.55 39.23 53.98 6.79 26.55 28.60 24.75 3.67
Errachidia Errich Ennzala 644 3,675 50.87 49.13 37.58 53.02 9.40 20.32 34.58 52.73 12.69 25.63 28.49 22.70 5.01 Gourrama 1,987 11,216 50.77 49.22 38.13 53.34 8.53 21.68 35.98 53.79 10.23 26.28 28.83 23.65 4.27 Guers Tiallaline 1,619 9,718 50.15 49.85 39.17 52.84 8.00 23.49 34.01 54.58 11.41 25.40 28.73 22.20 4.54 Guir 857 4,716 48.41 51.59 35.91 54.05 10.03 20.83 34.86 54.39 10.76 26.04 28.93 23.53 4.19 M'Zizel 963 6,309 47.92 52.08 39.55 52.65 7.80 25.81 38.16 50.21 11.63 26.60 29.85 23.30 2.95 Sidi Aayad 980 6,372 50.02 49.96 42.02 51.92 6.05 25.08 34.39 55.18 10.44 24.08 26.63 21.38 4.67 Za. Sidi Hamza 1,024 6,624 52.60 47.40 41.09 52.28 6.63 21.87 30.30 60.97 8.73 24.82 27.09 22.15 6.26
Errachidia Imilchil Imilchil 1,245 7,253 49.55 50.45 41.04 50.73 8.22 23.34 23.05 61.35 15.60 22.55 25.90 19.75 6.37 Amouguer 741 4,787 51.29 48.71 42.04 50.96 7.00 23.79 33.93 54.85 11.21 24.89 27.60 22.85 5.02 Outerbat 993 5,898 49.61 50.37 42.10 50.07 7.80 23.29 28.89 58.81 12.30 23.88 27.39 20.75 7.83 Ait Yahya 672 4,219 51.42 48.58 44.95 48.77 6.27 25.75 30.42 57.67 11.91 23.95 27.00 21.06 6.31 Bou Azmou 1,311 7,838 50.38 49.62 40.64 51.08 8.46 23.79 29.27 56.73 14.00 23.53 27.96 19.18 5.28
Errachidia Errissani Sidi Ali 406 3,572 50.97 49.03 51.16 44.03 4.81 28.83 25.09 67.41 7.51 21.95 24.52 19.54 5.97 TOTAL / AVERAGE 23,317 150,243 49.86 50.14 39.16 52.94 7.90 23.57 34.72 54.97 10.30 25.43 28.31 22.64 4.36
Province Cercle Commune Illiteracy Rate (%) School Attendance (%) (8 to 13 yrs) Economically Active Rate (%) Unemployment Rate (%) Type of Economical Activity Total
Population Male Female Total Male Female Total Male Female Total Male Female Salaried
Employee Independent Business
House Keeping
Others
Errachidia Goulmima Ghr. El Ouloui 51.31 30.33 71.80 80.89 95.32 67.56 26.41 43.83 8.95 16.41 17.92 9.00 51.03 24.31 19.05 5.61 Errachidia Errteb 56.69 35.61 77.82 70.50 85.12 54.49 25.24 48.01 2.69 17.39 17.01 24.24 40.73 39.09 19.45 0.73 Aoufous 43.65 19.34 67.19 81.26 93.06 69.85 20.83 35.53 4.21 21.57 23.38 5.55 49.89 36.60 1.11 2.40 Lkheng 43.46 26.70 58.79 83.58 90.49 76.44 26.95 42.25 12.65 15.79 13.97 21.46 41.24 33.63 20.80 4.33 Ouad Naam 56.02 37.56 71.91 68.62 76.93 59.95 25.64 45.20 8.19 25.07 28.21 9.62 23.64 41.66 34.70 0.00 Chorfa M'Daghra 41.78 21.02 62.49 80.09 93.02 65.47 27.67 44.40 10.93 25.30 11.75 80.42 50.90 35.43 9.55 4.11
Errachidia Errich Ennzala 76.55 64.37 89.38 44.19 59.60 27.58 37.50 57.62 16.66 11.23 12.82 5.57 13.62 43.66 42.10 0.63 Gourrama 63.89 52.36 75.56 53.13 58.11 47.33 30.96 51.52 9.74 16.58 18.86 4.13 22.90 43.16 33.62 0.33 Guers Tiallaline 56.95 38.54 75.12 75.66 90.52 59.06 30.46 45.81 15.03 11.94 15.61 0.67 26.01 41.88 32.08 0.04 Guir 70.30 62.75 77.01 43.11 52.16 33.12 37.55 54.54 21.62 10.85 10.78 11.02 11.05 42.13 46.44 0.37 M'Zizel 58.11 35.56 79.47 55.78 78.03 35.61 28.62 47.33 11.41 10.93 12.11 6.45 19.26 40.74 39.26 0.74 Sidi Aayad 59.44 42.08 76.79 63.85 80.46 46.28 33.02 45.44 20.59 7.88 9.45 4.43 23.89 35.43 39.23 1.45 Za. Sidi Hamza 86.21 75.99 97.10 24.42 37.75 7.77 42.04 55.79 26.78 3.24 3.30 3.10 7.75 40.29 51.82 0.15
Errachidia Imilchil Imilchil 89.18 82.77 95.39 20.18 27.27 12.62 34.42 60.90 8.42 8.29 7.15 16.39 14.59 42.49 42.49 0.42 Amouguer 76.36 59.62 93.38 37.56 56.56 15.69 40.08 52.72 26.77 5.09 5.85 3.51 12.75 33.44 53.16 0.65 Outerbat 88.24 78.52 98.28 16.85 31.27 3.34 39.08 56.30 22.12 6.52 7.94 2.97 14.16 39.63 46.07 0.14 Ait Yahya 85.50 73.76 97.76 40.17 65.38 12.19 50.42 53.02 47.66 1.49 2.76 0.00 5.19 27.74 66.98 0.09 Bou Azmou 94.00 88.92 99.27 19.58 36.80 0.86 44.78 57.07 32.30 2.69 3.76 0.79 6.25 35.32 58.28 0.15
Errachidia Errissani Sidi Ali 91.75 87.43 96.19 23.43 30.94 14.80 23.80 45.34 1.41 6.88 6.85 8.00 13.14 44.96 41.77 0.12 TOTAL / AVERAGE 62.75 46.81 78.35 58.41 71.20 44.85 31.12 48.12 14.09 13.74 13.53 14.60 28.78 37.43 31.33 1.60
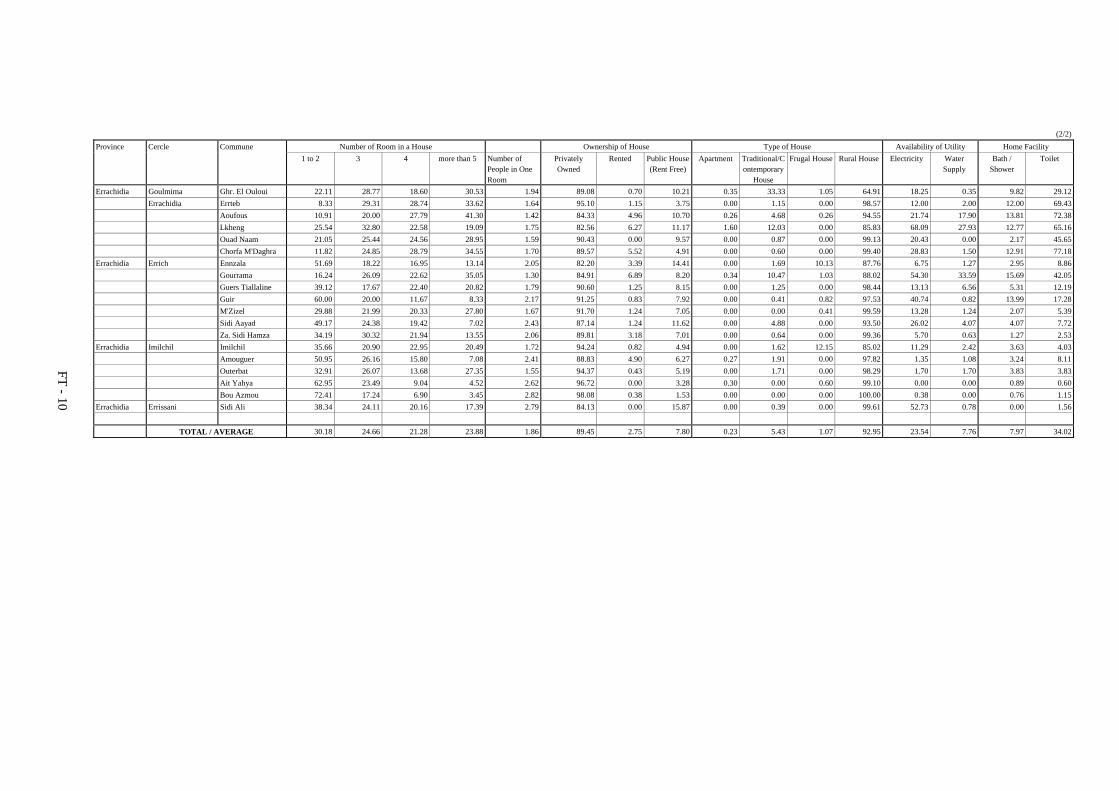
FT - 10
(2/2) Province Cercle Commune Number of Room in a House Ownership of House Type of House Availability of Utility Home Facility
1 to 2 3 4 more than 5 Number of People in One Room
Privately Owned
Rented Public House (Rent Free)
Apartment Traditional/Contemporary
House
Frugal House Rural House Electricity Water Supply
Bath / Shower
Toilet
Errachidia Goulmima Ghr. El Ouloui 22.11 28.77 18.60 30.53 1.94 89.08 0.70 10.21 0.35 33.33 1.05 64.91 18.25 0.35 9.82 29.12 Errachidia Errteb 8.33 29.31 28.74 33.62 1.64 95.10 1.15 3.75 0.00 1.15 0.00 98.57 12.00 2.00 12.00 69.43 Aoufous 10.91 20.00 27.79 41.30 1.42 84.33 4.96 10.70 0.26 4.68 0.26 94.55 21.74 17.90 13.81 72.38 Lkheng 25.54 32.80 22.58 19.09 1.75 82.56 6.27 11.17 1.60 12.03 0.00 85.83 68.09 27.93 12.77 65.16 Ouad Naam 21.05 25.44 24.56 28.95 1.59 90.43 0.00 9.57 0.00 0.87 0.00 99.13 20.43 0.00 2.17 45.65 Chorfa M'Daghra 11.82 24.85 28.79 34.55 1.70 89.57 5.52 4.91 0.00 0.60 0.00 99.40 28.83 1.50 12.91 77.18
Errachidia Errich Ennzala 51.69 18.22 16.95 13.14 2.05 82.20 3.39 14.41 0.00 1.69 10.13 87.76 6.75 1.27 2.95 8.86 Gourrama 16.24 26.09 22.62 35.05 1.30 84.91 6.89 8.20 0.34 10.47 1.03 88.02 54.30 33.59 15.69 42.05 Guers Tiallaline 39.12 17.67 22.40 20.82 1.79 90.60 1.25 8.15 0.00 1.25 0.00 98.44 13.13 6.56 5.31 12.19 Guir 60.00 20.00 11.67 8.33 2.17 91.25 0.83 7.92 0.00 0.41 0.82 97.53 40.74 0.82 13.99 17.28 M'Zizel 29.88 21.99 20.33 27.80 1.67 91.70 1.24 7.05 0.00 0.00 0.41 99.59 13.28 1.24 2.07 5.39 Sidi Aayad 49.17 24.38 19.42 7.02 2.43 87.14 1.24 11.62 0.00 4.88 0.00 93.50 26.02 4.07 4.07 7.72 Za. Sidi Hamza 34.19 30.32 21.94 13.55 2.06 89.81 3.18 7.01 0.00 0.64 0.00 99.36 5.70 0.63 1.27 2.53
Errachidia Imilchil Imilchil 35.66 20.90 22.95 20.49 1.72 94.24 0.82 4.94 0.00 1.62 12.15 85.02 11.29 2.42 3.63 4.03 Amouguer 50.95 26.16 15.80 7.08 2.41 88.83 4.90 6.27 0.27 1.91 0.00 97.82 1.35 1.08 3.24 8.11 Outerbat 32.91 26.07 13.68 27.35 1.55 94.37 0.43 5.19 0.00 1.71 0.00 98.29 1.70 1.70 3.83 3.83 Ait Yahya 62.95 23.49 9.04 4.52 2.62 96.72 0.00 3.28 0.30 0.00 0.60 99.10 0.00 0.00 0.89 0.60 Bou Azmou 72.41 17.24 6.90 3.45 2.82 98.08 0.38 1.53 0.00 0.00 0.00 100.00 0.38 0.00 0.76 1.15
Errachidia Errissani Sidi Ali 38.34 24.11 20.16 17.39 2.79 84.13 0.00 15.87 0.00 0.39 0.00 99.61 52.73 0.78 0.00 1.56 TOTAL / AVERAGE 30.18 24.66 21.28 23.88 1.86 89.45 2.75 7.80 0.23 5.43 1.07 92.95 23.54 7.76 7.97 34.02
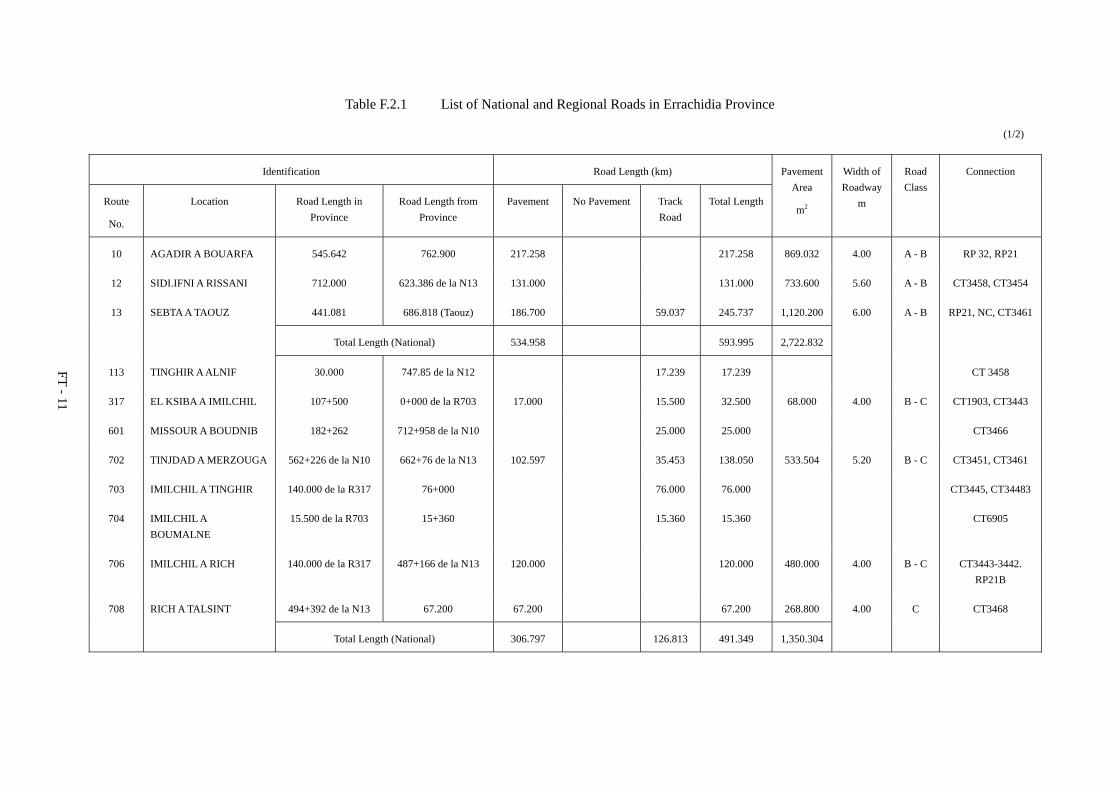
FT - 11
Table F.2.1 List of National and Regional Roads in Errachidia Province
(1/2)
Identification Road Length (km)
Route
No.
Location Road Length in Province
Road Length from Province
Pavement No Pavement Track Road
Total Length
Pavement Area
m2
Width of Roadway
m
Road Class
Connection
10 AGADIR A BOUARFA 545.642 762.900 217.258 217.258 869.032 4.00 A - B RP 32, RP21
12 SIDI.IFNI A RISSANI 712.000 623.386 de la N13 131.000 131.000 733.600 5.60 A - B CT3458, CT3454
13 SEBTA A TAOUZ 441.081 686.818 (Taouz) 186.700 59.037 245.737 1,120.200 6.00 A - B RP21, NC, CT3461
Total Length (National) 534.958 593.995 2,722.832
113 TINGHIR A ALNIF 30.000 747.85 de la N12 17.239 17.239 CT 3458
317 EL KSIBA A IMILCHIL 107+500 0+000 de la R703 17.000 15.500 32.500 68.000 4.00 B - C CT1903, CT3443
601 MISSOUR A BOUDNIB 182+262 712+958 de la N10 25.000 25.000 CT3466
702 TINJDAD A MERZOUGA 562+226 de la N10 662+76 de la N13 102.597 35.453 138.050 533.504 5.20 B - C CT3451, CT3461
703 IMILCHIL A TINGHIR 140.000 de la R317 76+000 76.000 76.000 CT3445, CT34483
704 IMILCHIL A BOUMALNE
15.500 de la R703 15+360 15.360 15.360 CT6905
706 IMILCHIL A RICH 140.000 de la R317 487+166 de la N13 120.000 120.000 480.000 4.00 B - C CT3443-3442. RP21B
708 RICH A TALSINT 494+392 de la N13 67.200 67.200 67.200 268.800 4.00 C CT3468
Total Length (National) 306.797 126.813 491.349 1,350.304
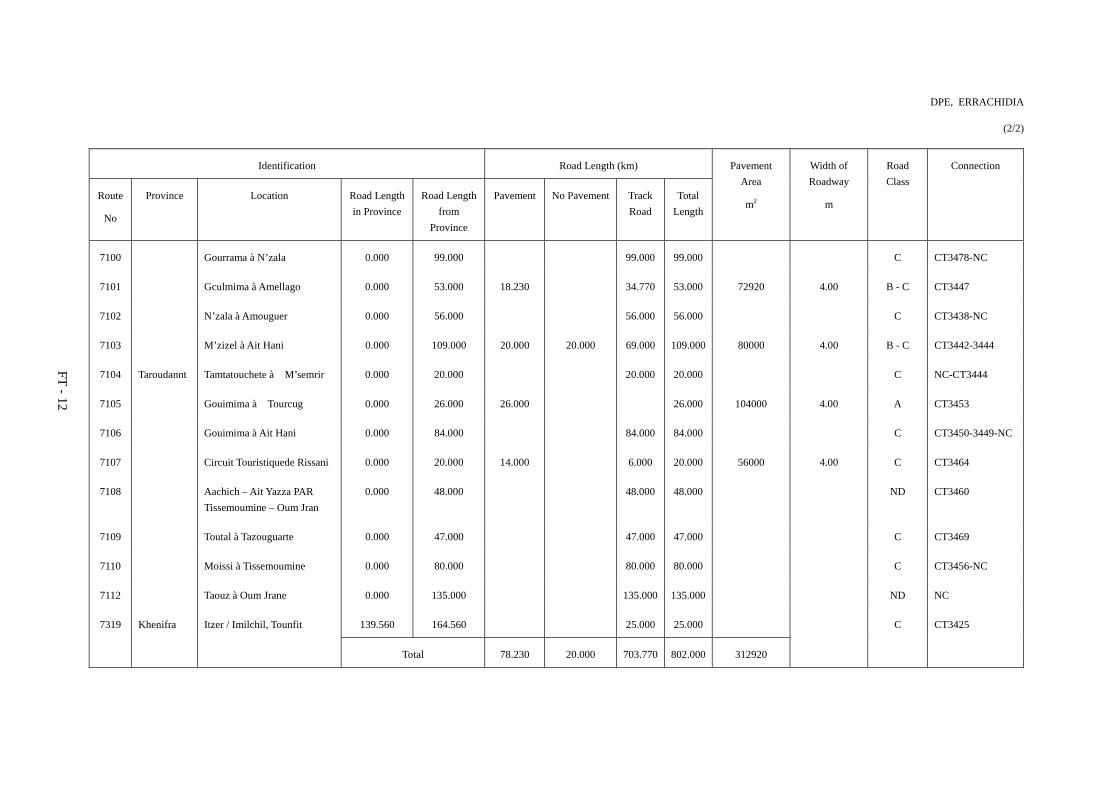
FT - 12
DPE, ERRACHIDIA
(2/2)
Identification Road Length (km)
Route
No
Province Location Road Length in Province
Road Length from
Province
Pavement No Pavement Track Road
Total Length
Pavement Area
m2
Width of Roadway
m
Road Class
Connection
7100 Gourrama à N’zala 0.000 99.000 99.000 99.000 C CT3478-NC
7101 Gculmima à Amellago 0.000 53.000 18.230 34.770 53.000 72920 4.00 B - C CT3447
7102 N’zala à Amouguer 0.000 56.000 56.000 56.000 C CT3438-NC
7103 M’zizel à Ait Hani 0.000 109.000 20.000 20.000 69.000 109.000 80000 4.00 B - C CT3442-3444
7104 Taroudannt Tamtatouchete à M’semrir 0.000 20.000 20.000 20.000 C NC-CT3444
7105 Gouimima à Tourcug 0.000 26.000 26.000 26.000 104000 4.00 A CT3453
7106 Gouimima à Ait Hani 0.000 84.000 84.000 84.000 C CT3450-3449-NC
7107 Circuit Touristiquede Rissani 0.000 20.000 14.000 6.000 20.000 56000 4.00 C CT3464
7108 Aachich – Ait Yazza PAR Tissemoumine – Oum Jran
0.000 48.000 48.000 48.000 ND CT3460
7109 Toutal à Tazouguarte 0.000 47.000 47.000 47.000 C CT3469
7110 Moissi à Tissemoumine 0.000 80.000 80.000 80.000 C CT3456-NC
7112 Taouz à Oum Jrane 0.000 135.000 135.000 135.000 ND NC
7319 Khenifra Itzer / Imilchil, Tounfit 139.560 164.560 25.000 25.000 C CT3425
Total 78.230 20.000 703.770 802.000 312920
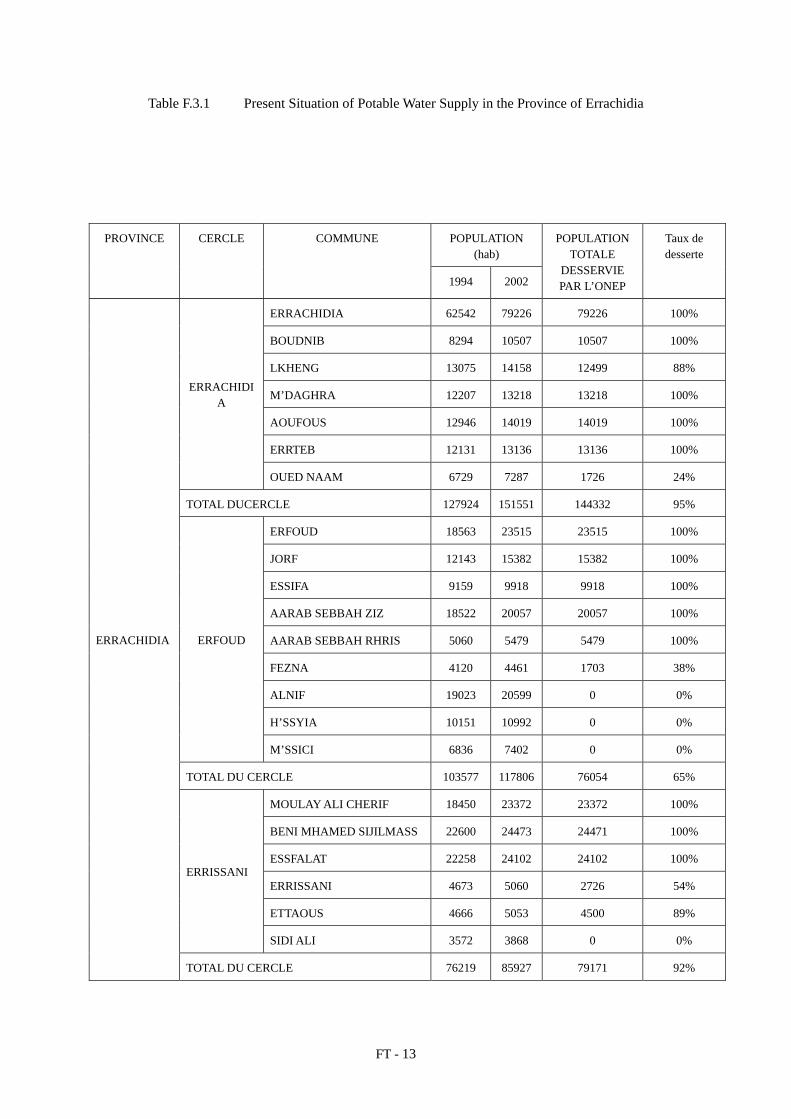
FT - 13
Table F.3.1 Present Situation of Potable Water Supply in the Province of Errachidia
POPULATION (hab)
PROVINCE CERCLE COMMUNE
1994 2002
POPULATION TOTALE
DESSERVIE PAR L’ONEP
Taux de desserte
ERRACHIDIA 62542 79226 79226 100%
BOUDNIB 8294 10507 10507 100%
LKHENG 13075 14158 12499 88%
M’DAGHRA 12207 13218 13218 100%
AOUFOUS 12946 14019 14019 100%
ERRTEB 12131 13136 13136 100%
ERRACHIDIA
OUED NAAM 6729 7287 1726 24%
TOTAL DUCERCLE 127924 151551 144332 95%
ERFOUD 18563 23515 23515 100%
JORF 12143 15382 15382 100%
ESSIFA 9159 9918 9918 100%
AARAB SEBBAH ZIZ 18522 20057 20057 100%
AARAB SEBBAH RHRIS 5060 5479 5479 100%
FEZNA 4120 4461 1703 38%
ALNIF 19023 20599 0 0%
H’SSYIA 10151 10992 0 0%
ERFOUD
M’SSICI 6836 7402 0 0%
TOTAL DU CERCLE 103577 117806 76054 65%
MOULAY ALI CHERIF 18450 23372 23372 100%
BENI MHAMED SIJILMASS 22600 24473 24471 100%
ESSFALAT 22258 24102 24102 100%
ERRISSANI 4673 5060 2726 54%
ETTAOUS 4666 5053 4500 89%
ERRISSANI
SIDI ALI 3572 3868 0 0%
ERRACHIDIA
TOTAL DU CERCLE 76219 85927 79171 92%
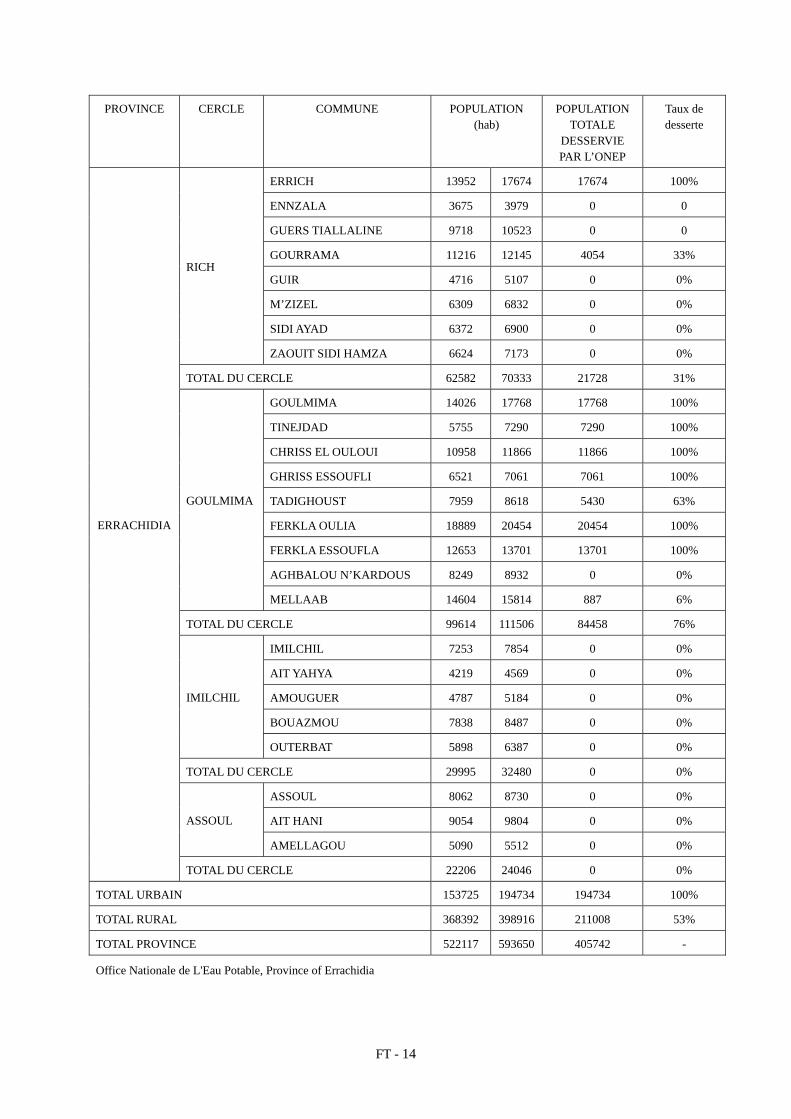
FT - 14
PROVINCE CERCLE COMMUNE POPULATION (hab)
POPULATION TOTALE
DESSERVIE PAR L’ONEP
Taux de desserte
ERRICH 13952 17674 17674 100%
ENNZALA 3675 3979 0 0
GUERS TIALLALINE 9718 10523 0 0
GOURRAMA 11216 12145 4054 33%
GUIR 4716 5107 0 0%
M’ZIZEL 6309 6832 0 0%
SIDI AYAD 6372 6900 0 0%
RICH
ZAOUIT SIDI HAMZA 6624 7173 0 0%
TOTAL DU CERCLE 62582 70333 21728 31%
GOULMIMA 14026 17768 17768 100%
TINEJDAD 5755 7290 7290 100%
CHRISS EL OULOUI 10958 11866 11866 100%
GHRISS ESSOUFLI 6521 7061 7061 100%
TADIGHOUST 7959 8618 5430 63%
FERKLA OULIA 18889 20454 20454 100%
FERKLA ESSOUFLA 12653 13701 13701 100%
AGHBALOU N’KARDOUS 8249 8932 0 0%
GOULMIMA
MELLAAB 14604 15814 887 6%
TOTAL DU CERCLE 99614 111506 84458 76%
IMILCHIL 7253 7854 0 0%
AIT YAHYA 4219 4569 0 0%
AMOUGUER 4787 5184 0 0%
BOUAZMOU 7838 8487 0 0%
IMILCHIL
OUTERBAT 5898 6387 0 0%
TOTAL DU CERCLE 29995 32480 0 0%
ASSOUL 8062 8730 0 0%
AIT HANI 9054 9804 0 0% ASSOUL
AMELLAGOU 5090 5512 0 0%
ERRACHIDIA
TOTAL DU CERCLE 22206 24046 0 0%
TOTAL URBAIN 153725 194734 194734 100%
TOTAL RURAL 368392 398916 211008 53%
TOTAL PROVINCE 522117 593650 405742 -
Office Nationale de L'Eau Potable, Province of Errachidia

FT - 15
Table F.4.1 Electric Power supply
Commune rural Ksar Year Commune rural Ksar Year
AARAB SEBBAH GHERIS EL BOUIYA 1998 AIT HANI AIT DAOUD OU AZZI
2004
AARAB SEBBAH GHERIS HANNABOU+ 1998 AIT HANI AIT HANI+ 2004 AARAB SEBBAH GHERIS KHATARA 1998 AIT HANI AIT LAHCEN 2004 AARAB SEBBAH GHERIS KRAIR 1998 AIT HANI ASSINEG 2004 AARAB SEBBAH ZIZ CHIYAHNA+ 1997 AIT HANI IKADMANE 2004 AARAB SEBBAH ZIZ CHLALFA 1998 AIT HANI TAADADAT 2004 AARAB SEBBAH ZIZ ELKHANDEG 1998 AIT HANI TAMATATOUCHTE 2004 AARAB SEBBAH ZIZ KSAKIS 1998 AIT HANI TAYAJOUT + 2004 AARAB SEBBAH ZIZ KSAR KSIBA 1997 AIT HANI TIIDRINE 2004
AARAB SEBBAH ZIZ KSBAT BELLAHCEN
1998 AIT HANI TIMOULA 2004
AARAB SEBBAH ZIZ KT BEN ALI 1997 AIT HANI TIZOUGAGHINE 2004 AARAB SEBBAH ZIZ LEBROUJ 1998 AIT HANI TOUMLILTE 2004 AARAB SEBBAH ZIZ LHAINE 1997 ALNIF ACHBAROU 2001 AARAB SEBBAH ZIZ L'HSASNA+ 1998 ALNIF AIT EL HABIB 2004 AARAB SEBBAH ZIZ MY BRAHIM 1998 ALNIF AIT BEN SAID 2004 AARAB SEBBAH ZIZ OD ALI 1997 ALNIF AIT HAMMOU 2004 AARAB SEBBAH ZIZ OD ELHACHMI 1999 ALNIF AIT SARROUD 2004 AARAB SEBBAH ZIZ OD MAATALLAH 1997 ALNIF AIT ZEGGANE 2004 AARAB SEBBAH ZIZ OD M'BAREK 1999 ALNIF ALNIF 2001 AARAB SEBBAH ZIZ OD:MOULOUD+ 1997 ALNIF AMMAR 2001 AARAB SEBBAH ZIZ OULAD ABDENBI 1998 ALNIF AZEKOUR 2001
AARAB SEBBAH ZIZ OULAD BOUZIANE+
1998 ALNIF MAGHNIA 2001
AARAB SEBBAH ZIZ OULAD OGBA+ 1997 ALNIF TAALLALT 2004 AARAB SEBBAH ZIZ OULAD ZAHRA 1998 ALNIF TABOURIKT 2004
AARAB SEBBAH ZIZ OULED BHAR(EXT BT)
1997 ALNIF TAGALGOULTE 2004
AARAB SEBBAH ZIZ OULED TALEB 1998 ALNIF TIZI N'TERFIG 2001 AARAB SEBBAH ZIZ RZIKATE(EXT-BT)+ 1999 ALNIF TOUGHZA 2001 AGHBALO N'KERDOUS AIT ABDSMAD 2002 AMOUGUER AMOUGUEUR 2005 AGHBALO N'KERDOUS IGOUDMANE 2002 AMOUGUER TAGUENDOUST 2005 AGHBALO N'KERDOUS IRBIBENE 2002 AOUFOUS EL GARA 1997 AGHBALO N'KERDOUS IZAKARENE 2002 AOUFOUS JRAMNA 1997 AGHBALO N'KERDOUS OULN'TAMAYOUST 2002 AOUFOUS KSAR JDID 1997 AGHBALO N'KERDOUS TAGHIA+ 2002 AOUFOUS OULAD AISSA 1997
AGHBALO N'KERDOUS TAGHNBOUT 2002 AOUFOUS OULAD CHAKER (II)
1997
AGHBALO N'KERDOUS TAOUDAATE 2002 AOUFOUS OULAD CHAKER(I)
1997
AGHBALO N'KERDOUS TAOURIRT N'AIT MIMOUN
2002 AOUFOUS ZAOUIT AMELKIS 1997
AGHBALO N'KERDOUS TARGUIOUT 2002 AOUFOUS ZAOUIT AOUFOUS
2000
AGHBALO N'KERDOUS TASAKHTE 2002 AOUFOUS ZOUALA+ 1997 AGHBALO N'KERDOUS TIMKITE 2002 AOUFOUS ZOUIOUA 1997 AGHBALO N'KERDOUS TOURTITE 2002 ARFOUD HBIBAT 1997 ARFOUD JRANA+ 1997 ARFOUD RMILA 1997
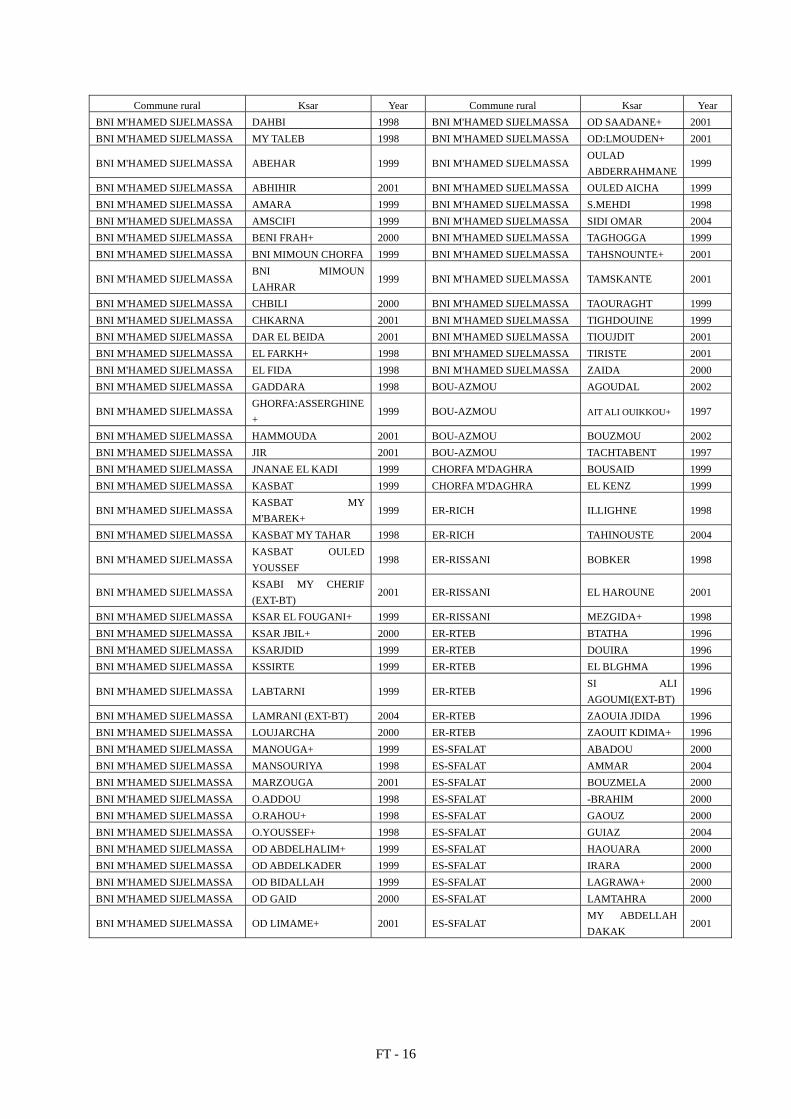
FT - 16
Commune rural Ksar Year Commune rural Ksar Year BNI M'HAMED SIJELMASSA DAHBI 1998 BNI M'HAMED SIJELMASSA OD SAADANE+ 2001 BNI M'HAMED SIJELMASSA MY TALEB 1998 BNI M'HAMED SIJELMASSA OD:LMOUDEN+ 2001
BNI M'HAMED SIJELMASSA ABEHAR 1999 BNI M'HAMED SIJELMASSA OULAD ABDERRAHMANE
1999
BNI M'HAMED SIJELMASSA ABHIHIR 2001 BNI M'HAMED SIJELMASSA OULED AICHA 1999 BNI M'HAMED SIJELMASSA AMARA 1999 BNI M'HAMED SIJELMASSA S.MEHDI 1998 BNI M'HAMED SIJELMASSA AMSCIFI 1999 BNI M'HAMED SIJELMASSA SIDI OMAR 2004 BNI M'HAMED SIJELMASSA BENI FRAH+ 2000 BNI M'HAMED SIJELMASSA TAGHOGGA 1999 BNI M'HAMED SIJELMASSA BNI MIMOUN CHORFA 1999 BNI M'HAMED SIJELMASSA TAHSNOUNTE+ 2001
BNI M'HAMED SIJELMASSA BNI MIMOUN LAHRAR
1999 BNI M'HAMED SIJELMASSA TAMSKANTE 2001
BNI M'HAMED SIJELMASSA CHBILI 2000 BNI M'HAMED SIJELMASSA TAOURAGHT 1999 BNI M'HAMED SIJELMASSA CHKARNA 2001 BNI M'HAMED SIJELMASSA TIGHDOUINE 1999 BNI M'HAMED SIJELMASSA DAR EL BEIDA 2001 BNI M'HAMED SIJELMASSA TIOUJDIT 2001 BNI M'HAMED SIJELMASSA EL FARKH+ 1998 BNI M'HAMED SIJELMASSA TIRISTE 2001 BNI M'HAMED SIJELMASSA EL FIDA 1998 BNI M'HAMED SIJELMASSA ZAIDA 2000 BNI M'HAMED SIJELMASSA GADDARA 1998 BOU-AZMOU AGOUDAL 2002
BNI M'HAMED SIJELMASSA GHORFA:ASSERGHINE+
1999 BOU-AZMOU AIT ALI OUIKKOU+ 1997
BNI M'HAMED SIJELMASSA HAMMOUDA 2001 BOU-AZMOU BOUZMOU 2002 BNI M'HAMED SIJELMASSA JIR 2001 BOU-AZMOU TACHTABENT 1997 BNI M'HAMED SIJELMASSA JNANAE EL KADI 1999 CHORFA M'DAGHRA BOUSAID 1999 BNI M'HAMED SIJELMASSA KASBAT 1999 CHORFA M'DAGHRA EL KENZ 1999
BNI M'HAMED SIJELMASSA KASBAT MY M'BAREK+
1999 ER-RICH ILLIGHNE 1998
BNI M'HAMED SIJELMASSA KASBAT MY TAHAR 1998 ER-RICH TAHINOUSTE 2004
BNI M'HAMED SIJELMASSA KASBAT OULED YOUSSEF
1998 ER-RISSANI BOBKER 1998
BNI M'HAMED SIJELMASSA KSABI MY CHERIF (EXT-BT)
2001 ER-RISSANI EL HAROUNE 2001
BNI M'HAMED SIJELMASSA KSAR EL FOUGANI+ 1999 ER-RISSANI MEZGIDA+ 1998 BNI M'HAMED SIJELMASSA KSAR JBIL+ 2000 ER-RTEB BTATHA 1996 BNI M'HAMED SIJELMASSA KSARJDID 1999 ER-RTEB DOUIRA 1996 BNI M'HAMED SIJELMASSA KSSIRTE 1999 ER-RTEB EL BLGHMA 1996
BNI M'HAMED SIJELMASSA LABTARNI 1999 ER-RTEB SI ALI AGOUMI(EXT-BT)
1996
BNI M'HAMED SIJELMASSA LAMRANI (EXT-BT) 2004 ER-RTEB ZAOUIA JDIDA 1996 BNI M'HAMED SIJELMASSA LOUJARCHA 2000 ER-RTEB ZAOUIT KDIMA+ 1996 BNI M'HAMED SIJELMASSA MANOUGA+ 1999 ES-SFALAT ABADOU 2000 BNI M'HAMED SIJELMASSA MANSOURIYA 1998 ES-SFALAT AMMAR 2004 BNI M'HAMED SIJELMASSA MARZOUGA 2001 ES-SFALAT BOUZMELA 2000 BNI M'HAMED SIJELMASSA O.ADDOU 1998 ES-SFALAT -BRAHIM 2000 BNI M'HAMED SIJELMASSA O.RAHOU+ 1998 ES-SFALAT GAOUZ 2000 BNI M'HAMED SIJELMASSA O.YOUSSEF+ 1998 ES-SFALAT GUIAZ 2004 BNI M'HAMED SIJELMASSA OD ABDELHALIM+ 1999 ES-SFALAT HAOUARA 2000 BNI M'HAMED SIJELMASSA OD ABDELKADER 1999 ES-SFALAT IRARA 2000 BNI M'HAMED SIJELMASSA OD BIDALLAH 1999 ES-SFALAT LAGRAWA+ 2000 BNI M'HAMED SIJELMASSA OD GAID 2000 ES-SFALAT LAMTAHRA 2000
BNI M'HAMED SIJELMASSA OD LIMAME+ 2001 ES-SFALAT MY ABDELLAH DAKAK
2001

FT - 17
Commune rural Ksar Year Commune rural Ksar Year
ES-SFALAT OD:MSALEM 2004 FERKALA ES-SOUFLA AIT BA MAATI(EXT-BT)
1999
ES-SFALAT OD:SIDI BRAHIM+ 2000 FERKALA ES-SOUFLA AIT BEN OMAR 1999
ES-SFALAT OUCHEN 2004 FERKALA ES-SOUFLA AIT M'AMMER AKDIM
1999
ES-SFALAT OUIGHLANE 1997 FERKALA ES-SOUFLA AIT MOULAY EL MAMOUN
1999
ES-SFALAT OULAD BOUALI+ 2000 FERKALA ES-SOUFLA EL KSIBA 1999 ES-SFALAT OULAD JMIAA 2000 FERKALA ES-SOUFLA QTAA EL OUED 1999 ES-SFALAT OULED OUILAL 2000 FERKALA ES-SOUFLA TALALT+ 1999 ES-SFALAT OULED YAHIA 2000 FERKALA ES-SOUFLA TAYARZA LAKDIM 1999 ES-SFALAT SARET BAHAJ 2000 FERKALA ES-SOUFLA TIGHFFART 1999 ES-SFALAT TABOUASSAMT 1997 FERKALA ES-SOUFLA TIZOUGGAGHINE 1999 ES-SFALAT TABOUBRIKTE( 2000 FERKALA ES-SOUFLA Z.S.EL HOUARI+ 1999 ES-SFALAT TAGHANJAOUTE 2000 FEZNA KSAR JDID 1997
ES-SFALAT TAZEGZOUT(ZT SIDI BOU-
2000 FEZNA LAKSIBA 1997
ES-SFALAT TINRHRAS 2000 FEZNA O.CHERKI 1997 ES-SFALAT ZAOUIAT SIDI ALI 2000 FEZNA O.JELLAL+ 1997 ES-SFALAT ZAOUIT EL MATI 2000 FEZNA OULAD GHANEM 1997
ES-SFALAT ZT EL HAJ BOUZINA (EXT-BT)
2001 GHERIS EL OULOUI AIT KETTOU 1998
ES-SFALAT ZT ELKADI 2000 GHERIS EL OULOUI HRT JDID 1998 ES-SFALAT ZT ER RMAL 2000 GHERIS EL OULOUI TIAONIN+ 1998 ES-SFALAT ZT MELAYKHAF) 2000 GHERIS EL OULOUI TIMAHRACHT II 1998
ES-SFALAT ZT SIDI ELGHAZI BEL KACEM
2000 GOULMIMA IGHRAME N'OUGOUMMAD
2000
ES-SFALAT ZT SIDI ELGHAZI BEN ARBI
2000 GOURRAMA LAHRI + 2000
ES-SIFA AL MOUNGRA 1998 GOURRAMA MOUGUEUR 2001 ES-SIFA DOUAR 1998 GOURRAMA TAFENDAST 2000
ES-SIFA K.ZT.S.ABDELLAH BOUBKER
1998 GOURRAMA TAGRIRT 2000
ES-SIFA KSAR GLAGLA 1998 GOURRAMA TALHARITE 2000
ES-SIFA KSAR OD.YAHYA(KT EL KAID+
1998 GOURRAMA TIOUZAGUINE 2000
ES-SIFA KT OD MOUMEN) 1998 GOURRAMA TIT N'ALI 2000 ES-SIFA OULED HSAINE 1998 GUERS TIAALLALINE A.LEFKIH+ 2000 ES-SIFA SIFA 1998 GUERS TIAALLALINE AIT AOUDA 2000 ET-TAOUS HASSI LABIED 1998 GUERS TIAALLALINE AIT TIKERT 2000 ET-TAOUS KHMLIA 1998 GUERS TIAALLALINE AMALOU 2000 ET-TAOUS TABOUMIAT 1999 GUERS TIAALLALINE BOULILI 2001 ET-TAOUS TANAMOST + 1998 GUERS TIAALLALINE BOUNIGAREF 2000 ET-TAOUS TIHARINE+ 1999 GUERS TIAALLALINE HAMT M.ALICHRIF 1998 FERKALA EL OULIA AMALAL 1999 GUERS TIAALLALINE KHARZOUZA+ 2000 FERKALA EL OULIA ASRIR 1997 GUERS TIAALLALINE LHAINE 2000 FERKALA EL OULIA AZAG NOUCHEN 2002 GUERS TIAALLALINE TAZMAMART 2005 FERKALA EL OULIA EL KHORBATE 1999 FERKALA EL OULIA KSOURS ASSAT 1999 FERKALA EL OULIA TAMARDOUTE 1999
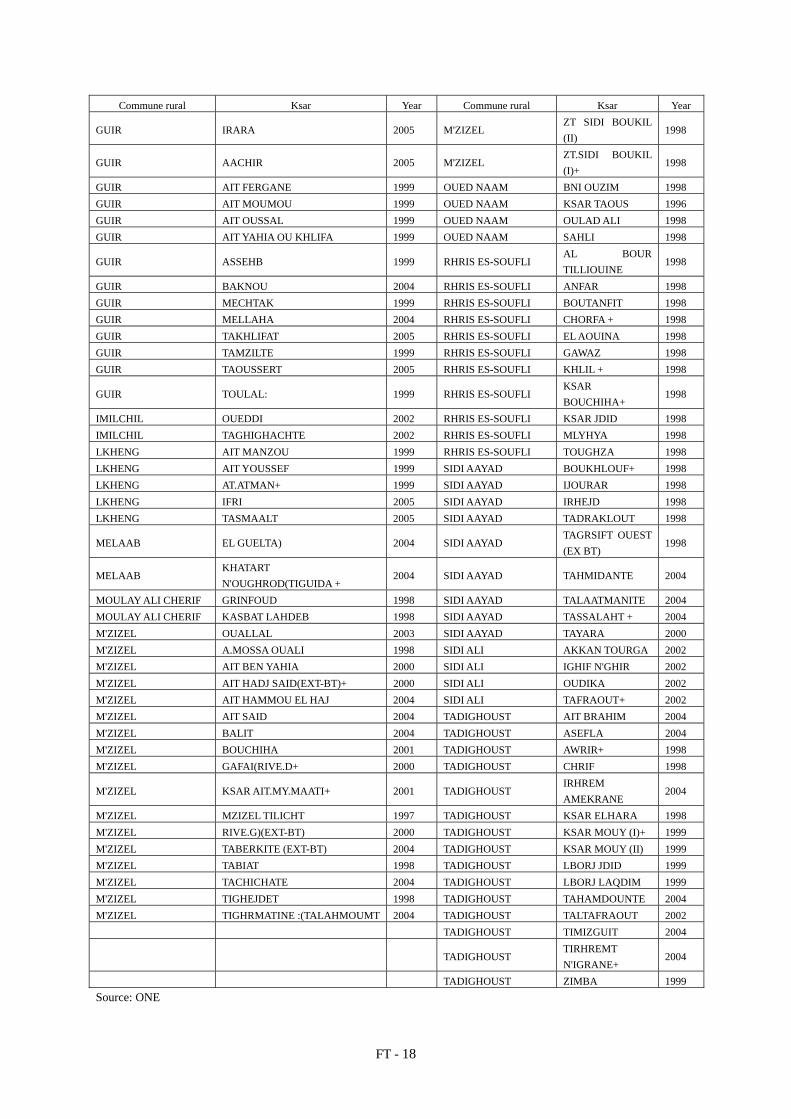
FT - 18
Commune rural Ksar Year Commune rural Ksar Year
GUIR IRARA 2005 M'ZIZEL ZT SIDI BOUKIL (II)
1998
GUIR AACHIR 2005 M'ZIZEL ZT.SIDI BOUKIL (I)+
1998
GUIR AIT FERGANE 1999 OUED NAAM BNI OUZIM 1998 GUIR AIT MOUMOU 1999 OUED NAAM KSAR TAOUS 1996 GUIR AIT OUSSAL 1999 OUED NAAM OULAD ALI 1998 GUIR AIT YAHIA OU KHLIFA 1999 OUED NAAM SAHLI 1998
GUIR ASSEHB 1999 RHRIS ES-SOUFLI AL BOUR TILLIOUINE
1998
GUIR BAKNOU 2004 RHRIS ES-SOUFLI ANFAR 1998 GUIR MECHTAK 1999 RHRIS ES-SOUFLI BOUTANFIT 1998 GUIR MELLAHA 2004 RHRIS ES-SOUFLI CHORFA + 1998 GUIR TAKHLIFAT 2005 RHRIS ES-SOUFLI EL AOUINA 1998 GUIR TAMZILTE 1999 RHRIS ES-SOUFLI GAWAZ 1998 GUIR TAOUSSERT 2005 RHRIS ES-SOUFLI KHLIL + 1998
GUIR TOULAL: 1999 RHRIS ES-SOUFLI KSAR BOUCHIHA+
1998
IMILCHIL OUEDDI 2002 RHRIS ES-SOUFLI KSAR JDID 1998 IMILCHIL TAGHIGHACHTE 2002 RHRIS ES-SOUFLI MLYHYA 1998 LKHENG AIT MANZOU 1999 RHRIS ES-SOUFLI TOUGHZA 1998 LKHENG AIT YOUSSEF 1999 SIDI AAYAD BOUKHLOUF+ 1998 LKHENG AT.ATMAN+ 1999 SIDI AAYAD IJOURAR 1998 LKHENG IFRI 2005 SIDI AAYAD IRHEJD 1998 LKHENG TASMAALT 2005 SIDI AAYAD TADRAKLOUT 1998
MELAAB EL GUELTA) 2004 SIDI AAYAD TAGRSIFT OUEST (EX BT)
1998
MELAAB KHATART N'OUGHROD(TIGUIDA +
2004 SIDI AAYAD TAHMIDANTE 2004
MOULAY ALI CHERIF GRINFOUD 1998 SIDI AAYAD TALAATMANITE 2004 MOULAY ALI CHERIF KASBAT LAHDEB 1998 SIDI AAYAD TASSALAHT + 2004 M'ZIZEL OUALLAL 2003 SIDI AAYAD TAYARA 2000 M'ZIZEL A.MOSSA OUALI 1998 SIDI ALI AKKAN TOURGA 2002 M'ZIZEL AIT BEN YAHIA 2000 SIDI ALI IGHIF N'GHIR 2002 M'ZIZEL AIT HADJ SAID(EXT-BT)+ 2000 SIDI ALI OUDIKA 2002 M'ZIZEL AIT HAMMOU EL HAJ 2004 SIDI ALI TAFRAOUT+ 2002 M'ZIZEL AIT SAID 2004 TADIGHOUST AIT BRAHIM 2004 M'ZIZEL BALIT 2004 TADIGHOUST ASEFLA 2004 M'ZIZEL BOUCHIHA 2001 TADIGHOUST AWRIR+ 1998 M'ZIZEL GAFAI(RIVE.D+ 2000 TADIGHOUST CHRIF 1998
M'ZIZEL KSAR AIT.MY.MAATI+ 2001 TADIGHOUST IRHREM AMEKRANE
2004
M'ZIZEL MZIZEL TILICHT 1997 TADIGHOUST KSAR ELHARA 1998 M'ZIZEL RIVE.G)(EXT-BT) 2000 TADIGHOUST KSAR MOUY (I)+ 1999 M'ZIZEL TABERKITE (EXT-BT) 2004 TADIGHOUST KSAR MOUY (II) 1999 M'ZIZEL TABIAT 1998 TADIGHOUST LBORJ JDID 1999 M'ZIZEL TACHICHATE 2004 TADIGHOUST LBORJ LAQDIM 1999 M'ZIZEL TIGHEJDET 1998 TADIGHOUST TAHAMDOUNTE 2004 M'ZIZEL TIGHRMATINE :(TALAHMOUMT 2004 TADIGHOUST TALTAFRAOUT 2002 TADIGHOUST TIMIZGUIT 2004
TADIGHOUST TIRHREMT N'IGRANE+
2004
TADIGHOUST ZIMBA 1999 Source: ONE

FT - 19
Commune rural Ksar Year Commune rural Ksar Year
AIN CHOUATER AIN CHOUATER 2000 FIGUIG SIDI ABDELKADER MOHAMED
1999
BNI GUIL GARE FERROVIERE 1999 TALSINT AIT IDIR 1999 BNI TADJITE SBAIK 1999 TALSINT AIT OMAR 1999
BOUANANE BENT EL KHATTAB 1999 TALSINT AIT SAID OU OTHMANE
1999
BOUANANE OULAD ABBES 1999 TALSINT LAGRABA (EXT BT)
1999
BOUANANE TAKOUMITE 1999 TALSINT ZAOUIA SOUFLA 1998 BOUARFA TOBA 2 1999 TALSINT ZAOUIA+ 1999 BOUARFA ZELLAKA 1999 Source: ONE

FT - 20
Table F.6.1 Sanitary Infrastructures and Projects in the Province of Errachidia
(1/3) Cercles Communes Population Formations Category Project
Urban Rural Total Assoul Assoul 8,189 8,189 Assoul HL Tirga DR Ait Hani 9,500 9,500 Ait Hani CSCA Tamtatoucht DR Amellagou 5,166 5,166 Amellagou CSC Extension of CSCA Erfoud Erfoud 21,875 13,343 35,218 H. Edakhil CSU Sghiri Houmani Belmaati PSP Alnif 8,825 8,825 Alnif CSCA 5,972 5972 Ait Zegane DR 5,619 5619 Azekor DR Reconstruction Jorf 12,651 12651 Jorf CSUA M'cissi 4,889 4889 M'cissi CSC Hciya 2,367 2367 Fezou DR Reconstruction 11,083 11083 Ait Saadane DR Mejrane DR Arab S. Ziz 4,954 4954 Maadid DR Oulad Maatallah CSC Construction Essifa 9,374 9374 Essifa CSCA Arab. S. Ghriss 5,272 5272 Hannabou CSC Fezna 4,292 4292 Fezna CSC Rissani M. A. Cherif 22,769 14,625 37394 Sijilmassa HL Rissani 3,941 3941 Mezguida CSC B. M. Sijimassa 2,241 2241 O. Abdelhalim DR Mansouria CSC Construction 4,698 4698 El Ghorfa DR Jbil DR Sfalat 21,966 21966 Sfalate CSC Extension Taouz 3,565 3565 Merzouga CSCA 4,555 4555 Taouz DR Sidi Ali Tafraout CSC
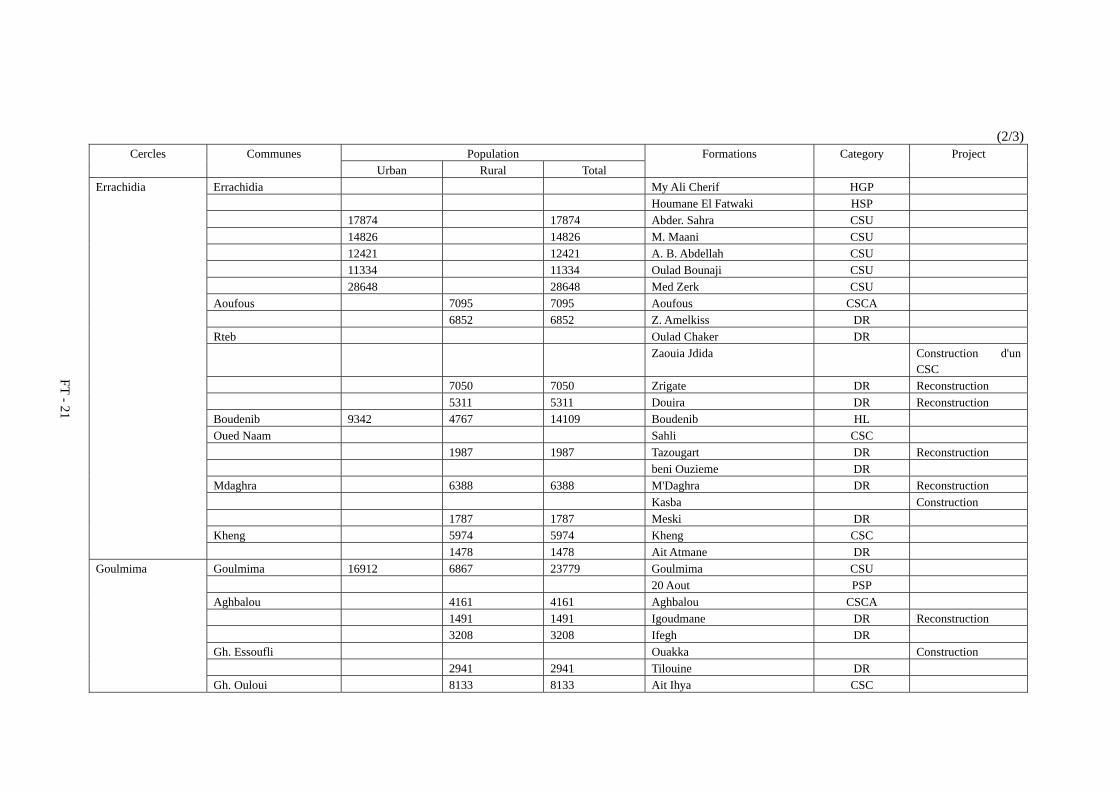
FT - 21
(2/3) Cercles Communes Population Formations Category Project
Urban Rural Total Errachidia Errachidia My Ali Cherif HGP Houmane El Fatwaki HSP 17874 17874 Abder. Sahra CSU 14826 14826 M. Maani CSU 12421 12421 A. B. Abdellah CSU 11334 11334 Oulad Bounaji CSU 28648 28648 Med Zerk CSU Aoufous 7095 7095 Aoufous CSCA 6852 6852 Z. Amelkiss DR Rteb Oulad Chaker DR Zaouia Jdida Construction d'un
CSC 7050 7050 Zrigate DR Reconstruction 5311 5311 Douira DR Reconstruction Boudenib 9342 4767 14109 Boudenib HL Oued Naam Sahli CSC 1987 1987 Tazougart DR Reconstruction beni Ouzieme DR Mdaghra 6388 6388 M'Daghra DR Reconstruction Kasba Construction 1787 1787 Meski DR Kheng 5974 5974 Kheng CSC 1478 1478 Ait Atmane DR Goulmima Goulmima 16912 6867 23779 Goulmima CSU 20 Aout PSP Aghbalou 4161 4161 Aghbalou CSCA 1491 1491 Igoudmane DR Reconstruction 3208 3208 Ifegh DR Gh. Essoufli Ouakka Construction 2941 2941 Tilouine DR Gh. Ouloui 8133 8133 Ait Ihya CSC

FT - 22
(3/3) Cercles Communes Population Formations Category Project
Urban Rural Total Goulmima Tadighoust 7982 7982 Tadighoust CSC Extension of CSCA Mellaab 9520 9520 Mellaab CSCA 4901 4901 Touroug DR Reconstruction Igli DR Tinejdad 6467 11093 17560 Amraoui B. CSUA Ferkla Soufla Ktaa El Ouad CSC 4663 4663 Tizougagine DR Reconstruction Ferkla Oulia 18851 18851 Asrir CSC Reconstruction Imilchil Amougeur 5628 5628 Amougeur CSCA Ait Yaacoub DR Ait Ihya 4592 4592 Tazarine CSC Imilchil 8902 8902 Imilchil HL Bouzmou 4398 4398 Bouzmou CSC 3251 3251 Agdal DR Outerbat 6317 6317 Outerbat CSCA Rich Rich 17150 1138 18288 Tahmidante CSU Rich HL Guers 6364 6364 Kerrandou CSCA 3260 3260 Ait Attou DR Reconstruction Nzala 3922 3922 N'zala CSC Mzizel 4448 4448 M'zizel CSC 5704 5704 Ait M. Ou Ali DR S. Ayad 3172 3172 Sidi Ayad CSC Z. S. Hamza 6696 6696 Z. S. Hamza CSCA Gourrama 9570 9570 Gourrama CSCA Guir 4688 4688 Toulal CSC
DR: Rural dispensary CSC: Communal health center CSCA: Communal health center with maternity
HL: Local hospital CSCA: Urban health center with maternity CSU: Urban kealth center
PSP: Public health polyclinic HGP: Provincial general hospital HSP: Provincial specialty hospital

FT - 23
Table F.7.1 Socio-Data (Preliminary School)
Commune Rural No. of Prelirinary school
No. of pupils Commune Rural No. of Prelirinary school
No. of pupils
Errachidia 18 10,280 Oued N'ame 8 788
Erfoud 7 4,359 Chorfa M'daghra
11 2,262
Goulmima 6 2,918 El Kheng 19 2,158
Rich 4 3,191 Aghbalou 14 1,944
Jorf 5 2,282 Ghris Soufli 7 1,227
My Ali Cherif 8 4,271 Ghris Al Ouloui 6 2,288
Boudenib 4 1,782 Tadighoust 14 1,367
Tinejdad 4 1,333 Mellaab 25 3,617
Ait Hani 11 1,400 Ferkla Soufla 11 2,645
Amellago 12 863 ferkla Al Oulia 16 3,875
Assoul 11 1,177 Ait Yahya 10 613
M'cissi 17 1,694 Amouguere 11 836
H'sya 20 2,760 Imilchil 15 925
Alnif 34 5,140 Bouzmou 12 1,316
Sifa 6 1,794 Outerbate 12 775
Arab Sebbah Ziz 18 4,446 Guers Tiallaline 16 1,765
Arab Sebbah Gheris
3 749 N'zala 14 570
Fezna 3 683 M'zizal 7 1,016
Beni M'Hamed Sijilm
24 2,901 Sidi Ayad 13 1,346
Rissani 13 841 Z. Sidi Hamza 7 680
S'falat 25 3,830 Guir 9 437
Taouz 12 845 Gourrama 13 871
Sidi Ali 6 545 Cenre Gourrama 2 1,107
Aoufous 14 1,652
R'teb 9 1,994
Total 566 98,158
Source: Deligation, Errachidia (2003/2004)
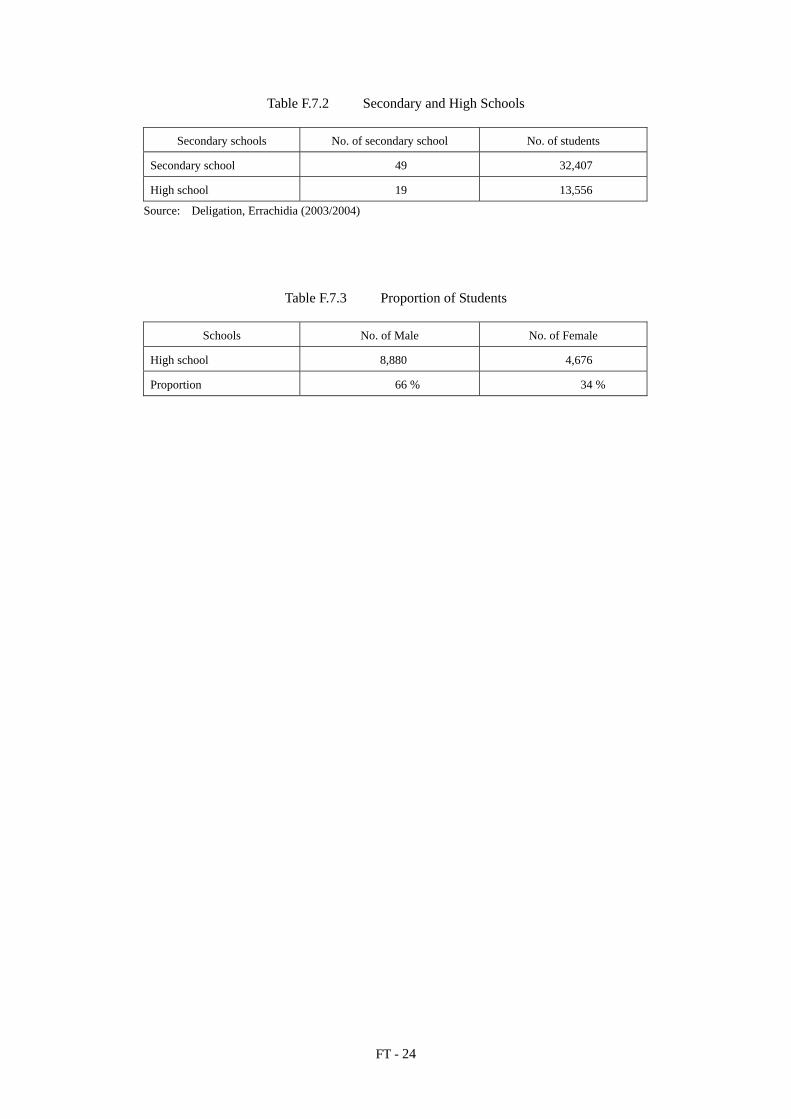
FT - 24
Table F.7.2 Secondary and High Schools
Secondary schools No. of secondary school No. of students
Secondary school 49 32,407
High school 19 13,556
Source: Deligation, Errachidia (2003/2004)
Table F.7.3 Proportion of Students
Schools No. of Male No. of Female
High school 8,880 4,676
Proportion 66 % 34 %

Figures

Legend Boundary of catchment area City, village Errachidia Khettara
Figure 7.1.1 Jurisdictional B
oundary of the OR
MVA
/TF
Toauz
Alnif
Boudenib
Beni-Tadjit Rich
Sifa
Bouanane
Province of Errachidia
Province of Ouarzazate
Rissani
FeznaJorf
Erfoud Mellaab
M’cissi
Errachidia
Gulmima
710
706
707
709
714
713
720
704
717
703
705
716
712
718
722
Province of Figuig Imilchil
Province of Khenifra
Province of Beni-Mellal
Province of Boulmane
Assoul
Outerbat
Aghbalou
Hssia
Sidi Ayad
N'Zala
Ait Hani
R'Teb
Amellago
Z.S.Hamza
Amouguer
Bouchaoune
Guers Tiallaline
M'Zizel Tillicht
Ait Yahya
Bouzmou
B.M'Hammed
Bas Ferkla
Arab Sabbah Ziz
Bas Gheris
Haut Gheris
Sidi Ali
Tadighoust
Haut Ferkla
Boumeriem
Talsint
Guir
Oued Naam
Kheng
Gourrama
M'Daghra
Aoufous
Sfalat
Rissani
Province of Azilal
0 100km
The Developm
ent Study on Rural C
omm
unity Developm
ent Project in Sem
i-Arid East A
tlas Regions w
ith Khettara R
ehabilitation in the K
ingdom of M
orocco
Japan International Cooperation A
gency
FF - 1

0 20 40 80km 60
Toauz
Alnif
Boudenib
Beni-Tadjit Rich
Merzouga
Sifa
Hannabou
Bouanane
Ain Chouater
Legend Boundary of catchment area City, village Errachidia Khettara
Province of Errachidia
Province of Ouarzazate
Province of Figuig
Rissani
Monkara
FeznaJorf
Erfoud
Mellabou
M’sissi
Errachidia
Gulmima
Tinejdad
Figure F.2.1
Road N
etwork in Errachidia
Hassan Addakhill Dam
National Road
Regional Road
Rural Road
The Developm
ent Study on Rural C
omm
unity Developm
ent Project in Sem
i-Arid East A
tlas Regions w
ith Khettara R
ehabilitation in the K
ingdom of M
orocco
Japan International Cooperation A
gency FF - 2

The Developm
ent Study on Rural C
omm
unity Developm
ent Project in Sem
i-Arid East A
tlas Regions w
ith Khettara R
ehabilitation in the K
ingdom of M
orocco
Japan International Cooperation A
gency
0 20 40 80km 60
Toauz
Alnif
Boudenib
Beni-Tadjit Rich
Merzouga
Sifa
Hannabou
Bouanane
Ain Chouater
Legend Boundary of catchment area City, village Errachidia Khettara
Province of Errachidia
Province of Ouarzazate
Province of Figuig
Rissani
Monkara
FeznaJorf
Erfoud
Mellabou
M’sissi
Errachidia
Gulmima
Tinejdad
Figure F.3.1
Water Supply N
etwork
Hassan Addakhill DamP
P
P
Dam
Pump station
Conduits
FF - 3

Annexe G Environmental Assessment and Evaluation

G – (i)
Annexe G Environmental Assessment and Evaluation
Contents
Page
G.1 Introduction ......................................................................................................................... G - 1
G.2 Environmental Conditions and Problems in Tafilalet Area ................................................... G - 1
G.2.1 General Environmental Situations ......................................................................... G - 1
G.2.2 Inventory Survey ................................................................................................... G - 2
G.2.3 Water Quality Survey ............................................................................................ G - 4
G.3 Environmental Impact Assessment ..................................................................................... G - 8
G.3.1 Initial Environmental Examination ........................................................................ G - 8
G.3.2 Environmental Impact Assessment ........................................................................ G - 8
G.4 Environmental Policy and Framework in Morocco ............................................................ G - 8
G.4.1 Procedure of Environmental Impact Assessment in Morocco................................. G - 8
G.4.2 Countermeasure against Farmland Devastation ...................................................... G - 9
Tables
Table G.2.1 Fluctuation of Water Flow by Zone Table G.2.2 Influence of Encroaching Sand Table G.2.3 The Result of Water Quality Survey and Adaptation to Irrigation Water Standard Table G.2.4 The Result of Water Quality Survey and Adaptation to Drinking Water Standard Table G.2.5 Water Quality Standards Table G.2.6 The Adoption to the Irrigation Standard by Zone and the Cause of Maladaptation Table G.2.7 The Adoption to the Drinking Water Standard by Zone and the Cause of Maladaptation Table G.3.1 Initial Environmental Examination (the Master Plan) Table G.4.1 Projects subjected to environmental impact assessment Table G.4.2 Sample of Contents of EIE Report Table G.4.3 National Program Countermeasure against Desertification (Long-Term) Table G.4.4 National Program Countermeasure against Desertification (Short-Term)
Figures Figure G.2.2 Location Map of Water Quality Survey and Surfactant Survey Figure G.4.1 Chronology of EIA procedure

G - 1
G.1 Introduction
Tafilalet area is located in the South of Morocco, in north of Sahara. The area includes four basins: Ziz,
Gheris, Guir and Maider, and situate in the southern side of the high Atlas. The area spreads on a total
surface of 77,250 km2 covering the Province of Errachidia and the Circle of Beni-Tadjit in the Province of
Figuig. The south area of the Tafilalet is extremely dry condition, and water resource is very limited.
Major environmental issues in Tafilalet area are farmland devastation and salinity of soil and water. The
following surveys were carried out to investigate the situation of those issues by the JICA Study Team.
- Water Quality survey: 32 items, 35 locations
- Interview survey for fluctuation of water flow through khettara, as a part of the Inventory Survey
- Interview survey for influence of encroaching sand, as a part of the Inventory Survey
Initial Environment Examination (IEE) was undertaken to determine the environmental impacts that might
be created by the proposed project in the Master Plan based on existing data and information to the related
projects, the comments and judgments of specialists who are familiar with the environmental impacts of
past similar projects, and the above 3 surveys.
G.2. Environmental Conditions and Problems in Tafilalet Area
G.2.1 General Environmental Situations
Major environmental issues in Tafilalet area are farmland devastation, high concentration of salt in soil and
groundwater, and so on. General situations of those issues are as follows,
- South area of the Tafilalet is extremely dry condition, and annual precipitation is about 50 mm in that
area. For that reason, the water volume gained thorough khettara has been decreased. The number of
farmers who abandon their cultivation is increased, because of lack of water source. Abandoned
farmland invaded by encroaching sand, and farmland devastation is advanced. This farmland
devastation occurs dominantly from Jorf to Taouz (Merzouga).
- The area in which the soil is highly damaged by salinity is also concentrated the area from Jorf to
Taouz (Merzouga). The highly damaged area by salinity shares about 20 % ((c)+(d) in the following
table) of total area as shown in the following table.
The Evaluation of Salinity Area in Tafilalet Area (a) No damaged area by salinity 38.2%
(b) The slightly damaged by slightly, which is possible to be improved 44%
(c) The hardly damaged area by salinity, which is difficult to be improved 10.2%
(d) The abandoned area caused by salinity 7.6%
(Source: the soil survey in 1982 by the ORMVA/TF)
- The water gained through khettara, where located in the area from Jorf to Taouz (Merzouga), contains
high concentration of salt as shown in the result of water quality survey.

G - 2
- The main issue of agricultural production is Bayoud for palm trees.
G.2.2 Inventory Survey
Farmland devastation is caused by limited water resources, dry climate, encroaching sand, emigrant of 30s
men and so on. The situation of limited water resources and encroaching sand are indicated in the
inventory survey for 410 khettaras. Two factors, such as fluctuation of water flow of khettara and influence
of encroaching sand, are picked up to explain the situation of farmland devastation from inventory survey
of 410 khettara.
(1) Fluctuation of water flow of khettara
The fluctuation of water flow of khettara by zone is shown in Table G.2.1, and summarized in the
following table. The number of valid response to the interview concerning fluctuation of water flow is 305
among 410 khettaras.
Fluctuation of Water Coming from Khettara The number of khettaras
(inside of ( ): percentage to valid response*1)
Dried up khettaras*2 160(52.5%)Water flow exist or not exist Khettaras with water flow at least limited term in the year*3 145(47.5%)
Total 305 (100 %)
Twenty yeas before Dried up khettara over twenty years before 72 (23.6%)
Khettaras dried up or reducing water flow during last five yeas*4 143 (46.9 %) Khettaras with continuous water flow thorough year*5 123(40.3%)
Last five years
Khettaras with constant or increased water flow*6 23 (7.5%) *1: The number of valid response is 305 among 410 khettaras. *2: The sum of the number of answers from (1) to (4) in the Table G.2.1 *3: The sum of the number of answers from (5) to (8) in the Table G.2.1 *4: The sum of the number of answers from (4) to (6) in the Table G.2.1 *5: The sum of the number of answers from (6) to (8) in the Table G.2.1 *6: The sum of the number of answers from (7) to (8) in the Table G.2.1
(Source: Inventory survey by the JICA Study Team and the ORMVA/TF)
The productive khettara are 191 numbers in the main report, and their share is 46 % of 410 as total number
of khettaras. According to inventory survey, khettaras with water flow at least limited term through year
are 47.5 % of 305 khettaras, which have valid responses of the interview. There are not big differences
between two population parameters. It seems that 305 khettaras shows the close enough situation of 410
khettaras. The population parameter is, therefore, 305 khettaras in the following analysis.
The khettaras with perennial water flow are 40 %. The khettaras, which have constant water flow or
increased water flow, are only 7.5 %. The khettaras dried up over twenty years before are 23.6 %. The
khettaras, which are dried up or reduced water flow in last five year, are 46.9 % of 305 khettaras. Almost
half of khettaras reduce their water flow in last five years.
The percentage of each answer from (1) to (8) by Zone except of Zone C, which has no valid answer, is
shown in the following figure. There are many unproductive khettaras from over 20 years ago in Zone D, E,
and F. Many khettaras in Zone G decrease their water flows within recent five years.

G - 3
0%10%20%30%40%50%60%70%80%90%
100%
A B D E F G
(8)(7)(6)(5)(4)(3)(2)(1)
(1): No water flow from 1950s or 1970s (2): No water flow in the last two-decade (3): No water flow in the last decade (4): No water flow in the passive five years (5): No water in the dry season in the past five years (6): Water flow exist thorough year, but water flow is reduced year by year. (7): Constant water flow (8): Water flow is increased
(Source: Inventory survey by the JICA Study Team and the ORMVA/TF)
Fluctuation of Water Flow by Zone
(2) Influence of encroaching sand
The influence of encroaching sand to khettara and farmland was investigated in the inventory survey to
410 khettara. The degree of the damage by encroaching sand to four portions of traditional irrigation
system by khettara, such as catchments, conduit, open channel, and irrigation canal, is shown in Table
G.2.2.
The following analysis is based on valid answers. It is shown as the reference, because the number of valid
answer varies by Zone and by portion of khettara irrigation system.
It is considered that the number of significant damaged khettaras in Zone D, E, and F is larger than that of
ones in Zone A, B, C and G as shown in the following figure. This tendency corresponds to the situation
that unproductive Khettaras concentrated into Zone D, E, and F. as mentioned in the above contents of “1)
Fluctuation of water flow of khettara”.
Productive khettaras
Unproductive khettaras

G - 4
0.0%
10.0%
20.0%
30.0%
40.0%
50.0%
60.0%
70.0%
80.0%
90.0%
100.0%
Zone
A
Zone
B
Zone
C
Zone
D
Zone
E
Zone
F
Zone
G
Catchments
Conduit of khettara
Open channel of khettara
Irrigation chnannel
(Source: Inventory survey by the JICA Study Team and the ORMVA/TF)
Percentage of Significant Damaged Khettaras by Encroaching Sand by Zone
G.2.3 Water Quality Survey
(1) Sampling and method
Water quality surveys by the JICA Study Team are summarized in the following table. Sampling locations
are shown in Figure G.2.1
Water quality surveys done by the JICA Study Team Sampling date Sampling location Method Analysis item
� From June 25 to July 16, 2003
Zone A: 6 khettaras Zone B : 2 khettaras Zone C : 2 khettaras Zone D : 6 khettaras Zone E : 4 khettaras Zone F : 2 khettaras Zone G : 6 khettaras Total 28 khettaras
Location of Sampling: outlet of each khettara
32 items shown in the Table G.2.3
� From February 11 to 13, 2004
Zone A: 2 khettaras Zone D : 3 khettaras Zone G : 2 khettaras Total 7 khettaras
Location of Sampling: outlet of each khettara
32 items shown in the Table G.2.3
� In July, 2005 Khettara Taoumart, Ait Ben Omar, Ait Moulay Mamoun
Location of sampling: Washing place Simplified color test
COD and surfactant
(2) Result of water quality survey
The water samples from 35 khettaras were analyzed for 32 water quality items. The result of survey and
adaptation to irrigation water standard is summarized in Table G.2.3, and adaptation to drinking water
standard in Table G.2.4.
(3) Evaluation of quality of khettara water
The khettara water is often used for both of irrigation and drinking in the project area. Water quality of

G - 5
khettara, therefore, should be evaluated by the both standard of irrigation and dinking water. The irrigation
water quality is evaluated by the Moroccan standard, and salinity by USDA’s standard. The Moroccan
standard of drinking water and WHO’s guideline are adopted to evaluate the quality of drinking water.
Moroccan standard of irrigation and drinking and WHO’s guideline are shown in Table G.2.5.
(a) Irrigation water
The evaluation of all samples by Moroccan standard is shown in Table G.2.6. The main issue of irrigation
water is salinity in the study area.
Samples in Zone D, E and F have high electric conductivity, which indicates the total volume of inorganic
ion. These samples also contain high value of chloride (Cl-), sulfate (SO42-), and sodium (Na). The source
of these high value items is considered to be derived from original rock and soil around the surveyed area.
All 35 samples’ classifications of conductivity and Sodium Adsorption Ratio (SAR) under the USDA
standard for irrigation are shown in the following figure.
0
5
10
15
20
25
30
35
40
45
50
55
60
65
100 1000 10000
Conductivity (μS/cm)
Sodium Adsorption Ratio (SAR)
Low Medium High Very High Conductivity C1 (0 – 250μS/cm) C2 (250 - 750μS/cm) C3 (750 - 2250μS/cm) C4 (2250 < μS/cm)SAR S1 (0 -10) S2 (10 - 18) S3 (18 - 26) S4 (26 < )
SAR = Na+/((Ca2++Mg2+)/2)1/2
Classification of SAR and Conductivity
Nineteen samples out of 35 are classified into C3-S4 and C4-S4 as shown in the following table. All
samples in Zone D, E, and F are classified in C3-C4 and C4-S4, while a few samples in Zone A and G are
classified into high SAR. For all samples classified listed in the following table, it is necessary to be
careful to occur salinity problem. Water saving irrigation techniques (drip irrigation and so on) and
C4-S1C4-S2
C4-S4C3-S4
C3-S3
C3-S2C3-S1C2-S1
C2-S2
C2-S3
C4-S3

G - 6
cultivation of high tolerance crops are necessary to spread farmers in those area.
Very High SAR and Conductivity Khettaras Classification Zone Nos Khettaras Nos of all
samplesC3-S4, C4-S4 Zone A 1 Taltafroute R.D 8
Zone B 1 Chouater 2
Conductivity: High - Very High SAR: Very High
Zone C 1 Ouled Ali 2
Zone D 9 Souihla Ouled Ghanem, Kadima Krair 9
Lahloua Monkara, Jdida El Bouya,
Khitiria Hannabou, Lagrinia Hannabou,
Lambarkia, Ouastania, Lagrinia
Zone E 4 Kadima Sifa, Haj Allal, Ighzer 4
Charchmia
Zone F 2 Haroun, El Bgaa 2
Zone G 1 Takacha 8 (Source: Water Quality Survey by the JICA Study Team)
(b) Drinking water
All samples are evaluated by 26 items, except of six items, such as total hardness (TH), silica (SiO2),
Carbonate (CO3-), Potassium (K), Calcium (Ca), and Magnesium (Mg), which are not contained in these
three standards. The evaluation of all samples is shown in the Table G.2.7.
Coli form group and fecal coli form are detected from all samples except of 4 khettaras. The detection of
coli form is thought to be caused by the contamination of human and animal feces and domestic
wastewater. The treatment of disinfection by chloride is necessary to drink the water in those areas.
The sample of Souihla Ouled Ghanem and so on, contains much volume of total nitrogen, ammonium ion,
BOD, and COD. On the contrary, it contains low volume of dissolved oxygen, which has the inverse
association with the value of BOD. These phenomena area considered to be caused by the contamination
of animal waste and domestic wastewater. It is necessary to make effort to treat adequately animal waste
and not to drain domestic water into canals.
All of the value of nitrate and nitrite are under the standard of WHO. Some samples in Zone A and G has
high value of nitrate as 24.8 mg/lit, and nitrite as 0.5 mg/lit. A sample from the well has high value of
Nitrate as 28.0 mg/lit, and the sample from the khettara close to that well has also slightly high value of
nitrate and nitrite.
(4) The brief survey of surfactant
Water guided through khettara is not only used for irrigation but also for drinking, livestock breeding,
washing and other living activities. In some Khettara, laundry place is not properly equipped and after

G - 7
wash water flows into irrigation canal. This causes deterioration of water quality for agriculture and rural
life. The ORMVA/TF and the JICA improve laundry places accompanied to khettara and also carry out
enlightenment activities in cooperation with local associations in order to prevent after wash water from
re-entering into irrigation canal. The water coming from khettara, on the contrary, is very valuable for
beneficiaries. They don’t want to lose water by draining after washing water outside of irrigation canal. For
that reason, we instruct inhabitants to drain after wash water with synthetic detergent into drainage tank
installed beside of laundry place, and to return after rinsing water into irrigation canal. This project was
implemented in Ait Ben Omar, Ait Moulay L’mamoun, and Taoumart.
The brief survey of COD and surfactant was carried out by the JICA Study Team to verify the effectiveness
of improvement of laundry places. The measurement of COD and surfactant was carried out 3 times as
shown in the following table.
Procedure of the Measurement Timing Location of measurement Purpose of measurement
1 Before washing Upstream of laundry place To measure the value of COD and surfactant in the base condition (no laundry practice)
2 Just after washing clothes with synthetic detergent
Just downstream of laundry place
To measure the value of them in the condition of before project
2 Just after rinsing clothes with khettara water
Just downstream of laundry place
To measure the value of them in the condition of after project
The result of the survey is shown in the following table.
The Result of Brief Survey of COD and Surfactant Values (mg/lit)
Location Items Base condition Before project After project
COD 2 50 3 Ait Ben Omar
Surfactant 0.5 2 2
COD 1 30 5 Ait Moulay L’mamoun
Surfactant 0.5 5 1.5
COD 1 1 1 Taoumart
Surfactant 0.5 0.5 0.5
(Source: Survey by the JICA Study Team)
It is confirmed that the values of surfactant COD and were reduced by preventing after wash water with
synthetic detergent from re-entering into irrigation canal. The values of surfactant were a little bit high
comparing with the Japanese standard of drinking water (0.2 mg/lit). These values is not big problem for
inhabitants health, because drinking water is usually taken from the upstream of washing place.
Concerning irrigation water, there is no standard for surfactant. The values of COD in the condition of after
project bellow the Moroccan standard of drinking water (25 mg/lit).

G - 8
G.3 Environmental Impact Assessment
G.3.1 Initial Environmental Examination
The IEE follows basically the JICA’s guideline of environmental impact assessment issued in March 2002.
The checklist of IEE is shown in Table G.3.1. The checklist covers the items defined by both the older one
issued in 2002 and the new one issued in 2004. The JICA’s Guidelines for Environmental and Social
Considerations was issued in April 2004.
No item in the checklist of IEE has significant or slight negative environmental impact. Some
environmental impacts that is necessary to be monitored in future are as follows,
- It is necessary to be careful to spread Bayoud into the expanded palm tree fields by the implementation of
projects proposed in the Master Plan.
- It is necessary to monitor the conductivity of irrigation water gained through khettara located the area
from Jorf to Taouz (Merzouga), because those water have high conductivity.
IEE for the plan of facilities for underground water increment is not undertaken, because it is not enough
for the JICA Study Team to assess it at present. Environmental Impact Assessment will be necessary to be
undertaken, when a specific plan is designed.
G.3.2 Environmental Impact Assessment
Environmental Impact Assessment was undertaken in the selected 7 areas, such as Ait Ben Omar, Diba,
Lambarkia, Ouastania, Lagrinia, Timarzit, and Taoumart. The environmental evaluation is shown in Annex
J.
G.4 Environmental Policy and Framework in Morocco
G.4.1 Procedure of Environmental Impact Assessment in Morocco
The project, which is necessary to undertake Environment Impact Assessment (EIE), is defined in the
Moroccan law of EIE by the Department of Environment, as shown in Table G.4.1. Any projects proposed
in the Master Plan are not contained in projects in Table G.4.1.
The Moroccan law for EIE is introduced as reference in the following contents.
The Moroccan law for EIE (Loi n° 12-03 relative aux études d'impactsur l'environnement) was established
by the department of environment in Morocco in May 2003. Promoters of the project are obliged to
conduct EIE, in case of the implementation of the project shown in Table G.4.1. In this law, the following
items were defined,
- the purpose, contents and procedure of the evaluation study
- Setting up national or rural committee of environment
- release the evaluation document to public and hearing public opinions

G - 9
The procedure of EIE is shown in Figure G.4.1, and sample of evaluation document is shown in Table
G.4.2.
G.4.2 Countermeasure against farmland devastation
(1) National program
The national action program against desertification (Programme d’action National de Lutte Contre la
Desertification) is carried out as the integrated program among water resources, agriculture, forestry and so
on is implemented since 2001.
The long-term programs and strategies are shown in Table G.4.3. And the principal projects in the five years
plan of countermeasures against desertification from 2000 to 2004 is shown in Table G.4.4.
(2) Countermeasure against encroaching sand - case of El Bouya
Some kinds of fences, such as concrete fence and grid fence with palm leaves, have been installed to fix
encroaching sand in El Bouya in 1980s. Rehabilitation of shafts and installing covers of shaft has also been
conducted for protecting khettara from sands.
The project, which recovers 5ha farm covered by sand, started from July 2003. Lattice fence with palm
leaves was installed to protect farmlands from encroaching sand in October 2003. Palm seedlings are going
to be planted in the farmland surrounded by the fence. This project is implemented under the cooperation
of the following organizations.
Recovering Farmland Project in El Bouya and Related Organizations Agency and organization Role
The ORMVA/TF ・Researches and surveys ・Management and extension of installation of lattice fence with palm
leaves ・Delivery of palm seedlings ・Management and extension of afforestation ・Management and extension of promotion of drip irrigation ・Follow-up the whole project
Ministry of Regional Planning, Environment, Urban Development and Housing
・Subsidy to purchase palm leaves for lattice fence ・Follow-up the project of holding encroaching sand
ADS (Social Development Agency) ・Subsidy to purchase materials of drip irrigation ・Follow-up to the drip irrigation project
SEEN (Service des Expérimentations, des Essais et de la Normalisation)
・Management and extension of the drip irrigation project
Association Amal (Association in El Bouya)
・Providing labors, lands and wells ・Researches and surveys (cooperating with the ORMVA/TF) ・Operating the project
Association de Lutte Contre la Desertification (NGO in Jorf)
・Supporting Association Amal ・Follow-up the whole project (with the ORMVA/TF)
University of Errachidia ・Follow-up the whole project (with the ORMVA/TF)
(Source: the ORMVA/TF)

G - 10
The water source of this project is the groundwater from a well with pumping machine. Three thousand
and five hundred Tamarixes have been already planted in that area with the donation of Ministry of
Regional Planning, Environment, Urban Development and Housing.

Tables

GT - 1
Table G.2.1 Fluctuation of Water Flow by Zone Zone A Zone B Zone C Zone D Zone E Zone F Zone G Total
Goulmima & Tinjdad
Beni-Tadjit, Gourrama
Zone Boudenib
Fezna, Jorf, & Hannabou
Sifa Rissani et Taouz
Alnif
Number of khettaras 137 24 8 69 25 44 103 410 (1) No water flow from 1950s or 1970s 9 0 0 26 6 18 13 72
(12.7%) (0.0%) (0.0%) (40.0%) (28.6%) (46.2%) (13.4%) (23.6%)
(2) No water flow in the last two-decade 0 1 0 7 1 7 19 35
(0.0%) (8.3%) (0.0%) (10.8%) (4.8%) (17.9%) (19.6%) (11.5%)
(3) No water flow in the last decade 5 1 0 4 5 4 13 32
(7.0%) (8.3%) (0.0%) (6.2%) (23.8%) (10.3%) (13.4%) (10.5%)
(4) No water flow in the passive five years 3 1 0 3 0 0 14 21
(2.2%) (4.2%) (0.0%) (4.3%) (0.0%) (0.0%) (13.6%) (6.9%)
(5) No water in the dry season in the past five years 3 1 0 6 0 1 11 22
(4.2%) (8.3%) (0.0%) (9.2%) (0.0%) (2.6%) (11.3%) (7.2%)
36 4 0 18 6 9 27 100 (6) Water flow thorough year, but water flow is reduced year by year.
(50.7%) (33.3%) (0.0%) (27.7%) (28.6%) (23.1%) (27.8%) (24.4%)
(7) Constant water flow 14 4 0 0 1 0 0 19
(19.7%) (33.3%) (0.0%) (0.0%) (4.8%) (0.0%) (0.0%) (6.2%)
(8) Water flow is increased 1 0 0 1 2 0 0 4
(1.4%) (0.0%) (0.0%) (1.5%) (9.5%) (0.0%) (0.0%) (1.3%)
No answer or invalid response 66 12 8 4 4 5 6 105
(48.2%) (50.0%) (100.0%) (5.8%) (16.0%) (11.4%) (5.8%) (25.6%)

GT - 2
Table G.2.2 Influence of Encroaching Sand (1/3) (1) Influence of encroaching sand in catchments area
Zone A Zone B Zone C Zone D Zone E Zone F Zone G Total Goulmima & Tinjdad
Beni-Tadjit, Gourrama
Zone Boudenib
Fezna, Jorf &t Hannabou
Sifa Rissani & Taouz
Alnif
Number of khettaras 137 24 8 69 25 44 103 410
(1) Khettaras damaged significantly by encroaching sand 28 3 1 1 1 17 5 56
(20.4%) (12.5%) (12.5%) (1.4%) (4.0%) (38.6%) (4.9%) (13.7%)
(2) Khettaras damaged partially by encroaching sand 17 8 3 1 2 4 38 73
(12.4%) (33.3%) (37.5%) (1.4%) (8.0%) (9.1%) (36.9%) (17.8%)
(3) Khettaras damaged negligibly by encroaching sand 55 13 4 3 15 19 13 122
(40.1%) (54.2%) (50.0%) (4.3%) (60.0%) (43.2%) (12.6%) (29.8%)
invalid response 37 0 0 64 7 4 47 159
(27.0%) (0.0%) (0.0%) (92.8%) (28.0%) (9.1%) (45.6%) (38.8%)
(2) Influence of encroaching sand to conduit of khettaras
Zone A Zone B Zone C Zone D Zone E Zone F Zone G Total Goulmima & Tinjdad
Beni-Tadjit, Gourrama
Zone Boudenib
Fezna, Jorf & Hannabou
Sifa Rissani & Taouz
Alnif
Number of khettaras 137 24 8 69 25 44 103 410
(1) Khettaras damaged significantly by encroaching sand 21 2 1 37 15 19 8 103
(15.3%) (8.3%) (12.5%) (53.6%) (60.0%) (43.2%) (7.8%) (25.1%)
(2) Khettaras damaged partially by encroaching sand 12 7 3 9 3 6 39 79
(8.8%) (29.2%) (37.5%) (13.0%) (12.0%) (13.6%) (37.9%) (19.3%)
(3) Khettaras damaged negligibly by encroaching sand 56 14 4 11 0 13 13 111
(40.9%) (58.3%) (50.0%) (15.9%) (0.0%) (29.5%) (12.6%) (27.1%)
invalid response 48 1 0 12 7 6 43 117
(35.0%) (4.2%) (0.0%) (17.4%) (28.0%) (13.6%) (41.7%) (28.5%)

GT - 3
Table G.2.2 Influence of Encroaching Sand (2/3) (3) Influence of encroaching sand to open channel of khettara
Zone A Zone B Zone C Zone D Zone E Zone F Zone G Total Goulmima & Tinjdad
Beni-Tadjit, Gourrama
Zone Boudenib
Fezna, Jorf et Hannabou
Sifa Rissani et Taouz
Alnif
Number of khettaras 137 24 8 69 25 44 103 410
(1) Khettaras damaged significantly by encroaching sand 42 4 0 7 12 16 14 95
(30.7%) (16.7%) (0.0%) (10.1%) (48.0%) (36.4%) (13.6%) (23.2%)
(2) Khettaras damaged partially by encroaching sand 9 4 3 0 3 2 33 54
(6.6%) (16.7%) (37.5%) (0.0%) (12.0%) (4.5%) (32.0%) (13.2%)
(3) Khettaras damaged negligibly by encroaching sand 52 13 5 2 2 21 12 107
(38.0%) (54.2%) (62.5%) (2.9%) (8.0%) (47.7%) (11.7%) (26.1%)
invalid response 34 3 0 60 8 5 44 154
(24.8%) (12.5%) (0.0%) (87.0%) (32.0%) (11.4%) (42.7%) (37.6%)
(4) Influence of encroaching sand to irrigation canal
Zone A Zone B Zone C Zone D Zone E Zone F Zone G Total
Number of khettaras 137 24 8 69 25 44 103 410
(1) Khettaras damaged significantly by encroaching sand 38 6 0 19 10 19 9 101
(27.7%) (25.0%) (0.0%) (27.5%) (40.0%) (43.2%) (8.7%) (24.6%)
(2) Khettaras damaged partially by encroaching sand 14 5 0 4 4 5 34 66
(10.2%) (20.8%) (0.0%) (5.8%) (16.0%) (11.4%) (33.0%) (16.1%)
(3) Khettaras damaged negligibly by encroaching sand 50 13 8 1 3 16 15 106
(36.5%) (54.2%) (100.0%) (1.4%) (12.0%) (36.4%) (14.6%) (25.9%)
invalid response 35 0 0 45 8 4 45 137
(25.5%) (0.0%) (0.0%) (65.2%) (32.0%) (9.1%) (43.7%) (33.4%)

GT - 4
Table G.2.2 Influence of Encroaching Sand (3/3) (5) The level of damage of open channel by encroaching sand
Zone A Zone B Zone C Zone D Zone E Zone F Zone G Total Goulmima & Tinjdad
Beni-Tadjit, Gourrama
Zone Boudenib
Fezna, Jorf & Hannabou
Sifa Rissani & Taouz
Alnif
Total of (1)+(2)+(3)+(4)+(5) 57 18 1 13 16 40 30 175 (1) The sand reaches nearby open channel of khettara 29 7 0 6 4 14 7 67 (50.9%) (38.9%) (0.0%) (46.2%) (25.0%) (35.0%) (23.3%) (38.3%)
11 7 0 6 5 14 10 53 (2) The sand encroaches into open channel of khettara, but this sand is available to remove by human power (19.3%) (38.9%) (0.0%) (46.2%) (31.3%) (35.0%) (33.3%) (30.3%) (3) The sand encroaches into open channel of khettara, but this sand is unavailable to remove by human power
5 1 0 1 4 5 4 20
(8.8%) (5.6%) (0.0%) (7.7%) (25.0%) (12.5%) (13.3%) (11.4%) (4) The sand encroaches into covered open channel, in spite of rehabilitation of channel
6 0 0 0 3 5 6 20
(10.5%) (0.0%) (0.0%) (0.0%) (18.8%) (12.5%) (20.0%) (11.4%) (5) The sand encroaches into covered open channel, because of rehabilitation of channel
6 3 1 0 0 2 3 15
(10.5%) (16.7%) (100.0%) (0.0%) (0.0%) (5.0%) (10.0%) (8.6%) (6) The level of damage to farmland
Zone A Zone B Zone C Zone D Zone E Zone F Zone G Total
Total of (1)+(2)+(3) 86 20 0 38 17 64 77 302
(1) The sand reached nearby farmland 44 12 0 10 7 22 29 124
(51.2%) (60.0%) - (26.3%) (41.2%) (34.4%) (37.7%) (41.1%)
(2) Agricultural activities are influenced by encroaching sand
25 6 0 8 10 22 25 96
(29.1%) (30.0%) - (21.1%) (58.8%) (34.4%) (32.5%) (31.8%)
(3) The agricultural land was abandoned by encroaching sand.
17 2 0 20 0 20 23 82
(19.8%) (10.0%) - (52.6%) (0.0%) (31.3%) (29.9%) (27.2%)

GT - 5
Table G.2.3 The Result of Water Quality Survey and Adaptation to Irrigation Water Standard (1/4)
pH Tempera-ture
(water)
Conduc-tivity (20℃)
Disso-lved O2
Turbid-ity
Sus -pended
Solid
Color Total Hardness
(℃) (μS/cm) (mg/lit) NTU (mg/lit) (mg/lit) (mg/lit)Water
Quality Standard
Moroccan standard of irrigation water
6.5~8.4 35 12,000 - - 100(Spot irrigation)
2,000(Spread
irrigation)
- -
Sampling location
Zone Name of khettara
Bakassia 7.75 22.5 1,185 8.10 11.60 6.0 ≦5 445.0 Ouinigui 7.80 27.5 525 6.48 26.50 6.8 ≦5 262.6
A Goulmina & Tinjdad Litama 8.15 22.2 1,125 7.36 6.06 2.8 ≦5 424.8
Taghia 8.20 27.0 510 7.68 1.82 2.8 ≦5 290.2 Agoudim 8.15 19.5 955 7.84 9.28 3.6 ≦5 590.8 Taltafroute R.D 7.50 26.0 2,190 5.92 2.86 3.8 ≦5 660.1 Aït Ben Omar 7.50 19.8 748 7.20 3.34 4.0 <5 0.0 Diba 7.20 18.5 1,120 8.80 8.26 1.4 <5 0.0
Chouater 7.80 23.5 4,115 8.48 6.08 3.6 ≦5 724.9 B Beni-Tadjit El kbira Ait El
Abd 7.95 19.5 800 8.64 68.80 50.8 ≦5 409.8
Jdida Ksar Boudnib
8.20 22.0 845 7.20 1.60 0.6 ≦5 249.8 C Boudnib
Ouled Ali 8.10 21.0 2,245 8.00 1.66 3.5 ≦5 649.3 Souihla Ouled
Ghanem 7.90 22.4 2,870 2.80 39.40 23.0 ≦5 710.1
Kadima Krair 8.00 23.7 2,690 7.50 2.97 0.8 ≦5 760.1
D Fezna, Jorf &
Hannabou Lahloua Mounkara 7.80 20.8 3,230 8.20 69.30 78.0 ≦5 819.9 Jdida El Bouya 8.05 23.3 3,125 7.90 3.40 2.8 ≦5 830.0 Khitiria Hannabou 7.90 23.3 3,065 7.52 0.74 0.8 ≦5 839.6 Lagrinia
Hannabou 8.20 23.3 2,345 7.36 4.89 2.2 ≦5 675.2
Lambarkia 7.50 16.9 2,490 8.60 23.70 8.1 <5 0.0 Ouastania 7.50 21.4 1,914 5.90 1.20 4.7 <5 0.0 Lagrinia 7.12 21.2 2,330 6.40 2.54 3.3 <5 0.0
Kadima Sifa 8.00 23.7 2,880 7.95 2.57 2.8 ≦5 775.0 E Sifa Haj Allal 7.95 23.5 2,570 7.95 2.61 2.0 ≦5 699.8
Ighzer 8.25 25.0 4,410 7.36 4.36 2.8 ≦5 1150.0 Charchmia 8.10 22.8 2,580 7.95 3.16 2.6 ≦5 705.0
Haroun 8.25 23.0 5,295 7.52 12.80 6.8 ≦5 1728.0 F Rissani &
Taouz El Bgaa 8.30 28.9 4,960 7.20 4.60 10.6 ≦5 1100.0
Takacha 8.30 31.8 1,060 7.52 11.30 5.2 ≦5 249.9 G Alnif Toufassamam 8.30 23.5 365 7.52 5.50 4.2 ≦5 183.1
Aachich Ait Izza 8.20 27.5 625 8.64 3.39 ≦0.43 ≦5 205.6 Tigirna 8.30 26.3 705 9.20 3.37 1.8 ≦5 257.2 Tinifift 8.00 26.4 515 8.96 1.50 2.4 ≦5 280.7 Azag 8.15 23.5 565 8.84 6.19 1.2 ≦5 239.9 Taoumart 7.58 18.2 690 5.60 2.14 5.3 <5 0.0 Timarzit 7.85 16.3 567 8.30 2.02 0.3 <5 0.0
: Maladoptation to irrigation standard

GT - 6
Table G.2.3 The Result of Water Quality Survey and Adaptation to Irrigation Water Standard (2/4)
Cl- Total Nitrogen
SiO-2 HCO-
3 CO2-3 NO3
- NO2- As
(mg/lit) (mg/lit) (mg/lit) (mg/lit) (mg/lit) (mg/lit) (mg/lit) (μg/lit)Water
Quality Standard
Moroccan standard of irrigation water
105(Spot Irrigation)
350(Spread irrigation)
- - 518 - 30Nitrate-Nitrogen)
※133mg/lit (Nitrate ion)
- 100
Sampling location Zone Name of khettara
Bakassia 203.8 0.385 15.5 322.1 0.0 9.25 ≦0.031 ≦6.8Ouinigui 43.1 0.325 21.9 268.4 0.0 0.21 ≦0.031 31.0
A Goulmima & Tinejdad Litama 191.1 0.390 13.3 287.9 0.0 12.80 ≦0.031 ≦6.8
Taghia 29.8 0.265 26.5 280.6 0.0 11.00 ≦0.031 ≦6.8 Agoudim 42.5 0.145 15.2 331.8 0.0 11.00 ≦0.031 ≦6.8 Taltafroute R.D 424.0 0.465 13.9 385.1 0.0 5.50 ≦0.031 ≦6.8 Aït Ben Omar 65.9 0.281 13.9 339.2 0.0 17.07 0 ≦6.8 Diba 93.6 0.293 16.3 303.8 0.0 15.81 0 ≦6.8
Chouater 1,038.6 - 16.3 151.2 0.0 13.80 ≦0.031 ≦6.8B Beni-Tadjit El kbira Ait El
Abd 46.8 0.145 15.9 317.2 0.0 13.60 ≦0.031 ≦6.8
Jdida Ksar Boudnib
125.0 0.340 12.0 180.0 0.0 7.50 ≦0.031 ≦6.8C Boudnib
Ouled Ali 473.0 0.240 15.0 278.0 0.0 4.40 ≦0.031 9.3 Souihla Ouled
Ghanem 578.9 4.200 19.1 370.9 0.0 0.08 ≦0.031 14.1
Kadima Krair 612.6 0.345 19.3 317.2 0.0 11.00 ≦0.031 7.3
D Fezna, Jorf &
Hannabou Lahloua Mounkara 733.8 0.545 17.0 268.4 0.0 9.80 ≦0.031 ≦6.8 Jdida El Bouya 717.5 0.185 17.3 297.7 0.0 10.00 ≦0.031 ≦6.8 Khitiria Hannabou 731.5 ≦0.066 18.4 322.1 0.0 10.50 ≦0.031 ≦6.8 Lagrinia
Hannabou 561.0 0.260 20.4 292.8 0.0 9.75 ≦0.031 7.6
Lambarkia 804.0 0.216 10.1 322.1 0.0 19.96 0 ≦6.8 Ouastania 420.0 0.253 21.8 295.2 0.0 10.35 0 ≦6.8 Lagrinia 542.0 0.257 20.4 268.4 0.0 10.71 0 ≦6.8
Kadima Sifa 667.9 0.135 17.9 297.7 0.0 11.50 ≦0.031 16.0 E Sifa Haj Allal 578.5 0.090 18.2 312.3 0.0 10.50 ≦0.031 ≦6.8
Ighzer 1,084.8 0.135 20.2 226.9 0.0 9.25 ≦0.031 ≦6.8 Charchmia 587.0 0.080 18.2 283.6 0.0 11.75 ≦0.031 ≦6.8
Haroun 1,394.0 1.320 14.7 163.5 0.0 9.75 0.123 ≦6.8F Rissani &
Taouz El Bgaa 913.2 0.505 14.3 117.1 0.0 5.00 ≦0.031 7.1
Takacha 85.9 0.215 16.6 251.3 0.0 6.50 ≦0.031 ≦6.8G Alnif Toufassamam 22.9 0.305 18.7 175.6 0.0 4.50 ≦0.031 ≦6.8
Aachich Ait Izza 51.1 0.175 21.7 185.4 0.0 14.50 ≦0.031 ≦6.8 Tigirna 59.6 0.125 22.4 205.0 8.4 19.00 ≦0.031 ≦6.8 Tinifift 21.3 0.340 24.4 258.6 0.0 7.50 ≦0.031 ≦6.8 Azag 42.5 0.075 17.2 249.0 0.0 3.10 ≦0.031 ≦6.8 Taoumart 28.5 0.528 27.0 324.5 0.0 2.29 0 ≦6.8 Timarzit 26.0 0.358 35.8 240.0 0.0 0.37 0 ≦6.8
: Maladoptation to irrigation standard

GT - 7
Table G.2.3 The Result of Water Quality Survey and Adaptation to Irrigation Water Standard (3/4)
As Al NH4+ Cd Fe F- SO4
2- Na K (μg/lit) (μg/lit) (mg/lit) (μg/lit) (μg/lit) (mg/lit) (mg/lit) (mg/lit) (mg/lit)
Water Quality
Standard
Moroccan standard of irrigation water
100 5,000 - 10 5,000 1.0 250 69mg/l(Spot irrigation)
9SAR(Spread irrigation)
-
Sampling location Zone Name of khettara
Bakassia ≦6.8 ≦14 0.022 ≦0.4 41.5 0.52 141.0 101.1 3.87 Ouinigui 31.0 59.5 0.008 ≦0.4 79.8 0.35 23.5 23.4 2.26
A Goulmima & Tinejdad Litama ≦6.8 ≦14 0.109 ≦0.4 17.4 0.33 130.0 97.4 2.99
Taghia ≦6.8 ≦14 0.667 ≦0.4 ≦10.4 0.35 35.5 23.0 3.80 Agoudim ≦6.8 ≦14 0.094 ≦0.4 62.5 0.55 313.0 28.3 1.45 Taltafroute R.D ≦6.8 ≦14 0.082 ≦0.4 37.1 0.55 245.0 245.0 4.80 Aït Ben Omar ≦6.8 ≦14 0.045 ≦0.4 30.4 0.15 91.6 55.3 2.88 Diba ≦6.8 ≦14 0.019 ≦0.4 24.8 0.16 164.2 89.6 3.63
Chouater ≦6.8 ≦14 0.013 ≦0.4 70.7 1.60 487.5 638.0 6.80 B Beni-Tadjit El kbira Ait El
Abd ≦6.8 ≦14 0.058 ≦0.4 534.2 0.37 132.0 38.8 0.62
C Boudnib
Jdida Ksar Boudnib
≦6.8 ≦14 0.016 ≦0.4 12.0 0.55 85.0 90.5 2.86
Ouled Ali 9.3 ≦14 0.056 ≦0.4 14.1 0.85 235.0 250.5 4.12 Souihla Ouled
Ghanem 14.1 188.3 0.937 ≦0.4 590.5 0.45 277.5 379.8 13.50
Kadima Krair 7.3 ≦14 0.005 ≦0.4 35.3 0.57 345.0 328.2 5.42
D Fezna, Jorf
& Hannabou Lahloua Mounkara ≦6.8 ≦14 0.022 ≦0.4 286.8 0.68 370.0 412.4 6.83
Jdida El Bouya ≦6.8 ≦14 0.023 ≦0.4 12.5 0.70 335.0 390.1 6.42 Khitiria Hannabou ≦6.8 ≦14 0.002 ≦0.4 ≦10.4 0.53 407.5 368.2 5.21 Lagrinia
Hannabou 7.6 ≦14 0.003 ≦0.4 52.7 0.65 340.0 296.8 4.81
Lambarkia ≦6.8 ≦14 0.017 ≦0.4 60.0 0.22 473.9 387.8 7.73 Ouastania ≦6.8 ≦14 0.007 ≦0.4 ≦10.4 0.32 265.7 225.9 4.55 Lagrinia ≦6.8 ≦14 0.011 ≦0.4 ≦10.4 0.33 336.9 279.4 6.25
Kadima Sifa 16.0 ≦14 0.031 ≦0.4 14.8 0.65 370.9 343.6 5.87 Haj Allal ≦6.8 ≦14 0.010 ≦0.4 12.8 0.76 313.0 298.0 5.04
E Sifa
Ighzer ≦6.8 ≦14 0.031 ≦0.4 32.9 0.68 557.5 570.2 7.96 Charchmia ≦6.8 ≦14 0.012 ≦0.4 23.4 0.72 317.5 309.5 5.11
Haroun ≦6.8 ≦14 0.662 ≦0.4 65.3 0.81 730.0 632.0 13.80 F Rissani &
Taouz El Bgaa 7.1 ≦14 0.249 ≦0.4 44.5 1.30 1,450.0 738.0 8.90
Takacha ≦6.8 ≦14 0.026 ≦0.4 118.5 1.20 158.0 153.0 5.96 Toufassamam ≦6.8 ≦14 0.076 ≦0.4 60.6 0.26 21.8 14.8 2.10
G Alnif
Aachich Ait Izza ≦6.8 ≦14 0.010 ≦0.4 12.0 0.85 60.4 67.8 2.50 Tigirna ≦6.8 ≦14 0.055 ≦0.4 30.5 0.62 117.0 59.4 4.90 Tinifift ≦6.8 ≦14 0.020 ≦0.4 ≦10.4 0.32 29.8 20.6 1.40 Azag ≦6.8 ≦14 0.016 ≦0.4 45.0 0.44 62.5 39.8 2.30 Taoumart ≦6.8 ≦14 <0,002 ≦0.4 661.0 0.08 127.0 45.5 5.02 Timarzit ≦6.8 ≦14 <0,002 ≦0.4 205.0 0.08 141.0 47.5 4.74
: Maladoptation to irrigation standard

GT - 8
Table G.2.3 The Result of Water Quality Survey and Adaptation to Irrigation Water Standard (4/4)
Ca Mn Mg BOD COD Coli form Group
Fecal coli form
Hg
(mg/lit) (μg/lit) (mg/lit) (mg/lit) (mg/lit) (/100ml) ( /100ml) (mg/lit)Water
Quality Standard
Moroccan standard of irrigation water
- 200 - - - - 1,000 0.001
Sampling location Zone Name of khettara
Bakassia 132.3 38.2 27.9 1.96 26.9 600 200 0 Ouinigui 80.7 13.8 14.9 6.30 38.4 30,000 4,600 0
A Goulmima & Tinejdad Litama 128.2 8.9 25.5 0.41 36.5 150,000 13,000 0
Taghia 80.2 ≦1 21.9 1.14 28.8 35,000 2,100 0 Agoudim 109.8 6.6 77.0 2.83 25.0 700 140 0 Taltafroute R.D 186.4 6.2 47.4 0.96 17.3 10,000 7,000 0 Aït Ben Omar 113.8 8.5 20.9 1.63 <7,5 30 0 0 Diba 88.2 7.4 60.8 0.56 <7,5 80 70 0
Chouater 170.3 17.0 72.9 ≦0.2 7.7 0 0 0 B Beni-Tadjit El kbira Ait El
Abd 105.2 89.2 35.8 1.55 17.3 930,000 400,000 0
C Boudnib
Jdida Ksar Boudnib
67.3 ≦1 19.9 ≦0.2 ≦7.5 5,400 2,600 0
Ouled Ali 156.0 2.2 63.2 0.88 12.1 3,300 980 0 Souihla Ouled
Ghanem 184.4 34.8 60.8 52.30 147.0 3,200 1,200 0
Kadima Krair 148.3 1.6 94.8 ≦0.2 20.2 3,300 1,200 0
D Fezna, Jorf
& Hannabou Lahloua Mounkara 190.4 10.8 83.8 ≦0.2 54.4 4,600 2,200 0
Jdida El Bouya 200.4 1.6 80.2 ≦0.2 46.3 2,100 620 0 Khitiria Hannabou 165.3 3.4 103.8 ≦0.2 29.2 210 50 0 Lagrinia
Hannabou 142.3 2.1 77.8 ≦0.2 24.2 4,400 1,800 0
Lambarkia 239.0 31.8 86.0 0.71 19.2 13,000 4,000 0 Ouastania 123.0 1.5 68.5 0.37 <7,5 90 60 0 Lagrinia 139.0 2.9 94.0 0.38 <7,5 300 0 0
Kadima Sifa 188.4 3.1 74.1 0.78 25.0 900 400 0 Haj Allal 172.3 2.5 65.6 0.62 40.3 12,000 4,800 0
E Sifa
Ighzer 204.4 4.2 155.5 0.78 25.0 7,000 2,800 0 Charchmia 166.3 1.8 70.5 0.55 28.8 6,000 900 0
Haroun 360.7 7.6 201.4 1.26 53.8 6,000 800 0 F Rissani &
Taouz El Bgaa 348.7 4.5 55.9 1.96 46.1 4,000 600 0
Takacha 60.1 15.2 24.3 0.43 ≦7.5 500 0 0 Toufassamam 54.1 17.4 11.7 1.85 11.5 44,000 16,000 0
G Alnif
Aachich Ait Izza 78.2 2.6 2.6 0.53 ≦7.5 12,000 7,000 0 Tigirna 70.1 5.4 20.0 0.82 22.0 6,000 700 0 Tinifift 79.2 4.0 20.2 0.67 ≦7.5 46,000 13,000 0 Azag 70.1 7.4 15.8 ≦0.72 22.0 11,000 900 0 Taoumart 98.6 33.6 37.9 0.30 13.4 1,600 450 0 Timarzit 59.3 8.9 45.4 <0,20 <7,5 8,000 850 0
: Maladoptation to irrigation standard

GT - 9
Table G.2.4 The Result of Water Quality Survey and Adaptation to Drinking Water Standard (1/4) pH Tempera
-ture (water)
Conduc-tivity(20℃)
Disso-lved
O2
Turbid -ity
Sus -pended
Solid
Color Total Hardness
(℃) (μS/cm)
(mg/lit)
NTU (mg/lit) (mg/lit) (mg/lit)
A1-G 6.5~8.5 20 1,300 7.0 - 50 <10 - A1-I - 30 2,700 - - - 20 -
Water Quality
Standard A2-G 6.5~9.2 20 1,300 5.0 - 1,000 50 - A2-I - 30 2,700 - - - 100 -
Moroccan Standard of drinking water
A3-G 6.5~9.2 20 1,300 3.0 - 2,000 50 - A3-I - 30 2,700 - - - 200 - G:Guide value
I:Valeur imperative The strictest
value 6.5~8.5 20 1,300 7.0 - 50 <10 -
WHO Guideline - - - - 5 - 15 - Sampling location
Zone Name of khettara Bakassia 7.75 22.5 1,185 8.10 11.60 6.0 ≦5 445.0 Ouinigui 7.80 27.5 525 6.48 26.50 6.8 ≦5 262.6
A Goulmima & Tinejdad Litama 8.15 22.2 1,125 7.36 6.06 2.8 ≦5 424.8
Taghia 8.20 27.0 510 7.68 1.82 2.8 ≦5 290.2 Agoudim 8.15 19.5 955 7.84 9.28 3.6 ≦5 590.8 Taltafroute R.D 7.50 26.0 2,190 5.92 2.86 3.8 ≦5 660.1 Aït Ben Omar 7.50 19.8 748 7.20 3.34 4.0 <5 0.0 Diba 7.20 18.5 1,120 8.80 8.26 1.4 <5 0.0
Chouater 7.80 23.5 4,115 8.48 6.08 3.6 ≦5 724.9 B Beni-Tadjit El kbira Ait El Abd 7.95 19.5 800 8.64 68.80 50.8 ≦5 409.8
Jdida Ksar Boudnib 8.20 22.0 845 7.20 1.60 0.6 ≦5 249.8 C Boudnib Ouled Ali 8.10 21.0 2,245 8.00 1.66 3.5 ≦5 649.3
Souihla Ouled Ghanem
7.90 22.4 2,870 2.80 39.40 23.0 ≦5 710.1
Kadima Krair 8.00 23.7 2,690 7.50 2.97 0.8 ≦5 760.1
D Fezna, Jorf &
Hannabou Lahloua Mounkara 7.80 20.8 3,230 8.20 69.30 78.0 ≦5 819.9 Jdida El Bouya 8.05 23.3 3,125 7.90 3.40 2.8 ≦5 830.0 Khitiria Hannabou 7.90 23.3 3,065 7.52 0.74 0.8 ≦5 839.6 Lagrinia Hannabou 8.20 23.3 2,345 7.36 4.89 2.2 ≦5 675.2 Lambarkia 7.50 16.9 2,490 8.60 23.70 8.1 <5 0.0 Ouastania 7.50 21.4 1,914 5.90 1.20 4.7 <5 0.0 Lagrinia 7.12 21.2 2,330 6.40 2.54 3.3 <5 0.0
Kadima Sifa 8.00 23.7 2,880 7.95 2.57 2.8 ≦5 775.0 E Sifa Haj Allal 7.95 23.5 2,570 7.95 2.61 2.0 ≦5 699.8
Ighzer 8.25 25.0 4,410 7.36 4.36 2.8 ≦5 1150.0 Charchmia 8.10 22.8 2,580 7.95 3.16 2.6 ≦5 705.0
Haroun 8.25 23.0 5,295 7.52 12.80 6.8 ≦5 1728.0 F Rissani &
Taouz El Bgaa 8.30 28.9 4,960 7.20 4.60 10.6 ≦5 1100.0
Takacha 8.30 31.8 1,060 7.52 11.30 5.2 ≦5 249.9 G Alnif Toufassamam 8.30 23.5 365 7.52 5.50 4.2 ≦5 183.1
Aachich Ait Izza 8.20 27.5 625 8.64 3.39 ≦0.43 ≦5 205.6 Tigirna 8.30 26.3 705 9.20 3.37 1.8 ≦5 257.2 Tinifift 8.00 26.4 515 8.96 1.50 2.4 ≦5 280.7 Azag 8.15 23.5 565 8.84 6.19 1.2 ≦5 239.9 Taoumart 7.58 18.2 690 5.60 2.14 5.3 <5 0.0 Timarzit 7.85 16.3 567 8.30 2.02 0.3 <5 0.0
A1: with treatment of simple filtration, A2: with treatment of simple filtration and disinfection by chlorine, A3: with high level treatment, G: Guide value, I: Imperative value
: Maladoptation to irrigation standard

GT - 10
Table G.2.4 The Result of Water Quality Survey and Adaptation to Drinking Water Standard (2/4) Cl- Total
NitrogenSiO-
2 HCO-3 CO2-
3 NO3- NO2
- As
(mg/lit) (mg/lit) (mg/lit) (mg/lit) (mg/lit) (mg/lit) (mg/lit) (μg/lit)A1-G 300 1 - - - - - - A1-I 750 - - - - 50 - 50
Water Quality
Standard A2-G 300 2 - - - - - - A2-I 750 - - - - 50 - 50
Moroccan Standard of drinking water
A3-G 300 3 - - - - - - A3-I 750 - - - - 50 - 100 G:Guide value
I:Valeur imperative The strictest
value 300 1 - - - 50 - 50
WHO Guideline 250 - - - - 50 3 10 Sampling location
Zone Name of khettara Bakassia 203.8 0.385 15.5 322.1 0.0 9.25 ≦0.031 ≦6.8Ouinigui 43.1 0.325 21.9 268.4 0.0 0.21 ≦0.031 31.0
A Goulmima & Tinejdad Litama 191.1 0.390 13.3 287.9 0.0 12.80 ≦0.031 ≦6.8
Taghia 29.8 0.265 26.5 280.6 0.0 11.00 ≦0.031 ≦6.8 Agoudim 42.5 0.145 15.2 331.8 0.0 11.00 ≦0.031 ≦6.8 Taltafroute R.D 424.0 0.465 13.9 385.1 0.0 5.50 ≦0.031 ≦6.8 Aït Ben Omar 65.9 0.281 13.9 339.2 0.0 17.07 0 ≦6.8 Diba 93.6 0.293 16.3 303.8 0.0 15.81 0 ≦6.8
Chouater 1,038.6 - 16.3 151.2 0.0 13.80 ≦0.031 ≦6.8B Beni-Tadjit El kbira Ait El Abd 46.8 0.145 15.9 317.2 0.0 13.60 ≦0.031 ≦6.8
Jdida Ksar Boudnib 125.0 0.340 12.0 180.0 0.0 7.50 ≦0.031 ≦6.8C Boudnib Ouled Ali 473.0 0.240 15.0 278.0 0.0 4.40 ≦0.031 9.3
Souihla Ouled Ghanem
578.9 4.200 19.1 370.9 0.0 0.08 ≦0.031 14.1
Kadima Krair 612.6 0.345 19.3 317.2 0.0 11.00 ≦0.031 7.3
D Fezna, Jorf &
Hannabou Lahloua Mounkara 733.8 0.545 17.0 268.4 0.0 9.80 ≦0.031 ≦6.8 Jdida El Bouya 717.5 0.185 17.3 297.7 0.0 10.00 ≦0.031 ≦6.8 Khitiria Hannabou 731.5 ≦0.066 18.4 322.1 0.0 10.50 ≦0.031 ≦6.8 Lagrinia Hannabou 561.0 0.260 20.4 292.8 0.0 9.75 ≦0.031 7.6 Lambarkia 804.0 0.216 10.1 322.1 0.0 19.96 0 ≦6.8 Ouastania 420.0 0.253 21.8 295.2 0.0 10.35 0 ≦6.8 Lagrinia 542.0 0.257 20.4 268.4 0.0 10.71 0 ≦6.8
Kadima Sifa 667.9 0.135 17.9 297.7 0.0 11.50 ≦0.031 16.0 E Sifa Haj Allal 578.5 0.090 18.2 312.3 0.0 10.50 ≦0.031 ≦6.8
Ighzer 1,084.8 0.135 20.2 226.9 0.0 9.25 ≦0.031 ≦6.8 Charchmia 587.0 0.080 18.2 283.6 0.0 11.75 ≦0.031 ≦6.8
Haroun 1,394.0 1.320 14.7 163.5 0.0 9.75 0.123 ≦6.8F Rissani &
Taouz El Bgaa 913.2 0.505 14.3 117.1 0.0 5.00 ≦0.031 7.1
Takacha 85.9 0.215 16.6 251.3 0.0 6.50 ≦0.031 ≦6.8G Alnif Toufassamam 22.9 0.305 18.7 175.6 0.0 4.50 ≦0.031 ≦6.8
Aachich Ait Izza 51.1 0.175 21.7 185.4 0.0 14.50 ≦0.031 ≦6.8 Tigirna 59.6 0.125 22.4 205.0 8.4 19.00 ≦0.031 ≦6.8 Tinifift 21.3 0.340 24.4 258.6 0.0 7.50 ≦0.031 ≦6.8 Azag 42.5 0.075 17.2 249.0 0.0 3.10 ≦0.031 ≦6.8 Taoumart 28.5 0.528 27.0 324.5 0.0 2.29 0 ≦6.8 Timarzit 26.0 0.358 35.8 240.0 0.0 0.37 0 ≦6.8
A1:with treatment of simple filtration A2:with treatment of simple filtration and disinfection by chlorine A3:with high-level treatment G:Guide value, I: Imperative value
: Maladoptation to irrigation standard

GT - 11
Table G.2.4 The Result of Water Quality Survey and adaptation to Drinking Water Standard (3/4) Al NH4
+ Cd Fe F- SO42- Na K
(μg/lit) (mg/lit) (μg/lit) (μg/lit) (mg/lit) (mg/lit) (mg/lit) (mg/lit)A1-G - 0.05 1 - 0.7 200 - - A1-I - 0.50 5 300 1.5 - - -
Water Quality
Standard
Moroccan Standard of drinking water
A2-G - 1.00 1 1,000 0.7 200 - - A2-I - 1.50 5 2,000 1.5 - - - A3-G - 2.00 1 1,000 0.7 200 - - A3-I - 4.00 5 3,000 1.5 - - - G:Guide value
I:Valeur imperative The strictest
value - 0.05 1 300 0.7 200 - -
WHO Guideline 200 - 3 300 1.5 250 200 - Sampling location
Zone Name of khettara Bakassia ≦14 0.022 ≦0.4 41.5 0.52 141.0 101.1 3.87 Ouinigui 59.5 0.008 ≦0.4 79.8 0.35 23.5 23.4 2.26
A Goulmima & Tinejdad Litama ≦14 0.109 ≦0.4 17.4 0.33 130.0 97.4 2.99
Taghia ≦14 0.667 ≦0.4 ≦10.4 0.35 35.5 23.0 3.80 Agoudim ≦14 0.094 ≦0.4 62.5 0.55 313.0 28.3 1.45 Taltafroute R.D ≦14 0.082 ≦0.4 37.1 0.55 245.0 245.0 4.80 Aït Ben Omar ≦14 0.045 ≦0.4 30.4 0.15 91.6 55.3 2.88 Diba ≦14 0.019 ≦0.4 24.8 0.16 164.2 89.6 3.63
Chouater ≦14 0.013 ≦0.4 70.7 1.60 487.5 638.0 6.80 B Beni-Tadjit El kbira Ait El Abd ≦14 0.058 ≦0.4 534.2 0.37 132.0 38.8 0.62
C Boudnib
Jdida Ksar Boudnib ≦14 0.016 ≦0.4 12.0 0.55 85.0 90.5 2.86
Ouled Ali ≦14 0.056 ≦0.4 14.1 0.85 235.0 250.5 4.12 Souihla Ouled
Ghanem 188.3 0.937 ≦0.4 590.5 0.45 277.5 379.8 13.50
Kadima Krair ≦14 0.005 ≦0.4 35.3 0.57 345.0 328.2 5.42
D Fezna, Jorf
& Hannabou Lahloua Mounkara ≦14 0.022 ≦0.4 286.8 0.68 370.0 412.4 6.83
Jdida El Bouya ≦14 0.023 ≦0.4 12.5 0.70 335.0 390.1 6.42 Khitiria Hannabou ≦14 0.002 ≦0.4 ≦10.4 0.53 407.5 368.2 5.21 Lagrinia Hannabou ≦14 0.003 ≦0.4 52.7 0.65 340.0 296.8 4.81 Lambarkia ≦14 0.017 ≦0.4 60.0 0.22 473.9 387.8 7.73 Ouastania ≦14 0.007 ≦0.4 ≦10.4 0.32 265.7 225.9 4.55 Lagrinia ≦14 0.011 ≦0.4 ≦10.4 0.33 336.9 279.4 6.25
Kadima Sifa ≦14 0.031 ≦0.4 14.8 0.65 370.9 343.6 5.87 Haj Allal ≦14 0.010 ≦0.4 12.8 0.76 313.0 298.0 5.04
E Sifa
Ighzer ≦14 0.031 ≦0.4 32.9 0.68 557.5 570.2 7.96 Charchmia ≦14 0.012 ≦0.4 23.4 0.72 317.5 309.5 5.11
Haroun ≦14 0.662 ≦0.4 65.3 0.81 730.0 632.0 13.80 F Rissani &
Taouz El Bgaa ≦14 0.249 ≦0.4 44.5 1.30 1,450.0 738.0 8.90
Takacha ≦14 0.026 ≦0.4 118.5 1.20 158.0 153.0 5.96 Toufassamam ≦14 0.076 ≦0.4 60.6 0.26 21.8 14.8 2.10
G Alnif
Aachich Ait Izza ≦14 0.010 ≦0.4 12.0 0.85 60.4 67.8 2.50 Tigirna ≦14 0.055 ≦0.4 30.5 0.62 117.0 59.4 4.90 Tinifift ≦14 0.020 ≦0.4 ≦10.4 0.32 29.8 20.6 1.40 Azag ≦14 0.016 ≦0.4 45.0 0.44 62.5 39.8 2.30 Taoumart ≦14 <0,002 ≦0.4 661.0 0.08 127.0 45.5 5.02 Timarzit ≦14 <0,002 ≦0.4 205.0 0.08 141.0 47.5 4.74
A1:with treatment of simple filtration A2:with treatment of simple filtration and disinfection by chlorine A3:with high-level treatment G:Guide value, I: Imperative value
: Maladoptation to irrigation standard

GT - 12
Table G.2.4 The Result of Water Quality Survey and Adaptation to Drinking Water Standard (4/4)
Ca Mn Mg BOD COD Coli form Group
Fecal coli form
Hg
(mg/lit) (μg/lit) (mg/lit) (mg/lit) (mg/lit) ( /100ml) ( /100ml) (mg/lit)A1-G - - - 3 - 50 20 - A1-I - 100 - - - - - 0.001
Water Quality
Standard
Moroccan Standard of drinking water
A2-G - 100 - 7 25 5,000 2,000 - A2-I - 100 - - - - - 0.001 A3-G - 1,000 - 10 40 50,000 20,000 - A3-I - - - - - - - 0.001 G:Guide value
I:Valeur imperative The strictest
value - 100 - 3 25 50 20 0.001
WHO Guideline - 500 - - - undetected
undetected 0.001
Sampling location Zone Name of khettara
Bakassia 132.3 38.2 27.9 1.96 26.9 600 200 0 Ouinigui 80.7 13.8 14.9 6.30 38.4 30,000 4,600 0
A Goulmima & Tinejdad Litama 128.2 8.9 25.5 0.41 36.5 150,000 13,000 0
Taghia 80.2 ≦1 21.9 1.14 28.8 35,000 2,100 0 Agoudim 109.8 6.6 77.0 2.83 25.0 700 140 0 Taltafroute R.D 186.4 6.2 47.4 0.96 17.3 10,000 7,000 0 Aït Ben Omar 113.8 8.5 20.9 1.63 <7,5 30 0 0 Diba 88.2 7.4 60.8 0.56 <7,5 80 70 0
Chouater 170.3 17.0 72.9 ≦0.2 7.7 0 0 0 B Beni-Tadjit El kbira Ait El Abd 105.2 89.2 35.8 1.55 17.3 930,000 400,000 0
C Boudnib
Jdida Ksar Boudnib 67.3 ≦1 19.9 ≦0.2 ≦7.5 5,400 2,600 0
Ouled Ali 156.0 2.2 63.2 0.88 12.1 3,300 980 0 Souihla Ouled
Ghanem 184.4 34.8 60.8 52.30 147.0 3,200 1,200 0
Kadima Krair 148.3 1.6 94.8 ≦0.2 20.2 3,300 1,200 0
D Fezna, Jorf
& Hannabou Lahloua Mounkara 190.4 10.8 83.8 ≦0.2 54.4 4,600 2,200 0
Jdida El Bouya 200.4 1.6 80.2 ≦0.2 46.3 2,100 620 0 Khitiria Hannabou 165.3 3.4 103.8 ≦0.2 29.2 210 50 0 Lagrinia Hannabou 142.3 2.1 77.8 ≦0.2 24.2 4,400 1,800 0 Lambarkia 239.0 31.8 86.0 0.71 19.2 13,000 4,000 0 Ouastania 123.0 1.5 68.5 0.37 <7,5 90 60 0 Lagrinia 139.0 2.9 94.0 0.38 <7,5 300 0 0
Kadima Sifa 188.4 3.1 74.1 0.78 25.0 900 400 0 Haj Allal 172.3 2.5 65.6 0.62 40.3 12,000 4,800 0
E Sifa
Ighzer 204.4 4.2 155.5 0.78 25.0 7,000 2,800 0 Charchmia 166.3 1.8 70.5 0.55 28.8 6,000 900 0
Haroun 360.7 7.6 201.4 1.26 53.8 6,000 800 0 F Rissani &
Taouz El Bgaa 348.7 4.5 55.9 1.96 46.1 4,000 600 0
Takacha 60.1 15.2 24.3 0.43 ≦7.5 500 0 0 Toufassamam 54.1 17.4 11.7 1.85 11.5 44,000 16,000 0
G Alnif
Aachich Ait Izza 78.2 2.6 2.6 0.53 ≦7.5 12,000 7,000 0 Tigirna 70.1 5.4 20.0 0.82 22.0 6,000 700 0 Tinifift 79.2 4.0 20.2 0.67 ≦7.5 46,000 13,000 0 Azag 70.1 7.4 15.8 ≦0.72 22.0 11,000 900 0 Taoumart 98.6 33.6 37.9 0.30 13.4 1,600 450 0 Timarzit 59.3 8.9 45.4 <0,20 <7,5 8,000 850 0
A1:with treatment of simple filtration A2:with treatment of simple filtration and disinfection by chlorine A3:with high-level treatment G:Guide value I: Imperative value
: Maladoptation to irrigation standard

GT - 13
Table G.2.5 Result of Water Quality Standards pH Temperature
(water) Conduc-tivity (20℃)
Disso-lved O2
Turbid-ity
Sus -pended Solid
Color Total Hardness
Cl- Total Nitrogen
SiO-2 HCO-
3 CO2-3 NO3
- NO2-
(℃) (μS/cm) (mg/lit) NTU (mg/lit) (mg/lit) (mg/lit) (mg/lit) (mg/lit) (mg/lit) (mg/lit) (mg/lit) (mg/lit) (mg/lit)
Water Quality Standard
Moroccan standard of irrigation water
6.5~8.4 35 12,000 - - 100(Spot irrigation)
2,000(Spread irrigation)
- - 105(Spot Irrigation)
350(Spread irrigation)
- - 518 - 30Nitrate- Nitrogen)
※133mg/lit (Nitrate ion)
-
A1-G 6.5~8.5 20 1,300 7.0 - 50 <10 - 300 1 - - - - - A1-I - 30 2,700 - - - 20 - 750 - - - - 50 - A2-G 6.5~9.2 20 1,300 5.0 - 1,000 50 - 300 2 - - - - - A2-I - 30 2,700 - - - 100 - 750 - - - - 50 -
Moroccan Standard of
drinking water
A3-G 6.5~9.2 20 1,300 3.0 - 2,000 50 - 300 3 - - - - - A3-I - 30 2,700 - - - 200 - 750 - - - - 50 - G:Guide value
I:Valeur imperative
The strictest value
6.5~8.5 20 1,300 7.0 - 50 <10 - 300 1 - - - 50 -
WHO Guideline - - - - 5 - 15 - 250 - - - - 50 3
As Al NH4
+ Cd Fe F- SO42- Na K Ca Mn Mg BOD COD Coli form
Group Fecal coli
form Hg
(μg/lit) (μg/lit) (mg/lit) (μg/lit) (μg/lit) (mg/lit) (mg/lit) (mg/lit) (mg/lit) (mg/lit) (μg/lit) (mg/lit) (mg/lit) (mg/lit) (MPN /100ml)
(MPN /100ml)
(mg/lit)
Water Quality Standard
Moroccan standard of irrigation water
100 5,000 - 10 5,000 1.0 250 69mg/l(Spot irrigation)
9SAR(Spread irrigation)
- - 200 - - - - 1,000 0.001
Moroccan Standard of
drinking water
A1-G - - 0.05 1 - 0.7 200 - - - - - 3 - 50 20 -
A1-I 50 - 0.50 5 300 1.5 - - - - 100 - - - - - 0.001 A2-G - - 1.00 1 1,000 0.7 200 - - - 100 - 7 25 5,000 2,000 - A2-I 50 - 1.50 5 2,000 1.5 - - - - 100 - - - - - 0.001 A3-G - - 2.00 1 1,000 0.7 200 - - - 1,000 - 10 40 50,000 20,000 - A3-I 100 - 4.00 5 3,000 1.5 - - - - - - - - - - 0.001 G:Guide value
I:Valeur imperative
The strictest value
50 - 0.05 1 300 0.7 200 - - - 100 - 3 25 50 20 0.001
WHO Guideline 10 200 - 3 300 1.5 250 200 - - 500 - - - undetected undetected 0.001

GT - 14
Table G.2.6 The Adaptation to the Irrigation Standard by Zone and the Cause of Maladaptation (1/2)
Item of survey Moroccan Standard of irrigation water
The number of samples which exceed the strictest standard
Evaluation Cause of Maladaptation
A (8)
B (2) C (2) D (9)
E (4) F (2) G (8)
pH 6.5~8.4 0 0 0 0 0 0 0 All samples meet the irrigation standard - Temperature
(water) (℃) 35 0 0 0 0 0 0 0 All samples meet the irrigation standard -
Conductivity(20℃)
(μS/cm) 12,000 0 0 0 0 0 0 0 - ditto - -
Dissolved O2
(mg/l) - - - - - - - - - -
Turbidity NTU - - - - - - - - - - Suspended
Solid (mg/lit) 100(Spot irrigation)
2,000(Spread irrigation)
0 0 0 0 0 0 0 All samples meet the irrigation standard -
Color (mg/lit) - - - - - - - - - - Total
Hardness (mg/lit) - - - - - - - - - -
Cl- (mg/lit) 105(Spot Irrigation) 350(Spread irrigation)
3 1 2 9 4 2 0 Twenty-one samples exceed the standard of irrigation water. The samples containing high value of chloride concentrate to Zone D, E, and F.
The main source of high chloride is derived from original rock and soil in the sampled area.
Total Nitrogen
(mg/lit) - - - - - - - - - -
SiO2- (mg/lit) - - - - - - - - - -
HCO3- (mg/lit) 518 0 0 0 0 0 0 0 All samples meet the irrigation standard -
CO32- (mg/lit) - - - - - - - - - -
NO3- (mg/lit) 30(Nitrate-Nitrogen)
※133mg/lit(Nitrate ion)0 0 0 0 0 0 0 All samples meet the standard of
irrigation and drinking water. -
NO2- (mg/lit) - - - - - - - - - -
As (μg/lit) 100 0 0 0 0 0 0 0 All samples meet the irrigation standard -

GT - 15
Table G.2.6 The Adaptation to the Irrigation standard by Zone and the Cause of Maladaptation (2/2)
Item of survey Moroccan Standard of irrigation water
The number of samples which exceed the strictest standard
Evaluation Cause of Maladaptation
A (8) B (2) C (2) D (9) E (4) F (2) G (8) Al (μg/lit) 5,000 0 0 0 0 0 0 0 All samples meet the irrigation standard -
NH4+ (mg/lit) - - - - - - - - - -
Cd (μg/lit) 10 0 0 0 0 0 0 0 All samples meet the irrigation standard - Fe (μg/lit) 5,000 0 0 0 0 0 0 0 All samples meet the irrigation standard - F- (mg/lit) 1.0 0 1 0 0 0 1 1 Three samples exceed the irrigation
standard. The source of fluorine ion is derived from the original rock and soil in the sampled area.
SO42- (mg/lit) 250 1 1 0 9 4 2 0 Fifteen samples exceed the standard of
irrigation standard. The source of sulfate ion is derived from original rock and soil in the sampled area. There is the possibility that the cause of it is contamination of domestic wastewater.
Na (mg/lit) 69mg/lit(Spot irrigation)
9SAR(Spread irrigation)
4 1 2 9 4 2 0 Twenty-two samples don't meet the Moroccan standard of irrigation water (Spot irrigation). The samples of high volume of sodium ion concentrate to Zone D, E, and F.
The source of high volume of sodium ion is thought to be derived from original rock and soil in the sampled area.
K (mg/lit) - - - - - - - - - - Ca (mg/lit) - - - - - - - - - - Mn (μg/lit) 200 0 0 0 0 0 0 0 All samples meet the irrigation standard - Mg (mg/lit) - - - - - - - - - -
BOD (mg/lit) - 1 0 0 1 0 0 0 The samples of Ouinigui and Souihla Ouled Ghaner don't meet the Moroccan standard of drinking water (A1-G).
The high value of BOD and COD indicate that the sample contains rich organic mater. The high value of BOD and COD is thought to be caused by contamination of animal waste and domestic wastewater.
COD (mg/lit) - 4 0 0 4 2 2 0 Twelve samples in Zone A, D, E, and F don't meet the Moroccan standard of drinking water (A2-G).
Coli form Group
(/100ml) - - - - - - - - Coli form groups are detected from all samples except of Chouater.
The high value of coli form group and fiscal coli form is caused by the contamination of animal and human excreta and domestic wastewater. Almost khettaras water except of 4 khettara should be disinfected by chorine for drinking.
Fecal Coli form
(/100ml) 1,000 4 1 1 5 2 0 3 Fiscal coli forms are detected from all samples except of Ait Ben Omar, Chouater, Lagrinia and Takacha.
Hg (mg/lit) 0.001 0 0 0 0 0 0 0 Hg is not detected from all samples. -

GT - 16
Table G.2.7 The Adaptation to the Drinking Water Standard by Zone and the Cause of Maladaptation (1/3) Item of survey Morocca
n standard
WHO Guidelin
e
The number of samples which exceed the strictest standard
Evaluation Cause of Maladaptation
A (8) B (2) C (2) D (9) E (4) F (2) G (8) pH 6.5~8.5 - 0 0 0 0 0 0 0 All samples meet the drinking water standard -
Temperature(water)
(℃) 20 - 5 1 2 8 4 2 6 Twenty-eight samples exceed the drinking water standard
-
Conductivity(20℃)
(μS/cm) 1,300 - 1 1 1 9 4 2 0 The high value of conductivity concentrate to Zone D, E, F.
Electric conductivity is the indicator of total volume of inorganic ion. These inorganic ions are derived from original rock and soil, because the volume of inorganic ions, such as Na, Cl, SO4, are also high, and no big industrial factory exists in the sampled area. There is the possibility that the source of them is domestic wastewater.
Dissolved O2
(mg/l) 7.0 - 2 0 0 3 0 0 1 Almost samples, except of 3 samples in Zone A, 2 samples in Zone D, and 1 sample in Zone G, meet the drinking water standard (A1-G).
Dissolved Oxygen (DO) has inverse association with BOD. The water indicating high BOD contains the low DO. The sample at Souihla Ouled Ghaner, which has extremely high BOD as 52.3mg/lit, has low DO as 2.8mg/lit.
Turbidity NTU - 5 5 2 0 3 0 1 3 Twelve samples exceed the standard of WHO guideline. The values of turbidity vary from location to location.
The main source of turbid is contamination of sand from shafts of khettara.
Suspended Solid
(mg/lit) 50 - 0 1 0 1 0 0 0 All samples, except of El Kbira Ait El in Zone A and Lahloua Monkara in Zone D, meet the standard of drinking water (A1-G).
Two samples mentioned in the left column also contain high value of turbidity. The samples, which contain high value of SS, are considered of contaminating much volume of sand.
Color (mg/lit) <10 15 0 0 0 0 0 0 0 All samples meet the drinking water standard - Total
Hardness (mg/lit) - - - - - - - - - The total hardness of samples varies from
183mg/lit,to 1,728mg/lit. According to WHO Guideline, all samples are classified into very hard.
Total hardness is the total volume of calcium and magnesium ion. These are derived from original rock and soil in the sampled area.
Cl- (mg/lit) 300 250 1 1 1 9 4 2 0 Eighteen samples exceed the standard of drinking water. The samples containing high value of chloride concentrate to Zone D, E, and F.
The main source of high chloride is derived from original rock and soil in the sampled area.

GT - 17
Table G.2.7 The Adaptation to the Drinking Water Standard by Zone and the Cause of Maladaptation (2/3) Item of survey Morocca
n standard
WHO Guidelin
e
The number of samples which exceed the strictest standard
Evaluation Cause of Maladaptation
A (8) B (2) C (2) D (9) E (4) F (2) G (8) Total
Nitrogen (mg/lit) 1 - 0 0 0 1 0 1 0 All samples except of Souihla Ouled Ghaner
in Zone D and Haroun in Zone F meet the standard of drinking water (A1-G).
Almost samples contain low total nitrogen, and all samples contains low nitrate. Then, the pollution by chemical fertilizer does not consider existing in this area.
SiO2- (mg/lit) - - - - - - - - - The concentration of SiO2 in natural water is
normally from 1 to 30 mg/lit. All samples are in the normal range.
-
HCO3- (mg/lit) - - 0 0 0 0 0 0 0 All samples meet the drinking water standards -
CO32- (mg/lit) - - - - - - - - - All samples include no carbonate ion. -
NO3- (mg/lit) 50 50 0 0 0 0 0 0 0 All samples meet the standard of irrigation
and drinking water. -
NO2- (mg/lit) - 3 0 0 0 0 0 0 0 All samples meet the standard of irrigation
and drinking water. -
As (μg/lit) 50 10 1 0 0 1 1 0 0 All samples meet the Moroccan standard of drinking water(A1-I), while three sample samples don't meet the WHO guideline.
-
Al (μg/lit) - 200 0 0 0 0 0 0 0 All samples meet the WHO guideline. - NH4
+ (mg/lit) 0.05 - 4 1 1 1 0 2 2 One each sample in zone A, D, and F, exceed the standard of drinking water (A1-I), while 11 samples exceed the standard of drinking water (A1-2).
High concentration of Ammonium ion is caused by contamination of animal waste and domestic wastewater.
Cd (μg/lit) 1 3 0 0 0 0 0 0 0 All samples bellow the detection limits. - Fe (μg/lit) 300 300 0 1 0 1 0 0 0 All samples, except of El Kbira Ait El Abd in Zone
B and Souihla Ouled Ghaner in Zone D, exceed the WHO Guideline. These values bellow the level of health damaging to inhabitants.
The source of high volume of Fe is thought to be derived from original rock and soil in the sampled area.
Al (μg/lit) - 200 0 0 0 0 0 0 0 All samples meet the WHO guideline. - NH4
+ (mg/lit) 0.05 - 4 1 1 1 0 2 2 One each sample in zone A, D, and F, exceed the standard of drinking water (A1-I), while 11 samples exceed the standard of drinking water (A1-2).
High concentration of Ammonium ion is caused by contamination of animal waste and domestic wastewater.

GT - 18
Table G.2.7 The Adaptation to the Drinking Water Standard by Zone and the Cause of Maladaptation (3/3)
Item of survey Moroccan standard
WHO Guideline
The number of samples which exceed the strictest standard
Evaluation Cause of Maladaptation
A (8) B (2) C (2) D (9) E (4) F (2) G (8) Cd (μg/lit) 1 3 0 0 0 0 0 0 0 All samples bellow the detection limits. - Fe (μg/lit) 300 300 0 1 0 1 0 0 0 All samples, except of El Kbira Ait El Abd and
Souihla Ouled Ghaner, exceed the WHO Guideline. These values bellow the level of health damaging to inhabitants.
The source of high volume of Fe is thought to be derived from original rock and soil in the sampled area.
F- (mg/lit) 0.7 1.5 0 1 1 0 2 2 2 The sample at Chouater exceeds slightly the WHO Guideline, while 8 samples exceed the Moroccan standard (A1-G).
The source of fluorine ion is derived from the original rock and soil around the sampled area.
SO42- (mg/lit) 200 250 2 1 1 9 4 2 0 Nineteen samples exceed the standard of
drinking water (A1-G). The source of sulfate ion is derived from original rock and soil in the sampled area. There is the possibility that the cause of it is contamination of domestic wastewater.
Na (mg/lit) - 200 1 1 2 9 4 2 0 Eighteen samples don't meet the WHO guideline. The samples of high volume of sodium ion concentrate to Zone D, E, and F.
The source of high volume of sodium ion is thought to be derived from original rock and soil in the sampled area.
K (mg/lit) - - - - - - - - - - - Ca (mg/lit) - - - - - - - - - - - Mn (μg/lit) 100 500 0 0 0 0 0 0 0 All samples meet the drinking water standard. - Mg (mg/lit) - - - - - - - - - - -
BOD (mg/lit) 3 - 1 0 0 1 0 0 0 The samples of Ouinigui and Souihla Ouled Ghaner don't meet the Moroccan standard of drinking water (A1-G).
The high value of BOD and COD indicate that the sample contains rich organic mater. The high value of BOD and COD is thought to be caused by contamination of animal waste and domestic wastewater.
COD (mg/lit) 25 - 4 0 0 4 2 2 0 Twelve samples in Zone A, D, E, and F don't meet the Moroccan standard of drinking water (A2-G). Coli form
Group (/100ml) 50 undetected 8 1 2 9 4 2 8 Coli form groups are detected from all samples
except of Chouater. The high value of coli form group and fiscal coli form is caused by the contamination of animal and human excreta and domestic wastewater. Almost khettaras water except of 4 khettara should be disinfected by chorine for drinking.
Fecal Coli form
(/100ml) 20 undetected △ △ × △ × × △ Fiscal coli forms are detected from all samples except of Ait Ben Omar, Chouater, Lagrinia and Takacha.
Hg (mg/lit) 0.001 0.001 0 0 0 0 0 0 0 Hg is not detected from all samples. -

GT - 19
Table G.3.1 Initial Environment Examination (the Master Plan) (1/5)
Segment of the environment Evaluation Underpinning
I Social environment
1. Social life
1-1 Life of populations
1. Programed displacements of population
D This project does not envisage displacements of population.
2. No voluntary displacements of population
D No expulsion is necessary.
3. Modification of life modes D The program should not change on the way of life. On the other hand for the advance of income generation projects and life improvement projects in the Master Plan, it is considered that the social status and role of women are changed. It is not evaluated as negative impact.
4. Frictions between inhabitants D The Master Plan takes into account the fairness of the opportunity of khettara and irrigation canal rehabilitation. Because it is possible that inhabitants whose khettara is include in the long term plan (it will be rehabilitated after 10 years later) complain that their khettara’s rehabilitation is implemented more earlier, it is necessary that the ORMVA/TF should explain inhabitants the selection criteria and basis of priority for khettara and canal rehabilitations.
5. Natives, minorities and nomads
D This project will not have effect on the life of nomads.
1-2 Demographic problems
1. Increase in the population D Because of its function first which is to guarantee the water of irrigation of the current arable lands, the project should not have effect over the increase in the population or the changes of the demographic composition (the stabilization of the incomes should on the hand dam up the rural migration towards the cities.
2. Abrupt modification of the demographic composition
D idem
1-3 Economic activities
1.Displacement of the bases of the economic activity
D Of share its objective which is to help those which take part in the bases of agricultural economics, it will not cause unemployment or displacements of the economic bases.
2. Economic conversions, unemployment
D idem
3. Digging of disparities of incomes
D The increase in the income of farmers through the increase in the production of the farmers’ lower-income group and the stabilization of their standard life being an objective of this project, the disparities should on the contrary grow blurred.

GT - 20
Table G.3.1 Initial Environment Examination (the Master Plan) (2/5)
Segment of the environment Evaluation Underpinning
1-4 Institution and custom
1. Adjustment of water right D The rehabilitation projects in the Master plan are implemented on the basis of the traditional water right system. Because the traditional water right system has wide flexibility, irrigation schedule is available to be adjusted in the water right system, even if the condition of irrigation schedule is changed by the khettara or canal rehabilitation.
2. Conversion of community structure by unionisation and so on
D It is possible that organizing farmers’ groups make influence to community structure. It is not evaluated as negative impact.
3. Conversion of existing institution and custom
D The Master Plan does not have negative impact to existing institution and custom
2. Health, hygiene
1. Increase of agricultural chemicals D Currently agriculture chemicals are scarcely used in the Study Area. On the other hand, chemical fertilizer is used in a matter in the Study Area. The quantity consumed of chemical fertilizer will not increased rapidly, because the utilization of organic fertilizer, such as straw, green manure, barnyard manure is considered to be promoted by implementation of the Mater Plan. Therefore, negative impact to environment hardly occurs.
2. Appearance of endemics D In the surroundings there are no diseases endemic or serious contagious and the project should not reveal some.
3. Propagation of the contagious diseases
D The project should not cause the appearance or the propagation of new contagious diseases. As measures of fight against the disease of the fly on the eyes which is a local problem of health we let us envisage constituting of compost with the household refuse. This should cause to prevent the appearance of contagious diseases.
4. Residual toxicity (accumulation of phytosanitary products)
D Currently agriculture chemicals are scarcely used in the Study Area. On the other hand, chemical fertilizer is used in a matter in the Study Area. The quantity consumed of chemical fertilizer will not increased rapidly, because the utilization of organic fertilizer, such as straw, green manure, barnyard manure is considered to be promoted by implementation of the Mater Plan. Therefore, negative impact to environment hardly occurs.
5. Increase in waste and dejections D This project having for objective to maintain volumes of agricultural water useful for the current farms (the number of owners is fixed) it will not have there abrupt flow of the population.
6. Others (drinking water) - Currently in the majority of the villages, the khettara’s water is used as drinking water whereas the analyses show that it is unsuitable with consumption. It is necessary to convince the population served by ONEP not to drink more the khettara’s water.

GT - 21
Table G.3.1 Initial Environment Examination (the Master Plan) (3/5)
Segment of the environment Evaluation Underpinning
3. Historic sites, cultural inheritance, landscapes
1. Deterioration or destruction of the historic sites or cultural inheritance
D One does not know historic sites or masonry indexed with the cultural inheritance in surroundings of the site (but they will have all the same to be taken into account if they are discovered under study). The khettaras themselves are regarded as forming part of the cultural inheritance, on which of this fact tour project will have a positive impact (maintenance and conservation)
2. Degradation of nice landscapes D There is not in the surroundings of the site of the rare landscapes and our project will not deteriorate the landscape.
3. Underground resources D No buried object is indexed in the surroundings of the site.
II. Natural Environment
4. Rare species and ecological sites
1. Modification of vegetable cover D Measurements against the desertification should somewhat improve or reconstitute vegetable cover. (Positive effect). That will not have effect on the ecological system.
2. Rare and particular vegetable species
D idem
3. Biodiversity D idem
4. Invasion and proliferation of the harmful species
C The areas of date culture will increase with the project; it will be necessary to pay attention so that the disease of the Bayoud caused by a bacterium of the soil
5. Soils and lands
5-1 Soils
1. Erosion of soils D The project will not have new incidence on erosion of the soil.
2. Salinity of soils C The project will introduce the water saving irrigation which is a method which does not have any impact on salinity, it will be necessary however to remain attentive because the water of khettara contains salts.
3. Decrease of soil fertility D The utilization of organic fertilizer, such as straw, green manure, barnyard manure and crop rotation are planned in the Master Plan. It is considered that soil fertility is increased by implementation of the Master Plan.
4. Soils pollution D Currently agriculture chemicals are scarcely used in the Study Area. On the other hand, chemical fertilizer is used in a matter in the Study Area. The quantity consumed of chemical fertilizer will not increased rapidly, because the utilization of organic fertilizer, such as straw, green manure, barnyard manure is considered to be promoted by implementation of the Mater Plan. Therefore, negative impact to environment hardly occurs.

GT - 22
Table G.3.1 Initial Environment Examination (the Master Plan) (4/5)
Segment of the environment Evaluation Underpinning
5-2 Lands
1. Degradation of lands (including desertification)
D The rehabilitation of khettaras and other shutters of the project will take part in protection against the degradation of the lands and against desertification; they will absolutely not cause a fall of productivity of the lands or the progress of desert. Moreover the afforestation is envisaged like measures of fight against desertification. Its results will have to be supervised.
2. Degradation of back-country (wood, pastures)
D There will be no increase in the population, no increase in the wood of heating and no increase in pasture likely to deteriorate the back-country.
3. Subsidence of the ground D There is no soft foundation in the Study Area and thus it should not occurs subsidence. Moreover it has until now never deferred case of subsidence because of water collecting in the underground.
6. Hydrogeology
6-1 Hydrology
1. Modification of surface flows D Surface flows are not influenced by khettara or canal rehabilitations. It is possible that surface flows are influence by construction of recahrge facility to underground water. The influence should be evaluated in future. (Zones A, C, D, E, G)
2. Modification of the underground flows and level of the water sheets
D A gallery of collecting will be built close of the water sheet for water storage on a great surface and to send it by gravity. This type of installation should slightly modify the level of the water sheet without having a very large incidence on the underground flows or the modification of the level. The equipment of recharge which they will be used to reload the overdrawn water sheet with surface water will not have either negative impact. It will be necessary to study the consequences which could have of the equipment of big size. There will be no impact because of the rehabilitation of khettaras. It will be necessary well to study the installation of the equipment of recharge so that they do not have repercussions (zones A, C, D, E, G).
3. Appearance of floods D There will be no impact because of the rehabilitation of khettaras. It will be necessary well to study the implementation of equipment of so that they do not have repercussions (zones A, C, D, E, G)
4. Sand accumulation D There will be no impact because of the rehabilitation of khettaras. The influence of recharge facilities to underground water should be evaluated in future.
5. Subsidence of bed of rivers D idem

GT - 23
Table G.3.1 Initial Environment Examination (the Master Plan) (5/5)
Segment of the environment Evaluation Underpinning
6-2 Quality and water temperature
1. Water polution D The water pollution will not occur by implementation of the Master Plan. Wastewater after washing and feces and food scraps as one of the sources of water pollution is expected to be reduced by enlightenment activities planned in the life improvement plan. The water quality is expected to be improved by implementation of the Master Plan.
2. Eutrophication D Nutritive salts which constitute the enrichment of the water sheet should not increase.
3. Temperature change D The temperature of the water sheet is stable, and should not change much after the rehabilitation and installation of recharge equipment.
6-3 Atmosphere
1. Atmosphere pollution D The rehabilitations of khettaras are work of relatively small scale which should not have negative effect. In case of big scale recharge facilities, it will be necessary to take in consideration this factor, and to study the working methods to measurement of the progress of the study.
Added Components in the New the JICA’s Guideline
Segment of the environment Evaluation Underpinning Bottom Material D It is not influenced by khettara or canal rehabilitation
In case construction of recharge facility to underground water, it is necessary to consider this factor.
Accidents D It is planned in the Master Plan that existing khettaras and canals are rehabilitated. The techniques of khettara and canals rehabilitation were stocked well through the long experience. We can prevent accidents from paying attention well to safety at implementation of rehabilitation works.
Greenhouse warming D The rehabilitation of kehttaras and canals are small scale works, and they don’t influence to greenhouse warming
Children’s entitlement D The rural life is expected to be improved by implementation of the Master Plan. Advancement rate is expected to be increased by the improvement of rural life. Therefore, they are evaluated as positive impact.

GT - 24
Table G.4.1 Projects subjected to environmental impact assessment ( Law n°12-03 relating to environmental impact assessment )
1 - Unsanitary, unpractical or dangerous facilities classified in category I. 2 - Infrastructure projects
- Road construction (national highways and freeways); - Railways; - Airports; - Development of urban areas; - Development of industrial areas; - Trading ports and marinas; - Dams or any other facilities intended for permanent water retention or water storage - Tourism complexes, namely those located along the coast, in the mountain and in rural areas; - Facilities for waste or storage disposal, whatever their nature or their disposal method; - Waste water treatment stations and related works; - Sea drainage channels; - Transportation of hazardous or toxic materials.
3 - Industrial projects 3.1 - Mining industry: - Mines; - Sand and gravel quarries; - Cement works; - Plaster industry; - Cork processing. 3.2 - Power industry: - Facilities intended for the storage of gas and any other inflammable products; - Oil refineries; - Energy transfer heavy engineering construction; - Thermal power plants and other facilities with a combustion heating capacity of at least 300 MW; - Nuclear power plants; - Hydro-electric power stations. 3.3 - Chemical industry: - Facilities for chemical products, pesticides, pharmaceutical products, varnish paints, elastomers and peroxide manufacturing; - Launching of new chemical products on the market; - Asbestos mining, processing and transformation. 3.4 - Metal processing : - Iron-and-steel works; - Metal surface treatment and coating; - Sheet metal works and metallic equipment.
E’ 3.5 - Food products industry: - Animal and plant product preservation; - Milk product manufacturing; - Brewery; - Confectionery and drink manufacturing; - Fish meal and oil plants; - Industrial starch industry; - Sugar plants and molasses processing; - Flour mills and semolina mills; - Oil mills. 3.6 - Textile, leather, wood, paper, paperboard and pottery industry: - Paper pulp, paper and paperboard manufacturing; - Tanning and tawing industry; - Cellulose production and processing; - Fiber dyeing; - Fiber, particle and plywood panel manufacturing; - Textile and dyeing industry; - Pottery. 3.7 - Rubber industry: - Elastomer-based product manufacturing and processing.
4 - Agriculture - Rural land consolidation projects; - Reforestation projects with a surface area above 100 hectares; - Wasteland or semi-natural land piece allocation projects for large-scale farming.
5 - Aquaculture and fish-farming projects

GT - 25
Table G.4.2 Sample of Contents of EIE report
PROJECT NOTIFICATION FORM DESCRIPTION SHEET
1- PROJECT SPONSOR 1.1 Name of person in charge 1.2 Address - Telephone 1.3 Profession 1.4 Nationality 2- COMPANY CHARACTERISTICS 2.1- Company name 2.2- The mission 2.3- Legal form 2.4- Corporate capital 2.5- Main shareholders if applicable, specify the share of resident and non-resident capital) 2.6- Component headquarters (specify if it is an agency, an affiliate or a subsidiary) 2.7 ? Amount of investment 3- LOCATION 3.1- Land geographical location (location map) 3.2- Land Real estate by-laws 3.3- Land surface area 3.4- Covered surface area 3.5- Nature of construction 4- PROJECT DESCRIPTION 4.1- Nature of activity 4.2- Manufacturing processes considered 4.3- Nature and characteristics of raw materials 4.4- Energy used 4.5- Origin of raw materials 4.6- Nature, characteristics and quantity of intermediate and finished products
4.7- Storage conditions 4.8- Equipment required 4.9. Water consumption considered 4.10. Power consumption considered 4 11. Infrastructures considered (drinking water distribution, sewage service, roads network, VRD) 5- ENVIRONMENT AND MAIN
CONSTRAINTS DESCRIPTION 5 1. Land use in the vicinity of the project site 5 2. Nature of soil, topography, groundwater level 6- CHARACTERIZATION AND
QUANTIFICATION OF REJETS ON THE NATURAL AND HUMAN ENVIRONMENT
? Liquid discharges - Volume of discharged waste water per day (m3/j) - Characterization of discharged waste water (physicochemical and bacteriological composition) - What purification or treatment system is anticipated? ? Solid wastes (what volume management method are anticipated?) ? Atmospheric emissions (gas, fumes, dusts, etc.) ? Sound (noise) and odor (foul smell) nuisances 7- NUMBER OF JOBS CREATED 8- PROJECT EXECUTION SCHEDULE
Source: Home page of the State Secretariat for Environment

GT - 26
Table G.4.3 National program Countermeasure against Desertification (Long-term)
Programme of agricultural and farmland development, preservation of the natural resources, and the struggle against the desertification and the draught
Strategies of program Principal Objective Cost (millions DH)
Target year
Irrigation development To enlarge the irrigable area until 1.36 million ha (one million ha is currently irrigated). The plans concerns the extension and rehabilitation of large hydraulic system and small and middle hydraulic system (*PMH: Petite et Moyenne Hydraulique)
37,400 2020
National program for watershed management
Implementation of 3 millions ha 3,000 2020
Reforestation plan Reforestation of 1.5 millions ha 18,000 2030
Strategy of development for pasturage land
Implementation and management of 20 millions ha. Reform and rehabilitation of 2 millions ha.
12,000 2020
Master plan for protective zones Management and conservation of 154 biologically and ecologically important sites
364 2025
Master plan of conservation for agricultural land
Promotion of conservation of agricultural land at some pilot project sites
6000 2020
Program of infrastructure and basic social services
Strategies of program Principal Objective Cost (millions DH)
Target year
Strategy of water resources development
Construction of 70 large and middle scaled dams, at the rate of 3 units per year
32,000 2020
Program of provision of drinking water for rural population (PAGER) (*PAGER : Programme d'Approvisionnement Groupé en Eau Potable des Populations Rurales )
Drinking water for 31,000 local areas covering 11 million ha
11 2010
National Program of construction of rural roads (PNCRR) (*PNCRR: Program National de Construction des Routes Rurales)
Construction and / or rehabilitation of 11.200 km of rural roads and piste
Program of global electrification in rural area (PERG) (*PERG: Programme d'Electrification Rurale Global
Electrification of 1,500,000 houses in rural area, to achieve the electrical rate of 80 %
15,000 2010
BAJI Programme
Improvement of the rate of access to basic educational service in 14 underprivileged provinces
2,600

GT - 27
Table G.4.4 National Program Countermeasure against Desertification (Short-term) Economic and social plan for countermeasure against desertification from 2000 to 2004
Components Contents of components Cost ( millions DH)
Larte scaled irrigation Extension to 86,120ha of irrigation arae and rehabilitation 4,021,900
Small and middle scaled irrigation (PMH) (PMH: Petite et moyenne hydraulique)
Extension to 13,620ha of samll and middle scaled irrigation area , 136,500 ha of rehabilitation
3,163
Farmland improvement Removing stones (40,000ha), rehabilitation of agricultural land (32,000ha) , and land reform (98,000ha)
56,800
Integratd development projects
Agricultural and rural development projects 2,285
Procedures of increasing plant production
Extension of 150,000ha of olive and regenesis of citrus orchards (34,000ha)
964
Procedures of increasing animal production
Genetic improvement of livestock sheep, cattle, and goat 599
Management of quality Phytosanitary treatment and creation of laboratories 267
Formation of research and training
Formation of professionals and techniques 1,216
Studies and information systems
Natural ressources inventories 112
Other activities
Promotion of investment and economy of water 16,173
Management of forest area Installing equipments and safeguard in forest area 154,760
Management of forest Management of forest activities (14,700ha) 75,370
Biodiversity Management of biodiversity in 21 SIBE (*SIBE: Sites présentant un intérêt Biologique et Ecologique)
124,150
Reforestation Reforestation projects to 114,000 ha area 734,370
Countermeasure to erosion Projects of range management for control erosion and countermeasure to 1,800 ha of sand dune
117,240
Integrated development of forestation and peri-forestation area
Realization of a integrated development project 228,860
Reinforcement of institutions and researches
74,650

Figures

GF - 1
0 20 40 80km 60
Toauz
Boudenib
Beni-TadjitRich
Merzouga
Sifa
Hannabo
Bouanane
Ain Chouater
Province of Errachidia
Province of
Province of Figuig
Rissani
Monkara
FeznaJorf
Erfoud
Mellabo
M’sissi
Errachidi
Gulmima
The Developm
ent Study on Rural Comm
unity D
evelopment Project in Sem
i-Arid Atlas Regions with
Khettara Rehabilitation
Japan International Cooperation Agency
Alnif Zone G
Zone FZone E
Zone D
Zone C
Zone B
Zone A
Guir river basin
Gheris、Todra river basin Ziz river basin
2
3
4
5
7
7, 8
9
1011
12
1314
32
17
15~21
34
27
28
35
1
31
30
26
6
29
Tinejdad
36
252322 1 Bakassia 19 Lambarkia
2 Ouinigui 20 Ouastania3 Litama 21 Lagrinia4 Taghia 22 Kadima Sifa5 Agoudim 23 Haj Allal6 Taltafroute R.D 24 Ighzer7 Aït Ben Omar 25 Charchmia8 Diba 26 Haroun9 Chouater 27 El Bgaa
10 El kbira Ait El Abd 28 Takacha11 Jdida Ksar Boudnib 29 Toufassamam12 Ouled Ali 30 Aachich Ait Izza13 Souihla Ouled Ghanem 31 Tigirna14 Kadima Krair 32 Tinifift15 Lahloua Mounkara 33 Azag16 Jdida El bouya 34 Taoumart17 Khitiria Hannabou 35 Timarzit18 Lagrinia Hannabou 36 Ait Moulay l'Mamoun
Legend Boundary of catchment area City, village Errachidia Khettara Water quality survey Surfactant survey
Figure G.2.1 Location
Map
of W
ater Q
uality Survey and Surfactant Survey

GF - 2
Figure G.4.1 Chronology of EIA procedure in Morocco
The petitioner
National committee for EIA (CNEIE)
no
Decide: Ask EIA whether or not (special cases) yes
Draw up an EIA
Source: Home page of the State Secretariat in charge of environment
Min Evn & Supervisory authority Check the EIA prescription execution and implementation and activity compliance with the monitoring and follow-up programe
l ’Assess project compatibility with environment; give a technical advice.
Make a decision on project compatibility with environment, devise the protection measures to take. Inform the parties concerned of the decision.
Min Env & CNEIE Check whether the EIE file is complete. If necessary, request supplementary information.
Min Env & CNEIE Check whether the EIE file is complete. If necessary, request supplementary information.
Ensure that the project complies with the laws in force and with environment protection standards
Supervisory ministry Prepare the terms and conditions on the basis of guidelines
Supervisory authorities - Ministry of environment(MinEnv)
Project subjected to project list
Project notification
Terms of references
EIA report
Report complete
Technical assessment of report
Final decision
Monitoring and follow-up program
Activity
Public survey
Monitoring and follow-up
The Development Study on Rural Community Development Project in Semi-Arid Atlas Regions with Khettara Rehabilitation
in the Kingdom of Marocco Japan International Cooperation Agency