annexures contents -...
TRANSCRIPT

ANNEXURES
Contents 1. Topographical Map ............................................................................................................................ 2
2. Site Layout ........................................................................................................................................... 3
3. Emission & Control ............................................................................................................................ 4
4. Water Requirement: ........................................................................................................................... 6
5. ETP Design .......................................................................................................................................... 7
6. Plant Process ........................................................................................................................................ 8
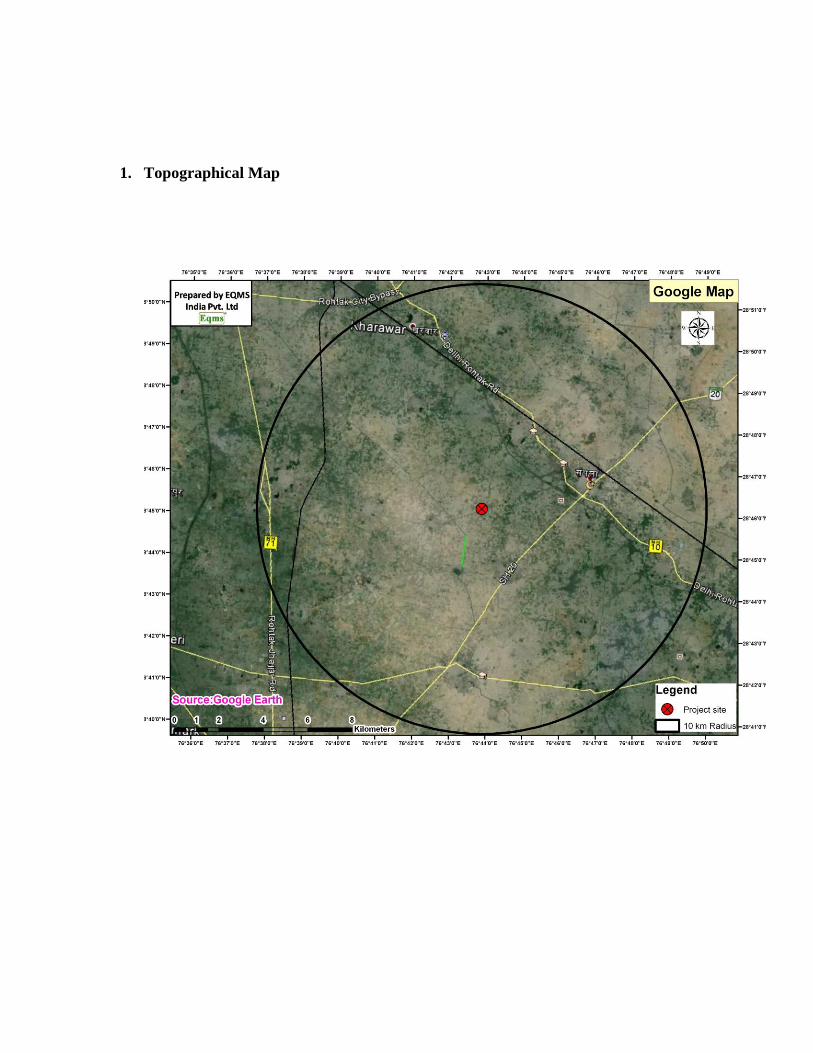
1. Topographical Map
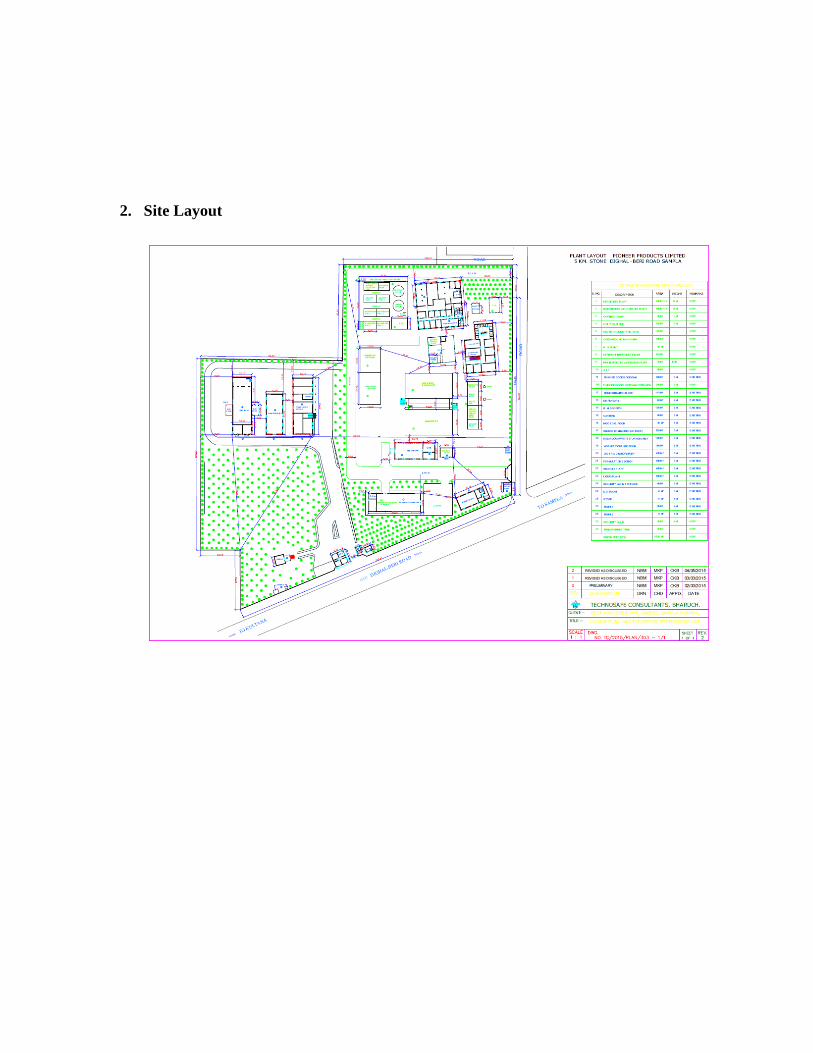
2. Site Layout
3. Emission & Control
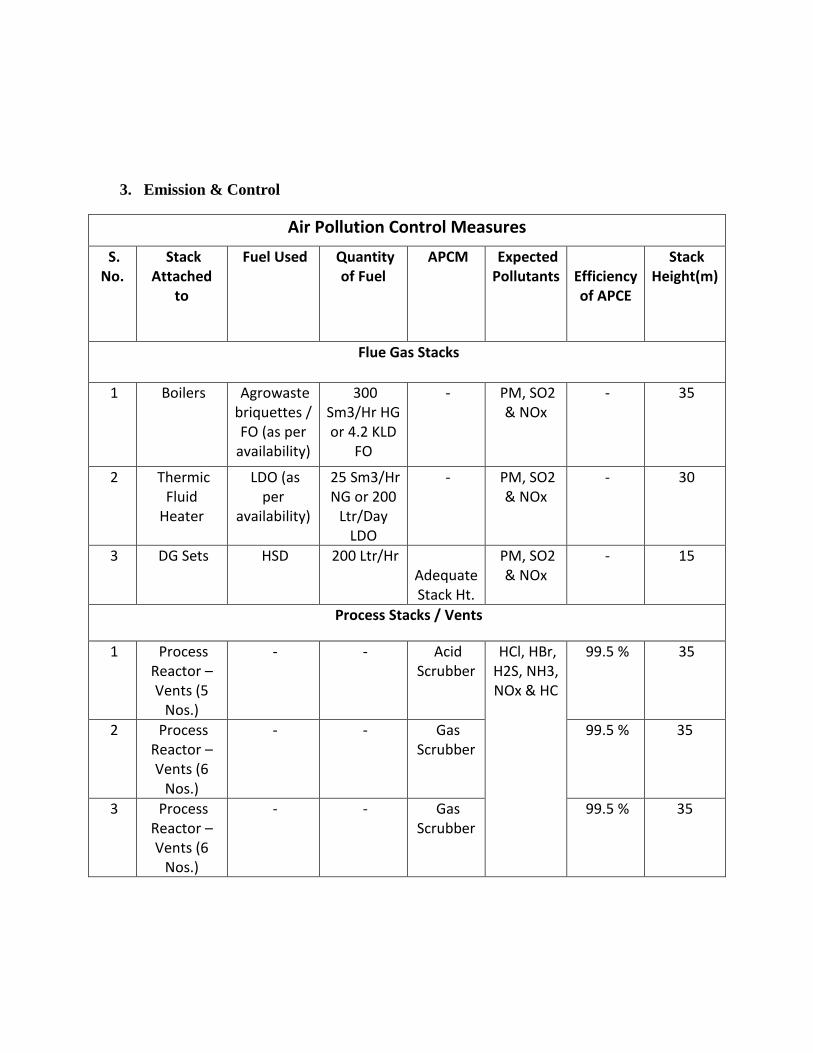
Air Pollution Control Measures
S. No.
Stack Attached
to
Fuel Used Quantity of Fuel
APCM Expected Pollutants
Efficiency of APCE
Stack Height(m)
Flue Gas Stacks
1 Boilers Agrowaste briquettes / FO (as per
availability)
300 Sm3/Hr HG or 4.2 KLD
FO
- PM, SO2 & NOx
- 35
2 Thermic Fluid
Heater
LDO (as per
availability)
25 Sm3/Hr NG or 200
Ltr/Day LDO
- PM, SO2 & NOx
- 30
3 DG Sets HSD 200 Ltr/Hr Adequate Stack Ht.
PM, SO2 & NOx
- 15
Process Stacks / Vents
1 Process Reactor – Vents (5
Nos.)
- - Acid Scrubber
HCl, HBr, H2S, NH3, NOx & HC
99.5 % 35
2 Process Reactor – Vents (6
Nos.)
- - Gas Scrubber
99.5 % 35
3 Process Reactor – Vents (6
Nos.)
- - Gas Scrubber
99.5 % 35

Odour Contol System:
4. Water Requirement:
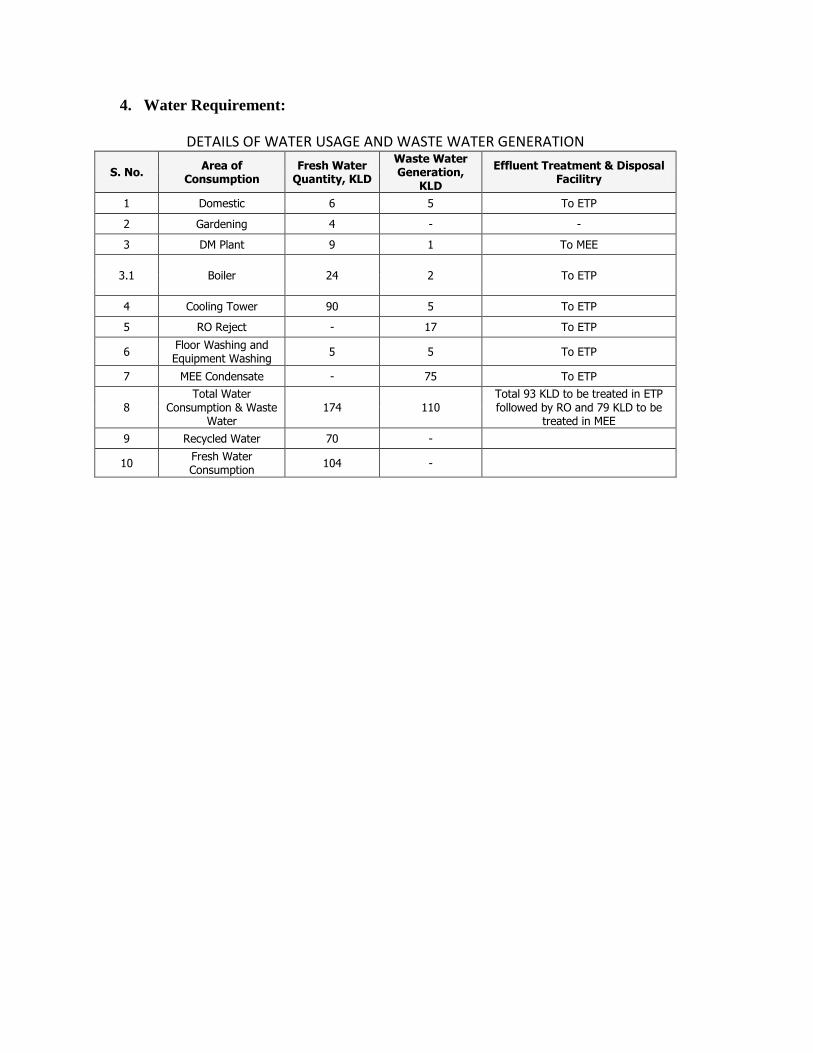
DETAILS OF WATER USAGE AND WASTE WATER GENERATION
S. No. Area of
Consumption Fresh Water
Quantity, KLD
Waste Water Generation,
KLD
Effluent Treatment & Disposal Facilitry
1 Domestic 6 5 To ETP
2 Gardening 4 - -
3 DM Plant 9 1 To MEE
3.1 Boiler 24 2 To ETP
4 Cooling Tower 90 5 To ETP
5 RO Reject - 17 To ETP
6 Floor Washing and Equipment Washing
5 5 To ETP
7 MEE Condensate - 75 To ETP
8 Total Water
Consumption & Waste Water
174 110 Total 93 KLD to be treated in ETP followed by RO and 79 KLD to be
treated in MEE
9 Recycled Water 70 -
10 Fresh Water Consumption
104 -
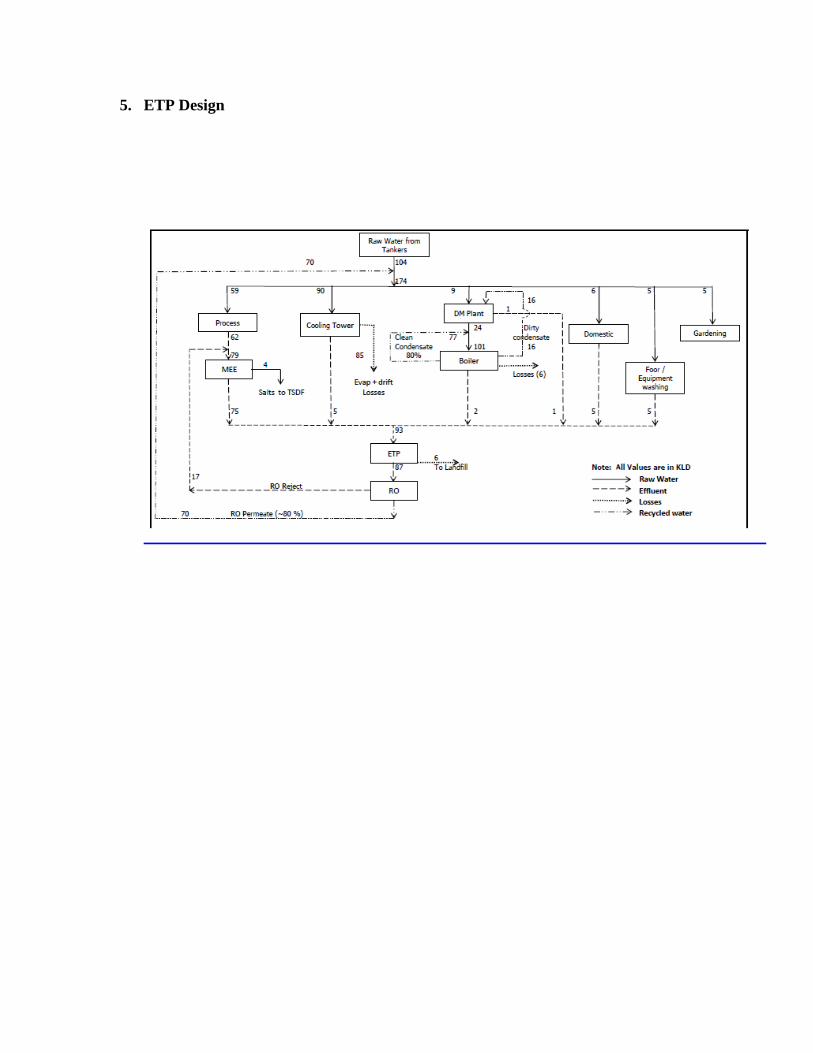
5. ETP Design

6. Plant Process
Herbicides
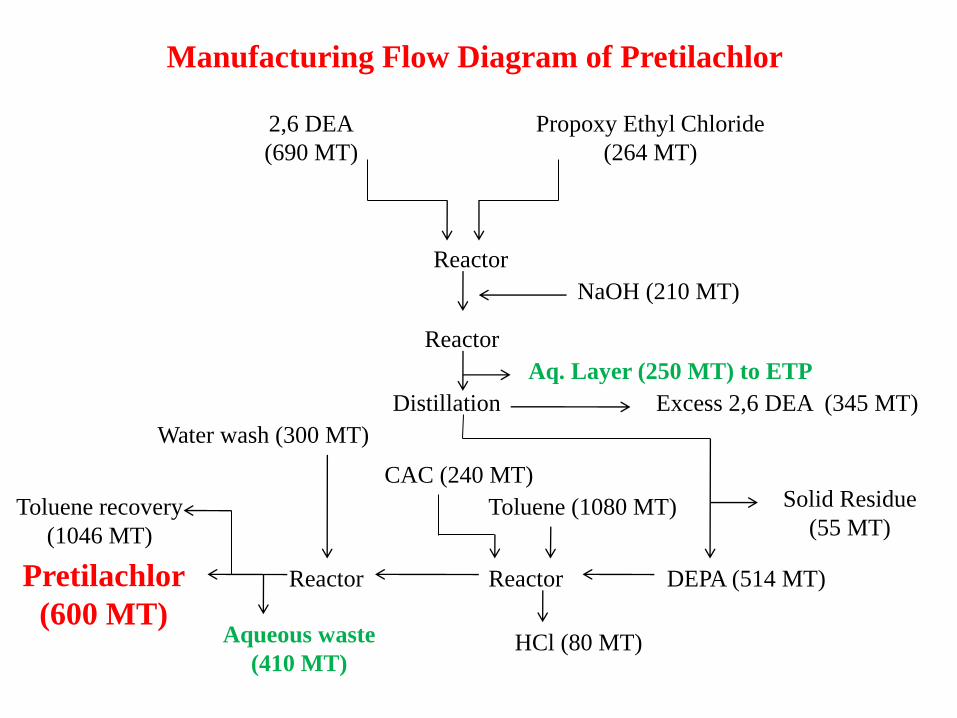
Manufacturing Flow Diagram of Pretilachlor
2,6 DEA
(690 MT)
Propoxy Ethyl Chloride
(264 MT)
Reactor
Reactor
NaOH (210 MT)
Distillation
Aq. Layer (250 MT) to ETP
Solid Residue
(55 MT)
DEPA (514 MT) Reactor
CAC (240 MT)
Toluene (1080 MT)
HCl (80 MT)
Reactor
Water wash (300 MT)
Pretilachlor
(600 MT) Aqueous waste
(410 MT)
Toluene recovery
(1046 MT)
Excess 2,6 DEA (345 MT)
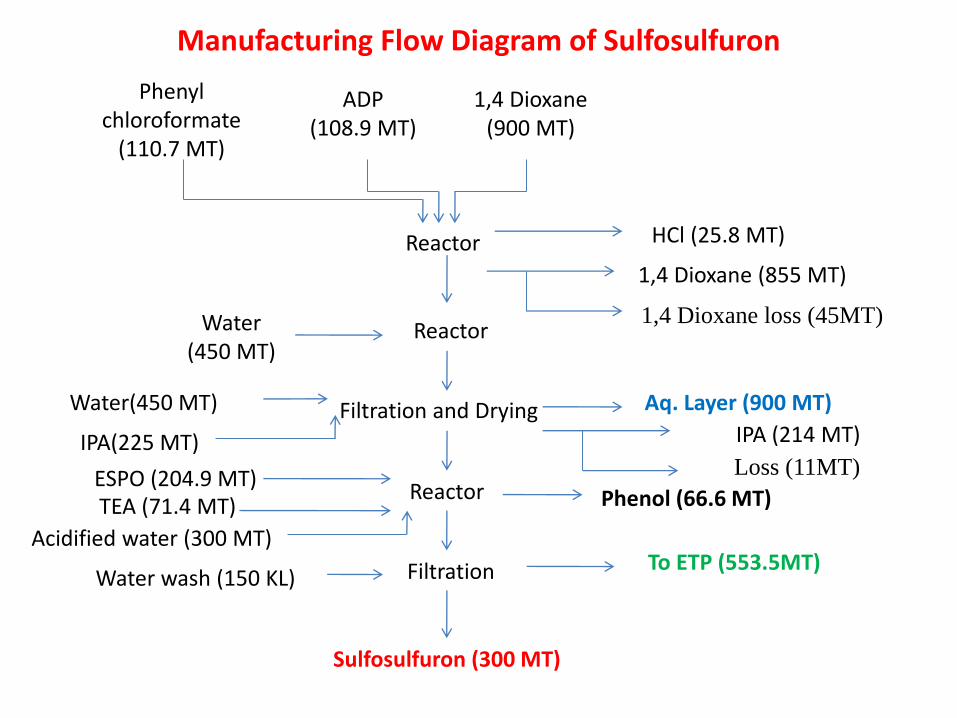
Manufacturing Flow Diagram of Sulfosulfuron
Phenyl chloroformate
(110.7 MT)
ADP (108.9 MT)
1,4 Dioxane (900 MT)
HCl (25.8 MT) Reactor
Reactor Water (450 MT)
Filtration and Drying
Filtration
Reactor
Sulfosulfuron (300 MT)
ESPO (204.9 MT)
Water wash (150 KL) To ETP (553.5MT)
Aq. Layer (900 MT)
1,4 Dioxane (855 MT)
1,4 Dioxane loss (45MT)
Water(450 MT)
IPA(225 MT) IPA (214 MT)
Loss (11MT)
Phenol (66.6 MT) TEA (71.4 MT)
Acidified water (300 MT)
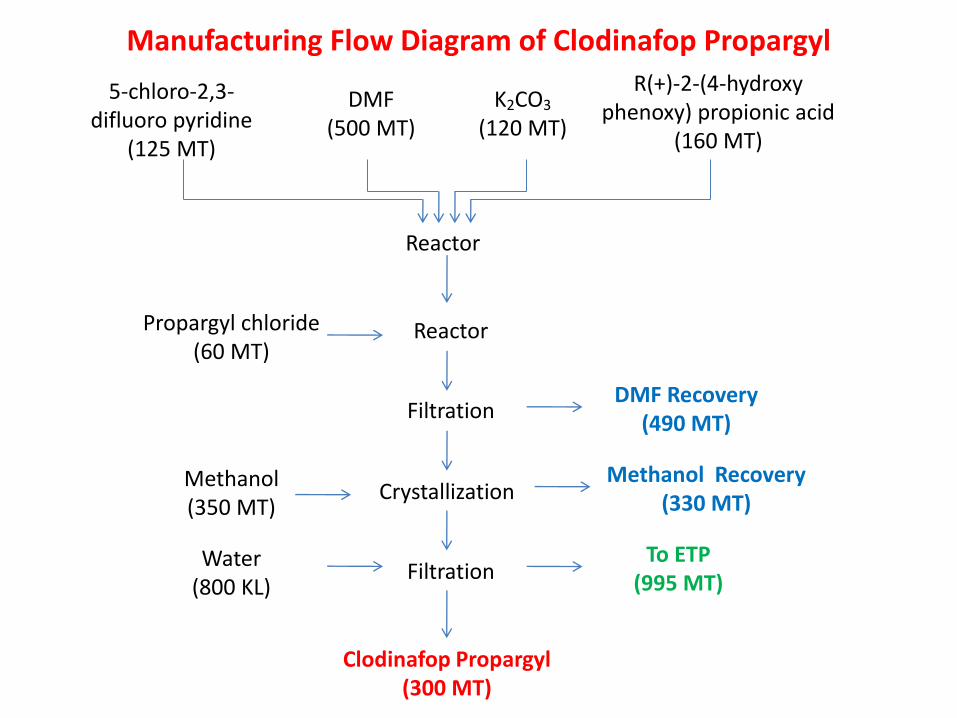
Manufacturing Flow Diagram of Clodinafop Propargyl
5-chloro-2,3-difluoro pyridine
(125 MT)
DMF (500 MT)
K2CO3
(120 MT)
R(+)-2-(4-hydroxy phenoxy) propionic acid
(160 MT)
Reactor
Reactor Propargyl chloride (60 MT)
Filtration
Filtration
Crystallization
Clodinafop Propargyl (300 MT)
Methanol (350 MT)
Water (800 KL)
To ETP (995 MT)
DMF Recovery (490 MT)
Methanol Recovery (330 MT)
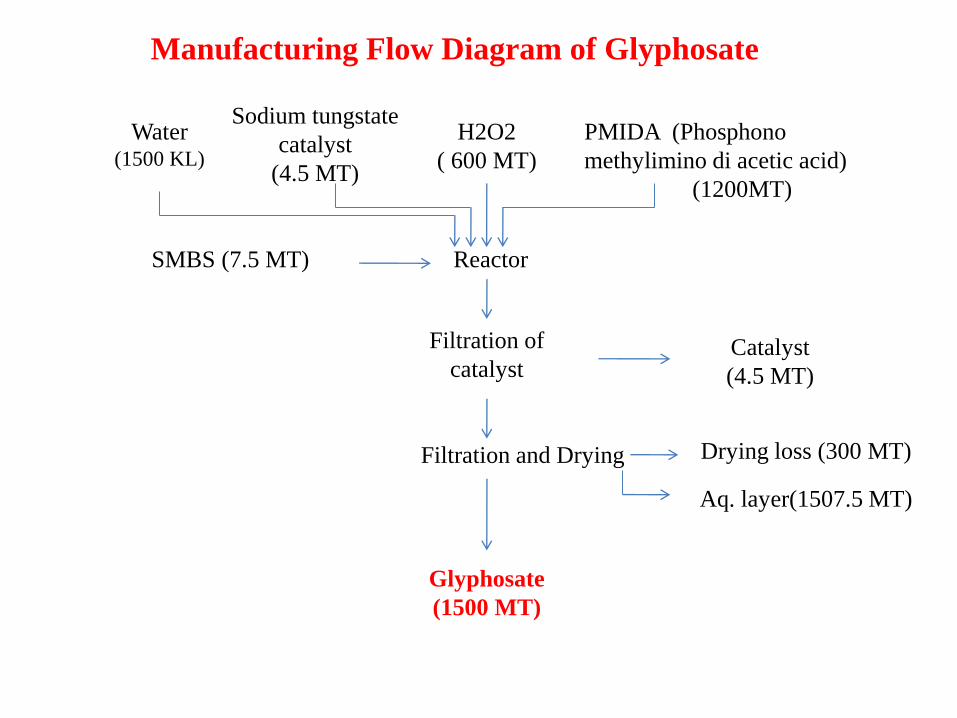
Manufacturing Flow Diagram of Glyphosate
Water (1500 KL)
Sodium tungstate
catalyst
(4.5 MT)
H2O2
( 600 MT)
PMIDA (Phosphono
methylimino di acetic acid)
(1200MT)
Reactor
Filtration of
catalyst
Drying loss (300 MT)
Glyphosate
(1500 MT)
Catalyst
(4.5 MT)
Filtration and Drying
Aq. layer(1507.5 MT)
SMBS (7.5 MT)
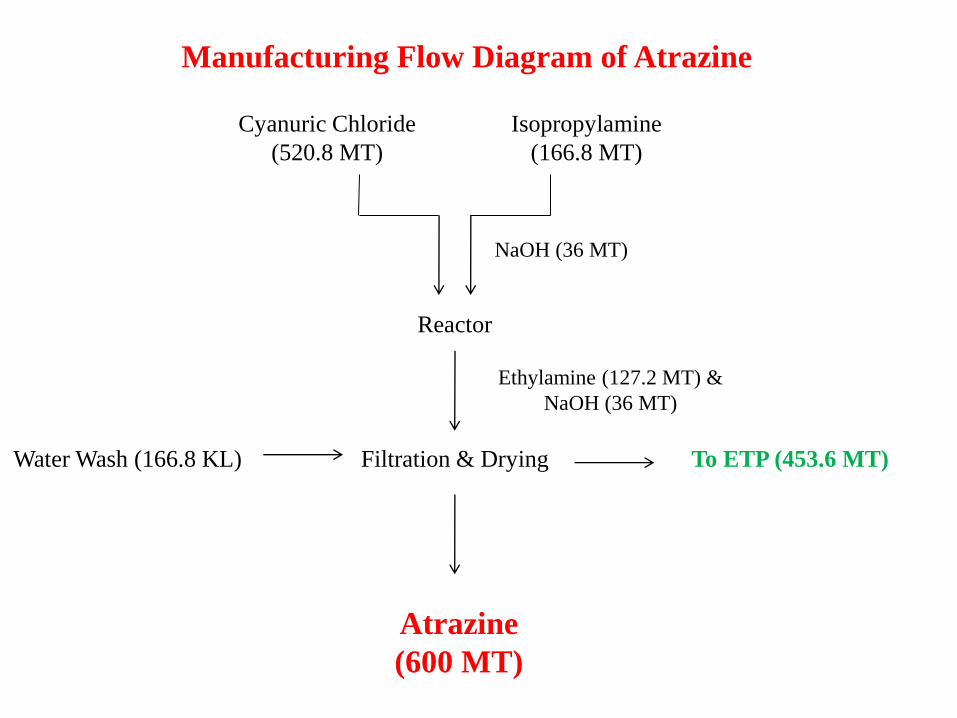
Manufacturing Flow Diagram of Atrazine
Reactor
Cyanuric Chloride
(520.8 MT)
Isopropylamine
(166.8 MT)
NaOH (36 MT)
Ethylamine (127.2 MT) &
NaOH (36 MT)
Filtration & Drying
Atrazine
(600 MT)
To ETP (453.6 MT) Water Wash (166.8 KL)
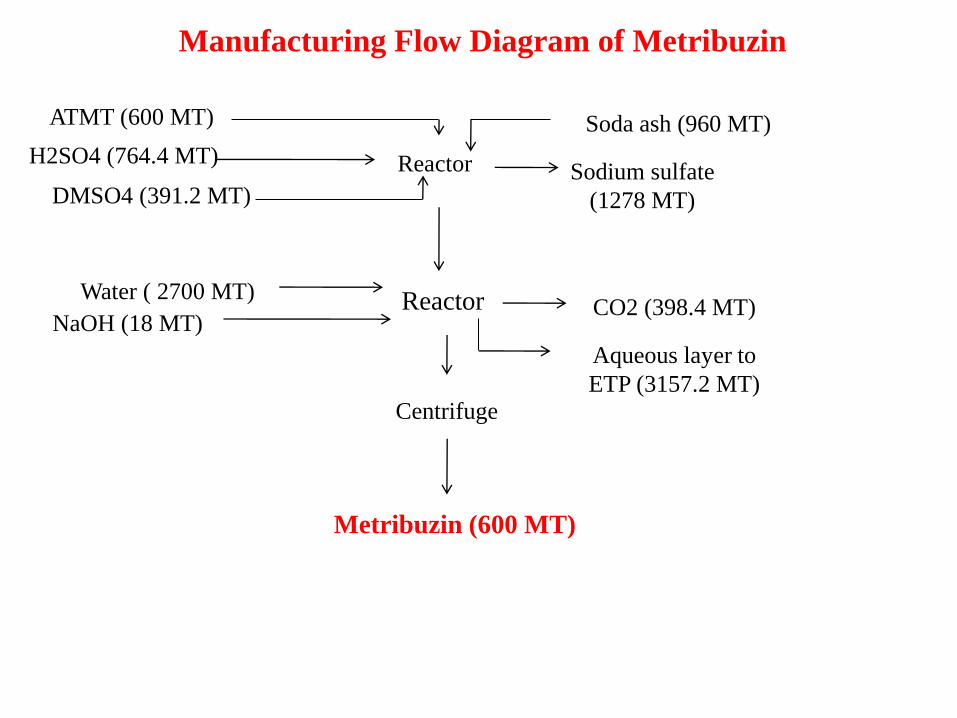
Manufacturing Flow Diagram of Metribuzin
DMSO4 (391.2 MT)
H2SO4 (764.4 MT) Reactor
ATMT (600 MT)
Sodium sulfate
(1278 MT)
Water ( 2700 MT)
NaOH (18 MT) Reactor CO2 (398.4 MT)
Metribuzin (600 MT)
Centrifuge
Aqueous layer to
ETP (3157.2 MT)
Soda ash (960 MT)
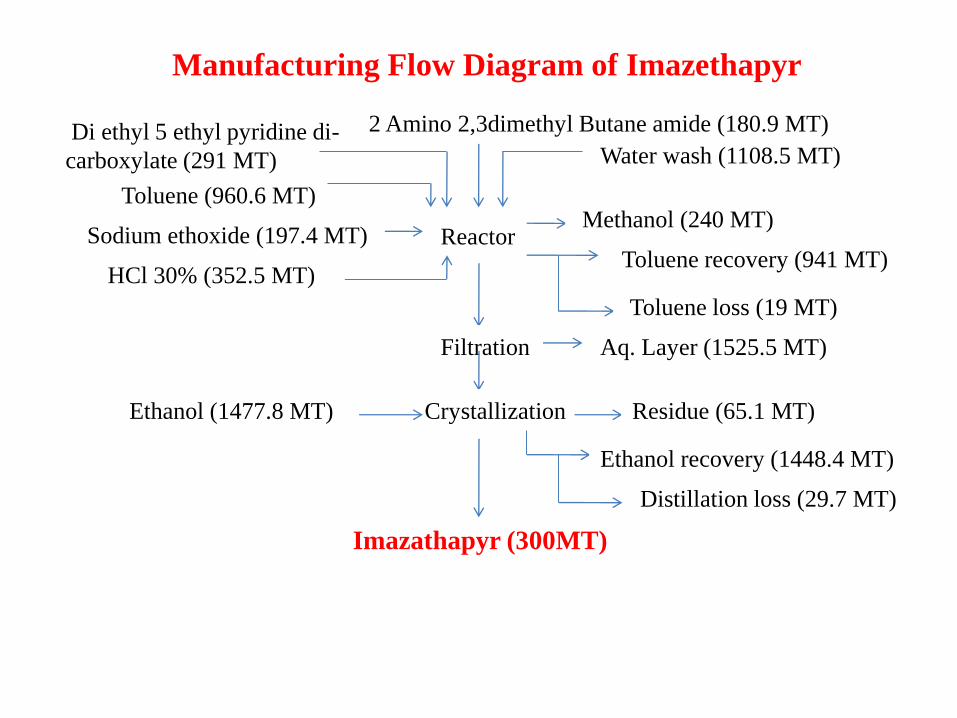
Manufacturing Flow Diagram of Imazethapyr
Reactor
Di ethyl 5 ethyl pyridine di-
carboxylate (291 MT) Water wash (1108.5 MT)
Filtration
Crystallization Ethanol (1477.8 MT)
Aq. Layer (1525.5 MT)
Imazathapyr (300MT)
2 Amino 2,3dimethyl Butane amide (180.9 MT)
Methanol (240 MT)
Ethanol recovery (1448.4 MT)
Toluene (960.6 MT)
Sodium ethoxide (197.4 MT) Toluene recovery (941 MT)
Toluene loss (19 MT)
HCl 30% (352.5 MT)
Residue (65.1 MT)
Distillation loss (29.7 MT)
Insecticides
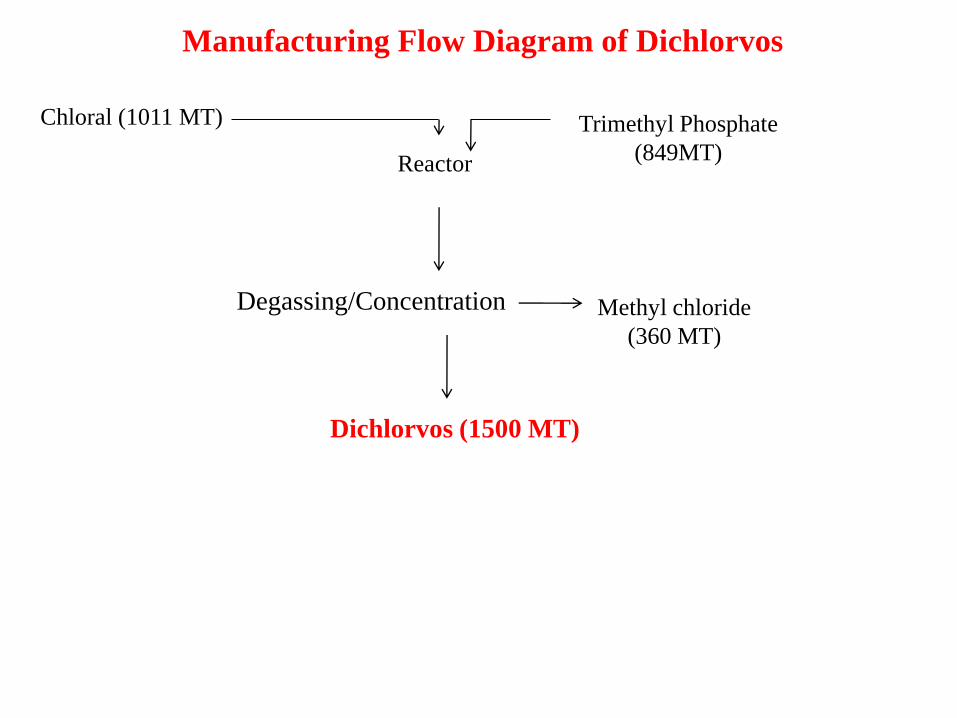
Manufacturing Flow Diagram of Dichlorvos
Reactor
Chloral (1011 MT)
Degassing/Concentration Methyl chloride
(360 MT)
Dichlorvos (1500 MT)
Trimethyl Phosphate
(849MT)
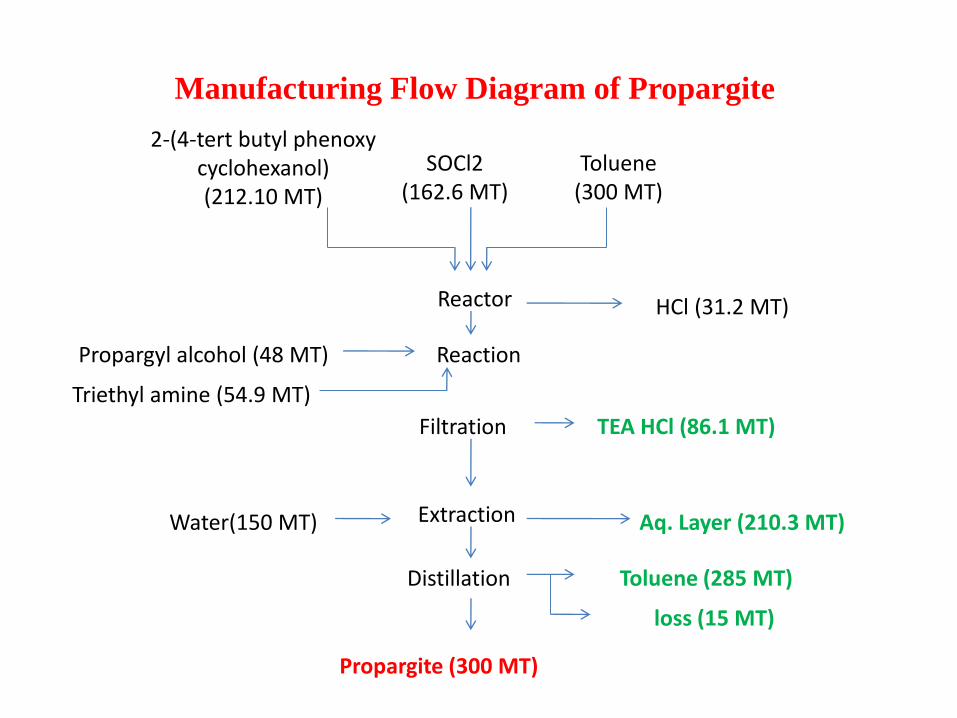
Manufacturing Flow Diagram of Propargite
2-(4-tert butyl phenoxy cyclohexanol) (212.10 MT)
SOCl2 (162.6 MT)
Toluene (300 MT)
Reactor
Filtration
Water(150 MT)
Propargite (300 MT)
TEA HCl (86.1 MT)
HCl (31.2 MT)
Reaction Propargyl alcohol (48 MT)
Triethyl amine (54.9 MT)
Extraction Aq. Layer (210.3 MT)
Toluene (285 MT)
loss (15 MT)
Distillation

Manufacturing Flow Diagram of Novaluron
2,6 Difluoro benzoyl isocyanate (111.48 MT)
Compund 1 (188.505 MT)
Reactor
Distillation and Filtration
Aq. waste (150 MT)
Reactor
Toluene(300 MT)
Novaluron (300 MT)
MCB (450 MT)
MCB (435 MT)
MCB loss (15 MT)
Water wash (150 MT)
Toluene (282 MT)
Toluene loss (18 MT)
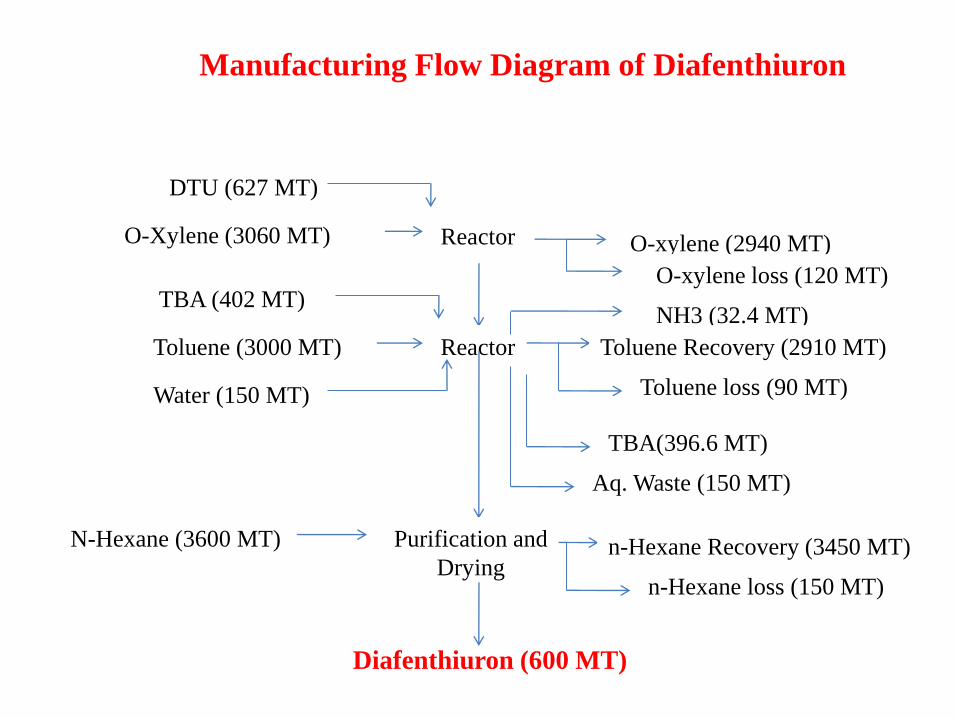
Manufacturing Flow Diagram of Diafenthiuron
Reactor
DTU (627 MT)
Reactor
Water (150 MT)
Diafenthiuron (600 MT)
O-Xylene (3060 MT) O-xylene (2940 MT)
O-xylene loss (120 MT)
Toluene (3000 MT)
TBA (402 MT) NH3 (32.4 MT)
Toluene Recovery (2910 MT)
Toluene loss (90 MT)
TBA(396.6 MT)
Aq. Waste (150 MT)
Purification and
Drying
N-Hexane (3600 MT) n-Hexane Recovery (3450 MT)
n-Hexane loss (150 MT)

Manufacturing Flow Diagram of Chlorpyrifos
Diethylphosphorochlorido
thioate
(548.57 MT)
Sodium salt of 3,5,6-
trichloropyridin-2-ol
(754.28 MT)
Phase Transfer
Catalyst Tertiary
amine acid boric
Tampon
MDC (4114.2 KL)
Reactor
Filtration
Chlorpyrifos
(1200 MT)
Dried Under
Vaccum
To ETP (308.57 KL)
MDC recovery (3908.56 MT)
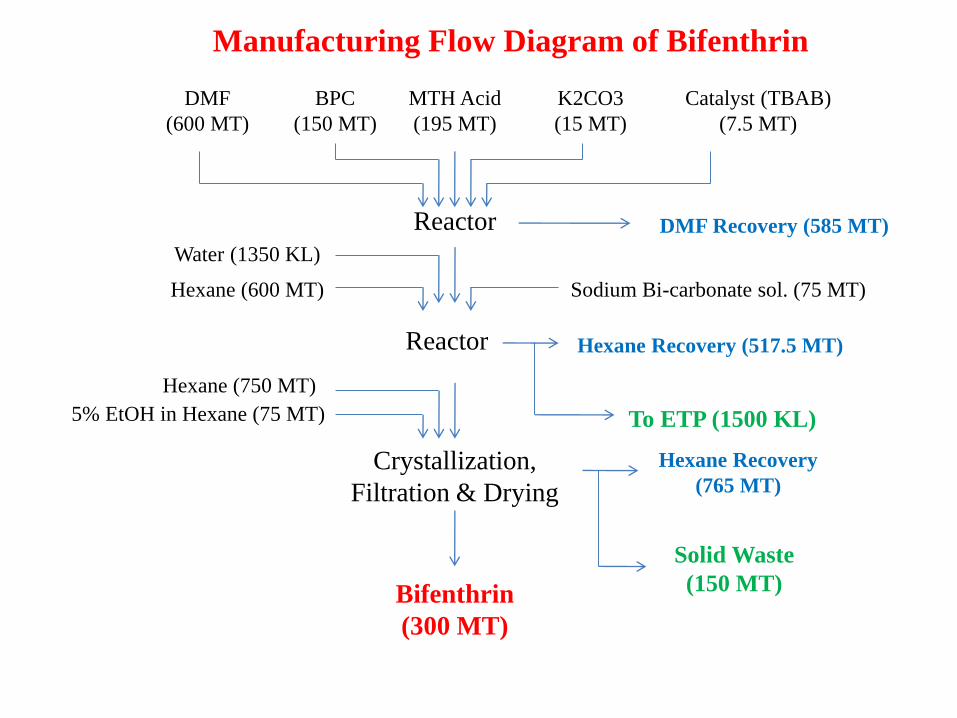
Manufacturing Flow Diagram of Bifenthrin
DMF
(600 MT)
BPC
(150 MT)
MTH Acid
(195 MT)
K2CO3
(15 MT)
Catalyst (TBAB)
(7.5 MT)
Reactor DMF Recovery (585 MT)
Reactor
Water (1350 KL)
Hexane (600 MT) Sodium Bi-carbonate sol. (75 MT)
Crystallization,
Filtration & Drying
Hexane (750 MT)
5% EtOH in Hexane (75 MT) To ETP (1500 KL)
Bifenthrin
(300 MT)
Hexane Recovery
(765 MT)
Hexane Recovery (517.5 MT)
Solid Waste
(150 MT)
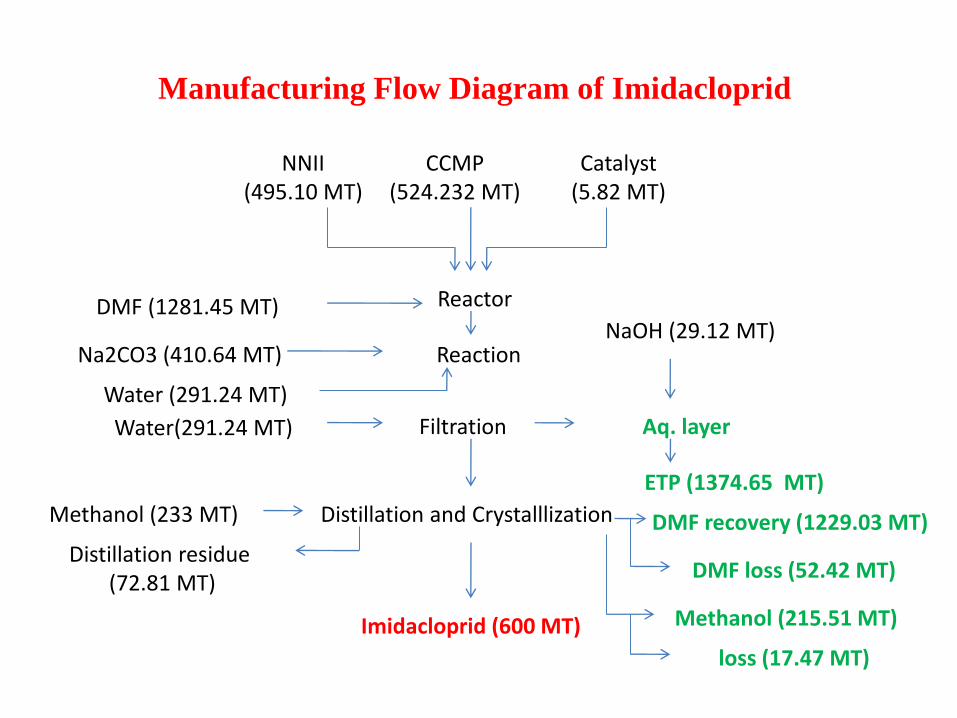
Manufacturing Flow Diagram of Imidacloprid
NNII (495.10 MT)
CCMP (524.232 MT)
Catalyst (5.82 MT)
Reactor
Filtration Water(291.24 MT)
Imidacloprid (600 MT)
Aq. layer
DMF (1281.45 MT)
Reaction Na2CO3 (410.64 MT)
Water (291.24 MT)
NaOH (29.12 MT)
ETP (1374.65 MT)
Distillation and Crystalllization DMF recovery (1229.03 MT)
DMF loss (52.42 MT)
Methanol (233 MT)
Methanol (215.51 MT)
loss (17.47 MT)
Distillation residue (72.81 MT)
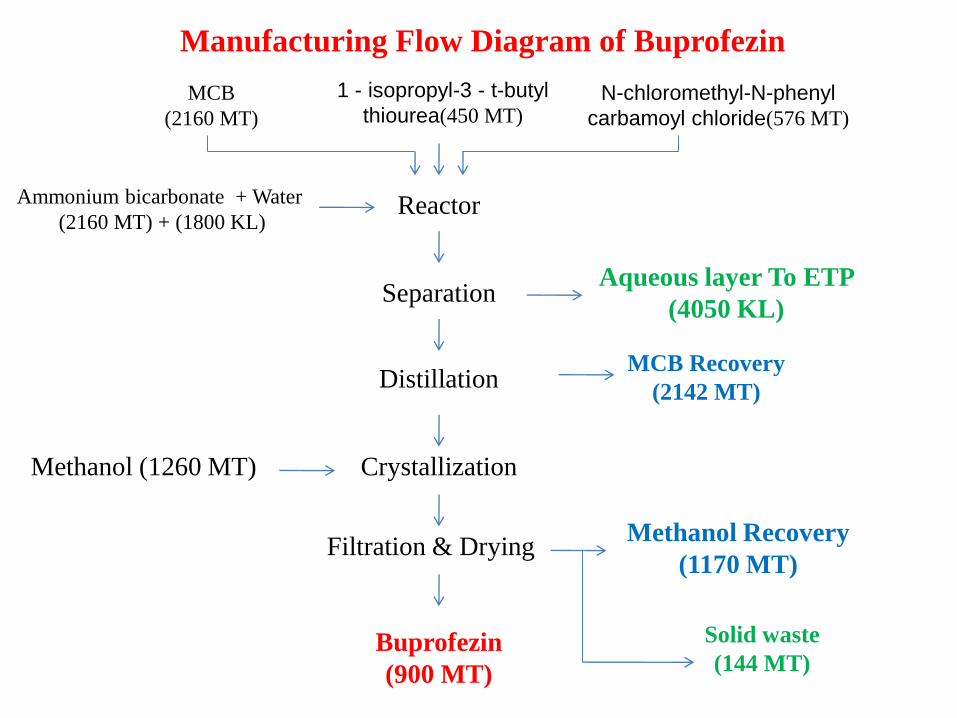
Manufacturing Flow Diagram of Buprofezin
MCB
(2160 MT)
1 - isopropyl-3 - t-butyl
thiourea(450 MT) N-chloromethyl-N-phenyl
carbamoyl chloride(576 MT)
Reactor
Separation
Ammonium bicarbonate + Water
(2160 MT) + (1800 KL)
Aqueous layer To ETP
(4050 KL)
Distillation MCB Recovery
(2142 MT)
Methanol (1260 MT) Crystallization
Filtration & Drying
Buprofezin
(900 MT)
Methanol Recovery
(1170 MT)
Solid waste
(144 MT)
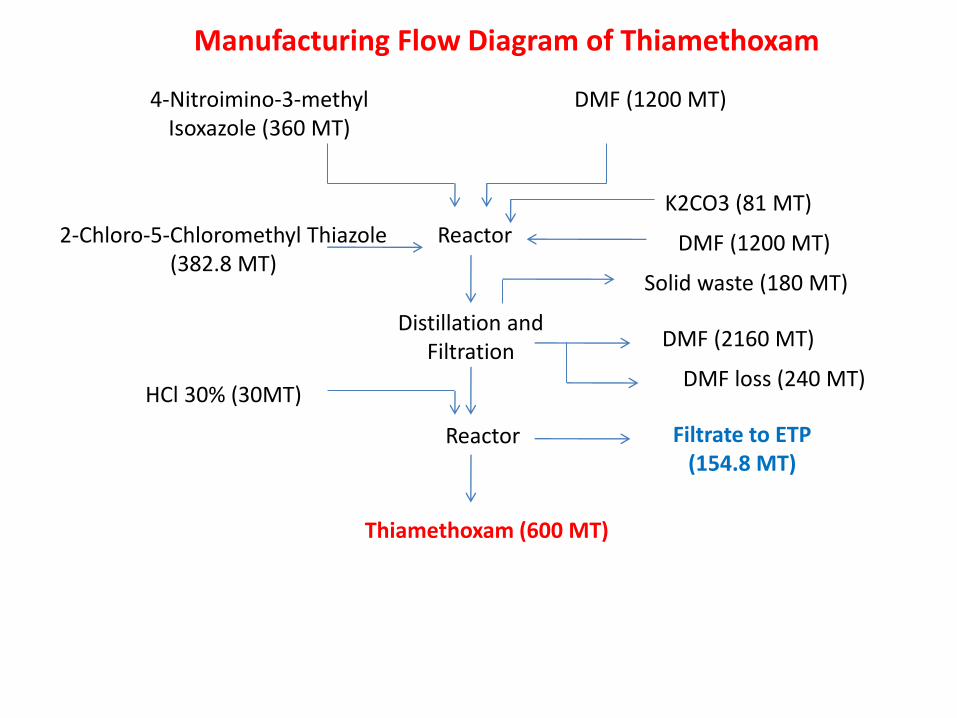
Manufacturing Flow Diagram of Thiamethoxam
4-Nitroimino-3-methyl Isoxazole (360 MT)
DMF (1200 MT)
Reactor
Distillation and Filtration
Solid waste (180 MT)
Reactor
HCl 30% (30MT)
Thiamethoxam (600 MT)
Filtrate to ETP (154.8 MT)
2-Chloro-5-Chloromethyl Thiazole (382.8 MT)
DMF (1200 MT)
K2CO3 (81 MT)
DMF (2160 MT)
DMF loss (240 MT)
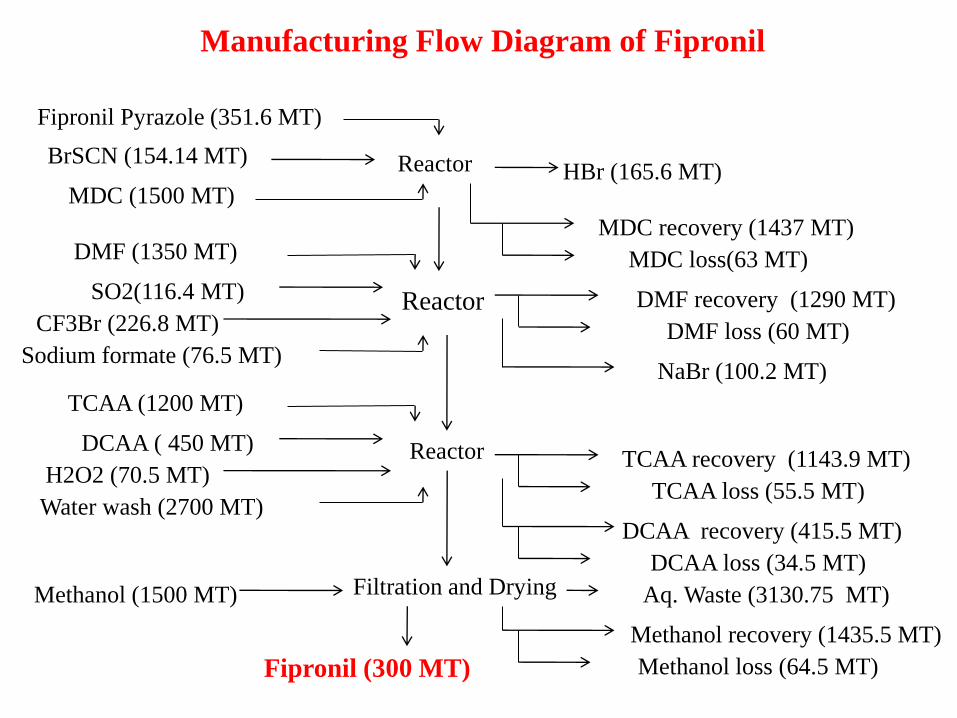
Manufacturing Flow Diagram of Fipronil
MDC (1500 MT)
BrSCN (154.14 MT) Reactor
Fipronil Pyrazole (351.6 MT)
HBr (165.6 MT)
SO2(116.4 MT)
CF3Br (226.8 MT) Reactor DMF recovery (1290 MT)
Fipronil (300 MT)
Reactor
DMF loss (60 MT)
MDC recovery (1437 MT)
MDC loss(63 MT) DMF (1350 MT)
Sodium formate (76.5 MT) NaBr (100.2 MT)
DCAA ( 450 MT)
H2O2 (70.5 MT)
TCAA (1200 MT)
Water wash (2700 MT)
TCAA recovery (1143.9 MT)
TCAA loss (55.5 MT)
DCAA recovery (415.5 MT)
DCAA loss (34.5 MT) Filtration and Drying Methanol (1500 MT)
Methanol recovery (1435.5 MT)
Methanol loss (64.5 MT)
Aq. Waste (3130.75 MT)
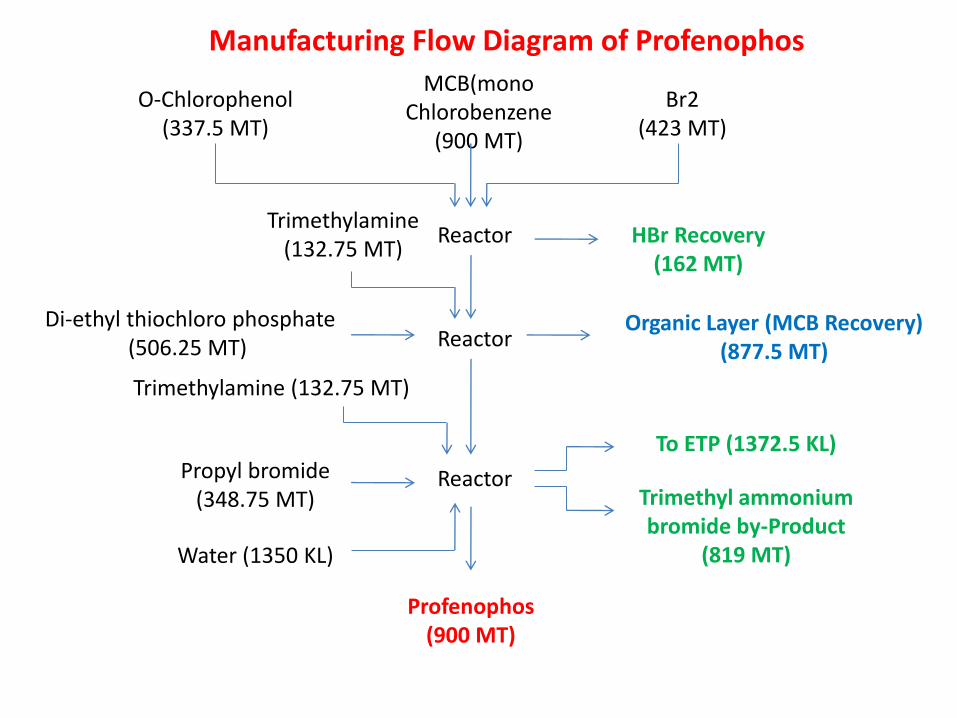
Manufacturing Flow Diagram of Profenophos
O-Chlorophenol (337.5 MT)
MCB(mono Chlorobenzene
(900 MT)
Br2 (423 MT)
Reactor HBr Recovery (162 MT)
Reactor Di-ethyl thiochloro phosphate
(506.25 MT)
Trimethylamine (132.75 MT)
Reactor
Organic Layer (MCB Recovery) (877.5 MT)
Profenophos (900 MT)
Propyl bromide (348.75 MT)
Trimethylamine (132.75 MT)
To ETP (1372.5 KL)
Trimethyl ammonium bromide by-Product
(819 MT) Water (1350 KL)

Manufacturing Flow Diagram of Acephate
DMPTC
(1755 MT) NH4OH
(1417.5 MT)
Reactor
Reactor
Reactor
Acetic anhydride (1239.375 MT)
Acephate
(1500 MT)
MDC (2002.5 MT)
Neutralization
MDC (750 MT)
Aq. Layer to ETP (1522.5 MT)
DMPAT
Dimethyl sulfate (225 MT)
Monitor (3877.5 MT)
H2SO4 (31.875 MT)
H2O (600 MT)
NH4OH (1025.625 MT)
Aq. Layer (4046.25 MT) Extraction
MDC (4725 MT)
Aq. Layer to
ETP (3553.12
MT)
Concentration
MDC recovery
(7196.25 MT)
Organic layer
(5218.125 MT)
Organic layer (3478.125 MT)
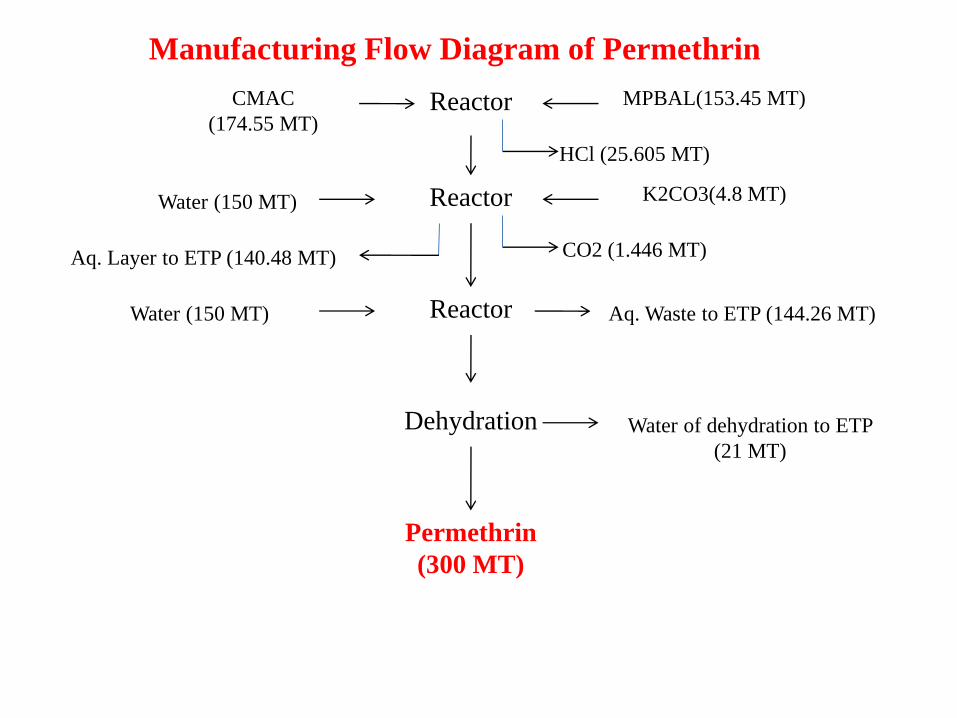
Manufacturing Flow Diagram of Permethrin
Permethrin
(300 MT)
CMAC
(174.55 MT)
MPBAL(153.45 MT) Reactor
Reactor
Reactor
Dehydration
Water (150 MT)
Water (150 MT) Aq. Waste to ETP (144.26 MT)
Water of dehydration to ETP
(21 MT)
HCl (25.605 MT)
K2CO3(4.8 MT)
CO2 (1.446 MT) Aq. Layer to ETP (140.48 MT)
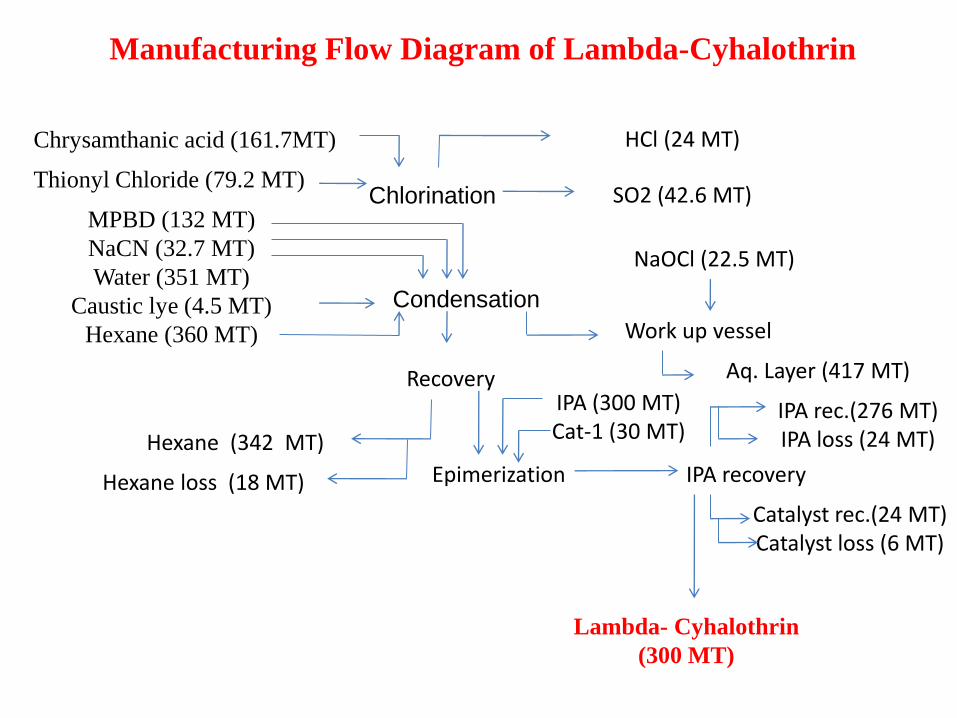
Manufacturing Flow Diagram of Lambda-Cyhalothrin
Lambda- Cyhalothrin
(300 MT)
Chrysamthanic acid (161.7MT)
Chlorination Thionyl Chloride (79.2 MT)
HCl (24 MT)
SO2 (42.6 MT)
Condensation
MPBD (132 MT)
NaCN (32.7 MT)
Water (351 MT)
Caustic lye (4.5 MT)
Hexane (360 MT)
Recovery
Hexane (342 MT)
Hexane loss (18 MT)
NaOCl (22.5 MT)
Aq. Layer (417 MT)
Epimerization
IPA (300 MT) Cat-1 (30 MT)
IPA recovery
IPA rec.(276 MT) IPA loss (24 MT)
Work up vessel
Catalyst rec.(24 MT) Catalyst loss (6 MT)
Fungicides
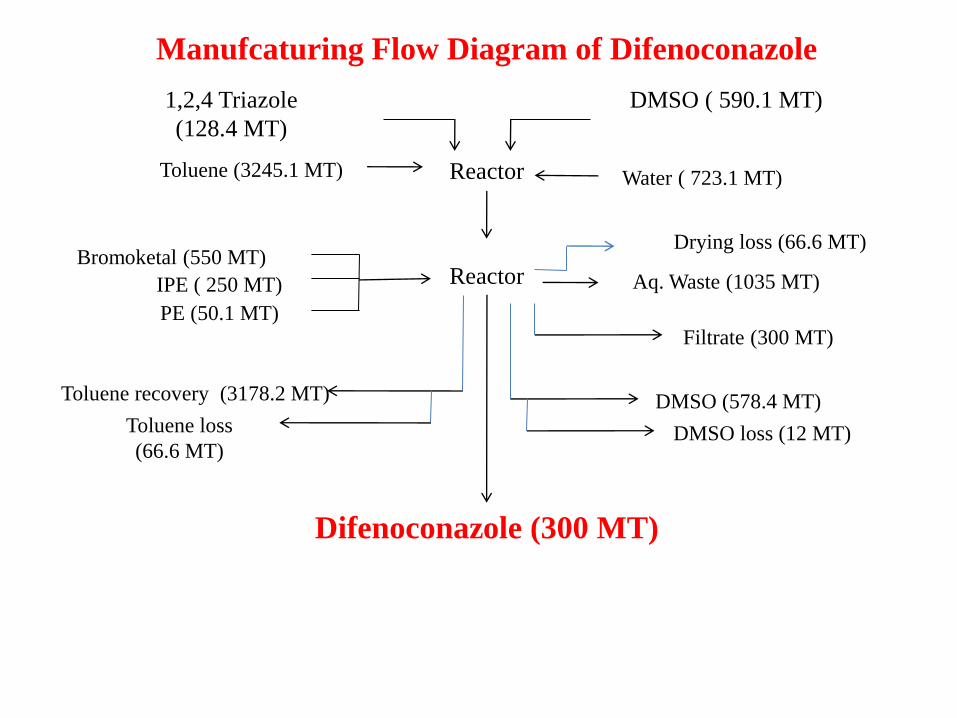
Manufcaturing Flow Diagram of Difenoconazole
1,2,4 Triazole
(128.4 MT)
DMSO ( 590.1 MT)
Reactor Toluene (3245.1 MT)
Reactor
Difenoconazole (300 MT)
Bromoketal (550 MT)
IPE ( 250 MT)
PE (50.1 MT)
Water ( 723.1 MT)
Drying loss (66.6 MT)
Aq. Waste (1035 MT)
Filtrate (300 MT)
DMSO (578.4 MT)
DMSO loss (12 MT)
Toluene recovery (3178.2 MT)
Toluene loss
(66.6 MT)
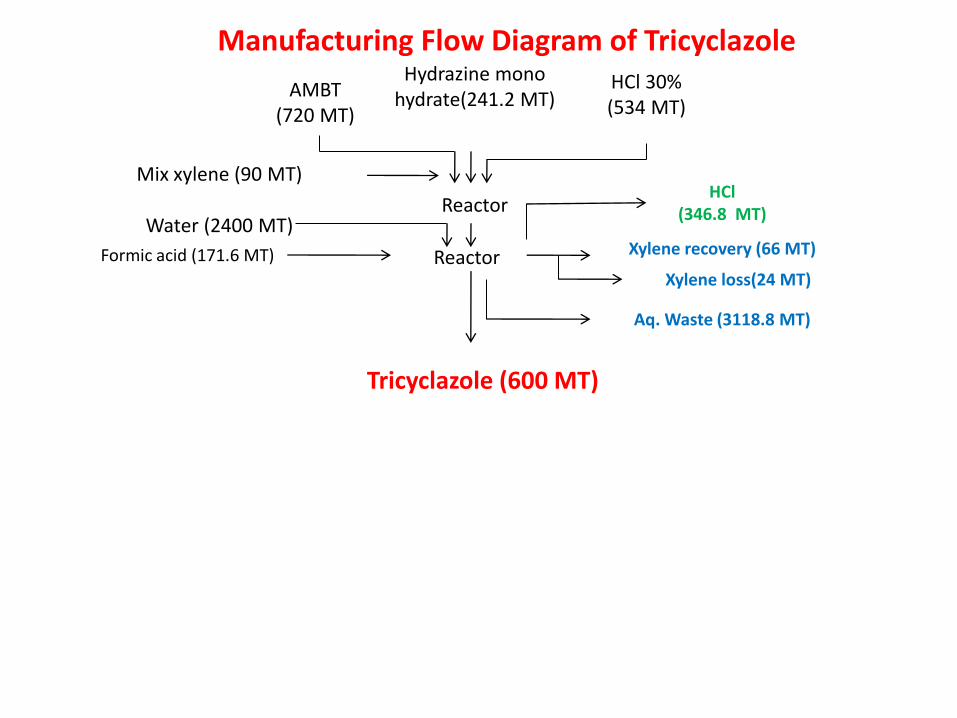
Manufacturing Flow Diagram of Tricyclazole
AMBT (720 MT)
Hydrazine mono hydrate(241.2 MT)
HCl 30% (534 MT)
Reactor
Tricyclazole (600 MT)
HCl (346.8 MT)
Mix xylene (90 MT)
Reactor Formic acid (171.6 MT) Xylene recovery (66 MT)
Water (2400 MT)
Xylene loss(24 MT)
Aq. Waste (3118.8 MT)
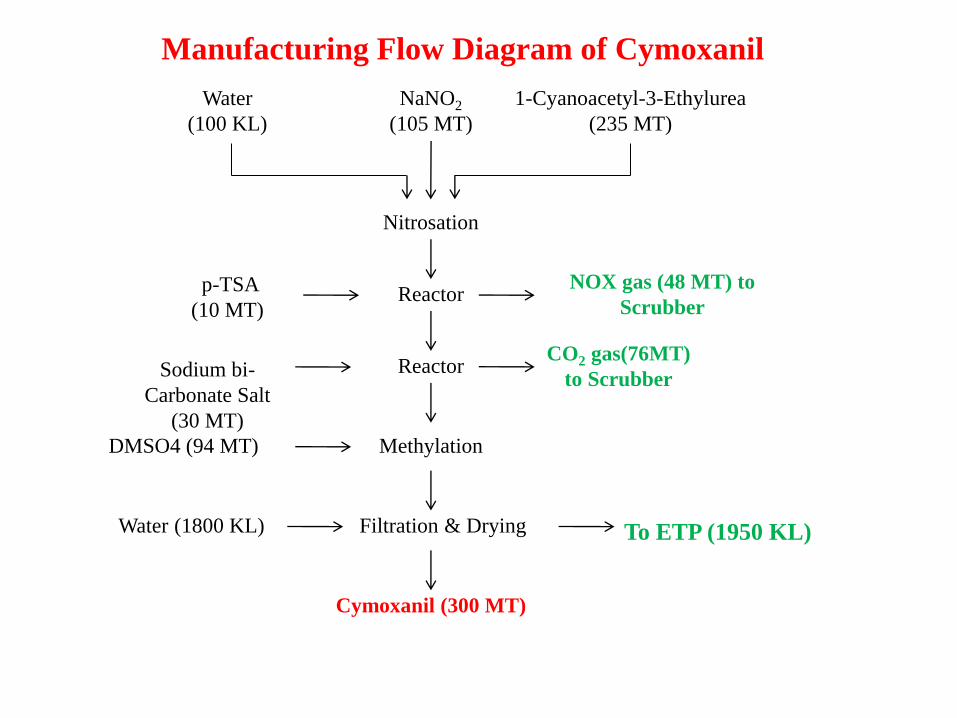
Manufacturing Flow Diagram of Cymoxanil
Water
(100 KL)
NaNO2
(105 MT)
1-Cyanoacetyl-3-Ethylurea
(235 MT)
Nitrosation
Reactor p-TSA
(10 MT)
Reactor Sodium bi-
Carbonate Salt
(30 MT)
Methylation DMSO4 (94 MT)
Filtration & Drying Water (1800 KL)
Cymoxanil (300 MT)
NOX gas (48 MT) to
Scrubber
CO2 gas(76MT)
to Scrubber
To ETP (1950 KL)
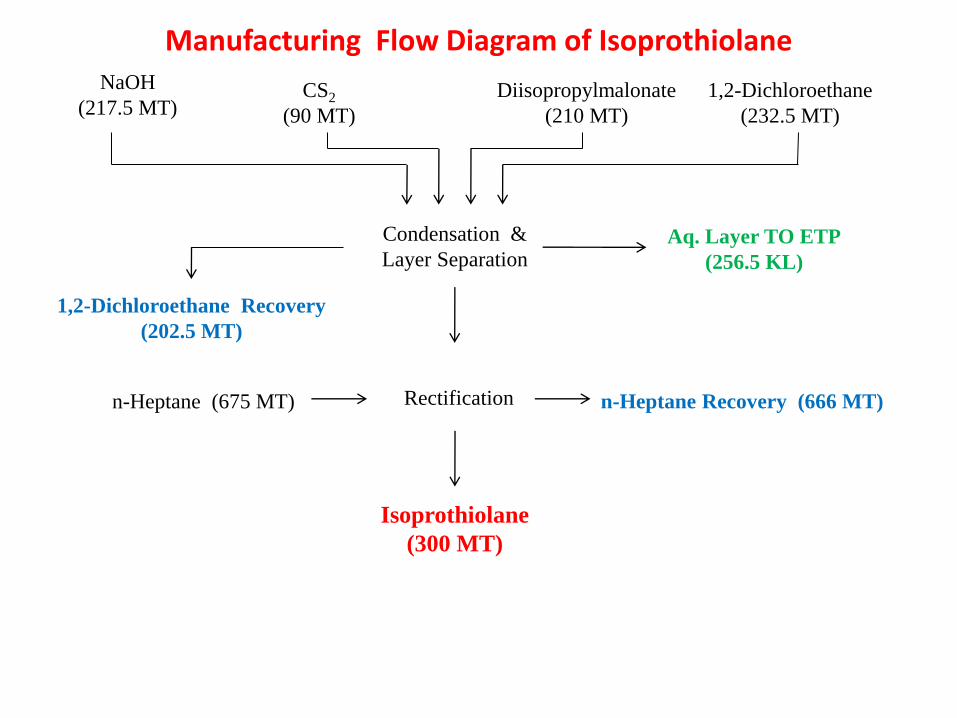
Manufacturing Flow Diagram of Isoprothiolane
CS2
(90 MT)
Diisopropylmalonate
(210 MT)
1,2-Dichloroethane
(232.5 MT)
Condensation &
Layer Separation
NaOH
(217.5 MT)
Aq. Layer TO ETP
(256.5 KL)
1,2-Dichloroethane Recovery
(202.5 MT)
Rectification n-Heptane (675 MT) n-Heptane Recovery (666 MT)
Isoprothiolane
(300 MT)
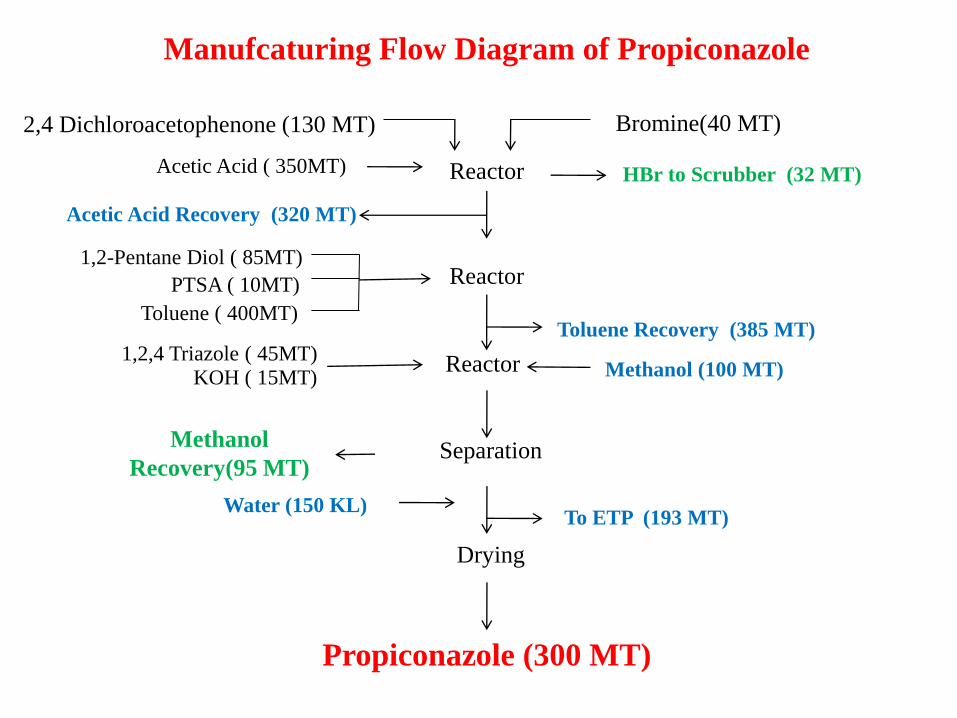
Manufcaturing Flow Diagram of Propiconazole
2,4 Dichloroacetophenone (130 MT) Bromine(40 MT)
Reactor Acetic Acid ( 350MT)
Reactor
Reactor
Separation
Propiconazole (300 MT)
Methanol
Recovery(95 MT)
Acetic Acid Recovery (320 MT)
HBr to Scrubber (32 MT)
Toluene Recovery (385 MT)
Methanol (100 MT)
1,2-Pentane Diol ( 85MT)
PTSA ( 10MT)
Toluene ( 400MT)
1,2,4 Triazole ( 45MT) KOH ( 15MT)
Water (150 KL) To ETP (193 MT)
Drying
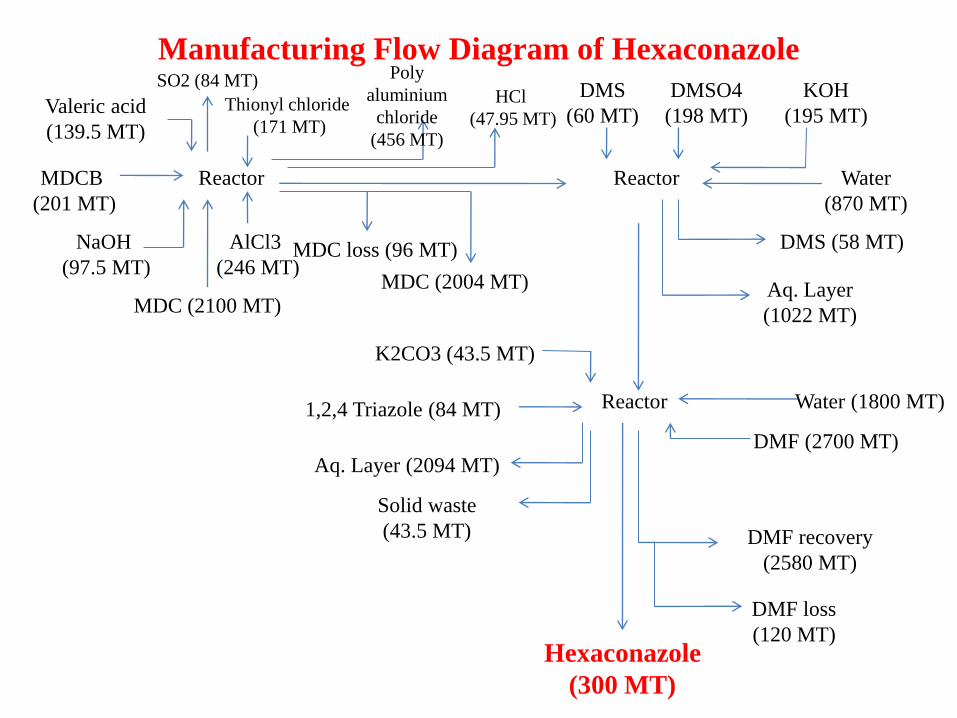
Hexaconazole
(300 MT)
Manufacturing Flow Diagram of Hexaconazole
Reactor
Valeric acid
(139.5 MT)
MDCB
(201 MT)
Thionyl chloride
(171 MT)
NaOH
(97.5 MT)
AlCl3
(246 MT)
MDC (2100 MT)
HCl
(47.95 MT)
MDC (2004 MT)
MDC loss (96 MT)
Reactor
DMS
(60 MT)
DMSO4
(198 MT)
KOH
(195 MT)
Water
(870 MT)
DMS (58 MT)
Aq. Layer
(1022 MT)
Reactor Water (1800 MT) 1,2,4 Triazole (84 MT)
K2CO3 (43.5 MT)
DMF (2700 MT)
DMF recovery
(2580 MT)
DMF loss
(120 MT)
Aq. Layer (2094 MT)
Solid waste
(43.5 MT)
Poly
aluminium
chloride
(456 MT)
SO2 (84 MT)
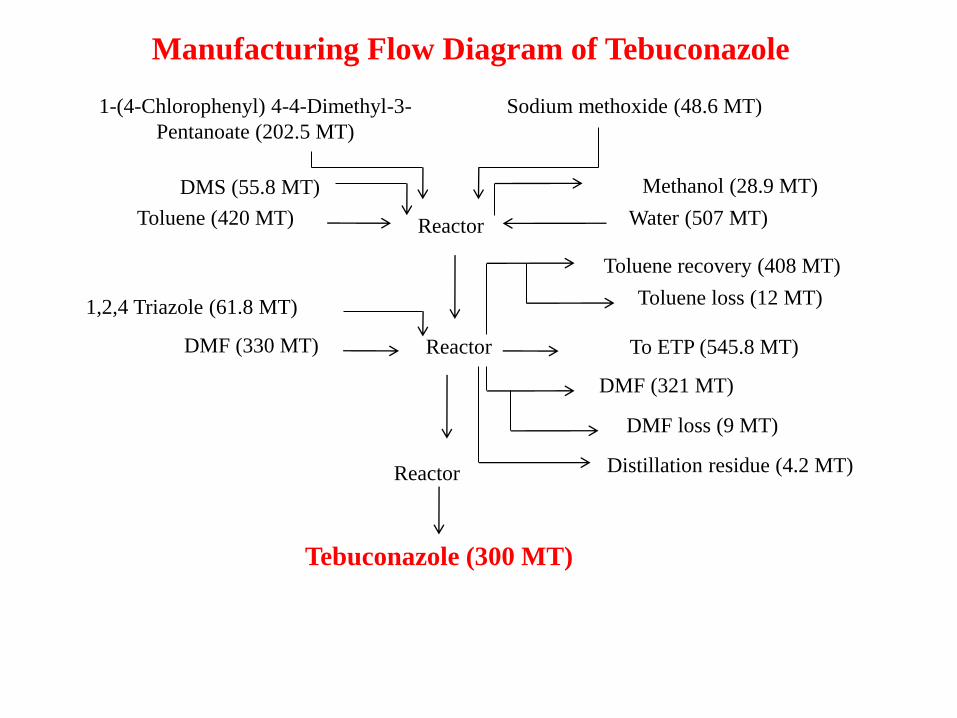
Manufacturing Flow Diagram of Tebuconazole
1-(4-Chlorophenyl) 4-4-Dimethyl-3-
Pentanoate (202.5 MT)
Sodium methoxide (48.6 MT)
Reactor
1,2,4 Triazole (61.8 MT)
Reactor
Reactor
Tebuconazole (300 MT)
DMS (55.8 MT)
Toluene (420 MT) Water (507 MT)
DMF (330 MT)
DMF (321 MT)
DMF loss (9 MT)
To ETP (545.8 MT)
Toluene recovery (408 MT)
Toluene loss (12 MT)
Distillation residue (4.2 MT)
Methanol (28.9 MT)