announcement of annual results for the year ended...
TRANSCRIPT

1
Hong Kong Exchanges and Clearing Limited and The Stock Exchange of Hong Kong Limited (the “Stock Exchange”) take no responsibility for the contents of this announcement, make no representation as to its accuracy or completeness and expressly disclaim any liability whatsoever for any loss howsoever arising from or in reliance upon the whole or any part of the contents of this announcement.
(Stock Code: 2225)
KAKIKO GROUP LIMITED (Incorporated in the Cayman Islands with limited liability)
ANNOUNCEMENT OF ANNUAL RESULTS FOR THE YEAR ENDED 31 DECEMBER 2017
The board (the “Board”) of directors (the “Directors”) of Kakiko Group Limited (the “Company”, together with its subsidiaries, “the Group” or “Our Group” or “we”) announces the audited consolidated results of the Group for the year ended 31 December 2017 (the “Year” or “FY2017”). This year marked a major milestone for the Group when the issued shares of the Company (the “Shares”) were successfully listed on the Main Board of the Stock Exchange on 17 October 2017 (the “Listing Date” and the “Listing”, respectively).
MANAGEMENT DISCUSSION AND ANALYSIS
BUSINESS REVIEW
The Group is a Singapore-based service provider and mainly provides manpower outsourcing and ancillary services to building and construction contractors in the Republic of Singapore (“Singapore”). To a lesser extent, the Group also provides dormitory services, IT services and construction ancillary services (which comprise warehousing services, cleaning services and building maintenance works) in Singapore. The Group commenced the business of providing manpower outsourcing services in Singapore in 2006.
For the Year, the Group’s revenue decreased to approximately S$44.4 million as compared to approximately S$45.1 million for the year ended 31 December 2016 (“FY2016”), representing a decrease of approximately 1.4%. It was because the recovery of the construction industry in Singapore in late 2017 was slower than expected. Several key public projects in the Singapore construction industry scheduled in 2017 such as part of the planned upgrading works of the Housing and Development Board flats, the development of Jurong Town Council’s Logistic Hub, etc. were at the initial startup stage or did not commence during the earlier months of FY2017. In addition, based on the information provided by the Building and Construction Authority of Singapore (“BCA”), the total value of contracts awarded in 2017 was approximately S$24.5 billion which was lower than that awarded in 2016 of approximately S$26.4 billion. Based on the above, we were facing an intensifying competition in FY2017 and therefore, we had to adopt a more aggressive pricing strategy in order to secure new contracts.
2
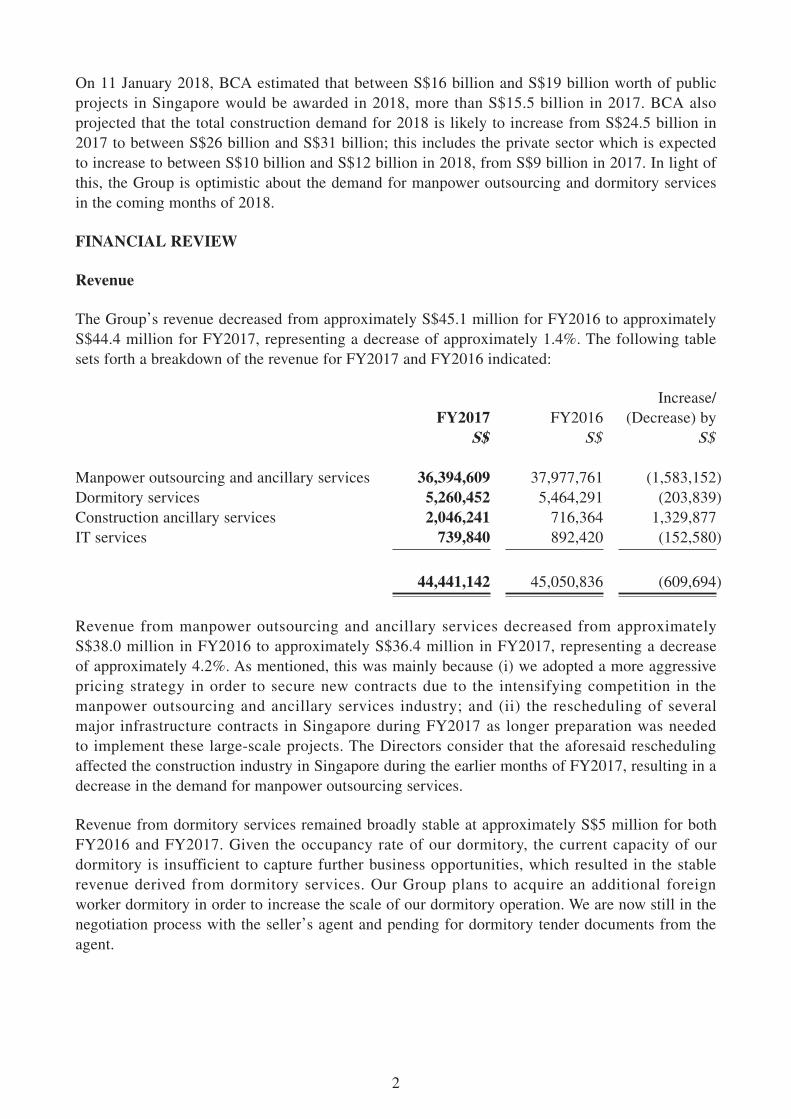
On 11 January 2018, BCA estimated that between S$16 billion and S$19 billion worth of public projects in Singapore would be awarded in 2018, more than S$15.5 billion in 2017. BCA also projected that the total construction demand for 2018 is likely to increase from S$24.5 billion in 2017 to between S$26 billion and S$31 billion; this includes the private sector which is expected to increase to between S$10 billion and S$12 billion in 2018, from S$9 billion in 2017. In light of this, the Group is optimistic about the demand for manpower outsourcing and dormitory services in the coming months of 2018.
FINANCIAL REVIEW
Revenue
The Group’s revenue decreased from approximately S$45.1 million for FY2016 to approximately S$44.4 million for FY2017, representing a decrease of approximately 1.4%. The following table sets forth a breakdown of the revenue for FY2017 and FY2016 indicated:
FY2017 FY2016Increase/
(Decrease) byS$ S$ S$
Manpower outsourcing and ancillary services 36,394,609 37,977,761 (1,583,152)Dormitory services 5,260,452 5,464,291 (203,839)Construction ancillary services 2,046,241 716,364 1,329,877IT services 739,840 892,420 (152,580)
44,441,142 45,050,836 (609,694)
Revenue from manpower outsourcing and ancillary services decreased from approximately S$38.0 million in FY2016 to approximately S$36.4 million in FY2017, representing a decrease of approximately 4.2%. As mentioned, this was mainly because (i) we adopted a more aggressive pricing strategy in order to secure new contracts due to the intensifying competition in the manpower outsourcing and ancillary services industry; and (ii) the rescheduling of several major infrastructure contracts in Singapore during FY2017 as longer preparation was needed to implement these large-scale projects. The Directors consider that the aforesaid rescheduling affected the construction industry in Singapore during the earlier months of FY2017, resulting in a decrease in the demand for manpower outsourcing services.
Revenue from dormitory services remained broadly stable at approximately S$5 million for both FY2016 and FY2017. Given the occupancy rate of our dormitory, the current capacity of our dormitory is insufficient to capture further business opportunities, which resulted in the stable revenue derived from dormitory services. Our Group plans to acquire an additional foreign worker dormitory in order to increase the scale of our dormitory operation. We are now still in the negotiation process with the seller’s agent and pending for dormitory tender documents from the agent.
3
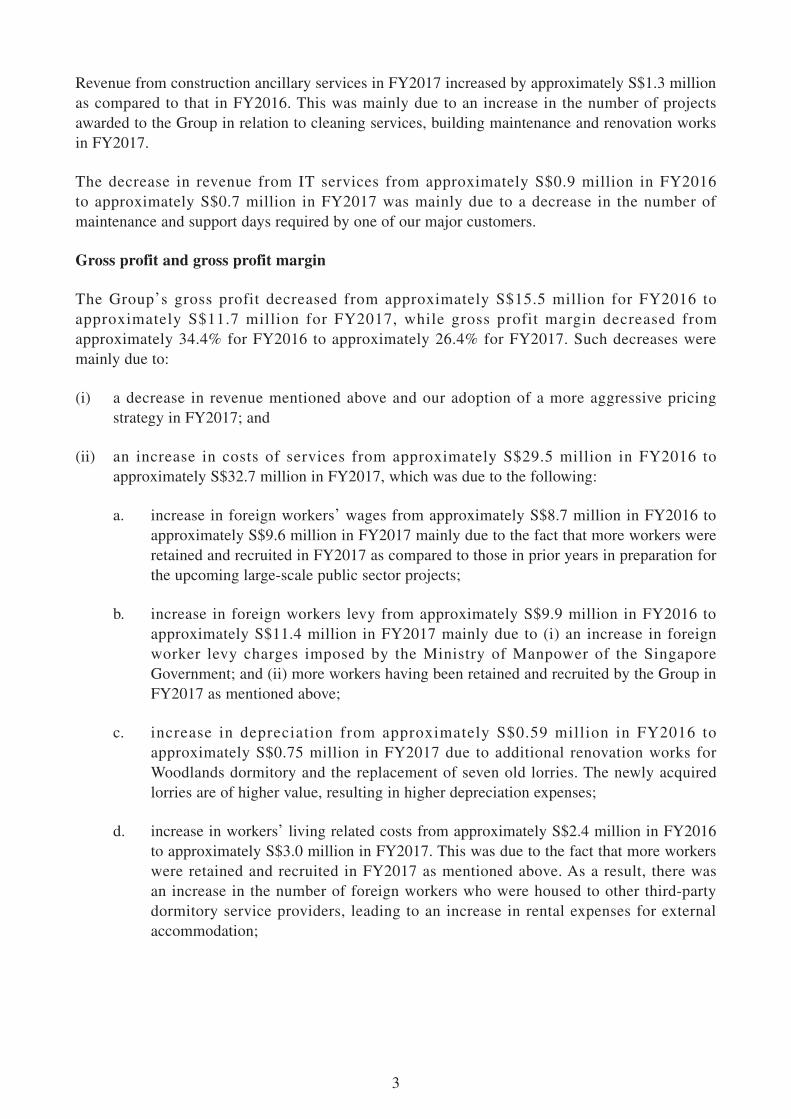
Revenue from construction ancillary services in FY2017 increased by approximately S$1.3 million as compared to that in FY2016. This was mainly due to an increase in the number of projects awarded to the Group in relation to cleaning services, building maintenance and renovation works in FY2017.
The decrease in revenue from IT services from approximately S$0.9 million in FY2016 to approximately S$0.7 million in FY2017 was mainly due to a decrease in the number of maintenance and support days required by one of our major customers.
Gross profit and gross profit margin
The Group’s gross profit decreased from approximately S$15.5 million for FY2016 to approximately S$11.7 million for FY2017, while gross profit margin decreased from approximately 34.4% for FY2016 to approximately 26.4% for FY2017. Such decreases were mainly due to:
(i) a decrease in revenue mentioned above and our adoption of a more aggressive pricing strategy in FY2017; and
(ii) an increase in costs of services from approximately S$29.5 million in FY2016 to approximately S$32.7 million in FY2017, which was due to the following:
a. increase in foreign workers’ wages from approximately S$8.7 million in FY2016 to approximately S$9.6 million in FY2017 mainly due to the fact that more workers were retained and recruited in FY2017 as compared to those in prior years in preparation for the upcoming large-scale public sector projects;
b. increase in foreign workers levy from approximately S$9.9 million in FY2016 to approximately S$11.4 million in FY2017 mainly due to (i) an increase in foreign worker levy charges imposed by the Ministry of Manpower of the Singapore Government; and (ii) more workers having been retained and recruited by the Group in FY2017 as mentioned above;
c. increase in depreciation from approximately S$0.59 million in FY2016 to approximately S$0.75 million in FY2017 due to additional renovation works for Woodlands dormitory and the replacement of seven old lorries. The newly acquired lorries are of higher value, resulting in higher depreciation expenses;
d. increase in workers’ living related costs from approximately S$2.4 million in FY2016 to approximately S$3.0 million in FY2017. This was due to the fact that more workers were retained and recruited in FY2017 as mentioned above. As a result, there was an increase in the number of foreign workers who were housed to other third-party dormitory service providers, leading to an increase in rental expenses for external accommodation;
4
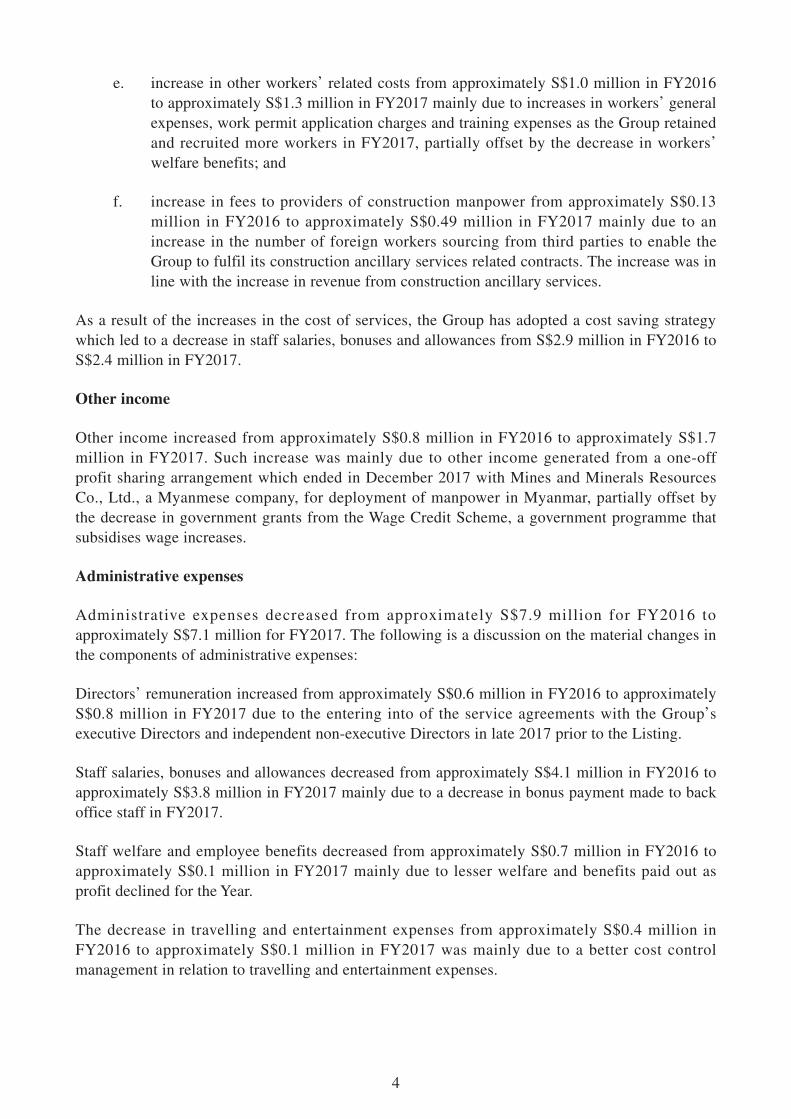
e. increase in other workers’ related costs from approximately S$1.0 million in FY2016 to approximately S$1.3 million in FY2017 mainly due to increases in workers’ general expenses, work permit application charges and training expenses as the Group retained and recruited more workers in FY2017, partially offset by the decrease in workers’ welfare benefits; and
f. increase in fees to providers of construction manpower from approximately S$0.13 million in FY2016 to approximately S$0.49 million in FY2017 mainly due to an increase in the number of foreign workers sourcing from third parties to enable the Group to fulfil its construction ancillary services related contracts. The increase was in line with the increase in revenue from construction ancillary services.
As a result of the increases in the cost of services, the Group has adopted a cost saving strategy which led to a decrease in staff salaries, bonuses and allowances from S$2.9 million in FY2016 to S$2.4 million in FY2017.
Other income
Other income increased from approximately S$0.8 million in FY2016 to approximately S$1.7 million in FY2017. Such increase was mainly due to other income generated from a one-off profit sharing arrangement which ended in December 2017 with Mines and Minerals Resources Co., Ltd., a Myanmese company, for deployment of manpower in Myanmar, partially offset by the decrease in government grants from the Wage Credit Scheme, a government programme that subsidises wage increases.
Administrative expenses
Administrative expenses decreased from approximately S$7.9 million for FY2016 to approximately S$7.1 million for FY2017. The following is a discussion on the material changes in the components of administrative expenses:
Directors’ remuneration increased from approximately S$0.6 million in FY2016 to approximately S$0.8 million in FY2017 due to the entering into of the service agreements with the Group’s executive Directors and independent non-executive Directors in late 2017 prior to the Listing.
Staff salaries, bonuses and allowances decreased from approximately S$4.1 million in FY2016 to approximately S$3.8 million in FY2017 mainly due to a decrease in bonus payment made to back office staff in FY2017.
Staff welfare and employee benefits decreased from approximately S$0.7 million in FY2016 to approximately S$0.1 million in FY2017 mainly due to lesser welfare and benefits paid out as profit declined for the Year.
The decrease in travelling and entertainment expenses from approximately S$0.4 million in FY2016 to approximately S$0.1 million in FY2017 was mainly due to a better cost control management in relation to travelling and entertainment expenses.

5
Other losses
Other losses increased from approximately S$0.1 million in FY2016 to approximately S$0.8 million in FY2017 due mainly to (i) an increase of approximately S$0.3 million in net foreign exchange loss as a result of the revaluation of bank balances denominated in Hong Kong dollar (“HK$”), which depreciated against Singapore dollar (“S$”) in 2017, and (ii) additional allowance of approximately S$0.5 million provided for doubtful debts.
Other expenses
Other expenses increased from approximately S$0.6 million in FY2016 to approximately S$2.3 million in FY2017 due to additional recognition of expenses in relation to the Listing.
Finance costs
Finance costs decreased by approximately S$15,000 in FY2017 mainly due to full settlement of our long-term bank borrowings.
Income tax expense
Income tax expense decreased by approximately S$93,000, from approximately S$1.0 million in FY2016 to approximately S$0.9 million in FY2017 mainly due to a decrease in our profit before income tax, partially offset by the recognition of deferred tax liabilities which arose mainly from the excess of tax over book depreciation of plant and equipment.
Profit for the year
As a result of the above factors, the Group recorded a profit for the year of approximately S$2.3 million in FY2017 (FY2016: approximately S$6.6 million). If the non-recurring Listing expenses incurred in FY2017 and FY2016 of approximately S$2.3 million and S$0.6 million, respectively were excluded, the Group would have recorded a profit for the year of approximately S$4.6 million in FY2017 (FY2016: approximately S$7.3 million), representing a decrease of approximately S$2.7 million. The decrease was mainly due to the combined effect of lower revenue and higher cost of services.
Earnings per share
For FY2017, the basic earnings per share was Singapore 0.21 cent and the calculation is based on the profit attributable to owners of the Company of approximately S$2.3 million and the weighted average number of 1,071,095,890 ordinary Shares in issue during the Year.
6
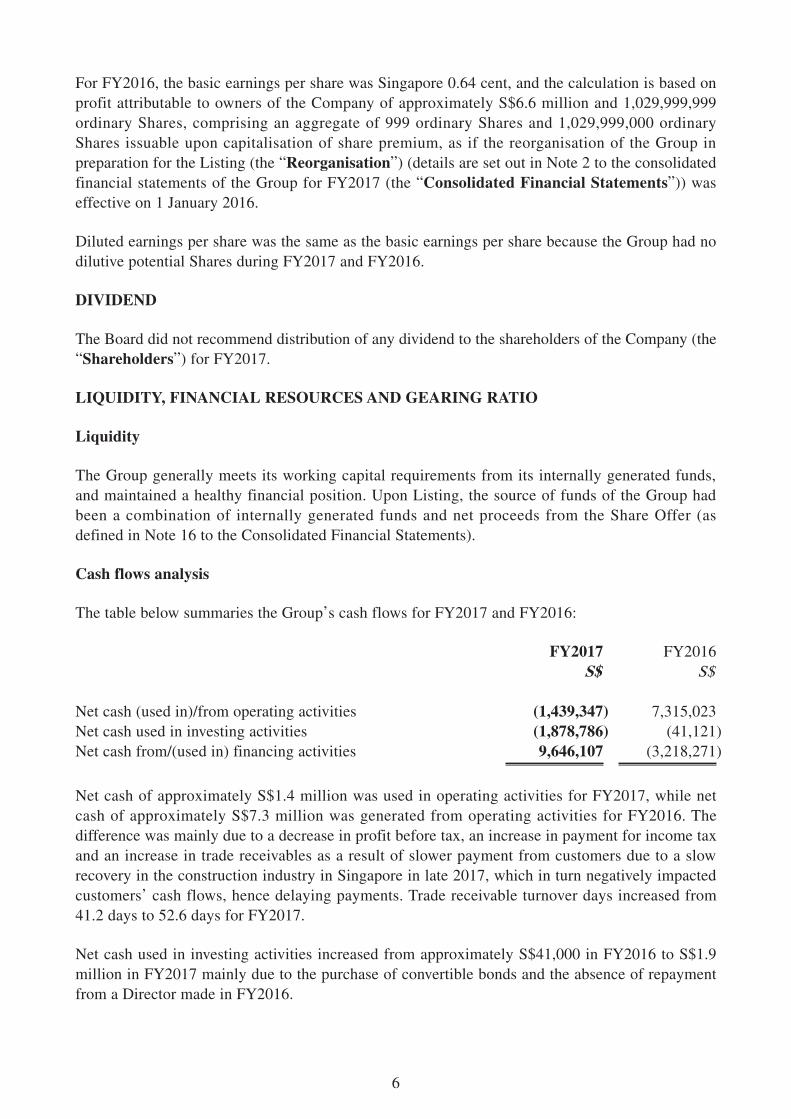
For FY2016, the basic earnings per share was Singapore 0.64 cent, and the calculation is based on profit attributable to owners of the Company of approximately S$6.6 million and 1,029,999,999 ordinary Shares, comprising an aggregate of 999 ordinary Shares and 1,029,999,000 ordinary Shares issuable upon capitalisation of share premium, as if the reorganisation of the Group in preparation for the Listing (the “Reorganisation”) (details are set out in Note 2 to the consolidated financial statements of the Group for FY2017 (the “Consolidated Financial Statements”)) was effective on 1 January 2016.
Diluted earnings per share was the same as the basic earnings per share because the Group had no dilutive potential Shares during FY2017 and FY2016.
DIVIDEND
The Board did not recommend distribution of any dividend to the shareholders of the Company (the “Shareholders”) for FY2017.
LIQUIDITY, FINANCIAL RESOURCES AND GEARING RATIO
Liquidity
The Group generally meets its working capital requirements from its internally generated funds, and maintained a healthy financial position. Upon Listing, the source of funds of the Group had been a combination of internally generated funds and net proceeds from the Share Offer (as defined in Note 16 to the Consolidated Financial Statements).
Cash flows analysis
The table below summaries the Group’s cash flows for FY2017 and FY2016:
FY2017 FY2016S$ S$
Net cash (used in)/from operating activities (1,439,347) 7,315,023Net cash used in investing activities (1,878,786) (41,121)Net cash from/(used in) financing activities 9,646,107 (3,218,271)
Net cash of approximately S$1.4 million was used in operating activities for FY2017, while net cash of approximately S$7.3 million was generated from operating activities for FY2016. The difference was mainly due to a decrease in profit before tax, an increase in payment for income tax and an increase in trade receivables as a result of slower payment from customers due to a slow recovery in the construction industry in Singapore in late 2017, which in turn negatively impacted customers’ cash flows, hence delaying payments. Trade receivable turnover days increased from 41.2 days to 52.6 days for FY2017.
Net cash used in investing activities increased from approximately S$41,000 in FY2016 to S$1.9 million in FY2017 mainly due to the purchase of convertible bonds and the absence of repayment from a Director made in FY2016.

7
Net cash from financing activities increased by approximately S$12.8 million in FY2017. This was mainly due to the proceeds from issuance of Shares and decreases in dividend paid and repayment of long-term debts, partially offset by the absence of advance from a Director made in FY2016.
Use of proceeds from the Share Offer
The net proceeds from the Share Offer were approximately HK$82.6 million (equivalent to approximately S$14.1 million) (after deducting underwriting fees and Listing expenses).
In line with that disclosed in the Company’s prospectus dated 4 October 2017, our Directors presently intend that the net proceeds will be applied as follows:
(i) approximately 93.4% of the net proceeds, for partly financing the acquisition of an additional foreign worker dormitory at an estimated consideration of HK$162.0 million (equivalent to approximately S$28.0 million, being the mid-point of our estimated range of consideration for the proposed acquisition), in connection with our plan to (a) cater to the accommodation needs of the additional foreign employees to be hired under our business expansion plan; and (b) increase the scale of our dormitory service business; and
(ii) approximately 6.6% of the net proceeds, for financing the acquisition of 10 additional lorries for us to cope with the expected increase in transportation needs from a larger size of our manpower in accordance with our business expansion plan.
As mentioned above, we are still in the negotiation process with the seller’s agent and pending for dormitory tender documents from the agent. Having considered (i) the slow recovery of the construction industry in Singapore in late 2017; (ii) the high occupancy rate of the dormitories owned by the Group; and (iii) that an additional dormitory had not yet been acquired, the Group did not further recruit a large number of foreign workers after the Listing. Therefore, no additional lorries has been acquired as of the date of this announcement.
Borrowings and gearing ratio
As at 31 December 2017, the Group had an aggregate of current and non-current finance lease obligations of approximately S$89,000, representing a significant decrease of approximately S$4.2 million as compared to approximately S$4.3 million as at 31 December 2016. The decrease was mainly due to full repayment of bank borrowings and amount due to a Director in FY2017.
The Group’s gearing ratio as at 31 December 2017 was approximately 0.3% (31 December 2016: approximately 43.2%). Gearing ratio is calculated by dividing total borrowings (comprising bank borrowings, finance lease obligations and amount due to a Director) by total equity as at the end of the respective year and multiplied by 100%.
As at 31 December 2017, the Group had no unutilised banking facilities available for cash drawdown.
8
Cash and cash equivalents
As at 31 December 2017, the Group had cash and cash equivalents of approximately S$21.7 million, of which approximately 24.6% was denominated in S$ and approximately 75.4% was denominated in HK$ which were placed in major licensed banks in Singapore and Hong Kong, respectively. Cash and cash equivalents denominated in United States dollars (“US$”) were immaterial.
Foreign exchange exposure
The Group transacts mainly in S$, which is the functional currency of the Group. A small portion of other receivables and payables is denominated in US$ arising from the transaction with a Myanmese company as mentioned above.
The Group retains a large portion of the proceeds from the Share Offer in HK$ which contributed to an unrealised foreign exchange loss of approximately S$0.3 million as HK$ weakened against S$.
Charges on the Group’s assets and contingent liabilities
As at 31 December 2017, the Group’s finance lease obligations were secured by the charge over leased assets with an aggregate net book value of approximately S$0.12 million (31 December 2016: S$221,000).
The Group did not have any material contingent liabilities as at 31 December 2017 and 2016.
Capital expenditures and capital commitments
The Group’s capital expenditures principally consisted of expenditures on motor vehicles, computer and equipment, furniture and fittings and renovation. The Group recorded capital expenditures for the purchases of property, plant and equipment and additions to investment property in the amounts of approximately S$1.4 million for FY2017 and FY2016, respectively.
As at 31 December 2017, the Group had bond commitments of S$0.68 million which were subsequently paid in January 2018.
Significant investments held, material acquisitions and disposal of subsidiaries, associates and joint ventures
There were no significant investments held, material acquisitions and disposal of subsidiaries, associates and joint ventures for FY2017 and FY2016.
Off-balance sheet transactions
As at 31 December 2017, the Group did not enter into any material off-balance sheet transaction.

9
EMPLOYEE AND REMUNERATION POLICY
As at 31 December 2017, the Group had 1,556 employees (31 December 2016: 1,393), including foreign workers.
The Group determines employee salaries based on employee’s qualifications, position and seniority. In order to attract and retain valuable employees, the Group reviews the performance of our employees, which will be taken into account in annual salary review and promotion appraisal. The Group has also adopted a sales incentive scheme, pursuant to which our sales managers are entitled to sales commission based on the number of hours of deployment in respect of any manpower outsourcing contracts obtained by them from customers.
The Group incurred staff costs (including the Directors and chief executive’s remuneration, and other staff’s salaries, wages and other benefits) of approximately S$17.5 million and S$17.8 million for FY2017 and FY2016 respectively.
QUANTITATIVE AND QUALITATIVE DISCLOSURE ABOUT MARKET RISK
Interest rate risk
The Group is exposed to cash flow interest rate risk on the variable rates of interest earned on the bank balances. The Group is also exposed to fair value interest rate risk in relation to fixed-rate finance lease obligations.
The Group currently does not have an interest rate hedging policy. However, the management monitors interest rate risk exposure and will consider interest rate hedging should the need arise.
Foreign currency risk
The Group has certain bank balances and trade receivables denominated in US$ and HK$ and certain trade payables denominated in US$ other than the functional currency of respective group entities, which expose the Group to foreign currency risk.
The Group manages the risk by closely monitoring the movement of the foreign currency rate.
Credit risk
In order to minimise the credit risk, the Group has policies in place for determination of credit limits, credit approvals and other monitoring procedures to ensure that follow-up action is taken to recover overdue debts. Before accepting any new customer, the Group carries out a research on the credit risk of the customer, assesses the customer’s credit quality and defines credit limits by customer. Limits attributed to customers are reviewed when necessary.
In addition, the Group reviews the recoverable amount of each individual trade debt at the end of each reporting period to ensure that adequate impairment losses are made for irrecoverable amounts. The Group has also obtained trade credit insurance, effective from 1 November 2017, which provides cover against loss due to credit risks such as protracted default, insolvency or bankruptcy. In this regard, management of the Group considers that the Group’s credit risk is significantly reduced.
10
Liquidity risk
In the management of the liquidity risk, the Group monitors and maintains a level of cash and cash equivalents deemed adequate by management to finance the Group’s operations and mitigate the effects of fluctuations in cash flows.
Fair value risk
The Group is exposed to fair value risk arising from financial assets and financial liabilities that are measured at fair value on a recurring and non-recurring basis.
FUTURE PROSPECTS AND DEVELOPMENT
The demand for manpower outsourcing service providers in Singapore is affected by developments in its construction industry. When the construction industry in Singapore is growing and the prospects of the construction industry strengthens, construction contractors in Singapore (i.e. our customers) will generally require more manpower to meet the increasing demand for construction activities.
In its media release dated 11 January 2018, BCA expects between S$26 billion and S$31 billion construction contracts to be awarded in 2018, up from the S$24.5 billion estimated to have been awarded in 2017. The projected higher construction demand is due largely to an expected increase in public sector construction projects, which is anticipated to make up 60% of the total projected demand. The figures reflect an increase from S$15.5 billion in 2017 to between S$16 billion and S$19 billion in 2018. Buoyed by a strengthened overall economic outlook and an upturn in property market sentiment, private sector demand is also expected to increase from S$9 billion in 2017 to between S$10 billion and S$12 billion in 2018.
Based on the aforesaid, our Directors took an optimistic view that the demand for manpower outsourcing and dormitory services is expected to increase in 2018.

11
CONSOLIDATED STATEMENT OF PROFIT OR LOSS AND OTHER COMPREHENSIVE INCOMEFOR THE YEAR ENDED 31 DECEMBER 2017
2017 2016Notes S$ S$
Revenue 4 44,441,142 45,050,836Cost of services (32,719,871) (29,538,360)
Gross profit 11,721,271 15,512,476Other income 5 1,732,586 823,711Selling expenses (31,927) (52,055)Administrative expenses (7,127,095) (7,894,256)Other gains and losses 6 (817,136) (141,112)Other expenses 7 (2,328,683) (649,996)Finance costs 8 (2,132) (17,227)
Profit before taxation 9 3,146,884 7,581,541Income tax expense 10 (869,111) (961,752)
Total comprehensive income for the year 2,277,773 6,619,789
Earnings per shareBasic and diluted 12 0.21 cent 0.64 cent
12
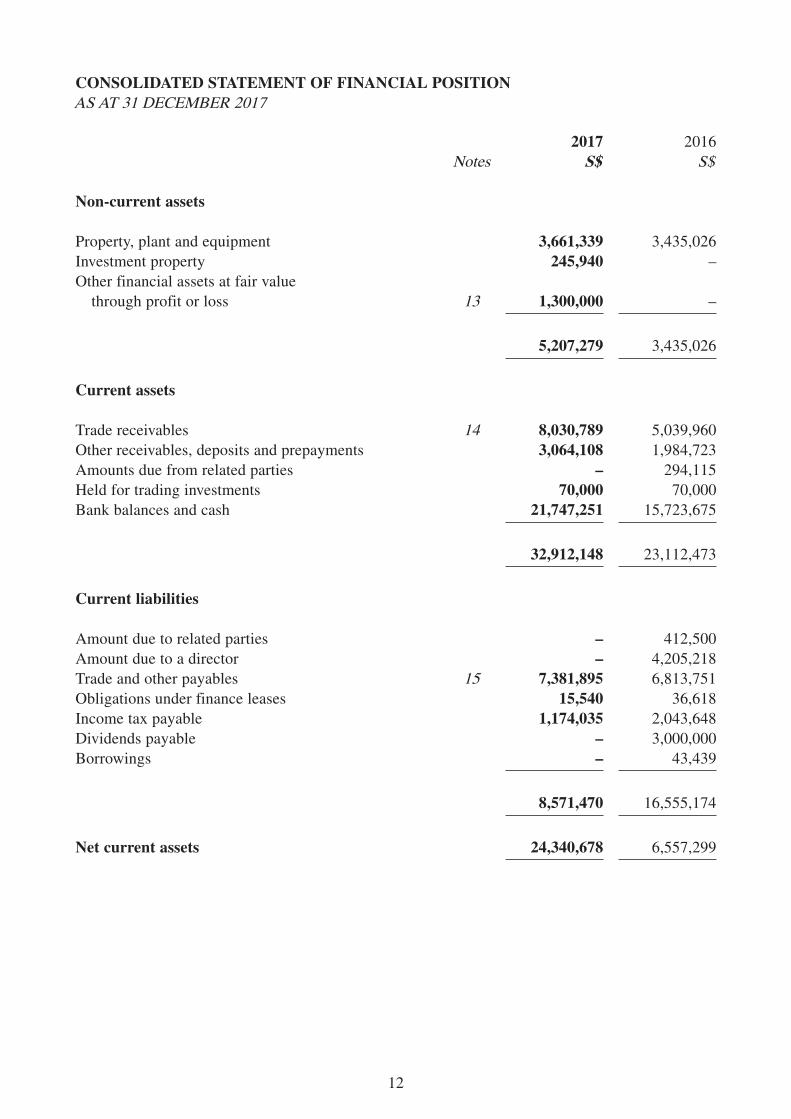
CONSOLIDATED STATEMENT OF FINANCIAL POSITIONAS AT 31 DECEMBER 2017
2017 2016Notes S$ S$
Non-current assets
Property, plant and equipment 3,661,339 3,435,026Investment property 245,940 –Other financial assets at fair value
through profit or loss 13 1,300,000 –
5,207,279 3,435,026
Current assets
Trade receivables 14 8,030,789 5,039,960Other receivables, deposits and prepayments 3,064,108 1,984,723Amounts due from related parties – 294,115Held for trading investments 70,000 70,000Bank balances and cash 21,747,251 15,723,675
32,912,148 23,112,473
Current liabilities
Amount due to related parties – 412,500Amount due to a director – 4,205,218Trade and other payables 15 7,381,895 6,813,751Obligations under finance leases 15,540 36,618Income tax payable 1,174,035 2,043,648Dividends payable – 3,000,000Borrowings – 43,439
8,571,470 16,555,174
Net current assets 24,340,678 6,557,299
13
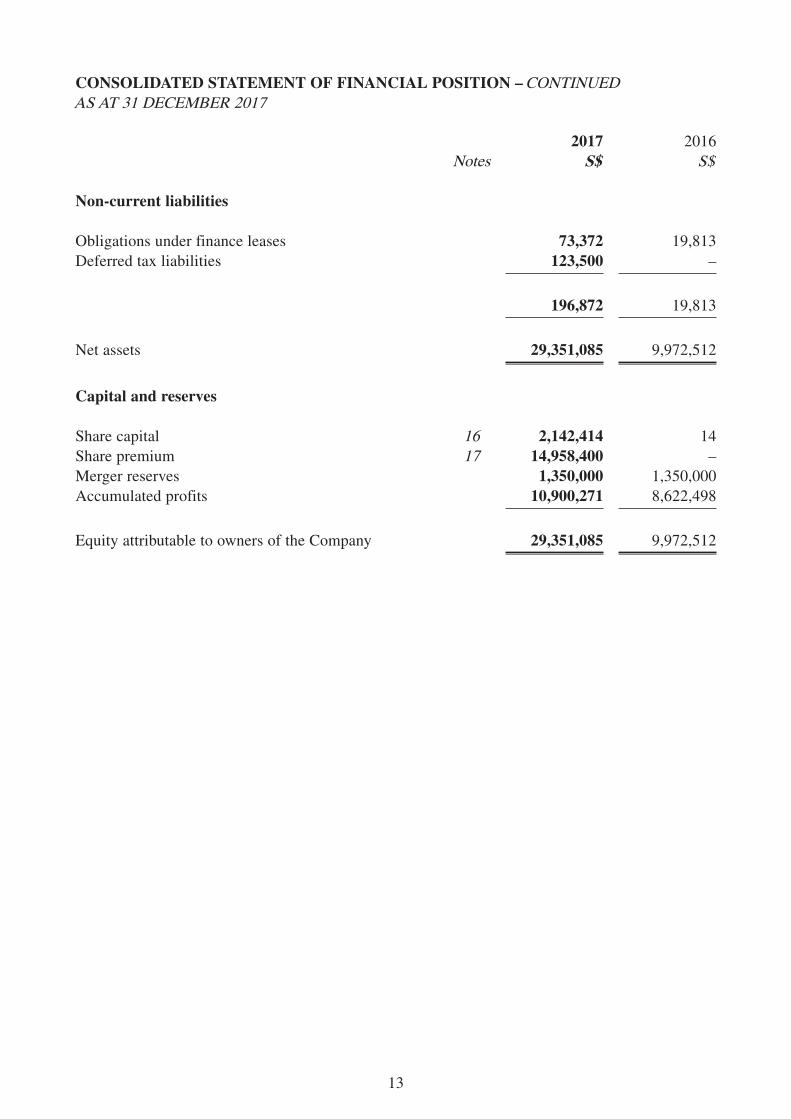
2017 2016Notes S$ S$
Non-current liabilities
Obligations under finance leases 73,372 19,813Deferred tax liabilities 123,500 –
196,872 19,813
Net assets 29,351,085 9,972,512
Capital and reserves
Share capital 16 2,142,414 14Share premium 17 14,958,400 –Merger reserves 1,350,000 1,350,000Accumulated profits 10,900,271 8,622,498
Equity attributable to owners of the Company 29,351,085 9,972,512
CONSOLIDATED STATEMENT OF FINANCIAL POSITION – CONTINUEDAS AT 31 DECEMBER 2017
14
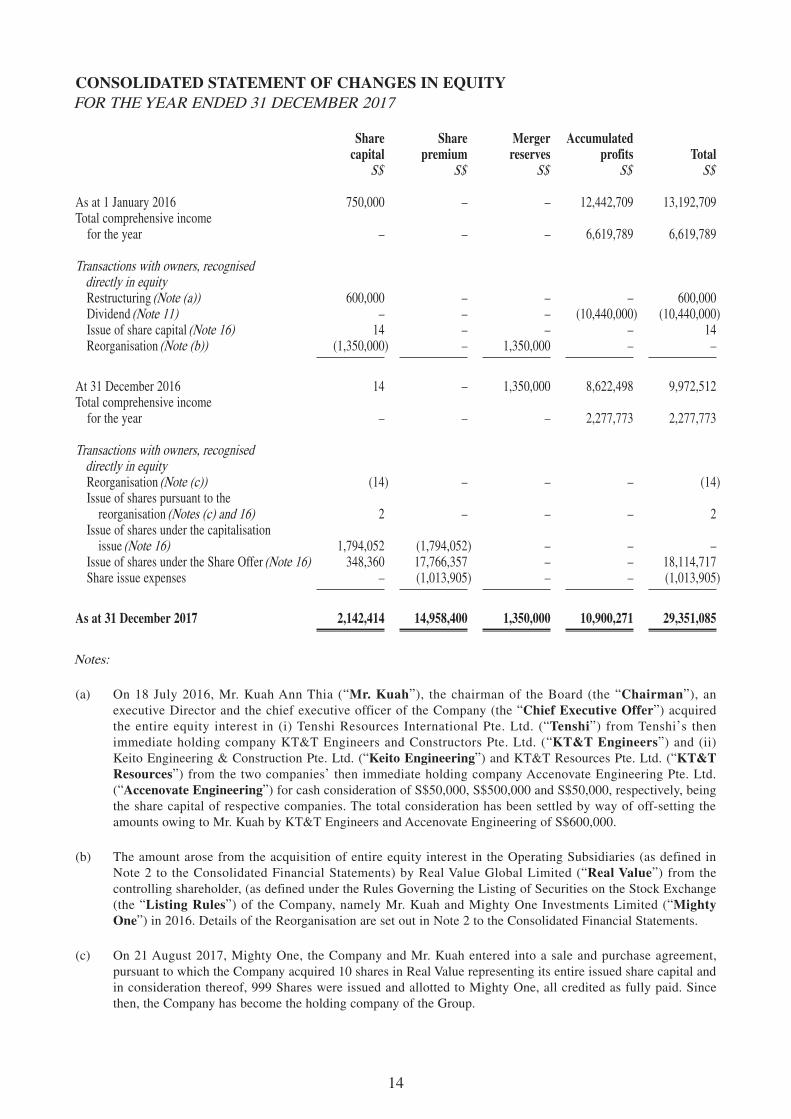
CONSOLIDATED STATEMENT OF CHANGES IN EQUITYFOR THE YEAR ENDED 31 DECEMBER 2017
Sharecapital
Share premium
Mergerreserves
Accumulated profits Total
S$ S$ S$ S$ S$
As at 1 January 2016 750,000 – – 12,442,709 13,192,709Total comprehensive income
for the year – – – 6,619,789 6,619,789
Transactions with owners, recognised directly in equityRestructuring (Note (a)) 600,000 – – – 600,000Dividend (Note 11) – – – (10,440,000) (10,440,000)Issue of share capital (Note 16) 14 – – – 14Reorganisation (Note (b)) (1,350,000) – 1,350,000 – –
At 31 December 2016 14 – 1,350,000 8,622,498 9,972,512Total comprehensive income
for the year – – – 2,277,773 2,277,773
Transactions with owners, recognised directly in equityReorganisation (Note (c)) (14) – – – (14)Issue of shares pursuant to the
reorganisation (Notes (c) and 16) 2 – – – 2Issue of shares under the capitalisation
issue (Note 16) 1,794,052 (1,794,052) – – –Issue of shares under the Share Offer (Note 16) 348,360 17,766,357 – – 18,114,717Share issue expenses – (1,013,905) – – (1,013,905)
As at 31 December 2017 2,142,414 14,958,400 1,350,000 10,900,271 29,351,085
Notes:
(a) On 18 July 2016, Mr. Kuah Ann Thia (“Mr. Kuah”), the chairman of the Board (the “Chairman”), an executive Director and the chief executive officer of the Company (the “Chief Executive Offer”) acquired the entire equity interest in (i) Tenshi Resources International Pte. Ltd. (“Tenshi”) from Tenshi’s then immediate holding company KT&T Engineers and Constructors Pte. Ltd. (“KT&T Engineers”) and (ii) Keito Engineering & Construction Pte. Ltd. (“Keito Engineering”) and KT&T Resources Pte. Ltd. (“KT&T Resources”) from the two companies’ then immediate holding company Accenovate Engineering Pte. Ltd. (“Accenovate Engineering”) for cash consideration of S$50,000, S$500,000 and S$50,000, respectively, being the share capital of respective companies. The total consideration has been settled by way of off-setting the amounts owing to Mr. Kuah by KT&T Engineers and Accenovate Engineering of S$600,000.
(b) The amount arose from the acquisition of entire equity interest in the Operating Subsidiaries (as defined in Note 2 to the Consolidated Financial Statements) by Real Value Global Limited (“Real Value”) from the controlling shareholder, (as defined under the Rules Governing the Listing of Securities on the Stock Exchange (the “Listing Rules”) of the Company, namely Mr. Kuah and Mighty One Investments Limited (“Mighty One”) in 2016. Details of the Reorganisation are set out in Note 2 to the Consolidated Financial Statements.
(c) On 21 August 2017, Mighty One, the Company and Mr. Kuah entered into a sale and purchase agreement, pursuant to which the Company acquired 10 shares in Real Value representing its entire issued share capital and in consideration thereof, 999 Shares were issued and allotted to Mighty One, all credited as fully paid. Since then, the Company has become the holding company of the Group.

15
NOTES TO THE CONSOLIDATED FINANCIAL STATEMENTSFOR THE YEAR ENDED 31 DECEMBER 2017
1. GENERAL
The Company was incorporated and registered as an exempted company in the Cayman Islands with limited liability on 14 February 2017. The immediate and ultimate holding company of the Group is Mighty One. The ultimate controlling party is Mr. Kuah Ann Thia, who is also the Chairman, executive Director and Chief Executive Officer. The registered office of the Company is at P. O. Box 31119 Grand Pavilion, Hibiscus Way, 802 West Bay Road, Grand Cayman, KY1-1205 Cayman Islands. The Company was registered in Hong Kong as a non-Hong Kong company under Part 16 of the Companies Ordinance (Chapter 622 of the laws of Hong Kong) (the “Hong Kong Companies Ordinance”) on 29 September 2017 and its principal place of business in Hong Kong is at Room 1603, 16/F, China Building, 29 Queen’s Road Central, Central, Hong Kong. The headquarters and principal place of business of the Company in Singapore is at 750 Chai Chee Road, #03-10/14 Viva Business Park, Singapore 469000. The issued Shares have been listed on the Main Board of the Stock Exchange with effect from on 17 October 2017.
The Company is an investment holding company and the principal activities of its Operating Subsidiaries (as defined in Note 2 below) are provision of manpower outsourcing and ancillary services, provision of dormitory services, and provision of IT services and construction ancillary services for the building and construction industry.
The functional currency of the Company is S$, which is also the presentation currency of the Company and its principal subsidiaries.
2. GROUP REORGANISATION AND BASIS OF PRESENTATION OF CONSOLIDATED FINANCIAL STATEMENTS
The Consolidated Financial Statements have been prepared in accordance with all applicable International Financial Reporting Standards (the “IFRSs”) issued by the International Accounting Standards Board (the “IASB”). In addition, the consolidated financial statements include applicable disclosures required by the Listing Rules and by the Hong Kong Companies Ordinance and the applicable conventions for group Reorganisation.
Prior to the Reorganisation, the operating subsidiaries of the Group including those group companies incorporated in Singapore, were wholly controlled by Mr. Kuah (the “Controlling Shareholder”) except for one company which 50% equity interest was held in trust by Mr. Kuah’s wife, Ms. Akiko Koshiishi. In preparing for the Listing, the companies comprising the Group underwent the Reorganisation as set out below:
• On 24 November 2016, Real Value was incorporated in the British Virgin Islands (the “BVI”) and one fully paid ordinary share of Real Value, representing its entire issued share capital, was allotted and issued to Mighty One, a company controlled by Mr. Kuah, not forming part of the Group, on 16 December 2016.
• Harbour Gold Investments Limited, Leading Elite Global Limited (“Leading Elite”), Priceless Developments Limited and Promising Elite Investments Limited (collectively the “Immediate Holding Companies”) were incorporated in the BVI on 28 November 2016, 28 November 2016, 13 October 2016 and 21 September 2016, respectively and one fully paid ordinary share of each of them, representing their respective entire issued share capital, was allotted and issued to Real Value on 16 December 2016.
• On 28 December 2016, Mr. Kuah acquired 50% equity interest in Nichefield Pte. Ltd. (“Nichefield”) held by his nominee at a nominal cash consideration of S$1.
16
• On 28 December 2016, the then entire equity interest in Nichefield, Tenshi, KT&T Engineers, Keito Engineering, KT&T Resources, Accenovate Engineering, Kanon Global Pte. Ltd. (“Kanon Global”), Accenovate Consulting (Asia) Pte. Ltd. (“Accenovate Cousulting”) and KT&T Global Pte. Ltd. (“KT&T Global”) (collectively the “Operating Subsidiaries”) were restructured by transferring from Mr. Kuah to the Immediate Holding Companies as nominees of Real Value at consideration settled by way of the issue and allotment of a total of nine shares in Real Value, credited as fully paid to Mighty One at the direction of Mr. Kuah.
• On 14 February 2017, the Company was incorporated in the Cayman Islands with an authorised share capital of HK$380,000 divided into 38,000,000 shares with a par value of HK$0.01 each, of which one share was allotted and issued in nil paid form to the initial subscriber, an independent third party and the said share was subsequently transferred to Mighty One on the same date for nil consideration.
• On 21 August 2017, Mighty One, the Company and Mr. Kuah entered into a sale and purchase agreement, pursuant to which the Company acquired ten shares in Real Value, representing its entire issued share capital from Mighty One and in consideration thereof, 999 Shares were issued and alloted to Mighty One, all credited as fully-paid.
As part of the Reorganisation, investment holding companies, including Real Value, the Immediate Holding Companies and the Company, were incorporated and interspersed between the Operating Subsidiaries and the Controlling Shareholder. Since then, the Company has become the holding company of the Group on 21 August 2017.
The Group resulting from the above-mentioned Reorganisation is regarded as a continuing entity. Accordingly, the Consolidated Financial Statements have been prepared using the principles of merger accounting as if the group structure under the Reorganisation had been in existence throughout the Year or their respective dates of incorporation, whichever is the shorter period.
The issued Shares have been listed on the Stock Exchange since 17 October 2017.
3. APPLICATION OF INTERNATIONAL FINANCIAL REPORTING STANDARDS
On 1 January 2017, the Group adopted all the new and revised IFRSs and Interpretations of IFRS (“INT IFRS”) that are effective and relevant to its operations. The adoption of these new/revised IFRSs and INT IFRSs does not result in significant changes to the Group’s accounting policies and has no material effect on the amounts reported for the current or prior periods.
On the date of authorisation of these Consolidated Financial Statements, the Group has not applied the following relevant new and revised IFRSs that have been issued but are not yet effective:
IFRS 9 Financial Instruments1
IFRS 15 Revenue from Contracts with Customers and the related Amendements1
IFRS 16 Leases2
1 Effective for annual periods beginning on or after 1 January 20182 Effective for annual periods beginning on or after 1 January 2019
Except as described below, the Directors consider that the application of the other new and revised IFRSs and International Accounting Standards (“IASs”) and interpretation is unlikely to have a material impact on the Group’s financial position and performance as well as disclosure in the future.
17
IFRS 9 Financial Instruments
IFRS 9 introduces new requirements for the classification and measurement of financial assets, financial liabilities, general hedge accounting and impairment requirements for financial assets.
Key requirements of IFRS 9 are described below:
• All recognised financial assets that are within the scope of IFRS 9 are required to be subsequently measured at amortized cost or fair value. Specifically, debt investments that are held within a business model whose objective is to collect the contractual cash flows, and that have contractual cash flows that are solely payments of principal and interest on the principal outstanding are generally measured at amortized cost at the end of subsequent accounting periods. Debt instruments that are held within a business model whose objective is achieved both by collecting contractual cash flows and selling financial assets, and that have contractual terms of the financial asset that give rise on specified dates to cash flows that are solely payments of principal and interest on the principal amount outstanding, are measured at ‘fair value through other comprehensive income’ (“FVTOCI”). All other debt investments and equity investments are measured at their fair value at the end of subsequent accounting periods. In addition, under IFRS 9, entities may make an irrevocable election to present subsequent changes in the fair value of an equity investment (that is not held for trading) in other comprehensive income, with only dividend income generally recognised in profit or loss.
• With regard to the measurement of financial liabilities designated as at fair value through profit or loss, IFRS 9 requires that the amount of change in the fair value of the financial liability that is attributable to changes in the credit risk of that liability is presented in other comprehensive income, unless the recognition of the effects of changes in the liability’s credit risk in other comprehensive income would create or enlarge an accounting mismatch in profit or loss. Changes in fair value of financial liabilities attributable to changes in the financial liabilities’ credit risk are not subsequently reclassified to profit or loss. Under IAS 39 Financial Instruments : Recognition and Measurement, the entire amount of the change in the fair value of the financial liability designated as at fair value through profit or loss was presented in profit or loss.
• In relation to the impairment of financial assets, IFRS 9 requires an expected credit loss model, as opposed to an incurred credit loss model under IAS 39. The expected credit loss model requires an entity to account for expected credit losses and changes in those expected credit losses at each reporting date to reflect changes in credit risk since initial recognition. In other words, it is no longer necessary for a credit event to have occurred before credit losses are recognised.
• The new general hedge accounting requirements retain the three types of hedge accounting mechanism currently available in IAS 39. Under IFRS 9, greater flexibility has been introduced to the types of transactions eligible for hedge accounting, specifically broadening the types of instruments that qualify for hedging instruments and the types of risk components of non-financial items that are eligible for hedge accounting. In addition, the effectiveness test has been overhauled and replaced with the principle of an ‘economic relationship’. Retrospective assessment of hedge effectiveness is also no longer required. Enhanced disclosure requirements about an entity’s risk management activities have also been introduced.
Management has performed an assessment of the requirements of the initial application of the new IFRS 9, which will result in changes to the accounting policies relating to the impairment provisions of financial assets and classification and measurement of the Group’s financial assets which will either be measured at fair value through profit or loss or be designated as FVTOCI (subject to fulfilment of the designation criteria). The Directors anticipate that the adoption of IFRS 9 will not have a material impact on the financial statements of the Group in the period of their initial adoption.
18
IFRS 15 Revenue from Contracts with Customers
IFRS 15 was issued which establishes a single comprehensive model for entities to use in accounting for revenue arising from contracts with customers. IFRS 15 will supersede the current revenue recognition guidance including IAS 18 Revenue , IAS 11 Construction Contracts and the related interpretations when it becomes effective.
The core principle of IFRS 15 is that an entity should recognise revenue to depict the transfer of promised goods or services to customers in an amount that reflects the consideration to which the entity expects to be entitled in exchange for those goods or services. Specifically, the standard introduces a 5-step approach to revenue recognition:
Step 1: Identify the contract(s) with a customer
Step 2: Identify the performance obligations in the contract
Step 3: Determine the transaction price
Step 4: Allocate the transaction price to the performance obligations in the contract
Step 5: Recognise revenue when (or as) the entity satisfies a performance obligation
Under IFRS 15, an entity recognises revenue when (or as) a performance obligation is satisfied, i.e. when ‘control’ of the goods or services underlying the particular performance obligation is transferred to the customer. Far more prescriptive guidance has been added in IFRS 15 to deal with specific scenarios. Furthermore, extensive disclosures are required by IFRS 15.
In 2017, the IASB issued clarifications to IFRS 15 in relation to the identification of performance obligations, principal versus agent considerations, as well as licensing application guidance.
The Directors anticipate that the adoption of IFRS 15 in the future is unlikely to have significant impact on revenue recognition but will result in more disclosures based on the assessment performed.
IFRS 16 Leases
IFRS 16 introduces a comprehensive model for the identification of lease arrangements and accounting treatments for both lessors and lessees. IFRS 16 will supersede IAS 17 Leases and the related interpretations when it becomes effective.
IFRS 16 distinguishes lease and service contracts on the basis of whether an identified asset is controlled by a customer. Distinctions of operating leases and finance leases are removed for lessee accounting, and is replaced by a model where a right-of-use asset and a corresponding liability have to be recognised for all leases by lessees, except for short-term leases and leases of low value assets. The right-of-use asset is initially measured at cost and subsequently measured at cost (subject to certain exceptions) less accumulated depreciation and impairment losses, adjusted for any remeasurement of the lease liability. The lease liability is initially measured at the present value of the lease payments that are not paid at that date. Subsequently, the lease liability is adjusted for, amongst others, interest and lease payments, as well as the impact of lease modifications. For the classification of cash flows, the Group currently presents operating lease payments as operating cash flows. Under the IFRS 16, lease payments in relation to lease liability will be allocated into a principal and an interest portion which will be presented as financing cash flows.
19
Under IAS 17, the Group has already recognised an asset and a related finance lease liability for finance lease arrangement where the Group is lessee. The application of IFRS 16 may result in potential changes in classification of these assets depending on whether the Group presents right-of-use assets separately or within the same line item at which the corresponding underlying assets would be presented if they were owned.
In contrast to lessee accounting, IFRS 16 substantially carries forward the lessor accounting requirements in IAS 17, and continues to require a lessor to classify a lease either as an operating lease or a finance lease.
Furthermore, extensive disclosures are required by IFRS 16.
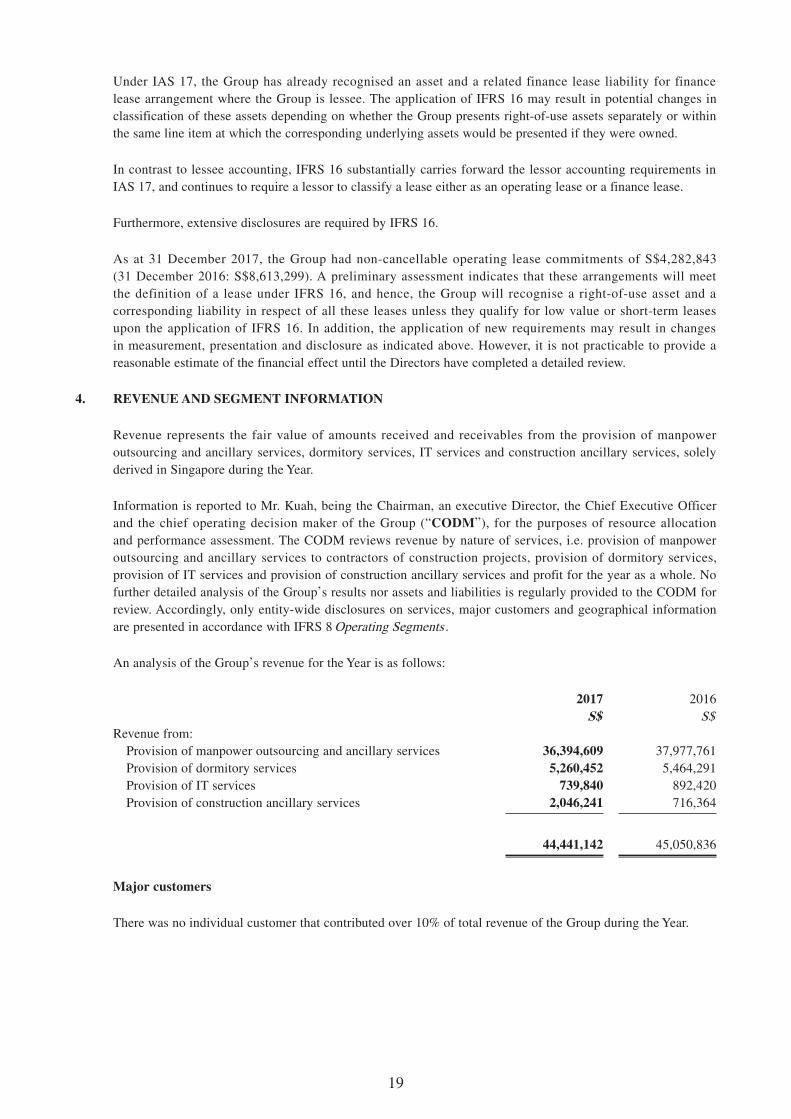
As at 31 December 2017, the Group had non-cancellable operating lease commitments of S$4,282,843 (31 December 2016: S$8,613,299). A preliminary assessment indicates that these arrangements will meet the definition of a lease under IFRS 16, and hence, the Group will recognise a right-of-use asset and a corresponding liability in respect of all these leases unless they qualify for low value or short-term leases upon the application of IFRS 16. In addition, the application of new requirements may result in changes in measurement, presentation and disclosure as indicated above. However, it is not practicable to provide a reasonable estimate of the financial effect until the Directors have completed a detailed review.
4. REVENUE AND SEGMENT INFORMATION
Revenue represents the fair value of amounts received and receivables from the provision of manpower outsourcing and ancillary services, dormitory services, IT services and construction ancillary services, solely derived in Singapore during the Year.
Information is reported to Mr. Kuah, being the Chairman, an executive Director, the Chief Executive Officer and the chief operating decision maker of the Group (“CODM”), for the purposes of resource allocation and performance assessment. The CODM reviews revenue by nature of services, i.e. provision of manpower outsourcing and ancillary services to contractors of construction projects, provision of dormitory services, provision of IT services and provision of construction ancillary services and profit for the year as a whole. No further detailed analysis of the Group’s results nor assets and liabilities is regularly provided to the CODM for review. Accordingly, only entity-wide disclosures on services, major customers and geographical information are presented in accordance with IFRS 8 Operating Segments .
An analysis of the Group’s revenue for the Year is as follows:
2017 2016S$ S$
Revenue from:Provision of manpower outsourcing and ancillary services 36,394,609 37,977,761Provision of dormitory services 5,260,452 5,464,291Provision of IT services 739,840 892,420Provision of construction ancillary services 2,046,241 716,364
44,441,142 45,050,836
Major customers
There was no individual customer that contributed over 10% of total revenue of the Group during the Year.

20
Geographical information
The Group principally operates in Singapore, which is also its place of domicile. All revenues are derived from Singapore based on the location of services delivered and the Group’s property, plant and equipment are all located in Singapore.
5. OTHER INCOME
2017 2016S$ S$
Government grants (Note (a)) 219,231 461,390Dividend income from held for trading investments 1,400 1,600Forfeiture of customer deposits 76,220 9,986Work injury/workmen compensation claims 86,651 203,464Sub-leasing income 186,093 100,069Other income from Myanmar (Note (b)) 1,123,985 –Others 39,006 47,202
1,732,586 823,711
Notes:
(a) Government grants mainly include the Special Employment Credit (“SEC”), the Productivity and Innovation Credit (“PIC”) Scheme and the Wages Credit Scheme (“WCS”), which are compensation for expenses or losses already incurred or for the purpose of giving immediate financial support to the Group with no future related costs.
During the years ended 31 December 2017 and 2016, the Group received respective grants of S$52,997 and S$71,460 under the SEC. Under the SEC, the government aims to encourage and facilitate Singapore-registered businesses to hire older Singaporean workers and persons with disabilities.
During the years ended 31 December 2017 and 2016, respective grants of S$99,484 and S$304,079 under WCS were received. Under this credit scheme, the government provides assistance to Singapore-registered businesses by way of co-funding 20% of wage increases given to Singapore citizen employees earning a gross monthly wage of S$4,000 or below in 2016 to 2017.
(b) Other income from Myanmar pertains to the profit sharing arrangement the Group has with a Myanmese counterparty with respect to a business collaboration with the Myanmese counterparty.
21
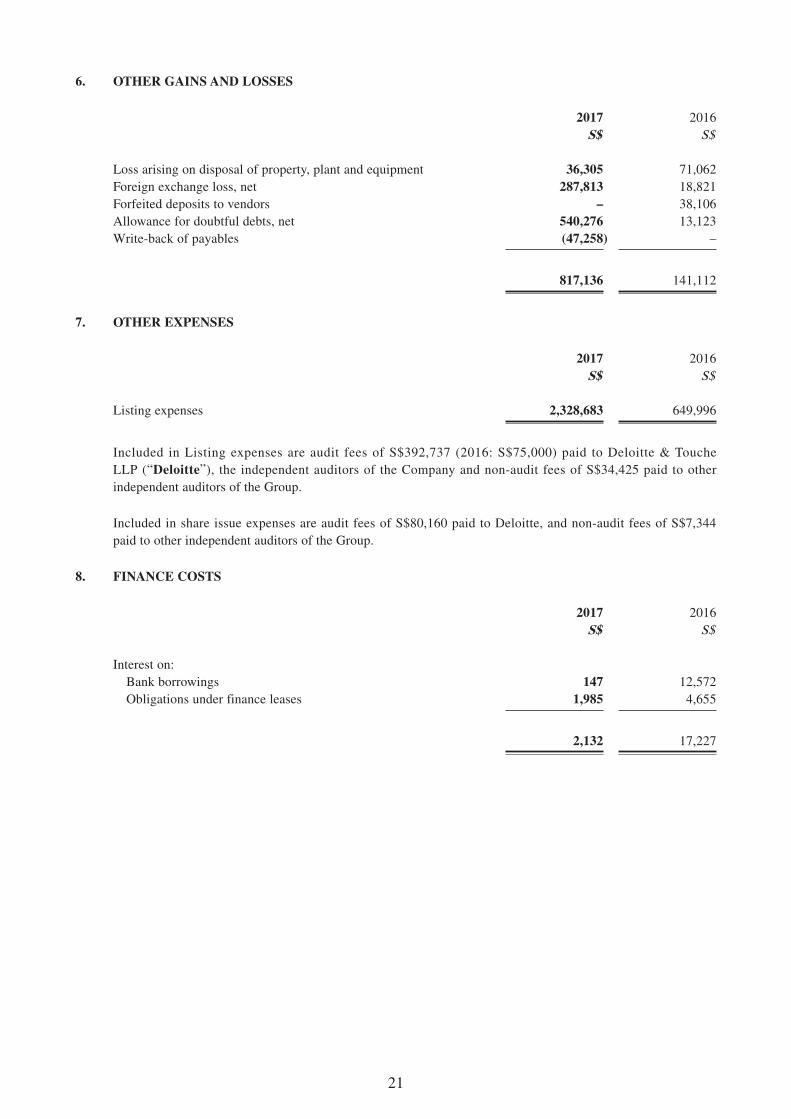
6. OTHER GAINS AND LOSSES
2017 2016S$ S$
Loss arising on disposal of property, plant and equipment 36,305 71,062Foreign exchange loss, net 287,813 18,821Forfeited deposits to vendors – 38,106Allowance for doubtful debts, net 540,276 13,123Write-back of payables (47,258) –
817,136 141,112
7. OTHER EXPENSES
2017 2016S$ S$
Listing expenses 2,328,683 649,996
Included in Listing expenses are audit fees of S$392,737 (2016: S$75,000) paid to Deloitte & Touche LLP (“Deloitte”), the independent auditors of the Company and non-audit fees of S$34,425 paid to other independent auditors of the Group.
Included in share issue expenses are audit fees of S$80,160 paid to Deloitte, and non-audit fees of S$7,344 paid to other independent auditors of the Group.
8. FINANCE COSTS
2017 2016S$ S$
Interest on:Bank borrowings 147 12,572Obligations under finance leases 1,985 4,655
2,132 17,227
22
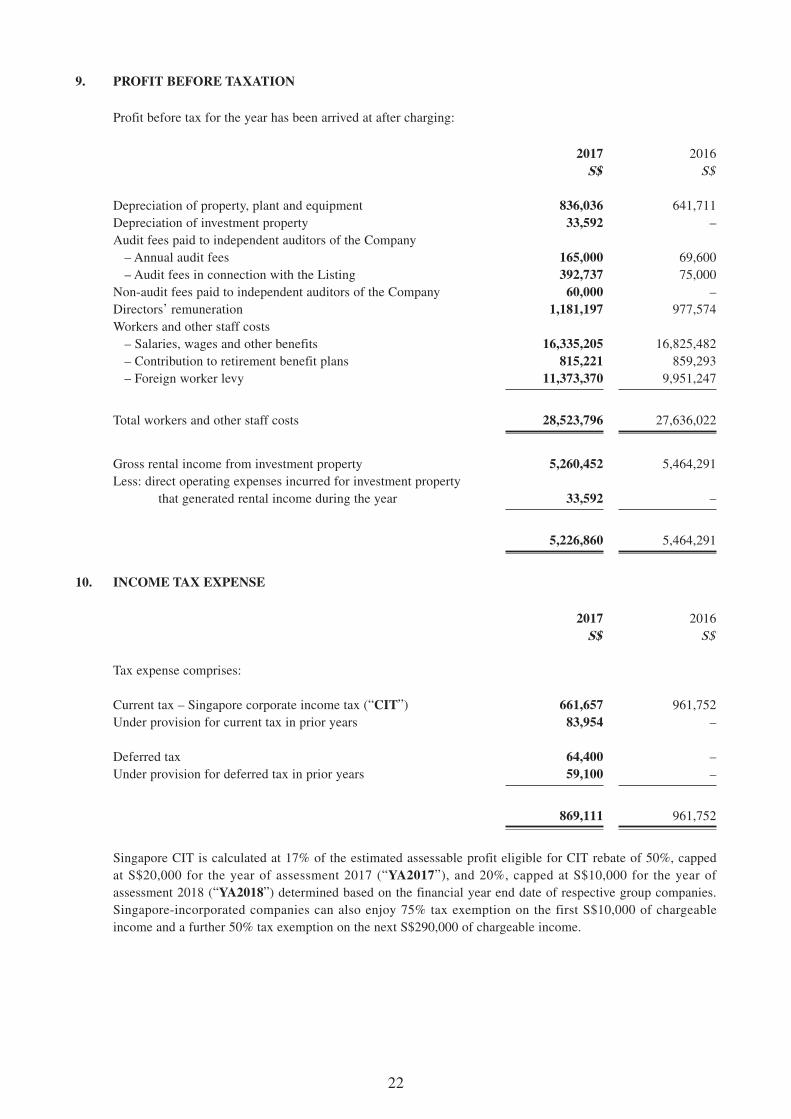
9. PROFIT BEFORE TAXATION
Profit before tax for the year has been arrived at after charging:
2017 2016S$ S$
Depreciation of property, plant and equipment 836,036 641,711Depreciation of investment property 33,592 –Audit fees paid to independent auditors of the Company
– Annual audit fees 165,000 69,600– Audit fees in connection with the Listing 392,737 75,000
Non-audit fees paid to independent auditors of the Company 60,000 –Directors’ remuneration 1,181,197 977,574Workers and other staff costs
– Salaries, wages and other benefits 16,335,205 16,825,482– Contribution to retirement benefit plans 815,221 859,293– Foreign worker levy 11,373,370 9,951,247
Total workers and other staff costs 28,523,796 27,636,022
Gross rental income from investment property 5,260,452 5,464,291Less: direct operating expenses incurred for investment property
that generated rental income during the year 33,592 –
5,226,860 5,464,291
10. INCOME TAX EXPENSE
2017 2016S$ S$
Tax expense comprises:
Current tax – Singapore corporate income tax (“CIT”) 661,657 961,752Under provision for current tax in prior years 83,954 –
Deferred tax 64,400 –Under provision for deferred tax in prior years 59,100 –
869,111 961,752
Singapore CIT is calculated at 17% of the estimated assessable profit eligible for CIT rebate of 50%, capped at S$20,000 for the year of assessment 2017 (“YA2017”), and 20%, capped at S$10,000 for the year of assessment 2018 (“YA2018”) determined based on the financial year end date of respective group companies. Singapore-incorporated companies can also enjoy 75% tax exemption on the first S$10,000 of chargeable income and a further 50% tax exemption on the next S$290,000 of chargeable income.
23
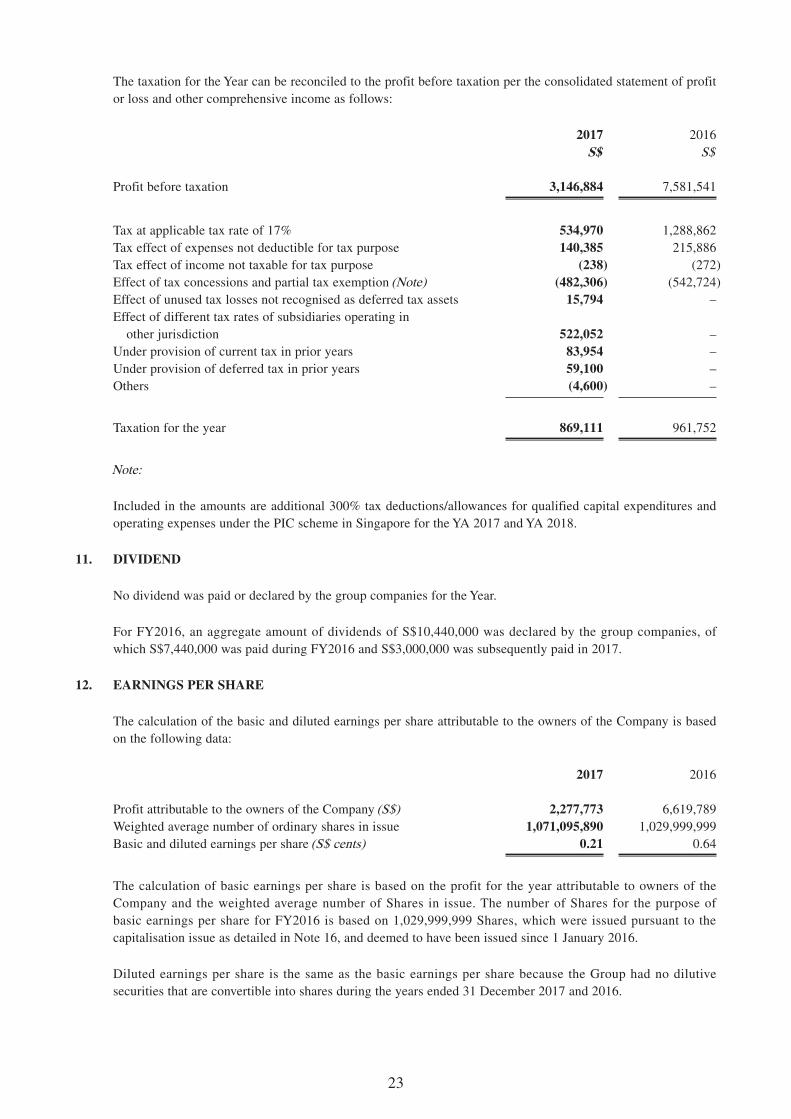
The taxation for the Year can be reconciled to the profit before taxation per the consolidated statement of profit or loss and other comprehensive income as follows:
2017 2016S$ S$
Profit before taxation 3,146,884 7,581,541
Tax at applicable tax rate of 17% 534,970 1,288,862Tax effect of expenses not deductible for tax purpose 140,385 215,886Tax effect of income not taxable for tax purpose (238) (272)Effect of tax concessions and partial tax exemption (Note) (482,306) (542,724)Effect of unused tax losses not recognised as deferred tax assets 15,794 –Effect of different tax rates of subsidiaries operating in
other jurisdiction 522,052 –Under provision of current tax in prior years 83,954 –Under provision of deferred tax in prior years 59,100 –Others (4,600) –
Taxation for the year 869,111 961,752
Note:
Included in the amounts are additional 300% tax deductions/allowances for qualified capital expenditures and operating expenses under the PIC scheme in Singapore for the YA 2017 and YA 2018.
11. DIVIDEND
No dividend was paid or declared by the group companies for the Year.
For FY2016, an aggregate amount of dividends of S$10,440,000 was declared by the group companies, of which S$7,440,000 was paid during FY2016 and S$3,000,000 was subsequently paid in 2017.
12. EARNINGS PER SHARE
The calculation of the basic and diluted earnings per share attributable to the owners of the Company is based on the following data:
2017 2016
Profit attributable to the owners of the Company (S$) 2,277,773 6,619,789Weighted average number of ordinary shares in issue 1,071,095,890 1,029,999,999Basic and diluted earnings per share (S$ cents) 0.21 0.64
The calculation of basic earnings per share is based on the profit for the year attributable to owners of the Company and the weighted average number of Shares in issue. The number of Shares for the purpose of basic earnings per share for FY2016 is based on 1,029,999,999 Shares, which were issued pursuant to the capitalisation issue as detailed in Note 16, and deemed to have been issued since 1 January 2016.
Diluted earnings per share is the same as the basic earnings per share because the Group had no dilutive securities that are convertible into shares during the years ended 31 December 2017 and 2016.
24
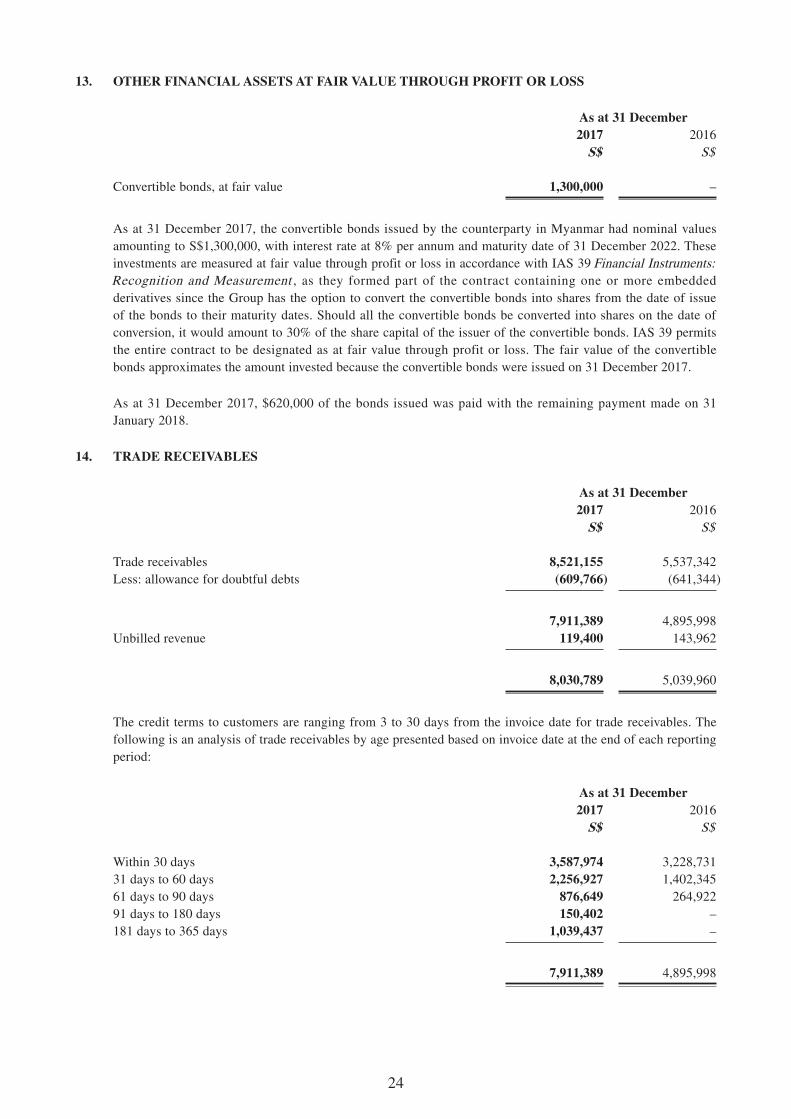
13. OTHER FINANCIAL ASSETS AT FAIR VALUE THROUGH PROFIT OR LOSS
As at 31 December 2017 2016
S$ S$
Convertible bonds, at fair value 1,300,000 –
As at 31 December 2017, the convertible bonds issued by the counterparty in Myanmar had nominal values amounting to S$1,300,000, with interest rate at 8% per annum and maturity date of 31 December 2022. These investments are measured at fair value through profit or loss in accordance with IAS 39 Financial Instruments: Recognition and Measurement , as they formed part of the contract containing one or more embedded derivatives since the Group has the option to convert the convertible bonds into shares from the date of issue of the bonds to their maturity dates. Should all the convertible bonds be converted into shares on the date of conversion, it would amount to 30% of the share capital of the issuer of the convertible bonds. IAS 39 permits the entire contract to be designated as at fair value through profit or loss. The fair value of the convertible bonds approximates the amount invested because the convertible bonds were issued on 31 December 2017.
As at 31 December 2017, $620,000 of the bonds issued was paid with the remaining payment made on 31 January 2018.
14. TRADE RECEIVABLES
As at 31 December 2017 2016
S$ S$
Trade receivables 8,521,155 5,537,342Less: allowance for doubtful debts (609,766) (641,344)
7,911,389 4,895,998Unbilled revenue 119,400 143,962
8,030,789 5,039,960
The credit terms to customers are ranging from 3 to 30 days from the invoice date for trade receivables. The following is an analysis of trade receivables by age presented based on invoice date at the end of each reporting period:
As at 31 December 2017 2016
S$ S$
Within 30 days 3,587,974 3,228,73131 days to 60 days 2,256,927 1,402,34561 days to 90 days 876,649 264,92291 days to 180 days 150,402 –181 days to 365 days 1,039,437 –
7,911,389 4,895,998
25
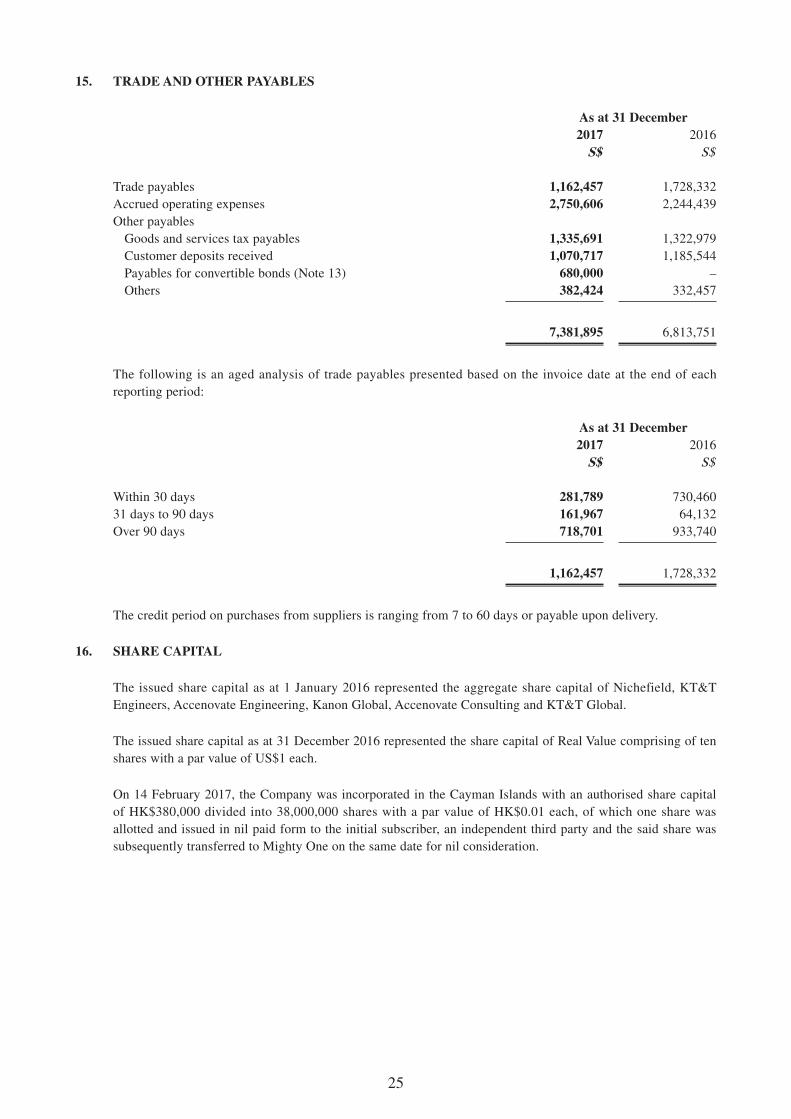
15. TRADE AND OTHER PAYABLES
As at 31 December2017 2016
S$ S$
Trade payables 1,162,457 1,728,332Accrued operating expenses 2,750,606 2,244,439Other payables
Goods and services tax payables 1,335,691 1,322,979Customer deposits received 1,070,717 1,185,544Payables for convertible bonds (Note 13) 680,000 –Others 382,424 332,457
7,381,895 6,813,751
The following is an aged analysis of trade payables presented based on the invoice date at the end of each reporting period:
As at 31 December2017 2016
S$ S$
Within 30 days 281,789 730,46031 days to 90 days 161,967 64,132Over 90 days 718,701 933,740
1,162,457 1,728,332
The credit period on purchases from suppliers is ranging from 7 to 60 days or payable upon delivery.
16. SHARE CAPITAL
The issued share capital as at 1 January 2016 represented the aggregate share capital of Nichefield, KT&T Engineers, Accenovate Engineering, Kanon Global, Accenovate Consulting and KT&T Global.
The issued share capital as at 31 December 2016 represented the share capital of Real Value comprising of ten shares with a par value of US$1 each.
On 14 February 2017, the Company was incorporated in the Cayman Islands with an authorised share capital of HK$380,000 divided into 38,000,000 shares with a par value of HK$0.01 each, of which one share was allotted and issued in nil paid form to the initial subscriber, an independent third party and the said share was subsequently transferred to Mighty One on the same date for nil consideration.
26
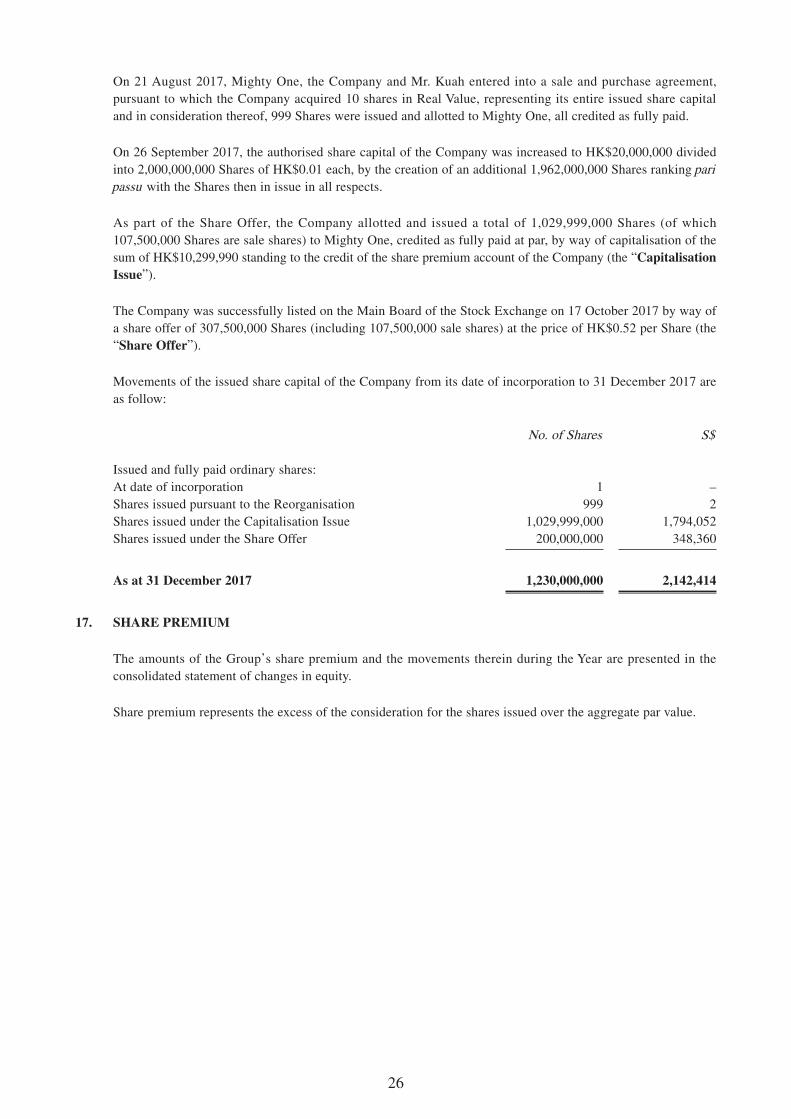
On 21 August 2017, Mighty One, the Company and Mr. Kuah entered into a sale and purchase agreement, pursuant to which the Company acquired 10 shares in Real Value, representing its entire issued share capital and in consideration thereof, 999 Shares were issued and allotted to Mighty One, all credited as fully paid.
On 26 September 2017, the authorised share capital of the Company was increased to HK$20,000,000 divided into 2,000,000,000 Shares of HK$0.01 each, by the creation of an additional 1,962,000,000 Shares ranking pari passu with the Shares then in issue in all respects.
As part of the Share Offer, the Company allotted and issued a total of 1,029,999,000 Shares (of which 107,500,000 Shares are sale shares) to Mighty One, credited as fully paid at par, by way of capitalisation of the sum of HK$10,299,990 standing to the credit of the share premium account of the Company (the “Capitalisation Issue”).
The Company was successfully listed on the Main Board of the Stock Exchange on 17 October 2017 by way of a share offer of 307,500,000 Shares (including 107,500,000 sale shares) at the price of HK$0.52 per Share (the “Share Offer”).
Movements of the issued share capital of the Company from its date of incorporation to 31 December 2017 are as follow:
No. of Shares S$
Issued and fully paid ordinary shares:At date of incorporation 1 –Shares issued pursuant to the Reorganisation 999 2Shares issued under the Capitalisation Issue 1,029,999,000 1,794,052Shares issued under the Share Offer 200,000,000 348,360
As at 31 December 2017 1,230,000,000 2,142,414
17. SHARE PREMIUM
The amounts of the Group’s share premium and the movements therein during the Year are presented in the consolidated statement of changes in equity.
Share premium represents the excess of the consideration for the shares issued over the aggregate par value.
27
SIGNIFICANT EVENTS AFTER FY2017
Change of compliance adviser
Dakin Capital Limited (“Dakin”) has resigned as the compliance adviser of the Company with effect from 1 February 2018 due to the change in personnel of Dakin. Grande Capital Limited has been appointed as the new compliance adviser to the Company pursuant to Rule 3A.27 of the Listing Rules with effect from 1 February 2018. For further details, please refer to the announcement of the Company dated 31 January 2018.
The Directors confirm that save as disclosed above, no other significant event that affected the Group has occurred after 31 December 2017 and up to the date of this announcement.
PURCHASE, SALE OR REDEMPTION OF THE COMPANY’S LISTED SECURITIES
During the period from the Listing Date to 31 December 2017 and thereafter up to the date of this announcement (the “Period”), neither the Company nor any of its subsidiaries purchased, sold or redeemed any listed securities of the Company.
SECURITIES TRANSACTIONS BY DIRECTORS
The Company has adopted the Model Code for Securities Transactions by Directors of Listed Issuers (the “Model Code”) as set out in Appendix 10 to the Listing Rules as its own code of conduct governing Directors’ securities transactions (the “Own Code of Conduct”). In response to a specific enquiry made by the Company on each of the Directors, all Directors have confirmed that they had complied with the required standards as set out in the Model Code and the Own Code of Conduct throughout the Period. The Model Code also applies to other specified senior management of the Group in respect of their dealings in the Company’s securities.
COMPLIANCE WITH CORPORATE GOVERNANCE CODE
During the Period, the Company has applied the principles and adopted all code provisions, where applicable, of the Corporate Governance Code as contained in Appendix 14 to the Listing Rules (the “CG Code”) as its own code of corporate governance.
The Company has complied with all applicable code provisions as set out in the CG Code during the Period save as disclosed below:
28
Code provision A.2.1 of the CG Code stipulates that the roles of chairman and chief executive should be separate and should not be performed by the same individual. Mr. Kuah currently holds both positions. Mr. Kuah has been managing the Group’s business and overall financial and strategic planning since May 2006. This arrangement also helps the Company to execute business strategies more efficiently in the ordinary business activities. All the other Directors (including the independent non-executive Directors (the “INEDs”)) consider that the vesting of the roles of the Chairman and the Chief Executive Officer in Mr. Kuah is beneficial to the business operations and management of the Group and will provide a strong and consistent leadership to the Group. In addition, due to the fact that three INEDs represent over half of the Board members, all the Directors (including the INEDs) consider that there is a balance of power and authority such that no one individual has unfettered power of decision. The Board will review the management structure from time to time and the need to separate the roles of the chairman of the Board and the chief executive to two individuals.
As the Company was sourcing and waiting for various quotations for Directors’ liabilities insurance after Listing, insurance cover in respect of legal actions against the Directors was not in place during the period from the Listing Date to 31 December 2017. In addition, as there were regular and timely communications among the Directors and the senior management of the Group, the Board was of the opinion that sound and effective corporate governance within the Group would suffice in monitoring and mitigating legal and compliance risks. Proper insurance coverage in respect of legal actions against the Directors’ liabilities has been arranged by the Company since 12 February 2018 and accordingly, the Company has complied with code provision A.1.8 of the CG Code.
Code provision C.1.2 of the CG Code stipulates that management should provide all members of the Board with monthly updates giving a balanced and understandable assessment of the Group’s performance, position and prospects in sufficient detail to enable the Board as a whole and each Director to discharge their duties under Rule 3.08 and Chapter 13 of the Listing Rules. The Board noted that relevant updates of the Group had been provided to the Directors on a quarterly basis rather than on a monthly basis. Though the Directors have full access to the Group’s information upon request, the Company has put in place policies to provide monthly updates to all its Directors from December 2017 and regarded that it has complied with code provision C.1.2 of the CG Code since then.
REVIEW BY AUDIT COMMITTEE
The audit committee of the Company (the “Audit Commitee”) was established on 26 September 2017 with written terms of reference in compliance with Rule 3.22 of the Listing Rules and code provision C.3 of the CG Code. The primary duties of the Audit Committee are, among other things, to make recommendations to the Board on the appointment, re-appointment and removal of external auditors and to review and monitor the financial reporting process, risk management and internal control systems of the Group. The Audit Committee currently comprises all the three INEDs, namely Mr. Ong Shen Chieh (also known as Mr. Wang Shengjie), Mr. Lau Kwok Fai Patrick and Mr. Lam Raymond Shiu Cheung. Mr. Lau Kwok Fai Partick is the chairman of the Audit Committee.
29
The Audit Committee has reviewed the audited Consolidated Financial Statements and is of the view that such statements have been prepared in compliance with the applicable accounting standards, the Listing Rules and other applicable legal requirements, and that adequate disclosure has been made.
Scope of work of auditors
The figures in respect of the preliminary announcement of the Group’s results for the Year have been compared by the Group’s auditors, Deloitte & Touche LLP (“Deloitte”), to the amounts set out in the Group’s audited consolidated financial statements for the Year and the amounts were found to be in agreement. The work performed by Deloitte in this respect was limited and did not constitute an audit, review or other assurance engagement and consequently no assurance has been expressed by Deloitte on this announcement.
SUFFICIENCY OF PUBLIC FLOAT
Based on the information that is publicly available to the Company and within the knowledge of the Directors as at the date of this announcement, the Directors confirmed that the Company has maintained a sufficient amount of public float for its Shares as required under the Listing Rules throughout the Period.
PUBLICATION OF ANNUAL REPORT
The annual report of the Company for the Year containing all information required by the Listing Rules will be despatched to the Shareholders and available on the Company’s website at www.kttgroup.com.sg and the Stock Exchange’s website at www.hkexnews.hk in due course.
APPRECIATION
The Board would like to express its gratitude to all the Group’s customers, management and staff and business partners as well as the Shareholders for their continuous support.
By order of the Board Kakiko Group Limited
Kuah Ann Thia Chairman, Executive Director and Chief Executive Officer
Singapore, 27 March 2018
As at the date of this announcement, the executive Directors are Mr. Kuah Ann Thia (Chairman and Chief Executive Officer) and Ms. Dolly Hwa Ai Kim (also known as Ms. Dolly Ke Aijin); and the independent non-executive Directors are Mr. Ong Shen Chieh (also known as Mr. Wang Shengjie), Mr. Lau Kwok Fai Patrick and Mr. Lam Raymond Shiu Cheung.