annual 2017 - andromeda metals · annual report 2017 3 andromeda metals limited is an australian...
TRANSCRIPT

A N N U A LR E P O R T
2017

DIRECTORSColin G Jackson Non-Executive Chairman Chris Drown Managing Director Nick Harding Executive Director and Company Secretary Jonathan Buckley Non-Executive Director
REGISTERED AND PRINCIPAL OFFICE69 King William Road Unley, South Australia 5061
CONTACT DETAILSTelephone: +61 8 8271 0600 Facsimile: +61 8 8271 0033 Postal: PO Box 1210 Unley BC SA 5061 [email protected] www.andromet.com.au
SHARE REGISTRYComputershare Investor Services Pty Ltd Level 5, 115 Grenfell Street Adelaide, South Australia 5000 GPO Box 1903, Adelaide SA 5000 Enquiries (within Australia): 1300 556 161 Enquiries (outside Australia): +61 3 9415 4000
AUDITORSDeloitte Touche Tohmatsu 11 Waymouth Street Adelaide, South Australia 5000
SOLICITORSMinter Ellison Lawyers 25 Grenfell Street Adelaide, South Australia 5000
BANKERSWestpac Banking Corporation 155 Unley Road Unley, South Australia 5061
STOCK EXCHANGE LISTINGAustralian Securities Exchange Limited ASX code: ADN
ABN/ACN75 061 503 375 / 061 503 375
Company information
Front cover photo: Drilling at the Baggy Green gold resource, November 2016
2 ANDROMEDA METALS LIMITED

ANNUAL REPORT 2017 3
Andromeda Metals Limited is an Australian Securities Exchange listed minerals exploration company based in Adelaide, South Australia. The Company’s name changed from Adelaide Resources to Andromeda Metals on 1 January 2017.
The Company’s Board of Directors comprises a team of four individuals with years of experience in the minerals industry, and with a strongly complementary range of technical, financial, managerial and directorship skills.
The Chairman, Colin Jackson, is a metallurgist with substantial global financial market experience. Colin previously held non-executive directorships with Terramin Australia, Intrepid Mines Limited and Red 5 Limited. During his tenure he guided the financing and development of the Paulsens gold mine in WA, the Angas zinc mine in SA, and the Siana gold mine in the Philippines.
Managing Director, Chris Drown is an exploration geologist with over 30 years resources industry experience. He has searched for minerals predominantly in the terrains in which the Company’s main exploration assets are located, and has played a key role in the various mineral discoveries made by the Company.
Executive Director Nick Harding, who also acts as Company Secretary and Chief Financial Officer, is an accountant with 30 years’ experience. He has previously held senior financial roles with WMC Resources Limited, Normandy Mining Limited and then Newmont Australia.
Non-Executive Director Jonathan Buckley holds an economics degree and is a corporate executive with extensive commercial and corporate finance experience spanning over 25 years in Australia and the United Kingdom.
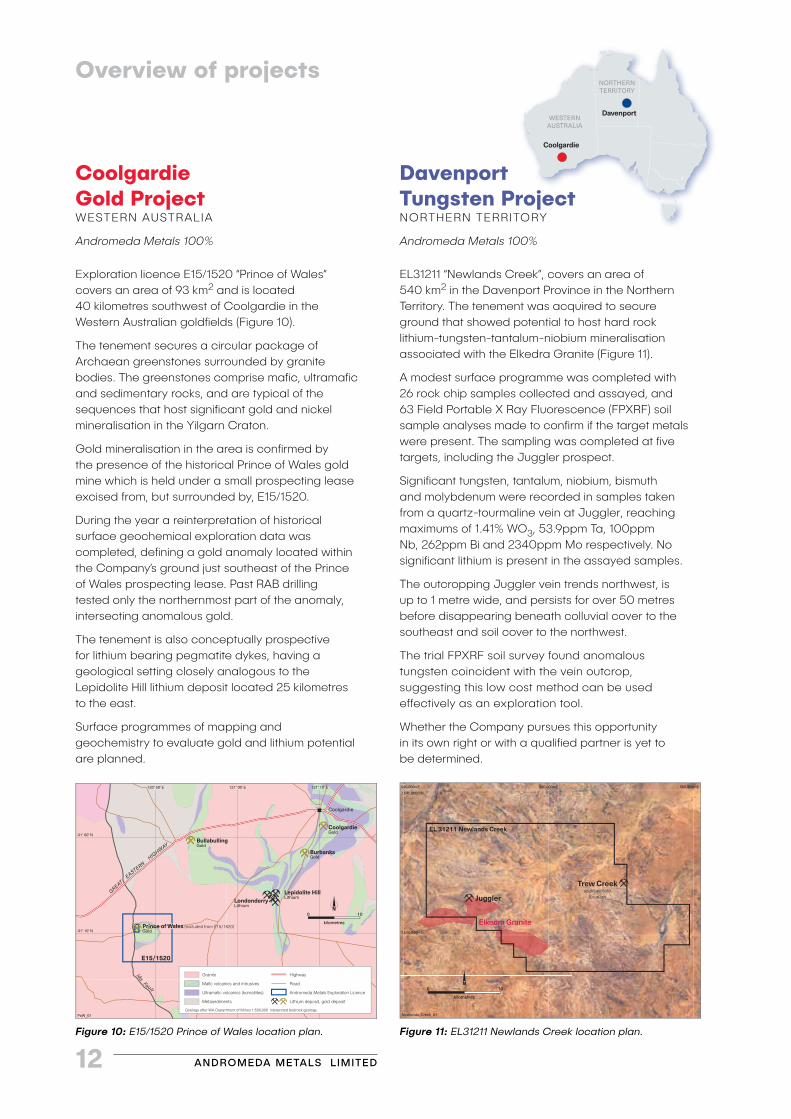
Since its public listing in 1996, the Company’s exploration projects have been located in South Australia, the Northern Territory, Queensland and Western Australia. The Company focuses its efforts on the discovery of gold deposits, complemented by exploration for copper and other metals.
Andromeda Metals’ vision is to be a sustainable minerals exploration company providing shareholders with risk managed discovery, development and mining opportunities.
Profile Contents
GoldEYRE PENINSULA Copper Gold
MOONTA
Copper GoldROVER
GoldDRUMMOND
2 Company information
3 Profile
4 Chairman's message
5 Managing Director's review
6 Overview of projects
6 Eyre Peninsula gold project
8 Drummond epithermal gold project
9 Thurlga Joint Venture
10 Moonta copper gold project
11 Rover copper gold project
12 Coolgardie gold project
12 Davenport tungsten project
13 Schedule of tenements
14 Corporate governance
14 Competent person and JORC 2012 compliance statements
15 Statutory reports
15 Directors' report
27 Auditor's independence declaration
28 Consolidated statement of profit or loss and other comprehensive income
29 Consolidated statement of financial position
30 Consolidated statement of changes in equity
31 Consolidated statement of cash flows
32 Notes to the financial statements
51 Directors' declaration
52 Independent audit report
54 Investor information
55 Additional shareholder information
ANDROMEDA METALS LIMITED4
Chairman's message
Colin G Jackson Chairman
The past twelve months have been demanding and ultimately disappointing for management and shareholders alike.
In the prior twelve months, the Company operated a concentrated exploration programme on the two gold properties – the 100% owned Eyre Peninsula and Queensland Drummond Basin tenements. Sensing that funding again would dictate the extent of our activities, the board resolved to nominate the number one priority as advancement of the Wudinna Gold Camp on the Eyre Peninsula to Resource status.
This was achieved when further drilling intersected the highest grades recorded to date and an independent assessment resulted in a 200,000 ounce gold Mineral Resource, estimated in compliance with the JORC guidelines. The Company was further rewarded with some of the very best gold recoveries achieved using a standard gravity and leach metallurgical flowsheet.
These results, together with the associated logistical advantages of a location like Wudinna, and a positively disposed landowner, led to an unsolicited approach to partner development from an unlisted entity with near term gold producer status. Whilst partnering our best property was not on our original agenda, the Company’s financial position and the potential introduction of a well-known earth moving contractor onto the entity’s shareholder base encouraged active discussion.
In the end the entity’s original business did not progress. The involvement of the earthmover did however prompt a first order mining study to be completed. This study showed a positive return but also recognised that additional inventory would be beneficial. A totally separate approach to purchase the property was also received but this reflected the Company’s financial position rather than the intrinsic value of the tenements.
The Company was successful in a funding application from the South Australian Plan for Accelerating Exploration (PACE) initiative to advance the Eyre Peninsula gold project. However, with limited treasury funds the Company was only able to take advantage of a minor amount of the $200,000 matching grant.
The second priority for the Company was to sell or joint venture the Moonta copper project with the aim of either generating cash to direct towards Eyre Peninsula or at the very least to retain an equity position whilst the cost of retaining and advancing the property was met by others.
Active discussions, which included site visits, detailed due diligence, laboratory test work and in one case, the drafting of extensive final legal documentation, continued with several parties throughout the year, demanding much of management’s time. But all to no avail - despite the participation of a merger and acquisition specialist and a rising copper price. The Company continues to seek expressions of interest based on the concept of in-situ recovery technology.
No new field exploration activity was undertaken at Drummond, on the basis of it being higher risk than Eyre Peninsula in the context of limited treasury funds, whilst joint venture partners were responsible for advancing the Rover and Thurgla projects.
Corporate overheads were again reviewed to direct the maximum percentage of available funds to in-ground activity. Personnel numbers were reduced again as were salary levels with non-executive directors deferring all fees until such time as the Company finances are stronger and executive directors deferring 30% of their already reduced fees. At 30 June 2017, these deferred fees amounted to nearly $70,000 and at the date of this report slightly in excess of $100,000. Of course, during difficult times, the hours dedicated to resolving the Company’s circumstances far exceed the norm. The tenement portfolio was again refined with properties dropped, applications withdrawn or in some cases ground surrendered to reduce the rentals.
On behalf of eligible shareholders the Company successfully participated for the second time in the Federal Government Exploration Development Incentive Scheme. This Scheme allows junior exploration companies with no taxable income to apply for a tax credit on green fields mineral exploration costs conducted in Australia. All of the eligible costs were recognised to deliver a total $189,761 in tax credits to Australian resident shareholders for the 2016/17 financial year, bringing total credits achieved to nearly $570,000.
My appreciation goes to our executive team who have unselfishly committed time and energy well in excess of normal expectations in an effort to reach a position where the business is on a more sustainable financial footing. Success or failure, which might see significant changes, is in the balance. Exploration is a high risk business with success blessed on few.

ANNUAL REPORT 2017 5
Managing Director's review
In my review in last year’s Annual Report, I welcomed what appeared at the time to be a positive change in sentiment for junior ASX listed exploration companies such as Andromeda Metals. My optimism was perhaps premature as evidenced by the performance of the S&P Small Resources Index which rose only a modest 2.3% from a level of 1,936 at the start of the year to 1,981 on 30 June 2017.
The market conditions have again proved challenging for Andromeda Metals. Efforts to raise sufficient capital to progress our exploration assets at a pace both Shareholders and Directors would wish to see achieved have fallen short of our goals. Despite the difficult funding environment, the Company maintained a commitment to use investor's funds as intended by continuing to explore, while further tightening the administrative spend. I am pleased that these efforts resulted in Company plus joint venture exploration spending being approximately double the administrative spend over the year.
While FY16-17 was flat, the S&P Small Resources Index has appreciated over 18% since 30 June to late September 2017, and coupled with increased IPO and secondary capital raising activity in our sector, gives us hope that the halting recovery in exploration is once again gathering pace.
The A$ price of Andromeda Metals’ main target commodity, gold, fell around 7% over FY16-17. However, gold remains at an historically high price and companies producing or exploring for gold have enjoyed increased market interest over the year.
During the year Andromeda Metals’ announced maiden Mineral Resources for the Barns, Baggy Green and White Tank gold deposits, all located in the Wudinna Gold Camp on the Eyre Peninsula. The consolidated resource position of 200,000 ounces represents an excellent platform from which to further grow resources and move towards mine development.
Metallurgical testwork on Barns and Baggy Green material was also completed, confirming exceptional gold recoveries averaging over 97% can be achieved using a conventional flowsheet.
The Board determined to direct limited funds to the Eyre Peninsula during the year and consequently no progress was made on the Drummond project in Queensland. The gold prospects at Drummond remain worthy drill targets and we remain committed to testing them when finances allow.
The price of copper, another commodity of interest to Andromeda Metals, finished the year at A$7,650, rising over 18% during FY16-17 and erasing falls seen in the previous two years.
Efforts to attract third party investment to the Moonta copper project in South Australia continue. After year end we recognised the potential to extract copper at two of the project deposits using in-situ recovery (ISR) methods, with early work indicating that many of the technical attributes critical to ISR appear to be present. We also confirmed that cobalt at potentially economic levels is present at a number of the Moonta prospects. Cobalt’s price has increased by around 140% over FY16-17 as its demand for use as a “battery” metal increased.
At Rover in the Northern Territory copper-gold-cobalt mineralisation of Tennant Creek style occurs below barren sedimentary cover. A farm-in and joint venture was formed to explore Rover with Emmerson Resources in 2016, however after year end Emmerson prematurely withdrew from the deal. The Company is now looking for alternative third party funding for the project.
A drilling programme completed by the Thurlga Joint Venture on the Eyre Peninsula, made a potentially significant graphite discovery with wide, high grade graphic units intersected.
The Company relinquished lithium focussed licence applications over salt lakes in South Australia, but progressed to grant hard rock focussed applications in the Northern Territory and Western Australia. These tenements are also prospective for other metals including tungsten (NT) and gold (WA).
STRATEGYTo achieve the goal of growing shareholder wealth, Andromeda Metals’ directors have formulated a Company strategy comprising the following key elements:
– The Company will maintain a focus on gold exploration, with copper a secondary target commodity. Directors believe the outlook for these metals remains positive, and consider these are commodities well suited to Andromeda Metals capability and expertise. The principal focus for the 2016/17 financial year has been to advance the Wudinna Gold Camp on the Eyre Peninsula towards mine development.
– The Company’s Board believes it is in shareholders’ best interests to retain maximum equity in its tier one projects and consequently seeks to self-fund exploration programmes on these projects when equity markets allow. The Board will contemplate third party investment in a tier one project if it believes the consequent loss of shareholder equity is more than compensated by increased financial certainty and the project de-risking that may accrue.
– The Company will pursue opportunities which have potential to unlock value in its other mineral assets, and will maintain an active lookout for quality new projects in Australia and a watching brief overseas.
– The Company will adhere to principles of good corporate governance, caring for its employees, conducting its operations in an environmentally sensitive manner, and maintaining respect for other stakeholders and for the communities in which it operates.
Chris Drown Managing Director

ANDROMEDA METALS LIMITED6
Overview of projects
The Eyre Peninsula Gold Project comprises six wholly owned tenements that total 2,052 km2 in area (Figure 1). The licences fall in the Central Gawler Gold Province, an arcuate geological belt that is prospective for gold and other metals. WPG Resources Limited’s Tarcoola gold mine, which commenced production in November 2016, also falls in the Central Gawler Gold Province.
The Eyre Peninsula Project includes the wholly owned Wudinna Gold Camp, a cluster of prospects including the Barns, Baggy Green and White Tank deposits located about 20 kilometres north of the township of Wudinna. Work completed during the year has been aligned with the goal of advancing the Wudinna Gold Camp into mine production.
In July 2016 the Company released a maiden Mineral Resource for the Barns deposit. The resource was estimated in accordance with the requirements of the JORC Code 2012, and completed with the assistance of independent consulting group Mining Plus Pty Ltd.
The Barns Mineral Resource estimate totals 2.11 million tonnes at 1.6g/t gold for 107,000 ounces at a 0.5g/t gold cut-off grade. The Resource is classified into 380,000 tonnes of Indicated and 1,730,000 tonnes of Inferred Resources.
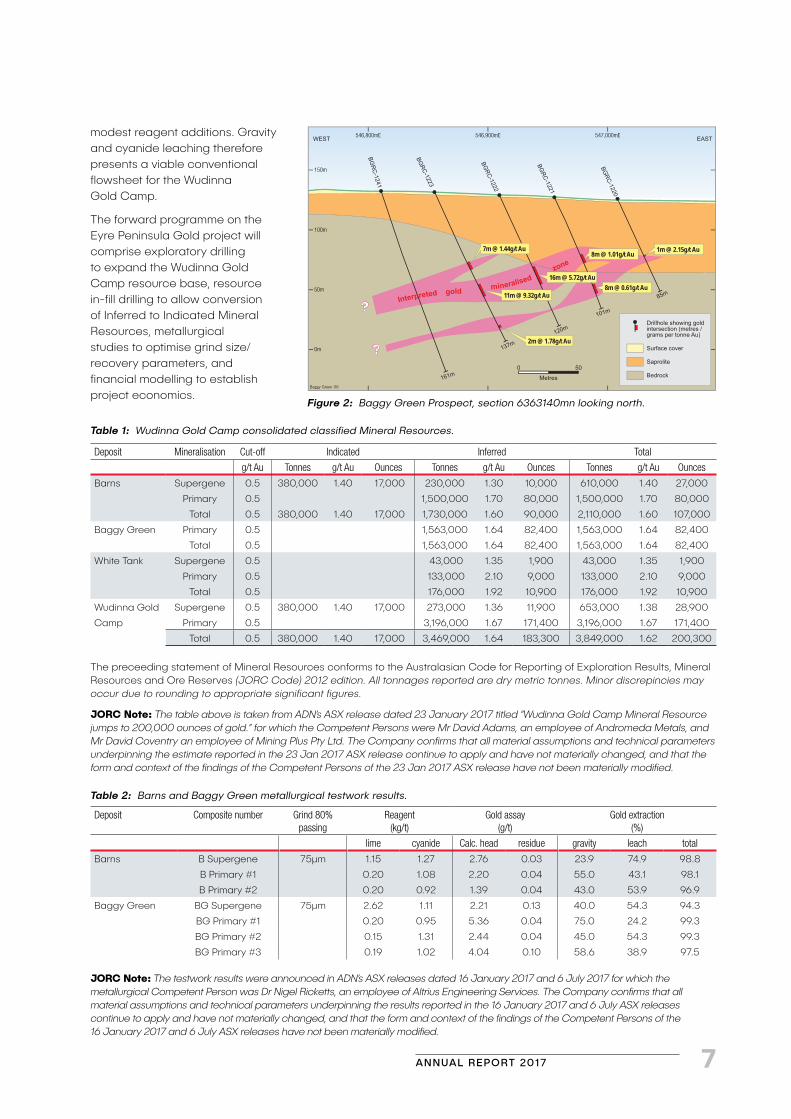
A reverse circulation drilling programme totalling 23 holes for 2,515 metres was undertaken at the Baggy Green prospect, located only 5.5 kilometres southeast of Barns, with the goal of defining shallow mineralisation that could materially add to the 107,000 ounce Barns resource. Analysis of the drill samples confirmed the presence of shallow high grade gold with adjacent 50 metre spaced holes BGRC-1222 and BGRC-1223 respectively recording 16 metres at 5.72g/t gold and 11 metres at 9.32g/t gold, the best gold intersections to date (Figure 2).
In January 2017, Mineral Resource estimations, again completed with the assistance of Mining Plus Pty Ltd, where completed for the Baggy Green deposit, and also for the White Tank deposit which is located 1 kilometre south of the Barns resource.
The Baggy Green Mineral Resource estimate totals 1.56 million tonnes at 1.64g/t gold for 82,400 ounces at a 0.5g/t gold cut-off grade. The White Tank Mineral Resource estimate totals 0.176 million tonnes at 1.92g/t gold for 10,900 ounces at a 0.5g/t gold cut-off grade. Both Resources are classified as Inferred.
Eyre Peninsula Gold ProjectSOUTH AUSTRALIA
Andromeda Metals 100%
Figure 1: Eyre Peninsula Gold Project location.
The consolidated Wudinna Gold Camp Mineral Resource, including the Baggy Green, White Tank and Barns gold deposits, therefore totals 3.84 million tonnes at 1.62g/t gold for 200,300 ounces using a 0.5g/t gold cut-off grade, comprised of 0.38 million tonnes at 1.40g/t gold for 17,000 ounces of Indicated Resource and 3.469 million tonnes at 1.64g/t gold for 183,300 ounces of Inferred Resources (Table 1).
All three of the deposits remain open down-dip and Baggy Green in particular presents excellent along strike targets. Additionally other nearby exploration targets and opportunities that can also deliver additional resources with exploration success were confirmed.
Metallurgical testing was conducted on composited samples from the Barns and Baggy Green deposits, with the composites representing both primary and oxide/supergene mineralised material.
At Barns gravity and cyanide leaching of the gravity concentrate and tailings recovered 98.8% of the gold in a supergene sample, and an average of 97.5% of the gold in primary samples. At Baggy Green recovery in a supergene sample was 94.3%, while recoveries for primary samples averaged 98.7% (Table 2). These outstanding gold recoveries were achieved with
SOUTHAUSTRALIA
550,000mE 600,000mE
kilometres
0 25
Eyre_01
Paris SilverDeposit
Baggy Green
Barns/White Tank
Wudinna
6,350,000mN
Wudinna Gold Camp
Kimba
Adelaide
Eyre Peninsula Project
SOUTH AUSTRALIA
Andromeda Metals Exploration Licence
Thurlga Joint Venture (with Investigator Resources Ltd)
Figure 1: Eyre Peninsula project location plan.
ANNUAL REPORT 2017 7
Figure 2: Baggy Green Prospect, section 6363140mn looking north.
150m
546,800mE 546,900mE 547,000mE
100m
50m
0m
0 50
Metres
7m @ 1.44g/t Au 1m @ 2.15g/t Au
8m @ 0.61g/t Au
8m @ 1.01g/t Au
16m @ 5.72g/t Au
11m @ 9.32g/t Au
2m @ 1.78g/t Au
Figure 6: Baggy Green Prospect, Section 6363140mN looking north.Baggy Green 06
WEST EAST
BGRC-1223
BGR
C-1241
BGRC-1222
BGRC-1221
BGRC-1220
137m
161m
120m
101m
85m
?
?
Interpreted gold mineralised zone
Drillhole showing gold intersection (metres / grams per tonne Au)
Surface cover
Saprolite
Bedrock
Table 2: Barns and Baggy Green metallurgical testwork results.
Deposit Composite number Grind 80% passing
Reagent(kg/t)
Gold assay (g/t)
Gold extraction (%)
lime cyanide Calc. head residue gravity leach total
Barns B Supergene 75µm 1.15 1.27 2.76 0.03 23.9 74.9 98.8
B Primary #1 0.20 1.08 2.20 0.04 55.0 43.1 98.1
B Primary #2 0.20 0.92 1.39 0.04 43.0 53.9 96.9
Baggy Green BG Supergene 75µm 2.62 1.11 2.21 0.13 40.0 54.3 94.3
BG Primary #1 0.20 0.95 5.36 0.04 75.0 24.2 99.3
BG Primary #2 0.15 1.31 2.44 0.04 45.0 54.3 99.3
BG Primary #3 0.19 1.02 4.04 0.10 58.6 38.9 97.5
JORC Note: The testwork results were announced in ADN’s ASX releases dated 16 January 2017 and 6 July 2017 for which the metallurgical Competent Person was Dr Nigel Ricketts, an employee of Altrius Engineering Services. The Company confirms that all material assumptions and technical parameters underpinning the results reported in the 16 January 2017 and 6 July ASX releases continue to apply and have not materially changed, and that the form and context of the findings of the Competent Persons of the 16 January 2017 and 6 July ASX releases have not been materially modified.
Table 1: Wudinna Gold Camp consolidated classified Mineral Resources.
Deposit Mineralisation Cut-off Indicated Inferred Total
g/t Au Tonnes g/t Au Ounces Tonnes g/t Au Ounces Tonnes g/t Au Ounces
Barns Supergene 0.5 380,000 1.40 17,000 230,000 1.30 10,000 610,000 1.40 27,000
Primary 0.5 1,500,000 1.70 80,000 1,500,000 1.70 80,000
Total 0.5 380,000 1.40 17,000 1,730,000 1.60 90,000 2,110,000 1.60 107,000
Baggy Green Primary 0.5 1,563,000 1.64 82,400 1,563,000 1.64 82,400
Total 0.5 1,563,000 1.64 82,400 1,563,000 1.64 82,400
White Tank Supergene 0.5 43,000 1.35 1,900 43,000 1.35 1,900
Primary 0.5 133,000 2.10 9,000 133,000 2.10 9,000
Total 0.5 176,000 1.92 10,900 176,000 1.92 10,900
Wudinna Gold Supergene 0.5 380,000 1.40 17,000 273,000 1.36 11,900 653,000 1.38 28,900
Camp Primary 0.5 3,196,000 1.67 171,400 3,196,000 1.67 171,400
Total 0.5 380,000 1.40 17,000 3,469,000 1.64 183,300 3,849,000 1.62 200,300
The preceeding statement of Mineral Resources conforms to the Australasian Code for Reporting of Exploration Results, Mineral Resources and Ore Reserves (JORC Code) 2012 edition. All tonnages reported are dry metric tonnes. Minor discrepincies may occur due to rounding to appropriate significant figures.
JORC Note: The table above is taken from ADN’s ASX release dated 23 January 2017 titled “Wudinna Gold Camp Mineral Resource jumps to 200,000 ounces of gold.” for which the Competent Persons were Mr David Adams, an employee of Andromeda Metals, and Mr David Coventry an employee of Mining Plus Pty Ltd. The Company confirms that all material assumptions and technical parameters underpinning the estimate reported in the 23 Jan 2017 ASX release continue to apply and have not materially changed, and that the form and context of the findings of the Competent Persons of the 23 Jan 2017 ASX release have not been materially modified.
modest reagent additions. Gravity and cyanide leaching therefore presents a viable conventional flowsheet for the Wudinna Gold Camp.
The forward programme on the Eyre Peninsula Gold project will comprise exploratory drilling to expand the Wudinna Gold Camp resource base, resource in-fill drilling to allow conversion of Inferred to Indicated Mineral Resources, metallurgical studies to optimise grind size/recovery parameters, and financial modelling to establish project economics.
ANDROMEDA METALS LIMITED8
QUEENSLAND
Drummond Epithermal Gold ProjectQUEENSLAND
Andromeda Metals 100%.
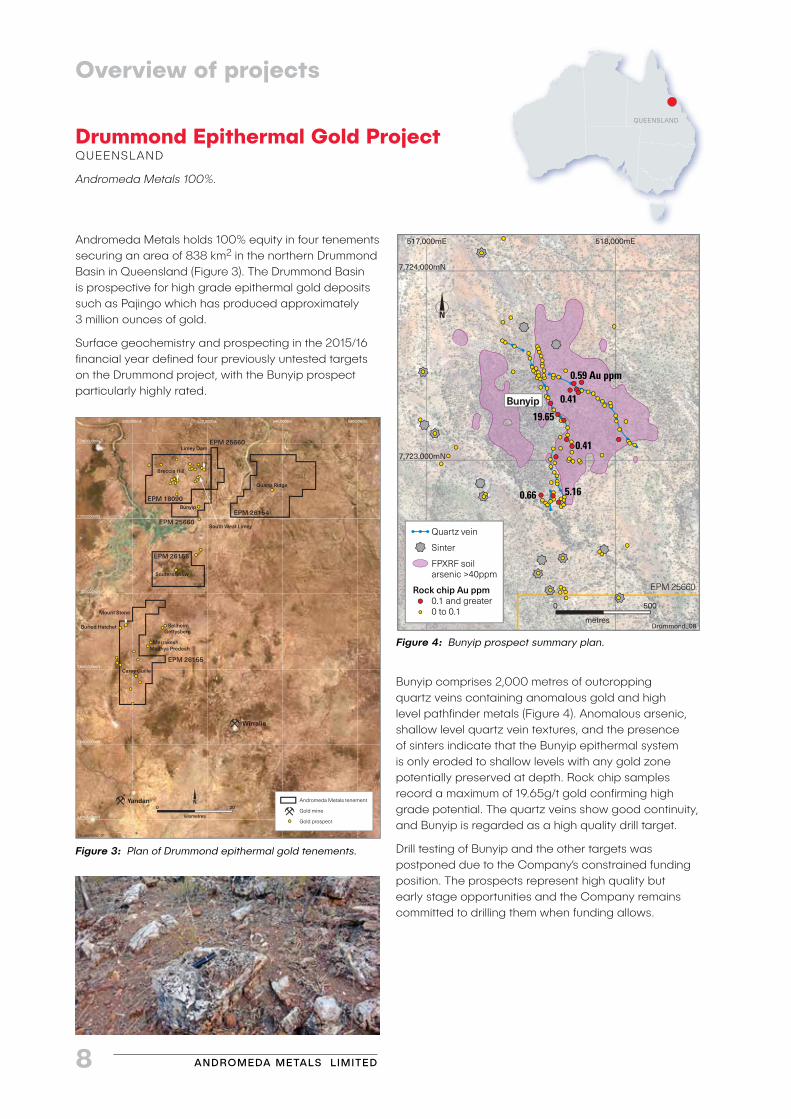
Andromeda Metals holds 100% equity in four tenements securing an area of 838 km2 in the northern Drummond Basin in Queensland (Figure 3). The Drummond Basin is prospective for high grade epithermal gold deposits such as Pajingo which has produced approximately 3 million ounces of gold.
Surface geochemistry and prospecting in the 2015/16 financial year defined four previously untested targets on the Drummond project, with the Bunyip prospect particularly highly rated.
7,740,000mN
500,000mE 520,000mE 540,000mE 560,000mE
7,720,000mN
7,700,000mN
7,680,000mN
7,660,000mN
7,640,000mN kilometres
0 20Yandan
Wirralie
EPM 18090
EPM 25660
EPM 25660
EPM 26154
EPM 26155
EPM 26155
Drummond_01
South West Limey
Quartz Ridge
Souters Show
Buried Hatchet
Bunyip
Mount Stone
Carey Guille
Limey Dam
Breccia Hill
Gettysberg
MarrakeshMadhya Predesh
Sellheim
Andromeda Metals tenement
Gold mine
Gold prospect
Figure 1: Plan of Drummond Epithermal Gold tenements.Figure 3: Plan of Drummond epithermal gold tenements.
Overview of projects
Figure 4: Bunyip prospect summary plan.
517,000mE 518,000mE
7,724,000mN
7,723,000mN
0.59 Au ppm
0.41
0.41
0.66 5.16
19.65
metres
0 500
EPM 25660
Drummond_08
Bunyip
Quartz vein
Sinter
FPXRF soil arsenic >40ppm
0.1 and greater0 to 0.1
Rock chip Au ppm
Bunyip comprises 2,000 metres of outcropping quartz veins containing anomalous gold and high level pathfinder metals (Figure 4). Anomalous arsenic, shallow level quartz vein textures, and the presence of sinters indicate that the Bunyip epithermal system is only eroded to shallow levels with any gold zone potentially preserved at depth. Rock chip samples record a maximum of 19.65g/t gold confirming high grade potential. The quartz veins show good continuity, and Bunyip is regarded as a high quality drill target.
Drill testing of Bunyip and the other targets was postponed due to the Company’s constrained funding position. The prospects represent high quality but early stage opportunities and the Company remains committed to drilling them when funding allows.

ANNUAL REPORT 2017 9
Figure 5: Conductivity imate (-80m depth-slice) from 2010 airborne RepTEM survey. Graphite occurrences in drilling and outcrop are coincident with conductive trends in the RepTEM survey.
Thurlga Joint VentureSOUTH AUSTRALIA
Andromeda Metals 25%, Investigator Resources 75%
The Thurlga Joint Venture with Investigator Resources Limited (IVR) is exploring a 333 km2 exploration licence adjacent to the Eyre Peninsula Gold Project tenements (Figure 5).
Soil sampling completed in 2016 defined a number of silver and base metal anomalous features, five of which were tested in a programme of aircore drilling totalling 20 holes for 1,076 metres. Anomalous silver and base metals were intersected at two targets.
More significantly, five holes drilled at the Ironstone prospect intersected substantial graphite mineralisation, with grades up to 16.5% TGC (total graphitic carbon) recorded in 3-metre composite samples. Hole TH17AC037B recorded 30 metres at 10.0% TGC, while TH17AC034 recorded 10 metres at 8.3% TGC.
An airborne RepTEM survey flown over the Thurlga tenement in 2010 reveals a series of linear conductive features that extend for 25 kilometres in aggregate strike length. The RepTEM conductors are coincident with the graphitic drill intersections and are likely to be sourced by the graphitic units.
Drilling completed to date indicates the graphitic formations are up to 500 metres wide and, should they extend along the 25 kilometres of strike indicated by the RepTEM conductors, the resource potential is very substantial.
IVR met its obligation to spend a total of $750,000 on exploration by 30 June 2017, and consequently has earned a 75% equity interest in the Joint Venture, with the Company retaining a 25% equity interest.
SOUTHAUSTRALIA
ANDROMEDA METALS LIMITED10
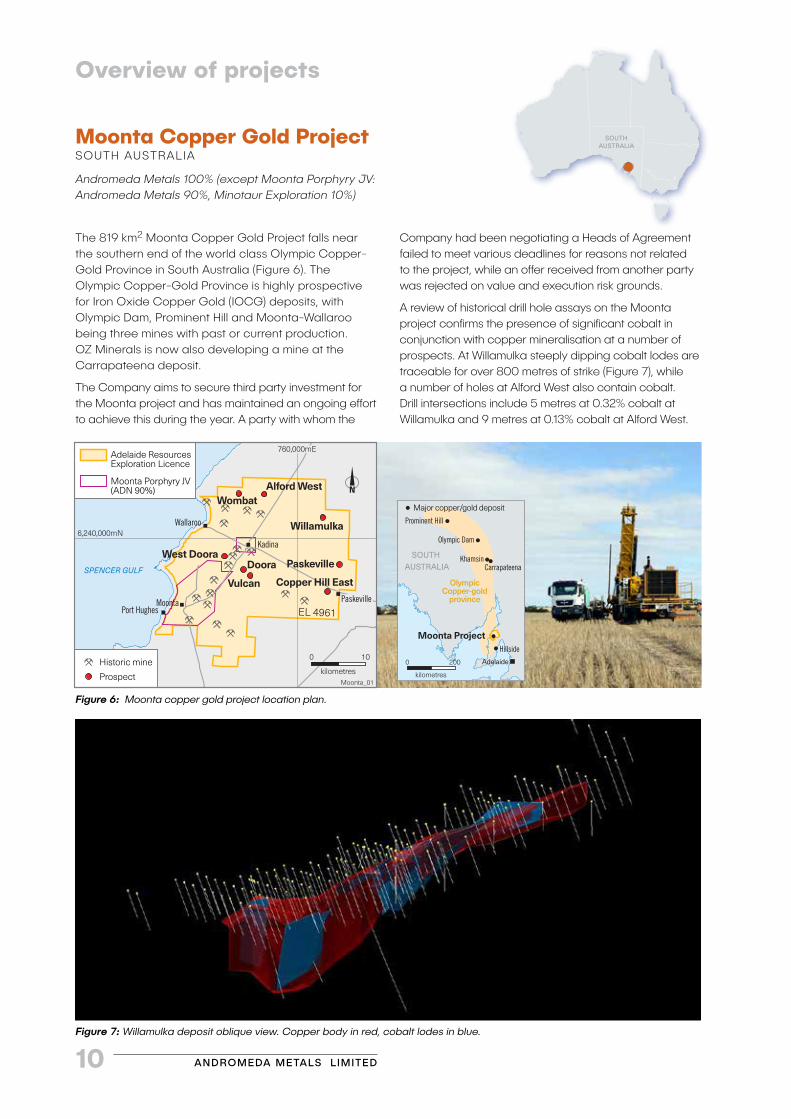
The 819 km2 Moonta Copper Gold Project falls near the southern end of the world class Olympic Copper-Gold Province in South Australia (Figure 6). The Olympic Copper-Gold Province is highly prospective for Iron Oxide Copper Gold (IOCG) deposits, with Olympic Dam, Prominent Hill and Moonta-Wallaroo being three mines with past or current production. OZ Minerals is now also developing a mine at the Carrapateena deposit.
The Company aims to secure third party investment for the Moonta project and has maintained an ongoing effort to achieve this during the year. A party with whom the
Moonta Copper Gold ProjectSOUTH AUSTRALIA
Andromeda Metals 100% (except Moonta Porphyry JV: Andromeda Metals 90%, Minotaur Exploration 10%)
Overview of projects
SOUTHAUSTRALIA
Figure 6: Moonta copper gold project location plan.
Figure 7: Willamulka deposit oblique view. Copper body in red, cobalt lodes in blue.
kilometres
0 200
Major copper/gold deposit
SOUTH AUSTRALIA
Prominent Hill
Olympic Dam
KhamsinCarrapateena
Moonta ProjectHillside
Adelaide
Olympic Copper-gold
province
Company had been negotiating a Heads of Agreement failed to meet various deadlines for reasons not related to the project, while an offer received from another party was rejected on value and execution risk grounds.
A review of historical drill hole assays on the Moonta project confirms the presence of significant cobalt in conjunction with copper mineralisation at a number of prospects. At Willamulka steeply dipping cobalt lodes are traceable for over 800 metres of strike (Figure 7), while a number of holes at Alford West also contain cobalt. Drill intersections include 5 metres at 0.32% cobalt at Willamulka and 9 metres at 0.13% cobalt at Alford West.
760,000mE
kilometres
0 10
Moonta_01
Alford WestWombat
Willamulka
Paskeville
Vulcan
DooraWest Doora
Copper Hill East
6,240,000mN
EL 4961
Kadina
Wallaroo
MoontaPort Hughes
Paskeville
Adelaide Resources Exploration Licence
Moonta Porphyry JV (ADN 90%)
Historic mine
Prospect
SPENCER GULF
ANNUAL REPORT 2017 11
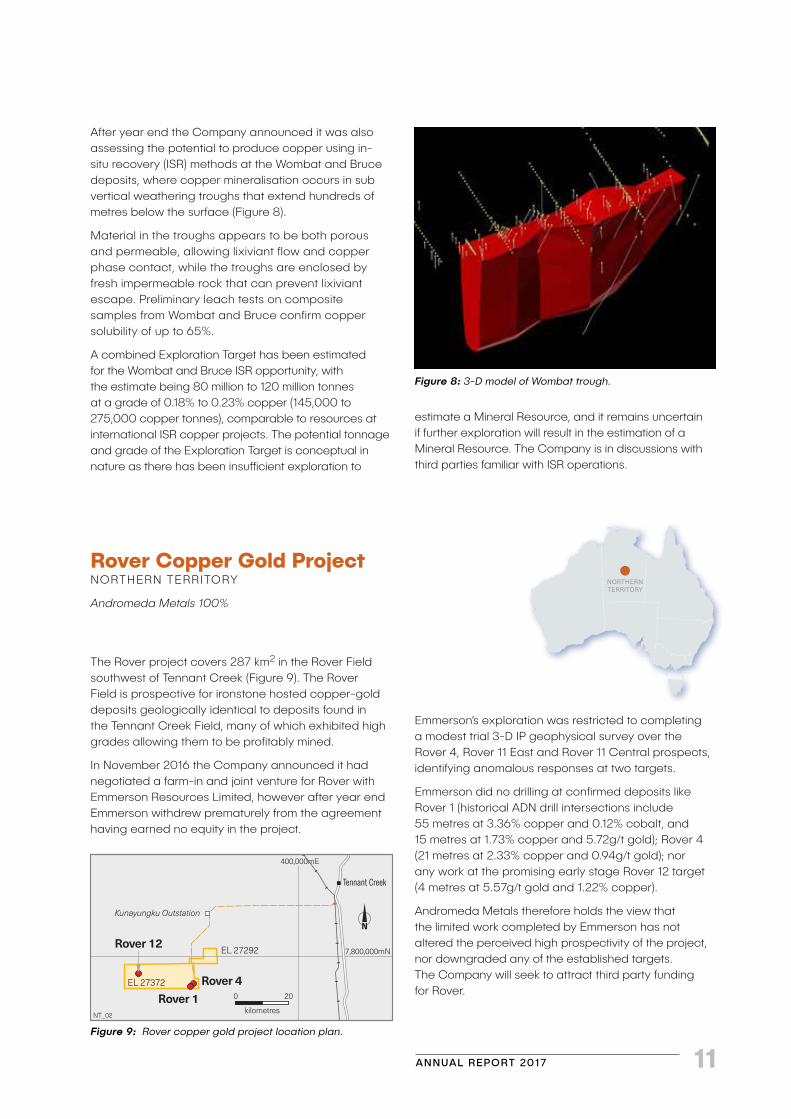
After year end the Company announced it was also assessing the potential to produce copper using in-situ recovery (ISR) methods at the Wombat and Bruce deposits, where copper mineralisation occurs in sub vertical weathering troughs that extend hundreds of metres below the surface (Figure 8).
Material in the troughs appears to be both porous and permeable, allowing lixiviant flow and copper phase contact, while the troughs are enclosed by fresh impermeable rock that can prevent lixiviant escape. Preliminary leach tests on composite samples from Wombat and Bruce confirm copper solubility of up to 65%.
A combined Exploration Target has been estimated for the Wombat and Bruce ISR opportunity, with the estimate being 80 million to 120 million tonnes at a grade of 0.18% to 0.23% copper (145,000 to 275,000 copper tonnes), comparable to resources at international ISR copper projects. The potential tonnage and grade of the Exploration Target is conceptual in nature as there has been insufficient exploration to
Figure 9: Rover copper gold project location plan.
Figure 8: 3-D model of Wombat trough.
The Rover project covers 287 km2 in the Rover Field southwest of Tennant Creek (Figure 9). The Rover Field is prospective for ironstone hosted copper-gold deposits geologically identical to deposits found in the Tennant Creek Field, many of which exhibited high grades allowing them to be profitably mined.
In November 2016 the Company announced it had negotiated a farm-in and joint venture for Rover with Emmerson Resources Limited, however after year end Emmerson withdrew prematurely from the agreement having earned no equity in the project.
Rover Copper Gold ProjectNORTHERN TERRITORY
Andromeda Metals 100%
Emmerson’s exploration was restricted to completing a modest trial 3-D IP geophysical survey over the Rover 4, Rover 11 East and Rover 11 Central prospects, identifying anomalous responses at two targets.
Emmerson did no drilling at confirmed deposits like Rover 1 (historical ADN drill intersections include 55 metres at 3.36% copper and 0.12% cobalt, and 15 metres at 1.73% copper and 5.72g/t gold); Rover 4 (21 metres at 2.33% copper and 0.94g/t gold); nor any work at the promising early stage Rover 12 target (4 metres at 5.57g/t gold and 1.22% copper).
Andromeda Metals therefore holds the view that the limited work completed by Emmerson has not altered the perceived high prospectivity of the project, nor downgraded any of the established targets. The Company will seek to attract third party funding for Rover.
estimate a Mineral Resource, and it remains uncertain if further exploration will result in the estimation of a Mineral Resource. The Company is in discussions with third parties familiar with ISR operations.
400,000mE
kilometres
0 20
NT_02
7,800,000mN
Tennant Creek
Kunayungku Outstation
Rover 4Rover 1
Rover 12EL 27292
EL 27372
NORTHERNTERRITORY
ANDROMEDA METALS LIMITED12
Exploration licence E15/1520 “Prince of Wales” covers an area of 93 km2 and is located 40 kilometres southwest of Coolgardie in the Western Australian goldfields (Figure 10).
The tenement secures a circular package of Archaean greenstones surrounded by granite bodies. The greenstones comprise mafic, ultramafic and sedimentary rocks, and are typical of the sequences that host significant gold and nickel mineralisation in the Yilgarn Craton.
Gold mineralisation in the area is confirmed by the presence of the historical Prince of Wales gold mine which is held under a small prospecting lease excised from, but surrounded by, E15/1520.
During the year a reinterpretation of historical surface geochemical exploration data was completed, defining a gold anomaly located within the Company’s ground just southeast of the Prince of Wales prospecting lease. Past RAB drilling tested only the northernmost part of the anomaly, intersecting anomalous gold.
The tenement is also conceptually prospective for lithium bearing pegmatite dykes, having a geological setting closely analogous to the Lepidolite Hill lithium deposit located 25 kilometres to the east.
Surface programmes of mapping and geochemistry to evaluate gold and lithium potential are planned.
Coolgardie Gold ProjectWESTERN AUSTRALIA
Andromeda Metals 100%
EL31211 “Newlands Creek”, covers an area of 540 km2 in the Davenport Province in the Northern Territory. The tenement was acquired to secure ground that showed potential to host hard rock lithium-tungsten-tantalum-niobium mineralisation associated with the Elkedra Granite (Figure 11).
A modest surface programme was completed with 26 rock chip samples collected and assayed, and 63 Field Portable X Ray Fluorescence (FPXRF) soil sample analyses made to confirm if the target metals were present. The sampling was completed at five targets, including the Juggler prospect.
Significant tungsten, tantalum, niobium, bismuth and molybdenum were recorded in samples taken from a quartz-tourmaline vein at Juggler, reaching maximums of 1.41% WO3, 53.9ppm Ta, 100ppm Nb, 262ppm Bi and 2340ppm Mo respectively. No significant lithium is present in the assayed samples.
The outcropping Juggler vein trends northwest, is up to 1 metre wide, and persists for over 50 metres before disappearing beneath colluvial cover to the southeast and soil cover to the northwest.
The trial FPXRF soil survey found anomalous tungsten coincident with the vein outcrop, suggesting this low cost method can be used effectively as an exploration tool.
Whether the Company pursues this opportunity in its own right or with a qualified partner is yet to be determined.
Davenport Tungsten ProjectNORTHERN TERRITORY
Andromeda Metals 100%
120° 50' E 121° 00' E 121° 10' E
-31° 00' N
-31° 10' N
kilometres
0 10
Lepidolite HillLithium
LondonderryLithium
E15/1520
PoW_01
Coolgardie
Prince of Wales (excluded from E15/1520)Gold
BullabullingGold
BurbanksGold
CoolgardieGold
Ida Fault
GREAT EASTERN
HIGHWAY
Figure 1: E15/1520 - Prince of Wales location plan.
Granite
Mafic volcanics and intrusives
Ultramafic volcanics (komatiites)
Metasediments
Highway
Road
Andromeda Metals Exploration Licence
Lithium deposit, gold deposit
Geology after WA Department of Mines 1:500,000 interpreted bedrock geology.
Figure 10: E15/1520 Prince of Wales location plan. Figure 11: EL31211 Newlands Creek location plan.
540,000mE 560,000mE 580,000mE
7,640,000mN
7,620,000mN
kilometres
0 10
EL 31211 Newlands Creek
Newlands_Creek_01
Trew CreekapproximatelocationJuggler
Elkedra Granite
Overview of projects
Coolgardie
WESTERNAUSTRALIA
NORTHERNTERRITORY
Davenport

ANNUAL REPORT 2017 13
Schedule of tenementsAS AT 30 JUNE 2017
Tenement Tenement Name
Area (km2)
Registered Holder or Applicant
Nature of Company’s Interest (%)
South Australia
Eyre Peninsula Gold Project
EL 5381 Pinkawillinie 186 Peninsula Resources Ltd1 100%
EL 5120 Corrobinnie 1397 Peninsula Resources Ltd 100%
EL 5615 Wudinna Hill 42 Peninsula Resources Ltd 100%
EL 5953 Minnipa 184 Peninsula Resources Ltd 100%
ELA 2016/00160 Waddikee Rocks 147 Peninsula Resources Ltd 100%
EL 5350 Acraman 96 Peninsula Resources Ltd 100%
Thurlga Joint Venture
EL 5419 Thurlga 333 Peninsula Resources Ltd, Gawler Resources Limited3
25%, Gawler Resources Limited 75%
Moonta Copper Gold Project
EL 5984 Moonta-Wallaroo 713 Peninsula Resources Ltd 100%
EL 5984 Moonta Porphyry JV 106 Peninsula Resources Ltd 90% – option to acquire 100% from Minotaur Exploration Limited
Northern Territory
Rover Copper Gold Project
EL 27292 Rover North 39 Adelaide Exploration Pty Ltd2 100% – Emmerson Resources Limited in Farm in JV4 (Franco-Nevada retain
70% buyback right)
EL 27372 Rover 248 Adelaide Exploration Pty Ltd 100% – Emmerson Resources Limited in Farm in JV4 (Franco-Nevada retain
70% buyback right)
Davenport Ranges Tungsten Project
EL 31211 Newlands Creek 540 Peninsula Resources Ltd 100%
Queensland
Drummond Epithermal Gold Project
EPM 18090 Glenroy 196 Adelaide Exploration Pty Ltd 100%
EPM 25660 Gunthorpe 74 Adelaide Exploration Pty Ltd 100%
EPM 26154 Sandalwood Creek 257 Adelaide Exploration Pty Ltd 100%
EPM 26155 Mount Wyatt 307 Adelaide Exploration Pty Ltd 100%
Western Australia
Coolgardie Gold Project
E15/520 Prince of Wales 93 Peninsula Resources Ltd 100%
1 Peninsula Resources Limited (incorporated 18 May 2007) is a wholly-owned subsidiary of Andromeda Metals Limited
2 Adelaide Exploration Pty Ltd (incorporated 13 July 2001) is a wholly-owned subsidiary of Andromeda Metals Limited
3 Gawler Resources Limited is a wholly owned subsidiary of Investigator Resources Limited.
4 Emmerson Resources withdrew from agreement after year end.

ANDROMEDA METALS LIMITED14
Competent person and JORC 2012 compliance statementsEXPLORATION RESULTSThe information in this report that relates to Exploration Targets, Exploration Results, Mineral Resources or Ore Reserves is based on information compiled by Chris Drown, a Competent Person, who is a Member of The Australasian Institute of Mining and Metallurgy. Mr Drown is employed by Drown Geological Services Pty Ltd and consults to the Company on a full time basis. Mr Drown has sufficient experience that is relevant to the style of mineralisation and type of deposit under consideration and to the activity being undertaken to qualify as a Competent Person as defined in the 2012 Edition of the ‘Australasian Code for Reporting of Exploration Results, Mineral Resources and Ore Reserves’. Mr Drown consents to the inclusion in the Report of the matters based on his information in the form and context in which it appears.
WUDINNA GOLD CAMP MINERAL RESOURCE ESTIMATESThe information in this report relating to the Mineral Resource Estimates for the Barns, Baggy Green and White Tank gold deposits is extracted from reports entitled “Maiden 107,000 ounce gold resource estimated for Barns deposit.” created on 19 July 2016; and “Wudinna Gold Camp Mineral Resource jumps to 200,000 ounces of gold.” created on 23 January 2017. Both reports are available to view on www.andromet.com.au. The Company confirms that it is not aware of any new information or data that materially affects the information included in the original market announcement and, in the case of estimates of Mineral Resources or Ore Reserves, that all material assumptions and technical parameters underpinning the estimates in the relevant market announcements continue to apply and have not materially changed. The Company confirms that the form and context in which the Competent Persons’ findings are presented have not been materially modified from the original market announcements.
WUDINNA GOLD CAMP METALLURGICAL TESTWORKThe information in this report relating to metallurgical testwork conducted on the Barns and Baggy Green gold deposits is extracted from reports entitled “Barns metallurgy results deliver 97% plus gold recovery with conventional flowsheet.” created on 16 January 2017, and “Superb metallurgical gold recoveries to 99.3% at Baggy Green using conventional flowsheet.” created on 6 July 2017. The reports are available to view on www.andromet.com.au. The Company confirms that it is not aware of any new information or data that materially affects the information included in the original market announcements and, in the case of estimates of Mineral Resources or Ore Reserves, that all material assumptions and technical parameters underpinning the estimates in the relevant market announcements continue to apply and have not materially changed. The Company confirms that the form and context in which the Competent Person’s findings are presented have not been materially modified from the original market announcements.
Andromeda Metals and the Board are committed to achieving and demonstrating the highest standards of corporate governance. The Company has reviewed its corporate governance practices against the Corporate Governance Principles and Recommendations (3rd Edition) published by the ASX Corporate Governance Council.
The corporate governance statement for the year ended 30 June 2017 can be viewed on the Company’s website at www.andromet.com.au.
Corporate governance

ANNUAL REPORT 2017 15
Statutory reports
Directors’ reportThe directors present this Directors’ Report and the attached annual financial report of Andromeda Metals Limited for the financial year ended 30 June 2017. In order to comply with the provisions of the Corporations Act 2001, the directors report as follows:
DIRECTORSThe names and details of the directors of the Company during or since the end of the financial year are:
Christopher G Drown BSc (Hons), MAusIMM, MAICD
Managing Director Chris Drown is a geologist with over 30 years’ experience in the Australian exploration and mining industry. He is a member of the Australasian Institute of Mining and Metallurgy, a member of the Australian Institute of Company Directors, and a member of the Geological Society of Australia.
A graduate of the University of Tasmania, Mr Drown worked in underground nickel mines at Western Mining Corporation Limited’s Kambalda operations in Western Australia, and filled mining geology roles at Aberfoyle Resources Limited’s Hellyer lead-zinc-silver deposit in western Tasmania.
In 1991, he moved from mine geology into exploration searching for base metal and gold deposits in the Northern Territory and South Australia.
Mr Drown was appointed exploration manager of Andromeda Metals shortly after it listed on the ASX and has since played a major role in the Company’s activities. In March 2005 he accepted an invitation to join the Board of Andromeda Metals as an executive director and in November 2007 was appointed Managing Director.
Nicholas J Harding BA (Acc), Grad Dip (Acc), Grad Dip (App Fin), Grad Dip (Corp Gov), FCPA, F Fin, AGIA, ACIS
Executive Director and Company SecretaryNick Harding is a qualified accountant and company secretary with over 30 years’ experience in the resources industry. He is a Fellow of CPA Australia, a Fellow of the Financial Services Institute of Australasia and a member of the Governance Institute of Australia and possesses qualifications in accounting, finance and corporate governance.
Mr Harding has held various senior roles with WMC Resources Limited, Normandy Mining Limited and Newmont Australia Limited. At WMC Resources over a period of 14 years to 1999 he held a number of senior
Colin G Jackson MSc, BSc (Hons), DIC, Grad Dip Bus Admin
Non-Executive ChairmanColin Jackson is a metallurgist and mineral process design engineer graduate of Birmingham University and Royal School of Mines, Imperial College, London University. He has over 40 years of industry experience and brings to the Company a strong technical background and extensive copper-gold knowledge. In addition he has substantial global financial market experience and has guided a number of companies from the exploration phase into production.
After ten years mine design and operating experience with Selection Trust Limited and RGC Limited, Mr Jackson became a Director of Research and Corporate for McIntosh Securities Ltd (now Bank of America Merrill Lynch) where he raised equity for a significant number of gold companies including Kidston Gold Mines and Placer Pacific Limited’s IPO over a 12 year period. His next 8 years were dedicated to communication and investor relations roles at Newcrest Mining Limited and Normandy Mining Limited where he was Group Executive Corporate.
More recently Mr Jackson has held Non-Executive Director positions with Terramin Australia Limited, and chaired Intrepid Mines Limited and Red 5 Limited where he helped guide the financing and development of the Angas zinc mine in South Australia, the Paulsens underground gold mine in Western Australia, and the Siana open pit gold mine on the island of Mindanao in the Philippines.
Mr Jackson is the Chairman of the Remuneration Committee and a member of the Audit and Risk Committee.
ANDROMEDA METALS LIMITED16
management roles at both minesites and regional offices in Western Australia and South Australia including five years as Chief Financial Officer for Olympic Dam Operations, and four years as Chief Accountant and Business Planning Manager for the Copper Uranium Division.
In eight years from 1999 to 2006 at Normandy Mining and then Newmont Australia following the takeover by Newmont of Normandy, Mr Harding held the positions of General Manager Operations Finance and General Manager Planning and Analysis which respectively had responsibilities for accounting, finance and budgeting for 14 mining operations in Australia and overseas.
Jonathan P Buckley B Ec
Non-Executive Director (Chairman of Audit and Risk Committee)Jonathan Buckley is a corporate executive with extensive commercial and corporate finance experience spanning over 25 years in Australia and the UK. He was previously Group Managing Director for PhillipCapital Australia, part of a leading Asian financial group providing corporate finance, funds management, stockbroking and wealth management services in Australia. He has been a founding director of a number of fund management businesses in high growth sectors, including resources and healthcare.
Prior to establishing PhillipCapital Australia’s corporate advisory business, Mr Buckley was Manager, Strategic Planning for Rothschild Asset Management UK based in London. He has also held roles with KPMG Management Consulting and Barclays de Zoete Wedd Securities in London.
Mr Buckley is the Chairman of the Audit and Risk Committee and a member of the Remuneration Committee.
Directorships of other listed companiesDirectorships of other listed companies held by directors in the three years immediately before the end of the financial year are as follows:
Name Company Period of Directorship
C G Jackson Intrepid Mines Limited
From 2003 to 2014
Red5 Limited From 2003 to 2013
PRINCIPAL ACTIVITIESThe principal continuing activity of the Group is the exploration for gold, copper and other economic mineral deposits.
OPERATING AND FINANCIAL REVIEW
StrategyTo achieve the goal of growing shareholder wealth, Andromeda Metals’ directors have formulated a Company strategy comprising the following key elements:
• The Company will maintain a focus on gold exploration, with copper a secondary target commodity. Directors believe the outlook for these metals remains positive, and consider these are commodities well suited to Andromeda Metals’ capability and expertise. The principal focus for the 2016/17 financial year has been to advance the Wudinna Gold Camp on the Eyre Peninsula towards mine development.
• The Company’s Board believes it is in shareholders’ best interests to retain maximum equity in its tier one projects and consequently seeks to self-fund exploration programmes on these projects when equity markets allow. The Board will contemplate third party investment in a tier one project if it believes the consequent loss of shareholder equity is more than compensated by increased financial certainty and project de-risking that may accrue.
• The Company will pursue opportunities which have potential to unlock value in its other mineral assets, and will maintain an active lookout for quality new projects in Australia and a watching brief overseas.
• The Company will adhere to principles of good corporate governance, caring for its employees, conducting its operations in an environmentally sensitive manner, and maintaining respect for other stakeholders and for the communities in which it operates.
Financial ResultsThe net result of operations for the year was a loss after income tax of $6,908,847 (2016: loss of $3,940,324).
Exploration expenditure for the year was $702,281 (2016: $1,186,677) with funds directed principally to the Eyre Peninsula Gold project. Expenditure during the year by joint venture parties on tenements in which the Company has an interest totalled $399,974. Net operating cash outflows for the year totalled $564,613 (2016: $1,028,701). At the 30 June 2017 the Company held cash and cash equivalents totalling $268,336 (2016: $348,398). An impairment of capitalised exploration expenditures of $6,069,107 (2016: $2,452,260) was also recorded for the year.
In July 2016 the Company completed a share placement to professional and sophisticated investors at an issue price of 1.9 cents per share raising

ANNUAL REPORT 2017 17
$816,050 before costs, and in May 2017 completed a 1-for-2 non-renounceable Rights Issue at an issue price of 0.8 cents per share which received applications totalling $378,703.
Exploration Activities During the 2016/17 financial year the Company focused its exploration effort on advancing the Wudinna Gold Camp on the Eyre Peninsula Gold Project on South Australia’s northern Eyre Peninsula, with only modest programmes directed to other Company projects. The third party funded joint ventures were also active.
Eyre Peninsula Gold ProjectThe Eyre Peninsula Gold Project comprises six wholly owned tenements that total 2,052 km2 in area. The licences fall in the Central Gawler Gold Province, an arcuate geological belt that is prospective for gold and other metals. WPG Resources Limited’s Tarcoola gold mine, which commenced production in November 2016, also falls in the Central Gawler Gold Province. The Eyre Peninsula Project includes the wholly owned Wudinna Gold Camp, a cluster of prospects including the Barns, Baggy Green and White Tank deposits located about 20 kilometres north of the township of Wudinna. Work completed during the year has been aligned with the goal of advancing the Wudinna Gold camp into production.
In July 2016 the Company released a maiden Mineral Resource for the Barns deposit. The resource was estimated in accordance with the requirements of the JORC Code 2012, and completed with the assistance of independent consulting group Mining Plus Pty Ltd.
The Barns Mineral Resource estimate totals 2.11 million tonnes at 1.6g/t gold for 107,000 ounces at 0.5g/t gold cut-off grade. The Resource is classified into 380,000 tonnes of Indicated and 1,730,000 tonnes of Inferred Resources.
A reverse circulation drilling programme totalling 23 holes for 2,515 metres was undertaken at the Baggy Green prospect, located only 5.5 kilometres southeast of Barns, with the goal of defining shallow mineralisation that could materially add to the 107,000 ounce Barns resource. Analysis of the drill samples confirmed the presence of shallow high grade gold with adjacent 50 metre spaced holes BGRG-1222 and BGRC-1223 respectively recording 16 metres at 5.72g/t gold and 11 metres at 9.32g/t gold, the best gold intersections achieved to date.
Mineral Resource estimations, again completed with the assistance of Mining Plus Pty Ltd, were then completed for the Baggy Green deposit, and also the White tank deposit which is located 1 kilometre south of the Barns resource.
The Baggy Green Mineral Resource estimate totals 1.56 million tonnes at 1.64g/t gold for 82,400 ounces at a 0.5g/t gold cut-off grade. The White Tank Mineral Resource estimate totals 0.176 million tonnes at 1.92g/t gold for 10,900 ounces at a 0.5g/t gold cut-off grade. Both Resources are classified as Inferred.
The consolidated Wudinna Gold Camp Mineral Resource, including the Baggy Green, White Tank and Barns gold deposits, therefore totals 3.84 million tonnes at 1.62g/t gold for 200,300 ounces using a 0.5g/t cut-off grade, comprised of 0.38 million tonnes at 1.40g/t gold for 17,000 ounces of Indicated Resource and 3.469 million tonnes at 1.64g/t gold for 183,300 ounces of Inferred Resources.
All three of the deposits remain open down-dip and Baggy Green in particular presents excellent along strike targets. Additionally other nearby exploration targets and opportunities that can also deliver additional resources with exploration success were confirmed.
Metallurgical testing was conducted on composited samples from the Barns and Baggy Green deposits, with the composites representing both primary and oxide/supergene mineralised material.
At Barns gravity and cyanide leaching of the gravity concentrate and tailings recovered 98.8% of the gold in a supergene sample, and an average of 97.5% of the gold in primary samples. At Baggy Green recovery in a supergene sample was 94.3%, while recoveries for primary samples averaged 98.7%. These outstanding gold recoveries were achieved with modest reagent additions. Gravity and cyanide leaching therefore represents a viable conventional flowsheet for the Wudinna Gold Camp.
Metallurgical flotation tests were also completed on the Barns primary zone samples and achieved gold recoveries approaching 90% in a flotation concentrate representing approximately 6% of the feed mass. These are also very good results and may present an alternative flowsheet option to gravity and cyanide leaching when assessing the optimum economic value of the project.
Thurlga Joint VentureThe Thurlga Joint Venture with Investigator Resources Limited (IVR) is exploring a 333 km2 exploration licence adjacent to the Eyre Peninsula Gold Project tenements, and to a tenement that hosts Investigator Resources’ 42 million ounce Paris silver deposit. IVR met its joint venture obligation to spend a total of $750,000 on exploration by 30 June 2017, and consequently has earned a 75% equity interest in the joint venture, with the Company retaining a 25% equity interest.
ANDROMEDA METALS LIMITED18
Soil sampling completed in 2016 defined a number of silver and base metal anomalous features, five of which were tested in a 2017 programme of aircore drilling totalling 20 holes for 1,076 metres. Anomalous silver and base metals were intersected at two targets.
More significantly, five holes drilled at the Ironstone prospect intersected substantial graphite mineralisation, with grades up to 16.5% TGC (total graphitic carbon) recorded in 3-metre composite samples. Hole TH17AC037B recorded 30 metres at 10.0% TGC, while TH17AC034 recorded 10 metres at 8.3% TGC.
An airborne RepTEM survey flown over the Thurlga tenement in 2010 reveals a series of linear conductive features that extend for 25 kilometres in aggregate strike length. The RepTEM conductors are coincident with the graphitic drill intersections and are likely to be sourced by the graphitic units.
Drilling completed to date indicates that the graphitic formations are up to 500 metres wide and, should they extend along the 25 kilometres of strike indicated by the RepTEM conductors, the resource potential is very substantial.
Drummond Epithermal Gold ProjectAndromeda Metals holds 100% equity in four tenements securing an area of 838 km2 in the northern Drummond Basin in Queensland. The Drummond Basin is prospective for high grade epithermal gold deposits such as Pajingo which has produced approximately 3 million ounces of gold.
Surface geochemistry and prospecting in the 2015/16 financial year defined four previously untested targets on the Drummond project, however drill testing of these targets was postponed due to the Company’s constrained funding position. The targets represent high quality but early stage opportunities and the Company remains committed to drilling them when funding allows.
Rover Copper-Gold ProjectThe Rover project covers 287 km2 in the Rover Field southwest of Tennant Creek in the Northern Territory. The Rover Field is prospective for ironstone hosted copper-gold deposits geologically identical to deposits found in the Tennant Creek Field, many of which exhibited high grades allowing them to be profitably mined in the past.
In November 2016 the Company announced it had negotiated a farm-in and joint venture for Rover with Emmerson Resources Limited (ERM). A modest 3-D Induced Polarisation geophysical survey,
collecting 13.5 line km of data over three targets, was completed. After year end, ERM announced it wished to withdraw from the farm-in and joint venture, citing funding constraints as the reason for its departure. At the time of reporting, the Company and ERM were in the process of negotiating a cash settlement to effect its withdrawal.
Moonta Copper-Gold ProjectA second priority for the year was to deliver shareholder value through securing third party investment in the Moonta project. A significant party with whom the Company had been negotiating a Heads of Agreement for a considerable part of the year, failed to meet various deadlines for reasons not related to the project. An offer received from another party was rejected on value and execution risk grounds. The Company remains in active discussion with other parties.
A review of historical drill hole assays on the Moonta project confirms the presence of significant cobalt in conjunction with copper mineralisation at a number of prospects. At Willamulka steeply dipping cobalt lodes are traceable for over 800 metres of strike, while a number of holes at Alford West also contain cobalt. Drill intersections include 5 metres at 0.32% cobalt at Willamulka and 9 metres at 0.13% cobalt at Alford West.
After year end the Company announced it was also assessing the potential to produce copper using in-situ recovery (ISR) methods at the Wombat and Bruce deposits, where copper mineralisation occurs in sub vertical weathering troughs that extend hundreds of metres below the surface. Material in the troughs appears to be both porous and permeable, allowing lixiviant flow and copper phase contact, while the troughs are enclosed by fresh impermeable rock that can prevent lixiviant escape. Preliminary leach tests on composite samples from Wombat and Bruce confirm copper solubility of up to 65%.
A combined Exploration Target has been estimated for the Wombat and Bruce ISR opportunity, with the estimate being 80 million to 120 million tonnes at a grade of 0.18% to 0.23% copper (145,000 to 275,000 copper tonnes), comparable to resources at international ISR copper projects. The potential tonnage and grade of the Exploration Target is conceptual in nature as there has been insufficient exploration to estimate a Mineral Resource, and it remains uncertain if further exploration will result in the estimation of a Mineral Resource. The Company is in discussions with parties familiar with ISR operations.

ANNUAL REPORT 2017 19
Other projectsA reconnaissance rock chip sampling programme completed on a wholly owned tenement in the Davenport Ranges area of the Northern Territory, initially selected for hard rock lithium potential, returned ore grade tungsten values up to 1.41% WO3 in a vein at the Juggler prospect. Anomalous tantalum and niobium are also present, while a trial FPXRF soil survey found anomalous tungsten coincident with the vein outcrop, suggesting this low cost method could be used effectively as an exploration tool.
The Company was granted a tenement southwest of Coolgardie in Western Australia. The area is prospective for archaean greenstone hosted gold, and is potentially prospective for massive nickel sulphides and pegmatite associated lithium deposits.
Technical assessment of a number of tenement applications made over South Australian salt lakes conceptually prospective for lithium brines were negative, and the applications were withdrawn.
Outlook and Future DevelopmentsSubject to funding, the forward exploration programme will again focus on advancing the Wudinna Gold Camp deposits towards production. Work programmes at Wudinna would include exploratory drilling with the goal of delineating additional mineralisaton to increase the currently established 200,000 ounce gold resource, infill drilling within the established resources to allow reclassification of Inferred Resources to Indicated Resources and thereby allowing estimation of Ore Reserves, further metallurgical studies to optimise grind size/recovery parameters, and economic studies.
The Company intends to drill test Bunyip and the other targets identified on the Drummond Project, and undertake low cost surface prospecting and geochemistry to define additional epithermal drill targets at Drummond.
Concerted attention to deliver value from the Company’s other exploration assets, including the copper dominant Moonta and Rover projects, through third party funding will be maintained.
DIVIDENDSNo dividends were paid or declared since the start of the financial year, and the directors do not recommend the payment of dividends in respect of the financial year.
CHANGES IN STATE OF AFFAIRSOn 16 December 2016 the Company changed its name from Adelaide Resources Limited to Andromeda Metals Limited. There was no other significant change in the state of affairs of the Group during the financial year.
SUBSEQUENT EVENTSSubsequent to the end of the financial year, Emmerson Resources Limited (ERM) has advised that it wished to withdraw from the Rover Joint Venture. As a consequence, a settlement amount payable to the Company by ERM to affect their withdrawal has been negotiated and incorporated in an Early Withdrawal and Termination Deed that was executed on 28 September 2017.
Other than the above, there were no other matters or circumstances occurring subsequent to the end of the financial year that has significantly affected, or may significantly affect, the operations of the consolidated entity, the results of those operations, or the state of affairs of the consolidated entity in future financial years.
ENVIRONMENTAL DEVELOPMENTSThe Group carries out exploration activities on its properties in South Australia, Queensland, Western Australia and in the Northern Territory. No mining activity has been conducted by the Group on its properties.
The Group’s exploration operations are subject to environmental regulations under the various laws of South Australia, Queensland the Northern Territory, and the Commonwealth. While its exploration activities to date have had a low level of environmental impact, the Group has adopted a best practice approach in satisfaction of the regulations of relevant government authorities.
MEETINGS OF DIRECTORSThe number of meetings of the Company’s Board of Directors attended by each director during the year ended 30 June 2017 was:
Meetings held while in office
Meetings attended
C G Jackson1 11 9
C G Drown 11 11
N J Harding 11 11
J P Buckley 11 11
1 C G Jackson was overseas and not at a secure contactable location for two Board meetings.
The Company held two meetings of the Audit and Risk Committee during the year ended 30 June 2017. The members of this committee comprise J P Buckley (Chairman) and C G Jackson.
There were two meetings held of the Remuneration Committee during the year ended 30 June 2017. The members of this committee comprise C G Jackson (Chairman) and J P Buckley.
ANDROMEDA METALS LIMITED20
NON-AUDIT SERVICESDetails of amounts paid or payable to the auditor for non-audit services provided during the year by the auditor are outlined in Note 18 to the financial statements.
The directors are satisfied that the provision of non-audit services during the year by the auditor (or by another person or firm on the auditor’s behalf) is compatible with the general standard of independence for auditors imposed by the Corporations Act 2001.
The directors are of the opinion that the services as disclosed in Note 18 to the financial statements do not compromise the external auditor’s independence for the following reasons:
• all non-audit services have been reviewed and approved to ensure that they do not impact the integrity and objectivity of the auditor, and
• none of the services undermine the general principles relating to auditor independence as set out in Code of Conduct APES 110 Code of Ethics for Professional Accountants issued by the Accounting Professional & Ethical Standards Board, including reviewing or auditing the auditor’s own work, acting in a management or decision-making capacity for the Company, acting as advocate for the Company or jointly sharing economic risks and rewards.
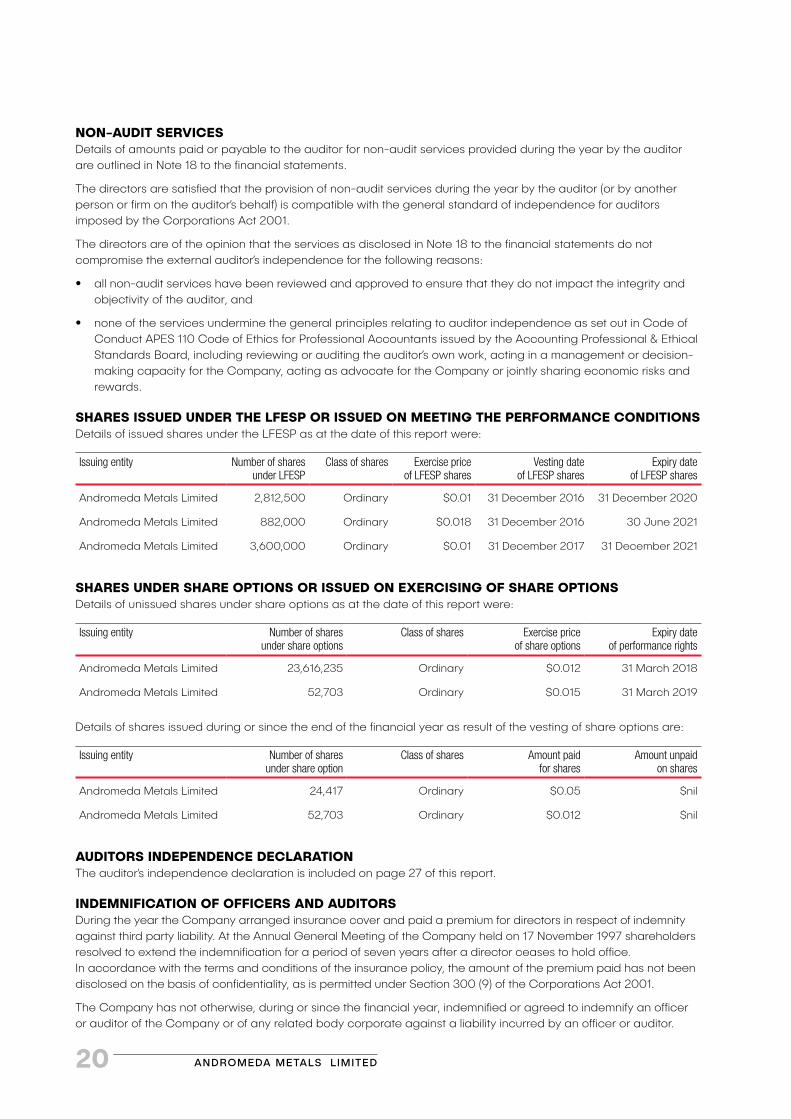
SHARES ISSUED UNDER THE LFESP OR ISSUED ON MEETING THE PERFORMANCE CONDITIONSDetails of issued shares under the LFESP as at the date of this report were:
Issuing entity Number of shares under LFESP
Class of shares Exercise price of LFESP shares
Vesting date of LFESP shares
Expiry date of LFESP shares
Andromeda Metals Limited 2,812,500 Ordinary $0.01 31 December 2016 31 December 2020
Andromeda Metals Limited 882,000 Ordinary $0.018 31 December 2016 30 June 2021
Andromeda Metals Limited 3,600,000 Ordinary $0.01 31 December 2017 31 December 2021
SHARES UNDER SHARE OPTIONS OR ISSUED ON EXERCISING OF SHARE OPTIONSDetails of unissued shares under share options as at the date of this report were:
Issuing entity Number of shares under share options
Class of shares Exercise price of share options
Expiry date of performance rights
Andromeda Metals Limited 23,616,235 Ordinary $0.012 31 March 2018
Andromeda Metals Limited 52,703 Ordinary $0.015 31 March 2019
Details of shares issued during or since the end of the financial year as result of the vesting of share options are:
Issuing entity Number of shares under share option
Class of shares Amount paid for shares
Amount unpaid on shares
Andromeda Metals Limited 24,417 Ordinary $0.05 $nil
Andromeda Metals Limited 52,703 Ordinary $0.012 $nil
AUDITORS INDEPENDENCE DECLARATIONThe auditor’s independence declaration is included on page 27 of this report.
INDEMNIFICATION OF OFFICERS AND AUDITORSDuring the year the Company arranged insurance cover and paid a premium for directors in respect of indemnity against third party liability. At the Annual General Meeting of the Company held on 17 November 1997 shareholders resolved to extend the indemnification for a period of seven years after a director ceases to hold office. In accordance with the terms and conditions of the insurance policy, the amount of the premium paid has not been disclosed on the basis of confidentiality, as is permitted under Section 300 (9) of the Corporations Act 2001.
The Company has not otherwise, during or since the financial year, indemnified or agreed to indemnify an officer or auditor of the Company or of any related body corporate against a liability incurred by an officer or auditor.
ANNUAL REPORT 2017 21
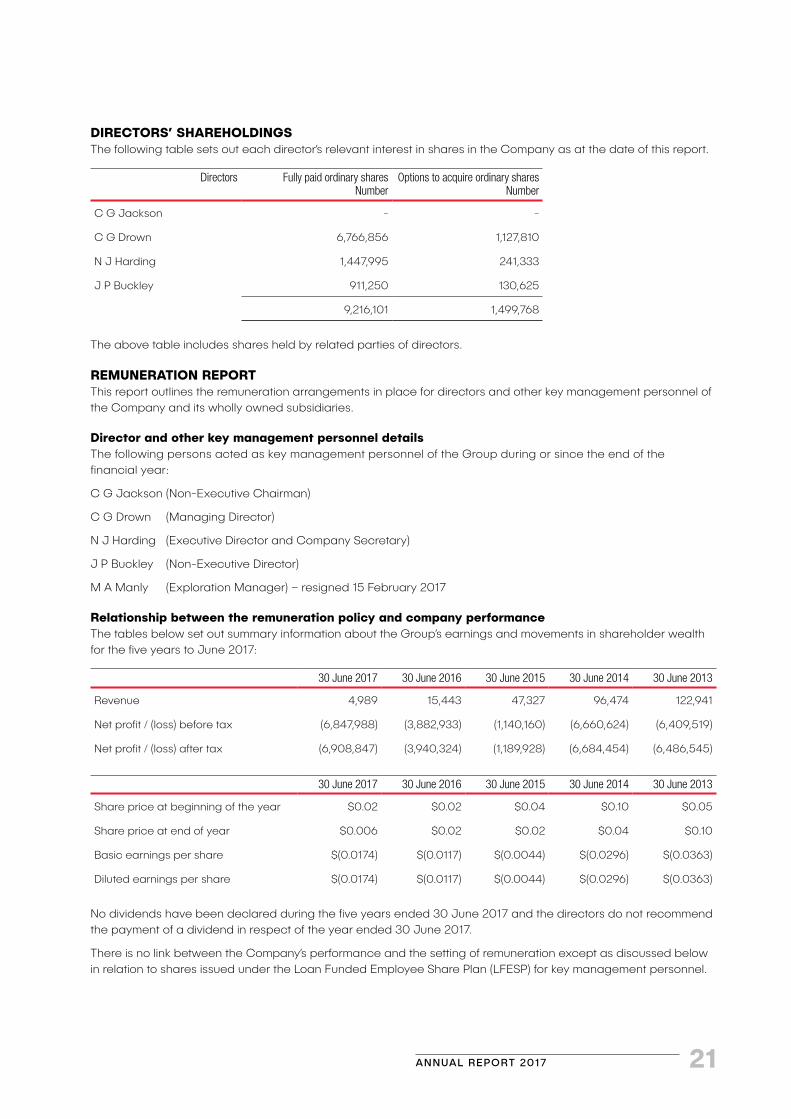
DIRECTORS’ SHAREHOLDINGSThe following table sets out each director’s relevant interest in shares in the Company as at the date of this report.
Directors Fully paid ordinary sharesNumber
Options to acquire ordinary sharesNumber
C G Jackson - -
C G Drown 6,766,856 1,127,810
N J Harding 1,447,995 241,333
J P Buckley 911,250 130,625
9,216,101 1,499,768
The above table includes shares held by related parties of directors.
REMUNERATION REPORTThis report outlines the remuneration arrangements in place for directors and other key management personnel of the Company and its wholly owned subsidiaries.
Director and other key management personnel detailsThe following persons acted as key management personnel of the Group during or since the end of the financial year:
C G Jackson (Non-Executive Chairman)
C G Drown (Managing Director)
N J Harding (Executive Director and Company Secretary)
J P Buckley (Non-Executive Director)
M A Manly (Exploration Manager) – resigned 15 February 2017
Relationship between the remuneration policy and company performanceThe tables below set out summary information about the Group’s earnings and movements in shareholder wealth for the five years to June 2017:
30 June 2017 30 June 2016 30 June 2015 30 June 2014 30 June 2013
Revenue 4,989 15,443 47,327 96,474 122,941
Net profit / (loss) before tax (6,847,988) (3,882,933) (1,140,160) (6,660,624) (6,409,519)
Net profit / (loss) after tax (6,908,847) (3,940,324) (1,189,928) (6,684,454) (6,486,545)
30 June 2017 30 June 2016 30 June 2015 30 June 2014 30 June 2013
Share price at beginning of the year $0.02 $0.02 $0.04 $0.10 $0.05
Share price at end of year $0.006 $0.02 $0.02 $0.04 $0.10
Basic earnings per share $(0.0174) $(0.0117) $(0.0044) $(0.0296) $(0.0363)
Diluted earnings per share $(0.0174) $(0.0117) $(0.0044) $(0.0296) $(0.0363)
No dividends have been declared during the five years ended 30 June 2017 and the directors do not recommend the payment of a dividend in respect of the year ended 30 June 2017.
There is no link between the Company’s performance and the setting of remuneration except as discussed below in relation to shares issued under the Loan Funded Employee Share Plan (LFESP) for key management personnel.
ANDROMEDA METALS LIMITED22
Remuneration philosophyThe performance of the Group depends on the quality of its directors and other key management personnel and therefore the Group must attract, motivate and retain appropriately qualified industry personnel. The Group embodies the following principles in its remuneration framework:
• provide competitive rewards to attract and retain high calibre directors and other key management personnel;
• link executive rewards to shareholder value (by the granting of performance rights or shares under the LFESP);
• link reward with the strategic goals and performance of the Company; and
• ensure total remuneration is competitive by market standards.
The above framework is reliant on the business having the financial capacity to deliver on the principles. Where this is not the situation, executive and director loyalty to shareholders may require short term sacrifice to maintain the viability of the business.
Remuneration policyThe Company has established a Remuneration Committee to assist the Board in discharging its responsibilities relating to the remuneration of directors and other key management personnel. The Committee makes recommendations on all remuneration matters for consideration by the Board.
The Committee assesses the appropriateness of the nature and amount of remuneration of such persons on a periodic basis by reference to relevant employment market conditions with the overall objective of ensuring maximum shareholder benefit from retention of high quality directors and other key management personnel. External advice on remuneration matters is sought whenever the Committee deems it necessary (no advice was obtained during the year ended 30 June 2017).
The remuneration of the directors and other key management personnel is not dependent on the satisfaction of a performance condition, other than as discussed below.
Non-executive director remunerationThe Board of Directors seeks to set remuneration of Non-Executive Directors at a level which provides the Company with the ability to attract and retain directors of the highest calibre, whilst incurring a cost which is appropriate at this stage of the Company’s development.
Currently, the Non-Executive Chairman is entitled to receive $57,200 (2016: $57,200) per annum excluding statutory superannuation. The Non-Executive Director is entitled to receive $34,920 (2016: $34,920) per annum excluding statutory superannuation. From 1 February 2017 both Non-Executive Directors have deferred and the Company has accrued 100% of their fees which will be paid when the Company has sufficient funds.
In addition, Non-Executive Directors are entitled to be paid reasonable travelling, accommodation and other expenses incurred as a consequence of their attendance at meetings of directors and otherwise in the execution of their duties as directors.
Managing director remunerationThe Company aims to reward the Managing Director with a level and mix of remuneration commensurate with his position and responsibilities within the Company to:
• align the interests of the Managing Director with those of shareholders;
• link reward with the strategic goals and performance of the Company; and
• ensure total remuneration is competitive by market standards.
Currently the Company has a service agreement with an entity associated with C G Drown, details of which are set out below.
Other key management personnel remunerationThe Company aims to remunerate other key management personnel at a level commensurate with their position and responsibility within the Company.
Currently the Company has a service agreement with an entity associated with N J Harding, details of which are set out below.
M A Manly was employed as Exploration Manager of the Company from 1 February 2016 on a casual employment basis at a daily rate of $700 per day inclusive of statutory superannuation contributions and resigned on 15 February 2017.
ANNUAL REPORT 2017 23
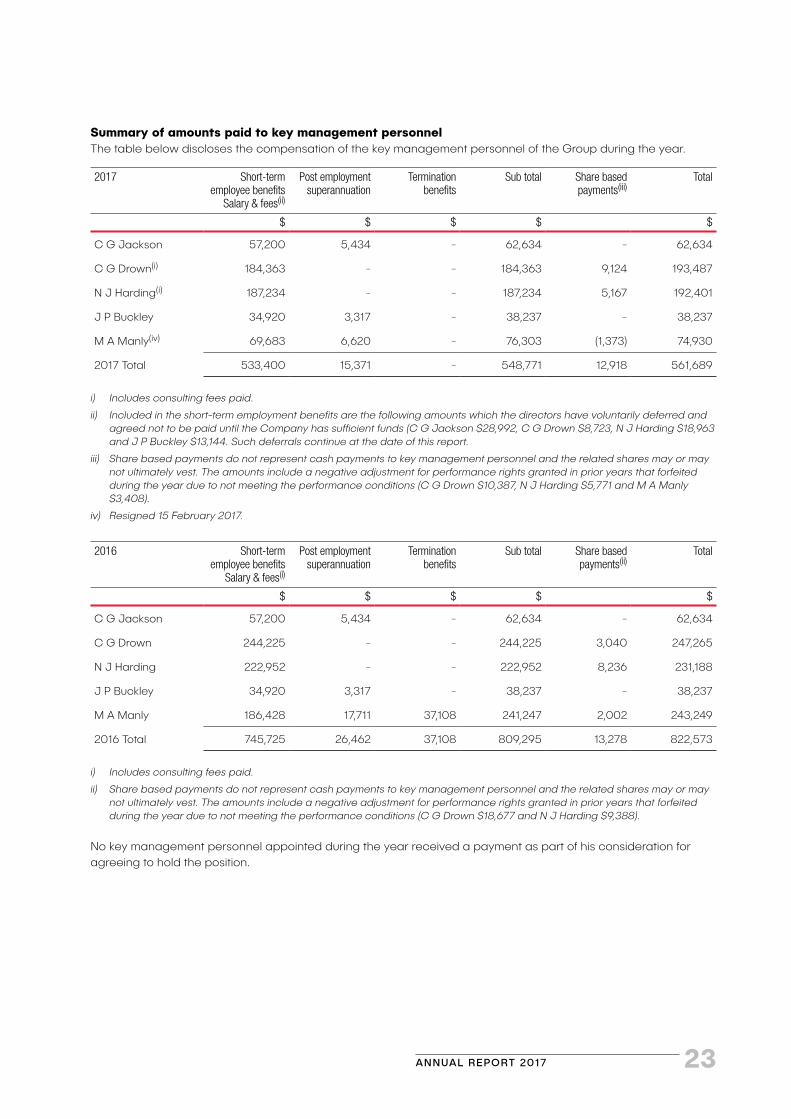
Summary of amounts paid to key management personnelThe table below discloses the compensation of the key management personnel of the Group during the year.
2017 Short-term employee benefits
Salary & fees(ii)
Post employment superannuation
Termination benefits
Sub total Share based payments(iii)
Total
$ $ $ $ $
C G Jackson 57,200 5,434 - 62,634 - 62,634
C G Drown(i) 184,363 - - 184,363 9,124 193,487
N J Harding(i) 187,234 - - 187,234 5,167 192,401
J P Buckley 34,920 3,317 - 38,237 - 38,237
M A Manly(iv) 69,683 6,620 - 76,303 (1,373) 74,930
2017 Total 533,400 15,371 - 548,771 12,918 561,689
i) Includes consulting fees paid.
ii) Included in the short-term employment benefits are the following amounts which the directors have voluntarily deferred and agreed not to be paid until the Company has sufficient funds (C G Jackson $28,992, C G Drown $8,723, N J Harding $18,963 and J P Buckley $13,144. Such deferrals continue at the date of this report.
iii) Share based payments do not represent cash payments to key management personnel and the related shares may or may not ultimately vest. The amounts include a negative adjustment for performance rights granted in prior years that forfeited during the year due to not meeting the performance conditions (C G Drown $10,387, N J Harding $5,771 and M A Manly $3,408).
iv) Resigned 15 February 2017.
2016 Short-term employee benefits
Salary & fees(i)
Post employment superannuation
Termination benefits
Sub total Share based payments(ii)
Total
$ $ $ $ $
C G Jackson 57,200 5,434 - 62,634 - 62,634
C G Drown 244,225 - - 244,225 3,040 247,265
N J Harding 222,952 - - 222,952 8,236 231,188
J P Buckley 34,920 3,317 - 38,237 - 38,237
M A Manly 186,428 17,711 37,108 241,247 2,002 243,249
2016 Total 745,725 26,462 37,108 809,295 13,278 822,573
i) Includes consulting fees paid.
ii) Share based payments do not represent cash payments to key management personnel and the related shares may or may not ultimately vest. The amounts include a negative adjustment for performance rights granted in prior years that forfeited during the year due to not meeting the performance conditions (C G Drown $18,677 and N J Harding $9,388).
No key management personnel appointed during the year received a payment as part of his consideration for agreeing to hold the position.

ANDROMEDA METALS LIMITED24
Service agreementsThe Group entered into service agreements with entities associated with C G Drown and N J Harding for a term of six months to 30 June 2016. Both service agreements have since continued under the same terms while the Company is sourcing sufficient funding at which time new service agreements will be formalised.
Details of the services and consultancy agreements are set out below:
2017
Key management personnel Terms
C G Drown Daily rate of $860.
N J Harding Daily rate of $765.
From 1 February 2017 30% of the above daily rates are being deferred and recorded as an accrual and will be paid when the Company has sufficient funds.
2016
Key management personnel Terms
C G Drown Daily rate of $1,250 for a minimum of 210 days per annum until 31 December 2015 when the daily rate was reduced to $860.
N J Harding Daily rate of $1,050 for a minimum of 40 hours per month until 31 December 2015 when the daily rate was reduced to $765.
The Company may terminate any of the above agreements by giving one month and two months notice to the entities associated with C G Drown and N J Harding respectively. The entities associated with the key management personnel may terminate their agreements with one and two months’ notice respectively. The Group has a contingent liability of $47,800 (2016: $47,800) in relation to these agreements, where the employee is not required to work out the notice period.
The Group entered into a consultancy agreement with J P Buckley on 7 April 2014 to provide consulting services on an as needs basis at the rate of $2,000 per day. There were no payments made under this agreement during the year (2016: $nil).
Payments under the above service agreements are included in the remuneration table.
Shares held by key management personnel under the Loan Funded Employee Share PlanAt the Annual General Meeting held on 30 November 2015 the shareholders approved the Company’s LFESP. Fully paid ordinary shares will be held by the trustee of the LFESP and transferred to key staff member of the Company on achieving certain Company and personal KPIs and the payment of the share issue price, as long as the holder remains employed by the Company. An interest-free loan will be provided by the Company to each key staff member to acquire the shares that are held by the trustee under the terms of the LFESP.
At the Annual General Meeting held on the 30 November 2015, the shareholder’s approved the granting of 4,500,000 fully paid ordinary shares to the Managing Director and 2,500,000 ordinary shares to the Executive Director under the LFESP (the value of these shares issued to the Managing Director and Executive Director were $24,119 and $13,400 respectively). The shares are to be transferred to the director on the achievement of those KPIs met by 31 December 2016 and the payment of $0.01 per share for those shares to which vested by 1 January 2021.
The KPIs for the Managing Director are as follows:
• up to 2,250,000 shares will vest based on the Company’s share performance against a peer group relative share price performance during the calendar year 2016; and
• up to 2,250,000 shares will vest on the achievement of various KPIs based on his personal performance during the calendar year 2016.
As at 31 December 2016 some of the KPIs were met resulting in 1,687,500 shares becoming unrestricted and 2,812,500 shares were returned to the trustee for future allocations. On payment of $0.01 per share the unrestricted shares will be issued to the Managing Director. As at the date of this report this has not occurred.
The KPIs for the Executive Director are as follows:
• up to 1,000,000 shares will vest based on the Company’s share performance against a peer group relative share price performance during the calendar year 2016; and
• up to 1,500,000 shares will vest on the achievement of various KPIs based on his personal performance during the calendar year 2016.
ANNUAL REPORT 2017 25
As at 31 December 2016 some of the KPIs were met resulting in 1,125,000 shares becoming unrestricted and 1,375,000 shares were returned to the trustee for future allocations. On payment of $0.01 per share the unrestricted shares will be issued to the Executive Director. As at the date of this report this has not occurred.
On the 30 June 2016, the Company granted 1,500,000 fully paid ordinary shares to the Exploration Manager (M A Manly) under the LFESP (the value of these shares issued were $4,037). The shares are to be transferred to the Exploration Manager on the achievement of those KPIs met by 31 December 2016 and the payment of $0.018 per share for those shares to which vested by 30 June 2021.
The KPIs for the Exploration Manager are as follows:
• up to 600,000 shares will vest based on the Company’s share performance against a peer group relative share price performance during the calendar year 2016; and
• up to 900,000 shares will vest on the achievement of various KPIs based on his personal performance during the calendar year 2016.
As at 31 December 2016 some of the KPIs were met resulting in 780,000 shares becoming unrestricted and 720,000 shares were returned to the trustee for future allocations. On payment of $0.018 per share the unrestricted shares will be issued to the Exploration Manager. As the Exploration Manager resigned on 15 February 2017 the unrestricted shares have been forfeited.
At the Annual General Meeting held on the 30 November 2016, the shareholder’s approved the granting of 2,300,000 fully paid ordinary shares to the Managing Director and 1,300,000 ordinary shares to the Executive Director under the LFESP (the value of these shares issued to the Managing Director and Executive Director were $16,647 and $9,409 respectively). The shares are to be transferred to the director on the achievement of those KPIs met by 31 December 2017 and the payment of $0.01 per share for those shares to which vested by 1 January 2022.
The KPIs for the Managing Director are as follows:
• up to 1,150,000 shares will vest based on the Company’s share performance against a peer group relative share price performance during the calendar year 2017; and
• up to 1,150,000 shares will vest on the achievement of various KPIs based on his personal performance during the calendar year 2017.
The KPIs for the Executive Director are as follows:
• up to 520,000 shares will vest based on the Company’s share performance against a peer group relative share price performance during the calendar year 2017; and
• up to 780,000 shares will vest on the achievement of various KPIs based on his personal performance during the calendar year 2017.
Value of shares granted under the LFESP – basis of calculation • Value of shares granted under the LFESP is
calculated by multiplying the fair value of shares granted by the number of shares granted during the financial year.
• The shares are issued once the KPIs have been met and the loan has been repaid. The value of shares issued under the LFESP is calculated by multiplying the fair value of shares at the date of issue (calculated as the difference between consideration paid and the Australian Securities Exchange last sale price on the day that the shares were issued) by the number of shares issued during the financial year.
• Value of shares granted under the LFESP forfeited/cancelled is calculated by multiplying the fair value of shares granted at the time they were forfeited/cancelled multiplied by the number of shares forfeited/cancelled during the financial year.
The total value of shares granted under the LFESP included in compensation for the financial year is calculated in accordance with Accounting Standard AASB 2 “Share-based Payment”. Shares granted under the LFESP during the financial year are recognised in compensation over their vesting period.
ANDROMEDA METALS LIMITED26
Equity holdings of key management personnel as at 30 June 2017
Fully paid ordinary shares issued by Andromeda Metals Limited
Balance01/07/16
Issued as result ofrights issue
Shares issuedunder the LFESP
Other changes Balance30/06/17
C G Jackson - - - - -
C G Drown 4,511,237 2,255,619 - - 6,766,856
N J Harding 965,330 482,665 - - 1,447,995
J P Buckley 650,000 261,250 - - 911,250
M A Manly 450,000 - - (450,000) -
Listed options issued by Andromeda Metals Limited
Balance 01/07/16
Granted Exercised Lapsed Balance30/06/17
Vestedand exercisable
Directors
C G Drown 626,873 1,127,810 - (626,873) 1,127,810 See Note 14 for details
N J Harding 85,889 241,333 - (85,889) 241,333 See Note 14 for details
J P Buckley 227,500 130,625 - (227,500) 130,625 See Note 14 for details
Shares held by the trustee of the LFESP
Balance 01/07/16
Granted Exercised Forfeited/cancelled
Balance30/06/17
Vestedand exercisable
C G Drown 4,500,000 2,300,000 - (2,812,500) 3,987,500 See Note 16 for details
N J Harding 2,500,000 1,300,000 - (1,375,000) 2,425,000 See Note 16 for details
M A Manly 1,500,000 - - (1,500,000) - See Note 16 for details
Signed in Adelaide this 29th day of September 2017 in accordance with a resolution of the Directors.
C G Drown J P Buckley Managing Director Non-Executive Director
ANNUAL REPORT 2017 27
Auditors independence declaration
Deloitte Touche TohmatsuABN 74 490 121 060 11 Waymouth Street Adelaide, SA, 5000 Australia
Phone: +61 8 8407 7000 www.deloitte.com.au
Liability limited by a scheme approved under Professional Standards Legislation.
Member of Deloitte Touche Tohmatsu Limited
Page 14
29 September 2017
The Board of Directors Andromeda Metals Limited 69 King William Road UNLEY SA 5061
Dear Board Members
Andromeda Metals Limited
In accordance with section 307C of the Corporations Act 2001, I am pleased to provide the following declaration of independence to the directors of Andromeda Metals Limited.
As lead audit partner for the audit of the financial statements of Andromeda Metals Limited for the financial year ended 30 June 2017, I declare that to the best of my knowledge and belief, there have been no contraventions of:
(i) The auditor independence requirements of the Corporations Act 2001 in relation to the audit
(ii) Any applicable code of professional conduct in relation to the audit.
Yours faithfully
DELOITTE TOUCHE TOHMATSU
Darren Hall Partner Chartered Accountants
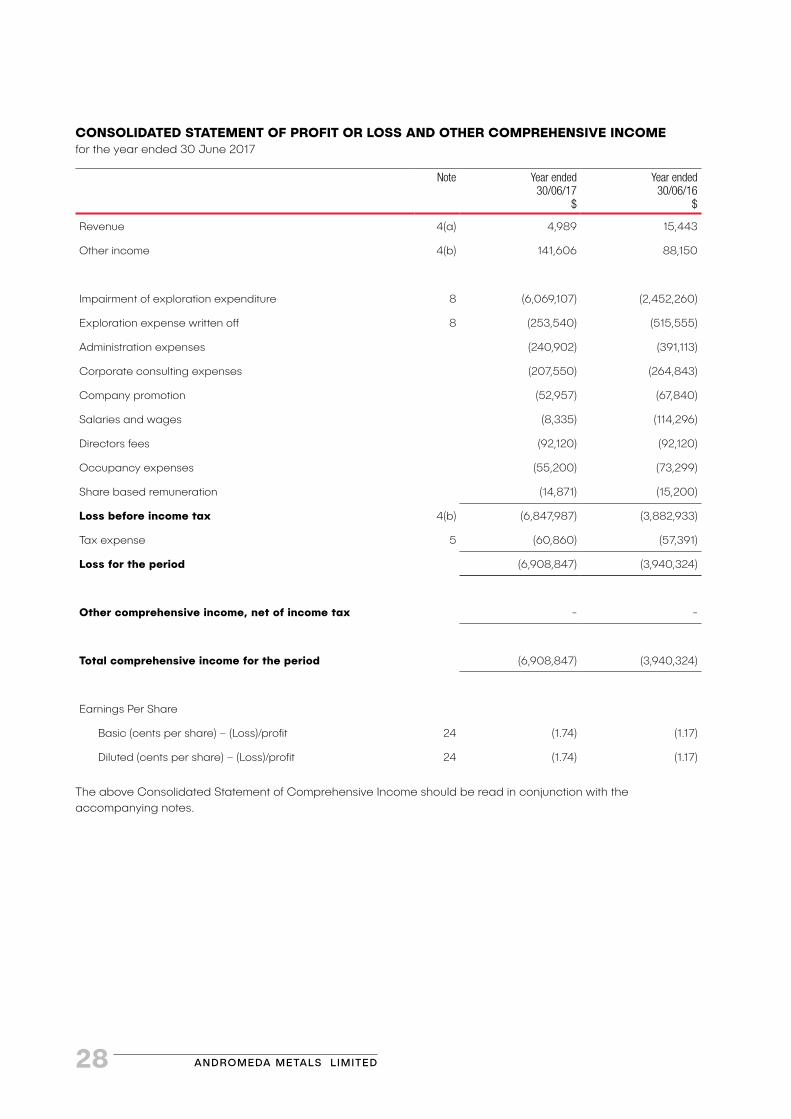
ANDROMEDA METALS LIMITED28
CONSOLIDATED STATEMENT OF PROFIT OR LOSS AND OTHER COMPREHENSIVE INCOMEfor the year ended 30 June 2017
Note Year ended30/06/17
$
Year ended30/06/16
$
Revenue 4(a) 4,989 15,443
Other income 4(b) 141,606 88,150
Impairment of exploration expenditure 8 (6,069,107) (2,452,260)
Exploration expense written off 8 (253,540) (515,555)
Administration expenses (240,902) (391,113)
Corporate consulting expenses (207,550) (264,843)
Company promotion (52,957) (67,840)
Salaries and wages (8,335) (114,296)
Directors fees (92,120) (92,120)
Occupancy expenses (55,200) (73,299)
Share based remuneration (14,871) (15,200)
Loss before income tax 4(b) (6,847,987) (3,882,933)
Tax expense 5 (60,860) (57,391)
Loss for the period (6,908,847) (3,940,324)
Other comprehensive income, net of income tax - -
Total comprehensive income for the period (6,908,847) (3,940,324)
Earnings Per Share
Basic (cents per share) – (Loss)/profit 24 (1.74) (1.17)
Diluted (cents per share) – (Loss)/profit 24 (1.74) (1.17)
The above Consolidated Statement of Comprehensive Income should be read in conjunction with the accompanying notes.

ANNUAL REPORT 2017 29
CONSOLIDATED STATEMENT OF FINANCIAL POSITIONas at 30 June 2017
Note 30/06/17$
30/06/16$
CURRENT ASSETS
Cash and cash equivalents 268,336 348,398
Trade and other receivables 6 36,912 54,305
TOTAL CURRENT ASSETS 305,248 402,703
NON-CURRENT ASSETS
Exploration and evaluation expenditure 8 4,358,222 9,978,588
Plant and equipment 9 4,260 24,920
Other financial assets 7 123,547 100,171
TOTAL NON-CURRENT ASSETS 4,486,029 10,103,679
TOTAL ASSETS 4,791,277 10,506,382
CURRENT LIABILITIES
Trade and other payables 10 195,705 195,964
Other liabilities 11 66,313 -
TOTAL CURRENT LIABILITIES 262,018 195,964
NON-CURRENT LIABILITIES
Provisions 12 9,214 11,626
Other liabilities 13 888,152 793,400
TOTAL NON-CURRENT LIABILITIES 897,366 805,026
TOTAL LIABILITIES 1,159,384 1,000,990
NET ASSETS 3,631,893 9,505,392
EQUITY
Issued capital 14 38,055,344 37,034,867
Reserves 15 36,433 26,984
Accumulated losses (34,459,884) (27,556,459)
TOTAL EQUITY 3,631,893 9,505,392
The above Consolidated Statement of Financial Position should be read in conjunction with the accompanying notes.
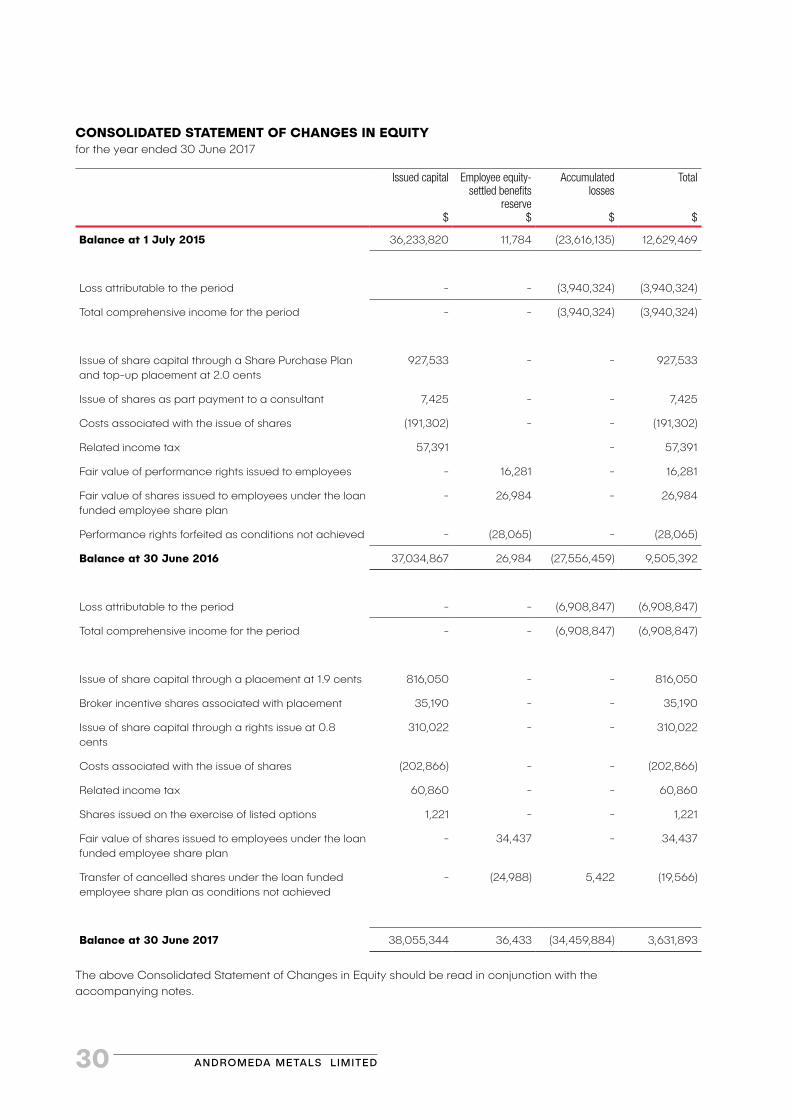
ANDROMEDA METALS LIMITED30
CONSOLIDATED STATEMENT OF CHANGES IN EQUITYfor the year ended 30 June 2017
Issued capital
$
Employee equity-settled benefits
reserve$
Accumulated losses
$
Total
$
Balance at 1 July 2015 36,233,820 11,784 (23,616,135) 12,629,469
Loss attributable to the period - - (3,940,324) (3,940,324)
Total comprehensive income for the period - - (3,940,324) (3,940,324)
Issue of share capital through a Share Purchase Plan and top-up placement at 2.0 cents
927,533 - - 927,533
Issue of shares as part payment to a consultant 7,425 - - 7,425
Costs associated with the issue of shares (191,302) - - (191,302)
Related income tax 57,391 - 57,391
Fair value of performance rights issued to employees - 16,281 - 16,281
Fair value of shares issued to employees under the loan funded employee share plan
- 26,984 - 26,984
Performance rights forfeited as conditions not achieved - (28,065) - (28,065)
Balance at 30 June 2016 37,034,867 26,984 (27,556,459) 9,505,392
Loss attributable to the period - - (6,908,847) (6,908,847)
Total comprehensive income for the period - - (6,908,847) (6,908,847)
Issue of share capital through a placement at 1.9 cents 816,050 - - 816,050
Broker incentive shares associated with placement 35,190 - - 35,190
Issue of share capital through a rights issue at 0.8 cents
310,022 - - 310,022
Costs associated with the issue of shares (202,866) - - (202,866)
Related income tax 60,860 - - 60,860
Shares issued on the exercise of listed options 1,221 - - 1,221
Fair value of shares issued to employees under the loan funded employee share plan
- 34,437 - 34,437
Transfer of cancelled shares under the loan funded employee share plan as conditions not achieved
- (24,988) 5,422 (19,566)
Balance at 30 June 2017 38,055,344 36,433 (34,459,884) 3,631,893
The above Consolidated Statement of Changes in Equity should be read in conjunction with the accompanying notes.
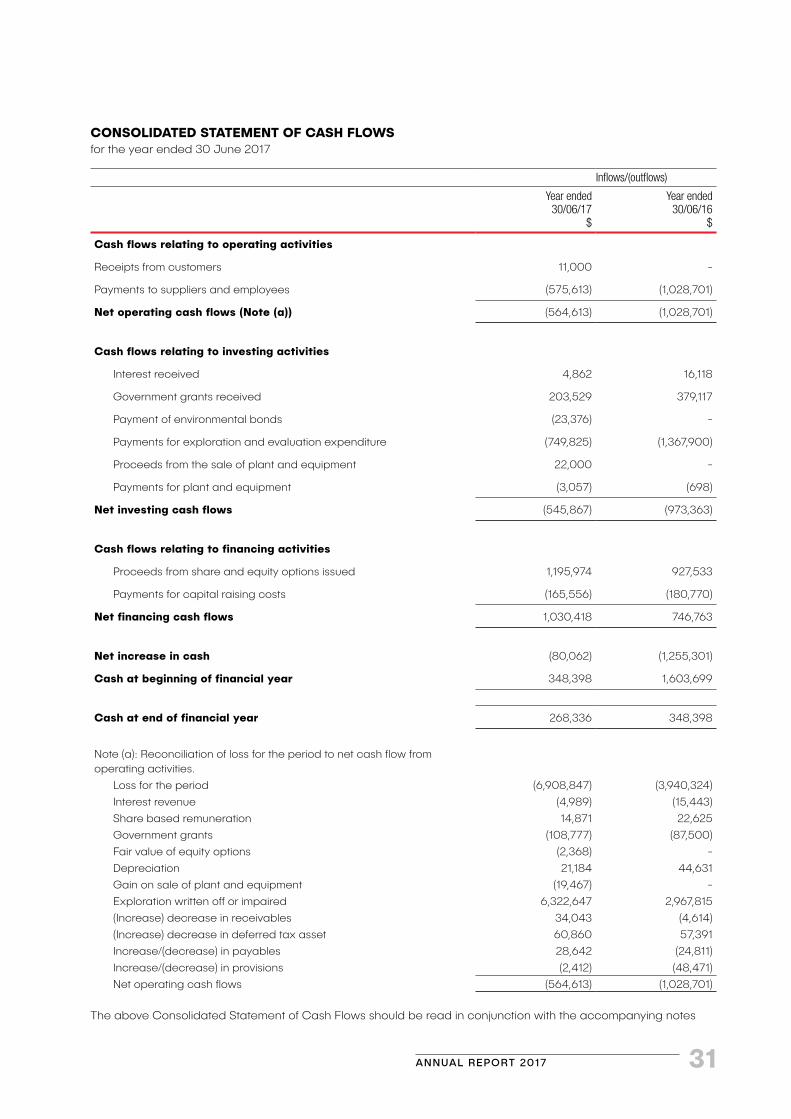
ANNUAL REPORT 2017 31
CONSOLIDATED STATEMENT OF CASH FLOWSfor the year ended 30 June 2017
Inflows/(outflows)
Year ended30/06/17
$
Year ended30/06/16
$
Cash flows relating to operating activities
Receipts from customers 11,000 -
Payments to suppliers and employees (575,613) (1,028,701)
Net operating cash flows (Note (a)) (564,613) (1,028,701)
Cash flows relating to investing activities
Interest received 4,862 16,118
Government grants received 203,529 379,117
Payment of environmental bonds (23,376) -
Payments for exploration and evaluation expenditure (749,825) (1,367,900)
Proceeds from the sale of plant and equipment 22,000 -
Payments for plant and equipment (3,057) (698)
Net investing cash flows (545,867) (973,363)
Cash flows relating to financing activities
Proceeds from share and equity options issued 1,195,974 927,533
Payments for capital raising costs (165,556) (180,770)
Net financing cash flows 1,030,418 746,763
Net increase in cash (80,062) (1,255,301)
Cash at beginning of financial year 348,398 1,603,699
Cash at end of financial year 268,336 348,398
Note (a): Reconciliation of loss for the period to net cash flow from operating activities.
Loss for the period (6,908,847) (3,940,324)
Interest revenue (4,989) (15,443)
Share based remuneration 14,871 22,625
Government grants (108,777) (87,500)
Fair value of equity options (2,368) -
Depreciation 21,184 44,631
Gain on sale of plant and equipment (19,467) -
Exploration written off or impaired 6,322,647 2,967,815
(Increase) decrease in receivables 34,043 (4,614)
(Increase) decrease in deferred tax asset 60,860 57,391
Increase/(decrease) in payables 28,642 (24,811)
Increase/(decrease) in provisions (2,412) (48,471)
Net operating cash flows (564,613) (1,028,701)
The above Consolidated Statement of Cash Flows should be read in conjunction with the accompanying notes
ANDROMEDA METALS LIMITED32
Notes to the Financial Statements for the financial year ended 30 June 2017
Basis of preparationThe financial report has been prepared on the basis of historical cost, except for the revaluation of certain non-current assets and financial instruments. Cost is based on the fair values of the consideration given in exchange for assets. All amounts are presented in Australian dollars, unless otherwise noted.
In the application of the Group’s accounting policies, which are described below, management is required to make judgements, estimates and assumptions about carrying values of assets and liabilities that are not readily apparent from other sources. The estimates and associated assumptions are based on historical experience and various other factors that are believed to be reasonable under the circumstances, the results of which form the basis of making the judgements. Actual results may differ from these estimates.
Significant management judgementThe following are significant management judgements in applying the accounting policies of the Group that have the most significant effect on the financial statements.
Estimation uncertaintyInformation about estimates and assumptions that have the most significant effect on recognition and measurement of assets, liabilities, income and expenses is provided below. Actual results may be substantially different.
Exploration and evaluation expenditureThe application of the Group’s accounting policy for exploration and evaluation expenditure requires judgement in determining whether it is likely that future economic benefits are likely either from future exploration or sale or where activities have not reached a stage which permits a reasonable assessment of the existence of reserves. The determination of a Joint Ore Reserves Committee (JORC) resource is itself an estimation process that requires varying degrees of uncertainty depending on sub-classification and these estimates directly impact the point of deferral of exploration and evaluation expenditure. The deferral policy requires management to make certain estimates and assumptions about future events or circumstances, in particular whether an economically viable extraction operation can be established. Estimates and assumptions made may change if new information becomes available.
Ore reserve and resource estimatesThe Group estimates its ore reserves and mineral resources based on information compiled by Competent Persons (as defined in the 2012 edition of the Australasian Code for Reporting of Exploration Results, Mineral Resources and Ore Resources (the JORC Code). Reserves determined in this way are taken into account in the calculation of impairment expenditure.
1. General informationAndromeda Metals Limited (the Company) is a listed public company, incorporated in Australia and operating in Australia.
Andromeda Metals Limited’s registered office and its principal place of business are as follows:
Registered office Principal place of business
69 King William Road Unley South Australia 5061
69 King William Road Unley South Australia 5061
2. Adoption of new and revised Accounting Standards In the current year, the Group has adopted all of the new and revised Standards and Interpretations issued by the Australian Accounting Standards Board (the AASB) that are relevant to its operations and effective for the current annual reporting period, resulting in no accounting policy changes and no changes to recognition and measurement.
Various other Standards and Interpretations were on issue but were not yet effective at the date of authorisation of the financial report. The issue of these Standards and Interpretations do not affect the Group’s present policies and operations. The directors anticipate that the adoption of these Standards and Interpretations in future periods will not affect the amounts recognised in the financial statements of the Group but may change the disclosure presently made in the financial statements of the Group.
3. Significant accounting policies
Statement of complianceThese financial statements are general purpose financial statements which have been prepared in accordance with the Corporations Act 2001, Accounting Standards and Interpretations, and comply with other requirements of the law. The financial statements comprise the consolidated statements of the Group. For the purpose of preparing the consolidated financial statements, the Company is a profit entity.
Accounting Standards include Australian Accounting Standards. Compliance with Australian Accounting Standards ensures that the financial statements and notes of the Company and the Group comply with International Financial Reporting Standards (‘IFRS’).
The financial statements were authorised for issue by the directors on 29th September 2017.
ANNUAL REPORT 2017 33
Going ConcernThe financial report has been prepared on the going concern basis, which assumes that the Group will be able to realise its assets and extinguish its liabilities in the normal course of business and at amounts stated in the financial report.
For the year ended 30 June 2017 the Group incurred a net loss of $6,908,847 (30 June 2016: $3,940,324), had a net cash outflow from operating activities of $564,486 (30 June 2016: $1,028,701) and net cash outflows from investing activities (principally exploration and evaluation expenditure) of $564,613 (2016: $973,363). At 30 June 2017, the Group has cash reserves of $268,336 (30 June 2016: $348,398).
The directors have prepared cash flow forecasts which indicate that the current cash resources will not be sufficient to fund planned exploration and working capital requirements without the raising of additional funds, and unless additional funding is obtained, cash resources will be exhausted by 31 October 2017. The Company will be required to raise additional funding (which may include a pro-rata issue to shareholders, placement of shares or sale or partial sale of some of the Group’s exploration interests) of at least $400,000 by 31 October 2017 and at least a further $1,600,000 to meet an active exploration programme and working capital requirement through to 30 September 2018. The Company continues to review various capital raising and sale/partial sale of exploration interest opportunities.
Based on the Group’s cash flow forecast and achieving the funding referred to above, the directors believe that the Group will be able to continue as a going concern.
Should the Company be unable to raise the funding referred to above, there is a material uncertainty as to whether the Group will continue as a going concern and therefore, whether it will realise its assets and extinguish its liabilities in the normal course of business.
The financial report does not include any adjustments relating to the recoverability and classification of recorded asset amounts or to the amount and classification of liabilities that might be necessary should the Group not continue.
Accounting policies a) Cash and cash equivalents
Cash and cash equivalents comprise cash on hand, cash in banks and bank deposits.
b) Employee benefitsA liability is recognised for benefits accruing to employees in respect of wages and salaries, annual leave, long service leave, and sick leave when it is probable that settlement will be required and they are capable of being measured reliably. Liabilities recognised in respect of employee benefits, expected to be settled within 12 months, are measured at their nominal values using the remuneration rate expected to apply at the time of settlement. Liabilities recognised in respect of employee benefits which are not expected to be settled within
12 months are measured as the present value of the estimated future cash outflows to be made by the consolidated entity in respect of services provided by employees up to reporting date.
Contributions to accumulated benefit superannuation plans are expensed when incurred.
c) Exploration and evaluation expenditureExploration and evaluation expenditures in relation to each separate area of interest, are recognised as an exploration and evaluation asset in the year in which they are incurred where the following conditions are satisfied:
i) the rights to tenure of the area of interest are current; and
ii) at least one of the following conditions is also met:
¬ the exploration and evaluation expenditures are expected to be recouped through successful development and exploration of the area of interest, or alternatively, by its sale: or
¬ exploration and evaluation activities in the area of interest have not at the reporting date reached a stage which permits a reasonable assessment of the existence or otherwise of economically recoverable reserves, and active and significant operations in, or in relation to, the area of interest are continuing.
Exploration and evaluation assets are initially measured at cost and include acquisition of rights to explore, studies, exploration drilling, trenching and sampling and associated activities. General and administrative costs are only included in the measurement of exploration and evaluation costs where they relate directly to operational activities in a particular area of interest.
Exploration and evaluation assets are assessed for impairment when facts and circumstances (as defined in AASB 6 “Exploration for and Evaluation of Mineral Resources”) suggest that the carrying amount of exploration and evaluation assets may exceed its recoverable amount. The recoverable amount of the exploration and evaluation assets (or the cash-generating unit(s) to which it has been allocated, being no larger than the relevant area of interest) is estimated to determine the extent of the impairment loss (if any). Where an impairment loss subsequently reverses, the carrying amount of the asset is increased to the revised estimate of its recoverable amount, but only to the extent that the increased carrying amount does not exceed the carrying amount that would have been determined had no impairment loss been recognised for the asset in previous years.
Where a decision is made to proceed with development in respect of a particular area of interest, the relevant exploration and evaluation asset is tested for impairment, reclassified to development properties, and then amortised over the life of the reserves associated with the area of interest once mining operations have commenced.

ANDROMEDA METALS LIMITED34
d) Financial assetsInvestments are recognised and derecognised on trade date where purchase or sale of an investment is under a contract whose terms require delivery of the investment within the time frame established by the market concerned, and are initially measured at fair value, net of transaction costs except for those financial assets classified as at fair value through profit and loss which are initially measured at fair value.
Other financial assets are classified into the following specified categories; financial assets ‘at fair value through profit or loss’, ‘held to maturity investments’, ‘available-for-sale’ financial assets, and ‘loans and receivables’. The classification depends on the nature and purpose of the financial assets and is determined at the time of initial recognition.
Effective interest methodThe effective interest method is a method of calculating the amortised cost of a financial asset and of allocating interest income over the relevant period. The effective interest rate is the rate that exactly discounts estimated future cash receipts through the expected life of the financial asset, or, where appropriate, a shorter period.
Income is recognised on an effective interest rate basis for debt instruments other than those financial assets ‘at fair value through profit and loss’.
Held-to-maturity investmentsBills of exchange and debentures with fixed or determinable payments and fixed maturity dates where the Group has the positive intent and ability to hold to maturity are classified as held-to-maturity investments. Held-to-maturity investments are recorded at amortised cost using the effective interest method less impairment, with revenue recognised on an effective yield basis.
Loans and receivablesTrade receivables, loans, and other receivables that have fixed or determinable payments that are not quoted in an active market are classified as ‘loans and receivables’. Loans and receivables are measured at amortised cost using the effective interest method less impairment.
Interest is recognised by applying the effective interest rate.
Impairment of financial assetsFinancial assets are assessed for indicators of impairment at each balance sheet date. Financial assets are impaired where there is objective evidence that as a result of one or more events that occurred after the initial recognition of the financial asset the estimated future cash flows of the investment have been impacted. For financial assets carried at amortised cost, the amount of the impairment is the difference between the asset’s carrying amount and the present value of estimated future cash flows, discounted at the original effective interest rate.
The carrying amount of the financial asset is reduced by the impairment loss directly for all financial assets with the exception of trade receivables where the carrying amount is reduced through the use of an allowance account. When a trade receivable is uncollectible, it is written off against the allowance account. Changes in the carrying amount of the allowance account are recognised in profit and loss.
e) Goods and service taxRevenues, expenses and assets are recognised net of the amount of goods and services tax (GST), except:
i) where the amount of GST incurred is not recoverable from the taxation authority, it is recognised as part of the cost of acquisition of an asset or as part of an item of expense or:
ii) for receivables and payables which are recognised inclusive of GST, the net amount of GST recoverable from, or payable to, the taxation authority is included as part of receivables or payables.
The net amount of GST recoverable from, or payable to, the taxation authority is included as part of receivables or payables.
Cash flows are included in the cash flow statement on a gross basis. The GST component of cash flows arising from investing and financing activities which is recoverable from, or payable to, the taxation authority is classified as operating cash flows.
f) Impairment of assets (other than exploration and evaluation)
At each reporting date, the Group reviews the carrying amounts of its tangible and intangible assets to determine whether there is any indication that those assets have suffered an impairment loss. If any such indication exists, the recoverable amount of the asset is estimated in order to determine the extent of the impairment loss (if any). Where the asset does not generate cash flows that are independent from other assets, the consolidated entity estimates the recoverable amount of the cash-generating unit to which the asset belongs.
Recoverable amount is the higher of fair value less costs to sell and value in use. In assessing value in use, the estimated future cash flows are discounted to their present value using pre-tax discount rate that reflects current market assessments of the time value of money and the risks specific to the asset for which the estimates of future cash flows have not been adjusted.
If the recoverable amount of an asset (or cash-generating unit) is estimated to be less than its carrying amount, the carrying amount of the asset (cash-generating unit) is reduced to its recoverable amount. An impairment loss is recognised in profit or loss immediately, unless the relevant asset is carried at fair value, in which case the impairment loss is treated as a revaluation decrease.

ANNUAL REPORT 2017 35
Where an impairment loss subsequently reverses, the carrying amount of the asset (cash-generating unit) is increased to the revised estimate of its recoverable amount, but only to the extent that the increased carrying amount does not exceed the carrying amount that would have been determined had no impairment loss been recognised for the asset (cash-generating unit) in prior periods. A reversal of an impairment loss is recognised in profit or loss immediately, unless the relevant asset is carried at fair value, in which case the reversal of the impairment loss is treated as a revaluation increase.
g) Income tax Current tax
Current tax is calculated by reference to the amount of income taxes payable or recoverable in respect of the taxable profit or tax loss for the period. It is calculated using tax rates and tax laws that have been enacted or substantively enacted by reporting date. Current tax for current and prior periods is recognised as a liability (or asset) to the extent that it is unpaid (or refundable).
Deferred taxDeferred tax is accounted for using the comprehensive balance sheet liability method in respect of temporary differences arising from differences between the carrying amount of assets and liabilities in the financial statements and the corresponding tax base of those items.
In principle, deferred tax liabilities are recognised for all taxable temporary differences. Deferred tax assets are recognised to the extent that it is probable that sufficient taxable amounts will be available against which deductible temporary differences or unused tax losses and tax offsets can be utilised. However, deferred tax assets and liabilities are not recognised if the temporary differences giving rise to them arise from the initial recognition of assets and liabilities (other than as a result of a business combination) which affects neither taxable income nor accounting profit. Furthermore, a deferred tax liability is not recognised in relation to taxable temporary differences arising from goodwill.
Deferred tax assets and liabilities are measured at the tax rates that are expected to apply to the period(s) when the asset and liability giving rise to them are realised or settled, based on tax rates (and tax laws) that have been enacted or substantively enacting by reporting date. The measurement of deferred tax liabilities and assets reflects the tax consequences that would follow from the manner in which the consolidated entity expects, at the reporting date, to recover or settle the carrying amount of its assets and liabilities.
Deferred tax assets and liabilities are offset when they relate to income taxes levied by the same taxation authority and the company/consolidated entity intends to settle its current tax assets and liabilities on a net basis.
Current and deferred tax for the period Current and deferred tax is recognised as an expense or income in the Statement of Comprehensive Income, except when it relates to items credited or debited directly to equity, in which case the deferred tax is also recognised directly in equity, or where it arises from the initial accounting for a business combination, in which case it is taken into account in the determination of goodwill or excess.
Tax consolidation The Company and all its wholly-owned Australian resident entity are part of a tax-consolidated group under Australian taxation law. Andromeda Metals Limited is the head entity in the tax-consolidated group. Tax expense/income, deferred tax liabilities and deferred tax assets arising from temporary differences of the members of the tax-consolidated group are recognised in the separate financial statements of the members of the tax-consolidated group using the ‘separate taxpayer within group’ approach. Current tax liabilities and assets and deferred tax assets arising from unused tax losses and tax credits of the members of the tax-consolidated group are recognised by the Company (as head entity in the tax-consolidated group).
Due to the existence of a tax funding arrangement between the entities in the tax-consolidated group, amounts are recognised as payable to or receivable by the Company and each member of the group in relation to the tax contribution amounts paid or payable between the parent entity and the other members of the tax-consolidated group in accordance with the arrangement. Further information about the tax funding arrangement is detailed in Note 5 to the financial statements. Where the tax contribution amount recognised by each member of the tax-consolidated group for a particular period is different to the aggregate of the current tax liability or asset and any deferred tax asset arising from unused tax losses and tax credits in respect of that period, the difference is recognised as a contribution from (or distribution to) equity participants.
h) Joint venturesInterests in jointly controlled operations are reported in the financial statements by including the consolidated entity’s share of assets employed in the joint arrangements, the share of liabilities incurred in relation to the joint arrangements and the share of any expenses incurred in relation to the joint arrangements in their respective classification categories.
i) Financial instruments issued by the Company Debt and equity instruments
Debt and equity instruments are classified as either liabilities or as equity in accordance with the substance of the contractual arrangement. An equity instrument is any contract that evidences a residual interest in the assets of an entity after deducting all of its liabilities. Equity instruments issued by the Group are recorded at the proceeds received, net of direct issue costs.
ANDROMEDA METALS LIMITED36
Other financial liabilitiesOther financial liabilities are initially measured at fair value, net of transaction costs.
Other financial liabilities are subsequently measured at amortised cost using the effective interest method, with interest expense recognised on an effective yield basis.
The effective interest method is a method of calculating the amortised cost of a financial liability and of allocating interest expense over the relevant period. The effective interest rate is the rate that exactly discounts estimated future cash payments through the expected life of the financial liability, or, where appropriate, a shorter period.
j) Plant and equipmentPlant and equipment are stated at cost less accumulated depreciation and impairment. Cost includes expenditure that is directly attributable to the acquisition of the item. In the event that settlement of all or part of the purchase consideration is deferred, cost is determined by discounting the amounts payable in the future to their present value as at the date of acquisition.
Depreciation is provided on plant and equipment. Depreciation is calculated on a straight line basis so as to write off the net cost of each asset over its expected useful life to its estimated residual value. The estimated useful lives, residual values and depreciation method is reviewed at the end of each annual reporting period.
The following estimated useful lives are used in the calculation of depreciation:
¬ Plant and equipment – at cost 3-5 years
k) Principles of consolidationThe consolidated financial statements incorporate the financial statements of the Company and entities (including structured entities) controlled by the Company and its subsidiaries. Control is achieved when the Company:
¬ has power over the investee;
¬ is exposed, or has rights, to variable returns from its involvement with the investee; and
¬ has the ability to use its power to affect its returns.
The Company reassesses whether or not it controls an investee if facts and circumstances indicate that there are changes to one or more of the three elements of control listed above.
When the Company has less than a majority of the voting rights of an investee, it has power over the investee when the voting rights are sufficient to give it the practical ability to direct the relevant activities of the investee unilaterally. The Company considers all relevant facts and circumstances in assessing whether or not the Company’s voting rights in an investee are sufficient to give it power, including:
¬ the size of the Company’s holding of voting rights relative to the size and dispersion of holdings of the other vote holders;
¬ potential voting rights held by the Company, other vote holders or other parties;
¬ rights arising from other contractual arrangements; and
¬ any additional facts and circumstances that indicate that the Company has, or does not have, the current ability to direct the relevant activities at the time that decisions need to be made, including voting patterns at previous shareholders’ meetings.
Consolidation of a subsidiary begins when the Company obtains control over the subsidiary and ceases when the Company loses control of the subsidiary. Specifically, income and expenses of a subsidiary acquired or disposed of during the year are included in the consolidated statement of profit or loss and other comprehensive income from the date the Company gains control until the date when the Company ceases to control the subsidiary.
Profit or loss and each component of other comprehensive income are attributed to the owners of the Company and to the non-controlling interests. Total comprehensive income of subsidiaries is attributed to the owners of the Company and to the non-controlling interests even if this results in the non-controlling interests having a deficit balance.
When necessary, adjustments are made to the financial statements of subsidiaries to bring their accounting policies into line with the Group’s accounting policies.
All intragroup assets and liabilities, equity, income, expenses and cash flows relating to transactions between members of the Group are eliminated in full on consolidation.
Changes in the Group’s ownership interests in subsidiaries that do not result in the Group losing control over the subsidiaries are accounted for as equity transactions. The carrying amounts of the Group’s interests and the non-controlling interests are adjusted to reflect the changes in their relative interests in the subsidiaries. Any difference between the amount by which the non-controlling interests are adjusted and the fair value of the consideration paid or received is recognised directly in equity and attributed to owners of the Company.
When the Group loses control of a subsidiary, a gain or loss is recognised in profit or loss and is calculated as the difference between the aggregate of the fair value of the consideration received and the fair value of any retained interest and the previous carrying amount of the assets (including goodwill), and liabilities of the subsidiary and any non-controlling interests. All amounts previously recognised in other comprehensive income in relation to that subsidiary are accounted for as if the Group had directly disposed of the related assets or liabilities of the subsidiary (i.e. reclassified to profit or loss or transferred to another category of equity as specified/permitted by applicable AASBs). The fair value of any investment retained in the former subsidiary at the date when control is lost is regarded as the fair value on initial recognition for subsequent accounting under AASB 139, when applicable, the cost on initial recognition of an investment in an associate or a joint venture.
ANNUAL REPORT 2017 37
i) Revenue Interest revenue
Interest revenue is accrued on a time basis, by reference to the principal outstanding and at the effective interest rate applicable, which is that rate that exactly discounts estimated future cash receipts through the expected life of the financial asset to that asset’s net carrying amount.
m) Share-based paymentsEquity-settled share-based payments to employees and others providing similar services are measured at the fair value of the equity instruments at the grant date. Details regarding the determination of the fair value of equity-settled share-based transactions are set out in Note 16.
The fair value determined at the grant date of the equity-settled share-based payments is expensed on a straight-line basis over the vesting period, based on the Group’s estimate of equity instruments that will eventually vest, with a corresponding increase in equity. At the end of each reporting period, the Group revises its estimate of the number of equity instruments expected to vest. The impact of the revision of the original estimates, if any, is recognised in profit or loss such that the cumulative expense reflects the revised estimate, with a corresponding adjustment to the equity-settled employee benefits reserve.
n) Government grantsGovernment grants are assistance by government in the form of transfers of resources to the Group in return for past or future compliance with certain conditions relating to the operating activities of the entity.
Government grants are not recognised until there is reasonable assurance that the Group will comply with the conditions attached to them and the grant will be received. Government grants whose primary condition is to assist with exploration activities are recognised as deferred income in the balance sheet and recognised as income on a systematic basis when the related exploration and evaluation is written off.
Other government grants are recognised as income over the periods necessary to match them with the related costs which they are intended to compensate on a systematic basis. Government grants receivable as compensation for expenses or losses already incurred or for the purpose of giving immediate financial support to the consolidated entity with no future related costs are recognised as income in the period in which it becomes receivable.
o) Business combinationsAcquisitions of subsidiaries and businesses are accounted for using the acquisition method. The consideration for each acquisition is measured at the aggregate of their fair values (at the date of exchange) of assets given, liabilities incurred or assumed, and equity instruments issued by the Group in exchange for control of the acquiree. Acquisition-related costs are recognised in profit or loss as incurred.
Where applicable, the consideration for the acquisition includes any asset or liability resulting from a contingent consideration arrangement, measured at its acquisition-date fair value. Subsequent changes in such fair values are adjusted against the cost of acquisition where they qualify as measurement period adjustments (see below). All other subsequent changes in the fair value of contingent consideration classified as an asset or liability are accounted for in accordance with relevant Standards. Changes in the fair value of contingent consideration classified as equity are not recognised.
Where a business combination is achieved in stages, the Group’s previously held interests in the acquired entity are remeasured to fair value at the acquisition date (i.e. the date the Group attains control) and the resulting gain or loss, if any, is recognised in profit or loss. Amounts arising from interest in the acquiree prior to the acquisition date that have previously been recognised in other comprehensive income are reclassified to profit or loss, where such treatment would be appropriate if that interest were disposed of.
The acquiree’s identifiable assets, liabilities and contingent liabilities that meet the conditions for recognition under AASB 3(2008) are recognised at their fair value at the acquisition date, except that:
¬ deferred tax assets or liabilities and liabilities or assets related to employee benefit arrangements are recognised and measured in accordance with AASB 112 “Income Taxes” and AASB 119 “Employee Benefits” respectively;
¬ liabilities or equity instruments related to the replacement by the Group of an acquiree’s share-based payment awards are measured in accordance with AASB 2 “Share-based Payment”; and
¬ assets (or disposal groups) that are classified as held for sale in accordance with AASB 5 “Non-current Assets Held for Sale and Discontinued Operations” are measured in accordance with that Standard.
If the initial accounting for a business combination is incomplete by the end of the reporting period in which the combination occurs, the Group reports provisional amounts for the items for which the accounting is incomplete. Those provisional amounts are adjusted during the measurement period (see below), or additional assets or liabilities are recognised, to reflect new information obtained about facts and circumstances that existed as of the acquisition date that, if known, would have affected the amounts recognised as of that date.
The measurement period is the period from the date of acquisition to the date the Group obtains complete information about facts and circumstances that existed as of the acquisition date, and is subject to a maximum of one year.

ANDROMEDA METALS LIMITED38
4. LOSS FROM OPERATIONSYear ended
30/06/17$
Year ended30/06/16
$
a) Revenue from continuing operations consisted of the following items
Interest income:
Bank deposits 4,989 15,443
b) Loss for the year includes the following gains and losses
Other income
Gain on sale of plant and equipment 19,467 -
Government grants 108,777 87,500
Change in fair value of equity options (Note 11) 2,368 -
Sub-lease rent and administration charge 7,125 -
Other 3,869 650
141,606 88,150
Other expenses
Employee benefit expense:
Post employment benefits:
Accumulated benefit superannuation plans 25,045 50,129
Share based payments:
Equity settled share-based payments (shares issued under the LFESP)(i)
34,437 43,265
Termination benefits - 70,604
Other employee benefits 635,229 999,290
694,711 1,163,288
Less amounts capitalised in exploration and evaluation expenditure
(349,845) (605,637)
344,866 557,651
Share based remuneration (employees)(i):
Current year amortisation of performance rights or shares issued under the LFESP
34,437 43,265
Shares forfeited as conditions not achieved (19,566) (28,065)
14,871 15,200
Depreciation of plant and equipment 21,184 44,631
Operating lease rental expenses 55,200 73,299
i) Share based payments relate to the amortisation of shares granted under the LFESP to employees. Shares granted under the LFESP do not represent cash payments and may or may not be exercised (paying the related loan amount) by the employee.

ANNUAL REPORT 2017 39
5. INCOME TAX
Year ended30/06/17
$
Year ended30/06/16
$
a) Income tax recognised in profit or loss
The prima facie income tax expense on the loss before income tax reconciles to the tax expense in the financial statements as follows:
Loss from continuing operations (6,847,987) (3,882,933)
Income tax income calculated at 30% (2,054,396) (1,164,880)
Share based payments 4,461 4,560
Change in fair value of equity options (710) -
Other 175 1,710
Tax losses previously recognised now not recognised 1,689,677 560,848
Current year tax losses not recognised 421,653 655,153
Tax expense 60,860 57,391
The tax rate used in the above reconciliation is the corporate tax rate of 30% payable by Australian corporate entities on taxable profits under Australian tax law. There has been no change in the corporate tax rate when compared with the previous reporting period.
b) Recognised tax assets and liabilities
Deferred tax assets and liabilities are attributable to the following:
Trade and other receivables (129) (91)
Exploration and evaluation expenditure (1,307,467) (2,993,576)
Capital raising costs 107,795 100,710
Trade and other payables 39,155 16,477
Employee benefits 2,764 3,488
Other liabilities 33,450 58,883
(1,124,432) (2,814,109)
Tax value of losses carried forward 1,124,432 2,814,109
Net deferred tax assets / (liabilities) - -
c) Unrecognised deferred tax assets:
A deferred tax asset has not been recognised in respect of the following item:
Tax losses-revenue 9,227,403 7,116,073
A deferred tax asset has not been recognised in respect of the above tax losses because it is not probable that future taxable profit will be available against which the consolidated entity can utilise the benefit.
d) Movement in recognised temporary differences and tax losses
Opening balance - -
Recognised in equity 60,860 57,391
Recognised in income (60,860) (57,391)
Closing balance - -

ANDROMEDA METALS LIMITED40
Tax consolidation Relevance of tax consolidation to the consolidated entity
The Company and its wholly-owned Australian resident entities are in a tax-consolidated group and are therefore taxed as a single entity. The head entity within the tax consolidated group is Andromeda Metals Limited.
Nature of tax funding arrangementEntities within the tax-consolidated group have entered into a tax funding arrangement with the head entity. Under the terms of the tax funding arrangement, Andromeda Metals Limited and its wholly owned Australian resident entities have agreed to pay a tax equivalent payment to or from the head entity, based on the current tax liability or current tax asset of the entity. Such amounts are reflected in amounts receivable from or payable to other entities in the-consolidated group.
6. CURRENT TRADE AND OTHER RECEIVABLES
Year ended30/06/17
$
Year ended30/06/16
$
Interest receivable 431 304
Other receivables 36,481 54,001
36,912 54,305
7. OTHER NON-CURRENT FINANCIAL ASSETS
Year ended30/06/17
$
Year ended30/06/16
$
At amortised cost:
Bank deposits (Note 21 (e)) 92,500 92,500
Environmental bonds 31,047 7,671
123,547 100,171
8. EXPLORATION AND EVALUATION EXPENDITURE
Year ended30/06/17
$
Year ended30/06/16
$
Costs brought forward 9,978,588 11,759,726
Expenditure incurred during the year 702,281 1,186,677
10,680,869 12,946,403
Expenditure impaired (6,069,107) (2,452,260)
Expenditure written off (253,540) (515,555)
4,358,222 9,978,588
Exploration impaired relates to exploration and evaluation expenditure associated with projects where the Group is not currently planning to carry out any further work.
Expenditure written off relates to exploration and evaluation expenditure associated with tenements or parts of tenements that have been surrendered.
The recoverability of the carrying value of the exploration and evaluation assets is dependent on successful development and commercial exploitation, or alternatively, sale of the respective areas of interest.
ANNUAL REPORT 2017 41
9. PLANT AND EQUIPMENT
Year ended30/06/17
$
Year ended30/06/16
$
Gross carrying amount
Balance at beginning of financial year 423,947 423,249
Additions 3,057 698
Disposals and write offs (39,773) -
Balance at end of financial year 387,231 423,947
Accumulated depreciation
Balance at beginning of financial year (399,027) (354,396)
Depreciation for year (21,184) (44,631)
Disposals and write offs 37,240 -
Balance at end of financial year (382,971) (399,027)
Net book value at beginning of financial year 24,920 68,853
Net book value at end of financial year 4,260 24,920
10. CURRENT LIABILITIES – TRADE AND OTHER PAYABLES
Year ended30/06/17
$
Year ended30/06/16
$
Trade payables and accruals 195,705 195,964
11. CURRENT LIABILITIES – OTHER
Year ended30/06/17
$
Year ended30/06/16
$
Movement in equity options
Balance at the beginning of the year - -
Value on issue 68,681 -
Change in fair value (2,368) -
Closing value 66,313 -
The equity option relates to the piggy back option as disclosed in Note 14 and Note 22.
This liability will not result in a payment by the Group, as when the equity options are exercised the amount associated with the exercised option will be transferred to equity and if the options are not exercised by the expiry date, 31 March 2018, the equity option will be transferred to the profit and loss.
12. NON-CURRENT LIABILITIES - PROVISIONS
30/06/17$
30/06/16$
Employee benefits 9,214 11,626
13. NON-CURRENT LIABILITIES – OTHER
30/06/17$
30/06/16$
Deferred income (government grant) 888,152 793,400
ANDROMEDA METALS LIMITED42
14. ISSUED CAPITAL
Year ended30/06/17
$
Year ended30/06/16
$
453,104,875 fully paid ordinary shares (2016: 361,326,414)
38,178,264 37,157,787
Treasury stock (122,920) (122,920)
38,055,344 37,034,867
Movement in issued shares for the year:
Number Year ended30/06/17
$
Number Year ended30/06/16
$
Fully paid ordinary shares
Balance at beginning of financial year 361,326,414 37,157,787 304,545,685 36,233,820
Placement at 1.9 cents 42,950,000 816,050 - -
Broker incentive shares associated with placement 1,466,232 35,190 - -
Exercise of listed options 24,417 1,221 - -
Rights issue at 0.8 cents less the value of equity options (see Note 11)
47,337,812 310,022 - -
Share Purchase Plan and top-up placement at 2.0 cents - - 46,376,667 927,533
Share issue under Loan Funded Employee Share Plan at 1.0 cent
- - 7,000,000 70,000
Share issue under Loan Funded Employee Share Plan at 1.8 cents
- - 2,940,000 52,920
Share issue as part payment to a consultant at 1.6 cents - - 464,062 7,425
Costs associated with the issue of shares - (202,866) - (191,302)
Related income tax - 60,860 - 57,391
Balance at end of financial year 453,104,875 38,178,264 361,326,414 37,157,787
Treasury stock
Balance at beginning of financial year (9,940,000) (122,920) - -
Share issue under Loan Funded Employee Share Plan at 1.0 cent
- - (7,000,000) (70,000)
Share issue under Loan Funded Employee Share Plan at 1.8 cents
- - (2,940,000) (52,920)
Balance at end of financial year (9,940,000) (122,920) (9,940,000) (122,920)
Total issued capital 443,164,875 38,055,344 351,386,414 37,034,867
Changes to the then Corporations Law abolished the authorised capital and par value concept in relation to share capital from 1 July 1998. Therefore, the Company does not have a limited amount of authorised capital and issued shares do not have a par value.
Fully paid shares carry one vote per share and carry the right to dividends.
On 23 May 2017 the Company issued 47,337,812 ordinary shares after undertaking a non-renounceable rights issue of one new shares for every two shares held at an issue price of $0.008 cents per share. The Company also issued one free attaching option for every two new shares purchased with an exercise price of $0.012 cents and an expiry date of 31 March 2018. Each new option upon exercise will receive one new piggy back option having an exercise price of $0.015 cents and an expiry date of 31 March 2019. The Company issued 23,668,938 options. The rights raised $378,703 before costs and expenses.
As the new option will result in a piggy back option being granted on exercise, AASB 132 “Financial Instruments: Presentation” requires the option to be treated as a financial liability instead of equity. Therefore, the Company recognised the option as a financial liability at fair value through profit and loss. See Note 11 and Note 22.
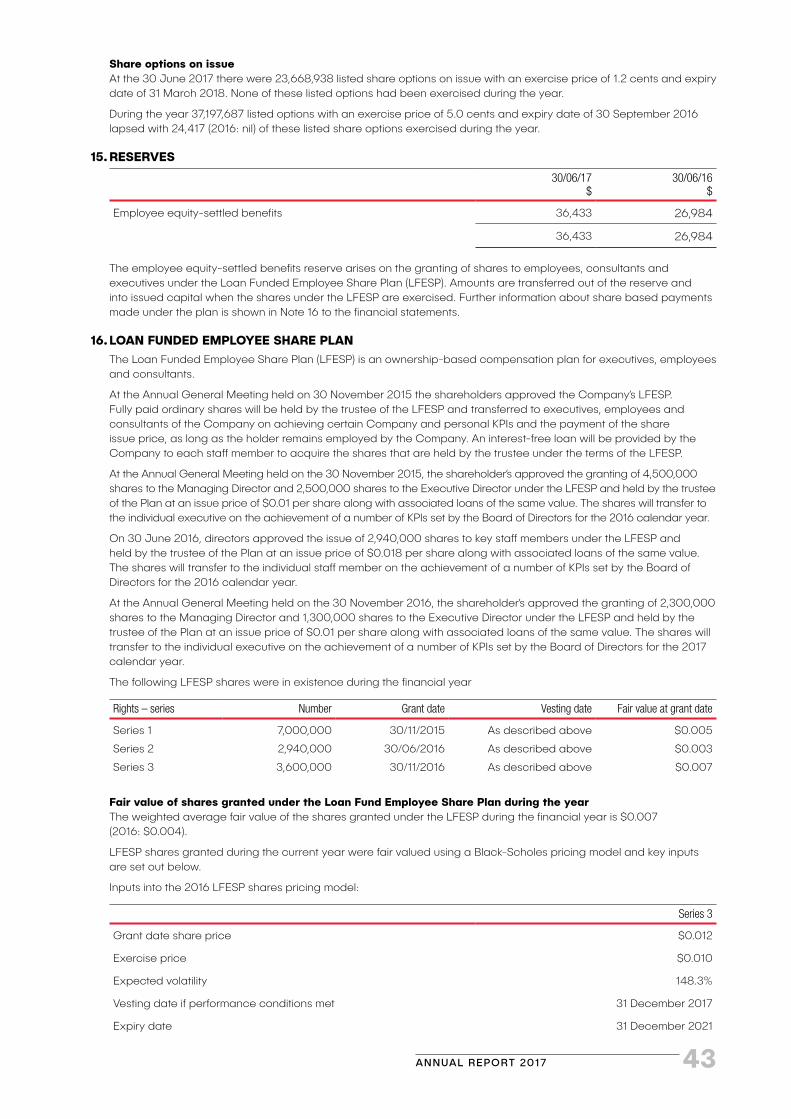
ANNUAL REPORT 2017 43
Share options on issueAt the 30 June 2017 there were 23,668,938 listed share options on issue with an exercise price of 1.2 cents and expiry date of 31 March 2018. None of these listed options had been exercised during the year.
During the year 37,197,687 listed options with an exercise price of 5.0 cents and expiry date of 30 September 2016 lapsed with 24,417 (2016: nil) of these listed share options exercised during the year.
15. RESERVES
30/06/17$
30/06/16$
Employee equity-settled benefits 36,433 26,984
36,433 26,984
The employee equity-settled benefits reserve arises on the granting of shares to employees, consultants and executives under the Loan Funded Employee Share Plan (LFESP). Amounts are transferred out of the reserve and into issued capital when the shares under the LFESP are exercised. Further information about share based payments made under the plan is shown in Note 16 to the financial statements.
16. LOAN FUNDED EMPLOYEE SHARE PLANThe Loan Funded Employee Share Plan (LFESP) is an ownership-based compensation plan for executives, employees and consultants.
At the Annual General Meeting held on 30 November 2015 the shareholders approved the Company’s LFESP. Fully paid ordinary shares will be held by the trustee of the LFESP and transferred to executives, employees and consultants of the Company on achieving certain Company and personal KPIs and the payment of the share issue price, as long as the holder remains employed by the Company. An interest-free loan will be provided by the Company to each staff member to acquire the shares that are held by the trustee under the terms of the LFESP.
At the Annual General Meeting held on the 30 November 2015, the shareholder’s approved the granting of 4,500,000 shares to the Managing Director and 2,500,000 shares to the Executive Director under the LFESP and held by the trustee of the Plan at an issue price of $0.01 per share along with associated loans of the same value. The shares will transfer to the individual executive on the achievement of a number of KPIs set by the Board of Directors for the 2016 calendar year.
On 30 June 2016, directors approved the issue of 2,940,000 shares to key staff members under the LFESP and held by the trustee of the Plan at an issue price of $0.018 per share along with associated loans of the same value. The shares will transfer to the individual staff member on the achievement of a number of KPIs set by the Board of Directors for the 2016 calendar year.
At the Annual General Meeting held on the 30 November 2016, the shareholder’s approved the granting of 2,300,000 shares to the Managing Director and 1,300,000 shares to the Executive Director under the LFESP and held by the trustee of the Plan at an issue price of $0.01 per share along with associated loans of the same value. The shares will transfer to the individual executive on the achievement of a number of KPIs set by the Board of Directors for the 2017 calendar year.
The following LFESP shares were in existence during the financial year
Rights – series Number Grant date Vesting date Fair value at grant date
Series 1
Series 2
Series 3
7,000,000
2,940,000
3,600,000
30/11/2015
30/06/2016
30/11/2016
As described above
As described above
As described above
$0.005
$0.003
$0.007
Fair value of shares granted under the Loan Fund Employee Share Plan during the yearThe weighted average fair value of the shares granted under the LFESP during the financial year is $0.007 (2016: $0.004).
LFESP shares granted during the current year were fair valued using a Black-Scholes pricing model and key inputs are set out below.
Inputs into the 2016 LFESP shares pricing model:
Series 3
Grant date share price $0.012
Exercise price $0.010
Expected volatility 148.3%
Vesting date if performance conditions met 31 December 2017
Expiry date 31 December 2021
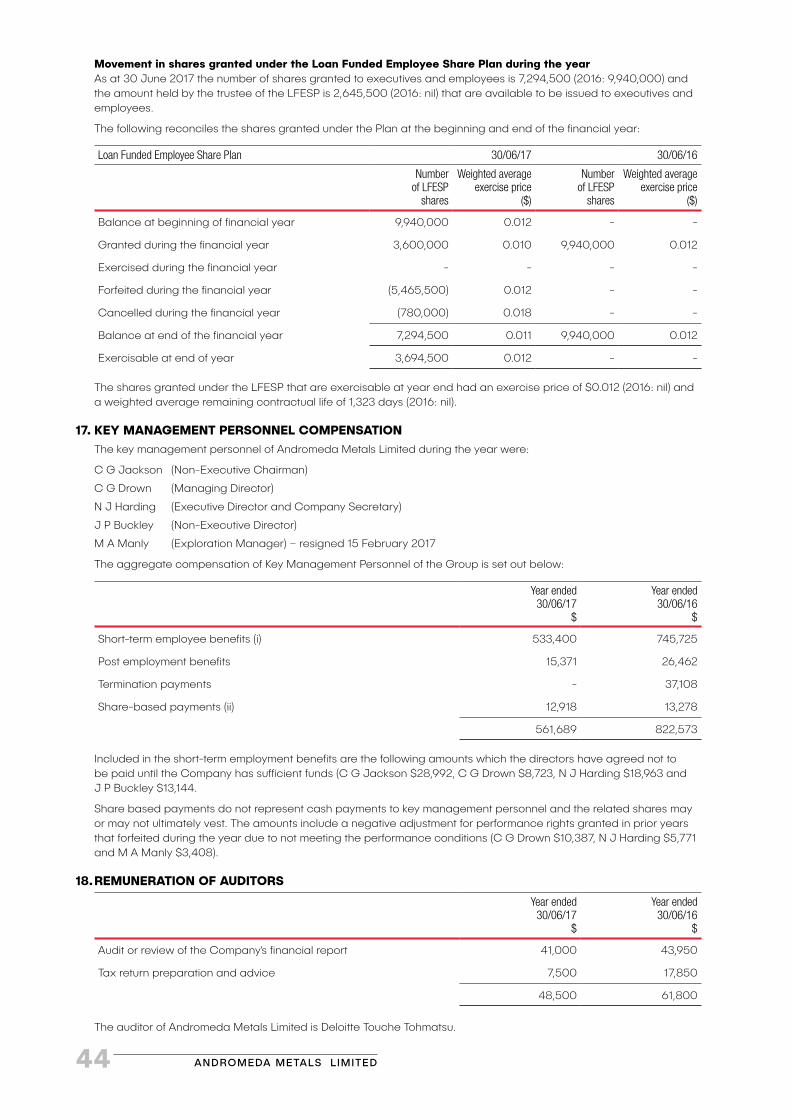
ANDROMEDA METALS LIMITED44
Movement in shares granted under the Loan Funded Employee Share Plan during the yearAs at 30 June 2017 the number of shares granted to executives and employees is 7,294,500 (2016: 9,940,000) and the amount held by the trustee of the LFESP is 2,645,500 (2016: nil) that are available to be issued to executives and employees.
The following reconciles the shares granted under the Plan at the beginning and end of the financial year:
Loan Funded Employee Share Plan 30/06/17 30/06/16
Number of LFESP
shares
Weighted average exercise price
($)
Number of LFESP
shares
Weighted average exercise price
($)
Balance at beginning of financial year 9,940,000 0.012 - -
Granted during the financial year 3,600,000 0.010 9,940,000 0.012
Exercised during the financial year - - - -
Forfeited during the financial year (5,465,500) 0.012 - -
Cancelled during the financial year (780,000) 0.018 - -
Balance at end of the financial year 7,294,500 0.011 9,940,000 0.012
Exercisable at end of year 3,694,500 0.012 - -
The shares granted under the LFESP that are exercisable at year end had an exercise price of $0.012 (2016: nil) and a weighted average remaining contractual life of 1,323 days (2016: nil).
17. KEY MANAGEMENT PERSONNEL COMPENSATIONThe key management personnel of Andromeda Metals Limited during the year were:
C G Jackson (Non-Executive Chairman)
C G Drown (Managing Director)
N J Harding (Executive Director and Company Secretary)
J P Buckley (Non-Executive Director)
M A Manly (Exploration Manager) – resigned 15 February 2017
The aggregate compensation of Key Management Personnel of the Group is set out below:
Year ended30/06/17
$
Year ended30/06/16
$
Short-term employee benefits (i) 533,400 745,725
Post employment benefits 15,371 26,462
Termination payments - 37,108
Share-based payments (ii) 12,918 13,278
561,689 822,573
Included in the short-term employment benefits are the following amounts which the directors have agreed not to be paid until the Company has sufficient funds (C G Jackson $28,992, C G Drown $8,723, N J Harding $18,963 and J P Buckley $13,144.
Share based payments do not represent cash payments to key management personnel and the related shares may or may not ultimately vest. The amounts include a negative adjustment for performance rights granted in prior years that forfeited during the year due to not meeting the performance conditions (C G Drown $10,387, N J Harding $5,771 and M A Manly $3,408).
18. REMUNERATION OF AUDITORS
Year ended30/06/17
$
Year ended30/06/16
$
Audit or review of the Company’s financial report 41,000 43,950
Tax return preparation and advice 7,500 17,850
48,500 61,800
The auditor of Andromeda Metals Limited is Deloitte Touche Tohmatsu.

ANNUAL REPORT 2017 45
19. RELATED PARTY DISCLOSURES a) Equity interests in related parties Equity interests in subsidiaries
Details of the percentage of ordinary shares held in subsidiaries are disclosed in Note 25 to the financial statements.
Interests in joint venturesDetails of interests in joint ventures are disclosed in Note 20 to the financial statements.
b) Key management personnel compensationDetails of key management personnel compensation are disclosed in Note 17.
c) Transactions with key management personnelOther than as disclosed in Note 16 and Note 21(d), there were no transactions with key management personnel or their personally related entities during the year ended 30 June 2017 (2016: Nil).
20. JOINTLY CONTROLLED ASSETSThe Group had interests in unincorporated joint arrangements at 30 June 2017 as follows:
Percentage interest2017
Percentage interest2016
Moonta Porphyry Joint Venture (Note i) – Copper/gold exploration 90% 90%
Kimba-Verran Joint Venture – Copper/gold exploration 0% 90%
Thurlga Joint Venture (Note ii) – Copper/gold exploration 25% 100%
Rover Joint Venture (Note iii) – Copper/gold exploration 100% N/A
i) The Group has an option to purchase the remaining 10% at any time for a consideration of $200,000 cash or the equivalent of $200,000 in Andromeda Metals Limited shares.
ii) Under the terms of the joint venture agreement, Investigator Resources Limited (IVR) was required to spend $750,000 by 30 June 2017 on exploration activities on the Group’s Thurlga tenement located on the Eyre Peninsula to earn a 75% equity interest in the tenement. Thereafter each party may contribute to ongoing expenditure in respect to their joint venture holding or else elect to dilute. Should a party’s equity fall to 5%, its share will be automatically acquired by the other party in exchange for a 1% Net Smelter Royalty. IVR had met its expenditure obligation by 30 June 2017 and had earned a 75% equity in the Thurlga Joint Venture.
iii) Under the terms of the Rover Farm-in and joint venture agreement, Emmerson Resources Limited (ERM) is required to spend $2,000,000 by 11 November 2019 on exploration activities to earn a 51% equity interest in the Group’s Rover Project, located southwest of Tennant Creek in the Northern Territory. ERM can the elect to sole fund a further $2,000,000 over an additional 3 year period to increase its equity to 75%. Thereafter each party may contribute to ongoing expenditure in respect to their joint venture holding or else elect to dilute. Should a party’s equity fall to 5%, its share may at any time be acquired by the other party at a price to be negotiated. See Note 27 where this joint venture is the process of being terminated.
The amount included in mining tenements, exploration and evaluation (Note 8) includes $44,379 (2016: $213,757) relating to the above joint arrangements.
21. COMMITMENTS FOR EXPENDITURE AND CONTINGENT LIABILITIES a) Exploration Expenditure Commitments
The Group has certain obligations to perform exploration work and expend minimum amounts of money on such works on mineral exploration tenements.
These obligations will vary from time to time, subject to statutory approval. The terms of current and future joint ventures, the grant or relinquishment of licences and changes to licence areas at renewal or expiry, will alter the expenditure commitments of the Company.
Total expenditure commitments at balance date in respect of minimum expenditure requirements not provided for in the financial statements are approximately:
Year ended2017
$
Year ended2016
$
Not later than one year: 1,057,093 627,761
Later than one year but not later than two years: 1,441,023 632,750
Later than two years but not later than five years: 4,533,338 1,973,250

ANDROMEDA METALS LIMITED46
b) Rover Project – Northern TerritoryUnder an agreement entered into with Newmont Gold Exploration Pty Ltd (“Newmont”) on 28 February 2005, Adelaide Exploration Limited acquired a 100% interest in the Rover Project (Exploration Licences 27292 and 27372) located near Tennant Creek, Northern Territory, on the following terms.
¬ A minimum of $400,000 to be spent on exploration activities within 18 months of approval being received from the Central Land Council. This obligation had been met by December 2005.
¬ A net smelter return royalty to Newmont ranging from 1.5% to 2.5% after production, and
¬ The grant of a once only option to Newmont to buy back a 70% interest should a resource of more than 2 million gold ounces be discovered, by paying Adelaide Exploration Limited the lesser of $A20 million or three times the expenditure by Adelaide Exploration Limited from the date of execution of the agreement.
¬ Under an agreement entered into with Adelaide Exploration Limited, Andromeda Metals Limited and Franco-Nevada Australia Pty Ltd (“Franco”) dated 11 February 2009; Newmont assigned its interest in the royalty buy back to Franco.
c) Newcrest Mining royalty deedBy a Royalty Deed dated 13 February 2002 the Group is obliged to pay to Newcrest Mining Limited a royalty of 1.5% of the gross proceeds received from the sale of refined minerals, less allowable deductions, mined from certain tenements on the Eyre Peninsula, South Australia.
d) Service agreementsThe Group entered into service agreements with entities associated with C G Drown and N J Harding for a term of six months to 30 June 2016. Both service agreements have since continued under the same terms while the Company is sourcing sufficient funding at which time new service agreements will be formalised.
Details of the current services and consultancy agreements are set out below:
2017
Key management personnel Terms
C G Drown Daily rate of $860.
N J Harding Daily rate of $765.
From 1 February 2017, 30% of the above daily rates are being deferred and recorded as an accrual and will be paid when the Company has sufficient funds.
2016
Key management personnel Terms
C G Drown Daily rate of $1,250 for a minimum of 210 days per annum until 31 December 2015 when the daily rate was reduced to $860.
N J Harding Daily rate of $1,050 for a minimum of 40 hours per month until 31 December 2015 when the daily rate was reduced to $765.
The Company may terminate any of the above agreements by giving one month and two months notice to the entities associated with C G Drown and N J Harding respectively. The entities associated with the key management personnel may terminate their agreements with one and two months’ notice respectively. The Group has a contingent liability of $47,800 (2016: $47,800) in relation to these agreements, where the employee is not required to work out the notice period.
The Group entered into a consultancy agreement with J P Buckley on 7 April 2014 to provide consulting services on an as needs basis at the rate of $2,000 per day. There were no payments made under this agreement during the year (2016: $nil).
e) Bank guaranteesThe Group has provided restricted cash deposits of $92,500 as security for the following unconditional irrevocable bank guarantees:
¬ A performance bond of $50,000 (2016: $50,000) to the Central Land Council, Northern Territory,
¬ An environment bond of $10,000 (2016: $10,000) to the Minister for Mineral Resources Department, South Australia,
¬ A rent guarantee of $32,500 (2016: $32,500) to the landlord of the Company’s leased office premises.
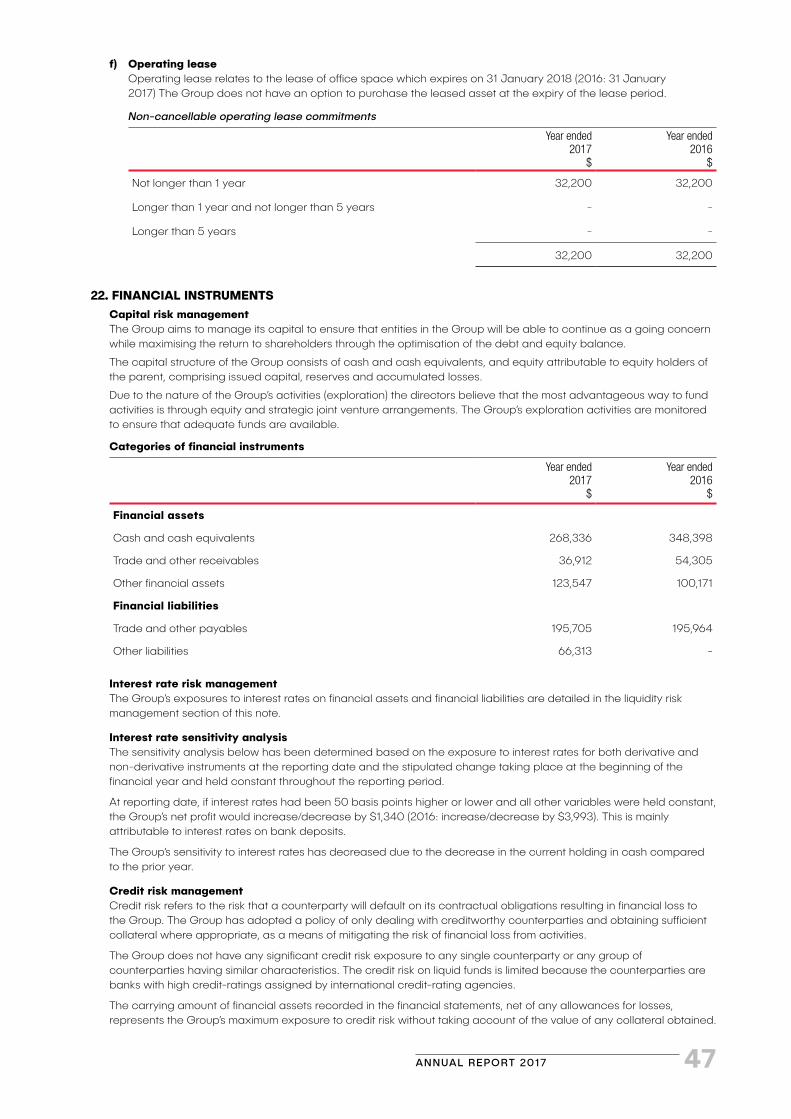
ANNUAL REPORT 2017 47
f) Operating lease Operating lease relates to the lease of office space which expires on 31 January 2018 (2016: 31 January 2017) The Group does not have an option to purchase the leased asset at the expiry of the lease period.
Non-cancellable operating lease commitments
Year ended2017
$
Year ended2016
$
Not longer than 1 year 32,200 32,200
Longer than 1 year and not longer than 5 years - -
Longer than 5 years - -
32,200 32,200
22. FINANCIAL INSTRUMENTS Capital risk management
The Group aims to manage its capital to ensure that entities in the Group will be able to continue as a going concern while maximising the return to shareholders through the optimisation of the debt and equity balance.
The capital structure of the Group consists of cash and cash equivalents, and equity attributable to equity holders of the parent, comprising issued capital, reserves and accumulated losses.
Due to the nature of the Group’s activities (exploration) the directors believe that the most advantageous way to fund activities is through equity and strategic joint venture arrangements. The Group’s exploration activities are monitored to ensure that adequate funds are available.
Categories of financial instruments
Year ended2017
$
Year ended2016
$
Financial assets
Cash and cash equivalents 268,336 348,398
Trade and other receivables 36,912 54,305
Other financial assets 123,547 100,171
Financial liabilities
Trade and other payables 195,705 195,964
Other liabilities 66,313 -
Interest rate risk managementThe Group’s exposures to interest rates on financial assets and financial liabilities are detailed in the liquidity risk management section of this note.
Interest rate sensitivity analysisThe sensitivity analysis below has been determined based on the exposure to interest rates for both derivative and non-derivative instruments at the reporting date and the stipulated change taking place at the beginning of the financial year and held constant throughout the reporting period.
At reporting date, if interest rates had been 50 basis points higher or lower and all other variables were held constant, the Group’s net profit would increase/decrease by $1,340 (2016: increase/decrease by $3,993). This is mainly attributable to interest rates on bank deposits.
The Group’s sensitivity to interest rates has decreased due to the decrease in the current holding in cash compared to the prior year.
Credit risk managementCredit risk refers to the risk that a counterparty will default on its contractual obligations resulting in financial loss to the Group. The Group has adopted a policy of only dealing with creditworthy counterparties and obtaining sufficient collateral where appropriate, as a means of mitigating the risk of financial loss from activities.
The Group does not have any significant credit risk exposure to any single counterparty or any group of counterparties having similar characteristics. The credit risk on liquid funds is limited because the counterparties are banks with high credit-ratings assigned by international credit-rating agencies.
The carrying amount of financial assets recorded in the financial statements, net of any allowances for losses, represents the Group’s maximum exposure to credit risk without taking account of the value of any collateral obtained.

ANDROMEDA METALS LIMITED48
Liquidity risk managementUltimate responsibility for liquidity risk management rests with the Board of Directors, who has built an appropriate liquidity risk management framework for the management of the Group’s short, medium and long-term funding and liquidity management requirements. The Group manages liquidity risk by maintaining adequate reserves.
Liquidity and interest risk tablesThe following table details the Group’s remaining contractual maturity for its non-derivative financial liabilities. The table has been drawn up based on the undiscounted cash flows of financial liabilities based on the earliest date on which the Group can be required to pay. The table includes both interest and principal cash flows.
Weighted average effective interest rate
%
Less than one year
$
2017Non-interest bearing - 262,018
2016Non-interest bearing - 195,964
Fair value of financial instrumentsThe fair values of financial assets and financial liabilities are determined as follows:
• the fair value of financial assets and financial liabilities with standard terms and conditions and traded on active liquid markets are determined with reference to quoted market prices.
• the fair value of other financial assets and financial liabilities (excluding derivative instruments) are determined in accordance with generally accepted pricing models based on discounted cash flow analysis using prices from observable current market transactions.
The following table gives information about how the fair values of equity options are determined (in particular the valuation technique(s) and inputs used).
Financial assets / Financial liabilities
Fair value as at30/06/17
$
Fair value at30/06/16
$
Fair value hierarchy
Valuation technique(s) and key inputs
Significant unobservable input(s)
Relationship of unobservable inputs to fair value
Other financial liability – equity options
66,313 - Level 3 Black Scholes pricing model. The option call price was estimated based on the market observable share price, historical share price volatility and prevailing interest rates
The share price volatility used in the valuation was estimated based on the average volatility of a peer group of companies
A higher stock price volatility would result in a higher fair value, and vice versa
Fair value of financial assets and financial liabilities that are not measured at fair value on a recurring basis (but fair value disclosures are required).
The directors consider that the carrying amounts of financial assets and financial liabilities recognised in the consolidated financial statements approximate their fair values.
Reconciliation of Level 3 fair value measurements:
Held at maturity – Options for company equities
$
Opening balance -
Issued during the year 66,681
Change in air value taken to profit or loss (2,368)
Closing balance 66,313
23. SEGMENT INFORMATIONThe Group has a number of exploration licenses in Australia which are managed on a portfolio basis. The decision to allocate resources to individual projects in the portfolio is predominantly based on available cash reserves, technical data and the expectations of future metal prices. Accordingly, the Group effectively operates as one segment, being exploration in Australia. This is the basis on which internal reports are provided to the directors for assessing performance and determining the allocation of resources within the Group.
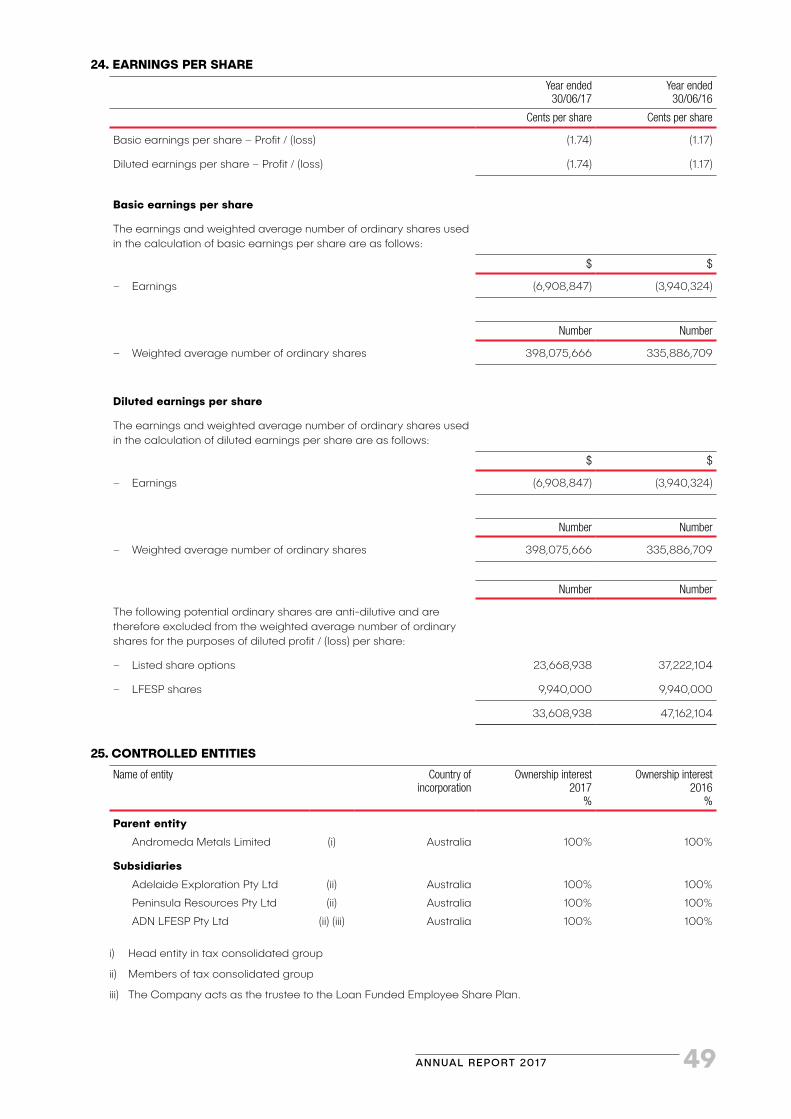
ANNUAL REPORT 2017 49
24. EARNINGS PER SHARE
Year ended30/06/17
Year ended30/06/16
Cents per share Cents per share
Basic earnings per share – Profit / (loss) (1.74) (1.17)
Diluted earnings per share – Profit / (loss) (1.74) (1.17)
Basic earnings per share
The earnings and weighted average number of ordinary shares used in the calculation of basic earnings per share are as follows:
$ $
– Earnings (6,908,847) (3,940,324)
Number Number
– Weighted average number of ordinary shares 398,075,666 335,886,709
Diluted earnings per share
The earnings and weighted average number of ordinary shares used in the calculation of diluted earnings per share are as follows:
$ $
– Earnings (6,908,847) (3,940,324)
Number Number
– Weighted average number of ordinary shares 398,075,666 335,886,709
Number Number
The following potential ordinary shares are anti-dilutive and are therefore excluded from the weighted average number of ordinary shares for the purposes of diluted profit / (loss) per share:
– Listed share options 23,668,938 37,222,104
– LFESP shares 9,940,000 9,940,000
33,608,938 47,162,104
25. CONTROLLED ENTITIES
Name of entity Country of incorporation
Ownership interest2017
%
Ownership interest2016
%
Parent entity
Andromeda Metals Limited (i) Australia 100% 100%
Subsidiaries
Adelaide Exploration Pty Ltd
Peninsula Resources Pty Ltd
ADN LFESP Pty Ltd
(ii)
(ii)
(ii) (iii)
Australia
Australia
Australia
100%
100%
100%
100%
100%
100%
i) Head entity in tax consolidated group
ii) Members of tax consolidated group
iii) The Company acts as the trustee to the Loan Funded Employee Share Plan.
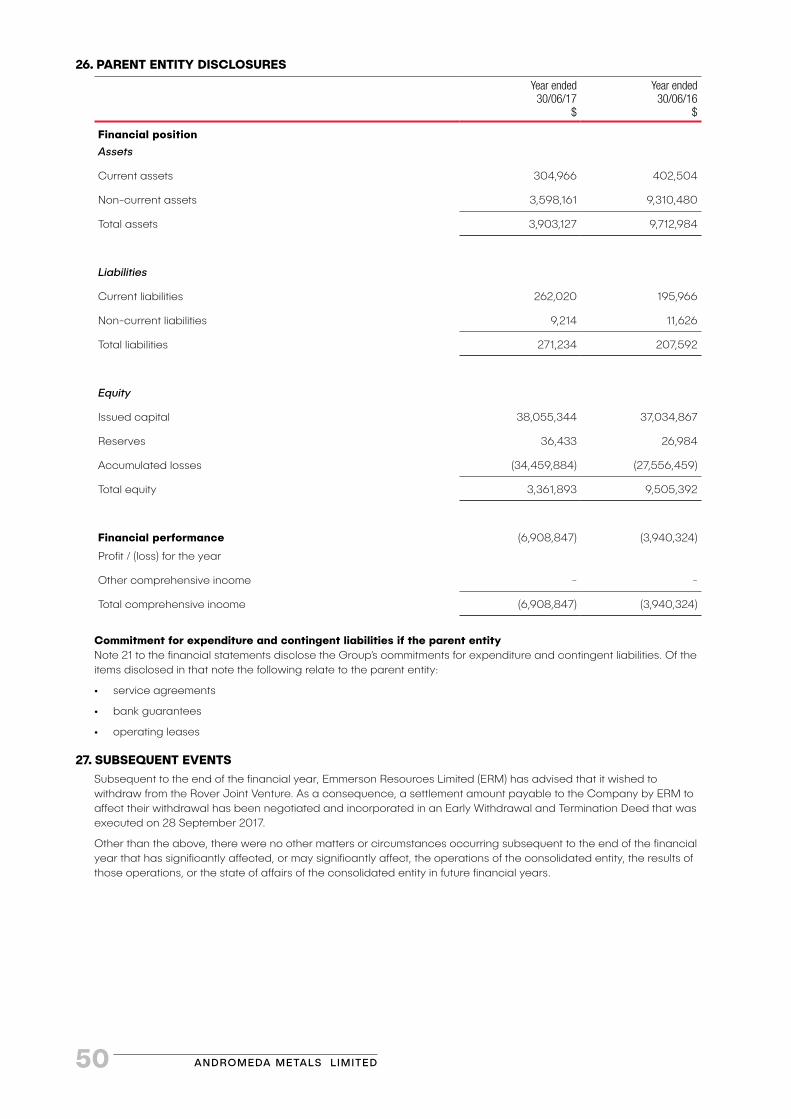
ANDROMEDA METALS LIMITED50
26. PARENT ENTITY DISCLOSURES
Year ended30/06/17
$
Year ended30/06/16
$
Financial positionAssets
Current assets 304,966 402,504
Non-current assets 3,598,161 9,310,480
Total assets 3,903,127 9,712,984
Liabilities
Current liabilities 262,020 195,966
Non-current liabilities 9,214 11,626
Total liabilities 271,234 207,592
Equity
Issued capital 38,055,344 37,034,867
Reserves 36,433 26,984
Accumulated losses (34,459,884) (27,556,459)
Total equity 3,361,893 9,505,392
Financial performance
Profit / (loss) for the year
(6,908,847) (3,940,324)
Other comprehensive income - -
Total comprehensive income (6,908,847) (3,940,324)
Commitment for expenditure and contingent liabilities if the parent entityNote 21 to the financial statements disclose the Group’s commitments for expenditure and contingent liabilities. Of the items disclosed in that note the following relate to the parent entity:
• service agreements
• bank guarantees
• operating leases
27. SUBSEQUENT EVENTSSubsequent to the end of the financial year, Emmerson Resources Limited (ERM) has advised that it wished to withdraw from the Rover Joint Venture. As a consequence, a settlement amount payable to the Company by ERM to affect their withdrawal has been negotiated and incorporated in an Early Withdrawal and Termination Deed that was executed on 28 September 2017.
Other than the above, there were no other matters or circumstances occurring subsequent to the end of the financial year that has significantly affected, or may significantly affect, the operations of the consolidated entity, the results of those operations, or the state of affairs of the consolidated entity in future financial years.

ANNUAL REPORT 2017 51
Directors’ declaration
The directors declare that:
a) In the directors’ opinion, there are reasonable grounds to believe that the Company will be able to pay its debts as and when they become due and payable;
b) In the directors’ opinion, the attached financial statements are in compliance with International Financial Reporting Standards, as stated in Note 3 to the financial statements;
c) In the directors’ opinion, the financial statements and notes thereto are in accordance with the Corporations Act 2001, including compliance with accounting standards and giving a true and fair view of the financial position and performance of the Company and consolidated entity; and
d) The directors have been given the declaration required by Section 295A of the Corporations Act 2001.
Signed in accordance with a resolution of the directors made pursuant to Section 295(5) of the Corporations Act 2001.
On behalf of the directors
C G Drown J P Buckley Managing Director Non-Executive Director
Adelaide, South Australia
29th September 2017
ANDROMEDA METALS LIMITED52
Deloitte Touche TohmatsuABN 74 490 121 060 11 Waymouth Street Adelaide, SA, 5000 Australia
Phone: +61 8 8407 7000 www.deloitte.com.au
Liability limited by a scheme approved under Professional Standards Legislation.
Member of Deloitte Touche Tohmatsu Limited
Page 44
Independent Auditor’s Report to the members of Andromeda Metals Limited
Report on the Audit of the Financial Report
Disclaimer of Opinion
We were engaged to audit the financial report of Andromeda Metals Limited (the Company) and its subsidiaries (the Group), which comprises the consolidated statement of financial position as at 30 June 2017, the consolidated statement of profit or loss and other comprehensive income, the consolidated statement of changes in equity and the consolidated statement of cash flows for the year then ended, and notes to the financial statements, including a summary of significant accounting policies, and the directors’ declaration.
Due to the significance of the matters described in the Basis for Disclaimer of Opinion section of our report, we have not been able to obtain sufficient appropriate audit evidence to provide a basis for an opinion on this financial report. Accordingly, we do not express an opinion as to whether the financial report of Andromeda Metals Limited is in accordance with the Corporations Act 2001, including:
(a) giving a true and fair view of the Group’s financial position as at 30 June 2017 and of its financial performance for the year then ended; and
(b) complying with Australian Accounting Standards and the Corporations Regulations 2001.
Basis for Disclaimer of Opinion
We draw attention to Note 3 ‘Going Concern’ in the financial report, which indicates that for the year ended 30 June 2017 the Group incurred a net loss of $6,908,847, had a net cash outflow from operating activities of $564,613 and a net cash outflow from investing activities of $545,867. At 30 June 2017 the Group had cash and cash equivalents of $268,336.
At the date of this report, we have been unable to obtain sufficient appropriate audit evidence as to the likelihood that the Group will be successful in raising the additional funding as described in Note 3.
Further, the statement of financial position as at 30 June 2017 includes the recognition of exploration and evaluation expenditure of $4,358,222 which are expected to be realised in future years. The ability to recover the carrying value of the exploration and evaluation expenditure is dependent on successfully achieving the fund raisings outlined in Note 3, and the Group continuing as a going concern.
These conditions, along with other matters as set forth in Note 3, indicate the existence of material uncertainties that cast significant doubt about the Group’s ability to continue as a going concern and therefore whether it will realise its assets and discharge its liabilities in the normal course of business.
Given the above circumstances, in our opinion, the uncertainties are so material and pervasive that we are unable to express an opinion on the financial report as a whole.
Directors’ Responsibilities for the Financial Report
The directors of the Company are responsible for the preparation of the financial report that gives a true and fair view in accordance with Australian Accounting Standards and the Corporations Act 2001 and for such internal control as the directors determine is necessary to enable the preparation of the financial report that gives a true and fair view and is free from material misstatement, whether due to fraud or error.
ANNUAL REPORT 2017 53Page 45
In preparing the financial report, the directors are responsible for assessing the Group’s ability to continueas a going concern, disclosing, as applicable, matters related to going concern and using the going concern basis of accounting unless the directors either intend to liquidate the Group or to cease operations, or hasno realistic alternative but to do so.
Auditors Responsibilities for the Audit of the Financial Report
Our responsibility is to conduct an audit of the financial report in accordance with Australian Auditing Standards and to issue an auditor’s report. However, because of the matters described in the Basis forDisclaimer of Opinion section of our report, we are not able to obtain sufficient appropriate audit evidenceto provide a basis for an audit opinion on the financial report.
We are independent of the Group in accordance with the auditor independence requirements of the Corporations Act 2001 and the ethical requirements of the Accounting Professional and Ethical StandardsBoard’s APES 110 Code of Ethics for Professional Accountants (the Code) that are relevant to our audit of the financial report in Australia. We have also fulfilled our other ethical responsibilities in accordance with the code.
We confirm that the independence declaration required by the Corporations Act 2001, which has beengiven to the Directors of Andromeda Metals Limited, would be in the same terms if given to the Directors as at the time of this auditors report.
Report on the Remuneration Report
Opinion on the Remuneration Report
We have audited the Remuneration Report included in pages 21 to 26 of the directors’ report for the yearended 30 June 2017.
In our opinion, the Remuneration Report of Andromeda Metals Limited, for the year ended 30 June 2017, complies with Section 300A of the Corporations Act 2001.
Responsibilities
The directors of the Company are responsible for the preparation and presentation of the Remuneration Report in accordance with Section 300A of the Corporations Act 2001. Our responsibility is to express anopinion on the Remuneration Report, based on our audit conducted in accordance with Australian Auditing Standards.
DELOITTE TOUCHE TOHMATSU
Darren Hall Partner Chartered Accountants Adelaide, 1 October 2017
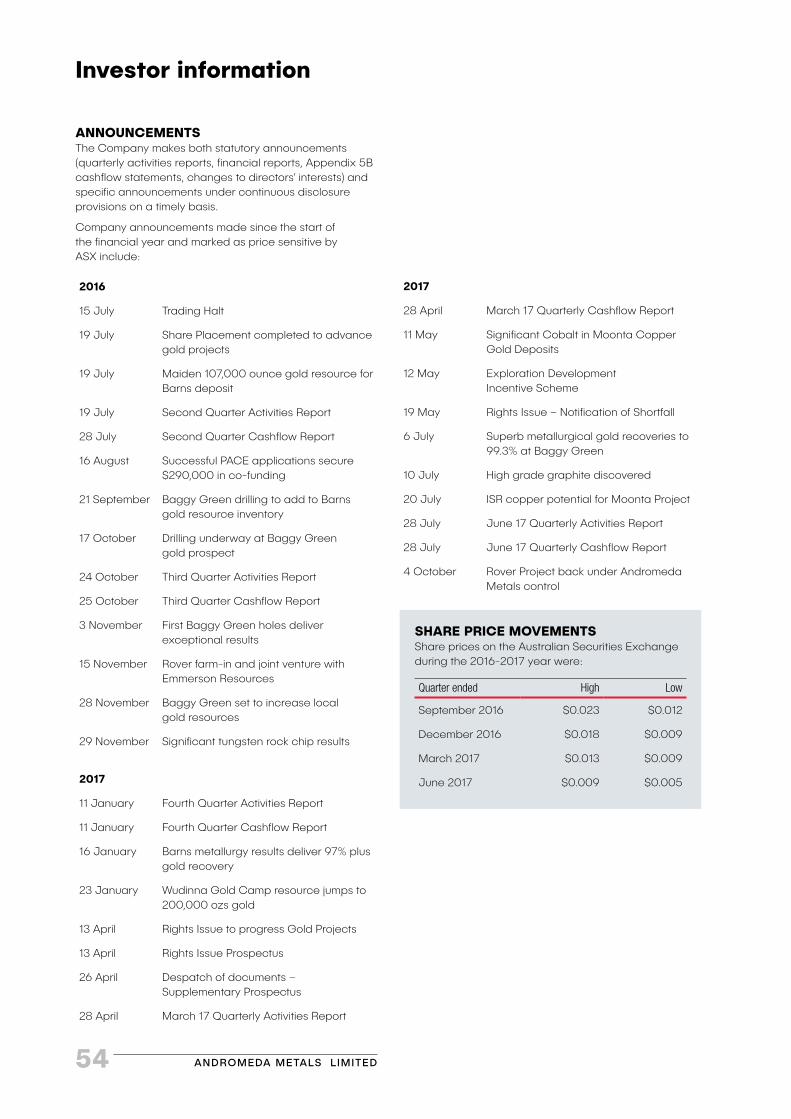
ANDROMEDA METALS LIMITED54
Investor information
ANNOUNCEMENTSThe Company makes both statutory announcements (quarterly activities reports, financial reports, Appendix 5B cashflow statements, changes to directors’ interests) and specific announcements under continuous disclosure provisions on a timely basis.
Company announcements made since the start of the financial year and marked as price sensitive by ASX include:
2016
15 July Trading Halt
19 July Share Placement completed to advance gold projects
19 July Maiden 107,000 ounce gold resource for Barns deposit
19 July Second Quarter Activities Report
28 July Second Quarter Cashflow Report
16 August Successful PACE applications secure $290,000 in co-funding
21 September Baggy Green drilling to add to Barns gold resource inventory
17 October Drilling underway at Baggy Green gold prospect
24 October Third Quarter Activities Report
25 October Third Quarter Cashflow Report
3 November First Baggy Green holes deliver exceptional results
15 November Rover farm-in and joint venture with Emmerson Resources
28 November Baggy Green set to increase local gold resources
29 November Significant tungsten rock chip results
2017
11 January Fourth Quarter Activities Report
11 January Fourth Quarter Cashflow Report
16 January Barns metallurgy results deliver 97% plus gold recovery
23 January Wudinna Gold Camp resource jumps to 200,000 ozs gold
13 April Rights Issue to progress Gold Projects
13 April Rights Issue Prospectus
26 April Despatch of documents – Supplementary Prospectus
28 April March 17 Quarterly Activities Report
2017
28 April March 17 Quarterly Cashflow Report
11 May Significant Cobalt in Moonta Copper Gold Deposits
12 May Exploration Development Incentive Scheme
19 May Rights Issue – Notification of Shortfall
6 July Superb metallurgical gold recoveries to 99.3% at Baggy Green
10 July High grade graphite discovered
20 July ISR copper potential for Moonta Project
28 July June 17 Quarterly Activities Report
28 July June 17 Quarterly Cashflow Report
4 October Rover Project back under Andromeda Metals control
SHARE PRICE MOVEMENTSShare prices on the Australian Securities Exchange during the 2016-2017 year were:
Quarter ended High Low
September 2016 $0.023 $0.012
December 2016 $0.018 $0.009
March 2017 $0.013 $0.009
June 2017 $0.009 $0.005

ANNUAL REPORT 2017 55
Additional shareholder informationas at 29 September 2017
SUBSTANTIAL SHAREHOLDERS
No. of ordinary shares
Buratu Pty Limited (Connolly Super Fund A/C) 85,000,000
TOP 20 SHAREHOLDERS OF ORDINARY SHARES
No. of ordinary shares % Shares
1 Buratu Pty Limited (Connolly Super Fund A/C) 85,000,000 18.76%
2 Navigator Australia Limited (MLC Investment Sett A/C) 13,788,089 3.03%
3 MLB Holdings Pty Limited (MLB Family A/C) 13,500,000 2.97%
4 ADN LFESP Pty Ltd 9,940,000 2.18%
5 Edward Garnet Bunn 8,000,000 1.76%
6 Greylands Super Pty Ltd (DJMS Super Fund A/C) 7,729,038 1.70%
7 Chris Drown & Lynette Drown (C&L Drown Family A/C) 5,891,313 1.29%
8 Norvest Projects Pty Ltd 5,000,000 1.09%
9 Jilldav Pty Ltd (Convoy Super Fund A/C) 4,672,500 1.02%
10 Robert Nairn Pty Ltd (Cherham A/C) 4,491,570 0.98%
11 George William Cridland 4,125,000 0.90%
12 Keith Yates & Assoc Pty Limited (Yates Family Super Fund A/C) 3,676,738 0.80%
13 Meherali Pty Limited (Meherali Family S/F A/C) 3,553,429 0.77%
14 Yongmei Chen 3,116,156 0.68%
15 Marmion Investments Pty Ltd (The Marmion Super Fund A/C) 3,000,000 0.65%
16 Nick Milenkovski 3,000,000 0.65%
17 Dimitrios & Konstantina Piliouras (Energia Super Fund A/C) 3,000,000 0.65%
18 Nurragi Investments Pty Ltd 2,530,263 0.55%
19 Keith Robert Yates 2,427,278 0.53%
20 Carmel Elizabeth Whiting 2,394,737 0.52%
Total of top 20 holdings 188,836,111 41.67%
Other holdings 264,321,467 58.33%
Total fully paid shares issued 453,157,578 100.00%
LISTED OPTIONS
No. of options
Exercise price of 1.2 cents and expiry date of 31 March 2018 23,616,235
UNLISTED OPTIONS
No. of options
Exercise price of 1.5 cents and expiry date of 31 March 2019 52,703
DISTRIBUTION OF SHAREHOLDERS
No. of holders No. of ordinary shares
1-1,000 317 72,681
1,001-5,000 318 944,970
5,001-10,000 281 2,437,263
10,001-100,000 818 35,787,446
100,001-over 557 413,915,218
Total 2,291 453,157,578
There were 1,616 shareholders with less than a marketable parcel of 83,334 shares.

Registered and Principal Office
69 King William Road, Unley, South Australia 5061
PO Box 1210, UNLEY BC SA 5061
T: +61 8 8271 0600; F: +61 8 8271 0033
www.andromet.com.au