annual budget of west coast district...
TRANSCRIPT

ANNUAL BUDGET OF
West Coast District
Municipality
2013/14 TO 2015/16
MEDIUM TERM REVENUE AND
EXPENDITURE FORECASTS
Copies of this document can be viewed:
In the foyers of all municipal buildings
At www.westcoastdm.co.za

ii
Table of Contents
PART 1 – ANNUAL BUDGET ...................................................................................................................... 1
1.1 MAYOR’S REPORT ....................................................................................................................................... 1
1.2 COUNCIL RESOLUTIONS ............................................................................................................................ 10
1.3 EXECUTIVE SUMMARY / FINANCIAL PLAN .................................................................................................. 11
1.4 OPERATING REVENUE FRAMEWORK ......................................................................................................... 18
1.5 OPERATING EXPENDITURE FRAMEWORK .................................................................................................. 22
1.6 CAPITAL EXPENDITURE .............................................................................................................................. 25
1.7 ANNUAL BUDGET TABLES - PARENT MUNICIPALITY .................................................................................. 27
PART 2 – SUPPORTING DOCUMENTATION ..................................................................................... 44
1.8 OVERVIEW OF THE ANNUAL BUDGET PROCESS ......................................................................................... 44
1.9 OVERVIEW OF ALIGNMENT OF ANNUAL BUDGET WITH IDP ....................................................................... 45
1.10 MEASURABLE PERFORMANCE OBJECTIVES AND INDICATORS ................................................................... 51
1.11 OVERVIEW OF BUDGET RELATED-POLICIES ............................................................................................... 60
1.12 OVERVIEW OF BUDGET ASSUMPTIONS ...................................................................................................... 61
1.13 OVERVIEW OF BUDGET FUNDING ............................................................................................................... 63
1.14 EXPENDITURE ON GRANTS AND RECONCILIATIONS OF UNSPENT FUNDS .................................................. 74
1.15 COUNCILLOR AND EMPLOYEE BENEFITS .................................................................................................... 76
1.16 MONTHLY TARGETS FOR REVENUE, EXPENDITURE AND CASH FLOW ........................................................ 78
1.17 ANNUAL BUDGETS AND SDBIPS – INTERNAL DEPARTMENTS ................................................................... 85
1.18 CONTRACTS HAVING FUTURE BUDGETARY IMPLICATIONS ........................................................................ 86
1.19 CAPITAL EXPENDITURE DETAILS ................................................................................................................ 86
1.20 LEGISLATION COMPLIANCE STATUS ........................................................................................................... 93
1.21 OTHER SUPPORTING DOCUMENTS ............................................................................................................. 94
1.22 MUNICIPAL MANAGER’S QUALITY CERTIFICATE ....................................................................................... 100
List of Tables
Table 1 Consolidated Overview of the 2013/14 MTREF ............................................................................ 18
Table 2 Summary of revenue classified by main revenue source .............................................................. 19
Table 3 Operating Transfers and Grant Receipts ....................................................................................... 20
Table 4 Proposed Water Tariffs ................................................................................................................. 21
Table 5 Summary of operating expenditure by standard classification item ............................................ 22
Table 6 Operational repairs and maintenance .......................................................................................... 24
Table 7 Repairs and maintenance per asset class ...................................................................................... 25
Table 8 2013/14 Medium-term capital budget per vote ........................................................................... 25
Table 9 MBRR Table A1 - Budget Summary ............................................................................................... 28
Table 10 MBRR Table A2 - Budgeted Financial Performance (revenue and expenditure by standard
classification)............................................................................................................................................... 30
Table 11 MBRR Table A3 - Budgeted Financial Performance (revenue and expenditure by municipal
vote) ............................................................................................................................................................ 31

iii
Table 12 Surplus/(Deficit) calculations for the trading services ................................................................ 32
Table 13 MBRR Table A4 - Budgeted Financial Performance (revenue and expenditure) ........................ 33
Table 14 MBRR Table A5 - Budgeted Capital Expenditure by vote, standard classification and funding
source .......................................................................................................................................................... 35
Table 15 MBRR Table A6 - Budgeted Financial Position ............................................................................ 37
Table 16 MBRR Table A7 - Budgeted Cash Flow Statement ...................................................................... 39
Table 17 MBRR Table A8 - Cash Backed Reserves/Accumulated Surplus Reconciliation .......................... 39
Table 18 MBRR Table A9 - Asset Management.......................................................................................... 41
Table 19 MBRR Table A10 - Basic Service Delivery Measurement ............................................................ 43
Table 20 IDP Strategic Objectives .............................................................................................................. 46
Table 21 MBRR Table SA4 - Reconciliation between the IDP strategic objectives and budgeted revenue
.................................................................................................................................................................... 48
Table 22 MBRR Table SA5 - Reconciliation between the IDP strategic objectives and budgeted operating
expenditure ................................................................................................................................................. 49
Table 23 MBRR Table SA7 - Reconciliation between the IDP strategic objectives and budgeted capital
expenditure ................................................................................................................................................. 50
Table 24 MBRR Table SA7 - Measurable performance objectives ............................................................. 53
Table 25 MBRR Table SA8 - Performance indicators and benchmarks...................................................... 58
Table 26 Credit rating outlook ................................................................................................................... 62
Table 27 Breakdown of the operating revenue over the medium-term ................................................... 63
Table 28 Proposed tariff increases over the medium-term ....................................................................... 64
Table 29 Sources of capital revenue over the MTREF ............................................................................... 65
Table 30 MBRR Table SA 17 - Detail of borrowings ................................................................................... 66
Table 31 MBRR Table SA 18 - Capital transfers and grant receipts ........................................................... 68
Table 32 MBRR Table A7 - Budget cash flow statement ............................................................................ 69
Table 33 MBRR Table A8 - Cash backed reserves/accumulated surplus reconciliation ............................ 70
Table 34 MBRR SA10 – Funding compliance measurement ...................................................................... 71
Table 35 MBRR SA19 - Expenditure on transfers and grant programmes .................................................. 74
Table 36 MBRR SA 20 - Reconciliation between of transfers, grant receipts and unspent funds ............. 75
Table 37 MBRR SA22 - Summary of councillor and staff benefits ............................................................. 76
Table 38 MBRR SA23 - Salaries, allowances and benefits (political office bearers/councillors/ senior
managers) ................................................................................................................................................... 77
Table 39 MBRR SA24 – Summary of personnel numbers .......................................................................... 78
Table 40 MBRR SA25 - Budgeted monthly revenue and expenditure ....................................................... 79
Table 41 MBRR SA26 - Budgeted monthly revenue and expenditure (municipal vote) ............................ 80
Table 42 MBRR SA27 - Budgeted monthly revenue and expenditure (standard classification) ................ 81
Table 43 MBRR SA28 - Budgeted monthly capital expenditure (municipal vote) ..................................... 82
Table 44 MBRR SA29 - Budgeted monthly capital expenditure (standard classification) ......................... 83
Table 45 MBRR SA30 - Budgeted monthly cash flow ................................................................................. 84
Table 46 Water Services Department - operating revenue by source, expenditure by type and total
capital expenditure ..................................................................................................................................... 85
Table 47 Water Services Department – Performance objectives and indicators ...................................... 85

iv
Table 48 MBRR SA 34a - Capital expenditure on new assets by asset class .............................................. 88
Table 49 MBRR SA34c - Repairs and maintenance expenditure by asset class ......................................... 88
Table 50 MBRR SA34d – Depreciation by asset class................................................................................. 90
Table 51 MBRR SA35 - Future financial implications of the capital budget .............................................. 91
Table 52 MBRR SA36 - Detailed capital budget per municipal vote .......................................................... 91
Table 53 MBRR SA37 - Projects delayed from previous financial year ...................................................... 92
Table 54 MBRR Table SA1 - Supporting detail to budgeted financial performance .................................. 94
Table 55 MBRR Table SA2 – Matrix financial performance budget (revenue source/expenditure type and
department) ................................................................................................................................................ 96
Table 56 MBRR Table SA3 – Supporting detail to Statement of Financial Position ................................... 97
Table 57 MBRR Table SA9 – Social, economic and demographic statistics and assumptions ................... 98
Table 58 MBRR SA32 – List of external mechanisms ................................................................................. 99
List of Figures
Figure 1 Main operational expenditure categories for the 2013/14 financial year .................................. 24
Figure 2 Capital Infrastructure Programme ............................................................................................... 27
Figure 3 Expenditure by major type ........................................................................................................... 34
Figure 4 Planning, budgeting and reporting cycle ..................................................................................... 51
Figure 5 Definition of performance information concepts ........................................................................ 52
Figure 6 Breakdown of operating revenue over the 2013/14 MTREF ....................................................... 64
Figure 7 Sources of capital revenue for the 2013/14 financial year .......................................................... 65
Figure 8 Growth in outstanding borrowing (long-term liabilities) ............................................................. 67
Figure 9 Cash and cash equivalents / Cash backed reserves and accumulated funds .............................. 71
ANNEXURE – A – BUDGET RELATED POLICIES .................................................. ERROR! BOOKMARK NOT DEFINED.
ANNEXURE – B – PROCESS PLAN ........................................................................ ERROR! BOOKMARK NOT DEFINED.

v
ABBREVIATIONS AND ACRONYMS
AMR Automated Meter Reading ASGISA Accelerated and Shared Growth
Initiative BPC Budget Planning Committee CBD Central Business District CFO Chief Financial Officer CM City Manager CPI Consumer Price Index CRRF Capital Replacement Reserve Fund DBSA Development Bank of South Africa DoRA Division of Revenue Act DWA Department of Water Affairs EE Employment Equity EEDSM Energy Efficiency Demand Side
Management EM Executive Mayor FBS Free basic services GAMAP Generally Accepted Municipal
Accounting Practice GDP Gross domestic product GDS Gauteng Growth and Development
Strategy GFS Government Financial Statistics GRAP General Recognised Accounting
Practice HR Human Resources HSRC Human Science Research Council IDP Integrated Development Strategy IT Information Technology kℓ kilolitre km kilometre KPA Key Performance Area KPI Key Performance Indicator kWh kilowatt
ℓ litre LED Local Economic Development MEC Member of the Executive Committee MFMA Municipal Financial Management Act
Programme MIG Municipal Infrastructure Grant MMC Member of Mayoral Committee MPRA Municipal Properties Rates Act MSA Municipal Systems Act MTEF Medium-term Expenditure
Framework MTREF Medium-term Revenue and
Expenditure Framework NERSA National Electricity Regulator South
Africa NGO Non-Governmental organisations NKPIs National Key Performance Indicators OHS Occupational Health and Safety OP Operational Plan PBO Public Benefit Organisations PHC Provincial Health Care PMS Performance Management System PPE Property Plant and Equipment PPP Public Private Partnership PTIS Public Transport Infrastructure
System RG Restructuring Grant RSC Regional Services Council SALGA South African Local Government
Association SAPS South African Police Service SDBIP Service Delivery Budget
Implementation Plan SMME Small Micro and Medium Enterprises

1
Part 1 – Annual Budget
1.1 Mayor’s Report / Speech
Geagte Meneer die Speaker, Onder-Burgemeester, Raadslede, Munisipale Bestuurder,
Direkteure, amptenare, die media en Lede van die publiek.
Ek ag dit as ‘n groot voorreg om vanoggend hierdie begroting aan u voor te hou.
Dis verder ‘n besonderse voorreg want die begroting was nie opgestel deur konsultante nie
maar deur die bevoegde amptenare van die Weskus Distriksmunisipaliteit. Ek noem dit in die
konteks van baie munisipaliteite wat miljoene rande spandeer op konsultante om munisipale
amptenare by te staan met die opstel van begrotings, state en Geintegeerde
Ontwikkelingsplanne. Weskus Distriksmunisipaliteit het die kundigheid in sy amptenare wie
meer as bevoeg is om hul van hierdie baie belangrike taak te kwyt. Ek kan met trots en
geloofwaardigheid beklemtoon dat die personeel van Weskus Distriksmunisipaliteit " FIT FOR
PURPOSE" is. Ek loof die personeel want as gevolg van hulle toegewydheid is die Weskus
Distriksmunisipaliteit die afgelope finansiële jaar met verskieie toekennings bekroon. Onder
andere het die Weskus Distrik Munisipaliteit op 29 April 2013 die “Clean audit award” ontvang.
Meneer die Speaker sedert my laaste begrotingstoespraak op 30 Mei 2012 was ons land se
ekonomiese klimaat onder geweldige druk as gevolg van verskeie faktore. Dit het meegebring
dat munisipaliteite ook nie vrygespreek was van hierdie geweldige ekonomiese druk nie. Verder
het dit veroorsaak dat nie net die inkomste van munisipaliteite negatief hierdeur geaffekteer was
nie, maar so ook die uitgawes. Gegee die huidige ekonomiese klimaat is dit nie altyd moontlik
om in almal se behoeftes te voorsien nie omdat die “vraag” groter as die “aanbod” is. Die
populasie het geweldig gegroei met 28% vanaf 2001 tot 2011 en die groeiende
werkloosheidsyfer in die Weskus is tans 16%. Hierdie faktore plaas geweldige druk op die
begrotings van munisipaliteite en dis ‘n bewys dat die vraag na werk groter is as die
werksgeleenthede. Die regering is nie ‘n primêre werkskepper nie maar kan wel die gunstige
klimaat skep vir ekonomiese groei en sodoende werkloosheidsyfer positief beinvloed. Die
Nasionale Ontwilkkelingsplan stel ambisieuse doelwitte vir armoede verligting, ekonomiese
groei, ekonomiese transformasie en werkskepping. Dis waartoe Weskus Distriksmunisipaliteit
homself verbind. Daarom wil ons deur middel van die Weskus Ekonomiese
Ontwikkelingsvennootskap ‘n gedeelde visie en agenda vir die ekonomiese vooruitgang van die

2
streek skep tussen Besigheid, regering en die ander belangrike rolspelers in die streek. In
hierdie verband kan ek verslag doen dat daar reeds aansienlike werk gedoen is om byvoorbeeld
die Landbou sektor se geleenthede te ontsluit en struikelblokke aan te spreek. Verder in hierdie
verband het die leierskap van regering en besigheid onlangs byeengekom om gemeenskaplike
leierskap kwessies te bespreek en ‘n beter werksverhouding daar te stel. Soos die Nasionale
Ontwikkelingsplan dit stel, kan die probleem van ons gemeenskap nie deur ‘n enkele rolspeler,
of slegs die regering, opgelos word nie.
“The National Development Plan (NDP) offers a long-term perspective. It defines a desired
destination and identifies the role different sectors of society need to play in reaching that goal.”
The NDP further emphasize the role of Local Government as a partner of the NDP “The plan
highlights the need to strengthen the ability of local government to fulfil its developmental role.
Municipal Integrated Development Plans (IDPs) need to be used more strategically to focus
attention on critical priorities in the NDP that relate to the mandate of local government such as
spatial planning, infrastructure and basic services to ensure effective implementation of the
objectives of the NDP. The West Coast District Municipality heeds this call and we therefore
align to the critical priorities in both our planning and our practice. It is also important to
strategically plan which priorities are most critical.
Die koek word nie groter nie, dit is die snye wat al kleiner word. “Genuine concern for others
is a lifestyle more than a technique” John Maxwell. Leiers het die mag van outoriteit maar
wie leiding neem inspireer. Dis nou tyd dat effektiewe leiding getoon word op politieke en
adminstratiewe vlakke te midde van die finansiële uitdagings wat munisipaliteite in die gesig
staar en dus die doelwitte volgens die Konstitusie van 1996 seksie 152 (a) tot (e) eerbiedig.
Deurmiddel van die Weskus Leierskaps inisiatief, wil ons juis alle vlakke van leierskap en
bestuur weer terug bring na die fundamentele beginsels van goeie leierskapspraktyke, en was
daar reeds twee geleenthede waar leierskap onder die loep geplaas was.
To keep a municipality financially sound, it is critical that mechanisms are in place as required
by legislation. It’s the responsibility of the Executive of Council, councillors and officials to take
ownership for the effective implementation. Oversight and accountability is of the outmost
importance in this process. If management, governance and oversight structures are not
working together in monitoring internal controls on a daily, monthly and quarterly basis to drive
the achievement of sustainable positive audit outcomes then we will fail in our duty to comply to
legislation and ultimately fail the communities who elected us to serve them. I have the pleasure
3
to announce that WCDM received a positive audit outcome for 2011/2012 as was the case in
2010/11 and we are also the best district municipality in the Western Cape. This is a result of all
the hard work of the Executive of Council, Councillors, Officials and their support staff and every
legislative committee member. I salute you and I am proud to say we create a shining example
of compliance and commitment to effective service delivery through legislation. After all we are
we are a quality destination of choice through an open opportunity society.
Ons het weereens daarin geslaag om ons begroting volgens die Algemene Aanvaarbare
Rekenkundige Praktyk (GRAP) op te stel. Hierdie strewe na uitnemendheid en hoë standaarde
is deel van die etos van ons organisasie.
Met die opstel van die Begroting en GOP is dit belangrik dat ons insette kry van ons B-
Munisipaliteite. Baie dankie aan die Munisipaliteite met wie ons kon gesels, maar ek moet
weereens rapporteer dat ons geen samewerking van Cederberg Munisipaliteit ontvang het nie.
Honourable Speaker the budget has to give expression to the needs of the community as
reflected in the Integrated Development Plan(IDP) of Council in terms of the Muncipal
Systems Act Chapter 5 sections 23 - 37. The West Coast District Municipality is committed to
accomplish an integrated sustainable- and socio-economic development of the area and to
ensure outstanding service delivery on the West Coast by pursuing the following strategic
objectives:
1. Ensuring Environmental Integrity for the West Coast.
The focus is developing strategies, policies and practices to improve the
environmental integrity of the district over the next five years.
Air Quality Management Plan for the West Coast is approved by Council and
the By-law will be tabled at the Council meeting on 29th May 2013.
The draft Integrated Coastal Management Programme in terms of the
Integrated Coastal Management Act was already circulated for public
comment and will be tabled at the Council meeting on the 29th May 2013.
2. To pursue economic growth and the indirect facilitation of job opportunities
Our aim is to improve economic development and job opportunities in our
region and can proudly to say that a successful economic business
partnership was recently launched to give effect to this objective.

4
Tourism awards received
Agricultural action research and round-table hosted
First Business Government leadership breakfast hosted
3. Promoting social well-being of the community
To promote and improve the social well-being of our targeted vulnerable
social groups over the next five years.
A major focus on Early Childhood Development(ECD) especially up skilling of
practitioners
Unemployed youth between the ages of 18 and 35 received entrepreneurship
training.
Volunteers are trained to help with the fight of drug abuse that ruin many
families and youth. In partnership with Department Education 2 schools per
annum received peer counselling.
We are in partnership with Department of Health, –Social Development and
NGO’s with regards the Orphanage Vulnerable Children’s(OVC) program.
Since 2012 the WCDM in partnership with Department Social Development
funded and arranged the 1st West Coast Golden games event. This will be an
annual event for our elderly and it will be in partnership with B-Municipalities,
Department Social Development, business and donors.
4. Provide essential bulk services in the region
Over the next five years we want to supply adequate and clean water
complying to SANS 241 requirements, alternative water supply through the
desalination of water, a regional waste site serving Matzikama and
Cederberg Municipalities and lastly a revised District Integrated Transport
System operating optimally.
Application for environmental authorization was submitted for the waste sites
at Matzikama- and Cederberg Municipalities and waiting for approval.
Capital Budget is zero.
5. Ensuring Good Governance and financial viability.

5
To sustain our Clean Audit Status, to build a happy, motivated staff team that
is suitably skilled and a council who exercises its oversight role with due
diligence.
Achievement of a clean audit – second year in a row; 10th consecutive
unqualified audit.
Risk management shared service pilot implemented for the West Coast
region
Meneer die Speaker. Daar is werklik in die opstel van hierdie begroting gepoog om optimaal
binne die huidige funksionele raamwerk van die Distrik Munisipaliteit aan die behoeftes van ons
inwoners te voorsien. Verder poog ons deur die begroting om verder te fokus op die funksies
van ‘n distrik munisipaliteit soos voorgeskryf deur wetgewing.
As Raad is ons ook statutêr verbind om die groeiende uitdaging van armoede holisties aan te
spreek en dus is daar begroot vir sosiale- ekonomiese inisiatiewe om effek te gee aan die
bogenoemde doelwitte.
Dus, Meneer die Speaker is die Begroting van die Weskus Distriks Munisipaliteit vir 2013 / 2014
soos volg.
Die begroting vir die Weskus Distriksmunisipale Raad
A. Kapitaal begroting beloop R16,300 miljoen teenoor die R35,065 miljoen van verlede
jaar.
Die Raad se kapitaal begroting kan as volg opgesom word:
1. Infrastruktuur
Water: : R15,200 miljoen (93%)
Dit sluit ook die bedrag van R10 miljoen in vir die ontsouting van water.
2. Ander
Kapitaal uitgawes : R1,100 miljoen (7%)
Wat insluit brandweer toerusting, kantoor toerusting, radio netwerk, ens.

6
Grootmaat watervoorsiening is een van ons kern funksies en is dus van kardinale belang dat die
bestaande infrastruktuur so doeltreffend moontlik onderhou en verbeter word.
Watervoorsiening in al sy afdelings synde:
a. Suiwering en verspreiding van grootmaat water aan die B-Munisipaliteite
(Swartland, Saldanhabaai en gedeelte van Bergrivier)
b. Instandhouding van masjienerie en pype
B. Bedryfsuitgawes vir hierdie boekjaar is R269, 805 560 miljoen (twee honderd nege-en-
sestig miljoen, agt honderd-en-vyf duisend, vyf honderd-en-sestig rand) teenoor verlede
jaar R261,636 930 miljoen (twee honderd een-en-sestig miljoen, ses honderd ses en
dertig duisend, nege honderd-en-dertig rand) wat die instandhouding van Paaie ten bedrae
van R81, 368 000 miljoen (een-en-tagtig miljoen, drie honderd agt-en-sestig duisend rand)
insluit.
Die Bedryfsbegroting is dus as volg:
Departement Munisipale Bestuurder en Raad
Interne oudit, IDP, LED, Strategiese Beplanning, Kantoor van die Munisipale
Bestuurder : R4,505 miljoen
Ontwikkeling : R2,967 miljoen
Verskeie ontwikkelingsprojekte word onder die pos ingesluit. Die projekte fokus op
die kwesbare groepe onder andere vroue, kinders, persone met gestremdhede,
jeug en ouer persone (bejaardes).
Opleiding : R1,5 miljoen.
Raad : R6,223 miljoen
Toerisme : R2,307 miljoen
Toerisme is tans die vinnigste groeiende ekonomiese sektor in die wêreld en ook een van die
sektore in die Weskus wat indirek die meeste werk verskaf. Dit is baie belangrik dat die WKDM
voortgaan om as katalisator op te tree vir die groei en ontwikkeling van Toerisme in die
Weskusstreek deur middel van effektiewe bemarkingsaksies, samewerkingsooreen-komste en
‘n positiewe klimaat vir toerismeontwikkeling.

7
Gedeelde dienste en ondersteuning vir die B-munisipaliteite geniet hoë prioriteit. 4 van die 5
Munisipaliteite funksioneer met die uitsluiting van Saldanha Munisipaliteit. Die diensvlak
ooreenkoms is alreeds geteken deur Bergrivier-, Cederberg-, Matzikama- en Swartland
Munisipaliteite. Die rede vir vir die uitsluiting van Saldanha is as gevolg van hul aktiwiteite vereis
‘n voltydse amptenaar. Na deeglike navorsing is besluit om met risikobestuur as gereelde diens
af te skop. Die WKDM se Risiko Bestuurder is op 1 Maart 2013 aangestel. Met die
ondersteuning van GIZ en die Provinsiale Regering is fondse beskikbaar om die projek te begin.
Verder sal voortgegaan word met die ondersteuning aan ons B-munisipaliteite op die gebiede
van stads- en streeksbeplaning, ekonomiese ontwikkeling, menslike hulpbronbestuur en
omgewingsintegriteit.
Die Distriks Munisipaliteit neem ook ‘n leidende rol in die deel van kennis op die gebied van
regsdienste en interne oudit.
Hierdie inisiatiewe is ‘n poging deur die Distriks Munisipaliteit om uitvoering te gee aan artikels
83(3) en 88 van die Strukture wet.
Departement Finansies en Administrasie
Die begroting vir die Departement is as volg:
Bydraes : R2,560 miljoen
(Sluit in Bydraes aan slegte skulde,verlof,en Mediese Fonds)
Administrasie :R7,499 miljoen
Bydraes/Opgradering van Plaaswerker
Behuising : R1,215 miljoen
Finansies : R5,462 miljoen
Grond en Geboue : R3,410 miljoen
Openbare Oord – Ganzekraal : R3,906 miljoen\
Die Raad wag nog op Cape Nature maar ons kan nie ingebrekke bly om daarvoor
te begroot nie.
Opleiding : R1,500 miljoen
Departement gemeenskapsdienste
Brandweerdienste : R25,516 miljoen

8
Die befondsing vir Brandweerdienste raak nou ‘n bron van kommer. Daar moet
indringend gesprekke gevoer word met die B–Munisipaliteite rakende die lewering
van ‘n koste effektiewe brandweerdiens in die Weskus Distriksgebied. Ons funksie
is bos- en veldbrande, en gespesialiseerde brande. Struktuur brande is die
verantwoordelikheid van B–Munisipaliteite, maar die plaaslike munisipaliteite
beskik nie oor die vermoeë om hulle statutêre funksie wat struktuurbrande is, te
verrig nie. Die heriening van die memorandum van verstandhouding rakende die
lewering van Brandweerdienste in die streek, word by die DCF tech bespreek ten
einde die pad vorentoe te bepaal. Ook moet daar met provinsie ingesprek getree
word oor die verlenging van ons lugbestrydings ure. Onsself sal so gou moontlik
nadat die begroting inwerking getree het die pad vorentoe bespreek. Tans is ons
branweerdiens op standaard en wil ek ten spyte van ‘n sterf geval aan diens en
die klipgooi voorval vroeër vanjaar in Malmesbury ons vroue en manne bedank vir
hul harde werk, toewyding en deursettingsvermoë in soms moeilike
omstandighede. Met al ses Brandweerstasies toegerus met voertuie en toerusting
het ons ook ons Hazmat voertuig inbesit geneem. Die mobiele kommunikasie
voertuig en Watervragmotor is reeds aangekoop en die sal voor einde Junie 2013
tenvolle toegerus wees.
Munisipale Gesondheid (dit sluit in die funksies van Lugkwaliteitsbestuur ,
Omgewingsgesondheid asook Omgewingsintegriteit) : R15,955 miljoen
Hierdie funksies dra by tot die daarstel van ‘n gesonde omgewing en bly hierdie
raad daartoe verbind om hierdie diens aan al vyf B – Munisipaliteite te lewer.
Rampbestuur : R3,779 miljoen
Departement Tegniese Dienste
Behuising(Waterafdeling) : R1,215 miljoen
Water(grootmaat) : R96,256 miljoen
Beplanning /Grootmaat Vullis/Proekte : R1,308 miljoen
Paaie : R81,368 miljoen
Agentskapdienste en dienste aan ander plaaslike owerhede en instellings word
gelewer teen werklike koste. Die Departement Paaie se uitgawes word ten volle
deur die Provinsie gedra en die Raad kan slegs fondse bestee soos deur die
Prinsipaal begroot en voorgeskryf. U is egter almal bewus dat GEEN raadsfondse

9
aangewend mag word om bovermelde dienste te subsideer nie en ons personeel
doen dus alles in hul vermoë om dienste op standaard te hou met die fondse tot hul
beskikking.
Ons fokus op die uitbreiding van grootmaatdienste aan ons B-Munisipaliteite en die beplanning
vir die ontwikkeling van die ontsoutingsaanleg in die Saldanhabaai omgewing is reeds aan die
gang. Die Omgewingsimpakstudie is afgehandel en ingedien vir die omgewings magtiging. ‘n
Loots aanleg by Danger Bay is opgerig op die terein waar die ontsoutingsaanleg gaan wees,
om die effektiwiteit van voorbehandeling en water kwaliteit te monitor vir 6 maande eindig
Oktober 2013. Die groot bekommernis is die besnoeiing van die RBIG(Regional Bulk
Infrastructure Grant) vanaf R53 miljoen tot R10 miljoen. Gesprekke met Departement
Waterwese is beplan vir einde Mei 2013 om hierdie situasie aan te spreek.
Tariewe
Water
- ʼn Gemiddelde verhoging van 9,73%
Ganzekraal Vakansieoord
- ʼn Gemiddelde verhoging van 7,55%
Water
- 6 Kiloliter water word gratis verskaf aan alle eindgebruikers van die weskus omgewing
aan wie die munisipaliteit water verskaf.
Salarisse is een van die faktore wat bydrae tot die verarming van munisipaliteite. Die
personeelbegroting beloop 28% van die bedryfsbegroting( sluit alle vakante poste in) wat nog
steeds onder die norm van 35% is.
Die Inkomste / Uitgawe begroting vir hierdie jaar is as volg:
INKOMSTE : R280 426 miljoen
UITGAWES : R269 806 miljoen
SURPLUS : R10 620 miljoen
Vote of thanks
Mr Speaker I want to express my sincere thanks to the Management and personnel who
contributed to the compiling of the budget and IDP but also to the success rate of this
municipality. Thanks for your loyalty and positive inclination in the execution of your work. You
can be assured of council’s appreciation for the work you have done and for the effort put in.

10
Ook my opregte dank aan die Munisipale Bestuurder vir sy leidende rol wat hy vervul asook aan
die Direkteure van die onderskeie departemente. Saam met jul onderskeie bestuurders is julle
‘n span toegewyde vroue en manne.
Aan die UBK wil ek ook my opregte dank betuig vir jul volgehoue ondersteuning die afgelope
jaar. Baie dankie aan al die ander Raadslede vir jul getrouheid, maar in besonder aan my
kollegas in die opposisie. Baie dankie vir jul rol wat jul vervul. Dit is werklik n plesier om julle hier
te hê. Kom ons doen wat die provinsie van ons vra: "BETTER TOGETHER"
Speaker dit is dan vir my ‘n voorreg om die GOP 2013/2014 – 2017/2018 en die begroting vir
2013 / 2014 – 2015/2016 aan u voor te lê vir goedkeuring.
1.2 Council Resolutions
On 07 May 2013 the Council of West Coast District Municipality met in the Council Chambers to consider the annual budget of the municipality for the financial year 2013/14. The Council approved and adopted the following resolutions: 1. The Council of the West Coast District Municipality, acting in terms of section 24 of the
Municipal Finance Management Act, (Act 56 of 2003) approves and adopts: 1.1. The annual budget of the municipality for the financial year 2013/14 and the multi-year
and single-year capital appropriations as set out in the following tables: 1.1.1. Budgeted Financial Performance (revenue and expenditure by standard
classification) as contained in Table 10 on page 30; 1.1.2. Budgeted Financial Performance (revenue and expenditure by municipal vote) as
contained in Table 11 on page 31; 1.1.3. Budgeted Financial Performance (revenue and expenditure) as contained in
Table 13 on page 33; and 1.1.4. Multi-year and single-year capital appropriations by municipal vote and standard
classification and associated funding by source as contained in Table 14 on page 35.
1.2. The financial position, cash flow budget, cash-backed reserve/accumulated surplus,
asset management and basic service delivery targets are approved as set out in the following tables:
1.2.1. Budgeted Financial Position as contained in Table 15 on page 37; 1.2.2. Budgeted Cash Flows as contained in Table 16 on page 39; 1.2.3. Cash backed reserves and accumulated surplus reconciliation as contained in
Table 17 on page 39; 1.2.4. Asset management as contained in Table 18 on page 41; and 1.2.5. Basic service delivery measurement as contained in Table 19 on page 43.
2. The Council of the West Coast District Municipality, acting in terms of section 75A of the
Local Government: Municipal Systems Act (Act 32 of 2000) approves and adopts with effect the policies.

11
2.1. All related policies – as set out in Annexure A
3. The Council of the West Coast District Municipality, acting in terms of 75A of the Local Government: Municipal Systems Act (Act 32 of 2000) approves and adopts with effect from 1 July 2013 the tariffs for other services.
4. To give proper effect to the municipality’s annual budget, the Council of the West Coast District Municipality approves: 4.1. That cash backing is implemented through the utilisation of a portion of the revenue
from the RSC Levy Replacement Grant to ensure that all capital reserves and provisions, unspent long-term loans and unspent conditional grants are cash backed as required in terms of the municipality’s funding and reserves policy as prescribed by section 8 of the Municipal Budget and Reporting Regulations.
1.3 Executive Summary / Financial Plan
1. Introduction The implementation of the Integrated Development Plan is largely reliant on the efficiency of the financial management system, and a strategy to enhance this capacity is necessary. The principles, Strategic Financial Framework, the Medium Term Expenditure and Revenue Framework (for the next three years) and Capital Investment Programme, are outlined in this section. The emphasis for the initial year, i.e. 2013/2014, is on projects receiving committed funding, and priority projects. It is important for the Municipality to ensure that they source funding for projects in an aggressive way in order to ensure that the implementation process is sustainable. The emphasis will fall on basic service delivery (bulk water supply), which will be funded, by all levels of government. Local economic development shall be encouraged as it could have a spill over effect, which will be beneficial to the municipality as a whole, triggering more investment.
2. Arrangements
The following arrangements regarding Resources and Guidelines will receive attention: 2.1 Inventory of Resources 2.1.1 Staff
a) An organisational structure for the finance department will be regularly reviewed. b) Job Descriptions will be kept updated for all Finance staff. c) A Standard Operating Procedure manual needs to be documented as guidance to
staff. d) Training of staff will be performed in terms of a Skills Development Plan.

12
2.1.2 Supervisory Authority
The Finance Committee deals with all financial issues. The Municipal Manager is the Accounting Officer, and is therefore responsible for financial management. The Chief Financial Officer will however be tasked with the day-to-day management of the Finance directorate in terms of his/her Performance agreement. The Audit Committee will perform a Monitoring and Evaluation function of External, Internal and Performance audit procedures and control systems.
2.1.3 Systems
a) Debtors Billing, Receipting, Creditors and Main Ledger transactions is performed on the SAMRAS (DB4) Data Processing System. The compatibility of the system with Council’s specifications will be regularly reviewed, inclusive of support services (hardware and software), and training for staff on the applications utilized.
b) Payroll function is managed on the SAMRAS (DB4), and will suffice for the next three years.
c) BAUD is used as an Assets management system and upgrading thereof is receiving Council’s attention. Reconciliations are performed on a monthly basis between the financial management system and the asset management system.
d) Grant management, Investments, Cash at Bank (reconciliation), and External Loans will be managed with SAMRAS (DB4) and control spread sheets. Incorporation into the Financial Management System will be updated monthly.
e) Systems procedure manuals (SOP’s) to all staff will be developed.
2.1.4 Accommodation
a) Offices: This space is restricted. b) Registry: Is shared with the other Departments in close proximity to Finance. c) Archives: An archiving system in place and conforms to legislation.
2.2 Management Guidelines
The formulation and adoption by Council of Policies and Bylaws to guide management towards the attainment of the vision and mission of the Municipality is a crucial aspect. The following policies will be reviewed on a regular basis:
a) Supply Chain Management Policy - conforming to National legislation (including the Preferential Procurement Policy Framework Act, Broad Based Black Economic Empowerment Act, and Municipal Finance Management Act) and Council’s own vision;
b) Investment Policy - conforming to the guidelines supplied by the Institute of Municipal Finance Officers and the Municipal Finance Management Act;
c) Tariff Policy - conforming to the principles contained in the Municipal Systems Act; d) Rates Policy - conforming to the principles outlined in the Property Rates Act,
regulations; e) Credit Control and Debt Collection Policy - in accordance with the Municipal Systems
Act and Case studies in this respect; f) Indigent Policy - from the National guidelines on this aspect; g) Asset Management Policy - to promote the efficient use and effective control over
Municipal assets, in terms of the Guidelines supplied by the Institute of Municipal Finance Officers, Local Government Capital Asset Management Guidelines and the Accounting Standards Board.

13
h) Accounting policy - to conform to the requirements of the Municipal Finance Management Act, and Generally Recognised Accounting Practice. Legislation requires that certain policies e.g. Credit control and Debt collection be supported by Bylaws, to assist enforcement.
3. Strategy
Strategies to be employed to improve the financial management efficiency and the financial position are as follows:
3.1 Financial Guidelines and Procedures
The Accounting policies will be reviewed to conform to the provisions contained in the Municipal Finance Management Act, and the Guidelines supplied by the Department of Finance and Accounting Standards Board. Procedures to give effect to these policies will be compiled. The Procedures will be aligned with Council’s policies regarding the various aspects, with reference to the applicable Job descriptions, and Terms of Reference of the various Standing Committees, to affix responsibility. Alignment with the Performance Management System will ensure the necessary control to Council.
3.2 Financing
3.2.1 Operating:
Revenue to finance the operating account is mainly attributed to bulk water supply, interest on investments, RSC Levy Replacement Grant (Equitable Share) and agency services in respect of road maintenance. 3.2.2 Capital: Capital expenditure is funded through revenue contributions, grants, capital contributions from Local Municipalities (Bulk water infrastructure).
3.3 Local Economic Development:
Council will embark on an extended Local Economic Development Programme, structured to facilitate financing from internally generated funds as well as Government grants. 3.4 Revenue raising
3.4.1 Tariffs: Tariffs for all services will be reviewed to conform to the principles contained in the Tariff policy, the Indigent policy and National guidelines in respect of the provisions of Free Basic Services. 3.4.2 Other Services: The possibility to raise revenue from services not previously provided by the Council, in accordance with the Schedules to the Constitution, and the Division of Powers and
14
Functions (Section 84(1) of the Municipal Structures Act), will be investigated. 3.5 Asset Management:
All assets will be managed in terms of the applicable policy from Council. Maintenance plans will be drawn up and implemented for all major assets with an extended lifespan. This municipality has a GRAP compliant Asset Register and utilize an external service provider to perform yearly asset counts, revision of useful lives, condition assessments and unbundling of assets. The Asset Register is updated on a monthly basis by the Asset Manager. The above procedures is done to mitigate risks and to segregate duties. The obsolescence and redundancy of assets are regularly monitored, with adequate replacement cycles being instituted, where applicable and affordable. 3.6 Cost-effectiveness
The Expenditure / Supply Chain Management divisions will be tasked to perform costing exercises on major expenditure, goods and services, in respect of projects and continuous contracts, to ensure Council obtains maximum benefit. The applicable policies will provide the guidelines in this respect. The ‘in-house’ provision of services will also be measured against outsourced suppliers of services. A system to control for under-utilised or unused stock will be instituted, with means to obtain a benefit to Council investigated.
4. Revenue and Expenditure Forecast 4.1 Financial Position
4.1.1 Cash Position: Council have sufficient cash resources available to meet its medium to long term needs. Certain resources are representative of unspent funds held by Council in respect of Government Grants. The utilization of these monies to finance operating expenses, and projects other than their directed use is not permissible. 4.1.2 Funds and Reserves: The Accumulated surplus have been utilised to finance Capital expenditure by the Fire Protection, Finance and Administration directorates and partially the Water Provision directorate. Council’s Retained Surplus / Working Capital, as well as the Provisions set aside for specific purposes e.g. Bad debts, Post – employment Health Care Benefits and Employee Benefits Accrual (Performance bonuses,13
th Cheque of employees and Staff
leave), represented by either Cash or Investments. 4.1.3 Debtors: The implementation of the procedures in terms of the Credit control and Debt collection Policy has facilitated the management of cash flow, and place Council in a position to finance operation expenses.

15
4.1.4 Rates and Tariffs The structure of Tariffs will be implemented in accordance with the applicable Council Policy documents. 4.1.5 Equitable Share Allocation One of Council’s sources of revenue to finance its Operating expenses is the RSC Levy Replacement Grant. Increased allocations in terms of the Division of Revenue Act were published for the next three years. 4.1.6 Depreciation The Depreciation cost in the Expenditure forecast was equated to the reports generated from the assets management system.
4.2 Operating Expenses
The following table detail the operating expenditure for the medium term revenue and expenditure framework:
Medium Term Revenue and Expenditure Framework
OPERATING EXPENDITURE
Budget Year 2013 / 2014
Budget Year +2014 / 2015
Budget Year +2015 / 2016
Budget R
Budget R
Budget R
Operating Expenditure by Type Employee costs Remuneration of councillors Depreciation & asset impairment Finance charges Bulk purchases General / Other expenses
74,916 4,784
24,764 12,930 9,861
142,551
82,271 5,023
26,470 11,847 11,390
155,879
86,003 5,274
28,317 10,664 13,212
173,563
Total Operating Expenditure
269,806
292,880
317,033

16
4.3 Operating Revenue
The following table detail the operating revenue for the medium term revenue and expenditure framework:
Medium Term Revenue and Expenditure Framework
OPERATING REVENUE
Budget Year 2013 / 2014
Budget Year +2014 / 2015
Budget Year +2015 / 2016
Budget R
Budget R
Budget R
Operating Revenue by Type Property rates Service charges Investment revenue Transfers recognised - operational Other own revenue Contributions recognised - capital
- 96,511 8,000
76,281 89,634 10,000
- 112,304
8,400 80,585 93,343 16,000
- 126,388
8,820 85,653 97,920 30,000
Total Operating Revenue
280,426
310,632
348,781
4.4 Grant Receivable
The following table detail the grants receivable for the medium term revenue and expenditure framework:
Medium Term Revenue and Expenditure Framework
GRANT RECEIVABLE
Budget Year 2013 / 2014
Budget Year +2014 / 2015
Budget Year +2015 / 2016
Budget R
Budget R
Budget R
Grant name Financial management grant Expanded public works programme Municipal systems improvement grant RSC levy replacement grant Equitable share grant Regional bulk infrastructure – capital Rural roads assets management system LGSETA
1,250 1,000
890 62,906 9,720
10,000 -
515
1,250 -
934 64,792 11,414 16 000 1,680
515
1,250 -
967 66,398 14,514 30,000 2,149
375
Total Operating Revenue
86,281
96,585
115,653

17
5. Capital Investment Programme
Functional Sector
Programme & Project Description
Funding Source
Budget Year
2013/2014
Budget Year
2014/2015
Budget Year
2015/2016
Total
Water Provision
Vergeleë/Besaansklip Storage
Surplus - -
1,550 1,550
Water Provision
Glen Lily System (Pipeline)
Surplus - - 2,500 2,500
Water Provision
Pipeline Swartland Surplus 1,100 17,000 - 18,100
Water Provision
Pipeline Darling (PRR Wesbank)
Surplus - 3,500 10,500 14,000
Water Provision
Voëlvlei WTW filter Surplus 4,100 2,250 250 6,600
Water Provision
Vehicles Surplus - 950 600 1,550
Water Provision
Flow meters
Surplus - 700 400 1,100
Water Provision
Computers & Network Surplus - 135 175 310
Water Provision
Valves Surplus - 3,000 1,500 4,500
Water Provision
Electronic equipment Surplus - 105 85 190
Water Provision
Laboratory equipment Surplus - 60 30 90
Water Provision
Furniture and office equipment
Surplus - 60 35 95
Water Provision
Air conditioning Surplus - 30 15 45
Water Provision
Desalination plant Grant 10,000 16,000 30,000 56,000
Health Inspectors
Furniture and equipment
Surplus 11 - - 11
Fire fighting Services
Vehicles Surplus 60 - - 60
Fire fighting Services
Radio’s Surplus 330 - - 330
Disaster Management
Furniture and equipment
Surplus 10 - - 10
Finance and Administration
Furniture and equipment
Surplus 71 - - 71
Ganzekraal Furniture and equipment
Surplus 30 - - 30
Information Technology
Computers & Network Surplus 232 - - 232
Buildings Furniture and equipment
Surplus 356 - - 356
16,300 43,790 47,640 107,730

18
6. Conclusion The Financial planning imperatives contribute to ensuring that the Municipality remains financially
viable and that municipal services are provided economically to all communities and stakeholders.
The Multi-year Financial Plan contains realistic and credible revenue and expenditure forecasts
which should provide a sound basis for improved financial management and institutional
development as well as service delivery improvements and implementation. The strategy towards
cash backing will certainly
In view of the aforementioned, the following table is a consolidated overview of the proposed 2013/14 Medium-term Revenue and Expenditure Framework: Table 1 Consolidated Overview of the 2013/14 MTREF
R thousand
Adjustment Budget
2012/13
Budget Year 2013/14
Budget Year +1 2014/15
Budget Year +2 2015/16
Total Operating Revenue Total Operating Expenditure
259,437,060 261,636,930
280,426,430 269,805,560
310,632,490 292,879,850
348,781,405 317,033,360
(Surplus) / Deficit for the year (2,199,870) 10,620,870 17,752,640 31,748,045
Total Capital Expenditure 35,065,500 16,300,000 43,790,000 47,640,000
Total operating revenue has grown by R20.9 million for the 2013/14 financial year when compared to the 2012/13 Adjustments Budget. For the two outer years, operational revenue will increase by R30.2 million and R38.1 million respectively, equating to a total revenue growth of R89.2 million over the MTREF when compared to the 2012/13 financial year. Total operating expenditure for the 2013/14 financial year has been appropriated at R269.8 million and translates into a budgeted surplus of R10.6 million. When compared to the 2012/13 Adjustments Budget, operational expenditure has grown to R8.1 million in the 2013/14 budget and by R23.0 million and R24.1 million for each of the respective outer years of the MTREF. The operating surplus for the two outer years steadily increases to R31.7 million. These surpluses will be used to fund capital expenditure and to further ensure cash backing of reserves and funds. The capital budget of R16.3 million for 2013/14 is less when compared to the 2010/11 Adjustment Budget. The reduction is due to various projects being finalised in the previous financial year as well as affordability constraints in the light of current economic circumstances. The capital programme increases to R43.7 million in the 2013/14 financial year and then evens out in 2015/16 to R47.6 million. Capital expenditure in each of the MTREF years will mainly be funded from capital grants and internally generated funds.
1.4 Operating Revenue Framework
For West Coast to continue improving the quality of services provided to its customers it needs to generate the required revenue. In these tough economic times strong revenue management is fundamental to the financial sustainability of every municipality. The expenditure required to address challenges will inevitably always exceed available funding; hence difficult choices have to be made in relation to tariff increases and balancing expenditures against realistically anticipated revenues.

19
The municipality’s revenue strategy is built around the following key components: • National Treasury’s guidelines and macroeconomic policy; • Growth in the municipal area and continued economic development; • Efficient revenue management, which aims to ensure a 95 per cent annual collection
rate for property rates and other key service charges; • Achievement of full cost recovery of specific user charges especially in relation to trading
services; • Determining the tariff escalation rate by establishing/calculating the revenue requirement
of each service; • Increase ability to extend new services and recover costs; • Tariff policies of the Municipality.
The following table is a summary of the 2013/14 MTREF (classified by main revenue source): Table 2 Summary of revenue classified by main revenue source
Description 2009/10 2010/11 2011/12 Current Year 2012/13 2013/14 Medium Term Revenue &
Expenditure Framework
R thousands Audited
Outcome Audited
Outcome Audited
Outcome Original Budget
Adjusted Budget
Full Year Forecast
Pre-audit outcome
Budget Year
2013/14
Budget Year +1 2014/15
Budget Year +2 2015/16
Financial Performance
Property rates 801 868 – – – – – – – –
Service charges 68 137 74 341 80 575 87 458 87 458 87 458 87 458 96 511 112 304 126 388
Investment revenue 15 287 9 549 8 076 8 020 8 020 8 020 8 020 8 000 8 400 8 820
Transfers recognised operational 72 346 81 517 78 037 72 799 72 216 72 216 71 853 76 281 80 585 85 653
Other own revenue 59 330 83 176 80 125 72 895 83 644 83 644 83 644 89 635 93 343 97 920
Total Revenue (excluding capital transfers and contributions)
215 901 249 451 246 813 241 171 251 337 251 337 250 974 270 426 294 632 318 781
In line with the formats prescribed by the Municipal Budget and Reporting Regulations, capital
transfers and contributions are excluded from the operating statement, as inclusion of these
revenue sources would distort the calculation of the operating surplus/deficit.
Grants and service charge revenues comprise more than two thirds of the total revenue mix. In the 2013/14 financial year, revenue from grants and services charges totalled R182.7 million. This increases to R208.8 million and R242.0 million in the respective financial years of the MTREF. The third largest sources is ‘other revenue’ which consists of various items such as income received from permits and licenses, building plan fees, connection fees and agency services (roads). Operating grants and transfers totals R86.2 million in the 2013/14 financial year and steadily increases to R115.6 million by 2015/16. The following table gives a breakdown of the various operating grants and subsidies allocated to the municipality over the medium term:

20
Table 3 Operating Transfers and Grant Receipts
Medium Term Revenue and Expenditure Framework
GRANT RECEIVABLE
Budget Year 2013 / 2014
Budget Year +2014 / 2015
Budget Year +2015 / 2016
Budget R
Budget R
Budget R
Grant name Financial management grant Expanded public works programme Municipal systems improvement grant RSC levy replacement grant Equitable share grant Regional bulk infrastructure – capital Rural roads assets management system LGSETA
1,250 1,000
890 62,906 9,720
10,000 -
515
1,250 -
934 64,792 11,414 16 000 1,680
515
1,250 -
967 66,398 14,514 30,000 2,149
375
Total Operating Revenue
86,281
96,585
115,653
Tariff-setting is a pivotal and strategic part of the compilation of any budget. When tariffs and other charges were revised, local economic conditions, input costs and the affordability of services were taken into account to ensure the financial sustainability of the municipality.
Municipalities must justify in their budget documentation all increases in excess of the 5.6 per cent upper boundary of the South African Reserve Bank’s inflation target. Excessive increases are likely to be counterproductive, resulting in higher levels of non-payment.
The percentage increases of Water bulk tariffs are beyond the mentioned inflation target. Given that these tariff increases are determined by external agencies, the impacts they have on the municipality’s bulk water supply are largely outside the control of the municipality.
It must also be appreciated that the consumer price index, as measured by CPI, is not a good measure of the cost increases of goods and services relevant to municipalities. The basket of goods and services utilised for the calculation of the CPI consist of items such as food, petrol and medical services, whereas the cost drivers of a municipality are informed by items such as the cost of remuneration, bulk purchases of water, petrol, diesel, chemicals, cement etc. The current challenge facing the municipality is managing the gap between cost drivers and tariffs levied, as any shortfall must be made up by either operational efficiency gains or service level reductions.

21
1.4.1 Sale of Water and Impact of Tariff Increases
South Africa faces similar challenges with regard to water supply as it did with electricity, since demand growth outstrips supply. Consequently, National Treasury is encouraging all municipalities to carefully review the level and structure of their water tariffs to ensure: • Water tariffs are fully cost-reflective – including the cost of maintenance and renewal of
purification plants, water networks and the cost associated with reticulation expansion; • Water tariffs are structured to protect basic levels of service and ensure the provision
water; and • Water tariffs are designed to encourage efficient and sustainable consumption. Better maintenance of infrastructure, new pipeline construction, desalination plant and cost-reflective tariffs will ensure that the supply challenges are managed in future to ensure sustainability. Bulk water tariffs will increase on average with 9.73 per cent from 1 July 2013. Table 4 Proposed Water Tariffs
CATEGORY CURRENT TARIFFS
2012/13 PROPOSED TARIFFS
2013/14
Rand per kℓ Rand per kℓ Bulk Sales
Water Sales - All Municipalities (Water Restrictions 0%) 3.45 3.80
Water Sales - All Municipalities (Water Restrictions 5%) 3.58 3.94
Water Sales - All Municipalities (Water Restrictions 10%) 3.72 4.10
Water Sales - All Municipalities (Water Restrictions 15%) 3.88 4.27
Water Sales - All Municipalities (Water Restrictions 20%) 4.06 4.27
Water Sales - All Municipalities (Water Restrictions 25%) 4.26 4.69
Water Sales - All Municipalities (Water Restrictions 30%) 4.49 4.94
Water Sales - All Municipalities (Water Restrictions 35%) 4.75 5.23
Private users
Water Sales - All Municipalities (Water Restrictions 0%) 4.32 4.75
Water Sales - All Municipalities (Water Restrictions 5%) 4.48 4.93
Water Sales - All Municipalities (Water Restrictions 10%) 4.65 5.13
Water Sales - All Municipalities (Water Restrictions 15%) 4.85 5.34
Water Sales - All Municipalities (Water Restrictions 20%) 5.08 5.59
Water Sales - All Municipalities (Water Restrictions 25%) 5.33 5.86
Water Sales - All Municipalities (Water Restrictions 30%) 5.61 6.18
Water Sales - All Municipalities (Water Restrictions 35%) 5.94 6.54

22
1.5 Operating Expenditure Framework
The municipality’s expenditure framework for the 2013/14 budget and MTREF is informed by the following: • The asset renewal strategy and the repairs and maintenance plan; • Balanced budget constraint (operating expenditure should not exceed operating
revenue) unless there are existing uncommitted cash-backed reserves to fund any deficit;
• Funding of the budget over the medium-term as informed by Section 18 and 19 of the MFMA;
• The capital programme is aligned to the asset renewal strategy; • Operational gains and efficiencies will be directed to funding the capital budget and other
core services; and • Strict adherences to the principle of no project plan no budget. If there is no business
plan no funding allocation can be made. The following table is a high level summary of the 2013/14 budget and MTREF (classified per main type of operating expenditure):
Table 5 Summary of operating expenditure by standard classification item
Description 2009/10 2010/11 2011/12 Current Year 2012/13 2013/14 Medium Term Revenue &
Expenditure Framework
R thousands Audited
Outcome Audited
Outcome Audited
Outcome Original Budget
Adjusted Budget
Full Year Forecast
Pre-audit outcome
Budget Year
2013/14
Budget Year +1 2014/15
Budget Year +2 2015/16
Financial Performance
Employee cost 61 670 64 818 66 184 69 608 69 294 62 365 62 365 74 916 82 271 86 003
Remuneration of councillors 6 812 4 700 3 652 4 372 4 372 3 935 3 935 4 784 5 023 5 274
Depreciation & asset impairment 14 833 18 351 19 526 23 701 23 701 21 331 21 331 24 764 26 470 28 317
Finance charges 6 657 8 174 11 164 13 235 13 235 11 911 11 911 12 930 11 847 10 664
Material and bulk purchases 13 435 72 764 28 770 67 183 29 409 27 313 27 313 88 061 93 439 103 663
Other expenditure 93 804 81 240 148 394 70 372 121 626 115 376 115 376 64 350 73 830 83 112
Total Expenditure (excluding capital transfers and contributions)
197 211 250 045 277 691 248 471 261 637 242 231 242 231 269 806 292 880 317 033
The budgeted allocation for employee related costs for the 2013/14 financial year totals R79.7 million, which equals 28 per cent of the total operating expenditure. This budget adds a salary increase of 7.5 per cent for the 2013/14 financial year. An annual increase of 7.5 per cent has been included in the two outer years of the MTREF. As part of the municipality’s cost reprioritization and cash management strategy vacancies have been significantly rationalized downwards. In addition expenditure against overtime was significantly reduced, with provisions against this budget item only being provided for emergency services and other critical functions. The cost associated with the remuneration of councillors is determined by the Minister of Co-operative Governance and Traditional Affairs in accordance with the Remuneration of Public Office Bearers Act, 1998 (Act 20 of 1998). The most recent proclamation in this regard has been taken into account in compiling the municipality’s budget.

23
The provision of debt impairment was determined based on an annual collection rate of 98 per cent and the Credit Control and Debt Management Policy of the Municipality. For the 2013/14 financial year this amount equates to R0.6 million and stays flat at R0.6 million by 2015/16. While this expenditure is considered to be a non-cash flow item, it informed the total cost associated with rendering the services of the municipality, as well as the municipality’s realistically anticipated revenues. Provision for depreciation and asset impairment has been informed by the Municipality’s Asset Management Policy. Depreciation is widely considered a proxy for the measurement of the rate asset consumption. Budget appropriations in this regard total R24.7 million for the 2013/14 financial year and equates to 10 per cent of the total operating expenditure. Finance charges consist primarily of the repayment of interest on long-term borrowing (cost of capital). Finance charges make up 5 per cent (R12.9 million) of operating expenditure excluding annual redemption for 2013/14 and decreases to R10.6 million by 2015/16. Bulk purchases are directly informed by the purchase of water from The Department of Water Affairs and Forestry. The annual price increases have been factored into the budget appropriations and directly inform the revenue provisions. The expenditures include distribution losses. Other material comprises of amongst others the purchase of fuel, diesel, materials for maintenance, cleaning materials and chemicals. For 2013/14 the appropriation against this group of expenditure has grown by 24 per cent (R79 million) and continues to grow of which budget allocation is in excess of R103 million by 2015/16. Other expenditure comprises of various line items relating to the daily operations of the municipality. This group of expenditure has also been identified as an area in which cost savings and efficiencies can be achieved. For 2013/14 the appropriation against this group of expenditure has grown by 28 per cent (R64 million) and continues to grow of which budget allocation is in excess of R83 million by 2015/16. Further details relating to contracted services can be seen in Table 54 MBRR SA1 (see page 94 and 95).

24
The following table gives a breakdown of the main expenditure categories for the 2013/14 financial year.
Employee costs28%
Council Remuneration
2%
Depreciation 10%
Finance Charges5%Bulk Purchases
3%
Materials 24%
Other Expense28%
Figure 1 Main operational expenditure categories for the 2013/14 financial year
1.5.1 Priority given to repairs and maintenance
Aligned to the priority being given to preserving and maintaining the Municipality’s current infrastructure, the 2013/14 budget and MTREF provide for extensive growth in the area of asset maintenance, as informed by the asset renewal strategy and repairs and maintenance plan of the municipality. In terms of the Municipal Budget and Reporting Regulations, operational repairs and maintenance is not considered a direct expenditure driver but an outcome of certain other expenditures, such as remuneration, purchases of materials and contracted services. Considering these cost drivers, the following table is a consolidation of all the expenditures associated with repairs and maintenance:
Table 6 Operational repairs and maintenance
Description 2009/10 2010/11 2011/12 Current Year 2012/13 2013/14 Medium Term Revenue & Expenditure
Framework
R thousands Audited
Outcome Audited
Outcome Audited
Outcome Original Budget
Adjusted Budget
Full Year Forecast
Pre-audit outcome
Budget Year
2013/14
Budget Year +1 2014/15
Budget Year +2 2015/16
Repairs and Maintenance By Expenditure item
Materials 55 661 65 431 21 114 58 731 58 731 52 858 52 858 78 200 8 557 8 985
Total Repairs and Maintenance Expenditure
55 661 65 431 21 114 58 731 58 731 52 858 52 858 78 200 8 557 8 985

25
During the compilation of the 2013/14 MTREF operational repairs and maintenance was substantially decreased from R78 million to R8.9 million. This is due to costing method within our agency services. The table below provides a breakdown of the repairs and maintenance in relation to asset class:
Table 7 Repairs and maintenance per asset class
Description 2009/10 2010/11 2011/12 Current Year 2012/13 2013/14 Medium Term Revenue &
Expenditure Framework
R thousands Audited
Outcome Audited
Outcome Audited
Outcome Original Budget
Adjusted Budget
Full Year Forecast
Pre-audit outcome
Budget Year
2013/14
Budget Year +1 2014/15
Budget Year +2 2015/16
Depreciation and Asset Impairment 14 833 18 351 19 526 23 701 23 701 21 331 21 331 24 764 26 470 28 317
Repairs and Maintenance by asset class 55 661 65 431 21 114 58 731 58 731 52 858 52 858 78 200 8 557 8 985
Infrastructure – Road transport 49 376 60 775 15 767 50 341 50 341 45 306 45 306 70 265
Infrastructure – Electricity 1 655 122
Infrastructure – Water 185 2 897 3 508 4 726 4 726 4 253 4 253 2 960 3 375 3 544
Total Infrastructure 51 216 63 794 19 276 55 066 55 066 49 559 49 559 73 225 3 375 3 544
Community 75 937 1 908 1 908 1 717 1 717 800 840 882
Investment Property 309
Other assets 4 370 700 1 529 1 757 1 757 1 581 1 581 4 175 4 341 4 558
Total Expenditure 70 494 83 781 40 640 82 433 82 433 74 189 74 189 102 964 35 026 37 302
For the 2013/14 financial year, R73.2 million of total repairs and maintenance will be spent on infrastructure assets. Road infrastructure has received a significant proportion of this allocation totalling R70.2 million, followed by water infrastructure at R2.9 million. Community assets have been allocated R2.5 million of total repairs and maintenance.
1.6 Capital expenditure
The following table provides a breakdown of budgeted capital expenditure by vote: Table 8 2013/14 Medium-term capital budget per vote
Description 2009/10 2010/11 2011/12 Current Year 2012/13 2013/14 Medium Term Revenue & Expenditure
Framework
R thousands Audited
Outcome Audited
Outcome Audited
Outcome Original Budget
Adjusted Budget
Full Year Forecast
Pre-audit outcome
Budget Year 2013/14
Budget Year +1 2014/15
Budget Year +2 2015/16
Executive and Council 97 35 12 300 700 700 700
Budget and Treasury office 6 364 1 023 243
Corporate Services 9 099 2 416
Community and Social Services
4 882 49 99
Sport and Recreation 549
Public Safety 5 994 4 286 1 221 1 766 1 766 1 766 1 766 400
Health 1 571 39 95
Road transport 4 110 3 336 20
Electricity 156 11 596
Water 43 117 48 845 28 603 43 700 32 600 32 600 32 600 15 200 43 790 47 640
Waste Management 614
Total Capital Expenditure 70 189 62 965 31 671 45 766 35 066 35 066 35 066 16 300 43 790 47 640
For 2013/14 an amount of R15.2 million has been appropriated for the development of water infrastructure which represents 93 per cent of the total capital budget. In the outer years this amount totals R43.7, and R47.6 million, respectively for each of the financial years.

26
Further detail relating to asset classes and proposed capital expenditure is contained in Table 18 MBRR A9 (Asset Management) on page 41 and 42. In addition to the MBRR Table A9, MBRR Tables SA34a, c and d provides a detailed breakdown of the capital programme relating to new asset construction, as well as operational repairs and maintenance by asset class (refer to pages 87, 88, 89 and 90). Some of the capital projects to be undertaken over the medium-term includes, amongst others:
Functional Sector
Programme & Project Description
Funding Source
Budget Year
2013/2014
Budget Year
2014/2015
Budget Year
2015/2016
Total
Water Provision
Vergeleë/Besaansklip Storage
Surplus - -
1,550 1,550
Water Provision
Glen Lily System (Pipeline)
Surplus - - 2,500 2,500
Water Provision
Pipeline Swartland Surplus 1,100 17,000 - 18,100
Water Provision
Pipeline Darling (PRR Wesbank)
Surplus - 3,500 10,500 14,000
Water Provision
Voëlvlei WTW filter Surplus 4,100 2,250 250 6,600
Water Provision
Vehicles Surplus - 950 600 1,550
Water Provision
Flow meters
Surplus - 700 400 1,100
Water Provision
Computers & Network Surplus - 135 175 310
Water Provision
Valves Surplus - 3,000 1,500 4,500
Water Provision
Electronic equipment Surplus - 105 85 190
Water Provision
Laboratory equipment Surplus - 60 30 90
Water Provision
Furniture and office equipment
Surplus - 60 35 95
Water Provision
Air conditioning Surplus - 30 15 45
Water Provision
Desalination plant Grant 10,000 16,000 30,000 56,000
Health Inspectors
Furniture and equipment
Surplus 11 - - 11
Fire fighting Services
Vehicles Surplus 60 - - 60
Fire fighting Services
Radio’s Surplus 330 - - 330
Disaster Management
Furniture and equipment
Surplus 10 - - 10
Finance and Administration
Furniture and equipment
Surplus 71 - - 71
Ganzekraal Furniture and equipment
Surplus 30 - - 30
Information Computers & Network Surplus 232 - - 232

27
Technology
Buildings Furniture and equipment
Surplus 356 - - 356
16,300 43,790 47,640 107,730
The following graph provides a breakdown of the capital budget to be spent per service related projects over the MTREF.
Figure 2 Capital Infrastructure Programme per service
1.6.1 Future operational cost of new infrastructure
The future operational costs and revenues associated with the capital programme have been included in Table 51 MBRR SA35 on page 90. This table shows that future operational costs associated with the capital programme totals R16.3 million in 2013/14 and escalates to R47.6 million by 2015/16. This concomitant operational expenditure is expected to decrease to R6.6 million by 2016/17. It needs to be noted that as part of the 2011/12 MTREF, this expenditure has been factored into the two outer years of the operational budget.
1.7 Annual Budget Tables - Parent Municipality
The following pages present the ten main budget tables as required in terms of section 8 of the Municipal Budget and Reporting Regulations. These tables set out the municipality’s 2013/14 budget and MTREF as approved by the Council. Each table is accompanied by explanatory notes on the facing page.
09/10 AUD 10/11 AUD 11/12 AUDCY 12/13
BUDCY 12/13
ADJCY 12/13
FCSTCY 12/13
ACTBudget
Year 13/14RBudget
Year 13/14
BudgetYear +114/15
BudgetYear +215/16
Trading Services 53 520 48 856 29 200 43 700 32 601 32 601 32 601 15 200 43 790 47 640
Agencies 20
0
5000000
10000000
15000000
20000000
25000000
30000000
35000000
40000000
45000000
50000000
Rm

28
Table 9 MBRR Table A1 - Budget Summary
Description 2009/10 2010/11 2011/12
R thousandsAudited
Outcome
Audited
Outcome
Audited
Outcome
Original
Budget
Adjusted
Budget
Full Year
Forecast
Pre-audit
outcome
Budget Year
2013/14
Budget Year
+1 2014/15
Budget Year
+2 2015/16
Financial Performance
Property rates 801 868 – – – – – – – –
Serv ice charges 68 137 74 341 80 575 87 458 87 458 87 458 87 458 96 511 112 304 126 388
Inv estment rev enue 15 287 9 549 8 076 8 020 8 020 8 020 8 020 8 000 8 400 8 820
Transfers recognised - operational 72 346 81 517 78 037 72 799 72 216 72 216 71 853 76 281 80 585 85 653
Other ow n rev enue 59 330 83 176 80 125 72 895 83 644 83 644 83 644 89 635 93 343 97 920
Total Revenue (excluding capital transfers
and contributions)
215 901 249 451 246 813 241 171 251 337 251 337 250 974 270 426 294 632 318 781
Employ ee costs 61 670 64 818 66 184 69 608 69 294 62 365 62 365 74 916 82 271 86 003
Remuneration of councillors 6 812 4 700 3 652 4 372 4 372 3 935 3 935 4 784 5 023 5 274
Depreciation & asset impairment 14 833 18 351 19 526 23 701 23 701 21 331 21 331 24 764 26 470 28 317
Finance charges 6 657 8 174 11 164 13 235 13 235 11 911 11 911 12 930 11 847 10 664
Materials and bulk purchases 13 435 72 764 28 770 67 183 29 409 27 313 27 313 88 061 93 439 103 663
Transfers and grants – – – – – – – – – –
Other ex penditure 93 804 81 240 148 394 70 372 121 626 115 376 115 376 64 350 73 830 83 112
Total Expenditure 197 211 250 045 277 691 248 471 261 637 242 231 242 231 269 806 292 880 317 033
Surplus/(Deficit) 18 690 (594) (30 877) (7 300) (10 300) 9 106 8 743 621 1 753 1 748
Transfers recognised - capital – – – 10 100 8 100 8 100 8 100 10 000 16 000 30 000
Contributions recognised - capital & contributed assets – – – – – – – – – –
Surplus/(Deficit) after capital transfers &
contributions
18 690 (594) (30 877) 2 800 (2 200) 17 206 16 843 10 621 17 753 31 748
Share of surplus/ (deficit) of associate – – – – – – – – – –
Surplus/(Deficit) for the year 18 690 (594) (30 877) 2 800 (2 200) 17 206 16 843 10 621 17 753 31 748
Capital expenditure & funds sources
Capital expenditure 70 189 62 965 31 671 45 766 35 066 35 066 35 066 16 300 43 790 47 640
Transfers recognised - capital – 9 124 – 10 100 8 100 8 100 8 100 10 000 16 000 30 000
Public contributions & donations – – – – – – – – – –
Borrow ing 40 500 35 000 – 30 000 24 800 24 800 24 800 – – –
Internally generated funds 29 689 18 841 31 671 5 666 2 166 2 166 2 166 6 300 27 790 17 640
Total sources of capital funds 70 189 62 965 31 671 45 766 35 066 35 066 35 066 16 300 43 790 47 640
Financial position
Total current assets 164 783 166 420 150 763 197 185 165 917 174 854 174 854 181 394 172 713 174 836
Total non current assets 289 083 339 704 317 180 372 771 372 771 433 262 433 262 486 202 512 286 528 078
Total current liabilities 40 351 42 332 35 320 27 637 27 637 52 395 52 395 24 409 21 052 23 065
Total non current liabilities 101 778 141 372 139 322 152 802 152 802 167 900 167 900 161 002 152 998 142 021
Community w ealth/Equity 311 737 322 419 293 300 389 516 358 248 387 821 387 821 482 185 510 949 537 828
Cash flows
Net cash from (used) operating 40 500 37 320 (2 942) 31 747 21 501 37 501 37 501 40 584 44 222 60 065
Net cash from (used) inv esting (66 554) (62 830) 4 097 (45 766) (35 066) (35 066) (35 066) (16 300) (43 790) (47 640)
Net cash from (used) financing 33 618 21 281 (18 239) 22 056 22 056 22 056 22 056 (8 861) (9 944) (11 127)
Cash/cash equivalents at the year end 155 555 151 325 134 240 142 277 142 732 158 732 158 732 174 156 164 643 165 941
Cash backing/surplus reconciliation
Cash and inv estments av ailable 155 555 151 325 134 240 190 000 158 732 158 732 158 732 174 156 164 643 165 941
Application of cash and inv estments 58 534 65 158 60 912 51 068 51 675 83 711 83 711 65 866 62 633 62 862
Balance - surplus (shortfall) 97 021 86 166 73 328 138 932 107 057 75 021 75 021 108 290 102 010 103 079
Asset management
Asset register summary (WDV) 289 083 339 704 317 180 372 771 372 771 433 262 486 202 486 202 512 286 528 078
Depreciation & asset impairment 14 833 18 351 19 526 23 701 23 701 21 331 24 764 24 764 26 470 28 317
Renew al of Ex isting Assets – – – – – – – – – –
Repairs and Maintenance 55 661 65 431 21 114 58 731 58 731 52 858 78 200 78 200 8 557 8 985
Free services
Cost of Free Basic Serv ices prov ided 45 51 26 – – – – – – –
Rev enue cost of free serv ices prov ided – – – – – – – – – –
Households below minimum service level
Water: – – – – – – – – – –
Sanitation/sew erage: – – – – – – – – – –
Energy : – – – – – – – – – –
Refuse: – – – – – – – – – –
2013/14 Medium Term Revenue &
Expenditure FrameworkCurrent Year 2012/13

29
Explanatory notes to MBRR Table A1 - Budget Summary 1. Table A1 is a budget summary and provides a concise overview of the municipality’s budget
from all of the major financial perspectives (operating, capital expenditure, financial position, cash flow, and MFMA funding compliance).
2. The table provides an overview of the amounts approved by Council for operating performance, resources deployed to capital expenditure, financial position, cash and funding compliance, as well as the municipality’s commitment to eliminating basic service delivery backlogs.
3. Financial management reforms emphasises the importance of the municipal budget being funded. This requires the simultaneous assessment of the Financial Performance, Financial Position and Cash Flow Budgets, along with the Capital Budget. The Budget Summary provides the key information in this regard:
a. The operating surplus/deficit (after Total Expenditure) is positive over the MTREF b. Capital expenditure is balanced by capital funding sources, of which
i. Transfers recognised is reflected on the Financial Performance Budget; ii. Internally generated funds are financed from a combination of the current
operating surplus and accumulated cash-backed surpluses from previous years. The amount is incorporated in the Net cash from investing on the Cash Flow Budget. The fact that the municipality’s cash flow remains positive, and is improving indicates that the necessary cash resources are available to fund the Capital Budget.
4. The Cash backing/surplus reconciliation shows Council as well as managements continued efforts to make this municipality financially viable and sustainable in the medium to long-term.

30
Table 10 MBRR Table A2 - Budgeted Financial Performance (revenue and expenditure by standard classification)
Explanatory notes to MBRR Table A2 - Budgeted Financial Performance (revenue and expenditure by standard classification) 1. Table A2 is a view of the budgeted financial performance in relation to revenue and
expenditure per standard classification. The modified GFS standard classification divides the municipal services into 15 functional areas. Municipal revenue, operating expenditure and capital expenditure are then classified in terms if each of these functional areas which enables the National Treasury to compile ‘whole of government’ reports.
2. Note the Total Revenue on this table includes capital revenues (Transfers recognised – capital) and so does not balance to the operating revenue shown on Table A4.
3. Note that as a general principle the revenues for the Trading Services should exceed their expenditures. The table highlights that this is the case for the water function.
Standard Classification Description Ref 2009/10 2010/11 2011/12
R thousand 1Audited
Outcome
Audited
Outcome
Audited
Outcome
Original
Budget
Adjusted
Budget
Full Year
Forecast
Budget Year
2013/14
Budget Year
+1 2014/15
Budget Year
+2 2015/16
Revenue - Standard
Governance and administration 84 670 89 912 81 848 85 029 82 392 82 392 75 686 78 651 81 063
Ex ecutiv e and council – 2 48 1 000 1 000 1 000 2 098 2 075 1 969
Budget and treasury office 77 852 83 066 75 852 72 329 69 692 69 692 73 573 76 560 79 077
Corporate serv ices 6 818 6 843 5 948 11 700 11 700 11 700 15 16 17
Community and public safety 11 799 11 869 14 562 14 775 14 775 14 775 15 485 17 464 20 866
Community and social serv ices 1 886 106 2 562 2 556 2 556 2 556 2 796 2 935 3 082
Sport and recreation – 2 465 – – – – – – –
Public safety 4 778 3 399 5 481 5 263 5 263 5 263 5 263 6 127 7 698
Housing 764 1 465 1 474 1 523 1 523 1 523 1 589 1 669 1 752
Health 4 371 4 435 5 045 5 432 5 432 5 432 5 837 6 732 8 334
Economic and environmental services 50 236 65 571 64 458 56 786 67 589 67 589 81 368 84 767 88 946
Planning and dev elopment 117 872 15 10 10 10 – – –
Road transport 50 119 64 699 64 443 56 776 67 579 67 579 81 368 84 767 88 946
Env ironmental protection – – – – – – – – –
Trading services 69 195 82 099 85 946 94 681 94 681 94 681 107 888 129 750 157 906
Electricity 1 016 2 016 – – – – – – –
Water 67 393 78 595 85 946 94 681 94 681 94 681 107 888 129 750 157 906
Waste w ater management 787 1 488 – – – – – – –
Waste management – – – – – – – – –
Other 4 – – – – – – – – –
Total Revenue - Standard 2 215 901 249 451 246 813 251 271 259 437 259 437 280 426 310 632 348 781
Expenditure - Standard
Governance and administration 39 523 64 020 80 740 45 927 46 290 41 661 34 122 36 134 39 106
Ex ecutiv e and council 16 408 14 689 10 250 11 046 11 046 9 941 14 065 14 580 15 126
Budget and treasury office 5 356 34 042 56 230 20 853 21 216 19 095 9 822 10 850 12 749
Corporate serv ices 17 758 15 289 14 260 14 028 14 028 12 625 10 235 10 705 11 231
Community and public safety 44 049 46 632 46 449 46 920 48 920 44 028 50 373 52 097 54 604
Community and social serv ices 4 577 4 039 3 187 3 834 3 834 3 451 3 907 4 103 4 308
Sport and recreation 528 286 – – – – – – –
Public safety 25 139 27 947 28 072 25 123 27 123 24 410 29 296 30 216 31 629
Housing 447 482 500 1 217 1 217 1 096 1 216 1 277 1 340
Health 13 357 13 877 14 690 16 746 16 746 15 071 15 955 16 501 17 327
Economic and environmental services 57 030 71 488 68 169 63 420 74 223 73 558 84 335 88 109 92 455
Planning and dev elopment 11 391 6 319 3 726 6 644 6 644 5 979 2 967 3 342 3 509
Road transport 45 638 65 170 64 443 56 776 67 579 67 579 81 368 84 767 88 946
Env ironmental protection – – – – – – – – –
Trading services 56 610 67 905 82 333 92 205 92 205 82 984 100 975 116 540 130 868
Electricity 1 013 2 014 – – – – – – –
Water 54 827 65 167 82 333 92 205 92 205 82 984 100 975 116 540 130 868
Waste w ater management 770 723 – – – – – – –
Waste management – – – – – – – – –
Other 4 – – – – – – – – –
Total Expenditure - Standard 3 197 211 250 045 277 691 248 471 261 637 242 231 269 806 292 880 317 033
Surplus/(Deficit) for the year 18 690 (594) (30 877) 2 800 (2 200) 17 206 10 621 17 753 31 748
Current Year 2012/132013/14 Medium Term Revenue &
Expenditure Framework

31
4. Other functions that show a deficit between revenue and expenditure are being financed from grants and other revenue sources reflected under the Budget and Treasury office.
Table 11 MBRR Table A3 - Budgeted Financial Performance (revenue and expenditure by
municipal vote)
Vote Description Ref 2009/10 2010/11 2011/12
R thousandAudited
Outcome
Audited
Outcome
Audited
Outcome
Original
Budget
Adjusted
Budget
Full Year
Forecast
Budget Year
2013/14
Budget Year
+1 2014/15
Budget Year
+2 2015/16
Revenue by Vote 1
Vote 1 - COMMUNITY SERVICES 101 628 94 880 85 028 89 192 86 555 86 555 81 513 85 373 89 385
Vote 2 - SUBSIDISED SERVICES 5 132 3 843 7 361 6 543 6 543 6 543 6 650 7 583 9 227
Vote 3 - ECONOMIC SERVICES 2 547 3 953 2 562 2 556 2 556 2 556 2 796 2 935 3 082
Vote 4 - HOUSING 764 1 465 1 474 1 523 1 523 1 523 1 589 1 669 1 752
Vote 5 - TRADING SERVICES 66 531 80 611 85 945 94 681 94 681 94 681 106 511 128 304 156 388
Vote 6 - AGENCIES 39 299 64 699 64 443 56 776 67 579 67 579 81 368 84 767 88 946
Vote 7 - [NAME OF VOTE 7] – – – – – – – – –
Vote 8 - [NAME OF VOTE 8] – – – – – – – – –
Vote 9 - [NAME OF VOTE 9] – – – – – – – – –
Vote 10 - [NAME OF VOTE 10] – – – – – – – – –
Vote 11 - [NAME OF VOTE 11] – – – – – – – – –
Vote 12 - [NAME OF VOTE 12] – – – – – – – – –
Vote 13 - [NAME OF VOTE 13] – – – – – – – – –
Vote 14 - [NAME OF VOTE 14] – – – – – – – – –
Vote 15 - [NAME OF VOTE 15] – – – – – – – – –
Total Revenue by Vote 2 215 901 249 451 246 813 251 271 259 437 259 437 280 426 310 632 348 781
Expenditure by Vote to be appropriated 1
Vote 1 - COMMUNITY SERVICES 64 911 78 882 94 652 63 638 64 001 57 601 52 045 54 902 58 813
Vote 2 - SUBSIDISED SERVICES 31 851 34 610 34 104 30 801 32 801 29 521 35 014 36 220 37 933
Vote 3 - ECONOMIC SERVICES 4 486 4 190 3 187 3 834 3 834 3 451 3 907 4 103 4 308
Vote 4 - HOUSING 447 482 500 1 217 1 217 1 096 1 216 1 276 1 340
Vote 5 - TRADING SERVICES 55 840 67 182 80 804 92 205 92 205 82 984 96 256 111 611 125 693
Vote 6 - AGENCIES 39 676 64 699 64 443 56 776 67 579 67 579 81 368 84 767 88 946
Vote 7 - [NAME OF VOTE 7] – – – – – – – – –
Vote 8 - [NAME OF VOTE 8] – – – – – – – – –
Vote 9 - [NAME OF VOTE 9] – – – – – – – – –
Vote 10 - [NAME OF VOTE 10] – – – – – – – – –
Vote 11 - [NAME OF VOTE 11] – – – – – – – – –
Vote 12 - [NAME OF VOTE 12] – – – – – – – – –
Vote 13 - [NAME OF VOTE 13] – – – – – – – – –
Vote 14 - [NAME OF VOTE 14] – – – – – – – – –
Vote 15 - [NAME OF VOTE 15] – – – – – – – – –
Total Expenditure by Vote 2 197 211 250 045 277 691 248 471 261 637 242 231 269 806 292 880 317 033
Surplus/(Deficit) for the year 2 18 690 (594) (30 877) 2 800 (2 200) 17 206 10 621 17 753 31 748
Current Year 2012/132013/14 Medium Term Revenue &
Expenditure Framework
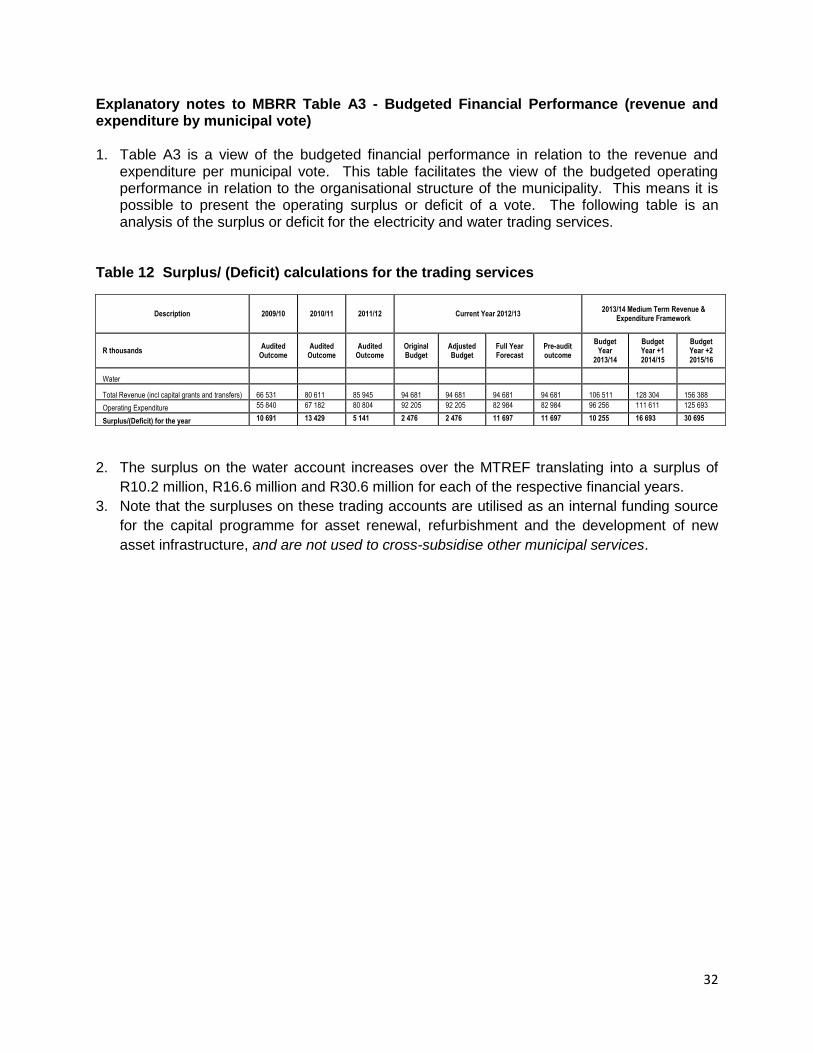
32
Explanatory notes to MBRR Table A3 - Budgeted Financial Performance (revenue and expenditure by municipal vote) 1. Table A3 is a view of the budgeted financial performance in relation to the revenue and
expenditure per municipal vote. This table facilitates the view of the budgeted operating performance in relation to the organisational structure of the municipality. This means it is possible to present the operating surplus or deficit of a vote. The following table is an analysis of the surplus or deficit for the electricity and water trading services.
Table 12 Surplus/ (Deficit) calculations for the trading services
Description 2009/10 2010/11 2011/12 Current Year 2012/13 2013/14 Medium Term Revenue &
Expenditure Framework
R thousands Audited
Outcome Audited
Outcome Audited
Outcome Original Budget
Adjusted Budget
Full Year Forecast
Pre-audit outcome
Budget Year
2013/14
Budget Year +1 2014/15
Budget Year +2 2015/16
Water
Total Revenue (incl capital grants and transfers) 66 531 80 611 85 945 94 681 94 681 94 681 94 681 106 511 128 304 156 388
Operating Expenditure 55 840 67 182 80 804 92 205 92 205 82 984 82 984 96 256 111 611 125 693
Surplus/(Deficit) for the year 10 691 13 429 5 141 2 476 2 476 11 697 11 697 10 255 16 693 30 695
2. The surplus on the water account increases over the MTREF translating into a surplus of
R10.2 million, R16.6 million and R30.6 million for each of the respective financial years.
3. Note that the surpluses on these trading accounts are utilised as an internal funding source
for the capital programme for asset renewal, refurbishment and the development of new
asset infrastructure, and are not used to cross-subsidise other municipal services.

33
Table 13 MBRR Table A4 - Budgeted Financial Performance (revenue and expenditure)
Explanatory notes to Table A4 - Budgeted Financial Performance (revenue and expenditure) 1. Total revenue is R259 million in 2013/14 and escalates to R348.7 by 2015/16. 2. Services charges relating to water constitutes the biggest component of the revenue basket
of the municipality totalling R96.2 million for the 2013/14 financial year and increasing to R125.6 million by 2015/16.
3. Transfers recognised – operating includes the local government equitable share and other operating grants from national and provincial government. It needs to be noted that in real terms the grants receipts from national government are growing slowly over the MTREF.
Description Ref 2009/10 2010/11 2011/12
R thousand 1Audited
Outcome
Audited
Outcome
Audited
Outcome
Original
Budget
Adjusted
Budget
Full Year
Forecast
Pre-audit
outcome
Budget Year
2013/14
Budget Year
+1 2014/15
Budget Year
+2 2015/16
Revenue By Source
Property rates 2 801 868 – – – – – – – –
Property rates - penalties & collection charges
Serv ice charges - electricity rev enue 2 947 1 186 – – – – – – – –
Serv ice charges - w ater rev enue 2 66 696 72 571 80 575 87 458 87 458 87 458 87 458 96 511 112 304 126 388
Serv ice charges - sanitation rev enue 2 494 585 – – – – – – – –
Serv ice charges - refuse rev enue 2 – – – – – – – – – –
Serv ice charges - other
Rental of facilities and equipment 2 605 3 610 3 610 3 610 3 610 5 279 5 543 5 820
Interest earned - ex ternal inv estments 15 287 9 549 8 076 8 020 8 020 8 020 8 020 8 000 8 400 8 820
Interest earned - outstanding debtors 62
Div idends receiv ed
Fines 60
Licences and permits 939 939 939 939 120 126 132
Agency serv ices 50 112 64 699 64 439 56 776 67 579 67 579 67 579 81 368 84 767 88 946
Transfers recognised - operational 72 346 81 517 78 037 72 799 72 216 72 216 71 853 76 281 80 585 85 653
Other rev enue 2 6 491 18 353 15 260 11 569 11 515 11 515 11 515 2 868 2 906 3 021
Gains on disposal of PPE 125 426
Total Revenue (excluding capital transfers
and contributions)
215 901 249 451 246 813 241 171 251 337 251 337 250 974 270 426 294 632 318 781
Expenditure By Type
Employ ee related costs 2 61 670 64 818 66 184 69 608 69 294 62 365 62 365 74 916 82 271 86 003
Remuneration of councillors 6 812 4 700 3 652 4 372 4 372 3 935 3 935 4 784 5 023 5 274
Debt impairment 3 200
Depreciation & asset impairment 2 14 833 18 351 19 526 23 701 23 701 21 331 21 331 24 764 26 470 28 317
Finance charges 6 657 8 174 11 164 13 235 13 235 11 911 11 911 12 930 11 847 10 664
Bulk purchases 2 7 150 7 332 7 329 8 450 8 450 8 450 8 450 9 861 11 390 13 212
Other materials 8 6 285 65 431 21 441 58 733 20 959 18 863 18 863 78 200 82 050 90 452
Contracted serv ices 4 400 – – – – – – – – –
Transfers and grants – – – – – – – – – –
Other ex penditure 4, 5 89 204 81 240 148 394 70 372 121 626 115 376 115 376 64 350 73 830 83 112
Loss on disposal of PPE
Total Expenditure 197 211 250 045 277 691 248 471 261 637 242 231 242 231 269 806 292 880 317 033
Surplus/(Deficit) 18 690 (594) (30 877) (7 300) (10 300) 9 106 8 743 621 1 753 1 748
Transfers recognised - capital 10 100 8 100 8 100 8 100 10 000 16 000 30 000
Contributions recognised - capital 6 – – – – – – – – – –
Contributed assets
Surplus/(Deficit) after capital transfers &
contributions
18 690 (594) (30 877) 2 800 (2 200) 17 206 16 843 10 621 17 753 31 748
Tax ation
Surplus/(Deficit) after taxation 18 690 (594) (30 877) 2 800 (2 200) 17 206 16 843 10 621 17 753 31 748
Attributable to minorities
Surplus/(Deficit) attributable to municipality 18 690 (594) (30 877) 2 800 (2 200) 17 206 16 843 10 621 17 753 31 748
Share of surplus/ (deficit) of associate 7
Surplus/(Deficit) for the year 18 690 (594) (30 877) 2 800 (2 200) 17 206 16 843 10 621 17 753 31 748
2013/14 Medium Term Revenue &
Expenditure FrameworkCurrent Year 2012/13

34
4. The following graph illustrates the major expenditure items per type.
Figure 3 Expenditure by major type
5. Bulk purchases have significantly increased over the 2009/10 to 2015/16 period escalating from R7.1 million to R13.2 million. These increases can be attributed to the substantial increase in the cost water.
6. Employee related costs and other expenditure are the main cost drivers within the municipality.
Depreciation & assetimpairment
Other expenditure Bulk purchases Employee related costs
09/10 AUD 14 833 89 204 7 150 61 670
10/11 AUD 18 351 81 240 7 332 64 818
11/12 AUD 19 526 148 394 7 329 66 184
CY 12/13 BUD 23 701 70 372 8 450 69 608
CY 12/13 ADJ 23 701 121 626 8 450 69 294
CY 12/13 FCST 21 331 115 412 8 450 62 365
CY 12/13 ACT 21 331 115 412 8 450 62 365
Budget Year 13/14 24 764 64 350 9 861 74 916
RBudget Year 13/14
Budget Year +1 14/15 26 470 73 830 11 390 82 271
Budget Year +2 15/16 28 317 83 112 13 212 86 003
20 000
40 000
60 000
80 000
100 000
120 000
140 000
160 000
Rm

35
Table 14 MBRR Table A5 - Budgeted Capital Expenditure by vote, standard classification and funding source
Vote Description Ref 2009/10 2010/11 2011/12
R thousand 1Audited
Outcome
Audited
Outcome
Audited
Outcome
Original
Budget
Adjusted
Budget
Full Year
Forecast
Pre-audit
outcome
Budget Year
2013/14
Budget Year
+1 2014/15
Budget Year
+2 2015/16
Capital expenditure - Vote
Multi-year expenditure to be appropriated 2
Vote 1 - COMMUNITY SERVICES 10 768 9 774 1 231 300 700 700 700 671 – –
Vote 2 - SUBSIDISED SERVICES 11 424 4 335 1 221 1 766 1 766 1 766 1 766 400 – –
Vote 3 - ECONOMIC SERVICES 614 – – – – – – 30 – –
Vote 4 - HOUSING – – – – – – – – – –
Vote 5 - TRADING SERVICES 43 273 48 856 29 200 43 700 32 601 32 601 32 601 15 200 43 790 47 640
Vote 6 - AGENCIES 4 110 – 20 – – – – – – –
Vote 7 - [NAME OF VOTE 7] – – – – – – – – – –
Vote 8 - [NAME OF VOTE 8] – – – – – – – – – –
Vote 9 - [NAME OF VOTE 9] – – – – – – – – – –
Vote 10 - [NAME OF VOTE 10] – – – – – – – – – –
Vote 11 - [NAME OF VOTE 11] – – – – – – – – – –
Vote 12 - [NAME OF VOTE 12] – – – – – – – – – –
Vote 13 - [NAME OF VOTE 13] – – – – – – – – – –
Vote 14 - [NAME OF VOTE 14] – – – – – – – – – –
Vote 15 - [NAME OF VOTE 15] – – – – – – – – – –
Capital multi-year expenditure sub-total 7 70 189 62 965 31 671 45 766 35 066 35 066 35 066 16 300 43 790 47 640
Single-year expenditure to be appropriated 2
Vote 1 - COMMUNITY SERVICES – – – – – – – – – –
Vote 2 - SUBSIDISED SERVICES – – – – – – – – – –
Vote 3 - ECONOMIC SERVICES – – – – – – – – – –
Vote 4 - HOUSING – – – – – – – – – –
Vote 5 - TRADING SERVICES – – – – – – – – – –
Vote 6 - AGENCIES – – – – – – – – – –
Vote 7 - [NAME OF VOTE 7] – – – – – – – – – –
Vote 8 - [NAME OF VOTE 8] – – – – – – – – – –
Vote 9 - [NAME OF VOTE 9] – – – – – – – – – –
Vote 10 - [NAME OF VOTE 10] – – – – – – – – – –
Vote 11 - [NAME OF VOTE 11] – – – – – – – – – –
Vote 12 - [NAME OF VOTE 12] – – – – – – – – – –
Vote 13 - [NAME OF VOTE 13] – – – – – – – – – –
Vote 14 - [NAME OF VOTE 14] – – – – – – – – – –
Vote 15 - [NAME OF VOTE 15] – – – – – – – – – –
Capital single-year expenditure sub-total – – – – – – – – – –
Total Capital Expenditure - Vote 70 189 62 965 31 671 45 766 35 066 35 066 35 066 16 300 43 790 47 640
Capital Expenditure - Standard
Governance and administration 9 196 6 399 1 037 300 700 700 700 659 – –
Ex ecutiv e and council 97 35 12 300 700 700 700
Budget and treasury office 6 364 1 023 243
Corporate serv ices 9 099 0 2 416
Community and public safety 12 996 4 374 1 415 1 766 1 766 1 766 1 766 430 – –
Community and social serv ices 4 882 49 99 30
Sport and recreation 549 –
Public safety 5 994 4 286 1 221 1 766 1 766 1 766 1 766 400
Housing
Health 1 571 39 95
Economic and environmental services 4 110 3 336 20 – – – – 11 – –
Planning and dev elopment
Road transport 4 110 3 336 20
Env ironmental protection 11
Trading services 43 888 48 856 29 200 43 700 32 600 32 600 32 600 15 200 43 790 47 640
Electricity 156 11 596
Water 43 117 48 845 28 603 43 700 32 600 32 600 32 600 15 200 43 790 47 640
Waste w ater management
Waste management 614
Other
Total Capital Expenditure - Standard 3 70 189 62 965 31 671 45 766 35 066 35 066 35 066 16 300 43 790 47 640
Funded by:
National Gov ernment 3 336 10 000 16 000 30 000
Prov incial Gov ernment
District Municipality
Other transfers and grants – 5 788 10 100 8 100 8 100 8 100
Transfers recognised - capital 4 – 9 124 – 10 100 8 100 8 100 8 100 10 000 16 000 30 000
Public contributions & donations 5
Borrowing 6 40 500 35 000 30 000 24 800 24 800 24 800
Internally generated funds 29 689 18 841 31 671 5 666 2 166 2 166 2 166 6 300 27 790 17 640
Total Capital Funding 7 70 189 62 965 31 671 45 766 35 066 35 066 35 066 16 300 43 790 47 640
2013/14 Medium Term Revenue &
Expenditure FrameworkCurrent Year 2012/13
36
Explanatory notes to Table A5 - Budgeted Capital Expenditure by vote, standard classification and funding source 1. Table A5 is a breakdown of the capital program in relation to capital expenditure by
municipal vote (multi-year and single-year appropriations); capital expenditure by standard classification; and the funding sources necessary to fund the capital budget, including information on capital transfers from national and provincial departments.
2. The MFMA provides that a municipality may approve multi-year or single-year capital budget appropriations. In relation to multi-year appropriations, for 2013/14 R16.3 million has been allocated of the total R107.7 million capital budget.
3. Single-year capital expenditure has been appropriated at R1.1 million for the 2013/14 financial year.
4. Unlike multi-year capital appropriations, single-year appropriations relate to expenditure that will be incurred in the specific budget year such as the procurement of vehicles and specialized tools and equipment. The budget appropriations for the two outer years are indicative allocations based on the departmental business plans as informed by the IDP and will be reviewed on an annual basis to assess the relevance of the expenditure in relation to the strategic objectives and service delivery imperatives. For the purpose of funding assessment of the MTREF, these appropriations have been included but no commitments will be incurred against single-year appropriations for the two outer-years.
5. The capital program is funded from capital grants and internally generated funds from current year surpluses. For 2013/14, capital transfers totals R10 million and escalates to R30 million by 2015/16. These funding sources are further discussed in detail in 2.6 (Overview of Budget Funding).

37
Table 15 MBRR Table A6 - Budgeted Financial Position
Description Ref 2009/10 2010/11 2011/12
R thousandAudited
Outcome
Audited
Outcome
Audited
Outcome
Original
Budget
Adjusted
Budget
Full Year
Forecast
Pre-audit
outcome
Budget Year
2013/14
Budget Year
+1 2014/15
Budget Year
+2 2015/16
ASSETS
Current assets
Cash 155 555 151 325 134 240 190 000 158 732 158 732 158 732 174 156 164 643 165 941
Call inv estment deposits 1 – – – – – – – – – –
Consumer debtors 1 2 347 6 292 6 624 4 000 4 000 9 818 9 818 5 566 6 427 7 139
Other debtors 5 746 7 610 8 473 2 000 2 000 5 066 5 066 410 425 446
Current portion of long-term receiv ables
Inv entory 2 1 136 1 194 1 426 1 185 1 185 1 239 1 239 1 262 1 218 1 310
Total current assets 164 783 166 420 150 763 197 185 165 917 174 854 174 854 181 394 172 713 174 836
Non current assets
Long-term receiv ables
Inv estments
Inv estment property 5 474 5 033 4 931 6 641 6 641 4 888 4 888 5 474 5 474 5 474
Inv estment in Associate
Property , plant and equipment 3 283 608 334 670 312 249 366 130 366 130 428 374 428 374 480 727 506 811 522 604
Agricultural
Biological
Intangible
Other non-current assets
Total non current assets 289 083 339 704 317 180 372 771 372 771 433 262 433 262 486 202 512 286 528 078
TOTAL ASSETS 453 866 506 124 467 943 569 956 538 688 608 117 608 117 667 595 684 999 702 915
LIABILITIES
Current liabilities
Bank ov erdraft 1
Borrow ing 4 5 594 7 050 7 944 7 944 7 944 7 944 7 944 8 861 9 944 11 127
Consumer deposits
Trade and other pay ables 4 34 528 35 034 26 985 19 693 19 693 44 451 44 451 15 548 11 108 11 938
Prov isions 229 248 391
Total current liabilities 40 351 42 332 35 320 27 637 27 637 52 395 52 395 24 409 21 052 23 065
Non current liabilities
Borrow ing 63 165 91 116 83 146 114 539 114 539 113 146 113 146 104 285 94 341 83 214
Prov isions 38 613 50 257 56 176 38 263 38 263 54 754 54 754 56 717 58 657 58 807
Total non current liabilities 101 778 141 372 139 322 152 802 152 802 167 900 167 900 161 002 152 998 142 021
TOTAL LIABILITIES 142 129 183 704 174 643 180 439 180 439 220 296 220 296 185 411 174 051 165 087
NET ASSETS 5 311 737 322 419 293 300 389 516 358 248 387 821 387 821 482 185 510 949 537 828
COMMUNITY WEALTH/EQUITY
Accumulated Surplus/(Deficit) 311 737 322 419 293 300 389 516 358 248 387 821 387 821 482 185 510 949 537 828
Reserv es 4 – – – – – – – – – –
Minorities' interests
TOTAL COMMUNITY WEALTH/EQUITY 5 311 737 322 419 293 300 389 516 358 248 387 821 387 821 482 185 510 949 537 828
2013/14 Medium Term Revenue &
Expenditure FrameworkCurrent Year 2012/13

38
Explanatory notes to Table A6 - Budgeted Financial Position 1. Table A6 is consistent with international standards of good financial management practice,
and improves understandability for councilors and management of the impact of the budget on the statement of financial position (balance sheet).
2. This format of presenting the statement of financial position is aligned to GRAP1, which is generally aligned to the international version which presents Assets less Liabilities as “accounting” Community Wealth. The order of items within each group illustrates items in order of liquidity; i.e. assets readily converted to cash, or liabilities immediately required to be met from cash, appear first.
3. Table 15 is supported by an extensive table of notes (SA3 which can be found on page 97) providing a detailed analysis of the major components of a number of items, including: • Call investments deposits; • Consumer debtors; • Property, plant and equipment; • Trade and other payables; • Provisions non-current; • Changes in net assets; and • Reserves
4. The municipal equivalent of equity is Community Wealth/Equity. The justification is that ownership and the net assets of the municipality belong to the community.
5. Any movement on the Budgeted Financial Performance or the Capital Budget will inevitably impact on the Budgeted Financial Position. As an example, the collection rate assumption will impact on the cash position of the municipality and subsequently inform the level of cash and cash equivalents at year end. Similarly, the collection rate assumption should inform the budget appropriation for debt impairment which in turn would impact on the provision for bad debt. These budget and planning assumptions form a critical link in determining the applicability and relevance of the budget as well as the determination of ratios and financial indicators. In addition the funding compliance assessment is informed directly by forecasting the statement of financial position.

39
Table 16 MBRR Table A7 - Budgeted Cash Flow Statement
Table 17 MBRR Table A8 - Cash Backed Reserves/Accumulated Surplus Reconciliation
Description Ref 2009/10 2010/11 2011/12
R thousandAudited
Outcome
Audited
Outcome
Audited
Outcome
Original
Budget
Adjusted
Budget
Full Year
Forecast
Pre-audit
outcome
Budget Year
2013/14
Budget Year
+1 2014/15
Budget Year
+2 2015/16
CASH FLOW FROM OPERATING ACTIVITIES
Receipts
Ratepay ers and other 229 150 227 395 236 199 184 084 179 121 178 121 178 121 199 345 214 047 233 128
Gov ernment - operating 1 72 799 72 216 71 853 71 853 76 281 80 585 85 653
Gov ernment - capital 1 10 100 8 100 8 100 8 100 10 000 16 000 30 000
Interest 11 172 9 549 8 076
Div idends
Payments
Suppliers and employ ees (199 823) (199 625) (247 217) (235 236) (237 936) (220 573) (220 573) (232 112) (254 563) (278 052)
Finance charges (12 930) (11 847) (10 664)
Transfers and Grants 1
NET CASH FROM/(USED) OPERATING ACTIVITIES 40 500 37 320 (2 942) 31 747 21 501 37 501 37 501 40 584 44 222 60 065
CASH FLOWS FROM INVESTING ACTIVITIES
Receipts
Proceeds on disposal of PPE 377 134 35 768
Decrease (Increase) in non-current debtors
Decrease (increase) other non-current receiv ables
Decrease (increase) in non-current inv estments
Payments
Capital assets (66 931) (62 965) (31 671) (45 766) (35 066) (35 066) (35 066) (16 300) (43 790) (47 640)
NET CASH FROM/(USED) INVESTING ACTIVITIES (66 554) (62 830) 4 097 (45 766) (35 066) (35 066) (35 066) (16 300) (43 790) (47 640)
CASH FLOWS FROM FINANCING ACTIVITIES
Receipts
Short term loans
Borrow ing long term/refinancing 37 631 29 454 (7 075) 30 000 30 000 30 000 30 000
Increase (decrease) in consumer deposits
Payments
Repay ment of borrow ing (4 013) (8 174) (11 164) (7 944) (7 944) (7 944) (7 944) (8 861) (9 944) (11 127)
NET CASH FROM/(USED) FINANCING ACTIVITIES 33 618 21 281 (18 239) 22 056 22 056 22 056 22 056 (8 861) (9 944) (11 127)
NET INCREASE/ (DECREASE) IN CASH HELD 7 564 (4 230) (17 084) 8 037 8 492 24 491 24 491 15 424 (9 512) 1 298
Cash/cash equiv alents at the y ear begin: 2 147 991 155 555 151 325 134 240 134 240 134 240 134 240 158 732 174 156 164 643
Cash/cash equiv alents at the y ear end: 2 155 555 151 325 134 240 142 277 142 732 158 732 158 732 174 156 164 643 165 941
2013/14 Medium Term Revenue &
Expenditure FrameworkCurrent Year 2012/13
Description Ref 2009/10 2010/11 2011/12
R thousandAudited
Outcome
Audited
Outcome
Audited
Outcome
Original
Budget
Adjusted
Budget
Full Year
Forecast
Pre-audit
outcome
Budget Year
2013/14
Budget Year
+1 2014/15
Budget Year
+2 2015/16
Cash and investments available
Cash/cash equiv alents at the y ear end 1 155 555 151 325 134 240 142 277 142 732 158 732 158 732 174 156 164 643 165 941
Other current inv estments > 90 day s 0 0 0 47 723 16 000 0 0 0 (0) (0)
Non current assets - Inv estments 1 – – – – – – – – – –
Cash and investments available: 155 555 151 325 134 240 190 000 158 732 158 732 158 732 174 156 164 643 165 941
Application of cash and investments
Unspent conditional transfers 8 913 2 320 1 408 – – 2 168 2 168 – – –
Unspent borrow ing – – – – – – – – –
Statutory requirements 2
Other w orking capital requirements 3 11 157 12 740 3 328 12 805 13 412 26 789 26 789 9 149 3 976 4 055
Other prov isions 38 463 50 099 56 176 38 263 38 263 54 754 54 754 56 717 58 657 58 807
Long term inv estments committed 4 – – – – – – – – – –
Reserv es to be backed by cash/inv estments 5
Total Application of cash and investments: 58 534 65 158 60 912 51 068 51 675 83 711 83 711 65 866 62 633 62 862
Surplus(shortfall) 97 021 86 166 73 328 138 932 107 057 75 021 75 021 108 290 102 010 103 079
2013/14 Medium Term Revenue &
Expenditure FrameworkCurrent Year 2012/13

40
Explanatory notes to Table A7 - Budgeted Cash Flow Statement 1. The budgeted cash flow statement is the first measurement in determining if the budget is
funded. 2. It shows the expected level of cash in-flow versus cash out-flow that is likely to result from
the implementation of the budget. 3. It can be seen that the cash levels are stable over the 2009/10 to 2015/16 financial years. 4. The 2013/14 MTREF has been informed by the planning principle of ensuring adequate
cash reserves over the medium-term. 5. Cash and cash equivalents totals R174.1 million as at the end of the 2013/14 financial year
and decreases to R165.9 million by 2015/16. Explanatory notes to Table A8 - Cash Backed Reserves/Accumulated Surplus Reconciliation 1. The cash backed reserves/accumulated surplus reconciliation is aligned to the requirements
of MFMA Circular 64 – Funding a Municipal Budget. 2. In essence the table evaluates the funding levels of the budget by firstly forecasting the cash
and investments at year end and secondly reconciling the available funding to the liabilities/commitments that exist.
3. The outcome of this exercise would either be a surplus or deficit. A deficit would indicate that the applications exceed the cash and investments available and would be indicative of non-compliance with the MFMA requirements that the municipality’s budget must be “funded”.
4. Non-compliance with section 18 of the MFMA is assumed because a shortfall would indirectly indicate that the annual budget is not appropriately funded.
5. From the table it can be seen that for the period 2009/10 to 2015/16 the surplus increases slightly from R97 million to R103 million.

41
Table 18 MBRR Table A9 - Asset Management
Description Ref 2009/10 2010/11 2011/12
R thousandAudited
Outcome
Audited
Outcome
Audited
Outcome
Original
Budget
Adjusted
Budget
Full Year
Forecast
Budget Year
2013/14
Budget Year
+1 2014/15
Budget Year
+2 2015/16
CAPITAL EXPENDITURE
Total New Assets 1 70 189 62 965 31 671 45 766 35 066 35 066 16 300 43 790 47 640
Infrastructure - Road transport 4 102 3 336 – – – – – – –
Infrastructure - Electricity 39 – 582 – – – – – –
Infrastructure - Water 38 982 48 600 28 295 41 900 30 800 30 800 15 200 38 750 44 800
Infrastructure - Sanitation 4 205 – – – – – – – –
Infrastructure - Other – – – – – – – – –
Infrastructure 47 328 51 935 28 877 41 900 30 800 30 800 15 200 38 750 44 800
Community – 1 667 – – – – – – –
Heritage assets – – – – – – – – –
Inv estment properties – – – – – – – – –
Other assets 6 22 861 9 363 2 781 3 866 4 266 4 266 1 100 5 040 2 840
Agricultural Assets – – – – – – – – –
Biological assets – – – – – – – – –
Intangibles – – 13 – – – – – –
Total Renewal of Existing Assets 2 – – – – – – – – –
Infrastructure - Road transport – – – – – – – – –
Infrastructure - Electricity – – – – – – – – –
Infrastructure - Water – – – – – – – – –
Infrastructure - Sanitation – – – – – – – – –
Infrastructure - Other – – – – – – – – –
Infrastructure – – – – – – – – –
Community – – – – – – – – –
Heritage assets – – – – – – – – –
Inv estment properties – – – – – – – – –
Other assets 6 – – – – – – – – –
Agricultural Assets – – – – – – – – –
Biological assets – – – – – – – – –
Intangibles – – – – – – – – –
Total Capital Expenditure 4
Infrastructure - Road transport 4 102 3 336 – – – – – – –
Infrastructure - Electricity 39 – 582 – – – – – –
Infrastructure - Water 38 982 48 600 28 295 41 900 30 800 30 800 15 200 38 750 44 800
Infrastructure - Sanitation 4 205 – – – – – – – –
Infrastructure - Other – – – – – – – – –
Infrastructure 47 328 51 935 28 877 41 900 30 800 30 800 15 200 38 750 44 800
Community – 1 667 – – – – – – –
Heritage assets – – – – – – – – –
Inv estment properties – – – – – – – – –
Other assets 22 861 9 363 2 781 3 866 4 266 4 266 1 100 5 040 2 840
Agricultural Assets – – – – – – – – –
Biological assets – – – – – – – – –
Intangibles – – 13 – – – – – –
TOTAL CAPITAL EXPENDITURE - Asset class 2 70 189 62 965 31 671 45 766 35 066 35 066 16 300 43 790 47 640
Current Year 2012/132013/14 Medium Term Revenue &
Expenditure Framework

42
Explanatory notes to Table A9 - Asset Management
1. Table A9 provides an overview of municipal capital allocations to building new assets and the renewal of existing assets, as well as spending on repairs and maintenance by asset class.
ASSET REGISTER SUMMARY - PPE (WDV) 5
Infrastructure - Road transport 4 136 7 429 33 3 867 3 867 43 43 43 43
Infrastructure - Electricity 4 158 3 657 377 10 875 10 875 662 662 662 662
Infrastructure - Water 174 046 205 491 226 197 219 874 219 874 292 773 344 027 370 111 385 903
Infrastructure - Sanitation 3 794 13 424 3 247 21 441 21 441 4 450 4 450 4 450 4 450
Infrastructure - Other 73 540 1 422 882 9 361 9 361 15 240 15 240 15 240 15 240
Infrastructure 259 675 231 423 230 736 265 418 265 418 313 168 364 422 390 506 406 298
Community 43 630 43 630 59 374 59 374 59 374 59 374
Heritage assets
Inv estment properties 5 474 5 033 4 931 6 641 6 641 4 888 5 474 5 474 5 474
Other assets 23 934 103 247 81 513 57 082 57 082 55 832 56 932 56 932 56 932
Agricultural Assets – – – – – – – – –
Biological assets – – – – – – – – –
Intangibles – – – – – – – – –
TOTAL ASSET REGISTER SUMMARY - PPE (WDV) 5 289 083 339 704 317 180 372 771 372 771 433 262 486 202 512 286 528 078
EXPENDITURE OTHER ITEMS
Depreciation & asset impairment 14 833 18 351 19 526 23 701 23 701 21 331 24 764 26 470 28 317
Repairs and Maintenance by Asset Class 3 55 661 65 431 21 114 58 731 58 731 52 858 78 200 8 557 8 985
Infrastructure - Road transport 49 376 60 775 15 767 50 341 50 341 45 306 70 265 – –
Infrastructure - Electricity 1 655 122 – – – – – – –
Infrastructure - Water 185 2 897 3 508 4 726 4 726 4 253 2 960 3 375 3 544
Infrastructure - Sanitation – – – – – – – – –
Infrastructure - Other – – – – – – – – –
Infrastructure 51 216 63 794 19 276 55 066 55 066 49 559 73 225 3 375 3 544
Community 75 937 – 1 908 1 908 1 717 800 840 882
Heritage assets – – – – – – – – –
Inv estment properties – – 309 – – – – – –
Other assets 6, 7 4 370 700 1 529 1 757 1 757 1 581 4 175 4 341 4 558
TOTAL EXPENDITURE OTHER ITEMS 70 494 83 781 40 640 82 433 82 433 74 189 102 964 35 026 37 302
Renewal of Existing Assets as % of total capex 0.0% 0.0% 0.0% 0.0% 0.0% 0.0% 0.0% 0.0% 0.0%
Renewal of Existing Assets as % of deprecn" 0.0% 0.0% 0.0% 0.0% 0.0% 0.0% 0.0% 0.0% 0.0%
R&M as a % of PPE 19.6% 19.6% 6.8% 16.0% 16.0% 12.3% 16.3% 1.7% 1.7%
Renewal and R&M as a % of PPE 19.0% 19.0% 7.0% 16.0% 16.0% 12.0% 16.0% 2.0% 2.0%

43
Table 19 MBRR Table A10 - Basic Service Delivery Measurement
2009/10 2010/11 2011/12
Outcome Outcome OutcomeOriginal
Budget
Adjusted
Budget
Full Year
Forecast
Budget Year
2013/14
Budget Year
+1 2014/15
Budget Year
+2 2015/16
Household service targets 1
Water:
Piped w ater inside dw elling 1 852 1 871 973 – – – – – –
Piped w ater inside y ard (but not in dw elling)
Using public tap (at least min.serv ice lev el) 2
Other w ater supply (at least min.serv ice lev el) 4
Minimum Service Level and Above sub-total 1 852 1 871 973 – – – – – –
Using public tap (< min.serv ice lev el) 3
Other w ater supply (< min.serv ice lev el) 4
No w ater supply
Below Minimum Service Level sub-total – – – – – – – – –
Total number of households 5 1 852 1 871 973 – – – – – –
Sanitation/sewerage:
Flush toilet (connected to sew erage) 84 – – – – – –
Flush toilet (w ith septic tank) 310 310 – – – – – –
Chemical toilet
Pit toilet (v entilated)
Other toilet prov isions (> min.serv ice lev el) 470 470 – – – – – –
Minimum Service Level and Above sub-total 780 780 84 – – – – – –
Bucket toilet
Other toilet prov isions (< min.serv ice lev el)
No toilet prov isions
Below Minimum Service Level sub-total – – – – – – – – –
Total number of households 5 780 780 84 – – – – – –
Energy:
Electricity (at least min.serv ice lev el) 76 76 84 – – – – – –
Electricity - prepaid (min.serv ice lev el) 336 336
Minimum Service Level and Above sub-total 412 412 84 – – – – – –
Electricity (< min.serv ice lev el)
Electricity - prepaid (< min. serv ice lev el)
Other energy sources
Below Minimum Service Level sub-total – – – – – – – – –
Total number of households 5 412 412 84 – – – – – –
Refuse:
Remov ed at least once a w eek 890 904 84 – – – – – –
Minimum Service Level and Above sub-total 890 904 84 – – – – – –
Remov ed less frequently than once a w eek
Using communal refuse dump
Using ow n refuse dump
Other rubbish disposal
No rubbish disposal
Below Minimum Service Level sub-total – – – – – – – – –
Total number of households 5 890 904 84 – – – – – –
Households receiving Free Basic Service 7
Water (6 kilolitres per household per month) 1 852 1 871 973 – – – – – –
Sanitation (free minimum lev el serv ice) 237 217 973 – – – – – –
Electricity /other energy (50kw h per household per month) 852 871 973 – – – – – –
Refuse (remov ed at least once a w eek) 649 643 973 – – – – – –
Cost of Free Basic Services provided (R'000) 8
Water (6 kilolitres per household per month) 6 9 25 – – – – – –
Sanitation (free sanitation serv ice) 7 7 0 – – – – – –
Electricity /other energy (50kw h per household per month) 13 16 1 – – – – – –
Refuse (remov ed once a w eek) 18 19 0 – – – – – –
Total cost of FBS provided (minimum social package) 45 51 26 – – – – – –
Highest level of free service provided
Property rates (R v alue threshold)
Water (kilolitres per household per month) 6 – – – – – –
Sanitation (kilolitres per household per month) – – 1 – – – – – –
Sanitation (Rand per household per month) 30 32 1 – – – – – –
Electricity (kw h per household per month) 100 – – – – – –
Refuse (av erage litres per w eek) 28 30 1 – – – – – –
Current Year 2012/132013/14 Medium Term Revenue &
Expenditure FrameworkDescription Ref

44
Explanatory notes to Table A10 - Basic Service Delivery Measurement
1. Table A10 provides an overview of service delivery levels, including backlogs (below minimum service level), for each of the main services.
2. The municipality’s DMA area was transferred in the 2011/12 financial year to the Local Municipalities which makes this table not applicable.
Part 2 – Supporting Documentation
1.8 Overview of the annual budget process Section 53 of the MFMA requires the Mayor of the municipality to provide general political guidance in the budget process and the setting of priorities that must guide the preparation of the budget. In addition Chapter 2 of the Municipal Budget and Reporting Regulations states that the Mayor of the municipality must establish a Budget Steering Committee to provide technical assistance to the Mayor in discharging the responsibilities set out in section 53 of the Act.
1.8.1 Budget Process Overview
In terms of section 21 of the MFMA the Mayor is required to table in Council ten months before the start of the new financial year a time schedule that sets out the process to revise the IDP and prepare the budget. The process plan will be added to this document as an appendix. There were no deviations from the key dates set out in the Budget Time Schedule tabled in Council. This plan is attached as Annexure B.
1.8.2 IDP and Service Delivery and Budget Implementation Plan
This is the first review of the IDP as adopted by Council in May 2013. It started in September 2012 after the tabling of the IDP Process Plan and the Budget Time Schedule for the 2013/14 MTREF in August. The municipality’s IDP is its principal strategic planning instrument, which directly guides and informs its planning, budget, management and development actions. This framework is rolled out into objectives, key performance indicators and targets for implementation which directly inform the Service Delivery and Budget Implementation Plan. The Process Plan applicable to the fourth revision cycle included the following key IDP processes and deliverables: • Registration of community needs; • Compilation of departmental business plans including key performance indicators and
targets; • Financial planning and budgeting process; • Public participation process; • Compilation of the SDBIP, and • The review of the performance management and monitoring processes.

45
The IDP has been taken into a business and financial planning process leading up to the 2013/14 MTREF, based on the approved 2012/13 MTREF, Mid-year Review and adjustments budget. The business planning process has subsequently been refined in the light of current economic circumstances and the resulting revenue projections. With the compilation of the 2013/14 MTREF, each department/function had to review the business planning process, including the setting of priorities and targets after reviewing the mid-year and third quarter performance against the 2012/13 Departmental Service Delivery and Budget Implementation Plan. Business planning links back to priority needs and master planning, and essentially informed the detail operating budget appropriations and three-year capital programme.
1.8.3 Financial Modelling and Key Planning Drivers
As part of the compilation of the 2013/14 MTREF extensive financial modelling was undertaken into account to ensure affordability and long-term financial sustainability. The following key factors and planning strategies have informed the compilation of the 2014/13 MTREF: • Policy priorities and strategic objectives • Asset maintenance • Economic climate and trends (i.e. inflation) • Performance trends • Cash Flow Management Strategy • Debtor payment levels • The need for tariff increases versus the ability of the community to pay for services; • Improved and sustainable service delivery In addition to the above, the strategic guidance given in National Treasury’s MFMA Circulars 64 and 67 has been taken into consideration in the planning and prioritisation process.
1.9 Overview of alignment of annual budget with IDP The Constitution mandates local government with the responsibility to exercise local developmental and cooperative governance. The eradication of imbalances in South African society can only be realized through a credible integrated developmental planning process. Municipalities in South Africa need to utilise integrated development planning as a method to plan future development in their areas and so find the best solutions to achieve sound long-term development goals. A municipal IDP provides a five year strategic programme of action aimed at setting short, medium and long term strategic and budget priorities to create a development platform, which correlates with the term of office of the political incumbents. The plan aligns the resources and the capacity of a municipality to its overall development aims and guides the municipal budget. An IDP is therefore a key instrument which municipalities use to provide vision, leadership and direction to all those that have a role to play in the development of a municipal area. The IDP enables municipalities to make the best use of scarce resources and speed up service delivery. Integrated developmental planning in the South African context is amongst others, an approach to planning aimed at involving the municipality and the community to jointly find the best solutions towards sustainable development. Furthermore, integrated development planning

46
provides a strategic environment for managing and guiding all planning, development and decision making in the municipality. It is important that the IDP developed by municipalities correlate with National and Provincial intent. It must aim to co-ordinate the work of local and other spheres of government in a coherent plan to improve the quality of life for all the people living in that area. Applied to the municipality, issues of national and provincial importance should be reflected in the IDP of the municipality. A clear understanding of such intent is therefore imperative to ensure that the municipality strategically complies with the key national and provincial priorities. The aim of this revision cycle was to develop and coordinate a coherent plan to improve the quality of life for all the people living in the area, also reflecting issues of national and provincial importance. One of the key objectives is therefore to ensure that there exists alignment between national and provincial priorities, policies and strategies and the municipality’s response to these requirements. The national and provincial priorities, policies and strategies of importance include amongst others: • Green Paper on National Strategic Planning of 2009; • Government Programme of Action; • Development Facilitation Act of 1995; • Provincial Growth and Development Strategy (GGDS); • National and Provincial spatial development perspectives; • Relevant sector plans such as transportation, legislation and policy; • National Key Performance Indicators (NKPIs); • Accelerated and Shared Growth Initiative (ASGISA); • National 2014 Vision; • National Spatial Development Perspective (NSDP) and • The National Priority Outcomes. The Constitution requires local government to relate its management, budgeting and planning functions to its objectives. This gives a clear indication of the intended purposes of municipal integrated development planning. Legislation stipulates clearly that a municipality must not only give effect to its IDP, but must also conduct its affairs in a manner which is consistent with its IDP. The following table highlights the IDP’s five strategic objectives for the 2012/14 MTREF and further planning refinements that have directly informed the compilation of the budget: Table 20 IDP Strategic Objectives
2014/14 MTREF
1. Ensuring Environmental Integrity for the West Coast
2. Pursuing economic growth and the facilitation of job opportunities
3. Promoting the social wellbeing of the community
4. Providing essential bulk services to the district
5. Ensuring good governance and financial viability

47
In order to ensure integrated and focused service delivery between all spheres of government it was important for the municipality to align its budget priorities with that of national and provincial government. All spheres of government place a high priority on infrastructure development, economic development and job creation, efficient service delivery, poverty alleviation and building sound institutional arrangements. Local priorities were identified as part of the IDP review process which is directly aligned to that of the national and provincial priorities. The key performance areas can be summarised as follows against the five strategic objectives:
1. Ensuring Environmental Integrity for the West Coast: o Implement an integrated environmental programme; o Implement the air quality management plan; o Carrying forward the disaster management plan; and o Climate change strategy to be developed.
2. Pursuing economic growth and the facilitation of job opportunities:
o Review of spatial development framework providing a framework; o Implementation of the regional economic development strategy; o Technical and capacity support to B-Municipalities; o Revision and updating in collaboration with economic development partners; and o Support regional investment promotion.
3. Promoting the social wellbeing of the community:
4. Providing essential bulk services to the district:
o Develop integrated transport plan; o Use and update the master plan for bulk water system; o Environmental impact assessment is currently underway for a proposed
desalination plant in the Saldanha Bay area; and o The municipality is currently developing a regional waste disposal site for
Matzikama and Cederberg municipalities.
5. Ensuring good governance and financial viability: o Strategic human resource and building of human capital (internally); o Corporate training and development in the district; o Employee wellness and assistance programme; and o Each post is linked to a full job description.
In line with the MSA, the IDP constitutes a single, inclusive strategic plan for the municipality. The five-year programme responds to the development challenges and opportunities faced by the municipality by identifying the key performance areas to achieve the five the strategic objectives mentioned above.

48
Lessons learned with previous IDP revision and planning cycles as well as changing environments were taken into consideration in the compilation of the first revised IDP, including: • Strengthening the analysis and strategic planning processes of the municipality; • Ensuring better coordination through a programmatic approach and attempting to focus
the budgeting process through planning interventions; and • Strengthening performance management and monitoring systems in ensuring the
objectives and deliverables are achieved. The 2013/14 MTREF has therefore been directly informed by the IDP revision process and the following tables provide a reconciliation between the IDP strategic objectives and operating revenue, operating expenditure and capital expenditure. Table 21 MBRR Table SA4 - Reconciliation between the IDP strategic objectives and budgeted revenue
Strategic Objective GoalGoal
Code2009/10 2010/11 2011/12
R thousand
Audited
Outcome
Audited
Outcome
Audited
Outcome
Original
Budget
Adjusted
Budget
Full Year
Forecast
Budget Year
2013/14
Budget Year
+1 2014/15
Budget Year
+2 2015/16
HUMAN WELL-BEING 13 357 3 122
HUMAN RESOURCE
DEVELOPMENT
1 375 754
ECONOMY 5 734 2 114
CO-OPERATION 45 078 102 791
SAFE ENVIROMENT 25 139 3 350
NATURAL AND BUILD
ENVIROMENT
9 372 163
INFRASTRUCTURE 115 846 137 157
MUNICIPAL
TRANSFORMATION & INST.
DEVELOPMENT
17 1 000 1 000 1 000 890 934 967
BASIC SERVICE DELIVERY 164 225 164 946 172 749 172 749 201 945 229 046 264 637
MUNICIPAL
TRANSFORMATION & INST.
DEVELOPMENT
78 832 82 329 82 692 82 692 73 573 76 560 79 077
GOOD GOVERNANCE &
PUBLIC PARTICIPATION
1 134 430 430 430 1 213 1 147 1 007
LOCAL ECONOMIC
DEVELOPMENT
2 605 2 566 2 566 2 566 2 806 2 946 3 093
Allocations to other priorities 2
Total Revenue (excluding capital transfers and contributions) 1 215 901 249 451 246 813 251 271 259 437 259 437 280 426 310 632 348 781
Current Year 2012/132013/14 Medium Term Revenue &
Expenditure FrameworkRef

49
Table 22 MBRR Table SA5 - Reconciliation between the IDP strategic objectives and budgeted operating expenditure
Strategic Objective GoalGoal
Code2009/10 2010/11 2011/12
R thousand
Audited
Outcome
Audited
Outcome
Audited
Outcome
Original
Budget
Adjusted
Budget
Full Year
Forecast
Budget Year
2013/14
Budget Year
+1 2014/15
Budget Year
+2 2015/16
HUMAN WELL- BEING 13 357 13 877
HUMAN RESOURCE
DEVELOPMENT
1 375 3 642
ECONOMY 5 734 5 735
CO-OPERATION 45 078 45 689
SAFE ENVIROMENT 25 139 27 947
NATURAL AND BUILD
ENVIROMENT
9 372 4 780
INFRASTRUCTURE 97 156 148 375
MUNICIPAL
TRANSFORMATION & INST.
DEVELOPMENT
6 846 8 595 8 595 7 735 4 026 4 431 4 652
BASIC SERVICE DELIVERY 193 962 196 655 209 458 195 270 228 810 249 301 270 110
MUNICIPAL FINANCIAL
VIABILITY & MANAGEMENT
58 212 21 853 22 216 19 995 11 641 12 760 14 754
GOOD GOVERNANCE &
PUBLIC PARTICIPATION
13 376 15 251 15 251 13 726 19 115 19 863 20 664
LOCAL ECONOMIC
DEVELOPMENT
5 294 6 117 6 117 5 506 6 214 6 526 6 852
Allocations to other priorities
Total Expenditure 1 197 211 250 045 277 690 248 471 261 637 242 231 269 806 292 880 317 033
Current Year 2012/132013/14 Medium Term Revenue &
Expenditure FrameworkRef

50
Table 23 MBRR Table SA6 - Reconciliation between the IDP strategic objectives and budgeted capital expenditure
Strategic Objective GoalGoal
Code2009/10 2010/11 2011/12
R thousand
Audited
Outcome
Audited
Outcome
Audited
Outcome
Original
Budget
Adjusted
Budget
Full Year
Forecast
Budget Year
2013/14
Budget Year
+1 2014/15
Budget Year
+2 2015/16
HUMAN WELL- BEING A 1 300
HUMAN RESOURCE
DEVELOPMENT
B
ECONOMY C
CO-OPERATION D 587
SAFE ENVIROMENT E 10 670
NATURAL AND BUILD
ENVIROMENT
F
INFRASTRUCTURE G 57 632
MUNICIPAL
TRANSFORMATION & INST.
DEVELOPMENT
H
BASIC SERVICE DELIVERY I 56 467 30 535 45 466 34 366 34 366 15 997 43 790 47 640
MUNICIPAL FINANCIAL
VIABILITY & MANAGEMENT
J 6 498 1 136 300 700 700 303
GOOD GOVERNANCE &
PUBLIC PARTICIPATION
K
LOCAL ECONOMIC
DEVELOPMENT
L
M
N
O
P
Allocations to other priorities 3
Total Capital Expenditure 1 70 189 62 965 31 671 45 766 35 066 35 066 16 300 43 790 47 640
Current Year 2012/132013/14 Medium Term Revenue &
Expenditure FrameworkRef

51
1.10 Measurable performance objectives and indicators Performance Management is a system intended to manage and monitor service delivery progress against the identified strategic objectives and priorities. In accordance with legislative requirements and good business practices as informed by the National Framework for Managing Programme Performance Information, the municipality has developed and implemented a performance management system of which system is constantly refined as the integrated planning process unfolds. The Municipality target, monitors, assesses and reviews organisational performance which in turn is directly linked to individual employee’s performance. At any given time within government, information from multiple years is being considered; plans and budgets for next year; implementation for the current year; and reporting on last year's performance. Although performance information is reported publicly during the last stage, the performance information process begins when policies are being developed, and continues through each of the planning, budgeting, implementation and reporting stages. The planning, budgeting and reporting cycle can be graphically illustrated as follows:
Figure 4 Planning, budgeting and reporting cycle The performance of the municipality relates directly to the extent to which it has achieved success in realising its goals and objectives, complied with legislative requirements and meeting stakeholder expectations. The municipality therefore has adopted one integrated performance management system which encompasses:

52
• Planning (setting goals, objectives, targets and benchmarks); • Monitoring (regular monitoring and checking on the progress against plan); • Measurement (indicators of success); • Review (identifying areas requiring change and improvement); • Reporting (what information, to whom, from whom, how often and for what purpose); and • Improvement (making changes where necessary).
The performance information concepts used by the municipality in its integrated performance management system are aligned to the Framework of Managing Programme Performance Information issued by the National Treasury:
Figure 5 Definition of performance information concepts
The following table provides the main measurable performance objectives the municipality undertakes to achieve this financial year.

West Coast District Municipality 2013/14 Annual Budget and MTREF
53
Table 24 MBRR Table SA7 - Measurable performance objectives will be attached as an appendix.
2009/10 2010/11 2011/12
Audited
Outcome
Audited
Outcome
Audited
Outcome
Original
Budget
Adjusted
Budget
Full Year
Forecast
Budget Year
2013/14
Budget Year
+1 2014/15
Budget Year
+2 2015/16
Effective functioning of council with compliance
in respect of number of meetings held per
annum.
No of council meetings
per annum4 4 4 4 4 4
Effective functioning of the portfolio committee
system with compliance in respect of the
number of meetings held annually
No of sec 80 committee
meetings per annum11 11 11 11 11 11
The main budget is approved by Council by the
legislative deadline
Approval of main budget
before the end of May1 1 1 1 1 1
The adjustment budget is approved by Council
by the legislative deadline
Approval of adjustments
budget before the end of
February
1 1 1 1 1 1
The SDBIP is approved by the Mayor within 28
days after the budget has been approved
SDBIP approved in
terms of the MFMA1 1 1 1 1 1
Facilitation of IGR in the district measured by
the number of DCF meetings heldNo of DCF meetings 4 4 4 4 4 4
An implementation plan for the GENDER Policy
Framework is developed and adopted by 30
June
Plan completed and
approved by council.1 1 1
The co-ordination by WCDM of drafting up a
consolidated plan for social development
interventions in the district
Number of consultation
engagements with
relevant role-players
2 2 2 2 2 2
Implementation of the Municipality's approved
Employment Equity report in liaison with the
approved recruitment and selection policy.
Number of Personnel
appointed according to
numerical goals.
50% 50% 50% 50% 50% 50%
% implementation measured by the budget
spent on the WSP by financial year end.
% implementation
measured by the budget
spent on the WSP by
financial year end.
100% 100% 100% 100% 100% 100%
Tabling of the draft annual report to council
before 31 January annually.
Minutes of oversight
committee submitted to
council
1 1 1 1 1 1
New 3rd generation IDP, new key
performance indicators
New 3rd generation IDP, new key
performance indicators
New 3rd generation IDP, new key
performance indicators
New 3rd generation IDP, new key
performance indicators
New 3rd generation IDP, new key
performance indicators
New 3rd generation IDP, new key
performance indicators
Vote 1 - Community Services
New 3rd generation IDP, new key
performance indicators
New 3rd generation IDP, new key
performance indicators
New 3rd generation IDP, new key
performance indicators
New 3rd generation IDP, new key
performance indicators
New 3rd generation IDP, new key
performance indicators
Unit of measurementDescription
Current Year 2012/132013/14 Medium Term Revenue &
Expenditure Framework

54
Table 24 MBRR Table SA7 - Measurable performance objectives will be attached as an appendix. (Continued)
Maintain human capital to ensure sustainable
capacity to create an effective and efficient
service delivery institution.
Vacancy levels
expressed as a
percentage of approved
posts in the organogram
10% 10% 10% 10% 10% 10%
Effective and healthy labour relations are
maintained and secured through regular LLF
meetings
No of LLF meetings
initiated by the employer
per annum
10 10 10 10 10 10
Revise HR policies by the end of June annually
to ensure compliance with regulatory
framework for fair, sound and equitable labour
relations
No of policies revised 6 6 6 6 6 6
Build solid HR capability through
implementation of the skills development plan
with targeted skills development interventions
No of staff who
completed training by
comparison with
personnel identified for
training.
75% 75% 75% 75% 75% 75%
Quarterly submission of fraud declaration by
Municipal Manager, directors and internal
auditor
Number of declarations
per quarter5 5 5 5 5 5
Implementation of the risk management policy
measured by the number of risks quarterly
managed by each directorate
Number of risks
managed by each
directorate quarterly
16 16 16 16 16 16
Institutional Performance management system
in place and implemented down to TASK level
12
No of levels
Implemented down to
TASK level 12
1 1 1 1 1 1
Functional audit committee that advises the
municipality on matters relating to internal
controls, risks, policies, performance and
governance
No of meetings held and
minutes of meetings
submitted to council
4 4 4 4 4 4
Approved Risk based audit plan elements
identified, audited by year end
Number of elements
identified, audited by
year end
70% 70% 70% 70% 70% 70%
Shared support are provided in the district
Number of actual shared
support
provided/Number of
requests received
75% 75% 75% 75% 75% 75%
Shared services implemented in the region
through number of recommended services
piloted
Number of shared
services piloted1 1 1 1 1 1
Facilitation of IGR in the district measured by
the number of DCF (Tech) meetings initiated
for policy support.
No of DCF Tech
meetings initiated.4 4 4 4 4 4
New 3rd generation IDP, new key
performance indicators
New 3rd generation IDP, new key
performance indicators
New 3rd generation IDP, new key
performance indicators
New 3rd generation IDP, new key
performance indicators
New 3rd generation IDP, new key
performance indicators
New 3rd generation IDP, new key
performance indicators
New 3rd generation IDP, new key
performance indicators
New 3rd generation IDP, new key
performance indicators
New 3rd generation IDP, new key
performance indicators
New 3rd generation IDP, new key
performance indicators
New 3rd generation IDP, new key
performance indicators
New 3rd generation IDP, new key
performance indicators

55
Table 24 MBRR Table SA7 - Measurable performance objectives will be attached as an appendix. (Continued)
Development of strategic partnerships to
enhance resource mobilisation
Number of strategic
partnerships formed2 2 2 2 2 2
Enhancement of integrated planning in the
district by developing the annual IDP district
process schedule by end of August annually.
Framework developed
by the end of August
annually.
100% 100% 100% 100% 100% 100%
Review of Integrated Development Plan that
facilitates alignment with municipal spending,
its approval by the end of May 2013 and
advertisement for public comment.
Reviewed IDP approved
by the end of May and
capital spending
alignment as per IDP.
1 1 1 1 1 1
District IDP consultation through management
bi-lateral- and municipal level engagements
between District- and Local municipalities take
place
No of B municipalities
consulted by the end of
May
5 5 5 5 5 5
Enhance integrated development planning in
the district through facilitating regular district
IDP Co-ordinating meetings
Number of meetings
held per annum4 4 4 4 4 4
Enhanced performance management through
signing section 57 performance agreements
with staff by the end of July 2012
No of performance
agreements signed by
end of July
5 5 5 5 5 5
Regional Tourism is promoted and supported
by council and reports to council.
Number of regional
tourism reports
submitted to municipal
manager, Mayco and
council.
10 10 10 10 10 10
Regional tourism is enhanced by targeted
tourism promotion activities
Percentage of targeted
tourism promotion
activities completed
80% 80% 80% 80% 80% 80%
Regional Economic Development (RED)
strategy is operationalised as part of the
implementation plan.
Number of RED focus
areas addressed and
implemented
2 2 2 2 2 2
EME's are targeted for contracts and tenders
above R30 000 as a means to enhance
economic development and job creation
R-value of quotes above
R30 000 and tenders
awarded to EME's.
20% 20% 20% 20% 20% 20%
The quality of water in the West Coast district
complies with SANS 241 specifications through
monthly monitoring
Sample test reports in
compliance in respect of
SANS 241 specifications
100 100 100 100 100 100
New 3rd generation IDP, new key
performance indicators
New 3rd generation IDP, new key
performance indicators
New 3rd generation IDP, new key
performance indicators
New 3rd generation IDP, new key
performance indicators
New 3rd generation IDP, new key
performance indicators
New 3rd generation IDP, new key
performance indicators
New 3rd generation IDP, new key
performance indicators
New 3rd generation IDP, new key
performance indicators
New 3rd generation IDP, new key
performance indicators
New 3rd generation IDP, new key
performance indicators
New 3rd generation IDP, new key
performance indicators
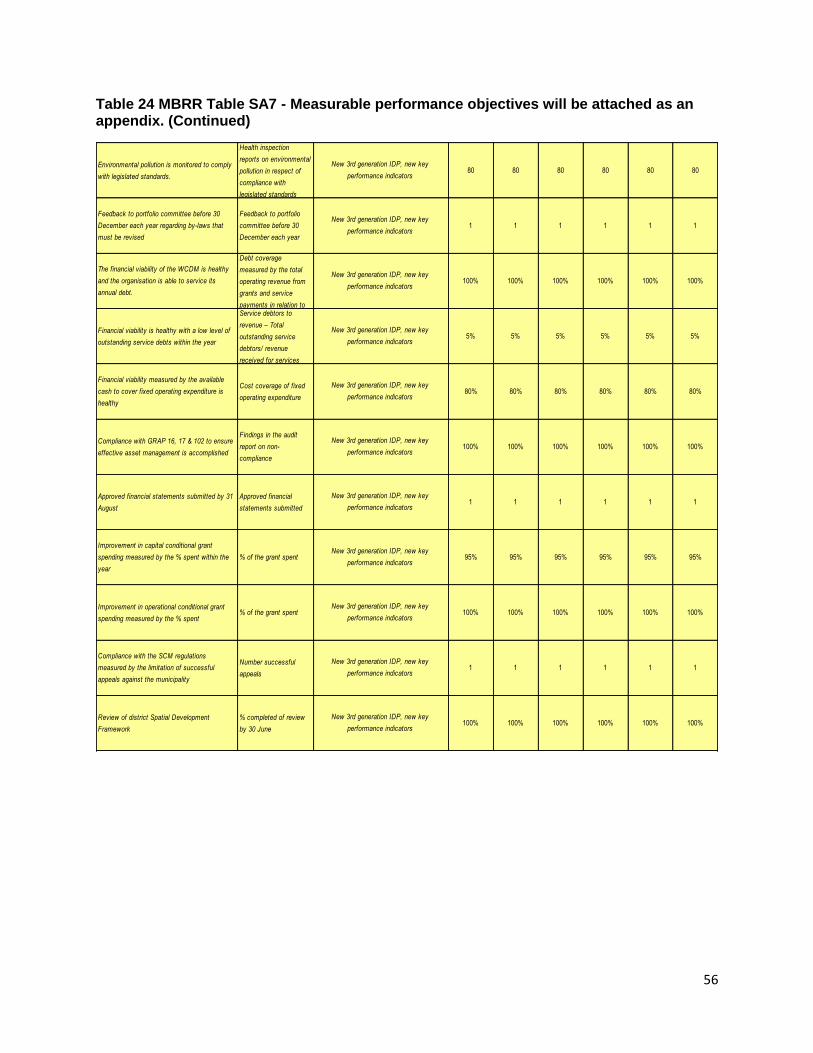
56
Table 24 MBRR Table SA7 - Measurable performance objectives will be attached as an appendix. (Continued)
Environmental pollution is monitored to comply
with legislated standards.
Health inspection
reports on environmental
pollution in respect of
compliance with
legislated standards
80 80 80 80 80 80
Feedback to portfolio committee before 30
December each year regarding by-laws that
must be revised
Feedback to portfolio
committee before 30
December each year
1 1 1 1 1 1
The financial viability of the WCDM is healthy
and the organisation is able to service its
annual debt.
Debt coverage
measured by the total
operating revenue from
grants and service
payments in relation to
100% 100% 100% 100% 100% 100%
Financial viability is healthy with a low level of
outstanding service debts within the year
Service debtors to
revenue – Total
outstanding service
debtors/ revenue
received for services
5% 5% 5% 5% 5% 5%
Financial viability measured by the available
cash to cover fixed operating expenditure is
healthy
Cost coverage of fixed
operating expenditure80% 80% 80% 80% 80% 80%
Compliance with GRAP 16, 17 & 102 to ensure
effective asset management is accomplished
Findings in the audit
report on non-
compliance
100% 100% 100% 100% 100% 100%
Approved financial statements submitted by 31
August
Approved financial
statements submitted1 1 1 1 1 1
Improvement in capital conditional grant
spending measured by the % spent within the
year
% of the grant spent 95% 95% 95% 95% 95% 95%
Improvement in operational conditional grant
spending measured by the % spent% of the grant spent 100% 100% 100% 100% 100% 100%
Compliance with the SCM regulations
measured by the limitation of successful
appeals against the municipality
Number successful
appeals1 1 1 1 1 1
Review of district Spatial Development
Framework
% completed of review
by 30 June 100% 100% 100% 100% 100% 100%
New 3rd generation IDP, new key
performance indicators
New 3rd generation IDP, new key
performance indicators
New 3rd generation IDP, new key
performance indicators
New 3rd generation IDP, new key
performance indicators
New 3rd generation IDP, new key
performance indicators
New 3rd generation IDP, new key
performance indicators
New 3rd generation IDP, new key
performance indicators
New 3rd generation IDP, new key
performance indicators
New 3rd generation IDP, new key
performance indicators
New 3rd generation IDP, new key
performance indicators
New 3rd generation IDP, new key
performance indicators

57
Table 24 MBRR Table SA7 - Measurable performance objectives will be attached as an appendix. (Continued)
Disaster risk awareness promoted in
communities
Number of awareness
initiatives for targeted
social groups and
communities per annum
4 4 4 4 4 4
Develop District Disaster Management
Framework by the end of December
Framework developed
by the end of Dec 1 1 1 1 1 1
Effective facilitation of disaster management in
the District measured in terms of the number
of advisory forum meetings held
No of meetings per
annum2 2 2 2 2 2
Fire service delivery in the district is
standardised through facilitating and co-
ordinating meetings to discuss and formalise
service delivery protocols
No of meetings held per
annum4 4 4 4 4 4
Development of the Regional Solid Waste
Disposal Site for Matzikama and Cederberg
Completion of the EIA
by 30 December 100%
Update Bulk Water System Master Plan by the
end of June Plan updated by 30 June 100% 100% 100% 100% 100% 100%
Percentage spent of the approved bulk water
capital projects allocation
% spent of budget
allocated for bulk water
capital projects
100% 100% 100% 100% 100% 100%
Bulk water quality supplied complies with
SANS 241 standards
Sample test results and
% water quality100% 100% 100% 100% 100% 100%
Development of the Desalination Plant as an
alternative supply source for Bulk water
Completion of the EIA
by June 100% 100% 100% 100% 100% 100%
Review of Integrated transport plan for the
district completed in the financial year% of completion 2013 100% 100% 100% 100% 100% 100%
Annual plan compiled for the comprehensive
maintenance of provincial roads
Submission of Annual
Performance Plan to
Provincial Government
by end of November
1 1 1 1 1 1
Provincial roads is maintained in compliance
with budget% of the budget spent 100% 100% 100% 100% 100% 100%
New 3rd generation IDP, new key
performance indicators
New 3rd generation IDP, new key
performance indicators
New 3rd generation IDP, new key
performance indicators
New 3rd generation IDP, new key
performance indicators
New 3rd generation IDP, new key
performance indicators
New 3rd generation IDP, new key
performance indicators
New 3rd generation IDP, new key
performance indicators
New 3rd generation IDP, new key
performance indicators
New 3rd generation IDP, new key
performance indicators
New 3rd generation IDP, new key
performance indicators
New 3rd generation IDP, new key
performance indicators
New 3rd generation IDP, new key
performance indicators
Vote 2 - Subsidised Services
Vote 3 - Economic Services
Vote 5 - Trading Services
Vote 6 - Agencies

58
The following table sets out the municipalities main performance objectives and benchmarks for the 2013/14 MTREF. Table 25 MBRR Table SA8 - Performance indicators and benchmarks
2009/10 2010/11 2011/12
Audited
Outcome
Audited
Outcome
Audited
Outcome
Original
Budget
Adjusted
Budget
Full Year
Forecast
Pre-audit
outcome
Budget Year
2013/14
Budget Year
+1 2014/15
Budget Year
+2 2015/16
Borrowing Management
Credit Rating A- A- A- A- A- A- A-
Capital Charges to Operating Ex penditure Interest & Principal Paid /Operating
Ex penditure
5.4% 6.5% 8.0% 8.5% 8.1% 8.2% 8.2% 8.1% 7.4% 6.9%
Capital Charges to Ow n Rev enue Finance charges & Repay ment of
borrow ing /Ow n Rev enue
7.4% 9.7% 13.2% 12.6% 11.8% 11.1% 11.1% 11.2% 10.2% 9.3%
Borrow ed funding of 'ow n' capital ex penditure Borrow ing/Capital ex penditure ex cl.
transfers and grants and contributions
53.6% 54.7% -22.3% 84.1% 111.3% 111.3% 111.3% 0.0% 0.0% 0.0%
Safety of Capital
Gearing Long Term Borrow ing/ Funds &
Reserv es
0.0% 0.0% 0.0% 0.0% 0.0% 0.0% 0.0% 0.0% 0.0% 0.0%
Liquidity
Current Ratio Current assets/current liabilities 4.1 3.9 4.3 7.1 6.0 3.3 3.3 7.4 8.2 7.6
Current Ratio adjusted for aged debtors Current assets less debtors > 90
day s/current liabilities
4.1 3.9 4.3 7.1 6.0 3.3 3.3 7.4 8.2 7.6
Liquidity Ratio Monetary Assets/Current Liabilities 3.9 3.6 3.8 6.9 5.7 3.0 3.0 7.1 7.8 7.2
Revenue Management
Annual Debtors Collection Rate (Pay ment
Lev el %)
Last 12 Mths Receipts/Last 12 Mths
Billing
178.6% 143.7% 147.4% 114.8% 104.7% 104.1% 104.1% 107.1% 104.1%
Current Debtors Collection Rate (Cash
receipts % of Ratepay er & Other rev enue)
178.6% 143.7% 147.4% 114.8% 104.7% 104.1% 104.1% 107.1% 104.1%
Outstanding Debtors to Rev enue Total Outstanding Debtors to Annual
Rev enue
3.7% 5.6% 6.1% 2.5% 2.4% 5.9% 5.9% 2.2% 2.3% 2.4%
Longstanding Debtors Recov ered Debtors > 12 Mths Recov ered/Total
Debtors > 12 Months Old
Creditors Management
Creditors Sy stem Efficiency % of Creditors Paid Within Terms
(w ithin`MFMA' s 65(e))
Creditors to Cash and Inv estments 16.5% 21.6% 19.1% 13.8% 13.8% 26.6% 26.6% 8.9% 6.7% 7.2%
Other Indicators
Total Volume Losses (kW)
Total Cost of Losses (Rand '000)
Total Volume Losses (kℓ)
Total Cost of Losses (Rand '000) 7.8% 11.7% 5.1%
Employ ee costs Employ ee costs/(Total Rev enue - capital
rev enue)
28.6% 26.0% 26.8% 28.9% 27.6% 24.8% 24.8% 27.7% 27.9% 27.0%
Remuneration Total remuneration/(Total Rev enue -
capital rev enue)
33.3% 27.9% 28.3% 30.7% 29.3% 26.4% 29.5% 29.6% 28.6%
Repairs & Maintenance R&M/(Total Rev enue ex cluding capital
rev enue)
25.8% 26.2% 8.6% 24.4% 23.4% 21.0% 28.9% 2.9% 2.8%
Finance charges & Depreciation FC&D/(Total Rev enue - capital rev enue) 10.0% 10.6% 12.4% 15.3% 14.7% 13.2% 13.2% 13.9% 13.0% 12.2%
IDP regulation financial viability indicators
i. Debt cov erage (Total Operating Rev enue - Operating
Grants)/Debt serv ice pay ments due
w ithin financial y ear)
8.1 8.7 21.2 21.2 21.2 21.2 20.2 19.5 19.2 21.0
ii.O/S Serv ice Debtors to Rev enue Total outstanding serv ice debtors/annual
rev enue receiv ed for serv ices
11.3% 18.5% 18.7% 6.6% 6.6% 16.3% 16.3% 5.9% 5.8% 5.7%
iii. Cost cov erage (Av ailable cash + Inv estments)/monthly
fix ed operational ex penditure
15.4 13.4 11.1 12.3 11.9 14.4 14.4 13.9 12.1 11.5
Water Distribution Losses (2)
Description of financial indicator
2013/14 Medium Term Revenue &
Expenditure Framework
Basis of calculation
Current Year 2012/13
Electricity Distribution Losses (2)

59
1.10.1 Performance indicators and benchmarks
1.10.1.1 Borrowing Management
Capital expenditure in local government can be funded by capital grants, own-source revenue and long term borrowing. The ability of a municipality to raise long term borrowing is largely dependent on its creditworthiness and financial position. The following financial performance indicators have formed part of the compilation of the 2013/14 MTREF: • Borrowing to asset ratio is a measure of the long-term borrowing as a percentage of the
total asset base of the municipality. While this ratio is decreasing over the MTREF from 8.1 per cent to 6.9 per cent in 2015/16.
1.10.1.2 Liquidity
• For the 2011/12 MTREF the current ratio is 7.4 in the 2013/14 financial year.
• The liquidity ratio is a measure of the ability of the municipality to utilize cash and cash equivalents to extinguish or retire its current liabilities immediately. Ideally the municipality should have the equivalent cash and cash equivalents on hand to meet at least the current liabilities, which should translate into a liquidity ratio of 1. Anything below 1 indicates a shortage in cash to meet creditor obligations. For the 2013/14 financial year the ratio was 7.1.
1.10.1.3 Revenue Management
• As part of the financial sustainability strategy, an aggressive revenue management framework has been implemented to increase cash inflow. The intention of the strategy is to streamline the revenue value chain by ensuring accurate billing, customer service, and credit control and debt collection.
1.10.1.4 Creditors Management
• The municipality has managed to ensure that creditors are settled within the legislated 30 days of invoice. This has had a favourable impact on suppliers’ perceptions of risk of doing business with the municipality.
1.10.1.5 Other Indicators
• The water distribution losses have been significantly reduced to 5 per cent in 2011/12. It
is planned to further reduce distribution losses in 2013/14. • Employee costs as a percentage of operating revenue continues to be stable over the
MTREF. • Repairs and maintenance as percentage of operating revenue is also decreasing owing
directly to the costing method adopted for agency services.

60
1.10.2 Providing clean water
The municipality provides bulk water services provider to 22 towns as well as 876 farmers. The Municipality’s bulk water needs are provided by the Department of Water Affairs and Forestry in the form of raw water. The Department of Water Affairs conducts an annual performance rating of water treatment works, presenting a Blue Drop award for water treatment works that meet certain criteria of excellence. The municipality were awarded Blue Drop status in 2010/11 and 2011/12, indicating that the municipality’s drinking water is of exceptional quality.
1.11 Overview of budget related-policies The municipality’s budgeting process is guided and governed by relevant legislation, frameworks, strategies and related policies.
1.11.1 Review of credit control and debt collection procedures/policies
The Collection Policy as approved by Council in 2003 is currently under review. While the adopted policy is credible, sustainable, manageable and informed by affordability and value for money there has been a need to review certain components to achieve a higher collection rate. Some of the possible revisions will include the transfer of the DMA areas. The 2013/14 MTREF has been prepared on the basis of achieving an average debtors’ collection rate of 95 per cent on current billings.
1.11.2 Asset Management Policy
A proxy for asset consumption can be considered the level of depreciation each asset incurs on an annual basis. Preserving the investment in new infrastructure needs to be considered a significant strategy in ensuring the future sustainability of infrastructure and the municipality’s revenue base. Within the framework, the need for new assets was considered a priority and hence the capital programme was determined based on new asset construction. The Asset Management Policy is therefore considered a strategic guide in ensuring a sustainable approach to new assets as well as asset renewal, repairs and maintenance. In addition the policy prescribes the accounting and administrative policies and procedures relating to property, plant and equipment (fixed assets).
1.11.3 Supply Chain Management Policy
The Supply Chain Management Policy was adopted by Council in September 2005. An amended policy was considered by Council in December 2012.

61
1.11.4 Cash Management and Investment Policy
The aim of the policy is to ensure that the municipality’s surplus cash and investments are adequately managed, especially the funds set aside for the cash backing of certain reserves. The policy details the minimum cash and cash equivalents required at any point in time and introduce time frames to achieve certain benchmarks.
1.11.5 Tariff Policies
The municipality’s tariff policies provide a broad framework within which the Council can determine fair, transparent and affordable charges that also promote sustainable service delivery. All the above policies are available on the municipality’s website, as well as other budget related policies:
1.12 Overview of budget assumptions
1.12.1 External factors
Owing to the economic slowdown which started in 2008, financial resources are limited due to reduced payment levels by consumers. This has resulted in declining cash inflows, which has necessitated restrained expenditure to ensure that cash outflows remain within the affordability parameters of the municipality’s finances.
1.12.2 General inflation outlook and its impact on the municipal activities
There are five key factors that have been taken into consideration in the compilation of the 2013/14 MTREF: • National Government macro-economic targets; • The general inflationary outlook; • The impact of municipal cost drivers; • The increase in prices for electricity and bulk water; and • The increase in the cost of remuneration. Employee related costs comprise 28 per cent
of total operating expenditure in the 2013/14 MTREF and therefore this increase above inflation places a disproportionate upward pressure on the expenditure budget.

62
1.12.3 Credit rating outlook
Table 26 Credit rating outlook
Security class Currency Rating
Annual rating 2013/14
Previous Rating
Short term Rand A1 May 2013 A1
Long-term Rand A May 2013 A
Outlook Rand Stable May 2013 Stable
1.12.4 Interest rates for borrowing and investment of funds
The MFMA specifies that borrowing can only be utilised to fund capital or refinancing of borrowing in certain conditions. The municipality’s borrowing will decrease of the MTREF.
1.12.5 Collection rate for revenue services
The base assumption is that tariff and rating increases will increase at a rate slightly higher that CPI over the long term. It is also assumed that current economic conditions, and relatively controlled inflationary conditions, will continue for the forecasted term. The rate of revenue collection is currently expressed as a percentage (98 per cent) of annual billings. Cash flow is assumed to be 100 per cent of billing.
1.12.6 Salary increases
The assumption is that for the three years an across the board increase of 7.5 per cent is allowed.
1.12.7 Impact of national, provincial and local policies
Integration of service delivery between national, provincial and local government is critical to ensure focussed service delivery and in this regard various measures were implemented to align IDPs, provincial and national strategies around priority spatial interventions. In this regard, the following national priorities form the basis of all integration initiatives: • Creating jobs; • Enhancing education and skill development; • Improving Health services; • Rural development and agriculture; and • Fighting crime and corruption. To achieve these priorities integration mechanisms are in place to ensure integrated planning and execution of various development programs. The focus will be to strengthen the link between policy priorities and expenditure thereby ensuring the achievement of the national, provincial and local objectives.

63
1.12.8 Ability of the municipality to spend and deliver on the programmes
It is estimated that a spending rate of at least 95 per cent is achieved on operating expenditure and 100 per cent on the capital programme for the 2011/12 MTREF of which performance has been factored into the cash flow budget.
1.13 Overview of budget funding
1.13.1 Medium-term outlook: operating revenue
The following table is a breakdown of the operating revenue over the medium-term:
Table 27 Breakdown of the operating revenue over the medium-term
Description 2009/10 2010/11 2011/12 Current Year 2012/13 2013/14 Medium Term Revenue &
Expenditure Framework
R thousands Audited
Outcome Audited
Outcome Audited
Outcome Original Budget
Adjusted Budget
Full Year Forecast
Pre-audit outcome
Budget Year
2013/14
Budget Year +1 2014/15
Budget Year +2 2015/16
Financial Performance
Property rates 801 868 – – – – – – – –
Service charges 68 137 74 341 80 575 87 458 87 458 87 458 87 458 96 511 112 304 126 388
Investment revenue 15 287 9 549 8 076 8 020 8 020 8 020 8 020 8 000 8 400 8 820
Transfers recognised operational 72 346 81 517 78 037 72 799 72 216 72 216 71 853 76 281 80 585 85 653
Other own revenue 59 330 83 176 80 125 72 895 83 644 83 644 83 644 89 635 93 343 97 920
Total Revenue (excluding capital transfers and contributions)
215 901 249 451 246 813 241 171 251 337 251 337 250 974 270 426 294 632 318 781
The following graph is a breakdown of the operational revenue per main category for the 2013/14 financial year.
Service Charges35%
Rental1%Interest
3%
Licence & Permits0%
Agency Services23%
Transfers -Operational
29%
Transfers - Capital4%
Other Revenue5%

64
Figure 6 Breakdown of operating revenue over the 2013/14 MTREF
Tariff setting plays a major role in ensuring desired levels of revenue. Getting tariffs right assists in the compilation of a credible and funded budget. The municipality derives most of its operational revenue from bulk water services; agency services (Roads), operating and capital grants from organs of state and other minor charges (such as building plan fees, licenses and permits etc.) The revenue strategy is a function of key components such as: • Growth in the municipality and economic development; • Revenue management and enhancement; • Achievement of a 100 per cent annual collection rate for consumer revenue; • National Treasury guidelines; • Achievement of full cost recovery of specific user charges; • Determining tariff escalation rate by establishing/calculating revenue requirements. The above principles guide the annual increase in the tariffs charged to the consumers and aligned to the economic forecasts. The proposed tariff increases for the 2013/14 MTREF on the different revenue categories are: Table 28 Proposed tariff increases over the medium-term
Revenue category
2013/14 proposed tariff
increase
2014/15 proposed tariff
increase
2015/16 proposed tariff
increase
2013/14 additional
revenue for each 1% tariff
increase
2013/14 additional
revenue owing to 2% tariff increases
2013/14 Total Budgeted revenue
% % % R’000 R’000 R’000
Water 9.73 12.41 12.54 966 1 931 96 511
Total 966 1 931 96 511
Services charges relating to bulk water constitutes the second biggest component of the revenue basket of the municipality totalling R96.5 million for the 2013/14 financial year and increasing to R126.3 million by 2015/16. For the 2013/14 financial year services charges amount to 34 per cent of the total revenue base and grows by 2 per cent. This growth can mainly be attributed to the increase in the bulk prices water. Operational grants and subsidies amount to R76.2 million, R80.5 million and R85.6 million for each of the respective financial years of the MTREF, or 27, 25 and 27 per cent of operating revenue. Investment revenue contributes marginally to the revenue base with a budget allocation of R8 million, R8.4 million and R8.8 million for the respective three financial years of the 2013/14 MTREF. It should be noted that all cash are classified under cash and cash equivalents as per GRAP. The municipality accounts for cash to comply with GRAP 24.

65
Table 29 Sources of capital revenue over the MTREF
The above table is graphically represented as follows for the 2013/14 financial year.
Figure 7 Sources of capital revenue for the 2013/14 financial year
Capital grants and receipts equates to 61 per cent of the total funding source which represents R16.3 million for the 2013/14 financial year and increase to R30 million or 63 per cent by 2014/16.
Vote Description Ref 2009/10 2010/11 2011/12
R thousand 1Audited
Outcome
Audited
Outcome
Audited
Outcome
Original
Budget
Adjusted
Budget
Full Year
Forecast
Pre-audit
outcome
Budget Year
2013/14
Budget Year
+1 2014/15
Budget Year
+2 2015/16
2013/14 Medium Term Revenue &
Expenditure FrameworkCurrent Year 2012/13
Funded by:
National Gov ernment 3 336 10 000 16 000 30 000
Prov incial Gov ernment
District Municipality
Other transfers and grants – 5 788 10 100 8 100 8 100 8 100
Transfers recognised - capital 4 – 9 124 – 10 100 8 100 8 100 8 100 10 000 16 000 30 000
Public contributions & donations 5
Borrowing 6 40 500 35 000 30 000 24 800 24 800 24 800
Internally generated funds 29 689 18 841 31 671 5 666 2 166 2 166 2 166 6 300 27 790 17 640
Total Capital Funding 7 70 189 62 965 31 671 45 766 35 066 35 066 35 066 16 300 43 790 47 640

66
The following table is a detailed analysis of the municipality’s borrowing liability.
Table 30 MBRR Table SA 17 - Detail of borrowings
Borrowing - Categorised by type Ref 2009/10 2010/11 2011/12
R thousandAudited
Outcome
Audited
Outcome
Audited
Outcome
Original
Budget
Adjusted
Budget
Full Year
Forecast
Budget Year
2013/14
Budget Year
+1 2014/15
Budget Year
+2 2015/16
Parent municipality
Long-Term Loans (annuity /reducing balance) 63 165 91 116 83 146 114 539 114 539 113 146 104 285 94 341 83 214
Long-Term Loans (non-annuity )
Local registered stock
Instalment Credit
Financial Leases
PPP liabilities
Finance Granted By Cap Equipment Supplier
Marketable Bonds
Non-Marketable Bonds
Bankers Acceptances
Financial deriv ativ es
Other Securities
Municipality sub-total 1 63 165 91 116 83 146 114 539 114 539 113 146 104 285 94 341 83 214
Entities
Long-Term Loans (annuity /reducing balance)
Long-Term Loans (non-annuity )
Local registered stock
Instalment Credit
Financial Leases
PPP liabilities
Finance Granted By Cap Equipment Supplier
Marketable Bonds
Non-Marketable Bonds
Bankers Acceptances
Financial deriv ativ es
Other Securities
Entities sub-total 1 – – – – – – – – –
Total Borrowing 1 63 165 91 116 83 146 114 539 114 539 113 146 104 285 94 341 83 214
Current Year 2012/132013/14 Medium Term Revenue &
Expenditure Framework

67
The following graph illustrates the growth in outstanding borrowing for the 2009/10 to 2015/16 period.
Figure 8 Growth in outstanding borrowing (long-term liabilities)
The municipality’s borrowings increased from 2009/10 to 2012/13 but no borrowings are foreseen in the near future. This municipality is in the process of finding other sources to finance its capital budget.

68
Table 31 MBRR Table SA 18 - Capital transfers and grants receipts
1.13.2 Cash Flow Management
Cash flow management and forecasting is a critical step in determining if the budget is funded over the medium-term. The table below is consistent with international standards of good financial management practice and also improves understanding for councillors and management. Some specific features include: • Clear separation of receipts and payments within each cash flow category; • Clear separation of capital and operating receipts from government, which also enables
cash from ‘Ratepayers and other’ to be provide for as cash inflow based on actual performance. In other words the actual collection rate of billed revenue., and
Description Ref 2009/10 2010/11 2011/12
R thousandAudited
Outcome
Audited
Outcome
Audited
Outcome
Original
Budget
Adjusted
Budget
Full Year
Forecast
Budget Year
2013/14
Budget Year
+1 2014/15
Budget Year
+2 2015/16
RECEIPTS: 1, 2
Operating Transfers and Grants
National Government: 57 369 59 315 61 966 72 799 71 916 71 916 75 766 78 390 83 129
Local Gov ernment Equitable Share 55 884 57 565 59 294 69 946 69 000 69 000 72 626 76 206 80 912
Finance Management 750 1 000 1 579 1 250 1 250 1 250 1 250 1 250 1 250
Municipal Sy stems Improv ement 735 750 790 1 000 1 000 1 000 890 934 967
EPWP Incentiv e 63 63 1 000
Other transfers/grants ( WSOG) 303 603 603 603
Provincial Government: 8 122 11 139 – – 300 300 – – –
EQUITABLE SHARE 8 122 11 139 300 300
District Municipality: – – – – – – – – –
[insert description]
Other grant providers: 1 570 7 975 16 071 10 100 8 100 8 100 515 2 195 2 524
OTHER TRANSFERS/ GRANTS 1 570 7 975 16 071 10 100 8 100 8 100 515 515 375
Rural Roads Asset Management System 1 680 2 149
Total Operating Transfers and Grants 5 67 061 78 429 78 037 82 899 80 316 80 316 76 281 80 585 85 653
Capital Transfers and Grants
National Government: – – – – – – 10 000 16 000 30 000
Regional Bulk Infrastructure 10 000 16 000 30 000
Other capital transfers/grants [insert desc]
Provincial Government: – – – – – – – – –
Other capital transfers/grants [insert
description]
District Municipality: – – – – – – – – –
[insert description]
Other grant providers: 5 285 5 788 – – – – – – –
MIG 5 285 5 788 –
Local Municipalities
Total Capital Transfers and Grants 5 5 285 5 788 – – – – 10 000 16 000 30 000
TOTAL RECEIPTS OF TRANSFERS & GRANTS 72 346 84 217 78 037 82 899 80 316 80 316 86 281 96 585 115 653
Current Year 2012/132013/14 Medium Term Revenue &
Expenditure Framework

69
• Separation of borrowing and loan repayments (no set-off), to assist with MFMA compliance assessment regarding the use of long term borrowing (debt).
Table 32 MBRR Table A7 - Budget cash flow statement
The above table shows that cash and cash equivalents of the municipality equals a positive cash balance of R155.5 million in 2009/10 to R165.9 million in 2015/16. With the 2012/13 adjustments budget various cost efficiencies and savings had to be realised to ensure the municipality could meet its operational expenditure commitments.
1.13.3 Cash Backed Reserves/Accumulated Surplus Reconciliation
This following table meets the requirements of MFMA Circular 64 which deals with the funding of a municipal budget in accordance with sections 18 and 19 of the MFMA. The table seeks to answer three key questions regarding the use and availability of cash: • What are the predicted cash and investments that are available at the end of the budget
year? • How are those funds used? • What is the net funds available or funding shortfall? A surplus would indicate the cash-backed accumulated surplus that was/is available. A shortfall (applications > cash and investments) is indicative of non-compliance with section 18 of the MFMA requirement that the municipality’s budget must be ‘funded’. Non-compliance with
Description Ref 2009/10 2010/11 2011/12
R thousandAudited
Outcome
Audited
Outcome
Audited
Outcome
Original
Budget
Adjusted
Budget
Full Year
Forecast
Pre-audit
outcome
Budget Year
2013/14
Budget Year
+1 2014/15
Budget Year
+2 2015/16
CASH FLOW FROM OPERATING ACTIVITIES
Receipts
Ratepay ers and other 229 150 227 395 236 199 184 084 179 121 178 121 178 121 199 345 214 047 233 128
Gov ernment - operating 1 72 799 72 216 71 853 71 853 76 281 80 585 85 653
Gov ernment - capital 1 10 100 8 100 8 100 8 100 10 000 16 000 30 000
Interest 11 172 9 549 8 076
Div idends
Payments
Suppliers and employ ees (199 823) (199 625) (247 217) (235 236) (237 936) (220 573) (220 573) (232 112) (254 563) (278 052)
Finance charges (12 930) (11 847) (10 664)
Transfers and Grants 1
NET CASH FROM/(USED) OPERATING ACTIVITIES 40 500 37 320 (2 942) 31 747 21 501 37 501 37 501 40 584 44 222 60 065
CASH FLOWS FROM INVESTING ACTIVITIES
Receipts
Proceeds on disposal of PPE 377 134 35 768
Decrease (Increase) in non-current debtors
Decrease (increase) other non-current receiv ables
Decrease (increase) in non-current inv estments
Payments
Capital assets (66 931) (62 965) (31 671) (45 766) (35 066) (35 066) (35 066) (16 300) (43 790) (47 640)
NET CASH FROM/(USED) INVESTING ACTIVITIES (66 554) (62 830) 4 097 (45 766) (35 066) (35 066) (35 066) (16 300) (43 790) (47 640)
CASH FLOWS FROM FINANCING ACTIVITIES
Receipts
Short term loans
Borrow ing long term/refinancing 37 631 29 454 (7 075) 30 000 30 000 30 000 30 000
Increase (decrease) in consumer deposits
Payments
Repay ment of borrow ing (4 013) (8 174) (11 164) (7 944) (7 944) (7 944) (7 944) (8 861) (9 944) (11 127)
NET CASH FROM/(USED) FINANCING ACTIVITIES 33 618 21 281 (18 239) 22 056 22 056 22 056 22 056 (8 861) (9 944) (11 127)
NET INCREASE/ (DECREASE) IN CASH HELD 7 564 (4 230) (17 084) 8 037 8 492 24 491 24 491 15 424 (9 512) 1 298
Cash/cash equiv alents at the y ear begin: 2 147 991 155 555 151 325 134 240 134 240 134 240 134 240 158 732 174 156 164 643
Cash/cash equiv alents at the y ear end: 2 155 555 151 325 134 240 142 277 142 732 158 732 158 732 174 156 164 643 165 941
2013/14 Medium Term Revenue &
Expenditure FrameworkCurrent Year 2012/13

70
section 18 is assumed because a shortfall would indirectly indicate that the annual budget is not appropriately funded (budgeted spending is greater than funds available or to be collected). Table 33 MBRR Table A8 - Cash backed reserves/accumulated surplus reconciliation
From the above table it can be seen that the cash and investments available total R174.1 million in the 2013/14 financial year and progressively decreases to R165.9 million by 2015/16, including the projected cash and cash equivalents as determined in the cash flow forecast. The following is a breakdown of the application of this funding: • Unspent conditional transfers (grants) are automatically assumed to be an obligation as
the municipality has received government transfers in advance of meeting the conditions. Ordinarily, unless there are special circumstances, the municipality is obligated to return unspent conditional grant funds to the national revenue fund at the end of the financial year. In the past these have been allowed to ‘roll-over’ and be spent in the ordinary course of business, but this practice has been discontinued.
• There is no unspent borrowing from the previous financial years. In terms of the municipality’s Borrowing and Investments Policy, borrowings are only drawn down once the expenditure has been incurred against the particular project. Unspent borrowing is ring-fenced and reconciled on a monthly basis to ensure no unnecessary liabilities are incurred.
• Against other provisions an amount R56.7 million has been provided for the 2013/14 financial year and these increases to R58.8 million by 2015/16. This liability is informed by, amongst others, the supplementary pension liability.
It can be concluded that the municipality has a surplus against the cash backed and accumulated surpluses reconciliation. The 2013/14 MTREF has been informed by ensuring the financial plan meets the minimum requirements of the MFMA.
Description Ref 2009/10 2010/11 2011/12
R thousandAudited
Outcome
Audited
Outcome
Audited
Outcome
Original
Budget
Adjusted
Budget
Full Year
Forecast
Pre-audit
outcome
Budget Year
2013/14
Budget Year
+1 2014/15
Budget Year
+2 2015/16
Cash and investments available
Cash/cash equiv alents at the y ear end 1 155 555 151 325 134 240 142 277 142 732 158 732 158 732 174 156 164 643 165 941
Other current inv estments > 90 day s 0 0 0 47 723 16 000 0 0 0 (0) (0)
Non current assets - Inv estments 1 – – – – – – – – – –
Cash and investments available: 155 555 151 325 134 240 190 000 158 732 158 732 158 732 174 156 164 643 165 941
Application of cash and investments
Unspent conditional transfers 8 913 2 320 1 408 – – 2 168 2 168 – – –
Unspent borrow ing – – – – – – – – –
Statutory requirements 2
Other w orking capital requirements 3 11 157 12 740 3 328 12 805 13 412 26 789 26 789 9 149 3 976 4 055
Other prov isions 38 463 50 099 56 176 38 263 38 263 54 754 54 754 56 717 58 657 58 807
Long term inv estments committed 4 – – – – – – – – – –
Reserv es to be backed by cash/inv estments 5
Total Application of cash and investments: 58 534 65 158 60 912 51 068 51 675 83 711 83 711 65 866 62 633 62 862
Surplus(shortfall) 97 021 86 166 73 328 138 932 107 057 75 021 75 021 108 290 102 010 103 079
2013/14 Medium Term Revenue &
Expenditure FrameworkCurrent Year 2012/13

71
The following graph supplies an analysis of the activities relating cash and cash equivalent over a seven year perspective.
Figure 9 Cash and cash equivalents activities
1.13.4 Funding compliance measurement
National Treasury requires that the municipality assess its financial sustainability against fourteen different measures that look at various aspects of the financial health of the municipality. These measures are contained in the following table. All the information comes directly from the annual budgeted statements of financial performance, financial position and cash flows. The funding compliance measurement table essentially measures the degree to which the proposed budget complies with the funding requirements of the MFMA. Each of the measures is discussed below. Table 34 MBRR SA10 – Funding compliance measurement
2009/10 2010/11 2011/12
Audited
Outcome
Audited
Outcome
Audited
Outcome
Original
Budget
Adjusted
Budget
Full Year
Forecast
Pre-audit
outcome
Budget Year
2013/14
Budget Year
+1 2014/15
Budget Year
+2 2015/16
Funding measures
Cash/cash equiv alents at the y ear end - R'000 18(1)b 1 155 555 151 325 134 240 142 277 142 732 158 732 158 732 174 156 164 643 165 941
Cash + inv estments at the y r end less applications - R'000 18(1)b 2 97 021 86 166 73 328 138 932 107 057 75 021 75 021 108 290 102 010 103 079
Cash y ear end/monthly employ ee/supplier pay ments 18(1)b 3 15.4 13.4 11.1 12.3 11.9 14.4 14.4 13.9 12.1 11.5
Surplus/(Deficit) ex cluding depreciation offsets: R'000 18(1) 4 18 690 (594) (30 877) 2 800 (2 200) 17 206 16 843 10 621 17 753 31 748
Serv ice charge rev % change - macro CPIX target ex clusiv e 18(1)a,(2) 5 N.A. 3.1% 1.1% 2.5% (6.0%) (6.0%) (6.0%) 4.4% 10.4% 6.5%
Cash receipts % of Ratepay er & Other rev enue 18(1)a,(2) 6 178.6% 143.7% 147.4% 114.8% 104.7% 104.1% 104.1% 107.1% 104.1% 103.9%
Debt impairment ex pense as a % of total billable rev enue 18(1)a,(2) 7 0.3% 0.0% 0.0% 0.0% 0.0% 0.0% 0.0% 0.0% 0.0% 0.0%
Capital pay ments % of capital ex penditure 18(1)c;19 8 95.4% 100.0% 100.0% 100.0% 100.0% 100.0% 100.0% 100.0% 100.0% 100.0%
Borrow ing receipts % of capital ex penditure (ex cl. transfers) 18(1)c 9 53.6% 54.7% (22.3%) 84.1% 111.3% 111.3% 111.3% 0.0% 0.0% 0.0%
Grants % of Gov t. legislated/gazetted allocations 18(1)a 10 0.0% 0.0% 0.0%
Current consumer debtors % change - incr(decr) 18(1)a 11 N.A. 71.8% 8.6% (60.3%) 0.0% 148.1% 0.0% (0.4%) 14.7% 10.7%
Long term receiv ables % change - incr(decr) 18(1)a 12 N.A. 0.0% 0.0% 0.0% 0.0% 0.0% 0.0% 0.0% 0.0% 0.0%
R&M % of Property Plant & Equipment 20(1)(v i) 13 19.6% 19.6% 6.8% 16.0% 16.0% 12.3% 18.3% 16.3% 1.7% 1.7%
Asset renew al % of capital budget 20(1)(v i) 14 0.0% 0.0% 0.0% 0.0% 0.0% 0.0% 0.0% 0.0% 0.0% 0.0%
Description
2013/14 Medium Term Revenue &
Expenditure FrameworkMFMA
sectionRef
Current Year 2012/13
72
1.13.4.1 Cash/cash equivalent position
The municipality’s forecast cash position was discussed as part of the budgeted cash flow statement. A ‘positive’ cash position, for each year of the MTREF would generally be a minimum requirement, subject to the planned application of these funds such as cash-backing of reserves and working capital requirements. The forecasted cash and cash equivalents for the 2013/14 MTREF shows R174.1 million, R164.6 million and R165.9 million for each respective financial year.
1.13.4.2 Cash plus investments less application of funds
The purpose of this measure is to understand how the municipality has applied the available cash and investments as identified in the budgeted cash flow statement. The detail reconciliation of the cash backed reserves/surpluses is contained in Table 17, on page 39. The reconciliation is intended to be a relatively simple methodology for understanding the budgeted amount of cash and investments available with any planned or required applications to be made. This has been extensively discussed above.
1.13.4.3 Monthly average payments covered by cash or cash equivalents
The purpose of this measure is to understand the level of financial risk should the municipality be under stress from a collection and cash in-flow perspective. Regardless of the annual cash position an evaluation should be made of the ability of the municipality to meet monthly payments as and when they fall due. Notably, the ratio is steady.
1.13.4.4 Surplus/deficit excluding depreciation offsets
The main purpose of this measure is to understand if the revenue levels are sufficient to conclude that the community is making a sufficient contribution for the municipal resources consumed each year. For the 2013/14 MTREF the indicative outcome is a surplus of R10.6 million, R17.7 million and R31.7 million. It needs to be noted that a surplus does not necessarily mean that the budget is funded from a cash flow perspective and the first two measures in the table are therefore critical.
1.13.4.5 Cash receipts as a percentage of ratepayer and other revenue
This factor is a macro measure of the rate at which funds are ‘collected’. This measure is intended to analyse the underlying assumed collection rate for the MTREF to determine the relevance and credibility of the budget assumptions contained in the budget. It can be seen that the outcome is at 107, 104 and 103 per cent for each of the respective financial years. Given that the assumed collection rate was based on a 98 per cent performance target, the cash flow statement has been conservatively determined. Should performance with the mid-year review and adjustments, be positive in relation to actual collections of billed revenue, the adjustments budget will be amended accordingly.
1.13.4.6 Debt impairment expense as a percentage of billable revenue
This factor measures whether the provision for debt impairment is being adequately funded and is based on the underlying assumption that the provision for debt impairment (doubtful and bad

73
debts) has to be increased to offset under-collection of billed revenues. Considering the municipality is a bulk water supplier to local municipalities this ratio is less than 0%.
1.13.4.7 Capital payments percentage of capital expenditure
The purpose of this measure is to determine whether the timing of payments has been taken into consideration when forecasting the cash position. The municipality aims to keep this as low as possible through strict compliance with the legislative requirement that debtors be paid within 30 days.
1.13.4.8 Borrowing as a percentage of capital expenditure (excluding transfers, grants and
contributions)
The purpose of this measurement is to determine the proportion of a municipality’s ‘own-funded’ capital expenditure budget that is being funded from borrowed funds to confirm MFMA compliance. Externally funded expenditure (by transfers/grants and contributions) has been be excluded. It can be seen that borrowing equates to 0 per cent of own funded capital.
1.13.4.9 Transfers/grants revenue as a percentage of Government transfers/grants available
The purpose of this measurement is mainly to ensure that all available transfers from national and provincial government have been budgeted for. A percentage less than 100 per cent could indicate that not all grants as contained in the Division of Revenue Act (DoRA) have been budgeted for. The municipality has budgeted for all transfers.
1.13.4.10 Consumer debtors change (Current and Non-current)
The purpose of these measures is to ascertain whether budgeted reductions in outstanding debtors are realistic. There are 2 measures shown for this factor; the change in current debtors and the change in long term receivables, both from the Budgeted Financial Position.
1.13.4.11 Repairs and maintenance expenditure level
This measure must be considered important within the context of the funding measures criteria because a trend that indicates insufficient funds are being committed to asset repair could also indicate that the overall budget is not credible and/or sustainable in the medium to long term because the revenue budget is not being protected. Details of the municipality’s strategy pertaining to asset management and repairs and maintenance are contained in Table 49 MBRR SA34c on page 89.

74
1.14 Expenditure on grants and reconciliations of unspent funds
Table 35 MBRR SA19 - Expenditure on transfers and grant programmes
Description Ref 2009/10 2010/11 2011/12
R thousandAudited
Outcome
Audited
Outcome
Audited
Outcome
Original
Budget
Adjusted
Budget
Full Year
Forecast
Budget Year
2013/14
Budget Year
+1 2014/15
Budget Year
+2 2015/16
EXPENDITURE: 1
Operating expenditure of Transfers and Grants
National Government: 57 369 59 315 61 966 72 799 71 916 71 916 75 766 78 390 83 129
Local Gov ernment Equitable Share 55 884 57 565 59 294 69 946 69 000 69 000 72 626 76 206 80 912
Finance Management 750 1 000 1 579 1 250 1 250 1 250 1 250 1 250 1 250
Municipal Sy stems Improv ement 735 750 790 1 000 1 000 1 000 890 934 967
EPWP Incentiv e 63 63 1 000
Other transfers/grants ( WSOG) 303 603 603 603
Provincial Government: 8 122 11 139 – – 300 300 – – –
EQUITABLE SHARE 8 122 11 139 300 300
District Municipality: – – – – – – – – –
[insert description]
Other grant providers: 1 570 7 975 16 071 10 100 8 100 8 100 515 2 195 2 524
OTHER TRANSFERS/ GRANTS 1 570 7 975 16 071 10 100 8 100 8 100 515 515 375
Rural Roads Asset Management System 1 680 2 149
Total operating expenditure of Transfers and Grants: 67 061 78 429 78 037 82 899 80 316 80 316 76 281 80 585 85 653
Capital expenditure of Transfers and Grants
National Government: – – – – – – 10 000 16 000 30 000
Regional Bulk Infrastructure 10 000 16 000 30 000
Other capital transfers/grants [insert desc]
Provincial Government: – – – – – – – – –
Other capital transfers/grants [insert
description]
District Municipality: – – – – – – – – –
[insert description]
Other grant providers: 5 285 5 788 – – – – – – –
MIG 5 285 5 788
Local Municipalities
Total capital expenditure of Transfers and Grants 5 285 5 788 – – – – 10 000 16 000 30 000
TOTAL EXPENDITURE OF TRANSFERS AND GRANTS 72 346 84 217 78 037 82 899 80 316 80 316 86 281 96 585 115 653
Current Year 2012/132013/14 Medium Term Revenue &
Expenditure Framework

75
Table 36 MBRR SA 20 - Reconciliation between of transfers, grant receipts and unspent funds
Description Ref 2009/10 2010/11 2011/12
R thousandAudited
Outcome
Audited
Outcome
Audited
Outcome
Original
Budget
Adjusted
Budget
Full Year
Forecast
Budget Year
2013/14
Budget Year
+1 2014/15
Budget Year
+2 2015/16
Operating transfers and grants: 1,3
National Government:
Balance unspent at beginning of the y ear
Current y ear receipts 72 346 81 517 78 037 72 799 72 216 72 216 75 766 78 390 83 129
Conditions met - transferred to revenue 72 346 81 517 78 037 72 799 72 216 72 216 75 766 78 390 83 129
Conditions still to be met - transferred to liabilities
Provincial Government:
Balance unspent at beginning of the y ear
Current y ear receipts
Conditions met - transferred to revenue – – – – – – – – –
Conditions still to be met - transferred to liabilities
District Municipality:
Balance unspent at beginning of the y ear
Current y ear receipts
Conditions met - transferred to revenue – – – – – – – – –
Conditions still to be met - transferred to liabilities
Other grant providers:
Balance unspent at beginning of the y ear
Current y ear receipts 515 2 195 2 524
Conditions met - transferred to revenue – – – – – – 515 2 195 2 524
Conditions still to be met - transferred to liabilities
Total operating transfers and grants revenue 72 346 81 517 78 037 72 799 72 216 72 216 76 281 80 585 85 653
Total operating transfers and grants - CTBM 2 – – – – – – – – –
Capital transfers and grants: 1,3
National Government:
Balance unspent at beginning of the y ear
Current y ear receipts 9 124 10 100 8 100 8 100 10 000 16 000 30 000
Conditions met - transferred to revenue – 9 124 – 10 100 8 100 8 100 10 000 16 000 30 000
Conditions still to be met - transferred to liabilities
Provincial Government:
Balance unspent at beginning of the y ear
Current y ear receipts
Conditions met - transferred to revenue – – – – – – – – –
Conditions still to be met - transferred to liabilities
District Municipality:
Balance unspent at beginning of the y ear
Current y ear receipts
Conditions met - transferred to revenue – – – – – – – – –
Conditions still to be met - transferred to liabilities
Other grant providers:
Balance unspent at beginning of the y ear
Current y ear receipts
Conditions met - transferred to revenue – – – – – – – – –
Conditions still to be met - transferred to liabilities
Total capital transfers and grants revenue – 9 124 – 10 100 8 100 8 100 10 000 16 000 30 000
Total capital transfers and grants - CTBM 2 – – – – – – – – –
TOTAL TRANSFERS AND GRANTS REVENUE 72 346 90 641 78 037 82 899 80 316 80 316 86 281 96 585 115 653
TOTAL TRANSFERS AND GRANTS - CTBM – – – – – – – – –
Current Year 2012/132013/14 Medium Term Revenue &
Expenditure Framework

76
1.15 Councillor and employee benefits
Table 37 MBRR SA22 - Summary of councillor and staff benefits
Summary of Employee and Councillor
remunerationRef 2009/10 2010/11 2011/12
R thousandAudited
Outcome
Audited
Outcome
Audited
Outcome
Original
Budget
Adjusted
Budget
Full Year
Forecast
Budget Year
2013/14
Budget Year
+1 2014/15
Budget Year
+2 2015/16
1 A B C D E F G H I
Councillors (Political Office Bearers plus Other)
Basic Salaries and Wages 5 232 3 656 2 930 2 839 2 839 2 555 3 601 3 781 3 971
Pension and UIF Contributions 542 349 137 438 438 394 479 503 528
Medical Aid Contributions 69
Motor Vehicle Allow ance 514 451 444 878 878 790 514 540 567
Cellphone Allow ance 185 163 130 183 183 164 154 161 169
Housing Allow ances
Other benefits and allow ances 83 81 11 34 34 30 36 38 40
Sub Total - Councillors 6 625 4 700 3 652 4 372 4 372 3 935 4 784 5 023 5 274
% increase 4 (29.1%) (22.3%) 19.7% – (10.0%) 21.6% 5.0% 5.0%
Senior Managers of the Municipality 2
Basic Salaries and Wages 5 195 3 545 3 913 3 913 3 521 4 000 4 240 4 495
Pension and UIF Contributions 404 435 198 198 178 107 114 120
Medical Aid Contributions 72 59 62 62 56 131 137 144
Ov ertime
Performance Bonus 175 203 192 192 172 213 226 239
Motor Vehicle Allow ance 3 276 261 382 382 343 333 353 374
Cellphone Allow ance 3 78 78 70 78 82 87
Housing Allow ances 3
Other benefits and allow ances 3 122 101 83 83 74 16 17 18
Pay ments in lieu of leav e
Long serv ice aw ards
Post-retirement benefit obligations 6
Sub Total - Senior Managers of Municipality – 6 244 4 604 4 906 4 906 4 415 4 878 5 169 5 478
% increase 4 – (26.3%) 6.6% – (10.0%) 10.5% 6.0% 6.0%
Other Municipal Staff
Basic Salaries and Wages 44 439 36 845 36 995 42 467 42 153 37 938 45 044 50 921 53 026
Pension and UIF Contributions 7 277 6 246 6 532 7 367 7 367 6 630 8 202 8 611 9 102
Medical Aid Contributions 1 742 1 922 4 547 2 156 2 156 1 941 0 – –
Ov ertime 1 692 4 713 4 021 2 053 2 053 1 848 2 255 2 368 2 487
Performance Bonus 3 240 2 772 2 813 3 672 3 862 4 064
Motor Vehicle Allow ance 3 4 647 4 233 4 531 4 448 4 448 4 003 4 746 5 195 5 449
Cellphone Allow ance 3 827 566 607 559 559 503 583 610 661
Housing Allow ances 3 393 321 343 365 365 329 382 395 415
Other benefits and allow ances 3 977 955 907 5 287 5 287 4 758 4 991 4 969 5 142
Pay ments in lieu of leav e
Long serv ice aw ards 284 163 171 180
Post-retirement benefit obligations 6
Sub Total - Other Municipal Staff 65 236 58 574 61 580 64 702 64 388 57 949 70 038 77 102 80 525
% increase 4 (10.2%) 5.1% 5.1% (0.5%) (10.0%) 20.9% 10.1% 4.4%
Total Parent Municipality 71 861 69 518 69 836 73 980 73 666 66 299 79 700 87 294 91 277
(3.3%) 0.5% 5.9% (0.4%) (10.0%) 20.2% 9.5% 4.6%
Current Year 2012/132013/14 Medium Term Revenue &
Expenditure Framework

77
Table 38 MBRR SA23 - Salaries, allowances and benefits (political office bearers/councillors/ senior managers)
Disclosure of Salaries, Allowances & Benefits 1. RefContributions In-kind
benefits
Total
Package
Rand per annum 1. 2.
Councillors 3
Speaker 4 321 884 50 582 46 558 419 024
Chief Whip –
Ex ecutiv e May or 462 647 72 702 46 556 581 905
Deputy Ex ecutiv e May or 435 990 85 793 59 486 581 269
Ex ecutiv e Committee 1 373 232 230 316 318 611 1 922 159
Total for all other councillors 682 973 195 232 401 519 1 279 724
Total Councillors 8 – 3 276 726 634 625 872 730 4 784 081
Senior Managers of the Municipality 5
Municipal Manager (MM) 1 346 176 34 695 125 132 67 309 1 573 312
Chief Finance Officer 887 774 116 777 48 218 48 549 1 101 318
Deputy City Manager - Technical Serv ices 891 132 9 914 151 723 48 549 1 101 318
Deputy City Manager - Corporate Serv ises 875 062 85 810 92 184 48 549 1 101 605
–
–
List of each offical with packages >= senior manager
–
–
–
–
–
–
–
–
–
–
–
–
–
Total Senior Managers of the Municipality 8,10 – 4 000 144 247 196 417 257 212 956 4 877 553
A Heading for Each Entity 6,7
List each member of board by designation
–
–
–
–
–
–
–
–
–
–
–
–
–
–
–
–
Total for municipal entities 8,10 – – – – – –
TOTAL COST OF COUNCILLOR, DIRECTOR and
EXECUTIVE REMUNERATION10 – 7 276 870 881 821 1 289 987 212 956 9 661 634
No.
AllowancesSalary Performance
Bonuses

78
Table 39 MBRR SA24 – Summary of personnel numbers
1.16 Monthly targets for revenue, expenditure and cash flow
Summary of Personnel Numbers Ref
Number 1,2 PositionsPermanent
employees
Contract
employeesPositions
Permanent
employees
Contract
employeesPositions
Permanent
employees
Contract
employees
Municipal Council and Boards of Municipal Entities
Councillors (Political Office Bearers plus Other Councillors) 25 14 1 24 7 17 24 7 17
Board Members of municipal entities 4 10 5 10 4 3 3
Municipal employees 5
Municipal Manager and Senior Managers 3 4 4
Other Managers 7
Professionals 64 55 8 115 107 4 114 106 4
Finance 28 27 26 22 4 25 21 4
Spatial/town planning 2 2 2 2
Information Technology 2 2 2 2
Roads
Electricity
Water 4 – 4 4 – – 4 – –
Sanitation
Refuse 2 2 –
Other 30 26 4 81 81 – 81 81 –
Technicians 441 286 42 487 330 158 493 345 158
Finance
Spatial/town planning
Information Technology
Roads 267 170 98 267 170 98
Electricity 316 191 40
Water 105 97 8 104 96 8
Sanitation 122 95 2
Refuse
Other 3 115 63 52 122 79 52
Clerks (Clerical and administrativ e) 103 103
Serv ice and sales w orkers
Skilled agricultural and fishery w orkers
Craft and related trades
Plant and Machine Operators 24 20 19 1 26 19 1
Elementary Occupations 6
TOTAL PERSONNEL NUMBERS 9 673 463 51 656 467 180 664 484 180
% increase (2.5%) 0.9% 252.9% 1.2% 3.6% –
Total municipal employees headcount 6, 10
Finance personnel headcount 8, 10
Human Resources personnel headcount 8, 10
Current Year 2012/13 Budget Year 2013/142011/12

79
Table 40 MBRR SA25 - Budgeted monthly revenue and expenditure
Description Ref
R thousand July August Sept. October November December January February March April May JuneBudget Year
2013/14
Budget Year
+1 2014/15
Budget Year
+2 2015/16
Revenue By Source
Property rates – – – –
Property rates - penalties & collection charges – – – –
Serv ice charges - electricity rev enue – – – –
Serv ice charges - w ater rev enue 4 826 4 826 5 791 5 791 6 756 9 651 9 651 7 721 10 616 15 442 9 651 5 791 96 511 112 304 126 388
Serv ice charges - sanitation rev enue – – – –
Serv ice charges - refuse rev enue – – – –
Serv ice charges - other – – – –
Rental of facilities and equipment 264 264 317 317 370 528 528 422 581 845 528 317 5 279 5 543 5 820
Interest earned - ex ternal inv estments 400 400 480 480 560 800 800 640 880 1 280 800 480 8 000 8 400 8 820
Interest earned - outstanding debtors – – – –
Div idends receiv ed – – – –
Fines – – – –
Licences and permits 6 6 7 7 8 12 12 10 13 19 12 7 120 126 132
Agency serv ices 4 068 4 068 4 882 4 882 5 696 8 137 8 137 6 509 8 950 13 019 8 137 4 882 81 368 84 767 88 946
Transfers recognised - operational 25 427 25 427 25 427 – 76 281 80 585 85 653
Other rev enue 143 143 172 172 201 287 287 229 315 459 287 172 2 868 2 906 3 021
Gains on disposal of PPE – – – –
Total Revenue (excluding capital transfers and contributions)35 134 9 707 11 649 11 649 13 590 44 842 19 415 15 532 46 783 31 063 19 415 11 648 270 426 294 632 318 781
Expenditure By Type
Employ ee related costs 3 746 3 746 4 495 4 495 5 244 7 492 7 492 5 993 8 241 11 987 7 492 4 495 74 916 82 271 86 003
Remuneration of councillors 239 239 287 287 335 478 478 383 526 765 478 287 4 784 5 023 5 274
Debt impairment – – – –
Depreciation & asset impairment 1 238 1 238 1 486 1 486 1 733 2 476 2 476 1 981 2 724 3 962 2 476 1 486 24 764 26 470 28 317
Finance charges 6 465 6 465 12 930 11 847 10 664
Bulk purchases 493 493 592 592 690 986 986 789 1 085 1 578 986 592 9 861 11 390 13 212
Other materials 3 910 3 910 4 692 4 692 5 474 7 820 7 820 6 256 8 602 12 512 7 820 4 692 78 200 82 050 90 452
Contracted serv ices – – – –
Transfers and grants – – – –
Other ex penditure 3 218 3 218 3 861 3 861 4 505 6 435 6 435 5 148 7 079 10 296 6 435 3 861 64 350 73 830 83 112
Loss on disposal of PPE – – – –
Total Expenditure 12 844 12 844 15 412 15 412 17 981 32 153 25 687 20 550 28 256 41 100 25 687 21 878 269 806 292 880 317 033
Surplus/(Deficit) 22 291 (3 136) (3 764) (3 764) (4 391) 12 689 (6 273) (5 018) 18 527 (10 037) (6 273) (10 230) 621 1 753 1 748
Transfers recognised - capital 3 333 3 333 3 333 – 10 000 16 000 30 000
Contributions recognised - capital – – – –
Contributed assets – – – –
Surplus/(Deficit) after capital transfers &
contributions25 624 (3 136) (3 764) (3 764) (4 391) 16 022 (6 273) (5 018) 21 860 (10 037) (6 273) (10 230) 10 621 17 753 31 748
Tax ation – – – –
Attributable to minorities – – – –
Share of surplus/ (deficit) of associate – – – –
Surplus/(Deficit) 1 25 624 (3 136) (3 764) (3 764) (4 391) 16 022 (6 273) (5 018) 21 860 (10 037) (6 273) (10 230) 10 621 17 753 31 748
Budget Year 2013/14Medium Term Revenue and Expenditure
Framework

80
Table 41 MBRR SA26 - Budgeted monthly revenue and expenditure (municipal vote)
Description Ref
R thousand July August Sept. October November December January February March April May JuneBudget Year
2013/14
Budget Year
+1 2014/15
Budget Year
+2 2015/16
Revenue by Vote
Vote 1 - COMMUNITY SERVICES 25 696 269 322 322 376 25 964 537 430 26 018 860 537 182 81 513 85 373 89 385
Vote 2 - SUBSIDISED SERVICES 333 333 399 399 466 665 665 532 732 1 064 665 399 6 650 7 583 9 227
Vote 3 - ECONOMIC SERVICES 140 140 168 168 196 280 280 224 308 447 280 167 2 796 2 935 3 082
Vote 4 - HOUSING 79 79 95 95 111 159 159 127 175 254 159 96 1 589 1 669 1 752
Vote 5 - TRADING SERVICES 8 159 4 826 5 791 5 791 6 756 12 984 9 651 7 721 13 949 15 442 9 651 5 792 106 511 128 304 156 388
Vote 6 - AGENCIES 4 068 4 068 4 882 4 882 5 696 8 137 8 137 6 509 8 950 13 019 8 137 4 882 81 368 84 767 88 946
Vote 7 - [NAME OF VOTE 7] – – – –
Vote 8 - [NAME OF VOTE 8] – – – –
Vote 9 - [NAME OF VOTE 9] – – – –
Vote 10 - [NAME OF VOTE 10] – – – –
Vote 11 - [NAME OF VOTE 11] – – – –
Vote 12 - [NAME OF VOTE 12] – – – –
Vote 13 - [NAME OF VOTE 13] – – – –
Vote 14 - [NAME OF VOTE 14] – – – –
Vote 15 - [NAME OF VOTE 15] – – – –
Total Revenue by Vote 38 474 9 714 11 657 11 657 13 600 48 189 19 429 15 543 50 131 31 086 19 429 11 518 280 426 310 632 348 781
Expenditure by Vote to be appropriated
Vote 1 - COMMUNITY SERVICES 2 602 2 602 3 123 3 123 3 643 5 205 5 205 4 164 5 725 8 327 5 205 3 123 52 045 54 902 58 813
Vote 2 - SUBSIDISED SERVICES 1 751 1 751 2 101 2 101 2 451 3 501 3 501 2 801 3 852 5 602 3 501 2 100 35 014 36 220 37 933
Vote 3 - ECONOMIC SERVICES 195 195 234 234 273 391 391 313 430 625 391 234 3 907 4 103 4 308
Vote 4 - HOUSING 61 61 73 73 85 122 122 97 134 195 61 133 1 216 1 276 1 340
Vote 5 - TRADING SERVICES 4 813 4 813 5 775 5 775 6 738 9 626 9 626 7 700 10 588 15 401 9 626 5 775 96 256 111 611 125 693
Vote 6 - AGENCIES 4 068 4 068 4 882 4 882 5 696 8 137 8 137 6 509 8 950 13 019 8 137 4 882 81 368 84 767 88 946
Vote 7 - [NAME OF VOTE 7] – – – –
Vote 8 - [NAME OF VOTE 8] – – – –
Vote 9 - [NAME OF VOTE 9] – – – –
Vote 10 - [NAME OF VOTE 10] – – – –
Vote 11 - [NAME OF VOTE 11] – – – –
Vote 12 - [NAME OF VOTE 12] – – – –
Vote 13 - [NAME OF VOTE 13] – – – –
Vote 14 - [NAME OF VOTE 14] – – – –
Vote 15 - [NAME OF VOTE 15] – – – –
Total Expenditure by Vote 13 490 13 490 16 188 16 188 18 886 26 981 26 981 21 584 29 679 43 169 26 920 16 249 269 806 292 880 317 033
Surplus/(Deficit) before assoc. 24 984 (3 776) (4 531) (4 531) (5 286) 21 208 (7 552) (6 042) 20 453 (12 083) (7 491) (4 730) 10 621 17 753 31 748
Tax ation – – – –
Attributable to minorities – – – –
Share of surplus/ (deficit) of associate – – – –
Surplus/(Deficit) 1 24 984 (3 776) (4 531) (4 531) (5 286) 21 208 (7 552) (6 042) 20 453 (12 083) (7 491) (4 730) 10 621 17 753 31 748
Budget Year 2013/14Medium Term Revenue and Expenditure
Framework

81
Table 42 MBRR SA27 - Budgeted monthly revenue and expenditure (standard classification)
Description Ref
R thousand July August Sept. October November December January February March April May JuneBudget Year
2013/14
Budget Year
+1 2014/15
Budget Year
+2 2015/16
Revenue - Standard
Governance and administration 24 630 106 127 127 148 24 736 211 169 24 757 338 211 127 75 686 78 651 81 063
Ex ecutiv e and council 105 105 126 126 147 210 210 168 231 336 210 126 2 098 2 075 1 969
Budget and treasury office 24 524 24 524 24 524 0 73 573 76 560 79 077
Corporate serv ices 1 1 1 1 1 2 2 1 2 2 2 1 15 16 17
Community and public safety 774 774 929 929 1 084 1 549 1 549 1 239 1 703 2 478 1 549 929 15 485 17 464 20 866
Community and social serv ices 140 140 168 168 196 280 280 224 308 447 280 167 2 796 2 935 3 082
Sport and recreation – – – –
Public safety 263 263 316 316 368 526 526 421 579 842 526 316 5 263 6 127 7 698
Housing 79 79 95 95 111 159 159 127 175 254 159 96 1 589 1 669 1 752
Health 292 292 350 350 409 584 584 467 642 934 584 350 5 837 6 732 8 334
Economic and environmental services 4 068 4 068 4 882 4 882 5 696 8 137 8 137 6 509 8 950 13 019 8 137 4 882 81 368 84 767 88 946
Planning and dev elopment – – – –
Road transport 4 068 4 068 4 882 4 882 5 696 8 137 8 137 6 509 8 950 13 019 8 137 4 882 81 368 84 767 88 946
Env ironmental protection – – – –
Trading services 8 159 4 826 5 791 5 791 6 756 12 984 9 651 7 721 13 949 15 442 9 651 7 169 107 888 129 750 157 906
Electricity – – – –
Water 8 159 4 826 5 791 5 791 6 756 12 984 9 651 7 721 13 949 15 442 9 651 7 169 107 888 129 750 157 906
Waste w ater management – – – –
Waste management – – – –
Other – – – –
Total Revenue - Standard 37 631 9 774 11 729 11 729 13 683 47 405 19 548 15 638 49 360 31 276 19 548 13 107 280 426 310 632 348 781 10 019 12 022 12 022 14 026 47 894 20 037 16 030 49 898 32 059 20 037
Expenditure - Standard
Governance and administration 1 706 1 706 2 047 2 047 2 389 3 412 3 412 2 730 3 753 5 460 3 412 2 047 34 122 36 134 39 106
Ex ecutiv e and council 703 703 844 844 985 1 407 1 407 1 125 1 547 2 250 1 407 844 14 065 14 580 15 126
Budget and treasury office 491 491 589 589 688 982 982 786 1 080 1 572 982 589 9 822 10 850 12 749
Corporate serv ices 512 512 614 614 716 1 024 1 024 819 1 126 1 638 1 024 614 10 235 10 705 11 231
Community and public safety 2 519 2 519 3 022 3 022 3 526 5 037 5 037 4 030 5 541 8 060 5 037 3 022 50 373 52 097 54 604
Community and social serv ices 195 195 234 234 273 391 391 313 430 625 391 234 3 907 4 103 4 308
Sport and recreation – – – –
Public safety 1 465 1 465 1 758 1 758 2 051 2 930 2 930 2 344 3 223 4 687 2 930 1 758 29 296 30 216 31 629
Housing 61 61 73 73 85 122 122 97 134 195 122 73 1 216 1 277 1 340
Health 798 798 957 957 1 117 1 596 1 596 1 276 1 755 2 553 1 596 957 15 955 16 501 17 327
Economic and environmental services 4 217 4 217 5 060 5 060 5 903 8 434 8 434 6 747 9 277 13 494 8 434 5 061 84 335 88 109 92 455
Planning and dev elopment 148 148 178 178 208 297 297 237 326 475 297 178 2 967 3 342 3 509
Road transport 4 068 4 068 4 882 4 882 5 696 8 137 8 137 6 509 8 950 13 019 8 137 4 882 81 368 84 767 88 946
Env ironmental protection – – – –
Trading services 5 049 5 049 6 059 6 059 7 068 10 098 10 098 8 078 11 107 16 156 10 098 6 059 100 975 116 540 130 868
Electricity – – – –
Water 5 049 5 049 6 059 6 059 7 068 10 098 10 098 8 078 11 107 16 156 10 098 6 059 100 975 116 540 130 868
Waste w ater management – – – –
Waste management – – – –
Other – – – –
Total Expenditure - Standard 13 490 13 490 16 188 16 188 18 886 26 981 26 981 21 584 29 679 43 169 26 981 16 188 269 806 292 880 317 033
Surplus/(Deficit) before assoc. 24 141 (3 716) (4 460) (4 460) (5 203) 20 424 (7 433) (5 946) 19 681 (11 893) (7 433) (3 081) 10 621 17 753 31 748
Budget Year 2013/14Medium Term Revenue and Expenditure
Framework

82
Table 43 MBRR SA28 - Budgeted monthly capital expenditure (municipal vote)
Description Ref
R thousand July August Sept. October Nov. Dec. January Feb. March April May JuneBudget Year
2013/14
Budget Year
+1 2014/15
Budget Year
+2 2015/16
Multi-year expenditure to be appropriated 1
Vote 1 - COMMUNITY SERVICES 34 34 40 40 47 67 47 54 74 107 67 60 671 – –
Vote 2 - SUBSIDISED SERVICES 20 20 24 24 28 40 40 32 44 64 40 24 400 – –
Vote 3 - ECONOMIC SERVICES 2 2 2 2 2 3 3 2 3 5 3 2 30 – –
Vote 4 - HOUSING – – – –
Vote 5 - TRADING SERVICES 760 760 912 912 1 064 1 520 1 520 1 216 1 672 2 432 1 520 912 15 200 43 790 47 640
Vote 6 - AGENCIES – – – –
Vote 7 - [NAME OF VOTE 7] – – – –
Vote 8 - [NAME OF VOTE 8] – – – –
Vote 9 - [NAME OF VOTE 9] – – – –
Vote 10 - [NAME OF VOTE 10] – – – –
Vote 11 - [NAME OF VOTE 11] – – – –
Vote 12 - [NAME OF VOTE 12] – – – –
Vote 13 - [NAME OF VOTE 13] – – – –
Vote 14 - [NAME OF VOTE 14] – – – –
Vote 15 - [NAME OF VOTE 15] – – – –
Capital multi-year expenditure sub-total 2 815 815 978 978 1 141 1 630 1 610 1 304 1 793 2 608 1 630 997 16 300 43 790 47 640
Single-year expenditure to be appropriated
Vote 1 - COMMUNITY SERVICES – – – –
Vote 2 - SUBSIDISED SERVICES – – – –
Vote 3 - ECONOMIC SERVICES – – – –
Vote 4 - HOUSING – – – –
Vote 5 - TRADING SERVICES – – – –
Vote 6 - AGENCIES – – – –
Vote 7 - [NAME OF VOTE 7] – – – –
Vote 8 - [NAME OF VOTE 8] – – – –
Vote 9 - [NAME OF VOTE 9] – – – –
Vote 10 - [NAME OF VOTE 10] – – – –
Vote 11 - [NAME OF VOTE 11] – – – –
Vote 12 - [NAME OF VOTE 12] – – – –
Vote 13 - [NAME OF VOTE 13] – – – –
Vote 14 - [NAME OF VOTE 14] – – – –
Vote 15 - [NAME OF VOTE 15] – – – –
Capital single-year expenditure sub-total 2 – – – – – – – – – – – – – – –
Total Capital Expenditure 2 815 815 978 978 1 141 1 630 1 610 1 304 1 793 2 608 1 630 997 16 300 43 790 47 640
Budget Year 2013/14Medium Term Revenue and Expenditure
Framework
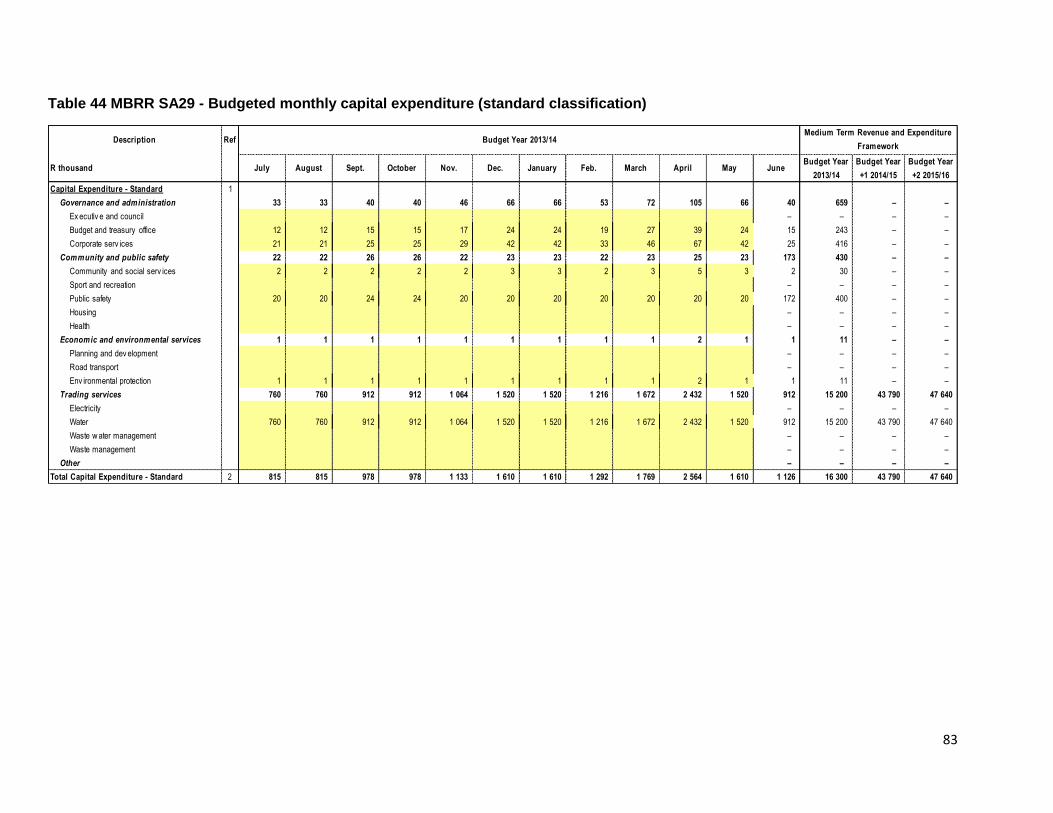
83
Table 44 MBRR SA29 - Budgeted monthly capital expenditure (standard classification)
Description Ref
R thousand July August Sept. October Nov. Dec. January Feb. March April May JuneBudget Year
2013/14
Budget Year
+1 2014/15
Budget Year
+2 2015/16
Capital Expenditure - Standard 1
Governance and administration 33 33 40 40 46 66 66 53 72 105 66 40 659 – –
Ex ecutiv e and council – – – –
Budget and treasury office 12 12 15 15 17 24 24 19 27 39 24 15 243 – –
Corporate serv ices 21 21 25 25 29 42 42 33 46 67 42 25 416 – –
Community and public safety 22 22 26 26 22 23 23 22 23 25 23 173 430 – –
Community and social serv ices 2 2 2 2 2 3 3 2 3 5 3 2 30 – –
Sport and recreation – – – –
Public safety 20 20 24 24 20 20 20 20 20 20 20 172 400 – –
Housing – – – –
Health – – – –
Economic and environmental services 1 1 1 1 1 1 1 1 1 2 1 1 11 – –
Planning and dev elopment – – – –
Road transport – – – –
Env ironmental protection 1 1 1 1 1 1 1 1 1 2 1 1 11 – –
Trading services 760 760 912 912 1 064 1 520 1 520 1 216 1 672 2 432 1 520 912 15 200 43 790 47 640
Electricity – – – –
Water 760 760 912 912 1 064 1 520 1 520 1 216 1 672 2 432 1 520 912 15 200 43 790 47 640
Waste w ater management – – – –
Waste management – – – –
Other – – – –
Total Capital Expenditure - Standard 2 815 815 978 978 1 133 1 610 1 610 1 292 1 769 2 564 1 610 1 126 16 300 43 790 47 640
Budget Year 2013/14Medium Term Revenue and Expenditure
Framework

84
Table 45 MBRR SA30 - Budgeted monthly cash flow
MONTHLY CASH FLOWS
R thousand July August Sept. October November December January February March April May JuneBudget Year
2013/14
Budget Year
+1 2014/15
Budget Year
+2 2015/16
Cash Receipts By Source 1
Property rates –
Property rates - penalties & collection charges –
Serv ice charges - electricity rev enue –
Serv ice charges - w ater rev enue 4 826 4 826 5 791 5 791 6 756 9 651 9 651 7 721 10 616 15 442 9 651 5 791 96 511 112 304 126 388
Serv ice charges - sanitation rev enue –
Serv ice charges - refuse rev enue –
Serv ice charges - other –
Rental of facilities and equipment 264 264 317 317 370 528 528 422 581 845 528 317 5 279 5 543 5 820
Interest earned - ex ternal inv estments 400 400 480 480 560 800 800 640 880 1 280 800 480 8 000 8 400 8 820
Interest earned - outstanding debtors –
Div idends receiv ed –
Fines –
Licences and permits 6 6 7 7 8 12 12 10 13 19 12 7 120 126 132
Agency serv ices 4 068 4 068 4 882 4 882 5 696 8 137 8 137 6 509 8 950 13 019 8 137 4 882 81 368 84 767 88 946
Transfer receipts - operational 25 427 25 427 25 427 – 76 281 80 585 85 653
Other rev enue 5 343 143 172 172 201 287 287 229 315 459 287 172 8 068 2 906 3 021
Cash Receipts by Source 40 334 9 707 11 649 11 649 13 590 44 842 19 415 15 532 46 783 31 063 19 415 11 648 275 626 294 632 318 781
Other Cash Flows by Source
Transfer receipts - capital 3 333 3 333 3 333 – 10 000 16 000 30 000
Contributions recognised - capital & Contributed assets –
Proceeds on disposal of PPE –
Short term loans –
Borrow ing long term/refinancing –
Increase (decrease) in consumer deposits –
Decrease (Increase) in non-current debtors –
Decrease (increase) other non-current receiv ables –
Decrease (increase) in non-current inv estments –
Total Cash Receipts by Source 43 668 9 707 11 649 11 649 13 590 48 175 19 415 15 532 50 116 31 063 19 415 11 648 285 626 310 632 348 781
Cash Payments by Type
Employ ee related costs 3 746 3 746 4 495 4 495 5 244 7 492 7 492 5 993 8 241 11 987 7 492 4 495 74 916 82 271 86 003
Remuneration of councillors 239 239 287 287 335 478 478 383 526 765 478 287 4 784 5 023 5 274
Finance charges 6 465 6 465 12 930 11 847 10 664
Bulk purchases - Electricity –
Bulk purchases - Water & Sew er 493 493 592 592 690 986 986 789 1 085 1 578 986 592 9 861 11 390 13 212
Other materials 3 910 3 910 4 692 4 692 5 474 7 820 7 820 6 256 8 602 12 512 7 820 4 692 78 200 82 050 90 452
Contracted serv ices –
Transfers and grants - other municipalities –
Transfers and grants - other –
Other ex penditure 3 218 3 218 3 861 3 861 4 505 6 435 6 435 5 148 7 079 10 296 6 435 3 861 64 350 73 830 83 112
Cash Payments by Type 11 606 11 606 13 927 13 927 16 248 29 676 23 211 18 569 25 532 37 138 23 211 20 392 245 042 266 410 288 717
Other Cash Flows/Payments by Type
Capital assets 815 815 978 978 1 141 1 630 1 630 1 304 1 793 2 608 1 630 978 16 300 43 790 47 640
Repay ment of borrow ing 4 430 4 430 8 861 9 944 11 127
Other Cash Flow s/Pay ments –
Total Cash Payments by Type 12 421 12 421 14 905 14 905 17 389 35 737 24 841 19 873 27 325 39 746 24 841 25 801 270 203 320 145 347 484
NET INCREASE/(DECREASE) IN CASH HELD 31 247 (2 713) (3 256) (3 256) (3 799) 12 438 (5 427) (4 341) 22 791 (8 682) (5 427) (14 152) 15 424 (9 512) 1 297
Cash/cash equiv alents at the month/y ear begin: 158 732 189 979 187 266 184 010 180 754 176 955 189 394 183 967 179 626 202 417 193 735 188 308 158 732 174 156 164 644
Cash/cash equiv alents at the month/y ear end: 189 979 187 266 184 010 180 754 176 955 189 394 183 967 179 626 202 417 193 735 188 308 174 156 174 156 164 644 165 941
Medium Term Revenue and Expenditure
FrameworkBudget Year 2013/14

85
1.17 Annual budgets and SDBIPs – internal departments
1.17.1 Water Services Department – Vote 5
The department is primarily responsible for the distribution of bulk water, which includes the purification of raw water, maintenance of the reticulation network and implementation of the departmental capital programme.
Table 46 Water Services Department - operating revenue by source, expenditure by type and total capital expenditure
Description Current Year 2012/13 2013/14 Medium Term Revenue & Expenditure Framework
R thousands Original Budget
Adjusted Budget
Full Year Forecast
Pre-audit outcome
Budget Year 2013/14
Budget Year +1 2014/15
Budget Year +2 2015/16
Financial Performance
Service charges 94 681 94 681 94 681 94 681 96 511 112 304 126 388
Total Revenue (excluding capital transfers and contributions)
94 681 94 681 94 681 94 681 96 511 112 304 126 388
Employee related cost 18 996 18 996 18 047 18 047 22 551 26 098 27 037
Debt impairment 200 262 275
Depreciation & Asset impairment 13 534 13 534 13 534 13 534 14 579 15 776 17 089
Finance Charges 13 234 13 234 13 234 13 234 12 930 11 847 10 663
Bulk Purchases 8 450 8 450 8 028 8 028 9 861 11 389 13 211
Other Materials 4 725 4 725 4 489 4 489 4 012 4 951 6 920
Other Expenditure 33 265 33 265 31 602 31 602 32 123 41 287 50 497
Total Expenditure 92 204 92 204 88 934 88 934 96 254 111 610 125 692
Surplus / (Deficit) 2 477 2 477 5 747 5 747 257 694 696
Transfers – Capital 10 000 16 000 30 000
Surplus / (Deficit) after Capital Transfers 2 477 2 477 5 747 5 747 10 257 16 694 30 696
Capital Expenditure 45 766 35 066 35 066 35 066 16 300 43 790 47 640
Table 47 Water Services Department – Performance objectives and indicators
There are currently no unfilled positions in the top management structure of the Water Services Department. The top management structure consists of the Director, senior manager and 1 professional engineer.
2009/10 2010/11 2011/12
Audited
Outcome
Audited
Outcome
Audited
Outcome
Original
Budget
Adjusted
Budget
Full Year
Forecast
Budget Year
2013/14
Budget Year
+1 2014/15
Budget Year
+2 2015/16
Unit of measurementDescription
Current Year 2012/132013/14 Medium Term Revenue &
Expenditure Framework
Vote 5 - Trading Services Water
Update Bulk Water System Master Plan by the
end of June Plan updated by 30 June 100% 100% 100% 100% 100% 100%
Percentage spent of the approved bulk water
capital projects allocation
% spent of budget
allocated for bulk water
capital projects
100% 100% 100% 100% 100% 100%
Bulk water quality supplied complies with
SANS 241 standards
Sample test results and
% water quality100% 100% 100% 100% 100% 100%
Development of the Desalination Plant as an
alternative supply source for Bulk water
Completion of the EIA
by June 100% 100% 100% 100% 100% 100%
New 3rd generation IDP, new key
performance indicators
New 3rd generation IDP, new key
performance indicators
New 3rd generation IDP, new key
performance indicators
New 3rd generation IDP, new key
performance indicators

86
Significant capital projects to be undertaken over the medium term includes, amongst others: • Vergeleë / Besaansklip Storage – R1.5 million; • Glen Lily Pipeline – R2.5 million; • Swartland Pipeline – R18.1 million; • Pipeline Darling (PRR Wesbank) – R14 million; and • Voëlvlei WTW filter – R6.6 million. The departmental strategy is ensuring the economic value and useful life of the water reticulation network and infrastructure is maintained. To this end, the medium-term expenditure framework provides for operational repairs and maintenance of R4 million, R4.9 million and R6.9 million in each of the respective financial years of the MTREF. The departmental revenue base is primarily informed by the sale of water of which budget appropriation for the 2013/14 financial year is R96.2 million and increases to R125.6 million by 2015/16 and has been informed by a collection rate of 100 per cent and distribution losses of 5.07 per cent. The reduction of distribution losses is considered a priority and hence the departmental objectives and targets. Past performance has been irregular with a total distribution loss of 11.68 per cent in 2010/11, dropping to 5.07 per cent the next year resulting in a total distribution loss of 16.75 per cent for the years. Note: Municipalities would be required to undertake the aforementioned for each department/vote within the municipality.
1.18 Contracts having future budgetary implications
In terms of the municipality’s Supply Chain Management Policy, no contracts are awarded beyond the medium-term revenue and expenditure framework (three years). In ensuring adherence to this contractual time frame limitation, all reports submitted to either the Bid Evaluation and Adjudication Committees must obtain formal financial comments from the Financial Management Division of the Treasury Department.
1.19 Capital expenditure details
The following three tables present details of the municipality’s capital expenditure programme, firstly on new assets, then the renewal of assets and finally on the repair and maintenance of assets.

87
Table 48 MBRR SA 34a - Capital expenditure on new assets by asset class
Description Ref 2009/10 2010/11 2011/12
R thousand 1Audited
Outcome
Audited
Outcome
Audited
Outcome
Original
Budget
Adjusted
Budget
Full Year
Forecast
Budget Year
2013/14
Budget Year
+1 2014/15
Budget Year
+2 2015/16
Capital expenditure on new assets by Asset Class/Sub-class
Infrastructure 47 328 51 935 28 877 41 900 30 800 30 800 15 200 38 750 44 800
Infrastructure - Road transport 4 102 3 336 – – – – – – –
Roads, Pavements & Bridges 4 102 3 336
Storm water
Infrastructure - Electricity 39 – 582 – – – – – –
Generation
Transmission & Reticulation 39 582
Street Lighting
Infrastructure - Water 38 982 48 600 28 295 41 900 30 800 30 800 15 200 38 750 44 800
Dams & Reservoirs 1 591 4 299 1 550
Water purification
Reticulation 38 982 47 009 23 997 41 900 30 800 30 800 15 200 38 750 43 250
Infrastructure - Sanitation 4 205 – – – – – – – –
Reticulation
Sewerage purification 4 205
Infrastructure - Other – – – – – – – – –
Waste Management
Transportation 2
Gas
Other 3
Community – 1 667 – – – – – – –
Parks & gardens
Sportsfields & stadia
Sw imming pools
Community halls 1 667
Libraries
Recreational facilities
Fire, safety & emergency
Security and policing
Buses 7
Clinics
Museums & Art Galleries
Cemeteries
Social rental housing 8
Other
Heritage assets – – – – – – – – –
Buildings
Other 9
Investment properties – – – – – – – – –
Housing dev elopment
Other
Other assets 22 861 9 363 2 781 3 866 4 266 4 266 1 100 5 040 2 840
General v ehicles 5 059 2 959 26 980 1 180 1 180 60 950 600
Specialised v ehicles 10 – – – – – – – – –
Plant & equipment 1 485 2 586 2 386 2 386 330 3 955 2 065
Computers - hardw are/equipment 1 123 231 232 135 175
Furniture and other office equipment 1 709 178 598 300 701 701 122
Abattoirs
Markets
Civ ic Land and Buildings
Other Buildings 11 260 2 356
Other Land 53 4 335
Surplus Assets - (Inv estment or Inv entory )
Other 2 172 1 660 2 155
Agricultural assets – – – – – – – – –
List sub-class
Biological assets – – – – – – – – –
List sub-class
Intangibles – – 13 – – – – – –
Computers - softw are & programming
Other (list sub-class) 13
Total Capital Expenditure on new assets 1 70 189 62 965 31 671 45 766 35 066 35 066 16 300 43 790 47 640
Current Year 2012/132013/14 Medium Term Revenue &
Expenditure Framework

88
Table 49 MBRR SA34c - Repairs and maintenance expenditure by asset class
Description Ref 2009/10 2010/11 2011/12
R thousand 1Audited
Outcome
Audited
Outcome
Audited
Outcome
Original
Budget
Adjusted
Budget
Full Year
Forecast
Budget Year
2013/14
Budget Year
+1 2014/15
Budget Year
+2 2015/16
Repairs and maintenance expenditure by Asset Class/Sub-class
Infrastructure 51 216 63 794 19 276 55 066 55 066 49 559 73 225 3 375 3 544
Infrastructure - Road transport 49 376 60 775 15 767 50 341 50 341 45 306 70 265 – –
Roads, Pavements & Bridges 46 226 60 775 15 767 50 341 50 341 45 306 70 265
Storm water 3 150 –
Infrastructure - Electricity 1 655 122 – – – – – – –
Generation
Transmission & Reticulation 1 655 122
Street Lighting
Infrastructure - Water 185 2 897 3 508 4 726 4 726 4 253 2 960 3 375 3 544
Dams & Reservoirs
Water purification 185 – 4 726 4 726 4 253 2 960 3 375 3 544
Reticulation 2 897 3 508
Infrastructure - Sanitation – – – – – – – – –
Reticulation
Sewerage purification
Infrastructure - Other – – – – – – – – –
Waste Management
Transportation 2
Gas
Other 3
Community 75 937 – 1 908 1 908 1 717 800 840 882
Parks & gardens
Sportsfields & stadia 17
Sw imming pools
Community halls
Libraries 8
Recreational facilities 838 838 754 800 840 882
Fire, safety & emergency 50 552 1 045 1 045 941
Security and policing
Buses 7
Clinics
Museums & Art Galleries
Cemeteries
Social rental housing 8
Other 385 25 25 23
Heritage assets – – – – – – – – –
Buildings
Other 9
Investment properties – – 309 – – – – – –
Housing dev elopment
Other 309
Other assets 4 370 700 1 529 1 757 1 757 1 581 4 175 4 341 4 558
General v ehicles 630 1 419 1 200 1 260
Specialised v ehicles 10 210 – – – – – – – –
Plant & equipment 36 501 135 155 163
Computers - hardw are/equipment 52 18 200 200 180 170 179 188
Furniture and other office equipment 669 211 10 10 9 131 166 175
Abattoirs
Markets
Civ ic Land and Buildings 1 555
Other Buildings 148 799 805 805 725 2 075 2 242 2 354
Other Land
Surplus Assets - (Inv estment or Inv entory )
Other 1 218 553 742 742 667 245 399 419
Agricultural assets – – – – – – – – –
List sub-class
Biological assets – – – – – – – – –
List sub-class
Intangibles – – – – – – – – –
Computers - softw are & programming
Other (list sub-class)
Total Repairs and Maintenance Expenditure 1 55 661 65 431 21 114 58 731 58 731 52 858 78 200 8 557 8 985
Specialised vehicles 210 – – – – – – – –
Refuse
Fire 210 –
Conserv ancy
Ambulances
R&M as a % of PPE 19.6% 19.6% 6.8% 16.0% 16.0% 12.3% 16.3% 1.7% 1.7%
R&M as % Operating Expenditure 28.2% 26.2% 7.6% 23.6% 22.4% 21.8% 29.0% 2.9% 2.8%
Current Year 2012/132013/14 Medium Term Revenue &
Expenditure Framework

89
Table 50 MBRR SA34d – Depreciation by asset class
Description Ref 2009/10 2010/11 2011/12
R thousand 1Audited
Outcome
Audited
Outcome
Audited
Outcome
Original
Budget
Adjusted
Budget
Full Year
Forecast
Budget Year
2013/14
Budget Year
+1 2014/15
Budget Year
+2 2015/16
Depreciation by Asset Class/Sub-class
Infrastructure 6 926 6 647 7 798 14 535 14 535 12 165 14 580 15 776 17 089
Infrastructure - Road transport 2 42 57 – – – 2 2 2
Roads, Pavements & Bridges 2 42 57 2 2 2
Storm water
Infrastructure - Electricity 333 324 157 – – – – – –
Generation
Transmission & Reticulation 333 324 157
Street Lighting
Infrastructure - Water 6 424 6 114 7 437 13 535 13 535 11 165 14 488 15 685 16 998
Dams & Reservoirs 1 862 1 863 2 361
Water purification 1 445
Reticulation 4 562 4 251 3 632 13 535 13 535 11 165 14 488 15 685 16 998
Infrastructure - Sanitation 167 167 148 1 000 1 000 1 000 90 90 90
Reticulation
Sewerage purification 167 167 148 1 000 1 000 1 000 90 90 90
Infrastructure - Other – – – – – – – – –
Waste Management
Transportation 2
Gas
Other 3
Community – – – – – – – – –
Parks & gardens
Sportsfields & stadia
Sw imming pools
Community halls
Libraries
Recreational facilities
Fire, safety & emergency
Security and policing
Buses 7
Clinics
Museums & Art Galleries
Cemeteries
Social rental housing 8
Other
Heritage assets – – – – – – – – –
Buildings
Other 9
Investment properties – 92 102 – – – 114 120 126
Housing dev elopment
Other 92 102 114 120 126
Other assets 7 907 11 612 11 402 9 166 9 166 9 166 9 844 10 348 10 876
General v ehicles 3 499 5 015 5 172 5 063 5 063 5 063 5 063 5 316 5 582
Specialised v ehicles 10 – – – – – – – – –
Plant & equipment
Computers - hardw are/equipment 397 670 632 424 424 424 424 445 467
Furniture and other office equipment 593 954 975 954 954 954 277 291 306
Abattoirs
Markets
Civ ic Land and Buildings
Other Buildings 2 522 3 000 2 826 1 636 1 636 1 636 1 636 1 718 1 803
Other Land
Surplus Assets - (Inv estment or Inv entory )
Other 896 1 973 1 797 1 090 1 090 1 090 2 445 2 578 2 718
Agricultural assets – – – – – – – – –
List sub-class
Biological assets – – – – – – – – –
List sub-class
Intangibles – – 223 – – – 226 226 226
Computers - softw are & programming 226 226 226
Other (list sub-class) 223
Total Depreciation 1 14 833 18 351 19 526 23 701 23 701 21 331 24 764 26 470 28 317
Current Year 2012/132013/14 Medium Term Revenue &
Expenditure Framework

90
Table 51 MBRR SA35 - Future financial implications of the capital budget
Vote Description Ref
R thousandBudget Year
2013/14
Budget Year
+1 2014/15
Budget Year
+2 2015/16
Forecast
2016/17
Forecast
2017/18
Forecast
2018/19
Present
value
Capital expenditure 1
Vote 1 - COMMUNITY SERVICES 671 – –
Vote 2 - SUBSIDISED SERVICES 400 – –
Vote 3 - ECONOMIC SERVICES 30 – –
Vote 4 - HOUSING – – –
Vote 5 - TRADING SERVICES 15 200 43 790 47 640 6 683 – – –
Vote 6 - AGENCIES – – –
Vote 7 - [NAME OF VOTE 7] – – –
Vote 8 - [NAME OF VOTE 8] – – –
Vote 9 - [NAME OF VOTE 9] – – –
Vote 10 - [NAME OF VOTE 10] – – –
Vote 11 - [NAME OF VOTE 11] – – –
Vote 12 - [NAME OF VOTE 12] – – –
Vote 13 - [NAME OF VOTE 13] – – –
Vote 14 - [NAME OF VOTE 14] – – –
Vote 15 - [NAME OF VOTE 15] – – –
List entity summary if applicable
Total Capital Expenditure 16 300 43 790 47 640 6 683 – – –
Future operational costs by vote 2
Vote 1 - COMMUNITY SERVICES
Vote 2 - SUBSIDISED SERVICES
Vote 3 - ECONOMIC SERVICES
Vote 4 - HOUSING
Vote 5 - TRADING SERVICES
Vote 6 - AGENCIES
Vote 7 - [NAME OF VOTE 7]
Vote 8 - [NAME OF VOTE 8]
Vote 9 - [NAME OF VOTE 9]
Vote 10 - [NAME OF VOTE 10]
Vote 11 - [NAME OF VOTE 11]
Vote 12 - [NAME OF VOTE 12]
Vote 13 - [NAME OF VOTE 13]
Vote 14 - [NAME OF VOTE 14]
Vote 15 - [NAME OF VOTE 15]
List entity summary if applicable
Total future operational costs – – – – – – –
Future revenue by source 3
Property rates
Property rates - penalties & collection charges
Serv ice charges - electricity rev enue
Serv ice charges - w ater rev enue
Serv ice charges - sanitation rev enue
Serv ice charges - refuse rev enue
Serv ice charges - other
Rental of facilities and equipment
List other revenues sources if applicable
List entity summary if applicable
Total future revenue – – – – – – –
Net Financial Implications 16 300 43 790 47 640 6 683 – – –
Forecasts2013/14 Medium Term Revenue &
Expenditure Framework

91
Table 52 MBRR SA36 - Detailed capital budget per municipal vote
Municipal Vote/Capital project Ref Individually Approved
(Yes/No)
Asset Class Asset Sub-Class GPS co-ordinates
R thousand 4 6 3 3 5
Audited
Outcome
2011/12
Current Year
2012/13
Full Year
Forecast
Budget Year
2013/14
Budget Year
+1 2014/15
Budget Year
+2 2015/16Ward location
New or
renewal
Parent municipality:
List all capital projects grouped by Municipal Vote
Water Supply / Reticulation Pipelines (Netw ork & Sw artland) Yes Infrastructure - Water Reticulation 22 605 32 600 15 200 38 750 44 800
Reserv oir Structure Vergelee / Besaansklip Yes Infrastructure - Water Dams & Reservoirs 4 299
Pump Stations Pipelines (Netw ork & Sw artland) Yes Infrastructure - Water Reticulation 1 392
Electricity Supply / Reticulation Vergelee / Besaansklip Yes Infrastructure - Water Transmission & Reticulation 582
Buildings Laboratories Yes Infrastructure - Water Buildings 2
Other Assets Other Assets Yes Other Other 2 779 2 466 1 100 5 040 2 840
Intangible Assets Computer Programs Yes Intangibles Computers - software & programming 13
Parent Capital expenditure 1 16 300 43 790 47 640
Entities:
List all capital projects grouped by Entity
Entity A
Water project A
Entity B
Electricity project B
Entity Capital expenditure – – – – –
Total Capital expenditure 31 671 35 066 16 300 43 790 47 640
Project information
Program/Project descriptionProject
number
IDP
Goal
code
2
Prior year outcomes
Total Project
Estimate
2013/14 Medium Term Revenue &
Expenditure Framework

92
Table 53 MBRR SA37 - Projects delayed from previous financial year
Ref.
1,2Original
Budget
Full Year
Forecast
Budget Year
2013/14
Budget Year
+1 2014/15
Budget Year
+2 2015/16
R thousand Year
Parent municipality:
List all capital projects grouped by Municipal Vote Examples Examples
Water Provision 1Voelvlei WTW filter rehabilitation & Pipeline 1 Infrastructure - Water Reticulation 2012/13 26 000 20 800 5 200 – –
Entities:
List all capital projects grouped by Municipal Entity
Entity Name
Project name
Municipal Vote/Capital project
Previous
target year to
complete
Current Year 2012/132013/14 Medium Term Revenue &
Expenditure Framework
Project nameProject
number
Asset Sub-Class
3
Asset Class
3
GPS co-ordinates
4

93
1.20 Legislation compliance status
Compliance with the MFMA implementation requirements have been substantially adhered to through the following activities: 1. In year reporting
Reporting to National Treasury in electronic format was fully complied with on a monthly basis. Section 71 reporting to the Executive Mayor (within 10 working days) has progressively improved and includes monthly published financial performance.
2. Internship programme
The municipality is participating in the Municipal Financial Management Internship programme and has employed five interns undergoing training in various divisions of the Financial Services Department and Internal Audit. Of the five interns two has been appointed permanently from 2012.
3. Budget and Treasury Office
The Budget and Treasury Office has been established in accordance with the MFMA. 4. Audit Committee
An Audit Committee has been established and is fully functional. 5. Service Delivery and Implementation Plan
The detail SDBIP document is at a draft stage and will be finalised after approval of the 2013/14 MTREF in May 2013 directly aligned and informed by the 2013/14 MTREF.
6. Annual Report
Annual report is compiled in terms of the MFMA and National Treasury requirements. 7. MFMP Training
The MFMP training is provided by Stellenbosch University in line with the minimum competency levels prescribed in legislation.

94
1.21 Other supporting documents
Table 54 MBRR Table SA1 - Supporting detail to budgeted financial performance
2009/10 2010/11 2011/12
Audited
Outcome
Audited
Outcome
Audited
Outcome
Original
Budget
Adjusted
Budget
Full Year
Forecast
Pre-audit
outcome
Budget Year
2013/14
Budget Year
+1 2014/15
Budget Year
+2 2015/16
R thousand
REVENUE ITEMS:
Property rates 6
Total Property Rates 801 868
less Revenue Foregone
Net Property Rates 801 868 – – – – – – – –
Service charges - electricity revenue 6
Total Serv ice charges - electricity rev enue 947 1 186
less Revenue Foregone
Net Service charges - electricity revenue 947 1 186 – – – – – – – –
Service charges - water revenue 6
Total Serv ice charges - w ater rev enue 66 696 72 571 80 575 87 458 87 458 87 458 87 458 96 511 112 304 126 388
less Revenue Foregone
Net Service charges - water revenue 66 696 72 571 80 575 87 458 87 458 87 458 87 458 96 511 112 304 126 388
Service charges - sanitation revenue
Total Serv ice charges - sanitation rev enue 494 585
less Revenue Foregone
Net Service charges - sanitation revenue 494 585 – – – – – – – –
Service charges - refuse revenue 6
Total refuse remov al rev enue
Total landfill rev enue
less Revenue Foregone
Net Service charges - refuse revenue – – – – – – – – – –
Other Revenue by source
List other revenue by source 6 491 18 353 15 260 6 220 6 166 6 166 6 166 2 868 2 906 3 021
Housing rental 2 793 2 793 2 793 2 793
Resorts (Ganzekraal) 2 556 2 556 2 556 2 556
3
Total 'Other' Revenue 1 6 491 18 353 15 260 11 569 11 515 11 515 11 515 2 868 2 906 3 021
EXPENDITURE ITEMS:
Employee related costs
Basic Salaries and Wages 2 42 711 44 035 32 732 44 847 44 533 40 080 40 080 49 044 55 162 57 521
Pension and UIF Contributions 11 286 8 657 16 699 8 003 8 003 7 203 7 203 8 309 8 725 9 223
Medical Aid Contributions 2 218 2 218 1 996 1 996 131 137 144
Ov ertime 1 692 4 713 4 021 2 053 2 053 1 848 1 848 2 255 2 368 2 487
Performance Bonus 2 947 4 267 3 519 3 519 3 167 3 167 3 849 4 050 4 264
Motor Vehicle Allow ance 5 480 3 988 7 539 5 708 5 708 5 137 5 137 5 080 5 548 5 823
Cellphone Allow ance 820 820 738 738 661 692 748
Housing Allow ances 393 321 535 365 365 329 329 382 395 415
Other benefits and allow ances 1 886 1 886 1 698 1 698 5 042 5 024 5 199
Pay ments in lieu of leav e
Long serv ice aw ards 95 158 391 188 188 169 169 163 171 180
Post-retirement benefit obligations 4 13
sub-total 5 61 670 64 818 66 184 69 608 69 294 62 365 62 365 74 916 82 271 86 003
Less: Employees costs capitalised to PPE
Total Employee related costs 1 61 670 64 818 66 184 69 608 69 294 62 365 62 365 74 916 82 271 86 003
Contributions recognised - capital
List contributions by contract
Total Contributions recognised - capital – – – – – – – – – –
Depreciation & asset impairment
Depreciation of Property , Plant & Equipment 14 833 18 351 19 526 23 701 23 701 21 331 21 331 24 764 26 470 28 317
Lease amortisation
Capital asset impairment
Depreciation resulting from rev aluation of PPE 10
Total Depreciation & asset impairment 1 14 833 18 351 19 526 23 701 23 701 21 331 21 331 24 764 26 470 28 317
Bulk purchases
Electricity Bulk Purchases 650 1 278
Water Bulk Purchases 6 500 6 055 7 329 8 450 8 450 8 450 8 450 9 861 11 390 13 212
Total bulk purchases 1 7 150 7 332 7 329 8 450 8 450 8 450 8 450 9 861 11 390 13 212
2013/14 Medium Term Revenue &
Expenditure FrameworkCurrent Year 2012/13
Description Ref

95
Table 54 MBRR Table SA1 - Supporting detail to budgeted financial performance
(Continued)
Transfers and grants
Cash transfers and grants – – – – – – – – – –
Non-cash transfers and grants – – – – – – – – – –
Total transfers and grants 1 – – – – – – – – – –
Contracted services
List services provided by contract 4 400
sub-total 1 4 400 – – – – – – – – –
Allocations to organs of state:
Electricity
Water
Sanitation
Other
Total contracted services 4 400 – – – – – – – – –
Other Expenditure By Type
Collection costs
Contributions to 'other' prov isions 448 7 239 7 700 7 700 6 930 6 930 7 817 8 882 8 426
Consultant fees
Audit fees 1 456 1 617 1 200 1 200 1 080 1 080 1 650 1 733 1 819
General ex penses 3 89 204 47 601 23 365 21 097 72 350 71 028 71 028 8 518 12 791 16 505
List Other Expenditure by Type
CHEMICALS 4 893 5 111 6 000 6 000 5 400 5 400 6 800 7 514 8 025
LEASE PAYMENTS 10 679 10 649 6 603 6 603 5 943 5 943 9 113 8 899 9 780
ELECTRICITY 10 661 13 080 14 120 14 120 12 708 12 708 16 820 19 741 23 780
TRAINING EXPENSES 1 750 1 750 1 575 1 575 1 945 1 964 2 052
PETROL & OIL 199 2 450 1 766 1 766 1 589 1 589 2 407 2 527 2 653
TRANSPORT 2 039 2 196 2 480 2 480 2 232 2 232 2 432 2 510 2 635
SUBSISTANCE ALLOWANCE 857 774 1 118 1 118 1 006 1 006 1 027 824 848
PROJECTS 649 1 267 1 303 1 303 1 173 1 173 1 080 977 1 025
PHONES 1 757 1 264 1 406 1 406 1 266 1 266 1 217 1 295 1 360
PROFESSIONAL SERVICES 2 076 3 830 3 830 3 447 3 447 2 295 2 882 2 849
PLANT AND INDIRECT ACCOUNT - ROADS 43 088 1 229 1 291 1 355
DISCONTINUED OPERATIONS 34 220
Total 'Other' Expenditure 1 89 204 81 240 148 394 70 372 121 626 115 376 115 376 64 350 73 830 83 112
Repairs and Maintenance 8
Employ ee related costs
Other materials 55 661 65 431 21 114 58 731 58 731 52 858 52 858 78 200 8 557 8 985
Contracted Serv ices
Other Ex penditure
Total Repairs and Maintenance Expenditure 9 55 661 65 431 21 114 58 731 58 731 52 858 52 858 78 200 8 557 8 985

96
Table 55 MBRR Table SA2 – Matrix financial performance budget (revenue source/expenditure type and department)
Description Ref
R thousand 1
Revenue By Source
Property rates –
Property rates - penalties & collection charges –
Serv ice charges - electricity rev enue –
Serv ice charges - w ater rev enue 96 511 96 511
Serv ice charges - sanitation rev enue –
Serv ice charges - refuse rev enue –
Serv ice charges - other –
Rental of facilities and equipment 1 377 2 796 1 107 5 279
Interest earned - ex ternal inv estments 8 000 8 000
Interest earned - outstanding debtors –
Div idends receiv ed –
Fines –
Licences and permits 120 120
Agency serv ices 81 368 81 368
Other rev enue 1 972 413 483 2 868
Transfers recognised - operational 71 421 4 860 76 281
Gains on disposal of PPE –
Total Revenue (excluding capital transfers and contributions)81 513 6 650 2 796 1 589 96 511 81 368 – – – – – – – – – 270 426
Expenditure By Type
Employ ee related costs 26 895 19 448 1 820 412 22 551 3 790 74 916
Remuneration of councillors 4 784 4 784
Debt impairment –
Depreciation & asset impairment 3 280 6 790 114 14 580 24 764
Finance charges 12 930 12 930
Bulk purchases 9 861 9 861
Other materials 420 1 862 842 800 4 013 70 265 78 200
Contracted serv ices –
Transfers and grants –
Other ex penditure 16 667 6 914 1 131 4 32 321 7 314 64 350
Loss on disposal of PPE –
Total Expenditure 52 045 35 014 3 907 1 216 96 256 81 368 – – – – – – – – – 269 806
Surplus/(Deficit) 29 467 (28 364) (1 111) 374 254 – – – – – – – – – – 621
Transfers recognised - capital –
Contributions recognised - capital 10 000 10 000
Contributed assets –
Surplus/(Deficit) after capital transfers &
contributions
29 467 (28 364) (1 111) 374 10 254 – – – – – – – – – – 10 621
Vote 15 -
[NAME OF
VOTE 15]
TotalVote 7 -
[NAME OF
VOTE 7]
Vote 8 -
[NAME OF
VOTE 8]
Vote 9 -
[NAME OF
VOTE 9]
Vote 10 -
[NAME OF
VOTE 10]
Vote 11 -
[NAME OF
VOTE 11]
Vote 12 -
[NAME OF
VOTE 12]
Vote 13 -
[NAME OF
VOTE 13]
Vote 14 -
[NAME OF
VOTE 14]
Vote 5 -
TRADING
SERVICES
Vote 6 -
AGENCIES
Vote 1 -
COMMUNITY
SERVICES
Vote 2 -
SUBSIDISED
SERVICES
Vote 3 -
ECONOMIC
SERVICES
Vote 4 -
HOUSING

West Coast District Municipality 2013/14 Annual Budget and MTREF
97
Table 56 MBRR Table SA3 – Supporting detail to Statement of Financial Position
2009/10 2010/11 2011/12
Audited
Outcome
Audited
Outcome
Audited
Outcome
Original
Budget
Adjusted
Budget
Full Year
Forecast
Pre-audit
outcome
Budget Year
2013/14
Budget Year
+1 2014/15
Budget Year
+2 2015/16
R thousand
ASSETS
Call investment deposits
Call deposits < 90 day s
Other current inv estments > 90 day s
Total Call investment deposits 2 – – – – – – – – – –
Consumer debtors
Consumer debtors 2 347 6 292 6 624 4 000 4 000 9 818 9 818 5 566 6 427 7 139
Less: Prov ision for debt impairment
Total Consumer debtors 2 2 347 6 292 6 624 4 000 4 000 9 818 9 818 5 566 6 427 7 139
Debt impairment provision
Balance at the beginning of the y ear
Contributions to the prov ision
Bad debts w ritten off
Balance at end of year – – – – – – – – – –
Property, plant and equipment (PPE)
PPE at cost/v aluation (ex cl. finance leases) 283 608 334 670 312 249 366 130 366 130 449 705 449 705 505 491 533 281 550 921
Leases recognised as PPE 3
Less: Accumulated depreciation 21 331 21 331 24 764 26 470 28 317
Total Property, plant and equipment (PPE) 2 283 608 334 670 312 249 366 130 366 130 428 374 428 374 480 727 506 811 522 604
LIABILITIES
Current liabilities - Borrowing
Short term loans (other than bank ov erdraft)
Current portion of long-term liabilities 5 594 7 050 7 944 7 944 7 944 7 944 7 944 8 861 9 944 11 127
Total Current liabilities - Borrowing 5 594 7 050 7 944 7 944 7 944 7 944 7 944 8 861 9 944 11 127
Trade and other payables
Trade and other creditors 25 615 32 714 25 577 19 693 19 693 42 283 42 283 15 548 11 108 11 938
Unspent conditional transfers 8 913 2 320 1 408 2 168 2 168
VAT
Total Trade and other payables 2 34 528 35 034 26 985 19 693 19 693 44 451 44 451 15 548 11 108 11 938
Non current liabilities - Borrowing
Borrow ing 4 63 165 91 116 83 146 114 539 114 539 113 146 113 146 104 285 94 341 83 214
Finance leases (including PPP asset element)
Total Non current liabilities - Borrowing 63 165 91 116 83 146 114 539 114 539 113 146 113 146 104 285 94 341 83 214
Provisions - non-current
Retirement benefits 38 463 50 099 56 176 38 263 38 263 54 754 54 754 56 717 58 657 58 807
List other major provision items
Refuse landfill site rehabilitation 149 158 –
Other
Total Provisions - non-current 38 613 50 257 56 176 38 263 38 263 54 754 54 754 56 717 58 657 58 807
CHANGES IN NET ASSETS
Accumulated Surplus/(Deficit)
Accumulated Surplus/(Deficit) - opening balance 293 048 323 013 324 178 386 716 360 448 370 615 370 978 471 564 493 196 506 080
GRAP adjustments
Restated balance 293 048 323 013 324 178 386 716 360 448 370 615 370 978 471 564 493 196 506 080
Surplus/(Deficit) 18 690 (594) (30 877) 2 800 (2 200) 17 206 16 843 10 621 17 753 31 748
Appropriations to Reserv es
Transfers from Reserv es
Depreciation offsets
Other adjustments
Accumulated Surplus/(Deficit) 1 311 737 322 419 293 300 389 516 358 248 387 821 387 821 482 185 510 949 537 828
Reserves
Housing Dev elopment Fund
Capital replacement
Self-insurance
Other reserv es
Rev aluation
Total Reserves 2 – – – – – – – – – –
TOTAL COMMUNITY WEALTH/EQUITY 2 311 737 322 419 293 300 389 516 358 248 387 821 387 821 482 185 510 949 537 828
Description Ref
2013/14 Medium Term Revenue &
Expenditure FrameworkCurrent Year 2012/13

98
Table 57 MBRR Table SA9 – Social, economic and demographic statistics and assumptions
2009/10 2010/11 2011/12 Current Year
2012/13
Outcome Outcome Outcome Original
Budget
Outcome Outcome Outcome
Demographics
Population 392 – – – –
Females aged 5 - 14 10 – – – –
Males aged 5 - 14 9 – – – –
Females aged 15 - 34 68.5 percent – – – –
Males aged 15 - 34 – – –
Unemploy ment 6 percent – – – –
Monthly household income (no. of households) 1, 12
No income
R1 - R1 600 – – – –
R1 601 - R3 200 – – – –
R3 201 - R6 400 – – – –
R6 401 - R12 800 – – – –
R12 801 - R25 600 – – – –
R25 601 - R51 200 – – – –
R52 201 - R102 400 – – – –
R102 401 - R204 800 – – – –
R204 801 - R409 600 – – – –
R409 601 - R819 200 – – – –
> R819 200 – – – –
Poverty profiles (no. of households)
< R2 060 per household per month 13 0.00 0.00 0.00 0.00
Insert description 2
Household/demographics (000)
Number of people in municipal area – – – –
Number of poor people in municipal area – – – –
Number of households in municipal area – – – –
Number of poor households in municipal area – – – –
Definition of poor household (R per month) - - - -
Housing statistics 3
Formal - - - -
Informal - - - -
Total number of households - - - - - - - - - -
Dw ellings prov ided by municipality 4 - - - -
Dw ellings prov ided by prov ince/s - - - -
Dw ellings prov ided by priv ate sector 5 - - - -
Total new housing dwellings - - - - - - - - - -
Economic 6
Inflation/inflation outlook (CPIX) 6.0% 6.0% 6.5% 6.5%
Interest rate - borrow ing 9.0% 0.0% 0.0% 0.0%
Interest rate - inv estment 8.0% 8.0% 8.0% 8.0%
Remuneration increases 10.0% 8.1% 9.8% 4.5%
Consumption grow th (electricity ) 0.0% 0.0% 0.0% 0.0%
Consumption grow th (w ater) 0.0% 10.4% 16.4% 12.5%
Collection rates 7
Property tax /serv ice charges 0.0% 0.0% 0.0% 0.0%
Rental of facilities & equipment 100.0% 100.0% 100.0% 100.0%
Interest - ex ternal inv estments 100.0% 100.0% 100.0% 100.0%
Interest - debtors 0.0% 0.0% 0.0% 0.0%
Rev enue from agency serv ices 100.0% 100.0% 100.0% 100.0%
2013/14 Medium Term Revenue &
Expenditure Framework
Description of economic indicator
Ref.
Basis of calculation 1996 Census 2001 Census 2007 Survey

99
Table 58 MBRR SA32 – List of external mechanisms
External mechanismPeriod of
agreement 1.
Monetary
value of
agreement 2.
Name of organisation Number R thousand
Not Applicable –
–
–
–
–
–
–
–
–
–
–
–
–
–
–
–
–
–
–
–
Service provided
Expiry date of
service delivery
agreement or
contract
Yrs/
Mths
100
1.22 Municipal manager’s quality certificate
I H F Prins, municipal manager of West Coast District Municipality, hereby certify that the
annual budget and supporting documentation have been prepared in accordance with the
Municipal Finance Management Act and the regulations made under the Act, and that the
annual budget and supporting documents are consistent with the Integrated Development Plan
of the municipality.
Print Name _____________________________________________
Municipal manager of West Coast District Municipality (DC1)
Signature ______________________________________________
Date _____________________________