annual business plan 2016-17 - town of walkerville · property, e.g. an extension ... business plan...
TRANSCRIPT
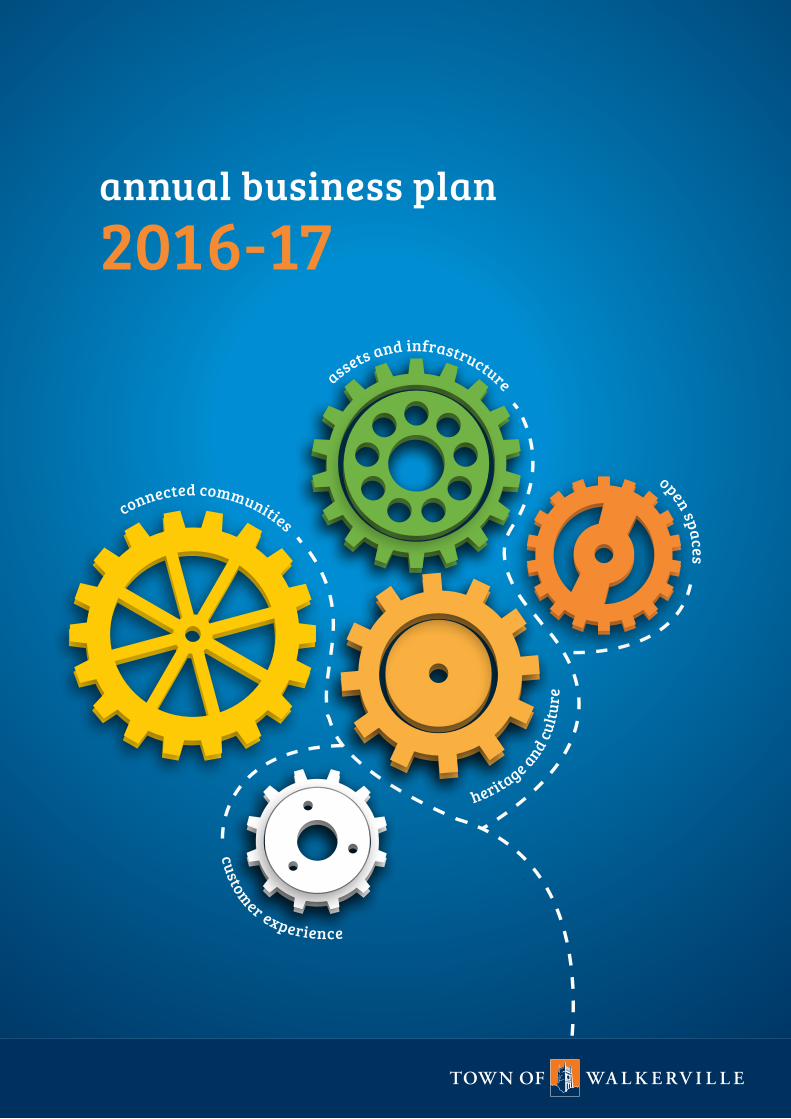
assets and infrastructure
open spaces
connected communities
heritage and cu
lture
custom
er experience
annual business plan
2016-17

2
Town of Walkerville 66 Walkerville Terrace, Gilberton SA 5081
telephone 08 8342 7100
walkerville.sa.gov.au
@walkerville5081
Photos: Simon Casson
The Town of Walkerville acknowledges the Kaurna people as the traditional custodians of this land, and respects their spiritual relationship with their country.
The Town of Walkerville recognises the generations of stewardship the Kaurna people have provided to this land, and respects that their cultural heritage and beliefs are as important today, as they were for their ancestors.

3
annual business plan 2016-17
useful definitions4
1 welcome 5 preamble
5 about the Town of Walkerville
6 message from the mayor
7 message from the chief executive officer
2 council’s strategic framework
9 strategic framework
10 Living in the Town of Walkerville: a strategic community plan
3 rates 12 where do your rates go?
12 factors that affect rates
12 how we compare
13 rating policy
16 concessions
4 making it happen 19 how council plans to achieve
these objectives
19 funding the plan
20 revenue sources
5 financial indicators 23
6 funded projects, programs and activities25
7 budgeted financial statements 30
long term financial plan 36
annual business plan
2016-17

4
useful definitions
CPI The Consumer Price Index (CPI) is based on the price of a ‘basket’ of goods and services and is used to measure change in this price over time. The content of the ‘basket’ is determined through the Australian Bureau of Statistics: Household expenditure survey.
Differential rate Refers to the rate in the dollar, which is used to calculate the ‘actual’ rates incurred by individual ratepayers.
Growth Residential:• changes in the property market based
on the sale of properties over the year• any new developments made to the
property, e.g. an extension • land divisions and new builds.
Commercial:• analysis of sales and rental data• improvements to those fixed to the
land and made to the land.
LGPI The Local Government Price Index (LGPI) measures price movements faced by Local Government in South Australia in respect of their purchases of goods and services.The LGPI provides Council with a useful reference regarding the inflationary effect of price changes of goods and services consumed by Local Government. The index reflects, over time, the movement in prices for a number of cost components as well as the aggregate spent on these components. The index includes both operating and capital expenditure on a State average basis.
Budget review The process of reviewing the budgeted income and expenditure and assessing the budget every quarter.
Key financial indicators Key financial indicators are calculated and provided in accordance with Information Paper 9 – Local Government Financial Indicators prepared as part of the Financial sustainability program for the Local Government Association of South Australia. They assist the reader to track Council’s financial management performance in identified critical areas.
Key financial indicators are:
1. Operating surplus ratio The operating surplus ratio highlights the operating result as a percentage of total rate revenue (excluding NRM Levy).
2. Net financial liabilities ratio This ratio demonstrates the relative size of Council’s net financial liabilities against total operating income.
3. Asset sustainability ratio The asset sustainability ratio represents the ratio of new capital expenditure on renewal or replacement of assets, relative to the optimal level of such expenditure proposed in Council’s Asset management plan.
Land use classification A State-wide property database, linked to the capital valuation process, is maintained by the Valuer-General. This database is updated annually and includes information on land use classification such as residential, commercial or industrial.
Average residential rate Council calculates its average residential rate by dividing the total revenue to be raised by residential rates by the total number of rateable residential properties.
Average capital value Council calculates its average capital value by dividing the capital value (set by Valuer-General) of all rateable residential properties by the total number of rateable residential properties.
Total Revenue Total revenue is the revenue received by Council from all its various sources of funding including rates revenue (net of all rebates), fee’s and charges levied and grants received.
Operating expenditure The cost related to the running of the Council, it represents the cost of consumption incurred when supplying services in the period.
Capital expediture The investment in the infrastructure and assets of the Town of Walkerville that creates a long term benefit, beyond the current year.

5
annual business plan 2016-17
welcome1preambleUnder section 123 of the Local Government Act 1999, all Councils set a budget for each financial year. The budget is aligned with the Council’s Annual business plan and must be adopted before the 31st of August of the financial year.
The Annual business plan is prepared as part of Council’s budget development process and must include: • a summary of Council’s long-term
objectives as outlined in its strategic framework
• a summary of Council’s objectives for the financial year ahead
• an outline of how Council plans to achieve those objectives
• the measures (financial and non-financial) to assess Council’s performance in achieving its objectives.
The Annual business plan will also: • assess the financial requirements for
the financial year and, taking those requirements into account, set out a summary of its proposed operating expenditure, capital expenditure and sources of revenue
• set out the rates structure and policies for the financial year
• assess the impact of the rates structure and policies on the community, based on modelling that has been undertaken or obtained by the Council
• take into account the Council’s long-term financial plan and relevant issues relating to the management and development of infrastructure and major assets by the Council.
The Annual business plan also includes the annual budget which details operating expenditure (day-to-day recurrent operations and services) and capital expenditure (renewal and acquisition) as well as identifying sources of revenue and rates for the year.
about the Town of WalkervilleThe Town of Walkerville encompasses the suburbs of Gilberton, Medindie, Vale Park and Walkerville and is located immediately north-east of the city of Adelaide, about 4 kilometres from the Adelaide GPO. The Town of Walkerville is the smallest council in metropolitan Adelaide and covers a land area of 3.5km². The Township is home to almost 8000 residents and remains the only council in inner metropolitan Adelaide to have retained its ‘Town’ status.
The Town of Walkerville is bordered by the River Torrens, the Adelaide Parklands and residential suburbs to the north and north-east. Its street boundaries are:• Park Terrace• Robe Terrace• Main North Road• Nottage Terrace• North East Road• Fife Street.
MEDINDIE
GILBERTON
WALKERVILLE VALE PARK

6
message from the mayorThis Annual business plan and budget delivers on the promise of the 2015-16 budget of achieving a positive operating position in 2016-17.The budget reaffirms Council’s undertaking to maintain financial sustainability and apply sensible debt management.
The 2016-17 Annual business plan delivers:• an average residential rate
increase of no more than 2.98% • a slight reduction in the differential
rate in the dollar from 2015-16 (this rate is applied to your property value to calculate your actual rates for the year) – refer to page 14
• total income of $9,040,000 • total operating expenditure of
$9,039,000 • expenditure allocated to capital
works $2,608,000 • an operating break even.
In 2015-16, just under half of the funded projects, programs and activities (20 out of 43) were focused on 'excellence in customer services'. One of these projects involved a whole of Township customer satisfaction survey . Some of the questions put to residents were: What do you like about living in the Town of Walkerville? How satisfied were you with our levels of customer service? What are your top priorities for the Township and how does Council’s performance rate in the priority areas?
The findings of the survey enabled us to connect with our community in relation to what mattered most to them and what services and programs we ought to be investing in. The 2016-17 Annual business plan will continue to focus on 'excellence in customer service'.
The survey gave us a starting point and a rationale for what projects we should be putting forward for consideration in the draft budget.
The top priority for residents who responded to the survey was the 'visual presentation' of the Council area. Hence, this budget and focus has been driven by the community’s desire for enhanced beautification and maintenance of our streetscapes and open spaces.
Council's existing outsourced services will be expanded and we have allocated an additional $150,000 in the operating budget to deliver Council wide beautification programs and services.
The needs and expectations from across our community remained front and centre at every stage of the budget planning process. However, as a Council we also have a responsibility to make long term projections and think beyond the here and now.
For example, we could cut spending on road infrastructure this year or postpone various capital works programs on kerbs, footpaths and similar. However, over time, this would translate into a greater financial impost on residents. The most responsible approach is to invest in the ongoing maintenance and management of Council assets and infrastructure because, as these assets depreciate over time, they become more of a financial burden and timing is critical. With low interest rates and low repayments this is the right climate to make strategic infrastructure investments. We have a shared responsibility to minimise intergenerational inequity – in simple terms – to make economic decisions today that will ensure future generations of residents aren’t paying the economic and social costs of deteriorating community infrastructure and assets.
The budget was endorsed by Council on the 18 July 2016 as per resolution CNC15/16-17.
Raymond (Ray) Grigg Mayor of Walkerville
M 0466 396 670 [email protected]
1 welcome
1 Community Survey December 2015. Telephone/face to face survey of 375 residents. The survey report and methodology can be downloaded from Council’s website.
7
annual business plan 2016-17
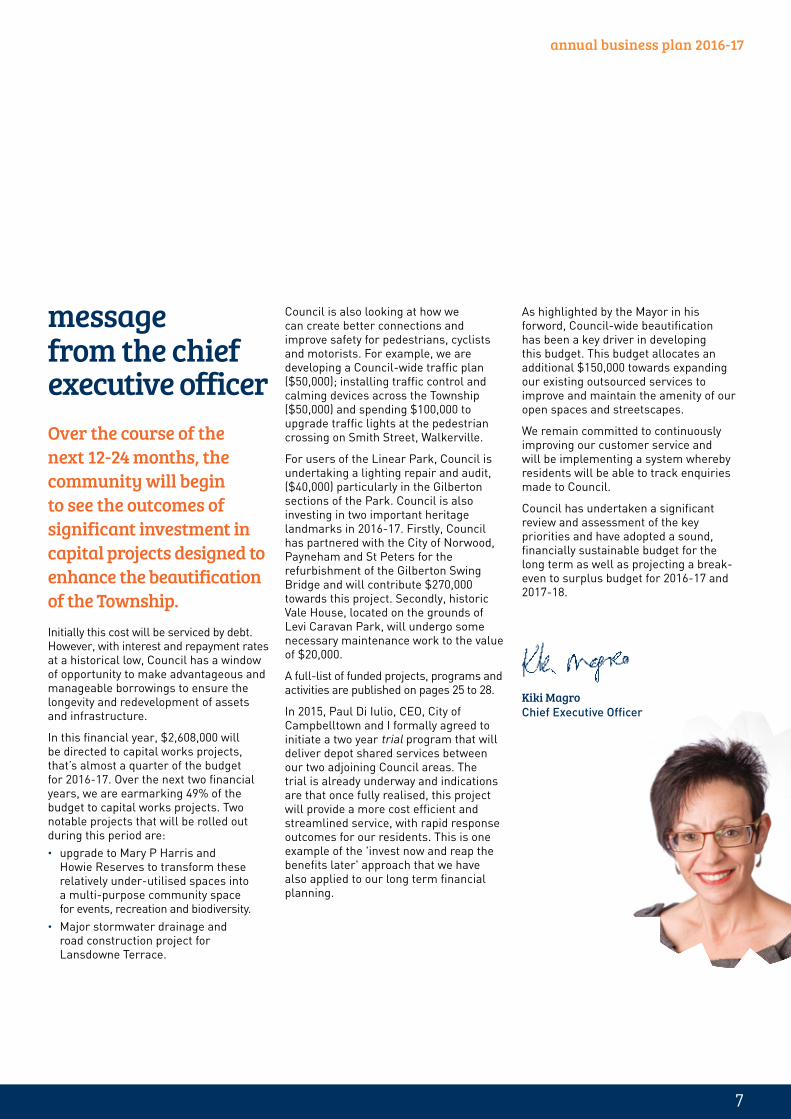
message from the chief executive officerOver the course of the next 12-24 months, the community will begin to see the outcomes of significant investment in capital projects designed to enhance the beautification of the Township.Initially this cost will be serviced by debt. However, with interest and repayment rates at a historical low, Council has a window of opportunity to make advantageous and manageable borrowings to ensure the longevity and redevelopment of assets and infrastructure.
In this financial year, $2,608,000 will be directed to capital works projects, that’s almost a quarter of the budget for 2016-17. Over the next two financial years, we are earmarking 49% of the budget to capital works projects. Two notable projects that will be rolled out during this period are:• upgrade to Mary P Harris and
Howie Reserves to transform these relatively under-utilised spaces into a multi-purpose community space for events, recreation and biodiversity.
• Major stormwater drainage and road construction project for Lansdowne Terrace.
Council is also looking at how we can create better connections and improve safety for pedestrians, cyclists and motorists. For example, we are developing a Council-wide traffic plan ($50,000); installing traffic control and calming devices across the Township ($50,000) and spending $100,000 to upgrade traffic lights at the pedestrian crossing on Smith Street, Walkerville.
For users of the Linear Park, Council is undertaking a lighting repair and audit, ($40,000) particularly in the Gilberton sections of the Park. Council is also investing in two important heritage landmarks in 2016-17. Firstly, Council has partnered with the City of Norwood, Payneham and St Peters for the refurbishment of the Gilberton Swing Bridge and will contribute $270,000 towards this project. Secondly, historic Vale House, located on the grounds of Levi Caravan Park, will undergo some necessary maintenance work to the value of $20,000.
A full-list of funded projects, programs and activities are published on pages 25 to 28.
In 2015, Paul Di Iulio, CEO, City of Campbelltown and I formally agreed to initiate a two year trial program that will deliver depot shared services between our two adjoining Council areas. The trial is already underway and indications are that once fully realised, this project will provide a more cost efficient and streamlined service, with rapid response outcomes for our residents. This is one example of the 'invest now and reap the benefits later' approach that we have also applied to our long term financial planning.
As highlighted by the Mayor in his forword, Council-wide beautification has been a key driver in developing this budget. This budget allocates an additional $150,000 towards expanding our existing outsourced services to improve and maintain the amenity of our open spaces and streetscapes.
We remain committed to continuously improving our customer service and will be implementing a system whereby residents will be able to track enquiries made to Council.
Council has undertaken a significant review and assessment of the key priorities and have adopted a sound, financially sustainable budget for the long term as well as projecting a break-even to surplus budget for 2016-17 and 2017-18.
Kiki Magro Chief Executive Officer

8

9
annual business plan 2016-17
council’s strategic framework2strategic framework
*Work health & safety and injury management plan
Setting out Council’s proposed services to the community and
its programs.
Ann
ual business planAn
nual budget
Outlining all aspects of Council’s financial strategy
and commitments.
Long
te
rm financial plan
Demonstrating responsible management of assets
and infrastructure.
Asse
t m
anagement plans
Council’s principal strategic planning document.
Livi
ng in
the Town of Walkerville: a st
ra
tegic comunity plan
Deve
lopment plan
Depa
rtment plans
Busin
ess continuity plan
Disas
te
r recovery plan
WHS&I*
m
anagement plan
A vision and direction for the future development of the Township for the next
30-40 years.
A co
nnec
ted community: the Town ofW
alke
rville
urban master plan

10
2 council’s strategic framework
2016-2020 living in the Town of Walkerville: a strategic community planBuilding sustainability for the Town of Walkerville is a key visionary strategy for Council and a fundamental foundation for future generations. The plan grew out of Living in the Town of Walkerville: a strategic plan for the Town of Walkerville 2012-2016. It exists within a State-wide context and supports the priorities identified in South Australia’s strategic plan.
Vision: A Council that supports the aspirations and wellbeing of the community.
Mission: This Council will make decisions and take actions that are shaped by the interest and values of the community. We respect our history that makes the Town of Walkerville unique. This Council will provide services that are equitable, responsible and sustainable.
Values: We are a Council that is transparent, accountable, fair, caring, honest, responsible, ethical, collaborative, adaptable, respectful, flexible, resilient.
The 2016-2020 strategic plan for the Town of Walkerville outlines five key focus areas:• vibrant local culture, inspired by
diversity and inclusivity• sustainable and resilient future, based
on a sensitive and sensible approach to planning, heritage, economic development and the public realm
• transparent and accountable local tier of Government that is respected for its forward thinking approaches and cross-council collaborations
• healthy, connected and inspired community
• positive and respectful customer service experience delivered by professional, informed and cohesive work force.
Each focus area is supported by initiatives, desired outcomes and targets. Each target in our plan is aligned to targets in the South Australia strategic plan www.saplan.org.au
Strategic plans are reviewed by Council every
four years. At the time of going out to consultation on the draft budget,
the Council was also consulting on 2016-2020 Living in the Town of Walkerville: a strategic community plan. As a result, the draft 2016-17 Annual Business Plan that went out for public consultation, referred to the strategic plan adopted
in 2012. The 2016-2020 Strategic plan was adopted July 2016
CNC5/16-17.
11
annual business plan 2016-17

12
where do your rates go?Abandoned vehiclesAged servicesArts and cultural programsBicycle tracksBuilding applications and approvalsBus SheltersBy-lawsCemeteriesCommunity busDogsEmergency Services LevyEmployment/training programsFire preventionFood and health inspectionsFootpaths Free internet in libraryGardensGraffitiGuttersImmunisationInspectionsLevi Caravan ParkLibraryLinear parkNeighbourhood amenityOvalsParking regulations and infringementsParks and gardens Pest controlPlanningPlaygrounds maintenancePublic orderPublic toilets maintenanceRoadsReserves and picnic areasStormwater drainage and reuseStreet cleaningStreet lightingStreet signsTraffic controlTreesWaste managementYouth programsZoning
factors that affect rates:• the CPI All Groups Adelaide increase on
goods and services for the 12 months ending 31 March 2016.
• the LGPI^ provides Council with a useful reference regarding the inflationary effect of price changes of goods and services consumed by Local Government, for the 12 months ending 31 March 2016.
• increase in salaries based on CPI or employment agreements.
• increase in the utilities and waste management charges.
• finance costs on borrowings for major capital projects.
• maintaining and renewing assets to a standard that meet community needs
• growth.
how we compare: The table below shows a comparison of residential rates – cents in the dollar.
rates3
^Local Government Price Index
$1757.25
$2404.40
$2,089.16
$1,995.08
$2,734.38
$2,274.95
$1,938.23
$2,821.13
$2,532.65
$2,417.57
$2,017.50
$3,144.00
$3,052.51
$1,910.63
$1,987.50
$1,995.75
Burnside 0.2286
Walkerville 0.25279
NPSP* 0.25388
Unley 0.2586
Prospect 0.319577
Campbelltown 0.321358
*Norwood, Payneham & St Peters
13
annual business plan 2016-17
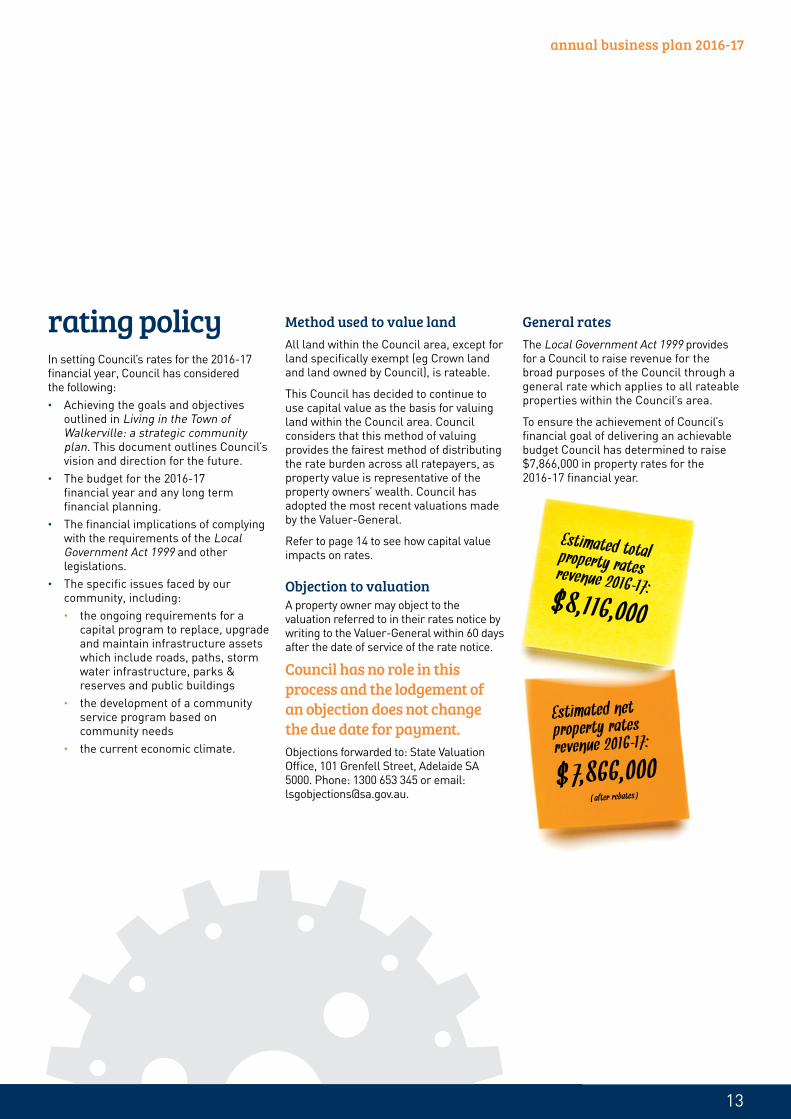
rating policyIn setting Council’s rates for the 2016-17 financial year, Council has considered the following:• Achieving the goals and objectives
outlined in Living in the Town of Walkerville: a strategic community plan. This document outlines Council’s vision and direction for the future.
• The budget for the 2016-17 financial year and any long term financial planning.
• The financial implications of complying with the requirements of the Local Government Act 1999 and other legislations.
• The specific issues faced by our community, including: • the ongoing requirements for a
capital program to replace, upgrade and maintain infrastructure assets which include roads, paths, storm water infrastructure, parks & reserves and public buildings
• the development of a community service program based on community needs
• the current economic climate.
Method used to value landAll land within the Council area, except for land specifically exempt (eg Crown land and land owned by Council), is rateable.
This Council has decided to continue to use capital value as the basis for valuing land within the Council area. Council considers that this method of valuing provides the fairest method of distributing the rate burden across all ratepayers, as property value is representative of the property owners’ wealth. Council has adopted the most recent valuations made by the Valuer-General.
Refer to page 14 to see how capital value impacts on rates.
Objection to valuationA property owner may object to the valuation referred to in their rates notice by writing to the Valuer-General within 60 days after the date of service of the rate notice.
Council has no role in this process and the lodgement of an objection does not change the due date for payment.Objections forwarded to: State Valuation Office, 101 Grenfell Street, Adelaide SA 5000. Phone: 1300 653 345 or email: [email protected].
General ratesThe Local Government Act 1999 provides for a Council to raise revenue for the broad purposes of the Council through a general rate which applies to all rateable properties within the Council’s area.
To ensure the achievement of Council’s financial goal of delivering an achievable budget Council has determined to raise $7,866,000 in property rates for the 2016-17 financial year.
Estimated net property rates revenue 2016–17:
SI 7, 866, 000 (
after rebates
Estimated total property rates revenue 2016–17:SI 8,116, 000

14
3 rates
Differential rateDue to the need to ensure an equitable distribution of the rate burden and to account for the variations within the community’s capacity to pay, the Council will continue to apply differential rates based on use of the property.
Proposed changes to differential rate 2016-17: Residential Non-res ($) ($)2016-17 0.0025279 0.0039182
2015-16 0.0025475 0.0039486
2014-15 0.0024733 0.0038336
Minimum rateCouncil has also determined to charge a minimum rate against all rateable properties. The reason for a minimum rate is that Council considers it appropriate that all rateable properties make a contribution to the cost of administering the Council’s activities and maintaining infrastructure.
Minimum rate 2016-17: $1,133The minimum rate is levied against the whole of an allotment (including land under separate lease or licence) and only one minimum rate is levied against two or more pieces of adjoining land owned and occupied by the same ratepayer.
The minimum rate will apply to all residential properties valued by the Valuer-General at under $446,000.
The minimum rate will affect approximately 28.9% of properties. (Maximum permitted under Section 158(2)(d) of the Local Government Act 1999 is 35%.)
Objection to land use classificationIf a ratepayer believes that their property has been incorrectly classified as to its land use, they can object to that land use classification within 60 days of being notified. The objection must set out the basis for the objection and details of the land use that should be attributed to that property. The Council will then decide on the objection as it sees fit and notify the ratepayer accordingly. A ratepayer has the right to appeal against the Council’s decision to the Land and Valuation Court. Objections to Council’s land use classification may be lodged with the Chief Executive Officer, Town of Walkerville. Note that the lodgement of an objection does not change the due date for payment.
Valuations on your property are made
by the Valuer– General, not Council.
If your property was valued at SI 500,000,
in 2015–16 and does not increase in
2016–17, your rates will decrease by
SI 9.80 in 2016–17.
If your property was valued at SI 1,000,000, in 2015–16 and does not
increase in 2016–17, your rates will
decrease by SI 19.60 in 2016–17.
Estimated rates at a glance:%*• a differential rate slight decrease• an average residential rate increase of no more than 2.98
Capital value and rates 2014-17:
capital value differential rate 2014-150.0024733
2015-160.0025475
2016-170.0025279 variance variance
$500,000 $1,237 $1,274 $1,264 -$9.80 -0.8%
$750,000 $1,855 $1,911 $1,896 -$14.70 -0.8%
$1,000,000 $2,473 $2,548 $2,528 -$19.60 -0.8%
$1,250,000 $3,092 $3,184 $3,160 -$24.50 -0.8%
15
annual business plan 2016-17
Payment of rates
The Council has determined that the payment of all rates can be either by full payment – due and payable by the 9 September 2016 or by quarterly instalments due and payable on the following dates:
1st payment: 9 September 2016
2nd payment: 9 December 2016
3rd payment: 9 March 2017
4th payment: 9 June 2017
Rates may be paid through:• BPay Service • telephone 1300 303 201 using
Mastercard or Visa card• Council’s website using Mastercard
or Visa card• in person at Council offices• cheque, money order, cash, EFTPOS,
Mastercard or Visa card facilities are available for payments (American Express and Diners Club cards are not accepted)
• post addressed to the Town of Walkerville PO Box 55, Walkerville SA 5081
• Australia Post.
Late payment of ratesThe Local Government Act provides that a Council may impose a penalty of 2.0% on any payment for rates (whether by instalment or otherwise) that is received after the due date. A payment that continues to be late is then charged a prescribed interest rate for every overdue month. The Local Government Act determines how this rate is calculated.
When rates are unpaid by the due date, Council issues a final notice for payment. Should rates remain unpaid then Council refers the matter to a debt collection agency. The debt collection agency charges collection fees to the ratepayer. When Council receives a payment in respect of overdue rates it applies the money as follows:
1st – to satisfy any costs awarded in connection with court proceedings2nd – to satisfy any interest costs3rd – in payment of any fines imposed4th – in payment of rates, in chronological order (starting from the oldest account).
Postponement of rates
SeniorsRatepayers who have a State Seniors Card can apply to Council to postpone payment of rates on their principal place of residence. Postponed rates remain as a charge on the land and are not required to be repaid until the property is sold or disposed of.
Senior ratepayers experiencing hardship should contact the Rates Officer for a confidential discussion.
Remission and postponement of rates due to hardshipThe Local Government Act permits a Council, on the application of the ratepayer, to partially or wholly remit rates on the basis of hardship. Where a ratepayer is suffering hardship in paying rates they can contact the Rates Officer to discuss the matter. Such enquiries are treated confidentially by Council. While arrangements for extended payments of rates are negotiable, remission of rates in whole, or in part, is rarely approved due to the inequitable situation for the rest of the community.
Ratepayers experiencing hardship should contact the Rates Officer for a confidential discussion.Forms are available from Council's website.
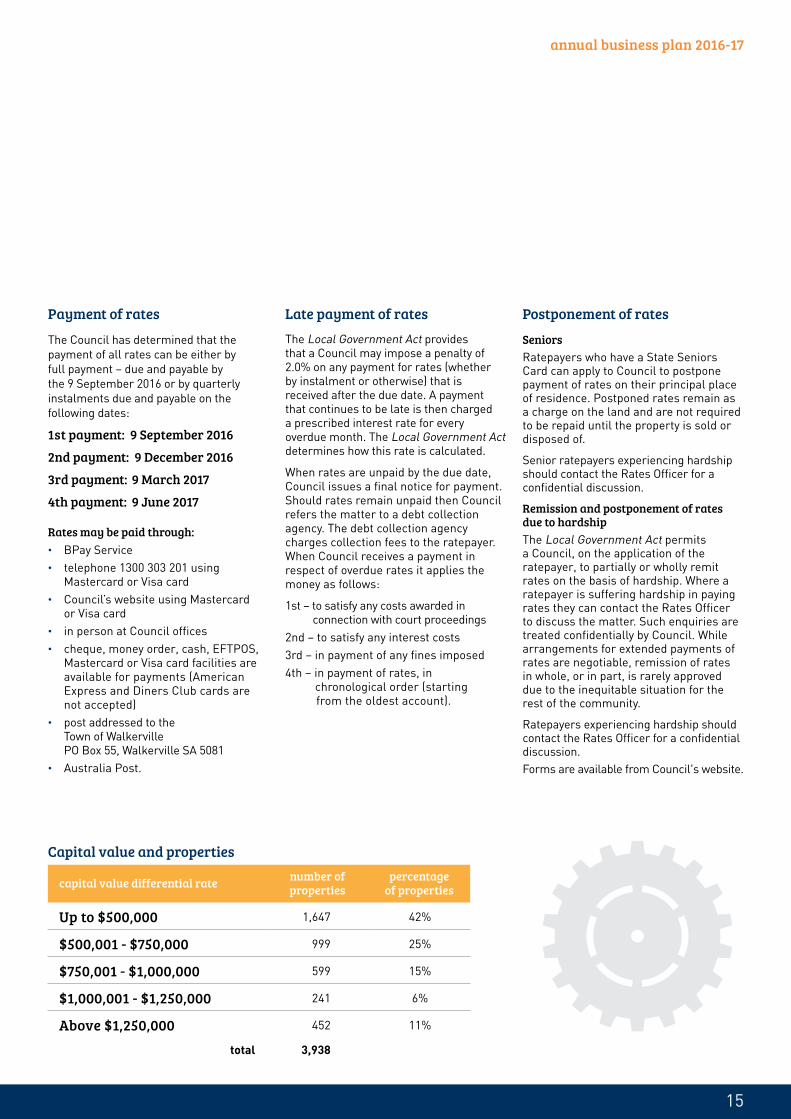
Capital value and properties
capital value differential rate number of properties
percentage of properties
Up to $500,000 1,647 42%
$500,001 - $750,000 999 25%
$750,001 - $1,000,000 599 15%
$1,000,001 - $1,250,000 241 6%
Above $1,250,000 452 11%
total 3,938

16
concessionsState Government concessionsThe State Government offers single 'cost-of-living payment' provided directly to those who are eligibile.This payment may be used for any purpose, including offsetting Council rates. To check eligibility, contact the Department for Communities and Social Inclusion (DCSI) Concessions Hotline 1800 307 758 or at www.sa.gov.au.
Natural Resources Management LevyCouncil collects a regional Natural Resources Management (NRM) Levy on behalf of the Adelaide and Mount Lofty Ranges NRM Board. The NRM Board sets the levy which goes towards managing and protecting priority water, land, marine and biodiversity assets. Council has no influence over how the Board sets the Levy, but acts as a collection agency on behalf of the NRM Board. The NRM Levy for 2016-17 is $270,392 (2015-16: $246,370).
For general NRM levy enquiries call the NRM Board on 8273 9100.
Statutory rebate of ratesThe Local Government Act requires Council to rebate the rates payable on some land including:
• 100% on land used solely for religious purposes
• a minimum of 75% for land used predominantly for educational purposes (subject to some qualifications) and
• a minimum of 75% on land used for the provision of supported accommodation.
2015-16 2016-17
100% Religious $23,218 $23,685
75% Community services
$1,481 $2,549
75% Education $137,530 $155,952
$162,229 $182,187
Discretionary rebatesCouncil may grant a rebate of services charges or rates in certain circumstances, as per section 166 of the Local Government Act 1999.
The Council has an absolute discretion to: • grant a rebate of rates or service
charges as per the Local Government Act 1999
• determine the amount of any such rebate.
Persons or bodies which seek a discretionary rebate will be required to submit an application form to the Council.
Application forms are available from Council's website, www.walkerville.sa.gov.au
Sale of land for non-payment of rates The Local Government Act provides that a Council may sell any property where the rates have been in arrears for three years or more. The Council is required to provide the owner with details of the outstanding amounts and advise the owner of its intention to sell the land if payment of the outstanding amount is not received within one month. Disclaimer: A rate cannot be challenged on the basis of non-compliance with this policy and must be paid in accordance with the required payment provisions. Where a ratepayer believes that the Council has failed to properly apply this policy they should raise the matter with Council’s Rates Officer.
3 rates
The NRM Levy is collected
by the Council on behalf
of the NRM.It is not
included in the budget.

17
annual business plan 2016-17

18

19
annual business plan 2016-17
making it happen4how council plans to achieve its objectivesTo achieve its objectives for the financial year Council has adopted a plan that seeks to achieve a reasonable degree of stability and predictability in the overall rates burden over time, while ensuring ratepayers are paying for the services and infrastructure maintenance, renewal and development obligations they are consuming. Long term financial plans enable Council to plan for the future and assess Council’s performance in adhering to key financial indicators and targets for debt, rates and asset sustainability.
Taking into account revenue sources and factors affecting rates will assist Council to achieve its objectives.
Council’s primary revenue source comes from property rates, which represent 87% of total revenue. Every year, Council makes an informed assessment of how much it needs to maintain financial sustainability and ensure that services and infrastructure maintenance, renewal and development, can be afforded by the community over the long term.
Council is best placed to achieve its objectives by taking into account the following assumptions and considerations:• Council’s financial strategy and
commitments• transparency and accountability• zero based budgeting• compliance with Australian
accounting standards• effective and efficient use of
resources available• alignment with strategic framework• Adelaide CPI and LGPI for the
March 2016 quarter in rates analysis• increase in salaries based on CPI
or employment agreements• increase in insurance costs• increase in finance costs, waste
management charges and utilities.
funding the planCouncil is granted the power to acquire funds under Section 133 of the Local Government Act 1999. Sources of funds include: property rates, grants, statutory charges, user charges, income from investments, reimbursements and commercial activity.
Operational expenditure is impacted by CPI and LGPI together with salary and wages costs which are adjusted annually in accordance with enterprise agreements, performance reviews, and incremental increases. Depreciation is adjusted subsequent to additions, disposals and revaluations when appropriate.
Fees and chargesCouncil sets and reviews its fees and charges pursuant to Section 188 of the Local Government Act 1999, that states fees or charges must not exceed a reasonable estimate of the direct cost to the Council. Fees and charges are taken into account when developing the budget.

20
4 making it happen
6.3%
2.4%
2.9%
87.3%
Estimated revenue by category:
$9,040,000
total income
user charges
$572,000
other income$93,000
reimbursements $17,000
investment & equity income $15,000
grants, subsidies
& contributions
$263,000
statutory charges $214,000
1.0%
0.2%
0.2%
rates
$7,866,000
revenue

21
annual business plan 2016-17
27%
20%
15%
10%
8%
7%
5%4% 2%2%
$9,039,000
oper
ating expenditure
capital
expenditure
$2,608,000
corporate services
$1,900,000
asse
ts &
in
fras
truc
ture
$1,4
27,0
00
strategy &
governance
$1,013,000
environment & waste $714,000
community services $735,000
planning &
building
$451,000
comm
unication & m
arketing$221,000
library
$417,000
public order $
159,000
expenditureEstimated operating & capital expenditure (excluding depreciation):

22

23
annual business plan 2016-17
financial indicators5Financial indicators are calculated and provided in accordance with Information Paper 9 – Local Government Financial Indicators prepared as part of the Financial sustainability program for the Local Government Association of South Australia. They assist the reader to track Council’s financial management performance in identified critical areas.
Council’s focus on its strategic directions in recent years aims to ensure Council creates and implements long term planning of its finances and asset management. This will also ensure it focuses on being financially sustainable. This focus on strategic directions and implementation of long term strategies will continue in 2016-2017 to ensure the implementation of previous strategies and to maintain Council’s focus on its organisational sustainability.
Operating surplus ratio: 0%The operating surplus ratio highlights the operating result as a percentage of total rate revenue (excluding NRM Levy).
The Council target range is between zero to 15%. The Council has a target to achieve a positive operating position in the 2016-17 budget.
Net financial liabilities ratio: 99%The Council target for this ratio is between zero and 60% only.
This ratio demonstrates the relative size of Council net financial liabilities against total operating income. It can be considered a measure of the ability to service liabilities. The increase in net financial liabilities ratio is largely due to the Civic and Community Centre redevelopment and is in line with the Council’s Long term financial plan.
Asset sustainability ratio: 100%The asset sustainability ratio represents the ratio of new capital expenditure on renewal or replacement of assets, relative to the optimal level of such expenditure proposed in Council’s Asset management plan.
The Council's target range is between 90-110% over the next five year period.
key financial indicators 2016-17
2015-16 BR2
2016-17 Budget
operating surplus/(deficit) $'000 (498) 1
operating surplus ratio -7% 0%0-15% (by what percentage does the major controllable income source vary from day to day expenses). Operating surplus expressed as a percentage of operating revenue excluding NRM levy.
net financial liabilities ratio 101% 99%0-60% of operating revenue (how significant is the net amount owed compared with income). Total liabilities less financial assets expressed as a percentage of total operating revenue.
asset sustainability ratio 97% 100%90-110%: (are assets being replaced at the rate they are wearing out). Capital expenditure on renewals and replacements expressed as a percentage of depreciation expense.

24

25
annual business plan 2016-17
6item no* project cost ($) rationale goal/
objective
assets & infrastructure
1 Depot shared services 25,000
Integration of outside operations with Campbelltown City Council will deliver better outcomes in terms of plant utilisation, staff development and savings through joint procurement processes, delivering a higher quality, more efficient service delivery model for both Councils. These funds are set aside to formally monitor progress, effectiveness and success, or otherwise.
2 Council-wide beautification 150,000
This focus is driven by the Walkerville community's desire for beautification of streetscapes and open spaces. As a result, and to allow for a higher level of service for beautification, Council's existing outsourced services will be expanded and include (but not limited to) additional Linear Park maintenance, active open space maintenance, pit cleaning and minor parks maintenance. Under a new operating model, Council's outside operations, based from Campbelltown City Council Depot, will focus on township beautification, services and response.
3 Mary P Harris Reserve upgrade stage 1 250,000 carry forward of project as per Council resolution CNC287/15-16
4 Walkerville Sports Club – accessibility 30,000Develop the concepts and the design for the upgrade of disability access for this sporting and community facility to ensure compliance with the Disability Discrimination Act (DDA).
5 Lansdowne Terrace storm water project 60,000Detailed design for stormwater and road construction for Lansdowne Terrace (Construction expected in 2017/18 and 2018/19).
6 Waterproofing Eastern Adelaide, ERA Water
35,000 infrastructure connections for ERA Water program
7 Contract project officer 90,000 contractor project officer to support capital and operational works (year 1 of a 3 year program)
8 lighting upgrades (Linear Park) 40,000 undertake light audit and repair of lights along Linear Park, in particular Gilberton area
9 interpretive signage 20,000develop a 5 year program for the design and installation of interpretive signage around sites of historical and cultural significance, and commence implementation of program
key: corporate goal
strategic community plan goals
funded projects, programs and activities
excellence in customer servicescapital expenditure
operating

26
item no* project cost ($) rationale goal/
objective
10 Vale House 20,000 maintenance for the historic Vale House located in the grounds of the Levi Caravan Park
11 drainage strategy (AMP) 50,000 development of township strategy for stormwater management
12 annual stormwater infrastructure program
25,000 annual renewal program of stormwater infrastructure within the township
13 Levi Caravan Park 10,000 general improvements
14 traffic management 50,000 traffic control and traffic calming devices
15 road reseal program 565,000 annual renewal program within the Township
16 kerb and gutter renewal program 150,000 annual renewal program within the Township
17 footpath renewal program 120,000 annual renewal program within the Township
18 general open space projects 50,000 open space project fund for Council identified projects
19 garden bed renewal program (Year 2 Robe Terrace)
50,000 includes garden beds, roundabouts in significant, high profile areas
20 traffic signals 100,000 traffic light upgrade at pedestrian crossing, Smith Street, St Andrew's School
21 plant and fleet program 130,000 upgrade of plant, fleet and equipment, includes $20,000 for CEO replacement vehicle as per contractual obligations
22 bin lid RFID program 20,000 RFID introduction to household mobile bins
23 street furniture renewal program 20,000 renewal of furniture inc: benches, bbqs, water fountains, street litter bins, dog bag dispensers etc
24 public toilet upgrades 27,500upgrade of internal fitout and doors (including investigation into automated open/close mechanisms) for Walkerville Sporting Club and Creswell Reserve
25 Gilberton Swing Bridge 270,000 bridge refurbishment – carried forward from 2015/16 CNC247/15-16
26 Town of Walkerville traffic plan 50,000 develop traffic plan – carried forward from 2015/16 CNC421/15-16
6 funded projects, programs and activities

27
annual business plan 2016-17
item no* project cost ($) rationale goal/
objective
community services
27 sponsorship 10,000supporting local individuals and community groups through sponsorship of their events and activities that are deemed to enhance quality of life and bring benefit to the Town of Walkerville
28 Civic & Community Centre 5,000 upgrade concierge desk so that payments can be made from this designated area in the foyer
finance
29 developing enhanced budget/LTFP and treasury model and policy review
15,000providing continuous improvement of financial management through effective, improving internal controls and finding future efficiencies and savings
30 engage internal auditor 20,000ensuring transparency and accountability and meeting legislative requirements. Improving internal control framework and develop an internal audit program for future years
Legislative requirement
IT & corporate services
31 IT software upgrades (Synergy) 50,000 ensure Council's IT infrastructure is maintained at level which maintains the integrity and security of IT systems and software
32 IT vision training and development 15,000 to provide ongoing training for staff for continuous improvement of service and processes
33 SharePoint server 2013 16,000enable compulsory inductions, performance development reviews to be done online as part of Council's continuous improvement processes
34 Nintex (SharePoint workflow software) 5,000workflow automation software to replace obsolete internal processes that could be handled more efficiently if moved online, in line with internal control processes
35 IT review implementation 250,000 to ensure Council's IT systems and hardware are at a required level
marketing & communication
36 annual sponsorship for 2017 RSL Anzac Day
10,000 recognising the value of this national event presented by the Walkerville RSL
37 annual community satisfaction survey 30,000Annual surveys will enable Council to benchmark its performance and results will be used to inform decision making. Budget includes exploring new methodologies and marketing and promotions.

28
6 funded projects, programs and activities:
item no* project cost ($) rationale goal/
objective
property & contracts
38 vendor panel management software 10,000 to ensure great internal efficiences and transparency and to streamline the existing procurement processes
39 Civic & Community Centre 30,000 ongoing maintenance of the Civic & Community Centre, includes remedial works on the air conditioner
public order
40 Strategic directions report (Section 30) 60,000 all Councils are required to produce a Strategic directions report in accordance with Section 30 of the Development Act (1993)
Legislative requirement
strategy & governance
41 representation review 25,000the purpose of a representation review is to determine whether the community could potentially benefit from a change to its ward composition or structure
Legislative requirement

29
annual business plan 2016-17

30
budgeted financial statementsfinancials ABP 2016-177
budgeted income statement 2015-16BR2
2016-17Budget
income $(‘000) $(‘000)
net rates revenue 7,522 7,866
statutory charges 210 214
user charges 543 572
grants, subsidies & contributions 234 263
investment income 47 13
reimbursements 42 17
other income 44 93
net gain: equity accounted council businesses 1 2
total revenues 8,641 9,040
expensesemployee costs* 2,711 2,897
materials, contracts & other expenses 3,908 3,894
finance costs 286 248
depreciation, amortisation & impairment 2,232 2,000
net loss: equity accounted council businesses 2 0
total expenses 9,139 9,039
operating surplus/(deficit) before capital amounts (498) 1
asset disposal & fair value adjustments 165 0
amounts specifically for new/upgraded assets 0 0
infrastructure, property, plant & equipment received FOC 0 0
net surplus/(deficit) (333) 1
other comprehensive incomechanges in revaluation surplus 0 0
total other comprehensive income 0 0
total comprehensive income (333) 1
* Refers to staff wages increase in line with CPI and includes Workcover, sick and accident insurance, superannuation and other employee related costs. The NRM Levy is
not included in budgeted financial statements.
annual business plan 2016-17
31
budgeted financial statements
budgeted income statement 2015-16BR2
2016-17Budget
income $(‘000) $(‘000)
net rates revenue 7,522 7,866
statutory charges 210 214
user charges 543 572
grants, subsidies & contributions 234 263
investment income 47 13
reimbursements 42 17
other income 44 93
net gain: equity accounted council businesses 1 2
total revenues 8,641 9,040
expensesemployee costs* 2,711 2,897
materials, contracts & other expenses 3,908 3,894
finance costs 286 248
depreciation, amortisation & impairment 2,232 2,000
net loss: equity accounted council businesses 2 0
total expenses 9,139 9,039
operating surplus/(deficit) before capital amounts (498) 1
asset disposal & fair value adjustments 165 0
amounts specifically for new/upgraded assets 0 0
infrastructure, property, plant & equipment received FOC 0 0
net surplus/(deficit) (333) 1
other comprehensive incomechanges in revaluation surplus 0 0
total other comprehensive income 0 0
total comprehensive income (333) 1
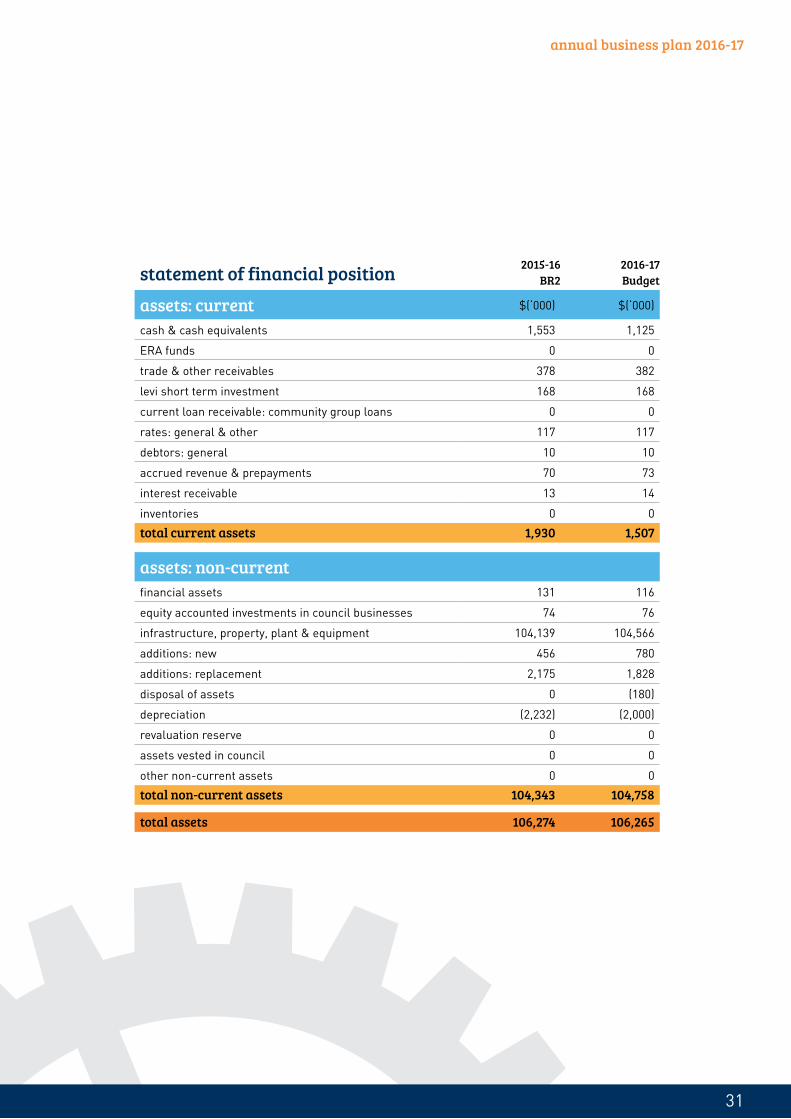
statement of financial position 2015-16BR2
2016-17Budget
assets: current $(‘000) $(‘000)
cash & cash equivalents 1,553 1,125
ERA funds 0 0
trade & other receivables 378 382
levi short term investment 168 168
current loan receivable: community group loans 0 0
rates: general & other 117 117
debtors: general 10 10
accrued revenue & prepayments 70 73
interest receivable 13 14
inventories 0 0
total current assets 1,930 1,507
assets: non-currentfinancial assets 131 116
equity accounted investments in council businesses 74 76
infrastructure, property, plant & equipment 104,139 104,566
additions: new 456 780
additions: replacement 2,175 1,828
disposal of assets 0 (180)
depreciation (2,232) (2,000)
revaluation reserve 0 0
assets vested in council 0 0
other non-current assets 0 0
total non-current assets 104,343 104,758
total assets 106,274 106,265
32
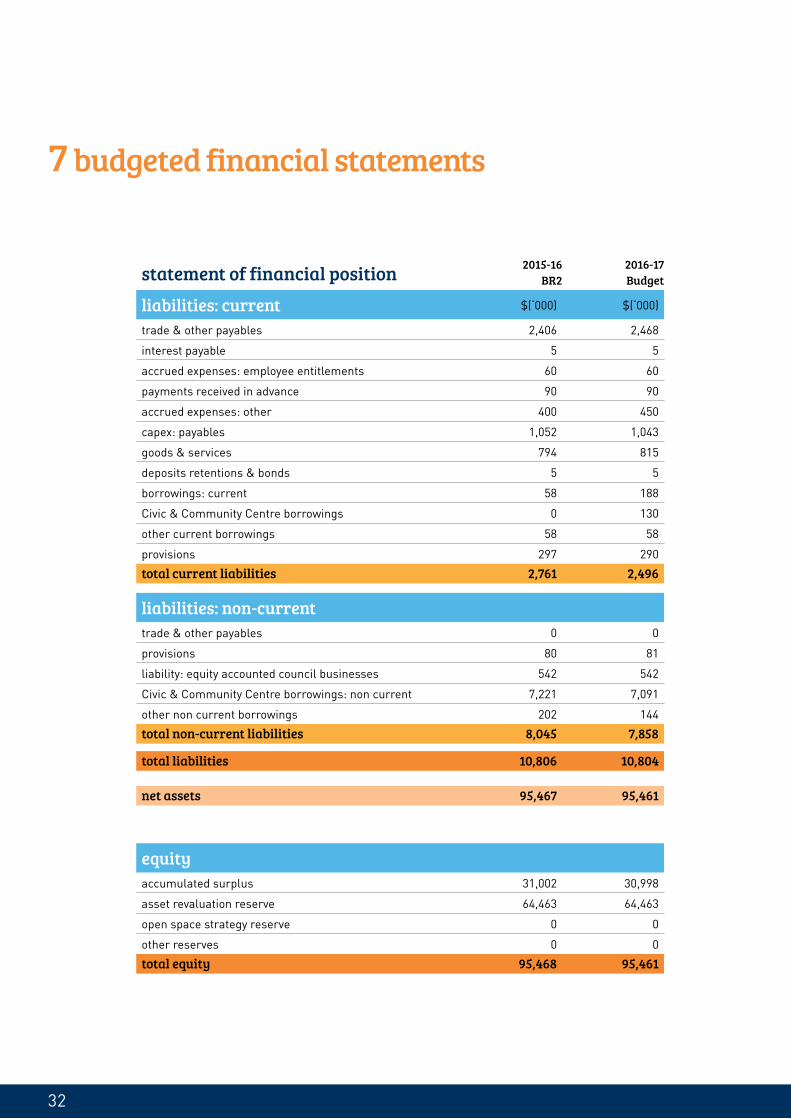
statement of financial position 2015-16BR2
2016-17Budget
liabilities: current $(‘000) $(‘000)
trade & other payables 2,406 2,468
interest payable 5 5
accrued expenses: employee entitlements 60 60
payments received in advance 90 90
accrued expenses: other 400 450
capex: payables 1,052 1,043
goods & services 794 815
deposits retentions & bonds 5 5
borrowings: current 58 188
Civic & Community Centre borrowings 0 130
other current borrowings 58 58
provisions 297 290
total current liabilities 2,761 2,496
liabilities: non-currenttrade & other payables 0 0
provisions 80 81
liability: equity accounted council businesses 542 542
Civic & Community Centre borrowings: non current 7,221 7,091
other non current borrowings 202 144
total non-current liabilities 8,045 7,858
total liabilities 10,806 10,804
net assets 95,467 95,461
equityaccumulated surplus 31,002 30,998
asset revaluation reserve 64,463 64,463
open space strategy reserve 0 0
other reserves 0 0
total equity 95,468 95,461
7 budgeted financial statements

annual business plan 2016-17
budgeted cash flow statement 2015-16BR2
2016-17Budget
cash flows from operating activities $(‘000) $(‘000)
receiptsoperating receipts 8,461 8,931
investment receipts 34 0
paymentsoperating payments to suppliers and employees (6,289) (6,627)finance payments (281) (243)net cash provided by (or used in) operating activities 1,924 2,060
cash flows from investing activitiesreceiptsamounts specifically for new/upgraded assets 0 0
sale of replaced assets 165 180repayments of loans by community groups 18 15paymentsexpenditure on renewal/replacement of assets (1,690) (2,157)expenditure on new/upgraded assets (274) (468)net cash provided by (or used in) investing activities (1,780) (2,431)
cash flows from financing activitiesreceiptsproceeds from borrowings 0 0civic centre borrowings 0 0other new borrowings 0 0 paymentsrepayments of borrowings (917) (58)net cash provided by (or used in) financing activities (917) (58)
net increase/(decrease) in cash held (773) (428)
cash & cash equivalents at beginning of period 2,326 1,553
cash & cash equivalents at end of period 1,553 1,125
33

34
budgeted statement of changes in equity 2015-16BR2
2016-17Budget
accumulated surplus $(‘000) $(‘000)
balance at end of previous reporting period 31,477 31,144
net surplus/(deficit) (333) 1
transfers to other reserves 0 0
transfers from other reserves 0 0
balance at end of period 31,144 31,146
asset revaluation reservebalance at end of previous reporting period 64,464 64,311
gain on revaluation of infrastructure, property, plant & equipment
0 0
transfer to accumulated surplus on sale of property, plant & equipment
(153)
balance at end of period 64,311 64,311
other reservesbalance at end of previous reporting period 0 0
transfers from accumulated surplus 0 0
transfers to accumulated surplus 0 0
balance at end of period 0 0
total equity at end of reporting period 95,454 95,461
7 budgeted financial statements

35
annual business plan 2016-17
uniform presentation of finances 2015-16BR2
2016-17Budget
$(‘000) $(‘000)
operating revenues 8,641 9,040
less operating expenses 9,139 9,039
operating surplus/(deficit) before capital amounts (498) 1
less: net outlays on existing assetscapital expenditure on renewal/replacement of existing assets
2,175 1,828
less depreciation, amortisation & impairment 2,232 2,000
less proceeds from sale of replaced assets 165 180
(222) (353)
less: net outlays on new and upgraded assetscapital expenditure on new/upgraded assets 456 780
less amounts specifically for new/upgraded assets 0 0
less proceeds from sale of surplus assets 165
291 780
net lending /(borrowing) for financial year (566) (426)
key financial indicatorsoperating surplus ratio: % -7% 0%
net financial liabilities ratio: % 101% 99%
asset sustainability ratio: % (based on depreciation) 97% 100%
7 budgeted financial statements

36
long term financial plan:
To achieve the objectives outlined in Council’s strategic framework Council needs a Long term financial plan which sets out financial strategies and commitments.
A well considered and forward looking Long term financial plan means Council is best placed to deliver improved existing services as well as being in a financial position to meet future opportunities and projects.
A Long term financial plan supports Council in: • maintaining financial sustainability
over the long term• achieving the objectives of Council’s
strategic framework to benefit the community
• minimising the possibility of unplanned increases for ratepayers
• ensuring optimum ‘value for money’ outcomes for ratepayers
• ensuring transparency and accountability.
The Long term financial plan includes capital and operating projections over a 10 year period. No new loan borrowings have been projected. The aim for Council is to maintain a rate that will be consistent with delivering existing and improved services to the community.
Through its 10-year Long term financial plan, Council makes an informed forecast of its future requirements. By definition, future projections are subject to change as a result of CPI, LGPI, growth as well as other factors. The complete Long term financial plan is available from the website.
key financial indicators 2016-17 to 2026-27operating surplus ratio 0% 1% 2% 2% 3% 4% 5% 5% 6% 6% 7%
net financial liabilities ratio 102% 127% 125% 120% 108% 103% 93% 81% 83% 77% 68%
asset sustainability ratio 100% 95% 89% 78% 73% 107% 87% 84% 160% 114% 105%
asset management plans 2016-17 to 2026-27
particulars $(‘000)
2016-17 2017-18 2018-19 2019-20 2020-21 2021-22 2022-23 2023-24 2024-25 2025-26 2026-27
Budget Year 1 Year 2 Year 3 Year 4 Year 5 Year 6 Year 7 Year 8 Year 9 Year 10
infrastructure: roads & pavements 565 314 315 311 314 564 564 563 565 564 565
infrastructure: kerb & gutter 150 83 22 24 34 35 43 69 81 73 133
infrastructure: footpath 120 119 116 118 120 120 120 120 119 119 118
infrastructure: traffic control devices 100 50 50 50 50 50 50 50 50 50 50
infrastructure: parking and traffic 50 50 50 50 50 50 50 50 50 50 50
infrastructure: building - - - 304 73 256 179 64 1,350 550 69
infrastructure: stormwater 60 15 15 123 15 167 96 30 15 15 172
infrastructure: lighting 40 40 25 25 25 25 25 25 25 25 25
movement action plan - 200 50 -
furniture & fittings 123 50 50 50 50 50 50 50 50 50 50
library 50 50 50 50 50 50 50 50 50 50 50
IT 250 100 100 100 250 350 100 100 100 250 350
plant & equipment 310 15 15 45 80 35 15 130 140 15 15
open space: reserve structures (inc playgrounds) 120 120 120 120 120 120 120 120 120 120 120
open space: irrigation 40 20 120 20 60 20 60 35 40 20 25
Lansdowne Terrace project:
road upgrade (renewal / upgrade) 30 500 500 -
stormwater upgrade (new) 30 2,000 500 -
Mary P Harris upgrade 250 500 - -
Walkerville Sporting Club ramp DDA compliance 50 500
Gilberton swing bridge 270
Gilberton lower level bridge 50 500
total capital expenditure 2,608 4,726 2,148 1,890 1,291 1,892 1,522 1,456 2,755 1,951 1,792
36
nominal

37
long term financial plan:
key financial indicators 2016-17 to 2026-27operating surplus ratio 0% 1% 2% 2% 3% 4% 5% 5% 6% 6% 7%
net financial liabilities ratio 102% 127% 125% 120% 108% 103% 93% 81% 83% 77% 68%
asset sustainability ratio 100% 95% 89% 78% 73% 107% 87% 84% 160% 114% 105%
asset management plans 2016-17 to 2026-27
particulars $(‘000)
2016-17 2017-18 2018-19 2019-20 2020-21 2021-22 2022-23 2023-24 2024-25 2025-26 2026-27
Budget Year 1 Year 2 Year 3 Year 4 Year 5 Year 6 Year 7 Year 8 Year 9 Year 10
infrastructure: roads & pavements 565 314 315 311 314 564 564 563 565 564 565
infrastructure: kerb & gutter 150 83 22 24 34 35 43 69 81 73 133
infrastructure: footpath 120 119 116 118 120 120 120 120 119 119 118
infrastructure: traffic control devices 100 50 50 50 50 50 50 50 50 50 50
infrastructure: parking and traffic 50 50 50 50 50 50 50 50 50 50 50
infrastructure: building - - - 304 73 256 179 64 1,350 550 69
infrastructure: stormwater 60 15 15 123 15 167 96 30 15 15 172
infrastructure: lighting 40 40 25 25 25 25 25 25 25 25 25
movement action plan - 200 50 -
furniture & fittings 123 50 50 50 50 50 50 50 50 50 50
library 50 50 50 50 50 50 50 50 50 50 50
IT 250 100 100 100 250 350 100 100 100 250 350
plant & equipment 310 15 15 45 80 35 15 130 140 15 15
open space: reserve structures (inc playgrounds) 120 120 120 120 120 120 120 120 120 120 120
open space: irrigation 40 20 120 20 60 20 60 35 40 20 25
Lansdowne Terrace project:
road upgrade (renewal / upgrade) 30 500 500 -
stormwater upgrade (new) 30 2,000 500 -
Mary P Harris upgrade 250 500 - -
Walkerville Sporting Club ramp DDA compliance 50 500
Gilberton swing bridge 270
Gilberton lower level bridge 50 500
total capital expenditure 2,608 4,726 2,148 1,890 1,291 1,892 1,522 1,456 2,755 1,951 1,792
annual business plan 2016-17
operating surplus ('000) 2016-17 to 2026-27
2016-17
2017-18
2018-19
2019-20
2020-21
2021-22
2022-23
2023-24
2024-25
2025-26
2026-27
1
41
144
196
254
332
403
476
525
558
603
38

annual business plan 2016-17

40