annual development effectiveness review 2016 · pdf fileannual development effectiveness...
TRANSCRIPT
Annual Development Effectiveness Review 2016Accelerating the pace of change
Annual review
African Development Bank Group

ACKNOWLEDGEMENTS
This sixth edition of the Annual Development Effectiveness Review of the African Development Bank (AfDB) is the product of strong collaboration on the part of staff from most of AfDB’s departments. Olivier Shingiro was the task manager of this report, and Augustin Kouadio Adom, Helmi Hmaidi, and Chimwemwe Nyirenda, provided valuable statistical support. We would like to recognise, Stefan Atchia, Samuel Blazyk, Cyril Blet, Andral Charly, Mbarack Diop, Al Hamndou Dorsouma, Dana Elhassan, Nathalie Gisabo Gahunga, Caroline Jehu-Appiah, Justus Joseph Kabyemera, Benedict Kanu, Patience Kuruneri, William Mala, Rhoda Mshana, Brian Mugova, Ihcen Naceur, Maimuna Nalubega, Emily Nwankwo, Armand Nzeyimana, Elise Ouattara, Audrey Rojkoff, Carina Sugden, Frederik Teufel, Pepin Cyriaque Vougo, and Colette Walendom.
We especially acknowledge the contributions of chief writer Andrew Johnston, graphic designer Nadim Guelbi (Créon Design), and editor Patricia Rogers, all consultants.
Frannie Leautier Senior Vice-President African Development Bank
Simon Mizrahi Director, Quality Assurance and Results Department African Development Bank
Victoria Chisala Manager, Quality Assurance and Results Department African Development Bank
Cover photo: The Bank is committed to increasing energy generation and access to energy by supporting the construction and rehabilitation of power plants. Our ambition is to increase not only the number of megawatts installed but also the number of people connected. Photo by Aurélien Gillier
© 2016 African Development Bank Group
All rights reserved. Published June 2016. Printed in Côte d'Ivoire.
African Development Bank Group Development Effectiveness Review 2016
The views expressed in this book are those of the authors and do not necessarily reflect the views and policies of the African Development Bank (AFDB), its Board of Governors, its Board of Directors or the governments they represent.
AfDB and its Board of Directors do not guarantee the accuracy of the data included in this publication and accept no responsibility for any consequence of their use.
By making any designation of or reference to a particular territory or geographic area, or by using the term “country” in this document, AfDB does not intend to make any judgments as to the legal or other status of any territory or area.
AfDB encourages printing or copying information exclusively for personal and non-commercial use with proper acknowledgment of AfDB. Users are restricted from reselling, redistributing, or creating derivative works for commercial purposes without the express, written consent of AfDB.
Note: In this report, “$” refers to US dollars.
African Development Bank Group
Avenue Joseph Anoma - 01 B.P. 1387 Abidjan 01, Côte d’Ivoire Phone: (+225) 20 26 10 20 • Fax: (+225) 20 21 31 00
www.afdb.org

ContentsAbbreviations v
Foreword 1Executive summary 3Introduction 11
Part 1: AfDB’s vital role in Africa’s transformation 13
Chapter 1 Light up and power Africa 14Meeting the African energy challenge 14Light up and power Africa: the Bank’s contribution 16Looking ahead: The New Deal on Energy for Africa 18
Chapter 2 Feed Africa 19African agriculture has enormous potential to drive growth and prosperity 19AfDB support for African agriculture 21Looking forward 23
Chapter 3 Industrialise Africa 25Industry can unlock Africa’s huge economic potential 25The Bank’s role in Africa’s industrial transformation 28Looking forward: What will it take to industrialise Africa? 29
Chapter 4 Integrate Africa 31Realising Africa’s potential: what integration could achieve 31The Bank’s ongoing role in integrating Africa 33Looking forward: Realising the potential of integration to improve Africans’ lives 34
Chapter 5 Improve the quality of life for the people of Africa 36Improving access to basic services and employment opportunities 36The Bank’s contribution to improving Africans’ quality of life 38Strategic cross-cutting issues 40Looking forward 44
Part 2: AfDB’s performance as a development institution 47
Chapter 6 Quality of Bank operations 49Strengthening results at the country level 49Delivering effective and timely operations 51Designing gender- and climate-informed operations 54Looking forward 55
Chapter 7 The organisation’s efficiency 56Decentralisation: sustaining gains 56Human resources: ensuring motivated and high-calibre staff 56Value for money: improving cost-efficiency 59Looking forward 60
Conclusion and outlook 63
Conclusion and outlook 64 Annexes 67

Contents
List of boxes
Box 1 Providing solar energy to people at the “bottom of the pyramid” 15
Box 2 AfDB support helps Morocco realise huge solar projects 17
Box 3 The New Deal on Energy underpins all the other High 5s 18
Box 4 Climate-smart approach to land management 22
Box 5 Boosting horticultural exports and incomes in Ghana 23
Box 6 Financing industrialisation in South Africa 28
Box 7 An optical fibre backbone in central Africa 34
Box 8 Supporting flood-resilient cities 39
Box 9 Supporting inclusive growth and the strengthening of food security 42
Box 10 Addressing fragility in Lake Chad Basin 43
Box 11 2015: Record year for Bank project approvals 53
Box 12 Togo: improving sustainability of projects 54
Box 13 African Development Bank to triple annual climate financing to nearly $5 billion by 2020 55
Box 14 Towards a new way of doing business 55
Box 15 Assessing the effectiveness of the Bank’s Regional Resources Centres 56
Box 16 Good practice in Morocco field office for smooth project implementation 57
Box 17 Five foundations support the redesign of our organisation 60
List of figures
Figure 1 The Bank’s Results Measurement Framework 11
Figure 2 Universal access to electricity by 2025 means doubling grid generation capacity 17
Figure 3 Moving up in the coffee value chain 22
Figure 4 Manufacturing exports are increasingly regional, and help Africa withstand economic shocks 26
Figure 5 Real manufacturing production is increasing despite a fall in Africa’s share of manufacturing in GDP 27
Figure 6 Driving integration in East Africa 34
Figure 7 Ethiopia: how a changing age structure can lead to economic growth 37
Figure 8 Beyond basic education in Kenya 38
Figure 9 Countries most vulnerable to climate change have also low level of readiness 43
Figure 10 Strengthening results at country level 49
Figure 11 Preparing high-quality operations 51
Figure 12 Ensuring strong portfolio performance 52
Figure 13 Learning from our operations 53
Figure 14 Designing gender- and climate-informed operations 54
Figure 15 Decentralisation 56
Figure 16 Human resources 57
Figure 17 Value for money: improving cost efficiency 59
List of tables
Table 1: How well AfDB manages its operations (Level 3) 50
Table 2: How efficient AfDB is as an organisation (Level 4) 58

Abbreviations
ADF African Development Fund
AfDB African Development Bank
CPIA Country Policy and Institutional Assessment
CPPR Country Portfolio Performance Review
CSP Country Strategy Paper
ESW Economic and sector work
GDP Gross domestic product
ICT information and communication technology
IMF International Monetary Fund
IT information technology
PCR Project Completion Report
RMF Results Measurement Framework
SME small and medium enterprise
UA Units of Account
UN United Nations
USD United States dollars
Weights and measures
CO2 Carbon dioxide
ha hectares
kg kilograms
km kilometres
km2 square kilometre
kWh kilowatt hour
m3 cubic metres
MW megawatts
Annual D
eve
lopm
ent Effe
ctiveness R
evie
w 2
016
v
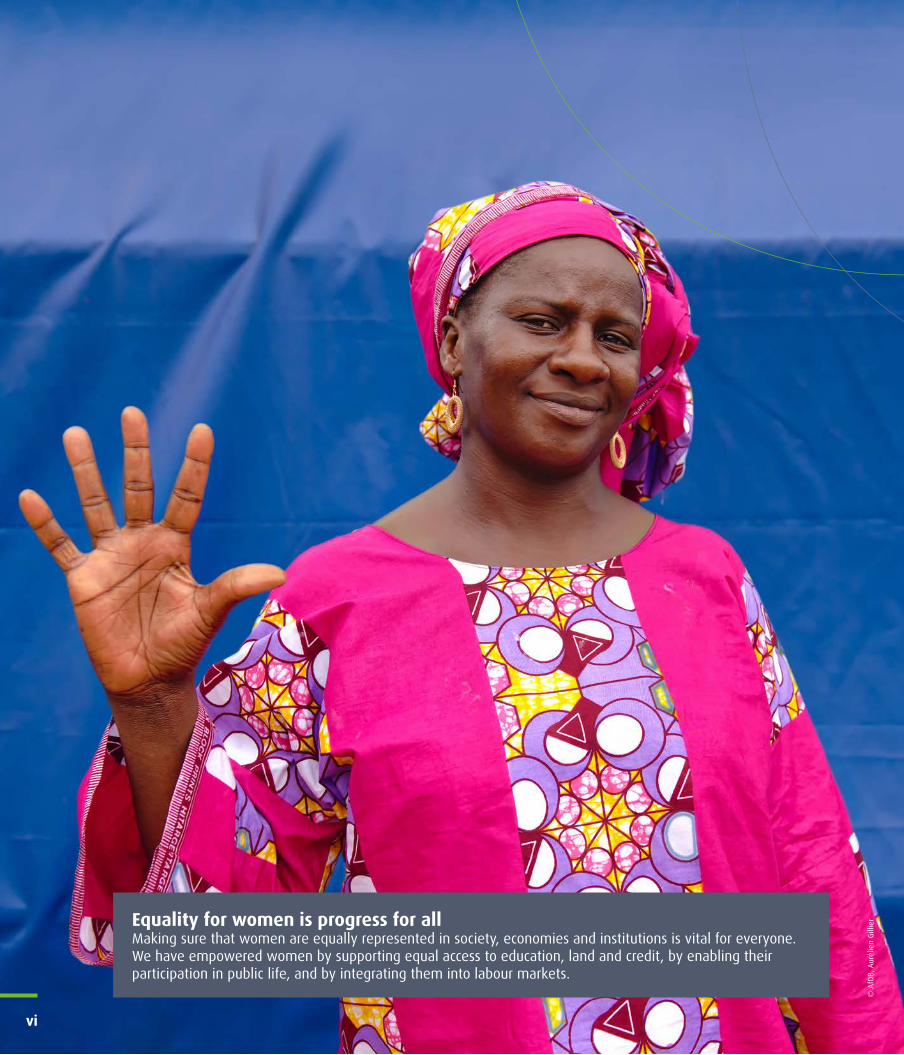
Equality for women is progress for allMaking sure that women are equally represented in society, economies and institutions is vital for everyone. We have empowered women by supporting equal access to education, land and credit, by enabling their participation in public life, and by integrating them into labour markets.
© A
fDB,
Aur
élie
n G
illie
r
vi
This year’s Annual Development Effectiveness Review (ADER) takes a fresh look at what Africa needs most: a massive, concerted, ambitious effort to accelerate the pace of change. The African Development Bank’s Ten-Year Strategy outlines the structural transformation that can help the continent prosper; to get there more quickly, we have
sharply focused the Bank’s work around five top priorities. We call them the “High 5s”: Light Up and Power Africa; Feed Africa; Industrialise Africa; Integrate Africa; and Improve the quality of life for the people of Africa.
The Bank is concentrating on energy for very good reasons. Lack of electricity is the greatest hindrance to Africa's growth and development. The Bank has launched the New Deal on Energy to “Light up and power Africa”, and the Transformative Partnership on Energy for Africa to work with partners to address this challenge.
We are reorganising ourselves to deliver on our High 5 priorities. A new business model of the Bank has been approved by the Board of Directors. The Bank has established new Vice Presidencies on Power, Energy and Green Growth; on Agriculture, Human and Social Development; and on the Private Sector, Infrastructure and Industrialisation. Our new Jobs for Africa’s Youth Initiative is designed to increase employment and hence reduce poverty, inequality, and economic and conflict-driven migration.
To deliver on the High 5s, make the Bank more efficient and execute our operations more quickly, we are moving closer to our clients by establishing five regional integration and business delivery offices. Our business process improvements will be an ongoing exercise. To achieve its ambitious goals, the Bank has to be a learning organisation committed to improving its operations continuously.
We have been delighted with the overwhelming support for the High 5s across every African country. Africa’s leaders and Africa’s people acknowledge that with 500 million people living in poverty, 635 million lacking access to electricity and climate change threatening livelihoods, Africa cannot afford to have low ambitions.
To realise these ambitions, we need to track our progress methodically and transparently, so that member countries, partners and other stakeholders across the continent have accurate information about our performance. That’s why this year we have revamped the ADER – our key monitoring and tracking tool — to give greater attention to Africa’s fundamental challenges and how the Bank is addressing them. We keep our operations under constant scrutiny to ensure that we are moving in the right direction and doing our very best to serve the people of Africa.
As African countries face the need to diversify their economies and mobilise domestic resources, they require greater support than ever. The Bank is here to give that support — and to draw in assistance for Africa from all around the world. We know that none of the ambitious objectives we have set out for ourselves will be achieved overnight. But we are confident that together we can achieve our vision of a prosperous Africa.
Foreword
1
Accelerating the pace of change
Annual D
eve
lopm
ent Effe
ctiveness R
evie
w 2
016
Akinwumi Ayodeji Adesina
President, African Development Bank Group
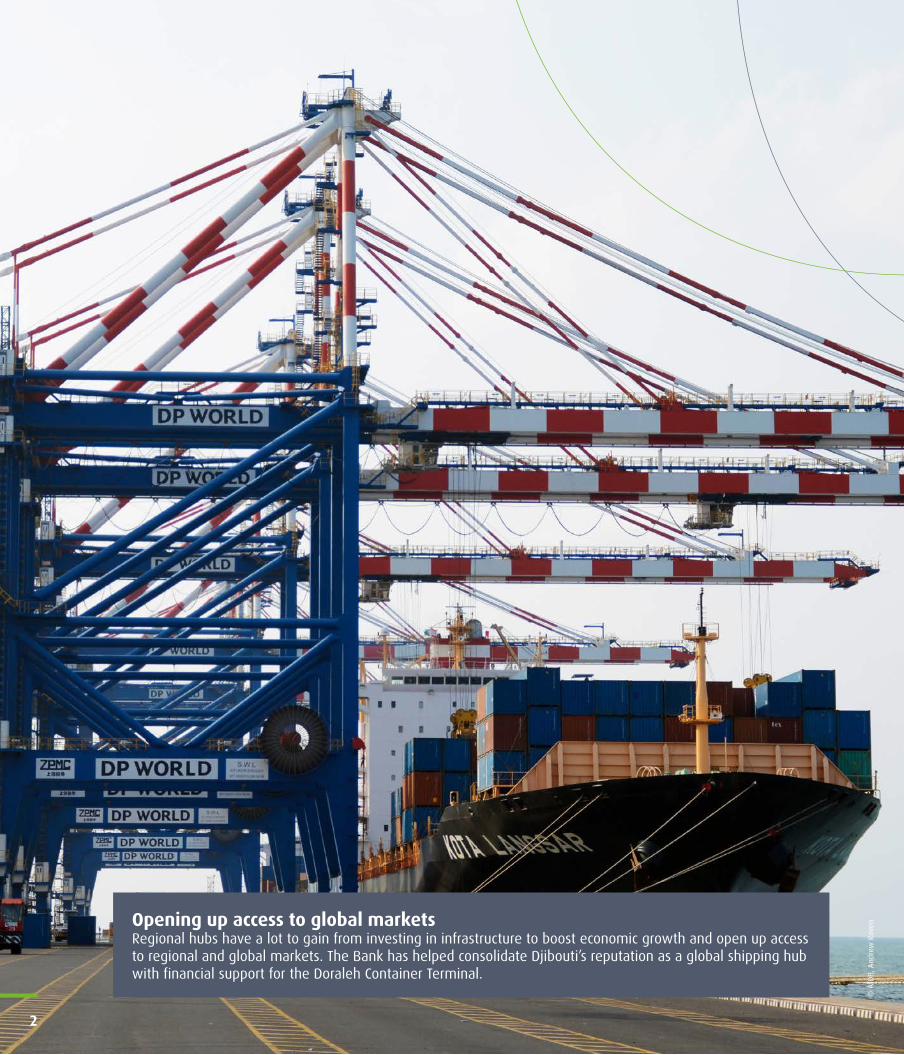
Opening up access to global marketsRegional hubs have a lot to gain from investing in infrastructure to boost economic growth and open up access to regional and global markets. The Bank has helped consolidate Djibouti’s reputation as a global shipping hub with financial support for the Doraleh Container Terminal.
© A
fDB,
And
rew
Rav
en
2
Executive summary
The Annual Development Effectiveness Review (ADER) examines development trends in Africa, assesses the impact of the African Development Bank (AfDB, or the Bank) and outlines opportunities and risks that lie ahead. The ADER enables us to measure our performance and identify areas where we need to enhance our efforts.
Drawing on data from a wide range of sources, the ADER reports on progress in achieving the Bank’s Ten-Year Strategy. It evaluates the Bank’s past results and performance according to our four-level Results Measurement Framework (RMF).
This year’s ADER marks the beginning of a new era for the Bank, with a new president and a sharpened focus on an interlocking set of critical priorities within the Bank’s Ten-Year Strategy. We call them the “High 5s”: Light up and power Africa, Feed Africa, Industrialise Africa, Integrate Africa, and Improve the quality of life for the people of Africa. These priorities are crucial for advancing Africa’s development, accelerating the structural transformation that Africa needs, and meeting the objectives of our Ten-Year Strategy.
ADER 2016 is structured around these vital issues, while maintaining the indicators and targets of the existing RMF. In Part 1 of the report, each chapter focuses on one of the High 5s, examining Africa’s progress and challenges (Level 1 of the RMF) and weighing the contribution that the Bank is making (Level 2). In Part 2 of the report, Chapter 6 focuses on the Bank’s performance in managing its portfolio (Level 3 of the RMF) and Chapter 7 on the Bank’s organisational efficiency (Level 4).
As well as using the indicators and targets of the existing RMF to gauge the Bank’s impact, ADER 2016 examines the immediate prospects for African development. By combining Level 1 and Level 2 of the RMF within each chapter in Part 1, we can better explain the connections between Africa’s key developmental challenges and the action the Bank is taking to address them.
Light up and Power Africa To grow and prosper, Africa needs modern energy systems that provide an adequate, affordable supply of power to every home, business and service provider. Energy is also crucial for achieving the AfDB’s other development objectives. But despite 15 years of economic growth, Africa’s energy systems are still grossly inadequate.
Access to electricity rose from 40% in 2010 to 43% in 2013, but about 635 million people still live without electricity. Access to clean, non-polluting cooking facilities is even more restricted. Almost four in five people rely for cooking on solid biomass. These energy-sector bottlenecks and power shortages have a deep economic impact on the region. They cost 2–4 percent of GDP annually, undermining job creation and investment.
Africa’s energy opportunity — Africa’s energy deficits stand in stark contrast to the region’s potential. Africa has abundant reserves of fossil fuels and an even greater abundance of renewable energy assets. The continent has more than half of the world’s renewable energy potential. Rising demand for energy makes it imperative for policymakers to develop Africa’s resources for Africa’s needs. Over the next 20 years, renewable energy generation should rise to account for nearly 49% of total energy generation in Africa, up from just 17% in 2013. Developing this potential requires a strong package of policy measures, including active government support for energy efficiency and the elimination of fossil fuel subsidies.
The challenge is not predominantly the technical one of greatly expanding the generation capacity; it is orienting policy to deliver electricity to those who need it most. Ambition is not merely about the number of megawatts installed, but the number of people reached. Distributed, clean energy interventions are best suited to tackling energy poverty — and poverty more generally.
The Bank’s contribution — We are demonstrating our commitment to increasing energy production and access through our support for construction and rehabilitation of power generation plants. In the period 2013–2015, the Bank’s investments provided almost 4 million people with improved access to electricity. We helped install 1422 MW of new electricity capacity, of which 72 MW was renewable.
The New Deal on Energy for Africa underpins all the other High 5s. Through this initiative, the AfDB is working in partnership with all
These energy-sector bottlenecks cost 2–4 percent of GDP annually, undermining job creation and investment
Annual D
eve
lopm
ent Effe
ctiveness R
evie
w 2
016
3
Executive summary
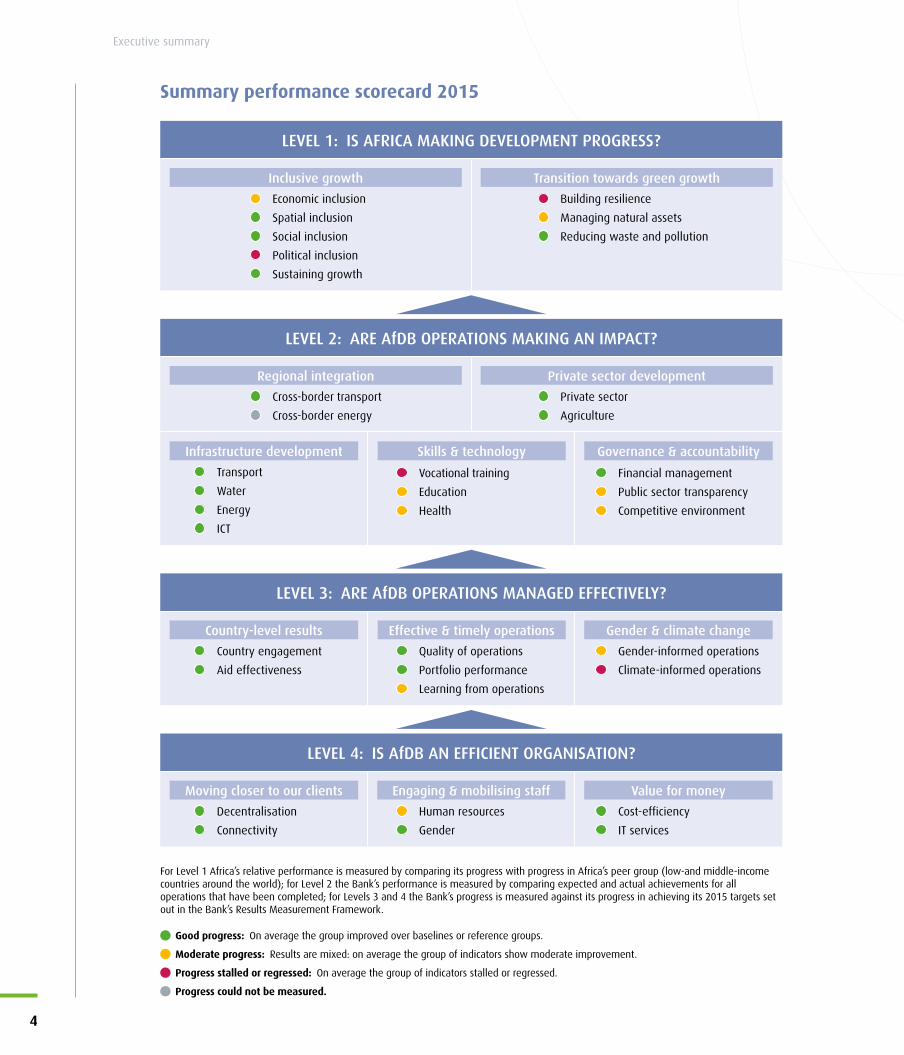
Summary performance scorecard 2015
For Level 1 Africa’s relative performance is measured by comparing its progress with progress in Africa’s peer group (low-and middle-income countries around the world); for Level 2 the Bank’s performance is measured by comparing expected and actual achievements for all operations that have been completed; for Levels 3 and 4 the Bank’s progress is measured against its progress in achieving its 2015 targets set out in the Bank’s Results Measurement Framework.
Good progress: On average the group improved over baselines or reference groups.
Moderate progress: Results are mixed: on average the group of indicators show moderate improvement.
Progress stalled or regressed: On average the group of indicators stalled or regressed.
Progress could not be measured.
LEVEL 2: ARE AfDB OPERATIONS MAKING AN IMPACT?
Transport
Water
Energy
ICT
Private sector
Agriculture
Cross-border transport
Cross-border energy
Vocational training
Education
Health
Financial management
Public sector transparency
Competitive environment
Infrastructure development
Private sector developmentRegional integration
Skills & technology Governance & accountability
LEVEL 1: IS AFRICA MAKING DEVELOPMENT PROGRESS?
Economic inclusion
Spatial inclusion
Social inclusion
Political inclusion
Sustaining growth
Building resilience
Managing natural assets
Reducing waste and pollution
Inclusive growth Transition towards green growth
LEVEL 3: ARE AfDB OPERATIONS MANAGED EFFECTIVELY?
Country-level results Gender & climate changeEffective & timely operations
Country engagement
Aid effectiveness
Gender-informed operations
Climate-informed operations
Quality of operations
Portfolio performance
Learning from operations
LEVEL 4: IS AfDB AN EFFICIENT ORGANISATION?
Moving closer to our clients Engaging & mobilising staff Value for money
Decentralisation
Connectivity
Human resources
Gender
Cost-efficiency
IT services
4
Executive summary
stakeholders to unify efforts to achieve universal access to energy in Africa. Our new Energy Strategy sets out the priorities for the Bank’s interventions in the energy sector from 2016 to 2025. The strategy aims to help transform Africa’s energy sector by increasing energy production, scaling up energy access, improving affordability, reliability and energy efficiency, and improving the sustainability of energy systems.
Feed Africa More than 70% of Africans depend for their livelihoods on agriculture, which contributes 15 percent of GDP. If its full potential were unlocked, agriculture could vastly improve the lives of millions of Africans — creating jobs, increasing prosperity and reducing hunger. Much of this potential remains untapped, however, and productivity is low, contributing to persistent poverty and deteriorating food security.
Africa has more undeveloped arable land than any other region, equivalent to 25% of the world’s fertile land, yet food insecurity and malnutrition are persistent. In 2015, 24.6% of the population was at risk of food insecurity. While this is an improvement on 33% in 2000, in the face of a growing population the rate of progress is not enough.
Low levels of agricultural productivity trap millions of farmers in poverty and act as a brake on growth. Between 2001 and 2008, overall GDP in Africa grew 6% annually but agricultural GDP grew by only 3.4% a year. Principal challenges to agricultural transformation in Africa include: limited use of modern agro-inputs and mechanisation; limited access to credit; poor access to markets; and a lack of gender inclusiveness.
AfDB support for African agriculture — The Bank is committed to improving food security and rural livelihoods by tackling the most important constraints on agricultural productivity. Our projects are demonstrating the potential of agriculture to create decent jobs. We are also helping to promote more sophisticated value chains by linking farmers to agri-businesses.
We have supported African governments in integrating climate resilience into their plans and policies. Climate-smart approaches preserve soil fertility and strengthen the climate resilience of the agriculture sector, including crop production, livestock, aquaculture and fisheries.
Since 2013, 17.4 million people have benefited from improvements in agriculture supported by the Bank. Our projects have enhanced water management across 137 000 hectares of land, and 1.2 million people in rural areas used improved technology in agriculture.
Although the Bank has made some substantial investment in this sector, we recognise that this has not been enough to achieve the substantial transformation required for a strong, sophisticated agricultural sector. Our agricultural operations will now be framed within a more business-oriented approach, based on a deeper understanding of the obstacles, potential and investment opportunities right across the sector, from the supply of inputs to the final point of retail.
The Bank demonstrated its commitment to agriculture at the Feeding Africa conference held in October 2015 in Dakar. The conference led to an 18-point action plan to accelerate investment in agribusiness, including a new facility at the Bank to provide funding and guarantees to African women in agribusiness, as well as projects tackling youth unemployment.
Industrialise AfricaAfrica’s recent growth has been strong, but a persistent lack of industrialisation is holding back Africa’s economies, which remain largely dependent on sectors like agriculture and unprocessed commodities that add relatively little value.
Africa's share of global manufacturing exports remains less than 1%, compared with over 16% for East Asia. From 1975 to 2014, the African manufacturing sector’s contribution to the continent’s total economy actually declined from 18% to 11%, leaving it with the smallest share of any developing region. However, in absolute terms industrialisation is growing. Manufacturing production has increased, from $73 billion in 2005 to $98 billion in 2005 prices in 2013, due to strong growth in parts of Africa, domestic policy and institutional improvements, and rising wages in China.
If Africans are to enjoy a higher standard of living, Africa needs to improve its economic performance. Today, the economies of African countries are facing several structural challenges: they rely on low value-adding activities; investment in education and skills development is insufficient; they import far more manufactured goods than they export; they remain dependent on limited value-added commodities; and their trade balance in manufactured goods is deeply negative.
In 2015, 24.6% of the population was at risk of food insecurity
Since 2013, 18 million people have benefited from improvements in agriculture supported by the Bank
Although Africa's share of global manufacturing exports remains less than 1%, industrialisation is growing in absolute terms
Annual D
eve
lopm
ent Effe
ctiveness R
evie
w 2
016
5
Executive summary

Africa also desperately needs more infrastructure investments in order to support industrialisation. We need roads, rail and ports to open up access to regional and global markets. Access to finance, currently one of the main obstacles to doing business in Africa, needs to be improved to enable enterprises to move up value chains. Only 31% of adults have access to an account at a bank or other financial institution.
The Bank’s role in Africa’s industrial transformation — In the period 2013–2015, the AfDB’s support to private sector development has created more than 3 million jobs, of which almost 812 000 were for women. A total of 153 000 microcredits were granted, while 5.7 million people benefited from investee projects and microfinance. Our support was focused on promoting enterprise development and helping to improve the business environment.
The experience of other industrialising economies around the world shows that Africa can realistically more than double its industrial GDP from $751 billion to $1.72 trillion within the next decade. This in turn would enable Africa to raise its continental GDP from $2.6 trillion to $5.62 trillion and its GDP per capita to $3368 by 2025.
For this to happen, Africa needs to implement a comprehensive and resolute industrial policy; one that can be adjusted for each country’s context, requirements and development goals. Lessons from countries that have rapidly industrialised their economies highlight five key enablers: supportive policy, legislation and institutions; conducive economic environment and infrastructure; access to capital; access to markets; competitive talents, capabilities, and entrepreneurship.
Industrialising Africa and driving progress on each of the five enablers outlined above will require combined and coordinated efforts by a wide range of stakeholders, both public and private. The Bank, as the premier financing institution on the continent, can and should play a leading role in the “Industrialise Africa” agenda.
While it will intervene along with its partners in all identified programmes, the Bank plans to place a stronger focus on areas where it can best leverage its experience, capabilities and its finances to support countries by championing a subset of these programmes, grouped into the six “Flagship Programmes”, which are at the core of the Bank’s “Industrialise Africa” priority. Over the next 10 years, the Bank will invest $3.5 billion per year through direct financing and leveraging to implement the six programmes.
Integrate AfricaThe Bank is focusing its integration efforts not just on movement of goods and services but also on mobility of people and investment. Enabling people to move freely across borders in Africa will give a powerful boost to economic growth. When capital flows more freely across borders, investment increases, finance is allocated where it can generate the most productivity, and investors get higher returns.
Inter-African trade increased from $145 billion in 2014 to $174 billion in 2015. Yet only 11.3% of trade in Africa is intra-regional and exports remain skewed towards raw minerals. Intra-African imports as a share of the continent’s GDP rose from around 2.7% in 1995 to around 4.5% in 2013, but this is low compared with regions such as the Americas (6.7%), Asia (17.9%) and Europe (21%). The cost of trading across borders, measured as the cost of shipping a container, has also increased by 11% since 2010, to $2384.
Numerous initiatives are under way to remedy this situation and unlock the power of regional trade to drive the economic transformation that Africa needs. In June 2015, two key shifts in Africa’s trade integration occurred: the Tripartite Free Trade Area Agreement was signed and the Continental Free Trade Area negotiations were formally launched.
Africa is employing innovative methods to raise infrastructure finance and to drive forward strategic infrastructure projects, including cross-border transport, communications and pipeline projects. Africa’s road density (length of road per square kilometre) has increased since 2010 from 7.9 km to 8.2 km, but this only represents 30% of Asia’s road density. Telephone communication is growing much faster: more than 76% of Africans now have access to telephone services, the majority are mobile connections.
Regional hubs, as well as small or landlocked countries, have a lot to gain from promoting infrastructure to boost economic growth. Both traditional and new funding partners are continuing to invest in Africa’s infrastructure at regional level. To power the continent’s energy needs and build first-class networks, regions and countries need to encourage stronger ownership and involve the private sector.
To promote the goal of the African Union’s Agenda 2063 to abolish visa requirements for all African citizens in all African countries, the Bank has developed the Africa Visa Openness Index.
The Bank’s approach to fostering free movement of people focuses on economic and sector work on migration and remittances; leveraging remittances for development; initiatives to reduce the cost of remittance services; supporting mutual recognition of skills and qualifications; and supporting mechanisms to facilitate movement of business people.
The Bank’s Regional Integration Policy and Strategy (2014–2023) acknowledges the opportunities provided by regional integration in boosting infrastructure, trade, industrialisation and movement of people. Overall, as a result of our projects, 1281 km of cross-border roads were constructed or rehabilitated between 2013 and 2015, close to our target.
Enabling people to move freely across borders in Africa will give a powerful boost to economic growth
6
Executive summary

As part of the “Integrate Africa” priority, the Bank will foster regional integration through the Programme for Infrastructure Development in Africa. This includes developing regional energy markets, transnational railways and highways to link countries’ economic activities.
Improve the quality of life for the people of Africa While economic growth has been relatively strong, it has not been rapid or inclusive enough to create jobs and improve quality of life. By some estimates, more than half of Africa’s youth are unemployed, underemployed or inactive. Health and education outcomes are among the lowest in the world and the continent’s population has insufficient access to sanitation and safe drinking water.
The AfDB is focusing its investments on education, vocational training and skills development. We will also continue to invest in improving access to basic services such as water and sanitation. The Ebola crisis was a wake-up call for the continent and the Bank: we must invest heavily in public health care systems in order to build Africa’s resilience in the face of health epidemics and emergencies.
We are committed to building up the availability of technical skills so that African economies can realise their full potential in high-technology sectors. Through our work in education, science and technology, 18 000 teachers and other educational staff were recruited or trained. Overall, more than 1.1 million people benefited from better access to education.
Expanding access to clean water and better sanitation is a strategic priority for the Bank. Overall, our projects created 116 000 m3 of drinking water capacity. During 2013–2015 more than 6.1 million people benefited from improved access to water and sanitation as a result of our projects. And overall, during the last three years, we provided 44 million people with access to better health services.
Strategic cross-cutting issues — Scaling up implementation in the five priority areas of the Ten-Year Strategy will be possible only if critical cross-cutting areas such as gender, governance, fragility and climate change are brought fully into the mainstream of the Bank’s operations to achieve greater impact creating jobs and reducing poverty.
Equality for women is progress for all. Better inclusion of women in institutional, social and economic matters is an important goal in its own right. It is also a key driver of economic competitiveness. In Africa, women’s participation in the labour market has remained
stagnant for several years at 42.5%, indicating that much more needs to be done to improve the participation of women.
Governance progress has been slow, except in political participation. We have achieved our strongest results recently in quality of public administration, and budgeting and financial management. Of countries in which the Bank has supported relevant reforms, 100% improved their public administration and 94% their financial management.
More than 250 million people in Africa live in countries that are affected by conflict and fragility. The Bank approaches fragility by applying a “fragility lens” to guide its strategic and operational engagement. In implementing the five high-priority areas, the Bank continues to champion interventions that are fragility-proofed.
To make sure all our investments support climate change objectives, we screen our projects for climate risk and build resilience into project design through the Climate Safeguards System. Our work in this area covers agriculture, water, transport and energy.
At the UN climate change conference in Paris in December 2015, the AfDB provided support to the African Group of Negotiators, the African Ministerial Conference of the Environment, and the Committee of African Heads of State and Government. The African Group of Negotiators went to Paris with two initiatives that would contribute to achieving the expected outcomes of the Paris Agreement: the Africa Renewable Energy Initiative and the Africa Adaptation Initiative.
In Paris, the AfDB and other multilateral development banks pledged to increase our climate finance and to support the outcomes of the conference through 2020. The Bank will nearly triple its annual climate financing to reach $5 billion a year by 2020. This will represent an increase to 40% of our total new investments by 2020.
Quality of Bank operations We strive to continually improve the design and supervision of our projects, so that they make the best possible contribution to our goals of promoting inclusive and green growth. We want our projects to deliver better results and to deliver them more quickly.
More than 1.1 million people benefited from better access to education
The Bank will nearly triple its annual climate financing to reach $5 billion a year by 2020
In implementing the five high-priority areas, the Bank continues to champion interventions that are fragility-proofed
Annual D
eve
lopm
ent Effe
ctiveness R
evie
w 2
016
7
Executive summary

During 2015, 99% of our new operations were rated satisfactory, above our target of 95%. The time taken to approve our operations remained stable at 6.3 months in 2015, close to our target of 6 months. In recent years, the Bank has made considerable progress in reducing delays for first disbursements — from an average of 21 months in 2007 to 10.6 months in 2014. However, in 2015 the Bank regressed in the time to first disbursement for new projects, which increased to 12 months, above our target of 11 months.
By measuring the pace at which the Bank makes resources available to clients, we monitor the speed with which the Bank implements its portfolio of projects. In 2015 our overall disbursement ratio stood at 21% — just below our target of 23%. Another measure of efficiency is the average time for procurement of goods and services, from bid reception to contract signature. During 2015, it improved from 9 to 7.9 months, slightly above the target.
However, the share of operations eligible for cancellation has increased to 19% from 13% in 2014, well above the target of 7%. These are operations that have lapsed or are not performing; they should be either redesigned or cancelled, and the resources reallocated to more productive operations. The Bank has begun implementing measures to ensure that loans and grants are signed in a timely manner and that non-disbursing projects are cancelled within reasonable periods in line with new guidelines.
The Bank is committed to minimising any negative social or environmental impacts of its projects by ensuring that the risks are carefully assessed and measures put in place to mitigate them. In 2015, 87% of our operations had satisfactory mitigation measures, an improvement on 2014 and above our target of 72%.
In 2015, 83% of completed operations were rated satisfactory — well above the target of 78% — and we achieved 90% of completed operations with sustainable outcomes, which was above our target.
Promoting gender equality and responding to climate change are among our cross-cutting priorities, which we aim to integrate into the design of operations wherever possible. Thus we assess all new projects for their contribution to gender equality and their response to climate change.
In 2015, the proportion of new projects with gender-informed design was 75%, compared with a target of 87%, while 61% of our projects had satisfactory gender-equality outcomes, below our target of 73%. We expect these results to improve. The Bank is introducing gender-marking to differentiate projects in terms of their likely contribution to gender equality goals.
In 2015, we delivered 75% of new projects with climate-informed design, below our target of 95%. While 90% of new projects are climate-proofed in of our ADF countries, our average including middle income countries is below our target of 95%. This is due to lower coverage of our private sector operations.
We are implementing a new business model that will expand the Bank’s business by moving it closer to its clients. This will improve the way the Bank delivers its services and increase the health of the organisation, guaranteeing its long-term performance and providing meaningful development impact for regional member countries. The objective is to improve service delivery by increasing responsiveness and client orientation, and shortening the project cycle.
The organisation’s efficiency The Bank Group’s priority in 2015 was to sustain the gains from implementation of the 2011-2015 Decentralisation Roadmap. Critical activities included learning lessons from a review of the two pilot Regional Resource Centres established in 2012 in Eastern and Southern Africa, and deciding on a third Regional Resource Centre in in North Africa.
During 2015, the Bank maintained its presence in 38 regional member countries while working on enhancing the delegation of authority to the offices in these countries. In term of performance, the share of projects managed from field offices increased from 51% in 2014 to 60% in 2015.
There was, however, a decrease in the share of operational staff based in field offices, from 50% in 2014 to 40.6% in 2015. The Bank is reviewing its decentralisation action plan to align it with the new business delivery model.
Ensuring motivated and high-calibre staff — The Bank’s return to its Headquarters in Abidjan was a major undertaking, requiring strong change management and business continuity planning. The return was accomplished successfully, with minimal disruption to the Bank’s business.
We are determined to increase the proportion of women in professional and management positions. In 2015, the percentage of women professional staff remained stable at about 27% of our professional staff, just below our target of 30%. The share of women management staff also remained stable at 30% in 2015.
Our staff balance is registering steady improvement. The share of our employees who are operations professional staff is already quite high at 67%, but we plan to increase it further. Our net vacancy rate for professional staff has been stable compared with 2014, at 16%, but above our target of 13%, given attrition and a freeze in recruitment during the Bank’s return to Headquarters.
After two years of case-by-case recruitment during the return to the Bank’s Headquarters, by the end of 2016 we will launch a
We are implementing a new business model that will expand the Bank’s business by moving it closer to its clients
8
Executive summary
recruitment plan that will reduce the time required to recruit new staff.
Value for money: improving cost-efficiency — The Bank is committed to maximising the value for money it delivers. We assess the extent to which the Bank has increased efficiency by reducing the administrative costs associated with disbursements. In 2015, because disbursements were below the expected targets, the Bank’s administrative costs per UA 1 million disbursed stood at UA 98 000, the same level as last year, well above the UA 85 000 target.
We also measure how well we manage our facilities, calculated as the total rental, maintenance, and utilities costs per seat. Our work environment cost per seat also increased in 2015, from UA 3300 to UA 3600, as result of increased costs related to the preparation for the Bank’s move to its Headquarters building.
We continue to focus on cost-effectiveness at the project level, tracking the costs of preparing and implementing our operations. The cost of supporting project implementation has decreased from UA 21 000 to UA19 000 — on target. However, the cost of preparing a lending project has increased from UA 74 000 in 2012 to UA 85 000 in 2015, above our target of UA 71 000.
Conclusion and way forwardThe Bank’s ambitions and operations are driven by Africa’s needs. The greatest need is for a structural transformation that will unlock the potential of the continent’s people and resources. Our High 5 priorities are the essential ingredients of that transformation: Light up and power Africa, Feed Africa, Industrialise Africa, Integrate Africa, and Improve the quality of life for the people of Africa.
The New Deal on Energy for Africa underpins all the other High 5s. Our new Energy Strategy aims to help transform Africa’s energy sector by increasing energy production, scaling up energy access, improving affordability, reliability and energy efficiency, and improving the sustainability of energy systems.
We are framing our agricultural operations within a business-oriented approach, based on a deeper understanding of the obstacles,
potential and investment opportunities right across the sector, from the supply of inputs to the final point of retail.
At the core of the Bank’s “Industrialise Africa” priority are six Flagship Programmes, chosen to represent areas where the AfDB can best leverage its experience, capabilities and its finances. Over the next 10 years, the Bank will invest $3.5 billion per year through direct financing and leveraging to implement the six programmes.
The Bank’s Regional Integration Policy and Strategy (2014–2023) acknowledges the opportunities provided by regional integration in boosting infrastructure, trade, industrialisation and movement of people.
In terms of lives and livelihoods, we are committed to building up the availability of technical skills so that African economies can realise their full potential in high-technology sectors. Acknowledging the urgent need to address climate change, the Bank will nearly triple its annual climate financing to reach $5 billion a year by 2020.
In scaling up our investments and implementation in the High 5s, we are also aiming to become more agile and responsive to the continent’s needs, and therefore have changed our business model. We are undertaking management and organisational changes to ensure closer alignment to these business priorities, enabling us to respond quickly to the needs of our clients, improving selectivity and operational effectiveness.
Overall, we aim to deliver on our commitment to maintain the institution as Africa’s premier financial institution and keep the institution relentlessly focused on results. Decentralisation is bringing us closer to our clients and our beneficiaries, making us better at listening and responding to their needs.
Stronger management practices and an increasingly sophisticated communications infrastructure are helping us operate as One Bank, while working with a decentralised structure. Finally, we will continue building on our partnerships and on our role as conveners and facilitators at the continental level. This will ensure that we deliver on our ambitious programme to support Africa’s transformation.
Annual D
eve
lopm
ent Effe
ctiveness R
evie
w 2
016
9
Executive summary
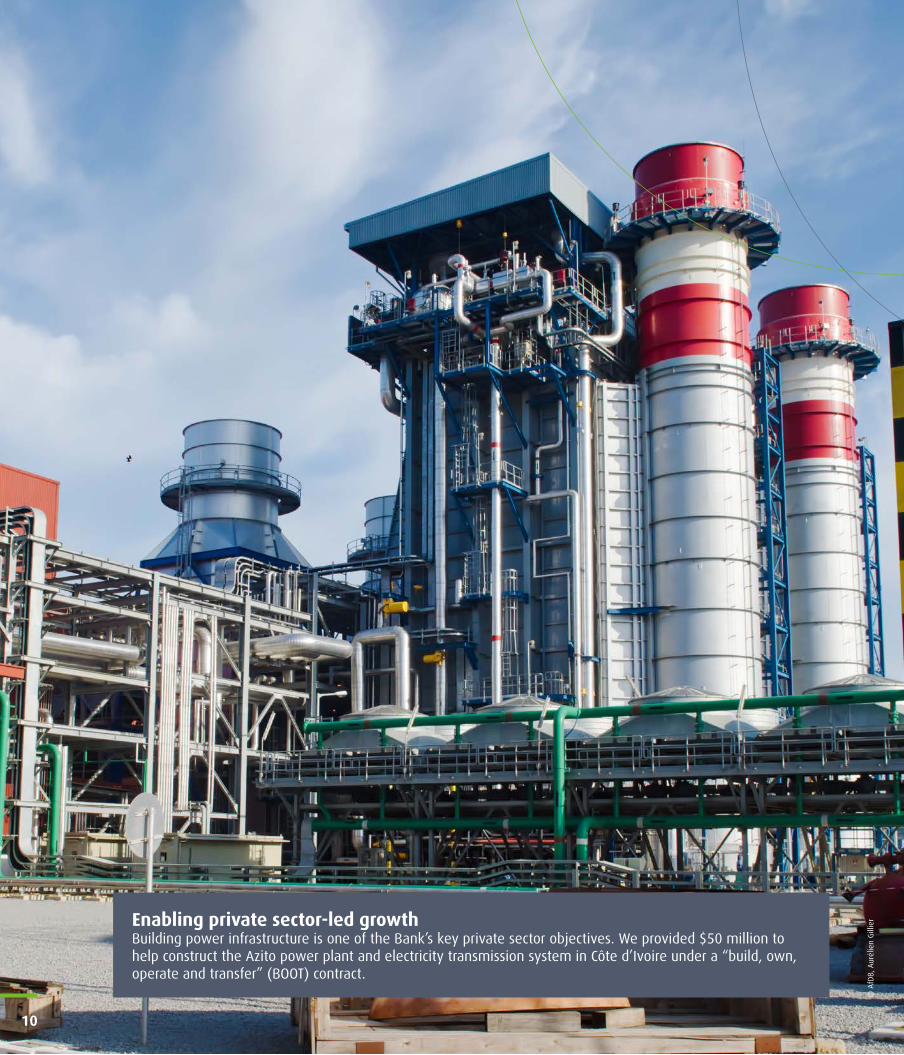
Enabling private sector-led growthBuilding power infrastructure is one of the Bank’s key private sector objectives. We provided $50 million to help construct the Azito power plant and electricity transmission system in Côte d’Ivoire under a “build, own, operate and transfer” (BOOT) contract.
© A
fDB,
Aur
élie
n G
illie
r
10

Introduction
Each year, the Annual Development Effectiveness Review (ADER) examines development trends in Africa, assesses the impact of the African Development Bank (AfDB, or the Bank) and outlines opportunities and risks that lie ahead. The ADER helps us to reflect on our performance and identify areas where we need to enhance our efforts.
In addition, as part of our commitment to being transparent and accountable across our operations, the ADER is written in a non-technical manner, so as to be accessible to our partners and stakeholders in Africa and beyond.
Drawing on data from a wide range of sources, the ADER reports on progress in achieving the Bank’s Ten-Year Strategy. It evaluates the Bank’s past results and performance according to our four-level Results Measurement Framework (RMF). A full list of indicators is presented in Annex 1.
This year’s ADER marks the beginning of a new era for the Bank, with a new president and a sharpened focus on an interlocking set of critical priorities within the Bank’s Ten-Year Strategy. We call them the “High 5s”: Light up and power Africa, Feed Africa, Industrialise Africa, Integrate Africa, and Improve the quality of life for the people of Africa. These priorities are crucial for advancing Africa’s development, accelerating the structural transformation that Africa needs, and achieving our Ten-Year Strategy.
ADER 2016 is structured around these vital issues, while maintaining the indicators and targets of the existing RMF. In Part 1 of the report, each chapter focuses on one of the High 5s, examining Africa’s progress and challenges (Level 1 of the RMF) and weighing the contribution that the Bank is making (Level 2). In Part 2 of the report, Chapter 6 focuses on the Bank’s performance in managing its portfolio (Level 3 of the RMF) and Chapter 7 on the Bank’s organisational efficiency (Level 4).
As well as using the indicators and targets of the existing RMF to gauge the Bank’s impact, ADER 2016 examines the immediate prospects for African development. By combining Level 1 and Level 2 of the RMF within each chapter in Part 1, we can better explain the connections between Africa’s key developmental challenges and the action the Bank is taking to address them. In Chapter 1, for example, we outline not only the scope and consequences of Africa’s energy deficit but also how the Bank’s investments have boosted electricity generation and provided almost 4 million people with improved access to electricity.
In 2016 the Bank will adopt a new Results Measurement Framework designed to capture Africa’s emerging challenges and the Bank’s new corporate priorities. It will focus on measuring how — and how well — the Bank can achieve the High 5 goals.
Figure 1 The Bank’s Results Measurement Framework
LEVEL 1 – WHAT DEVELOPMENT PROGRESS IS AFRICA MAKING?
LEVEL 2 – HOW WELL IS AfDB CONTRIBUTING TO DEVELOPMENT IN AFRICA?
LEVEL 3 – IS AfDB MANAGING ITS OPERATIONS EFFECTIVELY?
LEVEL 4 – IS AfDB MANAGING ITSELF EFFICIENTLY?
Annual D
eve
lopm
ent Effe
ctiveness R
evie
w 2
016
11
Introduction

Unlocking the potential of Africa’s young peopleWe invest in Africa’s youth to build skills and encourage entrepreneurship, while providingaccess to the financial resources they need to unleash the power of their enterprises. The Bank supports vocational schools in Kenya, for example, helping tackle the country’s youth unemployment crisis.
© A
fDB,
And
rew
Rav
en
12

Annual D
eve
lopm
ent Effe
ctiveness R
evie
w 2
016
13
PART 1:
AfDB’s vital role in Africa’s transformationThe African Development Bank remains optimistic about the continent’s prospects. Africa is dynamic and resilient. In Part 1 of the report, we examine the factors that have built that resilience, the obstacles that persist and the policy actions required to overcome those obstacles.
Now, more than ever, the Bank is committed to pursuing its objectives of ensuring that Africa achieves inclusive growth and helping it make the transition to green growth, in line with the overarching priorities of our Ten-Year Strategy.
In this part of the report we focus on five critical areas of the Ten-Year Strategy, the High 5s: Light up and power Africa, feed Africa, industrialise Africa, integrate Africa and improve the quality of life for the people of Africa. In each of the five chapters we examine Africa’s progress and challenges (Level 1) and the Bank’s contribution (Level 2) in these key areas.
This part uses 32 indicators from Level 1 of the One Bank Results Measurement Framework to show performance in 2015, with traffic light symbols to indicate how African countries have progressed compared with other developing countries.
We also report on the Bank’s contribution to Africa’s development in the period 2013–15, using 36 indicators from Level 2 of the same framework. Traffic light symbols show whether we reached or fell short of our targets. In addition, this part sets out some of our plans and targets for the next three years.
Chapter 1
Light up and power Africa
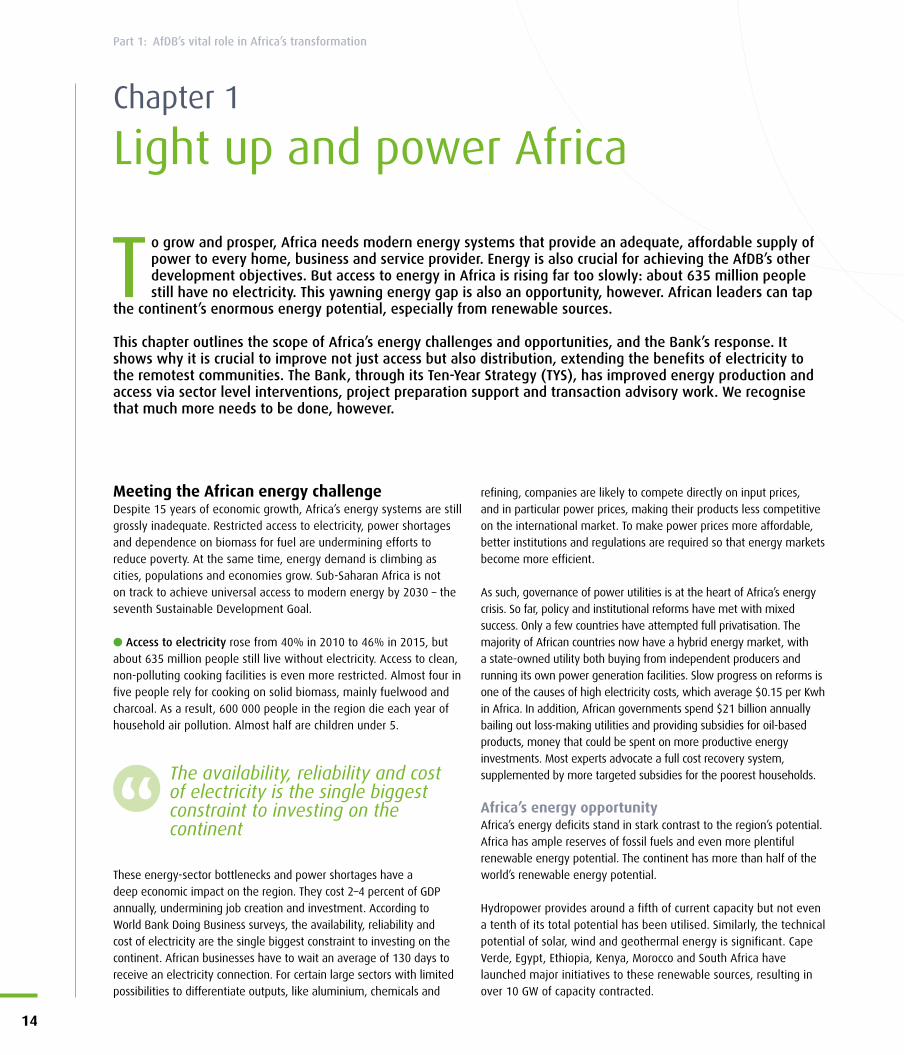
To grow and prosper, Africa needs modern energy systems that provide an adequate, affordable supply of power to every home, business and service provider. Energy is also crucial for achieving the AfDB’s other development objectives. But access to energy in Africa is rising far too slowly: about 635 million people still have no electricity. This yawning energy gap is also an opportunity, however. African leaders can tap
the continent’s enormous energy potential, especially from renewable sources.
This chapter outlines the scope of Africa’s energy challenges and opportunities, and the Bank’s response. It shows why it is crucial to improve not just access but also distribution, extending the benefits of electricity to the remotest communities. The Bank, through its Ten-Year Strategy (TYS), has improved energy production and access via sector level interventions, project preparation support and transaction advisory work. We recognise that much more needs to be done, however.
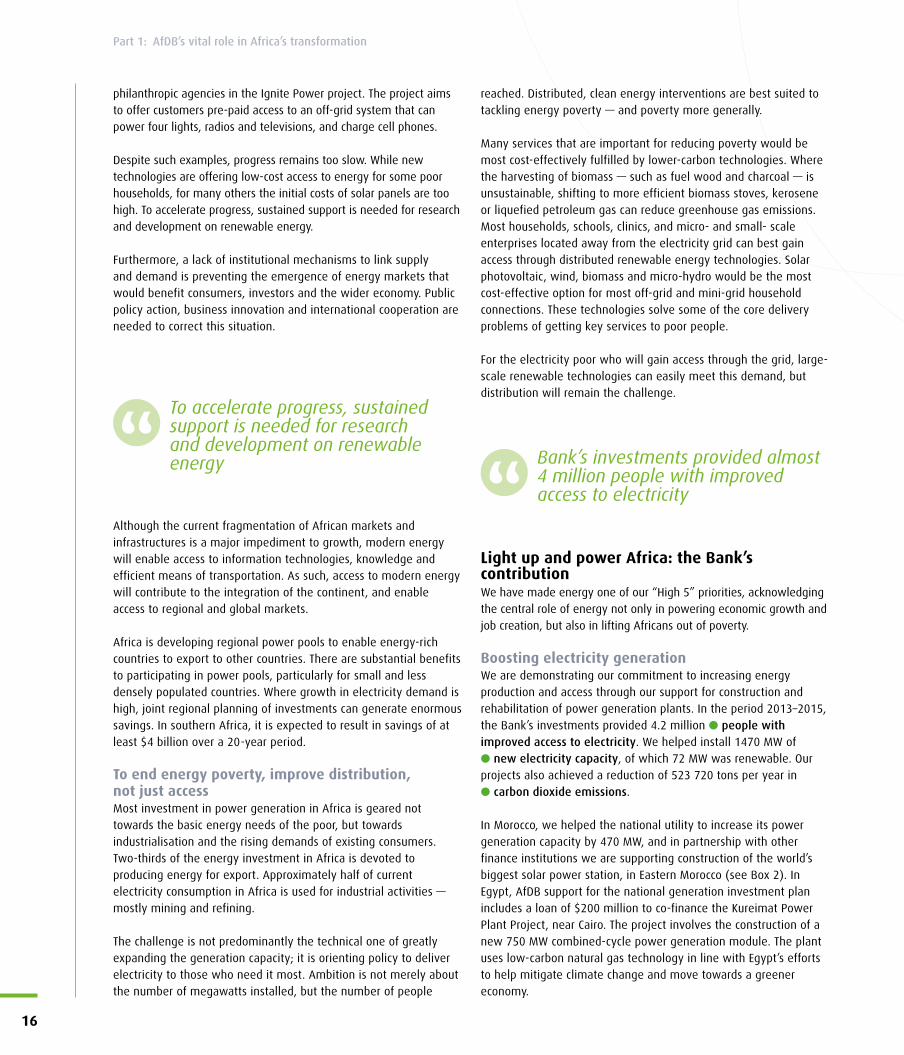
Meeting the African energy challenge Despite 15 years of economic growth, Africa’s energy systems are still grossly inadequate. Restricted access to electricity, power shortages and dependence on biomass for fuel are undermining efforts to reduce poverty. At the same time, energy demand is climbing as cities, populations and economies grow. Sub-Saharan Africa is not on track to achieve universal access to modern energy by 2030 – the seventh Sustainable Development Goal.
● Access to electricity rose from 40% in 2010 to 46% in 2015, but about 635 million people still live without electricity. Access to clean, non-polluting cooking facilities is even more restricted. Almost four in five people rely for cooking on solid biomass, mainly fuelwood and charcoal. As a result, 600 000 people in the region die each year of household air pollution. Almost half are children under 5.
These energy-sector bottlenecks and power shortages have a deep economic impact on the region. They cost 2–4 percent of GDP annually, undermining job creation and investment. According to World Bank Doing Business surveys, the availability, reliability and cost of electricity are the single biggest constraint to investing on the continent. African businesses have to wait an average of 130 days to receive an electricity connection. For certain large sectors with limited possibilities to differentiate outputs, like aluminium, chemicals and
refining, companies are likely to compete directly on input prices, and in particular power prices, making their products less competitive on the international market. To make power prices more affordable, better institutions and regulations are required so that energy markets become more efficient.
As such, governance of power utilities is at the heart of Africa’s energy crisis. So far, policy and institutional reforms have met with mixed success. Only a few countries have attempted full privatisation. The majority of African countries now have a hybrid energy market, with a state-owned utility both buying from independent producers and running its own power generation facilities. Slow progress on reforms is one of the causes of high electricity costs, which average $0.15 per Kwh in Africa. In addition, African governments spend $21 billion annually bailing out loss-making utilities and providing subsidies for oil-based products, money that could be spent on more productive energy investments. Most experts advocate a full cost recovery system, supplemented by more targeted subsidies for the poorest households.
Africa’s energy opportunityAfrica’s energy deficits stand in stark contrast to the region’s potential. Africa has ample reserves of fossil fuels and even more plentiful renewable energy potential. The continent has more than half of the world’s renewable energy potential.
Hydropower provides around a fifth of current capacity but not even a tenth of its total potential has been utilised. Similarly, the technical potential of solar, wind and geothermal energy is significant. Cape Verde, Egypt, Ethiopia, Kenya, Morocco and South Africa have launched major initiatives to these renewable sources, resulting in over 10 GW of capacity contracted.
The availability, reliability and cost of electricity is the single biggest constraint to investing on the continent
14
Part 1: AfDB’s vital role in Africa’s transformation
Demand for energy is rising rapidly, so it is vital that policymakers develop Africa’s resources. Over the next 20 years, renewable energy generation should rise to account for nearly 49% of total energy generation in Africa, up from just 17% in 2013. Developing this potential requires a strong package of policy measures, including active government support for energy efficiency and the elimination of fossil fuel subsidies.
Renewable energy sources have a critical role to play. As well as reducing carbon emissions, they can be deployed far more quickly than fossil fuel power plants and they can generate power both on-grid and off-grid. As they consider energy investment decisions, Africa’s governments should lay the foundations for a low-carbon future, while acknowledging that the transition from high-carbon infrastructure will need to be gradual.
Africa’s energy potential is reflected in what some countries are already achieving. Ethiopia, Ghana, Kenya, Nigeria and South Africa are developing large power plants that generate renewable energy. On a smaller but no less important scale, household demand for lighting and power is propelling a renewables revolution. The
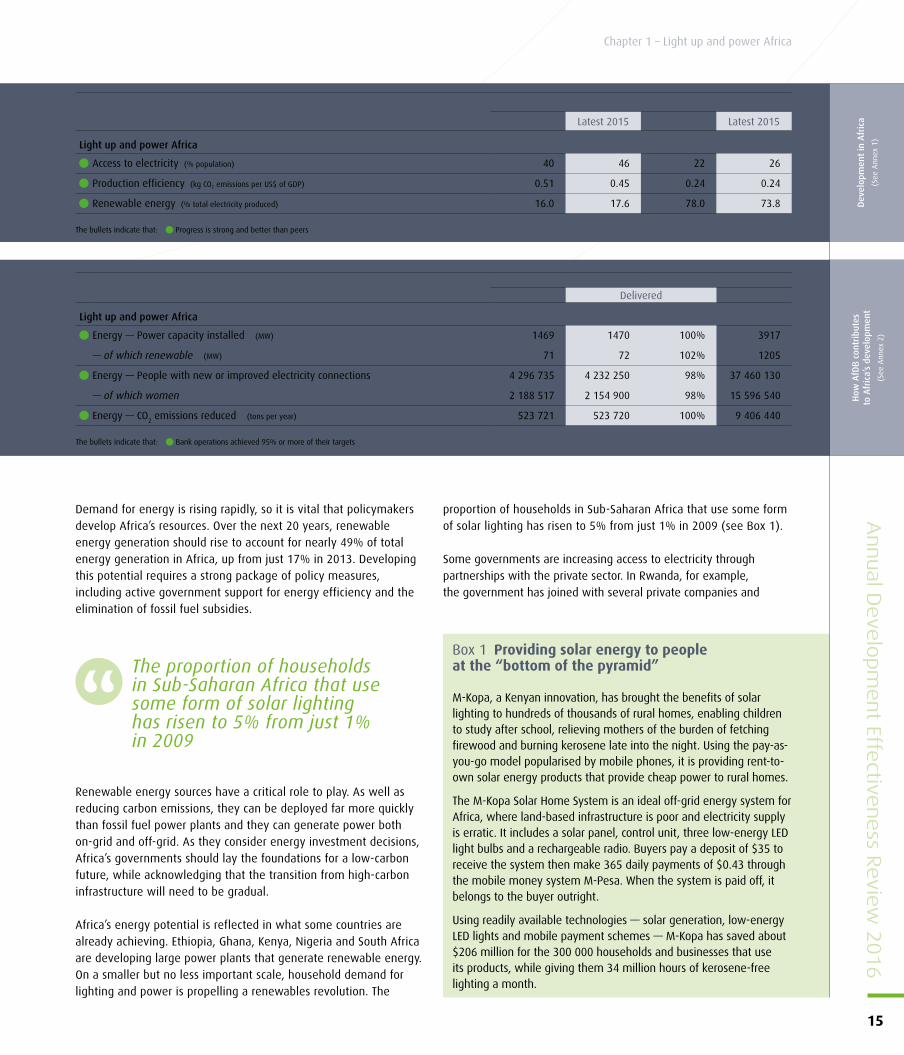
proportion of households in Sub-Saharan Africa that use some form of solar lighting has risen to 5% from just 1% in 2009 (see Box 1).
Some governments are increasing access to electricity through partnerships with the private sector. In Rwanda, for example, the government has joined with several private companies and
Box 1 Providing solar energy to people at the “bottom of the pyramid”
M-Kopa, a Kenyan innovation, has brought the benefits of solar lighting to hundreds of thousands of rural homes, enabling children to study after school, relieving mothers of the burden of fetching firewood and burning kerosene late into the night. Using the pay-as-you-go model popularised by mobile phones, it is providing rent-to-own solar energy products that provide cheap power to rural homes.
The M-Kopa Solar Home System is an ideal off-grid energy system for Africa, where land-based infrastructure is poor and electricity supply is erratic. It includes a solar panel, control unit, three low-energy LED light bulbs and a rechargeable radio. Buyers pay a deposit of $35 to receive the system then make 365 daily payments of $0.43 through the mobile money system M-Pesa. When the system is paid off, it belongs to the buyer outright.
Using readily available technologies — solar generation, low-energy LED lights and mobile payment schemes — M-Kopa has saved about $206 million for the 300 000 households and businesses that use its products, while giving them 34 million hours of kerosene-free lighting a month.
Dev
elop
men
t in
Afr
ica
(See
Ann
ex 1
)
INDICATOR2013–2015 2016–2018
Expected Delivered Expected
Light up and power Africa
Energy — Power capacity installed (MW) 1469 1470 100% 3917
— of which renewable (MW) 71 72 102% 1205
Energy — People with new or improved electricity connections 4 296 735 4 232 250 98% 37 460 130
— of which women 2 188 517 2 154 900 98% 15 596 540
Energy — CO2 emissions reduced (tons per year) 523 721 523 720 100% 9 406 440
The bullets indicate that: Bank operations achieved 95% or more of their targets
How
AfD
B c
ontr
ibut
es
to A
fric
a’s
deve
lopm
ent
(See
Ann
ex 2
)
The proportion of households in Sub-Saharan Africa that use some form of solar lighting has risen to 5% from just 1% in 2009
INDICATORALL AFRICAN COUNTRIES OF WHICH ADF COUNTRIES
Baseline 2010 Latest 2015 Baseline 2010 Latest 2015
Light up and power Africa
Access to electricity (% population) 40 46 22 26
Production efficiency (kg CO2 emissions per US$ of GDP) 0.51 0.45 0.24 0.24
Renewable energy (% total electricity produced) 16.0 17.6 78.0 73.8
The bullets indicate that: Progress is strong and better than peers
Annual D
eve
lopm
ent Effe
ctiveness R
evie
w 2
016
15
Chapter 1 – Light up and power Africa
philanthropic agencies in the Ignite Power project. The project aims to offer customers pre-paid access to an off-grid system that can power four lights, radios and televisions, and charge cell phones.
Despite such examples, progress remains too slow. While new technologies are offering low-cost access to energy for some poor households, for many others the initial costs of solar panels are too high. To accelerate progress, sustained support is needed for research and development on renewable energy.
Furthermore, a lack of institutional mechanisms to link supply and demand is preventing the emergence of energy markets that would benefit consumers, investors and the wider economy. Public policy action, business innovation and international cooperation are needed to correct this situation.
Although the current fragmentation of African markets and infrastructures is a major impediment to growth, modern energy will enable access to information technologies, knowledge and efficient means of transportation. As such, access to modern energy will contribute to the integration of the continent, and enable access to regional and global markets.
Africa is developing regional power pools to enable energy-rich countries to export to other countries. There are substantial benefits to participating in power pools, particularly for small and less densely populated countries. Where growth in electricity demand is high, joint regional planning of investments can generate enormous savings. In southern Africa, it is expected to result in savings of at least $4 billion over a 20-year period.
To end energy poverty, improve distribution, not just access Most investment in power generation in Africa is geared not towards the basic energy needs of the poor, but towards industrialisation and the rising demands of existing consumers. Two-thirds of the energy investment in Africa is devoted to producing energy for export. Approximately half of current electricity consumption in Africa is used for industrial activities — mostly mining and refining.
The challenge is not predominantly the technical one of greatly expanding the generation capacity; it is orienting policy to deliver electricity to those who need it most. Ambition is not merely about the number of megawatts installed, but the number of people
reached. Distributed, clean energy interventions are best suited to tackling energy poverty — and poverty more generally.
Many services that are important for reducing poverty would be most cost-effectively fulfilled by lower-carbon technologies. Where the harvesting of biomass — such as fuel wood and charcoal — is unsustainable, shifting to more efficient biomass stoves, kerosene or liquefied petroleum gas can reduce greenhouse gas emissions. Most households, schools, clinics, and micro- and small- scale enterprises located away from the electricity grid can best gain access through distributed renewable energy technologies. Solar photovoltaic, wind, biomass and micro-hydro would be the most cost-effective option for most off-grid and mini-grid household connections. These technologies solve some of the core delivery problems of getting key services to poor people.
For the electricity poor who will gain access through the grid, large-scale renewable technologies can easily meet this demand, but distribution will remain the challenge.
Light up and power Africa: the Bank’s contributionWe have made energy one of our “High 5” priorities, acknowledging the central role of energy not only in powering economic growth and job creation, but also in lifting Africans out of poverty.
Boosting electricity generationWe are demonstrating our commitment to increasing energy production and access through our support for construction and rehabilitation of power generation plants. In the period 2013–2015, the Bank’s investments provided 4.2 million ● people with improved access to electricity. We helped install 1470 MW of ● new electricity capacity, of which 72 MW was renewable. Our projects also achieved a reduction of 523 720 tons per year in ● carbon dioxide emissions.
In Morocco, we helped the national utility to increase its power generation capacity by 470 MW, and in partnership with other finance institutions we are supporting construction of the world’s biggest solar power station, in Eastern Morocco (see Box 2). In Egypt, AfDB support for the national generation investment plan includes a loan of $200 million to co-finance the Kureimat Power Plant Project, near Cairo. The project involves the construction of a new 750 MW combined-cycle power generation module. The plant uses low-carbon natural gas technology in line with Egypt’s efforts to help mitigate climate change and move towards a greener economy.
To accelerate progress, sustained support is needed for research and development on renewable energy Bank’s investments provided almost
4 million people with improved access to electricity
16
Part 1: AfDB’s vital role in Africa’s transformation
Through our independent evaluation function, we are continuously assessing the impact of our operations. The findings and recommendations help us derive lessons to improve future programming. As such, in some countries we supported, electricity tariffs have not fallen as much as we expected. To reduce tariff levels, the Bank’s power generation and national grid extension projects require a more comprehensive approach. Effective tariff design and implementation requires progress with metering, better data on consumption patterns, and lifeline tariffs or other programmes to protect the poorest consumers. Including tariff studies as a project component could be a good solution, but they need to be periodically conducted after the plant commissioning, not before or during the project implementation, which has been the case in a number of our energy projects.
Bank backs “green mini-grids”In recognition of the need to improve the distribution of energy, we are increasingly supporting smaller-scale electrical distribution networks, such as “green mini-grids”, alongside core efforts to expand electricity generation capacity. Those core efforts are also embracing the need to move to renewable energy, as illustrated
by large-scale low-carbon power projects supported by the Bank in Morocco and Egypt.
Green mini-grids (GMGs) are increasingly recognised as an essential part of a comprehensive strategy to achieve universal energy access. GMGs are village, town or district electrical distribution networks either unconnected to or able to operate autonomously from the main electrical grid. GMGs are powered
Box 2 AfDB support helps Morocco realise huge solar projects
The Ain Ben Mathar Thermosolar Plant Project in Morocco was the Bank’s first experience in solar power. The project enables the national electricity and water utility, Office National de l’Electricité et de l’Eau Potable (ONEE), to increase its power generation capacity by 470 MW (20 MW from concentrated solar power and 450 MW from thermal power). The plant supplies nearly 3540 additional GWh per year, connecting 100% of Moroccans in urban areas and 98% in rural areas. Each year the plant saves more than 12 000 tonnes of fuel oil and reduces CO
2 emissions by
33 500 tonnes.
The lessons learned about concentrated solar power technology in particular (cost, storage, local manufacturing and maintenance) helped the Moroccan authorities design and obtain the financing for the Ouarzazate solar complex project — the world’s biggest solar power complex — with a total capacity of 500 MW. The AfDB approved financing in 2012 for phase 1 of the Ouarzazate project and in 2014 for phase 2.
Green mini-grids are increasingly recognised as an essential part of a comprehensive strategy to achieve universal energy access
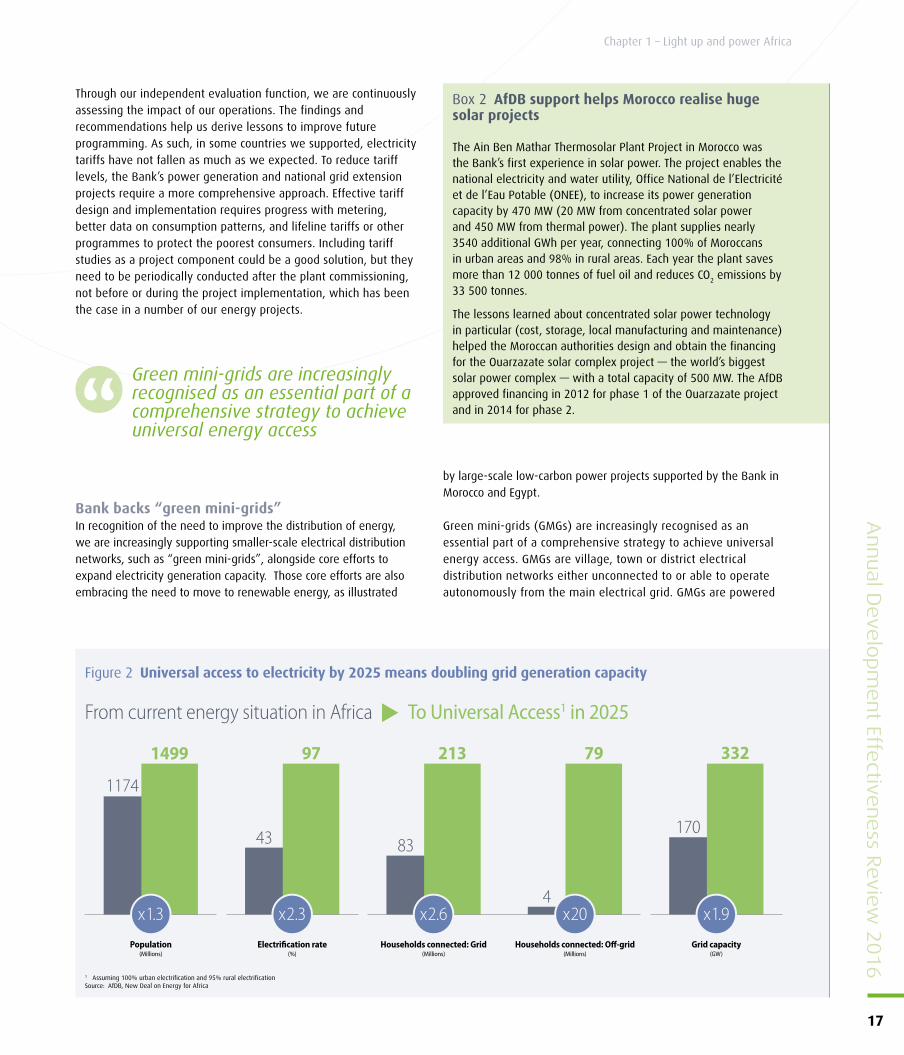
Figure 2 Universal access to electricity by 2025 means doubling grid generation capacity
Population(Millions)
Electri�cation rate(%)
Households connected: Grid(Millions)
Households connected: O�-grid(Millions)
Grid capacity(GW)
1174
43 83
4
170
1499 97 213 79 332
From current energy situation in Africa To Universal Access1 in 2025
x1.3 x2.3 x2.6 x20 x1.9
1 Assuming 100% urban electrification and 95% rural electrificationSource: AfDB, New Deal on Energy for Africa
Annual D
eve
lopm
ent Effe
ctiveness R
evie
w 2
016
17
Chapter 1 – Light up and power Africa
by renewable energy or a hybrid of renewable energy and fossil fuels.
Looking ahead: The New Deal on Energy for AfricaThe New Deal on Energy for Africa underpins all the other High 5s (see Box 3). Through this initiative, the AfDB is working in partnership with all stakeholders to unify efforts to achieve universal access to energy in Africa (see Figure 2).
Our new Energy Strategy sets out the priorities for the Bank’s interventions in the energy sector from 2016 to 2025. The strategy aims to contribute to the transformation of Africa’s energy sector, promoting inclusive growth and the transition to green growth by increasing energy production, scaling up energy access, improving affordability, reliability and energy efficiency, and improving the sustainability of energy systems.
The strategy focuses on five key principles: (1) raising aspirations to solve Africa's energy challenges; (2) establishing a Transformative Partnership on Energy for Africa; (3) mobilising domestic and international capital for innovative financing in Africa’s energy sector; (4) supporting African governments in strengthening energy policy, regulation and sector governance; and (5) increasing the AfDB's investments in energy and climate financing.
To achieve universal access to modern energy, the AfDB is working with governments, the private sector, bilateral and multilateral energy sector initiatives to develop a Transformative Partnership on Energy for Africa — a platform for public-private partnerships for innovative financing in Africa’s energy sector. The Bank will work side by side with other multilateral development banks to scale up investments in the sector. This includes initiatives such as Power Africa and Sustainable Energy for All (SE4All). We also established Africa50 as an investment platform for the promotion and financing of infrastructure projects. This is a significant stage in the Bank’s shift towards mobilizing innovative private and public sector financing for infrastructure development, from both in Africa and externally.
Finally, the New Deal intends to focus on seven areas where development of the energy sector needs to be accelerated: setting up an enabling policy environment; helping utility companies to succeed; dramatically increasing the number of bankable energy projects; increasing the funding pool to deliver new projects; supporting “bottom-of-the-pyramid’ energy access programmes; accelerating major regional projects and driving integration; and rolling out waves of country-wide energy transformations.
The Bank will address these areas through a series of flagship programmes including: IPP procurement, power utility transformation, an early stage project support facility, funding catalyst programmes, a bottom-of-the-pyramid energy financing facility, a mobile payment programme, a regional project acceleration programme, country-wide energy sector turnarounds, and transformative partnerships.
Box 3 The New Deal on Energy underpins all the other High 5s
The implementation of the New Deal on Energy in Africa will contribute to the achievement of the other High 5s:
Feed Africa: Access to modern energy will directly contribute to increased productivity in agriculture, through irrigation, mechanisation, the use of fertilisers and moving forward the value-added chain of agricultural outputs.
Industrialise Africa: African enterprises view unreliable power supply as the biggest constraint to the growth of their business, ahead of corruption and access to finance. Industrial facilities are particularly concerned as they require large amounts of reliable base load power, and any interruption in the power supply can damage the production equipment.
Integrate Africa: The New Deal has a clear regional dimension. It aims at accelerating the completion of large regional projects to achieve economies of scale and foster cooperation between neighbouring countries.
Improve the quality of life of Africans: The New Deal also encourages off-grid solutions, leveraging on recent technological developments. As such, it is designed to maximise impacts in rural areas where access to modern energy is likely to give access to new services and economic opportunities.
Through the New Deal on Energy, the AfDB is working with all stakeholders to unify efforts to achieve universal energy access
18
Part 1: AfDB’s vital role in Africa’s transformation
Chapter 2
Feed Africa
Agriculture, the most important sector in Africa’s economy, contributes 15 percent of GDP. More than 70% of Africans depend on agriculture for their livelihoods. If its full potential were unlocked, agriculture could vastly improve the lives of millions of Africans — creating jobs, increasing prosperity and reducing hunger. Much of this potential remains untapped, however, and productivity is low,
contributing to persistent poverty and deteriorating food security.
This chapter starts by looking at Africa’s agricultural potential and the progress made since 2010 in productivity and food security. As food demand increases and consumption habits change, net food imports are rising rapidly. This shows that there is a broader opportunity to transform agriculture into a vibrant agribusiness sector.
The African Development Bank’s work in agriculture has delivered better seeds, irrigation and sustainable technologies, and greater access to finance and to markets. We show that Bank projects have increased yields, production levels and incomes for farmers, resulting in more dynamic local economies. However, the Bank has recognised that substantive transformation will require a more concerted effort that draws on the strengths of the Bank and its partners.
African agriculture has enormous potential to drive growth and prosperityAfrica has more undeveloped arable land than any other region, equivalent to 25% of the world’s fertile land, yet food insecurity and malnutrition are persistent. In 2015, 24.6% of the population was at risk of ● food insecurity. While this is an improvement on 33% in 2000, in the face of a growing population the rate of progress is not enough.
A significant number of Africa’s farmers also work fragile soils in rain-fed areas, using little or no fertiliser, pesticide, irrigation or machinery. They lack infrastructure, financial systems, scientific innovation and access to markets. This is reflected in low levels of ● agricultural productivity that trap millions of farmers in poverty and act as a brake on growth.
Between 2001 and 2008, overall GDP in Africa grew 6% annually but agricultural GDP grew by only 3.4% a year. The underperformance of the agriculture sector keeps rural incomes low and food prices high, and limits agriculture’s potential to generate
jobs in the farm and non-farm sectors, including manufacturing and services. It also traps millions in hunger. More than one in four of Africa’s 856 million people are undernourished, making Africa the world’s most food-insecure region, with women and children particularly at risk.
Potentially, Africa’s farmers could not only feed rapidly growing populations but also generate exports to meet demand in global markets. However, the region is increasingly dependent on imports. African countries spent $35 billion on food imports (excluding fish) in 2011. The share accounted for by intra-African trade was less than 5 percent. If Africa’s farmers increased their productivity and substituted these imports with their own produce, this would provide a powerful impetus to reducing poverty, enhancing food and nutrition security, and supporting a more inclusive pattern of growth.
African farmers also need help to cope with the effects of climate change, which is very likely to lead to above-average warming over the course of the 21st century, reducing the yields of major cereal crops. Even modest changes in the timing and intensity of rainfall, in the frequency and duration of droughts, and surface temperature can have profoundly damaging consequences for production, poverty and nutrition. That is why we need “climate-smart” agriculture — including better water management — that increases the productivity of land, labour and capital invested in farming, and strengthens the resilience of farmers.
The underperformance of the agriculture sector keeps rural incomes low and food prices high
Annual D
eve
lopm
ent Effe
ctiveness R
evie
w 2
016
19
Chapter 2 – Feed Africa
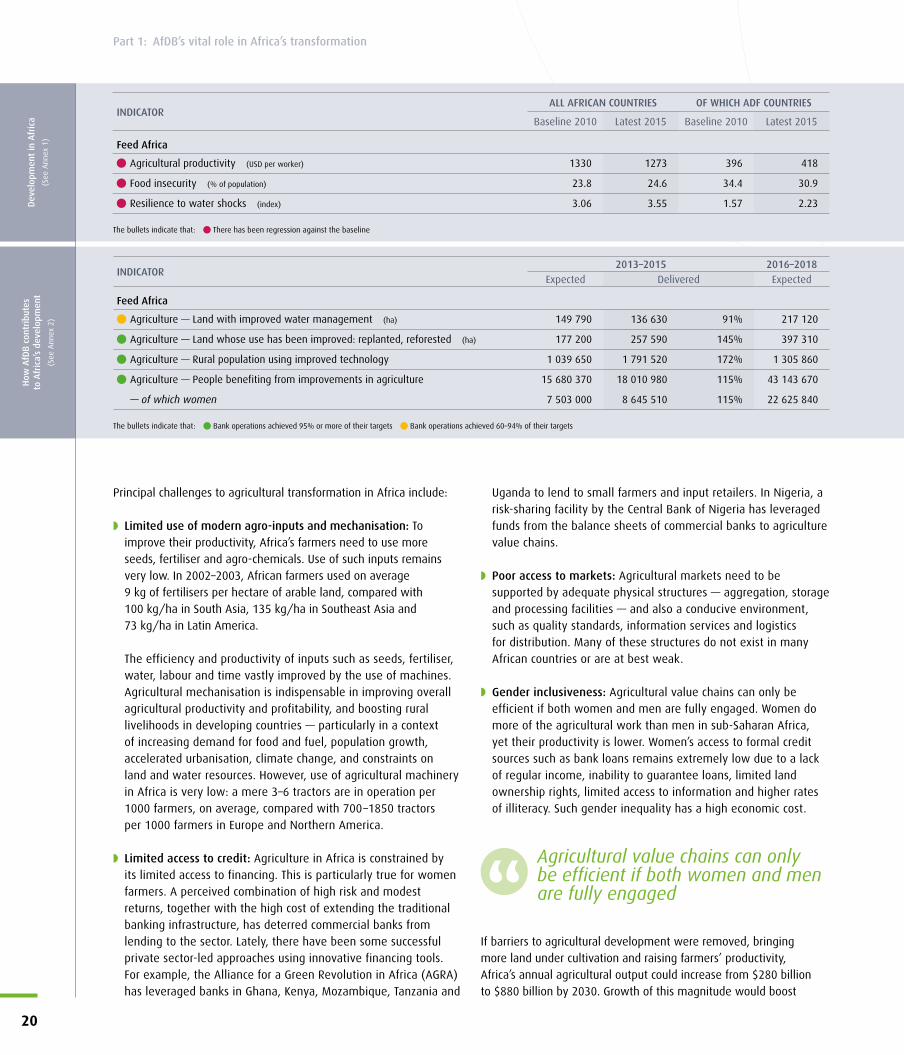
Principal challenges to agricultural transformation in Africa include:
◗ Limited use of modern agro-inputs and mechanisation: To improve their productivity, Africa’s farmers need to use more seeds, fertiliser and agro-chemicals. Use of such inputs remains very low. In 2002–2003, African farmers used on average 9 kg of fertilisers per hectare of arable land, compared with 100 kg/ha in South Asia, 135 kg/ha in Southeast Asia and 73 kg/ha in Latin America.
The efficiency and productivity of inputs such as seeds, fertiliser, water, labour and time vastly improved by the use of machines. Agricultural mechanisation is indispensable in improving overall agricultural productivity and profitability, and boosting rural livelihoods in developing countries — particularly in a context of increasing demand for food and fuel, population growth, accelerated urbanisation, climate change, and constraints on land and water resources. However, use of agricultural machinery in Africa is very low: a mere 3–6 tractors are in operation per 1000 farmers, on average, compared with 700–1850 tractors per 1000 farmers in Europe and Northern America.
◗ Limited access to credit: Agriculture in Africa is constrained by its limited access to financing. This is particularly true for women farmers. A perceived combination of high risk and modest returns, together with the high cost of extending the traditional banking infrastructure, has deterred commercial banks from lending to the sector. Lately, there have been some successful private sector-led approaches using innovative financing tools. For example, the Alliance for a Green Revolution in Africa (AGRA) has leveraged banks in Ghana, Kenya, Mozambique, Tanzania and
Uganda to lend to small farmers and input retailers. In Nigeria, a risk-sharing facility by the Central Bank of Nigeria has leveraged funds from the balance sheets of commercial banks to agriculture value chains.
◗ Poor access to markets: Agricultural markets need to be supported by adequate physical structures — aggregation, storage and processing facilities — and also a conducive environment, such as quality standards, information services and logistics for distribution. Many of these structures do not exist in many African countries or are at best weak.
◗ Gender inclusiveness: Agricultural value chains can only be efficient if both women and men are fully engaged. Women do more of the agricultural work than men in sub-Saharan Africa, yet their productivity is lower. Women’s access to formal credit sources such as bank loans remains extremely low due to a lack of regular income, inability to guarantee loans, limited land ownership rights, limited access to information and higher rates of illiteracy. Such gender inequality has a high economic cost.
If barriers to agricultural development were removed, bringing more land under cultivation and raising farmers’ productivity, Africa’s annual agricultural output could increase from $280 billion to $880 billion by 2030. Growth of this magnitude would boost
Agricultural value chains can only be efficient if both women and men are fully engaged
INDICATORALL AFRICAN COUNTRIES OF WHICH ADF COUNTRIES
Baseline 2010 Latest 2015 Baseline 2010 Latest 2015
Feed Africa
Agricultural productivity (USD per worker) 1330 1273 396 418
Food insecurity (% of population) 23.8 24.6 34.4 30.9
Resilience to water shocks (index) 3.06 3.55 1.57 2.23
The bullets indicate that: There has been regression against the baseline
Dev
elop
men
t in
Afr
ica
(See
Ann
ex 1
)
INDICATOR2013–2015 2016–2018
Expected Delivered Expected
Feed Africa
Agriculture — Land with improved water management (ha) 149 790 136 630 91% 217 120
Agriculture — Land whose use has been improved: replanted, reforested (ha) 177 200 257 590 145% 397 310
Agriculture — Rural population using improved technology 1 039 650 1 791 520 172% 1 305 860
Agriculture — People benefiting from improvements in agriculture 15 680 370 18 010 980 115% 43 143 670
— of which women 7 503 000 8 645 510 115% 22 625 840
The bullets indicate that: Bank operations achieved 95% or more of their targets Bank operations achieved 60–94% of their targets
How
AfD
B c
ontr
ibut
es
to A
fric
a’s
deve
lopm
ent
(See
Ann
ex 2
)
20
Part 1: AfDB’s vital role in Africa’s transformation

upstream demand for products that farmers use, including fertilisers, seeds and pesticides. It would also fuel downstream industries that depend on farm produce, such as grain refining, biofuels and other types of food processing. This combination of upstream and downstream activities could bring in an additional $275 billion in revenue by 2030.
To bring about the transformation that would unlock Africa’s enormous agricultural potential, governments need to create a policy and regulatory environment that is pro-business. They must enable the private sector to take advantage of technological improvements, foster efficient agro-input delivery, and open access to credit and markets.
In order to achieve these objectives, governments need to invest in infrastructure and apply the lessons of science to embrace an African “green revolution”. Africa urgently needs the scientific innovations in drought-resistant seeds, in higher-yielding varieties and in water use, fertiliser and pesticide that helped to transform agriculture in other regions.
Governments should act on their pledge to spend at least 10 percent of budget resources on agriculture. They also need to create the right market conditions, by cutting tariffs and non-tariff barriers to regional trade, eliminating transport cartels and developing marketing infrastructure.
On average, agricultural growth reduces poverty roughly twice as much as growth in other sectors. If Africa is to achieve the transformative economic growth that it needs to reduce poverty, there is no alternative to the development of a vibrant and prosperous agricultural sector.
The business of agricultureWhat Africa needs is an agricultural transformation that will integrate its farmers into the global economy. This requires a fundamental shift in attitude across the continent. Agriculture should be seen not only as a way of life or a means of subsistence but also as a potential business enterprise.
African smallholder farmers make up the largest segment of the continent’s private sector. By seeing agriculture as a business and farmers as entrepreneurs, policymakers and investors can leverage the continent’s existing assets to catalyse economic transformation.
For decades, farming was viewed as a subsistence activity whose loftiest goal was food security for individual households. Farmers want education, health, and housing — comfort and a promising future — and they will invest in those things if given the opportunity.
If the development sector started treating agriculture as a business, then the hundreds of millions of small business owners operating farms will have better options from which to choose.
Agriculture has the potential to raise incomes and contribute substantially to the economy. Hundreds of millions of small farmers, thousands of local agribusinesses, and hundreds of seed and food companies will make it pay, as long as governments are willing to increase the level of investment in the sector. It can pay in terms of incomes for smallholders and in terms of profit for the businesspeople engaged in the sector. It can also pay in terms of an improvement in the quality of life for hundreds of millions of Africans.
Over 60 percent of Africans are under 25. Roughly 350 million young people will be entering the labour force between now and 2035. Even under the most optimistic projections, wage jobs in sub-Saharan Africa will absorb only 25 percent of these 350 million workers. Farming and self-employment will have to provide gainful employment for at least 70 percent of young Africans entering the labour force until at least 2030. However, agriculture will not be attractive to young people until earnings in the sector increase substantially, and profitable farming, among many other things, requires access to land. There is a need for clear and accessible laws that foster a business environment that benefits all market players — from farmers (including the more vulnerable such as female and young farmers and smallholders), to consumers and large investors.
AfDB support for African agriculture The Bank is committed to improving food security and rural livelihoods by tackling the most important constraints on agricultural productivity. Our projects are demonstrating the potential of agriculture to create decent jobs. We are also helping to promote more sophisticated value chains by linking farmers to agri-businesses (see Figure 3 example).
Our agriculture projects often have other components in transport or microfinance. In the Democratic Republic of Congo, the Bank supported the rehabilitation of the agriculture sector in Katanga, Kasai-Oriental and Kasai-Occidental provinces. The project increased food production and technology use, and rehabilitated 593 km of feeder roads, connecting production areas to markets.
In Sierra Leone, we enhanced food security by contributing towards increasing agricultural production and farmers’ income in five districts (Kambia, Port Loko, Moyamba, Pujehun and Kenema). With our support, about 8000 ha of tree crop plantations — cocoa, coffee, and oil palm — were rehabilitated; 240 km of feeder roads
Agriculture should be seen not only as a way of life or a means of subsistence but also as a potential business enterprise
Farming and self-employment will have to provide employment for at least 70 percent of Africans
Annual D
eve
lopm
ent Effe
ctiveness R
evie
w 2
016
21
Chapter 2 – Feed Africa
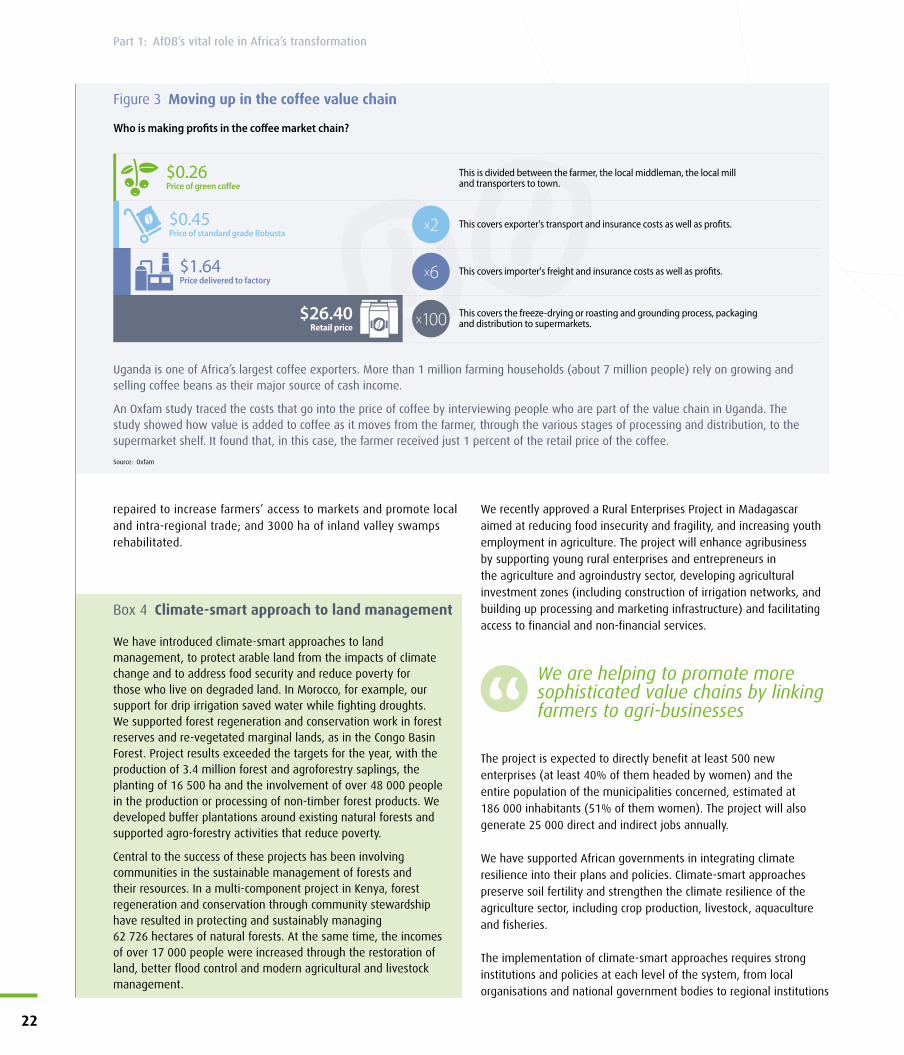
repaired to increase farmers’ access to markets and promote local and intra-regional trade; and 3000 ha of inland valley swamps rehabilitated.
We recently approved a Rural Enterprises Project in Madagascar aimed at reducing food insecurity and fragility, and increasing youth employment in agriculture. The project will enhance agribusiness by supporting young rural enterprises and entrepreneurs in the agriculture and agroindustry sector, developing agricultural investment zones (including construction of irrigation networks, and building up processing and marketing infrastructure) and facilitating access to financial and non-financial services.
The project is expected to directly benefit at least 500 new enterprises (at least 40% of them headed by women) and the entire population of the municipalities concerned, estimated at 186 000 inhabitants (51% of them women). The project will also generate 25 000 direct and indirect jobs annually.
We have supported African governments in integrating climate resilience into their plans and policies. Climate-smart approaches preserve soil fertility and strengthen the climate resilience of the agriculture sector, including crop production, livestock, aquaculture and fisheries.
The implementation of climate-smart approaches requires strong institutions and policies at each level of the system, from local organisations and national government bodies to regional institutions
$0.26Price of green co�ee
This is divided between the farmer, the local middleman, the local mill and transporters to town.
$0.45Price of standard grade Robusta
This covers exporter's transport and insurance costs as well as pro�ts.
$1.64Price delivered to factory
This covers importer's freight and insurance costs as well as pro�ts.
$26.40Retail price
This covers the freeze-drying or roasting and grounding process, packaging and distribution to supermarkets.x100
x6
x2
Figure 3 Moving up in the coffee value chain
Who is making profits in the coffee market chain?
Uganda is one of Africa’s largest coffee exporters. More than 1 million farming households (about 7 million people) rely on growing and selling coffee beans as their major source of cash income.
An Oxfam study traced the costs that go into the price of coffee by interviewing people who are part of the value chain in Uganda. The study showed how value is added to coffee as it moves from the farmer, through the various stages of processing and distribution, to the supermarket shelf. It found that, in this case, the farmer received just 1 percent of the retail price of the coffee.
Source: Oxfam
Box 4 Climate-smart approach to land management
We have introduced climate-smart approaches to land management, to protect arable land from the impacts of climate change and to address food security and reduce poverty for those who live on degraded land. In Morocco, for example, our support for drip irrigation saved water while fighting droughts. We supported forest regeneration and conservation work in forest reserves and re-vegetated marginal lands, as in the Congo Basin Forest. Project results exceeded the targets for the year, with the production of 3.4 million forest and agroforestry saplings, the planting of 16 500 ha and the involvement of over 48 000 people in the production or processing of non-timber forest products. We developed buffer plantations around existing natural forests and supported agro-forestry activities that reduce poverty.
Central to the success of these projects has been involving communities in the sustainable management of forests and their resources. In a multi-component project in Kenya, forest regeneration and conservation through community stewardship have resulted in protecting and sustainably managing 62 726 hectares of natural forests. At the same time, the incomes of over 17 000 people were increased through the restoration of land, better flood control and modern agricultural and livestock management.
We are helping to promote more sophisticated value chains by linking farmers to agri-businesses
22
Part 1: AfDB’s vital role in Africa’s transformation
with the appropriate authority and governance arrangements. Such approaches also require appropriate financing mechanisms to promote the uptake of improved technologies at all levels (see Box 4).
Since 2013, 18 million ● people have benefited from improvements in agriculture supported by the Bank. Our projects have ● enhanced water management across 137 000 hectares of land, and 1.8 million ● people in rural areas used improved technology in agriculture. In Ghana, we supported a project that led to remarkable increases in exports and earnings from non-traditional agricultural products (see Box 5).
Although the Bank has made some substantial investment in this sector, we recognise that this has not been enough to achieve the substantial transformation required for a strong, sophisticated agricultural sector.
Transformation is beginning to occur in some countries and across a diverse range of agricultural commodity value chains, such as in the horticulture sector in Kenya, or in the rice sector in various countries in West Africa. The lessons learned from these experiences help frame our strategy. Successful transformations are business-led, and involve, among other conditions, productivity-increasing technology and inputs, and a well-functioning and vibrant private sector that can manage and allocate skill and capital to scale up emergent success.
Looking forwardThe African Development Bank aims to make Africa self-sufficient in food by transforming the agriculture sector from one of subsistence to one that is a creator of jobs, wealth and growth. The Bank is bringing agriculture into Africa’s transformational agenda; it is one of the top five priorities established by the Bank’s — “High 5s” — in order to deliver real changes in the lives and livelihoods of Africans.
The Bank demonstrated its commitment to agriculture at the Feeding Africa conference held in October 2015 in Dakar. The conference led to an 18-point action plan to accelerate investment in agribusiness, including a new facility at the Bank to provide funding and guarantees to African women in agribusiness, as well as projects tackling youth unemployment.
Our agricultural operations will now be framed within a more business-oriented approach, based on a deeper understanding of the obstacles, potential and investment opportunities right across the sector, from the supply of inputs to the final point of retail. We will work to develop an integrated, vibrant and dynamic sector.
In particular, we will connect farmers better to local, regional and global agricultural value chains, to ensure they have larger, more reliable markets for their produce. We will focus on expanding smallholder agribusiness and larger scale agro-industry, creating vertically integrated value chains to increase output and create jobs. Our close engagement with the private sector will encourage increased investment in agriculture, including private equity.
Underpinning this vision are four specific goals: helping to eliminate extreme poverty; ending hunger and malnutrition; making Africa a net food exporter; and moving Africa to the top of export-orientated global value chains where it has comparative advantage.
Given the scale of resources required, and the scale of coordination needed to transform the entire value chains, it is important to apply a targeted investment strategy. We will aim to: achieve self-sufficiency in key staples (rice, wheat, fish); move up the value chain in key export-oriented commodities (cocoa, coffee, cotton, cashew, cassava and horticulture); create a food secure Sahel (sorghum, millet, cowpea, livestock); and realise the potential of the Guinea Savannah (maize, soybean, livestock).
More than 18 million people have benefited from improvements in agriculture through our support
We will support African countries achieve self-sufficiency in key staples
Box 5 Boosting horticultural exports and incomes in Ghana
The Export Marketing and Quality Awareness Project (EMQAP) in Ghana, supported by the AfDB, aimed to increase export earnings from non-traditional agricultural products. Commodities were selected for which Ghana could develop a comparative advantage to produce for the domestic market and for export to regional and international markets.
The project imported 30 varieties of mangoes from Florida in 2011 for evaluation for their commercial potential. Over 2.5 million seedlings were raised and planted in Greater Accra, Eastern, Brong-Ahafo and Northern regions. Export volumes rose by 16.1% in 2012 in comparison with the project start-up period. Among other non-traditional commodities, pineapple production amounted to 41 211 million tonnes in 2013, 65% of it exported. Significant increases were also recorded for producers of papaya and bird’s-eye chillies.
Technology dissemination improved the knowledge, attitudes and practices of farmers, resulting in increased yield levels. Greater productivity led to significant increases in income from horticultural crops. Annual household gross incomes of pineapple farmers rose by an average of 90%.
Annual D
eve
lopm
ent Effe
ctiveness R
evie
w 2
016
23
Chapter 2 – Feed Africa

We will continue to support countries to create better returns to farmers and agribusinesses, including more opportunities for women and young people, while promoting improved food
security and nutrition levels. We are refocusing our assistance to the agriculture sector and intend to play a key role in catalysing agricultural transformation.
24
Part 1: AfDB’s vital role in Africa’s transformation

Chapter 3
Industrialise Africa
Africa is still relying for economic growth on agriculture and the export of raw commodities. Although industrialisation is growing, Africa’s share of global manufacturing is less than 1%, putting the continent at the bottom of the global value chain. Consequently, economic growth has not been creating enough jobs for the growing number of youth.
Africa has many of the ingredients of industrial success. To unleash this potential, African countries must embark on a bold agenda driven by private sector-led investments in industrial transformation. There is a real opportunity for Africa to create jobs and promote inclusive economic transformation through domestic manufacturing and a commodity-based industrialization process.
This chapter reviews Africa’s progress on key enablers such as a conducive economic environment, economic diversification, competitiveness and access to capital. The chapter also covers the Bank’s role in Africa’s industrial transformation. Our support is focused on promoting enterprise development and helping to improve the business environment. Our operations have supported job creation and provided economic opportunities.
Industry can unlock Africa’s huge economic potential Africa’s recent growth has been strong. This reflects a host of encouraging factors, including expanding domestic markets driven by a burgeoning middle class, an improving business environment, improved macroeconomic management, favourable commodity prices, rapid urbanisation, and increasing public investment.
Several of these factors continue to drive growth but a persistent lack of industrialisation is holding back Africa’s economies, which remain largely dependent on sectors like agriculture and unprocessed commodities that add relatively little value, even though in absolute terms it is growing. On average, industry generates merely $700 of GDP per capita in Africa, less than a third of Latin America’s output ($2500 per capita) and barely a fifth of East Asia’s ($3400 per capita). Industrial GDP influences overall GDP, as industrial productivity drives productivity in other sectors.
By exporting unprocessed commodities, Africa is effectively exporting wealth and jobs. Behind the growth numbers is persistent inequality and unemployment. Africa needs to keep its wealth by adding value to its primary commodities. That requires an economic
transformation, driven by policy that stimulates the creation and growth of industry.
Across the world and throughout history, an active industrial policy has been essential for advancing national economic development efforts – from eighteenth-century Britain to the recent spectacular rise of East Asian economies. Manufacturing also offers an opportunity for African countries to increase resilience to economic shocks (see Figure 4).
Africa has many of the ingredients of industrial success. Its abundant natural resources offer reliable supplies of raw materials, including minerals, agricultural products, fish and timber. Its large and growing working-age population makes up one of the world’s most dynamic labour forces. Domestic markets are expanding as the middle class swells.
The scale of Africa’s resource wealth bears repeating: over $82 trillion in discovered natural resources, which are expected to contribute over $30 billion per annum in government revenues over the next 20 years. The continent has 120 billion barrels of oil reserves — as much as half of Saudi Arabia’s — and 600 million hectares of uncultivated arable land, a quarter of the world total.
Africa is richly endowed with mineral reserves, ranking first or second among the continents in its share of the world’s bauxite, chromite, cobalt, industrial diamonds, manganese, platinum and many other minerals.
By exporting unprocessed commodities, Africa is effectively exporting wealth and jobs
Annual D
eve
lopm
ent Effe
ctiveness R
evie
w 2
016
25
Chapter 3 – Industrialise Africa

The other vital ingredient of Africa’s economic transformation is its powerful demographic transition. Africa is the world’s youngest continent, with 70% of the population under the age of 30. Its working age population, currently 54% of the continent’s total, will increase to 62% by 2050. Africa’s labour force will surpass China’s and could play a huge role in global consumption and production. Unlike other regions, Africa will neither face a shortage in domestic labour nor need to worry about the economic burden of an increasingly ageing population for most of the 21st century.
This “demographic dividend” can be cashed in to stimulate industrial production. An influx of new workers from rural areas into the cities, if complemented with the necessary educational reforms, could lead to a major productivity boom. This would increase savings and investment rates, push up per capita GDP, and prompt skills transfer.
For many countries, the manufacturing sector will be essential for yielding employment, diversifying technological capabilities that promote and expand the skills base and deepen individual
INDICATORALL AFRICAN COUNTRIES OF WHICH ADF COUNTRIES
Baseline 2010 Latest 2015 Baseline 2010 Latest 2015
Industrialise Africa
Economic Diversification (index) 0.6 0.6 0.6 0.6
Global Competitiveness (index) 3.6 3.64 3.4 3.5
Time required for business start-up (days) 42 25.6 39.5 20.3
Access to finance (% population) 21.8 30.8 10.7 13.2
The bullets indicate that: Progress is strong and better than peers Progress is positive but less than peers or no progress against the baseline
Dev
elop
men
t in
Afr
ica
(See
Ann
ex 1
)
INDICATOR2013–2015 2016–2018
Expected Delivered Expected
Industrialise Africa
Microcredits granted (number) 138 880 153 050 110% 36 320
Jobs created 2 287 120 3 006 780 131% 2 105 840
— of which jobs for women 617 870 812 300 131% 1 045 750
People benefiting from investee projects and microfinance 5 671 500 5 714 160 101% 4 138 710
— of which women 2 860 580 2 884 220 101% 2 070 290
Countries with improved competitive environment 15 9 60% ..
The bullets indicate that: Bank operations achieved 95% or more of their targets Bank operations achieved 60–94% of their targets
How
AfD
B c
ontr
ibut
es
to A
fric
a’s
deve
lopm
ent
(See
Ann
ex 2
)
2013 2014 2015
5
0
-5
-10
-15
-20
-25
-30
-35
Manufactured goods exports Non-manufactured goods exports
Figure 4 Manufacturing exports are increasingly regional, and help Africa withstand economic shocks% change in exports
African manufacturing exports (including re-exports) doubled between 2005 and 2014 to more than $100 billion. Asian countries have become more important destinations. African countries are also increasingly exporting manufactured goods to one another. Intra-African trade’s share of total manufacturing trade rose from 20% in 2005 to 34% in 2014.
And while the global economic slowdown led to a 30% decline in the value of non-manufacturing African exports to the European Union, United States, Japan and China in 2015, manufacturing exports — especially to China — held up much more positively. This shows that manufacturing offers African countries a chance to increase resilience to economic shocks.
Source: ODI
26
Part 1: AfDB’s vital role in Africa’s transformation

countries’ industrial structures. Having a more domestic industry would:
◗ increase the value that is created in an economy by generating activity all along the value chain from raw material to finished product;
◗ boost productivity, both by introducing equipment and techniques and by increasing the capability of the workforce, and diffuses this improvement into the wider economy;
◗ generate formal employment, which creates stability;
◗ improve the balance of trade, because it creates goods that can both substitute for what was formerly imported and be exported.
Between 1950 and 2006, about half of the catch-up by developing countries to advanced economy levels of output per worker was explained by rising productivity within industry combined with labour moving out of agriculture into manufacturing.
Rapid industrialisation is possible. Many countries have gone through a phase of rapid industrialisation as part of their larger economic development, particularly in Asia, and their examples offer lessons that Africa can use to leap forward over the next decade.
Industrialising Africa: challenges and prioritiesThe reality today is that Africa is not making sufficient progress on industrialisation. Africa's share of global manufacturing exports remains less than 1%, compared with over 16% for East Asia. From 1975 to 2014, the African manufacturing sector’s contribution to the continent’s total economy actually declined from 18% to 11%, leaving it with the smallest share of any developing region. However, in absolute terms industrialisation is growing. Manufacturing production has increased, from $73 billion in 2005 to $98 billion in 2005 prices in 2013, due to strong growth in parts of Africa, domestic policy and institutional improvements, and rising wages in China (see Figure 5).
African manufacturing has grown at 3.5% annually in real terms over the past decade, which is faster than global growth in manufacturing production. The food and beverages sector increased faster than average, partly because of the importance of growing domestic demand. The textiles and clothing sector did less well, unable to withstand competition from Asian imports — but this is now changing due to increased Chinese investment in labour-
intensive garment manufacturing, for example in Ethiopia and Rwanda, and to growing regional markets.
Despite these improvements, the growth in the manufacturing sector has been insufficient to create much-needed jobs for the growing number of young Africans.
If Africans are to enjoy a higher standard of living, Africa needs to improve its economic performance. Today, the economies of African countries are facing several structural challenges:
◗ they rely on low value-adding activities, such as the extraction of oil, gas, and other minerals;
◗ insufficient investment in education and skills development, so that the labour force is poorly equipped to work in more complex sectors;
◗ they import far more manufactured goods than they export, a commercial imbalance that drains wealth away from their economies and uses scarce foreign currency;
◗ they remain dependent on limited value-added commodities;
◗ their trade balance in manufactured goods — which embody far more added value than the raw materials they are made from — is deeply negative: 62% of total imports into Africa are manufactured goods, compared with only 19% of its exports.
Figure 5 Real manufacturing production is increasing despite a fall in Africa’s share of manufacturing in GDP
Source: World Bank
Manufacturing value addedPercentage of GDP
Manufacturing value addedConstant 2005 $ billion
1977 1980 1983 1986 1989 1992 1995 1998 2001 2004 2007 2010 2013
19
18
17
16
15
14
13
12
11
10
1977 1980 1983 1986 1989 1992 1995 1998 2001 2004 2007 2010 2013
120
100
80
60
40
20
0
Africa has many of the ingredients of industrial success: abundant natural resources, a growing labour force and expanding domestic markets A
nnual D
eve
lopm
ent Effe
ctiveness R
evie
w 2
016
27
Chapter 3 – Industrialise Africa
These shortfalls are linked to the limited investment and growth in the domestic economies of many African countries. Given the demographic profile, considerable action is required to diversify production structures into higher employment-intensive activities, as 10 million new formal jobs are needed each year to absorb the massive youth population entering the market. African countries must build on recent gains by creating opportunities for social change, including critical human capital investments in education and skills. They must also take advantage of science, technology and innovations, to support industrial growth on the continent.
Without effective policies, African countries risk high youth unemployment, which may spark political instability. Africa also needs to solve its energy crisis. Without power, industrialisation cannot be achieved and therefore, the African Development Bank has made the New Deal for Energy its top priority. We believe that Africa must power itself in order to power its industries.
Africa also desperately needs more infrastructure investments in order to support industrialisation. We need roads, rail and ports to open up access to regional and global markets and enhance our ● competitiveness index, which has slightly increased from 3.61 to 3.64 from 2014 to 2015. A major achievement that is boosting private sector development is the ● time required for business start-up which has fallen from 42 days in 2010 to 25 days in 2015.
● Access to finance, currently one of the main obstacles to doing business in Africa, needs to be improved to enable enterprises to move up value chains. Only 31% of adults have access to an account at a bank or other financial institution.
Expanding the industrial sector will not be easy without stronger regional integration, which provides opportunities for intra-Africa trade. The pursuit of an African industrial revolution can only occur where large markets drive competitive production and build economies of scale in the context of regional integration.
The Bank’s role in Africa’s industrial transformation
The Bank has supported job creation and provided economic opportunities In the period 2013–2015, the AfDB’s support to private sector development has created more than 3 million ● jobs, of which almost 812 000 were for women. A total of 153 000 ● microcredits were granted while 5.7 million ● people benefited from investee projects and microfinance.
In Egypt, our support to strengthen and develop infrastructure has enhanced productivity and helped make firms more competitive, as well as helping to attract investors. Our investments in Egypt include $54.8 million supporting Egypt’s National Drainage programme to boost agricultural production, and $140 million for the Sharm El-Sheikh Airport expansion project, to increase the airport’s capacity from 10 million to 18 million passengers a year, supporting the country’s tourism and the establishment of well-developed transport links.
In South Africa, we financed a line of credit of $100 million in favour of the Industrial Development Corporation. The line of credit was used by the IDC to provide medium- and long-term financing to 103 small- and medium-scale enterprises and 4 large-scale enterprises, of which more than 60% were new industrial enterprises (see Box 6).
A core area of the Bank’s interventions in governance is addressing bottlenecks to private sector development and competitiveness. Overall, during 2013–2015, 9 out 15 countries supported by the Bank improved their ● competitive environment, reflecting challenges in some countries to set up a robust legal and regulatory environment to help private businesses invest, create jobs, and become more productive.
Examples of our support to reforms geared towards improving the investment climate include the Bank’s projects in Mauritius and the Seychelles. Both countries are now considered top performers on the continent with regard to ensuring an enabling business environment.
In the Seychelles, a key constraint to private sector development was poor access to finance, in particular growth of micro, small and medium-sized enterprises (MSME). The Bank helped the government to implement an MSME financing scheme, which greatly improved access to finance for MSMEs; over 670 businesses have benefited from the scheme.
Box 6 Financing industrialisation in South Africa
In 2000, we made available a line of credit of $100 million to finance small and medium-sized enterprises across various sectors including textiles, metals, machinery and chemicals. As a result, we helped create 16 000 jobs and contributed to the gross domestic product through increased turnovers totalling $340 million and annual tax revenues of $100 million.
The increased competition and competitiveness helped to bring down prices of some products in the market. One chemical company has increased competition in the soap and desinfectant industry, reducing its price from $1.8 per unit to $1 per unit, lower than the price of imported goods. The line of credit also had a positive impact on local suppliers. It was used to finance acquisition of technology and industrial inputs. About 40% of the resources were used to purchase equipment, machinery and raw materials from within South Africa.
AfDB’s support to private sector development has created more than 3 million jobs
28
Part 1: AfDB’s vital role in Africa’s transformation

Looking forward: What will it take to industrialise Africa?The experience of other industrialising economies around the world shows that Africa can realistically more than double its industrial GDP from $751 billion to $1.72 trillion within the next decade. This in turn would enable Africa to raise its continental GDP from $2.6 trillion to $5.62 trillion and its GDP per capita to $3368 by 2025.
For this to happen, Africa needs to implement a comprehensive and resolute industrial policy; one that can be adjusted for each country’s context, requirements and development goals. This will require vision and commitment from political leaders but also from the Bank and the broader development community, who will provide support through financing, technical assistance, capacity building, continuous dialogue and advisory services.
Experience suggests that creating opportunities for entrepreneurship (both new business creation and expansion of existing ones) is the most important driver of industrialisation. To achieve this, however, Africa needs to leverage the full strength of its partners in this area, including the Bank and the specialised expertise of organisations such as the United Nations Industrial Development Organisation and the United nations Economic Commission for Africa as well as that of a broader set of stakeholders including the African Union, regional economic communities, national governments, policy makers and development finance institutions.
Lessons from other industrialising countries in the developing world highlight five key enablers that have been common to almost all countries that have rapidly industrialised their economies. These enablers are:
◗ supportive policy, legislation and institutions; ◗ conducive economic environment and infrastructure; ◗ access to capital; ◗ access to markets; ◗ competitive talents, capabilities, and entrepreneurship.
In successful industrialising countries, these enablers have typically been integrated into a comprehensive industrial policy that has enabled businesses, both large and small, to develop along the value chains of selected, high-potential industrial sectors. These programmes are feasible and can be implemented with the right levers.
The Bank’s strategy to industrialise AfricaIndustrialising Africa and driving progress on each of the five enablers outlined above will require combined and coordinated efforts by a wide range of stakeholders, both public and private. That said, the Bank, as the premier financing institution on the continent,
can and should play a leading role in the “Industrialise Africa” agenda.
While it will intervene along with its partners in all identified programmes, the Bank plans to place a stronger focus on areas where it can best leverage its experience, capabilities and its finances to support countries by championing a subset of these programmes, grouped into the six “Flagship Programmes”, which are at the core of the Bank’s “Industrialise Africa” priority. To that end the Bank will:
◗ foster successful industrial policies; ◗ grow liquid and effective capital markets; ◗ catalyse funding in infrastructure and industry projects; ◗ promote and drive enterprise development; ◗ promote strategic partnerships; ◗ integrate African markets; ◗ accelerate flows of capital into African countries; ◗ accelerate the development of skills and technologies.
How will the Bank’s strategy be implemented?Through a partnership with UNIDO, UNECA, the African Union Commission and regional economic communities, the Bank will support governments in crafting their national industrial policies, identify potential sectors for industrial development, and provide value chain analysis, technical assistance and some degree of operational support. In addition, the Bank will strive to facilitate dialogue between governments and the private sector to foster coordination between all the industrialisation stakeholders.
Given the significant crosscutting agenda embedded in the Bank’s industrialisation strategy for Africa, our non-sovereign operations and Financial Sector Development teams will jointly take the lead and work with other departments and organisational units to deliver on the ambitious agenda within the framework of the One Bank Approach.
In this respect, the key initiatives the Bank is launching under the High 5s will have positive impacts on the economic environment, infrastructure, access to markets, and access to talent and capabilities, which in turn will foster industrialisation.
To deliver the six “Industrialise Africa” flagship programmes, the Bank needs to mobilise a large volume of funding, human resources, and hard and soft infrastructure-related mechanisms. Over the next 10 years, the Bank will invest $ 3.5 billion per year through direct financing and leveraging to implement the six programmes. This will cover non-sovereign operations, technical assistance pertaining to the industry clusters, investments in SMEs and linkage projects, establishment of a facility to increase liquidity
To “Industrialise Africa”, the Bank will leverage its experience, capabilities and its finances
We will invest $3.5 billion per year to implement six industry flagship programmes
Annual D
eve
lopm
ent Effe
ctiveness R
evie
w 2
016
29
Chapter 3 – Industrialise Africa
in African capital markets, technical assistance for capital markets and PPP-targeted projects and special fora dedicated to establishing strategic partnerships.
To increase and channel funding into Africa’s flagship industrialisation projects, the Bank Group will scale up its own investment, including from managed funds, to catalyse funding by others, acting as strategic investor or as lead arranger. Moreover, the Bank will develop its capability to drive mobilisation activities, i.e. play a lead arranger role, through improved processes and
relevant skills and expertise, while increasing its participation in co-financing activities.
In a nutshell, “Industrialise Africa” represents a bold vision and an ambitious strategy — one that has the potential to truly transform the continent. The Bank is committed to playing a leading role in achieving this vision — acting as a catalyst to build support from governments and other development finance institutions, and working with the private sector to turn the vision into reality, factory by factory, across the continent.
30
Part 1: AfDB’s vital role in Africa’s transformation

Chapter 4
Integrate Africa
Regional integration has been at the heart of Africa’s political agenda for many years. With 1 billion people, Africa has a combined GDP of more than $3.4 trillion. Such a market could create huge opportunities for producers on the continent. To make it a reality, African governments and regional economic communities need to cooperate to make it easier to move goods, services, people, money, energy and knowledge across borders.
However, regional integration is by no means easy to implement and Africa’s regional integration challenges are well known. In the first part of this chapter we review some of these challenges and the extent to which African countries trade with each other. The continent’s physical landscape makes connection between communities, countries, and even entire regions difficult.
We believe that linking African countries is critical to Africa’s economic transformation. For this reason, as the continent’s leading financier of infrastructure, we have a strong focus on regional connectivity. In the latter part of this chapter, we track our contribution to regional integration. We are not only investing in infrastructure such as roads, transmission lines, pipelines and communications networks, but also crafting and implementing coherent policies that open up borders.
Realising Africa’s potential: what integration could achieve When people talk about Africa integration they often talk about trade. Bringing down trade barriers is vital — but so is the free movement of people and financial integration. The Bank is focusing its integration efforts not just on movement of goods and services but also on mobility of people and investment.
Moving freely across Africa Enabling people to move freely across borders in Africa will give a powerful boost to economic growth. When people can travel with ease for business, employment, tourism or education, there are enormous potential benefits. Cross-border movement can support talent mobility and competitiveness. Skills gaps can be plugged and ideas exchanged, spreading entrepreneurship and innovation. When visa and work permit restrictions are reduced, businesses and economies become more competitive.
On average Africans need visas to travel to 55% of other African countries. They can get visas on arrival in only 25% of other countries and do not require a visa to travel to just 20% of other countries on the continent. In many cases, non-African travellers have easier access.
Some of Africa’s regional economic communities, including the East African Community (particularly Kenya, Rwanda and Uganda) and the Economic Community of West African States have facilitated their nationals’ movements among member countries. Progress in other
regional economic communities is less advanced, however, and the average ratification rate for protocols on free movement of persons remains at 60%.
The benefits of financial integrationWhen capital flows more freely across borders, investment increases, finance is allocated where it can generate the most productivity, and investors get higher returns. In turn, as transaction costs of doing business fall and financial institutions work more effectively, companies of all sizes benefit: micro-, small and medium-sized enterprises.
The Abuja Treaty, which sets out the continent’s integration pathway, establishes monetary union as a key priority. Yet many regional economic communities have not made their national currencies convertible; coordinating macroeconomic convergence at country level needs a greater push. As the global financial crisis has shown, being more capital-connected comes with risk. More data, information and transparency build confidence among national authorities and financial institutions, as does improving regulatory frameworks, safeguards and supervision.
Africans need visas to travel to 55% of other African countries
Annual D
eve
lopm
ent Effe
ctiveness R
evie
w 2
016
31
Chapter 4 – Integrate Africa

When capital flows more freely across borders, finance is allocated where it can generate the most productivity, and investors get higher returns
Financial integration is a complex process that covers policies (monetary policies, provision of financial services), infrastructure (legal and regulatory frameworks, payment systems), and financial institutions (bank, non-bank and capital markets). Actions that can make a difference include promoting banking across borders; standardising regional payments; putting in place multilateral fiscal guidelines; and joining up policy on inflation, public finance and exchange rate stability. By taking such steps, governments can create more predictable conditions in which cross-border trade and investment will thrive.
Though data are limited on intra-African foreign direct investment, it appears that such flows represent only a fraction of Africa’s own GDP. However, some African banks are opening branches across the continent, suggesting a potential for greater financial integration if barriers to cross-border lending are lowered further.
Trade integration: a long way to go● Inter-African trade increased from $145 billion in 2014 to $174 billion in 2015. Yet only 11.3% of trade in Africa is intra-regional and exports remain skewed towards raw minerals. Intra-African imports as a share of the continent’s GDP rose from around 2.7% in 1995 to around 4.5% in 2013, but this is low compared with regions such as the Americas (6.7%), Asia (17.9%) and Europe (21%). The ● cost of trading across borders, measured as the cost of shipping a container, has also increased by 11% since 2010, to $2384.
Numerous initiatives are under way to remedy this situation and unlock the power of regional trade to drive the economic transformation that Africa needs. In June 2015, two key shifts in Africa’s trade integration occurred. First, the Tripartite Free Trade Area Agreement between the Common Market for Eastern and Southern Africa (COMESA), the East African Community (EAC) and the Southern African Development Community (SADC) was signed. While much work remains to put it into effect, it marks a huge step towards rationalising Africa’s regional trade arrangements.
Second, the Continental Free Trade Area negotiations were formally launched. They are expected to last until the end of 2017 and will cover trade in goods and services, investment, intellectual property rights and competition policy.
Africa is also making progress in establishing legal frameworks to deepen trade integration among regional economic communities. In January 2015, the Economic Community of West African States (ECOWAS) launched its customs union, which eight of the bloc’s 15 member states began to implement through a common external tariff by April 2015. The Arab Maghreb Union (AMU) is coming closer to launching its own free trade area. Its member states have already signed three out of the four necessary protocols.
Several regional economic communities have reduced tariffs on intra-regional imports to a low level: EAC has a zero average applied tariff on imports within the bloc, while the Economic Community of Central African States (ECCAS) and COMESA both apply tariffs averaging around 1.9%. SADC’s intra-regional tariffs are higher at 3.8%, as are those of ECOWAS (5.7%). COMESA, EAC, ECOWAS and SADC have all adopted measures to facilitate transport and reduce non-tariff barriers.
INDICATORALL AFRICAN COUNTRIES OF WHICH ADF COUNTRIES
Baseline 2010 Latest 2015 Baseline 2010 Latest 2015
Integrate Africa
Intra-African trade (billion USD) 135.5 174.5 26.6 43.2
Cost of trading across borders (USD) 2145 2384 2338 2675
Access to telephone services (per 1000 people) 538 766 368 614
Road density (km per km2 of land area) 7.9 8.2 6.7 7.1
The bullets indicate that: Progress is strong and better than peers There has been regression against the baseline
Dev
elop
men
t in
Afr
ica
(See
Ann
ex 1
)
INDICATOR2013–2015 2016–2018
Expected Delivered Expected
Integrate Africa
Transport — Cross-border roads constructed or rehabilitated (km) 1339 1281 96% 6858
Energy — Cross-border transmission lines constructed or rehabilitated (km) .. .. .. 2556
The bullets indicate that: Bank operations achieved 95% or more of their targets Data are not available to measure progress
How
AfD
B c
ontr
ibut
es
to A
fric
a’s
deve
lopm
ent
(See
Ann
ex 2
)
32
Part 1: AfDB’s vital role in Africa’s transformation
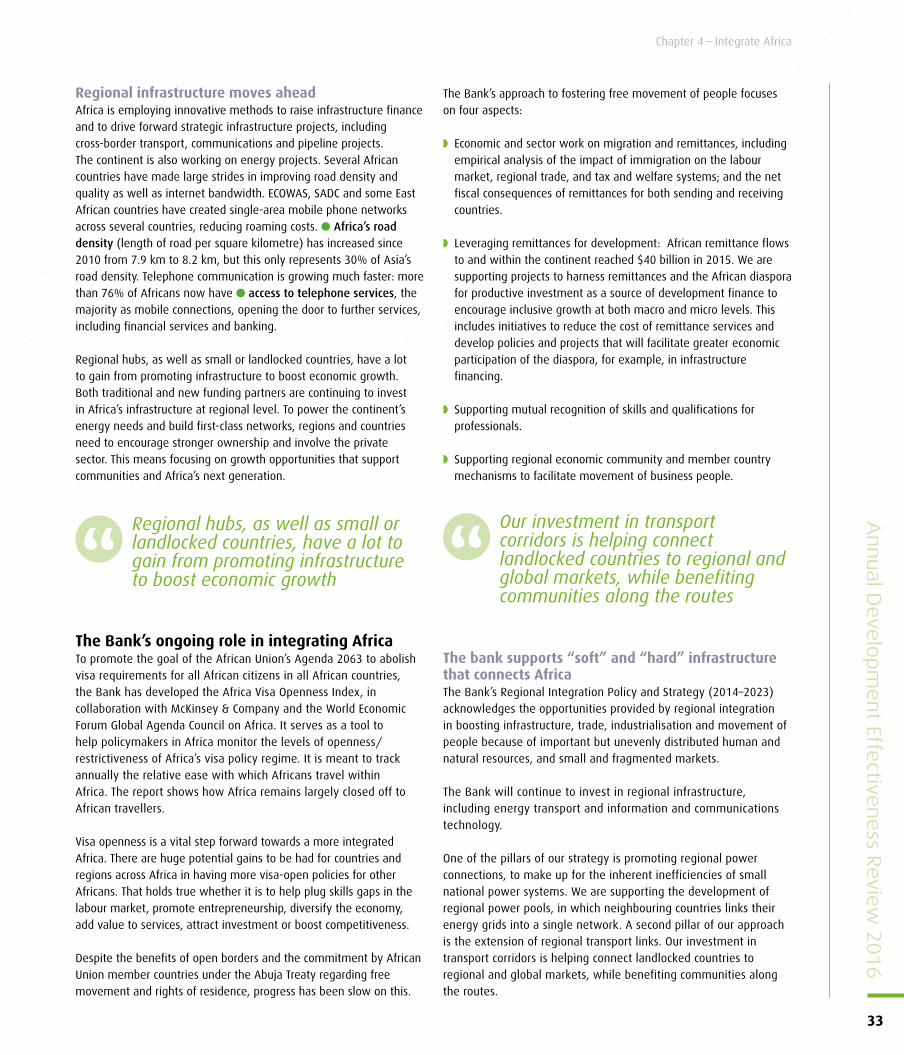
Regional infrastructure moves aheadAfrica is employing innovative methods to raise infrastructure finance and to drive forward strategic infrastructure projects, including cross-border transport, communications and pipeline projects. The continent is also working on energy projects. Several African countries have made large strides in improving road density and quality as well as internet bandwidth. ECOWAS, SADC and some East African countries have created single-area mobile phone networks across several countries, reducing roaming costs. ● Africa’s road density (length of road per square kilometre) has increased since 2010 from 7.9 km to 8.2 km, but this only represents 30% of Asia’s road density. Telephone communication is growing much faster: more than 76% of Africans now have ● access to telephone services, the majority as mobile connections, opening the door to further services, including financial services and banking.
Regional hubs, as well as small or landlocked countries, have a lot to gain from promoting infrastructure to boost economic growth. Both traditional and new funding partners are continuing to invest in Africa’s infrastructure at regional level. To power the continent’s energy needs and build first-class networks, regions and countries need to encourage stronger ownership and involve the private sector. This means focusing on growth opportunities that support communities and Africa’s next generation.
The Bank’s ongoing role in integrating AfricaTo promote the goal of the African Union’s Agenda 2063 to abolish visa requirements for all African citizens in all African countries, the Bank has developed the Africa Visa Openness Index, in collaboration with McKinsey & Company and the World Economic Forum Global Agenda Council on Africa. It serves as a tool to help policymakers in Africa monitor the levels of openness/restrictiveness of Africa’s visa policy regime. It is meant to track annually the relative ease with which Africans travel within Africa. The report shows how Africa remains largely closed off to African travellers.
Visa openness is a vital step forward towards a more integrated Africa. There are huge potential gains to be had for countries and regions across Africa in having more visa-open policies for other Africans. That holds true whether it is to help plug skills gaps in the labour market, promote entrepreneurship, diversify the economy, add value to services, attract investment or boost competitiveness.
Despite the benefits of open borders and the commitment by African Union member countries under the Abuja Treaty regarding free movement and rights of residence, progress has been slow on this.
The Bank’s approach to fostering free movement of people focuses on four aspects:
◗ Economic and sector work on migration and remittances, including empirical analysis of the impact of immigration on the labour market, regional trade, and tax and welfare systems; and the net fiscal consequences of remittances for both sending and receiving countries.
◗ Leveraging remittances for development: African remittance flows to and within the continent reached $40 billion in 2015. We are supporting projects to harness remittances and the African diaspora for productive investment as a source of development finance to encourage inclusive growth at both macro and micro levels. This includes initiatives to reduce the cost of remittance services and develop policies and projects that will facilitate greater economic participation of the diaspora, for example, in infrastructure financing.
◗ Supporting mutual recognition of skills and qualifications for professionals.
◗ Supporting regional economic community and member country mechanisms to facilitate movement of business people.
The bank supports “soft” and “hard” infrastructure that connects Africa The Bank’s Regional Integration Policy and Strategy (2014–2023) acknowledges the opportunities provided by regional integration in boosting infrastructure, trade, industrialisation and movement of people because of important but unevenly distributed human and natural resources, and small and fragmented markets.
The Bank will continue to invest in regional infrastructure, including energy transport and information and communications technology.
One of the pillars of our strategy is promoting regional power connections, to make up for the inherent inefficiencies of small national power systems. We are supporting the development of regional power pools, in which neighbouring countries links their energy grids into a single network. A second pillar of our approach is the extension of regional transport links. Our investment in transport corridors is helping connect landlocked countries to regional and global markets, while benefiting communities along the routes.
Regional hubs, as well as small or landlocked countries, have a lot to gain from promoting infrastructure to boost economic growth
Our investment in transport corridors is helping connect landlocked countries to regional and global markets, while benefiting communities along the routes
Annual D
eve
lopm
ent Effe
ctiveness R
evie
w 2
016
33
Chapter 4 – Integrate Africa
The Bank continues also to lead in several continent-wide initiatives in “soft” infrastructure, such as trade and services facilitation policies and instruments, including:
◗ the Continental Free Trade Area; ◗ the Comprehensive Africa Agriculture Development Programme; ◗ the Programme for Infrastructure Development in Africa; ◗ the Boosting Intra-African Trade agenda.
Overall, as a result of our projects, 1281 km of ● cross-border roads were constructed or rehabilitated between 2013 and 2015, close to our target. In Eastern Africa, we supported the Mombasa–Nairobi–Addis Ababa road corridor to help increase regional integration (see Figure 6).
We also recently approved an optical fibre backbone project in Central Africa that will help Cameroon develop a genuine digital economy in order to create more jobs. It will also extend the coverage of the national optical fibre network by filling the missing links and extending it to Cameroon’s borders with Congo, Nigeria and Central African Republic (see Box 7).
Looking forward: Realising the potential of integration to improve Africans’ livesAs part of the “Integrate Africa” priority, the Bank will foster regional integration through the Programme for Infrastructure Development in Africa. This includes developing regional energy markets, transnational railways and highways to link countries’ economic activities. It will support trans-boundary programmes including basin development, such as Lake Chad and Niger.
The Bank will work with other stakeholders to help regional economic communities and national authorities to integrate “soft” infrastructure, including by facilitating cross-border investments, eliminating non-tariff trade barriers, harmonising investment and engineering codes, and quality assurance and certification standards. This includes helping countries lift market barriers and
Main roadsPhase 1 constructionPhase 2 & 3 constructionOne stop border post
Road network
ERITREA
Aksu
Mekele
Gonder
Bahir DarGuba
Burë
Weldiya
Dese
DebreBirhan
Serdo
Asaita
Bïye K’obë
Dire Dawa
Awash Harrar
Degeh Bur
Jijiga
Korahe
Nazareth
Goba
Imi
Dolo Odo
Godere
Awasa
Negëlë
Yebelo
MegaMoyale
El WakBuna
TurbiKalecha
Dida
North Horr
Marsabit
Habaswein
LiboiGarba TulaMeru
EmbuGarissa
BuraKituiMagadi
NarokKisii
Kisumu
Kakamega Eldoret
NakuruNyeri
Garsen
MalindiVoi
Kwale
MerilleRiver
Kakuma
Lodwar
Kitale Maralal
Isiolo
Nek’emte
Assosa
BedeleMetu
Jima Hosa’ina
BongaSodo
Majï
Bako
Gambela
Gech’a
Agere Maryam
SUDAN
SOUTHSUDAN
UGANDA
TANZANIA
KENYA
ETHIOPIA
DJIBOUTI
SOMALIA
Addis Abeba
Nairobi
Mombasa
Figure 6 Driving integration in East Africa
The 2000 km road corridor linking the Kenyan port of Mombasa to the Ethiopian capital, Addis Ababa, through Kenya’s capital, Nairobi, is a key axis of regional integration in East Africa. As part of the planned Trans-African Highway from Cairo to Cape Town, it will put an end to a situation in which the two largest economies of East Africa share more than 1000 km of common border but not a single all-weather road connecting them.
Phase II of the project, begun in 2009, involves the construction to bitumen standard of 438 km of road and has been largely completed. Phase III is set to complete the rehabilitation of the missing road sections.
The Bank has played a key role in facilitating the project by stimulating administrative cooperation, customs harmonisation and political dialogue in the region. The two countries have signed a Road Transport Service Agreement that sets out conditions for the use of the transport infrastructure and provides a basis for dialogue on aligning transport rules and regulations.
That round of cooperation culminated in the signing of the Joint Ethiopia–Kenya Corridor development commission in Addis Ababa in April 2014, which approved the design of the one-stop border post to be constructed at the border town of Moyale.Source: AfDB
Box 7 An optical fibre backbone in central Africa
In July 2015, the Bank approved the first project of its new information and communication technology division: the installation of 916 km of optical fibre in Cameroon is a first step to create a “Central African Backbone” for new technologies. The project will extend the coverage of the national optical fibre network by filling in the missing links and extending the network to Cameroon’s borders with Congo, Nigeria and Central African Republic. By increasing the supply of high-quality broadband electronic communication services at competitive prices, the project will help Cameroon develop a genuine digital economy to create jobs.
The project also envisages the implementation of ICT applications and services, such as e-banking, and systems for delivering information on markets and climate. The project implementation will span four years and includes institutional support as well as capacity building for the project beneficiaries. The total project cost is estimated at $51 million. The Bank will provide $41 million.
34
Part 1: AfDB’s vital role in Africa’s transformation
formalise women’s participation in cross-border trade. Through changes in the visa regime we will promote the movement of people.
The Bank also aims to work with countries to deepen regional financial markets. We will support operations to promote robust,
market-based monetary systems. We will also finance projects supporting financial stability and integration of financial markets.
Finally, we will continue to develop new approaches to increasing the leverage of our relatively limited concessional resources. This can be done externally through co-financing with other donors, in public-private partnerships or through innovative financial solutions such as infrastructure bonds.
Overall, these actions will expand Africa’s regional markets and reduce the costs of trading for African countries, but will require political will, financial commitment and a strong sense of solidarity.
The Bank will support operations to promote robust, market-based monetary systems
Annual D
eve
lopm
ent Effe
ctiveness R
evie
w 2
016
35
Chapter 4 – Integrate Africa
Chapter 5
Improve the quality of life for the people of Africa
In recent decades, African countries have designed ambitious policies aimed at boosting education, health, access to water, labour market opportunities and other factors that improve quality of life. In this chapter we show that while most countries have made advances in at least one area, progress has not been sufficient. Overall poverty rates are still hovering around 43%. By some estimates, more than half of Africa’s
youth are unemployed, underemployed or inactive. Health and education outcomes are among the lowest in the world and the continent’s population has insufficient access to sanitation and safe drinking water. While economic growth has been relatively strong, it has not been rapid or inclusive enough to create jobs. More Africans need to see the benefits of economic growth in their daily lives.
Our Ten-Year Strategy was designed to bring about Africa’s economic transformation, built on growth that is both inclusive and green. In this chapter we demonstrate our contribution to improving access to basic services that are a catalyst for productivity and growth in other important sectors of activity. Our support to education helps young Africans develop the skills they need to find jobs, establishing the foundations of a productive workforce and creating opportunities for employment. We conclude by assessing Africa’s progress and our contribution in promoting gender equality, strengthening governance and accountability, building resilience in fragile situations and addressing climate change.
Improving access to basic services and employment opportunitiesAccess to basic services is a vital component of quality of life. In Africa, ● access to safe drinking water is improving slowly: almost a quarter of the current African population has gained access to an improved drinking water source since 2000. Today 71% of Africa’s population has access to safe drinking water. Wide rural-urban disparities in access to safe drinking water tend to pull down national aggregate figures: over 90% of the richest quintile in urban areas use improved water sources, and over 60% have piped water on the premises. In rural areas, piped-in water is non-existent in the poorest 40% of households, and less than half of the population use any form of improved source of water. At the same time, ● access to improved sanitation facilities has improved only slightly since 2010, reaching 39% of the population.
For Africa’s poor people, a heavy burden of communicable diseases and nutritional deficiencies reduces their productivity, their quality of life and their life expectancy. Poor households are particularly vulnerable to health shocks that impoverish them even further. ● Life expectancy across Africa improved gradually until 2011, but has remained at 59 years since then. Some countries have done better than others — for example, there has been remarkable
progress in Ethiopia, where life expectancy for men has risen by almost 16 years, from 45.5 in 1990 to 61 in 2013 (see Figure 7).
Education for all remains a challenge in many African countries. According to UNESCO, 16 of the 20 countries that are most challenged in terms of schooling progress since 2000 are in Africa. ● Enrolment in education remained at 45% in 2013, the same level as in 2010. Nevertheless, there has been some notable progress. In 2015 in francophone Africa, 8 of every 10 children were going to school, up from only 5 in 1990. Kenya provides another example of progress in education (see Figure 8).
In parallel, budgets for education have increased much more in Africa than in the rest of the world. In Ghana, education represents more than one-third of budget spending. Ethiopia, Kenya and Tanzania have abolished tuition fees at the primary level, enabling many children to gain access to education.
In Ethiopia, life expectancy for men has risen by almost 16 years, from 45 in 1990 to 61 in 2013
36
Part 1: AfDB’s vital role in Africa’s transformation
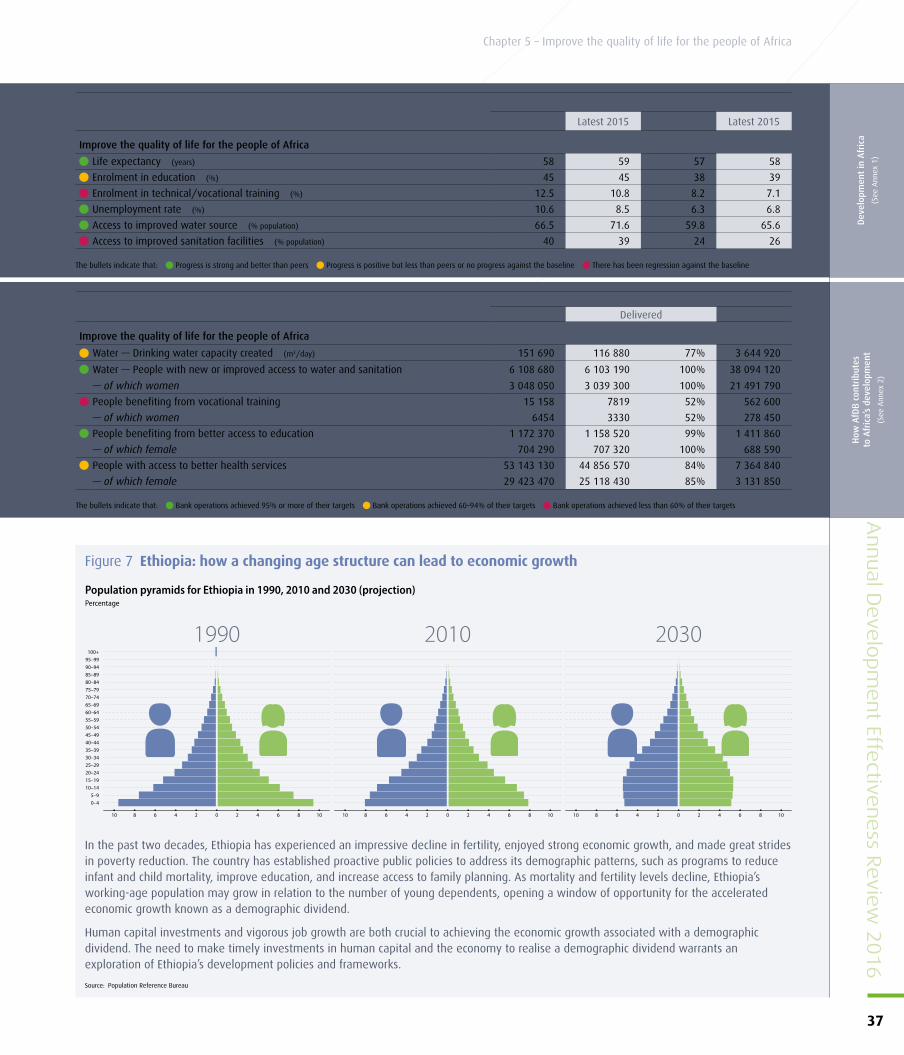
100+95–9990–9485–8980–8475–7970–7465–6960–6455–5950–5445–4940–4435–3930–3425–2920–2415–1910–14
5–90–4
10 8 6 4 2 0 2 4 6 8 1010 8 6 4 2 0 2 4 6 8 1010 8 6 4 2 0 2 4 6 8 10
1990 2010 2030
Figure 7 Ethiopia: how a changing age structure can lead to economic growth
In the past two decades, Ethiopia has experienced an impressive decline in fertility, enjoyed strong economic growth, and made great strides in poverty reduction. The country has established proactive public policies to address its demographic patterns, such as programs to reduce infant and child mortality, improve education, and increase access to family planning. As mortality and fertility levels decline, Ethiopia’s working-age population may grow in relation to the number of young dependents, opening a window of opportunity for the accelerated economic growth known as a demographic dividend.
Human capital investments and vigorous job growth are both crucial to achieving the economic growth associated with a demographic dividend. The need to make timely investments in human capital and the economy to realise a demographic dividend warrants an exploration of Ethiopia’s development policies and frameworks.
Source: Population Reference Bureau
Population pyramids for Ethiopia in 1990, 2010 and 2030 (projection)Percentage
INDICATORALL AFRICAN COUNTRIES OF WHICH ADF COUNTRIES
Baseline 2010 Latest 2015 Baseline 2010 Latest 2015
Improve the quality of life for the people of Africa
Life expectancy (years) 58 59 57 58
Enrolment in education (%) 45 45 38 39
Enrolment in technical/vocational training (%) 12.5 10.8 8.2 7.1
Unemployment rate (%) 10.6 8.5 6.3 6.8
Access to improved water source (% population) 66.5 71.6 59.8 65.6
Access to improved sanitation facilities (% population) 40 39 24 26
The bullets indicate that: Progress is strong and better than peers Progress is positive but less than peers or no progress against the baseline There has been regression against the baseline
Dev
elop
men
t in
Afr
ica
(See
Ann
ex 1
)
INDICATOR2013–2015 2016–2018
Expected Delivered Expected
Improve the quality of life for the people of Africa
Water — Drinking water capacity created (m3/day) 151 690 116 880 77% 3 644 920
Water — People with new or improved access to water and sanitation 6 108 680 6 103 190 100% 38 094 120
— of which women 3 048 050 3 039 300 100% 21 491 790
People benefiting from vocational training 15 158 7819 52% 562 600
— of which women 6454 3330 52% 278 450
People benefiting from better access to education 1 172 370 1 158 520 99% 1 411 860
— of which female 704 290 707 320 100% 688 590
People with access to better health services 53 143 130 44 856 570 84% 7 364 840
— of which female 29 423 470 25 118 430 85% 3 131 850
The bullets indicate that: Bank operations achieved 95% or more of their targets Bank operations achieved 60–94% of their targets Bank operations achieved less than 60% of their targets
How
AfD
B c
ontr
ibut
es
to A
fric
a’s
deve
lopm
ent
(See
Ann
ex 2
)
Annual D
eve
lopm
ent Effe
ctiveness R
evie
w 2
016
37
Chapter 5 – Improve the quality of life for the people of Africa

Unemployment, particularly among Africa’s growing youth population of over 400 million, is estimated to be 48% in sub-Saharan Africa1 and is a threat to social cohesion and inclusive development. Across Africa, ● unemployment rates have increased since last year, from 8.2% to 8.5%. And there is a much broader issue of underemployment and vulnerability of employment.
After leaving school, a majority of young people enter the informal economy. The informal economy in Africa contributes 50–80% of GDP, 60–80% of employment and 90% of new jobs. It is estimated that 9 out of 10 workers in both rural and urban areas hold only informal jobs. The informal sector is characterised by lower incomes and a lack of job security and sustainability.
Though young people are better educated than previous generations, their prospects for gainful employment have not increased. The vocational training sector is still not well developed in sub-Saharan Africa; only a few governments are able to finance technical and vocational education and training at the level that
1 30% in North Africa
is needed. Since 2010, ● enrolment in technical/vocational training in Africa has stayed stable at 10.8% — that is, of all students enrolled in secondary education, only 10.8% are enrolled in technical/vocational programmes at public and private upper secondary education institutions. This gives an idea of the limited extent to which African young people are being equipped with job skills.
The Bank’s contribution to improving Africans’ quality of life The AfDB is focusing its investments on education, vocational training and skills development. We are embarking on innovative programmes and financing approaches to accelerate job creation and allow Africa’s greatest demographic asset — its young people — to contribute to its economic prosperity. We will also continue to invest in improving access to basic services such as water and sanitation. The Ebola crisis was a wake-up call for the continent and the Bank: we must invest heavily in public health care systems in order to build Africa’s resilience in the face of health epidemics and emergencies.
Building resilient public health systemsWe are working to promote inclusion through improved service delivery in the health sector. In Tanzania, we supported the reduction of maternal mortality in Mara, Tabora and Mtwara Regions on the mainland and the Islands of Zanzibar. In these remote areas, there were no viable options for maternal and child health care.
Figure 8 Beyond basic education in Kenya
Kenya has lengthened the time children spend in school, increasing secondary school gross enrolment from 40% in the early 2000s to 67% in 2012 and inspiring more students to join higher education — enrolment in public universities more than doubled between 2008 and 2013. Strong demand for higher-level qualifications and free primary education explain this growth. On the day the Government introduced free primary education in 2003, an extra 1.1 million students went to school. In parallel, public spending on education rose by 42% in real terms between 2004 and 2011. Decentralised funding has also supported infrastructure development and bursaries.
Source: ODI
Average number of years children spend in school
Enrolment in public universities
Children transitioning from primary to secondary school
8 years2000
11 years2009
46%2002
77%2012
97 0002007
201 0002012
The informal economy in Africa contributes 60–80% of employment and 90% of new jobs
38
Part 1: AfDB’s vital role in Africa’s transformation
Since the Ebola outbreak, we have continued to support Guinea, Liberia and Sierra Leone by contributing to the availability of selected basic social services and the restoration of livelihoods and economic opportunities. Our Post-Ebola Recovery Social Investment Fund, co-funded with the U.S. State Department, is targeting Ebola-affected communities to finance demand-driven, small-scale business activities. It is expected to play a catalytic role in improving community response to outbreaks, thereby contributing to inclusive growth, gender equality and poverty reduction in the three affected countries.
Overall, during the last three years, our operations provided 44.8 million people — of whom 25 million were female — with ● access to better health services.
Investing in education and vocational trainingWe are committed to building up the availability of technical skills so that African economies can realise their full potential in high-technology sectors.
In Kenya, for example, we contributed to improved access, affordability and quality of education and training services. We supported increased physical access and improved the conditions for the teaching of science and mathematics. We also provided increased access and learning opportunities to disadvantaged children, including those with special educational needs, and contributed to the development of a more relevant and appropriate national technical, industrial, vocational and entrepreneurship training system. Scholarship support to 20 303 poor and needy students (33% girls) enabled 350 schools to admit and retain needy students.
Through our work in education, science and technology, 18 000 teachers and other educational staff were recruited or trained. Overall, more than 1.1 million ● people benefited from better access to education.
Providing sustainable water and sanitation servicesAccess to safe water supply and improved sanitation is essential to improve health and education and to enhance food security and nutrition. Therefore, expanding access to clean water and better sanitation is a strategic priority for the Bank. With a strong emphasis on rural communities and small and medium-sized towns, we are providing sustainable water and sanitation services to the most underserved areas in Africa. In Cameroon, for example, our sanitation infrastructure project helped improve the living conditions of 300 000 people in the capital, Yaoundé, mainly in poor residential areas (see Box 8).
In Rwanda, we enhanced water security for over 700 000 people in rural communities through the development of sustainable water supply and sanitation infrastructure, institutional support and programme management. The project contributed to the achievement of MDG 7 for both sanitation and hygiene for the project area and reduced the average time beneficiaries had to walk to collect water from 4.5 hours to 30 minutes. This allowed women to increase their involvement in income-generating activities, particularly market gardening, and allowed girls to improve their school attendance and performance.
Overall, our projects created 116 000 ● m3 of drinking water capacity. During 2013–2015 more than 6.1 million ● people benefited from improved access to water and sanitation as a result of our projects, including 3 million women.
A recent Bank impact evaluation looked at the rural water supply and sanitation programme in Ethiopia. The programme had significant impact on access to and use of improved water sources in selected communities, but was not effective in ensuring the water was completely safe for drinking at the source and point of use. Poor-quality water and sanitation facilities and services, combined with irregular water quality testing and treatment, could undermine positive health outcomes. We derive lessons from such evaluations and use them to improve the design and implementation of similar projects.
We are committed to building up the availability of technical skills so that African economies can realise their full potential
More than 6.1 million people benefited from improved access to water and sanitation as a result of our projects
Box 8 Supporting flood-resilient cities
Our sanitation infrastructure project in Yaoundé, the capital of Cameroon, aimed at limiting the floods that disrupt the city’s socioeconomic activities and improving the living conditions of 300 000 people in the poor areas.
The project is an example of how we promote the development of flood-resilience in cities. This investment reduced the number of floods from 15 to 3 per year and reduced the prevalence of malaria from 16% to 12%. It led to the creation of 755 direct and 1 070 indirect jobs, including jobs related to landscaping and pre-collection of solid waste.
A second phase of the project—to extend the canal built in the first phase—has just started, with co-financing from the government, the French Development Agency and the Global Environment Facility. This phase will include hygiene and environmental aspects related to wastewater management and will benefit 1.8 million people, 49% of them women.
Annual D
eve
lopm
ent Effe
ctiveness R
evie
w 2
016
39
Chapter 5 – Improve the quality of life for the people of Africa

Strategic cross-cutting issuesScaling up implementation in the five priority areas of the Ten-Year Strategy will be possible only if critical cross-cutting areas such as gender, governance, fragility and climate change are brought fully into the mainstream of the Bank’s operations to achieve greater impact creating jobs and reducing poverty.
Gender equalityEquality for women is progress for all. Better inclusion of women in institutional, social and economic matters is an important goal in its own right. It is also a key driver of economic competitiveness: economies that harness women’s energy and talent outperform those that do not. Empowering women by providing equal access to education, land and credit, ensuring their equal legal rights, enabling their participation in public life, and integrating them into the labour market can foster productivity and growth, and reduce poverty. In Africa, ● women’s participation in the labour market has remained stagnant for several years at 42.5%, indicating that much more needs to be done to improve the participation of women.
The Bank is committed to promoting gender equality as an essential driver of progress and sustainable development. We are engaging with countries to address gender issues directly through our operations and indirectly by placing special emphasis on mainstreaming gender throughout all our operations.
Small and medium-sized enterprises (SMEs) are significant drivers of economic growth, job creation and poverty alleviation in Africa. However, it is estimated that only a third of formal African SMEs are owned by women, who often have limited access to finance when establishing SMEs. The Bank is therefore making a concerted effort to increase the involvement of women as a means for economic empowerment.
In Senegal, our competitiveness project supports women’s entrepreneurship by establishing an SME guarantee and financing scheme. In Mozambique, the Bank is supporting women’s entrepreneurship by improving access to financial services and helping overcome barriers that hinder business creation. In Burkina Faso, we financed “one-stop shops” to provide training and assistance to women for business registration. This led to a 49% increase in the number of registered women-led businesses, from 708 in 2010 to 1 052 in 2014.
Our governance projects also support policy reform and gender-responsive budgeting initiatives to promote gender equality. There
INDICATORALL AFRICAN COUNTRIES OF WHICH ADF COUNTRIES
Baseline 2010 Latest 2015 Baseline 2010 Latest 2015
Strategic cross cutting areas
Women’s participation in the labour market (%) 42.3 42.5 46.2 46.2
Mo Ibrahim Index of African Governance (index) 51 50 47 47
Tax and non-tax fiscal revenues (% of GDP) 16.7 16.1 13.1 13.7
Index of effective and accountable government (index) 3 2.8 3.3 2.9
Country Policy and Institutional Assessment (CPIA) score 3.4 3.4 3.2 3.4
Gender-Sensitive Country Institutions (index) .. 0.3 .. 0.3
Share of population living in fragile countries (%) 22 24 39.3 39.2
Institutional capacity for environmental sustainability (index) 3.5 3.5 3.3 3.4
The bullets indicate that: Progress is strong and better than peers Progress is positive but less than peers or no progress against the baseline There has been regression against the baseline Data are not available to measure progress
Dev
elop
men
t in
Afr
ica
(See
Ann
ex 1
)
INDICATOR2013–2015 2016–2018
Expected Delivered Expected
Strategic cross cutting areas
Countries with improved quality of budgetary and financial management 18 17 94% ..
Countries with improved quality of public administration 6 6 100% ..
Countries with improved transparency, accountability and corruption mitigation in the public sector
20 15 75% ..
Countries with improved procurement systems 9 5 56% ..
Countries with improved competitive environment 15 9 60% ..
The bullets indicate that: Bank operations achieved 95% or more of their targets Bank operations achieved 60–94% of their targets
How
AfD
B c
ontr
ibut
es
to A
fric
a’s
deve
lopm
ent
(See
Ann
ex 2
)
Women’s participation in the labour market has remained stagnant for several years at 42.5%
40
Part 1: AfDB’s vital role in Africa’s transformation
The implementation of the High 5 will require undertaking important governance and regulatory reforms to promote an enabling business environment
is an increased emphasis on the use of gender indicators and the collection of gender-disaggregated data to monitor the impact of policies and programmes.
In another approach to improving the welfare of African women, we have started to engage in the clean cooking sector through the Sustainable Energy Fund for Africa (SEFA) and the Sustainable Energy for All (SE4All) Africa Hub. SEFA approved a project that will finance a bio-refinery producing clean cooking fuel in Nigeria, and more than 10 sub-Saharan countries are receiving support to prepare the SE4All Action Agenda, which establishes the objectives for 2030 for access to clean cooking solutions.
Governance and accountabilityGovernance progress as measured by the ● Mo Ibrahim Index of African Governance has been slow, except in political participation. The 54 countries on the continent receive diverse scores, each showing specific patterns along a wide range of results, with a more than 70-point gap between the top-ranking country, Mauritius, and the bottom-ranking country, Somalia.
Over the recent period, we have achieved our strongest results in ● quality of public administration and ● budgeting and financial management. Of countries in which the Bank has supported relevant reforms, 100% improved their public administration and 94% their financial management. Given the importance of governance and accountability in promoting inclusive growth, the Bank supports its regional member countries in strengthening their public financial management systems (particularly in Sierra Leone, Niger, Burundi, Sudan and Tanzania) and promoting business-enabling environments.
Delivery on these areas of work has been further enhanced by the Bank’s new Governance Strategy and Action Plan, which also gives special focus to enhancing voice and accountability; addressing governance for improved service delivery in core sectors such as energy, health and education; and improving management of natural resources.
We have also had commendable results in improving ● transparency, accountability and corruption mitigation (75% of countries in which the Bank has supported relevant reforms). We have, however, encountered some challenges in supporting countries in ● improving their procurement systems (56%) and ● their competitive environment (60%).
A core area of the Bank’s business is addressing bottlenecks to private sector development and competitiveness. For the Bank, the
implementation of the five high-priority areas will require strengthening national capacities as well as undertaking important governance, legal and regulatory reforms to promote an enabling business environment. Our governance operations have achieved results across all of these areas: improved policy and institutional frameworks, greater transparency and accountability of government, increased revenue collection, and improved conditions for doing business.
Examples of support for reforms geared towards improving the investment climate include our work in Mauritius and the Seychelles. Both countries are now considered to be top performers on the continent in ensuring a business-enabling environment. In the Seychelles, a key constraint to private sector development, in particular the growth of the micro, small and medium-sized enterprise (MSME) and SME sector, was poor access to finance. The Bank supported the government’s reforms to implement a new MSME financing scheme that greatly improved access to finance, with over 670 businesses benefiting. Other policy reforms included establishing the Financial Supervision Agency; passing legislation on payment systems; passing a new legal practitioner’s bill; developing a competition policy; and approving new procurement regulations. All of these contributed to improving the business-enabling environment and, in particular, the development of the financial sector.
As external sources of financing become more constrained, African governments will, more than ever, need to tap into their countries’ additional revenue potential if they want to maintain their development efforts in a sustainable way. Domestic resource mobilisation was central to the agenda of the Financing for Development Conference in July 2015. In the outcome document, countries agreed to an array of measures aimed at widening the revenue base, improving tax collection, and combatting tax evasion and illicit financial flows.
In 2015, ● tax and non-tax fiscal revenues as a proportion of GDP — at 16% — have not progressed much since 2005. Some countries are showing good progress in domestic revenue mobilisation, but from a low starting point. There were some downward pressures on trade tax revenue as countries engaged in trade liberalisation to support regional integration, and some countries (Botswana, Nigeria, and Zambia) also faced a decrease in revenue because of commodity price falls and inefficient tax collection systems. Governance challenges need to be addressed to ensure that African states have the capacity to raise revenues and deliver public services effectively and efficiently.
Thus the Bank has given particular priority to strengthening domestic resource mobilisation, with a focus on taxation, natural resource management, stemming illicit financial flows, and strengthening fiscal revenue administration systems. Effective taxation that provides a reliable and sustainable source of revenue to governments can have an exponential effect on recovery and growth. Unfortunately, many African countries face challenges in implementing and maintaining effective tax collection systems because of weak institutional capacity and a lack of incentives to comply.
Annual D
eve
lopm
ent Effe
ctiveness R
evie
w 2
016
41
Chapter 5 – Improve the quality of life for the people of Africa

In Niger, the Bank’s effective support for tax reforms led to the creation of 20 new tax collection points and an increased rate of taxation — from 15% in 2011 to 17% by 2013 (see Box 9). We have also given particular attention to improving the governance of natural resources — especially extractives, which are important as a source of revenue. In Tanzania, for example, the Bank supported the ongoing reform of the tax system, as well as greater transparency in the extractives sector. As a result, in 2012 Tanzania reached compliance with the Extractive Industries Transparency Initiative (EITI).
Fragility and building resilienceMore than 250 million people in Africa live in countries that are affected by conflict and fragility — the share of the African ● population living in fragile countries is 24%.
The principle of “leaving no one behind” through the development of inclusive societies is at the core of the Sustainable Development Goals (SDGs). The Bank recognises that the SDGs cannot be delivered without efforts to tackle fragility and build resilience, in both the short and the long term.
The Bank approaches fragility by applying a “fragility lens” to guide its strategic and operational engagement. In implementing the five high-priority areas, the Bank continues to champion interventions that are fragility-proofed.
In fragile situations, agriculture development offers realistic prospects for large-scale job creation, reducing further potential conflicts over limited land and natural resources. In the same vein, private sector development through increased access to energy and industrialisation is important for transitioning out of fragility. Fragility also has a regional dimension: many of the drivers of fragility, including scarcity of water resources, climate change, and other environmental losses, are regional in nature.
Countries in fragile situations are often the ones most vulnerable to climate change. There is an important overlap between countries with fragile situations and those that are most vulnerable to climate change (see Figure 9). Changing climatic conditions therefore act as a “risk multiplier”, interacting with drivers of fragility — political and economic instability, wealth disparities, weak governance, and historical grievances — to exacerbate existing conflicts or trigger new ones.
The AfDB has been the first multilateral development bank to recognise the nexus of fragility and climate change through the work of its High-Level Panel on Fragile States and its Strategy for Addressing Fragility and Building Resilience in Africa, which explicitly considers the environmental dimension of fragility. The risks of climate change are highest in regions that combine environmental fragility with poorly diversified economies, high dependence on rain-fed agriculture and public institutions that lack the capacity or willingness to support adaptation and conflict management. Other risks include climate-induced migration and accelerated urbanisation.
The fragility-climate change challenge requires regional approaches. The more extreme the event in one country, the more likely it will affect neighbouring countries.
The Bank has increased its efforts to design and implement regional initiatives that address the climate change-fragility nexus. In a first phase, it has targeted the Sahel, the Horn of Africa and the Lake Chad Basin (see Box 10). While these operations are still in their early phases, they are indicative of the shift in the Bank’s approach to fragile situations, complementing national operations with regional interventions and working with and through such regional institutions as the Intergovernmental Authority on Development, the Permanent Interstate Committee for Drought Control in the Sahel, and the Lake Chad Basin Commission.
The climate change opportunityAddressing climate change is at the heart of our mission to address poverty by spurring sustainable economic development and social progress. Our investments can create opportunities for Africa to adopt a low-carbon, climate-resilient development pathway that
In Niger, the Bank’s effective support for tax reforms led to an increased rate of taxation — from 15% in 2011 to 17% by 2013
Countries in fragile situations are often the ones most vulnerable to climate change
Box 9 Supporting inclusive growth and the strengthening of food security
In Niger, we supported the Programme for Inclusive Growth and the Strengthening of Food Security through a successful collaboration between our governance and agriculture operational teams. The programme improved internal revenue collection and contributed to greater transparency and efficiency in the expenditure chain. The tax ratio increased from 15% in 2011 to 17% in 2013, and the Public Expenditure and Financial Accountability (PEFA) score also improved. The project addressed critical governance constraints to the development of the agriculture sector for enhanced food security, including the adoption of related key policies, strategies and action plans to guide the implementation. Reforms supported included adopting a strategy to expand irrigation, improving access to agricultural inputs, and removing trade barriers. Niger managed to stabilise the food insecurity vulnerability index at 15%. Finally, we assisted in improving the business climate and the competitiveness of agro-industries with the development of an action plan for the reform of import-export procedures and the establishment of a business centre.
42
Part 1: AfDB’s vital role in Africa’s transformation
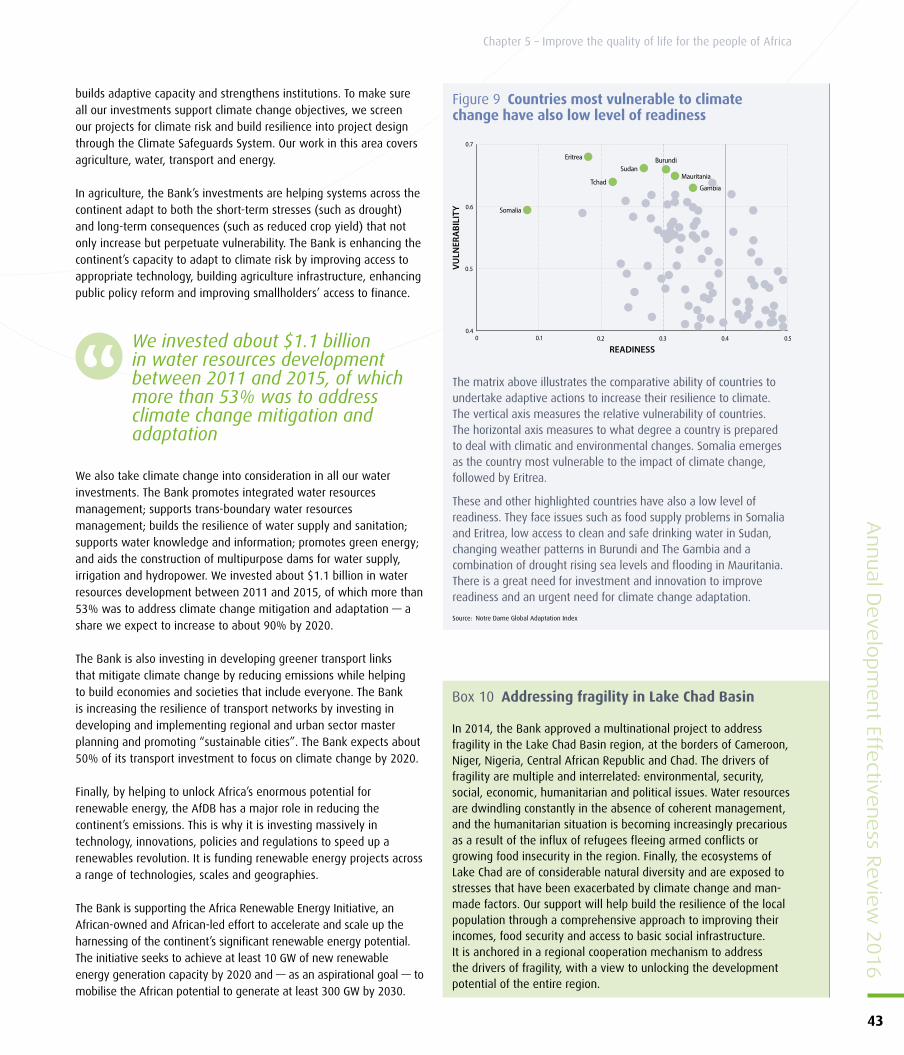
We invested about $1.1 billion in water resources development between 2011 and 2015, of which more than 53% was to address climate change mitigation and adaptation
Box 10 Addressing fragility in Lake Chad Basin
In 2014, the Bank approved a multinational project to address fragility in the Lake Chad Basin region, at the borders of Cameroon, Niger, Nigeria, Central African Republic and Chad. The drivers of fragility are multiple and interrelated: environmental, security, social, economic, humanitarian and political issues. Water resources are dwindling constantly in the absence of coherent management, and the humanitarian situation is becoming increasingly precarious as a result of the influx of refugees fleeing armed conflicts or growing food insecurity in the region. Finally, the ecosystems of Lake Chad are of considerable natural diversity and are exposed to stresses that have been exacerbated by climate change and man-made factors. Our support will help build the resilience of the local population through a comprehensive approach to improving their incomes, food security and access to basic social infrastructure. It is anchored in a regional cooperation mechanism to address the drivers of fragility, with a view to unlocking the development potential of the entire region.
builds adaptive capacity and strengthens institutions. To make sure all our investments support climate change objectives, we screen our projects for climate risk and build resilience into project design through the Climate Safeguards System. Our work in this area covers agriculture, water, transport and energy.
In agriculture, the Bank’s investments are helping systems across the continent adapt to both the short-term stresses (such as drought) and long-term consequences (such as reduced crop yield) that not only increase but perpetuate vulnerability. The Bank is enhancing the continent’s capacity to adapt to climate risk by improving access to appropriate technology, building agriculture infrastructure, enhancing public policy reform and improving smallholders’ access to finance.
We also take climate change into consideration in all our water investments. The Bank promotes integrated water resources management; supports trans-boundary water resources management; builds the resilience of water supply and sanitation; supports water knowledge and information; promotes green energy; and aids the construction of multipurpose dams for water supply, irrigation and hydropower. We invested about $1.1 billion in water resources development between 2011 and 2015, of which more than 53% was to address climate change mitigation and adaptation — a share we expect to increase to about 90% by 2020.
The Bank is also investing in developing greener transport links that mitigate climate change by reducing emissions while helping to build economies and societies that include everyone. The Bank is increasing the resilience of transport networks by investing in developing and implementing regional and urban sector master planning and promoting “sustainable cities”. The Bank expects about 50% of its transport investment to focus on climate change by 2020.
Finally, by helping to unlock Africa’s enormous potential for renewable energy, the AfDB has a major role in reducing the continent’s emissions. This is why it is investing massively in technology, innovations, policies and regulations to speed up a renewables revolution. It is funding renewable energy projects across a range of technologies, scales and geographies.
The Bank is supporting the Africa Renewable Energy Initiative, an African-owned and African-led effort to accelerate and scale up the harnessing of the continent’s significant renewable energy potential. The initiative seeks to achieve at least 10 GW of new renewable energy generation capacity by 2020 and — as an aspirational goal — to mobilise the African potential to generate at least 300 GW by 2030.
0 0.1 0.2 0.3 0.4 0.50.4
0.5
0.6
0.7
READINESS
VULN
ERA
BILI
TY
Gambia
Mauritania
Burundi
Tchad
Sudan
Somalia
Eritrea
Figure 9 Countries most vulnerable to climate change have also low level of readiness
The matrix above illustrates the comparative ability of countries to undertake adaptive actions to increase their resilience to climate. The vertical axis measures the relative vulnerability of countries. The horizontal axis measures to what degree a country is prepared to deal with climatic and environmental changes. Somalia emerges as the country most vulnerable to the impact of climate change, followed by Eritrea.
These and other highlighted countries have also a low level of readiness. They face issues such as food supply problems in Somalia and Eritrea, low access to clean and safe drinking water in Sudan, changing weather patterns in Burundi and The Gambia and a combination of drought rising sea levels and flooding in Mauritania. There is a great need for investment and innovation to improve readiness and an urgent need for climate change adaptation.
Source: Notre Dame Global Adaptation Index
Annual D
eve
lopm
ent Effe
ctiveness R
evie
w 2
016
43
Chapter 5 – Improve the quality of life for the people of Africa
In December 2015, 195 countries meeting in Paris unanimously approved the first universal climate agreement, pledging to keep global temperatures “well below” 2.0 degrees Celsius above pre-industrial times and "endeavouring to limit" them even more, to 1.5C. The AfDB provided support to the coherent structure that was established through the African Group of Negotiators, the African Ministerial Conference of the Environment, and the Committee of African Heads of State and Government. The African Group of Negotiators went to Paris with two initiatives that would contribute to achieving the expected outcomes of the Paris Agreement: the Africa Renewable Energy Initiative and the Africa Adaptation Initiative.
In Paris, during the United Nations conference on climate change, the AfDB and other multilateral development banks pledged to increase our climate finance and to support the outcomes of the conference through 2020. As such, the Bank will nearly triple its annual climate financing to reach $5 billion a year by 2020. This will represent an increase to 40% of our total new investments by 2020.
Looking forwardAfrica must use the skills of its people to transform its “demographic dividend” into “economic dividends.” Africa’s population is the youngest among all the continents: an estimated 60% of its population is between the ages of 15 and 24. But more than half of Africa’s youth are unemployed, underemployed, or inactive. Africa’s pervasive lack of economic opportunity for youth also fuels migration. Sometimes it is internal migration: young people leave rural areas for urban centres, putting a strain on cities and still not finding opportunity. Sometimes it is external migration to Europe and beyond. This serves as a stark reminder that Africa is in danger of compromising its future growth by underinvesting in education and quality job creation.
These millions of young people are sources of ingenuity and engines of productivity that — if carefully cultivated — could ignite a new age of inclusive prosperity on the continent. We must invest in Africa’s youth to build skills and encourage entrepreneurship, while providing access to the financial resources necessary to unlock their creativity and unleash the power of their enterprises.
We aim to create vocational and employment schemes for young people, through such schemes as our Jobs for Africa’s Youth Initiative. This strategy is designed to increase direct and indirect employment, resulting in reduced poverty, inequality, and economic and conflict-driven migration. It will also contribute to increased social cohesion and political stability.
To accomplish this goal, the strategy aims to increase inclusive employment and entrepreneurship, strengthen human capital, and create durable labour market linkages by making use of three strategic levers: innovation, investment and integration. It will create jobs for rural youths through agriculture. It will also develop Skills Enhancement Zones that will link industrial clusters with young graduates, who will be supported with business incubation and financing facilities to grow their businesses. We believe that the initiative can reach over 50 million young people over a 10-year period, stimulate the creation of 25 million jobs, and inject an additional $30 billion into African economies.
To improve the quality of life of a larger part of the population, we will also continue to invest in improving access to basic services such as water and sanitation as well as investing heavily in strengthening institutions that deliver these services, particularly health systems in countries most vulnerable to epidemics such as Ebola.
Promoting gender equality across Africa remains a top priority as well as an essential ingredient of the inclusive growth agenda. When implementing the High 5 strategies, the Bank will ensure that gender mainstreaming is scaled up in new and ongoing budget and investment interventions, including a more systematic assessment of gender issues in country strategy papers and sector strategies.
Responding to demands in Africa for better governance and basic services across the High 5s, the Bank will assist institutions that support inclusion and promote accountability. We will continue to support initiatives that increase accountability for the provision of essential services and help countries better manage their natural resource wealth to finance greater diversification, competitiveness and productive employment.
We have taken important steps towards building our capacity to assess fragility and apply a fragility lens in our engagement in fragile situations, as prescribed in our Strategy for Addressing Fragility and Building Resilience in Africa 2014–19. Improving quality of life for Africans in fragile situations will require specific approaches combining urgent responses when required and medium to long-term interventions aiming at strengthening capacity of basic service structures.
As part of the efforts of multilateral development banks to meet the COP21 agenda, we have committed to tripling our climate finance to $5 billion a year by 2020 in all key sectors. We will enhance the capacities of our regional member countries to access global climate finance and achieve their commitments to
We will nearly triple its annual climate financing to reach $5 billion a year by 2020, an increase to 40% of our total new investments by 2020
Africa’s pervasive lack of economic opportunity for young people is fuelling migration — internal and external
44
Part 1: AfDB’s vital role in Africa’s transformation

climate change adaptation and mitigation. Besides climate finance enhancement, this includes the implementation of Africa’s Intended Nationally Determined Contributions (INDCs), the alignment of the
Bank’s High5 areas with the Paris Agreement, the New Deal on Energy for Africa, and the Africa Renewable Energy Initiative, which will be hosted by the Bank.
Annual D
eve
lopm
ent Effe
ctiveness R
evie
w 2
016
45
Chapter 5 – Improve the quality of life for the people of Africa
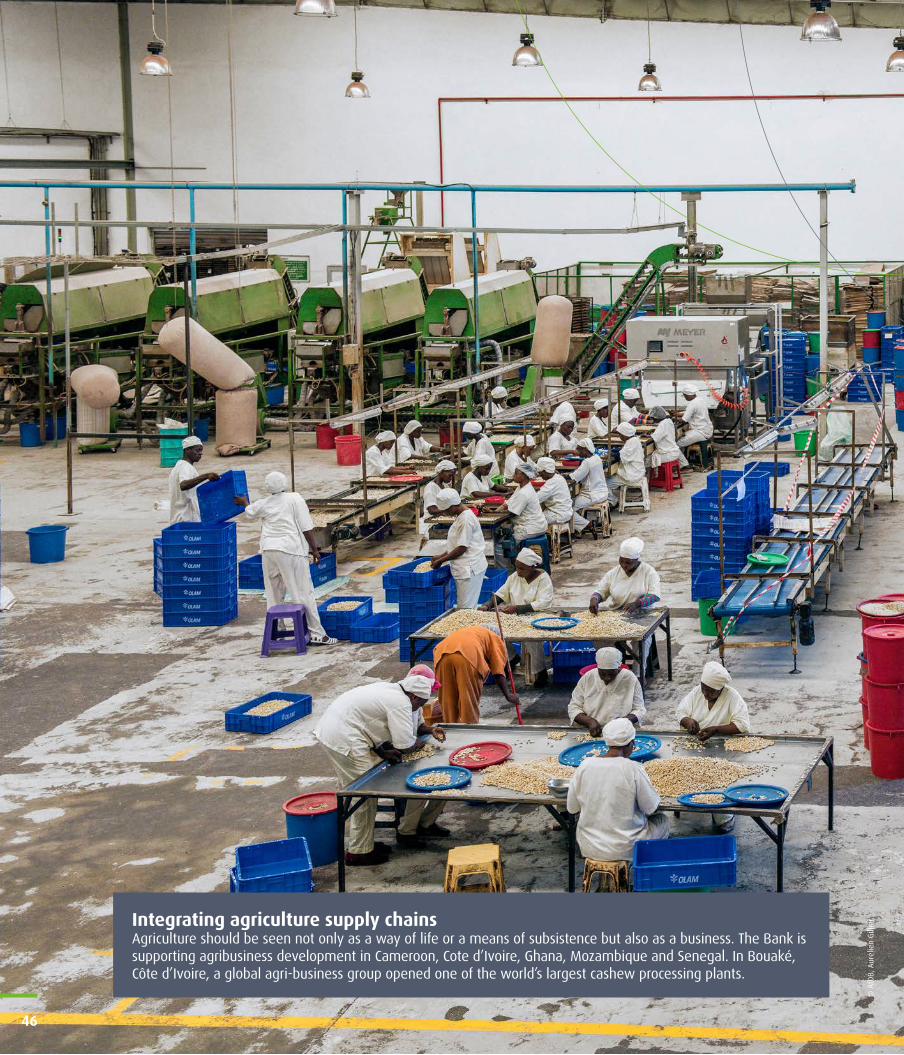
Integrating agriculture supply chains Agriculture should be seen not only as a way of life or a means of subsistence but also as a business. The Bank is supporting agribusiness development in Cameroon, Cote d’Ivoire, Ghana, Mozambique and Senegal. In Bouaké, Côte d’Ivoire, a global agri-business group opened one of the world’s largest cashew processing plants.
© A
fDB,
Aur
élie
n G
illie
r
46
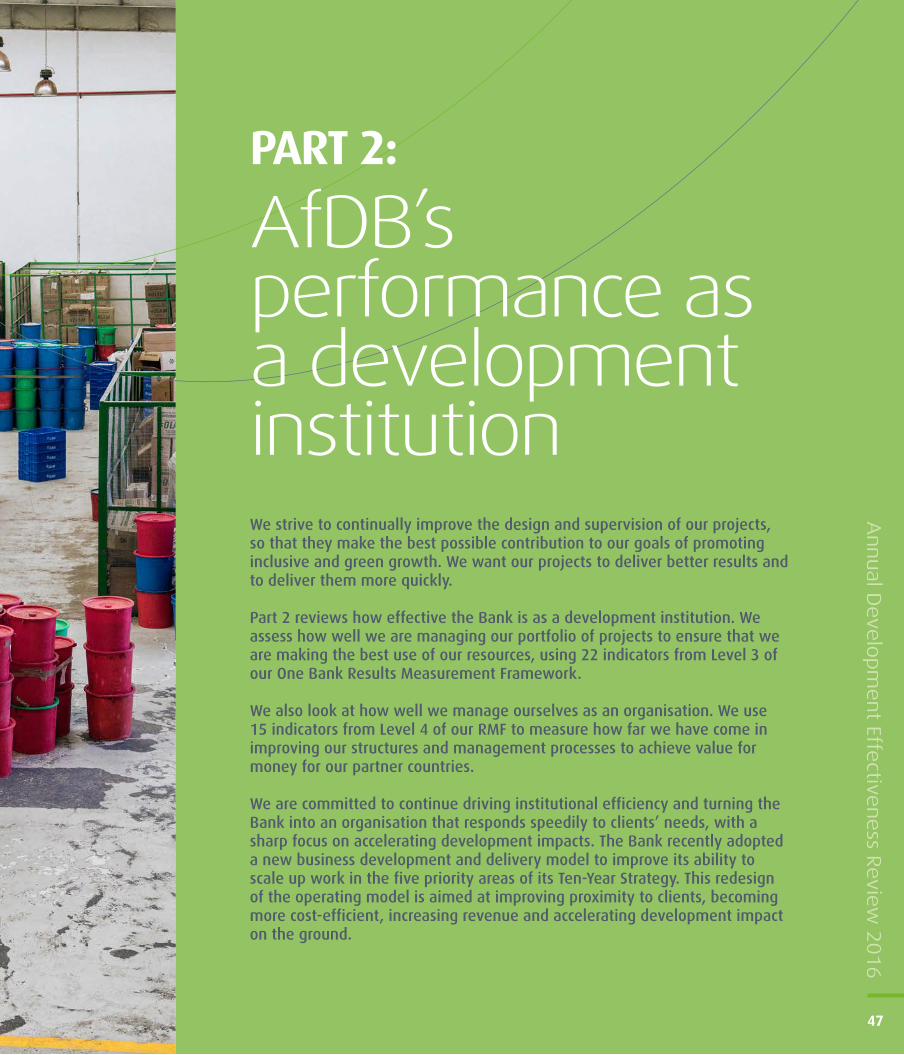
Annual D
eve
lopm
ent Effe
ctiveness R
evie
w 2
016
47
PART 2:
AfDB’s performance as a development institutionWe strive to continually improve the design and supervision of our projects, so that they make the best possible contribution to our goals of promoting inclusive and green growth. We want our projects to deliver better results and to deliver them more quickly.
Part 2 reviews how effective the Bank is as a development institution. We assess how well we are managing our portfolio of projects to ensure that we are making the best use of our resources, using 22 indicators from Level 3 of our One Bank Results Measurement Framework.
We also look at how well we manage ourselves as an organisation. We use 15 indicators from Level 4 of our RMF to measure how far we have come in improving our structures and management processes to achieve value for money for our partner countries.
We are committed to continue driving institutional efficiency and turning the Bank into an organisation that responds speedily to clients’ needs, with a sharp focus on accelerating development impacts. The Bank recently adopted a new business development and delivery model to improve its ability to scale up work in the five priority areas of its Ten-Year Strategy. This redesign of the operating model is aimed at improving proximity to clients, becoming more cost-efficient, increasing revenue and accelerating development impact on the ground.

48
Delivering impact in the Bank’s five priority areasThis map plots the geographic location of the 745 Bank operations that were approved between 2002 and 2015 in each of the High 5s.
The Bank remains committed to increase transparency of its operations. MapAfrica, its geocoding tool, has been revamped with a focus on five critical areas of the Ten-Year Strategy: Light up and power Africa, Feed Africa, Industrialise Africa, Integrate Africa and Improve the quality of life for the people of Africa. Explore our 6000 project locations through the High 5s by visiting mapafrica.afdb.org.
Light up and power Africa
Feed Africa
Industrialise Africa
Integrate Africa
Improve life of people
The High 5s
Tracking the High 5s

Chapter 6
Quality of Bank operations
The Bank needs to keep its portfolio of operations under close scrutiny to ensure they perform well and to maximise development outcomes and returns on investments. This chapter assesses how we manage our portfolio of projects across the continent. We also look at progress in strengthening our results at the country level, and how well we are bringing gender and climate into the mainstream of our strategies and projects.
Strengthening results at the country level Our country strategies are aligned with the national and regional priorities and policies of our regional member countries. They set out our medium-term objectives and how we will allocate our resources. They also reflect the Bank’s focus and comparative advantage as a development partner.
We measure the quality of our Country Strategy Papers (CSPs) using our readiness review tool. On a scale of 1 to 6, the ● average CSP rating in 2015 was 4.3, which was below our target of 5.
The Bank is reviewing the way CSPs are prepared and drafted. One of the main innovations in our approach is the adoption of new results tools that will improve the Bank’s strategic alignment and tracking of results in a comprehensive manner at the country level. The new CSP process is being piloted in Mozambique, and key lessons will enable us to fine-tune the approach before the Bank implements it more widely.
The broader objective of the new CSP approach is to ensure strategic and consistent alignment with the Bank’s objectives, in order to respond flexibly to regional member countries’ priorities and promote strong partnership between the Bank and other development partners. The new CSP approach also aims at improving the efficiency of the Bank’s business processes by reducing the financial, human and administrative costs of preparing country strategies.
During 2015, independent evaluations were carried out for Cameroon, Ethiopia, Senegal, Tanzania and Togo. We acknowledged the need to ensure that the Bank’s interventions are selective and sustainable. Newly approved country strategies have benefited from
the independent evaluations’ analyses and recommendations, and key lessons were integrated.
Once strategies are approved and projects are implemented, we regularly undertake country or regional portfolio performance reviews (CPPRs), often during the preparation of our strategies and related reports, to ensure that portfolio performance is closely linked to strategy and project planning. Over the last year, 57% of our countries achieved ● timely CPPR coverage, up from 56% in 2014. These reviews are carried out in a participatory manner and draw findings from stakeholder consultations. They inform us whether our programmes are on track and prompt us to take action when necessary.
We remain committed to the global aid effectiveness agenda and are making progress against the three indicators under the Global Partnership for Effective Development Cooperation (GPEDC) agreed in
We are adopting new tools that will improve the Bank’s strategic alignment and tracking of results in a comprehensive manner
Figure 10 Strengthening results at country level
Average CSP rating (1-6)
Timely CPPR coverage (%)
Development resources recorded on budget (%)
Predictable disbursements (%)
Use of country systems (%)
New ESW and related papers (number)
4.3
30
85
80
4.7
25
72
66
27
58
2730
62
6782
57
5
2012 2013 2014 2015 2016
Target Actual
74
Annual D
eve
lopm
ent Effe
ctiveness R
evie
w 2
016
49
Chapter 6 – Quality of Bank operations
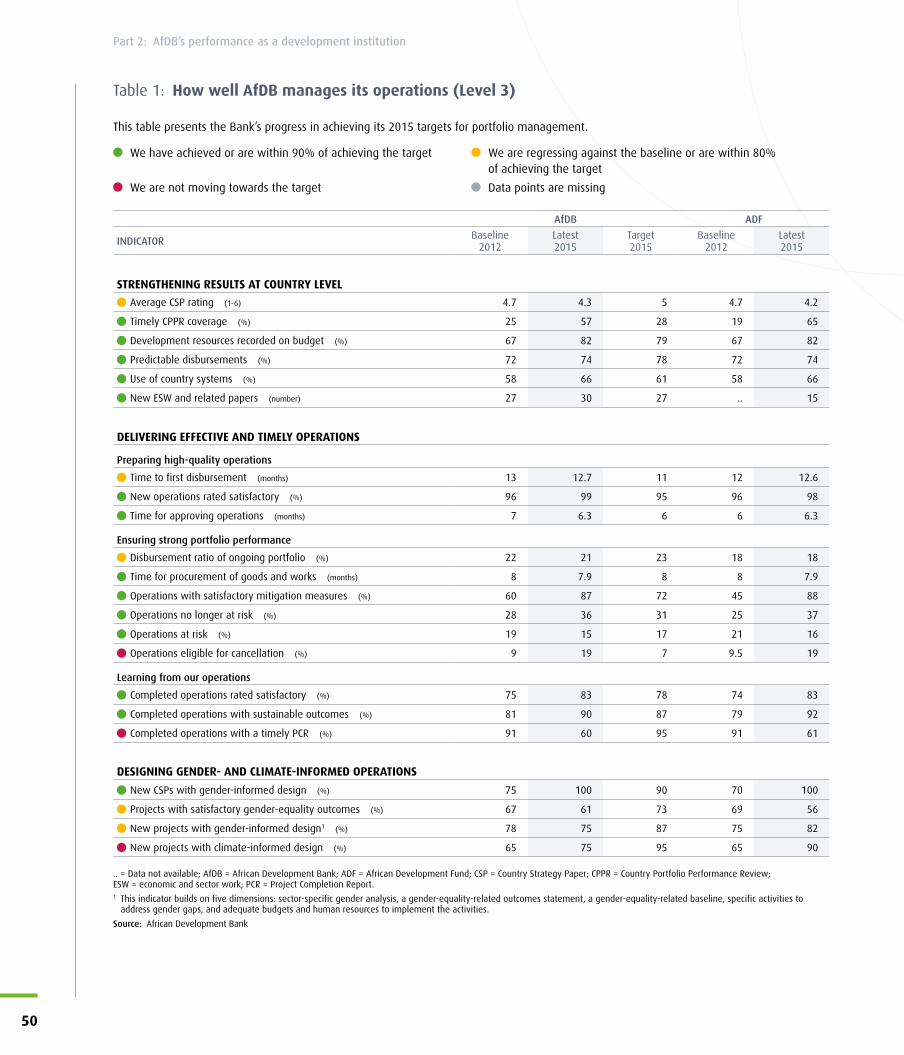
Table 1: How well AfDB manages its operations (Level 3)
This table presents the Bank’s progress in achieving its 2015 targets for portfolio management.
We have achieved or are within 90% of achieving the target We are regressing against the baseline or are within 80% of achieving the target
We are not moving towards the target Data points are missing
AfDB ADF
INDICATOR Baseline 2012
Latest 2015
Target 2015
Baseline 2012
Latest 2015
STRENGTHENING RESULTS AT COUNTRY LEVEL
Average CSP rating (1-6) 4.7 4.3 5 4.7 4.2
Timely CPPR coverage (%) 25 57 28 19 65
Development resources recorded on budget (%) 67 82 79 67 82
Predictable disbursements (%) 72 74 78 72 74
Use of country systems (%) 58 66 61 58 66
New ESW and related papers (number) 27 30 27 .. 15
DELIVERING EFFECTIVE AND TIMELY OPERATIONS
Preparing high-quality operations
Time to first disbursement (months) 13 12.7 11 12 12.6
New operations rated satisfactory (%) 96 99 95 96 98
Time for approving operations (months) 7 6.3 6 6 6.3
Ensuring strong portfolio performance
Disbursement ratio of ongoing portfolio (%) 22 21 23 18 18
Time for procurement of goods and works (months) 8 7.9 8 8 7.9
Operations with satisfactory mitigation measures (%) 60 87 72 45 88
Operations no longer at risk (%) 28 36 31 25 37
Operations at risk (%) 19 15 17 21 16
Operations eligible for cancellation (%) 9 19 7 9.5 19
Learning from our operations
Completed operations rated satisfactory (%) 75 83 78 74 83
Completed operations with sustainable outcomes (%) 81 90 87 79 92
Completed operations with a timely PCR (%) 91 60 95 91 61
DESIGNING GENDER- AND CLIMATE-INFORMED OPERATIONS
New CSPs with gender-informed design (%) 75 100 90 70 100
Projects with satisfactory gender-equality outcomes (%) 67 61 73 69 56
New projects with gender-informed design1 (%) 78 75 87 75 82
New projects with climate-informed design (%) 65 75 95 65 90
.. = Data not available; AfDB = African Development Bank; ADF = African Development Fund; CSP = Country Strategy Paper; CPPR = Country Portfolio Performance Review; ESW = economic and sector work; PCR = Project Completion Report.1 This indicator builds on five dimensions: sector-specific gender analysis, a gender-equality-related outcomes statement, a gender-equality-related baseline, specific activities to
address gender gaps, and adequate budgets and human resources to implement the activities.
Source: African Development Bank
50
Part 2: AfDB’s performance as a development institution
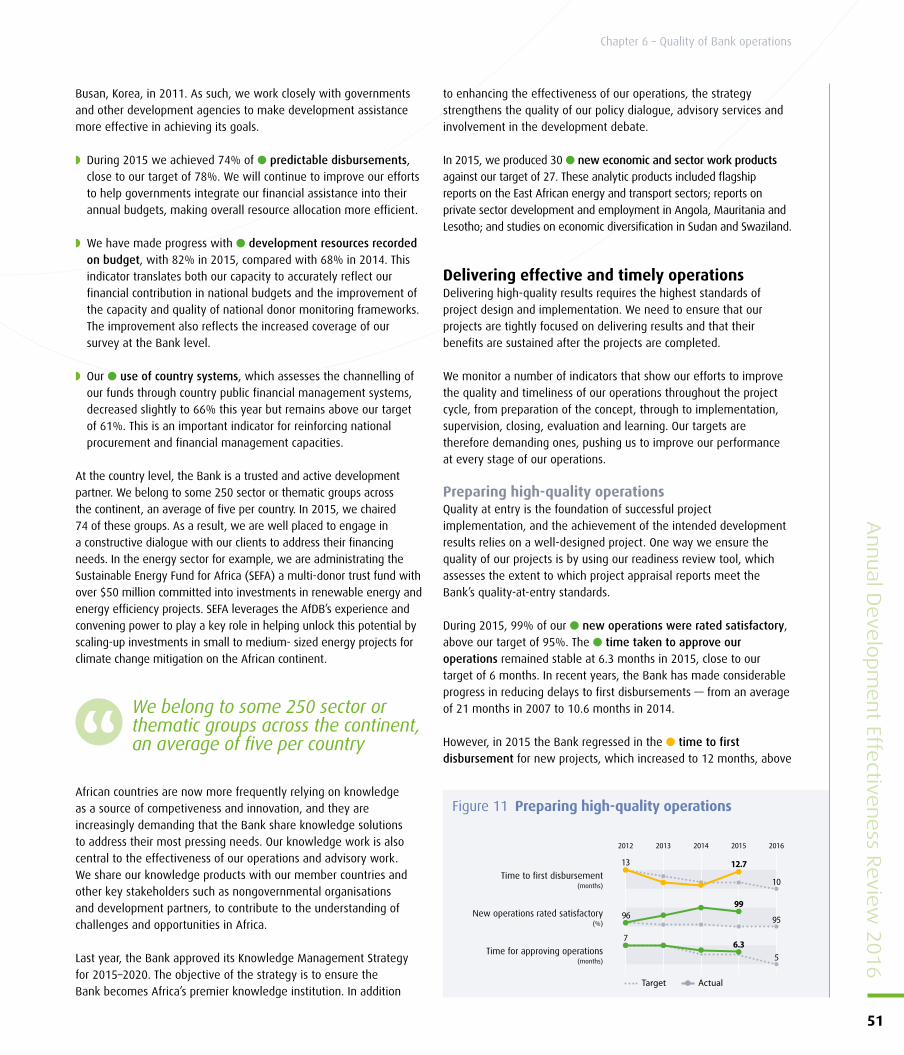
Busan, Korea, in 2011. As such, we work closely with governments and other development agencies to make development assistance more effective in achieving its goals.
◗ During 2015 we achieved 74% of ● predictable disbursements, close to our target of 78%. We will continue to improve our efforts to help governments integrate our financial assistance into their annual budgets, making overall resource allocation more efficient.
◗ We have made progress with ● development resources recorded on budget, with 82% in 2015, compared with 68% in 2014. This indicator translates both our capacity to accurately reflect our financial contribution in national budgets and the improvement of the capacity and quality of national donor monitoring frameworks. The improvement also reflects the increased coverage of our survey at the Bank level.
◗ Our ● use of country systems, which assesses the channelling of our funds through country public financial management systems, decreased slightly to 66% this year but remains above our target of 61%. This is an important indicator for reinforcing national procurement and financial management capacities.
At the country level, the Bank is a trusted and active development partner. We belong to some 250 sector or thematic groups across the continent, an average of five per country. In 2015, we chaired 74 of these groups. As a result, we are well placed to engage in a constructive dialogue with our clients to address their financing needs. In the energy sector for example, we are administrating the Sustainable Energy Fund for Africa (SEFA) a multi-donor trust fund with over $50 million committed into investments in renewable energy and energy efficiency projects. SEFA leverages the AfDB’s experience and convening power to play a key role in helping unlock this potential by scaling-up investments in small to medium- sized energy projects for climate change mitigation on the African continent.
African countries are now more frequently relying on knowledge as a source of competiveness and innovation, and they are increasingly demanding that the Bank share knowledge solutions to address their most pressing needs. Our knowledge work is also central to the effectiveness of our operations and advisory work. We share our knowledge products with our member countries and other key stakeholders such as nongovernmental organisations and development partners, to contribute to the understanding of challenges and opportunities in Africa.
Last year, the Bank approved its Knowledge Management Strategy for 2015–2020. The objective of the strategy is to ensure the Bank becomes Africa’s premier knowledge institution. In addition
to enhancing the effectiveness of our operations, the strategy strengthens the quality of our policy dialogue, advisory services and involvement in the development debate.
In 2015, we produced 30 ● new economic and sector work products against our target of 27. These analytic products included flagship reports on the East African energy and transport sectors; reports on private sector development and employment in Angola, Mauritania and Lesotho; and studies on economic diversification in Sudan and Swaziland.
Delivering effective and timely operations Delivering high-quality results requires the highest standards of project design and implementation. We need to ensure that our projects are tightly focused on delivering results and that their benefits are sustained after the projects are completed.
We monitor a number of indicators that show our efforts to improve the quality and timeliness of our operations throughout the project cycle, from preparation of the concept, through to implementation, supervision, closing, evaluation and learning. Our targets are therefore demanding ones, pushing us to improve our performance at every stage of our operations.
Preparing high-quality operationsQuality at entry is the foundation of successful project implementation, and the achievement of the intended development results relies on a well-designed project. One way we ensure the quality of our projects is by using our readiness review tool, which assesses the extent to which project appraisal reports meet the Bank’s quality-at-entry standards.
During 2015, 99% of our ● new operations were rated satisfactory, above our target of 95%. The ● time taken to approve our operations remained stable at 6.3 months in 2015, close to our target of 6 months. In recent years, the Bank has made considerable progress in reducing delays to first disbursements — from an average of 21 months in 2007 to 10.6 months in 2014.
However, in 2015 the Bank regressed in the ● time to first disbursement for new projects, which increased to 12 months, above
We belong to some 250 sector or thematic groups across the continent, an average of five per country
Figure 11 Preparing high-quality operations
Time to first disbursement(months)
New operations rated satisfactory(%)
Time for approving operations(months)
959699
Target Actual
10
5
7
13
6.3
12.7
2012 2013 2014 2015 2016
Annual D
eve
lopm
ent Effe
ctiveness R
evie
w 2
016
51
Chapter 6 – Quality of Bank operations

our target of 11 months. Measuring the time elapsed from Board approval to first disbursement is a good indicator of our operational performance. It is typically at project start-up that poorly designed operations experience problems and delays in implementation. Some of the delays can be explained by weak institutional and management capacity in some member countries, leading to slow project implementation and delays in procurement and in meeting disbursement conditions. Delays in disbursements can also be attributed to fragility situations, conflicts, political transitions and complex in-country processes, including obtaining parliamentary approval for ratifying loans.
To accelerate our performance, we have adopted a new directive that reduces our target for first disbursement to 6 months. This will improve projects’ quality at entry by requiring operations teams to undertake the necessary preparatory work in advance.
For private sector operations, we have revised our approach to assessing additionality and development outcomes, with a greater focus on inclusive and green growth, a redefinition of some development outcomes categories, and an improved assessment of our financial intermediaries.
Ensuring strong portfolio performanceWe are continuing to improve the management of our portfolio by providing adequate supervision of the implementation of our ongoing operations.
By measuring the pace at which the Bank makes resources available to clients, we monitor the speed at with which the Bank implements its portfolio of projects. In 2015 our overall ● disbursement ratio stood at 21% — just below our target of 23%.
Another measure of efficiency is the average ● time for procurement of goods and works, from bid reception to contract signature. During 2015, it improved from 9 to 7.9 months, slightly above the target. A diligent yet speedy process is critical to implement projects on time and contribute to a reasonable disbursement ratio. Implementation of the revised procurement framework, which fosters extensive use of national procurement systems, has accelerated procurement and project implementation.
To sustain positive trends and turn around areas of unsatisfactory performance, AfDB management has begun implementing the following key recommendations from recent internal reviews of projects qualifying for cancellation and of procurement delays:
◗ strengthening the technical review processes;
◗ enhancing accountability on portfolio performance matters;
◗ shifting focus and resources towards upstream project preparation activities to enhance project readiness for implementation before Board approval; and
◗ establishing training programmes for task managers on designing, approving and supervising operations.
We are expecting these actions to reduce project processing times. This would be a timely achievement, as the Bank experienced a record year for Bank project approvals in 2015, putting pressure on the Bank’s capacity to disburse quickly in the coming years (see Box 11).
We have been proactive in addressing the challenges that can hold up project implementation. Of the projects identified as problematic at the beginning of 2015, 36% were successfully brought back on track and are ● no longer at risk. This enabled us to stabilise the overall proportion of ● operations at risk at 15%. However, the share of ● operations eligible for cancellation has increased to 19% from 13% in 2014, well above the target of 7%. These are operations that have lapsed or are not performing; they should be either redesigned or cancelled, and the resources reallocated to more productive operations. The Bank has begun implementing measures to ensure that loans and grants are signed in a timely manner and that non-disbursing projects are cancelled within reasonable periods in line with new guidelines.
The Bank experienced a record year for project approvals in 2015, putting pressure on our capacity to disburse quickly in the coming years
To accelerate our performance, we have adopted a new directive that reduces our target for first disbursement to 6 months
Figure 12 Ensuring strong portfolio performance
Disbursement ratio of ongoing portfolio (%)
Time for procurement of goods and works (months)
Operations with satisfactory mitigation measures (%)
Operations no longer at risk (%)
Operations at risk (%)
Operations eligible for cancellation(%)
23
7
8775
8 7.9
2012 2013 2014 2015 2016
22 21
60
28 36 31
15 16
7
19
19
9
Target Actual
52
Part 2: AfDB’s performance as a development institution
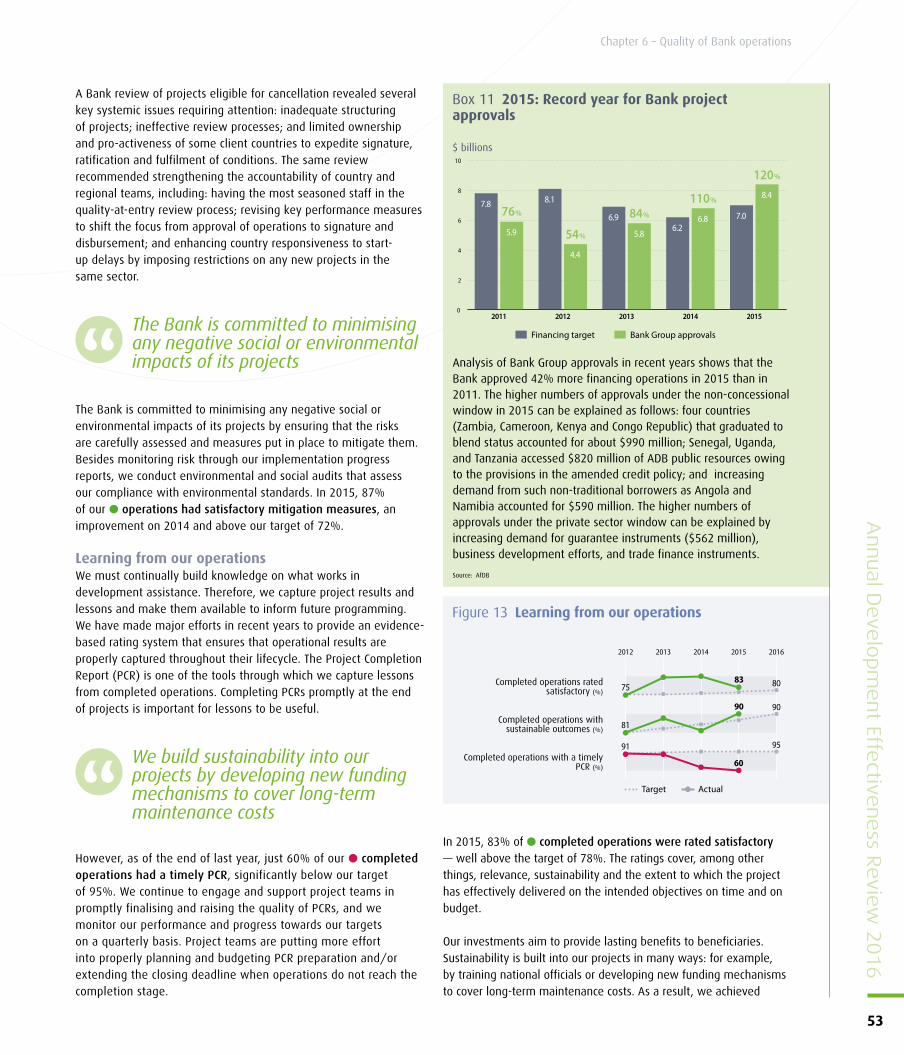
A Bank review of projects eligible for cancellation revealed several key systemic issues requiring attention: inadequate structuring of projects; ineffective review processes; and limited ownership and pro-activeness of some client countries to expedite signature, ratification and fulfilment of conditions. The same review recommended strengthening the accountability of country and regional teams, including: having the most seasoned staff in the quality-at-entry review process; revising key performance measures to shift the focus from approval of operations to signature and disbursement; and enhancing country responsiveness to start-up delays by imposing restrictions on any new projects in the same sector.
The Bank is committed to minimising any negative social or environmental impacts of its projects by ensuring that the risks are carefully assessed and measures put in place to mitigate them. Besides monitoring risk through our implementation progress reports, we conduct environmental and social audits that assess our compliance with environmental standards. In 2015, 87% of our ● operations had satisfactory mitigation measures, an improvement on 2014 and above our target of 72%.
Learning from our operationsWe must continually build knowledge on what works in development assistance. Therefore, we capture project results and lessons and make them available to inform future programming. We have made major efforts in recent years to provide an evidence-based rating system that ensures that operational results are properly captured throughout their lifecycle. The Project Completion Report (PCR) is one of the tools through which we capture lessons from completed operations. Completing PCRs promptly at the end of projects is important for lessons to be useful.
However, as of the end of last year, just 60% of our ● completed operations had a timely PCR, significantly below our target of 95%. We continue to engage and support project teams in promptly finalising and raising the quality of PCRs, and we monitor our performance and progress towards our targets on a quarterly basis. Project teams are putting more effort into properly planning and budgeting PCR preparation and/or extending the closing deadline when operations do not reach the completion stage.
In 2015, 83% of ● completed operations were rated satisfactory — well above the target of 78%. The ratings cover, among other things, relevance, sustainability and the extent to which the project has effectively delivered on the intended objectives on time and on budget.
Our investments aim to provide lasting benefits to beneficiaries. Sustainability is built into our projects in many ways: for example, by training national officials or developing new funding mechanisms to cover long-term maintenance costs. As a result, we achieved
0
2
4
6
8
10
20152014201320122011
7.8 8.1
6.96.2
7.0
5.9
4.4
5.8
6.8
8.4
76%
54%
84%
110%
120%
Bank Group approvals Financing target
Box 11 2015: Record year for Bank project approvals
$ billions
Analysis of Bank Group approvals in recent years shows that the Bank approved 42% more financing operations in 2015 than in 2011. The higher numbers of approvals under the non-concessional window in 2015 can be explained as follows: four countries (Zambia, Cameroon, Kenya and Congo Republic) that graduated to blend status accounted for about $990 million; Senegal, Uganda, and Tanzania accessed $820 million of ADB public resources owing to the provisions in the amended credit policy; and increasing demand from such non-traditional borrowers as Angola and Namibia accounted for $590 million. The higher numbers of approvals under the private sector window can be explained by increasing demand for guarantee instruments ($562 million), business development efforts, and trade finance instruments.
Source: AfDB
The Bank is committed to minimising any negative social or environmental impacts of its projects
We build sustainability into our projects by developing new funding mechanisms to cover long-term maintenance costs
Figure 13 Learning from our operations
Completed operations rated satisfactory (%)
Completed operations with sustainable outcomes (%)
Completed operations with a timely PCR (%)
80
9090
95
81
7583
91
60
Target Actual
2012 2013 2014 2015 2016
Annual D
eve
lopm
ent Effe
ctiveness R
evie
w 2
016
53
Chapter 6 – Quality of Bank operations
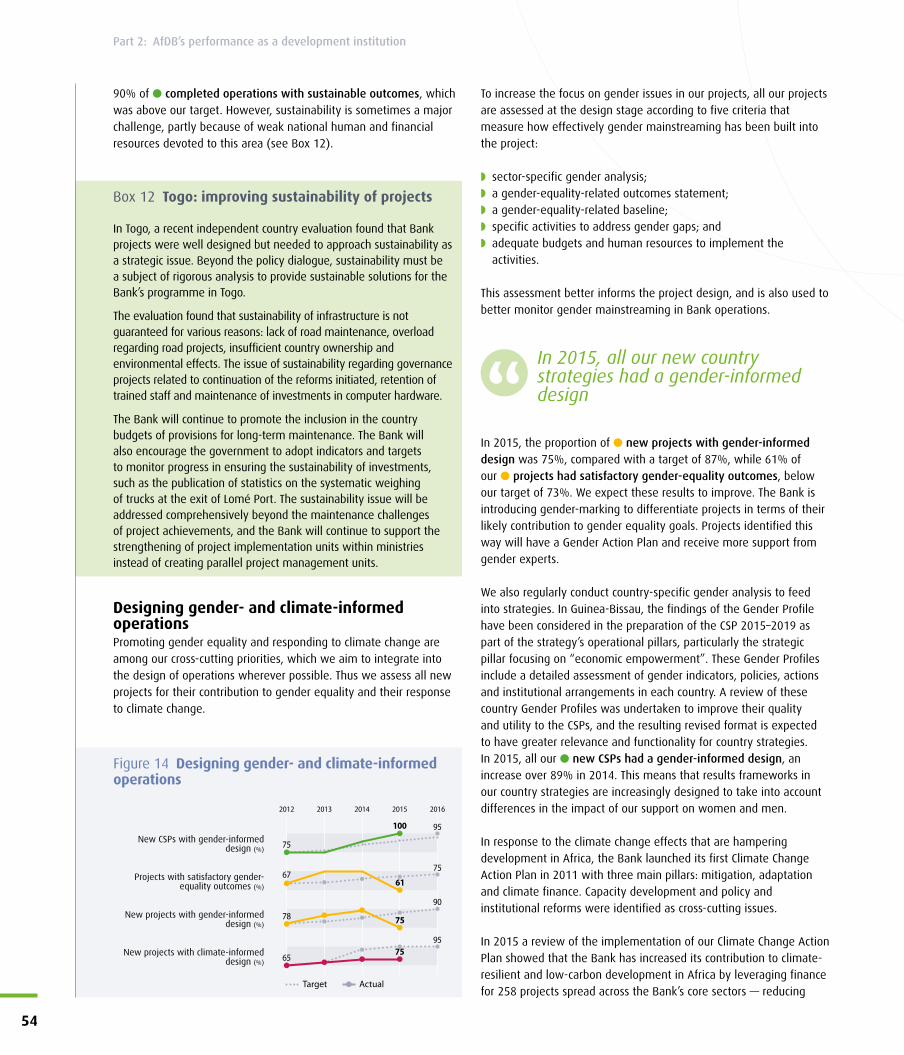
In 2015, all our new country strategies had a gender-informed design
90% of ● completed operations with sustainable outcomes, which was above our target. However, sustainability is sometimes a major challenge, partly because of weak national human and financial resources devoted to this area (see Box 12).
Designing gender- and climate-informed operationsPromoting gender equality and responding to climate change are among our cross-cutting priorities, which we aim to integrate into the design of operations wherever possible. Thus we assess all new projects for their contribution to gender equality and their response to climate change.
To increase the focus on gender issues in our projects, all our projects are assessed at the design stage according to five criteria that measure how effectively gender mainstreaming has been built into the project:
◗ sector-specific gender analysis; ◗ a gender-equality-related outcomes statement; ◗ a gender-equality-related baseline; ◗ specific activities to address gender gaps; and ◗ adequate budgets and human resources to implement the activities.
This assessment better informs the project design, and is also used to better monitor gender mainstreaming in Bank operations.
In 2015, the proportion of ● new projects with gender-informed design was 75%, compared with a target of 87%, while 61% of our ● projects had satisfactory gender-equality outcomes, below our target of 73%. We expect these results to improve. The Bank is introducing gender-marking to differentiate projects in terms of their likely contribution to gender equality goals. Projects identified this way will have a Gender Action Plan and receive more support from gender experts.
We also regularly conduct country-specific gender analysis to feed into strategies. In Guinea-Bissau, the findings of the Gender Profile have been considered in the preparation of the CSP 2015–2019 as part of the strategy’s operational pillars, particularly the strategic pillar focusing on “economic empowerment”. These Gender Profiles include a detailed assessment of gender indicators, policies, actions and institutional arrangements in each country. A review of these country Gender Profiles was undertaken to improve their quality and utility to the CSPs, and the resulting revised format is expected to have greater relevance and functionality for country strategies. In 2015, all our ● new CSPs had a gender-informed design, an increase over 89% in 2014. This means that results frameworks in our country strategies are increasingly designed to take into account differences in the impact of our support on women and men.
In response to the climate change effects that are hampering development in Africa, the Bank launched its first Climate Change Action Plan in 2011 with three main pillars: mitigation, adaptation and climate finance. Capacity development and policy and institutional reforms were identified as cross-cutting issues.
In 2015 a review of the implementation of our Climate Change Action Plan showed that the Bank has increased its contribution to climate-resilient and low-carbon development in Africa by leveraging finance for 258 projects spread across the Bank’s core sectors — reducing
Box 12 Togo: improving sustainability of projects
In Togo, a recent independent country evaluation found that Bank projects were well designed but needed to approach sustainability as a strategic issue. Beyond the policy dialogue, sustainability must be a subject of rigorous analysis to provide sustainable solutions for the Bank’s programme in Togo.
The evaluation found that sustainability of infrastructure is not guaranteed for various reasons: lack of road maintenance, overload regarding road projects, insufficient country ownership and environmental effects. The issue of sustainability regarding governance projects related to continuation of the reforms initiated, retention of trained staff and maintenance of investments in computer hardware.
The Bank will continue to promote the inclusion in the country budgets of provisions for long-term maintenance. The Bank will also encourage the government to adopt indicators and targets to monitor progress in ensuring the sustainability of investments, such as the publication of statistics on the systematic weighing of trucks at the exit of Lomé Port. The sustainability issue will be addressed comprehensively beyond the maintenance challenges of project achievements, and the Bank will continue to support the strengthening of project implementation units within ministries instead of creating parallel project management units.
Figure 14 Designing gender- and climate-informed operations
New CSPs with gender-informed design (%)
Projects with satisfactory gender-equality outcomes (%)
New projects with gender-informed design (%)
New projects with climate-informed design (%)
100
90
75
95
78 75
6761
75
Target Actual
65
9575
2012 2013 2014 2015 2016
54
Part 2: AfDB’s performance as a development institution
greenhouse gas emissions through clean energy and building adaptive capacity in the water and sanitation, agriculture and agro-industry sectors. We have committed almost $7 billion to support climate-resilient and low-carbon development in Africa in the past four years, while effectively using the climate safeguard system. In 2015, we delivered 75% of ● new projects with climate-informed design, below our target of 95%. While 90% of new projects are climate-proofed in of our ADF countries, our average including middle income countries is below our target of 95%. This is due to lower coverage of our private sector operations. We are revisiting our integrated training programme in order to further assist operational teams, including the private sector through a step-by-step approach.
We have deepened our efforts to bring into the mainstream of the design and implementation of new projects, such climate change resilience aspects as improving community-level water resources management, watershed management and providing alternative water sources. For example, in Uganda we built resilience to climate change in flood-prone areas of Mount Elgon by rehabilitating 500 ha of degraded forest, planting 400 ha of indigenous flora along 250 km of river banks, and training local communities.
The Bank is now developing its next Action Plan, which will focus on delivering increased climate financing (see Box 13).
Looking forwardWe are implementing a new business model that will expand the Bank’s business by moving it closer to its clients. This will improve the way the Bank delivers its services and increase the health of the organisation, guaranteeing its long-term performance and providing meaningful development impact for regional member countries (see Box 14).
Over the past two years, AfDB has invested significant efforts in creating a higher sense of urgency for delivery, greater transparency, and accountability for performance. These efforts are starting to pay off: lending performance is stronger and portfolio performance has improved moderately.
Our CSPs and our project designs are rigorously scrutinised to ensure that they support our objectives and our quality standards, and that they are adequately supervised throughout implementation. The large majority of our new projects now have gender equality and climate change goals integrated into their design.
The Bank’s active portfolio requires further attention, however. We aim to improve quality at entry of projects by undertaking in
advance the necessary preparatory work related to safeguards and procurement. Start-up delays, disbursement performance and timely completion reporting will be closely monitored at the country and division levels to speed up development impact and increase the Bank’s revenue. In this regard, new internal directives provide a greater impetus for enhanced quality at entry and accelerated implementation and management of projects, focusing on results.
In the next chapter, we turn to the progress we are making in building our own capacity as a development organisation.
Box 13 African Development Bank to triple annual climate financing to nearly $5 billion by 2020
The Bank is working to almost triple its annual climate financing to reach $5 billion a year — or 40% of its total new investments — by 2020.
Part of the $5 billion will be dedicated to reducing Africa’s greenhouse gas emissions by unlocking the continent’s enormous potential for renewable energy: solar, hydro, wind and geothermal power. We will also work with our clients to improve energy efficiency and build sustainable transport systems.
The other portion of the $5 billion will help African economies adapt to climate change through such measures as investing in climate-resilient crops, building sustainable infrastructure, and improving irrigation and access to water. To this end, the Bank will also integrate climate resilience into all of the infrastructure projects it finances.
Box 14 Towards a new way of doing business
Our proposed structural changes will be complemented by changes in human resources, budget incentives and related business processes.
The objective is to improve service delivery by increasing responsiveness and client orientation, and shortening the project cycle. Many processes will be reviewed to ensure they become more efficient and effective. Key actions to address process improvements will include:
◗ the Delegation of Authority will be revised further in light of the emerging organisational structure and business model of the Bank;
◗ the Bank is in the process of rolling out a new procurement policy to ensure increased country focus, accountability and to help reduce project delays;
◗ management is taking decisive actions to address delays in disbursements. In this regard, a new directive was issued in 2015 to help address disbursement challenges.
The business process improvements will be an ongoing exercise. We will continuously seek ways to speed up execution while maintaining high standards of quality at entry and of portfolio management.We are implementing a new business
model that will expand the Bank’s business by moving it closer to its clients
Annual D
eve
lopm
ent Effe
ctiveness R
evie
w 2
016
55
Chapter 6 – Quality of Bank operations

Chapter 7
The organisation’s efficiency
This chapter assesses how efficient we are as a development institution. The 15 indicators show the progress we have made in reforming and strengthening our structures and management processes, to ensure that we deliver high-quality, sustainable results. The results also provide evidence of areas where the Bank needs to make improvements to deliver effectively on its ambitious agenda.
Decentralisation: sustaining gainsThe Bank Group’s priority in 2015 was to sustain the gains from the implementation of the 2011–2015 Decentralisation Roadmap. Critical activities included learning lessons from a review of the two
pilot Regional Resource Centres established in 2012 in Eastern and Southern Africa, and deciding on a third Regional Resource Centre in North Africa (see Box 15).
During 2015, the Bank maintained its presence in 38 regional member countries while working on enhancing the delegation of authority to the offices in these countries. In term of performance, the share of ● projects managed from field offices (Regional Resource Centres and Country Offices) increased from 51% in 2014 to 60% in 2015 (see Box 16).
There was, however, a decrease in the share of ● operational staff based in field offices, from 50% in 2014 to 40.6% in 2015. The Bank is reviewing its decentralisation action plan to align it with the new business delivery model. The infrastructure needed to ensure good communication between staff in field offices and Headquarters remains sufficient, with 99% of videoconferences successfully ● connecting to field offices.
Human resources: ensuring motivated and high-calibre staffAs a development bank, our effectiveness depends as much on our people and their knowledge and skills as it does on our finance. The Bank needs to attract the highest calibre of development professionals across a wide range of specialist fields. We need to ensure that staff members continuously develop their skills and expertise, and we must offer them rewarding career paths with incentives for continuous improvement.
The Bank’s return to its Headquarters in Abidjan was a major undertaking, requiring strong change management and business
Box 15 Assessing the effectiveness of the Bank’s Regional Resources Centres
A Bank presence at the regional level has proven to be an effective and efficient delivery platform for decentralisation. The 2015 review of the two pilot Regional Resource Centres in Eastern and Southern Africa is enabling the Bank to deepen the quality of its delivery from this level. The Centres have increased the franchise value of the Bank in their regions through more timely dialogue with stakeholders, enhanced business development, and improved aid coordination and portfolio management. The advantages of the Centres to be leveraged include the ability to: respond quickly to requests for technical support from the countries they serve because of close proximity; optimally deploy and coordinate the limited technical services available for the benefit of all countries, particularly those in fragile situations; develop effective teams across sector lines because of the critical mass of experts available at the regional level; and operate much more strategically in support of regional economic priorities and initiatives aimed at promoting regional economic integration.
The Bank is reviewing its decentralisation action plan to align it with the new business delivery model
Figure 15 Decentralisation
Operational staff based in field offices (%)
Projects managed from field offices (%)
Connecting to field offices(% successful videoconferences)
50
55
3640.6
>95
42
90
60
99
Target Actual
2012 2013 2014 2015 2016
56
Part 2: AfDB’s performance as a development institution

continuity planning. The return was accomplished successfully, with minimal disruption to the Bank’s business. The Bank is the only multilateral institution that has moved its entire operations and staff internationally, on two occasions, and done so successfully, surpassing its lending targets in 2015 by 20%.
The return to Abidjan was a major step into the unknown for many at the Bank: 68% of the 2014 workforce was recruited in Tunis, and many of the staff who came from Abidjan when the Bank moved in 2003 had not visited Abidjan during the temporary relocation period. For this reason, management put in place a comprehensive change management strategy and communication plan. Change facilitation activities and communication sessions were provided throughout 2015 as staff arrived and settled in Abidjan. On-boarding sessions were held regularly to inform staff and engage them on issues related to settling into their new home and environment.
The Staff Survey is one of the tools the Bank uses to engage with and obtain feedback from staff. It measures progress across the pillars of the People Strategy, including on employee engagement, managerial effectiveness, performance and accountability. Besides monitoring employee motivation and well-being, the survey collects feedback on the quality of management and leadership, and enables the Bank to diagnose organisational issues that require intervention.
The Bank has conducted four Staff Surveys since 2007. The last survey was in April 2015, with a participation rate of 82% — the highest rate ever, and the best among multilateral development banks. The result of the 2015 Staff Survey for the ● employee engagement index was 73%, a reduction of 2% on 2013 results. This may be attributed to disruption created by the return to Abidjan. The Staff Surveys concluded also that the ● management effectiveness index remains stable at 48%, indicating that more needs to be done.
Some recurring themes need to be addressed: building a culture of openness, trust and respect; the persistent gender gap; career development/coaching; and toleration of poor performance. Against these can be set a number of areas where the surveys reveal real strengths: pride in working for AfDB, sense of accomplishment, clarity of expectations, and improvements in work/life balance.
Management is committed to a continuous review of progress to identify areas of improved performance, such as preventing delays in setting forward objectives by delinking the process from the annual review process. A strong performance management system will lay the foundation for an effective Talent Management and Succession Planning system that management is aiming to put in place in the next two years, in line with the People Strategy and HR Action Plan.
Over the past few years, we have also been working to improve management practices throughout the Bank. We have implemented a Leadership and Management Development Programme, and we work with a range of external business partners to provide continuous training to managers.
The Bank is actively seeking innovative ways to reach, attract and retain women in its workforce. This calls for a good understanding of the Bank’s internal gender profile and the priorities and expectations of female staff. In all key Staff Survey questions on engagement,
Box 16 Good practice in Morocco field office for smooth project implementation
In 2012, we supported Morocco in increasing the share of renewable energy by helping to finance the Ouarzazate solar complex. The Bank office in Morocco played an important role in monitoring this project, which disbursed fully and was completed on time. As the Bank was the main financier, the field office coordinated other donors and provided leadership, particularly when urgent decisions were required.
In addition, the Bank engaged in a continuous dialogue on and supervision of the project, supporting the project implementation unit in better understanding and applying Bank rules. Because the field office was instrumental in solving problems and providing guidance to the executing agency, the Bank received good-quality disbursement requests, which expedited disbursements and project implementation.
The plant has been commercially active since December 2015. It is functional to its full design capacity of 160 MW and an additional 350 MW of power generation is expected by the end of 2018. During and after the construction of phases I and II, 1100 permanent and 2400 temporary jobs will be created.
The Bank is the only multilateral institution that has moved its entire operations and staff internationally, on two occasions, successfully
Figure 16 Human resources
Employee engagement index (%)
Managerial effectiveness index(%)
Operations professional staff(%)
Share of women in professional staff(%)
Share of management staff who are women (%)
Net vacancy rate—professional staff(%)
Time to recruit new staff(days)
65
70
33
48
27 26.7
32
100
24
223
29.4
67 67
48
70
53
73
9915.7
Target Actual
2012 2013 2014 2015 2016
Annual D
eve
lopm
ent Effe
ctiveness R
evie
w 2
016
57
Chapter 7 – The organisation’s efficiency
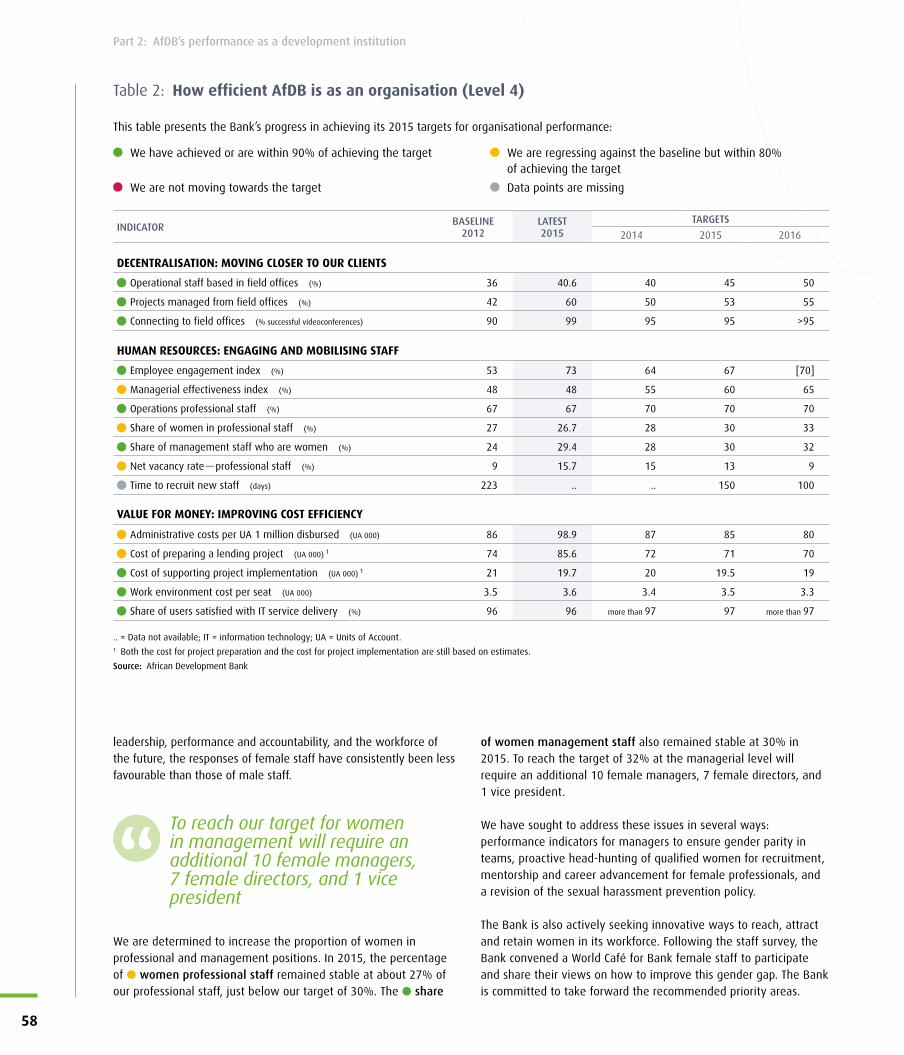
Table 2: How efficient AfDB is as an organisation (Level 4)
This table presents the Bank’s progress in achieving its 2015 targets for organisational performance:
We have achieved or are within 90% of achieving the target We are regressing against the baseline but within 80% of achieving the target
We are not moving towards the target Data points are missing
INDICATOR BASELINE 2012
LATEST 2015
TARGETS
2014 2015 2016
DECENTRALISATION: MOVING CLOSER TO OUR CLIENTS
Operational staff based in field offices (%) 36 40.6 40 45 50
Projects managed from field offices (%) 42 60 50 53 55
Connecting to field offices (% successful videoconferences) 90 99 95 95 >95
HUMAN RESOURCES: ENGAGING AND MOBILISING STAFF
Employee engagement index (%) 53 73 64 67 [70]
Managerial effectiveness index (%) 48 48 55 60 65
Operations professional staff (%) 67 67 70 70 70
Share of women in professional staff (%) 27 26.7 28 30 33
Share of management staff who are women (%) 24 29.4 28 30 32
Net vacancy rate — professional staff (%) 9 15.7 15 13 9
Time to recruit new staff (days) 223 .. .. 150 100
VALUE FOR MONEY: IMPROVING COST EFFICIENCY
Administrative costs per UA 1 million disbursed (UA 000) 86 98.9 87 85 80
Cost of preparing a lending project (UA 000) 1 74 85.6 72 71 70
Cost of supporting project implementation (UA 000) 1 21 19.7 20 19.5 19
Work environment cost per seat (UA 000) 3.5 3.6 3.4 3.5 3.3
Share of users satisfied with IT service delivery (%) 96 96 more than 97 97 more than 97
.. = Data not available; IT = information technology; UA = Units of Account. 1 Both the cost for project preparation and the cost for project implementation are still based on estimates.
Source: African Development Bank
leadership, performance and accountability, and the workforce of the future, the responses of female staff have consistently been less favourable than those of male staff.
We are determined to increase the proportion of women in professional and management positions. In 2015, the percentage of ● women professional staff remained stable at about 27% of our professional staff, just below our target of 30%. The ● share
of women management staff also remained stable at 30% in 2015. To reach the target of 32% at the managerial level will require an additional 10 female managers, 7 female directors, and 1 vice president.
We have sought to address these issues in several ways: performance indicators for managers to ensure gender parity in teams, proactive head-hunting of qualified women for recruitment, mentorship and career advancement for female professionals, and a revision of the sexual harassment prevention policy.
The Bank is also actively seeking innovative ways to reach, attract and retain women in its workforce. Following the staff survey, the Bank convened a World Café for Bank female staff to participate and share their views on how to improve this gender gap. The Bank is committed to take forward the recommended priority areas.
To reach our target for women in management will require an additional 10 female managers, 7 female directors, and 1 vice president
58
Part 2: AfDB’s performance as a development institution

Our staff balance is registering steady improvement. The share of our employees who are ● operations professional staff is already quite high at 67%, but we plan to increase it further. Our ● net vacancy rate for professional staff has been stable compared with 2014, at 16%, but above our target of 13%, given attrition and a freeze in recruitment during the Bank’s return to Headquarters.
We had expected that the Bank would have a high attrition rate through the return process. However, by September 2015, only 13.5% of the Bank population had opted to take the separation package because of the move.
After two years of case-by-case recruitment during the return to the Bank’s Headquarters, by the end of 2016 we will launch a recruitment plan that will reduce the ● time required to recruit new staff.
Value for money: improving cost-efficiencyThe Bank is committed to maximising the value for money (VfM) it delivers. We want to make sure that every dollar we spend delivers the greatest development value for our shareholders.
This has implications at different levels: projects need to achieve their objectives cost-efficiently; our capital should be allocated on the basis of country performance; and we should keep our running costs at a level that helps the Bank to achieve its goals.
Jointly with other multilateral development banks, we have reflected on a common understanding of VfM. A conceptual framework endorsed by the AfDB and five other multilateral development banks outlines the economic principles of a VfM approach centred on cost-effectiveness and cost-efficiency. During the next phase, the Bank will conduct a case study of its approach to VfM, providing useful material for its sister organisations. This initiative is renewing emphasis on improving both the efficiency and effectiveness of our operations and those of other multilaterals.
We aim to manage costs to deliver maximum VfM. We assess the extent to which the Bank has increased efficiency by reducing the administrative costs associated with disbursements. In 2015, because disbursements were below the expected targets, the Bank’s ● administrative costs per UA 1 million disbursed stood at UA 98 000, the same level as last year, well above the UA 85 000 target.
Overall, the Bank compared favourably to the average of other Multilateral Lending Institutions on efficiency ratios as published by Standard and Poor’s in 2015.
We also measure how well we manage our facilities, calculated as the total rental, maintenance, and utilities costs per seat. Our ● work environment cost per seat also increased in 2015, from UA 3300 to UA 3600, as result of increased costs related to the preparation for the Bank’s move to its Headquarters building.
We continue to focus on cost-effectiveness at the project level, tracking the costs of preparing and implementing our operations. The ● cost of supporting project implementation has decreased from UA 21 000 to UA 19 000 — on target. However, the ● cost of preparing a lending project has increased from UA 74 000 in 2012 to UA 85 000 in 2015, above our target of UA 71 000. The increased coverage of our staff time recording system across operational departments means that we are capturing more cost data and that we can better allocate the expenditures associated with project identification, preparation, appraisal and launching.
To increase efficiency, the Bank continues to invest in modern, well-functioning IT infrastructure to facilitate the collaboration of teams, improve the efficiency of the Bank’s business processes and reduce travel expenses. With improved videoconferencing capacities, almost all recruitment interviews with candidates based outside Côte d’Ivoire were made by videoconference, saving the Bank UA 16.3 million.
During 2015, we completed the transfer of our IT infrastructure to our Headquarters in Abidjan, including successfully migrating data from Tunis to Abidjan.
Jointly with other multilateral development banks, we have reflected on a common understanding of value for money
Figure 17 Value for money: improving cost efficiency
Administrative costs per UA 1 million disbursed (UA 000)1
Cost of preparing a lending project (UA 000)
Cost of supporting project implementation (UA 000)
Work environment cost per seat (UA 000)
Share of users satisfied with IT service delivery (%)
80
19
8698.9
21 19.7
74
85.6
3.5 3.6
70
3.3
>97
Target Actual
96 96
2012 2013 2014 2015 2016
1 Revised after final financial statements
In scaling up our investments and implementation in our High 5s, we are also aiming to become more agile and responsive to the continent’s needs
Annual D
eve
lopm
ent Effe
ctiveness R
evie
w 2
016
59
Chapter 7 – The organisation’s efficiency

These efforts have improved the Bank’s overall performance in 2015: 96% of ● users were satisfied with IT services delivered.
Looking forwardIn scaling up our investments and implementation in our five key areas, the High 5s, we are also aiming to become more agile and responsive to the continent’s needs, and therefore have changed our business model. We are undertaking several management and organisational changes to ensure closer alignment to these business priorities, enabling us to respond quickly to the needs of our clients, improving selectivity and operational effectiveness.
The redesign of the operating model is aimed at improving proximity to clients, becoming more cost-efficient, increasing revenue and accelerating developmental impact on the ground. These changes
will help us accelerate delivery of the Ten-Year Strategy with a focus on the High 5s.
The redesign of our organisation will be built on five foundations (see Box 17).
Overall, we aim to deliver on our commitment to maintain the institution as Africa’s premier financial institution and keep the institution relentlessly focused on results. The Bank will offer clients world-class development solutions by making the organisation efficient and impact-driven. Decentralisation is bringing us closer to our clients and our beneficiaries, making us better at listening and responding to their needs.
Stronger management practices and an increasingly sophisticated communications infrastructure are helping us operate as One Bank, while working with a decentralised structure. To achieve this, the Bank will establish five Regional Development and Business Delivery Offices, one each for West Africa, East Africa, Central Africa, North Africa and Southern Africa. We will streamline all processes and systems to fully empower the regional integration and business delivery hubs.
Our current focus on VfM will bring us closer to becoming a leaner and more efficient organisation. Finally, we will continue building on our partnerships and on our role as conveners and facilitators at the continental level. This will ensure that we deliver on our ambitious programme to support Africa’s transformation.
Stronger management practices and an increasingly sophisticated communications infrastructure are helping us operate as One BankBox 17 Five foundations support the redesign
of our organisation
The five foundations that we need to build within the Bank call for a culture change:
◗ moving closer to our clients to enhance delivery;
◗ reconfiguring Headquarters to help the regions deliver better outcomes;
◗ strengthening the performance culture to attract and maintain talent;
◗ streamlining business processes to promote efficiency and effectiveness;
◗ improving financial performance and increasing development impact.
60
Part 2: AfDB’s performance as a development institution
Annual D
eve
lopm
ent Effe
ctiveness R
evie
w 2
016
61
Chapter 7 – The organisation’s efficiency

Managing rural waterAfrica is highly vulnerable to changes in rainfall and their consequences for agricultural production. Expanding irrigation could greatly improve productivity and food security. On Santiago Island, Cape Verde, we helped reduce rural poverty by promoting soil conservation and optimising water resources.
© A
fDB
62

63
Annual D
eve
lopm
ent Effe
ctiveness R
evie
w 2
016
Conclusion and outlook

Conclusion and outlook
The global economic environment facing Africa weakened significantly in 2015. The recent fall in commodity prices and the consequent slowing in Africa’s economic growth have raised concerns about the continent’s prospects. In 2015 Africa’s ● economic growth1 fell to 3.6 percent, from 4.3 percent in 2014. As commodity prices fell, global growth weakened, borrowing costs rose, and political stability and security came under threat in some countries. The apparent end of the commodity super-cycle and slowing growth in China and other emerging economies are principal sources of current concern about African prospects.
The Africa Development Bank remains optimistic about the continent’s prospects. Africa is resilient and dynamic. Not all African countries are net commodity exporters: 17 countries with a quarter of the region’s population are benefiting from lower energy prices. And single-minded attention to the commodities market can blind observers to the many positive trends that underpin the continent’s long-term growth.
Those developments include improved political stability; more solid macroeconomic and fiscal policy; increased public sector investment, especially in infrastructure; increased private consumption and improvements in public sector governance. Despite continuing conflict in several countries, Africa on the whole is more stable and more democratic.
Together these tendencies have increased the continent’s capacity to resist shocks, and helped maintain growth at record rates. Despite the decline from 2014 to 2015, growth is projected to accelerate to 3.7% in 2016, and could strengthen further to 4.5% in 2017.
However, much more need to be done to achieve broad based growth and prosperity: 600 million people have no access to electricity, 120 million Africans remain out of work, 42 percent of the ● population still live below the US $1.25 poverty line2, and around one in four people in Sub-Saharan Africa remain undernourished. Inequality is also high: six of the 10 most unequal countries in the world are African, particularly affecting women and the youth.
What Africa needs most of all is a structural transformation that will unlock the potential of the continent’s people and resources, achieving the inclusive growth and green growth that are at
the heart of our Ten-Year Strategy. Our High 5 priorities are the essential ingredients of that transformation: Light up and power Africa, Feed Africa, Industrialise Africa, Integrate Africa, and Improve the quality of life for the people of Africa.
Light up and power Africa — The New Deal on Energy for Africa, a partnership led by the Bank, underpins all the other High 5s. To reach this goal, the AfDB is working in partnership with all stakeholders to unify all of the other efforts that are driving towards achieving the goals of universal access to energy in Africa.
Our new Energy Strategy sets out the priorities for the Bank’s interventions in the energy sector from 2016 to 2025. The strategy aims to contribute to the transformation of Africa’s energy sector by increasing energy production, scaling up energy access, improving affordability, reliability and energy efficiency, and improving the sustainability of energy systems.
To achieve universal access to modern energy — the goal of the New Deal on Energy for Africa, — the AfDB is working with governments, the private sector, bilateral and multilateral energy sector initiatives to develop a Transformative Partnership on Energy for Africa — a platform for public-private partnerships for innovative financing in Africa’s energy sector. The Bank will work side by side with other Multilateral Development Banks to scale up investments in the sector. This includes initiatives such as the US Power Africa and Sustainable Energy for All.
Feed Africa — Africa needs an agricultural transformation that will integrate its farmers into the global economy. This requires a fundamental shift in attitude across the continent. Agriculture should be seen not only as a way of life or a means of subsistence but also as a potential business enterprise.
The Bank is framing its agricultural operations within a business-oriented approach, based on a deeper understanding of the obstacles, potential and investment opportunities right across the sector, from the supply of inputs to the final point of retail.
In particular, we will connect farmers better to local, regional and global agricultural value chains, to ensure they have larger, more reliable markets for their produce. We will focus on expanding smallholder agribusiness and larger scale agro-industry, creating
1 A red bullet indicates that there has been regression against the baseline.
2 A yellow bullet indicates that progress is positive but less than peers or no progress against the baseline.
64
Conclusion and outlook
vertically integrated value chains to increase output and create jobs. Our close engagement with the private sector will encourage increased investment in agriculture, including private equity.
Industrialise Africa — Africa has many of the ingredients of industrial success: abundant natural resources, a large and growing working-age population and expanding domestic markets. But while industrialisation is growing in absolute terms, Africa's share of global manufacturing exports remains less than 1%, compared with over 16% for East Asia.
Africa needs to implement a comprehensive and resolute industrial policy; one that can be adjusted for each country, specific to the local context and requirements and is aligned with the country’s development goals. This will require combined and coordinated efforts by a wide range of stakeholders, both public and private.
At the core of the Bank’s “Industrialise Africa” priority are six flagship programmes, chosen to represent areas where the AfDB can best leverage its experience, capabilities and its finances. Over the next 10 years, the Bank will invest $3.5 billion per year through direct financing and leveraging to implement the six programmes.
Integrate Africa — The Bank’s Regional Integration Policy and Strategy (2014–2023) acknowledges the opportunities provided by regional integration in boosting infrastructure, trade, industrialisation and movement of people.
As part of the ‘Integrate Africa’ priority, the Bank will foster regional integration through the Programme for Infrastructure Development in Africa. This includes developing regional energy markets, transnational railways and highways to link countries’ economic activities. It will support trans-boundary programmes, including basin development.
The Bank will work with other stakeholders to assist in strengthening regional economic communities and national authorities to encourage and support regional ‘soft’ infrastructure sector integration, cross-border investments, elimination of non-tariff trade barriers, the harmonisation of investment and engineering codes, and quality assurance and certification standards. This includes helping countries lift market barriers and formalise women’s participation in cross-border trade. Through changes in the visa regime we will promote the movement of people.
Improve the quality of life for the people of Africa — The AfDB is focusing its investments on education, vocational training and skills development. We are embarking on innovative programmes and financing approaches to accelerate job creation and allow Africa’s greatest demographic asset — its young people — to contribute to its economic prosperity. We are committed to building up the availability of technical skills so that African economies can realise their full potential in high-technology sectors.
Access to safe water supply and improved sanitation is essential to improve health and education and to enhance food security and nutrition outcomes. Therefore, expanding access to clean water and better sanitation is a strategic priority for the Bank. We must also invest heavily in public health care systems in order to build Africa’s resilience in the face of health epidemics and emergencies: the Ebola crisis was a wake-up call for the continent and the Bank.
Strategic cross cutting issues — Scaling up implementation in the five priority areas of the Ten-Year Strategy will be possible only if critical cross-cutting areas such as gender equality, governance, fragility and climate change are brought fully into the mainstream of the Bank’s operations. The Bank is engaging with countries to address gender issues directly through our operations as well as indirectly by emphasising gender equality throughout all our work.
The Bank’s new Governance Strategy and Action Plan gives special focus to enhancing voice and accountability; addressing governance for improved service delivery in core sectors such as energy, health and education; and improving management of natural resources.
The Bank approaches fragility by applying a “fragility lens” to guide its strategic and operational engagement. In implementing the five high-priority areas, the Bank continues to champion interventions that are fragility-proofed.
Acknowledging the urgent need to address climate change, the Bank will nearly triple its annual climate financing to reach $5 billion a year by 2020. To make sure all our investments support climate change objectives, we screen our projects for climate risk and build resilience into project design through the Climate Safeguards System.
The Bank’s performance as a development institutionThe Bank is committed to pursuing its objectives of ensuring that Africa achieves inclusive growth and helping it make the transition to green growth, in line with the overarching priorities of our Ten-Year Strategy. In scaling up our investments and implementation in the High 5s, we are reorganising the Bank to become more agile and responsive to the continent’s needs. The Board of Directors has approved a new business model for the Bank. Three new Vice Presidencies have been established: on Power, Energy and Green Growth; on Agriculture, Human and Social Development; and on the Private Sector, Infrastructure and Industrialisation. We have launched a strategy called Jobs for Youth in Africa to increase employment and hence reduce poverty and inequality.
To implement the High 5s, increase our efficiency and carry out our work more quickly, we are establishing five regional integration and business delivery offices, which will bring us
65
Conclusion and outlookA
nnual D
eve
lopm
ent Effe
ctiveness R
evie
w 2
016

closer to our clients. We will improve our business processes and operations continuously, learning as we go, so that we have the greatest chance of achieving our ambitious goals.
Initiatives will be implemented to change the Bank’s culture by vastly improving performance management and inculcating a new culture of accountability, driven by performance contracts and results orientation.
In creating this new organisational culture and promote innovation within the Bank , an idea contest — Innopitch, was designed for Bank staff to bring innovative thinking to the forefront of the Bank’s business process and operations.
Overall, we aim to deliver on our commitment to maintain the institution as Africa’s leading financial institution and keep the Bank relentlessly focused on results. Decentralisation is bringing us closer to our clients and our beneficiaries, making us better at listening and responding to their needs.
Stronger management practices and an increasingly sophisticated communications infrastructure are helping us operate as One Bank, while working with a decentralised structure. Finally, we will continue building on our partnerships and on our role as conveners and facilitators at the continental level. This will ensure that we deliver on our ambitious programme to support Africa’s transformation.
66
Conclusion and outlook
Annexes Annual D
eve
lopm
ent Effe
ctiveness R
evie
w 2
016
67
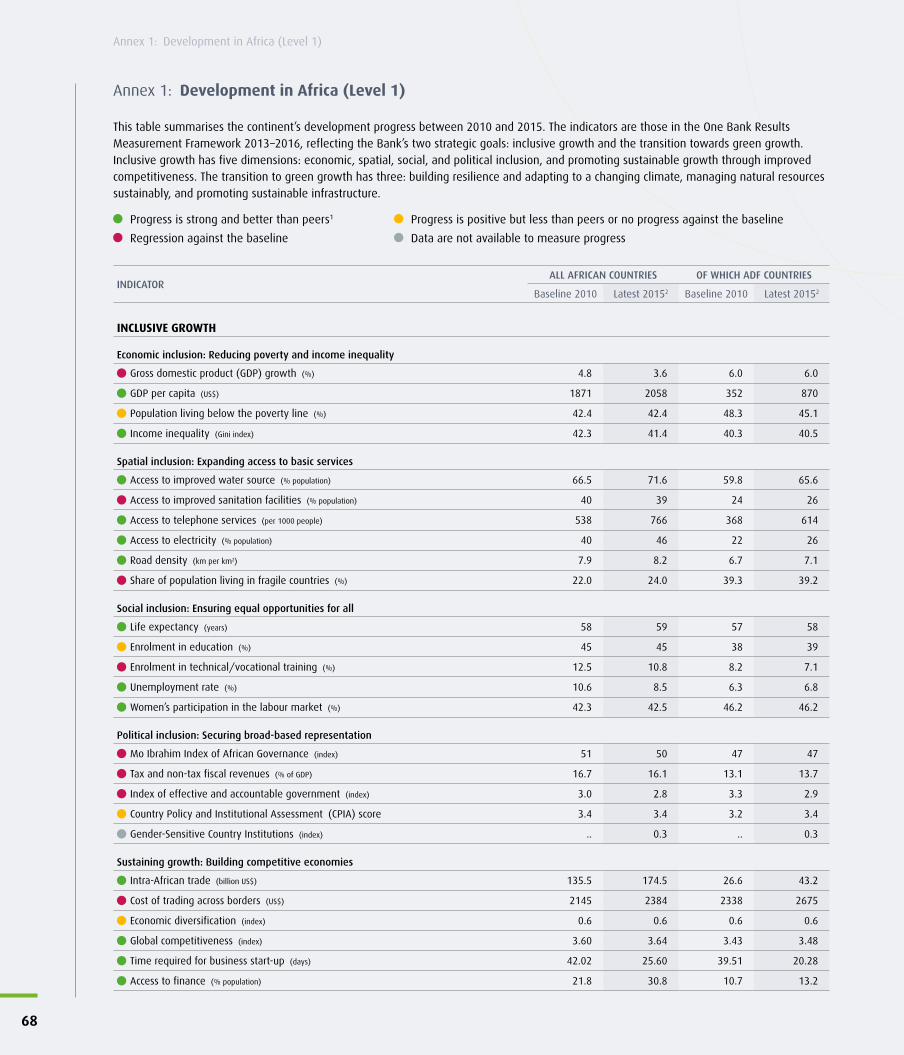
Annex 1: Development in Africa (Level 1)
This table summarises the continent’s development progress between 2010 and 2015. The indicators are those in the One Bank Results Measurement Framework 2013–2016, reflecting the Bank’s two strategic goals: inclusive growth and the transition towards green growth. Inclusive growth has five dimensions: economic, spatial, social, and political inclusion, and promoting sustainable growth through improved competitiveness. The transition to green growth has three: building resilience and adapting to a changing climate, managing natural resources sustainably, and promoting sustainable infrastructure.
Progress is strong and better than peers1 Progress is positive but less than peers or no progress against the baseline
Regression against the baseline Data are not available to measure progress
INDICATORALL AFRICAN COUNTRIES OF WHICH ADF COUNTRIES
Baseline 2010 Latest 20152 Baseline 2010 Latest 20152
INCLUSIVE GROWTH
Economic inclusion: Reducing poverty and income inequality
Gross domestic product (GDP) growth (%) 4.8 3.6 6.0 6.0
GDP per capita (US$) 1871 2058 352 870
Population living below the poverty line (%) 42.4 42.4 48.3 45.1
Income inequality (Gini index) 42.3 41.4 40.3 40.5
Spatial inclusion: Expanding access to basic services
Access to improved water source (% population) 66.5 71.6 59.8 65.6
Access to improved sanitation facilities (% population) 40 39 24 26
Access to telephone services (per 1000 people) 538 766 368 614
Access to electricity (% population) 40 46 22 26
Road density (km per km2) 7.9 8.2 6.7 7.1
Share of population living in fragile countries (%) 22.0 24.0 39.3 39.2
Social inclusion: Ensuring equal opportunities for all
Life expectancy (years) 58 59 57 58
Enrolment in education (%) 45 45 38 39
Enrolment in technical/vocational training (%) 12.5 10.8 8.2 7.1
Unemployment rate (%) 10.6 8.5 6.3 6.8
Women’s participation in the labour market (%) 42.3 42.5 46.2 46.2
Political inclusion: Securing broad-based representation
Mo Ibrahim Index of African Governance (index) 51 50 47 47
Tax and non-tax fiscal revenues (% of GDP) 16.7 16.1 13.1 13.7
Index of effective and accountable government (index) 3.0 2.8 3.3 2.9
Country Policy and Institutional Assessment (CPIA) score 3.4 3.4 3.2 3.4
Gender-Sensitive Country Institutions (index) .. 0.3 .. 0.3
Sustaining growth: Building competitive economies
Intra-African trade (billion US$) 135.5 174.5 26.6 43.2
Cost of trading across borders (US$) 2145 2384 2338 2675
Economic diversification (index) 0.6 0.6 0.6 0.6
Global competitiveness (index) 3.60 3.64 3.43 3.48
Time required for business start-up (days) 42.02 25.60 39.51 20.28
Access to finance (% population) 21.8 30.8 10.7 13.2
68
Annex 1: Development in Africa (Level 1)

INDICATORALL AFRICAN COUNTRIES OF WHICH ADF COUNTRIES
Baseline 2010 Latest 20152 Baseline 2010 Latest 20152
THE TRANSITION TOWARDS GREEN GROWTH
Building resilience and adapting to a changing environment
Food insecurity (% of population) 23.8 24.6 34.4 30.9
Resilience to water shocks (index) 3.06 3.55 1.57 2.23
Managing natural assets efficiently and sustainably
Institutional capacity for environmental sustainability (index) 3.5 3.5 3.3 3.4
Agricultural productivity (US$ per worker) 1330 1273 396 418
Promoting sustainable infrastructure, reducing waste and pollution
Production efficiency (kg CO2 emissions per US$ of GDP) 0.51 0.45 0.24 0.24
Renewable energy (% total electricity produced) 16.0 17.6 78.0 73.8
.. = data not available; ADF = African Development Fund; GDP = gross domestic product; US$ = United States dollars.1 Peers refers to other developing countries around the world. For two indicators — the Mo Ibrahim index and institutional capacity for environmental sustainability — Africa is not
assessed against peers but rather on the basis of progress on historic trends. 2 Where data are not available for 2015, the latest available values are used.
Notes: ADF countries are the 37 lower-income AfDB member countries that qualify for concessional funding: Benin, Burkina Faso, Burundi, Cameroon, Central African Republic, Chad, Comoros, Democratic Republic of the Congo, Côte d’Ivoire, Djibouti, Eritrea, Ethiopia, Gambia, Ghana, Guinea, Guinea-Bissau, Kenya, Lesotho, Liberia, Madagascar, Malawi, Mali, Mauritania, Mozambique, Niger, Rwanda, São Tomé and Principe, Senegal, Sierra Leone, Somalia, Sudan, South Sudan, Tanzania, Togo, Uganda, Zambia, and Zimbabwe.
Source: AfDB, Carbon Dioxide Information Analysis Center, Education Statistics, Food and Agriculture Organization, Freedom House, International Finance Corporation, International Labour Organization, IMF, International Telecommunications Union, Mo Ibrahim Foundation, Organisation for Economic Co-operation and Development, UN Population Information Network, UN Conference on Trade and Development, United Nations Development Programme, United Nations Children’s Fund, World Bank, World Economic Forum.
Annual D
eve
lopm
ent Effe
ctiveness R
evie
w 2
016
69
Annex 1: Development in Africa (Level 1)
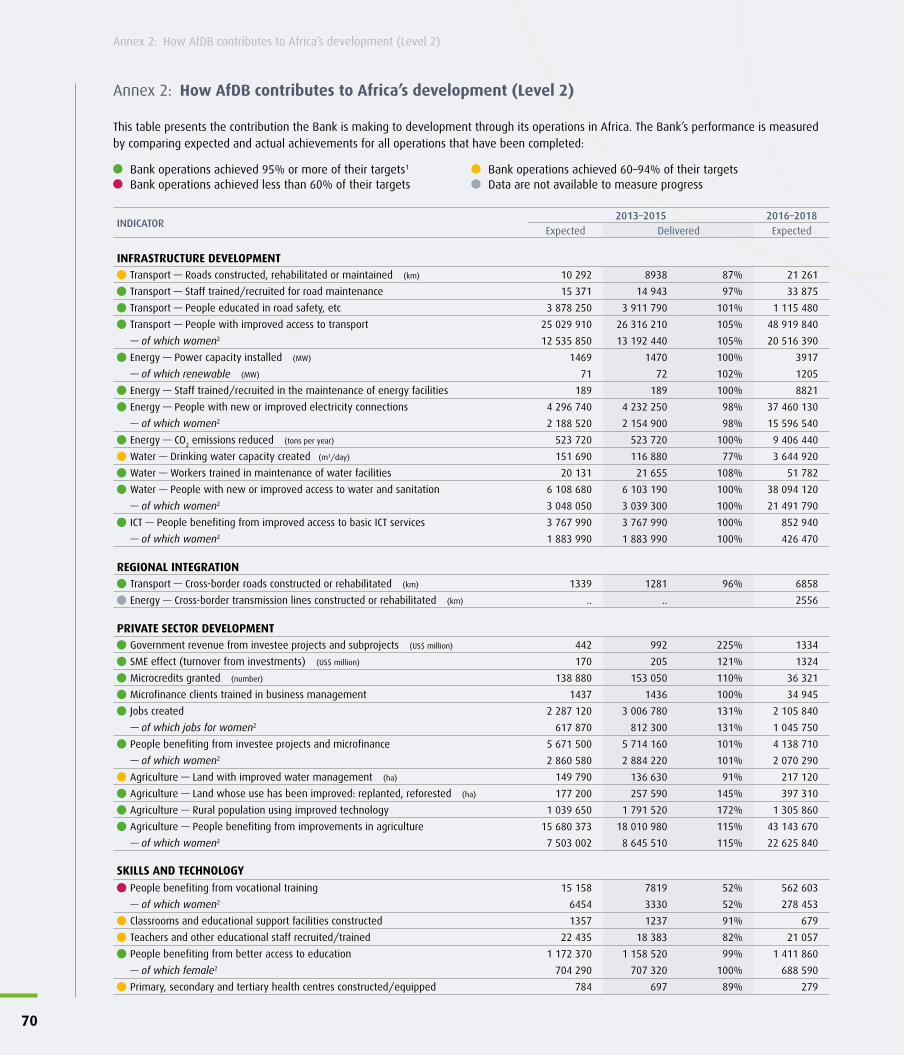
Annex 2: How AfDB contributes to Africa’s development (Level 2)
This table presents the contribution the Bank is making to development through its operations in Africa. The Bank’s performance is measured by comparing expected and actual achievements for all operations that have been completed:
Bank operations achieved 95% or more of their targets1 Bank operations achieved 60–94% of their targetsBank operations achieved less than 60% of their targets Data are not available to measure progress
INDICATOR2013–2015 2016–2018
Expected Delivered Expected
INFRASTRUCTURE DEVELOPMENTTransport — Roads constructed, rehabilitated or maintained (km) 10 292 8938 87% 21 261
Transport — Staff trained/recruited for road maintenance 15 371 14 943 97% 33 875
Transport — People educated in road safety, etc 3 878 250 3 911 790 101% 1 115 480
Transport — People with improved access to transport 25 029 910 26 316 210 105% 48 919 840
— of which women2 12 535 850 13 192 440 105% 20 516 390
Energy — Power capacity installed (MW) 1469 1470 100% 3917
— of which renewable (MW) 71 72 102% 1205
Energy — Staff trained/recruited in the maintenance of energy facilities 189 189 100% 8821
Energy — People with new or improved electricity connections 4 296 740 4 232 250 98% 37 460 130
— of which women2 2 188 520 2 154 900 98% 15 596 540
Energy — CO2 emissions reduced (tons per year) 523 720 523 720 100% 9 406 440
Water — Drinking water capacity created (m3/day) 151 690 116 880 77% 3 644 920
Water — Workers trained in maintenance of water facilities 20 131 21 655 108% 51 782
Water — People with new or improved access to water and sanitation 6 108 680 6 103 190 100% 38 094 120
— of which women2 3 048 050 3 039 300 100% 21 491 790
ICT — People benefiting from improved access to basic ICT services 3 767 990 3 767 990 100% 852 940
— of which women2 1 883 990 1 883 990 100% 426 470
REGIONAL INTEGRATIONTransport — Cross-border roads constructed or rehabilitated (km) 1339 1281 96% 6858
Energy — Cross-border transmission lines constructed or rehabilitated (km) .. .. 2556
PRIVATE SECTOR DEVELOPMENTGovernment revenue from investee projects and subprojects (US$ million) 442 992 225% 1334
SME effect (turnover from investments) (US$ million) 170 205 121% 1324
Microcredits granted (number) 138 880 153 050 110% 36 321
Microfinance clients trained in business management 1437 1436 100% 34 945
Jobs created 2 287 120 3 006 780 131% 2 105 840
— of which jobs for women2 617 870 812 300 131% 1 045 750
People benefiting from investee projects and microfinance 5 671 500 5 714 160 101% 4 138 710
— of which women2 2 860 580 2 884 220 101% 2 070 290
Agriculture — Land with improved water management (ha) 149 790 136 630 91% 217 120
Agriculture — Land whose use has been improved: replanted, reforested (ha) 177 200 257 590 145% 397 310
Agriculture — Rural population using improved technology 1 039 650 1 791 520 172% 1 305 860
Agriculture — People benefiting from improvements in agriculture 15 680 373 18 010 980 115% 43 143 670
— of which women2 7 503 002 8 645 510 115% 22 625 840
SKILLS AND TECHNOLOGYPeople benefiting from vocational training 15 158 7819 52% 562 603
— of which women2 6454 3330 52% 278 453
Classrooms and educational support facilities constructed 1357 1237 91% 679
Teachers and other educational staff recruited/trained 22 435 18 383 82% 21 057
People benefiting from better access to education 1 172 370 1 158 520 99% 1 411 860
— of which female2 704 290 707 320 100% 688 590
Primary, secondary and tertiary health centres constructed/equipped 784 697 89% 279
70
Annex 2: How AfDB contributes to Africa’s development (Level 2)
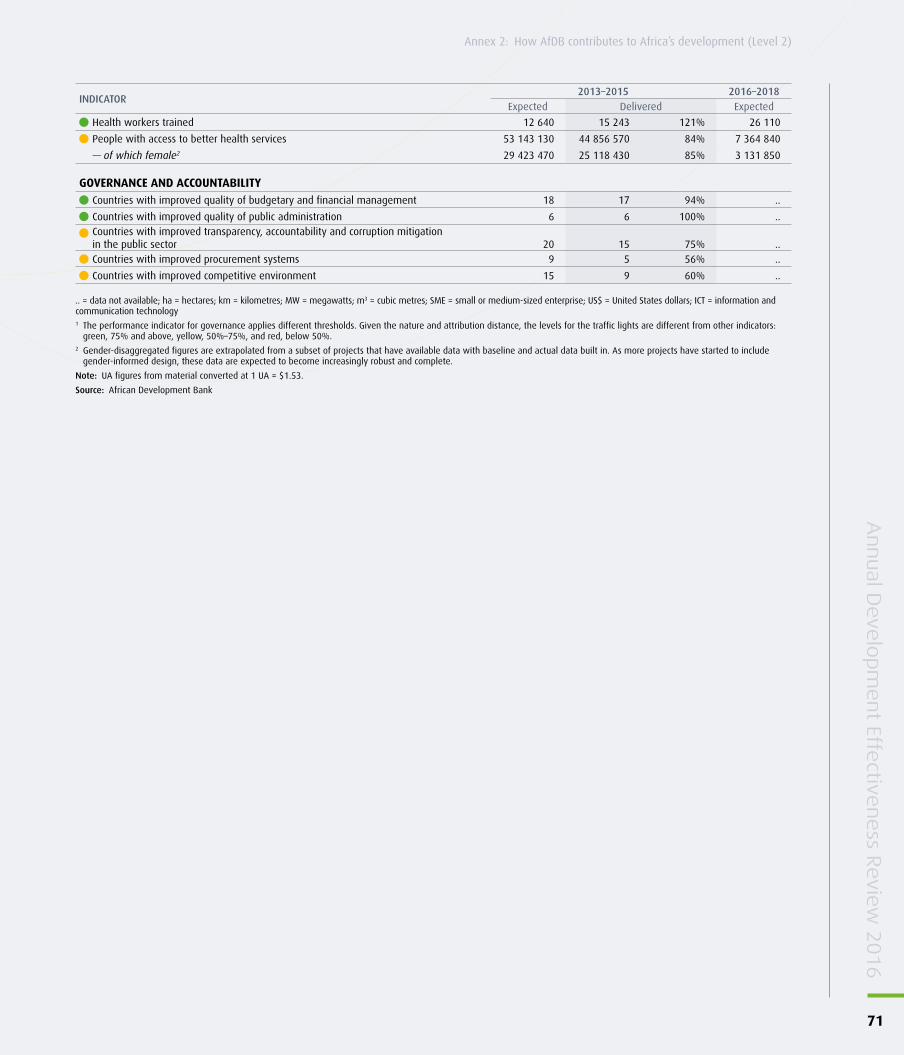
INDICATOR2013–2015 2016–2018
Expected Delivered Expected
Health workers trained 12 640 15 243 121% 26 110
People with access to better health services 53 143 130 44 856 570 84% 7 364 840
— of which female2 29 423 470 25 118 430 85% 3 131 850
GOVERNANCE AND ACCOUNTABILITYCountries with improved quality of budgetary and financial management 18 17 94% ..
Countries with improved quality of public administration 6 6 100% ..Countries with improved transparency, accountability and corruption mitigation in the public sector 20 15 75% ..Countries with improved procurement systems 9 5 56% ..
Countries with improved competitive environment 15 9 60% ..
.. = data not available; ha = hectares; km = kilometres; MW = megawatts; m3 = cubic metres; SME = small or medium-sized enterprise; US$ = United States dollars; ICT = information and communication technology1 The performance indicator for governance applies different thresholds. Given the nature and attribution distance, the levels for the traffic lights are different from other indicators:
green, 75% and above, yellow, 50%–75%, and red, below 50%. 2 Gender-disaggregated figures are extrapolated from a subset of projects that have available data with baseline and actual data built in. As more projects have started to include
gender-informed design, these data are expected to become increasingly robust and complete.
Note: UA figures from material converted at 1 UA = $1.53.
Source: African Development Bank
Annual D
eve
lopm
ent Effe
ctiveness R
evie
w 2
016
71
Annex 2: How AfDB contributes to Africa’s development (Level 2)

Annual Development Effectiveness Review 2014Towards Africa’s transformation
Annual review
African Development Bank Group
Annual Development Effectiveness Review 2015Driving development through innovation
Annual review
African Development Bank Group
The Development Effectiveness Review series of the Bank
Annual reviews
Thematic reviews
Country reviews
African Development Bank Group
Development Effectiveness Review 2012Fragile StateS and ConFliCt-aFFeCted CountrieS
Thematic review
African Development Bank Group
Thematic review
Development Effectiveness Review 2014ENERGY
Development Effectiveness Review 2015ETHIOPIA
Country review
African Development Bank GroupAfrican Development Bank Group
Country review
Development Effectiveness Review 2015SIERRA LEONE

Annual review
Annual Development Effectiveness Review 2011
African Development Bank Group
Annual Development Effectiveness Review 2012Growing African Economies Inclusively
Annual review
African Development Bank Group
Annual Development Effectiveness Review 2013Towards sustainable growth for Africa
Annual review
African Development Bank Group
Development Effectiveness Review 2012GOVERNANCE
Thematic review
African Development Bank GroupAfrican Development Bank Group
Thematic review
Development Effectiveness Review 2012Promoting regional integration
De
ve
lop
me
nt Effe
ctive
ne
ss Re
vie
w 2
01
2 - P
ro
mo
ting
reg
ion
al in
tegr
atio
n
Development Effectiveness Review 2012Rwanda
African Development Bank Group
Country review
Development Effectiveness Review 2013ZAMBIA
African Development Bank Group
Country review
Development Effectiveness Review 2013SENEGAL
African Development Bank Group
Country review

www.afdb.org Des
ign/
layo
ut: w
ww
.cre
onde
sign
.net

African Development Bank
Avenue Joseph Anoma - 01 B.P. 1387 Abidjan 01, Côte d’Ivoire
www.afdb.org
About this publicationThe 2016 Annual Development Effectiveness Review is a comprehensive report on the performance of the African Development Bank (AfDB). The report reviews development trends across the continent and explores how the AfDB’s operations have contributed to Africa’s development results over the past three years. This year’s edition reflects the AfDB’s new focus on an interlocking set of five critical priorities within the Bank’s Ten-Year Strategy: the “High 5s”. It also looks at how effectively the AfDB manages its operations and its own organisation. The report is supplemented each year by more detailed reviews of particular sectors and thematic areas as well as selected country reviews.
About the African Development Bank GroupThe AfDB Group is a multilateral development bank whose shareholders include 54 African countries and 26 non-African countries. The AfDB Group’s primary objective is to contribute to the sustainable economic development and social progress of its regional members, individually and jointly. It does this by financing a broad range of development projects and programmes through public sector loans, including policy-based loans, and through private sector loans and equity investments; by providing technical assistance for institutional support projects and programmes; by making public and private capital investments; by assisting countries with development policies and plans; and by supplying emergency assistance.