annual education performance report - birmingham
TRANSCRIPT
Annual Education Performance Report
2016 Examinations and Assessments March 2017

Exam and Assessments Results 2016
1
Exam and Assessments Results 2016
2
Contents Executive Summary ........................................................................................................................................................................................ 4 Early Years and Primary School Results .......................................................................................................................................................... 6
Early Years Foundation Stage Profile (EYFSP) ............................................................................................................................................. 7 Key Messages ................................................................................................................................................................................................... 7 Background ...................................................................................................................................................................................................... 7 Overall Performance ........................................................................................................................................................................................ 7 National Comparisons ...................................................................................................................................................................................... 8 Gender, Free School Meals and Language ....................................................................................................................................................... 9 Ethnicity ......................................................................................................................................................................................................... 10 Ward/Geography ........................................................................................................................................................................................... 11
Phonics ..................................................................................................................................................................................................... 12 Key Messages ................................................................................................................................................................................................. 12 Background .................................................................................................................................................................................................... 12 Overall Performance ...................................................................................................................................................................................... 12 National Comparisons .................................................................................................................................................................................... 13 Public Characteristics - Gender, Free School Meals, Disadvantaged, Language ............................................................................................ 14 And Special Educational Needs ...................................................................................................................................................................... 14 Ethnicity ......................................................................................................................................................................................................... 15
Key Stage 1 ............................................................................................................................................................................................... 16 Key Messages ................................................................................................................................................................................................. 16 Background .................................................................................................................................................................................................... 16 Overall Performance ...................................................................................................................................................................................... 16 National Comparisons .................................................................................................................................................................................... 17 Public Characteristics - Gender, Free School Meals, Disadvantaged, Language and Special Educational Needs .......................................... 18 Ethnicity ......................................................................................................................................................................................................... 19 Ward/Geography ........................................................................................................................................................................................... 20
Key Stage 2 ............................................................................................................................................................................................... 23 Key Messages ................................................................................................................................................................................................. 23 Background .................................................................................................................................................................................................... 23 National Comparisons .................................................................................................................................................................................... 25 Public Characteristics - Gender, Free School Meals, Disadvantaged, Language and Special Educational Needs .......................................... 27 Ethnicity ......................................................................................................................................................................................................... 30 Ethnic group, gender and disadvantaged ...................................................................................................................................................... 33 Ward/Geography ........................................................................................................................................................................................... 34 Disadvantaged vs Non Disadvantaged ........................................................................................................................................................... 35 Floor Standards and Coasting Schools ........................................................................................................................................................... 36
Secondary School Results .............................................................................................................................................................................. 38 Key Stage 4 ............................................................................................................................................................................................... 39
Key Messages ................................................................................................................................................................................................. 39 Background .................................................................................................................................................................................................... 39 Overall Performance ...................................................................................................................................................................................... 40 Attainment ..................................................................................................................................................................................................... 40 Progress ......................................................................................................................................................................................................... 40 Subject performance compared with previous years .................................................................................................................................... 41 National Comparisons .................................................................................................................................................................................... 42 Public Characteristics - Gender, Free School Meals, Disadvantaged, Language and Special Educational Needs .......................................... 43 Ethnicity ......................................................................................................................................................................................................... 45 Ward geography ............................................................................................................................................................................................ 49 Disadvantaged vs Non Disadvantaged ........................................................................................................................................................... 57 Floor standards and Coasting Schools ........................................................................................................................................................... 59
Key Stage 5 ............................................................................................................................................................................................... 62 Key Messages ................................................................................................................................................................................................. 62 Background .................................................................................................................................................................................................... 62 Overall Performance ...................................................................................................................................................................................... 63 National Comparisons .................................................................................................................................................................................... 64 Public Characteristics - Gender ...................................................................................................................................................................... 67
Appendix 1 – Primary School Summary Comparison Table ..................................................................................................................................... 68 Appendix 2 – Secondary School Summary Comparison Table ................................................................................................................................. 69 Appendix 3 – Explanation of Deprivation vs Non Deprivation Chart ....................................................................................................................... 70
Exam and Assessments Results 2016
3
Produced by
Intelligence and Analysis Team Birmingham City Council
Richard Browne – Intelligence Manager James Killan – Intelligence Officer
Brenda Henry – Intelligence Officer Helen Yee – Intelligence Officer
For more information contact [email protected]
Exam and Assessments Results 2016
4
Executive Summary Early Years Foundation Stage
63.7% of pupils achieved a Good Level of Development in Birmingham in 2016.
The proportion of children achieving a Good Level of Development improved between 2015 and 2016, however at the same time, the gap with the national average increased.
Birmingham’s performance is below the statistical neighbour average, but in line with the average core city performance.
There are gaps in the outcomes of different cohorts of children across the city. Girls continue to outperform boys, but both are below the average of theirs equivalents nationally with the gap between Birmingham girls and national girls the most pronounced at 7 percentage points (pp).
Those receiving Free School Meals (FSM) outperform their national peers.
The highest performing ethnic groups were those of Indian heritage, those of other Black background and other mixed background. The lowest performing groups were Gypsy/Roma and those from any other White background (ie. non White British/Irish).
Phonics
The percentage of pupils meeting the expected standard of decoding in Year 1 Phonics improved for Year 1 and end of Year 2 pupils (an increase of 3pp and 1pp respectively from 2015).
However, the gap between Birmingham and national performance has widened over the last few years
Girls continue to outperform boys (attainment gap of 7pp).
Attainment of pupils eligible for FSM has improved (an increase of 4pp) and Birmingham performs better compared to the national equivalent (difference of 4pp).
There are still significant gaps across ethnic groups. In particular pupils of Gypsy/Roma, Irish, Traveller of Irish heritage and any other white background underperform compared to other ethnic groups.
Key Stage 1
70% Birmingham pupils achieved the new expected standard in reading, 2 in 3 (67%) in maths and 6 in 10 (61%) in writing.
In comparisons with national results, Birmingham FSM pupils outperformed their national peers in reading, writing and maths.
Birmingham’s disadvantaged pupils also outperformed disadvantaged pupils nationally in reading, writing and maths.
Attainment for children who are not eligible for FSM or not disadvantaged was below national levels.
Girls convincingly outperform boys in all subjects. However, in contrast to other subjects, the attainment gap between the sexes in maths is much lower.
National comparators show that there are still significant gaps across ethnic groups, with differences being particularly pronounced for pupils with Gypsy/Roma, Other white and White and Black Caribbean heritage.
Key Stage 2
There a significant gaps across most subjects and cohorts in Birmingham for key stage 2.
47% of pupils reached the new expected standard and 3% achieved a high standard in reading, writing and maths – this performance was below the national average.
The percentage reaching the expected standard in the Grammar, Punctuation and Spelling (GPS) test was 72% and 22% achieved the high standard - GPS remains the highest of the tested subjects.
There are still gender differences between the subjects with the biggest gap in writing – 63% of boys and 76% of girls reaching the expected standard. However 66% of boys and 66% of girls reached the expected standard in maths.
Exam and Assessments Results 2016
5
Reading Writing and Maths combined attainment of pupils eligible for FSM is slightly above national averages, although progress is below comparator groups. Birmingham does perform better for GPS – 61% of pupils reaching the expected standard compared to the national figure of 57%.
However there are still significant gaps across ethnic groups with pupils of Gypsy / Roma , Black Caribbean and any other Black background underperforming.
Key Stage 4
Birmingham’s pupils make identical progress between key stage 2 and key stage 4 to pupils nationally. Compared to the figures for children attending state funded schools nationally, Birmingham pupils make slightly better progress.
The average Attainment 8 score is 49.4 which is in line with the national of 49.9.
The percentage of Birmingham children (24.6%) achieving the English Baccalaureate has increased by 1pp and is in line with the national figure (24.7%).
The percentage of children achieving A* to C in English and maths has risen 4 pp from last year to 59.9%. This rise, while in line with national, leaves Birmingham with a 3% attainment gap.
The Progress 8 and Attainment 8 scores for disadvantaged and non-disadvantaged children are above those nationally. There is a significantly smaller gap between the two groups in attainment and progress than comparable groups nationally.
The Progress 8 score of children with English as an additional language (EAL) in Birmingham, while higher than the overall average, is significantly behind other EAL children nationally.
As a group, children from an Asian background make better progress between key stage 2 and 4 than all children nationally but less progress than other Asian children nationally.
The attainment of most individual ethnic groups in Birmingham is in line with similar groups nationally. Children from an Asian background have relatively high attainment but do not achieve as highly as similar children nationally.
Key Stage 5
Birmingham’s key stage 5 attainment is above national average for 2016.
Birmingham mainly outperforms core cities, statistical neighbours and the West Midlands.
Girls generally obtain a higher average point score than boys.
Boys do better than girls in the attainment measures.
Exam and Assessments Results 2016
6
Early Years and Primary School Results
Exam and Assessments Results 2016
7
Early Years Foundation Stage Profile (EYFSP)
Key Messages
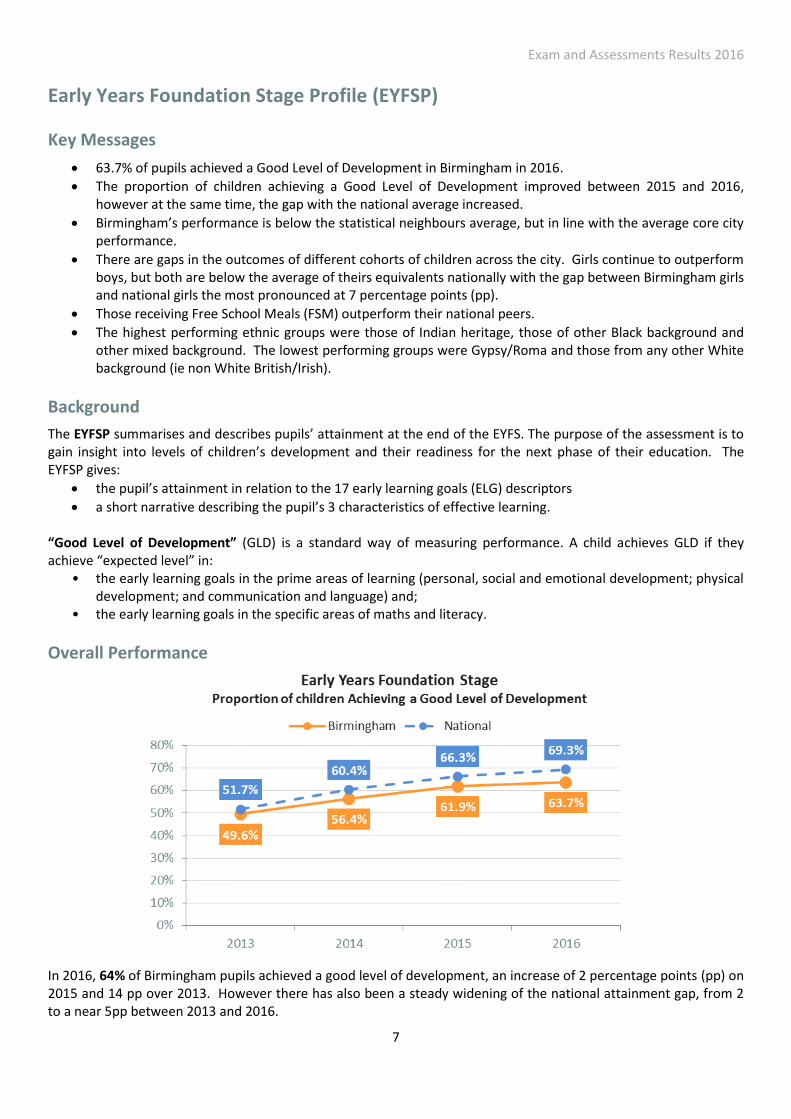
63.7% of pupils achieved a Good Level of Development in Birmingham in 2016.
The proportion of children achieving a Good Level of Development improved between 2015 and 2016, however at the same time, the gap with the national average increased.
Birmingham’s performance is below the statistical neighbours average, but in line with the average core city performance.
There are gaps in the outcomes of different cohorts of children across the city. Girls continue to outperform boys, but both are below the average of theirs equivalents nationally with the gap between Birmingham girls and national girls the most pronounced at 7 percentage points (pp).
Those receiving Free School Meals (FSM) outperform their national peers.
The highest performing ethnic groups were those of Indian heritage, those of other Black background and other mixed background. The lowest performing groups were Gypsy/Roma and those from any other White background (ie non White British/Irish).
Background
The EYFSP summarises and describes pupils’ attainment at the end of the EYFS. The purpose of the assessment is to gain insight into levels of children’s development and their readiness for the next phase of their education. The EYFSP gives:
the pupil’s attainment in relation to the 17 early learning goals (ELG) descriptors
a short narrative describing the pupil’s 3 characteristics of effective learning. “Good Level of Development” (GLD) is a standard way of measuring performance. A child achieves GLD if they achieve “expected level” in:
• the early learning goals in the prime areas of learning (personal, social and emotional development; physical development; and communication and language) and;
• the early learning goals in the specific areas of maths and literacy.
Overall Performance
In 2016, 64% of Birmingham pupils achieved a good level of development, an increase of 2 percentage points (pp) on 2015 and 14 pp over 2013. However there has also been a steady widening of the national attainment gap, from 2 to a near 5pp between 2013 and 2016.
Exam and Assessments Results 2016
8
National Comparisons
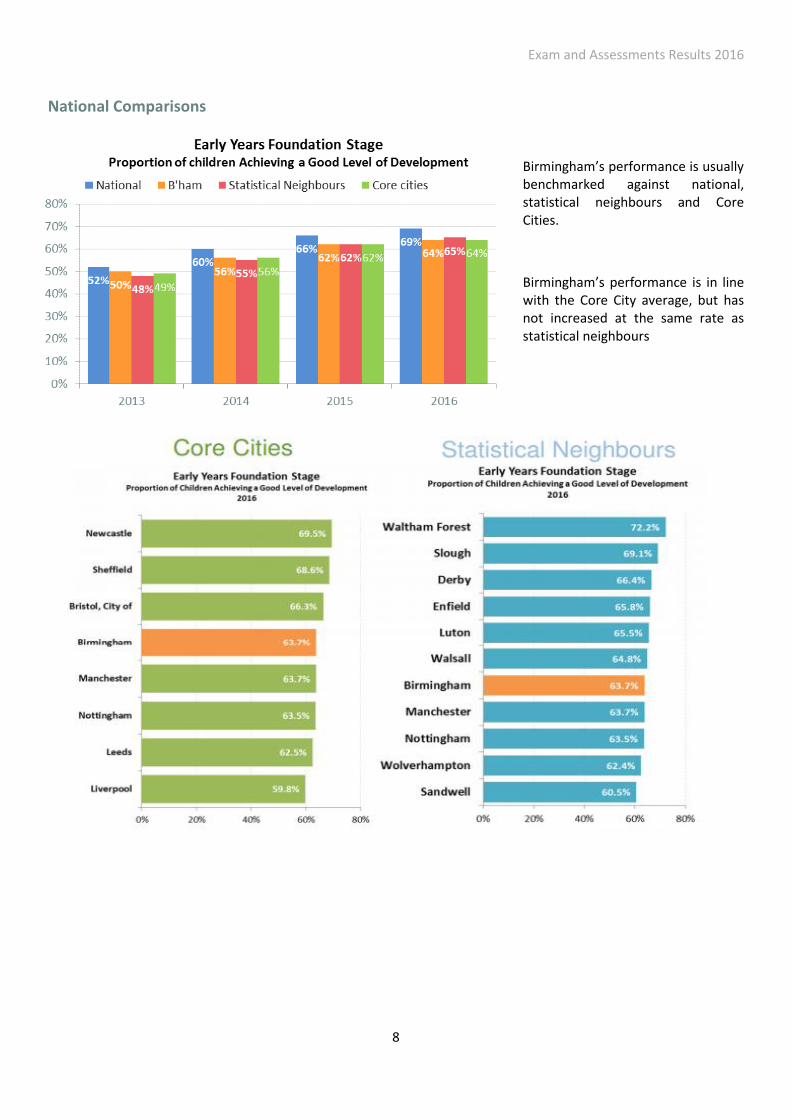
Birmingham’s performance is usually benchmarked against national, statistical neighbours and Core Cities.
Birmingham’s performance is in line with the Core City average, but has not increased at the same rate as statistical neighbours

Exam and Assessments Results 2016
9
Gender, Free School Meals and Language
The chart above shows the attainment gap between Birmingham and the national average for the proportion of children achieving a Good Level of Development across three main cohorts – Gender, Free School Meal, and Language. There are gaps across all groups, apart from those receiving Free School meals which out performs their national peers. The gap between Birmingham girls and national girls is most pronounced at 6 pp, although girls are the highest performing group in the city.
Gender
The chart on the left shows that the attainment gaps between Birmingham boys and national boys and Birmingham girls and national girls have increased over time, with the gaps becoming particularly pronounced in 2016.
Free School Meals
The chart on the right shows that Birmingham FSM school children have consistently outperformed their national peers since 2013, although this gap is narrowing.
At 67%, the proportion of Birmingham early years children achieving GLD and who are not eligible for free school meals is trailing the national average by 5pp. The most recent years show a widening of the national attainment gap.
Exam and Assessments Results 2016
10
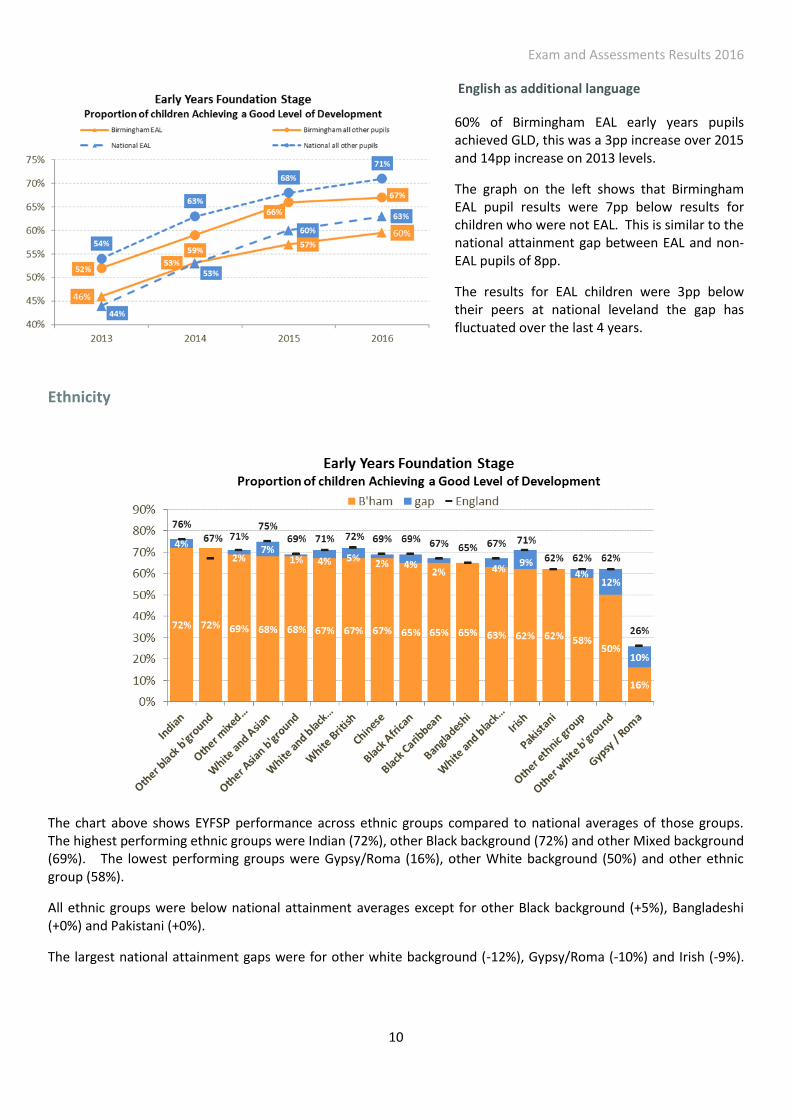
English as additional language
60% of Birmingham EAL early years pupils achieved GLD, this was a 3pp increase over 2015 and 14pp increase on 2013 levels.
The graph on the left shows that Birmingham EAL pupil results were 7pp below results for children who were not EAL. This is similar to the national attainment gap between EAL and non-EAL pupils of 8pp.
The results for EAL children were 3pp below their peers at national leveland the gap has fluctuated over the last 4 years.
Ethnicity
The chart above shows EYFSP performance across ethnic groups compared to national averages of those groups. The highest performing ethnic groups were Indian (72%), other Black background (72%) and other Mixed background (69%). The lowest performing groups were Gypsy/Roma (16%), other White background (50%) and other ethnic group (58%).
All ethnic groups were below national attainment averages except for other Black background (+5%), Bangladeshi (+0%) and Pakistani (+0%).
The largest national attainment gaps were for other white background (-12%), Gypsy/Roma (-10%) and Irish (-9%).
Exam and Assessments Results 2016
11
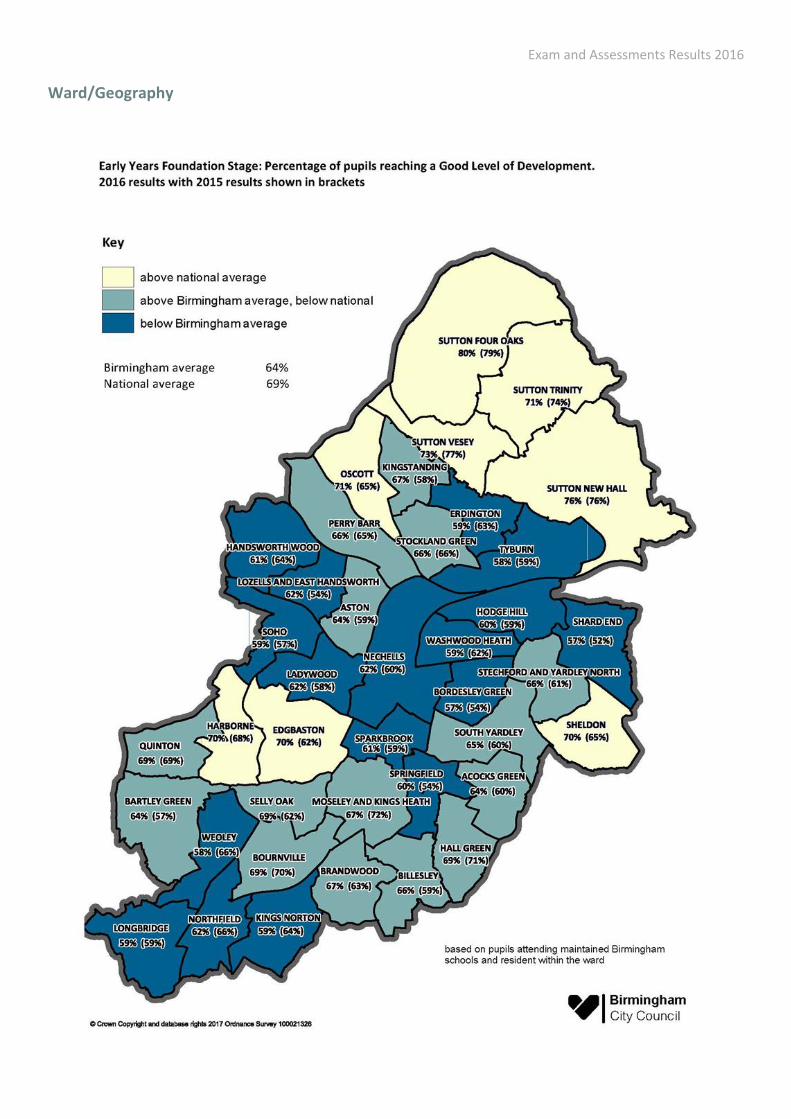
Ward/Geography
Exam and Assessments Results 2016
12
Phonics
Key Messages
The percentage of pupils meeting the expected standard of decoding in Year 1 Phonics improved for Year 1 and end of Year 2 pupils (an increase of 3pp and 1pp respectively from 2015)
However the gap between Birmingham and national performance has widened over the last few years
Girls continue to outperform boys (attainment gap of 7pp)
Attainment of pupils eligible for FSM has improved (an increase of 4pp) and Birmingham performs better compared to the national equivalent (difference of 4pp)
There are still significant gaps across ethnic groups. In particular pupils of Gypsy / Roma, Irish, Traveller of Irish heritage and any other white background underperform compared to other ethnic groups.
Background The Phonics screening check is a short assessment of phonic decoding. It consists of a list of 40 words, half real words and half non-words, which Year 1 children read to a teacher. Those children who did not undertake Phonics or make the expected standard in Year 1 then re-take the screening check in Year 2. A child is required to achieve 32 out of 40 to meet the expected standard in Phonics. This threshold has remained the same since 2012 which was the year of introduction.
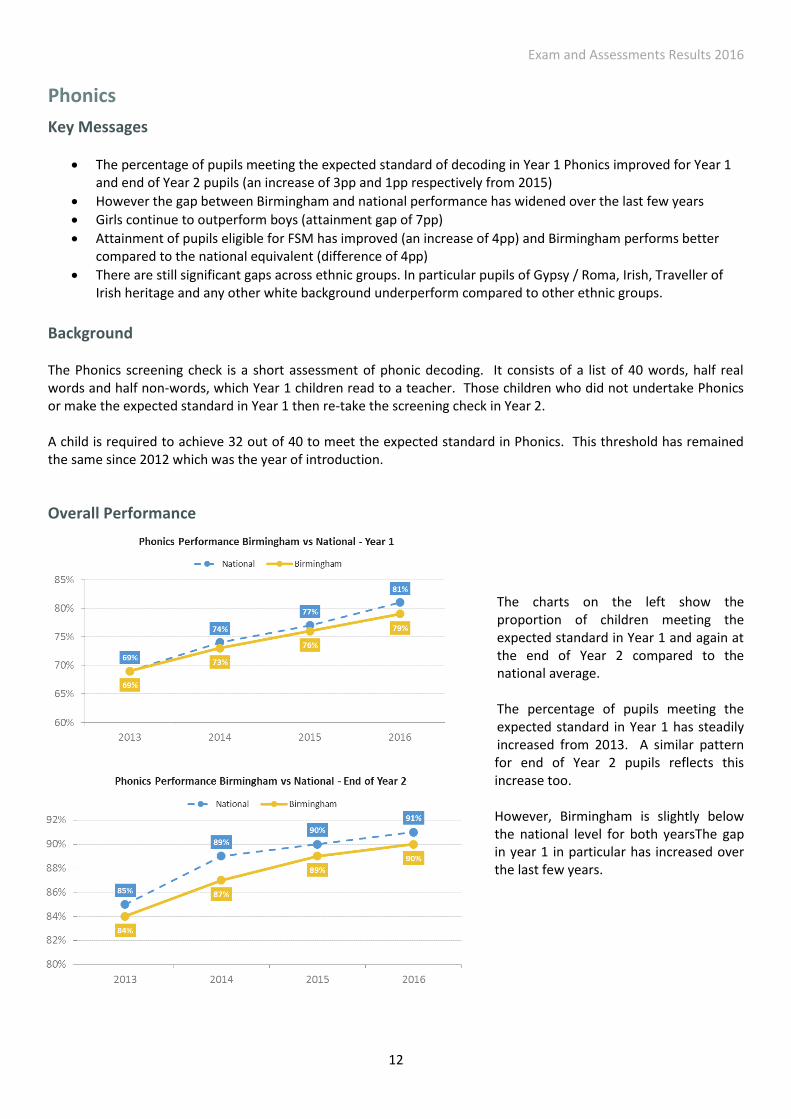
Overall Performance
The charts on the left show the proportion of children meeting the expected standard in Year 1 and again at the end of Year 2 compared to the national average. The percentage of pupils meeting the expected standard in Year 1 has steadily increased from 2013. A similar pattern for end of Year 2 pupils reflects this increase too. However, Birmingham is slightly below the national level for both yearsThe gap in year 1 in particular has increased over the last few years.
Exam and Assessments Results 2016
13
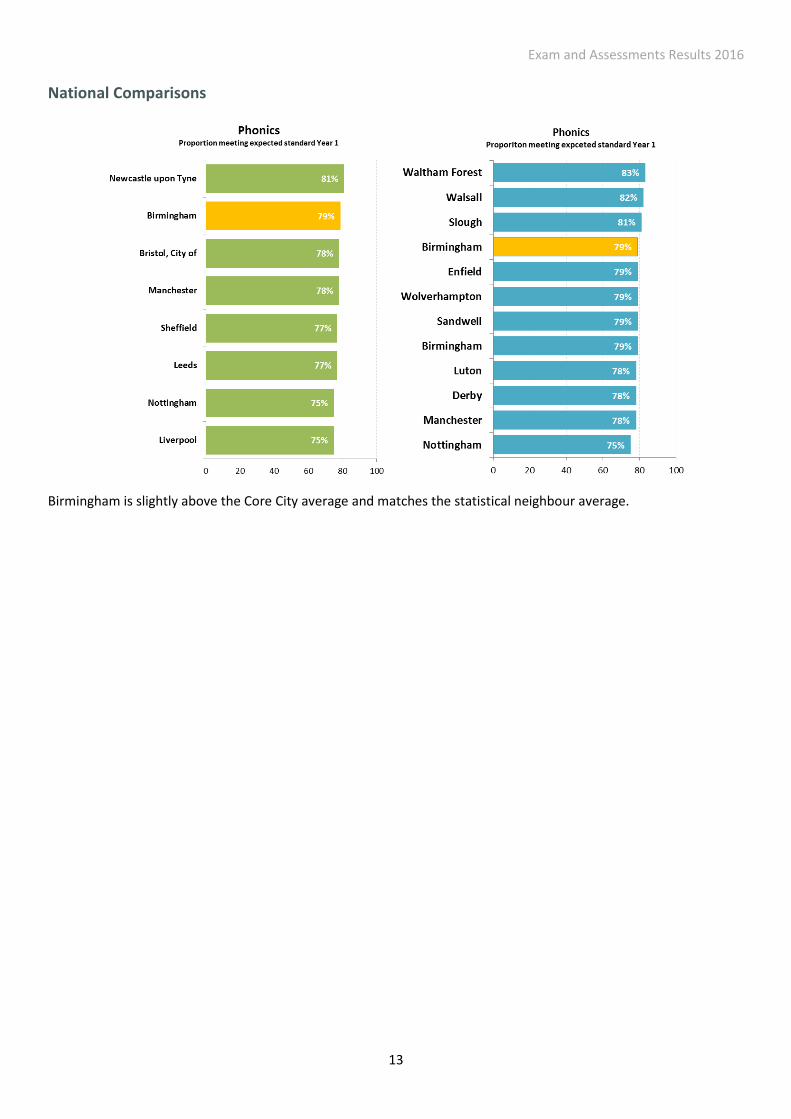
National Comparisons
Birmingham is slightly above the Core City average and matches the statistical neighbour average.
Exam and Assessments Results 2016
14
Public Characteristics - Gender, Free School Meals, Disadvantaged, Language And Special Educational Needs
The chart above breaks down Birmingham Phonics performance at Year 1 across the different cohorts of pupils, and compares each group’s performance with the equivalent national average. In Birmingham, girls outperform boys by 7pp – although this gap has closed by 2pp in the last 12 months. Both groups are very slightly below the national average. Birmingham’s Free School Meal pupils and disadvantaged pupils outperform their national peers. Within the city there was a 9pp gap between Free School Meals (FSM) pupil performance and non FSM pupils, and a 7pp gap between disadvantaged pupils and non-disadvantaged pupils. Both gaps have closed within the last 12 months. The gap in performance between those with EAL and Non EAL pupils has increased slightly in the last year, with EAL pupils performing just below their national peers. The biggest attainment gap is between pupils with special educational needs (SEN) and those with no identified SEN. SEN pupils’ performance is however in line with the equivalent national average.
By the end of year 2, nearly all cohorts in the city are in line with their national peers and the gap in Birmingham and national EAL pupils has almost closed.
Exam and Assessments Results 2016
15
Ethnicity
Attainment for Phonics Year 1 continues to vary between different ethnicity groups. Chinese pupils remain the highest achieving group although they dropped slightly from 2015. It is worth noting that the ethnic group which made the most improvement from 2015 to 2016 was the Any other black background which improved from 69% to 81%. Ethnicity groups which were highest achieving for Phonics in 2016 are:
Chinese
Indian
White and Black African
Exam and Assessments Results 2016
16
Key Stage 1
Key Messages
70% Birmingham pupils achieved the new expected standard in reading, 2 in 3 (67%) in maths and 6 in 10 (61%) in writing.
Comparisons with national results show that Birmingham FSM pupils outperformed their national peers in reading, writing and maths.
Birmingham disadvantaged pupils outperformed ‘disadvantaged’ pupils nationally in reading, writing and maths.
Attainment for children who are not eligible for FSM or not disadvantaged was below national levels.
Girls convincingly outperform boys in all subjects. However, in contrast to other subjects, the attainment gap between the sexes in maths is much lower.
National comparators show that there are still significant gaps across ethnic groups, with differences being particularly pronounced for pupils with Gypsy/Roma, Other white and White and Black Caribbean heritage.
Background 2016 was the first time that pupils have been taught and assessed against the new more challenging national curriculum. The expected standard has been raised, therefore the results may not be meaningfully compared with previous years.
Overall Performance
Overall, 7 in 10 Birmingham pupils achieved the new expected standard in reading, 2 in 3 (67%) in maths and 6 in 10 (61%) in writing. The proportion of Birmingham pupils achieving at least the expected standard at key stage 1 was highest for science and lowest for writing, this reflects the national results. However, results for Birmingham’s pupils were below the national average for all subjects. The attainment gaps were greatest for Science (8pp) and maths (6pp). Looking at more advanced attainment, 14% of pupils were working at greater depth in reading, but fewer for maths (14%) and writing (11%). This reflects the national results, however once again results for Birmingham were significantly below the national average for all subjects.
Exam and Assessments Results 2016
17
National Comparisons
The charts below compare Birmingham’s results across reading, writing and maths with Core Cities and statistical neighbours. All core cities were below the national average for reading. Newcastle upon Tyne was the only Core City to achieve national results for the proportion of children reaching at least the expected standard in writing and maths. Birmingham exceeded the Core City average for the proportion of pupils achieving at least the expected standard in reading and writing and was just 1pp below for maths. Birmingham’s key stage 1 attainment for reading and writing was slightly below the statistical neighbours’ average and 3pp below for maths.
Exam and Assessments Results 2016
18
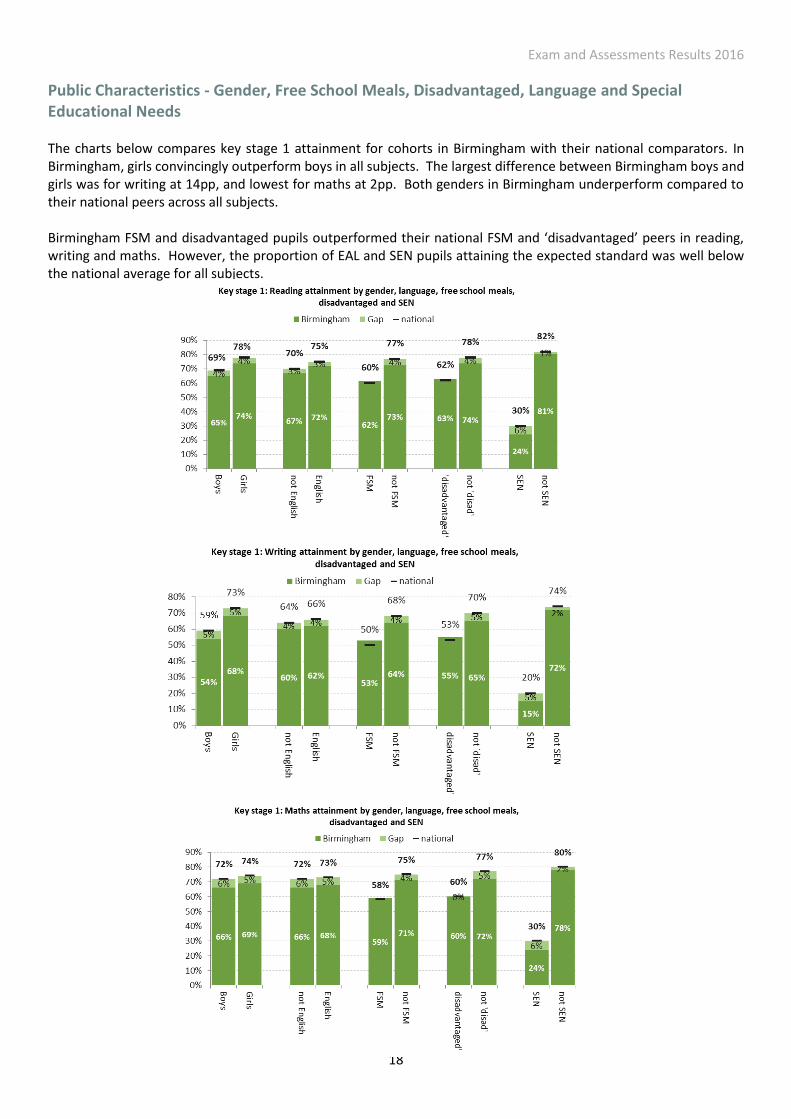
Public Characteristics - Gender, Free School Meals, Disadvantaged, Language and Special Educational Needs The charts below compares key stage 1 attainment for cohorts in Birmingham with their national comparators. In Birmingham, girls convincingly outperform boys in all subjects. The largest difference between Birmingham boys and girls was for writing at 14pp, and lowest for maths at 2pp. Both genders in Birmingham underperform compared to their national peers across all subjects. Birmingham FSM and disadvantaged pupils outperformed their national FSM and ‘disadvantaged’ peers in reading, writing and maths. However, the proportion of EAL and SEN pupils attaining the expected standard was well below the national average for all subjects.
Exam and Assessments Results 2016
19
Ethnicity
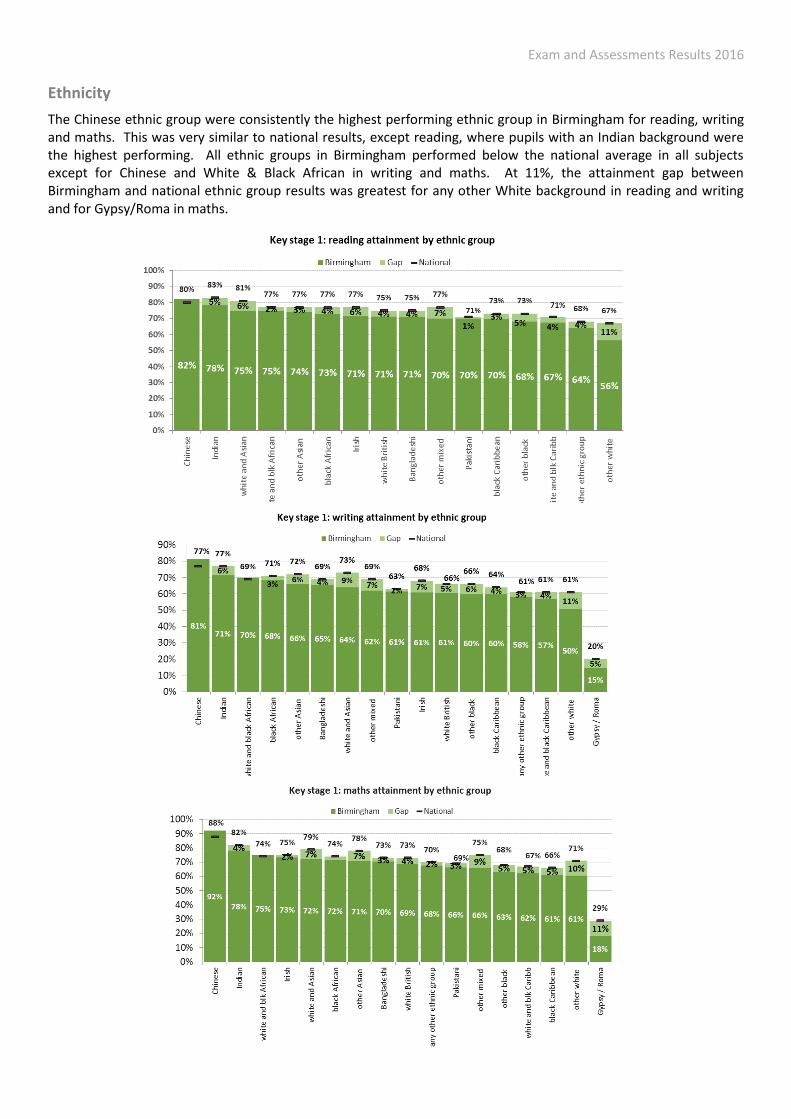
The Chinese ethnic group were consistently the highest performing ethnic group in Birmingham for reading, writing and maths. This was very similar to national results, except reading, where pupils with an Indian background were the highest performing. All ethnic groups in Birmingham performed below the national average in all subjects except for Chinese and White & Black African in writing and maths. At 11%, the attainment gap between Birmingham and national ethnic group results was greatest for any other White background in reading and writing and for Gypsy/Roma in maths.
Exam and Assessments Results 2016
20
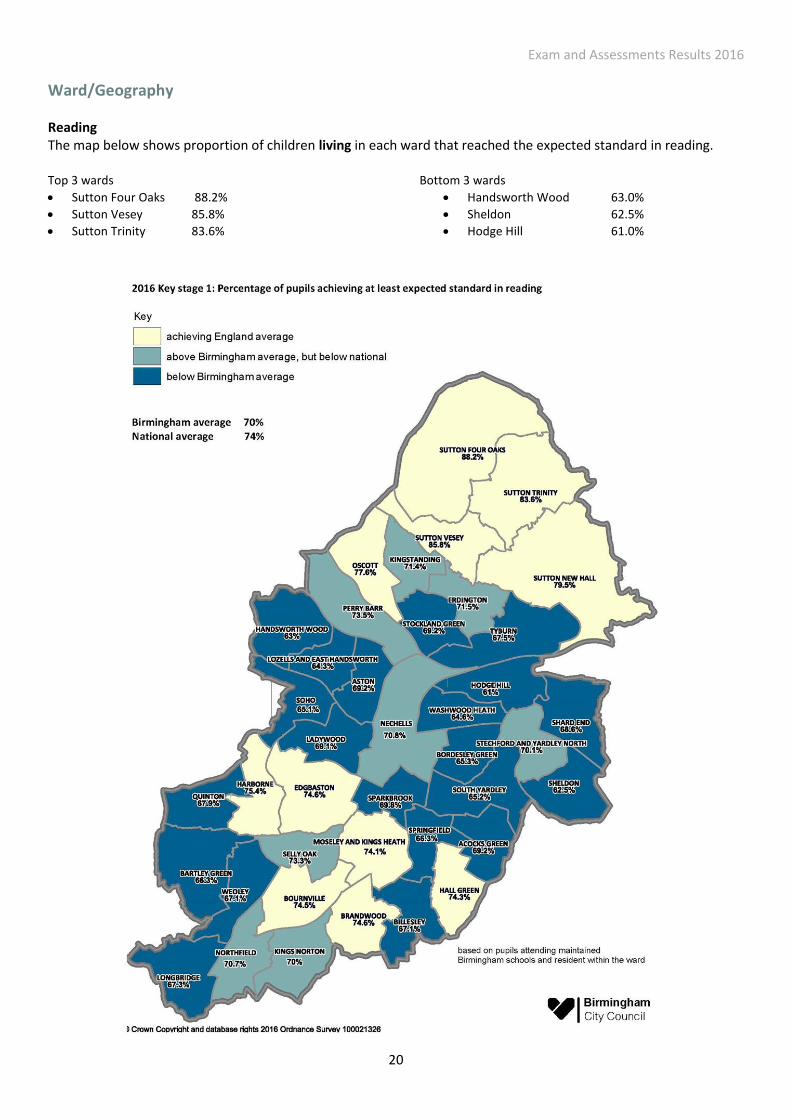
Ward/Geography Reading The map below shows proportion of children living in each ward that reached the expected standard in reading. Top 3 wards
Sutton Four Oaks 88.2%
Sutton Vesey 85.8%
Sutton Trinity 83.6%
Bottom 3 wards
Handsworth Wood 63.0%
Sheldon 62.5%
Hodge Hill 61.0%
Exam and Assessments Results 2016
21
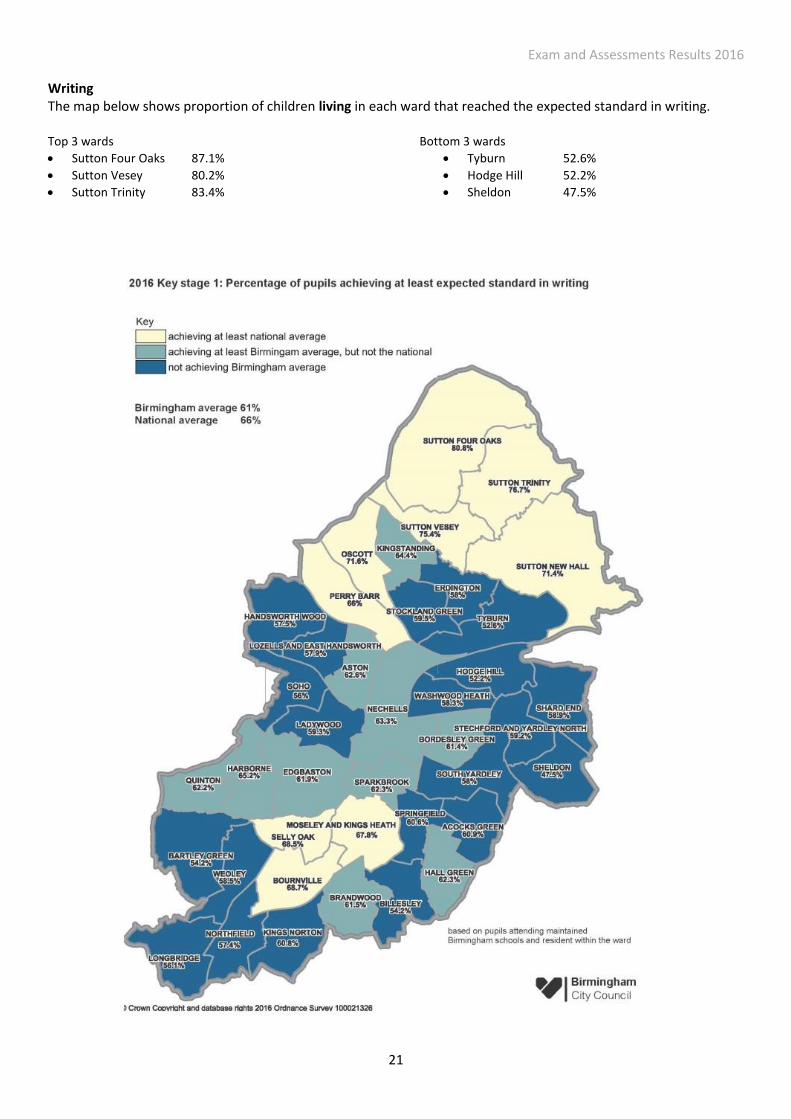
Writing The map below shows proportion of children living in each ward that reached the expected standard in writing. Top 3 wards
Sutton Four Oaks 87.1%
Sutton Vesey 80.2%
Sutton Trinity 83.4%
Bottom 3 wards
Tyburn 52.6%
Hodge Hill 52.2%
Sheldon 47.5%
Exam and Assessments Results 2016
22
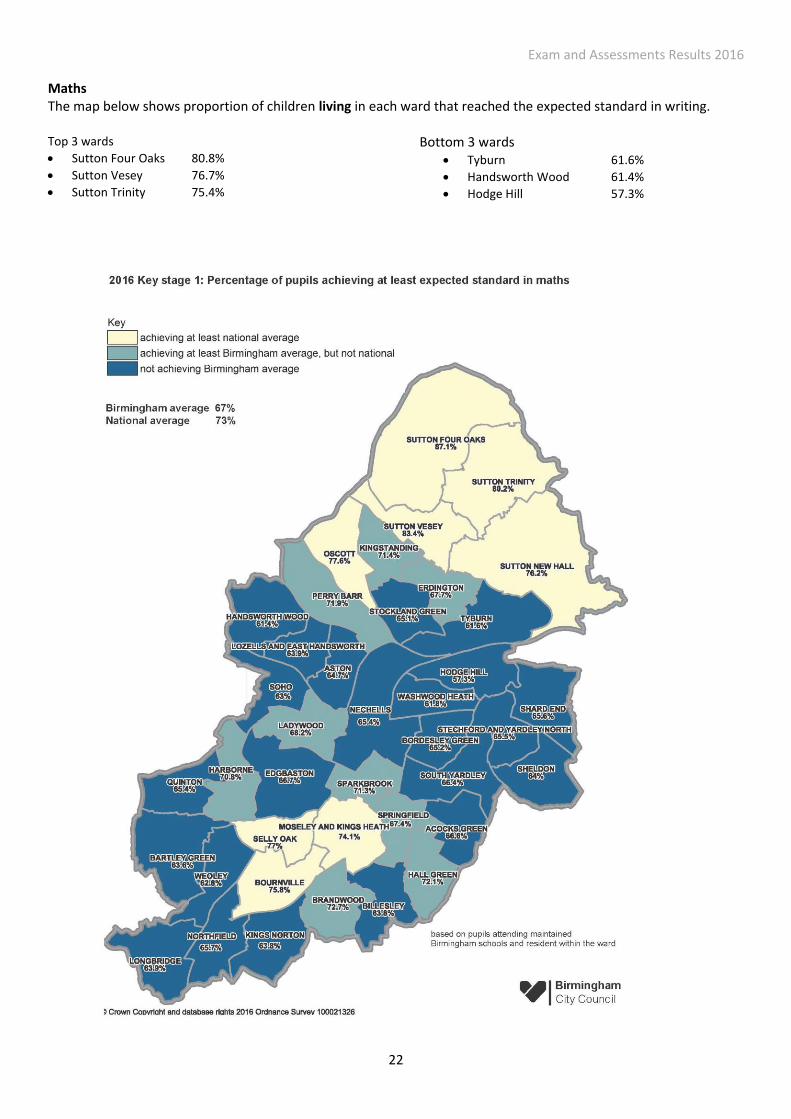
Maths The map below shows proportion of children living in each ward that reached the expected standard in writing. Top 3 wards
Sutton Four Oaks 80.8%
Sutton Vesey 76.7%
Sutton Trinity 75.4%
Bottom 3 wards Tyburn 61.6%
Handsworth Wood 61.4%
Hodge Hill 57.3%
Exam and Assessments Results 2016
23
Key Stage 2
Key Messages
There a significant gaps across most subjects and cohorts in Birmingham for key stage 2.
47% of pupils reached the new expected standard and 3% achieved a high standard in reading, writing and maths. This performance was below the national average.
The percentage reaching the expected standard in the Grammar, Punctuation and Spelling (GPS) test was 72% and 22% achieved the high standard - GPS remains the highest of the tested subjects.
There are still gender differences between the subjects with the biggest gap in writing – 63% of boys and 76% of girls reaching the expected standard. However 66% of boys and 66% of girls reached the expected standard in Maths.
Reading writing and maths combined attainment of pupils eligible for FSM is slightly above national averages, although progress is below comparator groups. Birmingham does perform better for GPS – 61% of pupils reaching the expected standard compared to the national figure of 57%.
However there are still significant gaps across ethnic groups with pupils of Gypsy / Roma , Black Caribbean and any other Black background underperforming.
Background
The 2016 key stage 2 assessments are the first which assess the new, more challenging national curriculum which was introduced in 2014. Because of these changes, figures for 2016 are not comparable to those for earlier years.
In 2016 schools are held to account for the percentage of pupils achieving the expected standard at the end of KS2 and whether they make sufficient progress based on a new, value-added measure of progress. A school will fall below the floor standard in 2016 where fewer than 65% of pupils achieve the expected standard and pupils do not make sufficient progress. Reading, Maths and GPS are primarily informed by tests with a scaled score of 100 indicating the pupil reaching the expected level. Writing remains as a teacher assessment.
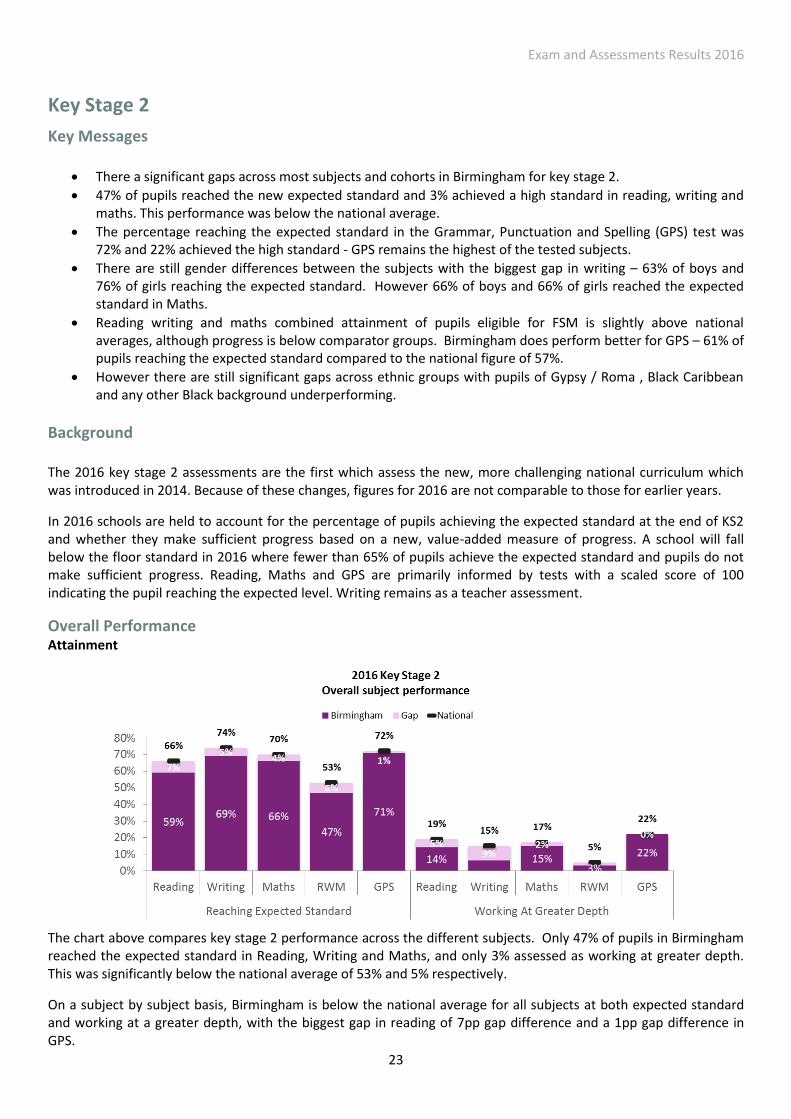
Overall Performance Attainment
The chart above compares key stage 2 performance across the different subjects. Only 47% of pupils in Birmingham reached the expected standard in Reading, Writing and Maths, and only 3% assessed as working at greater depth. This was significantly below the national average of 53% and 5% respectively.
On a subject by subject basis, Birmingham is below the national average for all subjects at both expected standard and working at a greater depth, with the biggest gap in reading of 7pp gap difference and a 1pp gap difference in GPS.
Exam and Assessments Results 2016
24
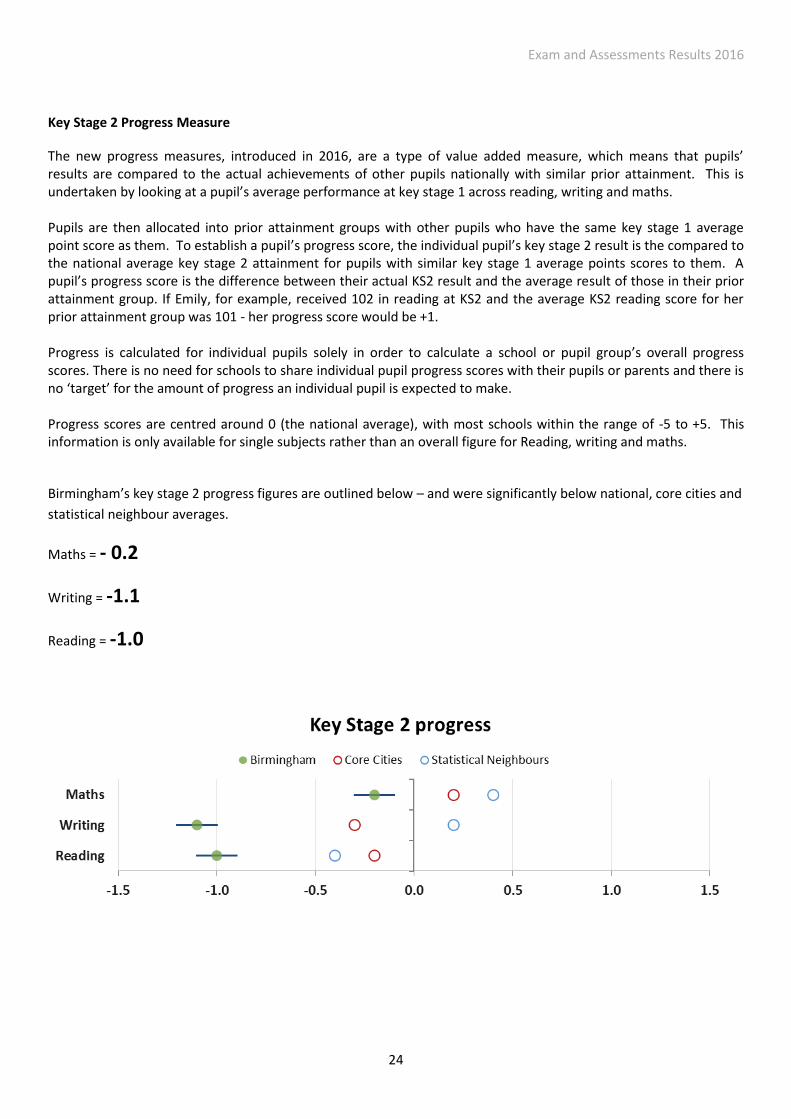
Key Stage 2 Progress Measure
The new progress measures, introduced in 2016, are a type of value added measure, which means that pupils’ results are compared to the actual achievements of other pupils nationally with similar prior attainment. This is undertaken by looking at a pupil’s average performance at key stage 1 across reading, writing and maths. Pupils are then allocated into prior attainment groups with other pupils who have the same key stage 1 average point score as them. To establish a pupil’s progress score, the individual pupil’s key stage 2 result is the compared to the national average key stage 2 attainment for pupils with similar key stage 1 average points scores to them. A pupil’s progress score is the difference between their actual KS2 result and the average result of those in their prior attainment group. If Emily, for example, received 102 in reading at KS2 and the average KS2 reading score for her prior attainment group was 101 - her progress score would be +1. Progress is calculated for individual pupils solely in order to calculate a school or pupil group’s overall progress scores. There is no need for schools to share individual pupil progress scores with their pupils or parents and there is no ‘target’ for the amount of progress an individual pupil is expected to make. Progress scores are centred around 0 (the national average), with most schools within the range of -5 to +5. This information is only available for single subjects rather than an overall figure for Reading, writing and maths.
Birmingham’s key stage 2 progress figures are outlined below – and were significantly below national, core cities and
statistical neighbour averages.
Maths = - 0.2
Writing = -1.1
Reading = -1.0
Exam and Assessments Results 2016
25
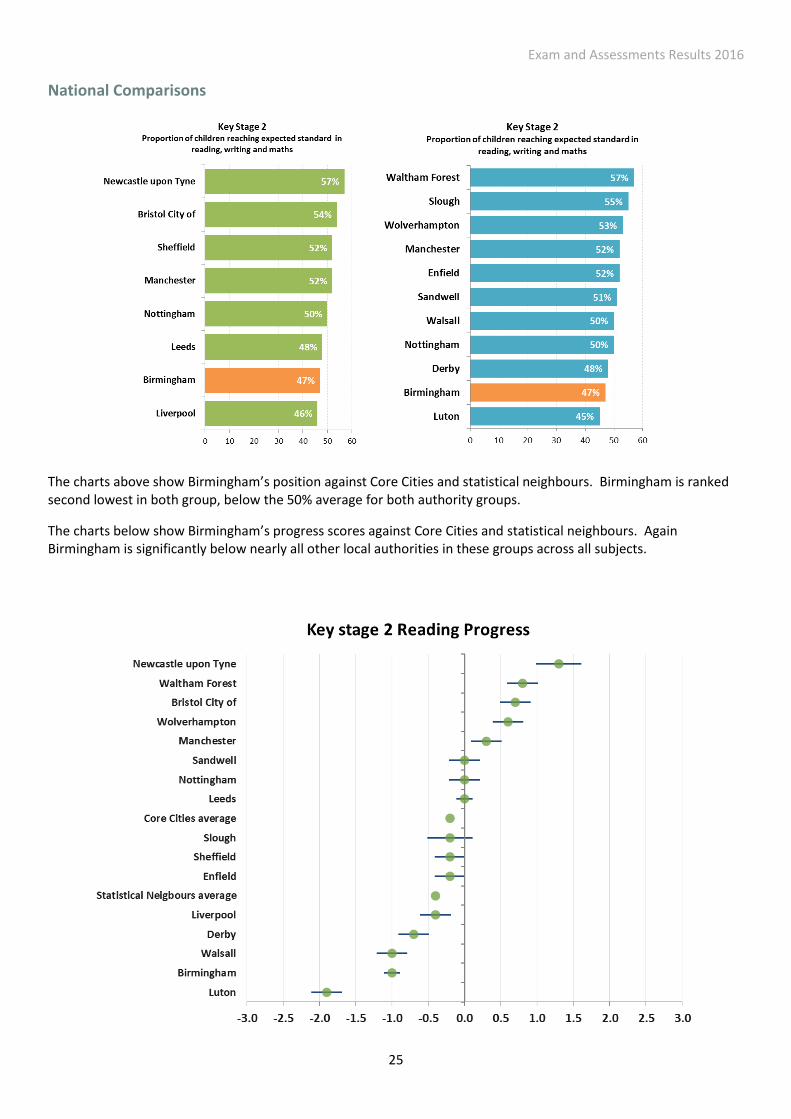
National Comparisons
The charts above show Birmingham’s position against Core Cities and statistical neighbours. Birmingham is ranked second lowest in both group, below the 50% average for both authority groups.
The charts below show Birmingham’s progress scores against Core Cities and statistical neighbours. Again Birmingham is significantly below nearly all other local authorities in these groups across all subjects.
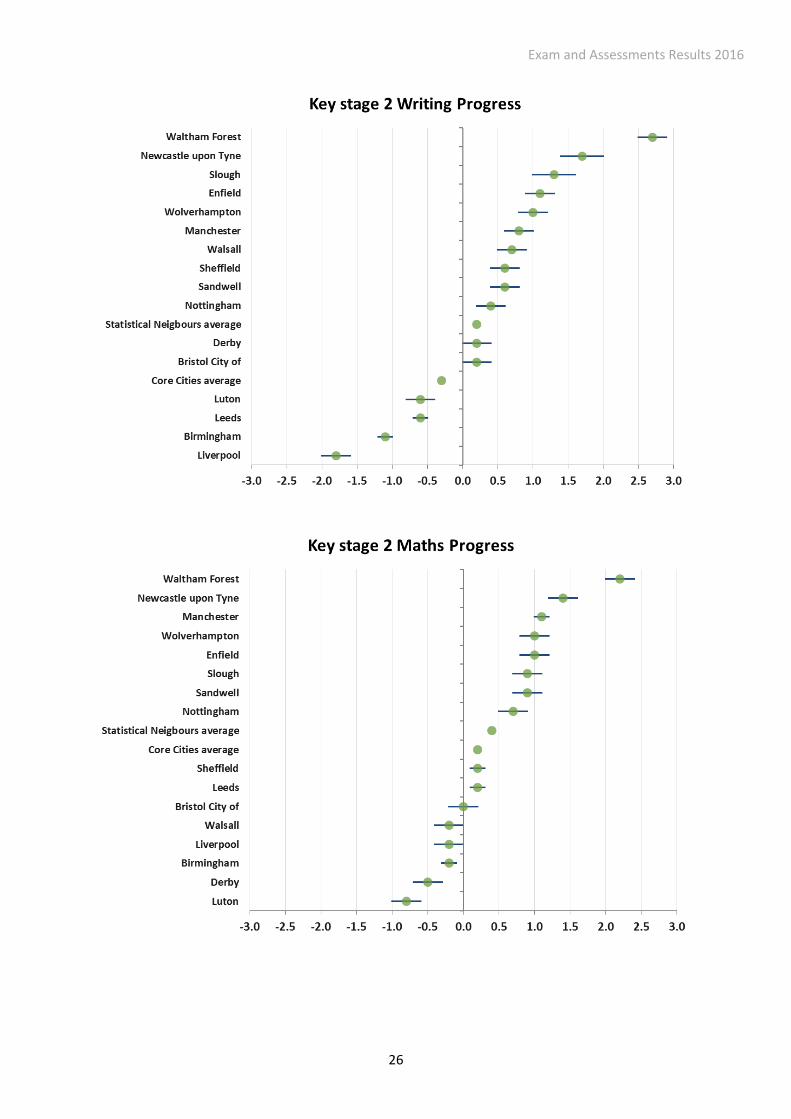
Exam and Assessments Results 2016
26
Exam and Assessments Results 2016
27
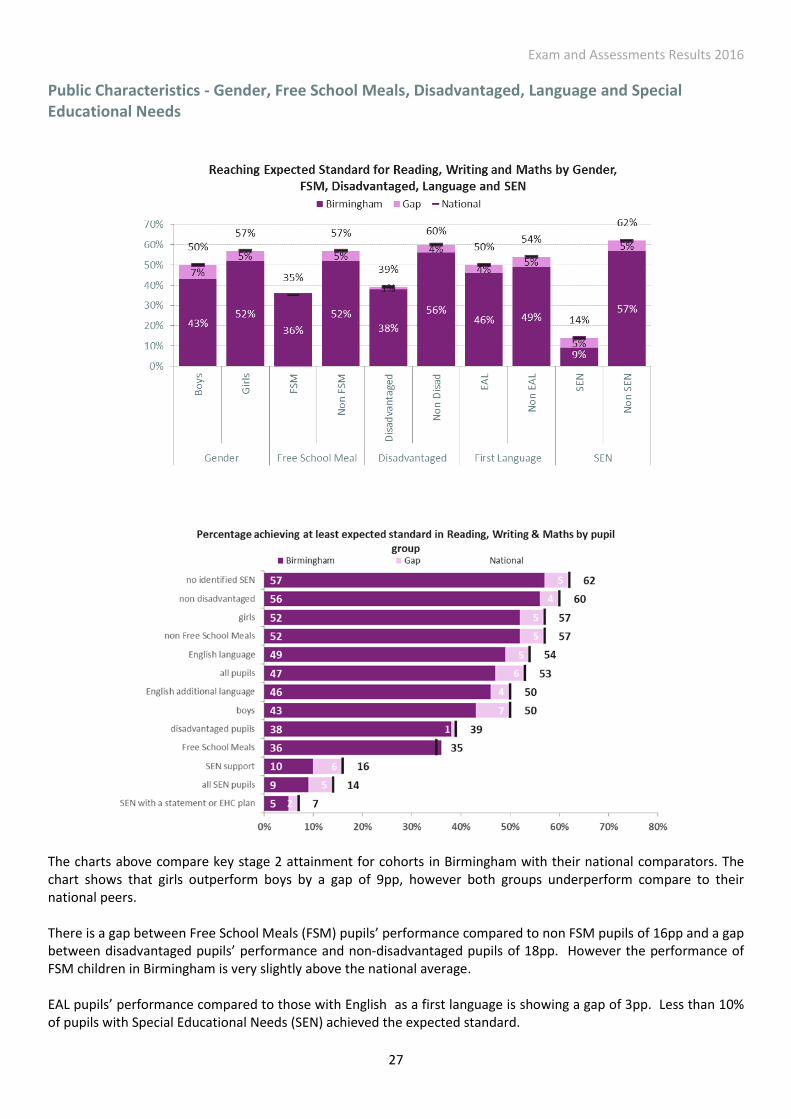
Public Characteristics - Gender, Free School Meals, Disadvantaged, Language and Special Educational Needs
The charts above compare key stage 2 attainment for cohorts in Birmingham with their national comparators. The chart shows that girls outperform boys by a gap of 9pp, however both groups underperform compare to their national peers. There is a gap between Free School Meals (FSM) pupils’ performance compared to non FSM pupils of 16pp and a gap between disadvantaged pupils’ performance and non-disadvantaged pupils of 18pp. However the performance of FSM children in Birmingham is very slightly above the national average. EAL pupils’ performance compared to those with English as a first language is showing a gap of 3pp. Less than 10% of pupils with Special Educational Needs (SEN) achieved the expected standard.
Exam and Assessments Results 2016
28
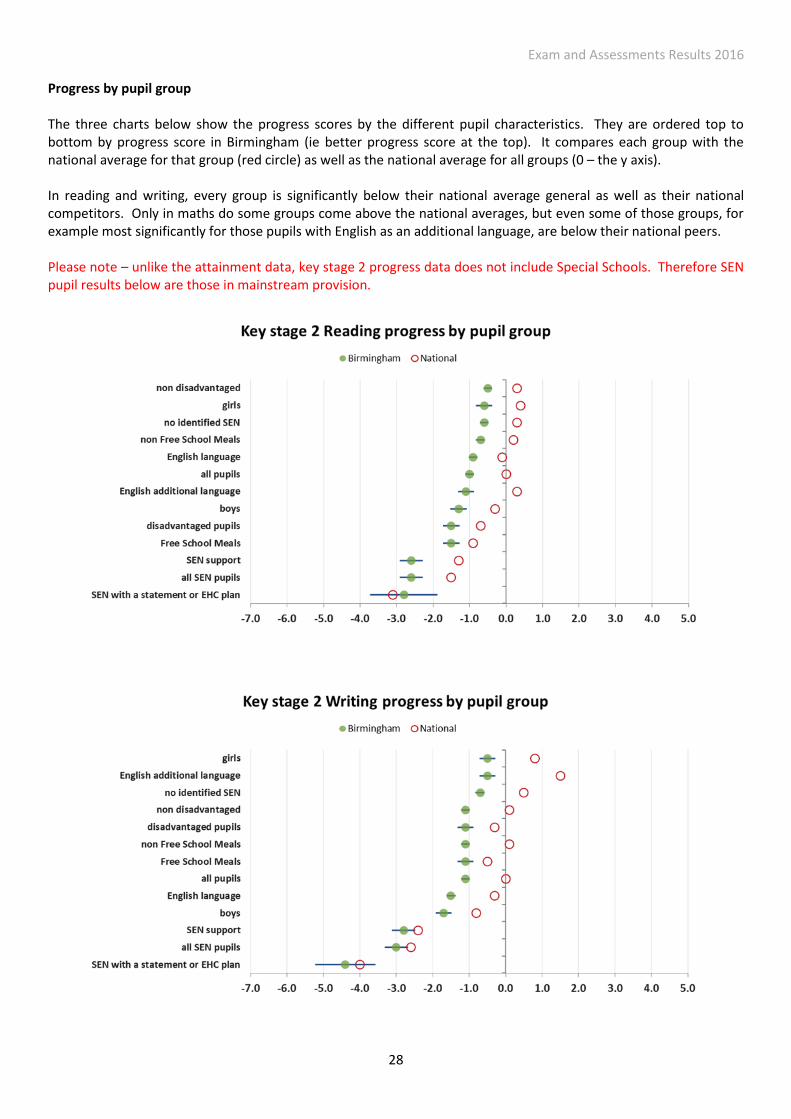
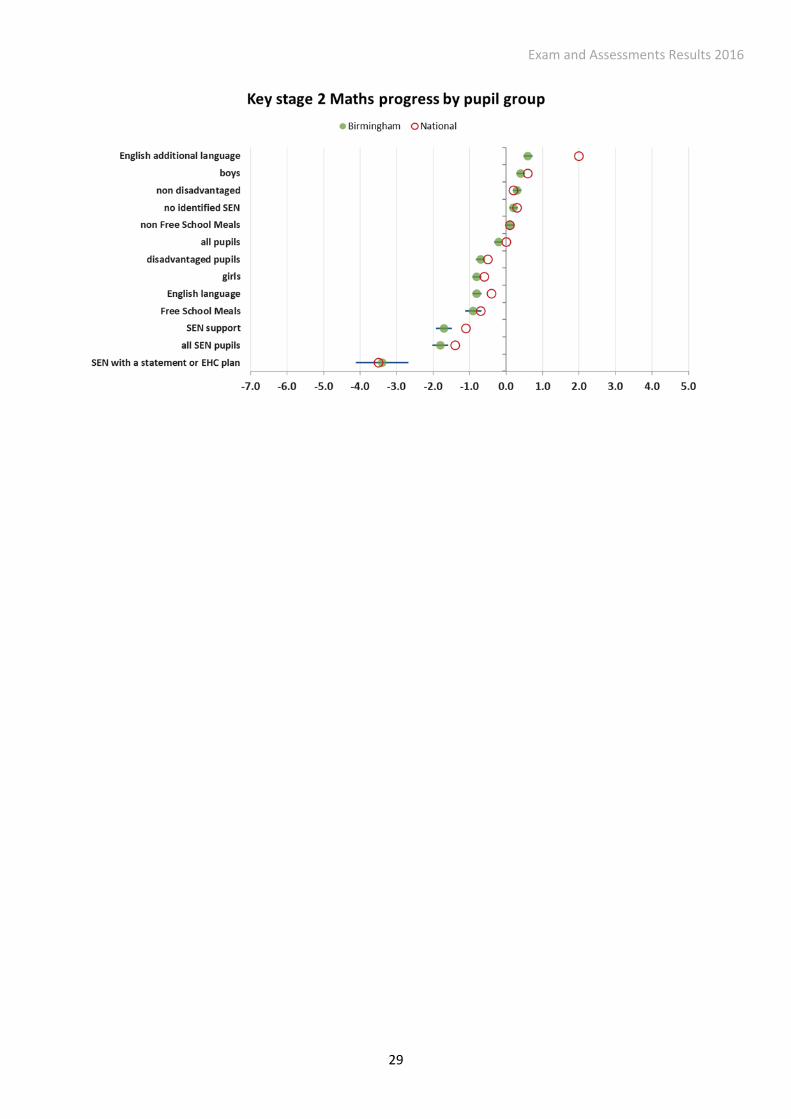
Progress by pupil group The three charts below show the progress scores by the different pupil characteristics. They are ordered top to bottom by progress score in Birmingham (ie better progress score at the top). It compares each group with the national average for that group (red circle) as well as the national average for all groups (0 – the y axis). In reading and writing, every group is significantly below their national average general as well as their national competitors. Only in maths do some groups come above the national averages, but even some of those groups, for example most significantly for those pupils with English as an additional language, are below their national peers. Please note – unlike the attainment data, key stage 2 progress data does not include Special Schools. Therefore SEN pupil results below are those in mainstream provision.
Exam and Assessments Results 2016
29
Exam and Assessments Results 2016
30
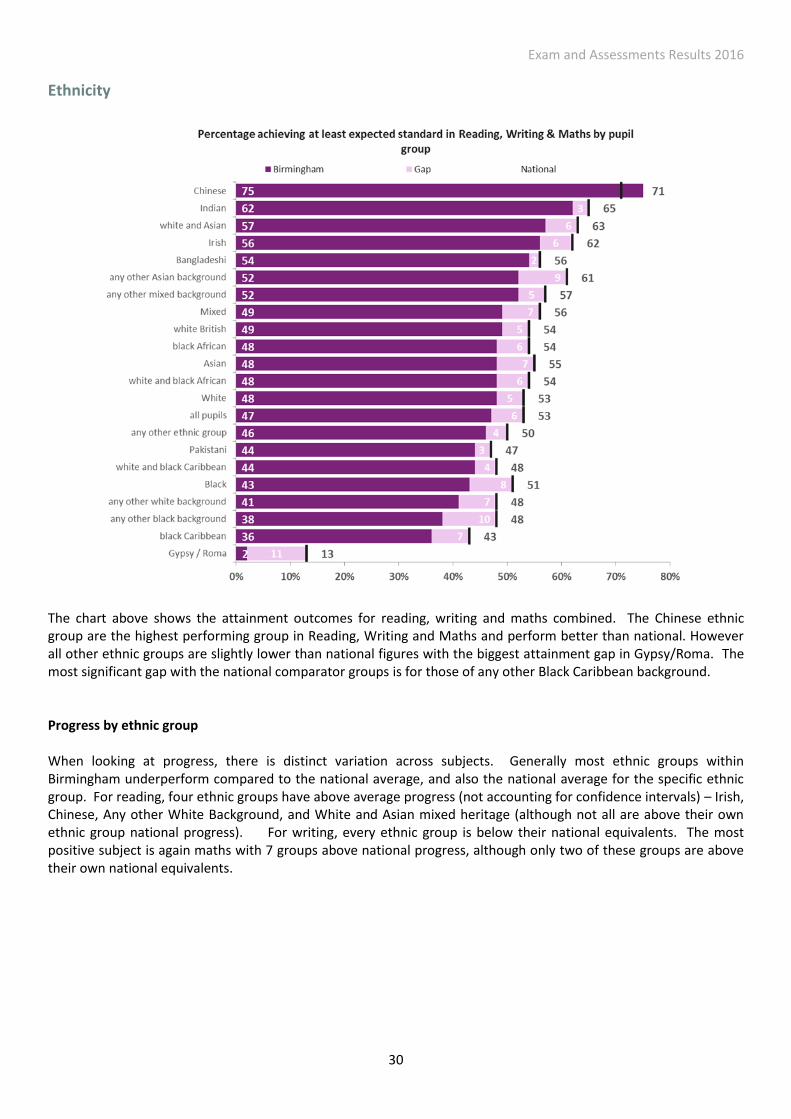
Ethnicity
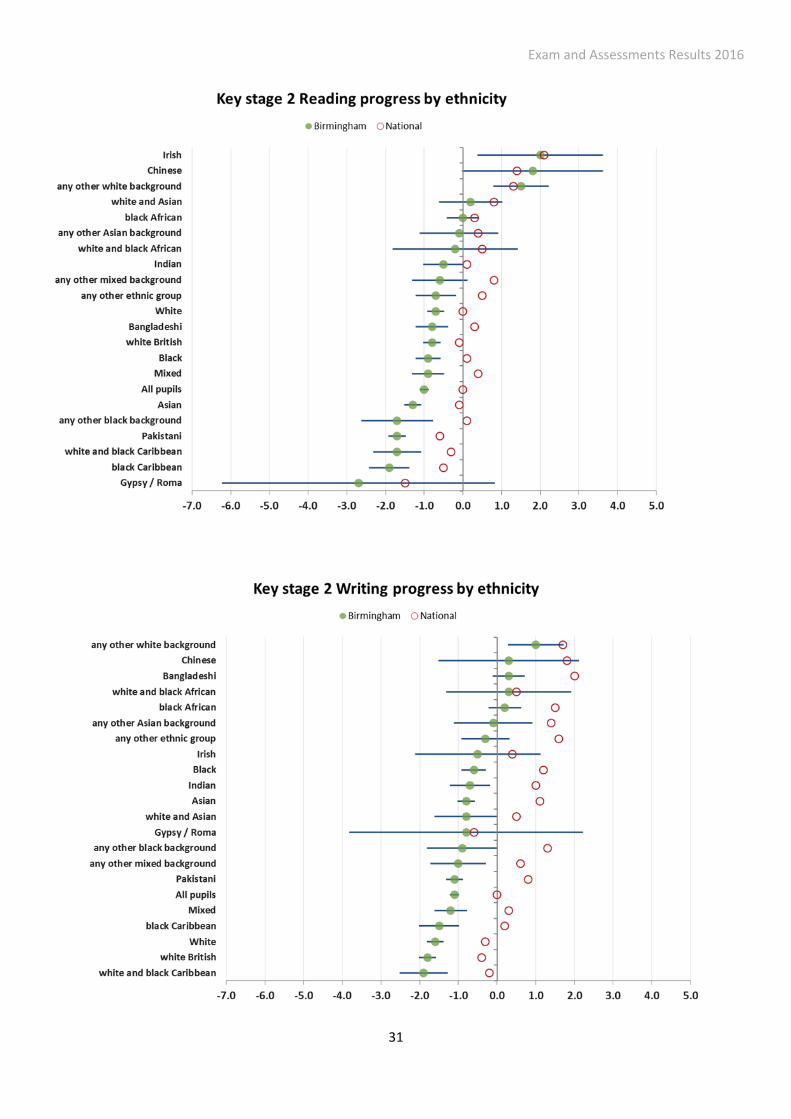
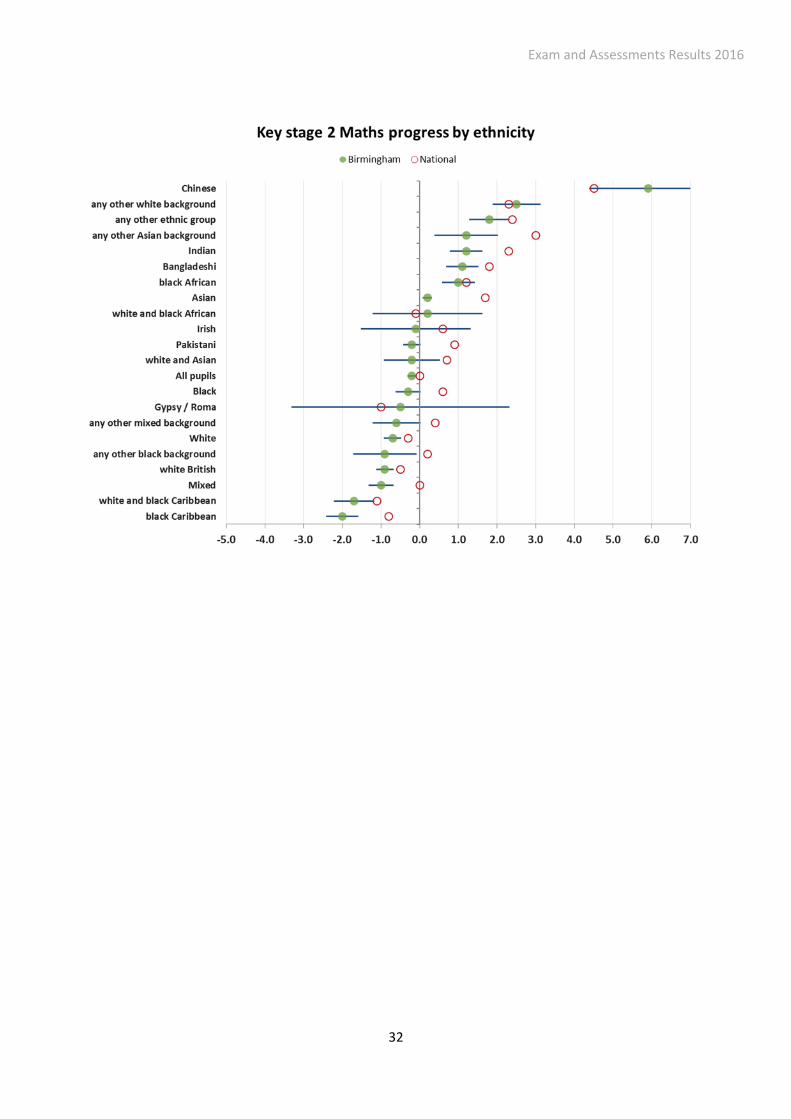
The chart above shows the attainment outcomes for reading, writing and maths combined. The Chinese ethnic group are the highest performing group in Reading, Writing and Maths and perform better than national. However all other ethnic groups are slightly lower than national figures with the biggest attainment gap in Gypsy/Roma. The most significant gap with the national comparator groups is for those of any other Black Caribbean background. Progress by ethnic group When looking at progress, there is distinct variation across subjects. Generally most ethnic groups within Birmingham underperform compared to the national average, and also the national average for the specific ethnic group. For reading, four ethnic groups have above average progress (not accounting for confidence intervals) – Irish, Chinese, Any other White Background, and White and Asian mixed heritage (although not all are above their own ethnic group national progress). For writing, every ethnic group is below their national equivalents. The most positive subject is again maths with 7 groups above national progress, although only two of these groups are above their own national equivalents.
Exam and Assessments Results 2016
31
Exam and Assessments Results 2016
32
Exam and Assessments Results 2016
33
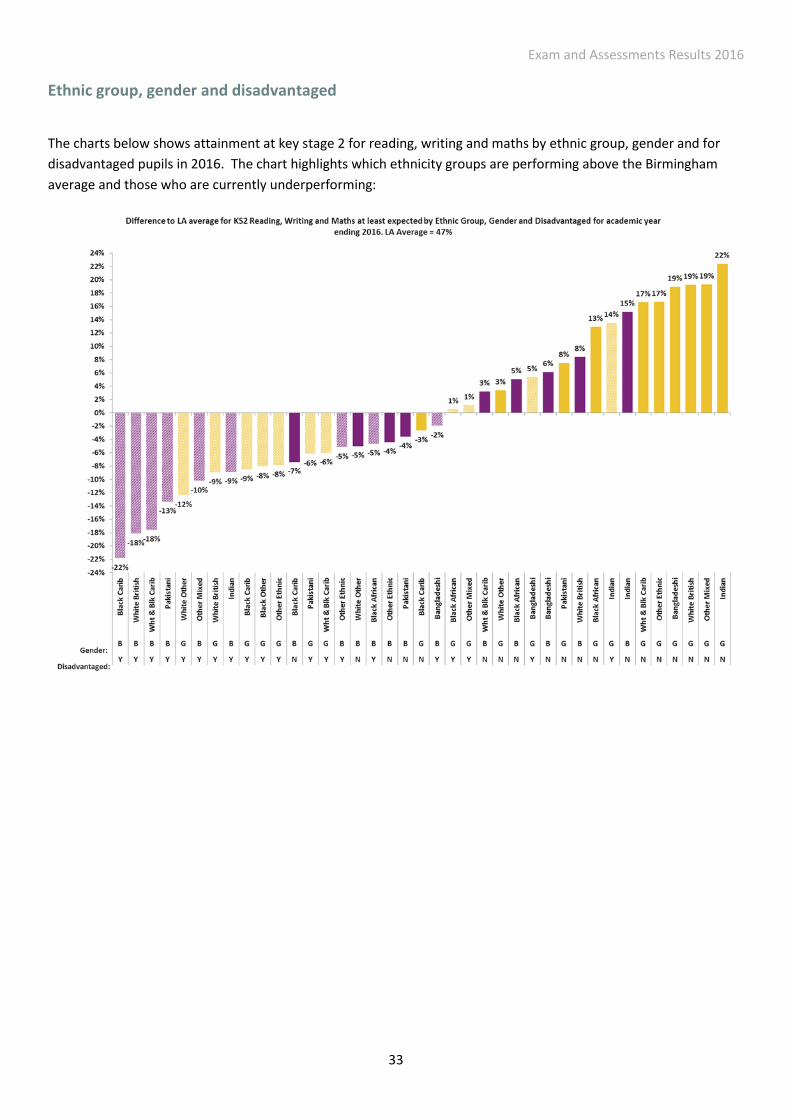
Ethnic group, gender and disadvantaged
The charts below shows attainment at key stage 2 for reading, writing and maths by ethnic group, gender and for
disadvantaged pupils in 2016. The chart highlights which ethnicity groups are performing above the Birmingham
average and those who are currently underperforming:
Exam and Assessments Results 2016
34
Ward/Geography The map below shows proportion of children living in each ward that reached the expected standard across reading, writing and maths. Top 3 wards
Sutton Four Oaks 73.3%
Sutton Vesey 71.3%
Sutton Trinity 64.1%
Bottom 3 wards
Washwood Heath 31.5%
Sheldon 35.3%
Shard End 37.3%
Exam and Assessments Results 2016
35
Disadvantaged vs Non Disadvantaged The chart below compares overall performance on disadvantaged and non-disadvantaged pupils within each ward in Birmingham. This highlights areas where there are significant gaps between the two groups performance. Disadvantaged pupils perform better than average in a number of wards across the city centre – most prominently in Sparkbook. However Selly Oak and Sutton Vesey are the wards where the Sheldon is the ward where disadvantaged pupils’ performance is furthest from the national average. The largest gaps in performance are across three Sutton Wards – Trinity, Four Oaks and New Hall. While in Four Oaks and Trinity both groups still perform above the national average, in Sutton New Hall disadvantaged pupils perform below the national average– resulting in a 35 pp gap between the two groups in the ward. The attainment gap is lowest in Washwood Heath however both groups of pupils who live in the ward perform significantly below national average. A full explanation of this chart can be found in Appendix 3.
Exam and Assessments Results 2016
36
Floor Standards and Coasting Schools The floor standard for primary schools for 2016 differs from previous years. Previously schools were classed as below floor standard if:
fewer than 65 percent of pupils achieve a combined level 4 or above in reading, writing and maths and
the percentage of pupils making expected progress in reading is below the median (national median = 94 percent for 2014) and
the percentage of pupils making expected progress in writing is below the median (national median = 96 percent for 2014) and
the percentage of pupils making expected progress in maths is below the median (national median = 93 percent for 2014).
Now schools are classed as below floor standard if:
• fewer than 65% of pupils meet the expected standard in reading, writing and maths OR • the school does not achieve sufficient progress scores in all three subjects. (At least -5 in English reading, -5
in maths and -7 in English writing) Under the new definitions, Birmingham has 18 schools below the Floor Standard and an additional 18 which are classed as coasting. 18 schools is a reduction compared to the old definitions but as a proportion of all our primary schools is significantly above all our comparator groups. The chart below shows percentage of schools below floor standard, from 2013 to 2015. Birmingham has more schools not reaching the primary floor standard when compared to Core Cities, statistical neighbours, West Midlands and national.
Exam and Assessments Results 2016
37
Exam and Assessments Results 2016
38
Secondary School Results
Exam and Assessments Results 2016
39
Key Stage 4
Key Messages
Birmingham’s pupils make identical progress between KS2 and KS4 to pupils nationally. Compared to the figures for children attending state funded schools nationally, Birmingham pupils make slightly better progress.
The average Attainment 8 score is 49.4 which is in line with the national of 49.9.
The percentage of Birmingham children (24.6%) achieving the English Baccalaureate has increased by 1pp and is in line with the national figure (24.7%).
The percentage of children achieving A* to C in English and maths has risen 4 pp from last year to 59.9%. This rise, while in line with national, leaves Birmingham with a 3% attainment gap.
The Progress 8 and Attainment 8 scores for disadvantaged and non-disadvantaged children are above those nationally. There is a significantly smaller gap between the two groups in attainment and progress than comparable groups nationally.
The Progress 8 score of EAL children in Birmingham, while higher than the overall average, is significantly behind other EAL children nationally.
As a group, children from an Asian background make better progress between KS2 and KS4 than all children nationally but less progress than other Asian children nationally.
The attainment of most individual ethnic groups in Birmingham is in line with similar groups nationally. Children from an Asian background have relatively high attainment but do not achieve as highly as similar children nationally.
Background
2016 saw the introduction of a new method of accountability for schools across the country. New measures of Progress 8 and Attainment 8 was introduced for all schools in 2016 Attainment 8 measures the achievement of a pupil across eight qualifications including maths (double weighted) and English (double weighted), three further qualifications that count in the English Baccalaureate (EBacc) measure and three further qualifications that can be GCSE qualifications (including EBacc subjects) or any other non-GCSE qualifications on the DfE approved list. Progress 8 is a value added measure focusing on the progress a pupil makes from the end of primary school to the end of secondary school.
Exam and Assessments Results 2016
40
Overall Performance
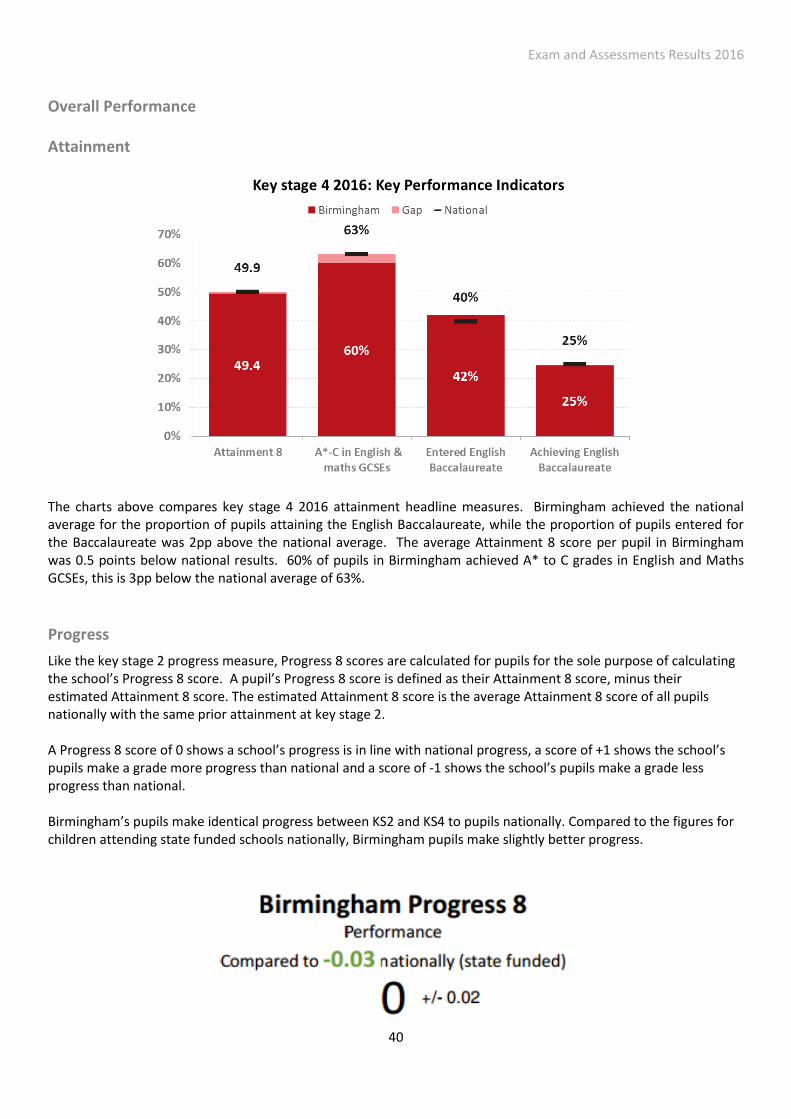
Attainment
The charts above compares key stage 4 2016 attainment headline measures. Birmingham achieved the national average for the proportion of pupils attaining the English Baccalaureate, while the proportion of pupils entered for the Baccalaureate was 2pp above the national average. The average Attainment 8 score per pupil in Birmingham was 0.5 points below national results. 60% of pupils in Birmingham achieved A* to C grades in English and Maths GCSEs, this is 3pp below the national average of 63%.
Progress
Like the key stage 2 progress measure, Progress 8 scores are calculated for pupils for the sole purpose of calculating the school’s Progress 8 score. A pupil’s Progress 8 score is defined as their Attainment 8 score, minus their estimated Attainment 8 score. The estimated Attainment 8 score is the average Attainment 8 score of all pupils nationally with the same prior attainment at key stage 2. A Progress 8 score of 0 shows a school’s progress is in line with national progress, a score of +1 shows the school’s pupils make a grade more progress than national and a score of -1 shows the school’s pupils make a grade less progress than national. Birmingham’s pupils make identical progress between KS2 and KS4 to pupils nationally. Compared to the figures for children attending state funded schools nationally, Birmingham pupils make slightly better progress.
Exam and Assessments Results 2016
41
Subject performance compared with previous years
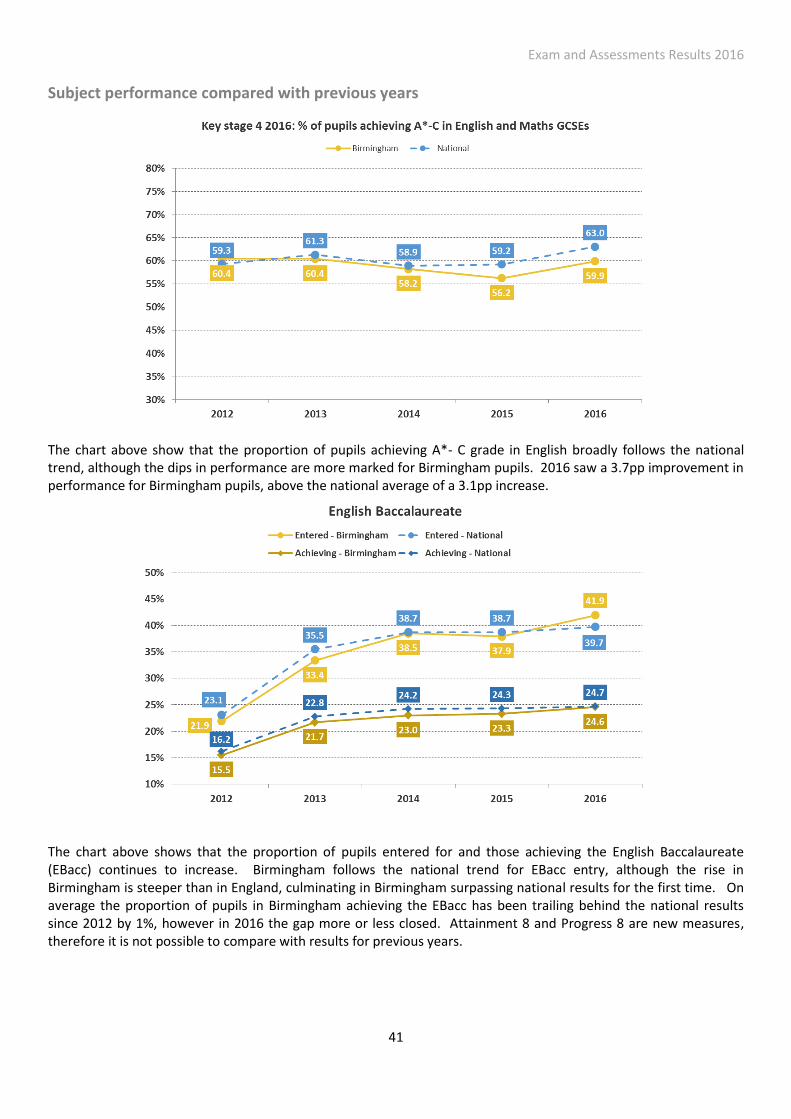
The chart above show that the proportion of pupils achieving A*- C grade in English broadly follows the national trend, although the dips in performance are more marked for Birmingham pupils. 2016 saw a 3.7pp improvement in performance for Birmingham pupils, above the national average of a 3.1pp increase.
The chart above shows that the proportion of pupils entered for and those achieving the English Baccalaureate (EBacc) continues to increase. Birmingham follows the national trend for EBacc entry, although the rise in Birmingham is steeper than in England, culminating in Birmingham surpassing national results for the first time. On average the proportion of pupils in Birmingham achieving the EBacc has been trailing behind the national results since 2012 by 1%, however in 2016 the gap more or less closed. Attainment 8 and Progress 8 are new measures, therefore it is not possible to compare with results for previous years.
Exam and Assessments Results 2016
42
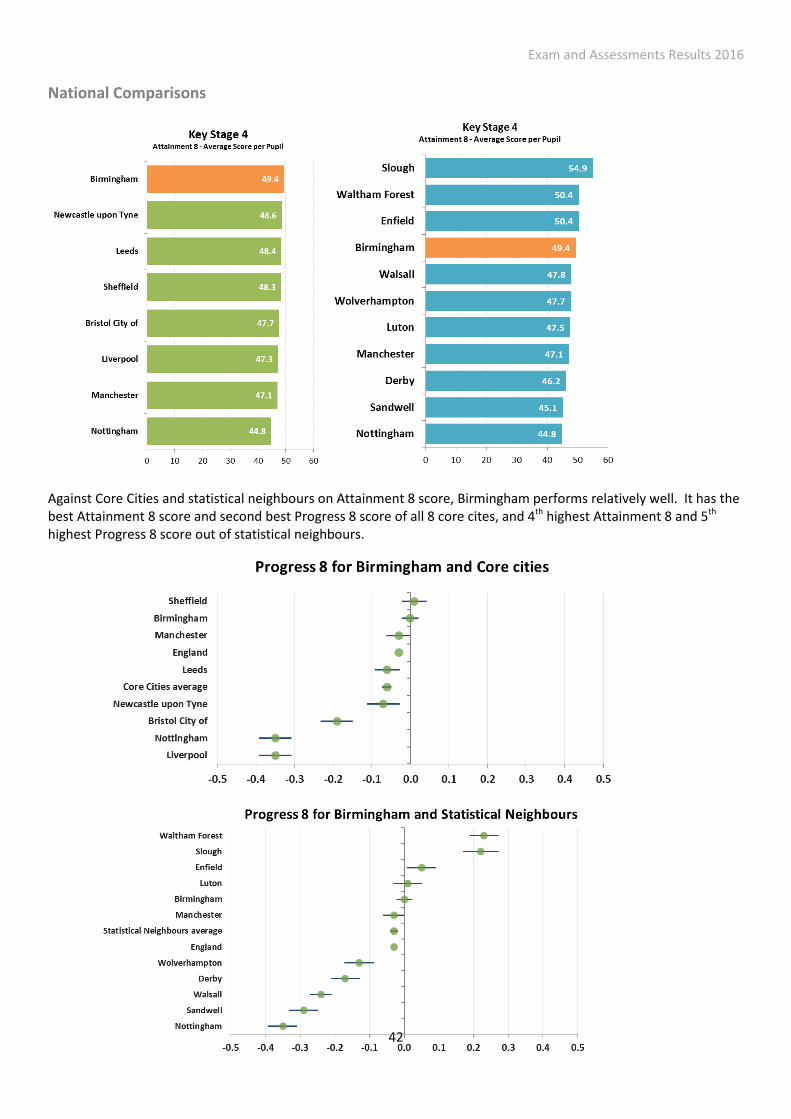
National Comparisons
Against Core Cities and statistical neighbours on Attainment 8 score, Birmingham performs relatively well. It has the best Attainment 8 score and second best Progress 8 score of all 8 core cites, and 4th highest Attainment 8 and 5th highest Progress 8 score out of statistical neighbours.
Exam and Assessments Results 2016
43
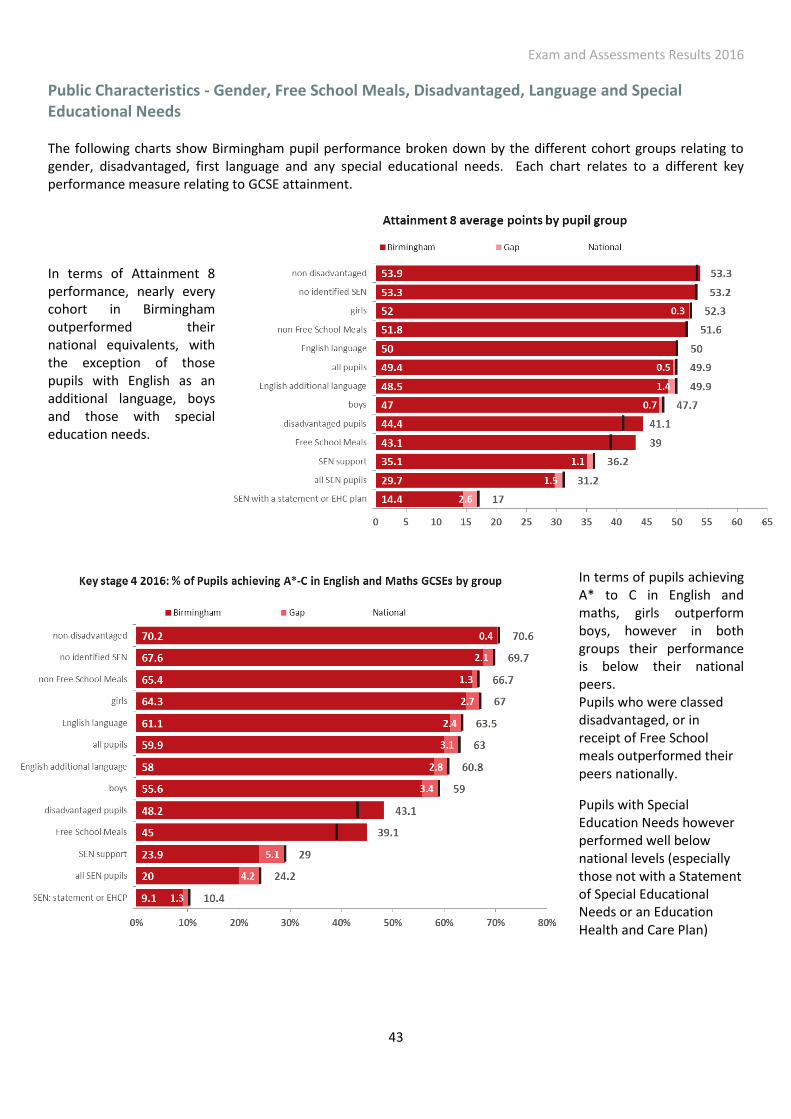
Public Characteristics - Gender, Free School Meals, Disadvantaged, Language and Special Educational Needs The following charts show Birmingham pupil performance broken down by the different cohort groups relating to gender, disadvantaged, first language and any special educational needs. Each chart relates to a different key performance measure relating to GCSE attainment.
In terms of Attainment 8 performance, nearly every cohort in Birmingham outperformed their national equivalents, with the exception of those pupils with English as an additional language, boys and those with special education needs.
In terms of pupils achieving A* to C in English and maths, girls outperform boys, however in both groups their performance is below their national peers. Pupils who were classed disadvantaged, or in receipt of Free School meals outperformed their peers nationally.
Pupils with Special Education Needs however performed well below national levels (especially those not with a Statement of Special Educational Needs or an Education Health and Care Plan)
Exam and Assessments Results 2016
44
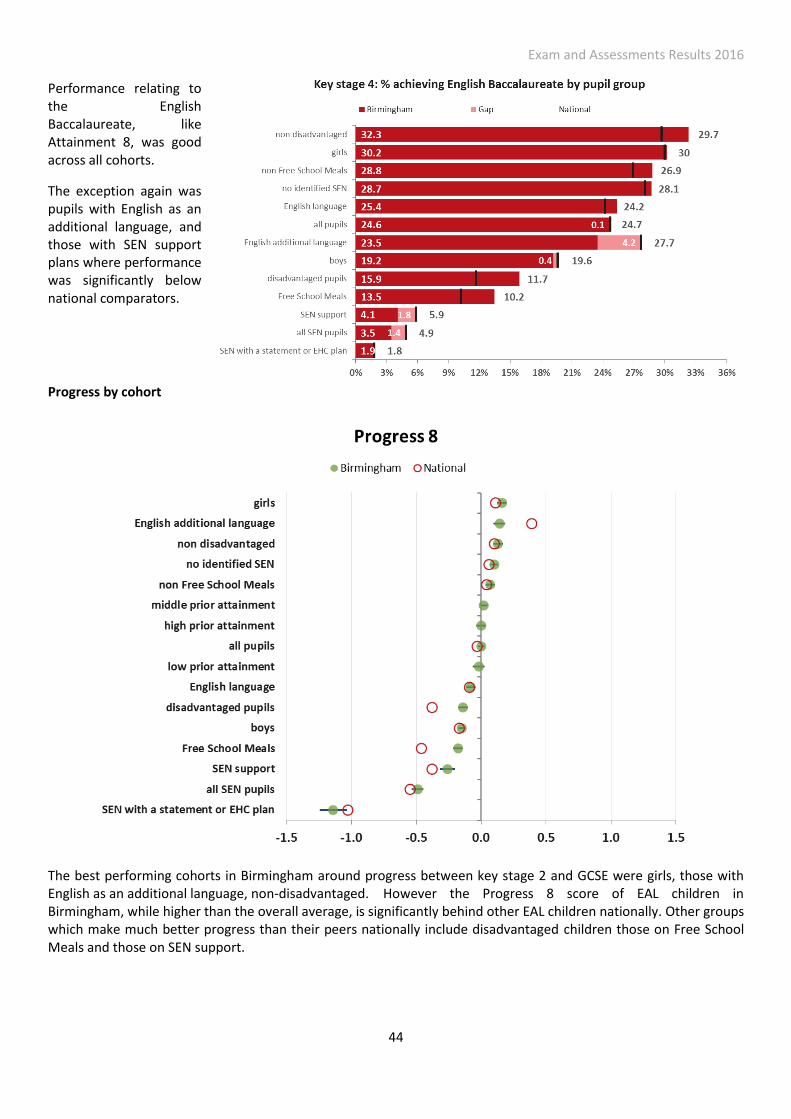
Performance relating to the English Baccalaureate, like Attainment 8, was good across all cohorts.
The exception again was pupils with English as an additional language, and those with SEN support plans where performance was significantly below national comparators.
Progress by cohort
The best performing cohorts in Birmingham around progress between key stage 2 and GCSE were girls, those with English as an additional language, non-disadvantaged. However the Progress 8 score of EAL children in Birmingham, while higher than the overall average, is significantly behind other EAL children nationally. Other groups which make much better progress than their peers nationally include disadvantaged children those on Free School Meals and those on SEN support.
Exam and Assessments Results 2016
45
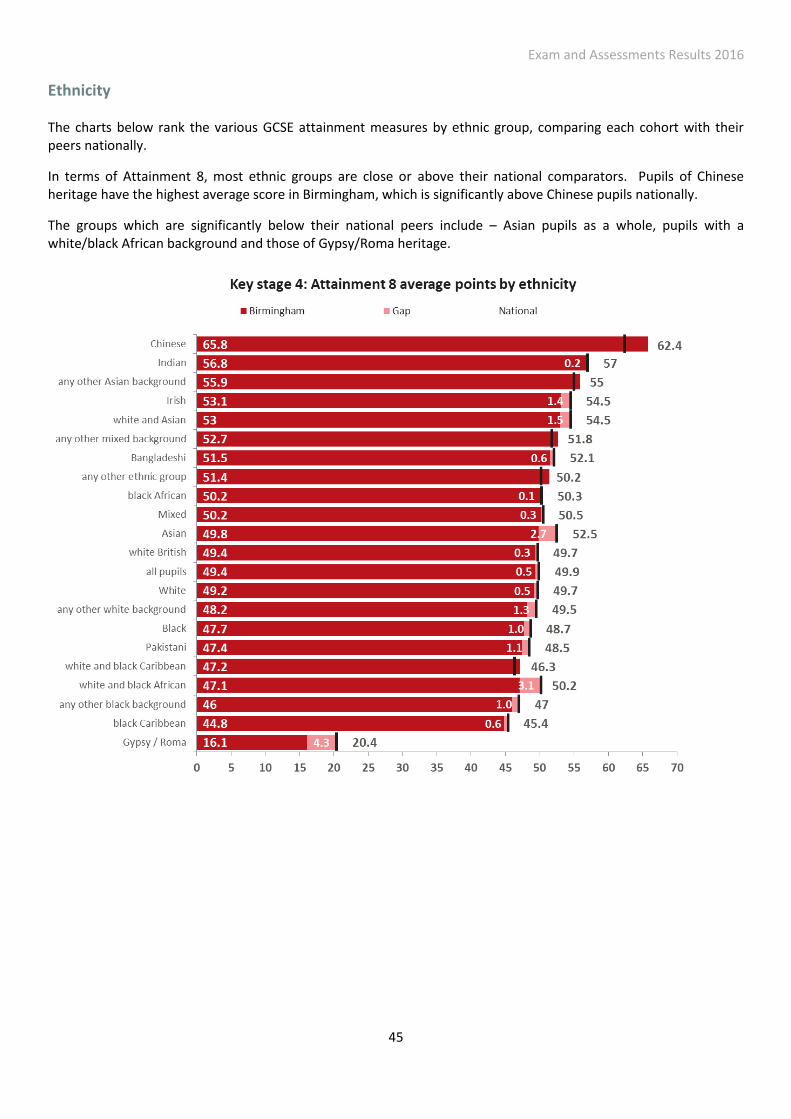
Ethnicity The charts below rank the various GCSE attainment measures by ethnic group, comparing each cohort with their peers nationally.
In terms of Attainment 8, most ethnic groups are close or above their national comparators. Pupils of Chinese heritage have the highest average score in Birmingham, which is significantly above Chinese pupils nationally.
The groups which are significantly below their national peers include – Asian pupils as a whole, pupils with a white/black African background and those of Gypsy/Roma heritage.
Exam and Assessments Results 2016
46
In comparison most ethnic groups underperform compare to their peers in achieving A* to C in English and maths. The overall pattern remains similar to Attainment 8, with Chinese and Indian pupils with the highest achieving compared to other ethnic groups, and those from a Gypsy/Roma background with the worst performance.
The gap between Birmingham ethnic groups and their peers nationally is most pronounced for those of with any other black background, and Asian pupils.
Exam and Assessments Results 2016
47
In terms of the Ebacc performance, again Chinese pupils are the best performing ethnic group in the city, with performance above national comparators. Those of any other Asian background also perform well. While White pupil performance is slightly below the overall city average, they still outperform the national average for White pupils.
Gypsy/Roma and Black Caribbean pupils again have the lowest attainment in the city, although Birmingham Gypsy/Roma pupils outperform those nationally.
The biggest gap between local and national performance is for Asian pupils (especially Indian, White/Asian, Bangladesh young people) – although most of these groups still perform better than other groups across the city.
Exam and Assessments Results 2016
48
Progress
The chart below ranks ethnic group by their Progress 8 performance, as well as comparing each group to national equivalent performance. The horizontal lines indicate the confidence intervals of Birmingham performance. The length of the line indicates the size of the cohort of pupils with a longer line representing a smaller cohort.
As a group, children from an Asian background make better progress between KS2 and KS4 than all children nationally but less progress than other Asian children nationally – this is true for all the Asian sub groups – Indian, Bangladeshi, and Pakistani pupils.
Gypsy/Roma pupils, whose attainment is the lowest in the city, fair better in progress measures, although their performance is subject to large confidence intervals.
Exam and Assessments Results 2016
49
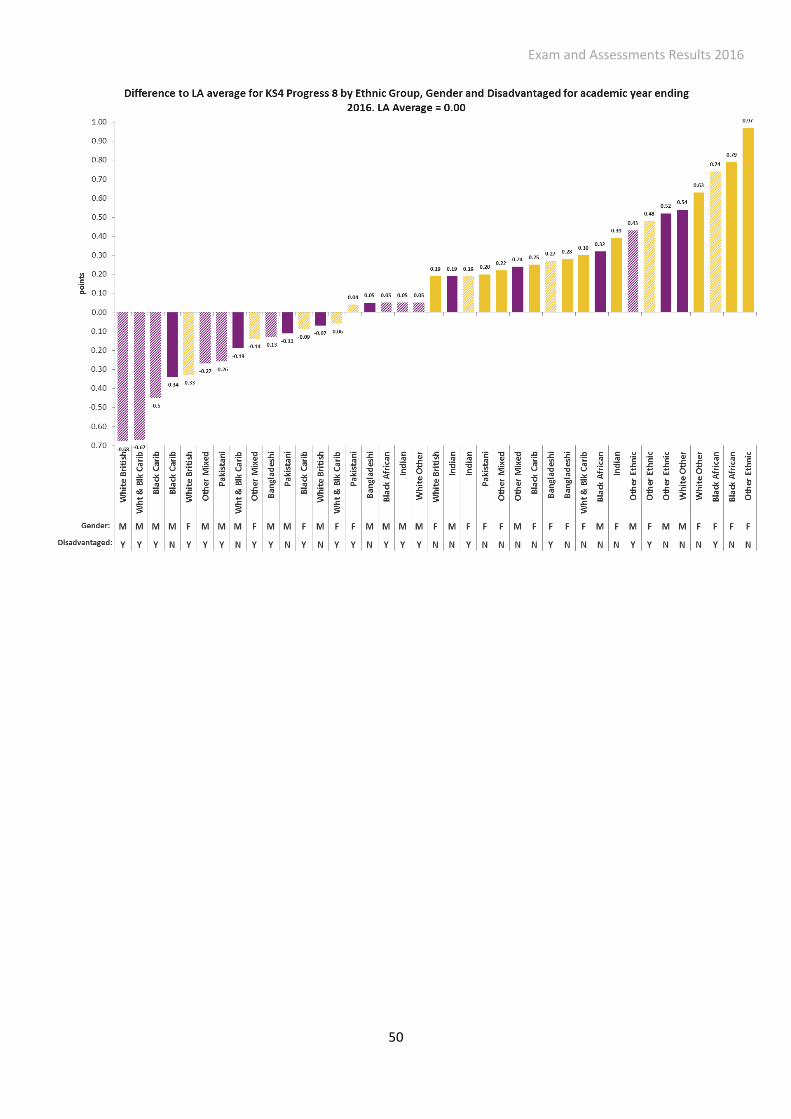
Ethnic group, gender and disadvantaged
The charts below (and over the page) show Attainment 8 and Progress 8 results by ethnic group, gender and for disadvantaged pupils. The chart highlights which ethnicity groups are performing above the Birmingham average and those who are currently underperforming. White British Boys who are disadvantaged are the group who underperform the most at both Attainment 8 and Progress 8. Black Caribbean boys also under perform significantly across the two main key stage 4 measures. In terms of disadvantaged groups – Black African girls are the best performing cohort across both measures.
Exam and Assessments Results 2016
50
Exam and Assessments Results 2016
51
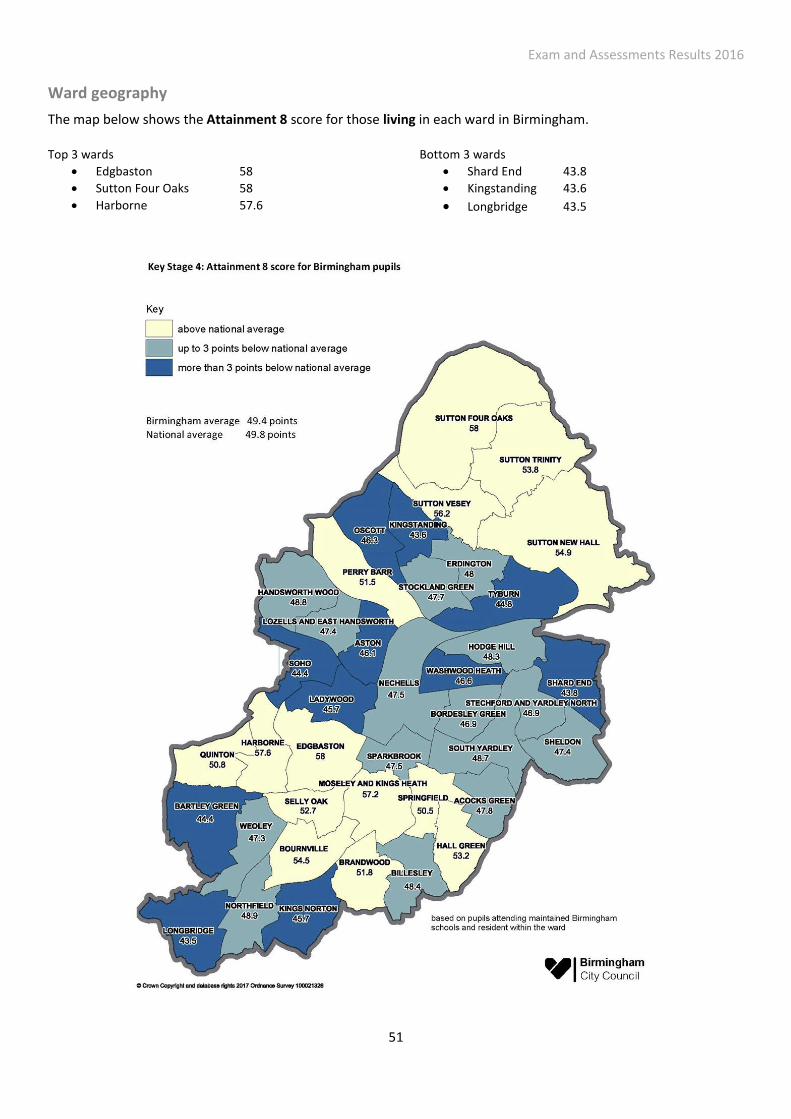
Ward geography
The map below shows the Attainment 8 score for those living in each ward in Birmingham. Top 3 wards
Edgbaston 58
Sutton Four Oaks 58
Harborne 57.6
Bottom 3 wards
Shard End 43.8
Kingstanding 43.6
Longbridge 43.5
Exam and Assessments Results 2016
52
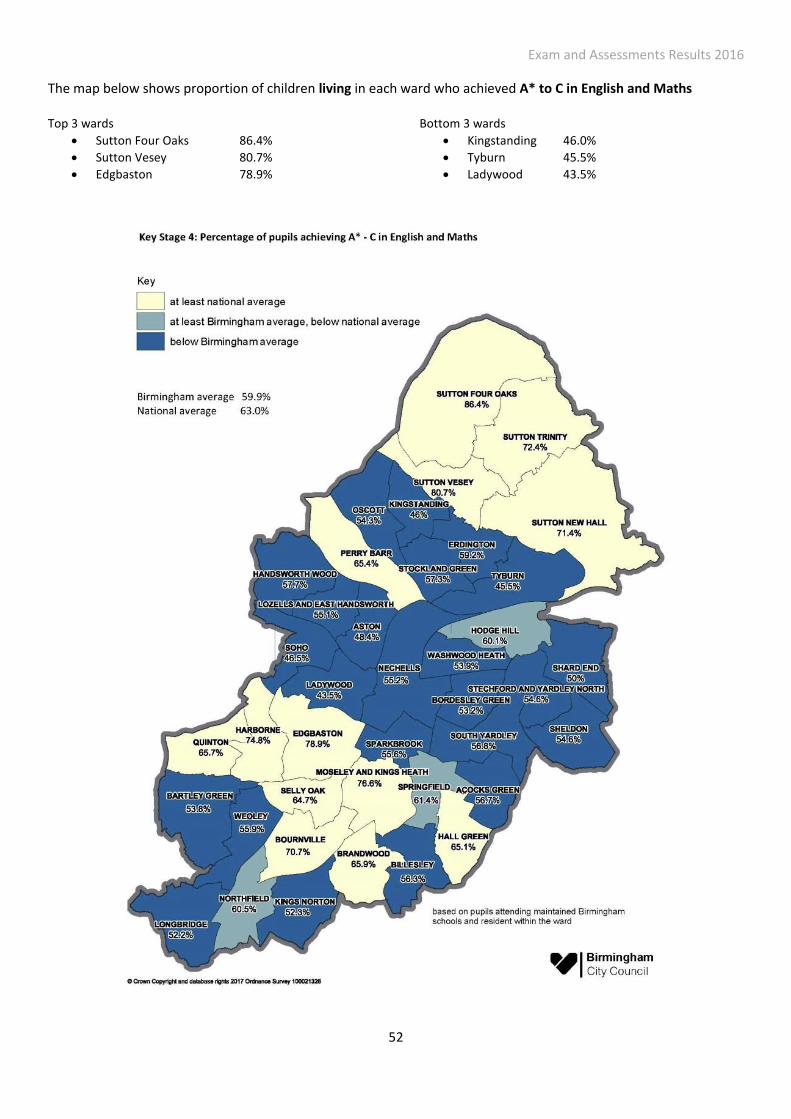
The map below shows proportion of children living in each ward who achieved A* to C in English and Maths Top 3 wards
Sutton Four Oaks 86.4%
Sutton Vesey 80.7%
Edgbaston 78.9%
Bottom 3 wards
Kingstanding 46.0%
Tyburn 45.5%
Ladywood 43.5%
Exam and Assessments Results 2016
53
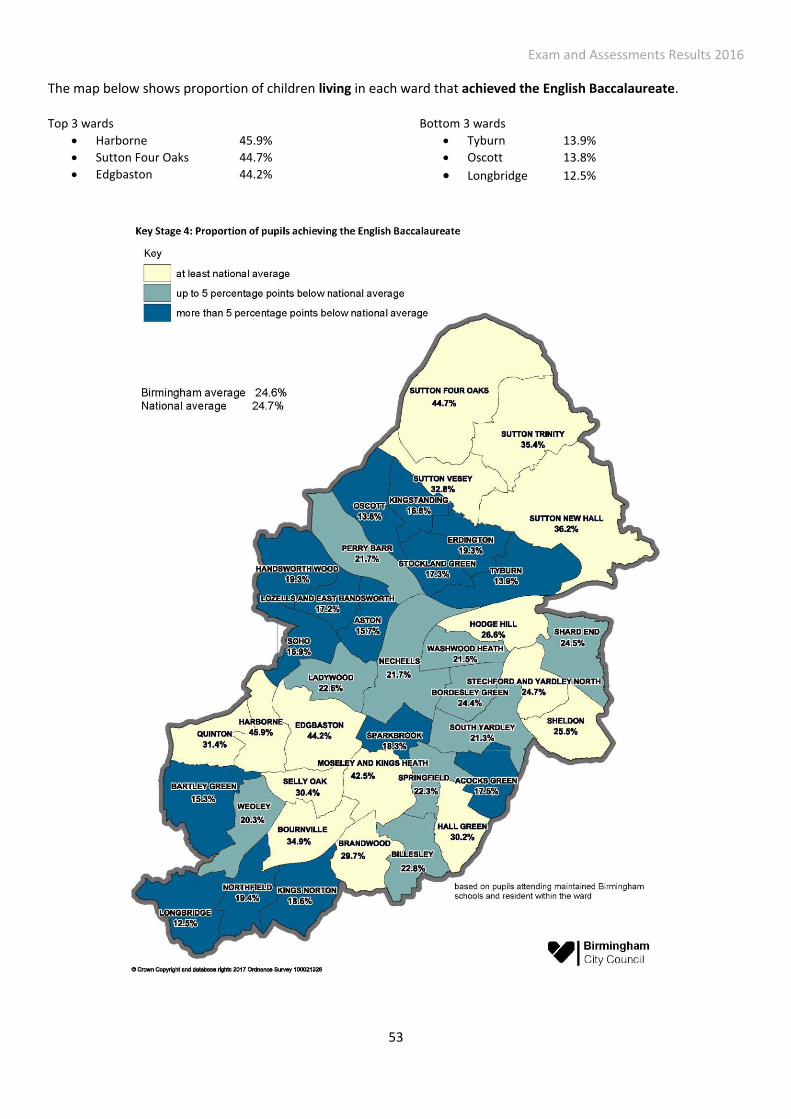
The map below shows proportion of children living in each ward that achieved the English Baccalaureate. Top 3 wards
Harborne 45.9%
Sutton Four Oaks 44.7%
Edgbaston 44.2%
Bottom 3 wards
Tyburn 13.9%
Oscott 13.8%
Longbridge 12.5%
Exam and Assessments Results 2016
54
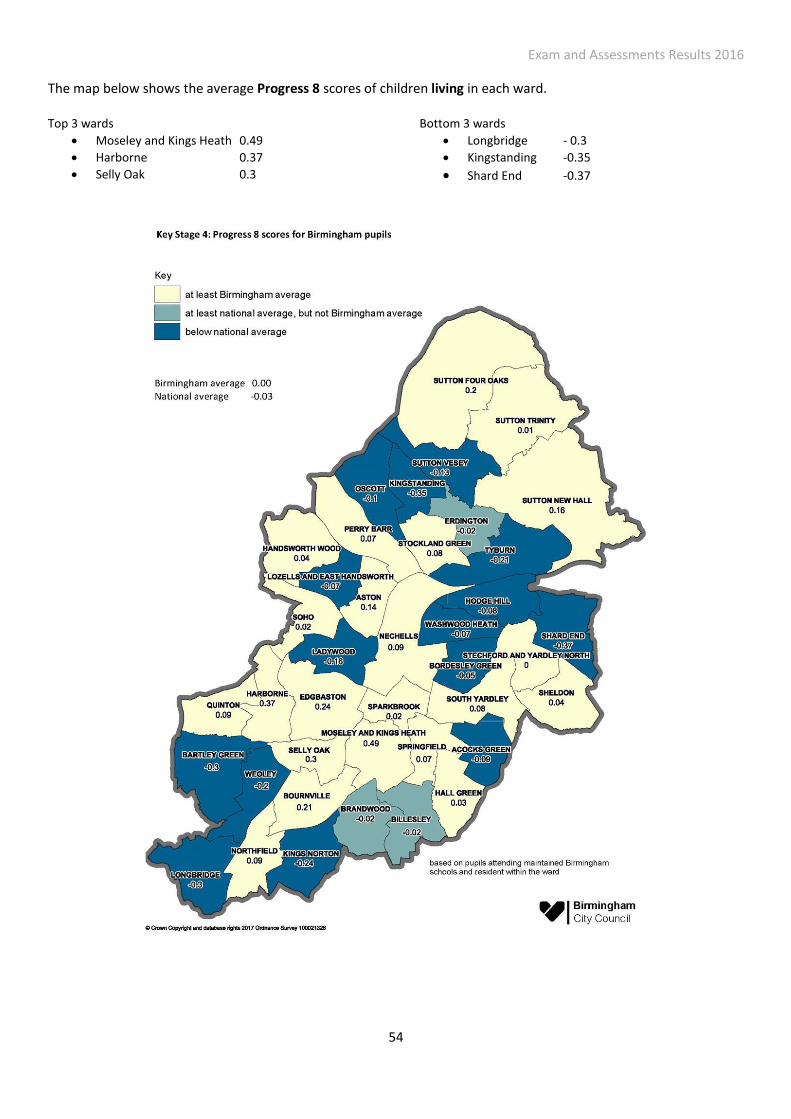
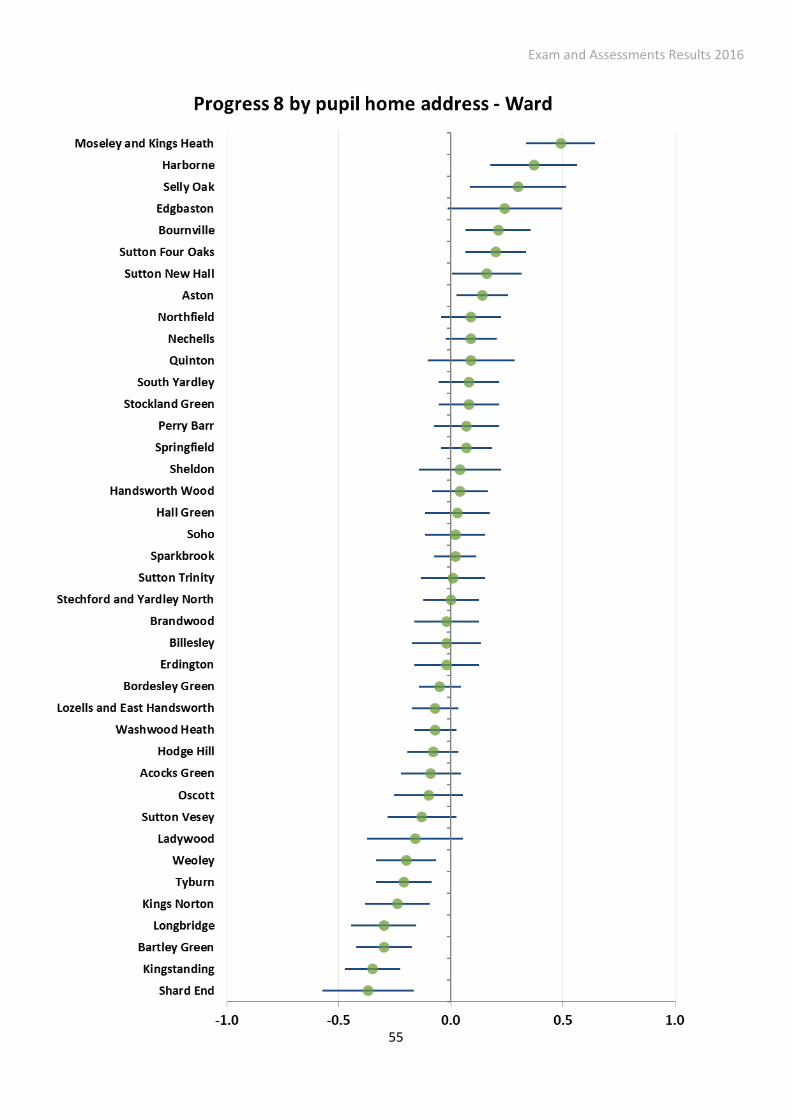
The map below shows the average Progress 8 scores of children living in each ward. Top 3 wards
Moseley and Kings Heath 0.49
Harborne 0.37
Selly Oak 0.3
Bottom 3 wards
Longbridge - 0.3
Kingstanding -0.35
Shard End -0.37
Exam and Assessments Results 2016
55
Exam and Assessments Results 2016
56
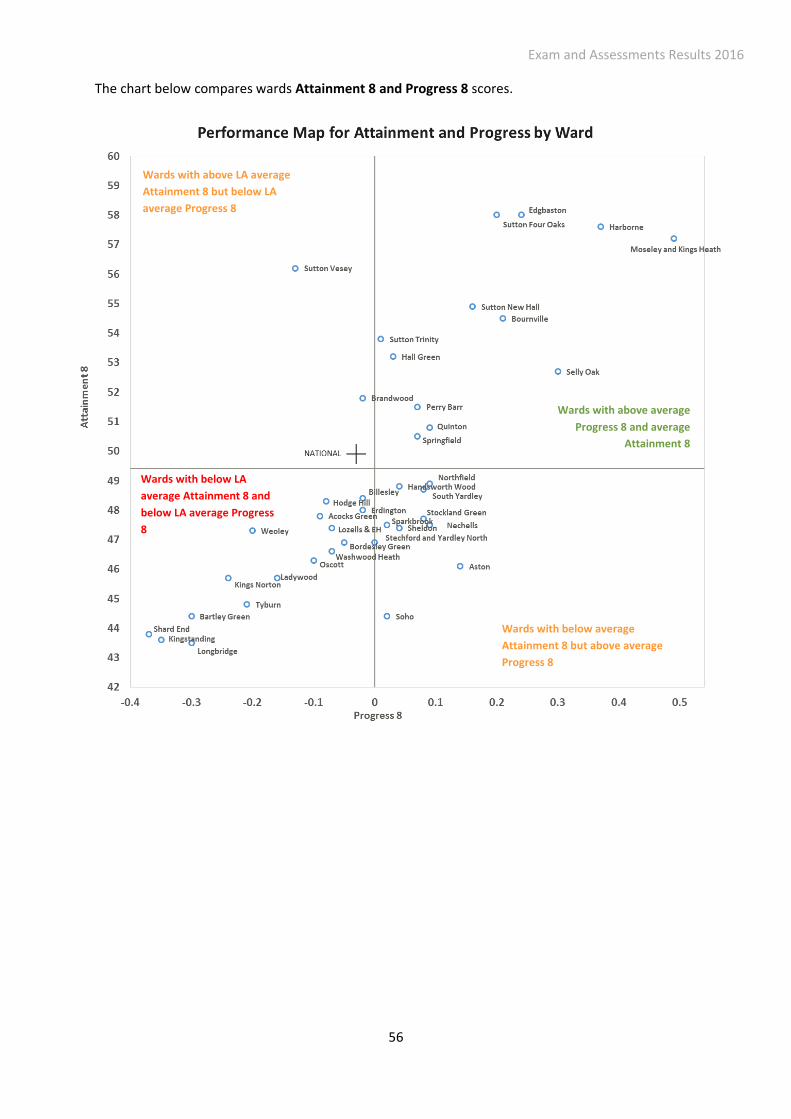
The chart below compares wards Attainment 8 and Progress 8 scores.
Wards with above LA average
Attainment 8 but below LA
average Progress 8
Wards with below LA
average Attainment 8 and
below LA average Progress
8
Wards with below average
Attainment 8 but above average
Progress 8
Wards with above average
Progress 8 and average
Attainment 8
Exam and Assessments Results 2016
57
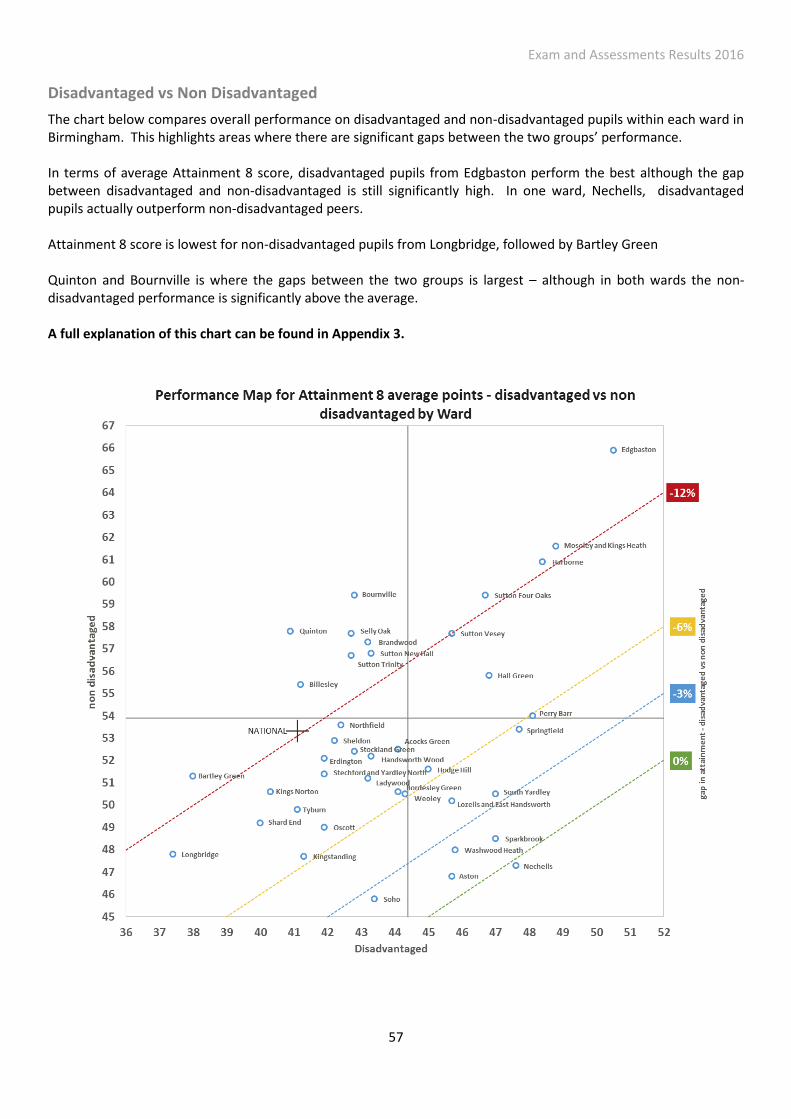
Disadvantaged vs Non Disadvantaged
The chart below compares overall performance on disadvantaged and non-disadvantaged pupils within each ward in Birmingham. This highlights areas where there are significant gaps between the two groups’ performance. In terms of average Attainment 8 score, disadvantaged pupils from Edgbaston perform the best although the gap between disadvantaged and non-disadvantaged is still significantly high. In one ward, Nechells, disadvantaged pupils actually outperform non-disadvantaged peers. Attainment 8 score is lowest for non-disadvantaged pupils from Longbridge, followed by Bartley Green Quinton and Bournville is where the gaps between the two groups is largest – although in both wards the non-disadvantaged performance is significantly above the average. A full explanation of this chart can be found in Appendix 3.
Exam and Assessments Results 2016
58
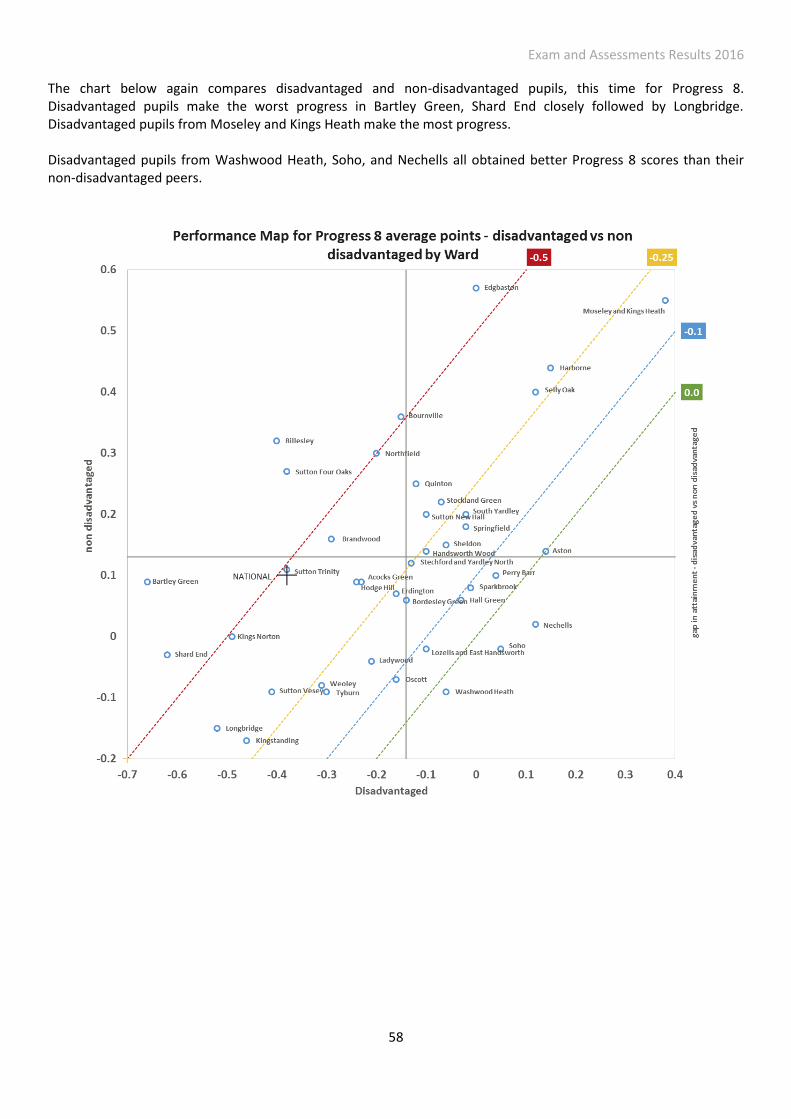
The chart below again compares disadvantaged and non-disadvantaged pupils, this time for Progress 8. Disadvantaged pupils make the worst progress in Bartley Green, Shard End closely followed by Longbridge. Disadvantaged pupils from Moseley and Kings Heath make the most progress. Disadvantaged pupils from Washwood Heath, Soho, and Nechells all obtained better Progress 8 scores than their non-disadvantaged peers.
Exam and Assessments Results 2016
59
Floor standards and Coasting Schools
KS4 - Floor In 2016 a school will be below the floor standard if its Progress 8 score is below -0.5, and the upper band of the 95% confidence interval is below zero. If a school’s performance falls below this floor standard, then the school may come under scrutiny through inspection. Floor standards do not apply to special schools, independent schools, pupil referral units, alternative provision or hospital schools. Schools are excluded from a Progress 8 floor standard in a particular year where they have fewer than 6 pupils at the end of key stage 4, or where less than 50% of pupils have key stage 2 assessments that can be used as prior attainment in the calculations of Progress 8. Schools in which pupils make on average one grade more progress than the national average (a Progress 8 score of +1.0 or above) will be exempt from routine inspections by Ofsted in the calendar year following the publication of the final performance tables. KS4 Coasting In January 2017 the Department published regulations setting out a three year definition of coasting based on the same performance measures that underpin the floor standards. This year a secondary school will fall within the coasting definition if:
• in 2014 fewer than 60% of pupils achieved 5 A*-C at GCSE (including English and maths) and less than the national median achieved expected progress in English and in maths and;
• in 2015, fewer than 60% of pupils achieved 5 A*-C at GCSE (including English and maths) and less than the national median achieved expected progress in English and in maths; and
• in 2016, the school’s Progress 8 score was below -0.25. Schools will be excluded from the coasting measure in 2016 if:
• they have fewer than 6 pupils at the end of key stage 4; or • less than 50% of pupils have key stage 2 assessments that can be used as prior attainment in the calculations
of Progress 8; or • the school closes within the academic year (except if it reopens as a converter academy).
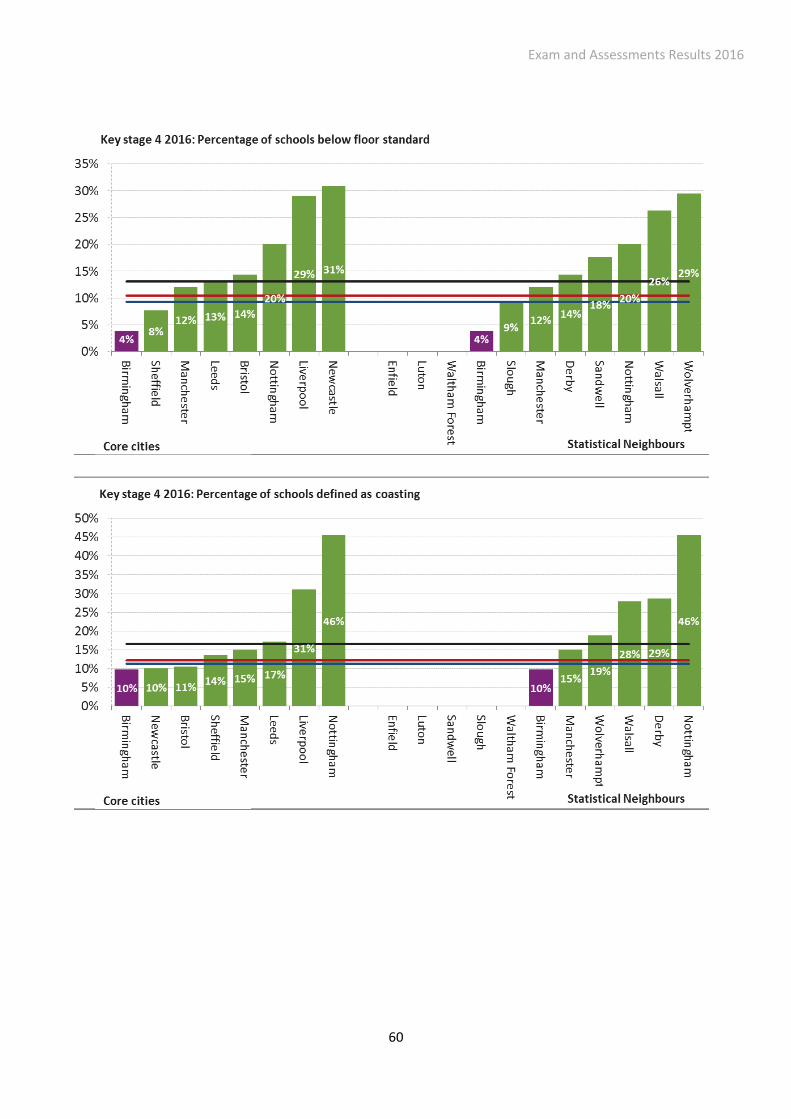
Birmingham has a much lower than average proportion of schools classed below the floor standard or coasting.
Exam and Assessments Results 2016
60
Exam and Assessments Results 2016
61
Exam and Assessments Results 2016
62
Key Stage 5
Key Messages
Birmingham’s key stage 5 attainment is above national average for 2016.
Birmingham mainly outperforms core cities, statistical neighbours and the west midlands.
Girls generally obtain a higher average point score than boys.
Boys do better than girls in the attainment measures.
Background A new 16-18 school and college accountability system has been implemented in 2016, which includes new headline accountability measures and changes to the methodology for calculating 16-18 results. It is not possible to directly compare 2016 results to previous years because of these changes. Below are some of the changes: Previous measures:
Vocational attainment is no longer reported.
Average point score (APS) per student measures have been removed. New measures:
Attainment is reported separately for students studying applied general and tech level qualifications.
A new measure has been included showing the average point score and grade for a student’s best 3 A levels.
A new point score system is being used - the old system used a scale of 150-300 for A levels, where a grade A* was given 300 points and a grade E was given 150 points. The new system uses a simpler scale of 10-60 points for A levels, where a grade A* is given 60 points and a grade E is given 10 points.
For further information please click on the below links:
https://www.gov.uk/government/publications/school-and-college-performance-tables-2016-statement-of-intent (School and college performance tables 2016: statement of intent)
https://www.gov.uk/government/publications/16-to-19-accountability-headline-measures-technical-guide (16 to 19 accountability headline measures: technical guide)
For 2016, there are new rules for how students are included in the attainment measures. When reporting average attainment for students that study A level, academic, applied general or tech level qualifications, only students who have entered for qualifications of at least a certain size have been included. This ensures that the students included are broadly comparable. Previously, students were only included if they had entered for at least one qualification the size of an A level in the reporting year. This meant that any students who had only entered for qualifications the size of half an A level e.g. an AS level, were not reported. This year, in line with changes to performance tables, the threshold has been lowered to include those who have studied the size of half an A level. This means that students who are at the end of 16-18 study and have studied for only an AS level (or similar sized vocational qualification) are now included.
Exam and Assessments Results 2016
63
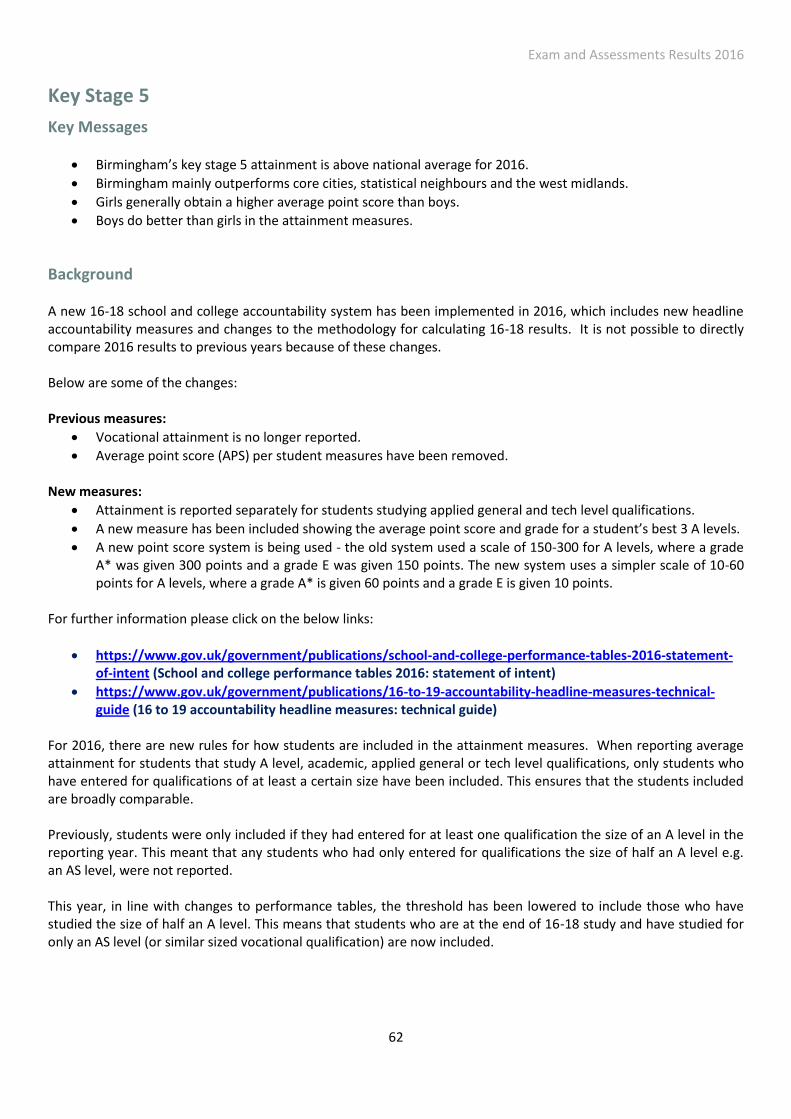
Overall Performance
The chart above gives overview of Birmingham’s performance compared to the national average across the main key stage 5 accountability measures. In the A level measures graph above, Birmingham outperform national. The average point score per entry and average point score per entry for the best 3 A levels is approximately 1 point above national. When comparing attainment measures, Birmingham is over 3 pp higher than national for students achieving grades AAB or better at A level. A similar picture is true for students achieving grades AAB or better at A level, of which at least two are in facilitating* subjects – Birmingham is 4 pp higher than national. *Please note that facilitating subjects are: maths and further maths, English literature, physics, biology, chemistry, geography, history and languages (classical and modern).
Exam and Assessments Results 2016
64
National Comparisons
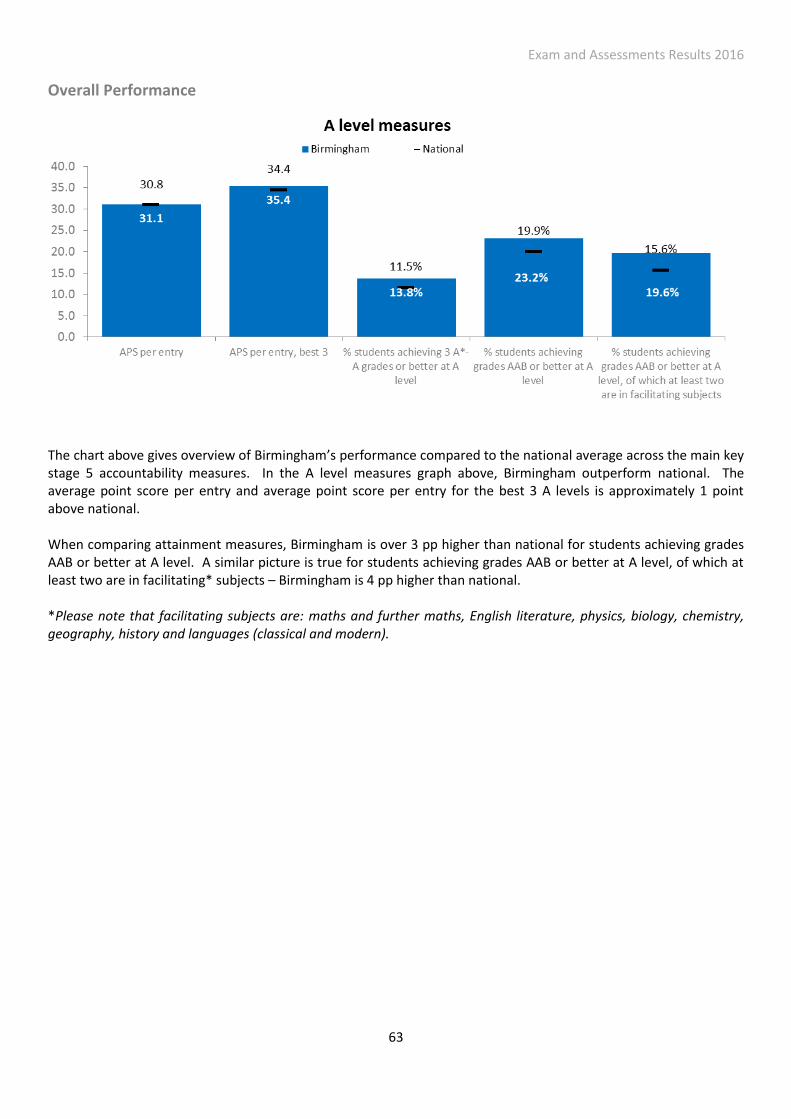
Average Point Score (APS) per entry
When comparing Birmingham A level students’ average point score per entry, Birmingham does fairly well – only 1.4 pp behind the best performing Core City Sheffield and less than 1pp behind Slough amongst our statistical neighbours.
Exam and Assessments Results 2016
65
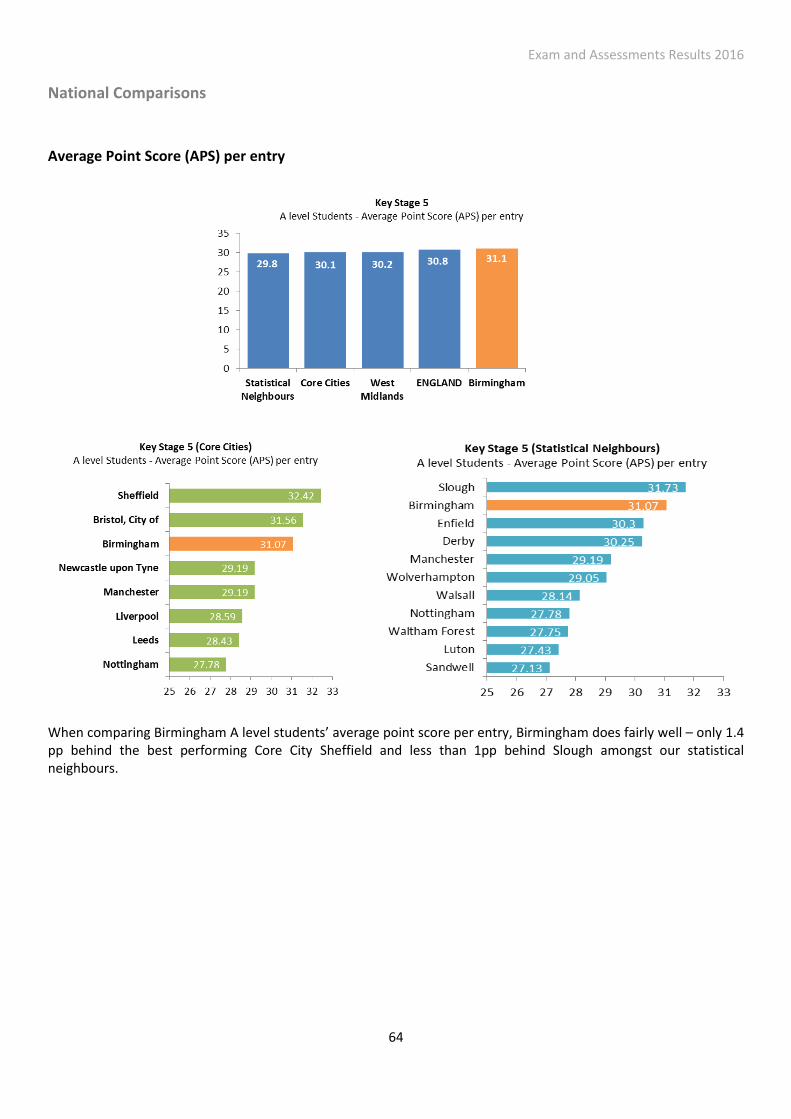
Average Point Score (APS) for a student’s best three A levels
When comparing Birmingham A level students’ average point score based on best three A levels, again Birmingham
performs well. It is the best performing Core City, and is slightly behind Slough for statistical neighbours.
Exam and Assessments Results 2016
66
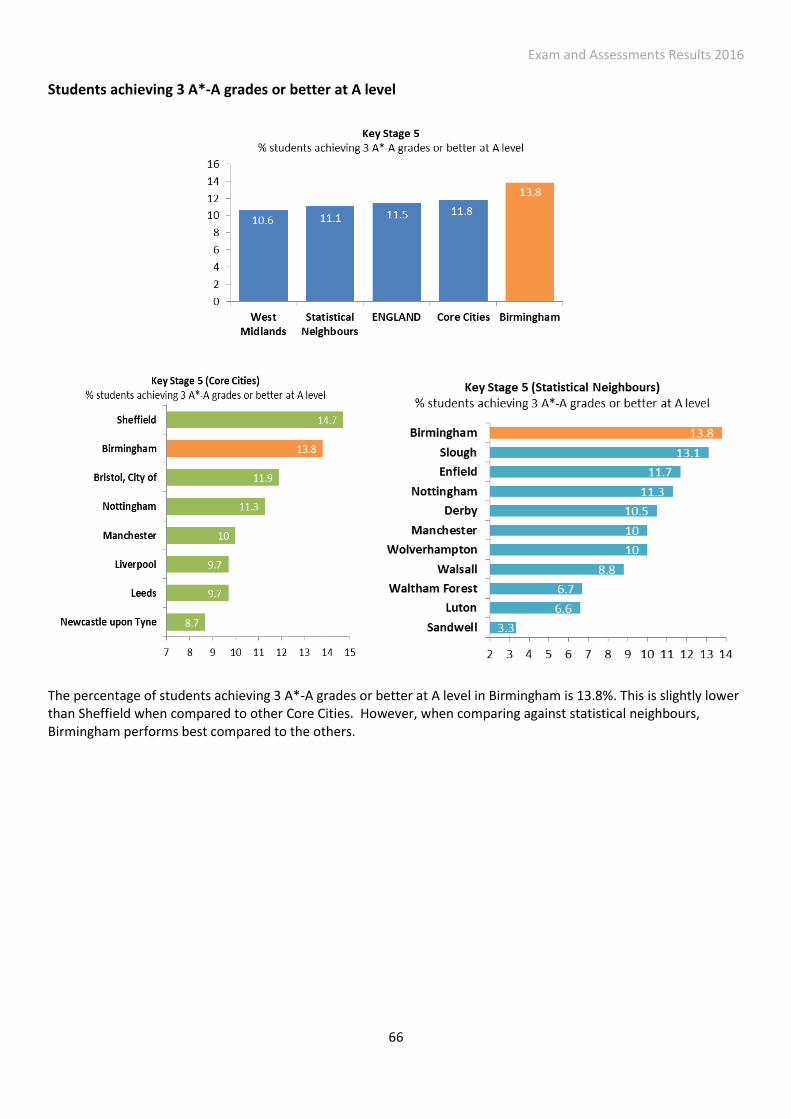
Students achieving 3 A*-A grades or better at A level
The percentage of students achieving 3 A*-A grades or better at A level in Birmingham is 13.8%. This is slightly lower than Sheffield when compared to other Core Cities. However, when comparing against statistical neighbours, Birmingham performs best compared to the others.
Exam and Assessments Results 2016
67
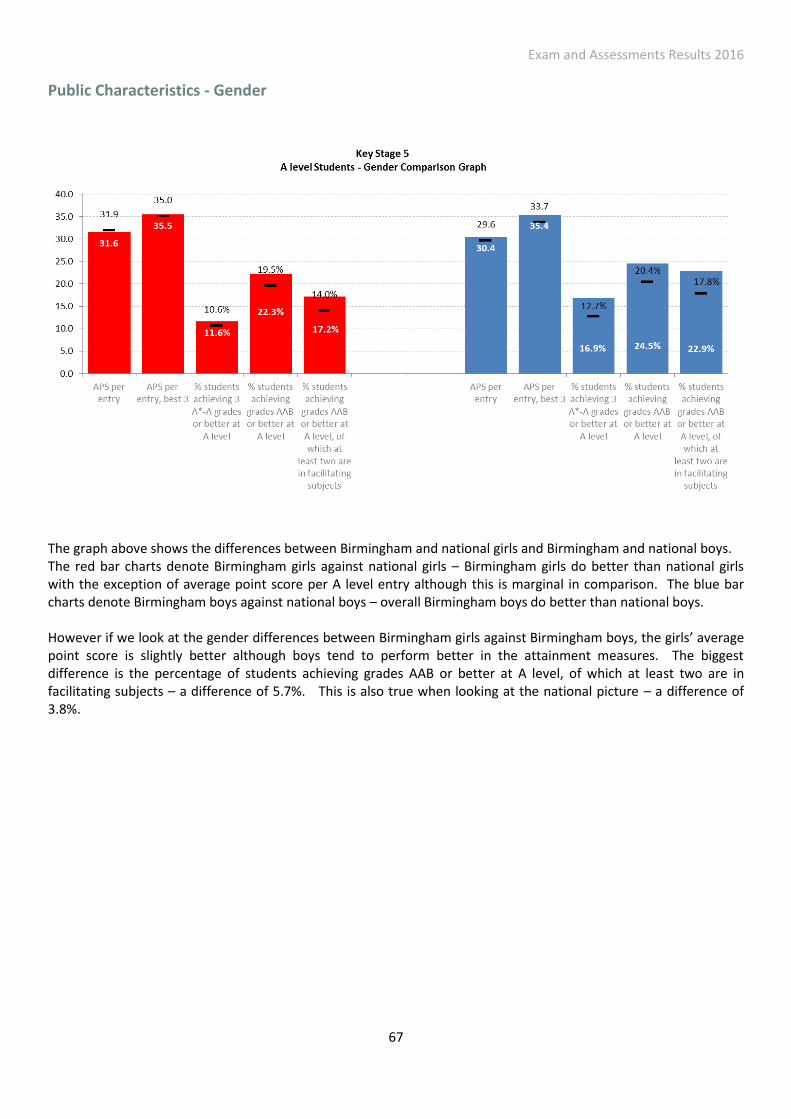
Public Characteristics - Gender
The graph above shows the differences between Birmingham and national girls and Birmingham and national boys. The red bar charts denote Birmingham girls against national girls – Birmingham girls do better than national girls with the exception of average point score per A level entry although this is marginal in comparison. The blue bar charts denote Birmingham boys against national boys – overall Birmingham boys do better than national boys. However if we look at the gender differences between Birmingham girls against Birmingham boys, the girls’ average point score is slightly better although boys tend to perform better in the attainment measures. The biggest difference is the percentage of students achieving grades AAB or better at A level, of which at least two are in facilitating subjects – a difference of 5.7%. This is also true when looking at the national picture – a difference of 3.8%.
Exam and Assessments Results 2016
68
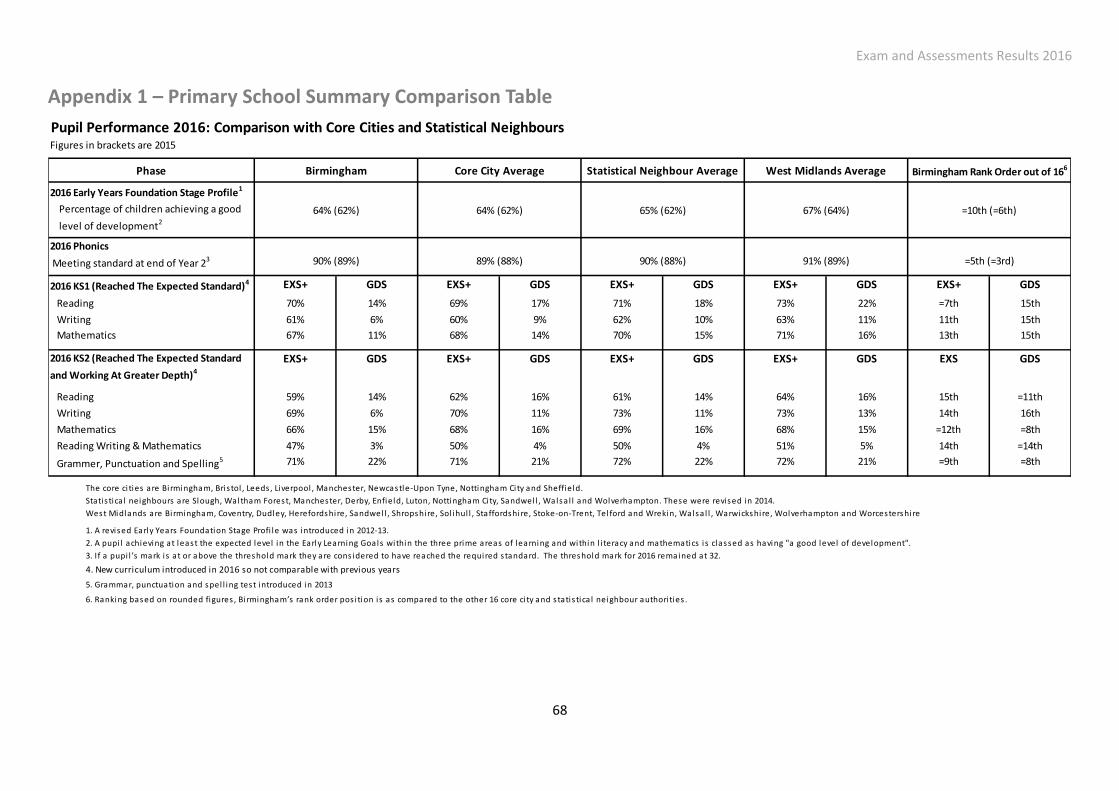
Appendix 1 – Primary School Summary Comparison Table
Pupil Performance 2016: Comparison with Core Cities and Statistical NeighboursFigures in brackets are 2015
Phase
2016 Early Years Foundation Stage Profile1
Percentage of children achieving a good
level of development2
2016 Phonics
Meeting standard at end of Year 23
2016 KS1 (Reached The Expected Standard)4 EXS+ GDS EXS+ GDS EXS+ GDS EXS+ GDS EXS+ GDS
Reading 70% 14% 69% 17% 71% 18% 73% 22% =7th 15th
Writing 61% 6% 60% 9% 62% 10% 63% 11% 11th 15th
Mathematics 67% 11% 68% 14% 70% 15% 71% 16% 13th 15th
2016 KS2 (Reached The Expected Standard
and Working At Greater Depth)4
EXS+ GDS EXS+ GDS EXS+ GDS EXS+ GDS EXS GDS
Reading 59% 14% 62% 16% 61% 14% 64% 16% 15th =11th
Writing 69% 6% 70% 11% 73% 11% 73% 13% 14th 16th
Mathematics 66% 15% 68% 16% 69% 16% 68% 15% =12th =8th
Reading Writing & Mathematics 47% 3% 50% 4% 50% 4% 51% 5% 14th =14th
Grammer, Punctuation and Spelling5 71% 22% 71% 21% 72% 22% 72% 21% =9th =8th
The core ci ties are Birmingham, Bris tol , Leeds , Liverpool , Manchester, Newcastle-Upon Tyne, Nottingham City and Sheffield.
Statis tica l neighbours are Slough, Waltham Forest, Manchester, Derby, Enfield, Luton, Nottingham City, Sandwel l , Walsa l l and Wolverhampton. These were revised in 2014.
West Midlands are Birmingham, Coventry, Dudley, Herefordshire, Sandwel l , Shropshire, Sol ihul l , Staffordshire, Stoke-on-Trent, Tel ford and Wrekin, Walsa l l , Warwickshire, Wolverhampton and Worcestershire
1. A revised Early Years Foundation Stage Profi le was introduced in 2012-13.
2. A pupi l achieving at least the expected level in the Early Learning Goals within the three prime areas of learning and within l i teracy and mathematics i s classed as having "a good level of development".
3. If a pupi l ’s mark i s at or above the threshold mark they are cons idered to have reached the required s tandard. The threshold mark for 2016 remained at 32.
4. New curriculum introduced in 2016 so not comparable with previous years
5. Grammar, punctuation and spel l ing test introduced in 2013
6. Ranking based on rounded figures , Bi rmingham’s rank order pos i tion is as compared to the other 16 core ci ty and s tatis tica l neighbour authori ties .
90% (88%)
65% (62%)
Statistical Neighbour Average
=5th (=3rd)
=10th (=6th)
West Midlands Average
67% (64%)
91% (89%)
Birmingham Rank Order out of 166Birmingham
90% (89%)
64% (62%)
Core City Average
89% (88%)
64% (62%)
Exam and Assessments Results 2016
69
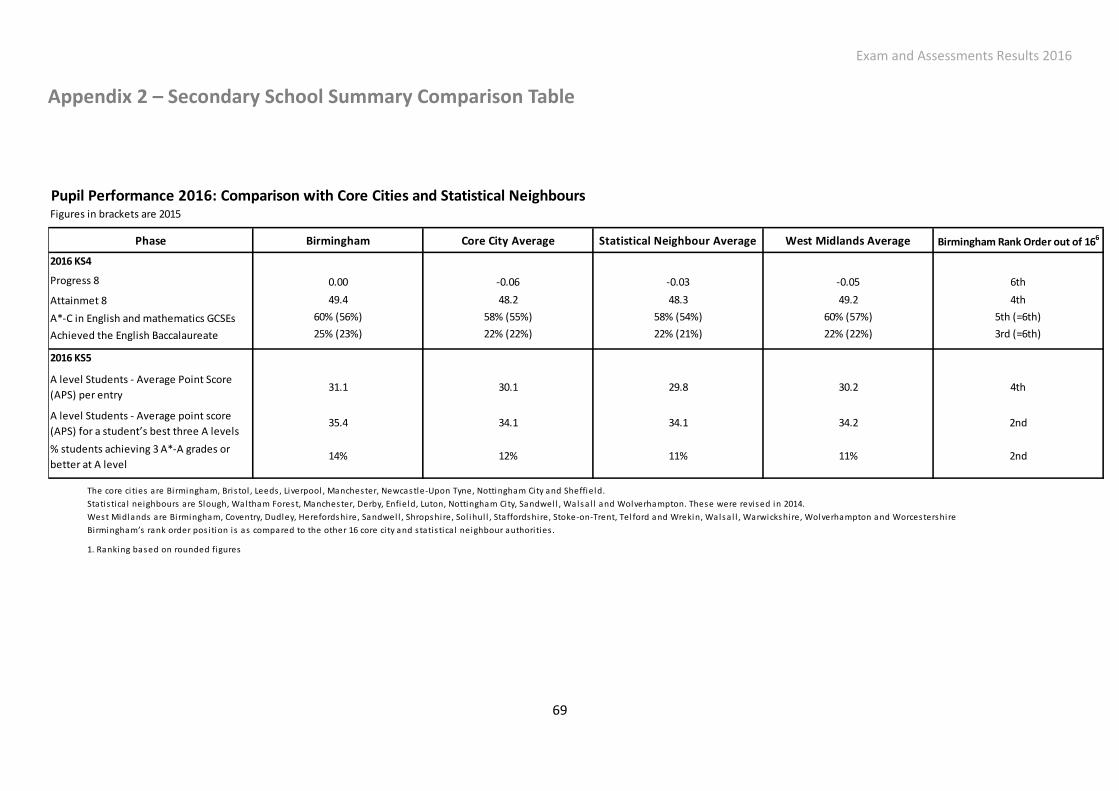
Appendix 2 – Secondary School Summary Comparison Table
Pupil Performance 2016: Comparison with Core Cities and Statistical NeighboursFigures in brackets are 2015
Phase
2016 KS4
Progress 8
Attainmet 8
A*-C in English and mathematics GCSEs
Achieved the English Baccalaureate
2016 KS5
A level Students - Average Point Score
(APS) per entry
A level Students - Average point score
(APS) for a student’s best three A levels
% students achieving 3 A*-A grades or
better at A level
The core ci ties are Birmingham, Bris tol , Leeds , Liverpool , Manchester, Newcastle-Upon Tyne, Nottingham City and Sheffield.
Statis tica l neighbours are Slough, Waltham Forest, Manchester, Derby, Enfield, Luton, Nottingham City, Sandwel l , Walsa l l and Wolverhampton. These were revised in 2014.
West Midlands are Birmingham, Coventry, Dudley, Herefordshire, Sandwel l , Shropshire, Sol ihul l , Staffordshire, Stoke-on-Trent, Tel ford and Wrekin, Walsa l l , Warwickshire, Wolverhampton and Worcestershire
Birmingham’s rank order pos i tion is as compared to the other 16 core ci ty and s tatis tica l neighbour authori ties .
1. Ranking based on rounded figures
49.4 48.2 48.3 49.2 4th
0.00 -0.06 -0.03 -0.05 6th
11% 11% 2nd
31.1 30.1 29.8 30.2 4th
35.4 34.1 34.1 34.2 2nd
14% 12%
60% (56%) 58% (55%) 58% (54%) 5th (=6th)
25% (23%) 22% (22%) 22% (21%) 22% (22%) 3rd (=6th)
60% (57%)
Birmingham Core City Average Statistical Neighbour Average West Midlands Average Birmingham Rank Order out of 166
Exam and Assessments Results 2016
70
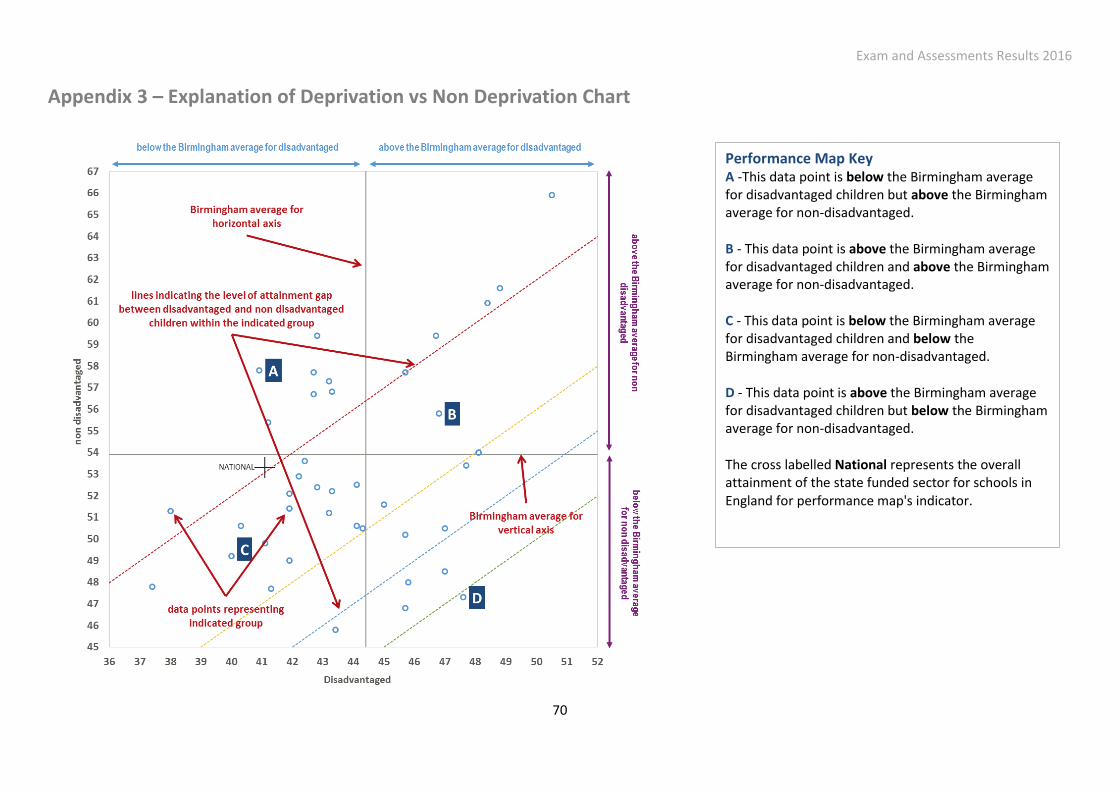
Appendix 3 – Explanation of Deprivation vs Non Deprivation Chart
Performance Map Key A -This data point is below the Birmingham average for disadvantaged children but above the Birmingham average for non-disadvantaged.
B - This data point is above the Birmingham average for disadvantaged children and above the Birmingham average for non-disadvantaged.
C - This data point is below the Birmingham average for disadvantaged children and below the Birmingham average for non-disadvantaged.
D - This data point is above the Birmingham average for disadvantaged children but below the Birmingham average for non-disadvantaged.
The cross labelled National represents the overall attainment of the state funded sector for schools in England for performance map's indicator.