annual environmental monitoring report · 2018-07-18 · annual environmental monitoring report 1...
TRANSCRIPT

ANNUAL ENVIRONMENTAL MONITORING REPORT 1 JULY 2014 TO 30 JUNE 2015
OPHIR ROAD RESOURCE RECOVERY CENTRE
PREPARED FOR
ORANGE CITY COUNCIL
AUGUST 2015

ANNUAL ENVIRONMENTAL MONITORING
REPORT 1 JULY 2014 TO 30 JUNE 2015
OPHIR ROAD RESOURCE RECOVERY CENTRE
PREPARED FOR:
ORANGE CITY COUNCIL
AUGUST 2015
POSTAL ADDRESS PO BOX 1963 ORANGE NSW 2800
LOCATION 154 PEISLEY STREET ORANGE NSW 2800
TELEPHONE 02 6393 5000 FACSIMILE 02 6393 5050
EMAIL [email protected] WEB SITE WWW.GEOLYSE.COM

ANNUAL ENVIRONMENTAL MONITORING REPORT ORRRC – 1 JULY 2014 TO 30 JUNE 2015
ORANGE CITY COUNCIL
298047_AEMR_14-15B.DOCX
Report Title: Annual Environmental Monitoring Report
Project: ORRRC – 1 July 2014 to 30 June 2015
Client: Orange City Council
Report Ref.: 298047_AEMR_14-15B.docx
Status: Final
Issued: 25 August 2015
Geolyse Pty Ltd and the authors responsible for the preparation and compilation of this report declare that we do not have, nor expect to have a beneficial interest in the study area of this project and will not benefit from any of the recommendations outlined in this report.
The preparation of this report has been in accordance with the project brief provided by the client and has relied upon the information, data and results provided or collected from the sources and under the conditions outlined in the report.
All information contained within this report is prepared for the exclusive use of Orange City Council to accompany this report for the land described herein and are not to be used for any other purpose or by any other person or entity. No reliance should be placed on the information contained in this report for any purposes apart from those stated therein.
Geolyse Pty Ltd accepts no responsibility for any loss, damage suffered or inconveniences arising from, any person or entity using the plans or information in this study for purposes other than those stated above.

ANNUAL ENVIRONMENTAL MONITORING REPORT ORRRC – 1 JULY 2014 TO 30 JUNE 2015
ORANGE CITY COUNCIL
298047_AEMR_14-15B.DOCX
TABLE OF CONTENTS
1.0 INTRODUCTION ........................................................................................ 1
1.1 BACKGROUND .................................................................................................................. 1 1.2 LICENCE REQUIREMENTS .............................................................................................. 1 1.3 REPORT STRUCTURE ...................................................................................................... 2
2.0 ENVIRONMENTAL MONITORING PROGRAM ........................................ 3
2.1 OVERVIEW ......................................................................................................................... 3 2.2 GROUNDWATER ............................................................................................................... 3 2.3 SURFACE WATER ............................................................................................................. 5 2.4 LEACHATE ......................................................................................................................... 6 2.5 ACCUMULATED BUILDING GAS ...................................................................................... 7
3.0 ENVIRONMENTAL MONITORING RESULTS .......................................... 8
3.1 INTRODUCTION ................................................................................................................ 8 3.2 GROUNDWATER ............................................................................................................... 8
3.2.1 GROUNDWATER LEVELS ................................................................................. 8 3.2.2 GROUNDWATER QUALITY ............................................................................... 9
3.3 SURFACE WATER ........................................................................................................... 11
3.3.1 QUALITY ........................................................................................................... 11
3.4 LEACHATE ....................................................................................................................... 12
3.4.1 QUALITY ........................................................................................................... 12
3.5 ACCUMULATED BUILDING GAS .................................................................................... 13
4.0 OTHER MONITORING DATA .................................................................. 14
4.1 PUBLIC CONCERNS AND COMPLAINTS ...................................................................... 14 4.2 SOLID WASTE QUANTITIES ........................................................................................... 14
4.2.1 SURVEY VOLUME CALCULATIONS ............................................................... 15 4.2.2 EFFECTIVE COMPACTION ............................................................................. 15 4.2.3 WASTE DIVERSION OPERATIONS ................................................................ 15
5.0 SUMMARY ............................................................................................... 16
5.1 MONITORING ................................................................................................................... 16
5.1.1 GROUNDWATER .............................................................................................. 16 5.1.2 SURFACE WATER ........................................................................................... 16 5.1.3 LEACHATE ........................................................................................................ 16 5.1.4 LANDFILL GAS ................................................................................................. 16
5.2 COMPLAINTS ................................................................................................................... 16 5.3 SOLID WASTE QUANTITIES ........................................................................................... 16 5.4 WASTE COMPACTION AND DIVERSION ...................................................................... 17
6.0 CONCLUSION AND RECOMMENDATIONS .......................................... 18
6.1 CONCLUSION .................................................................................................................. 18 6.2 RECOMMENDATIONS .................................................................................................... 18
7.0 REFERENCES ......................................................................................... 19

ANNUAL ENVIRONMENTAL MONITORING REPORT ORRRC – 1 JULY 2014 TO 30 JUNE 2015
ORANGE CITY COUNCIL
298047_AEMR_14-15B.DOCX
APPENDICES
APPENDIX A Monitoring Data
APPENDIX B Monitoring Reports and Laboratory Results
TABLES
Table 2.1 – Monitoring Undertaken ......................................................................................................... 3 Table 2.2 – Groundwater Monitoring ....................................................................................................... 5 Table 2.3 – Surface Water Monitoring .................................................................................................... 6 Table 2.4 – Leachate Monitoring ............................................................................................................. 6 Table 4.1 – 2014/2015 Total Waste to Landfill, Tonnes ....................................................................... 14

ANNUAL ENVIRONMENTAL MONITORING REPORT ORRRC – 1 JULY 2014 TO 30 JUNE 2015
ORANGE CITY COUNCIL
PAGE 1 298047_AEMR_14-15B.DOCX
1.0 INTRODUCTION
1.1 BACKGROUND
The Ophir Road Resource Recovery Centre is located approximately 3km north-east of the Orange central business district. The area surrounding the property to the north, east and south is predominantly rural or rural residential development. Orange City Council’s sewage treatment works is located immediately west of the facility on the opposite side of Blackmans Swamp Creek.
Ophir Road Resource Recovery Centre is owned by Orange City Council and has been in operation since the mid 1960’s. The site is zoned 5(a) Public Purposes under Orange Local Environmental Plan 2000.
1.2 LICENCE REQUIREMENTS
The Ophir Road Resource Recovery Centre currently operates under Environment Protection Licence 5956 (EPL 5956), issued under Section 55 of the Protection of the Environment Operations Act 1997 (The Act). This licence governs the design, construction, operation, monitoring and rehabilitation of the facility in accordance with The Act.
Management and operation of the centre is also undertaken in accordance with the Landfill Environmental Management Plan (LEMP, Geolyse, 2013).
Section 5 of EPL 5956 provides instructions on environmental monitoring requirements. Specifically, Condition M2.1 describes the requirements to monitor the concentration of pollutants discharged to groundwater, surface water, leachate, surface gas and sub-surface gas.
Annual reporting requirements that are outlined in Condition R1.1 state:
“R1.1 The licensee must complete and supply to the EPA an Annual Return in the approved form comprising:
a) a Statement of Compliance; and
b) a Monitoring and Complaints Summary.
At the end of each reporting period, the EPA will provide to the licensee a copy of the form that must be completed and returned to the EPA.”
The deadline for the Annual Return that is outlined in Condition R1.5 states:
“The Annual Return for the reporting period must be supplied to the EPA by registered post not later than 60 days after the end of each reporting period or in the case of a transferring licence not later than 60 days after the date the transfer was granted (the 'due date')”
The reporting period for this AEMR is from 1 July 2014 to 30 June 2015. All monitoring data collected prior to this reporting period has also been included in the presentation and analysis of data. Collection of environmental data began at the Ophir Road Resource Recovery Centre in December 1997.
EPL 5956 was varied on 25 June 2014, and applicable to the current next reporting period. The primary implications of the variation included:
Changing the activity "contaminated soil treatment" from a primary activity to an ancillary activity;
Removal of surface and sub-surface gas monitoring requirements;
Provision of and reference to a new location description drawing;
Weekly cover requirement introduced with the option of using alternate covering materials; and
A Pollution Studies and Reduction Program required to be undertaken.

ANNUAL ENVIRONMENTAL MONITORING REPORT ORRRC – 1 JULY 2014 TO 30 JUNE 2015
ORANGE CITY COUNCIL
PAGE 2 298047_AEMR_14-15B.DOCX
1.3 REPORT STRUCTURE
Section 1 – presents a brief introduction and background to the report;
Section 2 – provides an overview of the environmental monitoring program undertaken at the facility during the reporting period;
Section 3 – presents the data and discussion of data collected during the reporting period;
Section 4 – presents all monitoring data that falls outside of the scope of environmental monitoring for the annual return year, including records of public complaints and quantities of waste deposited;
Section 5 – presents a summary of all monitoring undertaken as described in detail in Section 3 and Section 4; and
Section 6 – presents the conclusions and recommendations resulting from monitoring undertaken during the reporting period.

ANNUAL ENVIRONMENTAL MONITORING REPORT ORRRC – 1 JULY 2014 TO 30 JUNE 2015
ORANGE CITY COUNCIL
PAGE 3 298047_AEMR_14-15B.DOCX
2.0 ENVIRONMENTAL MONITORING PROGRAM
2.1 OVERVIEW
Environmental monitoring undertaken at the Ophir Road Resource Recovery Centre during the reporting period included that required for groundwater, surface water, leachate and gas. This section summarises all environmental monitoring undertaken during the reporting period (Table 2.1).
Table 2.1 – Monitoring Undertaken
Date Groundwater (Biannually) Surface Water (monthly during
discharge)
Leachate (Biannually)
Building Gas Accumulation
(Monthly) Level Water Quality
July 2014
Aug 2014
Sept 2014
Oct 2014
Nov 2014
Dec 2014
Jan 2015
Feb 2015
Mar 2015
Apr 2015
May 2015
Jun 2015
Note: * Additional to EPL Requirements
2.2 GROUNDWATER
The groundwater monitoring network is shown on Figure 1. The network comprises ten (10) piezometers at seven (7) locations. These are nominated as monitoring points BH1, BH1A, BH2, BH2A, BH3, BH4, BH5, BH6, BH7 and BH7A (EPL Monitoring Points 1 – 6 and 13 – 16).
Groundwater level measurement and sampling are undertaken on a biannual basis in accordance with EPL 20104. Monitoring commenced in August 2012, prior to commissioning of the facility.

ANNUAL ENVIRONMENTAL MONITORING REPORT ORRRC – 1 JULY 2014 TO 30 JUNE 2015
ORANGE CITY COUNCIL
PAGE 4 298047_AEMR_14-15B.DOCX
Figure 1: Ophir Road Resource Recovery Centre Sampling Locations

ANNUAL ENVIRONMENTAL MONITORING REPORT ORRRC – 1 JULY 2014 TO 30 JUNE 2015
ORANGE CITY COUNCIL
PAGE 5 298047_AEMR_14-15B.DOCX
Table 2.2 shows the list of groundwater parameters and their analysis frequency during the reporting period.
Table 2.2 – Groundwater Monitoring
Biannual1 Parameter September 20142 March 2015
Alkalinity
Aluminium
Ammonia
Boron3
Calcium
Chloride
Electrical Conductivity (field4 + laboratory)
Copper
Fluoride
Iron
Magnesium
Manganese
Nitrate
pH (field4 + laboratory)
Phosphate
Potassium
Sodium
Standing Water Level
Sulfate
Total Dissolved Solids
Total Organic Carbon
Total Petroleum Hydrocarbons
Total Phenolics
Total Recoverable Hydrocarbons
Zinc
Temperature4 (field)
Notes: 1: Required inspection frequency, sample where liquid is present. 2: Monitoring Points BH5, BH6, BH7 and BH7A were added to EPL in April 2015, and had not yet been constructed
at the time of sampling in September 2014. 3: Boron was added as a groundwater analyte to the EPL in April 2015, and was not required to be analysed during
the September 2014 sampling event. 4: Parameters that have been included but are not required to be monitored by EPL 5956.
2.3 SURFACE WATER
Surface water was collected from monitoring points SW3 and SW4 (previously L1). EPL 5956 requires sampled collection monthly during discharge. The monitoring network is illustrated in Figure 1. Surface water quality monitoring is nominated as Points 7 and 8 in the licence. The monitoring network is illustrated in Figure 1. In accordance with EPL 5956, these points are required to be sampled monthly during discharge.

ANNUAL ENVIRONMENTAL MONITORING REPORT ORRRC – 1 JULY 2014 TO 30 JUNE 2015
ORANGE CITY COUNCIL
PAGE 6 298047_AEMR_14-15B.DOCX
Table 2.3 shows the list of surface water parameters and their analysis frequency during the reporting period.
Table 2.3 – Surface Water Monitoring
Discharge Parameter February
2015 April 2015
Temperature1 (field) SW3, SW4 SW3, SW4
Total Alkalinity SW3, SW4 SW3, SW4
Ammonia (as N) SW3, SW4 SW3, SW4
Boron2 - -
Calcium SW3, SW4 SW3, SW4
Chloride SW3, SW4 SW3, SW4
Elect. Cond (lab) SW3, SW4 SW3, SW4
Fluoride SW3, SW4 SW3, SW4
Iron SW3, SW4 SW3, SW4
Magnesium SW3, SW4 SW3, SW4
Manganese SW3, SW4 SW3, SW4
Nitrate (as N) SW3, SW4 SW3, SW4
pH (lab) SW3, SW4 SW3, SW4
Potassium SW3, SW4 SW3, SW4
Sodium SW3, SW4 SW3, SW4
Sulfate SW3, SW4 SW3, SW4
Total Organic Carbon SW3, SW4 SW3, SW4
Total Recoverable Hydrocarbons2 - -
Total Phenolics SW3, SW4 SW3, SW4
Total Petroleum Hydrocarbons2 - -
Notes: 1: Parameters that have been included but are not required to be monitored by EPL 5956 2: Boron, total recoverable hydrocarbons and total petroleum hydrocarbons were added as surface water analytes
to the EPL on 17 April 2015, and were not scheduled for analysis during the February 2015 and April 2015 sampling events.
2.4 LEACHATE
The leachate monitoring network consists of one leachate collection pond (L2) located on the western side of the site; this is nominated as Point 9 in the licence. The location of L2 is shown in Figure 1.
Table 2.4 shows the list of leachate parameters and their frequency of analysis for the reporting period.
Table 2.4 – Leachate Monitoring
Biannual1 Parameter September 2014 March 2015
Alkalinity
Ammonia
Boron2
Calcium

ANNUAL ENVIRONMENTAL MONITORING REPORT ORRRC – 1 JULY 2014 TO 30 JUNE 2015
ORANGE CITY COUNCIL
PAGE 7 298047_AEMR_14-15B.DOCX
Table 2.4 – Leachate Monitoring
Biannual1 Parameter September 2014 March 2015
Chloride
Electrical Conductivity (field3 + laboratory)
Fluoride
Iron
Magnesium
Manganese
Nitrate
pH (field3 + laboratory)
Potassium
Sodium
Sulfate
Total Organic Carbon
Total Petroleum Hydrocarbons2
Total Phenolics
Total Recoverable Hydrocarbons2
Temperature3 (field)
Notes: 1: Required inspection frequency, sample where liquid is present. 2: Boron, total recoverable hydrocarbons and total petroleum hydrocarbons were added as leachate analytes to the
EPL in April 2015, and was not required to be analysed during the September 2014 and March 2015 sampling events.
3: Parameters that have been included but are not required to be monitored by EPL 5956.
2.5 ACCUMULATED BUILDING GAS
Landfill gas was monitored in all buildings located within 250m of active landfill areas on a monthly basis. This includes all buildings located in the eastern portion of the site by the main gate. Measurements were undertaken monthly using a GA2000 Landfill Gas Analyser.
The threshold for further investigation is 1.25% (v/v) methane. Building gas accumulation monitoring is nominated as Point 12 in the licence.

ANNUAL ENVIRONMENTAL MONITORING REPORT ORRRC – 1 JULY 2014 TO 30 JUNE 2015
ORANGE CITY COUNCIL
PAGE 8 298047_AEMR_14-15B.DOCX
3.0 ENVIRONMENTAL MONITORING RESULTS
3.1 INTRODUCTION
Monitoring results are presented in this section for all environmental monitoring undertaken during the reporting period. The laboratory data are presented, along with an interpretation of trends, variability and anomalies for groundwater, surface water, leachate and accumulated gas. Levels greater than the LEMP provisional limits, any deficiencies in monitoring, environmental incidents and remedial actions undertaken to correct any problems or deficiencies are also discussed.
Monitoring data is summarised in the following figures and in the tables of Appendix A. All laboratory reports and chain-of-custody documentation are included in Appendix B.
3.2 GROUNDWATER
Groundwater monitoring consisted of biannual water level measurements at the six piezometer monitoring stations (ten in the most recent monitoring event) and biannual collection of groundwater samples from these piezometers.
3.2.1 GROUNDWATER LEVELS
Groundwater level measurements are presented for all monitoring stations in Appendix A, Table A1 and are illustrated below in Figure 3.1 for the previous 3 years.
Figure 3.1 Groundwater Levels – Ophir Road Resource Recovery Centre, 2012 to 2015
Groundwater levels remained relatively consistent throughout the reporting period, with BH3 remaining the up-gradient monitoring point. Groundwater elevations of recently installed monitoring locations BH5 and BH6 correspond to down-gradient locations.

ANNUAL ENVIRONMENTAL MONITORING REPORT ORRRC – 1 JULY 2014 TO 30 JUNE 2015
ORANGE CITY COUNCIL
PAGE 9 298047_AEMR_14-15B.DOCX
3.2.2 GROUNDWATER QUALITY
Complete historical results for each groundwater monitoring event in the reporting period are presented in Appendix A, Tables A2-A3. Monitoring locations BH2A and BH7A were unable to be sampled in the reporting period due to insufficient water volume.
Laboratory measured pH was slightly alkaline and relatively consistent across the site in the reporting period, with values ranging from 7.11 at BH2 (March 2015) to 7.98 at BH3 (September 2014). pH values are indicative of suitable for livestock drinking water, with all values falling within the guideline range of 6.5 to 8.5 (Markwick, 2007). pH of groundwater at all piezometers (with historic data available) decreased during the reporting period.
Electrical conductivity (EC) ranged from 224 µS/cm at BH1A (September 2014) to 3200 µS/cm at BH4 (September 2014). Corresponding total dissolved solids (TDS) concentrations ranged from 150 mg/L to 2,144 mg/L, and are considered suitable for consumption by the most susceptible livestock category, poultry (<3,000 mg/L, ANZECC & ARMCANZ, 2000).
Total alkalinity concentrations ranged from 73 mgCaCO3/L at BH7 (March 2015) to 854 mgCaCO3/L at BH4 (March 2015). Concentrations were generally observed to increase in the reporting period (where historic data was available). The guideline hardness value for potential fouling of waters (350 mgCaCO3/L, ANZECC & ARMCANZ, 2000) was exceeded at monitoring locations BH2, BH3, BH4 and BH5 at the September 2014 and/or the March 2015 monitoring events.
Sulfate ranged from a low of 1 mg/L at BH1 (March 2015) to 297 mg/L at BH7 (March 2015). These concentrations are lower than the 1000 mg/L guideline value for livestock drinking water (ANZECC & ARMCANZ, 2000).
Chloride concentrations in groundwater ranged from 3 mg/L at BH1 (September 2014) to 640 mg/L at BH4 (March 2015). No concentrations of chloride in groundwater exceeded the upper guideline value for irrigation to moderately tolerant crops (700 mg/L, ANZECC & ARMCANZ, 2000) in the reporting period.
Calcium concentrations were all lower than the livestock drinking water guideline value of 1,000 mg/L (ANZECC & ARMCANZ, 2000). Monitoring station BH4 recorded the highest concentration at 281 mg/L (March 2015), and BH1A recorded the lowest at 11 mg/L (September 2014). Concentrations were consistent with historical data.
Magnesium concentrations ranged from 12 mg/L at BH1A (September 2014) to 261 mg/L at BH4 (March 2015) and were consistent with historical data.
Chloride, calcium and magnesium concentrations were all observed to be elevated at monitoring points BH2, BH4, BH5, with average concentrations in groundwater over five times greater than concentrations recorded at monitoring points BH1, BH1A, BH3 and BH7.
Potassium concentrations in groundwater ranged from below the laboratory limit of reporting (LOR) of 1 mg/L to 11 mg/L, and were consistent with historical data.
Sodium in groundwater was recorded to be lowest at BH1 at 11 mg/L (September 2014) and highest at BH7 at 98 mg/L (March 2015). These values are below the irrigation guideline for moderately tolerant crops (460 mg/L, ANZECC & ARMCANZ 2000) and the conservative aesthetic guideline for human drinking water (180 mg/L, NHMRC & NRMMC 2011).
Manganese ranged from below the laboratory LOR of 0.001 mg/L at BH6 (March 2015) to 0.768 mg/L at BH2 (March 2015). Groundwater in BH3 and BH4 were consistently below the long-term (<100 years) crop irrigation guideline value of 0.2 mg/L, while all monitoring locations recorded manganese concentrations below the short-term (<20 years) guideline value of 10 mg/L (ANZECC & ARMCANZ, 2000). Concentrations were consistent with historical data.
Iron was below the laboratory LOR of 0.05 mg/L at BH3 and BH4 (September 2014) and BH3, BH4, BH5, BH6 and BH7 (March 2015). Iron in groundwater was most elevated at BH2, ranging from

ANNUAL ENVIRONMENTAL MONITORING REPORT ORRRC – 1 JULY 2014 TO 30 JUNE 2015
ORANGE CITY COUNCIL
PAGE 10 298047_AEMR_14-15B.DOCX
0.56 mg/L (September 2014) to 4.93 mg/L (March 2015). For irrigation purposes, iron concentrations in groundwater from BH1, BH1A and BH2 are considered suitable for short-term (<20 years) use and the remainder of points are considered suitable for long-term (<100 years) use (ANZECC & ARMCANZ, 2000).
Fluoride concentrations ranged from below the laboratory LOR of 0.1 mg/L at BH4 (September 2014) to 0.3 mg/L at BH7 (March 2015). All values were lower than the livestock drinking water guideline value of 2 mg/L (ANZECC & ARMCANZ, 2000) and are consistent historical data.
Ammonia concentrations were most elevated at BH2 (3.25 mgN/L in March 2015) which exceeded the LEMP provisional limit, however BH2 has consistently displayed the highest ammonia concentrations. The ammonia concentration recorded in BH2 increased by 2.01 mgN/L during the reporting period. Ammonia concentrations in groundwater from all other monitoring points were below the aesthetic guideline for ammonia in human drinking water (0.41 mgN/L, NHMRC & NRMMC, 2011).
Nitrate concentrations in groundwater ranged from 0.02 mgN/L at BH4 (September 2014) and BH1 (March 2015) to 6.50 mgN/L at BH6 (March 2015). Nitrate concentrations in groundwater from all monitoring points were below the LEMP provisional limit of 10 mgN/L and below the livestock drinking water guideline value of 90.29 mgN/L (ANZECC & ARMCANZ, 2000) at all monitoring locations, however the elevated groundwater nitrate concentration at BH6 will continue to be monitored.
Total organic carbon concentrations in groundwater ranged from below the LOR (<1 mg/L) at BH3 (September 2014) to 16 mg/L at BH4 (September 2014 and March 2015) and BH5 (March 2015).
Total phenolics were below the LOR (<0.05 mg/L) at all groundwater monitoring points. Subsequently all samples were below the LEMP provisional limit of 0.1 mg/L and were within the historical ranges at each site.
No total petroleum hydrocarbon (TPH) fractions were detected at BH1, BH1A, BH3, BH5, BH6 or BH7 during the reporting period. Only the C6-C9 fraction was recorded at BH2, at concentrations of 1.50 mg/L and 2.07 mg/L (September 2014 and March 2015 respectively). BH4 recorded TPH fractions up to the C15-C28 fraction in the September 2014 monitoring round, totalling 0.84 mg/L, but only the C6-C9 fraction (0.15 mg/L) in March 2015. The LEMP provisional limits were exceeded at BH2 and BH4 but remained below the historical maximum values.
Low levels of aluminium were detected at all monitoring stations, with the highest being 0.08 mg/L at BH1 and BH1A in September 2014. This concentration is significantly lower than the 5 mg/L guideline value for livestock drinking water (ANZECC & ARMCANZ, 2000). There is no LEMP provisional limit for aluminium in groundwater; all concentrations were consistent with historical results.
The concentration of copper remained below the LEMP provisional limit of 0.015 mg/L in all samples with the highest concentration of 0.009 mg/L recorded at BH5 (March 2015). All concentrations were consistent with historical ranges, lower than the guideline value for livestock (0.5-5 mg/L, ANZECC & ARMCANZ, 2000) and for human drinking water (2 mg/L, NHMRC & NRMMC, 2011).
Manganese concentrations ranged from below the laboratory LOR of 0.001 mg/L at BH6 (March 2015) to 0.768 mg/L at BH2 (March 2015). The manganese concentration of 0.768 mg/L at BH2 fell outside the established range was the new maximum at the site No values recorded during the reporting period exceeded the conservative human health guideline limit of 0.5 mg/L. There are no livestock drinking water or LEMP provisional limits for manganese.
Concentrations of iron ranged from below the laboratory LOR of <0.05 mg/L at multiple locations, to a maximum of 4.93 mg/L at BH2 (March 2015). All concentrations were consistent with established ranges and all were below the short-term crop irrigation guideline value of 10 mg/L (ANZECC & ARMCANZ, 2000). There is no LEMP provisional limit for iron in groundwater.
In accordance with Section 3.8.2.3 of the LEMP, if monitoring indicates pollution, groundwater in the affected piezometer will be sampled and tested again as soon as possible to confirm the results. If re-sampling confirms the anomaly, the EPA will be notified as soon as practicable after it becomes known, by telephone and in writing within 14 days of confirmation.
ANNUAL ENVIRONMENTAL MONITORING REPORT ORRRC – 1 JULY 2014 TO 30 JUNE 2015
ORANGE CITY COUNCIL
PAGE 11 298047_AEMR_14-15B.DOCX
While a number of parameters exceeded the LEMP provisional groundwater limits this monitoring period, all levels were generally consistent with historical results, were not considered excessively high or displayed decreases in subsequent monitoring rounds. No increasing adverse trends were observed, therefore re-sampling was not undertaken.
3.3 SURFACE WATER
Surface water quality monitoring consists of sampling at monitoring sites SW3 and SW4 monthly during discharge. Discharge events occurred only in February and April 2015 (SW3 and SW4).
Analytical results for SW3 and SW4 are presented in Appendix A, Tables A4 and A5.
3.3.1 QUALITY
pH in surface water ranged from slightly alkaline in SW3 at 7.53 (February 2015) to moderately alkaline in SW4 at 7.96 (February 2015). These values are within the range recommended as suitable for livestock drinking water (Markwick, 2007).
Electrical conductivity ranged from 580 µS/cm at SW4 (April 2015) to 1,050 µS/cm at SW3 (February 2015). Corresponding total dissolved solids (TDS) concentrations ranged from 389 mg/L to 704 mg/L, and are considered suitable for consumption by the most susceptible livestock category, poultry (<3,000 mg/L, ANZECC & ARMCANZ, 2000).
Total alkalinity ranged from 166 mgCaCO3/L at SW4 (April 2015) to 290 mgCaCO3/L at SW4 (February 2015). All values were below the conservative aesthetic guideline for human drinking water (200 mgCaCO3/L, NHMRC & NRMMC, 2011) and the guideline hardness value for potential fouling of waters (350 mgCaCO3/L, ANZECC & ARMCANZ, 2000).
Sulfate concentrations ranged from 7 mg/L at SW4 (April 2015) to 157 mg/L at SW3 (April 2015). These concentrations are lower than the 1000 mg/L guideline value for livestock drinking water (ANZECC & ARMCANZ, 2000).
Chloride concentrations ranged from 78 mg/L at SW3 (February 2015) to 118 mg/L at SW4 (February 2015). No exceedance of the upper guideline value for irrigation to moderately tolerant crops (700 mg/L, ANZECC & ARMCANZ, 2000) was recorded.
Calcium concentrations were all lower than the livestock drinking water guideline value of 1,000 mg/L (ANZECC & ARMCANZ, 2000). Monitoring station SW3 recorded the highest concentration at 63 mg/L (February 2015), whilst the lowest concentration of 12 mg/L was recorded at SW4 (April 2015). Concentrations were consistent with historical data.
Magnesium concentrations ranged from 17 mg/L at SW4 (April 2014) to 29 mg/L at SW4 (February 2015) and were consistent with historical data.
Potassium concentrations ranged from 27 mg/L at SW4 (April 2015) to 54 mg/L at SW4 (February 2015) and were consistent with historical data.
Sodium concentrations were recorded to be lowest at SW4 at 60 mg/L (April 2015) and highest at SW4 at 86 mg/L (February 2015). These values are below the irrigation guideline for moderately tolerant crops (460 mg/L, ANZECC & ARMCANZ 2000), and the conservative aesthetic guideline for human drinking water (180 mg/L, NHMRC & NRMMC 2011).
Manganese ranged from 0.302 mg/L at SW4 (April 2015) to 1.05 mg/L at SW4 (February 2015). Manganese concentrations were consistently below the short-term (<20 years) crop irrigation guideline value of 10 mg/L (ANZECC & ARMCANZ, 2000). Concentrations were consistent with historical data.
Iron ranged from 0.44 mg/L at SW4 (February 2015) to 3.35 mg/L at SW3 (April 2015). For irrigation purposes, iron concentrations were below short-term (<20 years) irrigation criteria of 10 mg/L (ANZECC & ARMCANZ, 2000) at all locations.

ANNUAL ENVIRONMENTAL MONITORING REPORT ORRRC – 1 JULY 2014 TO 30 JUNE 2015
ORANGE CITY COUNCIL
PAGE 12 298047_AEMR_14-15B.DOCX
Fluoride concentrations were consistent at 0.2 mg/L and lower than the livestock drinking water guideline value of 2 mg/L (ANZECC & ARMCANZ, 2000) and are consistent historical data.
Ammonia concentrations were recorded up to 14 mgN/L at SW3 (April 2015) which exceeded the aesthetic guideline for ammonia in human drinking water (0.41 mgN/L, NHMRC & NRMMC, 2011). Ammonia concentrations of 1.98 mgN/L at SW3 and 4.04 mgN/L at SW4 in February 2015 also exceeded the aesthetic guideline. The LEMP provisional limit of 1 mgN/L was also exceeded at these locations, however ammonia concentrations were below the historical maximums recorded at each monitoring point.
Nitrate was lowest at 0.02 mgN/L at SW4 (April 2015) and highest at SW3 at 2.49 mgN/L (April 2015). Nitrate concentrations were below the livestock drinking water guideline value of 90.29 mgN/L (ANZECC & ARMCANZ, 2000) and the LEMP provisional limit of 10 mgN/L.
Total phenolics were below the LOR (<0.05 mg/L) at all surface water monitoring points in the reporting period.
3.4 LEACHATE
Leachate quality monitoring consisted of sampling of the leachate pond L2 in the September 2014 and March 2015 sampling rounds.
Analytical results for leachate are presented in Appendix A, Table A2 and A3.
3.4.1 QUALITY
pH in leachate was slightly alkaline and ranged from 7.48 (March 2015) to 7.82 (September 2014). These values are within the range recommended as suitable for livestock drinking water (Markwick, 2007).
Electrical conductivity ranged from 1,730 µS/cm (March 2015) to 2,200 µS/cm (September 2014). Corresponding TDS concentrations ranged from 1,159 mg/L to 1,474 mg/L, below the criteria for consumption by the most susceptible livestock category, poultry (<3,000 mg/L, ANZECC & ARMCANZ, 2000).
Total alkalinity ranged from 451 mgCaCO3/L (March 2015) to 504 mgCaCO3/L (September 2014), exceeding the conservative aesthetic guideline for human drinking water (200 mgCaCO3/L, NHMRC & NRMMC, 2011) and the guideline hardness value for potential fouling of waters (350 mgCaCO3/L, ANZECC & ARMCANZ, 2000).
Sulfate concentrations ranged from 30 mg/L (March 2015) to 31 mg/L (September 2014). These concentrations are lower than the 1000 mg/L guideline value for livestock drinking water (ANZECC & ARMCANZ, 2000).
Chloride concentrations ranged from 224 mg/L (March 2015) to 365 mg/L (September 2014). No exceedance of the upper guideline value for irrigation to moderately tolerant crops (700 mg/L, ANZECC & ARMCANZ, 2000) was recorded.
Calcium concentrations were all lower than the livestock drinking water guideline value of 1,000 mg/L (ANZECC & ARMCANZ, 2000). Calcium concentrations ranged from 72 mg/L (March 2015) to 112 mg/L (September 2014). Concentrations were consistent with historical data.
Magnesium concentrations ranged from 61 mg/L (March 2015) to 92 mg/L (September 2014) and were consistent with historical data.
Potassium concentrations ranged from 28 mg/L (March 2015) to 40 mg/L (September 2014) and were consistent with historical data.

ANNUAL ENVIRONMENTAL MONITORING REPORT ORRRC – 1 JULY 2014 TO 30 JUNE 2015
ORANGE CITY COUNCIL
PAGE 13 298047_AEMR_14-15B.DOCX
Sodium concentrations ranged from 95 mg/L (March 2015) to 153 mg/L (September 2014), below the conservative aesthetic guideline for human drinking water (180 mg/L, NHMRC & NRMMC 2011),and the irrigation guideline for moderately tolerant crops (460 mg/L, ANZECC & ARMCANZ 2000).
Manganese ranged from 1.73 mg/L (September 2014) to 5.53 (March 2015). Manganese concentrations were consistently below the short-term (<20 years) crop irrigation guideline value of 10 mg/L (ANZECC & ARMCANZ, 2000) and were consistent with historical data.
Iron ranged from 0.51 mg/L (September 2014) to 0.99 mg/L (March 2015). For irrigation purposes, iron concentrations were consistently below short-term (<20 years) irrigation criteria of 10 mg/L (ANZECC & ARMCANZ, 2000).
Fluoride concentrations ranged from 0.2 mg/L (September 2014) to 0.4 mg/L (March 2015). All values were lower than the livestock drinking water guideline value of 2 mg/L (ANZECC & ARMCANZ, 2000) and are consistent historical data.
Ammonia concentrations ranged from 9.25 mgN/L (September 2014) to 10.8 mgN/L (March 2015) which consistently exceeded the aesthetic guideline for ammonia in human drinking water (0.41 mgN/L, NHMRC & NRMMC, 2011).
Nitrate concentrations ranged from 0.14 mgN/L (March 2015) to 3.64 mgN/L (September 2014). Nitrate concentrations were below the livestock drinking water guideline value of 90.29 mgN/L (ANZECC & ARMCANZ, 2000).
Total phenolics were below the LOR (<0.05 mg/L) at leachate monitoring point L2 in the reporting period.
3.5 ACCUMULATED BUILDING GAS
All buildings located within 250 metres of deposited waste were measured for methane gas levels on a monthly basis. Readings from these premises were consistently below the threshold concentration of 1.25% (v/v) during the monitoring period.

ANNUAL ENVIRONMENTAL MONITORING REPORT ORRRC – 1 JULY 2014 TO 30 JUNE 2015
ORANGE CITY COUNCIL
PAGE 14 298047_AEMR_14-15B.DOCX
4.0 OTHER MONITORING DATA
4.1 PUBLIC CONCERNS AND COMPLAINTS
There were seven complaints made to the EPA regarding the operation of the landfill during the annual reporting period. All complaints fell between September 2014 and March 2015 and related to odour. Application of cover material, drying out of wet organic material, closing facility doors, floor washing, daily removal of waste from within the baling facility and use of a probiotic within the misting system addressed these issues.
4.2 SOLID WASTE QUANTITIES
Waste quantities landfilled at ORRRC for the 2014-2015 reporting period are summarised in Table 4.1.
Table 4.1 – 2014/2015 Total Waste to Landfill, Tonnes
Waste Type
Sector
Building / Demolition
Industrial / Commercial / Not-For-Profit
Residential / Municipal
ORRRCInternal
Virgin Excavated Natural Material (VENM)
8965.15 0.6 - -
12.6 - - -
Mixed Waste 13.88 7.02 0.8 13.42
0.3 0.3 -
Aggregate / Road Base 306.48 53 -
0.3 -
Asbestos 110.9 5.02 -
9.9 1.08 -
Rocks / Soil / Contaminated Waste
1.04 96.6 -
0.06 -
Glass Fines (from MRF) 1974.03
-
Stormwater Harvest Waste 26.9 -
-
Water Treatment Works Waste
836.06 -
-
Street Sweeping 1315.22 -
-
Baler 6420.39
-
Shredder 5.2
-
Animal Carcasses -
5.105 2.005 -
TOTALS 9420.25 168.785 2181.285 8413.04
Note: For each ‘Waste Type’, the first number identifies waste tonnage that has been weighed. The second number refers to tonnage estimates using EPA published vehicle weight conversion factors.

ANNUAL ENVIRONMENTAL MONITORING REPORT ORRRC – 1 JULY 2014 TO 30 JUNE 2015
ORANGE CITY COUNCIL
PAGE 15 298047_AEMR_14-15B.DOCX
The total tonnage received into the landfill for the year ending June 2015 was 20,183.36 t. The total Virgin Excavated Natural Material (VENM) component of this was 8,978.35 t. For licensing purposes, the total waste amount applied to landfill was 11,205.01 t.
It is noted that MRF glass fines are used for access track construction.
The total amount into landfill for 2014/2015 is below the limit set under Licence Condition L5.1, which states that the total tonnage of waste disposed of at the premises must not exceed 65,000 t/annum.
4.2.1 SURVEY VOLUME CALCULATIONS
Detailed survey of the Stage 3 landfill surface was undertaken in June 2014 and July 2015. Data from these surveys was used to create digital terrain models of the landfill for use in volume calculations.
The landfill volume used between the two surveys was determined to be 21,413 m3.
4.2.2 EFFECTIVE COMPACTION
The calculated landfill volume and the recorded waste quantities were used to determine the average waste compaction (excluding cover material) for the landfill. The licence for the facility requires a minimum waste compaction of 0.65 t/m3.
The landfill volume utilised in the period from 16 June 2014 to 7 July 2015 was 21,413 m3. Correcting this volume for the 365 day licensing period, the landfill volume utilised equates to 20,248 m3, which is comprised of 8,978.35 t of VENM, 1,974.03 t of glass fines and 9,230.98 t of waste materials.
Therefore, the average waste compaction for the landfill in the reporting period to 30 June 2015 is 1.00 t/m3. This indicates that compliance with the minimum compaction requirement is being achieved.
4.2.3 Waste Diversion Operations
The approximate proportions of waste streams diverted by sector are shown below:
Building / Demolition: 9,989 t diverted1 of 14,244 t received; 70%
Industrial / Commercial / Not-For-Profit: 5,260 t diverted2 of 14,254 t received; 37%
Residential / Municipal: 19,603 t diverted of 32,851 t received; 60%
Based on the above tonnages, approximately 34,852 t of waste material (of 61,349 t received) is diverted for recycling or on-site landfill operational purposes, equating to approximately 57% diversion.
1 Includes 8,678 t of VENM waste used for operational purposes at ORRRC. 2 Includes 1,974 t of glass fines used for operational purposes at ORRRC.

ANNUAL ENVIRONMENTAL MONITORING REPORT ORRRC – 1 JULY 2014 TO 30 JUNE 2015
ORANGE CITY COUNCIL
PAGE 16 298047_AEMR_14-15B.DOCX
5.0 SUMMARY
This section provides a summary of the monitoring results presented in Section 3 and Section 4.
5.1 MONITORING
5.1.1 Groundwater
Groundwater monitoring was conducted at six piezometer monitoring stations in September 2014 and ten piezometer monitoring stations in March 2015.
Groundwater levels remained relatively consistent throughout the reporting period, with BH3 remaining the up-gradient monitoring point. Groundwater elevations of recently installed monitoring locations BH5 and BH6 correspond to down-gradient locations.
Groundwater samples were obtained from monitoring stations BH1, BH1A, BH2, BH3, BH4, BH5, BH6 and BH7 and were analysed for the biannual suite of parameters. Monitoring stations BH2A and BH7A could not be sampled as they provided insufficient recharge following purging.
While a number of parameters exceeded the LEMP provisional groundwater limits this monitoring period (e.g. TPH in BH2 and BH4), all levels were generally consistent with historical results, were not considered excessively high or displayed decreases in subsequent monitoring rounds. No increasing adverse trends were observed, therefore re-sampling was not undertaken.
5.1.2 Surface Water
Two discharge samples were collected from SW3 and SW4 during the reporting. Only Ammonia in February 2015 (SW3 and SW4) and April 2015 (SW3) exceeded the LEMP provisional limit, but was consistent with the established range.
Concentrations of monitored analytes in surface water were generally below LEMP provisional limits or within historical ranges.
5.1.3 Leachate
The leachate monitoring point was sampled in September 2015 and March 2015. Concentrations of monitored analytes in leachate were generally within historical ranges.
5.1.4 Landfill Gas
No landfill gas was detected accumulated within buildings located within 250 metres of deposited waste during the reporting period.
5.2 COMPLAINTS
There were seven complaints made to the EPA regarding the operation of the landfill during the annual reporting period. All complaints fell between September 2014 and March 2015 and related to odour. Application of cover material, drying out of wet organic material, closing facility doors, floor washing, daily removal of waste from within the baling facility and use of a probiotic within the misting system addressed these issues.
5.3 SOLID WASTE QUANTITIES
A total of 20,183.36 t of waste (including VENM) was received into the landfill for the reporting period.
The total waste landfilled for licensing purposes was 11,205.01 t. This is below the maximum limit set under Licence Condition L5.1 (65,000 t).

ANNUAL ENVIRONMENTAL MONITORING REPORT ORRRC – 1 JULY 2014 TO 30 JUNE 2015
ORANGE CITY COUNCIL
PAGE 17 298047_AEMR_14-15B.DOCX
5.4 WASTE COMPACTION AND DIVERSION
The rate of waste compaction was 1.00 t/m3, which was above the requirement of 0.65 t/m3.
In the reporting period, approximately 57% of waste material was diverted for recycling or on-site landfill operational purposes.

ANNUAL ENVIRONMENTAL MONITORING REPORT ORRRC – 1 JULY 2014 TO 30 JUNE 2015
ORANGE CITY COUNCIL
PAGE 18 298047_AEMR_14-15B.DOCX
6.0 CONCLUSION AND RECOMMENDATIONS
6.1 CONCLUSION
The results of the groundwater and surface water monitoring sampling indicated some minor fluctuations in the conditions at the Ophir Road Resource Recovery Centre. While a limited number of historical ranges and LEMP provisional limits were exceeded, no adverse trends were observed.
No landfill gas was detected accumulated within buildings located within 250 metres of deposited waste during the reporting period.
The total waste landfilled for licensing purposes was 11,205.01 t. This is below the limit set under Licence Condition L5.1. The rate of waste compaction was above the licencing requirement.
6.2 RECOMMENDATIONS
It is recommended that environmental monitoring be continued at the Ophir Road Resource Recovery Centre in accordance with existing monitoring requirements of EPL 5956 and the Ophir Road Waste Management Facility LEMP.
ANNUAL ENVIRONMENTAL MONITORING REPORT ORRRC – 1 JULY 2014 TO 30 JUNE 2015
ORANGE CITY COUNCIL
PAGE 19 298047_AEMR_14-15B.DOCX
7.0 REFERENCES Australia and New Zealand Environment and Conservation Council and the Agriculture and Resource Management Council of Australia and New Zealand (ANZECC & ARMCANZ) 2000, Australian and New Zealand Guidelines for Fresh and Marine Water Quality.
Geolyse Pty Ltd 2013, Landfill Environmental Management Plan - Ophir Road Resource Recovery Centre. Report prepared for Orange City Council.
Markwick, G 2007, ‘Water requirements for sheep and cattle’, Primefact 326, New South Wales Department of Primary Industries, Australia.
National Health and Medical Research Council and the Natural Resource Management Ministerial Council (NHMRC & NRMMC) 2011, National Water Quality Management Strategy: Australian Drinking Water Guidelines. Updated 2015

Appendix A MONITORING DATA

Ophir Road Resource Recovery Centre
Environmental Monitoring
Piezometer Details: Definitions:
Piezometer Elevation: Elevation of the top of the piezometer casing in mAHD.Piezometer All elevations are measured to the same datum, hence piezo GWL's are
Elevation, mAHD relative to each other.
BH1 841.66 GWL: Elevation of groundwater at the piezometer in mAHD.
BH1A 841.68 Measured: Depth of groundwater measured from the top of the piezometer casing.
BH2 843.51 NMWL: No measureable water level.
BH2A 843.53 Note: Piezometer survey conducted 16/01/15
BH3 869.69
BH4 847.17
BH5 835.85
BH6 834.90
BH7 840.89
BH7A 840.93
MeasuredGWL
(m RL)Measured
GWL
(m RL)Measured
GWL
(m RL)Measured
GWL
(m RL)Measured
GWL
(m RL)Measured
GWL
(m RL)
23-Dec-97 838.99 839.04 840.22 839.09 848.24 845.35
18-Mar-98 2.80 838.86 2.85 838.82 2.84 840.67 4.18 839.36 21.57 848.12 2.75 844.42
27-Apr-98 2.70 838.96 2.63 839.05 2.77 840.74 3.62 839.91 21.61 848.08 2.64 844.53
29-May-98 2.68 838.98 2.63 839.05 3.05 840.46 4.15 839.38 21.60 848.09 2.18 844.99
30-Jun-98 1.42 840.24 1.38 840.30 2.85 840.66 3.34 840.19 21.55 848.14 1.70 845.47
30-Jul-98 0.68 840.98 0.80 840.88 2.76 840.75 3.02 840.51 20.20 849.49 0.68 846.49
31-Aug-98 1.03 840.63 1.09 840.59 3.00 840.51 3.62 839.91 8.65 861.04 0.64 846.53
25-Sep-98 0.87 840.79 0.75 840.93 2.85 840.66 3.21 840.32 10.82 858.87 0.52 846.65
30-Oct-98 1.11 840.55 1.16 840.52 2.90 840.61 3.20 840.33 13.07 856.62 0.71 846.46
30-Nov-98 1.38 840.28 1.40 840.28 3.09 840.42 3.94 839.59 15.03 854.66 1.02 846.15
17-Dec-98 1.60 840.06 1.69 839.99 2.88 840.63 3.66 839.87 16.12 853.57 1.19 845.98
29-Jan-99 2.14 839.52 2.15 839.53 2.88 840.63 3.45 840.08 18.64 851.05 1.58 845.59
28-Feb-99 2.39 839.27 2.36 839.32 3.08 840.43 4.05 839.48 19.92 849.77 1.90 845.27
16-Mar-99 2.50 839.16 2.46 839.22 3.07 840.44 3.90 839.63 20.53 849.16 2.09 845.08
30-Apr-99 2.42 839.24 2.40 839.28 3.04 840.47 4.09 839.44 21.05 848.64 1.99 845.18
30-May-99 2.42 839.24 2.39 839.29 3.08 840.43 4.10 839.43 21.14 848.55 2.23 844.94
28-Jun-99 2.46 839.20 2.42 839.26 3.14 840.37 4.00 839.53 21.19 848.50 2.20 844.97
30-Jul-99 2.44 839.22 2.41 839.27 3.15 840.36 3.94 839.59 21.28 848.41 2.08 845.09
26-Aug-99 1.99 839.67 1.99 839.69 3.09 840.42 3.56 839.97 21.21 848.48 1.85 845.32
30-Sep-99 1.91 839.75 1.92 839.76 3.12 840.39 3.63 839.90 21.26 848.43 1.62 845.55
29-Oct-99 1.20 840.46 1.21 840.47 2.99 840.52 3.36 840.17 20.80 848.89 1.10 846.07
30-Nov-99 1.41 840.25 1.56 840.12 3.24 840.27 3.77 839.76 16.83 852.86 1.36 845.81
20-Dec-99 1.88 839.79 1.88 839.80 3.17 840.34 3.73 839.80 17.75 851.94 1.35 845.82
28-Jan-00 1.87 839.79 1.84 839.84 2.88 840.63 3.61 839.92 19.73 849.96 1.55 845.62
17-Feb-00 2.22 839.44 2.23 839.45 3.08 840.43 3.9 839.63 20.45 849.24 1.72 845.45
27-Mar-00 2.14 839.52 2.12 839.56 2.85 840.66 3.34 840.19 21.01 848.68 1.55 845.62
19-Apr-00 2.09 839.57 2.08 839.60 2.89 840.62 3.46 840.07 21.07 848.62 1.45 845.72
26-May-00 1.93 839.73 1.88 839.80 2.83 840.68 3.28 840.25 20.75 848.94 1.43 845.74
3-Jul-00 1.28 840.38 1.33 840.35 2.86 840.65 3.18 840.35 22.00 847.69 1.06 846.11
31-Jul-00 0.93 840.73 1.33 840.35 2.86 840.65 3.18 840.35 22.00 847.69 1.06 846.11
19-Sep-00 1.22 840.44 1.20 840.48 2.90 840.61 3.50 840.03 21.27 848.42 0.88 846.29
30-Oct-00 2.03 839.63 2.13 839.55 3.30 840.21 3.74 839.79 14.34 855.35 1.05 846.12
29-Nov-00 1.13 840.53 1.20 840.48 3.15 840.36 3.45 840.08 13.64 856.05 0.83 846.34
20-Dec-00 1.62 840.04 1.70 839.98 5.13 838.38 4.05 839.48 13.9 855.79 1.10 846.07
24-Jan-01 1.87 839.79 1.88 839.80 2.86 840.65 3.71 839.82 16.57 853.12 1.25 845.92
15-Feb-01 2.15 839.51 2.13 839.55 3.02 840.49 3.86 839.67 16.73 852.96 1.54 845.63
22-Mar-01 2.13 839.53 1.97 839.71 3.07 840.44 19.44 850.25 1.50 845.67
24-Apr-01 2.15 839.51 2.13 839.55 3.21 840.30 20.73 848.96 1.75 845.42
23-May-01 2.28 839.38 2.23 839.45 3.34 840.17 20.94 848.75 1.82 845.35
6-Jun-01 2.47 839.19 2.38 839.30 3.48 840.03 21.05 848.64 1.95 845.22
28-Jul-01 2.05 839.61 2.02 839.66 3.00 840.51 21.14 848.55 1.62 845.55
23-Aug-01 2.25 839.41 2.18 839.50 4.18 839.33 21.20 848.49 1.72 845.45
19-Sep-01 1.60 840.06 1.52 840.16 4.20 839.31 5.20 838.33 20.70 848.99 1.20 845.97
4-Oct-01 1.85 839.81 1.80 839.88 4.20 839.31 20.40 849.29 1.41 845.76
4-Nov-01 2.11 839.55 2.10 839.58 4.22 839.29 20.69 849.00 1.64 845.53
17-Dec-01 2.34 839.32 2.33 839.35 4.22 839.29 20.96 848.73 1.86 845.31
23-Jan-02 2.49 839.17 2.47 839.21 4.17 839.34 21.13 848.56 2.03 845.14
27-Feb-02 2.23 839.43 2.22 839.46 3.99 839.52 21.09 848.60 1.52 845.65
13-Mar-02 2.37 839.29 2.36 839.32 4.06 839.45 20.61 849.08 1.67 845.5
12-Apr-02 2.45 839.21 2.43 839.25 4.07 839.44 20.57 849.12 1.9 845.27
23-May-02 2.44 839.22 2.4 839.28 4.03 839.48 20.96 848.73 2.06 845.11
17-Jun-02 2.56 839.10 2.41 839.27 3.80 839.71 21.07 848.62 1.94 845.23
16-Jul-02 2.48 839.18 2.43 839.25 4.10 839.41 21.18 848.51 2.02 845.15
28-Aug-02 2.56 839.10 2.54 839.14 4.26 839.25 21.25 848.44 2.35 844.82
16-Sep-02 2.58 839.08 2.62 839.06 4.30 839.21 21.25 848.44 2.25 844.92
29-Oct-02 2.70 838.96 2.65 839.03 4.35 839.16 21.35 848.34 2.60 844.57
11-Nov-02 2.76 838.90 2.7 838.98 4.36 839.15 21.41 848.28 2.71 844.46
3-Dec-02 2.88 838.78 2.78 838.90 4.35 839.16 21.40 848.29 2.83 844.34
28-Jan-03 2.97 838.69 2.91 838.77 4.24 839.27 21.43 848.26 3.03 844.14
20-Feb-03 2.84 838.82 2.75 838.93 4.38 839.13 21.38 848.31 2.79 844.38
24-Mar-03 2.9 838.76 3.01 838.67 3.95 839.56 21.48 848.21 2.78 844.39
24-Apr-03 2.93 838.73 2.98 838.70 3.98 839.53 21.57 848.12 2.8 844.37
21-May-03 2.83 838.83 2.77 838.91 3.92 839.59 21.51 848.18 3.08 844.09
4-Jun-03 2.85 838.81 2.71 838.97 3.86 839.65 21.52 848.17 3.04 844.13
29-Jul-03 2.64 839.02 2.57 839.11 3.87 839.64 4.70 838.83 21.53 848.16 2.41 844.76
22-Aug-03 2.62 839.04 2.6 839.08 3.86 839.65 4.70 838.83 21.64 848.05 2.45 844.72
30-Sep-03 2.49 839.17 2.67 839.01 4.08 839.43 4.91 838.62 21.15 848.54 2.04 845.13
31-Oct-03 2.42 839.24 2.41 839.27 4.17 839.34 4.98 838.55 20.99 848.70 1.85 845.32
27-Nov-03 2.58 839.08 2.55 839.13 4.20 839.31 5.02 838.51 21.08 848.61 2.72 844.45
22-Dec-03 2.56 839.10 2.52 839.16 4.10 839.41 4.95 838.58 21.19 848.50 2.19 844.98
6-Jan-04 2.8 838.86 2.74 838.94 4.20 839.31 5.06 838.47 21.17 848.52 2.16 845.01
19-Feb-04 2.94 838.72 2.89 838.79 4.13 839.38 5.10 838.43 21.37 848.32 2.83 844.34
TABLE A1 - GROUNDWATER LEVEL MEASUREMENTS
BH4
Date
BH1 BH1A BH2 BH2A BH3
Geolyse Pty Ltd

Ophir Road Resource Recovery Centre
Environmental Monitoring
Piezometer Details: Definitions:
Piezometer Elevation: Elevation of the top of the piezometer casing in mAHD.Piezometer All elevations are measured to the same datum, hence piezo GWL's are
Elevation, mAHD relative to each other.
BH1 841.66 GWL: Elevation of groundwater at the piezometer in mAHD.
BH1A 841.68 Measured: Depth of groundwater measured from the top of the piezometer casing.
BH2 843.51 NMWL: No measureable water level.
BH2A 843.53 Note: Piezometer survey conducted 16/01/15
BH3 869.69
BH4 847.17
BH5 835.85
BH6 834.90
BH7 840.89
BH7A 840.93
MeasuredGWL
(m RL)Measured
GWL
(m RL)Measured
GWL
(m RL)Measured
GWL
(m RL)Measured
GWL
(m RL)Measured
GWL
(m RL)
TABLE A1 - GROUNDWATER LEVEL MEASUREMENTS
BH4
Date
BH1 BH1A BH2 BH2A BH3
17-Mar-04 2.99 838.67 2.86 838.82 4.25 839.26 5.09 838.44 21.44 848.25 2.87 844.3
22-Apr-04 3.01 838.65 2.9 838.78 4.27 839.24 5.14 838.39 21.51 848.18 2.9 844.27
12-May-04 2.97 838.69 2.89 838.79 4.07 839.44 5.08 838.45 21.52 848.17 3.32 843.85
15-Jun-04 2.87 838.79 2.75 838.93 4.07 839.44 5.08 838.45 21.54 848.15 3.06 844.11
29-Sep-04 2.54 839.12 2.51 839.17 4.28 839.23 4.95 838.58 21.43 848.26 1.89 845.28
21-Dec-04 2.68 838.98 2.67 839.01 4.23 839.28 21.32 848.37 2.00 845.17
3-Mar-05 3.04 838.62 2.91 838.77 4.11 839.40 5.10 838.43 21.51 848.18 2.57 844.6
8-Jun-05 2.97 838.69 2.89 838.79 4.24 839.27 21.59 848.10 3.48 843.69
13-Sep-05 1.88 839.78 1.87 839.81 3.68 839.83 4.42 839.11 21.51 848.18 1.53 845.64
21-Dec-05 2.23 839.43 2.14 839.54 4.09 839.42 4.98 838.55 20.05 849.64 2.56 844.61
14-Mar-06 2.6 839.06 2.54 839.14 4.10 839.41 5.03 838.50 20.96 848.73 1.94 845.23
14-Jun-06 2.78 838.88 2.66 839.02 4.22 839.29 5.03 838.50 21.31 848.38 2.92 844.25
6-Sep-06 2.79 838.87 2.61 839.07 4.34 839.17 21.47 848.22 3.02 844.15
10-Dec-06 3.05 838.61 2.93 838.75 4.45 839.06 5.20 838.33 21.60 848.09 3.69 843.48
13-Mar-07 2.99 838.67 2.85 838.83 4.51 839.00 21.64 848.05 3.90 843.27
18-Jun-07 2.94 838.72 2.8 838.88 4.25 839.26 21.69 848.00 3.58 843.59
10-Sep-07 2.82 838.84 2.7 838.98 4.42 839.09 21.71 847.98 2.51 844.66
11-Dec-07 2.85 838.81 2.81 838.87 4.48 839.03 5.10 838.43 21.76 847.93 3.20 843.97
12-Mar-08 2.95 838.71 2.84 838.84 4.38 839.13 21.77 847.92 3.38 843.79
23-Jun-08 2.97 838.69 2.86 838.82 4.51 839.00 5.21 838.32 21.76 847.93 3.61 843.56
10-Sep-08 2.94 838.72 2.83 838.85 4.48 839.03 21.75 847.94 3.55 843.62
11-Dec-08 2.7 838.96 2.66 839.02 4.64 838.87 5.06 838.47 21.62 848.07 2.76 844.41
10-Mar-09 2.9 838.76 2.85 838.83 4.58 838.93 5.20 838.33 21.59 848.10 3.09 844.08
10-Jun-09 2.68 838.98 2.73 838.95 4.39 839.12 21.75 847.94 3.62 843.55
16-Sep-09 2.93 838.73 2.81 838.87 4.69 838.82 21.76 847.93 3.60 843.57
7-Dec-09 3.11 838.55 3.01 838.67 4.78 838.73 5.25 838.28 21.78 847.91 4.02 843.15
2-Mar-10 2.97 838.69 2.85 838.83 4.60 838.91 21.82 847.87 3.60 843.57
22-Jun-10 2.79 838.87 2.69 838.99 4.54 838.97 21.92 847.77 2.94 844.23
1-Sep-10 1.41 840.25 1.23 840.45 4.38 839.13 4.38 839.15 21.14 848.55 1.25 845.92
8-Dec-10 1.03 840.63 0.94 840.74 3.92 839.59 3.96 839.57 19.67 850.02 0.97 846.20
8-Mar-11 2.14 839.52 2.15 839.53 4.40 839.11 18.85 850.84 1.92 845.25
21-Jun-11 2.29 839.37 2.30 839.38 4.44 839.07 21.01 848.68 2.13 845.04
28-Sep-11 2.14 839.52 2.17 839.51 4.64 838.87 5.02 838.51 21.16 848.53 2.96 844.21
7-Dec-11 2.12 839.54 2.05 839.63 4.51 839.00 21.14 848.55 1.83 845.34
19-Mar-12 1.54 840.12 1.42 840.26 4.33 839.18 5.12 838.41 19.31 850.38 2.76 844.41
14-Jun-12 2.23 839.43 2.16 839.52 4.49 839.02 5.17 838.36 20.56 849.13 2.42 844.75
12-Sep-12 1.89 839.77 1.90 839.78 4.67 838.84 4.95 838.58 20.53 849.16 1.77 845.40
5-Mar-13 2.22 839.44 2.33 839.35 4.35 839.16 5.05 838.48 21.26 848.43 2.78 844.39
3-Sep-13 2.54 839.12 2.46 839.22 4.62 838.89 5.13 838.40 21.33 848.36 2.73 844.44
17-Mar-14 2.62 839.04 2.59 839.09 4.30 839.21 5.10 838.43 21.51 848.18 3.47 843.70
18-Sep-14 2.44 839.22 2.43 839.25 4.58 838.93 4.94 838.59 21.43 848.26 2.15 845.02
1-Jan-15 838.82 838.88 838.87 838.58 848.17 843.72
9-Mar-15 2.57 839.09 2.51 839.17 4.46 839.05 4.96 838.57 21.42 848.27 3.10 844.07
Note:
Monitoring station BH2A was unable to be accessed on 22-Mar-01, 24-Apr-01, 23-May-01, 6-Jun-01 and 28-Jul-01.
Geolyse Pty Ltd

Ophir Road Resource Recovery Centre
Environmental Monitoring
Leachate
BH1 BH1A BH2 BH3 BH4 L2 SW3 SW4
(Previously L1)
9001
Di H2O
9003
(BH2)
Temperature (field) oC 385 13.8 12.8 15.2 16 14.1 10.2 Nil discharge Nil discharge
pH (lab) pH units 6.5-8.53,4, 7.0-9.05 7.43 7.48 7.77 7.98 7.73 7.82 6.91 7.74
pH (field) pH units 7.23 7.63 6.84 7.68 6.96 7.43
Electrical Cond. (lab) µS/cm 47004, 6300³ 251 224 2020 686 3200 2200 12 2020
Electrical Cond. (field) µS/cm 280 280 1554 740 2164 1785
Total Alkalinity mg/L 113 97 443 292 775 504 3 442
Ammonia - N mg/L 1¹,², 505 0.03 0.09 1.24 0.03 0.04 9.25 <0.01 1.25
Chloride mg/L 3 5 312 8 563 365 3 314
Fluoride mg/L 23,4, 205 0.2 0.2 0.1 0.2 <0.1 0.2 <0.1 0.1
Sulphate mg/L <10003,4, 1005 2 2 135 21 83 31 <1 140
Calcium mg/L <10003,4 18 11 156 49 276 112 <1 160
Iron mg/L 1005 0.06 0.34 0.56 <0.05 <0.05 0.51 <0.05 0.53
Magnesium mg/L 14 12 103 34 255 92 <1 106
Potassium mg/L <1 <1 5 9 2 40 <1 6
Sodium mg/L 11 13 94 29 27 153 2 98
Manganese mg/L 105 0.002 0.252 0.232 0.006 0.141 1.73 <0.001 0.227
Nitrate - N mg/L 10¹·² 0.42 0.08 0.1 4.36 0.02 3.64 0.01 0.02
Total Phenols mg/L 0.1¹·²
, 105 <0.05 <0.05 <0.05 <0.05 <0.05 <0.05 <0.05 <0.05
Total Organic Carbon mg/L 1 10 6 <1 16 27 <1 6
Total Dissolved Solids mg/L 190 149 1110 363 2060 <10 1120
BTEX Benzene mg/L 0.001¹ <0.001 <0.001 <0.001 <0.001 <0.001 <0.001 <1 <1
Ethylbenzene mg/L 0.05¹ <0.002 <0.002 <0.002 <0.002 <0.002 <0.002 <2 <2
Xylene mg/L 0.05¹ <0.002 <0.002 <0.002 <0.002 <0.002 <0.002 <2 <2
Toluene mg/L 0.05¹ <0.002 <0.002 <0.002 <0.002 <0.002 <0.002 <2 <2
BOD mg/L <2¹
Phosphate mg/L 3¹ 0.02 0.02 0.08 0.02 0.04 <0.01 <0.01
Hexavalent Cr, Cr6+ mg/L 0.001¹
Aluminium mg/L 53,4, 1005 0.08 0.08 0.01 <0.01 <0.01 <0.01 <0.01
Arsenic mg/L 0.007¹, 0.53,4, 15
Barium mg/L 0.05¹
Cadmium mg/L 0.004¹, 0.013,4, 25
Chromium mg/L 0.001¹, 13,4, 55
Cobalt mg/L 0.02¹, 13,4, 55
Coppermg/L
0.015¹, 0.5³(ex.pigs),
54(inc.pigs), 55 0.001 0.004 0.002 0.002 0.002 0.001 0.002
Lead mg/L 0.01¹, 0.13,4, 25
Nickel mg/L
Zinc mg/L 0.006 <0.005 0.006 0.01 0.007 <0.005 0.005
TPH (C6 - C9) mg/L <0.02 <0.02 1.5 <0.02 0.31 <20 1640
(C10 - C14) mg/L <0.05 <0.05 <0.05 <0.05 0.08 <50 <50
(C15 - C28) mg/L <0.1 <0.1 <0.1 <0.1 0.45 <100 140
(C29 - C36) mg/L <0.05 <0.05 <0.05 <0.05 <0.05 <50 <50
TPH (C6 - C36) mg/L 0.1¹ <0.05 <0.05 1.5 <0.05 0.84 <50 140
TRHs- NEPM 2010 Draft
C6-C10 mg/L <0.02 <0.02 1.55 <0.02 0.32 <20 1700
>C10-C16 mg/L <0.1 <0.1 <0.1 <0.1 <0.11 <100 <100
>C16-C34 mg/L <0.1 <0.1 <0.1 <0.1 0.45 <100 140
>C34-C40 mg/L <0.1 <0.1 <0.1 <0.1 <0.1 <100 <100
>C10-C40 sum mg/L <0.1 <0.1 <0.1 <0.1 0.56 <100 140
Mercury mg/L 0.001¹, 0.0023,4, 0.025
OCP's mg/L 0.001¹
OPP's mg/L 0.001¹
PAH's mg/L 1¹
PCB's mg/L 0.001¹
Notes:
¹ LEMP provisional limit for groundwater
² LEMP provisional limit for leachate and surface water
³ Maximum guideline limit for livestock (dairy & beef cattle, horses, pigs & sheep) drinking water with no long-term loss of production (ANZECC & ARMCANZ, 2000) 4 Maximum guideline limit for poultry drinking water with no long-term loss of production (ANZECC & ARMCANZ, 2000)
5 Trade waste limit (Samra & McLean, 2005)
** Values indicated in bold face text exceed the provisional limit
TPH=Total Petroleum Hydrocarbons
TRH= Total Recoverable Hydrocarbons
OCP=Organochlorine Pesticides
OPP=Organophophorous Pesticides
PAH=Polynuclear Aromatic Hydrocarbons
PCB=Polychlorinated Biphenyls
TABLE A2 - RESULTS OF LABORATORY ANALYSIS - SEPTEMBER 2014
Analyte UnitsProv.
Limit
Groundwater Boreholes Surface Water QA/QC
298047
Geolyse Pty Ltd

Ophir Road Resource Recovery Centre
Environmental Monitoring
Leachate
BH1 BH1A BH2 BH3 BH4 BH5 BH6 BH7 BH7a L2 SW3 SW4
(Previously L1)
9001
Di H2O
9003
(BH3)
Temperature (field) oC 38517.0 16.7 16.6 17.4 18.9 16.2 20.8 18.5
pH (lab) pH units 6.5-8.53,4, 7.0-9.057.18 7.28 7.11 7.81 7.25 7.31 7.5 7.95 7.48 6.52 7.85
pH (field) pH units 7.52 6.62 7.49 10.44 7.24 8.59 8.41 6.92
Electrical Cond. (lab) µS/cm 47004, 6300³ 246 249 2170 672 3130 1690 468 885 1730 12 673
Electrical Cond. (field) µS/cm
Total Alkalinity mg/L 125 127 533 348 854 758 178 73 451 2 346
Ammonia - N mg/L 1¹,², 505
0.15 0.08 3.25 0.03 0.03 0.05 0.02 0.76 10.8 0.02 0.02
Chloride mg/L 8 7 420 10 640 170 11 41 224 2 10
Fluoride mg/L 23,4, 2050.2 0.2 0.1 0.2 0.1 0.1 0.1 0.3 0.4 <0.1 0.2
Sulphate mg/L <10003,4, 10051 2 88 14 82 12 41 297 30 <1 15
Calcium mg/L <10003,416 17 195 33 281 118 42 66 72 <1 68
Iron mg/L 10050.62 0.65 4.93 <0.05 <0.05 <0.05 <0.05 <0.05 0.99 <0.05 <0.05
Magnesium mg/L 16 15 118 41 261 150 31 23 61 <1 41
Potassium mg/L <1 <1 8 11 2 4 <1 6 28 <1 11
Sodium mg/L 14 14 92 30 27 50 14 98 95 2 30
Manganese mg/L 1050.442 0.438 0.768 0.117 0.141 0.198 <0.001 0.081 5.53 <0.001 0.116
Nitrate - N mg/L 10¹·² 0.02 0.03 0.03 3.61 0.04 0.14 6.5 0.11 0.14 <0.01 3.49
Total Phenols mg/L 0.1¹·²
, 105<0.05 <0.05 <0.05 <0.05 <0.05 <0.05 <0.05 <0.05 <0.05 <0.05 <0.05
Total Organic Carbon mg/L 6 5 14 4 16 16 1 4 23 2 4
Total Dissolved Solids mg/L 166 168 950 390 1730 916 842 544 18 392
BTEX Benzene mg/L 0.001¹ <0.001 <0.001 0.002 <0.001 0.001 <0.001 <0.001 <0.001 <0.001 <0.001
Ethylbenzene mg/L 0.05¹ <0.002 <0.002 <0.002 <0.002 <0.002 <0.002 <0.002 <0.002 <0.002 <0.002
Xylene mg/L 0.05¹ <0.002 <0.002 <0.002 <0.002 <0.002 <0.002 <0.002 <0.002 <0.002 <0.002
Toluene mg/L 0.05¹ <0.002 <0.002 <0.002 <0.002 <0.002 <0.002 <0.002 <0.002 <0.002 <0.002
BOD mg/L <2¹
Phosphate mg/L 3¹ 0.04 0.03 <0.01 <0.01 0.06 0.03 0.06 0.02 0.03 <0.01
Hexavalent Cr, Cr6+ mg/L 0.001¹
Aluminium mg/L 53,4, 10050.01 0.01 <0.01 <0.01 <0.01 <0.01 0.02 0.02 <0.01 <0.01
Arsenic mg/L 0.007¹, 0.53,4, 15
Barium mg/L 0.05¹
Boron mg/L <0.05 <0.05 10.4 0.100 5.690 0.440 <0.05 0.660 0.16 <0.05
Cadmium mg/L 0.004¹, 0.013,4, 25
Chromium mg/L 0.001¹, 13,4, 55
Cobalt mg/L 0.02¹, 13,4, 55
Coppermg/L
0.015¹, 0.5³(ex.pigs),
54(inc.pigs), 55 0.004 0.002 <0.001 0.002 0.001 0.009 <0.001 <0.001 0.002 0.002
Lead mg/L 0.01¹, 0.13,4, 25
Nickel mg/L
Zinc mg/L 0.129 0.124 <0.005 0.019 <0.005 0.016 <0.005 <0.005 <0.005 0.016
TPH (C6 - C9) mg/L <0.02 <0.02 2.07 <0.02 0.15 <0.02 <0.02 <0.02 <0.02 <0.02
(C10 - C14) mg/L <0.05 <0.05 <0.05 <0.05 <0.05 <0.05 <0.05 <0.05 <0.05 <0.05
(C15 - C28) mg/L <0.1 <0.1 <0.1 <0.1 <0.1 <0.1 <0.1 <0.1 <0.1 <0.1
(C29 - C36) mg/L <0.05 <0.05 <0.05 <0.05 <0.05 <0.05 <0.05 <0.05 <0.05 <0.05
TPH (C10 - C36) mg/L 0.1¹ <0.05 <0.05 2.07 <0.05 0.15 <0.05 <0.05 <0.05 <0.05 <0.05
TRHs- NEPM 2013
C6-C10 mg/L <0.02 <0.02 2.09 <0.02 0.15 <0.02 <0.02 <0.02 <0.02 <0.02
>C10-C16 mg/L <0.1 <0.1 <0.1 <0.1 <0.1 <0.1 <0.1 <0.1 <0.1 <0.1
>C16-C34 mg/L <0.1 <0.1 <0.1 <0.1 <0.1 <0.1 <0.1 <0.1 <0.1 <0.1
>C34-C40 mg/L <0.1 <0.1 <0.1 <0.1 <0.1 <0.1 <0.1 <0.1 <0.1 <0.1
>C10-C40 sum mg/L <0.1 <0.1 <0.1 <0.1 <0.1 <0.1 <0.1 <0.1 <0.1 <0.1
Mercury mg/L 0.001¹, 0.0023,4, 0.025
OCP's mg/L 0.001¹
OPP's mg/L 0.001¹
PAH's mg/L 1¹
PCB's mg/L 0.001¹
Notes:
¹ LEMP provisional limit for groundwater
² LEMP provisional limit for leachate and surface water
³ Maximum guideline limit for livestock (dairy & beef cattle, horses, pigs & sheep) drinking water with no long-term loss of production (ANZECC & ARMCANZ, 2000) 4 Maximum guideline limit for poultry drinking water with no long-term loss of production (ANZECC & ARMCANZ, 2000)
5 Trade waste limit (Samra & McLean, 2005)
** Values indicated in bold face text exceed the provisional limit
TPH=Total Petroleum Hydrocarbons
TRH= Total Recoverable Hydrocarbons
OCP=Organochlorine Pesticides
OPP=Organophophorous Pesticides
PAH=Polynuclear Aromatic Hydrocarbons
PCB=Polychlorinated Biphenyls
TABLE A3 - RESULTS OF LABORATORY ANALYSIS - MARCH 2015
Analyte UnitsProv.
Limit
Groundwater Boreholes Surface Water QA/QC
298047
Geolyse Pty Ltd

Ophir Road Resource Recovery Centre
Environmental Monitoring
Leachate
BH1 BH1A BH2 BH3 BH4 L2 SW3 SW4
(Previously L1)
9001
Di H2O
9003
(BH2)
Temperature (field) oC 385 24 24.1
pH (lab) pH units 6.5-8.53,4, 7.0-9.05 7.74 7.74
pH (field) pH units 7.71 7.50
Electrical Cond. (lab) µS/cm 47004, 6300³ 934 1040
Electrical Cond. (field) µS/cm 1015 1192
Total Alkalinity mg/L 184 290
Ammonia - N mg/L 1¹,², 505 1.98 4.04
Chloride mg/L 78 118
Fluoride mg/L 23,4, 205 0.2 0.2
Sulphate mg/L <10003,4, 1005 130 46
Calcium mg/L <10003,4 63 37
Iron mg/L 1005 0.65 0.44
Magnesium mg/L 23 29
Potassium mg/L 33 54
Sodium mg/L 69 86
Manganese mg/L 105 0.328 1.05
Nitrate - N mg/L 10¹·² 2.19 0.9
Total Phenols mg/L 0.1¹·²
, 105 <0.05 <0.05
Total Organic Carbon mg/L 33 31
Total Dissolved Solids mg/L
BTEX Benzene mg/L 0.001¹
Ethylbenzene mg/L 0.05¹
Xylene mg/L 0.05¹
Toluene mg/L 0.05¹
BOD mg/L <2¹
Phosphate mg/L 3¹
Hexavalent Cr, Cr6+ mg/L 0.001¹
Aluminium mg/L 53,4, 1005
Arsenic mg/L 0.007¹, 0.53,4, 15
Barium mg/L 0.05¹
Cadmium mg/L 0.004¹, 0.013,4, 25
Chromium mg/L 0.001¹, 13,4, 55
Cobalt mg/L 0.02¹, 13,4, 55
Coppermg/L
0.015¹, 0.5³(ex.pigs),
54(inc.pigs), 55
Lead mg/L 0.01¹, 0.13,4, 25
Nickel mg/L
Zinc mg/L
TPH (C6 - C9) mg/L
(C10 - C14) mg/L
(C15 - C28) mg/L
(C29 - C36) mg/L
TPH (C6 - C36) mg/L 0.1¹
TRHs- NEPM 2010 Draft
C6-C10 mg/L
>C10-C16 mg/L
>C16-C34 mg/L
>C34-C40 mg/L
>C10-C40 sum mg/L
Mercury mg/L 0.001¹, 0.0023,4, 0.025
OCP's mg/L 0.001¹
OPP's mg/L 0.001¹
PAH's mg/L 1¹
PCB's mg/L 0.001¹
Notes:
¹ LEMP provisional limit for groundwater
² LEMP provisional limit for leachate and surface water
³ Maximum guideline limit for livestock (dairy & beef cattle, horses, pigs & sheep) drinking water with no long-term loss of production (ANZECC & ARMCANZ, 2000) 4 Maximum guideline limit for poultry drinking water with no long-term loss of production (ANZECC & ARMCANZ, 2000)
5 Trade waste limit (Samra & McLean, 2005)
** Values indicated in bold face text exceed the provisional limit
TPH=Total Petroleum Hydrocarbons
TRH= Total Recoverable Hydrocarbons
OCP=Organochlorine Pesticides
OPP=Organophophorous Pesticides
PAH=Polynuclear Aromatic Hydrocarbons
PCB=Polychlorinated Biphenyls
TABLE A4 - RESULTS OF LABORATORY ANALYSIS - FEBRUARY 2015
Analyte UnitsProv.
Limit
Groundwater Boreholes Surface Water QA/QC
298047
Geolyse Pty Ltd

Ophir Road Resource Recovery Centre
Environmental Monitoring
Leachate
BH1 BH1A BH2 BH3 BH4 BH5 BH6 BH7 BH7a L2 SW3 SW4
(Previously L1)
Temperature (field) oC 38515 12.9
pH (lab) pH units 6.5-8.53,4, 7.0-9.05 7.53 7.96
pH (field) pH units 7.82 8.26
Electrical Cond. (lab) µS/cm 44774, 59703
1050 580
Electrical Cond. (field) µS/cm 1175 682
Total Alkalinity mg/L 241 166
Ammonia - N mg/L 1¹,², 505
14.0 0.23
Chloride mg/L 81 83
Fluoride mg/L 23,4, 2050.2 0.2
Sulphate mg/L <10003,4, 1005157 7
Calcium mg/L <10003,462 12
Iron mg/L 10053.35 0.87
Magnesium mg/L 23 17
Potassium mg/L 38 27
Sodium mg/L 67 60
Manganese mg/L 1050.317 0.302
Nitrate - N mg/L 10¹·² 2.49 0.02
Total Phenols mg/L 0.1¹·²
, 105<0.05 <0.05
Total Organic Carbon mg/L 47 36
Notes:
¹ LEMP provisional limit for groundwater
² LEMP provisional limit for leachate and surface water
5 Trade waste limit (Samra & McLean, 2005)
** Values indicated in bold face text exceed a provisional limit
³ Maximum guideline limit for livestock (dairy & beef cattle, horses, pigs & sheep) drinking water with no long-term loss of production (ANZECC & ARMCANZ, 2000)
4 Maximum guideline limit for poultry drinking water with no long-term loss of production (ANZECC & ARMCANZ, 2000)
TABLE A5 - RESULTS OF LABORATORY ANALYSIS - APRIL 2015 -RAINFALL EVENT
Analyte UnitsProv.
Limit
Groundwater Boreholes Surface Water
298047
Geolyse Pty Ltd

Appendix B MONITORING REPORTS AND LABORATORY RESULTS

False
9 9.00False Environmental
CERTIFICATE OF ANALYSISWork Order : ES1421222 Page : 1 of 9
:: LaboratoryClient Environmental Division SydneyORANGE CITY COUNCIL
: :ContactContact KERRY FRAGAR Client Services
:: AddressAddress PO Box 35
ORANGE NSW 2800
277-289 Woodpark Road Smithfield NSW Australia 2164
:: E-mailE-mail [email protected] [email protected]
:: TelephoneTelephone 02 6393 8041 +61-2-8784 8555
:: FacsimileFacsimile 02 6393 8872 +61-2-8784 8500
:Project 298047 OPHIR LANDFILL QC Level : NEPM 2013 Schedule B(3) and ALS QCS3 requirement
:Order number ----
:C-O-C number ---- Date Samples Received : 19-SEP-2014
Sampler : KF Issue Date : 25-SEP-2014
Site : ----
9:No. of samples received
Quote number : SY/476/14 9:No. of samples analysed
This report supersedes any previous report(s) with this reference. Results apply to the sample(s) as submitted. All pages of this report have been checked and approved for
release.
This Certificate of Analysis contains the following information:
l General Comments
l Analytical Results
l Surrogate Control Limits
Environmental Division Sydney ABN 84 009 936 029 Part of the ALS Group An ALS Limited Company
Address 277-289 Woodpark Road Smithfield NSW Australia 2164 | PHONE +61-2-8784 8555 | Facsimile +61-2-8784 8500

2 of 9:Page
Work Order :
:Client
ES1421222
ORANGE CITY COUNCIL
298047 OPHIR LANDFILL:Project
General Comments
The analytical procedures used by the Environmental Division have been developed from established internationally recognized procedures such as those published by the USEPA, APHA, AS and NEPM. In house
developed procedures are employed in the absence of documented standards or by client request.
Where moisture determination has been performed, results are reported on a dry weight basis.
Where a reported less than (<) result is higher than the LOR, this may be due to primary sample extract/digestate dilution and/or insufficient sample for analysis.
Where the LOR of a reported result differs from standard LOR, this may be due to high moisture content, insufficient sample (reduced weight employed) or matrix interference.
When sampling time information is not provided by the client, sampling dates are shown without a time component. In these instances, the time component has been assumed by the laboratory for processing purposes.
Where a result is required to meet compliance limits the associated uncertainty must be considered. Refer to the ALS Contact for details.
CAS Number = CAS registry number from database maintained by Chemical Abstracts Services. The Chemical Abstracts Service is a division of the American Chemical Society.
LOR = Limit of reporting
^ = This result is computed from individual analyte detections at or above the level of reporting
Key :
This document has been electronically signed by the authorized signatories indicated below. Electronic signing has been carried out in
compliance with procedures specified in 21 CFR Part 11.
Signatories Accreditation CategoryPosition
Ankit Joshi Inorganic Chemist Sydney Inorganics
Ashesh Patel Inorganic Chemist Sydney Inorganics
Dian Dao Inorganic Chemist Sydney Inorganics
Phalak Inthakesone Laboratory Manager - Organics Sydney Organics
Sanjeshni Jyoti Senior Chemist Volatiles Sydney Organics
Shobhna Chandra Metals Coordinator Sydney Inorganics
NATA Accredited Laboratory 825
Accredited for compliance with
ISO/IEC 17025.
Signatories

3 of 9:Page
Work Order :
:Client
ES1421222
ORANGE CITY COUNCIL
298047 OPHIR LANDFILL:Project
Analytical Results
BH4BH3BH2BH1ABH1Client sample IDSub-Matrix: WATER (Matrix: WATER)
18-SEP-2014 13:3018-SEP-2014 09:0018-SEP-2014 12:0018-SEP-2014 11:0018-SEP-2014 10:00Client sampling date / time
ES1421222-005ES1421222-004ES1421222-003ES1421222-002ES1421222-001UnitLORCAS NumberCompound
EA005P: pH by PC Titrator
pH Value 7.487.43 7.77 7.98 7.73pH Unit0.01----
EA010P: Conductivity by PC Titrator
Electrical Conductivity @ 25°C 224251 2020 686 3200µS/cm1----
EA015: Total Dissolved Solids
Total Dissolved Solids @180°C 149190 1110 363 2060mg/L10----
ED037P: Alkalinity by PC Titrator
Hydroxide Alkalinity as CaCO3 <1<1 <1 <1 <1mg/L1DMO-210-001
Carbonate Alkalinity as CaCO3 <1<1 <1 <1 <1mg/L13812-32-6
Bicarbonate Alkalinity as CaCO3 97113 443 292 775mg/L171-52-3
Total Alkalinity as CaCO3 97113 443 292 775mg/L1----
ED041G: Sulfate (Turbidimetric) as SO4 2- by DA
Sulfate as SO4 - Turbidimetric 22 135 21 83mg/L114808-79-8
ED045G: Chloride Discrete analyser
Chloride 53 312 8 563mg/L116887-00-6
ED093F: Dissolved Major Cations
Calcium 1118 156 49 276mg/L17440-70-2
Magnesium 1214 103 34 255mg/L17439-95-4
Sodium 1311 94 29 27mg/L17440-23-5
Potassium <1<1 5 9 2mg/L17440-09-7
EG020F: Dissolved Metals by ICP-MS
Aluminium 0.080.08 0.01 <0.01 <0.01mg/L0.017429-90-5
Copper 0.0040.001 0.002 0.002 0.002mg/L0.0017440-50-8
Manganese 0.2520.002 0.232 0.006 0.141mg/L0.0017439-96-5
Zinc <0.0050.006 0.006 0.010 0.007mg/L0.0057440-66-6
Iron 0.340.06 0.56 <0.05 <0.05mg/L0.057439-89-6
EK040P: Fluoride by PC Titrator
Fluoride 0.20.2 0.1 0.2 <0.1mg/L0.116984-48-8
EK055G: Ammonia as N by Discrete Analyser
Ammonia as N 0.090.03 1.24 0.03 0.04mg/L0.017664-41-7
EK057G: Nitrite as N by Discrete Analyser
Nitrite as N <0.01<0.01 <0.01 <0.01 <0.01mg/L0.01----
EK058G: Nitrate as N by Discrete Analyser
Nitrate as N 0.080.42 0.10 4.36 0.02mg/L0.0114797-55-8

4 of 9:Page
Work Order :
:Client
ES1421222
ORANGE CITY COUNCIL
298047 OPHIR LANDFILL:Project
Analytical Results
BH4BH3BH2BH1ABH1Client sample IDSub-Matrix: WATER (Matrix: WATER)
18-SEP-2014 13:3018-SEP-2014 09:0018-SEP-2014 12:0018-SEP-2014 11:0018-SEP-2014 10:00Client sampling date / time
ES1421222-005ES1421222-004ES1421222-003ES1421222-002ES1421222-001UnitLORCAS NumberCompound
EK059G: Nitrite plus Nitrate as N (NOx) by Discrete Analyser
Nitrite + Nitrate as N 0.080.42 0.10 4.36 0.02mg/L0.01----
EK071G: Reactive Phosphorus as P by discrete analyser
Reactive Phosphorus as P 0.020.02 0.08 0.02 0.04mg/L0.0114265-44-2
EN055: Ionic Balance
Total Anions 2.122.38 20.5 6.50 33.1meq/L0.01----
Total Cations 2.102.53 20.5 6.74 36.0meq/L0.01----
Ionic Balance -------- 0.05 1.79 4.20%0.01----
EP005: Total Organic Carbon (TOC)
Total Organic Carbon 101 6 <1 16mg/L1----
EP035G: Total Phenol by Discrete Analyser
Phenols (Total) <0.05<0.05 <0.05 <0.05 <0.05mg/L0.05----
EP080/071: Total Petroleum Hydrocarbons
C6 - C9 Fraction <20<20 1500 <20 310µg/L20----
C10 - C14 Fraction <50<50 <50 <50 80µg/L50----
C15 - C28 Fraction <100<100 <100 <100 450µg/L100----
C29 - C36 Fraction <50<50 <50 <50 <50µg/L50----
^ C10 - C36 Fraction (sum) <50<50 <50 <50 530µg/L50----
EP080/071: Total Recoverable Hydrocarbons - NEPM 2013 Fractions
C6 - C10 Fraction <20<20 1550 <20 320µg/L20C6_C10
^ C6 - C10 Fraction minus BTEX
(F1)
<20<20 1550 <20 320µg/L20C6_C10-BTEX
>C10 - C16 Fraction <100<100 <100 <100 110µg/L100>C10_C16
>C16 - C34 Fraction <100<100 <100 <100 450µg/L100----
>C34 - C40 Fraction <100<100 <100 <100 <100µg/L100----
^ >C10 - C40 Fraction (sum) <100<100 <100 <100 560µg/L100----
^ >C10 - C16 Fraction minus Naphthalene
(F2)
<100<100 <100 <100 110µg/L100----
EP080: BTEXN
Benzene <1<1 <1 <1 <1µg/L171-43-2
Toluene <2<2 <2 <2 <2µg/L2108-88-3
Ethylbenzene <2<2 <2 <2 <2µg/L2100-41-4
meta- & para-Xylene <2<2 <2 <2 <2µg/L2108-38-3 106-42-3
ortho-Xylene <2<2 <2 <2 <2µg/L295-47-6
^ Total Xylenes <2<2 <2 <2 <2µg/L21330-20-7

5 of 9:Page
Work Order :
:Client
ES1421222
ORANGE CITY COUNCIL
298047 OPHIR LANDFILL:Project
Analytical Results
BH4BH3BH2BH1ABH1Client sample IDSub-Matrix: WATER (Matrix: WATER)
18-SEP-2014 13:3018-SEP-2014 09:0018-SEP-2014 12:0018-SEP-2014 11:0018-SEP-2014 10:00Client sampling date / time
ES1421222-005ES1421222-004ES1421222-003ES1421222-002ES1421222-001UnitLORCAS NumberCompound
EP080: BTEXN - Continued
^ Sum of BTEX <1<1 <1 <1 <1µg/L1----
Naphthalene <5<5 <5 <5 <5µg/L591-20-3
EP080S: TPH(V)/BTEX Surrogates
1.2-Dichloroethane-D4 92.195.7 98.5 86.5 91.3%0.117060-07-0
Toluene-D8 104106 103 98.2 102%0.12037-26-5
4-Bromofluorobenzene 94.1100 94.0 88.4 93.5%0.1460-00-4

6 of 9:Page
Work Order :
:Client
ES1421222
ORANGE CITY COUNCIL
298047 OPHIR LANDFILL:Project
Analytical Results
----L2TW1W9003W9001Client sample IDSub-Matrix: WATER (Matrix: WATER)
----18-SEP-2014 11:0018-SEP-2014 15:0018-SEP-2014 12:0018-SEP-2014 12:00Client sampling date / time
----ES1421222-009ES1421222-008ES1421222-007ES1421222-006UnitLORCAS NumberCompound
EA005P: pH by PC Titrator
pH Value 7.746.91 ---- 7.82 ----pH Unit0.01----
EA010P: Conductivity by PC Titrator
Electrical Conductivity @ 25°C 202012 ---- 2200 ----µS/cm1----
EA015: Total Dissolved Solids
Total Dissolved Solids @180°C 1120<10 ---- ---- ----mg/L10----
EA025: Suspended Solids
Suspended Solids (SS) -------- 1060 ---- ----mg/L5----
ED037P: Alkalinity by PC Titrator
Hydroxide Alkalinity as CaCO3 <1<1 ---- <1 ----mg/L1DMO-210-001
Carbonate Alkalinity as CaCO3 <1<1 ---- <1 ----mg/L13812-32-6
Bicarbonate Alkalinity as CaCO3 4423 ---- 504 ----mg/L171-52-3
Total Alkalinity as CaCO3 4423 ---- 504 ----mg/L1----
ED041G: Sulfate (Turbidimetric) as SO4 2- by DA
Sulfate as SO4 - Turbidimetric 140<1 ---- 31 ----mg/L114808-79-8
ED045G: Chloride Discrete analyser
Chloride 3143 ---- 365 ----mg/L116887-00-6
ED093F: Dissolved Major Cations
Calcium 160<1 ---- 112 ----mg/L17440-70-2
Magnesium 106<1 ---- 92 ----mg/L17439-95-4
Sodium 982 ---- 153 ----mg/L17440-23-5
Potassium 6<1 ---- 40 ----mg/L17440-09-7
EG020F: Dissolved Metals by ICP-MS
Aluminium <0.01<0.01 ---- ---- ----mg/L0.017429-90-5
Copper 0.0020.001 ---- ---- ----mg/L0.0017440-50-8
Manganese 0.227<0.001 ---- ---- ----mg/L0.0017439-96-5
Zinc 0.005<0.005 ---- ---- ----mg/L0.0057440-66-6
Iron 0.53<0.05 ---- ---- ----mg/L0.057439-89-6
EG020T: Total Metals by ICP-MS
Manganese -------- ---- 1.73 ----mg/L0.0017439-96-5
Iron -------- ---- 0.51 ----mg/L0.057439-89-6
EK040P: Fluoride by PC Titrator
Fluoride 0.1<0.1 ---- 0.2 ----mg/L0.116984-48-8
EK055G: Ammonia as N by Discrete Analyser

7 of 9:Page
Work Order :
:Client
ES1421222
ORANGE CITY COUNCIL
298047 OPHIR LANDFILL:Project
Analytical Results
----L2TW1W9003W9001Client sample IDSub-Matrix: WATER (Matrix: WATER)
----18-SEP-2014 11:0018-SEP-2014 15:0018-SEP-2014 12:0018-SEP-2014 12:00Client sampling date / time
----ES1421222-009ES1421222-008ES1421222-007ES1421222-006UnitLORCAS NumberCompound
EK055G: Ammonia as N by Discrete Analyser - Continued
Ammonia as N 1.25<0.01 ---- 9.25 ----mg/L0.017664-41-7
EK057G: Nitrite as N by Discrete Analyser
Nitrite as N 0.07<0.01 ---- 0.06 ----mg/L0.01----
EK058G: Nitrate as N by Discrete Analyser
Nitrate as N 0.020.01 ---- 3.64 ----mg/L0.0114797-55-8
EK059G: Nitrite plus Nitrate as N (NOx) by Discrete Analyser
Nitrite + Nitrate as N 0.090.01 ---- 3.70 ----mg/L0.01----
EK071G: Reactive Phosphorus as P by discrete analyser
Reactive Phosphorus as P <0.01<0.01 ---- ---- ----mg/L0.0114265-44-2
EN055: Ionic Balance
Total Anions 20.60.14 ---- 21.0 ----meq/L0.01----
Total Cations 21.10.09 ---- 20.8 ----meq/L0.01----
Ionic Balance 1.26---- ---- 0.41 ----%0.01----
EP005: Total Organic Carbon (TOC)
Total Organic Carbon 6<1 ---- 27 ----mg/L1----
EP020: Oil and Grease (O&G)
Oil & Grease -------- 62 ---- ----mg/L5----
EP035G: Total Phenol by Discrete Analyser
Phenols (Total) <0.05<0.05 ---- <0.05 ----mg/L0.05----
EP080/071: Total Petroleum Hydrocarbons
C6 - C9 Fraction 1640<20 <20 ---- ----µg/L20----
C10 - C14 Fraction <50<50 140 ---- ----µg/L50----
C15 - C28 Fraction 140<100 11600 ---- ----µg/L100----
C29 - C36 Fraction <50<50 8780 ---- ----µg/L50----
^ C10 - C36 Fraction (sum) 140<50 20500 ---- ----µg/L50----
EP080/071: Total Recoverable Hydrocarbons - NEPM 2013 Fractions
C6 - C10 Fraction 1700<20 <20 ---- ----µg/L20C6_C10
^ C6 - C10 Fraction minus BTEX
(F1)
1700<20 <20 ---- ----µg/L20C6_C10-BTEX
>C10 - C16 Fraction <100<100 690 ---- ----µg/L100>C10_C16
>C16 - C34 Fraction 140<100 16800 ---- ----µg/L100----
>C34 - C40 Fraction <100<100 7050 ---- ----µg/L100----
^ >C10 - C40 Fraction (sum) 140<100 24500 ---- ----µg/L100----
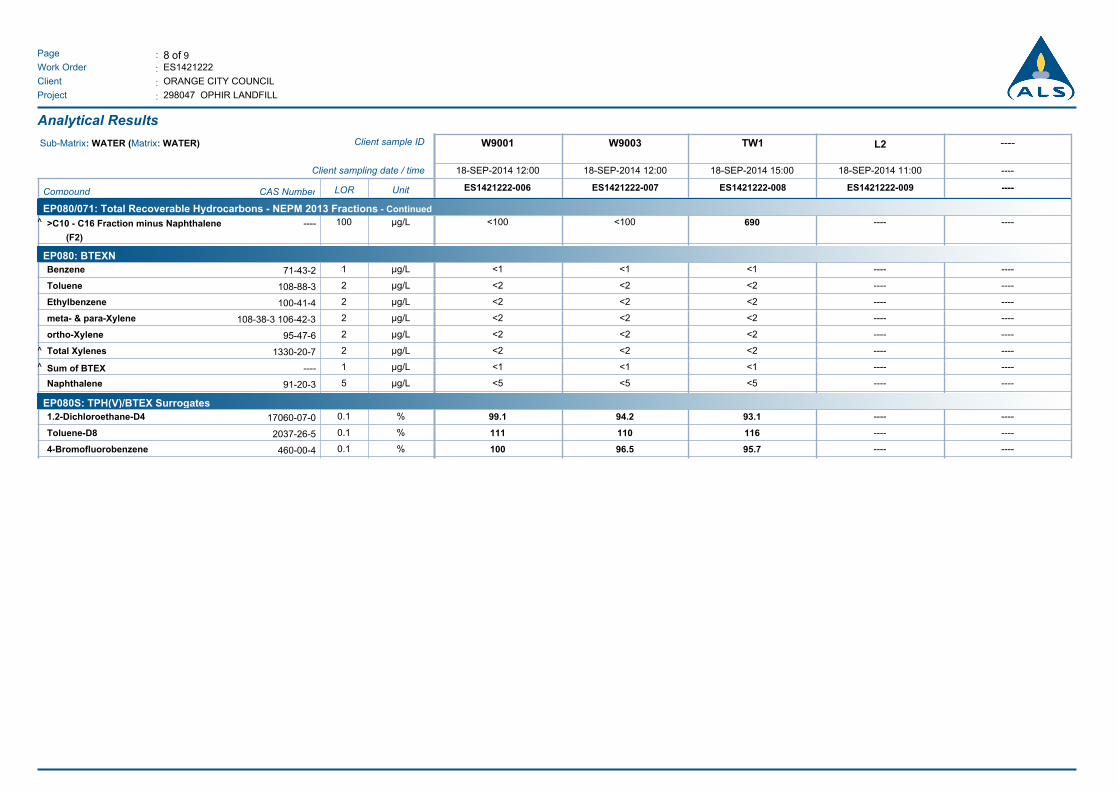
8 of 9:Page
Work Order :
:Client
ES1421222
ORANGE CITY COUNCIL
298047 OPHIR LANDFILL:Project
Analytical Results
----L2TW1W9003W9001Client sample IDSub-Matrix: WATER (Matrix: WATER)
----18-SEP-2014 11:0018-SEP-2014 15:0018-SEP-2014 12:0018-SEP-2014 12:00Client sampling date / time
----ES1421222-009ES1421222-008ES1421222-007ES1421222-006UnitLORCAS NumberCompound
EP080/071: Total Recoverable Hydrocarbons - NEPM 2013 Fractions - Continued
^ >C10 - C16 Fraction minus Naphthalene
(F2)
<100<100 690 ---- ----µg/L100----
EP080: BTEXN
Benzene <1<1 <1 ---- ----µg/L171-43-2
Toluene <2<2 <2 ---- ----µg/L2108-88-3
Ethylbenzene <2<2 <2 ---- ----µg/L2100-41-4
meta- & para-Xylene <2<2 <2 ---- ----µg/L2108-38-3 106-42-3
ortho-Xylene <2<2 <2 ---- ----µg/L295-47-6
^ Total Xylenes <2<2 <2 ---- ----µg/L21330-20-7
^ Sum of BTEX <1<1 <1 ---- ----µg/L1----
Naphthalene <5<5 <5 ---- ----µg/L591-20-3
EP080S: TPH(V)/BTEX Surrogates
1.2-Dichloroethane-D4 94.299.1 93.1 ---- ----%0.117060-07-0
Toluene-D8 110111 116 ---- ----%0.12037-26-5
4-Bromofluorobenzene 96.5100 95.7 ---- ----%0.1460-00-4

9 of 9:Page
Work Order :
:Client
ES1421222
ORANGE CITY COUNCIL
298047 OPHIR LANDFILL:Project
Surrogate Control Limits
Recovery Limits (%)Sub-Matrix: WATER
Compound CAS Number Low High
EP080S: TPH(V)/BTEX Surrogates
1.2-Dichloroethane-D4 17060-07-0 71 137
Toluene-D8 2037-26-5 79 131
4-Bromofluorobenzene 460-00-4 70 128

False
3 3.00True Environmental
CERTIFICATE OF ANALYSISWork Order : ES1502317 Page : 1 of 4
:: LaboratoryClient Environmental Division SydneyORANGE CITY COUNCIL
: :ContactContact KERRY FRAGAR Client Services
:: AddressAddress PO Box 35
ORANGE NSW 2800
277-289 Woodpark Road Smithfield NSW Australia 2164
:: E-mailE-mail [email protected] [email protected]
:: TelephoneTelephone 02 6393 8041 +61-2-8784 8555
:: FacsimileFacsimile 02 6393 8872 +61-2-8784 8500
:Project 298047 ORRRC QC Level : NEPM 2013 Schedule B(3) and ALS QCS3 requirement
:Order number ----
:C-O-C number ---- Date Samples Received : 03-FEB-2015
Sampler : KF Issue Date : 11-FEB-2015
Site : ----
2:No. of samples received
Quote number : SY/476/14 2:No. of samples analysed
This report supersedes any previous report(s) with this reference. Results apply to the sample(s) as submitted. All pages of this report have been checked and approved for
release.
This Certificate of Analysis contains the following information:
l General Comments
l Analytical Results
NATA Accredited Laboratory 825
Accredited for compliance with
ISO/IEC 17025.
SignatoriesThis document has been electronically signed by the authorized signatories indicated below. Electronic signing has been
carried out in compliance with procedures specified in 21 CFR Part 11.
Signatories Accreditation CategoryPosition
Ankit Joshi Sydney InorganicsInorganic Chemist
Ashesh Patel Sydney InorganicsInorganic Chemist
Shobhna Chandra Sydney InorganicsMetals Coordinator
Environmental Division Sydney ABN 84 009 936 029 Part of the ALS Group An ALS Limited Company
Address 277-289 Woodpark Road Smithfield NSW Australia 2164 | PHONE +61-2-8784 8555 | Facsimile +61-2-8784 8500

2 of 4:Page
Work Order :
:Client
ES1502317
ORANGE CITY COUNCIL
298047 ORRRC:Project
General Comments
The analytical procedures used by the Environmental Division have been developed from established internationally recognized procedures such as those published by the USEPA, APHA, AS and NEPM. In house
developed procedures are employed in the absence of documented standards or by client request.
Where moisture determination has been performed, results are reported on a dry weight basis.
Where a reported less than (<) result is higher than the LOR, this may be due to primary sample extract/digestate dilution and/or insufficient sample for analysis.
Where the LOR of a reported result differs from standard LOR, this may be due to high moisture content, insufficient sample (reduced weight employed) or matrix interference.
When sampling time information is not provided by the client, sampling dates are shown without a time component. In these instances, the time component has been assumed by the laboratory for processing purposes.
Where a result is required to meet compliance limits the associated uncertainty must be considered. Refer to the ALS Contact for details.
CAS Number = CAS registry number from database maintained by Chemical Abstracts Services. The Chemical Abstracts Service is a division of the American Chemical Society.
LOR = Limit of reporting
^ = This result is computed from individual analyte detections at or above the level of reporting
Key :
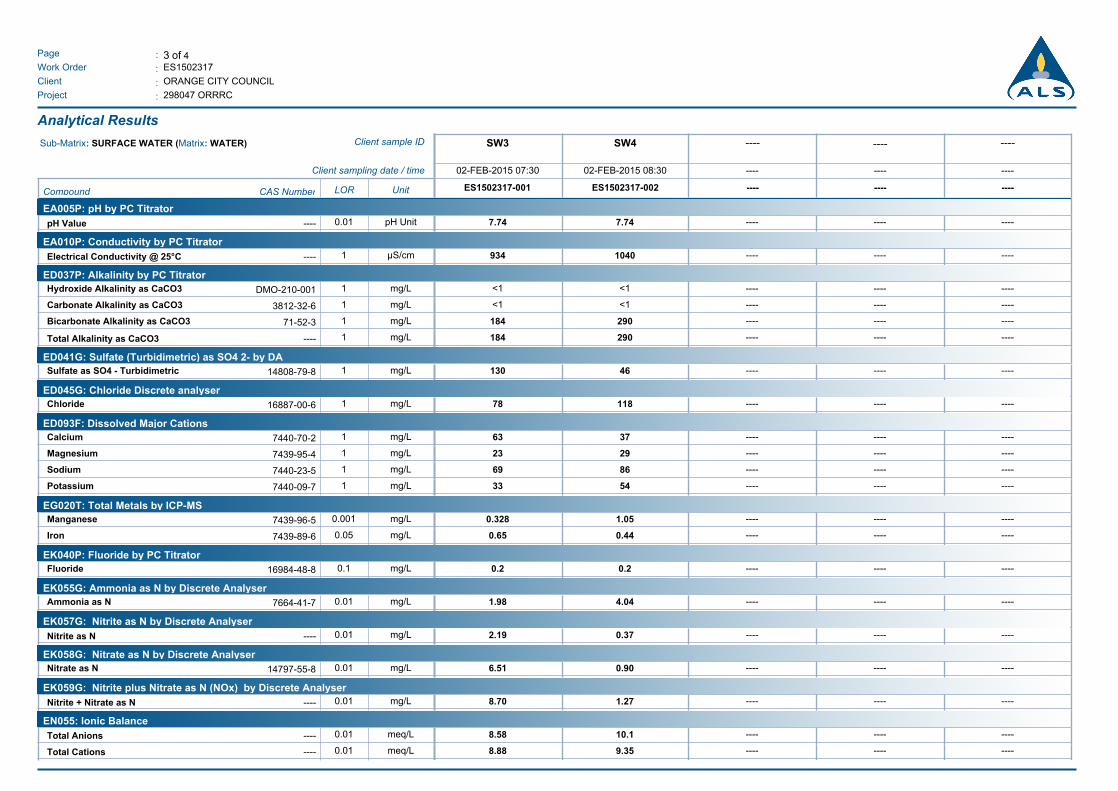
3 of 4:Page
Work Order :
:Client
ES1502317
ORANGE CITY COUNCIL
298047 ORRRC:Project
Analytical Results
------------SW4SW3Client sample IDSub-Matrix: SURFACE WATER (Matrix: WATER)
------------02-FEB-2015 08:3002-FEB-2015 07:30Client sampling date / time
------------ES1502317-002ES1502317-001UnitLORCAS NumberCompound
EA005P: pH by PC Titrator
pH Value 7.747.74 ---- ---- ----pH Unit0.01----
EA010P: Conductivity by PC Titrator
Electrical Conductivity @ 25°C 1040934 ---- ---- ----µS/cm1----
ED037P: Alkalinity by PC Titrator
Hydroxide Alkalinity as CaCO3 <1<1 ---- ---- ----mg/L1DMO-210-001
Carbonate Alkalinity as CaCO3 <1<1 ---- ---- ----mg/L13812-32-6
Bicarbonate Alkalinity as CaCO3 290184 ---- ---- ----mg/L171-52-3
Total Alkalinity as CaCO3 290184 ---- ---- ----mg/L1----
ED041G: Sulfate (Turbidimetric) as SO4 2- by DA
Sulfate as SO4 - Turbidimetric 46130 ---- ---- ----mg/L114808-79-8
ED045G: Chloride Discrete analyser
Chloride 11878 ---- ---- ----mg/L116887-00-6
ED093F: Dissolved Major Cations
Calcium 3763 ---- ---- ----mg/L17440-70-2
Magnesium 2923 ---- ---- ----mg/L17439-95-4
Sodium 8669 ---- ---- ----mg/L17440-23-5
Potassium 5433 ---- ---- ----mg/L17440-09-7
EG020T: Total Metals by ICP-MS
Manganese 1.050.328 ---- ---- ----mg/L0.0017439-96-5
Iron 0.440.65 ---- ---- ----mg/L0.057439-89-6
EK040P: Fluoride by PC Titrator
Fluoride 0.20.2 ---- ---- ----mg/L0.116984-48-8
EK055G: Ammonia as N by Discrete Analyser
Ammonia as N 4.041.98 ---- ---- ----mg/L0.017664-41-7
EK057G: Nitrite as N by Discrete Analyser
Nitrite as N 0.372.19 ---- ---- ----mg/L0.01----
EK058G: Nitrate as N by Discrete Analyser
Nitrate as N 0.906.51 ---- ---- ----mg/L0.0114797-55-8
EK059G: Nitrite plus Nitrate as N (NOx) by Discrete Analyser
Nitrite + Nitrate as N 1.278.70 ---- ---- ----mg/L0.01----
EN055: Ionic Balance
Total Anions 10.18.58 ---- ---- ----meq/L0.01----
Total Cations 9.358.88 ---- ---- ----meq/L0.01----

4 of 4:Page
Work Order :
:Client
ES1502317
ORANGE CITY COUNCIL
298047 ORRRC:Project
Analytical Results
------------SW4SW3Client sample IDSub-Matrix: SURFACE WATER (Matrix: WATER)
------------02-FEB-2015 08:3002-FEB-2015 07:30Client sampling date / time
------------ES1502317-002ES1502317-001UnitLORCAS NumberCompound
EN055: Ionic Balance - Continued
Ionic Balance 3.741.72 ---- ---- ----%0.01----
EP005: Total Organic Carbon (TOC)
Total Organic Carbon 3133 ---- ---- ----mg/L1----
EP035G: Total Phenol by Discrete Analyser
Phenols (Total) <0.05<0.05 ---- ---- ----mg/L0.05----

False
9 9.00False Environmental
CERTIFICATE OF ANALYSISWork Order : ES1505742 Page : 1 of 11
:: LaboratoryClient Environmental Division SydneyORANGE CITY COUNCIL
: :ContactContact MARTIN HAEGE Client Services
:: AddressAddress PO Box 35
ORANGE NSW, AUSTRALIA 2800
277-289 Woodpark Road Smithfield NSW Australia 2164
:: E-mailE-mail [email protected] [email protected]
:: TelephoneTelephone +61 02 6366 8042 +61-2-8784 8555
:: FacsimileFacsimile +61 02 63618178 +61-2-8784 8500
:Project 298047 OPHIR LANDFILL QC Level : NEPM 2013 Schedule B(3) and ALS QCS3 requirement
:Order number ----
:C-O-C number ---- Date Samples Received : 11-MAR-2015
Sampler : DL Issue Date : 18-MAR-2015
Site : ----
11:No. of samples received
Quote number : SY/476/14 11:No. of samples analysed
This report supersedes any previous report(s) with this reference. Results apply to the sample(s) as submitted. All pages of this report have been checked and approved for
release.
This Certificate of Analysis contains the following information:
l General Comments
l Analytical Results
l Surrogate Control Limits
Environmental Division Sydney ABN 84 009 936 029 Part of the ALS Group An ALS Limited Company
Address 277-289 Woodpark Road Smithfield NSW Australia 2164 | PHONE +61-2-8784 8555 | Facsimile +61-2-8784 8500

2 of 11:Page
Work Order :
:Client
ES1505742
ORANGE CITY COUNCIL
298047 OPHIR LANDFILL:Project
General Comments
The analytical procedures used by the Environmental Division have been developed from established internationally recognized procedures such as those published by the USEPA, APHA, AS and NEPM. In house
developed procedures are employed in the absence of documented standards or by client request.
Where moisture determination has been performed, results are reported on a dry weight basis.
Where a reported less than (<) result is higher than the LOR, this may be due to primary sample extract/digestate dilution and/or insufficient sample for analysis.
Where the LOR of a reported result differs from standard LOR, this may be due to high moisture content, insufficient sample (reduced weight employed) or matrix interference.
When sampling time information is not provided by the client, sampling dates are shown without a time component. In these instances, the time component has been assumed by the laboratory for processing purposes.
Where a result is required to meet compliance limits the associated uncertainty must be considered. Refer to the ALS Contact for details.
CAS Number = CAS registry number from database maintained by Chemical Abstracts Services. The Chemical Abstracts Service is a division of the American Chemical Society.
LOR = Limit of reporting
^ = This result is computed from individual analyte detections at or above the level of reporting
Key :
Ionic Balance out of acceptable limits for various samples due to analytes not quantified in this report.l
TDS by method EA-015 may bias high due to the presence of fine particulate matter, which may pass through the prescribed GF/C paper.l
This document has been electronically signed by the authorized signatories indicated below. Electronic signing has been carried out in
compliance with procedures specified in 21 CFR Part 11.
Signatories Accreditation CategoryPosition
Ankit Joshi Inorganic Chemist Sydney Inorganics
Ashesh Patel Inorganic Chemist Sydney Inorganics
Kim McCabe Senior Inorganic Chemist Brisbane Inorganics
Pabi Subba Senior Organic Chemist Sydney Organics
Wisam Marassa Inorganics Coordinator Sydney Inorganics
NATA Accredited Laboratory 825
Accredited for compliance with
ISO/IEC 17025.
Signatories

3 of 11:Page
Work Order :
:Client
ES1505742
ORANGE CITY COUNCIL
298047 OPHIR LANDFILL:Project
Analytical Results
BH4BH3BH2BH1ABH1Client sample IDSub-Matrix: GROUNDWATER (Matrix: WATER)
09-MAR-2015 13:3009-MAR-2015 09:0009-MAR-2015 12:0009-MAR-2015 11:0009-MAR-2015 10:00Client sampling date / time
ES1505742-005ES1505742-004ES1505742-003ES1505742-002ES1505742-001UnitLORCAS NumberCompound
EA005P: pH by PC Titrator
pH Value 7.287.18 7.11 7.81 7.25pH Unit0.01----
EA010P: Conductivity by PC Titrator
Electrical Conductivity @ 25°C 249246 2170 672 3130µS/cm1----
EA015: Total Dissolved Solids
Total Dissolved Solids @180°C 168166 950 390 1730mg/L10----
ED037P: Alkalinity by PC Titrator
Hydroxide Alkalinity as CaCO3 <1<1 <1 <1 <1mg/L1DMO-210-001
Carbonate Alkalinity as CaCO3 <1<1 <1 <1 <1mg/L13812-32-6
Bicarbonate Alkalinity as CaCO3 127125 533 348 854mg/L171-52-3
Total Alkalinity as CaCO3 127125 533 348 854mg/L1----
ED041G: Sulfate (Turbidimetric) as SO4 2- by DA
Sulfate as SO4 - Turbidimetric 21 88 14 82mg/L114808-79-8
ED045G: Chloride Discrete analyser
Chloride 78 420 10 640mg/L116887-00-6
ED093F: Dissolved Major Cations
Calcium 1716 195 66 281mg/L17440-70-2
Magnesium 1516 118 41 261mg/L17439-95-4
Sodium 1414 92 30 27mg/L17440-23-5
Potassium <1<1 8 11 2mg/L17440-09-7
EG020F: Dissolved Metals by ICP-MS
Aluminium 0.010.01 <0.01 <0.01 <0.01mg/L0.017429-90-5
Copper 0.0020.004 <0.001 0.002 0.001mg/L0.0017440-50-8
Manganese 0.4380.442 0.768 0.117 0.141mg/L0.0017439-96-5
Zinc 0.1240.129 <0.005 0.019 <0.005mg/L0.0057440-66-6
Boron <0.05<0.05 10.4 0.10 5.69mg/L0.057440-42-8
Iron 0.650.62 4.93 <0.05 <0.05mg/L0.057439-89-6
EK040P: Fluoride by PC Titrator
Fluoride 0.20.2 0.1 0.2 0.1mg/L0.116984-48-8
EK055G: Ammonia as N by Discrete Analyser
Ammonia as N 0.080.15 3.25 0.03 0.03mg/L0.017664-41-7
EK057G: Nitrite as N by Discrete Analyser
Nitrite as N <0.01<0.01 <0.01 <0.01 <0.01mg/L0.01----
EK058G: Nitrate as N by Discrete Analyser

4 of 11:Page
Work Order :
:Client
ES1505742
ORANGE CITY COUNCIL
298047 OPHIR LANDFILL:Project
Analytical Results
BH4BH3BH2BH1ABH1Client sample IDSub-Matrix: GROUNDWATER (Matrix: WATER)
09-MAR-2015 13:3009-MAR-2015 09:0009-MAR-2015 12:0009-MAR-2015 11:0009-MAR-2015 10:00Client sampling date / time
ES1505742-005ES1505742-004ES1505742-003ES1505742-002ES1505742-001UnitLORCAS NumberCompound
EK058G: Nitrate as N by Discrete Analyser - Continued
Nitrate as N 0.030.02 0.03 3.61 0.04mg/L0.0114797-55-8
EK059G: Nitrite plus Nitrate as N (NOx) by Discrete Analyser
Nitrite + Nitrate as N 0.030.02 0.03 3.61 0.04mg/L0.01----
EK071G: Reactive Phosphorus as P by discrete analyser
Reactive Phosphorus as P 0.030.04 <0.01 <0.01 0.06mg/L0.0114265-44-2
EN055: Ionic Balance
Total Anions 2.782.74 24.3 ---- 36.8meq/L0.01----
Total Anions -------- ---- 7.79 ----meq/L0.01----
Total Cations 2.692.72 23.6 8.25 36.7meq/L0.01----
Ionic Balance 1.570.38 1.40 ---- 0.12%0.01----
Ionic Balance -------- ---- 2.88 ----%0.01----
EP005: Total Organic Carbon (TOC)
Total Organic Carbon 56 14 4 16mg/L1----
EP035G: Total Phenol by Discrete Analyser
Phenols (Total) <0.05<0.05 <0.05 <0.05 <0.05mg/L0.05----
EP080/071: Total Petroleum Hydrocarbons
C6 - C9 Fraction <20<20 2070 <20 150µg/L20----
C10 - C14 Fraction <50<50 <50 <50 <50µg/L50----
C15 - C28 Fraction <100<100 <100 <100 <100µg/L100----
C29 - C36 Fraction <50<50 <50 <50 <50µg/L50----
^ C10 - C36 Fraction (sum) <50<50 <50 <50 <50µg/L50----
EP080/071: Total Recoverable Hydrocarbons - NEPM 2013 Fractions
C6 - C10 Fraction <20<20 2090 <20 150µg/L20C6_C10
^ C6 - C10 Fraction minus BTEX
(F1)
<20<20 2090 <20 150µg/L20C6_C10-BTEX
>C10 - C16 Fraction <100<100 <100 <100 <100µg/L100>C10_C16
>C16 - C34 Fraction <100<100 <100 <100 <100µg/L100----
>C34 - C40 Fraction <100<100 <100 <100 <100µg/L100----
^ >C10 - C40 Fraction (sum) <100<100 <100 <100 <100µg/L100----
^ >C10 - C16 Fraction minus Naphthalene
(F2)
<100<100 <100 <100 <100µg/L100----
EP080: BTEXN
Benzene <1<1 2 <1 1µg/L171-43-2
Toluene <2<2 <2 <2 <2µg/L2108-88-3

5 of 11:Page
Work Order :
:Client
ES1505742
ORANGE CITY COUNCIL
298047 OPHIR LANDFILL:Project
Analytical Results
BH4BH3BH2BH1ABH1Client sample IDSub-Matrix: GROUNDWATER (Matrix: WATER)
09-MAR-2015 13:3009-MAR-2015 09:0009-MAR-2015 12:0009-MAR-2015 11:0009-MAR-2015 10:00Client sampling date / time
ES1505742-005ES1505742-004ES1505742-003ES1505742-002ES1505742-001UnitLORCAS NumberCompound
EP080: BTEXN - Continued
Ethylbenzene <2<2 <2 <2 <2µg/L2100-41-4
meta- & para-Xylene <2<2 <2 <2 <2µg/L2108-38-3 106-42-3
ortho-Xylene <2<2 <2 <2 <2µg/L295-47-6
^ Total Xylenes <2<2 <2 <2 <2µg/L21330-20-7
^ Sum of BTEX <1<1 2 <1 1µg/L1----
Naphthalene <5<5 <5 <5 <5µg/L591-20-3
EP080S: TPH(V)/BTEX Surrogates
1.2-Dichloroethane-D4 122110 112 112 107%0.117060-07-0
Toluene-D8 102125 110 121 119%0.12037-26-5
4-Bromofluorobenzene 96.7120 102 115 112%0.1460-00-4

6 of 11:Page
Work Order :
:Client
ES1505742
ORANGE CITY COUNCIL
298047 OPHIR LANDFILL:Project
Analytical Results
W9003W9001BH7BH6BH5Client sample IDSub-Matrix: GROUNDWATER (Matrix: WATER)
09-MAR-2015 09:0009-MAR-2015 09:0009-MAR-2015 15:0009-MAR-2015 16:3009-MAR-2015 17:30Client sampling date / time
ES1505742-010ES1505742-009ES1505742-008ES1505742-007ES1505742-006UnitLORCAS NumberCompound
EA005P: pH by PC Titrator
pH Value 7.507.31 7.95 6.52 7.85pH Unit0.01----
EA010P: Conductivity by PC Titrator
Electrical Conductivity @ 25°C 4681690 885 12 673µS/cm1----
EA015: Total Dissolved Solids
Total Dissolved Solids @180°C 842916 544 18 392mg/L10----
ED037P: Alkalinity by PC Titrator
Hydroxide Alkalinity as CaCO3 <1<1 <1 <1 <1mg/L1DMO-210-001
Carbonate Alkalinity as CaCO3 <1<1 <1 <1 <1mg/L13812-32-6
Bicarbonate Alkalinity as CaCO3 178758 73 2 346mg/L171-52-3
Total Alkalinity as CaCO3 178758 73 2 346mg/L1----
ED041G: Sulfate (Turbidimetric) as SO4 2- by DA
Sulfate as SO4 - Turbidimetric 4112 297 <1 15mg/L114808-79-8
ED045G: Chloride Discrete analyser
Chloride 11170 41 2 10mg/L116887-00-6
ED093F: Dissolved Major Cations
Calcium 42118 66 <1 68mg/L17440-70-2
Magnesium 31150 23 <1 41mg/L17439-95-4
Sodium 1450 98 2 30mg/L17440-23-5
Potassium <14 6 <1 11mg/L17440-09-7
EG020F: Dissolved Metals by ICP-MS
Aluminium 0.02<0.01 0.02 <0.01 <0.01mg/L0.017429-90-5
Copper <0.0010.009 <0.001 0.002 0.002mg/L0.0017440-50-8
Manganese <0.0010.198 0.081 <0.001 0.116mg/L0.0017439-96-5
Zinc <0.0050.016 <0.005 <0.005 0.016mg/L0.0057440-66-6
Boron <0.050.44 0.66 0.16 <0.05mg/L0.057440-42-8
Iron <0.05<0.05 <0.05 <0.05 <0.05mg/L0.057439-89-6
EK040P: Fluoride by PC Titrator
Fluoride 0.10.1 0.3 <0.1 0.2mg/L0.116984-48-8
EK055G: Ammonia as N by Discrete Analyser
Ammonia as N 0.020.05 0.76 0.02 0.02mg/L0.017664-41-7
EK057G: Nitrite as N by Discrete Analyser
Nitrite as N <0.01<0.01 <0.01 <0.01 <0.01mg/L0.01----
EK058G: Nitrate as N by Discrete Analyser

7 of 11:Page
Work Order :
:Client
ES1505742
ORANGE CITY COUNCIL
298047 OPHIR LANDFILL:Project
Analytical Results
W9003W9001BH7BH6BH5Client sample IDSub-Matrix: GROUNDWATER (Matrix: WATER)
09-MAR-2015 09:0009-MAR-2015 09:0009-MAR-2015 15:0009-MAR-2015 16:3009-MAR-2015 17:30Client sampling date / time
ES1505742-010ES1505742-009ES1505742-008ES1505742-007ES1505742-006UnitLORCAS NumberCompound
EK058G: Nitrate as N by Discrete Analyser - Continued
Nitrate as N 6.500.14 0.11 <0.01 3.49mg/L0.0114797-55-8
EK059G: Nitrite plus Nitrate as N (NOx) by Discrete Analyser
Nitrite + Nitrate as N 6.500.14 0.11 <0.01 3.49mg/L0.01----
EK071G: Reactive Phosphorus as P by discrete analyser
Reactive Phosphorus as P 0.060.03 0.02 0.03 <0.01mg/L0.0114265-44-2
EN055: Ionic Balance
Total Anions ----20.2 8.80 0.10 ----meq/L0.01----
Total Anions 5.19---- ---- ---- 7.76meq/L0.01----
Total Cations 5.2620.5 9.60 0.09 8.35meq/L0.01----
Ionic Balance ----0.78 4.36 ---- ----%0.01----
Ionic Balance 0.65---- ---- ---- 3.66%0.01----
EP005: Total Organic Carbon (TOC)
Total Organic Carbon 116 4 2 4mg/L1----
EP035G: Total Phenol by Discrete Analyser
Phenols (Total) <0.05<0.05 <0.05 <0.05 <0.05mg/L0.05----
EP080/071: Total Petroleum Hydrocarbons
C6 - C9 Fraction <20<20 <20 <20 <20µg/L20----
C10 - C14 Fraction <50<50 <50 <50 <50µg/L50----
C15 - C28 Fraction <100<100 <100 <100 <100µg/L100----
C29 - C36 Fraction <50<50 <50 <50 <50µg/L50----
^ C10 - C36 Fraction (sum) <50<50 <50 <50 <50µg/L50----
EP080/071: Total Recoverable Hydrocarbons - NEPM 2013 Fractions
C6 - C10 Fraction <20<20 <20 <20 <20µg/L20C6_C10
^ C6 - C10 Fraction minus BTEX
(F1)
<20<20 <20 <20 <20µg/L20C6_C10-BTEX
>C10 - C16 Fraction <100<100 <100 <100 <100µg/L100>C10_C16
>C16 - C34 Fraction <100<100 <100 <100 <100µg/L100----
>C34 - C40 Fraction <100<100 <100 <100 <100µg/L100----
^ >C10 - C40 Fraction (sum) <100<100 <100 <100 <100µg/L100----
^ >C10 - C16 Fraction minus Naphthalene
(F2)
<100<100 <100 <100 <100µg/L100----
EP080: BTEXN
Benzene <1<1 <1 <1 <1µg/L171-43-2
Toluene <2<2 <2 <2 <2µg/L2108-88-3

8 of 11:Page
Work Order :
:Client
ES1505742
ORANGE CITY COUNCIL
298047 OPHIR LANDFILL:Project
Analytical Results
W9003W9001BH7BH6BH5Client sample IDSub-Matrix: GROUNDWATER (Matrix: WATER)
09-MAR-2015 09:0009-MAR-2015 09:0009-MAR-2015 15:0009-MAR-2015 16:3009-MAR-2015 17:30Client sampling date / time
ES1505742-010ES1505742-009ES1505742-008ES1505742-007ES1505742-006UnitLORCAS NumberCompound
EP080: BTEXN - Continued
Ethylbenzene <2<2 <2 <2 <2µg/L2100-41-4
meta- & para-Xylene <2<2 <2 <2 <2µg/L2108-38-3 106-42-3
ortho-Xylene <2<2 <2 <2 <2µg/L295-47-6
^ Total Xylenes <2<2 <2 <2 <2µg/L21330-20-7
^ Sum of BTEX <1<1 <1 <1 <1µg/L1----
Naphthalene <5<5 <5 <5 <5µg/L591-20-3
EP080S: TPH(V)/BTEX Surrogates
1.2-Dichloroethane-D4 109120 117 117 113%0.117060-07-0
Toluene-D8 105109 110 109 105%0.12037-26-5
4-Bromofluorobenzene 96.9100 99.0 90.8 86.4%0.1460-00-4

9 of 11:Page
Work Order :
:Client
ES1505742
ORANGE CITY COUNCIL
298047 OPHIR LANDFILL:Project
Analytical Results
----------------L2Client sample IDSub-Matrix: GROUNDWATER (Matrix: WATER)
----------------09-MAR-2015 11:00Client sampling date / time
----------------ES1505742-011UnitLORCAS NumberCompound
EA005P: pH by PC Titrator
pH Value ----7.48 ---- ---- ----pH Unit0.01----
EA010P: Conductivity by PC Titrator
Electrical Conductivity @ 25°C ----1730 ---- ---- ----µS/cm1----
ED037P: Alkalinity by PC Titrator
Hydroxide Alkalinity as CaCO3 ----<1 ---- ---- ----mg/L1DMO-210-001
Carbonate Alkalinity as CaCO3 ----<1 ---- ---- ----mg/L13812-32-6
Bicarbonate Alkalinity as CaCO3 ----451 ---- ---- ----mg/L171-52-3
Total Alkalinity as CaCO3 ----451 ---- ---- ----mg/L1----
ED041G: Sulfate (Turbidimetric) as SO4 2- by DA
Sulfate as SO4 - Turbidimetric ----30 ---- ---- ----mg/L114808-79-8
ED045G: Chloride Discrete analyser
Chloride ----224 ---- ---- ----mg/L116887-00-6
ED093F: Dissolved Major Cations
Calcium ----72 ---- ---- ----mg/L17440-70-2
Magnesium ----61 ---- ---- ----mg/L17439-95-4
Sodium ----95 ---- ---- ----mg/L17440-23-5
Potassium ----28 ---- ---- ----mg/L17440-09-7
EG020T: Total Metals by ICP-MS
Manganese ----5.53 ---- ---- ----mg/L0.0017439-96-5
Iron ----0.99 ---- ---- ----mg/L0.057439-89-6
EK040P: Fluoride by PC Titrator
Fluoride ----0.4 ---- ---- ----mg/L0.116984-48-8
EK055G: Ammonia as N by Discrete Analyser
Ammonia as N ----10.8 ---- ---- ----mg/L0.017664-41-7
EK057G: Nitrite as N by Discrete Analyser
Nitrite as N ----0.01 ---- ---- ----mg/L0.01----
EK058G: Nitrate as N by Discrete Analyser
Nitrate as N ----0.14 ---- ---- ----mg/L0.0114797-55-8
EK059G: Nitrite plus Nitrate as N (NOx) by Discrete Analyser
Nitrite + Nitrate as N ----0.15 ---- ---- ----mg/L0.01----
EN055: Ionic Balance
Total Anions ----16.0 ---- ---- ----meq/L0.01----
Total Cations ----14.0 ---- ---- ----meq/L0.01----

10 of 11:Page
Work Order :
:Client
ES1505742
ORANGE CITY COUNCIL
298047 OPHIR LANDFILL:Project
Analytical Results
----------------L2Client sample IDSub-Matrix: GROUNDWATER (Matrix: WATER)
----------------09-MAR-2015 11:00Client sampling date / time
----------------ES1505742-011UnitLORCAS NumberCompound
EN055: Ionic Balance - Continued
Ionic Balance ----6.68 ---- ---- ----%0.01----
EP005: Total Organic Carbon (TOC)
Total Organic Carbon ----23 ---- ---- ----mg/L1----
EP035G: Total Phenol by Discrete Analyser
Phenols (Total) ----<0.05 ---- ---- ----mg/L0.05----

11 of 11:Page
Work Order :
:Client
ES1505742
ORANGE CITY COUNCIL
298047 OPHIR LANDFILL:Project
Surrogate Control Limits
Recovery Limits (%)Sub-Matrix: GROUNDWATER
Compound CAS Number Low High
EP080S: TPH(V)/BTEX Surrogates
1.2-Dichloroethane-D4 17060-07-0 71 137
Toluene-D8 2037-26-5 79 131
4-Bromofluorobenzene 460-00-4 70 128

3 3.00 True
CERTIFICATE OF ANALYSISWork Order : Page : 1 of 4ES1520378
:: LaboratoryClient ORANGE CITY COUNCIL Environmental Division Sydney
: :ContactContact BRENDAN STUART
:: AddressAddress PO Box 35
ORANGE NSW, AUSTRALIA 2800
277-289 Woodpark Road Smithfield NSW Australia 2164
:: E-mailE-mail [email protected]
:: TelephoneTelephone +61 02 6366 8042 +61-2-8784 8555
:: FacsimileFacsimile +61 02 63618178 +61-2-8784 8500
:Project 298047, ORRRC QC Level : NEPM 2013 Schedule B(3) and ALS QCS3 requirement
:Order number ---- Date Samples Received : 24-Apr-2015 09:00
:C-O-C number ---- Date Analysis Commenced : 25-Apr-2015
Sampler : KERRY FRAGAR Issue Date : 01-May-2015 16:49
Site : ----
2:No. of samples received
Quote number : ---- 2:No. of samples analysed
This report supersedes any previous report(s) with this reference. Results apply to the sample(s) as submitted.
This Certificate of Analysis contains the following information:
l General Comments
l Analytical Results
SignatoriesThis document has been electronically signed by the authorized signatories indicated below. Electronic signing has been
carried out in compliance with procedures specified in 21 CFR Part 11.
Signatories Accreditation CategoryPosition
Ankit Joshi Inorganic Chemist Sydney Inorganics
Ashesh Patel Inorganic Chemist Sydney Inorganics
Shobhna Chandra Metals Coordinator Sydney Inorganics
NATA Accredited Laboratory 825
Accredited for compliance with
ISO/IEC 17025.
R I G H T S O L U T I O N S | R I G H T P A R T N E R

2 of 4:Page
Work Order :
:Client
ES1520378
298047, ORRRC:Project
ORANGE CITY COUNCIL
General Comments
The analytical procedures used by the Environmental Division have been developed from established internationally recognized procedures such as those published by the USEPA, APHA, AS and NEPM. In house
developed procedures are employed in the absence of documented standards or by client request.
Where moisture determination has been performed, results are reported on a dry weight basis.
Where a reported less than (<) result is higher than the LOR, this may be due to primary sample extract/digestate dilution and/or insufficient sample for analysis.
Where the LOR of a reported result differs from standard LOR, this may be due to high moisture content, insufficient sample (reduced weight employed) or matrix interference.
When sampling time information is not provided by the client, sampling dates are shown without a time component. In these instances, the time component has been assumed by the laboratory for processing purposes.
CAS Number = CAS registry number from database maintained by Chemical Abstracts Services. The Chemical Abstracts Service is a division of the American Chemical Society.
LOR = Limit of reporting
^ = This result is computed from individual analyte detections at or above the level of reporting
ø = ALS is not NATA accredited for these tests.
Key :

3 of 4:Page
Work Order :
:Client
ES1520378
298047, ORRRC:Project
ORANGE CITY COUNCIL
Analytical Results
------------SW4SW3Client sample IDSub-Matrix: WATER
(Matrix: WATER)
------------22-Apr-2015 11:0022-Apr-2015 11:40Client sampling date / time
------------------------ES1520378-002ES1520378-001UnitLORCAS NumberCompound
Result Result Result Result Result
EA005P: pH by PC Titrator
7.53 7.96 ---- ---- ----pH Unit0.01----pH Value
EA010P: Conductivity by PC Titrator
1050 580 ---- ---- ----µS/cm1----Electrical Conductivity @ 25°C
ED037P: Alkalinity by PC Titrator
<1Hydroxide Alkalinity as CaCO3 <1 ---- ---- ----mg/L1DMO-210-001
<1Carbonate Alkalinity as CaCO3 <1 ---- ---- ----mg/L13812-32-6
241Bicarbonate Alkalinity as CaCO3 166 ---- ---- ----mg/L171-52-3
241 166 ---- ---- ----mg/L1----Total Alkalinity as CaCO3
ED041G: Sulfate (Turbidimetric) as SO4 2- by DA
157Sulfate as SO4 - Turbidimetric 7 ---- ---- ----mg/L114808-79-8
ED045G: Chloride by Discrete Analyser
81Chloride 83 ---- ---- ----mg/L116887-00-6
ED093F: Dissolved Major Cations
62Calcium 12 ---- ---- ----mg/L17440-70-2
23Magnesium 17 ---- ---- ----mg/L17439-95-4
67Sodium 60 ---- ---- ----mg/L17440-23-5
38Potassium 27 ---- ---- ----mg/L17440-09-7
EG020T: Total Metals by ICP-MS
0.317Manganese 0.302 ---- ---- ----mg/L0.0017439-96-5
3.35Iron 0.87 ---- ---- ----mg/L0.057439-89-6
EK040P: Fluoride by PC Titrator
0.2Fluoride 0.2 ---- ---- ----mg/L0.116984-48-8
EK055G: Ammonia as N by Discrete Analyser
14.0Ammonia as N 0.23 ---- ---- ----mg/L0.017664-41-7
EK058G: Nitrate as N by Discrete Analyser
2.49^ Nitrate as N 0.02 ---- ---- ----mg/L0.0114797-55-8
EN055: Ionic Balance
10.9 ---- ---- ---- ----meq/L0.01----Total Anions
----^ 5.80 ---- ---- ----meq/L0.01----Total Anions
10.6 ---- ---- ---- ----meq/L0.01----Total Cations
----^ 5.30 ---- ---- ----meq/L0.01----Total Cations
3.32 ---- ---- ---- ----%0.01----Ionic Balance
----^ 4.56 ---- ---- ----%0.01----Ionic Balance
EP005: Total Organic Carbon (TOC)

4 of 4:Page
Work Order :
:Client
ES1520378
298047, ORRRC:Project
ORANGE CITY COUNCIL
Analytical Results
------------SW4SW3Client sample IDSub-Matrix: WATER
(Matrix: WATER)
------------22-Apr-2015 11:0022-Apr-2015 11:40Client sampling date / time
------------------------ES1520378-002ES1520378-001UnitLORCAS NumberCompound
Result Result Result Result Result
EP005: Total Organic Carbon (TOC) - Continued
47 36 ---- ---- ----mg/L1----Total Organic Carbon
EP035G: Total Phenol by Discrete Analyser
<0.05 <0.05 ---- ---- ----mg/L0.05----Phenols (Total)