annual fact book 2015-2016 and fall 2016 december … fact book 2015-2016 and fall 2016 december 14,...
TRANSCRIPT

Annual Fact Book
2015-2016
and
Fall 2016
December 14, 2016

Prepared by:
Michael Dennehy, Ed.D., Executive Director
Marianne Roffino, Senior Executive Assistant
Cathy Todd, Senior Research Analyst
Betty Zelada, Senior Research Analyst
Office of Planning, Research and Institutional Effectiveness
For questions or further information, please contact the
Brookhaven College Office of Planning, Research and Institutional Research
972-860-4607

Contents Key Performance Indicators .......................................................................................................................... 3
KPI 1.1.1.1 ................................................................................................................................................. 3
Dual Credit Enrollment and Contact Hours........................................................................................... 3
KPI 1.1.1.2 ................................................................................................................................................. 4
Brookhaven Early College High School Enrollment and Contact Hours ................................................ 4
P-TECH Collegiate Academy Enrollment and Contact Hours ................................................................ 5
KPI 1.1.1.3 ................................................................................................................................................. 6
Brookhaven College Total Contact Hours ............................................................................................. 6
Brookhaven College Total Enrollment .................................................................................................. 7
KPI 1.1.1.4 ................................................................................................................................................. 8
Brookhaven College Total Headcount .................................................................................................. 8
KPI 1.1.1.5 ................................................................................................................................................. 9
Distance Learning Enrollment and Contact Hours ................................................................................ 9
Distance Learning Contact Hours ........................................................................................................ 10
Distance Learning Headcount & Student Load ................................................................................... 11
Distance Learning Flex vs. Distance Learning Full-Term ...................................................................... 12
KPI 1.1.2.1 ............................................................................................................................................... 13
Retention ............................................................................................................................................ 13
KPI 1.1.2.2 ............................................................................................................................................... 13
Persistence (Course Completion ......................................................................................................... 13
KPI 1.1.2.3 ............................................................................................................................................... 14
Completion .......................................................................................................................................... 14
KPI 1.1.3.1 ............................................................................................................................................... 15
C.E. Enrollment (All Course Types) ...................................................................................................... 15
KPI 4.1.1.2 ............................................................................................................................................... 16
Migrated from C.E. to Credit ............................................................................................................... 16
KPI 4.1.1.3 ............................................................................................................................................... 17
C.E. Productivity: Courses Offered, Enrollment, Contact Hours ......................................................... 17
Credit Student Enrollment .......................................................................................................................... 19
Fall 2016 Brookhaven College Student Demographics ........................................................................... 19
Fall 2016 Top Ten Program Areas ........................................................................................................... 20
1

Fall 2016 Top Ten Enrollment Courses ................................................................................................... 20
Distance Learning Enrollments ............................................................................................................... 21
Dual Credit and Early College High School .................................................................................................. 21
Dual Credit and Early College High School Enrollments ......................................................................... 21
Dual Credit and Early College High School Contact Hours ...................................................................... 22
Dual Credit and Early College High School Headcount ........................................................................... 22
Credit Student Statistics .............................................................................................................................. 23
Fall Summary of Credit Student Statistics ............................................................................................... 23
Summer 1 Summary of Credit Student Statistics .................................................................................... 25
Spring Summary of Credit Student Statistics .......................................................................................... 27
Student Success, Retention and Completion .............................................................................................. 29
Student Retention ................................................................................................................................... 29
Course Success and Completion Rates ................................................................................................... 30
2015-2016 Success, Drop, Fail by Department ....................................................................................... 31
Automotive Division ............................................................................................................................ 31
Business Division ................................................................................................................................. 32
Communications Division.................................................................................................................... 33
Fine Arts Division................................................................................................................................. 34
Human Development Division ............................................................................................................ 34
Health and Human Services Division .................................................................................................. 35
Math and Science Division .................................................................................................................. 36
Social Science Division ........................................................................................................................ 37
World Languages Division ................................................................................................................... 37
Degrees and Certificates ......................................................................................................................... 39
Licensure Pass Rates ............................................................................................................................... 40
Job Placement Rates ............................................................................................................................... 40
Financials ..................................................................................................................................................... 41
Fiscal Year 2015 Core Revenues and Expenses ....................................................................................... 41
Full-Time Employee Demographics ............................................................................................................ 43
Faculty Demographics ................................................................................................................................. 44
2

KPI 1.1.1.1
% change from
previous year
% change from
previous year
% change from
previous year
2013FA 595 2013FA 453 2013FA 40,832
2014FA 801 34.6% 2014FA 608 34.2% 2014FA 48,144 17.9%
2015FA 948 18.4% 2015FA 681 12.0% 2015FA 53,904 12.0%
2016FA 1,167 23.1% 2016FA 861 26.4% 2016FA 64,976 20.5%
2016FA Target 995 2016FA Target 715 2016FA Target 56,599Target: 995 Target: 715 Target 56,599
Progress to Target 117% Progress to Target 120% Progress to Target 115%
Data as of 9/28/16; Source: PRIE warehouse databases: Dual Credit, STUDENT COURSE, COURSE; built from Colleague files: STUDENTS, STUDENT.ACAD.CRED, COURSE.SECTIONS, STUDENT.RESTRICTIONS, TA finanaical aid files
Brookhaven College
Dual Credit Enrollment and Contact Hours
Fall Dual Credit Enrollment Fall Dual Credit Contact Hours Fall Dual Credit Headcount
Targets for current year are calculated as 5% above previous year
595
801
948
1,167
0 200 400 600 800 1,000 1,200 1,400
2013FA
2014FA
2015FA
2016FA
Dual Credit Enrollment
20
16
FA T
arge
t
995
453
608
681
861
0 200 400 600 800 1000
2013FA
2014FA
2015FA
2016FA
Dual Credit Headcount
20
16
FA T
arge
t
715
120%
0%
10%
20%
30%
40%
50%
60%
70%
80%
90%
100%
Progress to Target
Dual Credit Headcount
117%
0%
10%
20%
30%
40%
50%
60%
70%
80%
90%
100%
Progress to Target
Dual Credit Enrollment
40,832
48,144
53,904
64,976
0 20,000 40,000 60,000 80,000
2014FA
2015FA
2016FA
Dual Credit Contact Hours
20
16
FA T
arge
t
56,599
115%
0%
10%
20%
30%
40%
50%
60%
70%
80%
90%
100%
Progress to Target
Dual Credit Contact Hours
Brookhaven College PRIE, C. Todd contact hours are not certified 12/14/20163

KPI 1.1.1.2
% change from
previous year
% change from
previous year
% change from
previous year
2013FA 858 2013FA 303 2013FA 50,264
2014FA 735 -14.3% 2014FA 280 -7.6% 2014FA 42,256 -15.9%
2015FA 724 -1.5% 2015FA 291 3.9% 2015FA 44,592 5.5%
2016FA 767 5.9% 2016FA 274 -5.8% 2016FA 41,328 -7.3%
2016FA Target 760 2016FA Target 303 2016FA Target 46,822Target: 760 Target: 303 Target: 46,822
Progress to Target 101% Progress to Target 90% Progress to Target 88%
Data as of 9/28/16; Source: PRIE warehouse databases: Dual Credit, STUDENT COURSE, COURSE; built from Colleague files: STUDENTS, STUDENT.ACAD.CRED, COURSE.SECTIONS, STUDENT.RESTRICTIONS, TA finanaical aid files
Fall Brookhaven ECHS Enrollment Fall Brookhaven ECHS Headcount Fall Brookhaven ECHS Contact Hours
Brookhaven College
Brookhaven Early College High School Enrollment and Contact Hours Targets for current year are calculated as 5% above previous year
735
724
767
600 650 700 750 800 850
2013FA
2014FA
2015FA
2016FA
ECHS Enrollment
20
16
FA T
arge
t
760
303
280
291
274
200 225 250 275 300 325
2013FA
2014FA
2015FA
2016FA
ECHS Headcount 303
20
16
FA T
arge
t
50,264
42,256
44,592
41,328
0 10,000 20,000 30,000 40,000 50,000 60,000
2013FA
2014FA
2015FA
2016FA
ECHS Contact Hours
20
16
FA T
arge
t
46,822
90%
0%
10%
20%
30%
40%
50%
60%
70%
80%
90%
100%
Title
ECHS Headcount
101%
0%
10%
20%
30%
40%
50%
60%
70%
80%
90%
100%
Title
ECHS Enrollment
88%
0%
10%
20%
30%
40%
50%
60%
70%
80%
90%
100%
Title
ECHS Contact Hours
Brookhaven College PRIE, C. Todd contact hours are not certified 12/14/20164
KPI 1.1.1.2
% change from
previous year
% change from
previous year
% change from
previous year
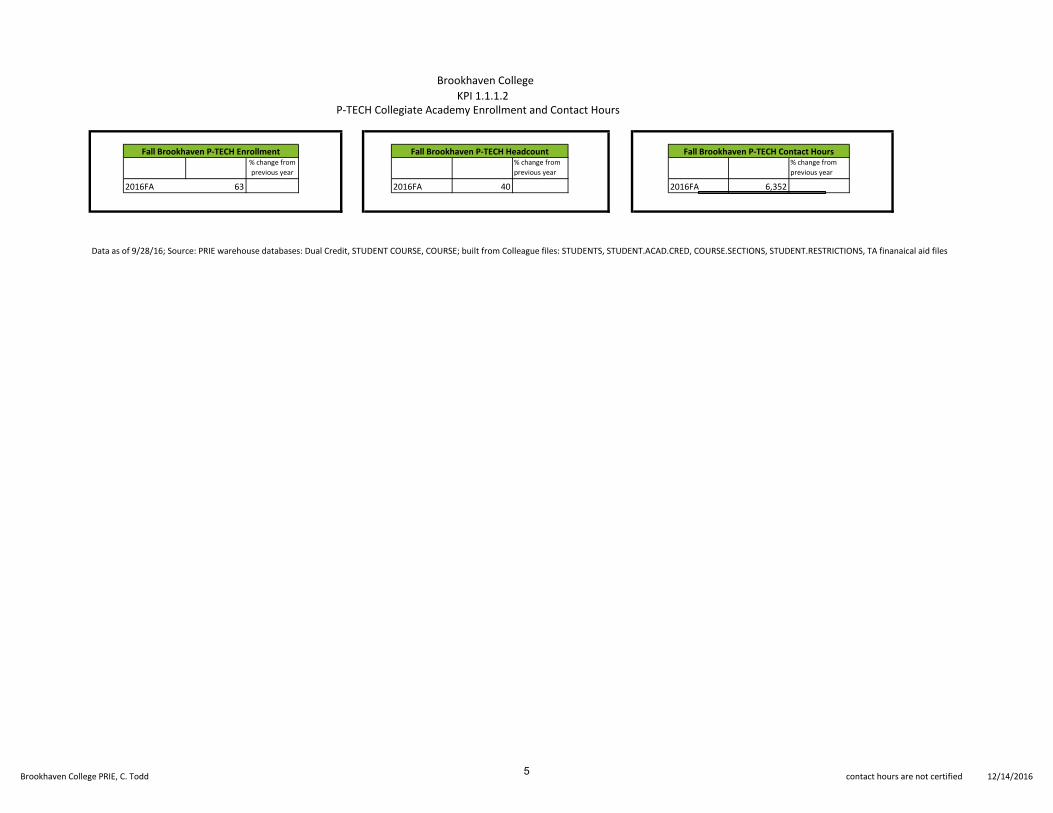
2016FA 63 2016FA 40 2016FA 6,352
Data as of 9/28/16; Source: PRIE warehouse databases: Dual Credit, STUDENT COURSE, COURSE; built from Colleague files: STUDENTS, STUDENT.ACAD.CRED, COURSE.SECTIONS, STUDENT.RESTRICTIONS, TA finanaical aid files
P-TECH Collegiate Academy Enrollment and Contact Hours
Brookhaven College
Fall Brookhaven P-TECH Enrollment Fall Brookhaven P-TECH Headcount Fall Brookhaven P-TECH Contact Hours
Brookhaven College PRIE, C. Todd contact hours are not certified 12/14/20165

KPI 1.1.1.3
Brookhaven College Total Contact Hours
2013-2014 4,054,560
2014-2015 3,991,384
2015-2016 4,171,240
2016-2017 1,790,568
2016-2017 Target 4,379,802Target: 4,379,802
Progress to Target 41%
% change from
previous year
1,754,336
1,727,344 -1.5%
1,735,080 0.4%
1,790,568 3.2%
% change from
previous year
1,637,128
1,599,784 -2.3%
1,664,120 4.0%
% change from
previous year
663,096
664,256 0.2%
772,040 16.2%
Data as of 2016FA census date; Source: PRIE warehouse databases: STUDENT COURSE and COURSE; built from Colleague files: STUDENT.ACAD.CRED and COURSE.SECTIONS
Targets for current year are calculated as 5% above previous year
Spring Contact Hours
Fall Contact Hours
Annual Contact Hours
% change from previous year
-1.6%
Summer Contact Hours
Brookhaven College
2014SP
2015SP
2016SP
4.5%
-57.1%
2013FA
2014FA
2015FA
2016FA
2016SU
2014SU
2015SU
0
200,000
400,000
600,000
800,000
1,000,000
1,200,000
1,400,000
1,600,000
1,800,000
2,000,000
2013-2014 2014-2015 2015-2016 2016-2017
Brookhaven College Contact Hours
Fall Spring Summer
4,054,560
3,991,384
4,171,240
1,790,568
0 1,000,000 2,000,000 3,000,000 4,000,000 5,000,000
2013-2014
2014-2015
2015-2016
2016-2017
Annual Contact Hours
20
16
-20
17
Tar
get
4,379,802
41%
0%
20%
40%
60%
80%
100%
Progress to Target
Annual Contact Hours
Brookhaven College PRIE, C. Todd contact hours are not certified 12/14/20166
KPI 1.1.1.3
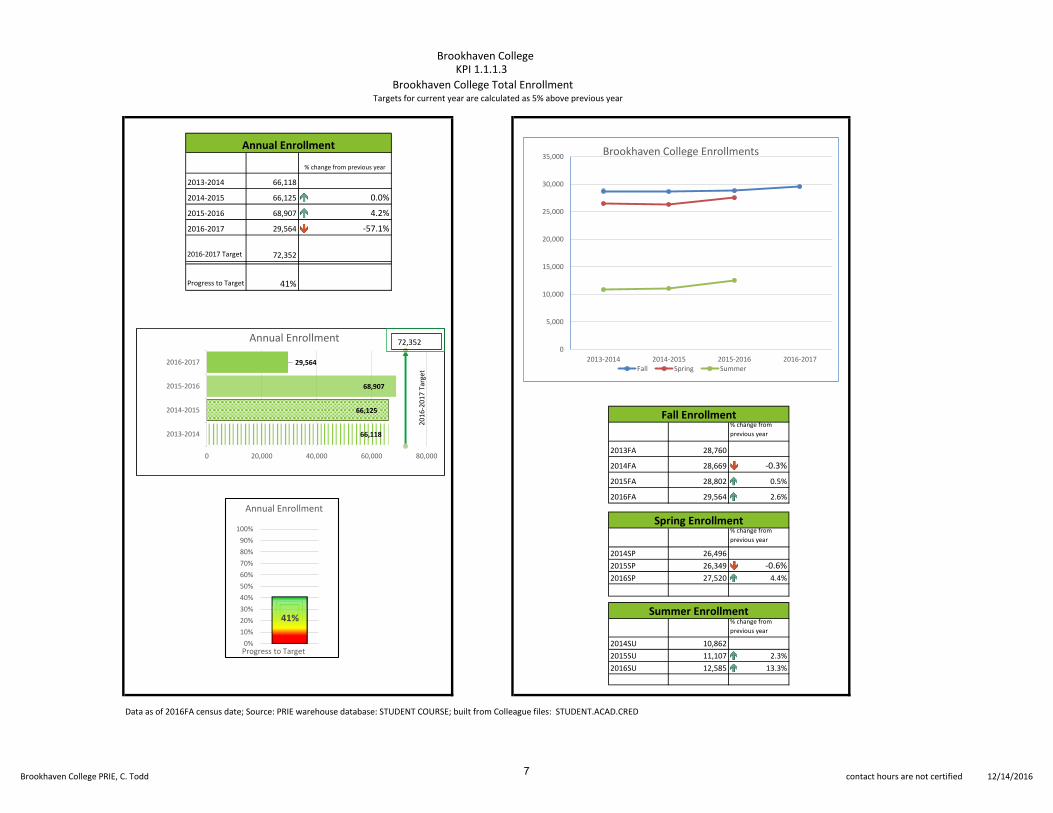
Brookhaven College Total Enrollment
2013-2014 66,118
2014-2015 66,125
2015-2016 68,907
2016-2017 29,564
2016-2017 Target 72,352Target: 72,352
Progress to Target 41%
% change from
previous year
28,760
28,669 -0.3%
28,802 0.5%
29,564 2.6%
% change from
previous year
26,496
26,349 -0.6%
27,520 4.4%
% change from
previous year
10,862
11,107 2.3%
12,585 13.3%
Data as of 2016FA census date; Source: PRIE warehouse database: STUDENT COURSE; built from Colleague files: STUDENT.ACAD.CRED
2014SP
2015SP
2016SP
Summer Enrollment
2014SU
2015SU
2016SU
2013FA
2014FA
2015FA
2016FA
Spring Enrollment
Fall Enrollment
Brookhaven College
Targets for current year are calculated as 5% above previous year
Annual Enrollment
% change from previous year
0.0%
4.2%
-57.1%
0
5,000
10,000
15,000
20,000
25,000
30,000
35,000
2013-2014 2014-2015 2015-2016 2016-2017
Brookhaven College Enrollments
Fall Spring Summer
66,118
66,125
68,907
29,564
0 20,000 40,000 60,000 80,000
2013-2014
2014-2015
2015-2016
2016-2017
Annual Enrollment
20
16
-20
17
Tar
get
72,352
41%
0%
10%
20%
30%
40%
50%
60%
70%
80%
90%
100%
Progress to Target
Annual Enrollment
Brookhaven College PRIE, C. Todd contact hours are not certified 12/14/20167
Brookhaven College
KPI 1.1.1.4
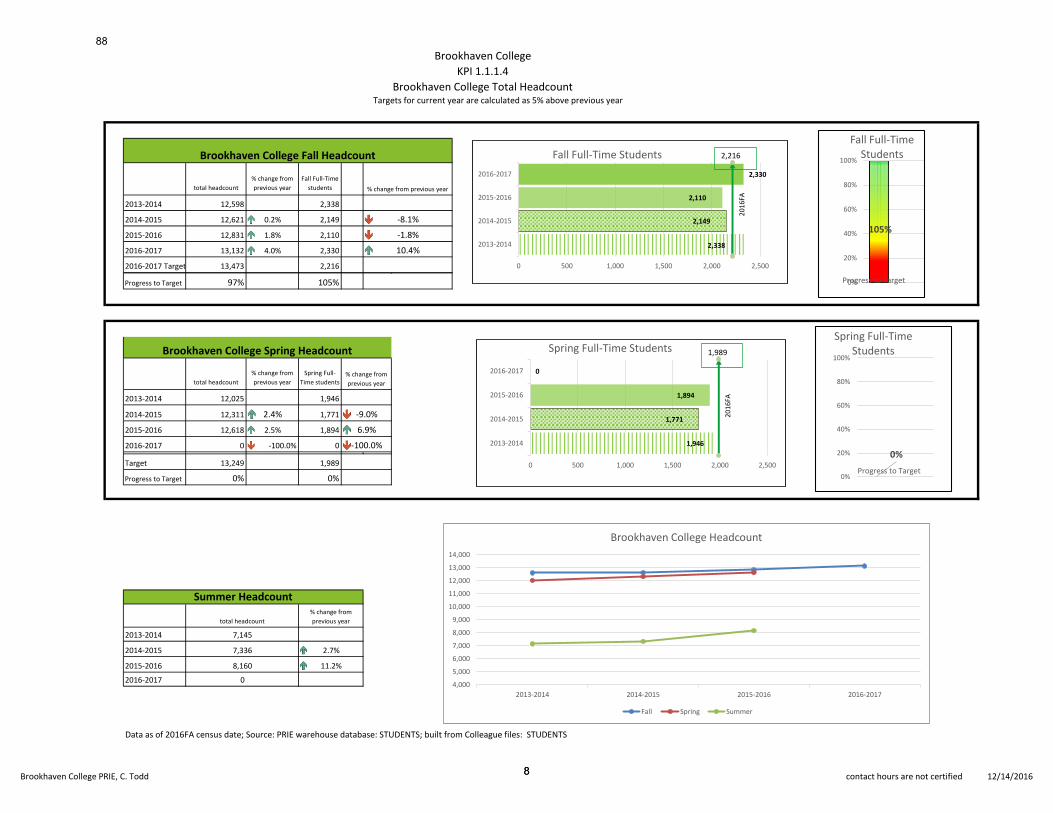
Brookhaven College Total Headcount
total headcount
% change from
previous year
Fall Full-Time
students
2013-2014 12,598 2,338
2014-2015 12,621 0.2% 2,149
2015-2016 12,831 1.8% 2,110
2016-2017 13,132 4.0% 2,330
2016-2017 Target 13,473 2,216Target 2,216
Progress to Target 97% 105%
total headcount
% change from
previous year
Spring Full-
Time students
2013-2014 12,025 1,946
2014-2015 12,311 2.4% 1,771
2015-2016 12,618 2.5% 1,894
2016-2017 0 -100.0% 02016-2017 Target 13,249 1,989
Target 13,249 1,989
Progress to Target 0% 0%
2013-2014
2014-2015
2015-2016
2016-2017
Data as of 2016FA census date; Source: PRIE warehouse database: STUDENTS; built from Colleague files: STUDENTS
total headcount
-8.1%
% change from previous year
Brookhaven College Fall Headcount
-1.8%
10.4%
Brookhaven College Spring Headcount
% change from
previous year
-9.0%
6.9%
-100.0%
% change from
previous year
Summer Headcount
2.7%
7,145
7,336
8,160
0
11.2%
Targets for current year are calculated as 5% above previous year
4,000
5,000
6,000
7,000
8,000
9,000
10,000
11,000
12,000
13,000
14,000
2013-2014 2014-2015 2015-2016 2016-2017
Brookhaven College Headcount
Fall Spring Summer
2,338
2,149
2,110
2,330
0 500 1,000 1,500 2,000 2,500
2013-2014
2014-2015
2015-2016
2016-2017
Fall Full-Time Students
20
16
FA
2,216
105%
0%
20%
40%
60%
80%
100%
Progress to Target
Fall Full-Time Students
1,946
1,771
1,894
0
0 500 1,000 1,500 2,000 2,500
2013-2014
2014-2015
2015-2016
2016-2017
Spring Full-Time Students
20
16
FA
1,989
0%
0%
20%
40%
60%
80%
100%
Progress to Target
Spring Full-Time Students
Brookhaven College PRIE, C. Todd contact hours are not certified 12/14/2016
88
88

Brookhaven CollegeKPI 1.1.1.5
Distance Learning Enrollment and Contact Hours
2013-2014 20,443
2014-2015 21,541
2015-2016 25,123
2016-2017 8,254
2016-2017 Target 26,379Target: 26,379
Progress to Target 31%
% change from
previous year
2013FA 7,371
2014FA 7,541 2.3%
2015FA 8,065 6.9%
2016FA 8,254 2.3%
% change from
previous year
2014SP 7,729
2015SP 8,157 5.5%
2016SP 8,804 7.9%
% change from
previous year
2014SU 5,343
2015SU 5,843 9.4%
2016SU 8,254 41.3%
Data as of 2016FA census date; Source: PRIE warehouse databases: STUDENT COURSE and COURSE; built from Colleague files: STUDENT.ACAD.CRED and COURSE.SECTIONS
% change from
previous year
5.4%
Distance Learning
Annual Enrollment
16.6%
Fall Distance Learning
Enrollment
Spring Distance Learning
Enrollment
Summer Distance Learning
Enrollment
-67.1%
Targets for current year are calculated as 5% above previous year
21,397
18,766
5,518
21,127
18,189
5,265
20,737
18,713
5,680
21,350
7,3717,729
5,3437,541 8,157
5,8438,065
8,8046,905
8,254
0
5,000
10,000
15,000
20,000
25,000
2013FA 2014SP 2014SU 2014FA 2015SP 2015SU 2015FA 2016SP 2016SU 2016FA
Online vs. Face-to-Face Enrollment Face-to-Face
INET
20,443
21,541
25,123
8,254
5,000 10,000 15,000 20,000 25,000
2013-2014
2014-2015
2015-2016
2016-2017
Distance Learning Annual Enrollment26,379
20
16
-20
17
Tar
get
31%
0%
20%
40%
60%
80%
100%
Progress to Target
DL Annual Enrollment
Brookhaven College PRIE, C. Todd contact hours are not certified 12/14/20169

Brookhaven CollegeKPI 1.1.1.5
Distance Learning Contact Hours
2013-2014 1,159,376
2014-2015 1,199,464
2015-2016 1,317,696
2016-2017 467,024
2016-2017 Target 1,383,581Target: 1,383,581
Progress to target 34%
% change from
previous year
1.5%
6.9%
2.1%
% change from
previous year
3.7%
7.0%
% change from
previous year
5.9%
17.9%
Data as of 2016FA census date; Source: PRIE warehouse databases: STUDENT COURSE and COURSE; built from Colleague files: STUDENT.ACAD.CRED and COURSE.SECTIONS
Note: 'Online' refers to class sections with an instructional method of 'INET'; 'Face-to-Face' refers to class sections with an insturctional method of 'LEC'
Spring Distance Learning Contact Hours
2014SP
2015SP
3.5%
9.9%
-64.6%
421,616
427,936
Summer Distance Learning Contact Hours
2014SU
Distance Learning
Annual Contact Hours% change from
previous year
2016SP
439,144
457,600
455,184
487,112
467,024
2015SU
2016SU
298,616
372,984
Targets for current year are calculated as 5% above previous year
Fall Distance Learning Contact Hours
2013FA
2014FA
2015FA
2016FA
316,344
1,333,104
1,197,872
364,480
1,298,640
1,144,456
347,992
1,277,5121,176,864
399,056
1,322,952
421,616439,144
298,616427,936 455,184
316,344457,600 487,112
372,984
467,024
0
200,000
400,000
600,000
800,000
1,000,000
1,200,000
1,400,000
2013FA 2014SP 2014SU 2014FA 2015SP 2015SU 2015FA 2016SP 2016SU 2016FA
Online vs. Face-to-Face Contact Hours Face-to-Face
INET
1,159,376
1,199,464
1,317,696
467,024
300,000 550,000 800,000 1,050,000 1,300,000 1,550,000
2013-2014
2014-2015
2015-2016
2016-2017
Annual DL Contact Hours 1,383,581
20
16-
20
17
34%
0%
20%
40%
60%
80%
100%
Progress to Target
Annual DL contact hours
Brookhaven College PRIE, C. Todd contact hours are not certified 12/14/201610

Brookhaven College
KPI 1.1.1.5
Distance Learning Headcount & Student Load
Student Load includes only Brookhaven online courses; students often take online courses from multiple DCCCD colleges
% change from
previous year
% change from
previous year
% change from
previous year
2013FA 5,325 2014SP 5,620 2014SU 4,255
2014FA 5,373 0.9% 2015SP 5,851 4.1% 2015SU 4,570 7.4%
2015FA 5,830 8.5% 2016SP 6,315 7.9% 2016SU 5,367 17.4%
2016FA 5,856 0.4%
Data as of 2016FA census date; Source: PRIE warehouse databases: STUDENT COURSE and COURSE; built from Colleague files: STUDENT.ACAD.CRED and COURSE.SECTIONS
Fall Distance Learning Headcount
Spring Distance Learning
Headcount
Summer Distance Learning
Headcount
Targets for current year are calculated as 5% above previous year
0 2000 4000 6000
1
2
3
4
Brookhaven Distance Learning Student Load
2016FA 2016SU 2016SP 2015FA
2015SU 2015SP 2014FA
2013FA 2014SP 2014SU 2014FA 2015SP 2015SU 2015FA 2016SP 2016SU 2016FA
4 or more Online Courses 111 115 149 127 128 38 130 134 149 149
3 Online Courses 291 280 152 303 304 135 338 350 195 323
2 Online Courses 1,016 1,088 794 1084 1091 883 1125 1229 1044 1180
1 Online Course 3,907 4,137 3,160 3859 4328 3514 4237 4602 3979 4204
0
1,000
2,000
3,000
4,000
5,000
6,000
7,000
Brookhaven Distance Learning Student Headcount and Load
40%
15%9%
19%
3% 10%
4%
Academic Year 2015-2016 Online Enrollments 2SOSC
2SCMT
2FAPE
2BUWF
2HDEV
2HHS
2COMM
2WLNG
Brookhaven College PRIE, C. Todd contact hours are not certified 12/14/201611

Brookhaven College
KPI 1.1.1.5
Distance Learning Flex vs. Distance Learning Full-Term
Individiual Courses (NOT sections)
# Full-Term DL
Courses
# Flex DL
Courses
Total # DL
Courses Full-Term Flex Total # DL Courses
% change from
previous year
total courses
2013FA 136 90 226 2014SP 150 99 249
2014FA 165 92 257 2015SP 173 114 287 15.3%
2015FA 165 109 274 2016SP 179 124 303 5.6%
2016FA 148 130 278
2016FA Target 288 2017SP Target 318Target: 288 Target: 318
Progress to target 97% Progress to target 0%
Note: 'Distance Learning' refers to classes with an instructional method of 'INET'
Data as of 2016FA census date; Source: PRIE warehouse databases: STUDENT COURSE and COURSE; built from Colleague files: STUDENT.ACAD.CRED and COURSE.SECTIONS
Targets for current year are calculated as 5% above previous year
Fall # Distance Learning Courses
6.6%
1.5%
% change from
previous year
total courses
13.7%
Spring # Distance Learning Courses
050
100150200250300
2013FA 2014FA 2015FA 2016FA
136 165 165
9092 109 130
Fall Distance Learning Courses
Flex
Full Term
226
257
274
278
0 50 100 150 200 250 300
2013FA
2014FA
2015FA
2016FA
Fall Distance Learning Courses 288
20
16
FA T
arge
t
97%
0%
20%
40%
60%
80%
100%
Progress to Target
# DL Fall Courses
050
100150200250300
2014SP 2015SP 2016SP
150 173 179
99114 124
Spring Distance Learning Courses
Flex
Full Term
249
287
303
0 100 200 300
2014SP
2015SP
2016SP
Spring Distance Learning Courses 318
20
17
SP
0%0%
20%
40%
60%
80%
100%
Progress to Target
# DL Spring Courses
Brookhaven College PRIE, C. Todd contact hours are not certified 12/14/201612

Brookhaven College KPI 1.1.2.1
Retention
Current
Target: 37.3% 95.2%
Progress to
Target: Target: 37.3% Target:
Data as of 2016FA census date; Source: PRIE warehouse databases: STUDENT COURSE and STUDENTS; built from Colleague files: STUDENT.ACAD.CRED and STUDENTS
Brookhaven College KPI 1.1.2.2
Persistence (Course Completion)
Target for Long-Term Course Persistence: 92.1%Target 92.1%
Progress to Target: 0.0%
Data as of 2016FA census date; Source: PRIE warehouse database: STUDENT COURSE; built from Colleague file: STUDENT.ACAD.CRED
Targets for current year are calculated as 5% above previous year
Targets for current year are calculated as 5% above previous year
0.0% 56.4%56.4%
Progress to
Target:
87.6%86.8% 87.3%86.2% 86.7%
88.1%
91.5%92.4% 91.9%
75.0%
80.0%
85.0%
90.0%
95.0%
100.0%
2013-2014 2014-2015 2015-2016
Course PersistenceFall
Spring
Summer
86.9%
86.7%
87.7%
0.0% 20.0% 40.0% 60.0% 80.0% 100.0%
2013-2014
2014-2015
2015-2016
2016-2017
Fall & Spring Average Course Persistence
Targ
et
92.1%
0.0%
0.0%
20.0%
40.0%
60.0%
80.0%
100.0%
Progress to Target
Fall/Spring Course Persistence
52.7%
53.6%
53.7%
0.0%
0.0% 10.0% 20.0% 30.0% 40.0% 50.0% 60.0% 70.0%
2013-2014
2014-2015
2015-2016
2016-2017
Fall to Spring Retention
Cu
rre
nt
Targ
et:
56.4%
95.2%
0.0%
20.0%
40.0%
60.0%
80.0%
100.0%
Progress to Target
Fall to Fall Retention
0.0%
0.0%
20.0%
40.0%
60.0%
80.0%
100.0%
Progress to Target
Fall to Spring Retention
35.2%
35.7%
35.6%
0.0% 10.0% 20.0% 30.0% 40.0% 50.0% 60.0% 70.0%
2013-2014
2014-2015
2015-2016
Fall to Fall Retention
Cu
rre
nt
Targ
et:
37.3%
Brookhaven College PRIE, C. Todd contact hours are not certified 12/14/201613
Brookhaven College
KPI 1.1.2.3
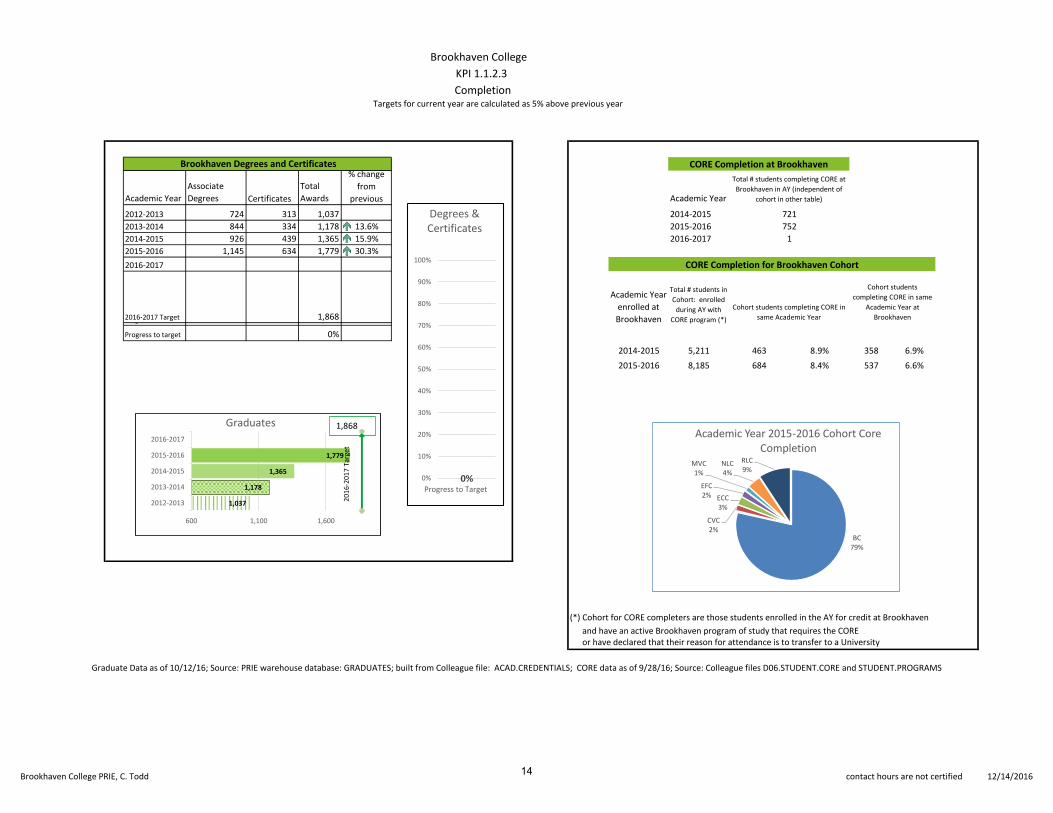
Completion
Academic Year
Associate
Degrees Certificates
Total
Awards Academic Year
2012-2013 724 313 1,037 2014-2015
2013-2014 844 334 1,178 2015-2016
2014-2015 926 439 1,365 2016-2017
2015-2016 1,145 634 1,779
2016-2017
2016-2017 Target 1,868Target: 1,868 # % # %
Progress to target 0%
5,211 463 8.9% 358 6.9%
8,185 684 8.4% 537 6.6%
or have declared that their reason for attendance is to transfer to a University
Graduate Data as of 10/12/16; Source: PRIE warehouse database: GRADUATES; built from Colleague file: ACAD.CREDENTIALS; CORE data as of 9/28/16; Source: Colleague files D06.STUDENT.CORE and STUDENT.PROGRAMS
Targets for current year are calculated as 5% above previous year
13.6%
15.9%
30.3%
Brookhaven Degrees and Certificates% change
from
previous
2015-2016
Cohort students completing CORE in
same Academic Year
CORE Completion at Brookhaven
CORE Completion for Brookhaven Cohort
2014-2015
Cohort students
completing CORE in same
Academic Year at
Brookhaven
Academic Year
enrolled at
Brookhaven
Total # students in
Cohort: enrolled
during AY with
CORE program (*)
Total # students completing CORE at
Brookhaven in AY (independent of
cohort in other table)
721
752
1
and have an active Brookhaven program of study that requires the CORE
(*) Cohort for CORE completers are those students enrolled in the AY for credit at Brookhaven
BC79%
CVC2%
ECC3%
EFC2%
MVC1%
NLC4%
RLC9%
Academic Year 2015-2016 Cohort Core Completion
1,037
1,178
1,365
1,779
600 1,100 1,600
2012-2013
2013-2014
2014-2015
2015-2016
2016-2017
Graduates
20
16
-20
17
Tar
get
1,868
0%0%
10%
20%
30%
40%
50%
60%
70%
80%
90%
100%
Progress to Target
Degrees & Certificates
Brookhaven College PRIE, C. Todd contact hours are not certified 12/14/201614

Brookhaven College
KPI 1.1.3.1
C.E. Enrollment (All Course Types)
Academic Year C.E. Enrollment
% change
from previous
year
2013-2014 12,544
2014-2015 10,753 -14.3%
2015-2016 15,065 40.1%
2016-2017 4,025 -73.3%
2016-2017 Target 15,818Target: 15,818
Progress to target 25.4%
Note: The totals here include Staff Enrichment (type SE) and Non-Course Remedial courses (type CL) and hence will be greater than the sum of the CW and 5 courses in measure 4.1.1.3Data as of 10./10/16; Source: colleague file: COURSE.SECTIONS
Brookhaven C.E. Enrollment
Targets for current year are calculated as 5% above previous year
12,544
10,753
15,065
4,025
0 3,000 6,000 9,000 12,000 15,000
2013-2014
2014-2015
2015-2016
2016-2017
C.E. Enrollment
20
16
-20
17
Tar
get
15,818
25.4%
0.0%
20.0%
40.0%
60.0%
80.0%
100.0%
Progress to Target
C.E. Enrollment
Brookhaven College PRIE, C. Todd contact hours are not certified 12/14/201615

Brookhaven College
KPI 4.1.1.2 `
Students that Migrated from C.E. to Credit within one year
Academic Year
#Students
migrating from
C.E. to Credit
% change
from previous
year
2013-2014 128
2014-2015 152 18.8%2015-2016 193 27.0%
Target 203
2016-2017
Target 203
Progress to
Target 0.0%
Brookhaven Continuing Education to Credit Migration
% of C.E. students
migrating to
Credit
Targets for current year are calculated as 5% above previous year
1.6%
Data as of 10./10/16; Source: colleague files: STUDENTS and STUDENT.ACAD.CRED
2.2%2.1%
128
152
193
0 50 100 150 200
2013-2014
2014-2015
2015-2016
CE to CR Migration 203
20
16
-20
17
Tar
get
0.0%0.0%
10.0%
20.0%
30.0%
40.0%
50.0%
60.0%
70.0%
80.0%
90.0%
100.0%
Progress toTarget
CE to CR Migration
Brookhaven College PRIE, C. Todd contact hours are not certified 12/14/201616

Brookhaven College
KPI 4.1.1.3
C.E. Productivty: Courses Offered, Enrollment, Contact Hours
% change from
previous year
% change from
previous year
% change from
previous year
2013-2014 215 2013-2014 6,511 2013-2014 219,531
2014-2015 197 -8.4% 2014-2015 6,555 0.7% 2014-2015 239,204 9.0%
2015-2016 195 -1.0% 2015-2016 7,496 14.4% 2015-2016 259,776 8.6%
2016-2017 105 -46.2% 2016-2017 972 -87.0% 2016-2017 40,333 -84.5%
2016-2017
Target 205
2016-2017
Target 7,871
2016-2017
Target 272,765Target: 205 Target: 7,871 Target: 272,765
Progress to
Target 51.3%
Progress to
Target 12.3%
Progress to
Target 14.8%
Data as of 10./10/16; Source: colleague file: COURSE.SECTIONS
Brookhaven College Continuing Education
Funded WECM Courses (Course Type 5)
EnrollmentUnique Active Courses
Targets for current year are calculated as 5% above previous year
Contact Hours
215
197
195
105
0 25 50 75 100 125 150 175 200 225 250
2013-2014
2014-2015
2015-2016
2016-2017
# Unique C.E. Funded Courses
20
16
-20
17
Tar
get
205
51.3%
0.0%
10.0%
20.0%
30.0%
40.0%
50.0%
60.0%
70.0%
80.0%
90.0%
100.0%
Progress to Target
CE Funded Courses
6,511
6,555
7,496
1,000 3,000 5,000 7,000 9,000
2013-2014
2014-2015
2015-2016
C.E. Funded Courses - Enrollment
20
16
-20
17
Ta
rget
7,871
219,531
239,204
259,776
40,333
0 50,000 100,000 150,000 200,000 250,000 300,000
2013-2014
2014-2015
2015-2016
2016-2017
C.E. Funded Contact Hours
20
16
-20
17
Tar
get
272,765
12.3%
0.0%
20.0%
40.0%
60.0%
80.0%
100.0%
Progress to Target
CE Funded Enrollment
14.8%
0.0%
20.0%
40.0%
60.0%
80.0%
100.0%
Progress to Target
CE Funded Contact Hours
Brookhaven College PRIE, C. Todd contact hours are not certified 12/14/201617

% change from
previous year
% change from
previous year
% change from
previous year
45 2013-2014 5,224 2013-2014 97,605
39 -13.3% 2014-2015 3,650 -30.1% 2014-2015 91,055 -6.7%
41 5.1% 7,347 101.3% 173,976 91.1%
26 -36.6% 2,941 -60.0% 115,813 -33.4%
43 3,833 182,67543 3,833 182,675
Progress to Target 60.4% 76.7% Progress to Target 63.4%
Data as of 10./10/16; Source: colleague file: COURSE.SECTIONS
2016-2017 2016-2017
Progress to Target
Target:
Enrollment
2015-2016
Unique Active Courses
Brookhaven College Continuing Education
Un-Funded CE Courses (Course Type CW)
2013-2014
2014-2015
2016-2017 TargetTarget:
2015-2016
Target
Contact Hours
2015-2016
2016-2017
2016-2017 Target 2016-2017 Target
45
39
41
26
0 10 20 30 40 50
2013-2014
2014-2015
2015-2016
2016-2017
Unique Un-Funded CE Courses
43
20
16
-20
17
5,224
3,650
7,347
0 2,000 4,000 6,000 8,000
2013-2014
2014-2015
2015-2016
Un-Funded CE Enrollment3,833
97,605
91,055
173,976
0 50,000 100,000 150,000 200,000
2013-2014
2014-2015
2015-2016
Un-Funded CE Contact Hours182,675
20
16
-20
17
Tar
get
20
16
-20
17 T
arge
t
60.4%
0.0%
20.0%
40.0%
60.0%
80.0%
100.0%
Progress to Target
CE Unfunded Courses
76.7%
0.0%
20.0%
40.0%
60.0%
80.0%
100.0%
Progress to Target
CE Unfunded Enrollment
63.4%
0.0%
20.0%
40.0%
60.0%
80.0%
100.0%
Progress to Targete
CE Unfunded Contact Hours
Brookhaven College PRIE, C. Todd contact hours are not certified 12/14/201618

Credit Student Enrollment Fall 2016 Brookhaven College Student Demographics
((*) Unduplicated Student Headcount
White27%
Native AmerAlas
0%
Hispanic39%
Unknown5%
Pac Isl/ Nat
Haw…
Asian11%
Intl1%
Black17%
Brookhaven Fall 2016 Students by Race 15 and
below2%
16-2032%
21-2528%
26-3015%
31-4013%
41-505%
51+5%
Brookhaven Students Fall 2016 by Age Group
Female, 58%
Male , 42%
Brookhaven Students Fall 2016 by Gender
Hispanic, 39%
Non-Hispanic,
55%
Unknown , 6%
Brookhaven Students Fall 2016 by Ethnicity
Full-time17%
Part-time83%
Brookhaven Fall 2016 Students by Status
19
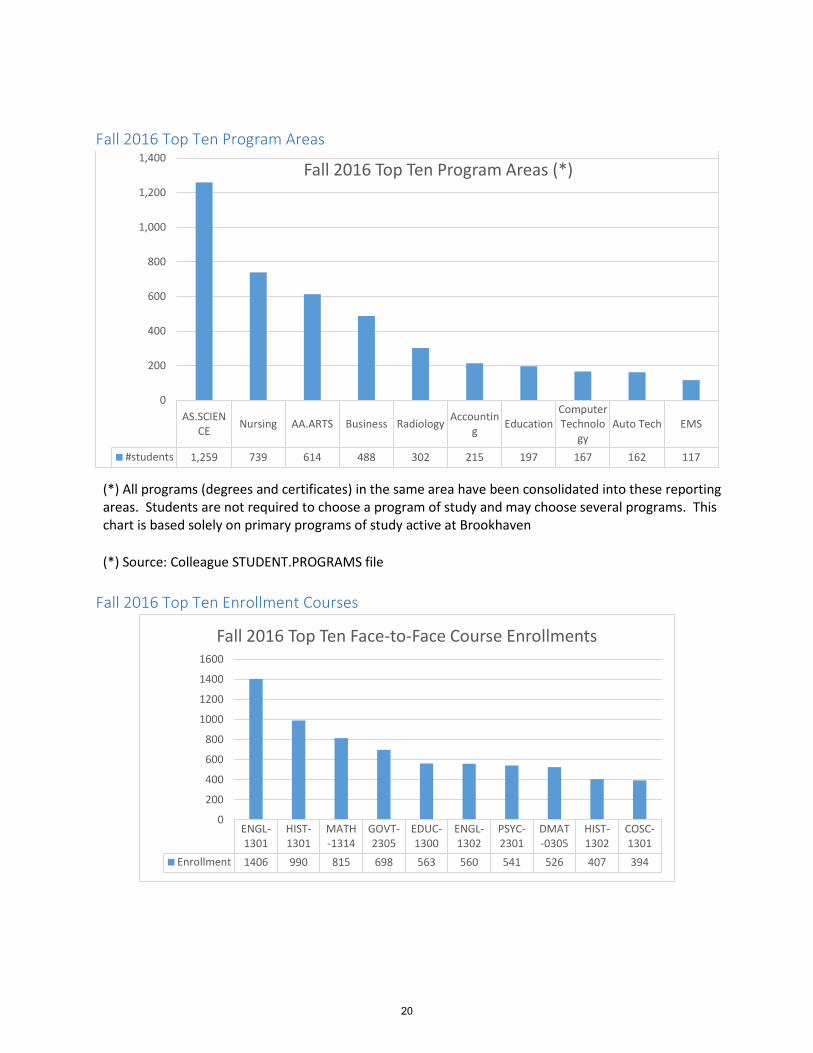
Fall 2016 Top Ten Program Areas
(*) All programs (degrees and certificates) in the same area have been consolidated into these reporting areas. Students are not required to choose a program of study and may choose several programs. This chart is based solely on primary programs of study active at Brookhaven
(*) Source: Colleague STUDENT.PROGRAMS file
Fall 2016 Top Ten Enrollment Courses
AS.SCIENCE Nursing AA.ARTS Business Radiology Accountin
g EducationComputerTechnolo
gyAuto Tech EMS
#students 1,259 739 614 488 302 215 197 167 162 117
0
200
400
600
800
1,000
1,200
1,400Fall 2016 Top Ten Program Areas (*)
ENGL-1301
HIST-1301
MATH-1314
GOVT-2305
EDUC-1300
ENGL-1302
PSYC-2301
DMAT-0305
HIST-1302
COSC-1301
Enrollment 1406 990 815 698 563 560 541 526 407 394
0
200
400
600
800
1000
1200
1400
1600
Fall 2016 Top Ten Face-to-Face Course Enrollments
20

Distance Learning Enrollments
Source: Colleague file STUDENT.ACAD.CRED
Dual Credit and Early College High School Dual Credit and Early College High School Enrollments
HIST-1301
GOVT-2305
GOVT-2306
PSYC-2314
HIST-1302
PSYC-2301
ENGL-1301
MATH-1314
PHED-1164
PHIL-2306
Enrollment 400 383 376 302 254 249 225 219 207 178
050
100150200250300350400450
Fall 2016 Top Ten Online Enrollment Courses
25.3% 26.0% 27.9%
28.8% 30.2% 31.5%
49.2% 52.6% 54.9%
0.0%
20.0%
40.0%
60.0%
80.0%
100.0%
2013-2014 2014-2015 2015-2016
Percentage of Total Credit Enrollment Taught as Distance Learning
Fall Spring Summer
0
500
1000
1500
2000
Fall 2015 Spring 2016 Summer 2016
724 677
29
948 1026
875
Brookhaven College Dual Credit and Early College High School 2015-2016 Enrollments (duplicated)
Brookhaven ECHS Other High Schools
Enrollment Fall 2015
Spring 2016
Summer 2016
Brookhaven ECHS 724 677 29 Other High Schools 948 1026 875
21

Dual Credit and Early College High School Contact Hours
Contact Hours Fall 2015 Spring 2016 Summer 2016 Brookhaven ECHS 44,592 38,336 1,392 Other High Schools 53,904 58,976 51,344
Dual Credit and Early College High School Headcount
Headcount Fall 2015 Spring 2016 Summer 2016 Brookhaven ECHS 291 280 25 Other High Schools 681 769 554
-
20,000
40,000
60,000
80,000
100,000
120,000
Fall 2015 Spring 2016 Summer 2016
44,592 38,336
1,392
53,904 58,976
51,344
Brookhaven College Dual Credit and Early College High School 2015-2016 Contact Hours
Brookhaven ECHS Other High Schools
0200400600800
10001200
Fall 2015 Spring 2016 Summer 2016
291 28025
681 769
554
Brookhaven College Dual Credit and Early College High School Headcounts (unduplicated)
Brookhaven ECHS Other HS
22

Credit Student Statistics Fall Summary of Credit Student Statistics
BROOKHAVEN COLLEGE Summary of Credit Student Statistics
Certification Date September 12, 2016 - CREDIT STUDENT STATISTICS STUDENT PROFILE Fall 2013 Fall 2014 Fall 2015 Fall 2016 Percent Change
(FA16 from FA15) Headcount 12,225 12,284 12,412 13,123 5.7% Total Contact Hours 1,727,216 1,693,768 1,705,312 1,784,296 4.6% Contact Hours (Academic) 1,374,480 79.6% 1,300,680 76.8% 1,337,760 78.4% 1,370,360 76.8% 2.4% Contact Hours (Technical) 352,736 20.4% 393,088 23.2% 367,552 21.6% 413,936 23.2% 12.6% Total Credit Hours 84,293 82,646 83,353 87,425 4.9% FTE (using 15 Credit Hours) 5,620 5,510 5,557 5,828 4.9% Male 5,110 41.8% 5,140 41.8% 5,248 42.3% 5,570 42.4% 6.1% Female 7,115 58.2% 7,144 58.2% 7,164 57.7% 7,553 57.6% 5.4% Part-Time 9,870 80.7% 10,133 82.5% 10,290 82.9% 10,793 82.2% 5.0% Full-Time 2,355 19.3% 2,151 17.5% 2,122 17.1% 2,330 17.8% 8.1% In District 8,520 69.7% 8,465 68.9% 8,497 68.5% 8,856 67.5% 4.2% Out of District 2,644 21.6% 2,796 22.8% 2,774 22.3% 2,813 21.4% 1.4% Out of State 456 3.7% 423 3.4% 366 2.9% 421 3.2% 15.0% Out of Country 605 4.9% 599 4.9% 775 6.2% 1,033 7.9% 33.3% AGE: 15 and below 94 0.8% 111 0.9% 125 1.0% 202 1.5% 61.6%
16-20 3,122 25.5% 3,306 26.9% 3,427 27.6% 3,862 29.4% 12.7% 21-25 3,596 29.4% 3,501 28.5% 3,755 30.3% 3,903 29.7% 3.9% 26-30 1,944 15.9% 1,970 16.0% 1,958 15.8% 2,022 15.4% 3.3% 31-35 1,169 9.6% 1,175 9.6% 1,120 9.0% 1,091 8.3% -2.6% 36-40 736 6.0% 697 5.7% 682 5.5% 682 5.2% 0.0% 41-45 497 4.1% 489 4.0% 402 3.2% 394 3.0% -2.0% 46-50 320 2.6% 287 2.3% 293 2.4% 317 2.4% 8.2% 51+ 747 6.1% 748 6.1% 650 5.2% 650 5.0% 0.0%
Average Student Age 28 28 28 27
RACE*
23

White 4,652 38.1% 4,852 39.5% 4,949 39.9% 5,189 39.5% 4.8% Black / African-American 2,397 19.6% 2,378 19.4% 2,162 17.4% 2,367 18.0% 9.5% Asian/Pacific Islander 1,298 10.6% 1,305 10.6% 1,417 11.4% 1,577 12.0% 11.3% Native American/Alaskan 148 1.2% 200 1.6% 226 1.8% 297 2.3% 31.4% International 132 1.1% 169 1.4% 211 1.7% 228 1.7% 8.1% Other/Not Reported 3,732 30.5% 3,594 29.3% 3,671 29.6% 3,721 28.4% 1.4% Nat Hawaiian/Pacific Isla 24 0.2% 23 0.2% 28 0.2% 29 0.2% 3.6%
ETHNICITY Hispanic/Latino Origin 4,289 35.1% 4,437 36.1% 4,808 38.7% 5,146 39.2% 7.0% Non Hispanic/Latino Origin 7,296 59.7% 7,152 58.2% 6,834 55.1% 7,120 54.3% 4.2% Unknown/Not Reported 640 5.2% 695 5.7% 770 6.2% 857 6.5% 11.3%
Day Students 5,690 46.5% 5,568 45.3% 5,451 43.9% 5,551 42.3% 1.8% Night Students 1,737 14.2% 1,777 14.5% 1,662 13.4% 1,650 12.6% -0.7%Day/Night Students 782 6.4% 756 6.2% 649 5.2% 587 4.5% -9.6%Other Students** 4,016 32.9% 4,183 34.1% 4,650 37.5% 5,335 40.7% 14.7%
First year (29 or less credit hours) 4,773 39.0% 4,997 40.7% 5,226 42.1% 5,555 42.3% 6.3% Second year (30 to 60 credit hours) 4,484 36.7% 4,330 35.2% 4,143 33.4% 4,583 34.9% 10.6% Unclassified 2,968 24.3% 2,957 24.1% 3,043 24.5% 2,985 22.7% -1.9%* Race: Students can choose more than one race**: Online, Weekend, Dual Credit, INETData Source: DCCCD XSS1 Report
2424
2424
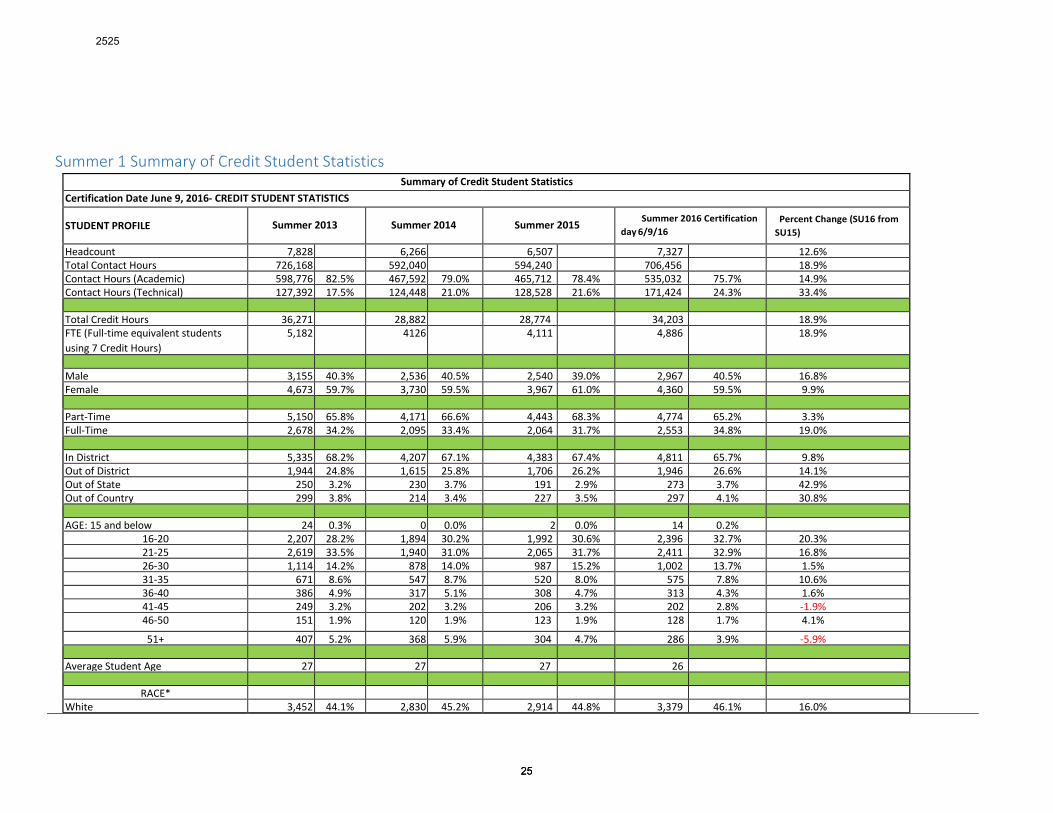
Summer 1 Summary of Credit Student Statistics Summary of Credit Student Statistics
Certification Date June 9, 2016- CREDIT STUDENT STATISTICS
STUDENT PROFILE Summer 2013 Summer 2014 Summer 2015 Summer 2016 Certification day 6/9/16
Percent Change (SU16 from SU15)
Headcount 7,828 6,266 6,507 7,327 12.6% Total Contact Hours 726,168 592,040 594,240 706,456 18.9% Contact Hours (Academic) 598,776 82.5% 467,592 79.0% 465,712 78.4% 535,032 75.7% 14.9% Contact Hours (Technical) 127,392 17.5% 124,448 21.0% 128,528 21.6% 171,424 24.3% 33.4%
Total Credit Hours 36,271 28,882 28,774 34,203 18.9% FTE (Full-time equivalent students using 7 Credit Hours)
5,182 4126 4,111 4,886 18.9%
Male 3,155 40.3% 2,536 40.5% 2,540 39.0% 2,967 40.5% 16.8% Female 4,673 59.7% 3,730 59.5% 3,967 61.0% 4,360 59.5% 9.9%
Part-Time 5,150 65.8% 4,171 66.6% 4,443 68.3% 4,774 65.2% 3.3% Full-Time 2,678 34.2% 2,095 33.4% 2,064 31.7% 2,553 34.8% 19.0%
In District 5,335 68.2% 4,207 67.1% 4,383 67.4% 4,811 65.7% 9.8% Out of District 1,944 24.8% 1,615 25.8% 1,706 26.2% 1,946 26.6% 14.1% Out of State 250 3.2% 230 3.7% 191 2.9% 273 3.7% 42.9% Out of Country 299 3.8% 214 3.4% 227 3.5% 297 4.1% 30.8%
AGE: 15 and below 24 0.3% 0 0.0% 2 0.0% 14 0.2% 16-20 2,207 28.2% 1,894 30.2% 1,992 30.6% 2,396 32.7% 20.3% 21-25 2,619 33.5% 1,940 31.0% 2,065 31.7% 2,411 32.9% 16.8% 26-30 1,114 14.2% 878 14.0% 987 15.2% 1,002 13.7% 1.5% 31-35 671 8.6% 547 8.7% 520 8.0% 575 7.8% 10.6% 36-40 386 4.9% 317 5.1% 308 4.7% 313 4.3% 1.6% 41-45 249 3.2% 202 3.2% 206 3.2% 202 2.8% -1.9%46-50 151 1.9% 120 1.9% 123 1.9% 128 1.7% 4.1% 51+ 407 5.2% 368 5.9% 304 4.7% 286 3.9% -5.9%
Average Student Age 27 27 27 26
RACE* White 3,452 44.1% 2,830 45.2% 2,914 44.8% 3,379 46.1% 16.0%
2525
2525

Black/African-American 1,325 16.9% 1,103 17.6% 1,146 17.6% 1,231 16.8% 7.4% Asian/Pacific Islander 959 12.3% 757 12.1% 813 12.5% 952 13.0% 17.1% Native American/Alaskan 87 1.1% 88 1.4% 101 1.6% 142 1.9% 40.6% International 74 0.9% 67 1.1% 89 1.4% 91 1.2% 2.2% Other/Not Reported 2,018 25.8% 1,519 24.2% 1,565 24.1% 1,673 22.8% 6.9% Nat Hawaiian/Pacific Isla 20 0.3% 11 0.2% 12 0.2% 22 0.3% 83.3%
ETHNICITY Hispanic/Latino Origin 2,238 28.6% 1,742 27.8% 2,011 30.9% 2,253 30.7% 12.0% Non Hispanic/Latino Origin 5,176 66.1% 4,184 66.8% 4,111 63.2% 4,600 62.8% 11.9% Unknown/Not Reported 414 5.3% 340 5.4% 385 5.9% 474 6.5% 23.1% Day Students 2,924 37.4% 2,338 37.3% 2,332 35.8% 2,368 32.3% 1.5% Night Students 768 9.8% 613 9.8% 548 8.4% 620 8.5% 13.1% Day/Night Students 188 2.4% 152 2.4% 116 1.8% 115 1.6% -0.9% Other Students** 3,948 50.4% 3,163 50.5% 3,511 54.0% 4,224 57.6% 20.3% First year (29 or less credit hours) 1,721 22.0% 2,433 38.8% 2,491 38.3% 2,930 40.0% 17.6% Second year (30 to 60 credit hours) 3,308 42.3% 2,096 33.5% 2,194 33.7% 2,488 34.0% 13.4% Unclassified 2,799 35.8% 1,737 27.7% 1,822 28.0% 1,909 26.1% 4.8% * Race: Students can choose more than one race **: Dual Credit, Online (INET) or Weekend Data Source: DCCCD XSS1 Report, Planning, Research and Institutional Effectiveness NOTE: District totals are unduplicated
* Race: Students can choose more than one race **: Online or Weekend, etc. Data Source: DCCCD XSS1 Report, Planning, Research and Institutional Effectiveness NOTE: District totals are unduplicated
Prepared by Marianne Roffino
26
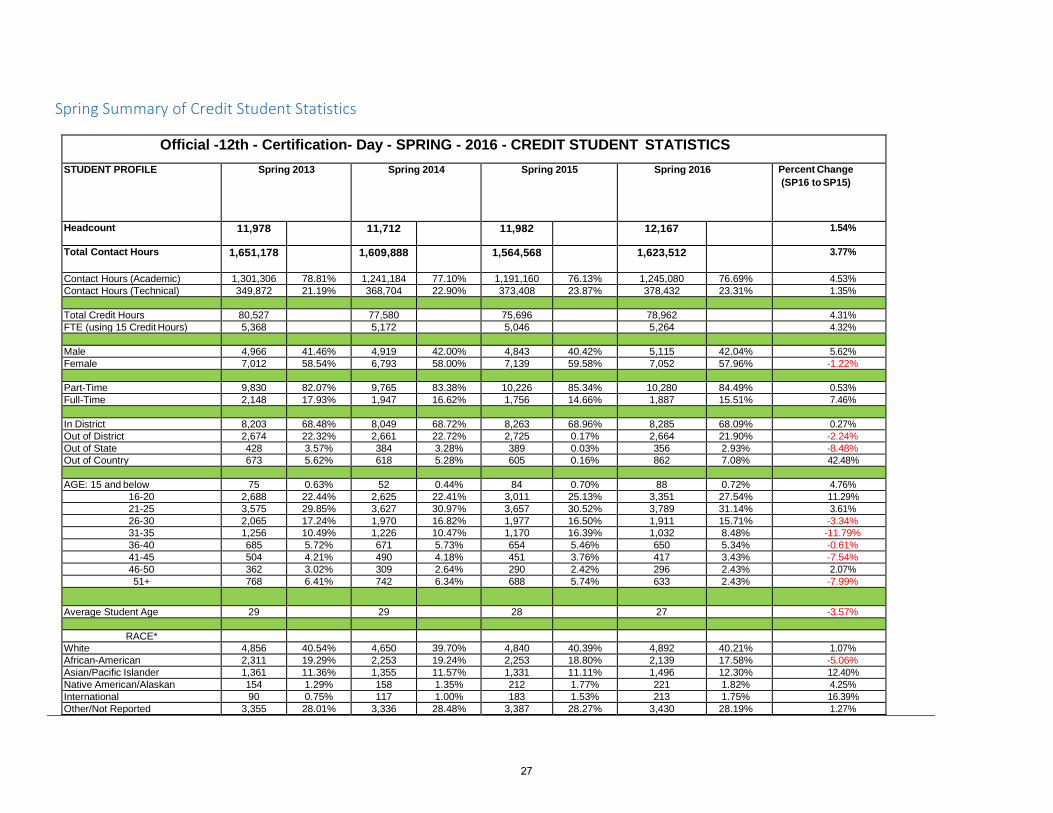
Spring Summary of Credit Student Statistics
Official -12th - Certification- Day - SPRING - 2016 - CREDIT STUDENT STATISTICS STUDENT PROFILE Spring 2013 Spring 2014 Spring 2015 Spring 2016 Percent Change
(SP16 to SP15)
Headcount 11,978 11,712 11,982 12,167 1.54% Total Contact Hours 1,651,178 1,609,888 1,564,568 1,623,512 3.77%
Contact Hours (Academic) 1,301,306 78.81% 1,241,184 77.10% 1,191,160 76.13% 1,245,080 76.69% 4.53% Contact Hours (Technical) 349,872 21.19% 368,704 22.90% 373,408 23.87% 378,432 23.31% 1.35% Total Credit Hours 80,527 77,580 75,696 78,962 4.31% FTE (using 15 Credit Hours) 5,368 5,172 5,046 5,264 4.32% Male 4,966 41.46% 4,919 42.00% 4,843 40.42% 5,115 42.04% 5.62% Female 7,012 58.54% 6,793 58.00% 7,139 59.58% 7,052 57.96% -1.22% Part-Time 9,830 82.07% 9,765 83.38% 10,226 85.34% 10,280 84.49% 0.53% Full-Time 2,148 17.93% 1,947 16.62% 1,756 14.66% 1,887 15.51% 7.46% In District 8,203 68.48% 8,049 68.72% 8,263 68.96% 8,285 68.09% 0.27% Out of District 2,674 22.32% 2,661 22.72% 2,725 0.17% 2,664 21.90% -2.24% Out of State 428 3.57% 384 3.28% 389 0.03% 356 2.93% -8.48% Out of Country 673 5.62% 618 5.28% 605 0.16% 862 7.08% 42.48% AGE: 15 and below 75 0.63% 52 0.44% 84 0.70% 88 0.72% 4.76%
16-20 2,688 22.44% 2,625 22.41% 3,011 25.13% 3,351 27.54% 11.29% 21-25 3,575 29.85% 3,627 30.97% 3,657 30.52% 3,789 31.14% 3.61% 26-30 2,065 17.24% 1,970 16.82% 1,977 16.50% 1,911 15.71% -3.34% 31-35 1,256 10.49% 1,226 10.47% 1,170 16.39% 1,032 8.48% -11.79% 36-40 685 5.72% 671 5.73% 654 5.46% 650 5.34% -0.61% 41-45 504 4.21% 490 4.18% 451 3.76% 417 3.43% -7.54% 46-50 362 3.02% 309 2.64% 290 2.42% 296 2.43% 2.07% 51+ 768 6.41% 742 6.34% 688 5.74% 633 2.43% -7.99%
Average Student Age 29 29 28 27 -3.57%
RACE* White 4,856 40.54% 4,650 39.70% 4,840 40.39% 4,892 40.21% 1.07% African-American 2,311 19.29% 2,253 19.24% 2,253 18.80% 2,139 17.58% -5.06% Asian/Pacific Islander 1,361 11.36% 1,355 11.57% 1,331 11.11% 1,496 12.30% 12.40% Native American/Alaskan 154 1.29% 158 1.35% 212 1.77% 221 1.82% 4.25% International 90 0.75% 117 1.00% 183 1.53% 213 1.75% 16.39% Other/Not Reported 3,355 28.01% 3,336 28.48% 3,387 28.27% 3,430 28.19% 1.27%
27

Nat Hawaiian/Pacific Isla 17 0.14% 20 0.17% 22 0.18% 29 0.24% 31.82% ETHNICITY Hispanic/Latino Origin 3,700 30.89% 3,807 32.51% 4,284 35.75% 4,544 37.35% 6.07% Non Hispanic/Latino Origin 7,653 63.89% 7,250 61.90% 7,016 58.55% 6,816 56.02% -2.85% Unknown/Not Reported 625 5.22% 655 48.34% 682 5.69% 807 6.63% 18.33% Day Students 5,226 43.63% 5,169 44.13% 4,920 41.06% 4,791 39.38% -2.62% Night Students 1,715 14.32% 1,605 13.70% 1,633 13.63% 1,573 12.93% -3.67% Day/Night Students 828 6.91% 724 6.18% 633 5.28% 627 5.15% -0.95% Other Students** 4,209 35.14% 4,214 35.98% 4,796 40.03% 5,176 42.54% 7.92% First year (29 or less credit 4,078 34.05% 3,839 32.78% 4,270 35.64% 4,487 36.88% 5.08% Second year (30 to 60 credit 4,785 39.95% 4,549 38.84% 4,428 36.96% 4,473 36.76% 1.02% Unclassified 3,115 26.01% 3,324 28.38% 3,284 27.41% 3,207 26.36% -2.34% * Race: Students can choose more than one race **: Online or Weekend, etc. Data Source: DCCCD, XSS1 Report, Planning, Research and Institutional Effectiveness
Prepared by Marianne Roffino
28

Student Success, Retention and Completion Student Retention
(*) Unduplicated Headcount
0.0%
20.0%
40.0%
60.0%
80.0%
100.0%
2011 2012 2013 2014 2015
50.0% 55.2% 56.1% 61.2% 58.9%
32.8% 34.9% 35.0% 35.4% 35.5%
Fall-to-Fall Retention
% FT FTIC % Brookhaven
0.0%10.0%20.0%30.0%40.0%50.0%60.0%70.0%80.0%90.0%
100.0%
2011FA 2012FA 2013FA 2014FA 2015FA
68.3%76.8% 74.6% 77.3% 78.5%
50.9% 51.9% 52.4% 53.5% 53.7%
Fall to Spring Retention
% FT FTIC
Female58%
Male42%
Returned from Fall 2015*4,557 Fall 2016 students returned
from Fall 2015
Asian12%
Black/African American
13%
Hispanic44%
International1%
Unknown/Not Reported
4%
White26%
Returned from Fall 2015*4,557 Fall 2016 students returned from Fall 2015
29

Course Success and Completion Rates
0.0%10.0%20.0%30.0%40.0%50.0%60.0%70.0%80.0%90.0%
100.0%
2011FA 2012FA 2013FA 2014FA 2015FA
57.8%63.6% 58.6% 60.4% 62.7%65.1% 66.2% 66.6% 65.0% 67.4%
Fall Course Success Rates (Grades A, B, C)
%FT FITC Success %Brookhaven Success
0.0%
20.0%
40.0%
60.0%
80.0%
100.0%
2011FA 2012FA 2013FA 2014FA 2015FA
86.3% 88.5% 86.7% 88.4% 87.6%86.6% 86.4% 87.6% 86.8% 87.3%
Fall Course Completion Rates
%FT FTIC Completion %Brookhaven Completion
0.00%
20.00%
40.00%
60.00%
80.00%
100.00%
2011FA 2012FA 2013FA 2014FA 2015FA
68.04% 69.59% 69.80% 67.79% 69.63%
55.52% 55.27% 57.16% 56.88% 61.70%
Brookhaven Fall Course Success Rates(Grades A, B, C)
Face-to-Face Online
0.00%
20.00%
40.00%
60.00%
80.00%
100.00%
2011FA 2012FA 2013FA 2014FA 2015FA
87.80% 88.06% 89.04% 88.16% 88.47%82.68% 81.07% 83.42% 82.90% 84.21%
Brookhaven Fall Course Completion Rates (all grades except W)
Face-to-Face Online
30

2015-2016 Success, Drop, Fail by Department Automotive Division
Subject Success Drop Fail AUMT 91.63% 2.29% 6.08%
91.63%
2.29%
6.08%
0% 20% 40% 60% 80% 100%
AUMT
2015-2016 Course SuccessAutomotive
Success
Drop
Fail
31

Business Division
Subject Success Drop Fail ACCT 55.05% 18.25% 26.71% ACNT 56.55% 17.42% 26.03% ARTC 69.41% 15.94% 14.65% ARTV 81.08% 13.51% 5.41% AUMT 93.71% 0.63% 5.66% BCIS 67.91% 11.42% 20.67% BMGT 68.78% 12.70% 18.52% BUSI 57.35% 10.60% 32.05% COSC 61.84% 11.89% 26.27% ECON 67.01% 12.10% 20.89% HITT 83.33% 9.03% 7.64% HPRS 90.63% 6.25% 3.13% HRPO 88.07% 1.83% 10.09% IMED 69.97% 17.49% 12.54% INEW 83.33% 8.33% 8.33% ITCC 66.13% 14.52% 19.35% ITMC 75.00% 0.00% 25.00% ITMT 79.31% 10.34% 10.34% ITNW 81.44% 5.15% 13.40% ITSC 81.60% 9.38% 9.03% ITSE 64.04% 19.24% 16.72% ITSW 50.00% 21.67% 28.33% ITSY 62.69% 4.48% 32.84% MDCA 74.53% 10.85% 14.62% MRKG 65.81% 8.55% 25.64% POFI 84.41% 7.50% 8.09% POFM 75.69% 9.72% 14.58% POFT 75.25% 10.37% 14.38% SPNL 61.54% 26.15% 12.31%
61.54%75.25%75.69%
84.41%65.81%
74.53%62.69%
50.00%64.04%
81.60%81.44%
79.31%75.00%
66.13%83.33%
69.97%88.07%90.63%
83.33%67.01%
61.84%57.35%
68.78%67.91%
93.71%81.08%
69.41%56.55%
55.05%
26.15%10.37%9.72%
7.50%8.55%
10.85%4.48%
21.67%19.24%
9.38%5.15%10.34%
0.00%14.52%
8.33%17.49%
1.83%6.25%
9.03%12.10%
11.89%10.60%
12.70%11.42%
0.63%13.51%
15.94%17.42%
18.25%
12.31%14.38%14.58%
8.09%25.64%
14.62%32.84%
28.33%16.72%
9.03%13.40%
10.34%25.00%
19.35%8.33%
12.54%10.09%
3.13%7.64%
20.89%26.27%
32.05%18.52%
20.67%5.66%5.41%
14.65%26.03%26.71%
0% 20% 40% 60% 80% 100%
SPNLPOFT
POFMPOFI
MRKGMDCA
ITSYITSWITSEITSC
ITNWITMTITMCITCC
INEWIMEDHRPOHPRSHITT
ECONCOSCBUSI
BMGTBCIS
AUMTARTVARTCACNTACCT
2015-2016 Course SuccessBusiness Division
Success
Drop
Fail
32

Communications Division
Subject Success Drop Fail BASR 36.73% 6.12% 57.14% BASW 45.10% 3.92% 50.98% COMM 83.13% 6.02% 10.84% DIRW 44.70% 16.05% 39.26% DREA 54.47% 10.09% 35.45% DWRI 44.90% 15.74% 39.36% ENGL 65.88% 14.82% 19.31% NCDR 62.88% 10.98% 26.14% NCDW 43.92% 18.52% 37.57% SPCH 76.28% 10.32% 13.40%
76.28%
43.92%
62.88%
65.88%
44.90%
54.47%
44.70%
83.13%
45.10%
36.73%
10.32%
18.52%
10.98%
14.82%
15.74%
10.09%
16.05%
6.02%
3.92%
6.12%
13.40%
37.57%
26.14%
19.31%
39.36%
35.45%
39.26%
10.84%
50.98%
57.14%
0% 20% 40% 60% 80% 100%
SPCH
NCDW
NCDR
ENGL
DWRI
DREA
DIRW
COMM
BASW
BASR
2015-2016 Course SuccessCommunications Division
Success
Drop
Fail
33

Fine Arts Division
Human Development Division
83.88%
75.96%
96.52%
94.99%
82.05%
74.54%
77.01%
87.89%
86.08%
7.04%
11.06%
2.78%
3.43%
3.42%
9.20%
8.29%
8.47%
6.27%
9.08%
12.98%
0.70%
1.58%
14.53%
16.27%
14.69%
3.63%
7.65%
0% 20% 40% 60% 80% 100%
PHED
MUSI
MUEN
MUAP
KINE
HUMA
DRAM
DANC
ARTS
2015-2016 Course SuccessFine Arts Division
Success
Drop
Fail
0% 20% 40% 60% 80% 100%
HDEV
2015-2016 Course SuccessHuman Development
Success
Subject Success Drop Fail ARTS 86.08% 6.27% 7.65% DANC 87.89% 8.47% 3.63% DRAM 77.01% 8.29% 14.69% HUMA 74.54% 9.20% 16.27% KINE 82.05% 3.42% 14.53% MUAP 94.99% 3.43% 1.58% MUEN 96.52% 2.78% 0.70% MUSI 75.96% 11.06% 12.98% PHED 83.88% 7.04% 9.08%
Subject Success HDEV 100.00%
34

Health and Human Services Division
94.12%
58.54%
88.10%
78.30%
97.14%
87.56%
64.55%
93.66%
82.37%
5.88%
22.76%
7.22%
7.16%
2.86%
3.29%
11.09%
5.63%
5.40%
18.70%
4.69%
14.55%
9.15%
24.36%
0.70%
12.23%
0% 20% 40% 60% 80% 100%
VIRT
TECA
RNSG
RADR
HPRS
EMSP
EDUC
CTMT
CDEC
2015-2016 Course SuccessHealth and Human Services
Success
Drop
Fail
Subject Success Drop Fail CDEC 82.37% 5.40% 12.23% CTMT 93.66% 5.63% 0.70% EDUC 64.55% 11.09% 24.36% EMSP 87.56% 3.29% 9.15% HPRS 97.14% 2.86% 0.00% RADR 78.30% 7.16% 14.55% RNSG 88.10% 7.22% 4.69% TECA 58.54% 22.76% 18.70% VIRT 94.12% 5.88% 0.00%
35

Math and Science Division
58.59%
74.96%
60.38%
58.63%
62.45%
78.18%
91.30%
45.59%
62.14%
69.64%
52.90%
20.47%
12.94%
16.51%
18.97%
9.96%
10.55%
2.90%
18.59%
21.37%
14.95%
7.10%
20.94%
12.10%
23.11%
22.40%
27.59%
11.27%
5.80%
35.82%
16.49%
15.41%
40.00%
0% 20% 40% 60% 80% 100%
SCIT
PHYS
NCDM
MATH
GISC
GEOL
ENGR
DMAT
CHEM
BIOL
BASM
2015-2016 Course SuccessMath & Science Division
Success
Drop
Fail
Subject Success Drop Fail BASM 52.90% 7.10% 40.00% BIOL 69.64% 14.95% 15.41% CHEM 62.14% 21.37% 16.49% DMAT 45.59% 18.59% 35.82% ENGR 91.30% 2.90% 5.80% GEOL 78.18% 10.55% 11.27% GISC 62.45% 9.96% 27.59% MATH 58.63% 18.97% 22.40% NCDM 60.38% 16.51% 23.11% PHYS 74.96% 12.94% 12.10% SCIT 58.59% 20.47% 20.94%
36

Social Science Division
World Languages Division
76.58%
77.46%
70.18%
69.99%
72.97%
70.49%
82.70%
77.25%
73.30%
10.67%
6.96%
12.11%
9.05%
9.46%
15.56%
7.27%
4.03%
10.68%
12.75%
15.58%
17.71%
20.96%
17.57%
13.95%
10.03%
18.73%
16.02%
0% 20% 40% 60% 80% 100%
SOCI
PSYC
PHIL
HIST
HDEV
GOVT
GEOG
CRIJ
ANTH
2015-2016 Course SuccessSocial Science Division
Success
Drop
Fail
Subject Success Drop Fail ANTH 73.30% 10.68% 16.02% CRIJ 77.25% 4.03% 18.73% GEOG 82.70% 7.27% 10.03% GOVT 70.49% 15.56% 13.95% HDEV 72.97% 9.46% 17.57% HIST 69.99% 9.05% 20.96% PHIL 70.18% 12.11% 17.71% PSYC 77.46% 6.96% 15.58% SOCI 76.58% 10.67% 12.75%
37

79.06%
75.00%
72.09%
66.67%
77.65%
74.32%
77.30%
63.95%
72.27%
77.49%
58.82%
54.90%
11.42%
14.29%
11.63%
0.00%
17.65%
16.22%
9.93%
6.98%
17.65%
3.39%
0.00%
21.57%
9.53%
10.71%
16.28%
33.33%
4.71%
9.46%
12.77%
29.07%
10.08%
19.12%
41.18%
23.53%
0% 20% 40% 60% 80% 100%
SPAN
SGNL
RUSS
NCER
KORE
JAPN
ITAL
GERM
FREN
ESOL
DIRS
CHIN
2015-2016 Course SuccessWorld Languages Division
Success
Drop
Fail
Subject Success Drop Fail CHIN 54.90% 21.57% 23.53% DIRS 58.82% 0.00% 41.18% ESOL 77.49% 3.39% 19.12% FREN 72.27% 17.65% 10.08% GERM 63.95% 6.98% 29.07% ITAL 77.30% 9.93% 12.77% JAPN 74.32% 16.22% 9.46% KORE 77.65% 17.65% 4.71% NCER 66.67% 0.00% 33.33% RUSS 72.09% 11.63% 16.28% SGNL 75.00% 14.29% 10.71% SPAN 79.06% 11.42% 9.53%
38

Degrees and Certificates
Degree #awards A 370 C1 554 ATC 26 AAT 15 C2 45 AAS 239 AS 521 ES 9
Brookhaven Degree and Certificate totals by Category
Category 2011-2012 2012-2013 2013-2014 2014-2015 2015-2016 Accounting 47 45 64 77 105 Advertising/Public Relations/Journalism 1 1 2 6 5 Associate of Arts 185 188 276 277 347 Associate of Science 237 292 325 395 506 Automotive Technology 87 182 144 168 357 BOSS 11 31 21 12 26 Business 23 17 21 32 21 Child Development 13 27 28 10 12 Computer Info Tech 25 25 50 115 75 Criminal Justice 5 7 9 15 46 EMS 28 10 36 40 59 GIS 12 8 5 11 10 Management 20 30 16 36 34 Marketing 2 1 4 5 3 Medical Front Office 21 12 25 14 16 Nursing 96 81 72 54 71 Radiology 52 45 42 54 56 Teacher Prep 10 9 16 16 15 Unknown 0 0 0 0 1 Visual Communication 13 26 22 28 14
ATC1%
A21%
C23%
AAS13%
AAT1%
AS29%
C131%
ES1%
2015-2016 Brookhaven Graduates
39

Licensure Pass Rates
Source: Texas Higher Education Coordinating Board
Job Placement Rates
Student Job Placement Rates (FY 2010)
(FY 2011)
(FY 2012)
(FY 2013)
(FY 2014)
Graduate Success - Academic - Employed Only - Total 43.9% 45.6% 43.7% 43.0% 44.0%
Graduate Success - Academic - Enrolled and Employed - Total 26.0% 23.9% 28.3% 20.6% 24.4%
Graduate Success - Technical - Employed Only - Total 78.6% 74.3% 73.0% 81.1% 82.6%
Graduate Success - Technical - Enrolled and Employed - Total 4.5% 7.8% 7.2% 5.4% 6.4%
Source: Texas Higher Education Coordinating Board Accountability System: Success: Contextual Measures
0.0%
20.0%
40.0%
60.0%
80.0%
100.0%
2009-2010 2010-2011 2011-2012 2012-2013 2013-2014
Brookhaven College Licensure Pass RatesEmergencyMedical
Nursing
Radiology
0.00%
20.00%
40.00%
60.00%
80.00%
100.00%
(FY 2010) (FY 2011) (FY 2012) (FY 2013) (FY 2014)
Brookhaven College Job Placement Rates Graduate Success -Academic - EmployedOnly - Total
Graduate Success -Academic - Enrolledand Employed - Total
Graduate Success -Technical - EmployedOnly - Total
Graduate Success -Technical - Enrolledand Employed - Total
Emergency Medical Nursing Radiology 2010-2011 74.0% 90.0% 100.0% 2011-2012 89.7% 93.7% 100.0% 2012-2013 75.9% 93.3% 100.0% 2013-2014 86.7% 72.3% 100.0% 2014-2015 83.9% 84.6% 100.0%
40
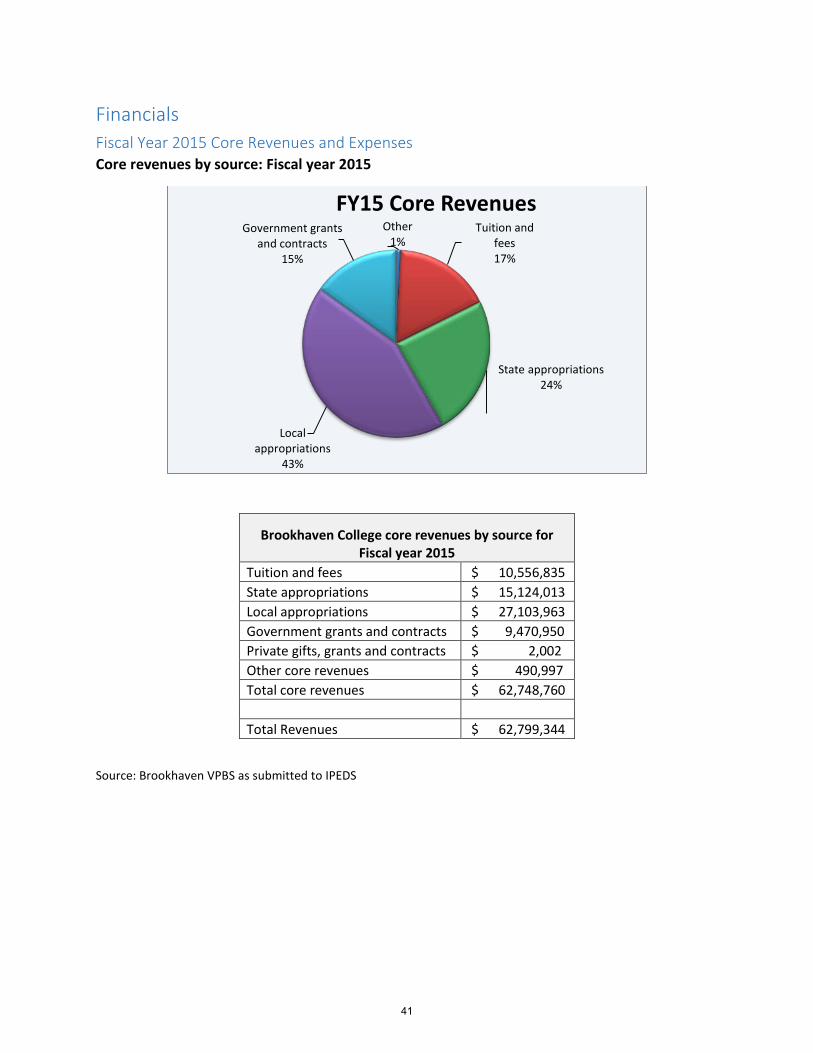
Financials Fiscal Year 2015 Core Revenues and Expenses Core revenues by source: Fiscal year 2015
Brookhaven College core revenues by source for Fiscal year 2015
Tuition and fees $ 10,556,835 State appropriations $ 15,124,013 Local appropriations $ 27,103,963 Government grants and contracts $ 9,470,950 Private gifts, grants and contracts $ 2,002 Other core revenues $ 490,997 Total core revenues $ 62,748,760 Total Revenues $ 62,799,344
Source: Brookhaven VPBS as submitted to IPEDS
Other1%
Tuition and fees17%
State appropriations24%
Local appropriations
43%
Government grants and contracts
15%
FY15 Core Revenues
41

Core expenses by source: Fiscal year 2015
Brookhaven College FY 2015 Core Expenses Instruction $ 33,823,297 Research $ - Public Service $ 1,013,451 Academic Support $ 2,501,299 Student Services $ 6,039,314 Institutional support $ 7,700,492 Scholarships, net $ 6,208,545 Auxillary enterprises $ 2,071,342 Total expenses $ 59,357,740
12-month student FTE 6,057 Expenses per FTE $ 9,799.86
Source: Brookhaven VPBS as submitted to IPEDS
Instruction57%
Public Service2%
Academic Support
4%
Student Services
10%
Institutional support
13%
Scholarships, net10%
Auxillary enterprises
4%
FY15 Core Expenses
42

Full-Time Employee Demographics
Administrators6%
Professional Support Staff
61%
Faculty33%
2015-2016 Full-Time Employees by TypeAmerican Indian/Alaskan
0% Asian7%
Black/African American
17%
Hispanic17%
International0%
Unknown/Not Reported1%
White58%
2015-2016 Full-Time Employees Gender and Race
43
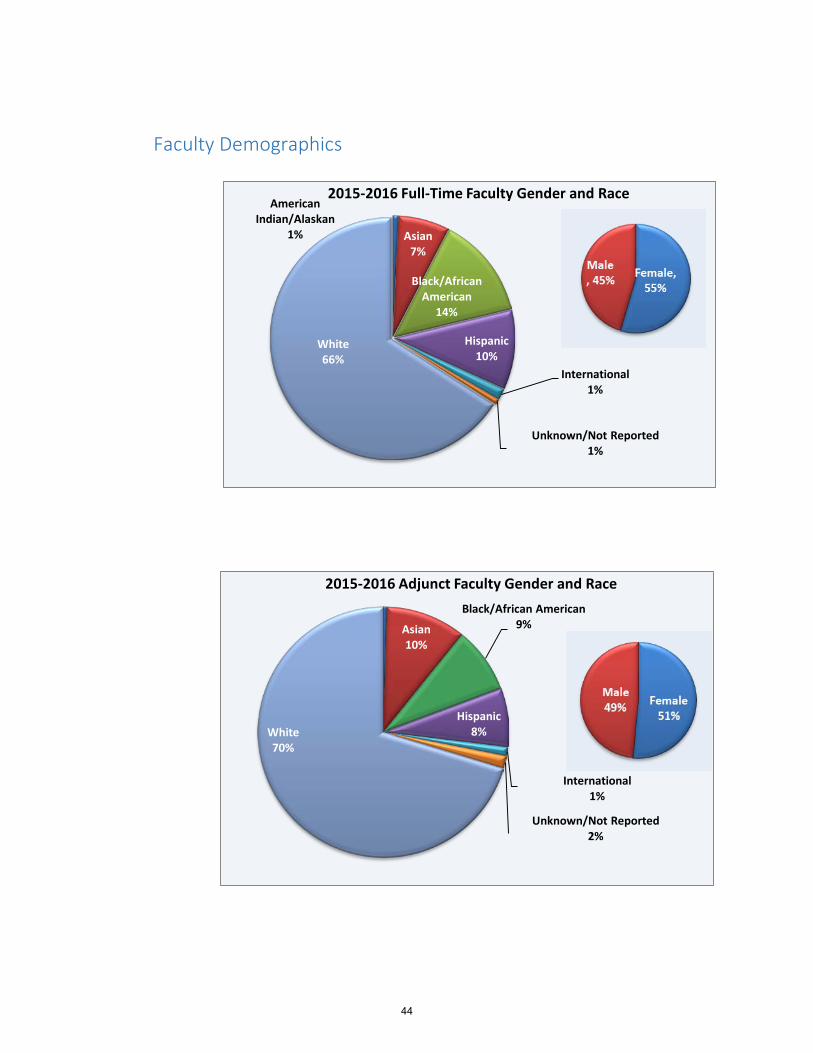
Faculty Demographics
American Indian/Alaskan
1% Asian7%
Black/African American
14%
Hispanic10%
International1%
Unknown/Not Reported1%
White66%
2015-2016 Full-Time Faculty Gender and Race
Asian10%
Black/African American9%
Hispanic8%
International1%
Unknown/Not Reported2%
White70%
2015-2016 Adjunct Faculty Gender and Race
44