annual financial report 2011 – 2012€¦ · the queen and his royal highness . the duke of...
TRANSCRIPT

annual financial report 2011 – 2012
ERC120644
Phot
o: M
arvi
n Bl
ake
Phot
o: S
hann
on M
cGra
th
120644 CHANDRA RCH Financial cover-FA.indd 1 7/09/12 3:40 PM

The Royal Children’s Hospital Melbourne 50 Flemington Road Parkville Victoria Australia 3052www.rch.org.au
ABN 35655720546
ContentsOur Vision, Our Values 04
Chairman’s Report 05
CEO’s Report 06
Board Members 10
Executive Staff 12
Organisational Chart 13
Statutory Statements 14
Statement of Priorities 17
Summary of Financial Results 21
Disclosure Index 23
Financial Statements 25

Our Vision Our ValuesvisionThe Royal Children’s Hospital, a GREAT children’s hospital, leading the way
values
Unity We work together to achieve our goals
Respect For everyone in our care and for each other
Integrity We act with honesty in all we do
Excellence We strive for the highest quality in every aspect of our work
The past year has been without question one of the most significant in our history, with the opening of and move to our outstanding new Royal Children’s Hospital (RCH). As Chairman of this great hospital it has been incredibly satisfying to see the hard work of our Board, the Executive and all staff come to fruition in this new hospital built for the children of Victoria.
It is world class in every sense of the term and has set a new benchmark in hospital design, winning numerous awards and attracting a broad range of visitors from both Australia and internationally.
In the past year, two occasions in particular stand out for me.
Firstly, the official opening by Her Majesty The Queen and His Royal Highness The Duke of Edinburgh on Wednesday 26 October 2011. What a magnificent day, with The Queen repeating history by opening this hospital just as she did our old hospital in 1963. I can think of no greater testament to who we are as an organisation than to have The Queen open our hospital, not once, but twice.
Secondly, Patient Move Day on Wednesday 30 November. I visited with the Hon Ted Baillieu MLA, Premier of Victoria and the Hon David Davis MLC, Minister for Health, on the morning of the move and was immensely proud of our staff and the level of planning that went into making this day so smooth. I am always impressed by the passion and dedication of our staff and this event demonstrated this once again.
Our challenge now is to ensure we make the most of this wonderful hospital and work with our campus partners, Murdoch Childrens Research Institute and The University of Melbourne Department of Paediatrics, as well as the RCH Foundation, to deliver outstanding care for this and future generations of young children.
I can think of no greater testament to who we are as an organisation than to have The Queen open our hospital, not once, but twice.
I would like to thank and acknowledge my colleagues on the RCH Board for their continued efforts and support. In particular I thank Patrick Burroughs who this year leaves the Board almost 12 years since he first joined the Women’s and Children’s Health Board in 2000. During this time he has been a great advocate for our hospital and an active member, and at times Chairman, of various committees including Audit, Finance and Investment. We welcome Mr Sammy Kumar, Managing Partner Strategy and Transformation PricewaterhouseCoopers to the Board.
I also would like to thank and pay special mention to Chief Executive Officer, Professor Christine Kilpatrick and the RCH Executive for leadership of our staff through the significant journey to this new hospital. They have done an outstanding job in meeting the challenges, not only of the build and move, but also in leading the major change program across the organisation. This has been a complex and, at times, difficult task and I, together with all board members, recognise their commitment to, and passion for, our hospital.
To our staff, supporters, patients, families and friends, I also say thank you—we could not do what we do without you.
tony beddison ao Chairman
Chairman’s report
| Annual Report 2011 – 12 The Royal Children’s Hospital and Controlled Entities04 05 Annual Report 2011 – 12 The Royal Children’s Hospital and Controlled Entities |

The past year saw significant change for The Royal Children’s Hospital (RCH) and our campus partners, Murdoch Childrens Research Institute and The University of Melbourne Department of Paediatrics.
Not only have we had the culmination of one of the biggest healthcare projects ever undertaken in Australia—the move to the new RCH—but also the implementation of significant reforms across the health sector with the Government’s National Health Reform Strategy. These reforms put our hospital and our partners even more clearly on a national stage, with new performance targets for funding models.
Our challenge within this context of change is to not only maximise our performance and the potential of the new RCH, but to further position ourselves in the hearts and minds of not just Victorians but all Australians. Our national impact is already felt through specialist clinical and community care, paediatric research and education. It is now up to us to take this to the next level to secure important support nationally.
the new royal children’s hospital
The move to our new hospital took place just one month after the magnificent official opening by Her Majesty The Queen. The move had been more than a year in the planning, with governance provided by an Executive-led steering committee and with clinical areas designing their own move plans to reflect their patient groups.
On Wednesday 30 November, 151 critically-ill patients were transferred from the old to the new hospital. Starting at 7.00am, with one child moving every 3.5 minutes, our Patient Move Day was seamless.
Importantly, there was no disruption to patient care or to the community. At 8.00am, the old and new Emergency Departments simultaneously closed and opened, with not one minute of care lost. This was fundamentally one of the most important principles of our move. As the state’s major paediatric trauma centre and a national centre for paediatric heart, liver and lung transplantation, our services had to remain uninterrupted.
The community, who share an incredible sense of personal ownership of the hospital, were witness to this feat as all Melbourne media covered the event from 7.00am that morning right through to the evening news. The move finished more than three hours ahead of schedule and was testament to the outstanding skill and experience of our staff.
We have already seen the positive impact of our wonderful new hospital. Staff, patients and families are genuinely enjoying the facilities and we are thrilled to see people engaging positively with the parkland setting.
Staff moved in the weeks before and after Patient Move Day, with all staff well settled by the time we celebrated our first Christmas in our new home.
In order to safely move patients to the new hospital, the RCH reduced activity over October to December 2011, including non-urgent elective surgery and some outpatient clinics. Once the move was complete, elective surgery and outpatient clinics were progressively increased back to normal levels.
We have already seen the positive impact of our wonderful new hospital. Staff, patients and families are genuinely enjoying the
CEO’s report
facilities and we are thrilled to see people engaging positively with the parkland setting.
Importantly, children are enjoying the environment. This hospital has many special features reflecting the unique nature of a children’s hospital and reflecting the growing body of evidence about the impact of environment, art and nature on the healing process. We now have a facility that truly matches the level of care we provide.
I think the result here at the RCH is testament to this evidence, delivering a patient and family-focused healing environment based on the latest in thinking in this area.
first paediatric intestinal transplant
This year we made Australian medical history, performing the country’s first paediatric intestinal transplant, giving a 13-year-old RCH patient a second chance at life.
The complex, multi-organ operation was a collaboration between the RCH and Austin Hospital, led by Austin Hospital surgeon Professor Bob Jones. The patient had intestinal failure due to a gastroenterological condition Hirschsprung’s disease. Since infancy his condition had worsened and he’s spent much of his life as an inpatient at the RCH.
The ten-and-a-half hour surgery gave him a new liver, small bowel, pancreas and duodenum and is a wonderful testament to the many years of work by our team. The RCH has been working in collaboration for some time with Austin Hospital on the development of an intestinal transplantation program. This is credit not only to our leadership in clinical care, but also to the courage and dedication of our teams who work together to provide these young, chronically-ill patients with the opportunity to have a normal life.
our campus partners
One of the most positive aspects of our new hospital is the even closer integration with our campus partners, Murdoch Childrens Research Institute and The University of Melbourne Department of Paediatrics. Our second campus wide Research Week was held, showcasing the multidisciplinary and interdisciplinary research conducted across the RCH campus. The close proximity of RCH laboratories and Murdoch Childrens Research Institute laboratories with each other, as well as our clinical areas, has further enhanced our work. In addition, our shared educational space, the Health Education and Learning Precinct, has meant even closer collaboration between the RCH and our education partner The University of Melbourne Department of Paediatrics. The RCH Foundation continues to provide outstanding support for our work, funding a record amount of projects this financial year.
Phot
o: Jo
hn G
ollin
gs
| Annual Report 2011 – 12 The Royal Children’s Hospital and Controlled Entities06 07 Annual Report 2011 – 12 The Royal Children’s Hospital and Controlled Entities |

finance report
The RCH ended the year in a sound financial position achieving a break even operating budget.
vip visits
Our new hospital has set quite a benchmark both here and internationally with its contemporary design drawing inspiration from our unique parkland setting. We have hosted many, many visitors including health, government and industry officials from Australia and overseas.
Their Excellencies Ms Quentin Bryce AC and Mr Michael Bryce AM AE visited early in the new year and also met with staff, patients and families from Developmental Medicine, as well as visiting the Emergency Department and young patients in the Sugar Glider Ward.
International sports star David Beckham also visited and spent more than two hours meeting patients and staff, a great boost for our patients who really enjoyed his visit.
good friday appeal
The Good Friday Appeal continues to excel as the country’s largest community fundraiser with this year’s record amount of more than $15.8 million. Poster boy, Declan, was all smiles as he presented the big cheque to me and our Chairman Tony Beddison AO at this year’s celebration event in June.
This year’s event was also a chance to farewell Appeal Director, Christine Unsworth who has been in the chair for 16 years. Christine is somewhat of an RCH expert since she also worked here for around 11 years prior to moving on to the Appeal. We all wish Christine a fond farewell and thank her for her dedicated years of fundraising for our hospital. We also welcome Deborah Hallmark as the new Director and look forward to working with her in the future.
Special thanks must go to the Good Friday Appeal team, as well as the Appeal media partners the Herald and Weekly Times, Channel 7, 3AW and Magic 1278 who again provided outstanding coverage and
support. To the many thousands of volunteers who continue to show fantastic support and passion for our hospital and our work, thank you.
This year’s funds will go towards the purchase of a PET MRI, an impressive piece of equipment which will help reduce the number of anaesthetics children require for imaging procedures.
The Good Friday Appeal continues to excel as the country’s largest community fundraiser with this year’s record amount of more than $15.8 million.
run for the kidsIn its seventh year the Herald Sun/City Link Run for the Kids surpassed previous records to raise a staggering $1.65 million for the Good Friday Appeal in support of our great hospital. With more than 30,000 competitors the event has become a must attend for serious and social runners and walkers who complete either the short or long course. Our hospital set its own record this year with close to 300 staff competing, all wearing team t-shirts featuring the new hospital logo.
staff achievements
Our staff continue to demonstrate outstanding commitment to our vision and our values and we would like to congratulate all those who have achieved recognition either through hospital awards, or in the community.
dame elisabeth murdoch ac dbe nursing leadership scholarship
Dr Sharon Kinney Nurse Consultant, Research
annual hospital awards
On Tuesday 15 November at our 141st Annual General Meeting and last in our old hospital, we celebrated the hard work and achievements of our staff over the past year. Twelve awards were presented to members of staff nominated by their colleagues for their contribution to the hospital.
Awards went to:
• Gold Medal – Associate Professor Andrew Kornberg, Neurology
• Chairman’s Medal – Lauren Andrew, Allied Health
• CEO Award – The New RCH Project Team
• CEO Award – Transformation and Redesign team
• New RCH Project Award – Simone Zelencich, Workforce Partnerships
• Innovation Award – Orthotics and Prosthetics Department
• Team Award – RCH Eating Disorder Program
• Allied Health Award – Judith Sloan, Social Work
• Enrolled Nurse Excellence Award – Natasha Daly, Koala Ward
• Mary Patten Award – Sharyn Hore, Children’s Cancer Centre
• Yvonne Wagner Medal – Monica Car, RCH@Home
• Dr William Snowball Medal – Dr Bindu Bali
2011 victorian healthcare awards
The RCH was recognised at the 2011 Victorian Public Healthcare Awards and won three awards and one highly commended.
Excellence in healthcare outcomes through person centred careWinner: Power to parents: taking child warfarin therapy monitoring home – RCH Anticoagulation Service.
Excellence in enhanced quality healthcare through e-health and communicationsWinner: Early diagnosis for developmental dysplasia of the hip – RCH Orthopaedics.
Outstanding achievement by an individual or a team in mental healthcareWinner: The RCH Eating Disorder Program – RCH Centre for Adolescent Health and RCH Mental Health.
Minister for Health’s Award for developing a capable and engaged workforceHighly Commended: Victorian Paediatric Orthopaedic Network – RCH Orthopaedics.
order of australia
australia day 2012 honours
Mrs Loula Kostos oamLoula was recognised for service to the RCH as a volunteer, where she has served for the past 47 years. She has helped countless families as an interpreter and in the operating suite in a family support role.
Mrs Davina Anne Johnson oamDavina was recognised for service to community health through the RCH Auxiliaries. She has been a dedicated and passionate supporter of the RCH, the Foundation and Auxiliaries for over 20 years, and currently holds the advisory position of Immediate Past President of Auxiliaries.
Mrs Claire Russell Vickery oamClaire funded and initiated the development of the ‘Family Based Therapy’ Eating Disorder Program at the RCH. Claire was recognised for service to the community through the Butterfly Foundation, which she founded in 2002. The Butterfly Foundation supports eating disorder sufferers and their carers.
Dr Rodney Neill Westhorpe oamRodney was Paediatric Anaesthetist, RCH, 1997-2008; Deputy Director, RCH Department of Anaesthetics, 1988-2006. Rodney was recognised for service to medicine as an anaesthetist.
Ms Ruth Elizabeth Wraith oamRuth was a Director of Child Psychotherapy and a Consultant at RCH International. Ruth was recognised for service to community health, particularly the treatment of children recovering from trauma.
Emeritus Professor Louise Brearley Messer amLouise was an Honorary Consultant at the RCH, 1990–2008. Louise was recognised for service to the dental profession, particularly in the field of paediatric dentistry, as a clinician, academic and researcher.
Mr Andrew Charles Darbyshire amAndrew was recognised for service to the community as a supporter of research into child-related brain conditions, through contributions to special needs children and their families, and to the arts.
queen’s birthday honours 2012
Mr Richard Williams oamRichard was recognised for his contribution to fundraising for the RCH through his work with the Pied Pipers, a great supporter of the hospital and the Good Friday Appeal.
thank you
The past year has been a truly historic year in our hospital’s long history and we thank and acknowledge the outstanding contribution of our staff during this exciting and challenging time. The move to the new hospital in November 2011 was the culmination of many, many years of work by dedicated staff to ensure the new RCH continues to be a centre of excellence, delivering the very best care to Victorian children. I thank each and every staff member, as well as our generous supporters and donors. I also thank our patients and their families, for their ongoing courage in facing some very tough medical challenges. They never cease to amaze me with their resilience and energy. I’m delighted our new hospital takes patient and family-centred care to a new level, enabling us to continue to improve the health and wellbeing of Victoria’s children now and into the future.
professor christine kilpatrick Chief Executive Officer
Phot
o: Jo
hn G
ollin
gs
| Annual Report 2011 – 12 The Royal Children’s Hospital and Controlled Entities08 09 Annual Report 2011 – 12 The Royal Children’s Hospital and Controlled Entities |
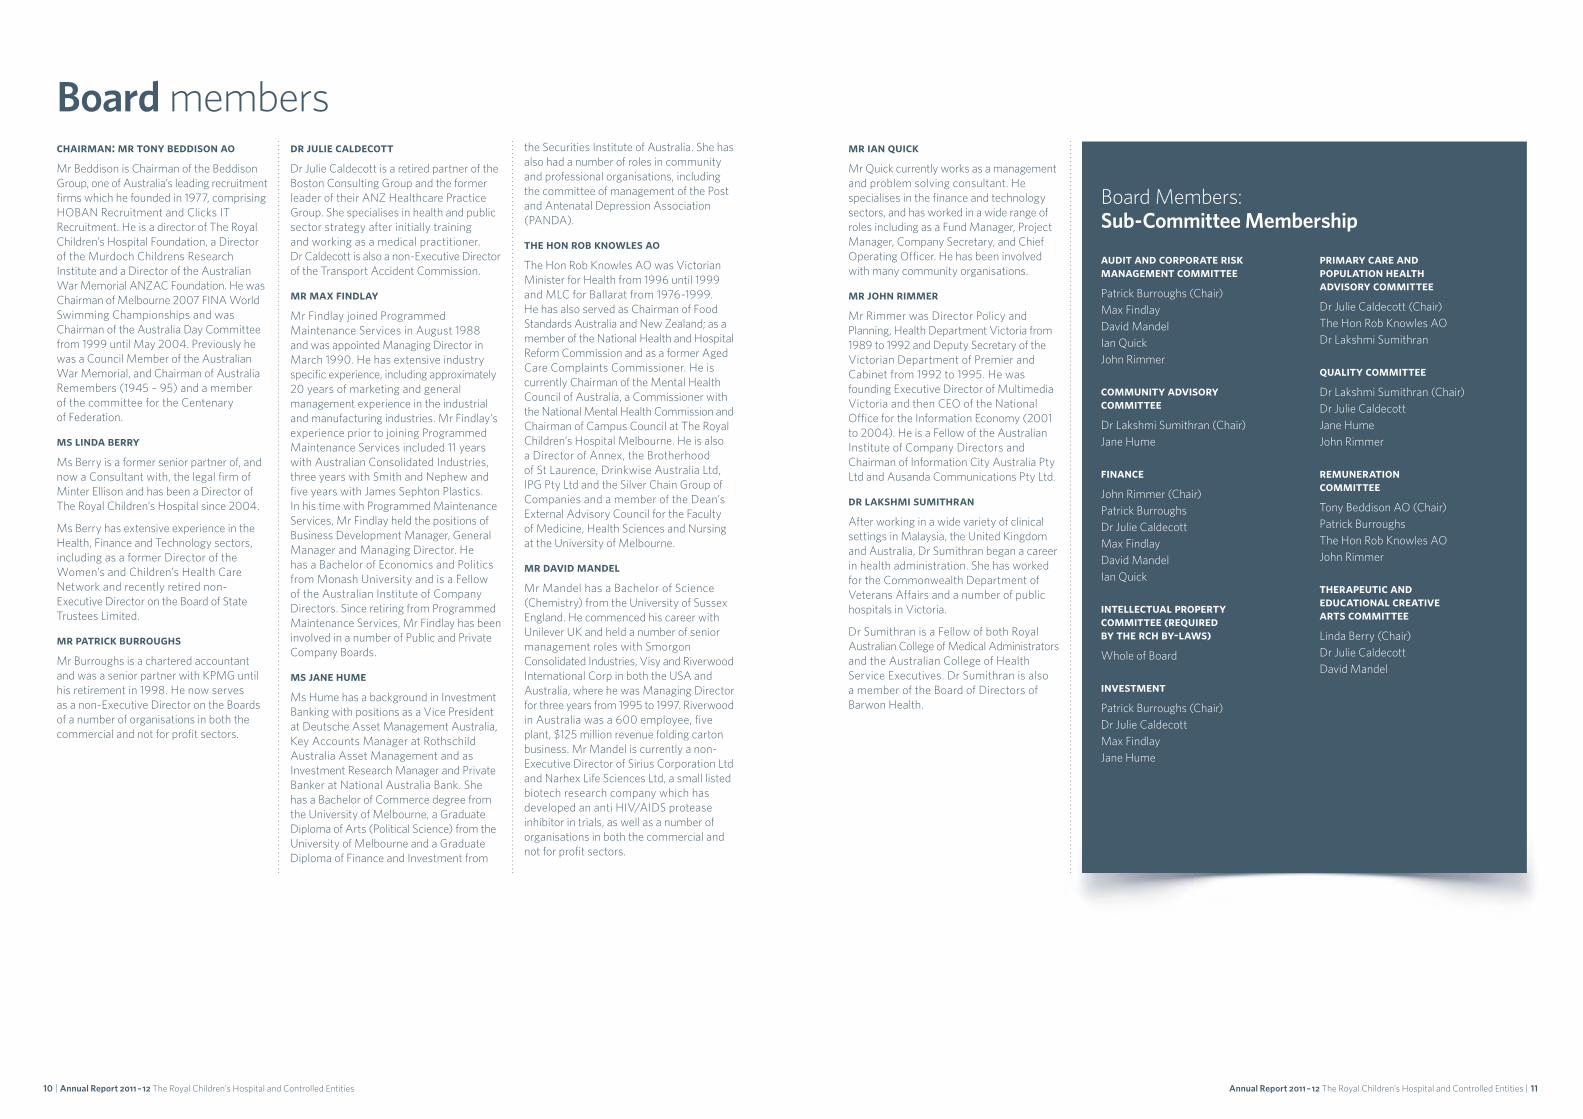
chairman: mr tony beddison ao
Mr Beddison is Chairman of the Beddison Group, one of Australia’s leading recruitment firms which he founded in 1977, comprising HOBAN Recruitment and Clicks IT Recruitment. He is a director of The Royal Children’s Hospital Foundation, a Director of the Murdoch Childrens Research Institute and a Director of the Australian War Memorial ANZAC Foundation. He was Chairman of Melbourne 2007 FINA World Swimming Championships and was Chairman of the Australia Day Committee from 1999 until May 2004. Previously he was a Council Member of the Australian War Memorial, and Chairman of Australia Remembers (1945 – 95) and a member of the committee for the Centenary of Federation.
ms linda berry
Ms Berry is a former senior partner of, and now a Consultant with, the legal firm of Minter Ellison and has been a Director of The Royal Children’s Hospital since 2004.
Ms Berry has extensive experience in the Health, Finance and Technology sectors, including as a former Director of the Women’s and Children’s Health Care Network and recently retired non-Executive Director on the Board of State Trustees Limited.
mr patrick burroughs
Mr Burroughs is a chartered accountant and was a senior partner with KPMG until his retirement in 1998. He now serves as a non-Executive Director on the Boards of a number of organisations in both the commercial and not for profit sectors.
dr julie caldecott
Dr Julie Caldecott is a retired partner of the Boston Consulting Group and the former leader of their ANZ Healthcare Practice Group. She specialises in health and public sector strategy after initially training and working as a medical practitioner. Dr Caldecott is also a non-Executive Director of the Transport Accident Commission.
mr max findlay
Mr Findlay joined Programmed Maintenance Services in August 1988 and was appointed Managing Director in March 1990. He has extensive industry specific experience, including approximately 20 years of marketing and general management experience in the industrial and manufacturing industries. Mr Findlay’s experience prior to joining Programmed Maintenance Services included 11 years with Australian Consolidated Industries, three years with Smith and Nephew and five years with James Sephton Plastics. In his time with Programmed Maintenance Services, Mr Findlay held the positions of Business Development Manager, General Manager and Managing Director. He has a Bachelor of Economics and Politics from Monash University and is a Fellow of the Australian Institute of Company Directors. Since retiring from Programmed Maintenance Services, Mr Findlay has been involved in a number of Public and Private Company Boards.
ms jane hume
Ms Hume has a background in Investment Banking with positions as a Vice President at Deutsche Asset Management Australia, Key Accounts Manager at Rothschild Australia Asset Management and as Investment Research Manager and Private Banker at National Australia Bank. She has a Bachelor of Commerce degree from the University of Melbourne, a Graduate Diploma of Arts (Political Science) from the University of Melbourne and a Graduate Diploma of Finance and Investment from
the Securities Institute of Australia. She has also had a number of roles in community and professional organisations, including the committee of management of the Post and Antenatal Depression Association (PANDA).
the hon rob knowles ao
The Hon Rob Knowles AO was Victorian Minister for Health from 1996 until 1999 and MLC for Ballarat from 1976-1999. He has also served as Chairman of Food Standards Australia and New Zealand; as a member of the National Health and Hospital Reform Commission and as a former Aged Care Complaints Commissioner. He is currently Chairman of the Mental Health Council of Australia, a Commissioner with the National Mental Health Commission and Chairman of Campus Council at The Royal Children’s Hospital Melbourne. He is also a Director of Annex, the Brotherhood of St Laurence, Drinkwise Australia Ltd, IPG Pty Ltd and the Silver Chain Group of Companies and a member of the Dean’s External Advisory Council for the Faculty of Medicine, Health Sciences and Nursing at the University of Melbourne.
mr david mandel
Mr Mandel has a Bachelor of Science (Chemistry) from the University of Sussex England. He commenced his career with Unilever UK and held a number of senior management roles with Smorgon Consolidated Industries, Visy and Riverwood International Corp in both the USA and Australia, where he was Managing Director for three years from 1995 to 1997. Riverwood in Australia was a 600 employee, five plant, $125 million revenue folding carton business. Mr Mandel is currently a non-Executive Director of Sirius Corporation Ltd and Narhex Life Sciences Ltd, a small listed biotech research company which has developed an anti HIV/AIDS protease inhibitor in trials, as well as a number of organisations in both the commercial and not for profit sectors.
Board members
Board Members: Sub-Committee Membership
audit and corporate risk management committee
Patrick Burroughs (Chair)Max FindlayDavid MandelIan QuickJohn Rimmer
community advisory committee
Dr Lakshmi Sumithran (Chair)Jane Hume
finance
John Rimmer (Chair)Patrick BurroughsDr Julie CaldecottMax FindlayDavid MandelIan Quick
intellectual property committee (required by the rch by-laws)
Whole of Board
investment
Patrick Burroughs (Chair)Dr Julie CaldecottMax FindlayJane Hume
primary care and population health advisory committee
Dr Julie Caldecott (Chair)The Hon Rob Knowles AODr Lakshmi Sumithran
quality committee
Dr Lakshmi Sumithran (Chair)Dr Julie CaldecottJane HumeJohn Rimmer
remuneration committee
Tony Beddison AO (Chair)Patrick BurroughsThe Hon Rob Knowles AOJohn Rimmer
therapeutic and educational creative arts committee
Linda Berry (Chair)Dr Julie CaldecottDavid Mandel
mr ian quick
Mr Quick currently works as a management and problem solving consultant. He specialises in the finance and technology sectors, and has worked in a wide range of roles including as a Fund Manager, Project Manager, Company Secretary, and Chief Operating Officer. He has been involved with many community organisations.
mr john rimmer
Mr Rimmer was Director Policy and Planning, Health Department Victoria from 1989 to 1992 and Deputy Secretary of the Victorian Department of Premier and Cabinet from 1992 to 1995. He was founding Executive Director of Multimedia Victoria and then CEO of the National Office for the Information Economy (2001 to 2004). He is a Fellow of the Australian Institute of Company Directors and Chairman of Information City Australia Pty Ltd and Ausanda Communications Pty Ltd.
dr lakshmi sumithran
After working in a wide variety of clinical settings in Malaysia, the United Kingdom and Australia, Dr Sumithran began a career in health administration. She has worked for the Commonwealth Department of Veterans Affairs and a number of public hospitals in Victoria.
Dr Sumithran is a Fellow of both Royal Australian College of Medical Administrators and the Australian College of Health Service Executives. Dr Sumithran is also a member of the Board of Directors of Barwon Health.
| Annual Report 2011 – 12 The Royal Children’s Hospital and Controlled Entities10 11 Annual Report 2011 – 12 The Royal Children’s Hospital and Controlled Entities |

chief executive officerProfessor Christine Kilpatrick MBBS, MBA, MD, FRACP, FRACMA, GAICD
deputy chief executive officer executive director operationsJohn Stanway BEc, Grad Dip IR, GAICD
executive director people and cultureColin Brown BA
executive director communications and marketingJulie Browning Waldren BEd, GradDip PR
executive director new rch projectAlex Campbell BEc, MHA, CPA, AFCHSE
chief of paediatric surgeryClinical Associate Professor Leo Donnan MBBS, FAOrth, FRACS
executive director finance and corporate services and chief financial officerJennifer Gale FCPA, BBus (Acc)
executive director legal servicesKatherine Lorenz BA, LLB (Hons)
executive director medical servicesDr Peter McDougall MBBS, MBA, FRACP, GAICD
chief of paediatric medicineProfessor Colin Robertson MBBS, MSc, MD, FRACP
executive director nursing servicesBernadette Twomey MN (Hons), PgDipHSc(Mgmt),
BHS (Ngs), ADN, RN
Staff summary
The Royal Children’s Hospital full time equivalent (FTE) as at 30 June 2012
Labour category June current month FTE June YTD FTE
2012 2011 2012 2011
Nursing 1057 973 1020 965
Administration and Clerical 623 573 591 568
Medical Support 348 353 349 344
Hotel and Allied Services 200 196 199 195
Medical Officers 109 102 105 98
Hospital Medical Officers 253 221 242 227
Sessional Clinicians 90 89 86 87
Ancillary Staff (Allied Health) 270 258 264 253
Total 2950 2765 2856 2738
Executive staff Organisational chart
Peter McDougall executive director medical services and clinical governance
Bernadette Twomey executive director nursing services
Colin Robertson chief of paediatric medicine
Leo Donnan chief of paediatric surgery
John Stanway deputy chief executive officer executive director operations
Jennifer Gale executive director finance & corporate services and chief financial officer
Colin Brown executive director people and culture
Alex Campbell executive director new hospital project
Katherine Lorenz executive director legal services
Julie Browning Waldren executive director communications and marketing
The Royal Children’s Hospital Board
Christine Kilpatrickchief executive officer
As at June 30, 2012
| Annual Report 2011 – 12 The Royal Children’s Hospital and Controlled Entities12 13 Annual Report 2011 – 12 The Royal Children’s Hospital and Controlled Entities |

The Royal Children’s Hospital (RCH) has cared for the children of Victoria since it was founded in 1870. It is internationally recognised as a leading centre for paediatric treatment, teaching and research. The hospital is accountable to the people of Victoria, through the Minister for Health.
powers and duties
The powers and duties of the RCH are prescribed by the Health Services Act.
nature and range of services
The RCH provides a full range of paediatric clinical and surgical services, including neonatal care, cardiac, plastic and craniofacial, orthopaedic and neurosurgery, cancer and renal services and health promotion programs. It is the national paediatric heart, liver (with Austin Hospital) and lung (with Alfred Hospital) transplant centre as well as the national centre for the treatment of hypo-plastic left heart syndrome. The hospital is the paediatric major trauma centre for Victoria, Tasmania and southern New South Wales. The hospital is a major teaching and research centre with key partnerships with Murdoch Childrens Research Institute and the University of Melbourne.
freedom of information
The Victorian Freedom of Information (FOI) Act 1982 provides a legally enforceable right of access to information held by government agencies. All FOI applications received by RCH were processed in accordance with the provisions of the FOI Act. RCH provides an annual report on FOI applications to the Department of Justice.
nominated officers
Ms Judith Smith, Freedom of Information Officer and Reviewer
Ms Diane Watkins, Consumer Liaison Officer, FOI Reviewer
Ms Pam Grant, Medical Imaging, Manager-Clerical and Support Services, FOI Reviewer
Dr Emma Magrath, Medico-Legal Physician, FOI Internal Reviewer
Ms Annabelle Mann, Legal Counsel, FOI Internal Reviewer
Requests received 2011-12 2010-11
Total 1598 1509
Outcome
Access granted 1448 1417
No information available 15 24
Application withdrawn 58 65
privacy
Kathy Cassin, Manager of Health Information Services, is the RCH Privacy Officer. Since the Health Records Act became legally binding on July 1, 2002 the RCH has aimed to ensure all staff are aware of the Act (and occasionally the Information Privacy Act, 2000) and its implications in the work place.
We marked national Privacy Week in May with the distribution of the revised ‘The privacy of your personal information’ brochure, a privacy session for staff and communication regarding privacy via the RCH intranet. Department education and presentations are conducted on request. These sessions continue to add to the solid foundation of privacy knowledge in the hospital.
The Privacy Officer continues to address general staff enquiries in relation to privacy.
In summary, privacy is part of the culture at the RCH and this will continue with the current ongoing education in place.
whistleblowers protection officer
The RCH has procedures in place to facilitate the making of disclosures about improper conduct and to provide protection for whistleblowers in accordance with the Whistleblowers Protection Act 2001 and the Guidelines issued by the Ombudsman Victoria.
The RCH Executive Director, Legal Services is the Protected Disclosure Officer for the purpose of the Act. During 2011-2012, there were no disclosures of corrupt or improper conduct as defined by the Act and accordingly there were no referrals to, or from, the Ombudsman for investigation.
national competition policy
In accordance with the Competition Principles Agreement (CPA), the State of Victoria is obliged to apply competitive neutrality policy and principles to all significant business activities undertaken by government agencies and local authorities.
The RCH has regard to this policy in relevant significant business activities.
ex-gratia payments
The RCH made no ex-gratia payments for the year ending 30 June 2012.
victorian industry participation policy
The RCH complies with the intent of the Victorian Industry Participation Policy Act 2003. The Act requires wherever possible local industry participation in supplies, taking into consideration the principle of value for money and transparent tendering processes.
For the Financial Year ending 30 June 2012, RCH does not have contracts that require separate disclosure.
rch occupational health and safety
The 2011-12 year has seen the OH&S Management system continue to develop and embed the changes implemented in 2010-11. The OH&S team has continued to work in a cohesive and committed manner and has developed good working relationships with the campus partners MCRI and University of Melbourne.
The move to the new hospital was a highlight for the first part of the 2011-12 year with considerable work being completed in the lead up to the move to ensure new equipment was safe and that staff were able to safely settle into the new environment. Ergonomic assessments were carried out across the hospital as well as safety inspections for all high risk areas to identify and control hazards.
The 2011-12 Safety and Wellness plan was developed and endorsed by the RCH Board in order to achieve systematic and sustainable improvements in health and safety as well as plan and organise the RCH health and safety activities. The plan provided the organisation with a roadmap for ongoing improvement in OH&S performance brought about by the setting of objectives and targets, and the allocation of responsibility for the work required. All of the KPIs were either met or exceeded which has resulted in an improved performance over previous years.
Manual handling continues to be the most significant accident type for the organisation. Considerable work has been done across the hospital to ensure that staff are aware of their responsibilities in reducing the negative impact manual
Statutory Statementshandling incidents have on staff and the organisation. The OH&S team has recruited Smart Move Smart Lift (SMSL) trainers across RCH and provided training to sustain our train the trainer program. A comprehensive review of our manual handling aids was undertaken and the introduction of a bed/cot mover (Gzunda) was introduced.
The new Consultative Committee structure implemented late in 2011 has proven to be very successful with many potential issues raised and addressed before they become problems. This structure also allowed for a quick escalation of issues that could not be dealt with at the work place level. It also provided an opportunity to bring together all campus partners in a consultative and constructive forum.
An outcome of the new Consultative Committee approach has been a heightened awareness of OH&S issues across the hospital. This increased awareness has resulted in an increase in the number of reportable incidents however, the majority of these have been very minor with little or no time lost.
The number and duration of workers compensation claims remain low with the most pleasing result being a decrease in claims costs. The OH&S team continues to focus on injury prevention and early return to work and has been successful in achieving an early return to work in all but a small number of cases. The 2011-12 early intervention strategies have included the development of comprehensive Job Safety Analysis (JSAs) for all occupational groups to better manage return to work outcomes.
Chemicals management is a large undertaking for the RCH due to the large amount of hazardous and potentially harmful chemicals used daily as part of standard operating procedures. At the RCH we take very seriously our responsibility to patients, staff and the environment to responsibly manage the use and disposal of chemicals. We enact stringent chemicals management policies above and beyond established laws to reduce chemical exposure. An online chemical management database was launched to allow for quick and easy access to Material Safety Data Sheets (MSDS) and consolidation of chemical registers. The new material safety data management system, ChemWatch, is now available to all RCH staff. All (MSDS) are now recorded in ChemWatch to manage all chemicals used in the RCH.
An important requirement under the OH&S legislation is to train employees. The RCH Health and Safety training includes: Induction for new employees, WorkCover training for Managers, Health and Safety Representative (HSR) training, HSR Refresher training, Hazard Identification and Risk Management, manual handling and ergonomics. The RCH 2011-12 training program has had a positive effect on the safety practices of staff.
compliance with building and maintenance provisions
The new hospital is maintained by the state’s private sector partner, Children’s Health Partnership (CHP) through Spotless for a period of 25 years. Spotless has established a comprehensive management and maintenance program with specialist contractors to maintain all Essential Safety Measures (ESM) services on site. An annual certificate will be issued at the end of the reporting period.
An external Building Surveyor will audit the maintenance of all the ESM at the new RCH facility annually and certifies the ESM report as evidence of an appropriate level of maintenance of the relevant physical fire safety measures.
environmental performance
The new RCH is managed by the state’s private sector partner, Children’s Health Partnership (CHP) and Spotless Service. CHP and the RCH hold all licences required by environment legislation and have procedures in place to ensure that the terms of these licences are complied with.
compliance
The RCH has complied substantially with the Tax Compliance Framework Certification and Financial Management Compliance Framework Certification in accordance with the requirements of the Victorian Public Sector Financial Management Compliance Framework for the year ended 30 June 2011. The 2011-12 Compliance Framework will be met by the due date of 30 September 2012.
consultancies less than $10k
During the year, there were four consultancies employed for less than $10k, totalling $14,530.
consultancies more than $10k
Refer to page 16 for details.
additional information (frd 22c appendix)
In compliance with the requirements of the Standing Directions of the Minister for Finance, details in respect of the items listed below have been retained by the RCH and are available to the relevant Ministers, Members of Parliament and the public on request (subject to the freedom of information requirements, if applicable):
a) A statement that declarations of pecuniary interests have been duly completed by all relevant officers;
b) Details of shares held by a senior officer as nominee or held beneficially in a statutory authority or subsidiary;
c) Details of publications produced by the entity about itself, and how these can be obtained;
d) Details of changes in prices, fees, charges, rates and levies charged by the entity;
e) Details of any major external reviews carried out on the entity;
f) Details of major research and development activities undertaken by the entity;
g) Details of overseas visits undertaken including a summary of the objectives and outcomes of each visit;
h) Details of major promotional, public relations and marketing activities undertaken by the entity to develop community awareness of the entity and its services;
i) Details of assessments and measures undertaken to improve the occupational health and safety of employees;
j) A general statement on industrial relations within the entity and details of time lost through industrial accidents and disputes;
k) A list of major committees sponsored by the entity, the purposes of each committee and the extent to which the purposes have been achieved; and
l) Details of all consultancies and contractors including:
• Consultants/contractors engaged;
• Services provided; and expenditure committed to for each engagement.
| Annual Report 2011 – 12 The Royal Children’s Hospital and Controlled Entities14 15 Annual Report 2011 – 12 The Royal Children’s Hospital and Controlled Entities |

consultancies more than $10,000
Consultant Purpose of Consultancy Start Date End date Total approved project fee
(excluding GST) $
Expenditure 2011-12
(excluding GST) $
Engaged by the RCH
Australian Council for Education Research Ltd
Expert advice in respect of setup of Australian Early Development Index (AEDI) program. This is funded by one-off funding from the Department of Education, Employment and Workplace Relations (DEEWR) for the program.
Jul-11 Mar-12 58,435 58,435
Cloudenerve Pty Ltd Expert advice in respect of setup of IT requirements for AEDI program. This is funded by a one-off funding from the Department of Education, Employment and Workplace Relations (DEEWR) for the program.
Feb-12 Apr-12 13,300 13,300
Designed Interventions Pty Ltd
Expert advice and on human resources. Nov-11 Jan-12 29,250 29,250
Expert advice and on human resources. Jul-11 Jun-12 18,750 12,750
Engaged by the State
CHW Consulting Pty Ltd Expert advice in setting up IT services for the new hospital site. Jul-09 Nov-11 440,262 59,045
Total 559,997 172,780
Part A: RCH Strategic Priorities
Victoria health priorities framework priority area
Health service strategy Deliverable Outcome
• Developing a system that is responsive to people’s needs
• Implementing continuous improvements and innovation
Deliver excellence in healthcare
- Pursue perfection in healthcare quality and safety
- Provide leadership in paediatric healthcare innovation
- Create better experiences for patients and their families
- Improve care planning and coordination of care for patients with chronic and complex conditions
• Pilot of a team-based approach to recognising and responding to clinical deterioration (based on the National Safety and Quality Health Service Standard) completed by June 2012.
• ISBAR has been introduced as a handover tool for MET.
• Coloured vests implemented to identify roles during a MET.
• Parent-initiated MET calls have been introduced.
• The National Standard for management of a deteriorating patient is being addressed by this group.
• Transition of NETS and PERS to RCH governance achieved by September 2011.
• Completed
• National Funded Centre (NFC) for Norwood procedure and staged surgical palliation for hypoplastic left heart syndrome established by August 2011.
• Completed. Minister for Health launched this NFC at RCH on 16 September 2011.
• Process for systematically collecting data on patient experience implemented by June 2012.
• The patient and family satisfaction survey was repeated in March 2012 with positive results in many areas. Issues identified include the use of the healthcare rights and responsibilities brochure, and this was re-launched in May 2012.
• Patient and family satisfaction survey for Nationally Funded Centre Programs implemented in April 2012 in accordance with NFC Program requirements.
• Pilot of ‘every patient and family every time’ program completed by June 2012.
• Information brochure for staff and consumers developed and work has commenced on an education plan for staff.
• Continue to develop referral and entry systems that makes it easy to get the right care at the right place at the right time.
• Defined Point of Access (DPOA) within RCH@Home has been evaluated.
• E-referral system for RCH@Home and HARP services is being piloted. It is anticipated that this will increase rate of referrals by streamlining the process for referrers.
• An evaluation of the Hawthorn satellite (HiTH and PAC) is currently underway.
• Redesign of Specialist Clinics contact centre processes has been completed and enhanced consumer and referrer access.
• A referral management system is under development for implementation in Specialist Clinics in 2012-13.
• Referral and entry systems for Primary Ciliary Dyskinesia Diagnostics Service, a new service funded by Department of Health, are currently being developed.
• Improving every Victorian’s health status and experiences
• Increasing the system’s financial sustainability and productivity
• Utilising e-health and communications technology
Realise the potential of the new RCH
- Deliver sustainable improvements to hospital systems
- Relocate safely and efficiently to the new RCH
- Harness the opportunities created by our new environment
• New RCH Orienteer Program established by September 2011.
• Completed.
• Models of care for implementation in the new RCH finalised by October 2011.
• Completed.
• Five-year information technology plan reviewed and revised by December 2011.
• Implementation of identified systems for the new hospital (patient calling and patient queuing) completed in time for new hospital move.
• Further work to be done following finalisation of business case re: scope of works with Department of Health.
• Implementation of priority information technology projects commenced by June 2012.
• Governance Committee with Department of Health commenced and priority to Clinical Productivity Tools agreed.
• High level project planning commenced and Program Director Recruitment completed.
• Contractual requirements associated with commissioning and handover of the new RCH satisfied by December 2011.
• Completed.
• Safe and efficient move achieved by December 2011.
• Completed.
• RCH brand refresh completed by December 2011.
• Completed.
• RCH website redeveloped by June 2012. • Completed.
2011-12 Statement of Priorities
| Annual Report 2011 – 12 The Royal Children’s Hospital and Controlled Entities16 17 Annual Report 2011 – 12 The Royal Children’s Hospital and Controlled Entities |

Victoria health priorities framework priority area
Health service strategy Deliverable Outcome
• Expanding service, workforce and system capacity
Support and strengthen the RCH team
- Attract and retain talented and skilled team members
- Promote the safety and wellbeing of our team members
- Celebrate achievement
• Staff successfully transitioned to new RCH service models (including outpatients and ward support) by December 2011.
• Completed.
• OH&S education program revised and implemented by November 2011.
• Completed.
• RCH recognition program and celebration evening reviewed by June 2012.
• A review of current annual RCH Recognition and Awards program will be completed prior to celebration evening in November 2012.
• RCH values built into processes across the employment life cycle by April 2012.
• The RCH values are currently being embedded into recruitment, employee induction, manager induction checklist and exit interview procedures and guidelines in support of active promotion and familiarisation by all staff.
• Increasing the system’s financial sustainability and productivity
Enhance community and stakeholder support
- Ensure financial sustainability
- Enhance relationships with our metropolitan and rural service partners to improve paediatric healthcare in Victoria
- Optimise our community support
• Balanced budget achieved by June 2012. • Achieved.
• Philanthropic support, in partnership with the RCH Foundation, expanded by June 2012.
• Good Friday Appeal achieved another record amount.
• Stakeholder engagement plan developed by June 2012.
• Stakeholder plan was successfully implemented to support the move.
• Paediatric tumour stream developed as part of Victorian Comprehensive Cancer Centre by June.
• Completed.
• Implementing continuous improvements and innovation
Maximise campus-led research
- Grow our research effort
- Improve patient outcomes by translating research into clinical practice
- Enhance the campus reputation for delivering internationally-recognised research
• RCH research strategic directions identified in collaboration with our campus partners by March 2012.
• “Big Idea” in development phase with excellent cross campus commitment.
• Development of plan to enhance cancer research with appointment of three clinician scientists.
• Campus relationships enhanced through active participation in Campus Council.
• Combined Campus Education and Research Week scheduled for 29th October 2012.
• Clinical research, especially in nursing and allied health, increased by June 2012.
• Professor of Nursing Research appointed. Strategic research priorities for nursing identified.
• Principles in The National Statement and Australian Code of the Responsible Conduct of Research applied to clinical research on campus by June 2012.
• Revised the RCH Research Policy to better reflect the NHMRC Australian Code for the Responsible Conduct of Research and created a procedure for handling and resolving breaches of this code on campus. This was completed in December 2011.
• Recruitment of Research Governance Officer has been completed. This position will bring the campus in line with the National Statement in terms of research governance. The monitoring and auditing is underway as per the requirements.
• Expanding service, workforce and system capacity
• Increasing accountability and transparency
Provide excellent education, development and training
- Create a world-class precinct that facilitates learning
- Educate the paediatric healthcare professionals of the future
- Develop our leaders
• e-Learning program for training (including new RCH training) implemented.
• Completed.
• Director of Education and Learning appointed by June 2012.
• Director of Medical Education appointed.
• Performance Development Program (PDAP) process and tools updated by June 2012.
• A first level review of the PDAP template based on alignment with RCH needs has been completed.
• A re-launch of Learning Seat with suite of support tools and resources scheduled for September 2012.
• To enhance decision making capability, content and use of internal reporting systems evaluated and opportunities for improvement identified by June 2012.
• New reports developed to meet federal funding KPIs.
• Scorecard reporting comments developed in conjunction with operational directors.
Part B: Performance Priorities
financial performanceKey performance indicator 2011-12 Actuals Target
Operating resultAnnual operating result ($m) 0.002 0
Cash management
Creditors 42 < 60 days
Debtors 50 < 60 days
access performanceKey performance indicator 2011-12 Actuals Target
Emergency care(1)
Percentage of operating time on hospital bypass 0 3
Percentage of emergency patients transferred to an inpatient bed within 8 hours 78 80
Percentage of non-admitted emergency patients with a length of stay less than 4 hours 78 80
Number of patients with a length of stay in the emergency department greater than 24 hours 7 0
Percentage of Triage Category 1 emergency patients seen immediately 100 100
Percentage of Triage Category 2 emergency patients seen within 10 minutes 87 80
Percentage of Triage Category 3 emergency patients seen within 30 minutes 75 75
Elective surgery(1)
Percentage of Urgency Category 1 elective patients admitted within 30 days 100 100
Percentage of Urgency Category 2 elective surgery patients waiting less than 90 days 74 80
Percentage of Urgency Category 3 elective surgery patients waiting less than 365 days 83 90
Number of patients on the elective surgery waiting list(2) 3,259 3850
Number of Hospital Initiated Postponements (HiPs) per 100 scheduled admissions 11.5 8
(1) Established benchmark targets for patient access to public health services. Performance of RCH against the targets may be adversely affected by transition to the new hospital during 2011-12. This will be taken into consideration when calculating the Performance Assessment Score and level of monitoring required of RCH.
(2) The target shown is the number of patients on the elective surgery waiting list as at 30 June 2012.
service performanceKey performance indicator 2011-12 Actuals Target
WIES(1) activity performance
Percentage of WIES (public and private) performance to target 98 98 to 102
Elective surgery(2)
Number of patients admitted from the elective surgery waiting list – quarter 1 1,965 1,883
Number of patients admitted from the elective surgery waiting list – quarter 2 1,307 1,271
Number of patients admitted from the elective surgery waiting list – quarter 3 1,675 1,721
Number of patients admitted from the elective surgery waiting list – quarter 4 1,638 1,875
Critical Care(3)
ICU minimum operating capacity 19 19(4)
NICU standard operating capacity and flex capacity 12-13 12-13(5)
No. of days below ICU minimum operating capacity 102 0
No. of days below NICU usual operating capacity and flex capacity 10 0
Quality and safety
Health service accreditation Four year accreditation awarded Full compliance
Cleaning standards Overall hospital score 96% in internal audit June 2012 Full compliance
Hand Hygiene Program compliance rate 74 65
SAB rate per occupied bed days(6) < 0.9/10,000(95% CI 0.4-1.9)
July 2011-March 2012
< 2/10,000
Newborns
Percentage of eligible newborns screened for hearing deficit before one month of age 97.8 > 97
(1) WIES is a Weighted Inlier Equivalent Separation. (2) Established benchmark targets for patient access to public health services. It is expected that health services show demonstrable improvement towards achievement of benchmark targets.(3) With the move to the New Hospital, intensive care beds transitioned over time to optimal capacity(4) As at 1 July 2011 ICU minimum operating capacity is 18, increasing to 19 as at 1 January 2012 (5) As at 1 July 2011 NICU standard operating capacity and flex capacity is 11-13, increasing to 12-13 as at 1 January 2012(6) SAB is Staphylococcus aureus bacteraemia
| Annual Report 2011 – 12 The Royal Children’s Hospital and Controlled Entities18 19 Annual Report 2011 – 12 The Royal Children’s Hospital and Controlled Entities |

Part C: Activity
Funding type 2011-12 Activity achievement
Acute inpatient
WIES Public 31,885
WIES Private 9,455
WIES (Public and Private) 41,340
WIES Renal 4
WIES TAC 502
WIES TOTAL 41,846
Subacute inpatient
Rehab – Paediatric 1,906
Palliative Care – Other
Ambulatory
Emergency Services – Non Admitted
VACS – Allied Health 58,414
VACS – Variable 73,544
VACS – Other
Hospital Admission Risk Program (HARP)
SACS
SACS – Paediatric 3,087
Post Acute Care 743
Palliative Care – Community
Palliative Care – Other
Aged care
HACC
Mental health
Mental Health – Inpatient
Mental Health – Ambulatory 36,478 reportable contacts
Mental Health – Service System Capacity 12 beds
Primary health
Community Health/Primary Care Programs
Community Health – Other
Other
Nationally Funded Centre Activity
Transplants – Paediatric Heart 9
Transplants – Paediatric Liver 9
Hypoplastic Left Heart Syndrome Surgery – Norwood Procedure (Stage 1) 10
Hypoplastic Left Heart Syndrome Surgery – BCPS (Stage 2) 6
Drug Services
Other specified funding
Total Funding
Summary of Financial Results2012
$’0002011
$’0002010
$’0002009
$’0002008
$’000
Total Revenue 482,674 415,749 393,947 371,153 351,213
Total Expenses 487,465 433,216 416,061 405,837 356,173
Net Result for the year (inc. Capital and Specific Items) (4,791) (17,467) (22,114) (34,684) (4,960)
Retained Surplus/(Accumulated Deficit) (70,539) (66,180) (41,322) (11,830) 5,479
Total Assets 1,135,558 221,324 239,032 252,678 272,171
Total Liabilities 1,044,939 110,788 111,096 112,199 95,626
Net Assets 90,619 110,536 127,936 140,479 176,545
Total Equity 90,619 110,536 127,936 140,479 176,545
Revenue IndicatorsAverage Collection Days
2012 2011
Total Average Days 50 49
Debtors Outstanding as at 30 June 2012 ($’000)Under 30 days 31-60 days 61-90 days Over 90 days Total 30 June 2012 Total 30 June 2011
Private 3,020 1,258 168 590 5,036 5,429
TAC 82 44 2 15 144 80
Operational and Financial Performance 2012
The Royal Children’s Hospital (RCH) ended the year in a sound financial position with an Operating Surplus before Capital and Specific Items of $2k against a break even operating budget. While the operating result from services supported by the Statement of Priorities returned an operating loss of $11.6 million, this was offset by an operating surplus of $11.61 million from hospital and community initiatives. The financial result reflects the impact of the Efficiency and Effectiveness Program implemented during the financial year.
Summary of Significant Change in Financial Position 2012
The Royal Children’s Hospital’s (RCH) agreed to record the states’ assets and obligations in relation to the Public Private Partnership (PPP) arrangement in this financial year. The RCH assets includes PPP leased Assets of $908 million and the RCH liability includes Finance leased liability of $917 million. The transaction has no impact to the RCH operating surplus before capital and specific items.
Subsequent Events
There has been no matter or circumstance which has arisen since 30 June 2012 that has significantly affected, or may affect:
(a) The operations, in financial years subsequent to 30 June 2012 of The Royal Children’s Hospital
(b) The results of those operations, or
(c) The state of affairs, in financial years, subsequent to 30 June 2012, of The Royal Children’s Hospital.
| Annual Report 2011 – 12 The Royal Children’s Hospital and Controlled Entities20 21 Annual Report 2011 – 12 The Royal Children’s Hospital and Controlled Entities |

The RCH ended the year in a sound financial position and achieved a break even operating budget.
responsible bodies declaration
In accordance with the Financial Management Act 1994, I am pleased to present the Report of Operations for The Royal Children’s Hospital Melbourne for the year ending 30 June 2012.
Signed:
Tony Beddison AOThe Royal Children’s Hospital Board Chairman
6 September 2012
attestation on compliance with australian/new zealand risk management standard
I, Christine Kilpatrick certify that The Royal Children’s Hospital Melbourne has risk management processes in place consistent with the Australian/New Zealand Risk Management Standard ISO 31000:2009 and an internal control system is in place that enables the executive to understand, manage and satisfactorily control risk exposures. Further planned improvements to the internal control systems will result in an improved ability to understand manage and control these risk exposures. The Royal Children’s Hospital Audit and Corporate Risk Management Committee verifies this assurance and that the risk profile of The Royal Children’s Hospital has been critically reviewed within the last 12 months.
Signed:
Professor Christine KilpatrickChief Executive Officer
6 September 2012
attestation on data integrity
I, Christine Kilpatrick certify that The Royal Children’s Hospital Melbourne has put in place appropriate internal controls and processes to ensure that reported data reasonably reflects actual performance. The Royal Children’s Hospital Melbourne has critically reviewed these controls and processes during the year.
Signed:
Professor Christine KilpatrickChief Executive Officer
6 September 2012
The annual report of The Royal Children’s Hospital Melbourne is prepared in accordance with all relevant Victorian legislation.
This index has been prepared to facilitate identification of the Department’s compliance with statutory disclosure requirements.
Legislation Requirement Page Reference
Ministerial Directions
Report of Operations
Charter and purpose
FRD 22C Manner of establishment and the relevant Ministers 14, 70
FRD 22C Objectives, functions, powers and duties 14
FRD 22C Nature and range of services provided 14
Management and structure
FRD 22C Organisational structure 13
Financial and other information
FRD 10 Disclosure index 23
FRD 11 Disclosure of ex-gratia payments 14
FRD 21B Responsible person and executive officer disclosures 70-73
FRD 22C Application and operation of Freedom of Information Act 1982 14
FRD 22C Application and operation of Whistleblowers Protection Act 2001 14
FRD 22C Compliance with building and maintenance provisions of Building Act 1993 15
FRD 22C Details of consultancies over $10,000 16
FRD 22C Details of consultancies under $10,000 15
FRD 22C Major changes or factors affecting performance 5-9
FRD 22C Occupational health and safety 14
FRD 22C Operational and budgetary objectives and performance against objectives 21
FRD 22C Significant changes in financial position during the year 21
FRD 22C Statement of availability of other information 15
FRD 22C Statement on National Competition Policy 14
FRD 22C Subsequent events 21
FRD 22C Summary of the financial results for the year 21
FRD 22C Workforce Data Disclosures including a statement on the application of employment and conduct principles 12
FRD 25 Victorian Industry Participation Policy disclosures 14
SD 4.2(j) Sign-off requirements 22
SD 3.4.13 Attestation on data integrity 22
SD 4.5.5 Attestation on Compliance with Australian/New Zealand Risk Management Standard 22
Financial Statements
Financial statements required under part 7 of the FMA
SD 4.2(a) Statement of Changes in Equity 31
SD 4.2(b) Operating Statement 29
SD 4.2(b) Balance Sheet 30
SD 4.2(b) Cash Flow Statement 32
Other requirements under Standing Directions 4.2
SD 4.2(a) Compliance with Australian accounting standards and other authoritative pronouncements 26, 34
SD 4.2(c) Accountable officer’s declaration 26
SD 4.2(c) Compliance with Ministerial Directions 26
SD 4.2(d) Rounding of amounts 34
Legislation
Freedom of Information Act 1982 14
Whistleblowers Protection Act 2001 14
Victorian Industry Participation Policy Act 2003 14
Building Act 1993 15
Financial Management Act 1994 26, 34
Disclosure Index
| Annual Report 2011 – 12 The Royal Children’s Hospital and Controlled Entities22 23 Annual Report 2011 – 12 The Royal Children’s Hospital and Controlled Entities |

Financial Statements
| Annual Report 2011 – 12 The Royal Children’s Hospital and Controlled Entities24 25 Annual Report 2011 – 12 The Royal Children’s Hospital and Controlled Entities |

the royal children’s hospital
Board member’s, accountable officer’s and chief finance and accounting officer’s declaration
We certify that the attached financial statements for The Royal Children’s Hospital and the Consolidated Entities have been prepared in accordance with Standing Direction 4.2 of the Financial Management Act 1994, applicable Financial Reporting Directions, Australian Accounting Standards, Interpretations and other mandatory professional reporting requirements.
We further state that, in our opinion, the information set out in the Comprehensive Operating Statement, Balance Sheet, Statement of Changes in Equity, Cash Flow Statement and notes to and forming part of the financial statements, presents fairly the financial transactions during the year ended 30 June 2012 and the financial position at that date of The Royal Children’s Hospital and Consolidated Entities as at 30 June 2012.
At the time of signing, we are not aware of any circumstances which would render any particulars included in the financial statements to be misleading or inaccurate.
We authorise the attached financial statements for issue on this day.
tony beddison ao professor christine kilpatrick jennifer galeChairman Accountable Officer Executive Director Finance & Corporate Services and CFO
The Royal Children’s Hospital The Royal Children’s Hospital The Royal Children’s HospitalMelbourne Melbourne Melbourne
6 September 2012 6 September 2012 6 September 2012
27 Annual Report 2011 – 12 The Royal Children’s Hospital and Controlled Entities || Annual Report 2011 – 12 The Royal Children’s Hospital and Controlled Entities26

The Royal Children’s Hospital Comprehensive Operating Statement
For the Year Ended 30 June 2012
Note
Parent Entity2012
$'000
Parent Entity2011
$'000
Consolidated2012
$'000
Consolidated2011
$'000
Revenue from Operating Activities 2 443,093 405,703 456,943 417,813
Revenue from Non-operating Activities 2 2,018 1,900 6,456 8,167
Employee Expenses 3 (317,884) (288,552) (322,220) (292,184)
Non Salary Labour Costs 3 (27,483) (27,927) (27,887) (28,535)
Supplies and Consumables 3 (50,260) (49,364) (50,279) (49,374)
Facility management, life cycle and other charges under PPP arrangement 3 (7,333) - (7,333) -
Other Expenses 3 (42,150) (41,666) (45,984) (46,088)
Net Result Before Capital and Specific Items 2 94 9,696 9,799
Capital Purpose Income 2 29,185 7,956 17,460 5,652
Net Gain/(Loss) on Disposal of Non-Current Assets 2c (20,210) (18) (20,210) (30)
Assets Received Free of Charge 2d 28,647 3 28,650 4
Expenditure Using Capital Purpose Income 3 (23,422) (1,112) (23,422) (1,112)
Depreciation and Amortisation 4 (18,933) (24,595) (19,131) (24,782)
Cumulative (gain)/loss transferred to Comprehensive Operating Statement on Sale of Financial Assets
15a (59) 205 (59) 205
NET RESULT FOR THE YEAR (4,791) (17,467) (7,017) (10,261)
Other Comprehensive Income
Net fair value gains/(losses) on Available for Sale Financial Investments 15a (352) 67 (4,226) 3,033
Net fair value revaluation on Non Financial Assets 15a (14,774) - (14,774) -
COMPREHENSIVE RESULT FOR THE YEAR (19,917) (17,400) (26,017) (7,228)
This Statement should be read in conjunction with the accompanying notes.
| Annual Report 2011 – 12 The Royal Children’s Hospital and Controlled Entities28 29 Annual Report 2011 – 12 The Royal Children’s Hospital and Controlled Entities |

The Royal Children’s Hospital Balance Sheet
As at 30 June 2012
Note
Parent Entity2012
$'000
Parent Entity2011
$'000
Consolidated2012
$'000
Consolidated2011
$'000
Current Assets
Cash and Cash Equivalents 5 30,054 16,153 51,016 37,823
Receivables 6 14,006 16,359 11,198 11,678
Other Financial Assets 7 - - 48,352 52,147
Inventories 8 1,660 1,469 1,660 1,469
Prepayments 569 522 572 525
Total Current Assets 46,289 34,503 112,798 103,642
Non-Current Assets
Receivables 6 10,299 7,627 10,299 7,627
Other Financial Assets 7 17,702 18,225 62,225 65,705
Property, Plant and Equipment 9 1,054,818 155,220 1,058,390 158,616
Intangible Assets 10 2,920 2,219 3,067 2,324
Investment Properties 11 3,531 3,531 3,531 3,531
Total Non-Current Assets 1,089,269 186,821 1,137,512 237,803
TOTAL ASSETS 1,135,558 221,324 1,250,310 341,445
Current Liabilities
Payables 12 24,937 24,704 27,092 26,279
Employee Benefits and Related On-Costs Provisions 13 83,819 64,377 84,501 64,899
Other Liabilities 14 4,925 5,331 4,925 5,376
Total Current Liabilities 113,681 94,412 116,518 96,554
Non-Current Liabilities
Employee Benefits and Related On-Costs Provisions 13 9,926 11,928 10,059 12,030
Finance Lease Liabilities 14 917,233 - 917,233 -
Other Liabilities 14 4,099 4,448 4,099 4,448
Total Non-Current Liabilities 931,258 16,376 931,391 16,478
TOTAL LIABILITIES 1,044,939 110,788 1,047,909 113,032
NET ASSETS 90,619 110,536 202,401 228,418
EQUITY
Property Plant and Equipment Revaluation Surplus 15a 17,928 32,702 19,781 34,555
Financial Asset Available for Sale Revaluation Surplus 15a 165 517 111 4,337
General Purpose Reserve 15a 16,743 14,206 16,743 14,206
Restricted Specific Purpose Reserve 15a 17,893 20,862 127,876 133,071
Contributed Capital 15b 108,429 108,429 108,429 108,429
Accumulated Deficit 15c (70,539) (66,180) (70,539) (66,180)
TOTAL EQUITY 90,619 110,536 202,401 228,418
Commitments 19 Contingent Assets and Contingent Liabilities 20
This Statement should be read in conjunction with the accompanying notes.
The Royal Children’s Hospital Statement of Changes in Equity
For the Year Ended 30 June 2012
Consolidated
Note
Property, Plant & Equipment
Revaluation Surplus
Financial Asset Available for
Sale Revaluation Surplus
General Purpose Surplus
Restricted Specific Purpose Surplus
Contributed Capital
Accumulated Surpluses/
(Deficits)
Total
$’000 $'000 $’000 $’000 $’000 $’000 $’000
Balance at 1 July 2010 34,555 1,304 9,557 123,123 108,429 (41,322) 235,646
Net result for the year 15c - - - - - (10,261) (10,261)
Other comprehensive income for the year 15a - 3,033 - - - - 3,033
Transfer to accumulated surplus/(deficit) 15a - - 4,649 9,948 - (14,597) -
Balance at 30 June 2011 34,555 4,337 14,206 133,071 108,429 (66,180) 228,418
Net result for the year 15c - - - - - (7,017) (7,017)
Other comprehensive income for the year 15a (14,774) (4,226) - - - - (19,000)
Transfer to accumulated surplus/(deficit) 15a - - 2,537 (5,195) - 2,658 -
Balance at 30 June 2012 19,781 111 16,743 127,876 108,429 (70,539) 202,401
Parent
Note
Property, Plant & Equipment
Revaluation Surplus
Financial Asset Available for
Sale Revaluation Surplus
General Purpose Surplus
Restricted Specific Purpose Surplus
Contributed Capital
Accumulated Surpluses/
(Deficits)
Total
$’000 $'000 $’000 $’000 $’000 $’000 $’000
Balance at 1 July 2010 32,702 450 9,557 18,120 108,429 (41,322) 127,936
Net result for the year 15c - - - - - (17,467) (17,467)
Other comprehensive income for the year 15a - 67 - - - - 67
Transfer to accumulated surplus/(deficit) 15a - - 4,649 2,742 - (7,391) -
Balance at 30 June 2011 32,702 517 14,206 20,862 108,429 (66,180) 110,536
Net result for the year 15c - - - - - (4,791) (4,791)
Other comprehensive income for the year 15a (14,774) (352) - - - - (15,126)
Transfer to accumulated surplus/(deficit) 15a - - 2,537 (2,969) - 432 -
Balance at 30 June 2012 17,928 165 16,743 17,894 108,429 (70,539) 90,620
This Statement should be read in conjunction with the accompanying notes.
| Annual Report 2011 – 12 The Royal Children’s Hospital and Controlled Entities30 31 Annual Report 2011 – 12 The Royal Children’s Hospital and Controlled Entities |

The Royal Children’s Hospital Cash Flow Statement
For the Year Ended 30 June 2012
Note
Parent Entity2012
$'000
Parent Entity2011
$'000
Consolidated2012
$'000
Consolidated2011
$'000
CASH FLOWS FROM OPERATING ACTIVITIES
Operating Grants from Government 346,839 316,957 345,115 314,278
Patient Fees Received 14,414 9,924 14,414 9,924
Private Practice Fees Received 25,780 25,781 25,780 25,781
Donations and Bequests Received 15,250 14,159 25,345 35,554
GST Received from/(Paid to) ATO 5,811 6,327 5,761 6,489
Interest Received 1,047 1,056 3,709 2,128
Other Receipts 36,505 31,847 40,852 34,720
Employee Benefits Paid (324,467) (303,551) (329,014) (307,535)
Fee for Service Medical Officers (3,129) (2,807) (3,129) (2,807)
Payments for Supplies and Consumables (56,733) (57,989) (56,791) (57,776)
Other Payments (45,983) (43,533) (49,725) (48,396)
Cash Generated from/(used in) Operations 15,334 (1,827) 22,317 12,360
Capital Grants from Government 296 1,707 296 1,707
Other Capital Receipts 2,291 74 2,291 74
Capital Donations and Bequests Received 12,145 5,833 420 3,529
NET CASH INFLOW FROM OPERATING ACTIVITIES 16 30,066 5,786 25,325 17,672
CASH FLOWS FROM INVESTING ACTIVITIES
Payments for Non Financial Assets (17,402) (12,443) (17,807) (12,647)
Proceeds from Sale of Property, Plant and Equipment 393 - 393 -
Purchase of Investments (866) (5,055) (1,429) (35,966)
Proceeds from Sale of Investments 1,868 5,055 6,869 19,335
NET CASH OUTFLOW FROM INVESTING ACTIVITIES (16,007) (12,443) (11,974) (29,278)
CASH FLOWS FROM FINANCING ACTIVITIES
NET CASH INFLOW FROM FINANCING ACTIVITIES - - - -
NET INCREASE/(DECREASE) IN CASH AND CASH EQUIVALENTS HELD 14,059 (6,657) 13,351 (11,608)
CASH AND CASH EQUIVALENTS AT BEGINNING OF THE YEAR 14,609 21,265 36,280 47,887
CASH AND CASH EQUIVALENTS AT END OF THE YEAR 5 28,669 14,609 49,631 36,280
This Statement should be read in conjunction with the accompanying notes.
Notes to the Financial Statements 30 June 2012 Table of Contents
note
1 Statement of Significant Accounting Policies 34
2 Revenue 45
2a Analysis of Revenue by Source 46
2b Patient Fees 47
2c Net Gain/(Loss) from Disposal of Non-Financial Assets 47
2d Assets Received Free of Charge or For Nominal Consideration 47
3 Expenses 48
3a Analysis of Expenses by Source 49
3b Analysis of Expenses by Internal and Restricted Specific Purpose Funds for Services Support by Hospital and Community Initiatives 50
4 Depreciation and Amortisation 50
5 Cash and Cash Equivalents 51
6 Receivables 51
7 Other Financial Assets 52
8 Inventories 52
9 Property, Plant and Equipment 53
10 Intangible Assets 55
11 Investment Properties 55
12 Payables 55
13 Employee Benefits and Related On-Cost Provisions 56
14 Other Liabilities 57
15 Equity 58
16 Reconciliation of Net Result for the Year to Net Cash Inflow/(Outflow) from Operating Activities 59
17 Non-Cash Financing and Investing Activities 59
18 Financial Instruments 60
19 Commitments for Expenditure 67
20 Contingent Assets and Contingent Liabilities 68
21 Jointly Controlled Operations and Assets 69
22 Responsible Person Disclosures 70
22a Executive Officer Disclosures 73
23 Controlled Entities 74
24 Events occurring after the Balance Sheet Date 74
| Annual Report 2011 – 12 The Royal Children’s Hospital and Controlled Entities32 33 Annual Report 2011 – 12 The Royal Children’s Hospital and Controlled Entities |

Note 1: Statement of Significant Accounting Policies
(a) Statement of Compliance
These financial statements are a general-purpose financial report which have been prepared in accordance with the Financial Management Act 1994, and applicable Australian Accounting Standards (AASs) and Australian Accounting Interpretations and other mandatory requirements. AASs include Australian equivalents to International Financial Reporting Standards.
The financial statements also comply with relevant Financial Reporting Directions (FRDs) issued by the Department of Treasury and Finance, and relevant Standing Directions (SDs) authorised by the Minister for Finance.
The Royal Children’s Hospital is a not-for-profit entity and therefore applies the additional Aus paragraphs applicable to “not-for-profit” Health Services under the AASs.
The annual financial statements were authorised for issue by the Board of The Royal Children’s Hospital on 6 September 2012.
(b) Basis of accounting preparation and measurement
Accounting policies are selected and applied in a manner which ensures that the resulting financial information satisfies the concepts of relevance and reliability, thereby ensuring that the substance of the underlying transactions or other events is reported.
The accounting policies set out below have been applied in preparing the financial statements for the year ended 30 June 2012, and the comparative information presented in these financial statements for the year ended 30 June 2011.
The going concern basis was used to prepare the financial statements.
These financial statements are presented in Australian dollars, the functional and presentation currency of The Royal Children’s Hospital.
The financial statements, except for cash flow information, have been prepared using the accrual basis of accounting. Under the accrual basis, items are recognised as assets, liabilities, equity, income or expenses when they satisfy the definitions and recognition criteria for those items, that is they are recognised in the reporting period to which they relate, regardless of when cash is received or paid.
The financial statements are prepared in accordance with the historical cost convention, except for the revaluation of certain non-current assets and financial instruments, as noted.
Particularly, exceptions to the historical cost convention include:
• Non-current physical assets, which subsequent to acquisition, are measured at valuation and are re-assessed with sufficient regularity to ensure that the carrying amounts do not materially differ from their fair values;
• Derivative financial instruments, managed investment schemes, certain debt securities, and investment properties after initial recognition, which are measured at fair value through profit and loss;
• Available-for-sale investments which are measured at fair value with movements reflected in equity until the asset is derecognised; and
• The fair value of assets other than land is generally based on their depreciated replacement value
Historical Cost is based on the fair values of the consideration given in exchange for assets.
In the application of AASs management is required to make judgements, estimates and assumptions about carrying values of assets and liabilities that are not readily apparent from other sources. The estimates and associated assumptions are based on historical experience and various other factors that are believed to be reasonable under the circumstances, the results of which form the basis of making the judgements. Actual results may differ from these estimates.
The estimates and underlying assumptions are reviewed on an ongoing basis. Revisions to accounting estimates are recognised in the period in which the estimate is revised if the revision affects only that period, or in the period of the revision and future periods if the revision affects both current and future periods. Judgements made by management in the application of AASs that have significant effects on the financial statements and estimates, with a risk of material adjustments in the subsequent reporting period, are disclosed throughout the notes to the financial statements.
(c) Reporting Entity
The financial statements include all the controlled activities of The Royal Children’s Hospital.
Its principal address is:50 Flemington Road Parkville Victoria 3052
A description of the nature of The Royal Children’s Hospital’s operations and its principal activities is included in the report of operations, which does not form part of these financial statements.
(d) Rounding
All amounts shown in the financial statements are expressed to the nearest thousand dollars unless otherwise stated.
Minor discrepancies in tables between totals and sum of components are due to rounding.
(e) Principles of Consolidation
In accordance with AASB 127 Consolidated and Separate Financial Statements, the consolidated financial statements of The Royal Children’s Hospital incorporates the assets and liabilities of all entities controlled by The Royal Children’s Hospital as at 30 June 2012, and their income and expenses for that part of the reporting period in which control existed. Control exists when The Royal Children’s Hospital has the power to govern the financial and operating policies of an entity so as to obtain benefits from its activities. In assessing control, potential voting rights that presently are exercisable are taken into account. The consolidated financial statements include the audited financial statements of the controlled entities listed in Note 23.
Where control of an entity is obtained during the financial period, its results are included in the comprehensive operating statement from the date on which control commenced. Where control ceases during a financial period, the entity’s results are included for that part of the period in which control existed. Where dissimilar accounting policies are adopted by entities and their effect is considered material, adjustments are made to ensure consistent policies are adopted in these financial statements.
The consolidated financial statements include the audited financial statements of the following controlled entities:
• The Royal Children’s Hospital’s Foundation Trust Fund
• The Royal Children’s Hospital Education Institute Limited
• Communities That Care Limited
The Royal Children’s Hospital’s Foundation Trust Fund is a controlled entity of The Royal Children’s Hospital by virtue of the power to appoint a new or additional trustee of the Foundation Trust Fund.
The Royal Children’s Hospital Education Institute Limited and Communities That Care Limited are deemed to be controlled entities of The Royal Children’s Hospital because the majority of the entities’ Board positions comprise of The Royal Children’s Hospital Directors and Senior Management.
In the process of preparing consolidated financial statements for The Royal Children’s Hospital, all material transactions and balances between consolidated entities are eliminated.
Intersegment TransactionsTransactions between segments within The Royal Children’s Hospital have been eliminated to reflect the extent of the Hospital’s operations as a group.
Jointly controlled assetsInterest in Victorian Comprehensive Cancer Centre which is a jointly controlled asset is accounted by recognising in The Royal Children’s Hospital’s Financial Statements its proportionate share of assets, liabilities and any income and expenses of such assets.
(f) Scope and presentation of financial statements
Fund AccountingThe Royal Children’s Hospital operates on a fund accounting basis and maintains three funds: Operating, Specific Purpose and Capital Funds. The Royal Children’s Hospital’s Capital and Specific Purpose Funds include unspent capital donations and receipts from fund-raising activities conducted solely in respect of these funds.
Services Supported by Health Services Agreement and Services Supported by Hospital and Community Initiatives
Activities classified as Services Supported by Health Services Agreement (HSA) are substantially funded by the Department of Health and are also funded from other sources such as the Commonwealth, patients and residents, while Services Supported by Hospital and Community Initiatives (H&CI) are funded by the Health Service’s own activities or local initiatives and/or the Commonwealth.
Comprehensive operating statementThe comprehensive operating statement includes the subtotal entitled ‘Net result Before Capital and Specific Items’ to enhance the understanding of the financial performance of The Royal Children’s Hospital. This subtotal reports the result excluding items such as capital grants; assets received or provided free of charge, depreciation, and items of unusual nature and amount such as specific revenues and expenses. The exclusion of these items is made to enhance matching of income and expenses so as to facilitate the comparability and consistency of results between years and Victorian Public Health Services. The Net result Before Capital and Specific Items is used by the management of The Royal Children’s Hospital, the Department of Health and the Victorian Government to measure the ongoing result of Health Services in operating hospital services.
Capital and specific items, which are excluded from this sub-total, comprise:
• Capital purpose income, which comprises all tied grants, donations and bequests received for the purpose of acquiring non-current assets, such as capital works, plant and equipment or intangible assets. It also includes donations of plant and equipment (refer Note 1 (g)). Consequently the recognition of revenue as capital purpose income is based on the intention of the provider of the revenue at the time the revenue is provided.
• Specific income/expense, comprises the following items, where material: - Voluntary departure packages
- Write-down of inventories - Non-current asset revaluation increments/decrements - Diminution/impairment of investments
• Depreciation and amortisation, as described in Note 1 (h)
• Assets provided or received free of charge, as described in Note 1 (g) and (h)
• Impairment of financial and non financial assets, includes all impairment losses which have been recognised in accordance with Note 1 (j) and (k).
• Expenditure using capital purpose income, comprises expenditure which either falls below the asset capitalisation threshold, or doesn’t meet asset recognition criteria and therefore does not result in the recognition of an asset in the balance sheet, where funding for that expenditure is from capital purpose income.
Balance SheetAssets and Liabilities are categorised either as current or non-current.
Statement of changes in equityThe statement of changes in equity presents reconciliations of each non-owner and owner equity opening balance at the beginning of the reporting period to the closing balance at the end of the reporting period. It also shows separately changes due to amounts recognised in the comprehensive result and amounts recognised in other comprehensive income related to other non-owner changes in equity.
Cash flow statementCash flows are classified according to whether or not they arise from operating activities, investing activities, or financing activities. This classification is consistent with requirements under AASB 107 Statement of Cash Flows.
Comparative InformationBelow are the changes to the consolidated figures from previous year’s financial report. These changes do not impact the underlying result:
• Note 3: Expenses – Consultancy, contractors and advertising costs are reclassed into individual line items as per the new FRD 22C. Consultancy and Contractors costs are added under Non Salary Labour Costs sub-total, $4.9M from salaries and wages and $2.4M from Administrative expense were reclassed to this new line item. Advertising cost is added under Other Expenses from Continuing Operations sub-total, $285k was reclassed from Administrative expenses to this new line item.
• Comprehensive Operating Statement – Reclass of net loss on disposal of Non-Current Assets from Capital Purpose income of $30k. This reclass is as per Health Service Guideline.
• Removal of Income in Advance under Financial Liabilities from Financial Instrument note. Income in advance is not considered a financial instrument. The schedules affected are Interest rate exposure of Financial Assets and Liabilities and Maturity Analysis of financial liabilities.
(g) Income Recognition
Income is recognised in accordance with AASB 118 Revenue and is recognised to the extent it is probable that the economic benefits will flow to The Royal Children’s Hospital and the income can be reliably measured. Unearned income at reporting date is reported as income received in advance.
Amounts disclosed as revenue are, where applicable, net of returns, allowances and duties and taxes.
Government Grants and other transfers of income (other than contributions by owners)In accordance with AASB 1004 Contributions, government grants and other transfers of income (other than contributions by owners) are recognised as income when The Royal Children’s Hospital gains control of the underlying assets irrespective of whether conditions are imposed on The Royal Children’s Hospital’s use of the contributions.
Contributions are deferred as income in advance when there is a present obligation to repay them and the present obligation can be reliably measured.
Indirect Contributions from the Department of HealthInsurance and Outsourced contributions for the Public Private Partnership are recognised as revenue following advice from the Department of Health.
Long Service Leave (LSL) – Revenue is recognised upon finalisation of movements in LSL liability in line with the arrangements set out in the Metropolitan Health and Aged Care Services Division Hospital Circular 14/2009.
Patient and Resident FeesPatient fees are recognised as revenue at the time invoices are raised.
Private Practice FeesPrivate practice fees are recognised as revenue at the time invoices are raised.
Revenue from commercial activitiesRevenue from commercial activities such as commercial laboratory medicine is recognised at the time invoices are raised.
Donations and Other BequestsDonations and bequests are recognised as revenue when received. If donations are for a special purpose, they may be appropriated to a reserve, such as specific restricted purpose reserve.
Dividend RevenueDividend Revenue is recognised when the right to receive payment is established.
Interest RevenueInterest revenue is recognised on a time proportionate basis that takes into account the effective yield of the financial asset.
Sale of InvestmentsThe gain/loss on sale of investments is recognised when the investment is realised.
notes to and forming part of the financial statements notes to and forming part of the financial statements
| Annual Report 2011 – 12 The Royal Children’s Hospital and Controlled Entities34 35 Annual Report 2011 – 12 The Royal Children’s Hospital and Controlled Entities |

Note 1: Statement of Significant Accounting Policies (continued)
Resources Received Free of Charge or for Nominal ConsiderationResources provided and received free of charge or for nominal consideration are recognised at their fair value when the transferee obtains control over them, irrespective of whether restrictions or conditions are imposed over the use of the contributions, unless received from another Health Service or agency as a consequence of a restructuring of administrative arrangements. In the latter case, such transfer will be recognised at carrying value. Contributions in the form of services are only recognised when a fair value can be reliably determined and the services would have been purchased if not donated.
(h) Expense Recognition
Expenses are recognised as they are incurred and reported in the financial year to which they relate.
Cost of Goods SoldCosts of goods sold are recognised when the sale of an item occurs by transferring the cost or value of the item/s from inventories.
Employee expensesEmployee expenses include:
• Wages and salaries;
• Annual leave;
• Sick leave;
• Accrued days off
• Long service leave; and
• Superannuation expenses which are reported differently depending upon whether employees are members of defined benefit or defined contribution plans.
Defined contribution superannuation plansIn relation to defined contribution (i.e. accumulation) superannuation plans, the associated expense is simply the employer contributions that are paid or payable in respect of employees who are members of these plans during the reporting period. Contributions to defined contribution superannuation plans are expensed when incurred.
Defined benefit superannuation plansThe amount charged to the comprehensive operating statement in respect of defined benefit plan superannuation represents the contributions made by The Royal Children’s Hospital to the superannuation plan in respect to the current services of current Royal Children’s Hospital staff during the reporting period. Superannuation contributions are made to the plans based on the relevant rules of each plan, and are based upon actuarial advice.
Employees of The Royal Children’s Hospital are entitled to receive superannuation benefits and The Royal Children’s Hospital contributes to both the defined benefit and defined contribution plans. The defined benefit plans provide benefits based on years of service and final average salary.
The Royal Children’s Hospital made contributions to the following major superannuation plans during the year:
Contributions Paid or Payable for the year
2012$
2011$
Defined benefit plans:
Health Super Scheme 946,134 982,018
Defined contribution plans:
Health Super Scheme 17,955,845 17,651,446
Hesta 4,916,980 4,139,443
Other 1,002,907 833,434
Depreciation
Assets with a cost in excess of $1,000 are capitalised and depreciation has been provided on depreciable assets so as to allocate their cost or valuation over their estimated useful lives. Depreciation is generally calculated on a straight-line basis, at a rate that allocates the asset value, less any estimated residual value over its estimated useful life. Estimates of the remaining useful lives and depreciation method for all assets are reviewed at least annually,
and adjustments made where appropriate. This depreciation charge is not funded by the Department of Health.
Depreciation is provided on property, plant and equipment, including freehold buildings, but excluding land and investment properties. Depreciation begins when the asset is available for use, which is when it is in the location and condition necessary for it to be capable of operating in a manner intended by management.
The following table indicates the expected useful lives of non-current assets on which the depreciation charges are based.
2012 2011
Buildings
- Structure Shell Building Fabric 52 Years 52 Years
- Site Engineering Services and Central Plant
23 years 23 years
Central Plant
- Fit Out 23 years 23 years
- Trunk Reticulated Building Systems 24 years 24 years
Plant and Equipment 3 to 7 years 3 to 7 years
Medical Equipment 7 to 10 years 7 to 10 years
Computers and Communication 3 years 3 years
Furniture and Fittings 13 years 13 years
Motor Vehicles 10 years 10 years
Intangible Assets 3 years 3 years
Leasehold Improvements 4 to 8 Years 4 to 8 Years
The remaining useful life of buildings was also reviewed as part of the valuation of Land and Buildings as at 30 June 2009 with the depreciated replacement cost where applicable reflecting the Buildings’ remaining useful life. Under the Public Private Partnership (PPP) arrangement, the Front Entry Building is currently being refurbished with project cost incurred by Children’s Health Partnership Pty Ltd (CHP). As of 30 June 2012, the Front Entry Building has been fully depreciated.
There is no depreciation on the Public Private Partnership (PPP) arrangement leased assets as the risk; maintenance and replacement of the leased assets are retained by Children’s Health Partnership Pty Ltd.
AmortisationAmortisation is allocated to intangible assets with finite useful lives on a systematic (typically straight-line) basis over the asset’s useful life. Amortisation begins when the asset is available for use, that is, when it is in the location and condition necessary for it to be capable of operating in the manner intended by management. The amortisation period and the amortisation method for an intangible asset with a finite useful life are reviewed at least at the end of each annual reporting period. In addition, an assessment is made at each reporting date to determine whether there are indicators that the intangible asset concerned is impaired. If so, the asset concerned is tested as to whether its carrying value exceeds its recoverable amount.
Intangible assets with indefinite useful lives are not amortised, but are tested for impairment annually or whenever there is an indication that the asset may be impaired. The useful lives of intangible assets that are not being amortised are reviewed each period to determine whether events and circumstances continue to support an indefinite useful life assessment for that asset. In addition, The Royal Children’s Hospital tests all intangible assets with indefinite useful lives for impairment by comparing the recoverable amount for each asset with its carrying amount:
• Annually; and
• Whenever there is an indication that the intangible asset may be impaired.
Any excess of the carrying amount over the recoverable amount is recognised as an impairment loss.
Intangible assets with finite useful lives are amortised over a 3 year period (2011: 3 years).
Finance CostsFinance costs are recognised as expenses in the period in which they are incurred.
Finance costs include:
• Finance charges in respect of finance leases recognised by The Royal Children’s Hospital on behalf of the State of Victoria in accordance with AASB 117 Leases.
Resources Provided Free of Charge or for Nominal ConsiderationResources provided free of charge or for nominal consideration are recognised at their fair value when the transferee obtains control over them, irrespective of whether restrictions or conditions are imposed over the use of the contributions, unless received from another Health Service or agency as a consequence of a restructuring of administrative arrangements. In the latter case, such transfer will be recognised at carrying value. Contributions in the form of services are only recognised when a fair value can be reliably determined and the services would have been purchased if not donated.
As of 30 June 2012, The Department of Health has provided land free of charge for the new Royal Children’s Hospital site. The land is recognised at fair value of $28.5M.
(i) Financial Instruments
Financial instruments arise out of contractual agreements that give rise to a financial asset of one entity and a financial liability or equity instrument of another entity. Due to the nature of The Royal Children’s Hospital’s activities, certain financial assets and financial liabilities arise under statute rather than a contract. Such financial assets and financial liabilities do not meet the definition of financial instruments in AASB 132 Financial Instruments: Presentation. For example, statutory receivables arising from taxes, fines and penalties do not meet the definition of financial instruments as they do not arise under contract.
Where relevant, for note disclosure purposes, a distinction is made between those financial assets and financial liabilities that meet the definition of financial instruments in accordance with AASB 132 and those that do not.
The following refers to financial instruments unless otherwise stated.
Financial assets at fair value through profit and lossFinancial assets are categorised as fair value through profit or loss at trade date if they are classified as held for trading or designated as such upon initial recognition. Financial instrument assets are designated at fair value through profit or loss on the basis that the financial assets form part of a group of financial assets that are managed by the entity concerned based on their fair values, and have their performance evaluated in accordance with documented risk management and investment strategies.
Financial instruments at fair value through profit or loss are initially measured at fair value and attributed transaction costs are expensed as incurred. Subsequently, any changes in fair value are recognised in the net result.
Financial assets held for trading purposes are classified as current assets and are stated at fair value, with any resultant gain or loss recognised in profit or loss. The net gain or loss recognised in net result incorporates any dividend or interest earned on the financial asset. Fair value is determined in the manner described in Note 17.
Loans and receivablesLoans and receivables are financial instrument assets with fixed and determinable payments that are not quoted on an active market. These assets are initially recognised at fair value plus any directly attributable transaction costs. Subsequent to initial measurement, loans and receivables are measured at amortised cost using the effective interest method, less any impairment.
Loans and receivables category includes cash and deposits (refer to Note 1(j)), term deposits with maturity greater than three months, trade receivables, loans and other receivables, but not statutory receivables.
The effective interest method is a method of calculating the amortised cost of a financial asset and of allocating interest income over the relevant period. The effective interest rate is the rate that exactly discounts estimated future cash receipts through the expected life of the financial asset, or, where appropriate, a shorter period.
Available-for-sale financial assetsAvailable-for-sale financial instrument assets are those designated as available-for-sale or not classified in any other category of financial instrument asset. Such assets are initially recognised at fair value. Gains and losses arising from changes in fair value are recognised directly in equity until the
investment is disposed of or is determined to be impaired, at which time the cumulative gain or loss previously recognised in equity is included in net result for the period. Fair value is determined in the manner described in Note 18.
Financial liabilities at amortised costFinancial instrument liabilities are initially recognised on the date they are originated. They are initially measured at fair value plus any directly attributable transaction costs. Subsequent to initial recognition, these financial instruments are measured at amortised cost with any difference between the initial recognised amount and the redemption value being recognised in profit and loss over the period of the interest-bearing liability, using the effective interest rate method.
Financial instrument liabilities measured at amortised cost include all of The Royal Children’s Hospital’s contractual payables, deposits held and advances received, and interest-bearing arrangements other than those designated at fair value through profit or loss.
The Financial Liabilities includes the Department of Health obligations to the Children’s Health Partnership for the Quarterly Service Payment (QSP) of the new Royal Children’s Hospital.
(j) Financial Assets
Cash and Cash EquivalentsCash and cash equivalents comprise cash on hand and cash at bank, deposits at call and highly liquid investments with an original maturity of three months or less, which are held for the purpose of meeting short term cash commitments rather than for investment purposes, which are readily convertible to known amounts of cash and are subject to insignificant risk of changes in value.
ReceivablesReceivables consist of:
• Statutory receivables, which includes predominantly amounts owing from the Victorian Government and GST input tax credits recoverable; and
• Contractual receivables, which includes of mainly debtors in relation to goods and services and accrued investment income.
Receivables that are contractual are classified as financial instruments and categorised as loans and receivables. Statutory receivables are recognised and measured similarly to contractual receivables (except for impairment), but are not classified as financial instruments because they do not arise from a contract.
Receivables are recognised initially at fair value and subsequently measured at amortised cost, using the effective interest method, less any accumulated impairment.
Trade debtors are carried at nominal amounts due and are due for settlement within 30 days from the date of recognition. Collectability of debts is reviewed on an ongoing basis, and debts which are known to be uncollectible are written off. A provision for doubtful debts is recognised when there is objective evidence that an impairment loss has occurred. Bad debts are written off when identified.
Investments and Other Financial AssetsInvestments are recognised and derecognised on trade date where purchase or sale of an investment is under a contract whose terms require delivery of the investment within the timeframe established by the market concerned, and are initially measured at fair value, net of transaction costs.
Investments are classified in the following categories:
• Financial assets at fair value through profit or loss;
• Loans and receivables; and
• Available-for-sale financial assets.
The Royal Children’s Hospital classifies its other financial assets between current and non-current assets based on the purpose for which the assets were acquired. Management determines the classification of its other financial assets at initial recognition.
The Royal Children’s Hospital assesses at each balance sheet date whether a financial asset or group of financial assets is impaired.
All financial assets, except those measured at fair value through profit and loss are subject to annual review for impairment.
notes to and forming part of the financial statements notes to and forming part of the financial statements
| Annual Report 2011 – 12 The Royal Children’s Hospital and Controlled Entities36 37 Annual Report 2011 – 12 The Royal Children’s Hospital and Controlled Entities |

Note 1: Statement of Significant Accounting Policies (continued)
Investments in jointly controlled assets and operationsIn respect of any interest in jointly controlled assets, The Royal Children’s Hospital recognises in the financial statements:
• its share of jointly controlled assets;
• any liabilities that it had incurred;
• its share of liabilities incurred jointly by the joint venture;
• any income earned from the selling or using of its share of the output from the joint venture; and
• any expenses incurred in relation to being an investor in the joint venture.
Impairment of Financial AssetsAt the end of each reporting period The Royal Children’s Hospital assesses whether there is objective evidence that a financial asset or group of financial asset is impaired. All financial instrument assets, except those measured at fair value through profit or loss, are subject to annual review for impairment.
Receivables are assessed for bad and doubtful debts on a regular basis. Bad debts considered as written off and allowances for doubtful receivables are expensed.
The amount of the allowance is the difference between the financial asset’s carrying amount and the present value of estimated future cash flows, discounted at the effective interest rate.
Where the fair value of an investment in an equity instrument at balance date has reduced by 20 percent or more than its cost price or where its fair value has been less than its cost price for a period of 12 or more months, the financial asset is treated as impaired.
In order to determine an appropriate fair value as at 30 June 2012 for its portfolio of financial assets, The Royal Children’s Hospital used the market value of the individual units in the funds invested which was provided by the Victorian Funds Management Corporation.
In assessing impairment of statutory (non-contractual) financial assets, which are not financial instruments, professional judgement is applied in assessing materiality using estimates, averages and other computational methods in accordance with AASB 136 Impairment of Assets.
Net Gain/(Loss) on Financial InstrumentsNet gain/(loss) on financial instruments includes:
• realised and unrealised gains and losses from revaluations of financial instruments that are designated at fair value through profit or loss;
• impairment and reversal of impairment for financial instruments at amortised cost; and
• disposals of financial assets.
Revaluation of Financial Instruments at Fair ValueThe Revaluation gain/(loss) on financial instruments at fair value excludes dividends or interest earned on financial assets.
(k) Non-Financial Assets
InventoriesInventories include goods held either for sale, consumption or for distribution at no or nominal cost in the ordinary course of business operations.
Inventories held for distribution are measured at cost, adjusted for any loss of service potential. All other inventories are measured at the lower of cost and net realisable value.
The basis used in assessing loss of service potential for inventories held for distribution include current replacement cost and technical or functional obsolescence. Technical obsolescence occurs when an item still functions for some or all of the tasks it was originally acquired to do, but no longer matches existing technologies. Functional obsolescence occurs when an item no longer functions the way it did when it was first acquired.
Property, Plant and EquipmentAll non-current physical assets are measured initially at cost and subsequently revalue at fair value less accumulated depreciation and impairment. Where an asset is acquired for no or nominal cost, the cost is its fair value at the date of acquisition.
The initial cost for non-financial physical assets under finance lease (Refer to Note 1(m)) is measured at the present value of the minimum lease payments committed over the lease term by the State of Victoria, each determined at the inception of the lease.
Crown Land is measured at fair value with regard to the property’s highest and best use after due consideration is made for any legal or constructive restrictions imposed on the land, public announcements or commitments made in relation to the intended use of the land. Theoretical opportunities that may be available in relation to the assets are not taken into account until it is virtually certain that any restrictions will no longer apply.
Land and Buildings are recognised initially at cost and subsequently measured at fair value less accumulated depreciation and impairment.
Plant, Equipment and Vehicles are measured initially at cost and subsequently measured at fair value less accumulated depreciation and impairment. Depreciated historical cost is generally a reasonable proxy for depreciated replacement cost because of the short lives of the assets concerned.
Revaluations of Non-Current Physical AssetsNon-current physical assets are measured at fair value and are revalued in accordance with FRD 103D Non-Current Physical Assets. This revaluation process normally occurs at least every five years, based upon the asset’s Government Purpose Classification, but may occur more frequently if fair value assessments indicate material changes in values. Independent valuers are used to conduct these scheduled revaluations and any interim revaluations are determined in accordance with the requirements of the FRDs. Revaluation increments or decrements arise from differences between an asset’s carrying value and fair value.
Revaluation increments are credited directly to the asset revaluation surplus, except that, to the extent that an increment reverses a revaluation decrement in respect of that same class of asset previously recognised as an expense in net result, the increment is recognised as income in the net result.
Revaluation decrements are recognised immediately as expenses in the net result, except that, to the extent that a credit balance exists in the asset revaluation surplus in respect of the same class of assets, they are debited directly to the asset revaluation surplus.
Revaluation increases and revaluation decreases relating to individual assets within an asset class are offset against one another within that class but are not offset in respect of assets in different classes.
Revaluation surplus are normally not transferred to accumulated funds on derecognition of the relevant asset.
In accordance with FRD 103D, The Royal Children’s Hospital’s non-current physical assets were assessed to determine whether revaluation of the non-current physical assets was required.
Investment PropertiesInvestment properties represent properties held to earn rentals or for capital appreciation or both. Investment properties exclude properties held to meet service delivery objectives of State of Victoria.
Investment properties are initially recognised at cost. Costs incurred subsequent to initial acquisition are capitalised when it is probable that future economic benefits in excess of the originally assessed performance of the asset will flow to The Royal Children’s Hospital.
Subsequent to initial recognition at cost, investment properties are revalued to fair value with changes in the fair value recognised as income or expenses in the period that they arise. Investment properties are not depreciated nor tested for impairment.
Rental revenue from the leasing of investment properties is recognised in the comprehensive operating statement in the periods in which it is receivable, on a straight line basis over the lease term.
Intangible AssetsIntangible assets represent identifiable non-monetary assets without physical substance including computer software and development costs.
Intangible assets are initially recognised at cost. Subsequently, intangible assets with finite useful lives are carried at cost less accumulated amortisation and accumulated impairment losses. Costs incurred subsequent to initial acquisition are capitalised when it is expected that additional future economic benefits will flow to The Royal Children’s Hospital.
Other Non-Financial AssetsPrepayments
Other non-financial assets include prepayments which represent payments in advance of receipt of goods or services or part of expenditure made in one accounting period covering a term extending beyond that period.
Disposal of Non-Financial Assets
Any gain or loss on the sale of non-financial assets is recognised in the Comprehensive Operating Statement at the date that control of the asset is passed to the buyer and is determined after deducting from the proceeds the carrying value of the asset at that time.
Impairment of Non-Financial Assets
Apart from intangible assets with indefinite useful lives, all other assets are assessed annually for indications of impairment, except for:
• inventories;
• financial instrument assets;
• investment property that is measured at fair value.
If there is an indication of impairment, the assets concerned are tested as to whether their carrying value exceeds their recoverable amount. Where an asset’s carrying value exceeds its recoverable amount, the difference is written-off as an expense except to the extent that the write-down can be debited to an asset revaluation surplus amount applicable to that same class of asset.
If there is an indication that there has been a change in the estimate of an asset’s recoverable amount since the last impairment loss was recognised, the carrying amount shall be increased to its recoverable amount. This reversal of the impairment loss occurs only to the extent that the asset’s carrying amount does not exceed the carrying amount that would have been determined, net of depreciation or amortisation, if no impairment loss had been recognised in prior years.
It is deemed that, in the event of the loss of an asset, the future economic benefits arising from the use of the asset will be replaced unless a specific decision to the contrary has been made. The recoverable amount for most assets is measured at the higher of depreciated replacement cost and fair value less costs to sell. Recoverable amount for assets held primarily to generate net cash inflows is measured at the higher of the present value of future cash flows expected to be obtained from the asset and fair value less costs to sell.
(l) Liabilities
PayablesPayables consist of:
• Contractual payables which consist predominantly of accounts payable representing liabilities for goods and services provided to the health service prior to the end of the financial year that are unpaid, and arise when the health service becomes obliged to make future payments in respect of the purchase of those goods and services.
The normal credit terms for accounts payable are usually Nett 60 days.
• Statutory payables, such as goods and services tax (GST) and fringe benefits tax (FBT) payables.
Contractual payables are initially recognised at fair value, and then subsequently carried at amortised cost. Statutory payables are recognised and measured similarly to contractual payables, but are not classified as financial instruments and not included in the category of financial liabilities at amortised cost, because they do not arise from a contract.
ProvisionsProvisions are recognised when The Royal Children’s Hospital has a present obligation, the future sacrifice of economic benefits is probable, and the amount of the provision can be measured reliably.
The amount recognised as a provision is the best estimate of the consideration required to settle the present obligation at reporting date, taking into account the risks and uncertainties surrounding the obligation. Where a provision is measured using the cash flows estimated to settle the present obligation, its carrying amount is the present value of those cash flows, using a discount rate that reflects the time value of money and risks specific to the provision.
When some or all of the economic benefits required to settle a provision are expected to be received from a third party, the receivable is recognised as an asset if it is virtually certain that recovery will be received and the amount of the receivable can be measured reliably.
Employee BenefitsWages and Salaries, Annual Leave and Accrued Days OffLiabilities for wages and salaries, including non-monetary benefits, annual leave, accumulating sick leave and accrued days off which are expected to be settled within 12 months of the reporting date are recognised in the provision for employee benefits in respect of employee’s services up to the reporting date, and are classified as current liabilities and measured at their nominal values.
Those liabilities that are not expected to be settled within 12 months are also recognised in the provision for employee benefits as current liabilities, but are measured at present value of the amounts expected to be paid when the liabilities are settled using the remuneration rate expected to apply at the time of settlement.
Long Service LeaveThe Liability for long service leave (LSL) is recognised in the provision for employee benefits.
Current Liability – Unconditional LSL (representing 10 or more years of continuous service) is disclosed as a current liability regardless of whether The Royal Children’s Hospital does not expect to settle the liability within 12 months as it does not have the unconditional right to defer the settlement of the entitlement should an employee take leave within 12 months.
The components of this current LSL liability are measured at:
• present value – component that The Royal Children’s Hospital does not expect to settle within 12 months; and
• nominal value – component that The Royal Children’s Hospital expects to settle within 2 months.
Non-Current Liability – Conditional LSL (representing less than 10 years of continuous service) is disclosed as a non-current liability. There is an unconditional right to defer the settlement of the entitlement until 10 years of service has been completed by an employee. Conditional LSL is required to be measured at present value.
Consideration is given to expected future wage and salary levels, experience of employee departures and periods of service. Expected future payments are discounted using interest rates of Commonwealth Government guaranteed securities in Australia.
On-CostsEmployee benefit on-costs, such as workers compensation and superannuation are recognised together with provisions for employee benefits.
Superannuation liabilitiesThe Royal Children’s Hospital does not recognise any unfunded defined benefit liability in respect of the superannuation plans because The Royal Children’s Hospital has no legal or constructive obligation to pay future benefits relating to its employees; its only obligation is to pay superannuation contributions as they fall due. The Department of Treasury and Finance administers and discloses the state’s defined benefit liabilities in its financial statements.
Termination BenefitsTermination benefits are payable when employment is terminated before the normal retirement date or when an employee accepts voluntary redundancy in exchange for these benefits.
Liabilities for termination benefits are recognised when a detailed plan for the termination has been developed and a valid expectation has been raised with those employees affected that the terminations will be carried out. The liabilities for termination benefits are recognised in other creditors unless the amount or timing of the payments is uncertain, in which case they are recognised as a provision.
(m) Leases
Leases are classified at their inception as either operating or finance leases based on the economic substance of the agreement so as to reflect the risks and rewards incidental to ownership.
notes to and forming part of the financial statements notes to and forming part of the financial statements
| Annual Report 2011 – 12 The Royal Children’s Hospital and Controlled Entities38 39 Annual Report 2011 – 12 The Royal Children’s Hospital and Controlled Entities |

Note 1: Statement of Significant Accounting Policies (continued)
Finance LeasesAs at 30 June 2012, The Royal Children’s hospital does not hold any finance lease arrangements with other parties.
The new facility was built through a Public Private Partnership arrangement between the State of Victoria and Children’s Health Partnership Pty Ltd. The Royal Children’s Hospital occupies the new facility through a sublease agreement with Children’s Health Partnership Pty Ltd. The Royal Children’s Hospital, on behalf of the State of Victoria, agreed to record and reports the state’s obligations (including Finance Lease liability and Operating expenses) associated with the new Royal Children’s Hospital’s development.
The Finance leases are recognised as assets and liabilities at amounts equal to the present value of the minimum lease payment, each determined at the inception of the lease. Minimum lease payments are apportioned between reduction of the outstanding lease liability, and the periodic finance expense which is calculated using the interest rate implicit in the lease, and charged directly to the comprehensive operating statement.
Contingent rentals associated with finance leases are recognised as an expense in the period in which they are incurred.
Operating LeasesRental income from operating lease is recognised when received over the term of the relevant lease.
Leasehold ImprovementsThe cost of leasehold improvements are capitalised as an asset and depreciated over the remaining term of the lease or the estimated useful life of the improvements, whichever is the shorter.
(n) Equity
Contributed CapitalConsistent with Australian Accounting Interpretation 1038 Contributions by Owners Made to Wholly-Owned Public Sector Entities and FRD 119 Contributions by Owners, appropriations for additions to the net asset base have been designated as contributed capital. Other transfers that are in the nature of contributions or distributions that have been designated as contributed capital are also treated as contributed capital.
Property, Plant and Equipment Revaluation SurplusThe asset revaluation surplus is used to record increments and decrements on the revaluation of non-current assets.
Financial Asset Available-for-Sale Revaluation SurplusThe available-for-sale revaluation surplus arises on the revaluation of available-for-sale financial assets. Where a revalued financial asset is sold, that portion of the surplus which relates to that financial asset is effectively realised, and is recognised in the comprehensive operating statement. Where a revalued financial asset is impaired that portion of the surplus which relates to that financial asset is recognised in the comprehensive operating statement.
General Purpose ReserveGeneral Purpose Reserves represent internally managed specific purpose funds that are not restricted. Internally managed specific purpose funds are funds established, managed, and controlled by the Board.
Specific Restricted Purpose ReserveA specific restricted purpose reserve is established where The Royal Children’s Hospital has possession or title to the funds but has no discretion to amend or vary the restriction and/or condition underlying the funds received.
(o) Commitments
Commitments for future expenditure include operating and capital commitments arising from contracts. These commitments are disclosed by way of a note (refer to Note 19) at their nominal value and are inclusive of the goods and services tax (GST) payable. In addition, where it is considered appropriate and provides additional relevant information to users, the net present values of significant individual projects are stated. These future expenditures cease to be disclosed as commitments once the related liabilities are recognised on the balance sheet.
(p) Contingent Assets and Contingent Liabilities
Contingent assets and contingent liabilities are not recognised in the balance sheet, but are disclosed by way of note and, if quantifiable, are measured at nominal value. Contingent assets and contingent liabilities are presented inclusive of GST receivable or payable respectively.
(q) Goods and Services Tax (GST)
Income, expenses and assets are recognised net of the amount of associated GST, unless the GST incurred is not recoverable from the taxation authority. In this case it is recognised as part of the cost of acquisition of the asset or as part of the expense.
Receivables and payables are stated inclusive of the amount of GST receivable or payable. The net amount of GST recoverable from, or payable to, the taxation authority is included with other receivables or payables in the balance sheet.
Cash flows are presented on a gross basis. The GST components of cash flows arising from investing or financing activities which are recoverable from, or payable to the taxation authority, are presented as an operating cash flow.
Commitments and contingent assets and liabilities are presented on a gross basis.
(r) Foreign currency
Foreign currency transactions during the financial year are brought to account using the exchange rate in effect at the date of the payment.
(s) Category Groups
The Royal Children’s Hospital has used the following category groups for reporting purposes for the current and previous financial years.
Admitted Patient Services (Admitted Patients) comprises all recurrent health revenue/expenditure on admitted patient services, where services are delivered in public hospitals, or free standing day hospital facilities, or palliative care facilities, or rehabilitation facilities, or alcohol and drug treatment units or hospitals specialising in dental services, hearing and ophthalmic aids.
Mental Health Services (Mental Health) comprises all recurrent health revenue/expenditure on specialised mental health services (child and adolescent, general and adult, community and forensic) managed or funded by the state or territory health administrations, and includes: Admitted patient services (including forensic mental health), outpatient services, emergency department services (where it is possible to separate emergency department mental health services), community-based services, residential and ambulatory services.
Outpatient Services (Outpatients) comprises all recurrent health revenue/expenditure on public hospital type outpatient services, where services are delivered in public hospital outpatient clinics, or free standing day hospital facilities, or rehabilitation facilities, or alcohol and drug treatment units, or outpatient clinics specialising in ophthalmic aids or palliative care.
Emergency Department Services (EDS) comprises all recurrent health revenue/expenditure on emergency department services that are available free of charge to public patients.
Primary Health revenue/expenditure for Community Health Services including health promotion and counselling, physiotherapy, speech therapy, podiatry and occupational therapy.
(t) Issued but not yet effective Australian accounting and reporting pronouncements
The table in this appendix is provided to assist entities in updating their disclosure as required by AASB 108 paragraph 30, of issued but not yet effective Australian Accounting Standards in the Summary of Significant Accounting Policies note of their financial reports.
Standard/Interpretation Summary Applicable for annual reporting periods beginning on
Impact on public sector entity financial statements
AASB 9 Financial instruments This standard simplifies requirements for the classification and measurement of financial assets resulting from Phase 1 of the IASB’s project to replace IAS 39 Financial Instruments: Recognition and Measurement (AASB 139 Financial Instruments: Recognition and Measurement).
1 Jan 2013 Detail of impact is still being assessed.
AASB 10 Consolidated Financial Statements
This Standard establishes principles for the presentation and preparation of consolidated financial statements when an entity controls one or more other entities and supersedes those requirements in AASB 127 Consolidated and Separate Financial Statements and Interpretation 112 Consolidation – Special Purpose Entities.
1 Jan 2013 Not-for-profit entities are not permitted to apply this Standard prior to the mandatory application date. The AASB is assessing the applicability of principles in AASB 10 in a not-for-profit context.
As such, impact will be assessed after the AASB’s deliberation.
AASB 11 Joint Arrangements This Standard requires entities that have an interest in arrangements that are controlled jointly to assess whether the arrangement is a joint operation or joint venture. AASB 11 shall be applied for an arrangement that is a joint operation. It also replaces parts of requirements in AASB 131 Interests in Joint Ventures.
1 Jan 2013 Not-for-profit entities are not permitted to apply this Standard prior to the mandatory application date. The AASB is assessing the applicability of principles in AASB 11 in a not-for-profit context.
As such, impact will be assessed after the AASB’s deliberation.
AASB 12 Disclosure of Interests in Other Entities
This Standard requires disclosure of information that enables users of financial statements to evaluate the nature of, and risks associated with, interests in other entities and the effects of those interests on the financial statements. This Standard replaces the disclosure requirements in AASB 127 and AASB 131.
1 Jan 2013 Not-for-profit entities are not permitted to apply this Standard prior to the mandatory application date. The AASB is assessing the applicability of principles in AASB 12 in a not-for-profit context.
As such, impact will be assessed after the AASB’s deliberation.
AASB 13 Fair Value Measurement
This Standard outlines the requirements for measuring the fair value of assets and liabilities and replaces the existing fair value definition and guidance in other AASs. AASB 13 includes a ‘fair value hierarchy’ which ranks the valuation technique inputs into three levels using unadjusted quoted prices in active markets for identical assets or liabilities; other observable inputs; and unobservable inputs.
1 Jan 2013 Disclosure for fair value measurements using unobservable inputs are relatively onerous compared to disclosure for fair value measurements using observable inputs. Consequently, the Standard may increase the disclosures for public sector entities that have assets measured using depreciated replacement cost.
AASB 119 Employee Benefits In this revised Standard for defined benefit superannuation plans, there is a change to the methodology in the calculation of superannuation expenses, in particular there is now a change in the split between superannuation interest expense (classified as transactions) and actuarial gains and losses (classified as ‘Other economic flows – other movements in equity’) reported on the comprehensive operating statement.
1 Jan 2013 Not-for-profit entities are not permitted to apply this Standard prior to the mandatory application date.
While the total superannuation expense is unchanged, the revised methodology is expected to have a negative impact on the net result from transactions of the general government sector and for those few Victorian public sector entities that report superannuation defined benefit plans.
AASB 127 Separate Financial Statements
This revised Standard prescribes the accounting and disclosure requirements for investments in subsidiaries, joint ventures and associates when an entity prepares separate financial statements.
1 Jan 2013 Not-for-profit entities are not permitted to apply this Standard prior to the mandatory application date. The AASB is assessing the applicability of principles in AASB 127 in a not-for-profit context.
As such, impact will be assessed after the AASB’s deliberation.
AASB 128 Investments in Associates and Joint Ventures
This revised Standard sets out the requirements for the application of the equity method when accounting for investments in associates and joint ventures.
1 Jan 2013 Not-for-profit entities are not permitted to apply this Standard prior to the mandatory application date. The AASB is assessing the applicability of principles in AASB 128 in a not-for-profit context.
As such, impact will be assessed after the AASB’s deliberation.
notes to and forming part of the financial statements notes to and forming part of the financial statements
| Annual Report 2011 – 12 The Royal Children’s Hospital and Controlled Entities40 41 Annual Report 2011 – 12 The Royal Children’s Hospital and Controlled Entities |

Note 1: Statement of Significant Accounting Policies (continued)
Standard/Interpretation Summary Applicable for annual reporting periods beginning on
Impact on public sector entity financial statements
AASB 1053 Application of Tiers of Australian Accounting Standards
This Standard establishes a differential financial reporting framework consisting of two tiers of reporting requirements for preparing general purpose financial statements.
1 July 2013 The Victorian Government is currently considering the impacts of Reduced Disclosure Requirements (RDRs) for certain public sector entities and has not decided if RDRs will be implemented in the Victorian public sector.
AASB 2009-11 Amendments to Australian Accounting Standards arising from AASB 9 [AASB 1, 3, 4, 5, 7, 101, 102, 108, 112, 118, 121, 127, 128, 131, 132, 136, 139, 1023 and 1038 and Interpretations 10 and 12]
This Standard gives effect to consequential changes arising from the issuance of AASB 9.
1 Jan 2013 No significant impact is expected from these consequential amendments on entity reporting.
AASB 2010-2 Amendments to Australian Accounting Standards arising from Reduced Disclosure Requirements
This Standard makes amendments to many Australian Accounting Standards, including Interpretations, to introduce reduced disclosure requirements to the pronouncements for application by certain types of entities.
1 July 2013 The Victorian Government is currently considering the impacts of Reduced Disclosure Requirements (RDRs) for certain public sector entities and has not decided if RDRs will be implemented in the Victorian public sector.
AASB 2010-7 Amendments to Australian Accounting Standards arising from AASB 9 (December 2010) [AASB 1, 3, 4, 5, 7, 101, 102, 108, 112, 118, 120, 121, 127, 128, 131, 132, 136, 137, 139, 1023 and 1038 and Interpretations 2, 5, 10, 12, 19 and 127]
These consequential amendments are in relation to the introduction of AASB 9.
1 Jan 2013 No significant impact is expected from these consequential amendments on entity reporting.
AASB 2010-8 Amendments to Australian Accounting Standards – Deferred Tax: Recovery of Underlying Assets [AASB 112]
This amendment provides a practical approach for measuring deferred tax assets and deferred tax liabilities when measuring investment property by using the fair value model in AASB 140 Investment Property.
Beginning 1 Jan 2012
This amendment provides additional clarification through practical guidance.
AASB 2010-10 Further Amendments to Australian Accounting Standards – Removal of Fixed Dates for First-time Adopters [AASB 2009-11 and AASB 2010-7]
The amendments ultimately affect AASB 1 First-time Adoption of Australian Accounting Standards and provide relief for first-time adopters of Australian Accounting Standards from having to reconstruct transactions that occurred before their date of transition to Australian Accounting Standards.
1 Jan 2013 No significant impact is expected on entity reporting.
AASB 2011-2 Amendments to Australian Accounting Standards arising from the Trans-Tasman Convergence Project – Reduced Disclosure Requirements [AASB 101 & AASB 1054]
The objective of this amendment is to include some additional disclosure from the Trans-Tasman Convergence Project and to reduce disclosure requirements for entities preparing general purpose financial statements under Australian Accounting Standards – Reduced Disclosure Requirements.
1 July 2013 The Victorian Government is currently considering the impacts of Reduced Disclosure Requirements (RDRs) and has not decided if RDRs will be implemented in the Victorian public sector.
AASB 2011-3 Amendments to Australian Accounting Standards – Orderly Adoption of Changes to the ABS GFS Manual and Related Amendments [AASB 1049]
This amends AASB 1049 to clarify the definition of the ABS GFS Manual, and to facilitate the adoption of changes to the ABS GFS Manual and related disclosures.
1 July 2012 This amendment provides clarification to users preparing the whole of government and general government sector financial reports on the version of the GFS Manual to be used and what to disclose if the latest GFS Manual is not used.
No impact on departmental or entity reporting.
AASB 2011-4 Amendments to Australian Accounting Standards to Remove Individual Key Management Personnel Disclosure Requirements [AASB 124]
This Standard amends AASB 124 Related Party Disclosures by removing the disclosure requirements in AASB 124 in relation to individual key management personnel (KMP).
1 July 2013 No significant impact is expected from these consequential amendments on entity reporting.
Standard/Interpretation Summary Applicable for annual reporting periods beginning on
Impact on public sector entity financial statements
AASB 2011-6 Amendments to Australian Accounting Standards – Extending Relief from Consolidation, the Equity Method and Proportionate Consolidation – Reduced Disclosure Requirements [AASB 127, AASB 128 & AASB 131]
The objective of this Standard is to make amendments to AASB 127 Consolidated and Separate Financial Statements, AASB 128 Investments in Associates and AASB 131 Interests in Joint Ventures to extend the circumstances in which an entity can obtain relief from consolidation, the equity method or proportionate consolidation.
1 July 2013 The Victorian Government is currently considering the impacts of Reduced Disclosure Requirements (RDRs) and has not decided if RDRs will be implemented in the Victorian public sector.
AASB 2011-7 Amendments to Australian Accounting Standards arising from the Consolidation and Joint Arrangements Standards [AASB 1, 2, 3, 5, 7, 9, 2009-11, 101, 107, 112, 118, 121, 124, 132, 133, 136, 138, 139, 1023 and 1038 and Interpretations 5, 9, 16 and 17]
This Standard outlines consequential changes arising from the issuance of the five ‘new Standards’ to other Standards. For example, references to AASB 127 Consolidated and Separate Financial Statements are amended to AASB 10 Consolidated Financial Statements or AASB 127 Separate Financial Statements, and references to AASB 131 Interests in Joint Ventures are deleted as that Standard has been superseded by AASB 11 and AASB 128 (August 2011).
1 Jan 2013 No significant impact is expected from these consequential amendments on entity reporting.
AASB 2011-8 Amendments to Australian Accounting Standards arising from AASB 13 [AASB 1, 2, 3, 4, 5, 7, 9, 2009-11, 2010-7, 101, 102, 108, 110, 116, 117, 118, 119, 120, 121, 128, 131, 132, 133, 134, 136, 138, 139, 140, 141, 1004, 1023 and 1038 and Interpretations 2, 4, 12, 13, 14, 17, 19, 131 and 132]
This amending Standard makes consequentical changes to a range of Standards and Interpretations arising from the issuance of AASB 13. In particular, this Standard replaces the existing definition and guidance of fair value measurements in other Australian Accounting Standards and Interpretations.
1 Jan 2013 Disclosures for fair value measurements using unobservable inputs is potentially onerous, and may increase disclosures for assets measured using depreciated replacement cost.
AASB 2011-9 Amendments to Australian Accounting Standards – Presentation of Items of Other Comprehensive Income [AASB 1, 5, 7, 101, 112, 120, 121, 132, 133, 134, 1039 & 1049]
The main change resulting from this Standard is a requirement for entities to group items presented in other comprehensive income (OCI) on the basis of whether they are potentially reclassifiable to profit or loss subsequently (reclassification adjustments). These amendments do not remove the option to present profit or loss and other comprehensive income in two statements, nor change the option to present items of OCI either before tax or net of tax.
1 July 2012 This amending Standard could change the current presentation of ‘Other economic flows- other movements in equity’ that will be grouped on the basis of whether they are potentially reclassifiable to profit or loss subsequently.
No other significant impact will be expected.
AASB 2011-10 Amendments to Australian Accounting Standards arising from AASB 119 (September 2011) [AASB 1, AASB 8, AASB 101, AASB 124, AASB 134, AASB 1049 and AASB 2011-8 and Interpretation 14]
This Standard makes consequential changes to a range of other Australian Accounting Standards and Interpretation arising from the issuance of AASB 119 Employee Benefits.
1 Jan 2013 No significant impact is expected from these consequential amendments on entity reporting.
AASB 2011-11 Amendments to AASB 119 (September 2011) arising from Reduced Disclosure Requirements
This Standard makes amendments to AASB 119 Employee Benefits (September 2011), to incorporate reduced disclosure requirements into the Standard for entities applying Tier 2 requirements in preparing general purpose financial statements.
1 July 2013 The Victorian Government is currently considering the impacts of Reduced Disclosure Requirements (RDRs) and has not decided if RDRs will be implemented in the Victorian public sector.
AASB 2011-12 Amendments to Australian Accounting Standards arising from Interpretation 20 [AASB 1]
This Standard makes amendments to AASB 1 First-time Adoption of Australian Accounting Standards, as a consequence of the issuance of IFRIC Interpretation 20 Stripping Costs in the Production Phase of a Surface Mine. This Standard allows the first-time adopters to apply the transitional provisions contained in Interpretation 20.
1 Jan 2013 There may be an impact for new agencies that adopt Australian Accounting Standards for the first time.
No implication is expected for existing entities in the Victorian public sector.
notes to and forming part of the financial statements notes to and forming part of the financial statements
| Annual Report 2011 – 12 The Royal Children’s Hospital and Controlled Entities42 43 Annual Report 2011 – 12 The Royal Children’s Hospital and Controlled Entities |

Note 1: Statement of Significant Accounting Policies (continued)
Standard/Interpretation Summary Applicable for annual reporting periods beginning on
Impact on public sector entity financial statements
2011-13 Amendments to Australian Accounting Standard – Improvements to AASB 1049
This Standard aims to improve the AASB 1049 Whole of Government and General Government Sector Financial Reporting at the operational level. The main amendments clarify a number of requirements in AASB 1049, including the amendment to allow disclosure of other measures of key fiscal aggregates as long as they are clearly distinguished from the key fiscal aggregates and do not detract from the information required by AASB 1049. Furthermore, this Standard provides additional guidance and examples on the classification between ‘transactions’ and ‘other economic flows’ for GAAP items without GFS equivalents.
1 July 2012 No significant impact is expected from these consequential amendments on entity reporting.
2012-1 Amendments to Australian Accounting Standards – Fair Value Measurement – Reduced Disclosure Requirements [AASB 3, AASB 7, AASB 13, AASB 140 and AASB 141]
This amending Standard prescribes the reduced disclosure requirements in a number of Australian Accounting Standards as a consequence of the issuance of AASB 13 Fair Value Measurement.
1 July 2013 As the Victorian whole of government and the general government (GG) sector are subject to Tier 1 reporting requirements (refer to AASB 1053 Application of Tiers of Australian Accounting Standards), the reduced disclosure requirements included in AASB 2012-1 will not affect the financial reporting for Victorian whole of government and GG sector.
AASB Interpretation 20 Stripping Costs in the Production Phase of a Surface Mine
This Interpretation clarifies when production stripping costs should lead to the recognition of an asset and how that asset should be initially and subsequently measured.
1 Jan 2013 No significant impact is expected on entity reporting.
Note 2: Revenue
Parent Consolidated
HSA2012
$'000
HSA2011
$'000
H&CI2012
$'000
H&CI2011
$'000
Total2012
$'000
Total2011
$'000
HSA2012
$'000
HSA2011
$'000
H&CI2012
$'000
H&CI2011
$'000
Total2012
$'000
Total2011
$'000
Revenue from Operating ActivitiesGovernment Grants - Department of Human Services 5,846 7,531 - - 5,846 7,531 5,846 7,531 - - 5,846 7,531 - Department of Health 333,777 304,907 - - 333,777 304,907 333,777 304,907 211 - 333,988 304,907 - Commonwealth Government 4,521 2,679 1,952 3,326 6,473 6,005 4,521 2,679 1,952 3,326 6,473 6,005Total Government Grants 344,144 315,117 1,952 3,326 346,096 318,443 344,144 315,117 2,163 3,326 346,307 318,443
Indirect Contributions by Department of Health - Insurance 440 4,613 - - 440 4,613 440 4,613 - - 440 4,613 - Facility management, lifecycle and other
charges under PPP arrangement 7,334 - - - 7,334 - 7,334 - - - 7,334 -
- Long Service Leave 2,672 2,026 - - 2,672 2,026 2,672 2,026 - - 2,672 2,026Total Indirect Contributions by Department of Health
10,446 6,639 - - 10,446 6,639 10,446 6,639 - - 10,446 6,639
Patient Fees - Patient Fees (refer Note 2b) 12,500 10,744 1,519 1,057 14,019 11,801 12,500 10,744 1,519 1,057 14,019 11,801Total Patient Fees 12,500 10,744 1,519 1,057 14,019 11,801 12,500 10,744 1,519 1,057 14,019 11,801
Commercial Activities and Specific Purpose Funds - Private Practice and other patient activity - - 13,127 18,595 13,127 18,595 - - 13,127 18,595 13,127 18,595 - Commercial Laboratory Medicine - - 137 199 137 199 - - 137 199 137 199 - Child Health and Information - - 201 214 201 214 - - 201 214 201 214 - Community Child Care - - 1,506 1,216 1,506 1,216 - - 1,506 1,216 1,506 1,216 - Educational Resource Centre - - 649 748 649 748 - - 649 748 649 748 - Property Income - - 819 240 819 240 - - 1,105 530 1,105 530 - Car Park Fees - - 5,214 4,070 5,214 4,070 - - 5,214 4,070 5,214 4,070 - Other - - 2,568 2,986 2,568 2,986 - - 5,826 6,445 5,826 6,445Total Business Units and Specific Purpose Funds - - 24,221 28,268 24,221 28,268 - - 27,765 32,017 27,765 32,017
Research and Program Grants 764 489 - - 764 489 764 489 - - 764 489Recoupment from Private Practice for Use of Hospital Facilities
12,516 6,987 - - 12,516 6,987 12,516 6,987 - - 12,516 6,987
Corporate Services 1,301 1,316 5 - 1,306 1,316 1,301 1,316 5 - 1,306 1,316Pathology 7,681 6,964 - - 7,681 6,964 7,681 6,964 - - 7,681 6,964Donations and Bequests - - 15,250 14,159 15,250 14,159 - - 25,345 22,407 25,345 22,407Other Revenue from Operating Activities 10,794 10,637 - - 10,794 10,637 10,794 10,637 - 113 10,794 10,750Sub-Total Revenue from Operating Activities 400,146 358,893 42,947 46,810 443,093 405,703 400,146 358,893 56,797 58,920 456,943 417,813
Revenue from Non-Operating ActivitiesInterest and Dividends - - 2,018 1,900 2,018 1,900 - - 6,512 8,414 6,512 8,414Market Movement in Investments - - - - - - - - (56) (247) (56) (247)Sub-Total Revenue from Non-Operating Activities - - 2,018 1,900 2,018 1,900 - - 6,456 8,167 6,456 8,167
Revenue from Capital Purpose IncomeState Government Capital Grants - Targeted Capital Works and Equipment - - - 1,296 - 1,296 - - - 1,296 - 1,296 - Department of Health -Indirect Contribution
on repayment of finance lease liabilities and PPP modifications costs - - 14,315 - 14,315 - - - 14,315 - 14,315 -
- Other - - 296 411 296 411 - - 296 411 296 411Assets Received Free of Charge (refer Note 2d) - - 28,647 3 28,647 3 - - 28,650 4 28,650 4Net Gain/(Loss) on Disposal of Non-Financial Assets (refer Note 2c)
- - (20,212) (18) (20,212) (18) - - (20,212) (30) (20,212) (30)
Donations and Bequests - - 12,145 5,833 12,145 5,833 - - 420 3,529 420 3,529Other Capital Purpose Income - - 2,431 416 2,431 416 - - 2,431 416 2,431 416Sub-Total Revenue from Capital Purpose Income - - 37,622 7,941 37,622 7,941 - - 25,900 5,626 25,900 5,626
Available for sale Revaluation Surplus gain recognized (refer Note 15a)
- - (59) 205 (59) 205 - - (59) 205 (59) 205
Total Revenue (refer to Note 2a) 400,146 358,893 82,528 56,856 482,674 415,749 400,146 358,893 89,094 72,918 489,240 431,811
Indirect contributions by Department of Health: Department of Health makes certain payments on behalf of The Royal Children’s Hospital. These amounts have been brought to account in determining the operating result for the year by recording them as revenue and expenses.
This note relates to revenues above the net result line only, and does not reconcile to comprehensive income.
notes to and forming part of the financial statements notes to and forming part of the financial statements
| Annual Report 2011 – 12 The Royal Children’s Hospital and Controlled Entities44 45 Annual Report 2011 – 12 The Royal Children’s Hospital and Controlled Entities |

Note 2a: Analysis of Revenue by Source
(based on the consolidated view of Note 2)
Admitted Patients
2012
Outpatients2012
EDS2012
Ambulatory2012
Mental Health
2012
Primary Health
2012
Other2012
Total2012
$'000 $'000 $'000 $'000 $'000 $'000 $'000 $'000Revenue from Services Supported by Health Services AgreementGovernment Grants 265,353 31,185 12,679 5,154 14,106 4,403 6,743 339,623Commonwealth Government 3,195 799 - - 50 - 477 4,521Indirect contributions by Department of Health 3,024 88 - - - - 7,334 10,446Patient Fees (refer Note 2b) 12,399 93 - - - - 8 12,500Research and Program Grants 104 21 - - 61 480 98 764Recoupment from Private Practice for Use of Hospital Facilities
10,024 2,492 - - - - - 12,516
Corporate Services 1,041 260 - - - - - 1,301Pathology 6,145 1,536 - - - - - 7,681Other 7,080 1,361 40 923 292 195 903 10,794Sub-Total Revenue from Services Supported by Health Services Agreement
308,365 37,835 12,719 6,077 14,509 5,078 15,563 400,146
Revenue from Services Supported by Hospital and Community InitiativesCommonwealth Government Grants - - - - - - 2,163 2,163Patient Fees - - - - - - 1,519 1,519Business Units and Specific Purpose Funds - - - - - - 27,765 27,765Donations and Bequests (non capital) - - - - - - 25,345 25,345Revenue from Non-Operating Activities - - - - - - 6,456 6,456Capital Purpose Income (refer Note 2) - - - - - - 25,900 25,900Corporate Services - - - - - - 5 5Other - - - - - - (59) (59)Sub-Total Revenue from Services Supported by Hospital and Community Initiatives - - - - - - 89,094 89,094Total Revenue 308,365 37,835 12,719 6,077 14,509 5,078 104,657 489,240
Admitted Patients
2011
Outpatients2011
EDS2011
Ambulatory2011
Mental Health
2011
Primary Health
2011
Other2011
Total2011
$'000 $'000 $'000 $'000 $'000 $'000 $'000 $'000Revenue from Services Supported by Health Services AgreementGovernment Grants 237,481 30,468 11,813 4,747 13,095 4,520 10,314 312,438Commonwealth Government 1,623 406 - - 50 217 383 2,679Indirect contributions by Department of Health 5,716 923 - - - - - 6,639Patient Fees (refer Note 2b) 10,647 96 - 1 - - - 10,744Research and Program Grants 154 31 - - 35 220 49 489Recoupment from Private Practice for Use of Hospital Facilities
5,601 1,386 - - - 80 (80) 6,987
Corporate Services 1,053 263 - - - - - 1,316Pathology 5,571 1,393 - - - - - 6,964Other 7,059 1,322 55 913 334 192 762 10,637Sub-Total Revenue from Services Supported by Health Services Agreement
274,905 36,288 11,868 5,661 13,514 5,229 11,428 358,893
Revenue from Services Supported by Hospital and Community InitiativesCommonwealth Government Grant - - - - - - 3,326 3,326Patient Fees - - - - - - 1,057 1,057Business Units and Specific Purpose Funds - - - - - - 32,017 32,017Donations and Bequests (non capital) - - - - - - 22,407 22,407Revenue from Non-Operating Activities - - - - - - 8,167 8,167Capital Purpose Income (refer Note 2) - - - - - - 5,626 5,626Other - - - - - - 318 318Sub-Total Revenue from Services Supported by Hospital and Community Initiatives - - - - - - 72,918 72,918Total Revenue 274,905 36,288 11,868 5,661 13,514 5,229 84,346 431,811
Indirect contributions by Department of Health:Department of Health makes certain payments on behalf of The Royal Children’s Hospital. These amounts have been brought to account in determining the operating result for the year by recording them as revenue and expenses.
Note 2b: Patient fees
Note 2c: Net Gain/(Loss) on Disposal of Non-Financial Assets
Note 2d: Assets Received Free of Charge or For Nominal Consideration
Parent Entity2012
Parent Entity2011
Consolidated2012
Consolidated2011
$'000 $'000 $'000 $'000
Patient Fees Raised
Recurrent:
Acute
– Inpatients 12,070 10,279 12,070 10,279
– Outpatients 1,368 707 1,368 707
– Other 581 815 581 815
Total Recurrent 14,019 11,801 14,019 11,801
Parent Entity2012
Parent Entity2011
Consolidated2012
Consolidated2011
$'000 $'000 $'000 $'000
Proceeds from Disposal of Non-Current Assets
Plant and Equipment (Footnote 1) 391 5 391 5
Motor Vehicles 1 - 1 3
Total Proceeds from Disposal of Non-Current Assets 392 5 392 8
Less: Written Down Value of Non-Current Assets
Furniture and Fittings 502 - 502 -
Plant and Equipment 241 20 241 20
Medical Equipment 817 - 817 15
Cultural Assets 124 - 124 -
Software 38 - 38 -
Buildings (Footnote 2) 18,597 - 18,597 -
Computers and Communications 284 3 284 3
Total Written Down Value of Non-Current Assets Sold 20,603 23 20,603 38
Net Gain/(Loss) on Disposal of Non-Current Assets (20,210) (18) (20,210) (30)
Footnote 1: Proceeds from auction for plant and equipment of the old hospital.
Footnote 2: Carrying amount of Front Entry Building written off.
Parent Entity2012
Parent Entity2011
Consolidated2012
Consolidated2011
$'000 $'000 $'000 $'000
During the reporting period, the fair value of assets received free of charge, was as follows:
Land (Footnote 3) 28,530 - 28,533 -
Cultural assets (Footnote 4) 25 - 25 -
Medical Equipment (Footnote 5) 92 3 92 4
TOTAL 28,647 3 28,650 4
Footnote 3: As of 30 June 2012, The Department of Health has provided land free of charge for the new Royal Children’s Hospital site. The land is recognised at fair value of $28.5 million. The existing parcel of land was split into two portions; one portion is to be returned to parkland upon the completion of stage 2 and the other portion to be developed as a commercial precinct. The proposed parkland was assessed at a lower value than previously recorded, which results in the write down value on the existing land. By the completion of stage 2, the total hectare of land occupied by The Royal Children’s Hospital should not exceed 4.1 hectares.
Footnote 4: 34 Donated cultural assets.
Footnote 5: An anaesthetic work station was donated to The Royal Children’s Hospital during the financial year ended 30 June 2012.
notes to and forming part of the financial statements notes to and forming part of the financial statements
| Annual Report 2011 – 12 The Royal Children’s Hospital and Controlled Entities46 47 Annual Report 2011 – 12 The Royal Children’s Hospital and Controlled Entities |

Note 3: Expenses
Parent Consolidated
HSA2012
$'000
HSA2011
$'000
H&CI2012
$'000
H&CI2011
$'000
Total2012
$'000
Total2011
$'000
HSA2012
$'000
HSA2011
$'000
H&CI2012
$'000
H&CI2011
$'000
Total2012
$'000
Total2011
$'000
Employee Expenses
Salaries and Wages 263,644 241,002 16,140 14,025 279,784 255,027 263,644 241,002 20,025 17,278 283,669 258,280
WorkCover Premium 2,147 1,228 367 409 2,514 1,637 2,147 1,228 429 468 2,576 1,696
Departure Packages 1,071 552 14 7 1,085 559 1,071 552 15 10 1,086 562
Long Service Leave 9,283 8,083 455 210 9,738 8,293 9,283 8,083 554 264 9,837 8,347
Superannuation 23,374 21,771 1,389 1,265 24,763 23,036 23,374 21,771 1,678 1,528 25,052 23,299
Total Employee Expenses 299,519 272,636 18,365 15,916 317,884 288,552 299,519 272,636 22,701 19,548 322,220 292,184
Non Salary Labour Costs
Fees for Visiting Medical Officers 2,193 1,895 936 912 3,129 2,807 2,193 1,895 936 912 3,129 2,807
Agency Costs – Nursing 2,398 2,896 - - 2,398 2,896 2,398 2,896 - - 2,398 2,896
Agency Costs – Other 13,603 12,047 1,982 3,159 15,585 15,206 13,603 12,047 2,131 3,421 15,734 15,468
Contractors and Consultants 4,670 4,240 1,701 2,778 6,371 7,018 4,670 4,240 1,956 3,124 6,626 7,364
Total Non Salary Labour Costs 22,864 21,078 4,619 6,849 27,483 27,927 22,864 21,078 5,023 7,457 27,887 28,535
Supplies and Consumables
Drug Supplies 18,208 15,716 180 213 18,388 15,929 18,208 15,716 180 213 18,388 15,929
S100 Drugs 394 2,123 - - 394 2,123 394 2,123 - - 394 2,123
Medical, Surgical Supplies and Prosthesis 22,695 22,921 34 77 22,729 22,998 22,695 22,921 38 76 22,733 22,997
Pathology Supplies 6,759 6,238 (3) 86 6,756 6,324 6,759 6,238 (3) 86 6,756 6,324
Food Supplies 1,986 1,986 7 4 1,993 1,990 1,986 1,986 22 15 2,008 2,001
Total Supplies and Consumables 50,042 48,984 218 380 50,260 49,364 50,042 48,984 237 390 50,279 49,374
Other Expenses
Domestic Services and Supplies 3,020 2,678 44 47 3,064 2,725 3,020 2,678 47 55 3,067 2,733
Fuel, Light, Power and Water 3,367 3,067 14 24 3,381 3,091 3,367 3,067 22 32 3,389 3,099
Insurance costs funded by DH 3,908 4,613 - - 3,908 4,613 3,908 4,613 - - 3,908 4,613
Motor Vehicle Expenses 344 251 (43) (74) 301 177 344 251 (1) (24) 343 227
Repairs and Maintenance 2,608 2,641 310 318 2,918 2,959 2,608 2,641 365 404 2,973 3,045
Maintenance Contracts 5,037 5,805 84 142 5,121 5,947 5,037 5,805 91 163 5,128 5,968
Patient Transport 385 309 241 - 626 309 385 309 241 - 626 309
Bad and Doubtful Debts 925 151 - - 925 151 925 151 - - 925 151
Lease Expenses 636 480 225 162 861 642 636 480 297 247 933 727
Advertising Expenses 98 275 24 9 122 284 98 275 50 10 148 285
Postage and Telephone 1,413 1,206 86 76 1,499 1,282 1,413 1,206 157 162 1,570 1,368
Stationery 1,179 1,665 284 349 1,463 2,014 1,179 1,665 404 455 1,583 2,120
Facility management, lifecycle and other charges under PPP arrangement
7,333 - - - 7,333 - 7,333 - - - 7,333 -
Other Administrative Expenses 8,823 8,204 8,708 8,745 17,531 16,948 8,823 8,204 12,073 12,657 20,897 20,861
Audit Fees
- VAGO – Audit of Financial Statements 137 128 - - 137 128 137 128 65 58 202 186
- KPMG Internal Audit Fees 292 396 - - 292 396 292 396 - - 292 396
Total Other Expenses from Continuing Operations 39,505 31,869 9,977 9,798 49,483 41,666 39,505 31,869 13,811 14,219 53,317 46,088
Expenditure using Capital Purpose Income
Other Expenses - - 436 1,112 436 1,112 - - 436 1,112 436 1,112
Special Function Costs - - 46 - 46 - - - 46 - 46 -
Finance lease interest expense - - 22,940 - 22,940 - - - 22,940 - 22,940 -
Total Expenditure using Capital Purpose Income
- - 23,422 1,112 23,422 1,112 - - 23,422 1,112 23,422 1,112
Depreciation and Amortisation (refer to Note 4) - - 18,933 24,595 18,933 24,595 - - 19,131 24,782 19,131 24,782
Total - - 18,933 24,595 18,933 24,595 - - 19,131 24,782 19,131 24,782
Total Expenses 411,930 374,567 75,534 58,650 487,465 433,216 411,930 374,567 84,325 67,508 496,256 442,075
Note 3a: Analysis of Expenses by Source
(based on the consolidated view of Note 3)
Consolidated
Admitted Patients
2012
Outpatients2012
EDS2012
Ambulatory2012
Mental Health
2012
Primary Health
2012
Other2012
Total2012
$'000 $'000 $'000 $'000 $'000 $'000 $'000 $'000
Services Supported by Health Services Agreement
Employee Expenses 221,694 26,772 15,344 7,155 11,125 8,556 8,873 299,519
Non Salary Labour Costs 13,374 2,518 471 4,002 734 274 1,491 22,864
Supplies and Consumables 40,035 5,833 916 864 133 9 2,252 50,042
Other Expenses from Continuing Operations 29,353 5,566 351 411 1,074 1,741 1,009 39,505
Sub-Total Expenses from Services Supported by Health Services Agreement 304,456 40,689 17,082 12,432 13,066 10,580 13,625 411,930
Services Supported by Hospital and Community Initiatives
Employee Benefits - - - - - - 22,701 22,701
Non Salary Labour Costs - - - - - - 5,024 5,024
Supplies and Consumables - - - - - - 237 237
Other Expenses from Continuing Operations - - - - - - 13,811 13,811
Sub-Total Expense from Services Supported by Hospital and Community Initiatives - - - - - - 41,773 41,773
Total Expenses from Ordinary Activities before Depreciation and Specific Items 304,456 40,689 17,082 12,432 13,066 10,580 55,398 453,703
Expenditure using Capital Purpose Income
Other expenses - - - - - - 436 436
Special Function Costs - - - - - - 46 46
PPP Interest Expense - - - - - - 22,940 22,940
Depreciation and Amortisation (refer Note 4) - - - - - - 19,131 19,131
Total Expenses 304,456 40,689 17,082 12,432 13,066 10,580 97,951 496,256
Consolidated
Admitted Patients
2011
Outpatients2011
EDS2011
Ambulatory2011
Mental Health
2011
Primary Health
2011
Other2011
Total2011
$'000 $'000 $'000 $'000 $'000 $'000 $'000 $'000
Services Supported by Health Services Agreement
Employee Expenses 205,438 22,099 13,939 6,646 10,999 8,033 5,482 272,636
Non Salary Labour Costs 11,701 2,024 376 4,608 727 270 1,372 21,078
Supplies and Consumables 38,501 5,603 630 573 85 23 3,570 48,984
Other Expenses from Continuing Operations 28,558 1,783 141 117 286 244 739 31,869
Sub-Total Expenses from Services Supported by Health Services Agreement 284,198 31,509 15,086 11,944 12,097 8,570 11,163 374,567
Services Supported by Hospital and Community Initiatives
Employee Benefits - - - - - - 19,548 19,548
Non Salary Labour Costs - - - - - - 7,457 7,457
Supplies and Consumables - - - - - - 390 390
Other Expenses from Continuing Operations - - - - - - 14,219 14,219
Sub-Total Expense from Services Supported by Hospital and Community Initiatives - - - - - - 41,614 41,614
Total Expenses from Ordinary Activities before Depreciation and Specific Items 284,198 31,509 15,086 11,944 12,097 8,570 52,777 416,181
Expenditure using Capital Purpose Income - - - - - - 1,112 1,112
Impairment of Non-Current Assets - - - - - - - -
Depreciation and Amortisation (refer Note 4) - - - - - - 24,782 24,782
Total Expenses 284,198 31,509 15,086 11,944 12,097 8,570 78,671 442,075
notes to and forming part of the financial statements notes to and forming part of the financial statements
| Annual Report 2011 – 12 The Royal Children’s Hospital and Controlled Entities48 49 Annual Report 2011 – 12 The Royal Children’s Hospital and Controlled Entities |

Note 3b: Analysis of Expenses by Internal and Restricted Specific Purpose Funds for Services Supported by Hospital and Community Initiatives
Note 4: Depreciation and Amortisation
Parent Entity2012
Parent Entity2011
Consolidated2012
Consolidated2011
$'000 $'000 $'000 $'000
Private Practice Activities 11,487 11,247 11,487 11,247
Car Park 113 331 113 331
Property 49 89 49 89
Child Health and Information Centre 191 206 191 206
Community Child Care 1,370 1,034 1,370 1,034
Educational Resource Centre 511 672 511 672
Safety Centre 4 31 4 31
Research 5,121 4,940 5,121 4,940
Departmental and General Purpose Funds 14,333 14,393 22,926 23,064
TOTAL 33,179 32,943 41,772 41,614
Parent Entity2012
Parent Entity2011
Consolidated2012
Consolidated2011
$'000 $'000 $'000 $'000
Depreciation
Buildings 10,051 15,927 10,115 15,987
Plant and Equipment 71 71 72 72
Medical Equipment 5,751 5,662 5,751 5,662
Computers and Communication 1,136 955 1,193 1,005
Furniture and Equipment 170 259 173 261
Motor Vehicles 27 24 36 35
Total Depreciation 17,206 22,898 17,340 23,022
Amortisation
Intangible Assets 1,727 1,697 1,791 1,759
Total Amortisation 1,727 1,697 1,791 1,759
Total Depreciation and Amortisation 18,933 24,595 19,131 24,782
Note 5: Cash and Cash Equivalents
Note 6: Receivables
For the purposes of the Cash Flow Statement, cash assets includes cash on hand and in banks, investments in money market instruments, and short-term deposits which are readily convertible to cash on hand, and are subject to an insignificant risk of change in value, net of outstanding bank overdrafts.
Parent Entity2012
Parent Entity2011
Consolidated2012
Consolidated2011
$'000 $'000 $'000 $'000
Cash on Hand 13 38 13 38
Cash at Bank 5,243 4,549 7,195 5,378
Deposits at Call 9,798 8,932 22,996 9,132
Fixed Deposits 15,000 2,634 20,812 23,275
TOTAL 30,054 16,153 51,016 37,823
Represented by:
Cash for Health Service Operations (as per Cash Flow Statement) 28,669 14,609 49,631 36,280
Cash for Monies Held in Trust
- Cash at Bank 1,385 1,543 1,385 1,543
Total Cash and Cash Equivalents 30,054 16,153 51,016 37,823
Parent Entity2012
Parent Entity2011
Consolidated2012
Consolidated2011
$'000 $'000 $'000 $'000
CURRENT
Contractual
Controlled Entity Debtors 2,282 2,410 - -
Inter Hospital Debtors 2,439 1,591 2,439 1,591
Trade Debtors 2,660 2,923 2,771 3,007
Patient Fees 3,692 3,929 3,692 3,929
Accrued Investment Income 198 115 836 547
Diagnostic Debtors 1,539 1,534 1,539 1,534
Sundry Debtors 828 531 828 1,140
AEDI Commonwealth Grant 1,459 3,394 - -
Less Allowance for Doubtful Debts
Trade Debtors 863 323 863 324
Patient Fees 285 122 285 122
Sundry Debtors 274 129 274 129
Diagnostic Debtors 321 253 321 253
13,353 15,601 10,362 10,920
Statutory
GST Receivable 484 758 667 758
Accrued Revenue – Department of Health 169 - 169 -
TOTAL CURRENT RECEIVABLES 14,006 16,359 11,198 11,678
NON-CURRENT
Statutory
Long Service Leave – Department of Health 10,299 7,627 10,299 7,627
TOTAL NON-CURRENT RECEIVABLES 10,299 7,627 10,299 7,627
TOTAL RECEIVABLES 24,305 23,986 21,497 19,305
(a) Movement in Allowance for Doubtful Contractual Receivables
Balance at beginning of year 827 690 828 690
Amounts written off during the year (6) (49) (6) (49)
Increase/(decrease) in allowance recognised in profit or loss 922 186 921 187
Balance at end of year 1,743 827 1,743 828
(b) Ageing analysis of receivablesPlease refer to Note 18b for the ageing analysis of contractual financial assets
(c) Nature and extent of risk arising from receivablesPlease refer to Note 18b for the nature and extent of credit risk arising from contractual financial assets
notes to and forming part of the financial statements notes to and forming part of the financial statements
| Annual Report 2011 – 12 The Royal Children’s Hospital and Controlled Entities50 51 Annual Report 2011 – 12 The Royal Children’s Hospital and Controlled Entities |

Note 7: Other Financial Assets
Note 8: Inventories
Parent Entity2012
Parent Entity2011
Consolidated2012
Consolidated2011
$'000 $'000 $'000 $'000
CURRENT
Managed Funds - - 47,452 51,247
Term Deposit - - 900 900
Total Current - - 48,352 52,147
NON-CURRENT
Managed Funds 17,702 18,225 62,225 65,705
Total Non-Current 17,702 18,225 62,225 65,705
TOTAL 17,702 18,225 110,577 117,852
Represented by:
Restricted Specific Purpose Reserves (refer to Note 15) 17,702 18,225 110,577 117,852
TOTAL 17,702 18,225 110,577 117,852
Parent Entity2012
Parent Entity2011
Consolidated2012
Consolidated2011
$'000 $'000 $'000 $'000
Pharmaceuticals – at cost 1,648 1,452 1,648 1,451
Gift Shop – at cost 12 18 12 18
TOTAL 1,660 1,469 1,660 1,469
Note 9: Property, Plant and Equipment
Parent Entity2012
Parent Entity2011
Consolidated2012
Consolidated2011
$'000 $'000 $'000 $'000
Land
Land at Fair Value
Crown 75,944 62,188 75,944 62,188
Freehold 11,529 11,529 13,817 13,818
Total Land (Footnote 9) 87,473 73,717 89,761 76,006
Buildings
Buildings at Cost 908 309 1,147 309
Less Accumulated Depreciation 208 162 447 162
700 147 700 147
Buildings at Fair Value 60,559 89,724 61,616 90,524
Less Accumulated Depreciation 36,755 37,318 36,830 37,358
23,804 52,406 24,786 53,166
Leasehold Improvements at cost - - - 346
Less Accumulated Depreciation - - - 211
- - - 135
Total Buildings (Footnote 7) 24,504 52,553 25,486 53,449
Plant and Equipment
Plant and Equipment at fair value 849 2,650 884 2,677
Less Accumulated Depreciation 365 1,906 380 1,920
Total Plant and Equipment (Footnote 8) 484 744 504 757
Medical Equipment
Medical Equipment at fair value 58,882 69,154 58,882 69,154
Less Accumulated Depreciation 28,386 45,179 28,386 45,179
Total Medical Equipment (Footnote 8) 30,496 23,975 30,496 23,975
Computers and Communication
Computers and Communication at fair value 5,510 19,895 6,174 20,407
Less Accumulated Depreciation 3,686 17,849 4,154 18,259
Total Computers and Communications (Footnote 8) 1,824 2,046 2,020 2,148
Furniture and Fittings
Furniture and Fittings at fair value 1,290 3,350 1,335 3,395
Less Accumulated Depreciation 514 1,958 535 1,977
Total Furniture and Fittings (Footnote 8) 776 1,392 800 1,418
Motor Vehicles
Motor Vehicles at fair value 332 326 421 415
Less Accumulated Depreciation 152 153 179 172
Total Motor Vehicles (Footnote 8) 180 173 242 243
Cultural Assets
Cultural Assets At Cost 244 244 244 244
244 244 244 244
Cultural Assets At Fair Value 277 376 277 376
Total Cultural Assets (Footnote 8) 521 620 521 620
Public Private Partnership (PPP) Assets
Leased Buildings 804,020 - 804,020 -
Leased Equipment 92,787 - 92,787 -
Leased Fittings 3,703 - 3,703 -
Leased Assets 900,510 - 900,510 -
Improvement on Leased Buildings and Equipment 8,050 - 8,050 -
Total PPP Assets (Footnote 6) 908,560 - 908,560 -
TOTAL 1,054,818 155,220 1,058,390 158,616
notes to and forming part of the financial statements notes to and forming part of the financial statements
| Annual Report 2011 – 12 The Royal Children’s Hospital and Controlled Entities52 53 Annual Report 2011 – 12 The Royal Children’s Hospital and Controlled Entities |

Note 9: Property, Plant and Equipment (continued)Reconciliations of the carrying amounts of each class of asset for the consolidated entity at the beginning and end of the previous and current financial year are set out below.(Note: Intangible Assets are not included in this schedule. Refer Note 10)
Consolidated
Land Buildings Plant and Equipment
Medical Equipment
Computers and Communications
Furniture and
Fittings
Motor Vehicles
Cultural Assets
PPPAssets
Total
$'000 $'000 $'000 $'000 $'000 $'000 $'000 $'000 $’000 $’000
Balance at 1 July 2010 76,006 69,318 584 21,224 1,625 1,665 232 620 - 171,274
Additions - 118 245 8,431 1,533 15 60 - - 10,402
Disposals - - - (20) (3) - (14) - - (37)
Net transfers between classes - - - 2 (2) - - - - -
Depreciation and Amortisation (Note 4)
- (15,987) (72) (5,662) (1,006) (261) (35) - - (23,023)
Balance at 1 July 2011 76,006 53,449 757 23,975 2,148 1,418 243 620 - 158,616
Additions 28,530 749 61 13,648 1,079 57 35 25 908,560 952,744
Disposals - (18,597) (241) (817) (284) (502) - (124) - (20,565)
Net transfers between classes - - - (560) 270 - - - - (290)
Revaluation Increments/(Decrements)
(14,775) - - - - - - - - (14,775)
Depreciation and Amortisation (Note 4)
- (10,115) (72) (5,751) (1,193) (173) (36) - - (17,340)
Balance at 30 June 2012 89,761 25,486 504 30,496 2,020 800 242 521 908,560 1,058,390
Footnote 6: The RCH on behalf of the State of Victoria has recorded the Public Private Partnership (PPP) assets and any other improvement to the PPP assets for the value of $908 million. The PPP Assets (except 3B Equipment) are maintained and replaced by the Children’s Health Partnership Pty Ltd.
Under the Public Private Partnership (PPP) arrangement, the Front Entry Building is currently being refurbished with project costs incurred by the Children’s Health Partnership Pty Ltd. As of 30 June 2012, the Front Entry Building has been fully depreciated.
Footnote 7: RCH maintains the ownership of the Research Precinct Building, while the refurbishment is underway with an expected completion date of December 2014. The revaluation of the building will be performed once refurbishment is completed.
Footnote 8: As part of the move to the new facility, RCH disposed of certain assets that were not able to be transferred/used in the new facility, with carrying amount totalling $1.9 million (Refer Note 2c).
Footnote 9: As of 30 June 2012, The Department of Health has provided land free of charge for the new Royal Children’s Hospital site. The land is recognised at fair value of $28.5 million. The existing parcel of land was split into two portions; one portion is to be returned to Parkland upon the completion of stage 2 and the other portion to be developed as commercial precinct. The proposed Parkland was assessed at a lower value than previously recorded, which results in the write down value on the existing land. By the completion of stage 2 , the total hectare of land occupied by The Royal Children’s Hospital should not exceed 4.1 hectares.
An annual assessment of the fair value of land and buildings was conducted by Management as at 30 June 2012. Management obtained from Department of Health the approved Valuer-General Victoria indices for 2012 and applied these to the carrying values of individual assets per the 2009 valuation. The indexed carrying value was then compared to the carrying values at June 2012 to determine the change in fair value. As this change in fair value is immaterial, there is no requirement to adjust the carrying value of land and building as at 30 June 2012.
Note 10: Intangible Assets
Parent Entity2012
Parent Entity2011
Consolidated2012
Consolidated2011
$'000 $'000 $'000 $'000
Software 10,965 9,087 11,330 9,347
Less Accumulated Amortisation 8,045 6,868 8,263 7,023
Total Written Down Value 2,920 2,219 3,067 2,324
Reconciliation of the carrying amounts of intangible assets at the beginning and end of the previous and current financial year:
Software Total$'000 $'000
Consolidated
Balance at 1 July 2010 1,830 1,830
Additions 2,253 2,253
Amortisation (Note 4) (1,759) (1,759)
Balance at 1 July 2011 2,324 2,324
Additions 2,280 2,280
Disposals (38) (38)
Net transfer from Property, Plant and Equipment 292 292
Amortisation (Note 4) (1,791) (1,791)
Balance at 30 June 2012 3,067 3,067
Note 11: Investment Properties
Note 12: Payables
Parent Entity2012
Parent Entity2011
Consolidated2012
Consolidated2011
$'000 $'000 $'000 $'000
Balance at Beginning of Year 3,531 3,531 3,531 3,531
Net Gain from Fair Value Adjustments - - - -
Balance at End of Year 3,531 3,531 3,531 3,531
Parent Entity2012
Parent Entity2011
Consolidated2012
Consolidated2011
$'000 $'000 $'000 $'000
CURRENT
Contractual
Trade Creditors 9,620 13,315 9,493 13,315
Accrued Expenses 6,471 3,900 7,836 5,173
Deposits 35 36 35 36
Sundry Creditors 1,389 1,274 2,306 1,576
17,515 18,525 19,670 20,100
Statutory
Superannuation and WorkCover 2,863 2,532 2,863 2,532
Department of Health 4,559 3,647 4,559 3,647
7,422 6,179 7,422 6,179
TOTAL CURRENT 24,937 24,704 27,092 26,279
(a) Maturity analysis of payablesPlease refer to Note 18c for the ageing analysis of contractual payables
(b) Nature and extent of risk arising from payablesPlease refer to Note 18c for the nature and extent of risk arising from contractual payables
notes to and forming part of the financial statements notes to and forming part of the financial statements
| Annual Report 2011 – 12 The Royal Children’s Hospital and Controlled Entities54 55 Annual Report 2011 – 12 The Royal Children’s Hospital and Controlled Entities |

Note 13: Employee Benefits and Related On-Cost Provisions
Parent Entity2012
Parent Entity2011
Consolidated2012
Consolidated2011
$'000 $'000 $'000 $'000
CURRENT PROVISIONS
Employee Benefits
- unconditional and expected to be settled within 12 months 38,333 27,326 38,893 27,745
- unconditional and expected to be settled after 12 months 38,916 31,680 38,982 31,738
77,249 59,006 77,875 59,483
Provisions related to employee benefit on-costs
- unconditional and expected to be settled within 12 months (nominal value) 2,406 1,981 2,455 2,020
- unconditional and expected to be settled after 12 months (present value) 4,164 3,390 4,171 3,396
6,570 5,371 6,626 5,416
TOTAL CURRENT PROVISIONS 83,819 64,377 84,501 64,899
NON-CURRENT PROVISIONS
Employee Benefits 8,967 10,775 9,083 10,867
Provisions related to employee benefit on-costs 959 1,153 977 1,163
TOTAL NON-CURRENT PROVISIONS 9,926 11,928 10,060 12,030
TOTAL PROVISIONS 93,745 76,305 94,561 76,929
(a) EMPLOYEE BENEFITS AND RELATED ON-COSTS (Footnotes 10 and 11)
CURRENT EMPLOYEE BENEFITS AND RELATED ON-COSTS
Unconditional long service leave entitlements 41,114 32,669 41,392 32,885
Annual leave entitlements 26,066 22,113 26,377 22,350
Accrued Wages and Salaries 15,845 8,813 15,922 8,865
Accrued Days Off 794 783 816 799
NON-CURRENT EMPLOYEE BENEFITS AND RELATED ON-COSTS
Conditional long service leave entitlements (present value) 9,926 11,928 10,054 12,030
TOTAL EMPLOYEE BENEFITS 93,745 76,305 94,561 76,929
(b) MOVEMENTS IN PROVISIONS
Movement in Long Service Leave:
Balance at start of year 44,597 39,193 44,915 39,562
Provision made during the year
- Revaluations Increments/(Decrements) 687 (50) 687 (50)
- Expense recognising Employee Service 8,999 8,355 9,122 8,406
Settlement made during the year (3,243) (2,901) (3,278) (3,003)
Balance at end of year 51,040 44,597 51,446 44,915
Footnote 10: In 2011-12, Newborn Emergency Transport Service (NETS) and Perinatal Emergency Referral Service (PERS) operations (including staff) were transferred from the Royal Women’s Hospital (RWH) to The Royal Children’s Hospital (RCH). The transfer has resulted in an increase in the RCH Employee Benefit provision.
Footnote 11:
(a) The new nursing Enterprise Bargaining Agreement (EBA) was certified by Fair Work Australia on the 29th of June 2012. The financial impact of this agreement has been provided in the 2011-12 RCH employee benefits.
(b) Health professional, Health and Allied Services, Manager and Administrative Officers EBA has gone through ballot process on the 21st of June, 2012. Full version of the agreement was circulated to all members and hence created a constructive obligation for future outflows to occur. The financial impact of this agreement has been provided in the 2011-12 RCH employee benefits.
Note 14: Other Liabilities
Parent Entity2012
Parent Entity2011
Consolidated2012
Consolidated2011
$'000 $'000 $'000 $'000
CURRENT
Monies Held in Trust*
- Patient Monies Held in Trust 235 223 235 223
- Employee Salary Packaging Monies Held in Trust 1,150 1,320 1,150 1,320
Income in Advance
- Rental 348 349 348 349
- AEDI Commonwealth Grant 1,459 3,394 1,459 3,394
- Other 1,733 45 1,733 90
Total Current 4,925 5,331 4,925 5,376
NON-CURRENT
Income in Advance
- Rental 4,099 4,448 4,099 4,448
Finance Lease Liabilities (Note 19) 917,233 - 917,233 -
Total Non-Current 921,332 4,448 921,332 4,448
Total Other Liabilities 926,257 9,779 926,257 9,824
*Total Monies Held in Trust
Represented by the following assets:
Cash Assets (Note 5) 1,385 1,543 1,385 1,543
TOTAL 1,385 1,543 1,385 1,543
notes to and forming part of the financial statements notes to and forming part of the financial statements
| Annual Report 2011 – 12 The Royal Children’s Hospital and Controlled Entities56 57 Annual Report 2011 – 12 The Royal Children’s Hospital and Controlled Entities |

Note 15: Equity
Parent Entity2012
Parent Entity2011
Consolidated2012
Consolidated2011
$'000 $'000 $'000 $'000
(a) Reserves
Property Plant and Equipment Revaluation Surplus (Footnote 12)
Balance at the beginning of the reporting Year 32,702 32,702 34,555 34,555
Revaluation Increment/(Decrement)
- Land (14,774) - (14,774) -
Balance at the end of the reporting Year 17,928 32,702 19,781 34,555
Represented by:
- Land 17,928 32,702 19,781 34,555
17,928 32,702 19,781 34,555
Financial Assets Available-for-Sale Revaluation Surplus (Footnote 13)
Balance at the beginning of the reporting Year 517 450 4,337 1,304
Valuation gain/(loss) recognised (411) 272 (4,285) 3,238
Cumulative (gain)/loss transferred to Comprehensive Operating Statement on Sale of Financial Assets 59 (205) 59 (205)
Balance at end of the reporting Year 165 517 111 4,337
General Purpose Surplus
Balance at the beginning of the reporting Year 14,206 9,557 14,206 9,557
Transfer (to)/from Accumulated Surpluses/(Deficits) 2,537 4,649 2,537 4,649
Balance at the end of the reporting Year 16,743 14,206 16,743 14,206
Restricted Specific Purpose Surplus
Balance at the beginning of the reporting Year 20,862 18,120 133,071 123,123
Transfer (to)/from Accumulated Surpluses/(Deficits) (2,969) 2,742 (5,195) 9,948
Balance at the end of the reporting Year 17,893 20,862 127,876 133,071
Total Reserves 52,729 68,287 164,511 186,169
(b) Contributed Capital
Balance at the beginning of the reporting Year 108,429 108,429 108,429 108,429
Balance at the end of the reporting Year 108,429 108,429 108,429 108,429
(c) Accumulated Surpluses/(Deficits)
Balance at the beginning of the reporting Year (66,180) (41,322) (66,180) (41,322)
Net Result for the Year (4,791) (17,467) (7,017) (10,261)
Transfer (to)/from Reserves 432 (7,391) 2,658 (14,597)
Balance at the end of the reporting Year (70,539) (66,180) (70,539) (66,180)
(d) Total Equity at end of financial year 90,619 110,536 202,401 228,418
Footnote 12: The Property, Plant and Equipment Revaluation Surplus balance is as a result of the revaluation of Property, Plant and Equipment undertaken in 2011-12.
Footnote 13: The Financial Assets Available-For-Sale Revaluation Surplus balance is as a result of the revaluation of Available-For-Sale Financial Assets undertaken in 2011-12. Where a revalued financial asset is sold, that portion of the reserve which relates to the financial asset, and is effectively realised, is recognised in the comprehensive operating statement. Where a revalued financial asset is impaired, that portion of the reserve which relates to that financial asset is recognised in the comprehensive operating statement.
Parent Entity2012
Parent Entity2011
Consolidated2012
Consolidated2011
(e) Restricted Specific Purpose Funds $'000 $'000 $'000 $'000
Private Practice 13,864 16,118 13,864 16,118
Major Equipment Replacement 1,272 2,181 1,272 2,181
Research and Trust Funds 634 576 634 576
Education and Training 219 265 219 265
Controlled Entity and Specific Purpose Funds 1,569 1,387 111,552 113,596
Funds Held in Perpetuity 335 335 335 335
Total Restricted Specific Purpose Funds 17,893 20,862 127,876 133,071
Represented by:
Other Financial Assets 17,702 18,225 110,577 117,852
Cash 191 2,637 17,299 15,219
Total Restricted Specific Purpose Funds 17,893 20,862 127,876 133,071
Note 16: Reconciliation of Net Result for the Year to Net Cash Inflow/(Outflow) from Operating Activities
Note 17: Non-Cash Financing and Investing Activities
Parent Entity2012
Parent Entity2011
Consolidated2012
Consolidated2011
$'000 $'000 $'000 $'000
Net Result for the Year (4,791) (17,467) (7,017) (10,261)
Depreciation and Amortisation 18,933 24,595 19,131 24,782
Facility management, lifecycle and other expenses under PPP arrangement (7,334) - (7,334) -
Department of Health – Indirect Contribution on repayment of finance lease liabilities (14,315) - (14,315) -
Facility management, lifecycle and other charges under PPP arrangement 7,333 - 7,333 -
PPP – Non-Cash Finance lease interest expense 22,940 - 22,940 -
PPP – Non-Cash Special Function Costs 46 - 46 -
Provision for Doubtful Receivables 916 138 915 138
Resources/Assets Received Free of Charge (28,647) (3) (28,650) (4)
Net (Gain)/Loss from Sale of Plant and Equipment 20,212 18 20,212 30
Income from Managed Funds Reinvested (886) (890) (2,512) (6,090)
Available-for-Sale Revaluation Surplus (Gain)/Loss recognised 59 (205) 59 (205)
Change in Operating Assets and Liabilities
Increase in Fair Value of Held for Trading Investments - - 56 246
Increase/(Decrease) in Payables (98) (4,882) 482 (4,377)
Increase in Employee Benefits 17,770 8,030 17,967 7,989
Increase/(Decrease) in Other Assets (238) 449 (238) 446
(Increase)/Decrease in Receivables (1,237) (966) (3,107) 8,025
(Decrease) in Other Liabilities (597) (3,031) (643) (3,046)
NET CASH INFLOW FROM OPERATING ACTIVITIES 30,066 5,786 25,325 17,672
Parent Entity2012
Parent Entity2011
Consolidated2012
Consolidated2011
$'000 $'000 $'000 $'000
Acquisition of Building, Plant and Equipment by means of PPP Finance lease (Note 9) 908,561 - 908,561 -
Total Non-Cash Financing and Investing Activities 908,561 - 908,561 -
notes to and forming part of the financial statements notes to and forming part of the financial statements
| Annual Report 2011 – 12 The Royal Children’s Hospital and Controlled Entities58 59 Annual Report 2011 – 12 The Royal Children’s Hospital and Controlled Entities |

Note 18: Financial Instruments
(a) Financial risk management objectives and policies
The Royal Children’s Hospital’s principal financial instruments comprise:- Cash Assets- Term Deposits- Receivables (excluding statutory receivables)- Investments in Equities and Managed Investment Schemes- Payables (excluding statutory receivables)
Details of the significant accounting policies and methods adopted, including the criteria for recognition, the basis of measurement and the basis on which income and expenses are recognised, with respect to each class of financial assets, financial liability and equity instrument are disclosed in Note 1 to the financial statements.
The main purpose in holding financial instruments is to manage prudentially Royal Children Hospital’s financial risks within the government policy parameters.
Categorisation of financial instruments
Consolidated Carrying Amount
2012
Consolidated Carrying Amount
2011$'000 $'000
Financial Assets
Cash and cash equivalents 51,016 37,823
Term Deposit 900 900
Available for Sale at fair value through equity 62,225 65,705
Held for Trading at fair value through profit and loss 47,452 51,247
Receivables 10,362 10,920
Total Financial Assets (Footnote 14) 171,955 166,595
Financial Liabilities
At amortised cost 938,288 21,643
Total Financial Liabilities (Footnote 15) 938,288 21,643
Footnote 14: The total amount of the financial assets disclosed here excludes statutory receivables (i.e. GST input tax credit recoverables and Department of Health receivables)
Footnote 15: The total amount of the financial liabilities disclosed includes PPP finance liabilities and excludes income in advance and statutory payables (i.e. Taxes payable and Department of Health payables)
Net holding gain/(loss) on financial instruments by category
Consolidated Net holding gain/
(loss)2012
Consolidated Net holding gain/
(loss)2011
$'000 $'000
Financial Assets
Cash and cash equivalents (Footnote 16) 6,512 8,414
Held for Trading at fair value through profit and loss (Footnote 17) (56) (247)
Available for Sale (Footnote 16) (59) 205
Receivables (924) (150)
Total Financial Assets 5,473 8,222
Financial Liabilities
Public Private Partnership (PPP) Finance lease liabilities (Footnote 18) 22,940 -
Total Financial Liabilities 22,940 -
Footnote 16: For cash and cash equivalents, receivables and available-for-sale financial assets, the net gain or loss is calculated by taking the interest revenue, plus or minus foreign exchange gains or losses arising from revaluation of the financial assets, and minus any impairment recognised in the net result.
Footnote 17: For financial assets and liabilities that are held-for-trading or designated at fair value through profit or loss, the net gain or loss is calculated by taking the movement in the fair value of the financial asset or liability.
Footnote 18: For financial liabilities measured at amortised cost, the net gain or loss is calculated by taking the interest expense, plus or minus foreign exchange gains or losses arising from the revaluation of financial liabilities measured at amortised cost.
The obligation of fulfilling the Public Private Partnership (PPP) interest payment over the PPP term rests with Department of Health.
Note 18: Financial Instruments (continued)
(b) Credit Risk
The Royal Children’s Hospital
Credit risk arises from the contractual financial assets of The Royal Children’s Hospital which comprises cash and deposits, non-statutory receivables and available for sale contractual financial assets. The Royal Children’s Hospital’s exposure to credit risk arises from the potential default of a counter party on their contractual obligations resulting in financial loss. Credit risk is measured at fair value and is monitored on a regular basis.
The Royal Children’s Hospital manages credit risk arising from receivables by undertaking transactions predominantly with other government bodies and patients covered by Medicare and highly rated insurers. The majority of the patients are located within Australia. Standard payment terms are 30 days for Department of Health, patient debtors and large corporate clients, controlled entity debtors, 14 days for Murdoch Childrens Research Institute and 7 days for all other debtors. Credit risk is also managed through debt collection procedures, including use of debt collection agency for debts outstanding for 90 days.
The Royal Children’s Hospital mainly obtains contractual financial assets that are on fixed interest, except for cash assets, which are mainly cash at bank.
For other investments, The Royal Children’s Hospital policy is to limit investment in securities to those with a Standard and Poor’s credit rating of at least A-1 and not to invest directly in any derivative instruments, short selling or margin products. RCH investments are currently managed by the Victorian Funds Management Corporation (VFMC). VFMC was established under state legislation in 1994. The Minister is the Hon Kim Wells, the Treasurer of Victoria. VFMC reports to the Minister through the Department of Treasury and Finance.
The Royal Children’s Hospital’s Foundation Trust Fund
The Royal Children’s Hospital’s Foundation Trust Fund is exposed to a low level of risk in its trade and other receivables.
The Royal Children’s Hospital’s Foundation Trust Fund manages its exposure to credit risk by only investing in accordance with the Investment policy approved by the Board, which is monitored by the Trustee’s Investment Committee. The Board permits investments in the following asset categories:
1. Unlisted units in Managed funds which are invested in:- Equities listed on recognised stock exchanges- High yield securities in the form of loans and hybrid securities- Listed fixed interest securities listed on the ASX as well as interest rate derivatives and stock derivatives- Global fixed interest securities- Property development loans, infrastructure debt structured financial instruments, asset and mortgage-backed securities.
2. Fixed interest securities which have a minimum rating level AA and actively traded liquid market
3. Cash securities which have a minimum rating level AA and actively traded liquid market
Given these investment guidelines, the Trust does not expect any counterparty to fail to meet its obligations.
Except as otherwise detailed in the following table, the carrying amount of contractual financial assets recorded in the financial statements, net of any allowances for losses, represents The Royal Children’s Hospital’s and its Controlled Entities’ maximum exposure to credit risk.
notes to and forming part of the financial statements notes to and forming part of the financial statements
| Annual Report 2011 – 12 The Royal Children’s Hospital and Controlled Entities60 61 Annual Report 2011 – 12 The Royal Children’s Hospital and Controlled Entities |

Note 18: Financial Instruments (continued)
Ageing Analysis of contractual financial assets as at 30 June
Consolidated Carrying Amount
Not Past Due and Not
Impaired
Past Due but Not Impaired Impaired Financial
AssetsLess than 1 month
1-3 Months 3 Months - 1 Year
2012 $'000 $'000 $'000 $'000 $'000 $'000Financial AssetsCash and Cash Equivalents 51,016 51,016 - - - -Receivables (Footnote 19) Inter Hospital Debtors 2,439 1,983 438 19 - - Trade Debtors 1,908 1,361 462 85 - - Patient Fees 3,407 2,414 926 67 - - Accrued investment income 836 836 - - - - Diagnostic Debtors 1,218 828 284 105 - - Sundry Debtors 555 555 - - - -Other Financial Assets Available for Sale - Managed Funds 62,225 62,225 - - - - Held for Trading - Managed Funds 47,452 47,452 - - - - Term Deposit 900 900 - - - -Total Financial Assets 171,955 169,569 2,110 276 - -
2011Financial AssetsCash and Cash Equivalents 37,823 37,823 - - - -Receivables (Footnote 19) Inter Hospital Debtors 1,591 1,346 184 62 - - Trade Debtors 2,684 2,357 255 53 19 - Patient Fees 3,807 3,122 587 98 - - Accrued investment income 547 547 - - - - Diagnostic Debtors 1,281 927 141 212 - - Sundry Debtors 1,011 1,011 - - - -Other Financial Assets Available for Sale – Managed Funds 65,705 65,705 - - - - Held for Trading – Managed Funds 51,247 51,247 - - - - Term Deposit 900 900 - - - -Total Financial Assets 166,596 164,983 1,167 426 19 -
Footnote 19: Ageing analysis of financial assets exclude statutory financial assets (i.e GST input tax credit and Department of Health receivable)
There are no material financial assets which are individually determined to be impaired. Currently The Royal Children’s Hospital does not hold any collateral as security nor credit enhancements relating to any of its financial assets. (2011: Nil)
There are no financial assets that have had their terms renegotiated so as to prevent them from being past due or impaired, and they are stated at the carrying amounts as indicated. The ageing analysis table above discloses the ageing only of contractual financial assets that are past due but not impaired.
Note 18: Financial Instruments (continued)
(c) Liquidity Risk
Liquidity risk is the risk that The Royal Children’s Hospital would be unable to meet its financial obligations as and when they fall due.
The Royal Children’s Hospital maximum exposure to liquidity risk is the carrying amounts of financial liabilities as disclosed in the face of the balance sheet.
Liquidity risk management policy
Liquidity risk is managed through regular fortnightly cash grants from the Department of Health. Trade payable contracts are entered into in accordance with The Royal Children’s Hospital’s policies for authorisation and suppliers are periodically reviewed. The Royal Children’s Hospital aims to settle all short term payables within 60 days. Any short-term or long-term borrowings entered into by The Royal Children’s Hospital require approval by the State Minister for Health and State Treasurer.
The following table discloses the contractual maturity analysis for The Royal Children’s Hospital and consolidated entity’s financial liabilities. For interest rates applicable to each class of liability, refer to individual notes to the financial statements.
Maturity Analysis of financial liabilities as at 30 June
Consolidated
Carrying Amount
Contractual Cash Flows
Maturity Dates
Less than 1 month
1-3 Months 3 Months - 1 Year
1-5 Years
2012 $'000 $'000 $'000 $'000 $'000 $'000
Payables
Trade Creditors and Accruals 17,329 17,329 4,484 12,139 706 -
Deposits 35 35 3 9 23 -
Sundry Creditors 2,306 2,306 1,390 19 - -
Other Financial Liabilities (Footnote 20)
Monies held in trust 1,385 1,385 1,385 - - -
Total Financial Liabilities 21,055 21,055 7,262 12,167 729 -
2011
Payables
Trade Creditors and Accruals 18,488 18,488 7,181 11,072 233 -
Deposits 36 36 3 9 24 -
Sundry Creditors 1,576 1,576 1,576 - - -
Other Financial Liabilities (Footnote 20)
Monies held in trust 1,543 1,543 1,543 - - -
Total Financial Liabilities 21,643 21,643 10,305 11,081 257 -
The Royal Children’s Hospital
Carrying Amount
Contractual Cash Flows
Maturity Dates
Less than 1 month
1-3 Months 3 Months - 1 Year
1-5 Years
2012 $'000 $'000 $'000 $'000 $'000 $'000
Payables
Trade Creditors and Accruals 16,091 16,091 4,484 10,902 706 -
Deposits 35 35 3 9 23 -
Sundry Creditors 1,389 1,389 1,389 - - -
Other Financial Liabilities (Footnote 20)
Monies held in trust 1,385 1,385 1,385 - - -
Total Financial Liabilities 18,900 18,900 7,261 10,911 729 -
2011
Payables
Trade Creditors and Accruals 17,215 17,215 7,538 9,443 233 -
Deposits 36 36 3 9 24 -
Sundry Creditors 1,274 1,274 1,274 - - -
Other Financial Liabilities (Footnote 20)
Monies held in trust 1,543 1,543 1,543 - - -
Total Financial Liabilities 20,068 20,068 10,358 9,453 257 -
Footnote 20: Ageing analysis of financial liabilities excludes PPP finance lease liability and statutory financial liabilities (i.e GST payable)
Maturity analysis of PPP finance lease liability ($917m) is disclosed under Note 19 (Commitments).
notes to and forming part of the financial statements notes to and forming part of the financial statements
| Annual Report 2011 – 12 The Royal Children’s Hospital and Controlled Entities62 63 Annual Report 2011 – 12 The Royal Children’s Hospital and Controlled Entities |

Note 18: Financial Instruments (continued)
(d) Market Risk
The Royal Children’s Hospital’s and its Controlled Entities’ exposure to market risk are primarily through interest rate risk and equity price risk. Exposure to foreign currency risk is discussed below. Objectives, policies and processes used to manage each of these risks are disclosed in the paragraph below.
Currency Risk
The Royal Children’s Hospital and its Controlled Entities are exposed to insignificant foreign currency risk through payables relating to purchases of supplies and consumables from overseas. It is also exposed to foreign currency risk through managed investments that have exposure to overseas markets. Movement in foreign currency is reflected in the value of the underlying units in the funds.
Interest Rate Risk
Exposure to interest rate risk arises primarily from The Royal Children’s Hospital’s cash and cash equivalents held in floating rate facilities. The Royal Children’s Hospital minimises interest rate risk by mainly undertaking fixed rate and non-interest bearing financial instruments. For financial liabilities, The Royal Children’s Hospital mainly undertakes financial liabilities with relatively even maturity values.
Equity Price Risks
Both The Royal Children’s Hospital and The Royal Children’s Hospital’s Foundation Trust Fund manages the equity price risk associated with the investments in managed funds through their own Investment Committees. These sub-committees are delegated with responsibility for over seeing the development, monitoring and review of the Investment strategy and policies. The Committees meet at least quarterly and at each meeting, considers a report on The Royal Children’s Hospital’s investments provided by the Victorian Funds Management Corporation. The committee monitors the returns on investments, and determines the allocation between the different classes of investments available.
Interest rate exposure of Financial Assets and Liabilities as at 30 June
Weighted Average Effective
Interest Rates
Consolidated Carrying Amount
Interest Rate Exposure
Fixed Interest Rate
Variable Interest Rate
Non Interest Bearing
2012 % $'000 $'000 $'000 $'000Financial AssetsCash and Cash Equivalents 4.07% 51,016 20,812 30,204 -Receivables (Footnote 21) Inter Hospital Debtors 2,439 - - 2,439 Trade Debtors 1,908 - - 1,908 Patient Fees 3,407 - - 3,407 Accrued investment income 836 - - 836 Diagnostic Debtors 1,218 - - 1,218 Sundry Debtors 555 - - 555Other Financial Assets Available for Sale – Managed Funds 4.48% 62,225 13,005 - 49,220 Held for Trading – Managed Funds 47,452 - - 47,452 Term Deposit 4.50% 900 900 - -Total Financial Assets 171,955 34,717 30,204 107,034
Financial LiabilitiesPayables (Footnote 21) Trade Creditors and Accruals 17,329 - - 17,329 Deposits 35 - - 35 Sundry Creditors 2,306 - - 2,306 Finance Lease Liabilities 4.84% 917,233 917,233 - -Other Financial Liabilities Monies held in trust 1,385 - - 1,385Total Financial Liabilities 938,288 917,233 - 21,055
Finance Lease Liability is a fixed interest rate contract at 4.84%
Note 18: Financial Instruments (continued)
Weighted Average Effective
Interest Rates
Consolidated Carrying Amount
Interest Rate Exposure
Fixed Interest Rate
Variable Interest Rate
Non Interest Bearing
2011 % $'000 $'000 $'000 $'000Financial AssetsCash and Cash Equivalents 4.91% 37,823 23,275 14,548 -Receivables (Footnote 21) Inter Hospital Debtors 1,591 - - 1,591 Trade Debtors 2,684 - - 2,684 Patient Fees 3,807 - - 3,807 Accrued investment income 547 - - 547 Diagnostic Debtors 1,281 - - 1,281 Sundry Debtors 1,011 - - 1,011Other Financial Assets Available for Sale – Managed Funds 5.58% 65,705 13,494 - 52,211 Held for Trading – Managed Funds 51,247 - - 51,247 Term Deposit 5.80% 900 900 - -Total Financial Assets 166,595 37,669 14,548 114,378
Financial LiabilitiesPayables (Footnote 21) Trade Creditors and Accruals 18,488 - - 18,488 Deposits 36 - - 36 Sundry Creditors 1,576 - - 1,576Other Financial Liabilities Monies held in trust 1,543 - - 1,543Total Financial Liabilities 21,643 - - 21,643
Footnote 21: The carrying amount exclude types of statutory financial assets and liabilities (i.e. GST input tax credit, GST payable, Department of Health payables and Income in advance)
Sensitivity Disclosure Analysis
Taking into account past performance, expectations, economic forecasts, and management’s knowledge and experience of the financial markets, The Royal Children’s Hospital believes the following movements are ‘reasonably possible’ over the next 12 months:
A shift of +1.25% and -1.25% in the current market interest rates
A shift of +20% and -20% in current market indices
Base rates are sourced from Victorian Funds Management Corporation
The following table discloses the impact on net operating result and equity for each category of financial instrument at year end as presented to key management personnel, if changes in the relevant risk occur.
Consolidated
2012
Carrying Amount
Interest Rate Risk Price Risk-20% + 20%-1.25% + 1.25%
Profit$'000
Equity$'000
Profit $'000
Equity $’000
Profit$'000
Equity$'000
Profit$'000
Equity$'000
Financial Assets
Cash and Cash Equivalent 51,016 (638) (638) 638 638 - - - -
Fixed rate Instruments
Term Deposits 900 (11) (11) 11 11 - - - -
Investments
Units in Managed Funds (Available for Sale) 62,225 - - - - - (12,445) - 12,445
Units in Managed Funds (Held for Trading) 47,452 - - - - (9,490) - 9,490 -
161,593 (649) (649) 649 649 (9,490) (12,445) 9,490 12,445
2011 -1% +1% -12% +12%
Financial Assets
Cash and Cash Equivalent 14,548 (145) (145) 145 145 - - - -
Fixed rate Instruments
Term Deposits 37,669 (377) (377) 377 377 - - - -
Investments
Units in Managed Funds (Available for Sale) 52,211 - - - - - (6,265) - 6,265
Units in Managed Funds (Held for Trading) 51,247 - - - - (6,150) - 6,150 -
155,675 (522) (522) 522 522 (6,150) (6,265) 6,150 6,265
notes to and forming part of the financial statements notes to and forming part of the financial statements
| Annual Report 2011 – 12 The Royal Children’s Hospital and Controlled Entities64 65 Annual Report 2011 – 12 The Royal Children’s Hospital and Controlled Entities |

Note 18: Financial Instruments (continued)
(e) Fair Value
The fair values and net fair values of financial instrument assets and liabilities are determined as follows:(i) Level 1 – the fair value of financial instrument with standard terms and conditions and traded in active liquid markets are determined with reference to
quoted market prices;(ii) Level 2 – the fair value is determined using inputs other than quoted prices that are observable for the financial asset or liability, either directly or
indirectly; and(iii) Level 3 – the fair value is determined in accordance with generally accepted pricing models based on discounted cash flow analysis using unobservable
market inputs.
The Royal Children’s Hospital considers that the carrying amount of financial instrument assets and liabilities recorded in the financial statements to be a fair approximation of their fair values, because of the short term nature of the financial instruments and the expectation that they will be paid or received in full.
The following table shows that the fair values of the contractual financial assets and liabilities are the same as their carrying amounts.
Comparison between carrying amount and fair value
Consolidated Carrying Amount
2012
Fair Value2012
Consolidated Carrying Amount
2011
Fair value2011
$'000 $'000 $'000 $'000
Financial AssetsCash and Cash Equivalents 51,016 51,016 37,823 37,823Receivables Inter Hospital Debtors 2,439 2,439 1,591 1,591 Trade Debtors 1,908 1,908 2,684 2,684 Patient Fees 3,407 3,407 3,807 3,807 Accrued investment income 836 836 547 547 Diagnostic Debtors 1,218 1,218 1,281 1,281 Sundry Debtors 555 555 1,011 1,011Other Financial Assets Available for Sale - Managed Funds 62,225 62,225 65,705 65,705 Held for Trading - Managed Funds 47,452 47,452 51,247 51,247 Term Deposit 900 900 900 900Total Financial Assets 171,955 171,955 166,595 166,595
Financial LiabilitiesPayables Trade Creditors and Accruals 17,329 17,329 18,488 18,488 Deposits 35 35 36 36 Sundry Creditors 2,306 2,306 1,576 1,576Other Financial Liabilities Monies held in trust 1,385 1,385 1,543 1,543 Finance Lease Liabilities 917,233 917,233 - -Total Financial Liabilities 938,288 938,288 21,643 21,643
Consolidated Carrying Amount
as at 30 June $’000
Fair value measurement at end of reporting period using:
2012Level 1$'000
Level 2$'000
Level 3$'000
Financial AssetsOther Financial Assets Available for Sale – Managed Funds 62,225 17,702 44,523 - Held for Trading – Managed Funds 47,452 - 47,452 - Term Deposit 900 900 - -Total Financial Assets 110,577 18,602 91,976 -
Consolidated Carrying Amount
as at 30 June $’000
Fair value measurement at end of reporting period using:
2011Level 1$'000
Level 2$'000
Level 3$'000
Financial AssetsOther Financial Assets Available for Sale – Managed Funds 65,705 13,493 52,212 - Held for Trading – Managed Funds 51,247 - 51,247 - Term Deposit 900 900 - -Total Financial Assets 117,852 14,393 103,459 -
Note 19: Commitments for Expenditure
This Note includes commitments for operating leases, capital and operating expenditure under contracts for the supply of works, services and materials insofar as they are not provided for in the Balance Sheet
Parent Entity2012
Parent Entity2011
Consolidated2012
Consolidated2011
$'000 $'000 $'000 $'000
Capital Expenditure Commitments
Payable:
Land and Buildings
Plant and Equipment 311 10,900 311 10,900
Total capital expenditure commitments 311 10,900 311 10,900
Plant and Equipment
Not later than one year 311 10,900 311 10,900
TOTAL 311 10,900 311 10,900
Operating Commitments
Payable
Not later than one year 3,705 4,154 3,705 3,776
Later than one year but not later than 5 years 313 - 313 -
Total Operating Commitments 4,018 4,154 4,018 3,776
Lease Commitments
Commitments in relation to leases contracted for at the reporting date:
Operating Leases 854 806 854 854
Total Lease Commitments 854 806 854 854
Operating Leases
Cancellable
Not later than one year 519 453 519 500
Later than 1 year and not later than 5 years 335 353 335 353
TOTAL 854 806 854 854
PPP Commitments – Finance Lease (Footnote 22)
Commitments in relation to finance leases are payable as follows:
Not later than one year 11,858 - 11,858 -
Later than 1 year and not later than 5 years 226,339 - 226,339 -
Later than 5 years 1,597,925 - 1,597,925 -
Minimum lease payments (Footnote 22) 1,836,122 - 1,836,122 -
Less stage 2 bid price 98,526 - 98,526 -
Less Future finance charges 813,686 - 813,686 -
Less 3B expenditure 6,677 6,677
Total Finance lease (Note 14) 917,233 - 917,233 -
PPP Operating Expenses (Footnote 23)
Future commitments for the operating expenses relating to the PPP Finance Lease:
Not later than one year 14,375 - 14,375 -
Later than 1 year and not later than 5 years 130,867 - 130,867 -
Later than 5 years 1,745,297 - 1,745,297 -
Total Future Commitments 1,890,539 - 1,890,539 -
Total Commitments for expenditure (inclusive of GST) 2,812,954 15,860 2,812,954 15,530
less GST recoverable from the Australian Tax Office (471) (1,442) (471) (1,412)
Total commitments for expenditure (exclusive of GST) 2,812,483 14,418 2,812,483 14,118
notes to and forming part of the financial statements notes to and forming part of the financial statements
| Annual Report 2011 – 12 The Royal Children’s Hospital and Controlled Entities66 67 Annual Report 2011 – 12 The Royal Children’s Hospital and Controlled Entities |

Note 20: Contingent Assets and Contingent Liabilities
Contingent Liabilities
Any claims made against The Royal Children’s Hospital (RCH) are covered by public healthcare insurance managed by Victorian Managed Insurance Authority (VMIA), with premiums being paid by the Department of Health.
There is a contingent liability in respect of grants received from the Department of Health that may be subject to recall of $2.172 million (2011 $2.87 million).
PPP Commitments
Footnote 22: The stage 2 price of $98,526,000 will be included in the lease liability on 31.12.2014, being the completion date for stage 2. The minimum lease payments include future payments for stage 2 of the Project Agreement. The effective interest rate implicit in the finance lease is 4.84%. The Department of Health of State of Victoria is obliged to fund the quarterly service payments due under the Project Agreement for the life of the Agreement, a period of up to 25 years.
Footnote 23: These commitments represent contingent rentals, lifecycle payments and recurrent charges relating to the facility management on the PPP which are due from the Department of Health of State of Victoria to CHP (Children’s Health Partnership). Contingent rentals arise from adjustments for consumer price and labour price indexes embedded in the capital component of the service payment. Contingent rentals are recognised as an expense in the period in which they are incurred.
Build-own-transfer arrangement - new Royal Children’s Hospital
The State of Victoria has entered into a 29 year agreement in November 2007 under its Partnerships Victoria policy with Children’s Health Partnership Pty Ltd (CHP) for the financing, design, construction, and maintenance for 25 years of the new Royal Children’s Hospital (RCH). The construction of the new hospital was completed on 22nd December 2011, at which time the RCH assumed the responsibility for the provision of health services at the facility.
In December 2011 the RCH entered into a 25 year Site sub-lease agreement in order to lease the facility from CHP. Stage 2 of the Project to redevelop the commercial precinct and expansion of car park has commenced and will be completed in December 2014. The RCH, on behalf of the State, agreed to record all obligations (including Finance Lease and Operating Lease payments) associated under the new RCH’s development. The state will pay to CHP the Quarterly Service Payment (QSP) from the operational commencement date. Each QSP includes an allowance for the capital cost of the facility and the facilities maintenance and ancillary service to be delivered by CHP over the 25 year operating phase.
Note 19: Commitments for Expenditure (continued) Note 21: Jointly Controlled Operations and Assets
Name of Entity Principal Activity
Ownership Interest
2012 2011
Victorian Comprehensive Cancer Centre
The Member Entities have committed to the establishment of a world leading comprehensive cancer centre in Parkville, Victoria, through the Joint Venture, with a view to saving lives through the integration of cancer research, education and training and patient care. The Royal Children’s Hospital joined the Victoria Comprehensive Cancer Centre on 1 July 2010. 13% 14%
The Royal Children’s Hospital’s interest in assets employed in the above jointly controlled operations and assets is detailed below. The amounts are included in the financial statements and consolidated financial statements under their respective asset categories:
2012 2011$'000 $'000
Current Assets
Cash and Cash Equivalents 152 84
Receivables 32 3
GST Recoverable 1 -
Prepayment 3 4
Total Current Assets 188 91
Non-Current Assets
Property, Plant and Equipment 5 5
Total Non-Current Assets 5 5
Total Assets 193 96
Current Liabilities
Accrued Expenses 23 6
Payables 19 16
Provisions – LSL and Annual Leave 29 -
Total Current Liabilities 71 22
Non-Current Liabilities
Provisions – LSL 3 -
Total Non-Current Liabilities 3 -
Total Liabilities 74 22
Net Assets 119 75
EQUITY
Accumulated Surpluses/(Deficits) 119 75
Total Equity 119 75
The Royal Children’s Hospital’s interest in revenues and expenses resulting from jointly controlled operations and assets is detailed below:
2012 2011$'000 $'000
Revenues
Grants 384 259
Interest 6 4
Goods received free of charge 3 -
Total Revenue 393 263
Expenses
Employee Benefits 131 66
Other Expenses from Continuing Operations 216 122
Depreciation and Amortisation 1 1
Total Expenses 349 189
Net Result 44 75
notes to and forming part of the financial statements notes to and forming part of the financial statements
| Annual Report 2011 – 12 The Royal Children’s Hospital and Controlled Entities68 69 Annual Report 2011 – 12 The Royal Children’s Hospital and Controlled Entities |

Note 22: Responsible Person Disclosures
(i) Responsible Persons
Period
Responsible MinisterThe Honourable David Davis MLC Minister for Health 1 July 2011 30 June 2012
Governing BoardMr Tony Beddison AO (Chairman) 1 July 2011 30 June 2012
Ms Linda Berry 1 July 2011 30 June 2012
Mr Patrick Burroughs 1 July 2011 30 June 2012
Dr Julie Caldecott 1 July 2011 30 June 2012
Mr Max Findlay 5 July 2011 30 June 2012
Ms Jane Hume 1 July 2011 30 June 2012
Hon Rob Knowles AO 1 July 2011 30 June 2012
Mr David Mandel 1 July 2011 30 June 2012
Mr Ian Quick 1 July 2011 30 June 2012
Mr John Rimmer 1 July 2011 30 June 2012
Dr Lakshmi Sumithran 5 July 2011 30 June 2012
Accountable OfficersProfessor Christine Kilpatrick (Chief Executive Officer) 1 July 2011 30 June 2012
(ii) Remuneration of Responsible Persons
The number of Responsible Persons are shown in their relevant income bands:
Parent2012
Parent2011
Consolidated2012
Consolidated2011
No. No. No. No.
Income Band
$10,000 - $19,999 3 8 3 8
$20,000 – $29,999 6 - 6 -
$30,000 - $39,999 1 1 1 1
$80,000 - $89,999* 1 - 1 -
$400,000 - $409,999 1 1 1 1
Total Numbers 12 10 12 10
* This figure includes remuneration received by RCH Board member as a Chairman in Campus Council
There are two additional Board Members in the Financial Year 2011-12
Total remuneration received or due and receivable by Responsible Persons from the reporting entity amounted to:
Parent2012
Parent2011
Consolidated2012
Consolidated2011
$ $ $ $
Total Remuneration 703,911 602,837 703,911 602,837
The responsible Minister from 1/7/11 to 30/6/12 was the Hon David Davis MLC, Minister for Health. The Minister does not receive any remuneration from The Royal Children’s Hospital. Ministerial remuneration is disclosed in the financial statements of the Department of Premier and Cabinet.
The responsible persons for The Royal Children’s Hospital’s Controlled Entities received no remuneration in the 2011-12 year. (2010-11 : NIL). The Responsible persons’ profiles are disclosed in The Royal Children’s Hospital’ Controlled Entities financial statements.
(iii) Retirement Benefits of Responsible Persons
Parent2012
Parent2011
Consolidated2012
Consolidated2011
$ $ $ $
Retirement benefits paid by the reporting entity in connection with the retirement of Responsible Persons of the reporting entity amount to: - - - -
Note 22: Responsible Person Disclosures (continued)
(iv) Other Transactions of Responsible Persons and their Related Parties
Mr Tony Beddison AO (Chairman)
A Director of The Royal Children’s Hospital, Mr Tony Beddison AO is a Director of Hoban Recruitment and Director of Clicks IT Recruitment Australia.
Hoban Recruitment renders services to The Royal Children’s Hospital. All dealings with The Royal Children’s Hospital are in the ordinary course of business and are on normal commercial terms and conditions.
Hoban Recruitment rendered services to The Royal Children’s Hospital for several decades prior to Mr Beddison’s appointment as the Hospital’s Chairman and the nature of these commercial arrangements was declared by Mr Beddison prior to his appointment as Chairman.
Parent2012
Parent2011
Consolidated2012
Consolidated2011
$ $ $ $
Hoban Recruitment 301,680 391,465 301,680 391,465
Clicks IT Recruitment Australia 56,555 266,813 56,555 266,813
Ms Linda Berry
A Director of The Royal Children’s Hospital, Ms Linda Berry is a former partner and now consultant to Minter Ellison. This firm rendered services to The Royal Children’s Hospital. In 2010-11 all dealings with The Royal Children’s Hospital are in the ordinary course of business and are on normal commercial terms and conditions.
Parent2012
Parent2011
Consolidated2012
Consolidated2011
$ $ $ $
Minter Ellison - 1,931 - 1,931
Mr Julian Clarke
A Director of The Royal Children’s Hospitals Foundation, Mr Julian Clarke was Managing Director of the Herald and Weekly Times Pty Ltd (HWT) and currently serves as a Chairman of that company. The HWT manages the Good Friday Appeal and rendered services to The Royal Children’s Hospital Foundation for the administrative costs necessarily incurred with the Good Friday Appeal. Mr Clarke’s term of office as a director of The Royal Children’s Hospital ended 30 June 2011.
Parent2012
Parent2011
Consolidated2012
Consolidated2011
$ $ $ $
Herald and Weekly Times Ltd - 852 1,164,168 1,239,053
The Herald and Weekly Times Ltd transferred funds to The Royal Children’s Hospital Foundation during the year. These funds represent the public’s donations to The Royal Children’s Hospital Good Friday Appeal.
Parent2012
Parent2011
Consolidated2012
Consolidated2011
$ $ $ $
Herald and Weekly Times Ltd - - 15,820,641 13,776,480
Mr Max Findlay
A Director of The Royal Children’s Hospital, Mr Max Findlay was appointed a Director of Skilled Group Ltd in early 2010. ATIVO, a company within the Skilled Group, has been providing contractors and services to RCH mainly in Engineering and Maintenance for many years. These arrangements with Skilled Group/ATIVO pre-date Mr Findlay’s appointment to the RCH Board in 2009 and are on normal commercial terms and conditions and in the ordinary course of business.
Parent2012
Parent2011
Consolidated2012
Consolidated2011
$ $ $ $
ATIVO 379,633 809,051 379,633 809,051
notes to and forming part of the financial statements notes to and forming part of the financial statements
| Annual Report 2011 – 12 The Royal Children’s Hospital and Controlled Entities70 71 Annual Report 2011 – 12 The Royal Children’s Hospital and Controlled Entities |

Note 22: Responsible Person Disclosures (continued)
Controlled Entity Related Party Transactions
The Royal Children’s Hospital’s Foundation Trust Fund
The CEO of The Royal Children’s Hospital is also a Director of The Royal Children’s Hospital Foundation.
Mr Tony Beddison is a Director of The Royal Children’s Hospital and The Royal Children’s Hospital Foundation.
The transactions between the two entities relates to reimbursements made by The Royal Children’s Hospital’s Foundation Trust Fund to The Royal Children’s Hospital for goods and services and the transfer of funds by way of distributions made to the Hospital. All dealings are in the normal course of business and are on normal commercial terms and conditions.
Parent Entity2012
Parent Entity2011
$ $
Distributions and reimbursements by The Royal Children’s Hospital’s Foundation Trust Fund 30,779,091 27,934,140
The Royal Children’s Hospital Education Institute Limited
The transactions between the two entities relates to reimbursements made by The Royal Children’s Hospital Education Institute Limited to The Royal Children’s Hospital for salaries, goods and services paid on its behalf. All dealings are in the normal course of business and are on normal commercial terms and conditions.
Parent Entity2012
Parent Entity2011
$ $
Reimbursements by The Royal Children’s Hospital Education Institute Limited for salaries, goods and services 2,575,291 2,008,139
Communities that Care Limited
The transactions between the two entities relates to reimbursements made by Communities That Care Limited to The Royal Children’s Hospital for salaries, goods and services paid on its behalf. All dealings are in the normal course of business and are on normal commercial terms and conditions.
Parent Entity2012
Parent Entity2011
$ $
Reimbursements by Communities That Care Limited for salaries, goods and services 70,244 21,500
(v) Other Receivables from and (Payables to) Controlled Entities
Parent Entity2012
Parent Entity2011
$ $
The Royal Children's Hospital's Foundation Trust Fund 2,223,065 2,279,108
The Royal Children's Hospital Education Institute Limited 52,073 128,187
Communities That Care Limited 7,819 3,150
Total amounts receivable from Controlled Entities 2,282,957 2,410,445
Note 22a: Executive Officer Disclosures
Executive Officers’ Remuneration
The numbers of executive officers, and their total remuneration during the reporting period are shown in the first two columns in the table below in their relevant income bands. The base remuneration of executive officers is shown in the third and fourth columns. Base remuneration is exclusive of bonus payments, long-service leave payments, redundancy payments and retirement benefits. The total annualised employee equivalent provides a measure of full-time equivalent executive officers over the reporting period.
Total remuneration payments include bonus payments leave entitlements and contract renegotiations during the year
Income Band Parent
Total Remuneration Base Remuneration
2012No.
2011No.
2012No.
2011No.
$100,000 – $109,999 - - - 1
$140,000 – $149,999 - - - 1
$170,000 – $179,999 - 1 - -
$180,000 – $189,999 - - - 1
$190,000 – $199,999 - 3 - 1
$200,000 – $209,999 1 - 3 1
$210,000 – $219,999 - - 3 -
$220,000 – $229,999 2 1 - 1
$230,000 – $239,999 2 - - -
$240,000 – $249,999 1 1 - 2
$250,000 – $259,999 - - 1 -
$260,000 – $269,999 - 2 - -
$290,000 – $299,999 1 - - -
$320,000 – $329,999 - - 1 -
$340,000 – $349,999 - - - 1
$370,000 – $379,999 1 1 - -
Total number of executives 8 9 8 9
Total annualised employee equivalent (AEE) (a) 7.63 7.91 7.63 7.91
Total amount $2,033,737 $2,150,287 $1,838,101 $1,887,510
Note: (a) Annualised employee equivalent is based on working 38 ordinary hours per week over the reporting period.
Executive Remuneration 2011-12
Two Executive Directors resigned during the year.
notes to and forming part of the financial statements notes to and forming part of the financial statements
| Annual Report 2011 – 12 The Royal Children’s Hospital and Controlled Entities72 73 Annual Report 2011 – 12 The Royal Children’s Hospital and Controlled Entities |

Note 23: Controlled Entities
Note 24: Events occurring after the balance sheet date
Name of entityCountry of incorporation/
establishmentEquity Holding
The Royal Children’s Hospital's Foundation Trust Fund Australia n/a
The Royal Children’s Hospital Education Institute Limited Australia Limited by Guarantee
Communities That Care Limited Australia Limited by Guarantee
Controlled Entities Contribution to the Consolidated Results2012 2011
$’000 $’000
NET RESULT FOR THE YEAR
The Royal Children’s Hospital's Foundation Trust Fund (2,301) 7,141
The Royal Children’s Hospital Education Institute Limited 8 12
Communities That Care Limited 24 (22)
Total Consolidated Result (2,269) 7,131
Subject to current market volatility in share markets, there are no events occurring after balance date.
notes to and forming part of the financial statements
| Annual Report 2011 – 12 The Royal Children’s Hospital and Controlled Entities74