annual financial report - fso.arizona.edu › sites › fso › files › 2018-01 ›...
TRANSCRIPT

Annual Financial ReportYear Ended June 30, 2010

It was a bold move in 1885 to start a
university in the middle of the desert
before Arizona was even a state. Those
original entrepreneurs laid the groundwork
for greatness. And now, the ideas and
investments that have been nurtured
and developed since those early days
are changing the world.
Memo r i a l Foun ta i n , 1 920Ua library, Special collectionS
cover:
St uden t bod y , 1 8 9 8 Ua library, Special collectionS
Spec i a l than k sto Ua StUdentS from reSidence life and the army and navy rotc

The University of Arizona Annual Financial Report | 1
2 A Message from
the President
4 Institutional Profile
8 Independent
Auditors’ Report
10 Management’s
Discussion and Analysis
Table of Contents 18 Statement of Net Assets
19 Statement of Financial
Position - Component Units
20 Statement of Revenues,
Expenses and Changes
in Net Assets
21 Statement of Activities -
Component Units
22 Statement of Cash Flows
24 Notes to Financial
Statements
© Scott KirKeSSner

2 | The University of Arizona Annual Financial Report2 | The University of Arizona Annual Financial Report
A Message from the President
2 | The University of Arizona Annual Financial Report
This year the University of Arizona is celebrating its 125th anniversary. Since our
founding in 1885, the UA has consistently been a world leader across an extraordinary
range of academic areas. Our rise to prominence really began in the 1920s, when the
science of tree ring research was discovered at the UA. The study of tree rings enables
scientists to discern weather patterns going back thousands of years, and has made the
UA a world leader in the study of climate change and the environment.
For decades, we have led the world in the study of space. Every NASA mission to
the moon has involved UA scientists; indeed the United States would never have been
able to land on the moon were it not for work done at UA. Last year, we led a mission
to Mars that produced groundbreaking insight into the presence of water in the
Martian soil.
At UA we build the biggest optical telescopes in the world (which has helped create a whole optics industry here in
Tucson); we have the best dance program west of the Mississippi, ranking second only to Julliard; we are leaders in the study
of entrepreneurship, solar energy, border studies, and the environment, all critical areas for the economy and quality of life
in Arizona.
We house the world’s greatest collection of Southwest pottery and artifacts; have the best modern poetry center in the
country; and have a medical school that has done some of the most critical work in the nation in areas as diverse as heart
transplantation, skin cancer and diabetes.
This year the University of Arizona was ranked number one in the nation in physical sciences by the National Science
Foundation. To put that ranking in perspective, in the physical sciences we outpaced visible and highly regarded institutions
such as MIT, Cal Tech, Johns Hopkins and UC Berkeley. In the NSF rankings UA was ranked number 16 among all public
universities for overall research funding and number 24 when private universities were included. Simply said, there are very
few places in this country – indeed the world – that are doing more research than we are doing right here in Tucson.
For the fourth consecutive year, we begin the fall with a record freshman enrollment, which will come in at slightly over
7,000 students. In addition to being the largest freshman class in history, it is once again our most diverse. While we won’t
have the final numbers before this goes to press, preliminary figures place the total minority enrollment at 38%, up from
34.2% last year, and 30.7% the year before. In just five years we’ve seen the Hispanic freshman class double in size. This is a
great success story, and one that reflects our deep commitment to access and diversity at UA.
This year we also had very good news from the ballot box. Against long odds, the people of Arizona went to the polls in
large numbers and voted by a two-to-one margin to approve a one-cent increase in the sales tax – via Proposition 100 – to
help shore up funding for education in our state. That vote flew in the face of stereotypes that many like to use to portray our
state, and it spoke to the value that Arizona taxpayers place on education and the role it plays in shaping our state’s future.

The University of Arizona Annual Financial Report | 3The University of Arizona Annual Financial Report | 3The University of Arizona Annual Financial Report | 3
Had Proposition 100 failed, the University of Arizona was facing an additional $42 million budget cut on top of
$100 million in cuts already taken. It would have been devastating. Arizona voters recognized that. In a period of
challenging economics, deep budget cuts and seemingly endless political acrimony, the people of this state made an
important statement. For that we are truly thankful.
Our financial position was further strengthened when the Board of Regents approved a significant tuition increase
for the 2010/11 academic year. Coupled with federal stimulus funding, the federal maintenance of effort provisions
which limit state budget cuts to higher education, and a very successful year of fundraising, the UA has managed a
measure of stability amid a sea of fiscal uncertainty.
The state’s budget deficit continues to loom over all elements of state government and public education; however,
strong and prudent fiscal management at the University enables us to meet the challenges that lie ahead.
Despite the extraordinary financial crisis that has confronted our state and nation, UA continues to operate on
solid footing and make life better for the people of Arizona. We are committed to provide access to a high-quality
education infused by the excitement of discovery, and are proud of the many ways we are bringing that pledge to
life. Whether measured by enrollment, research awards or fundraising, we expect the coming year to be our most
successful ever.
Sincerely,
Robert N. SheltonPresident

4 | The University of Arizona Annual Financial Report
Institutional Profile
The University of Arizona was established as a land grant institution in 1885, 27 years before the Arizona Territory became a state. The years following World War II and the Korean War were a period of substantial growth for the University. In the late 1950s, enrollment greatly increased, with the University gaining an average of more than 1,200 students per year for 17 years. During this period, the foundation was laid for the development of a leading research institution. Today, the University serves 38,767 students through 18 colleges offering 329 degree programs and is ranked among the leading research universities in the country.
Enrollment Statistics – Academic Year 2009 - 2010
Undergraduate enrollment – Fall 2009 30,346
Graduate and Professional enrollment – Fall 2009 8,421
Degrees awarded – Bachelor’s 5,914
Degrees awarded – Advanced 2,326
Tuition and fees for full-time student – Resident $6,842
Tuition and fees for full-time student – Non-resident $22,251
The University’s 2,400 full time equivalent faculty and 1,241 full time equivalent graduate teaching and research assistants and associates educate a diverse student population. The student population is 52.4% female, 16% Hispanic, 6.9% Asian or Pacific Islander, 3.4% Black, and 2.8% Native American. It includes students from all fifty states and 116
foreign countries. International students totaled 6.1% of the Fall 2009 enrollment, with the largest numbers of foreign students hailing from the People’s Republic of China, India, Korea, Mexico and Taiwan.
Research ExcellenceThe University offers an unusually extensive and varied group of research, graduate and professional programs. During the past 25 years the University has emerged as one of the top research universities in the nation (16th among public research universities), according to the National Science Foundation. With its abundance of physical, biological, health sciences programs and interdisciplinary strengths, the University has tremendous potential for further research expansion.
The University was one of the original Carnegie Research I institutions. In 1985, the University was elected to membership in the Association of American Universities (AAU), a prestigious group limited to North America’s preeminent public and private research universities. The University’s outstanding research programs provide advances in applied and basic or pure knowledge that fulfill the institution’s obligation to the State and the nation. Such programs attract internationally distinguished faculty who serve the University’s students through a comprehensive range of undergraduate and graduate programs.
High-quality research programs secure extensive federal and corporate funding, enriching instructional programs and providing tremendous education and research opportunities for the students, as well as helping to provide up-to-date facilities and equipment.
Stewa rd Obse r va to r y , 1 923UA LiBrArY, SPeciAL coLLectionS

The University of Arizona Annual Financial Report | 5
StrengthsIn the most recent ranking (fiscal year 2008) the National Science Foundation (NSF) ranked the University of Arizona as America’s No. 1 university for research expenditures in the physical sciences, which includes astronomy, physics and chemistry. Overall, the UA’s ranking among public research universities was 16th, and it was ranked as the nation’s 24th institution among all public and private universities and colleges. A persistent theme in the University’s history has been developing strengths based on its unique physical and cultural environment. Some examples follow:
• Two University of Arizona research and development groups were selected to develop and manufacture key technology for the first major undertaking to investigate the mystery of dark energy in the universe. UA’s Imaging Technology Laboratory, a research group within Steward Observatory, and the Optical Fabrication and Engineering Facility at the College of Optical Sciences will provide image recording devices and the heart of the optical system used for imaging, respectively, for the Hobby-Eberly Telescope at the McDonald Observatory, which is operated by the University of Texas, Austin. The additions are part of outfitting the world’s fourth largest optical telescope with an array of new instruments to analyze the light from distant galaxies in an effort to understand the nature of dark energy. Scientists have known for a while that dark energy exists, but so far, nobody has been able to come up with an explanation of what it is.
• The National Alliance for Advanced Biofuels and Bioproducts, of which the UA is a founding member, has received a grant from the U.S. Department of
Energy totaling more than $44 million for algal biofuels and bioproducts research and development. Several University of Arizona researchers are part of a consortium that has just received a U.S. Department of Energy grant totaling more than $44 million that is intended to bring more sustainable and economically sound algae-based biofuels to market. The UA’s contribution will be multifaceted, involving a range of individuals focusing on water usage and quality issues, biology, reactor design and other topics.
• The Arizona Geriatric Education Center, housed within the University of Arizona Center on Aging, has received a five-year, $2 million grant to train health professionals throughout the state in the care of older adults. Led by co-principal investigators Dr. Mindy Fain and Jane Mohler, the center is a statewide consortium consisting of the UA’s Arizona Health Sciences Center, Arizona State University and the Southern Arizona VA Healthcare System. “In our rapidly aging society, all health-care professionals must be prepared to work together to provide safe and quality care for seniors, especially those with complex health-care needs,” Mohler said. “The center is poised to address just such challenges in Arizona, through state-of-the-art inter-professional geriatric education and training programs, with a special focus on meeting the needs of ethnic minority elders and those living in rural and underserved areas.”
• A small group of institutions across the nation was chosen to train individuals in a national fellowship program that is targeting the top-performing students of color – and the University of Arizona is among them. The Woodrow Wilson National Fellowship Foundation named the UA’s College of Education one among 27 institutions able to accept students in its Woodrow Wilson-Rockefeller Brothers Fund Fellowships for Aspiring Teachers of Color program. The UA college’s Teach Arizona program, which encompasses all secondary programs within the college, will begin taking WW-RBF Fellowship students during the 2011-2012 academic year.
• More than a dozen University of Arizona students were named Fulbright Scholars, a nationally competitive award that funds U.S. students studying or teaching internationally. Of the 15 University students named at the end of June 2010, three received Fulbright awards to study in locations where the organization has not yet sent a UA student: Namibia, in Africa; Trinidad and Tobago; and Tajikistan, located in Central Asia. On average, 12 UA students receive the scholarship each year, said Karna Walter, director of nationally competitive scholarships
Stewa rd Obse r va to r y© DAviD HArveY

6 | The University of Arizona Annual Financial Report
for the UA’s Honors College. At most, 15 scholars have been named at the UA and more than 100 UA students in the last decade have been named scholars in the program, which is sponsored by the U.S. Department of State.
• The University of Arizona is among a small group of institutions nationwide to receive a highly competitive, multi-million dollar federal grant to investigate the effects of highly specialized lasers on the atmosphere. University of Arizona researcher Jerome Moloney is leading a team that is investigating lasers with practical implications, such as generating terahertz waves for use in airport scanners or in creating detection systems that could be used over long distances. Generated by lab-based scientific researchers, multi-terawatt femtosecond laser pulses deliver extreme power densities in incredibly short bursts, creating havoc as they pass through the atmosphere.
• The University of Arizona Pediatric Pulmonary Center has been awarded a five-year, $1.7 million grant by the Maternal and Child Health Bureau of the Health Resources and Services Administration. The funding will enable the center to continue serving as a regional and national resource for training graduate-level students to care for children with chronic pulmonary disorders within the disciplines of medicine, nursing, nutrition, social work and respiratory therapy. The UA Pediatric
Pulmonary Center is one of only six such centers funded in the U.S.
• The University of Arizona had a strong showing in the annual Top 100 Producers of Minority Undergraduate and Graduate Degrees rankings by the educational news magazine Diverse Issues in Higher Education. The magazine generates rankings according to the total number of degrees awarded to minority students across all disciplines as well as in specific disciplines. The UA ranked in the top 10 nationally for producing undergraduates in its biological and biomedical sciences, education and psychology degree programs. Specifically, biological and biomedical sciences ranked 9th and education ranked 10th for producing Hispanic graduates, and psychology ranked 10th for producing Native American graduates. In the category of graduate and professional degrees, the UA twice ranked 2nd highest in the country for producing Native American graduates in the fields of engineering and ethnic, cultural and gender studies.
• As of June 30, 2010, the University of Arizona had received American Recovery and Reinvestment Act (ARRA) awards totaling $102.4 million. The UA submitted more than 500 proposals in response to ARRA funding opportunities. The UA received 153 awards from the proposals that were submitted, a respectable 30% successful awards rate.
Opportunities and ChallengesThe University has been meeting the needs of the people of the State through its strong liberal arts program and nationally acclaimed expertise in business, engineering, and natural and medical sciences. Given continuing increases in population and the potential for economic growth, the State will increasingly face challenges and opportunities in areas as diverse as water resource management, transportation, education, land use planning, technology development and transfer, and the provision of jobs for a growing population. The University has assisted in attracting corporations to the State and, through its faculty and graduates, has stimulated important business enterprises, especially in optics and biotechnology. The latter has unique potential now, based on the University’s strong programs in medicine, agriculture and science, and on rapidly expanding federal funding for biotechnology research.
Adm i n i s t ra t ion Bu i l d i n g a nd K r u t ch Cac t u s Ga rdenBALf WALKer / cHriS MooneY

The University of Arizona Annual Financial Report | 7
Management continues to regard the University as well positioned to continue its sound financial condition and service to students, the research community, citizens of Arizona and our country. Future successes are largely dependent upon cost containment, the ability to recruit and retain the highest quality students, faculty and staff, and ongoing financial and political support from the State government.
The University has been increasing its competitiveness in obtaining sponsored research funds through the expansion of laboratory-oriented facilities and by pursuing organizational and programmatic initiatives (e.g., optics, biotechnology, medicine). The University has been aggressive in applying for ARRA funds from the NIH, NSF and DOE as well as various other federal agencies.
For instructional purposes the University is primarily dependent upon State appropriations and tuition and fees, with gifts providing some additional revenues, primarily for scholarships. The main revenue sources for government services, including public education, are State sales and income taxes. Consequently, as the State economy continues to decline (or the State alters the tax base that supports government services), appropriated funds may increase slowly or be reduced dependent upon the ebb and flow of sales tax revenues. Since resident tuition continues to
be among the lowest of our peer public universities in the nation, there are opportunities to increase tuition, as long as financial aid resources also increase. The Arizona Board of Regents approved a mandatory tuition surcharge in April 2009. The tuition surcharge was an economic recovery surcharge used for University programs and infrastructure most essential to student success. The approved annual amount was $766 and is reflected in the graph showing Arizona resident tuition and fees by year. For non-resident students, the surcharge was $966. This tuition surcharge that was set to expire June 2010 was rolled into the fiscal year 2011 tuition increase. The increase request of $1,050 for Arizona resident students includes the tuition surcharge as does the $2,000 increase for nonresidents. The tuition and fee increases were approved by the Arizona Board of Regents at the April 2010 meeting.
Resident Tuition and Fees FY 2005 - 2011
R u f u s W i l d ca t , 1 928UA LiBrArY, SPeciAL coLLectionS
Private gift contributions are an important supplement to the fundamental support from the State of Arizona and are a significant factor in the growth of academic, research, and medical school units. Economic pressures affecting donors may also affect the future level of support afforded the University from corporate and individual giving.
The State continues to project rapid growth in post-secondary education enrollment over the next several years, and the University is making every effort to meet those needs, while continuing to preserve our standards of excellence and maintaining a leadership position in higher education.
9,000
8,000
7,000
6,000
5,000
4,000
3,000
2,000
1,000
02005 2006 2007 2008 2009 2010 2011
DOLL
ARS
FISCAL YEAR

8 | The University of Arizona Annual Financial Report
Independent Auditors’ Report
8 | The University of Arizona Annual Financial Report

The University of Arizona Annual Financial Report | 9
Independent Auditors’ Report
The University of Arizona Annual Financial Report | 9

10 | The University of Arizona Annual Financial Report
Management’s Discussion and Analysis
The following management’s discussion and analysis (MD&A) provides an overview of the University of Arizona’s financial performance based on currently known facts, decisions and conditions and is designed to assist readers in understanding the accompanying financial statements. These financial statements are prepared in accordance with Governmental Accounting Standards Board (GASB) principles and focus on the University as a whole. The MD&A, financial statements and notes are the responsibility of University management. The MD&A should be read in conjunction with the financial statements and notes.
The financial statements encompass the University and its discretely presented component units; however, the MD&A focuses only on the University. Information relating to the component units can be found in their separately issued financial statements. The University’s financial report includes three basic financial statements: the Statement of Net Assets; the Statement of Revenues, Expenses, and Changes in Net Assets; and the Statement of Cash Flows. While audited financial statements for the 2008-2009 fiscal year are not presented with this report, condensed data will be presented in the MD&A to illustrate certain increases and decreases.
Overview of Financial Statements
Statement of Net AssetsThe Statement of Net Assets presents the financial position of the University at fiscal year end. From the data presented, readers of this statement are able to determine the assets available to continue the operations of the University. They are also able to determine how much the University owes vendors, investors and lending institutions. Finally, the Statement of Net Assets provides a picture of the net assets (assets minus liabilities) and their availability for expenses of the University. The change in net assets is one indicator of whether the financial condition has improved or worsened during the year when considered with nonfinancial facts, such as enrollment levels and the condition of facilities.
Fi r s t sw imm i ng poo l on campu s , 1 9 16UA LiBrArY, SPeciAL coLLectionS
St uden t Rec rea t ion Cen te r poo l

The University of Arizona Annual Financial Report | 11
CONdENSEd SChEdUlE OF ASSETS, liAbiliTiES ANd NET ASSETSA comparison of the University’s assets, liabilities and net assets (in thousands of dollars) at June 30, 2010, and at June 30, 2009, is as follows:
2010 2009 % Change
Other assets $ 931,390 $ 843,677 10%
Capital assets 1,402,259 1,339,428 5%
Total assets $ 2,333,649 $ 2,183,105 7%
Other liabilities $ 139,759 $ 154,427 -9%
Long-term liabilities 1,220,287 1,147,501 6%
Total liabilities $ 1,360,046 $ 1,301,928 4%
Net assets
Invested in capital assets, net of related debt $ 490,309 $ 466,674 5%
Restricted - nonexpendable 101,263 94,307 7%
Restricted - expendable 127,599 140,375 -9%
Unrestricted 254,432 179,821 41%
Total net assets $ 973,603 $ 881,177 10%
Total AssetsAssets are what the University owns and are measured in current value, except for capital assets, which are recorded at historical cost less applicable accumulated depreciation. The following table and chart present total assets by dollars and percent:
Cash and Investments $ 703,483 30.1%
Receivables 205,872 8.9%
Capital Assets being Depreciated 1,163,124 49.8%
Other Assets 261,170 11.2%
Total Assets $ 2,333,649 100.0%
Total assets for the University increased by $150.5 million during the 2009-2010 fiscal year. There was an increase in capital assets of $62.8 million. During the 2009-2010 fiscal year, disbursements of $102.8 million were made for construction to complete buildings, to continue projects in progress and to begin new construction. The other assets increase of $87.7 million resulted from proceeds of a $147.5 million bond issued near fiscal year end.
Cash and Investments 30.1%
Receivables8.9%Capital Assets being
Depreciated49.8%
Other Assets11.2%

12 | The University of Arizona Annual Financial Report
Total liabilitiesLiabilities are what the University owes to others or what it has collected from others before it has provided the services. The following table and chart present total liabilities by dollars and percent:
Payables and Accrued Liabilities $ 113,969 8.4%
Deferred Revenues 76,300 5.6%
Long-Term Debt 1,145,073 84.2%
Other Liabilities 24,704 1.8%
Total Liabilities $ 1,360,046 100.0%
Total liabilities increased by $58.1 million during the 2009-2010 fiscal year. Long-term liabilities increased by $72.8 million due to the issuance of a bond for campus construction projects and other liabilities decreased by $14.7 million primarily due to a decrease in accounts payable.
Total Net AssetsNet assets are divided into three categories. Invested in capital assets, net of related debt, represents the historical cost of capital assets reduced by the balance of related outstanding debt and accumulated depreciation. Restricted net assets include amounts that have been restricted for use by an external party and are further broken down into nonexpendable and expendable. Restricted nonexpendable net assets are those that are required to be retained in perpetuity. Restricted expendable net assets include amounts restricted by external parties for such things as debt service, academic and departmental uses, scholarships and fellowships and capital projects. Finally, unrestricted net assets include amounts institutionally designated or committed to support specific academic and research programs and for working capital requirements. The following chart represents net asset categories by percent:
Unrestricted net assets increased 41.5% over the prior fiscal year from $179.8 million to $254.4 million primarily because of a $24.1 million reimbursement in the 2009-2010 fiscal year for construction expenses incurred in the 2008-2009 fiscal year for the Health Sciences Education building in Phoenix and an increase of $31.6 million in summer session revenue, program fees and locally retained fees offset by increased scholarship expenses.
Mei nel Op t i c s Bu i l d i n gBALf WALKer / cHriS MooneY
Long-Term Debt84.2%
Other Liabilities1.8%
Payables and Accrued Liabilities
8.4%
Deferred Revenues
5.6%
Unrestricted26.1%
Invested in capital assets, net of related debt
50.4%
Restricted23.5%

The University of Arizona Annual Financial Report | 13
CONdENSEd SChEdUlE OF REVENUES, EXPENSES ANd ChANGES iN NET ASSETSA comparison of the University’s operations (in thousands of dollars) for the year ended June 30, 2010, and for the year ended June 30, 2009, is as follows: 2010 2009 % Change
Total revenues Student tuition and fees $ 329,586 $ 269,447 22% Grants, contracts and other appropriations 538,081 526,965 2% State appropriations 330,297 348,941 -5% Auxiliary enterprises 165,594 154,698 7% Share of State sales tax revenues 20,102 22,547 -11% Gifts 79,164 78,156 1% Investment income 18,133 (19,749) 192% Other operating revenues 38,677 40,292 -4% Other nonoperating revenues, net 16,063 10,175 58%
Total revenues $ 1,535,697 $ 1,431,472 7% Total expenses Instruction and academic support $ 458,331 $ 462,941 -1% Research and public service 465,378 455,310 2% Student services and scholarships 82,924 74,896 11% Institutional support and operation of plant 169,422 168,375 1% Auxiliary enterprises 144,096 144,707 0% Depreciation 101,226 99,657 2% Interest expense on debt 45,077 40,887 10%
Total expenses $ 1,466,454 $ 1,446,773 1% Income before capital and endowment additions $ 69,243 $ (15,301) 553% Capital and endowment additions 23,183 25,116 -8%
Increase in net assets $ 92,426 $ 9,815 842%
Net assets, beginning of year 881,177 871,362 1% Net assets, end of year $ 973,603 $ 881,177 10%
Statement of Revenues, Expenses and Changes in Net Assets The Statement of Revenues, Expenses and Changes in Net Assets presents the University’s revenues earned and the expenses incurred during the 2009-2010 fiscal year, regardless of when cash is received or paid. Activities are reported as either operating or nonoperating. Generally, operating revenues are earned in exchange for providing goods and services. Operating expenses are incurred in the normal operation of the University, including a provision for depreciation on capital assets. Certain revenue sources that the University relies on for operations, including State appropriations, gifts and investment income are required by GASB Statement No. 35 to be classified as nonoperating revenues. Nonoperating expenses include capital financing costs.

14 | The University of Arizona Annual Financial Report
Total RevenuesThe following chart represents total revenues for the 2009-2010 fiscal year:
Grants, contracts and other appropriations: Operating grants, contracts and appropriations revenues increased by $32.5 million or 8.2% in fiscal year 2010. Revenues vary from year to year for many reasons, including the availability of funding from sponsors and the commencement or closure of particularly large projects. The availability of competitive American Recovery and Reinvestment Act (ARRA) funds and the University’s ability to garner funding contributed greatly to the increase in grants and contracts operating activity. Non-exchange grants and appropriations, reported as nonoperating revenues, decreased $21.4 million from $131.4 million in fiscal year 2009 to $110.0 million in fiscal year 2010, a decrease of 16.3%, primarily due to a reduction in Federal Fiscal Stabilization Funds received under ARRA.
State appropriations and share of state sales tax revenues: Appropriations, including the University’s share of state sales taxes, decreased from $371.5 million to $350.4 million, a decrease of $21.1 million over the prior fiscal year. The decrease of 5.3% in state appropriations and 10.8% in sales tax revenues is related to the national recession and decreased sales tax revenues for the State.
Auxiliary Enterprises: Revenues from auxiliary enterprises increased 7.0% from $154.7 million in fiscal year 2009 to $165.6 million in fiscal year 2010 primarily due to increases in intercollegiate athletics and residence life revenues.
Investment income: A summary of investment income (in thousands of dollars) for the years ended June 30, 2010 and 2009 follows:
2010 2009 % Change
Pooled operating funds $ 6,804 $ 14,486 -53.0%
Deposits with trustees for capital projects 3,692 1,438 156.7%
Endowments 7,637 (35,673) 121.4%
Total investment income $ 18,133 $ (19,749) 191.8%
Pooled operating funds are invested in short-term instruments. The net decrease in pooled operating funds investment income is attributable to the declining interest rate environment during fiscal year 2010. Due to the fact that deposits with trustees for capital projects are invested in short-term debt instruments, interest is dependent upon the current interest rate environment and the amount available to be invested. Participation in public markets through externally managed funds generated net gains in the Endowment Growth and Income Pool during fiscal year 2010 due to an overall increase in both debt and equity markets.
Student tuition and fees: Tuition and fees rose by $60.1 million due to approved tuition and fee increases. In-state undergraduate resident tuition and fees increased by $1,300, or 23.5%, to $6,842, while out-of-state undergraduate tuition and fees increased by $3,575, or 19.1%, to $22,251.
Total Revenues (in thousands)
Grants, Contracts
and Gifts
State Appropriations
Tuition and Fees
Auxiliary EnterprisesOther
Share of State
Sales Tax
Investment Income
$700,000
$600,000
$500,000
$400,000
$300,000
$200,000
$100,000
$0
617,245
330,297
165,594
54,740 20,102
329,586
18,133

The University of Arizona Annual Financial Report | 15
Total ExpensesThe following chart represents total expenses for the 2009-2010 fiscal year:
Total Expenses (in thousands)
Total expenses increased by $19.7 million or 1.4% in fiscal year 2010. Expenses for research increased by $9.5 million compared to last fiscal year, due in part to the availability of ARRA funding. Scholarships and fellowships increased by $8.6 million as the University set aside additional amounts to offset tuition increases to maintain institutional accessibility. Interest expense on debt increased by $4.2 million or 10.3% from $40.9 million in fiscal year 2009 to $45.1 million in fiscal year 2010 due to issuance of new debt in May 2009.
Operating Expenses by Natural Classification (in thousands)In addition to programmatic (functional) classification of operating expenses, a summary of the University’s expenses by natural classification as listed in Note 11 for the years ended June 30, 2010 and 2009 follows:
Natural Classification of Operating Expenses: 2010 2009 % Change
Personal services and benefits $ 912,764 $ 921,237 -1%
Supplies and services 355,865 342,847 4%
Scholarships and fellowships 51,522 42,145 22%
Depreciation 101,226 99,657 2%
Total Operating Expenses $ 1,421,377 $ 1,405,886 1%
Personal services and benefits64%
Depreciation7%Scholarships and fellowships
4%
Supplies and services25%
Student Services
Interest
Scholarships and Fellowships
Public Service
Institutional Support
Operation and Maintenance of Plant
Academic Support
Depreciation
Auxiliary Enterprises
Instruction
Research
27,608
45,077
55,316
70,370
83,080
86,342
100,415
101,226
144,096
357,916 395,008
$0 $100,000 $200,000 $300,000 $400,000 $500,000

16 | The University of Arizona Annual Financial Report
Capital and Debt Analysis
The University’s major capital projects completed in fiscal year 2010 were mainly related to student services and building renewal and deferred maintenance to address life and safety issues. To enhance the life experience and to meet the diverse recreational, fitness and wellness needs of the students and the campus community, the University expanded the Student Recreation Center by approximately 55,000 gross square feet to provide state-of-the-art fitness and recreation equipment, outdoor equipment and resource center, and sport facilities. The main section of the facility was renovated to provide new spaces for a lobby/lounge, a fitness apparel and accessory retail area, a computer lab, and a food and beverage cafeteria. The expanded and renovated facility alleviates overcrowding and provides a much more rewarding experience to the students and staff. The Student Recreation Center Expansion Project and the renovation project were constructed at a cost of $30.6 million. As the State economy was slow to recover these past several years, the University partnered with the State of Arizona and implemented the Stimulus Plan for Economic and Education Development (SPEED) initiative which provided an important economic stimulus to the State economy through construction spending. The construction projects the University included in this initiative were to
Condensed Statement of Cash Flows The following summarizes cash flows for the 2010 and 2009 fiscal years (in thousands):
Cash Provided By (Used For): 2010 2009
Operating Activities $ (385,905) $ (414,248)
Noncapital Financing Activities 559,649 478,658
Capital Financing Activities (102,838) 25,049
Investing Activities (41,515) (96,629)
Net Increase (Decrease) in Cash and Cash Equivalents 29,391 (7,170)
Cash and Cash Equivalents, Beginning of Year 169,070 176,240
Cash and Cash Equivalents, End of Year $ 198,461 $ 169,070
The statement of cash flows provides additional information about the University’s financial results by reporting the major sources and uses of cash and cash equivalents. This statement assists in evaluating the University’s ability to generate net cash flows, its ability to meet its financial obligations as they come due and its need for external financing. Cash flows from operating activities show the net cash used by the operating activities of the University. Cash flows from capital financing activities include all plant funds and related long-term debt activities. Cash flows from investing activities show all the uses of cash and cash equivalents to purchase investments, and all the increases in cash and cash equivalents as a result of selling investments or earning income on cash and investments. Finally cash flows from the noncapital financing activities include State appropriations, donations and other activities not covered in other sections.
expand the medical college campus in the City of Phoenix, to provide new construction on campus, and to address urgently needed life and safety related improvement projects for existing buildings and facilities. Under this partnership, the State will allocate lottery revenue funds up to 80% and the University will provide funding of at least 20% to fund the annual debt service on these project financings. The College of Medicine expansion in Phoenix is in progress with construction of the new Health Science Education Building. This project started in fiscal year 2010, and will cost $157.2 million when complete. The University compiled a list of critical building renewal and deferred maintenance projects totaling $68 million for the SPEED initiative. As of June 30, 2010, the University has expended $10.5 million in projects for fire alarm and fire sprinkler systems, electrical code upgrades, elevator and code compliance upgrades, roofing repairs and other building component repairs. The University also completed construction of a new Hazardous Waste Facility with 6,556 gross square feet to store and secure chemical waste generated by lab activities. This project was completed at a cost of $2.8 million. Other major projects currently under construction are the Sixth Street Residence Halls, Residence Life Building Renewal Phases III and IV, and Bryant Bannister Tree Ring Building.

The University of Arizona Annual Financial Report | 17
The University manages its buildings and infrastructure capital through a comprehensive Capital Improvement Plan (CIP) as required by Arizona Revised Statutes §41-793 and Arizona Board of Regents (ABOR) policy 7-106. The CIP presents the University’s strategic plan on capital acquisitions to meet short-term and long-term space requirements. It outlines the University’s current capital funding allocations; building renewal and deferred maintenance funding requirements; offices and facilities leases; building inventory; status of current construction projects; capital planning for a three-year period to address deficiencies in academic, research and support service space; management of building renewal and deferred maintenance projects; and expansion of student dormitory and parking capacities. The CIP also provides current debt information and demonstrates the University’s ability to issue debt instruments to finance capital acquisitions.
The University generally finances capital improvements and acquisitions through the issuance of System Revenue Bonds (SRBs), Build America Bonds (BABs) and Certificates of Participation (COPs). Prior to issuing any Bonds or COPs, the University must submit a financing and funding plan for approval by the Arizona Board of Regents and for review by the State Joint Committee on Capital Review. The amount of debt the University is able to issue is limited by State law (Arizona Revised Statutes §15-1683) and ABOR policy 7-102(D)(3) using a debt ratio limit. The debt ratio limit established by State law and ABOR policy is 8% (total Bonds and COPs debt service to total operating expenses and debt service). At June 30, 2010 the University’s debt ratio was 5.8%. The University’s credit ratings on System Revenue Bonds are Aa2 by Moody’s and AA by Standard and Poor’s.
During fiscal year 2009-10, the University issued SPEED Revenue Bonds Taxable Series 2010 Build America Bonds (BABs) for $147.5 million, a taxable bond with federal government interest subsidy enacted by Congress under the American Recovery and Reinvestment Act to stimulate the U.S. economy. The Series 2010 Bonds were issued to finance the Health Science Education Building and building renewal projects. Detailed debt issuance and debt service information is available in Note 8 of the accompanying notes to the financial statements.
Economic Outlook
The State of Arizona continues to experience weak economic conditions, which resulted in a negative effect on the State’s revenue projections and ultimately forced a budget reduction for the University of Arizona ($18.6 million) during FY 2010. The budget reductions would have been significantly higher for the University had the Maintenance of Effort (MOE) requirement of the Federal Fiscal Stabilization Funds received by the University not forced the State to maintain State appropriations at the 2006 fiscal year levels. Through the efforts of the Governor, a temporary three year one cent sales tax increase was placed on the May 2010 ballot. The citizens of the State of Arizona responded with a resounding approval of the ballot initiative thereby preventing significant cuts to the 2011 fiscal year budget. However, if the national economy continues to sputter, it is anticipated that State revenues will continue to decline as well in FY 2011, thereby possibly forcing mid-year budget rescissions.
The University of Arizona continuously evaluates programmatic and institutional changes necessary to serve as a center for advanced graduate and professional studies while emphasizing research and providing excellence in undergraduate programs. University management has been diligently working to develop long- and short-term strategic plans to address these programmatic and institutional changes and other challenges to the financial health of the institution. At the same time, the Arizona Board of Regents and the three State universities are actively evaluating creative solutions to contain costs and generate new revenues in order to continue providing quality and affordable education.
The University requested and received approval from the Arizona Board of Regents to increase tuition for the 2011 fiscal year. Due to increased financial needs to attract and retain talented faculty and staff, maintain existing facilities and provide a world-class education, it is the intention of management to continue requests to benchmark main campus tuition and fees to the median of the University’s approved peers and to offer differentiated, lower tuition options at UA South and other UA learning centers.
Since the University is ultimately subject to the same economic variables that affect other financial entities, it is not possible to predict future outcomes. Management is well aware of the challenges ahead and is working diligently to continue to provide quality instruction, research and public service to the State of Arizona and the nation.
18 | The University of Arizona Annual Financial Report
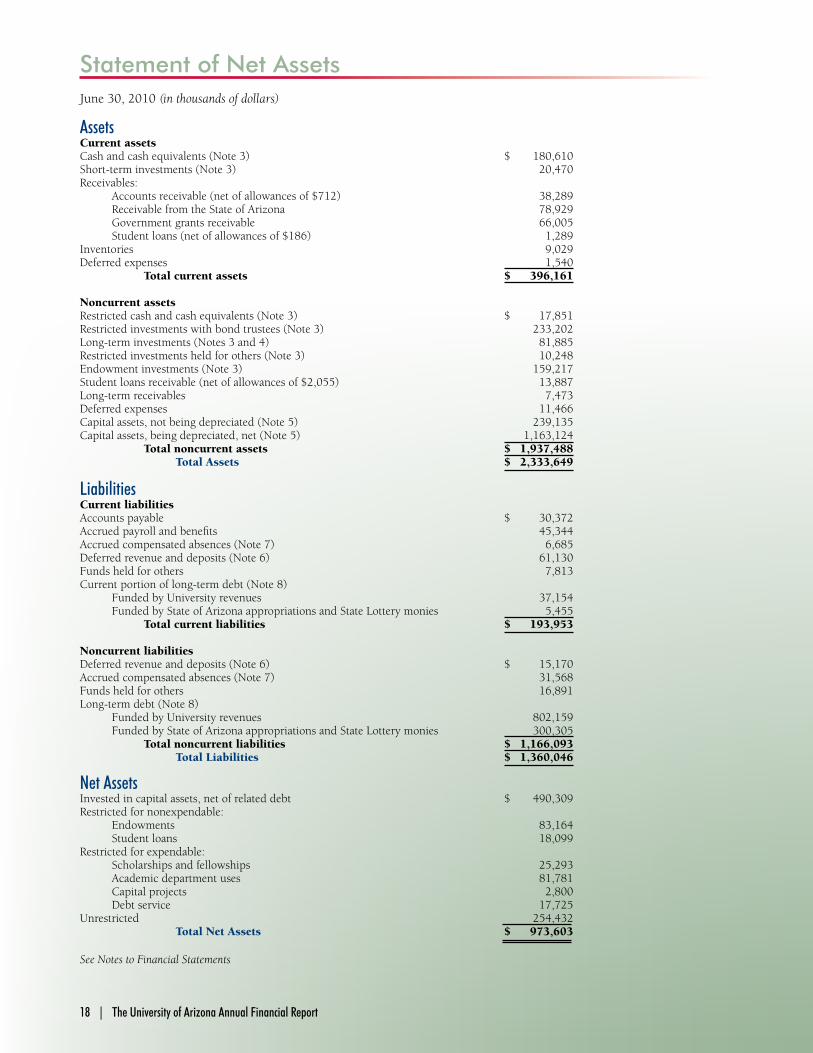
Statement of Net Assets June 30, 2010 (in thousands of dollars)
Assets Current assets Cash and cash equivalents (Note 3) $ 180,610 Short-term investments (Note 3) 20,470 Receivables: Accounts receivable (net of allowances of $712) 38,289 Receivable from the State of Arizona 78,929 Government grants receivable 66,005 Student loans (net of allowances of $186) 1,289 Inventories 9,029 Deferred expenses 1,540 Total current assets $ 396,161 Noncurrent assets Restricted cash and cash equivalents (Note 3) $ 17,851 Restricted investments with bond trustees (Note 3) 233,202 Long-term investments (Notes 3 and 4) 81,885 Restricted investments held for others (Note 3) 10,248 Endowment investments (Note 3) 159,217 Student loans receivable (net of allowances of $2,055) 13,887 Long-term receivables 7,473 Deferred expenses 11,466 Capital assets, not being depreciated (Note 5) 239,135 Capital assets, being depreciated, net (Note 5) 1,163,124 Total noncurrent assets $ 1,937,488 Total Assets $ 2,333,649
liabilities Current liabilities Accounts payable $ 30,372 Accrued payroll and benefits 45,344 Accrued compensated absences (Note 7) 6,685 Deferred revenue and deposits (Note 6) 61,130 Funds held for others 7,813 Current portion of long-term debt (Note 8) Funded by University revenues 37,154 Funded by State of Arizona appropriations and State Lottery monies 5,455 Total current liabilities $ 193,953 Noncurrent liabilities Deferred revenue and deposits (Note 6) $ 15,170 Accrued compensated absences (Note 7) 31,568 Funds held for others 16,891 Long-term debt (Note 8) Funded by University revenues 802,159 Funded by State of Arizona appropriations and State Lottery monies 300,305 Total noncurrent liabilities $ 1,166,093 Total Liabilities $ 1,360,046 Net Assets Invested in capital assets, net of related debt $ 490,309 Restricted for nonexpendable: Endowments 83,164 Student loans 18,099 Restricted for expendable: Scholarships and fellowships 25,293 Academic department uses 81,781 Capital projects 2,800 Debt service 17,725 Unrestricted 254,432 Total Net Assets $ 973,603 See Notes to Financial Statements
18 | The University of Arizona Annual Financial Report

The University of Arizona Annual Financial Report | 19
Statement of Financial Position - Component Units June 30, 2010 (in thousands of dollars)
Assets Cash and cash equivalents $ 46,346 Pledges receivable 42,015 Other receivables 3,890 Investments in marketable securities 386,524 Other investments 6,770 Property and equipment, net 26,616 Other assets 7,232 Total Assets $ 519,393 liabilities and Net Assets Liabilities Accounts payable and accrued expenses $ 6,052 Annuities payable and other trust liabilities 16,134 Deferred revenue and deposits 5,045 Short-term and long-term debt 9,374 Other liabilities 948 Total Liabilities $ 37,553 Net Assets Unrestricted $ 28,178 Temporarily restricted 138,133 Permanently restricted 315,529 Total Net Assets $ 481,840 Total Liabilities and Net Assets $ 519,393 See Notes to Financial Statements
The University of Arizona Annual Financial Report | 19

20 | The University of Arizona Annual Financial Report
Statement of Revenues, Expenses and Changes in Net Assets Year Ended June 30, 2010 (in thousands of dollars)
Operating Revenues Student tuition and fees, net of scholarship allowances of $139,500 $ 329,586 Federal grants and contracts 324,919 State and other government grants and contracts 28,737 Nongovernment grants and contracts 74,447 Sales and services of educational departments 28,873 Auxiliary enterprises, net of scholarship allowances of $5,526 165,594 Other operating revenues 9,804 Total operating revenues $ 961,960 Operating Expenses Educational and general Instruction $ 357,916 Research 395,008 Public service 70,370 Academic support 100,415 Student services 27,608 Institutional support 83,080 Operation and maintenance of plant 86,342 Scholarships and fellowships 55,316 Auxiliary enterprises 144,096 Depreciation (Note 5) 101,226 Total operating expenses $ 1,421,377 Operating Loss $ (459,417) Nonoperating Revenues (Expenses) State appropriations $ 330,297 Share of State sales tax revenues 20,102 Federal grants and appropriations 74,308 Federal fiscal stabilization funds 28,313 State and other government grants 3,415 Nongovernment grants 3,942 Gifts 79,164 Investment income 18,133 Interest expense on debt (45,077)Other nonoperating revenues, net 16,063 Net nonoperating revenues $ 528,660 Income before Capital and Endowment Additions $ 69,243 Capital grants, gifts and conveyances $ 7,080 Capital appropriations - Research Infrastructure Capital Financing 14,253 Additions to permanent endowments 1,850 Total capital and endowment additions $ 23,183 Increase in Net Assets $ 92,426 Net Assets Net Assets - Beginning of year 881,177 Net Assets - End of year $ 973,603
See Notes to Financial Statements
20 | The University of Arizona Annual Financial Report

The University of Arizona Annual Financial Report | 21
Statement of Activities – Component UnitsYear Ended June 30, 2010 (in thousands of dollars)
Temporarily Permanently
Unrestricted Restricted Restricted Total
Revenues
Sales and services $ 955 $ 955
Contributions 838 $ 31,774 $ 18,086 50,698
Rental revenues 12,393 12,393
Investment income 4,732 5,187 24,384 34,303
Net assets released from restriction 55,685 (43,645) (12,040)
Other income 8,819 3,944 130 12,893
Total revenues $ 83,422 $ (2,740) $ 30,560 $ 111,242
Expenses
Program services:
Leasing related expenses $ 8,651 $ 8,651
Payments to the University 41,672 41,672
Payments on behalf of the University 18,440 18,440
Supporting services:
Management and general 6,244 6,244
Fund raising 5,758 5,758
Other expenses $ 7 $ 6 13
Total expenses $ 80,765 $ 7 $ 6 $ 80,778
Increase/(decrease) in Net Assets $ 2,657 $ (2,747) $ 30,554 $ 30,464
Net Assets - Beginning of year 25,095 141,096 285,185 451,376
Transfers 175 35 (210)
Reclassification of funds with deficiencies 251 (251)
Net Assets - End of year $ 28,178 $ 138,133 $ 315,529 $ 481,840
See Notes to Financial Statements
The University of Arizona Annual Financial Report | 21
Chem i s t r y Bu i l d i n gBALf WALKer / cHriS MooneY

22 | The University of Arizona Annual Financial Report
Statement of Cash FlowsYear Ended June 30, 2010 (in thousands of dollars) Cash Flows from Operating Activities Tuition and fees $ 328,304 Grants and contracts 411,721 Payments for salaries, wages and benefits (908,985)Payments to suppliers (367,926)Payments for scholarships and fellowships (51,522)Loans issued to students (4,148)Collections on loans to students 2,785 Auxiliary enterprise receipts 165,613 Sales and services of educational departments 28,464 Other receipts 9,789 Net cash used for operating activities $ (385,905) Cash Flows from Noncapital Financing Activities State appropriations $ 294,548 Share of State sales tax receipts 20,015 Gifts and grants for other than capital purposes 163,038 Federal fiscal stabilization funds 89,137 Other nonoperating receipts 9,290 Federal Family Education Loans received 172,845 Federal Family Education Loans disbursed (173,110)Funds held for others received 108,674 Funds held for others disbursed (124,788) Net cash provided by noncapital financing activities $ 559,649 Cash Flows from Capital Financing Activities Proceeds from issuance of capital debt $ 146,044 Capital grants, gifts and appropriations received 20,711 Proceeds from sale of capital assets 344 Purchase of capital assets (172,299)Principal paid on capital debt and leases (52,046)Interest paid on capital debt and leases (45,592) Net cash used for capital financing activities $ (102,838) Cash Flows from investing Activities Proceeds from sales and maturities of investments $ 126,519 Interest and dividends on investments 9,678 Purchase of investments (177,712) Net cash used for investing activities $ (41,515) Net increase in Cash and Cash Equivalents $ 29,391 Cash and Cash Equivalents Cash and Cash Equivalents - Beginning of year 169,070 Cash and Cash Equivalents - End of year $ 198,461
See Notes to Financial Statements
22 | The University of Arizona Annual Financial Report

The University of Arizona Annual Financial Report | 23The University of Arizona Annual Financial Report | 23
Statement of Cash FlowsYear Ended June 30, 2010 (in thousands of dollars)
Reconciliation of Operating loss to Net Cash Used for Operating Activities Operating loss $ (459,417)Adjustments to reconcile operating loss to net cash used for operating activities: Depreciation expense 101,226 Changes in assets and liabilities: Receivables, net (16,472) Inventories (423) Deferred expenses (339) Accounts payable (11,354) Accrued payroll and benefits and compensated absences 3,777 Deferred revenue and deposits (2,903) Net Cash Used for Operating Activities $ (385,905) Significant Noncash Transactions Gifts and conveyances of capital assets $ 1,165 Change in fair value of investments 8,466 Amortization of bond discount and issuance costs (2,346)Amortization of bond premium 1,728 Amortization of deferred costs of refundings 1,497Net loss on disposal of capital assets with an original cost of $14,964, accumulated depreciation of $12,344 and cash proceeds of $344 (2,276)Amortization of IBM deferred rent 4,900
See Notes to Financial Statements
Med i ca l Resea r ch Bu i l d i n gBALf WALKer / cHriS MooneY

24 | The University of Arizona Annual Financial Report
NOTES TO FINANCIAL STATEMENTS
NOTE 1. bASiS OF PRESENTATiON & SUMMARY OF SiGNiFiCANT ACCOUNTiNG POliCiESbasis of PresentationThe accompanying financial statements include all activities that are directly controlled by the University. In addition, the financial statements include the financial position and activities of the University’s discretely presented component units as described in Notes 2 and 13. Fiscal responsibility for the University remains with the State of Arizona; therefore, the University is considered part of the State’s reporting entity for financial reporting purposes.
The financial statements are presented in accordance with U.S. generally accepted accounting principles (GAAP) applicable to governmental colleges and universities engaged in business-type activities as adopted by the Governmental Accounting Standards Board (GASB). The University follows Financial Accounting Standards Board (FASB) Statements and Interpretations issued on or before November 30, 1989, Accounting Principles Board Opinions, and Accounting Research Bulletins, unless those pronouncements conflict with GASB pronouncements. The University has chosen the option not to follow FASB Statements and Interpretations issued after November 30, 1989.
The component units are legally separate, private, nonprofit organizations that report under FASB standards. As such, certain revenue recognition criteria and presentation features are different from GASB revenue recognition criteria and presentation features. No modifications have been made to the component units’ financial information included in the University’s financial report. Accordingly, those financial statements have been reported on separate pages following the respective counterpart financial statements of the University.
For the year ended June 30, 2010, the University implemented the provisions of GASB Statement No. 51, Accounting and Financial Reporting for Intangible Assets, and No. 53, Accounting and Financial Reporting for Derivative Instruments. GASB Statement No. 51 establishes standards for accounting and financial reporting for intangible assets for all state and local governments. GASB Statement No. 53 establishes accounting and financial reporting standards for all state and local governments that enter into derivative instruments. The implementation of GASB Statement No. 53 had no effect on
fiscal year 2010 financial statement amounts and therefore no additional note disclosures were required.
The financial statements include a Statement of Net Assets; a Statement of Revenues, Expenses and Changes in Net Assets; and a Statement of Cash Flows.
• The Statement of Net Assets provides information about the assets, liabilities, and net assets of the University at June 30. Assets and liabilities are classified as either current or noncurrent. Current liabilities are obligations that will be paid within one year of the statement date, and current assets are those resources available to satisfy current liabilities. Net assets are the residual amounts and are classified according to external donor restrictions and availability of assets to satisfy University obligations. Invested in capital assets, net of related debt, represents capital assets less accumulated depreciation and the amount of related outstanding debt for those assets. Nonexpendable restricted net assets are gifts received for endowment purposes and revolving student loan funds, the corpus of which cannot be expended. Expendable restricted net assets represent grants, contracts, gifts, and other resources that have been externally restricted for specific purposes. Unrestricted net assets include all other net assets, including those that have been designated by management to be used for other than general operating purposes.
• The Statement of Revenues, Expenses and Changes in Net Assets provides information about the University’s financial activities during the year. Revenues and expenses are classified as either operating or nonoperating, and all changes in net assets are reported, including capital contributions and additions to endowments. Operating revenues and expenses are those that generally result from exchange transactions. Accordingly, revenues such as tuition and fees, sales and services of auxiliary enterprises and most government and nongovernment research grants and contracts are considered operating. Certain significant revenue streams relied upon for operations are recorded as nonoperating revenues, as defined by GASB Statement No. 35, including state appropriations, nonexchange grants, gifts and investment income. Operating expenses include the cost of sales and services, administrative expenses, and depreciation of capital assets. Other expenses, such as interest expense on debt, are considered to be nonoperating expenses.

The University of Arizona Annual Financial Report | 25
• The Statement of Cash Flows provides information about the University’s sources and uses of cash and cash equivalents during the year. Increases and decreases in cash and cash equivalents are classified as operating, noncapital financing, capital financing, or investing activities.
The financial statements have been prepared using the economic resources measurement focus and the accrual basis of accounting. Revenues are recorded when earned and expenses are recorded at the same time liabilities are incurred, regardless of when the related cash flows take place. State appropriations are recognized as revenue in the year in which the appropriation is first made available for use. Grants and donations are recognized as revenue as soon as all eligibility requirements imposed by the provider have been met. The University eliminates all internal activity.
Significant Accounting Policies The methods of applying GAAP that materially affect financial presentation are summarized below:
Cash and Investments• Cash equivalents include all highly liquid investments
with an original maturity of 90 days or less.
• Investments are stated at fair value at June 30. Fair value typically is the quoted market price for securities.
• Investment income includes interest and dividend earnings and changes in fair value of investments during the fiscal year from the investment of endowment, operating and trustee funds.
Endowment Spending Rate Policy – Arizona State law permits the University to expend the entire net appreciation of endowment fund investments. When determining the spending rate for endowment funds, the Investment Committee and University administration consider long- and short-term needs, total investment return and price level trends, and general economic conditions. For fiscal year 2010, the expendable rate was established at 4% of the three- year average market value ending December 31, 2008. Donor restricted endowments that are available for expenditure are reported as restricted and expendable on the Statement of Net Assets.
Inventories – Inventories consist primarily of bookstore items and resale supplies. They are stated at the lower of cost (determined by the first-in, first-out or the weighted average method) or market.
Capital Assets, Special Collections and Historical Treasures• Capital assets are reported at actual cost or, if donated, at
fair market value at date received.
• The University maintains special collections and historical treasures for educational purposes and public exhibition. These special collections include Kress, Pfiefer, and Gallagher artwork, Ansel Adams, Richard Avedon, and Edward Westin photography collections, American Indians of the Southwest archeological collection, pottery whole vessel collection, and several medical and law book collections. They are not subject to disposal for financial gain or encumbrance. Accordingly, such collections are not capitalized for financial statement purposes but are inventoried for property control purposes.
V i l l a del P uen te Hal lcoUrteSY of cLArK B. LoHr
Dorm i to r y room , 1 9 7 8

26 | The University of Arizona Annual Financial Report
• Interest incurred during the construction phase of projects is capitalized, net of interest earned on the invested proceeds over the same period.
• Capital assets, other than land, construction in progress and intangible assets with indefinite useful lives, are depreciated over their estimated useful lives using the straight line method. The capitalization thresholds and estimated useful lives for capital assets of the University are as follows:
Asset CategoryCapitalization Threshold ($)
Estimated Useful
Life (yrs)
Infrastructure 100,000 20 - 100
Buildings and improvements 100,000 20 - 50
Equipment: Various equipment, 5,000 - 100,000 3 - 25machinery, vehicles and other
Intangible assets, computer 10,000,000 10 software $10 million
Intangible assets, computer 1,000,000 5 software < $10 million
Library materials 1 10
Land 1 n/a
Construction in progress 100,000 n/a
Scholarship Allowances – A scholarship allowance is the difference between the stated charge for tuition and fees and the amount paid by the student or third parties making payments on behalf of the student. Accordingly, some types of student financial aid such as fee waivers, Pell grants, and scholarship awards are considered to be scholarship allowances if used to pay tuition and residence fees. These allowances are netted against tuition and auxiliary revenues in the Statement of Revenues, Expenses and Changes in Net Assets.
Restricted and Unrestricted Resources – The University has both restricted and unrestricted resources available for most programs. Restricted resources are externally restricted for a specific purpose and primarily include sponsored research grants and contracts and gifts. The University’s policy regarding whether to first apply restricted or unrestricted resources is made on a case-by-case basis. Restricted resources remain classified as such until spent.
NOTE 2. COMPONENT UNiTS The financial statements of the University include the operations of The University of Arizona Foundation, Inc., The University of Arizona Alumni Association, the Law College Association of the University of Arizona and the Campus Research Corporation, all discretely presented component units. For financial reporting purposes, only the statement of financial position and statement of activities are included in the University’s financial statements as required by U.S. generally accepted accounting principles for public colleges and universities. Discretely presented component units are reported on separate pages following the University’s respective counterpart financial statements because those component unit financial statements are prepared in accordance with non-governmental U.S. generally accepted accounting principles (i.e., FASB). Each discretely presented component unit discussed below has a June 30 year-end with the exception of the Law College Association of the University of Arizona, which has a May 31 year-end.
Component units can be defined as legally separate entities for which the University is considered to be financially accountable. GASB Statement No. 14 - The Financial Reporting Entity has set forth criteria to be considered in determining financial accountability. These criteria include appointing a voting majority of an organization’s governing body and (1) the ability of the University to impose its will on that organization; or (2) the potential for the organization to provide specific financial benefits to, or impose specific financial burdens on, the University. GASB Statement No. 39 - Determining Whether Certain Organizations Are Component Units provides additional criteria for determining whether certain organizations are component units. Organizations that are legally separate, tax-exempt entities and that meet all of the following criteria should also be considered component units, with discrete presentation. These criteria are (1) the economic resources received or held by the separate organization are entirely or almost entirely for the direct benefit of the University, its component units, or its constituents; (2) the University or its component units, is entitled to, or has the ability to otherwise access, a majority of the economic resources received or held by the separate organization; and (3) the economic resources received or held by an individual organization that the University, or its component units, is entitled to, or has the ability to otherwise access, are significant to the University.

The University of Arizona Annual Financial Report | 27
discretely Presented Component UnitsThe University of Arizona Foundation, Inc. (Foundation) is a legally separate, nonprofit, tax-exempt organization controlled by a separate Board of Directors. The principal goals of the Foundation are to support the University through various fund-raising activities, and to contribute funds to the University in support of various programs. Although the University does not control the timing or amount of receipts from the Foundation, the Foundation’s restricted resources are significant to the University and can only be used by, or for the benefit of, the University or its constituents. As the University is also entitled to these resources, the Foundation is considered a component unit of the University and is discretely presented in the University’s financial statements. The Foundation’s financial statements are not publicly available. For information regarding the Foundation’s financial statements, contact The University of Arizona Comptroller at the following address: The University of Arizona, Financial Services, P.O. Box 3310, Tucson, Arizona 85722-3310.
The University of Arizona Alumni Association (Alumni As-sociation) is a legally separate, tax-exempt, nonprofit cor-poration governed by a separate Board of Directors and was established to serve the University and its graduates, former students, and friends by attracting, organizing and encourag-ing them to advance the University’s missions – teaching, re-search, and public service. There is an Administrative Service Agreement between the Alumni Association and the Univer-sity whereby the University provides staff, facilities and ser-vices to the Alumni Association and the Alumni Association agrees to provide an organizational framework for volunteer service and other activities to benefit and promote the Uni-versity. As the economic resources held by the Alumni As-sociation are significant to the University and are entirely or
almost entirely for the direct benefit of the University, and as the University is entitled to a majority of the economic re-sources received or held by the Alumni Association, it is con-sidered a component unit of the University and is discretely presented in the University’s financial statements. Complete copies of the financial statements of the aforementioned com-ponent unit can be obtained by contacting the Alumni As-sociation at the following address: Alumni Association, The University of Arizona, P.O. Box 210109, Tucson, Arizona 85721-0109.
The Law College Association of the University of Arizona (Law Association) is a legally separate, tax-exempt, nonprofit cor-poration governed by a separate Board of Directors and was established to provide support and financial assistance to the College of Law at the University of Arizona. The Law Asso-ciation funds provide support to the College on many levels, from endowed student scholarships to named faculty pro-fessorships. The funds also provide support for various aca-demic programs. As the economic resources held by the Law Association are significant to the University and are entirely or almost entirely for the direct benefit of the University, and as the University is entitled to a majority of the economic resources received or held by the Law Association, it is con-sidered a component unit of the University and is discretely presented in the University’s financial statements. Complete copies of the financial statements of the aforementioned component unit can be obtained by contacting the Law As-sociation at the following address: Law College Association, The University of Arizona, P.O. Box 210176, Tucson, Arizona 85721-0176.
Campus Research Corporation (CRC) is a legally separate, tax-exempt, nonprofit corporation governed by a separate Board of Directors and was established to assist the University in the acquisition, improvement, and operation of the UA Science and Technology Park (Park) and related properties. CRC currently leases from the University the remaining 67% of building space of the Park not leased to the Arizona Research Park Authority. CRC is responsible for assisting in the development of the presently undeveloped portions of the Park and for subleasing unoccupied space, newly developed space, and space now occupied by IBM or its subtenants once the current subleases expire. The University is responsible for payment of the operational expenses associated with the space occupied by University departments, offices, and programs. All income received by CRC from its activities, after payment of expenses and financial reserves, will be distributed to the University. During fiscal year 2010, a distribution of $200,000 was made to the University. As the University approves CRC’s budget, fiscal dependency exists between the entities, making CRC a component unit. Cla s s room , 1 8 9 9
UA LiBrArY, SPeciAL coLLectionS

28 | The University of Arizona Annual Financial Report
As CRC provides services to all tenants of the Park, not just the University, by acting as the property management company, CRC is presented as a discrete component unit in the University’s financial statements. Complete copies of the financial statements of the aforementioned component unit can be obtained by contacting the Chief Financial Officer at the following address: The University of Arizona Science and Technology Park, 9030 South Rita Road, Suite 302, Tucson, Arizona 85747.
NOTE 3. dEPOSiTS & iNVESTMENTSA. GeneralAt year end, the University’s deposits and investments had a fair value of $703,483,000. The required disclosures are included in sections B and C of this footnote.
Included in the University’s deposits and investments are capital project funds totaling $268,897,000 which are held in trust by a commercial bank. Of this amount, $233,202,000 is available for future construction costs, and $35,695,000 is from bond proceed earnings for unrestricted purposes. Trust funds are invested in accordance with the Board’s authorizing resolutions, as disclosed in section B of this footnote.
In addition, endowment funds make up a portion of the deposits and investments. These funds are primarily invested in the Consolidated Endowment Growth/Income Pool. Included in these investments are balances invested on behalf of the Arizona Student Financial Aid Trust (ASFAT). The University currently invests ASFAT for The University of Arizona and Northern Arizona University. ASFAT was established by the Arizona Board of Regents and is funded by the Arizona State Legislature and student fees. Funds
invested for Northern Arizona University are recorded as investments held for others at the fair value of $10,248,000. The University’s ASFAT funds are recorded as endowment investments at $19,069,000. Beginning in fiscal year 2010, the University of Arizona no longer manages nor invests ASFAT funds for Arizona State University.
Also included within the endowment funds are certain endowments held by external trustees. At June 30, 2010, University endowments totaling $14,590,000 are held and invested by bank trustees according to donor specifications. These externally held endowments are further discussed in the custodial credit risk disclosure in section C of this footnote.
b. Statutory and board of Regents’ PoliciesArizona Revised Statutes require that deposits of the University not covered by federal deposit insurance be secured by government bonds or by a safekeeping receipt of the institution accepting the deposit. Further policy regarding deposits is provided by the Arizona Board of Regents. According to Board policy, deposits can be made only at depository banks approved by the Board.
The Statutes do not specifically address the investment policy of the University; rather, Board of Regents’ policy governs in this area. Board policy requires that the University arrange for the safekeeping of securities by a bank or other financial institution approved by the Board. Also under Board policy, the University is limited to investing its pooled operating funds in certificates of deposit, collateralized repurchase agreements, United States Treasury securities, Federal agency securities, investment grade corporate bonds or in the government investment pool administered by the State Treasurer’s Office.
Investment of capital project funds held with bond trustees are subject to investment policy set by the Board and included in bond indentures. The moneys may be invested in obligations of or guaranteed by the federal government or any of the senior debt of its agencies, sponsored agencies, corporations, sponsored corporations or instrumentalities; or in certificates of deposit of federally insured banks, trust companies or savings and loan associations in the State of Arizona.
With regard to endowments, Board of Regents’ policy dictates that these funds are to be invested under the direction of an investment committee designated by the president of each university. At the University of Arizona, the investment committee is responsible for defining, developing, and implementing investment objectives, policies, and restrictions.
Col l ege of Med i c i ne — Phoen i x

The University of Arizona Annual Financial Report | 29
Concentration of Credit Risk:Other than United States Treasury securities and other Federal agency securities, which can represent greater than 5% of total investments, University policy limits investment in a single issuer to 5% or less of the fair value of the total portfolio. Except for those issuers allowed by policy, the University does not have an investment in any single issuer that exceeds 5% of the overall portfolio. At June 30, 2010, the University had investments in Federal Home Loan Banks, Federal National Mortgage Association, and Federal Home Loan Mortgage Corporation agency securities with a fair value of $48,600,000, $47,329,000, and $35,758,000 or 6.9%, 6.7%, and 5.1% of total investments, respectively.
However, if donors restrict investments, Board policy requires that the University invest those funds separately as directed by the donor, and the individual endowments bear all changes in value.
The University’s deposit and investment policies follow the Board’s policies.
C. deposit & investment RiskCustodial Credit Risk:University policy for its operating funds requires all repurchase agreements to be collateralized with government debt securities or cash balances held in the controller’s demand deposit account. Beyond this requirement, the University does not have a policy that specifically addresses custodial credit risk. At June 30, 2010, $14,590,000 of the University’s total deposits and investments is exposed to custodial credit risk since a portion of the University’s endowment funds are held by trustees. These deposits and securities are held by the counterparties in the names of the individual donors as irrevocable trusts for the benefit of the University.
Credit Risk:With regard to credit risk, University policy restricts investment of the operating funds to certificates of deposit and collateralized repurchase agreements, United States Treasury securities, Federal agency securities, investment grade corporate bonds or the government investment pool administered by the State Treasurer’s Office. When investing operating funds, University policy requires corporate bonds and notes to be of investment grade quality, rated Baa or higher by Moody’s Investors Service, at the time of purchase. The Moody’s credit quality ratings for the University’s investments in debt securities at June 30, 2010 are disclosed in the following table:
Moody’s Rating Investment Type Fair Value Not Rated AAA AA A BAA
Asset Backed Securities $ 705,000 6,000 689,000 10,000 Bond Mutual Funds and Exchange Traded Funds 22,098,000 22,098,000 Commingled Funds 26,098,000 26,098,000 Corporate Bonds 34,955,000 2,996,000 7,969,000 20,968,000 2,820,000 202,000 Federal Agency Securities 131,699,000 131,699,000 Money Market Mutual Funds 347,748,000 210,000 347,538,000 Municipal Bonds 11,000 11,000 State Treasurer's Pool 634,000 634,000
Totals $ 563,948,000 52,042,000 487,895,000 20,979,000 2,830,000 202,000

30 | The University of Arizona Annual Financial Report
Interest Rate Risk:University policy for its operating funds limits the maximum maturity of any fixed-rate or variable-rate security to five years from the settlement date of purchase. The endowment fund portfolio has no such limitation. The following chart presents the interest rate risk for the University’s debt investments at June 30, 2010, utilizing the segmented time distribution method:
Maturity Date Investment Type Fair Value < 1 Year 1-5 Years 6-10 Years > 10 Years
Asset Backed Securities $ 705,000 135,000 10,000 560,000
Bond Mutual Funds and
Exchange Traded Funds 22,098,000 254,000 21,797,000 47,000
Corporate Bonds 34,955,000 11,126,000 22,832,000 981,000 16,000
Federal Agency Securities 131,699,000 73,694,000 57,394,000 60,000 551,000
Money Market Mutual Funds 347,748,000 347,748,000
Municipal Bonds 11,000 11,000
State Treasurer’s Pool 634,000 634,000
U.S. Treasury 25,956,000 20,048,000 5,589,000 319,000
Totals $ 563,806,000 453,250,000 86,215,000 23,167,000 1,174,000
At June 30, 2010, the University held $131,699,000 or 19% of investments in Federal agency securities, including Federal Farm Credit Banks, Federal Home Loan Banks, Federal Home Loan Mortgage Corporation and Federal National Mortgage Association, which may be considered to be highly sensitive to interest rate fluctuations because borrower repayment terms may vary.
Foreign Currency Risk:The University’s foreign-currency denominated investments at June 30, 2010 are shown in the table below. These investments are part of the University’s endowment portfolio and are invested in the University’s Consolidated Endowment Growth/Income Pool or are invested and held by external trustees. University policy does not include any specific requirements for foreign currency risk. University endowment funds held by external trustees are invested in accordance with donor restrictions.
In addition to the investments listed above, at June 30, 2010, the University had deposits in European euros of $838,000. University policy does not address foreign currency risk for deposits.
Investment Type Currency Fair Value
Equities Various $ 31,686,000 Private Infrastructure Funds European euro 4,656,000 Bonds Various 1,272,000 Miscellaneous Various 642,000
Total $ 38,256,000

The University of Arizona Annual Financial Report | 31
NOTE 4. JOiNT VENTURE The University is a participant in the Large Binocular Telescope Corporation (LBT). LBT was formally incorporated as a nonprofit corporation in August 1992 pursuant to a Memorandum of Understanding, as amended, executed on February 24, 1989, between the University and Arcetri Astrophysical Observatory in Florence, Italy (Arcetri). The purpose of the joint venture is to design, develop, construct, own, operate and maintain a binocular telescope located in Arizona. The current members of LBT are the University, INAF Astrophysical Observatory, Research Corporation, Ohio State University, and LBT Beteiligungsgesellschaft (LBTB).
The University has committed resources equivalent to 25% of LBT’s construction costs and annual operating costs. The University has made total cash contributions of $18,159,000 toward the project’s construction costs which were recorded as long-term investments on the statement of net assets.
The University’s financial interest represents future viewing/observation rights. As of December 31, 2007, the assets had been substantially completed and the telescope entered the commissioning phase. During calendar year 2007, the telescope became operational for research purposes; thus, depreciation of the property and equipment commenced. The University recorded its proportionate share of the use of the viewing/observation rights, $750,000 in calendar year 2009, as a reduction in its investment. At June 30, 2010, the investment totaled $16,007,000. According to the audited financial statements of LBT for the year ended December 31, 2009, assets, liabilities, revenues and expenses totaled $129 million, $4 million, $14 million, and $11 million, respectively. For information regarding LBT’s financial statements, contact the University of Arizona Comptroller at the following address: University of Arizona, Financial Services, P.O. Box 3310, Tucson, Arizona 85722-3310.
NOTE 5. CAPiTAl ASSETSCapital asset activity for the year ended June 30, 2010, was as follows:
BeginningBalance
July 1, 2009 Additions RetirementsTransfers/Reclasses
Ending Balance
June 30, 2010
Land $ 73,514,000 $ 2,352,000 $ 75,866,000 Construction in progress 87,175,000 120,353,000 $ (44,259,000) 163,269,000 Total non-depreciable capital assets $ 160,689,000 $ 122,705,000 $ 0 $ (44,259,000) $ 239,135,000 Buildings and improvements $ 1,588,494,000 $ 5,406,000 $ (1,415,000) $ 33,384,000 $ 1,625,869,000 Infrastructure 177,102,000 141,000 5,017,000 182,260,000 Equipment 415,735,000 25,493,000 (11,759,000) 5,858,000 435,327,000 Library materials 230,306,000 12,932,000 (1,789,000) 241,449,000 Total depreciable capital assets $ 2,411,637,000 $ 43,972,000 $ (14,963,000) $ 44,259,000 $ 2,484,905,000 Less: accumulated depreciation Buildings and improvements $ 686,231,000 $ 53,394,000 $ (46,000) $ 739,579,000 Infrastructure 66,398,000 7,155,000 73,553,000 Equipment 298,718,000 29,912,000 (10,508,000) 318,122,000 Library materials 181,551,000 10,765,000 (1,789,000) 190,527,000 Total accumulated depreciation $ 1,232,898,000 $ 101,226,000 $ (12,343,000) $ 0 $ 1,321,781,000 Depreciable capital assets, net $ 1,178,739,000 $ (57,254,000) $ (2,620,000) $ 44,259,000 $ 1,163,124,000 Capital assets, net $ 1,339,428,000 $ 65,451,000 $ (2,620,000) $ 0 $ 1,402,259,000
In addition to expenditures through June 30, 2010, it is estimated that $571,264,000 will be required to complete projects under construction or planned for construction. Of that amount, $78,880,000 is contractually encumbered.

32 | The University of Arizona Annual Financial Report
Deferred revenue and deposits at June 30, 2010 consist of the following:
Current Deferred Revenue and Deposits Unexpended cash advances received for sponsored programs $ 43,456,000Auxiliary sales and services 5,662,000IBM lease related to the acquisition of the Park 4,900,000Tuition and fees 4,305,000Other deferred revenues 1,618,000Deposits 1,189,000Total current deferred revenue and deposits $ 61,130,000 Noncurrent Deferred Revenue and Deposits IBM lease related to the acquisition of the Park $ 15,170,000
NOTE 6. dEFERREd REVENUE ANd dEPOSiTSDeferred revenue consists primarily of amounts received from grants and contract sponsors that have not yet been earned under the terms of the agreements and the unamortized portion of the IBM lease (see discussion below) related to the acquisition of the University of Arizona Science and Technology Park (Park). Deferred revenue also includes amounts received in advance of an event, such as advance ticket sales for sporting events.
Arizona Research Park Authority (ARPA) was established under the State’s industrial development authority statute to assist in the acquisition, improvement and operation of university research parks and related properties. In August 1994, ARPA sold $98 million of transferable special revenue
bonds to International Business Machines Corporation (IBM) to enable the University to acquire from IBM a 345-acre developed industrial site near Tucson, Arizona, together with 1,000 acres of adjacent unimproved land (collectively, the University of Arizona Science and Technology Park (Park)). The bonds are payable solely from lease rentals paid by IBM. If IBM defaults or cancels its lease, the bonds must be surrendered and discharged. Title to the entire Park resides with the University and neither the Park nor any payments by the University secures ARPA’s bonds. Since the original transaction, IBM has reduced its leasehold to 33% of the building space for periods up to the remaining term of four years. The University has recorded the value of the Park as a capital asset and is amortizing the associated deferred revenue over a 20-year period.
UA Dance Tro upe , 1 929UA LiBrArY, SPeciAL coLLectionS

The University of Arizona Annual Financial Report | 33
NOTE 7. ACCRUEd COMPENSATEd AbSENCESThe University accrues vacation when earned. At fiscal year-end, the University accrued up to the maximum 22 days allowed by University policy for which an employee can be paid upon termination of employment. The University does not accrue sick time. Upon retirement, employees with a minimum of 500 hours of accumulated sick time are paid a formulated amount from the Retiree Accumulated Sick Leave (RASL) fund administered by the Arizona State Department of Administration. The University pays a percentage of its payroll to RASL annually and does not have further liability. Accrued compensated vacation for the year ended June 30, 2010, was as follows:
Beginning balance $ 36,029,000
Additions 46,132,000
Reductions (43,908,000)
Ending balance $ 38,253,000
Current portion $ 6,685,000
NOTE 8. lONG-TERM dEbT & lEASE ObliGATiONSLong-term debt activity for the year ended June 30, 2010 was as follows:
Beginning Balance
July 1, 2009 Additions Reductions
Ending Balance
June 30, 2010
Due Within
One Year
Bonds payable $ 498,650,000 $ 147,475,000 $ (23,860,000) $ 622,265,000 $ 24,720,000
Certificates of participation 489,859,000 205,000 (14,625,000) 475,439,000 15,705,000
Capitalized lease obligations 51,621,000 2,043,000 (13,787,000) 39,877,000 2,113,000
Subtotal long-term debt $ 1,040,130,000 $ 149,723,000 $ (52,272,000) $ 1,137,581,000 $ 42,538,000
Premium on sale of debt 25,321,000 0 (1,728,000) 23,593,000 1,685,000
Discount on sale of debt (2,872,000) 0 144,000 (2,728,000) (144,000)
Deferred costs of refundings (14,870,000) 0 1,497,000 (13,373,000) (1,470,000)
Total long-term debt $ 1,047,709,000 $ 149,723,000 $ (52,359,000) $ 1,145,073,000 $ 42,609,000
Schoo l of Dance , 2008

34 | The University of Arizona Annual Financial Report
Bonds – The University’s bonded debt consists of various issues of system revenue bonds and Stimulus Plan for Economic and Educational Development (SPEED) revenue bonds that are generally callable with interest payable semi-annually. Bond proceeds are used to pay for acquiring or constructing capital facilities and infrastructure. Bond proceeds are also used for refunding obligations from previously issued bonds.
On June 15, 2010, the University sold SPEED Revenue Bonds Taxable Series 2010 Build America Bonds for $147,475,000 dated June 23, 2010. The 2010 Bonds include $29,675,000 of serial bonds with interest rates ranging from 4.310% to 6.058% and maturity dates ranging from 2016 to 2025. The 2010 Bonds also include two term bonds consisting of $63,580,000 with an interest rate of 6.423% due August 1, 2035; and $54,220,000 with an interest rate of 6.643% due August 1, 2044. The serial bonds with maturity on or after August 1, 2021, are subject to optional redemption without premium. The term bonds are subject to mandatory sinking fund redemption without premium. All of the 2010 bonds are subject to extraordinary optional redemption should the federal government fail to provide the interest subsidy described below. The University realized net proceeds of $146,126,000 after payment of $1,349,000 for issuance costs and underwriter discounts. The net proceeds will be used to finance the Health Science Education Building and building renewal projects. Under the bond resolution, up to 80% of
the debt service payments on the 2010 Bonds are payable from the University’s SPEED revenue bond account monies, which are derived from certain revenues of the Arizona State Lottery. To the extent SPEED revenue bond account monies are not sufficient to make debt service payments, the 2010 Bonds are secured by a pledge of certain gross revenues, such as student tuition and fees, but that pledge is subordinate to the pledge of those gross revenues for the University’s system revenue bonds.
The 2010 SPEED Revenue Bonds were issued as designated Build America Bonds under the provisions of the American Recovery and Reinvestment Act. As such, the University is eligible to receive direct payments from the U.S. Treasury Department equal to 35% of the interest payments on such bonds on each interest payment date. In order to receive such payments, the University must file certain required information with the federal government between 90 and 45 days prior to the interest payment date. The amount paid to the University by the federal government may be reduced or eliminated due to such issues as failure by the University to submit the required information, any amounts owed by the University to the federal government, or changes in the law that would reduce or eliminate such payments. The University is currently not aware of any such issues that may adversely affect the amount of payments to be received from the federal government related to such designated Build America Bonds.
Footba l l Team , 2009coUrteSY of UA AtHLeticS

The University of Arizona Annual Financial Report | 35
The following schedule details outstanding bonds payable at June 30, 2010:
Issue Original Amount
Year of Final Maturity
InterestRates
Outstanding Principal
1992A – System Revenue Refunding Bonds $ 55,490,000 2016 6.00-6.20% $ 34,060,000
2002 – System Revenue Refunding Bonds 93,080,000 2011 4.20-5.25% 12,515,000
2003 – System Revenue Refunding Bonds 30,805,000 2024 3.50-5.00% 30,805,000
2004A – System Revenue Bonds 17,780,000 2029 4.00-5.00% 15,055,000
2004B – System Revenue Bonds 50,265,000 2034 4.00-5.00% 47,045,000
2005A – System Revenue Bonds 35,570,000 2031 3.25-5.00% 32,530,000
2006A – System Revenue Refunding Bonds 17,645,000 2020 5.00% 17,645,000
2007 – System Revenue Bonds 31,010,000 2032 4.00-5.00% 28,885,000
2008A – System Revenue Bonds 43,105,000 2040 4.00-5.00% 41,725,000
2008B – System Revenue Refunding Bonds 18,090,000 2018 3.50-4.50% 12,155,000
2009A – System Revenue Bonds 202,370,000 2039 3.00-5.00% 202,370,000
Subtotal – System Revenue Bonds $ 595,210,000 $ 474,790,000
2010 – SPEED Revenue Bonds 147,475,000 2045 4.31-6.643% 147,475,000
Total $ 742,685,000 $ 622,265,000
The following schedule details debt service requirements to maturity for System and SPEED Revenue Bonds payable at June 30, 2010:
Year Principal Interest
2011 $ 24,720,000 $ 28,571,000
2012 17,375,000 30,984,000
2013 21,470,00 30,143,000
2014 22,500,000 29,143,000
2015 21,080,000 28,044,000
2016-20 116,230,000 123,680,000
2021-25 101,675,000 96,143,000
2026-30 104,880,000 69,860,000
2031-35 85,865,000 43,470,000
2036-40 73,825,000 21,530,000
2041-45 32,645,000 5,604,000
Total $ 622,265,000 $ 507,172,000Footba l l Team , 1 900
UA LiBrArY, SPeciAL coLLectionS

36 | The University of Arizona Annual Financial Report
The University has pledged portions of its gross revenues towards the payment of debt related to all system revenue, system revenue refunding bonds, and SPEED revenue bonds outstanding at June 30, 2010. The bonds generally provide financing for various capital projects of the University. These pledged revenues include student tuition and fees, auxiliary enterprise revenue, sales and service revenue and other operating revenues, such as indirect cost recovery and certain investment income. Pledged revenues do not include state appropriations, gifts, endowment income or other restricted revenues. At June 30, 2010, pledged revenues totaled $783.3 million of which 6.2% ($48.4 million) was required to cover current year debt service. Future annual principal and interest payments on the bonds are expected to require approximately 4 percent of pledged revenues. Future pledged revenues required to pay all remaining debt service for the bonds through final maturity of August 1, 2044 is $1.129 billion.
Certificates of Participation – The University utilizes Certificates of Participation and various capital leases to acquire buildings, equipment and land. The Certificates are generally callable, and the capital leases are subject to prepayment.
In fiscal year 2003, the University refunded, in advance of maturity, a portion of outstanding Certificates of Participation Series 2001B. At June 30, 2010, the outstanding principal balance for the Certificates of Participation Series 2001B was $1,980,000, which will be paid by investments held in an irrevocable trust with a fair market value of $2,121,000. Accordingly, the trust account assets and liability for these defeased certificates are not included in the University’s financial statements. In fiscal year 2005, the University refunded, in advance of maturity, a portion of outstanding Certificates of Participation Series 2001A. At June 30, 2010, the total outstanding principal balance for the Certificates of Participation Series 2001A was $8,730,000, which will be paid by investments held in an irrevocable trust with a fair value of $8,832,000. Accordingly, the trust account assets and liability for these defeased certificates are not included in the University’s financial statements.
In fiscal year 2007, the University refunded, in advance of maturity, a portion of outstanding Certificates of Participation Series 2001A, 2001B, and 2002A. At June 30, 2010, the total outstanding principal balance for the Certificates of Participation Series 2001A, 2001B, and 2002A was $59,195,000, which will be paid by investments held in an irrevocable trust with a fair value of $59,930,000. Accordingly, the trust account assets and liability for these defeased certificates are not included in the University’s financial statements.
So l a r pa nel s a top the Second S t ree t GarageLeSLie joHnSton

The University of Arizona Annual Financial Report | 37
The following schedule details outstanding Certificates of Participation payable at June 30, 2010:
Issue Original Amount
Year of Final Maturity
Interest Rates
Outstanding Principal
1999A Fixed Student Union Certificates $ 21,607,000 2020 5.125-5.30% $ 4,364,000
2001A Park Std. Union, Learning Svcs., 6th Street Garage, TEP Bldg.
31,695,000 2012 4.30-4.450% 1,990,000
2001B Gittings Bldg., Highland Infra., Life Sci. 21,425,000 2014 4.75-5.00% 2,185,000
2002A Student Housing, Health Bldg., UA North 76,965,000 2022 4.380-5.50% 11,640,000
2002B Meinel Bldg., Refund COPS 1994B 29,845,000 2023 4.75-5.125% 26,640,000
2003A Refund COPS 1997 & Portion of COPS 2001B 10,615,000 2022 3.50-5.00% 10,615,000
2003B Medical Research Bldg., Biomedical Sciences & Biotech. Bldg., Technology Infrastructure
153,960,000 2031 3.767-5.25% 138,340,000
2004A Chemistry Bldg. Expansion, Res. Life Phase I, Highland Pkg. Garage, Refund COPS 1994A
42,020,000 2029 4.50-5.25% 30,510,000
2005A Refund COPS 1999A 12,660,000 2024 4.00-5.00% 12,660,000
2005B Refund COPS 1999 14,825,000 2024 5.00% 14,825,000
2005C Refund COPS 2001A 16,330,000 2022 4.125-5.00% 16,330,000
2005D Refund COPS 1999A & B 6,655,000 2020 4.125-5.00% 6,655,000
2005E Refund COPS 1999 3,555,000 2014 3.625-4.136% 3,260,000
2005F Refund COPS 2000A & 2001A
14,915,000 2025 4.00-4.50% 12,315,000
2005G Refund COPS 2001B, 2002A, & 2003A 2,245,000 2020 4.125-4.375% 2,245,000
2005H Refund COPS 2002B 770,000 2020 4.125-4.375% 770,000
2005I Refund COPS 2003B, 2004A 1,320,000 2020 4.125-4.375% 1,320,000
2006A Refund COPS 1999A & 1999B 35,785,000 2024 3.875-5.00% 35,785,000
2006B Refund COPS 2000A & 2001A 12,395,000 2025 3.75-4.50% 10,865,000
2006C Refund COPS 2001B, 2002A, & 2003A 6,100,000 2020 4.25-4.375% 6,100,000
2006D Refund COPS 2002B 1,285,000 2020 4.25-4.375% 1,285,000
2006E Refund COPS 2003B & 2004A 3,085,000 2020 4.25-4.375% 3,085,000
2006 Arizona Biomedical Research Collaborative Building Project
18,240,000 2031 4.00-5.00% 16,825,000
2007A Refund COPS 2001A 12,035,000 2025 3.50-4.50% 11,975,000
2007B Refund COPS 2001B & 2002A 50,150,000 2022 4.00-4.50% 50,050,000
2007D Refund COPS 2004B 42,895,000 2031 4.00% 42,805,000
Total $ 643,377,000 $ 475,439,000

38 | The University of Arizona Annual Financial Report
The following schedule details debt service requirements to maturity for Certificates of Participation payable at June 30, 2010:
Year Principal Interest
2011 $ 15,705,000 $ 22,180,000
2012 21,852,000 21,913,000
2013 23,061,000 21,005,000
2014 24,223,000 19,903,000
2015 23,574,000 19,317,000
2016-20 159,729,000 70,741,000
2021-25 128,705,000 34,943,000
2026-30 64,975,000 12,570,000
2031 13,615,000 641,000
Total $ 475,439,000 $ 223,213,000
Capital Leases – The University has entered into various long-term leases to acquire equipment and enhance fixtures and infrastructure. These leases are classified as capital leases since they provide a bargain purchase option, a transfer of ownership by the end of the lease term, or comply with other accounting criteria. The largest lease entered into this fiscal year was with The University of Arizona Foundation for a real estate property in the amount of $1,400,000 with a 7.00% interest rate and a final payment date of March 27, 2014.
The following schedule details debt service requirements to maturity for capital leases payable at June 30, 2010:
Year
Capital Lease Payments
2011 $ 4,314,000
2012 4,046,000
2013 4,032,000
2014 3,515,000
2015 3,186,000
2016-20 13,489,000
2021-25 13,219,000
2026-30 13,402,000
2031-35 10,312,000
2036 320,000
Total minimum lease payments $ 69,835,000
Less: interest (29,958,000)
Present value of net minimum lease payments
$ 39,877,000
L ibra r y con s t r u c t ion , 1 924UA LiBrArY, SPeciAL coLLectionS
Ar i zona S ta te M u se um , 20 10AHSc BioMeDicAL coMMUnicAtionS

The University of Arizona Annual Financial Report | 39
Capital Asset Financing – Following is a summary of capital assets financed by certificates of participation and capital leases at June 30, 2010:
Land $ 7,447,000Buildings and improvements 492,754,000Infrastructure 35,800,000Equipment 21,966,000 Total cost of assets $ 557,967,000Less: accumulated depreciation (151,013,000) Carrying value of assets $ 406,954,000
Operating Leases – The University has entered into certain operating leases, generally with options for annual renewal, and other rental agreements for real property and equipment. For fiscal year 2010, rent expenses totaled $21,900,000.
The following schedule details future operating lease payments to maturity:
Year Operating Lease Payments
2011 $ 4,016,000
2012 3,351,000
2013 1,480,000
2014 1,016,000
2015 560,000
Total $ 10,423,000
NOTE 9. SElF-iNSURANCE PROGRAM The University is exposed to various risks of loss related to: torts; theft of, damage to, and destruction of assets; errors and omissions; injuries to employees; and natural disasters. The University participates in a self-insurance program administered by the State of Arizona Department of Administration, Risk Management Division. Arizona Revised Statutes §41-621 et seq provides that losses eligible for coverage and not covered by insurance will be paid by the State from the self-insurance program or by a future appropriation from the State Legislature. Loss risks not covered by Risk Management and for which the University has no insurance coverage are losses that arise from contractual breaches, or are directly attributable to an act or omission determined to be a felony by a court of law. With this exception, the University has no significant risk of loss
beyond adjustments to future years’ premium payments to the State’s self-insurance program. All estimated losses for unsettled claims and actions of the State are determined on an actuarial basis and are included in the State of Arizona Comprehensive Annual Financial Report.
NOTE 10. RETiREMENT PlANS The University participates in one cost-sharing, multiple-employer defined benefit pension plan and four defined contribution pension plans.
A. defined benefit PlanPlan Description. The Arizona State Retirement System (ASRS) administers a cost-sharing multiple-employer defined benefit pension plan that covers employees of the state of Arizona, including University employees, and employees of participating political subdivisions and school districts. Benefits are established by State statute. The ASRS provides retirement, death and survivor benefits through its Retirement Fund; health insurance premium benefits (i.e., a monthly subsidy) through its Health Benefit Supplement Fund; and long-term disability benefits through its Long-Term Disability Fund. The ASRS is governed by the Arizona State Retirement System Board according to the provisions of ARS Title 38, Chapter 5, Article 2. The ASRS issues a publicly available comprehensive annual financial report that includes its financial statements and required supplementary information. That report may be obtained by writing to the ASRS, 3300 North Central Avenue, PO Box 33910, Phoenix, Arizona 85067-3910, or by calling (602) 240-2000 or (800) 621-3778.
Funding Policy. For the year ended June 30, 2010, active ASRS members were required to contribute at the actuarially determined rate of 9.40 percent (9.00 percent retirement and 0.4 percent long term disability) of the members’ annual covered payroll. The University was required to contribute at the actuarially determined rate of 9.40 percent (8.34 percent for retirement, 0.66 percent for health insurance premium, and 0.4 percent for long-term disability) of the members’ annual covered payroll. The Arizona State Legislature establishes and may amend active plan members’ and the University’s contribution rates.

40 | The University of Arizona Annual Financial Report
The University’s contributions for the current and two preceding years, all of which were equal to the required contributions were as follows:
Years ended June 30, Retirement
FundHealth Benefit
Supplement Fund Long-Term
Disability Fund
2010 $ 26,043,000 $ 2,061,000 $ 1,249,0002009 25,366,000 3,048,000 1,587,0002008 25,139,000 3,279,000 1,561,000
b. defined Contribution PlansPlan Description. In accordance with ARS §15-1628, University faculty, academic professionals, and administrative officers have the option to participate in defined contribution pension plans. For the year ended June 30, 2010, plans offered by the Teachers Insurance Annuity Association/College Retirement Equities Fund (TIAA/CREF), Variable Annuity Life Insurance Company (VALIC), and Fidelity Investments Tax-Exempt Services Company (Fidelity) were approved by the Arizona Board of Regents. In addition, employees hired before July 1, 1972 have the option to participate in the defined contribution plan administered by the ASRS. Benefits under these plans depend solely on the contributed amounts and the returns earned on investments of those contributions. Contributions made by members vest immediately; University contributions vest after five years of full-time employment. Member and University
contributions and associated returns earned on investments may be withdrawn upon termination of employment, death, or retirement. The distribution of member contributions and associated investment earnings are made in accordance with the member’s contract with the applicable insurance and annuity company.
Funding Policy. The Arizona State Legislature establishes the contribution rates for active plan members and the University. For the year ended June 30, 2010, plan members and the University were each required by statute to contribute an amount equal to 7 percent of a member’s compensation, except for a 7.40 percent member contribution and an 8.06 percent University contribution for the ASRS plan. Contributions to these plans for the year ended June 30, 2010, were as follows:
PlanUniversity
ContributionsMember
ContributionsTotal
Contributions
TIAA/CREF $ 13,610,000 $ 13,610,000 $ 27,220,000VALIC 684,000 684,000 1,368,000Fidelity 7,016,000 7,016,000 14,032,000ASRS 19,000 18,000 37,000
St uden t Un ion ca fe te r i a k nown a s the Ca t sbah , c . 1 950 ’ sUA LiBrArY, SPeciAL coLLectionS

The University of Arizona Annual Financial Report | 41
NOTE 11. OPERATiNG EXPENSES bY ClASSiFiCATiONOperating expenses by functional and natural classification for the year ended June 30, 2010, consist of the following: Personal Services Supplies Scholarships and Benefits and Services and Fellowships Depreciation Total
Instruction $ 320,026,000 $ 37,890,000 $ 357,916,000
Research 244,894,000 150,114,000 395,008,000
Public Service 47,979,000 22,391,000 70,370,000
Academic Support 87,861,000 12,554,000 100,415,000
Student Services 22,291,000 5,317,000 27,608,000
Institutional Support 56,649,000 26,431,000 83,080,000
Operation and Maintenance of Plant 33,316,000 53,026,000 86,342,000
Scholarships and Fellowships 5,900,000 $ 49,416,000 55,316,000
Auxiliary Enterprises 93,848,000 48,142,000 2,106,000 144,096,000
Depreciation $ 101,226,000 101,226,000
Total Operating Expenses $ 912,764,000 $ 355,865,000 $ 51,522,000 $ 101,226,000 $ 1,421,377,000
NOTE 12. CONTiNGENT liAbiliTiESOn April 20, 2010, the Arizona State Legislature’s Joint Legislative Budget Committee approved a settlement agreement between the Havasupai Tribe and the Arizona Board of Regents resolving the litigation with the Tribe and the individual plaintiffs. No part of the monetary portion of the settlement was specifically attributable to UA.
NOTE 13. diSCRETElY PRESENTEd COMPONENT UNiT diSClOSURESA. Summary of Significant Accounting PoliciesThe University of Arizona FoundationBasis of AccountingFor financial reporting purposes, three net asset categories are utilized to reflect resources according to the existence or lack thereof of externally (donor) imposed restrictions. A description of the three net asset categories follows.
• Unrestricted net assets – include assets and contributions that are not restricted by donors or for which such restrictions have expired.
St uden t Un ion Memo r i a l Cen te r d i n i n g a t 3 Cheeses & a Nood l ecoUrteSY of ArizonA StUDent UnionS MArKeting

42 | The University of Arizona Annual Financial Report
• Temporarily restricted net assets – include contributions for which donor imposed restrictions have not been met (either by the passage of time or by actions of the Foundation), charitable remainder unitrusts, pooled income funds, gift annuities, and pledges receivable for which the ultimate purpose of the proceeds is not permanently restricted. Donor-restricted contributions are classified as temporarily restricted even if restrictions are satisfied in the same reporting period in which the contributions are received.
• Permanently restricted net assets – include contributions, charitable remainder unitrusts, pooled income funds, gift annuities, and pledges receivable which require by donor restriction that the corpus be invested in perpetuity. Included in permanently restricted net assets is the Foundation’s endowment.
Cash and Cash EquivalentsCash and cash equivalents include monies held in certificates of deposit, overnight money market accounts, and U.S. Government or U.S. Treasury money market funds with original maturities of three months or less. Cash equivalents are stated at cost, which approximates fair value.
InvestmentsInvestments are stated at fair value. Such investments are exposed to various risks, including market risk, company-specific risk, country-specific risk, interest rate risk, liquidity risk and credit risk. Investments in domestic and international equity securities and mutual funds, U.S. government and
agency obligations and mutual funds, corporate bonds, and mutual funds, REIT funds, and international fixed income mutual funds are valued based on quoted market prices. Investments in real estate and timber partnerships are recorded at fair value as determined by the general partner based on the appraised value of the partnerships’ assets. Absolute return limited partnership interests are recorded at fair value based on quoted market prices (where the underlying investment is a mutual fund) or as determined by the fund manager. Investments in alternative securities are highly susceptible to valuation changes. Private capital and commodity limited partnership interests are recorded at fair value as determined by the fund manager. Investment income or loss comprises the sum of realized and unrealized gains and losses on investments and interest and dividends, less an investment management fee.
CollectionsThe Foundation capitalizes donated collections (principally photographs, prints and negatives to benefit the University of Arizona’s Center for Creative Photography) at a nominal value.
Annuities Payable and Other Trust LiabilitiesAnnuities payable and other trust liabilities of $16,134,000 at June 30, 2010 are stated at the actuarially computed present value of future payments to the annuitants, which approximates fair value. The excess of the fair values of assets received (classified according to their nature in the statement of financial position) pursuant to annuity agreements over the actuarially computed annuities payable (using market rates in effect on the contribution date) is recorded as contributions in the year received. The fair values of such assets held in trust at June 30, 2010 total $30,525,000, of which $2,108,000 were unrestricted, $10,492,000 were temporarily restricted and $17,925,000 were permanently restricted.
Net Assets Released From RestrictionExpenses are not incurred in the temporarily restricted or permanently restricted net asset categories. As the restrictions on temporarily restricted net assets are met, the net assets are reclassified to unrestricted net assets. The total net assets reclassified are reported as net assets released from restriction in the accompanying statement of activities.
L i fe Sc i e nces Sou thjeff SMitH

The University of Arizona Annual Financial Report | 43
Campus Research CorporationProperty, Equipment and DepreciationProperty and equipment are stated at cost and depreciation is provided for using the straight-line method over the estimated useful lives of the assets. Expenditures for major improvements to property are capitalized and expenditures for repairs and maintenance are expensed as incurred. The Corporation has recorded in the financial statements a building and related debt for which the ABOR on behalf of UA holds the title to the building, under the requirements of a lease.
C. EndowmentThe University of Arizona Foundation The Foundation’s endowment consists of approximately 1,350 individual funds established for a variety of purposes. In accordance with accounting principles generally accepted in the United States, net assets associated with endowment funds are classified and reported based on the existence or absence of donor-imposed restrictions. The Foundation has also invested certain unrestricted and temporarily restricted assets in its endowment pool. These invested funds, which are stated at fair value, are reported as due from the permanently restricted fund. The endowment pool is subject to the Arizona Management of Charitable Funds Act, which was signed into law on April 14, 2008.
As a result of explicit donor stipulations contained in its endowment agreements, the Foundation classifies as permanently restricted net assets: (1) the original value of gifts donated to the endowment, (2) subsequent gifts to the endowment, and (3) all realized and unrealized appreciation or depreciation experienced by the endowment fund.
The endowment payout rate (“Payout Rate”), a percentage (4% of the average fair value at the three previous calendar
year-ends) of the fair value of each endowment account, as determined from time to time by the Foundation’s Board, is made available to support the purposes of the individual accounts comprising each endowment account as specified by the donors. The Foundation charges a cost recovery fee, a percentage (1.25% in 2010) of the fair value of the Endowment as determined from time to time by the Foundation’s Board, which is paid from the Endowment to defray the Foundation’s costs of holding, managing and stewarding the Endowment, including costs for safeguarding, investing and accounting for such funds. Cost recovery fees of $3,745,000 were recognized in 2010.
d. Pledges ReceivableThe University of Arizona FoundationUnconditional promises are included in the financial statements as pledges receivable and revenue of the appropriate net asset category. Unconditional promises are recorded at their net realizable value using yields on U.S. Treasury obligations of equivalent maturity dates at the end of the fiscal year in which they were received. Unconditional promises at June 30, 2010 totaled $14,068,000.
Protected Water Facility RightsThe Corporation is in the process of developing a new well, well pump, one million gallon storage tank, various booster pumps, piping, valving, electrical and other equipment and improvements required to operate a well booster station and water storage facility (water project) in accordance with their master water plan. The purpose of this development is to provide water throughout the Park. Once the water project is complete, title will pass to ABOR and ultimately to the City of Tucson in exchange for protected water rights.
b. investmentsThe University of Arizona FoundationInvestments comprised the following amounts at June 30, 2010:
Carrying Value Cost
Domestic/international equity securities and mutual funds $ 126,983,000 $ 137,401,000
Absolute return limited partnerships and funds 113,629,000 105,219,000
U.S. fixed income obligations and mutual funds 70,672,000 67,695,000
Private capital and commodity limited partnerships 28,118,000 32,000,000
International fixed income mutual funds 19,036,000 24,306,000
REIT funds, real estate and timber partnerships 18,645,000 29,409,000
Totals $ 377,083,000 $ 396,030,000

44 | The University of Arizona Annual Financial Report
Law College Association of the University of ArizonaAt May 31, 2010, the Association had unconditional promises to give pledged for future support. Net of present value discounts and allowances for doubtful pledges, these unconditional promises totaled $27,847,000. Of the
Association’s total pledges receivable, 93% come from one individual donor.
E. Property and EquipmentCampus Research CorporationProperty and equipment consisted of the following as of June 30, 2010:
Building and infrastructure improvements $ 15,224,000
Furniture, equipment and other property 2,441,000
Total $ 17,665,000
Less accumulated depreciation (4,312,000)
Property and equipment, net $ 13,353,000
F. long-Term debtCampus Research Corporation
Bonds payable, Series A, payable in scheduled monthly installments of principal plus interest at the floating taxable bond rate (remarketed weekly) through May 2013, with a lump sum payment of $6,142,000 due in June 2013.
$ 6,761,000
Noninterest-bearing note payable, Arizona Commerce and Economic Development Commission, payable in monthly principal installments of $2,000 through April 2016, unsecured.
130,000
Note payable, Wells Fargo Bank, payable in monthly installments of $22,000 including interest at 7.25% through June 2010, and one final payment of $14,000 in July 2010.
14,000
Note payable, Wells Fargo Bank, payable in monthly installments of $26,000 including interest at 5% through June 2015.
1,406,000
Note payable, Wells Fargo Bank, nonrevolving line of credit for $1,500,000 converted to a term note in December 2009, payable in monthly installments of $20,000 including interest based on a formula prescribed in the agreement, through December 2016. At June 30, 2010, interest was 3.25%.
687,000
Note payable, Wells Fargo Bank, nonrevolving line of credit for $420,000 converted to a term note in October 2009, payable in monthly installments of $9,000 including interest based on a formula prescribed in the agreement, through October 2013. At June 30, 2010 interest was 3.25%.
351,000
Total long-term debt$ 9,349,000

The University of Arizona Annual Financial Report | 45
The bonds and notes payable to Wells Fargo Bank are collateralized by leasehold interests in real property and an assignment of rents and require the Corporation to be in compliance with certain financial and nonfinancial covenants.
Wells Fargo Bank Arizona issued an $11,400,000 letter of credit to enhance the sale of the bonds and the Corporation entered into a reimbursement agreement with the bank, which provides real property as collateral to the bank. The letter of credit is renewed annually in July at the outstanding bond amount plus 45 days of interest.
The Corporation entered into an interest rate swap agreement with Wells Fargo Bank to reduce the variability in cash flows caused by changes in interest payments on the series A bonds. Under the swap contract, the Corporation pays interest at the fixed rate (6.30%) and receives interest at the variable rate (LIBOR). The swap was not designated as a cash flow hedge.
The swap was issued at market terms so that it had no value at inception. The notional amount under the agreement decreases as principal payments on the note are made. The duration of the swap agreement is structured to coincide with the maturity of the note. As required by GAAP, the carrying amount of the swap has been adjusted to fair value at June 30, 2010. The Corporation’s derivative instruments held for risk management purposes at June 30, 2010 had a notional amount of $6,761,000 and a fair value of $948,000.
G. Project Operation Agreement (POA):Campus Research CorporationThe Corporation has an agreement with IBM whereby all common services at the Park are to be provided by the Managing Operator, which is currently IBM. Common services consist of the operation, maintenance and repair of the central utility system, project fire and security services, and the common areas. The term of the agreement coincides with the IBM master lease agreement that expires in August 2014. Exercise of contractual extensions contained within the IBM master lease agreement will extend the POA according to the terms of the lease agreement.
The Corporation is required to pay a monthly amount based on an annual operating budget for these services that is prepared by IBM. The Corporation has the right to review and consult with IBM in the process of preparing the operating budget. A quarterly analysis of the central utility and occupant electric expenses is prepared for each building and its occupants and these costs are reconciled to the budget. Annual common service expenses are also reconciled to the budget. Based on these reconciliations, an additional charge or refund is assessed. Lease agreements between the Corporation and its tenants provide for either the inclusion of a factor for these costs in their monthly rent or a proration of these costs based on the quarterly budget and subject to a quarterly reconciliation. Leases with one tenant include a maximum on the amount of cumulative annual capital expenditures that will be paid by the tenant. The Corporation is responsible for any capital expenditures allocated to this tenant in excess of the maximum.
Fam i l y a n d Con s ume r Sc i e ncesAHSc BioMeDicAL coMMUnicAtionS

46 | The University of Arizona Annual Financial Report
h. Condensed Financial Statements of Major Component Units
Major Component UnitsStatement of Financial PositionJune 30, 2010
The University of Arizona Foundation
Other Component
Units Total
Assets
Cash, cash equivalents and investments $ 420,862,000 $ 18,778,000 $ 439,640,000
Pledges receivable 14,068,000 27,947,000 42,015,000
Property and equipment, net 13,113,000 13,503,000 26,616,000
Other assets 2,960,000 8,162,000 11,122,000
Total Assets $ 451,003,000 $ 68,390,000 $ 519,393,000
Liabilities and Net Assets
Liabilities
Annuities payable and other trust liabilities $ 16,134,000 $ 16,134,000
Short-term and long-term debt $ 9,374,000 9,374,000
Other liabilities 4,500,000 7,545,000 12,045,000
Total Liabilities $ 20,634,000 $ 16,919,000 $ 37,553,000
Net Assets
Unrestricted $ 12,811,000 $ 15,367,000 $ 28,178,000
Temporarily restricted 106,147,000 31,986,000 138,133,000
Permanently restricted 311,411,000 4,118,000 315,529,000
Total Net Assets $ 430,369,000 $ 51,471,000 $ 481,840,000
Total Liabilities and Net Assets $ 451,003,000 $ 68,390,000 $ 519,393,000

The University of Arizona Annual Financial Report | 47
i. Condensed Financial Statements of Major Component Units, Continued
Major Component UnitsStatement of Activities Year Ended June 30, 2010
The University of Arizona Foundation
OtherComponent
Units Total
Revenues
Contributions $ 50,893,000 $ (195,000) $ 50,698,000
Rental revenues 12,393,000 12,393,000
Investment income 33,650,000 653,000 34,303,000
Other income 9,899,000 3,949,000 13,848,000
Total revenues $ 94,442,000 $ 16,800,000 $ 111,242,000
Expenses
Program services:
Leasing related expenses $ 8,651,000 $ 8,651,000
Payments to the University $ 41,672,000 41,672,000
Payments on behalf of the University 13,194,000 5,246,000 18,440,000
Supporting services:
Management and general 4,117,000 2,127,000 6,244,000
Fund raising 5,593,000 165,000 5,758,000
Other expenses 13,000 13,000
Total expenses $ 64,576,000 $ 16,202,000 $ 80,778,000
Increase in Net Assets $ 29,866,000 $ 598,000 $ 30,464,000
Net Assets - Beginning of year 400,503,000
50,873,000 451,376,000
Net Assets - End of year $ 430,369,000 $ 51,471,000 $ 481,840,000

48 | The University of Arizona Annual Financial Report
BookS to re l obby gArY MAcKenDer
BookS to re , 1 953

Arizona Board of RegentsEX-OFFICIO
Honorable Janice K. Brewer Governor of Arizona
Honorable Tom Horne Superintendent of Public Instruction
APPOINTED
Anne Mariucci, Chair Phoenix
Fred DuVal, Vice Chair Phoenix
Bob McLendon, Secretary Yuma
LuAnn Leonard, Treasurer Kykotsmovi
Jennifer Lyn Ginther, Assistant Treasurer Flagstaff
Ernest Calderón Phoenix
Dennis DeConcini Tucson
William R. Holmes Chandler
Mark Killian Mesa
Rick Myers Tucson
The University of Arizona Executive AdministrationRobert N. Shelton President
Meredith Hay Executive Vice President and Provost
Joel D. Valdez Senior Vice President for Business Affairs
Robert R. Smith Interim Senior Vice President for Business Affairs
William M. Crist Vice President for Health Affairs
B. Glenn George Vice President for Legal Affairs and General Counsel
Stephen J. MacCarthy Vice President for External Relations
Jacqueline Mok Vice President and Chief of Staff
Michele L. Norin Chief Information Officer
Leslie P. Tolbert Vice President for Research, Graduate Studies and Economic Development
Allison Vaillancourt Vice President for Human Resources
Melissa Vito Vice President for Student Affairs
Charles E. Ingram Associate Vice President, Financial Services
James Florian Assistant Vice President, Budget Director
Mark A. McGurk Comptroller
CreditsContent Mark A. McGurk Comptroller Floyd Roman Associate Comptroller, Financial Services Office Duc Ma Director, Capital Finance, Financial Services Office
Gail Craig-Jager Assistant Comptroller, Financial Services Office Guadalupe Valencia Assistant Comptroller, Financial Services OfficeDesign Darla L. Keneston AHSC Biomedical Communications
Contributions to this publication by the Financial Services Office staff are greatly appreciated:Meredith Abrams, Daniel Alu, Michael Aramian, Kajali Arora, Rachel Aschmann, Ramona Barajas, Alan Blumberg, Susan Brown, Andrea Bushong, Mario Calderon, Karen Christianson, Beckie Copeland, Denise Dellinger, Hanh Do, Steven Froehlich, Maritza Gastelum, Karshannon Gene, Janet Gurton, Amy Hoeft, Connie Huber, Pavel Jandura, John Jennings, Kris Keithly, David Kulze, Ajana Lee, Brittany Lemmons, Rebecca Lona, Jena Michels, Eddie Minter, Michael Mitchell, Marlene Moldenhauer, Denise Moynihan, Sarah Ortega, Fred Pearson, Melinda Pelusi, Jennifer Pfennig, Brian Pierson, Chris Pings, Susan Reece, Susan Richmond, Gennady Sare, Sarah Trotta, Johanna Valdez, Kandyce Williams, Clyde Wofford, Xuemei Yang and the Information Technology Services team.
St uden t Un ion Memo r i a l Cen te r , 1 95 1UA LibrAry, speciAL coLLections
St uden t Un ion Memo r i a l Cen te rJeff smith
Fi r s t W i l bu r W i l d ca t ma s co t , 1 959UA LibrAry, speciAL coLLections

© 2010 Arizona Board of Regents. All rights reserved.
The University of Arizona is an equal opportunity, affirmative action institution. The University prohibits discrimination in its programs and activities on the basis of race, color, religion, sex, national origin, age, disability, veteran status, or sexual orientation and is committed to maintaining an environment free from sexual harassment and retaliation.
UA L
ibr
Ary,
spe
ciA
L c
oLL
ecti
on
s