annual financial report - stm · 800 de la gauchetière street west suite 9100 montreal, quebec h5a...
TRANSCRIPT
stm.info You can also view the 2011 Sustainable Development Report, the 2011 Activities Report, as well as the 2011 Budget and 2011-2013 Three-year Capital Expenditures Program in the Documentation Centre section of our website.
PUBLISHED BY THE SOCIÉTÉ DE TRANSPORT DE MONTRÉAL
Executive Division - Finance and Control Division - Financial Management and Systems Framework800 De La Gauchetière Street West Suite 9100 Montreal, Quebec H5A 1J6 Legal DepositBibliothèque nationale1st quarter
Ce document est disponible en français
Annual Financial Report
20
11 AN
NU
AL F
INA
NC
IAL R
EP
OR
T S
OC
IÉT
É D
E T
RA
NS
PO
RT
DE
MO
NT
RÉ
AL

IN 2011, wE BROkE A RIDERSHIP RECORD wITH...

2011 marked 150 years of public transportation in montréal.
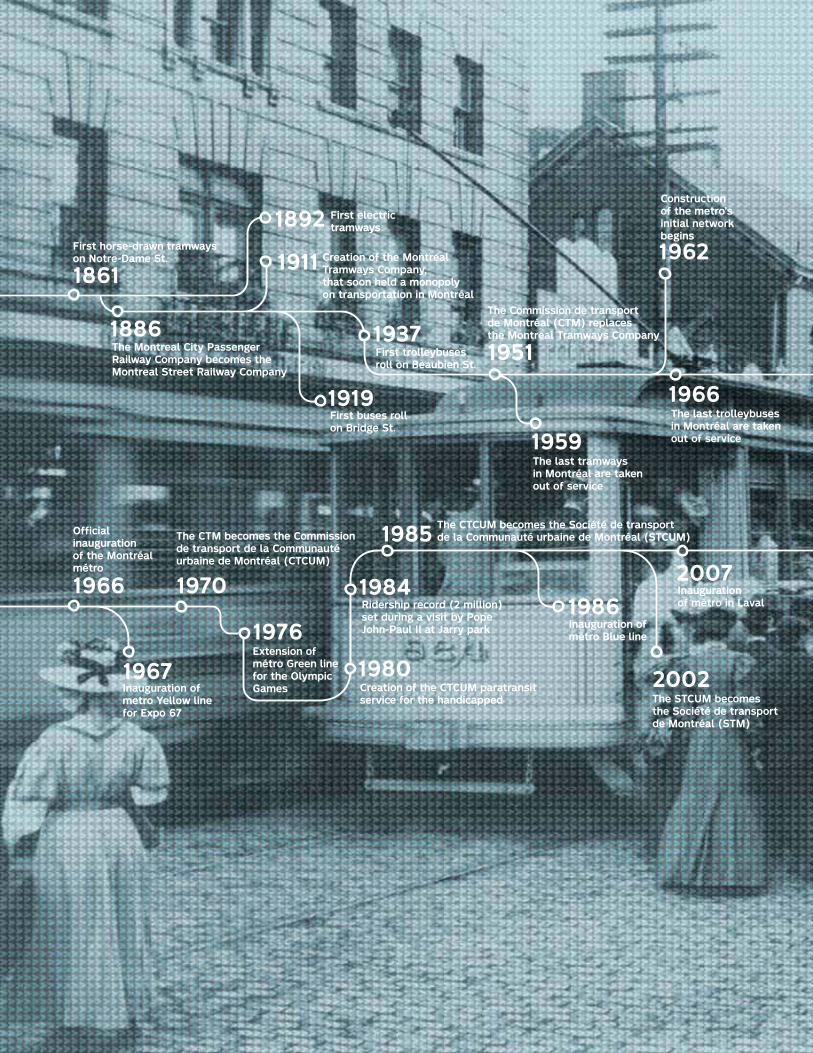
First horse-drawn tramways on Notre-Dame St.
First electric tramways
The Montreal City Passenger Railway Company becomes the Montreal Street Railway Company
1861
1886
1892Creation of the Montreal Tramways Company, that soon held a monopoly on transportation in Montréal
1911
1919
1951
1959First buses roll on Bridge St.
1937First trolleybuses roll on Beaubien St.
The Commission de transport de Montréal (CTM) replaces the Montreal Tramways Company
The last tramways in Montréal are taken out of service
1962
1966
1966
1967
1970
1976
Construction of the metro’s initial network begins
Of�cial inauguration of the Montréal métro
Inauguration of metro Yellow line for Expo 67
The last trolleybuses in Montréal are taken out of service
The CTM becomes the Commission de transport de la Communauté urbaine de Montréal (CTCUM)
Extension of métro Green line for the Olympic Games
1980
1984
Creation of the CTCUM paratransit service for the handicapped
Ridership record (2 million) set during a visit by Pope John-Paul II at Jarry park
1985
2002
The CTCUM becomes the Société de transport de la Communauté urbaine de Montréal (STCUM)
1986Inauguration of métro Blue line
The STCUM becomes the Société de transport de Montréal (STM)
2007Inauguration of métro in Laval
2011 marked 150 years of public transportation in montréal.

in 2011, we celebrated our 150th anniversary.
to find out more,go to 150stm.info

in 2011, we celebrated our 150th anniversary.

1stm2011 annual financial report
table of contents
introduction
Acknowledgements 3
Members of the Board of Directors 4
Members of the Audit Committee 5
Organization of the STM 6
Message from Management 10
Analysis of the Consolidated Financial Statements 13
financial information
Management’s Responsibility for Financial Reporting 21
Auditor General of Montréal Report 22
Independent Auditors’ Report 24
Consolidated Financial Statements
Consolidated Statement of Operations 27
Reconciliations for Tax Purposes
Consolidated Operating Surplus for Tax Purposes 28
Consolidated Investing Surplus (Deficit) for Tax Purposes 29
Consolidated Statement of Financial Position 30
Consolidated Statement of Change in Net Debt 31
Consolidated Statement of Cash Flows 32
Consolidated Expenses by Item 33
Notes to the Consolidated Financial Statements 34
Supplementary Tables
Table 1 - Consolidated Accumulated Surplus 57
Table 2 - Consolidated Total Net Long-Term Indebtedness 61
unaudited supplementary information
Consolidated Results of Operations 63
Consolidated Revenues by Type 64
Consolidated Expenses by Function 67
Financing of Capital Assets 69
Long-Term Debt 70
Financial Ratios 72

2 stm2011 annual financial report
introduction

3stm2011 annual financial report
acknowledGementsThe production of the 2011 Annual Financial Report involved a collaborative effort of many employees in the Finance and Control Executive Directorate. Thank you to everyone who contributed, particularly the Financial Management and Systems Framework Directorate.
angèle dubé, caDirector
lison lefebvre, caDivision Head
nicole racine, caUnit Head
véronique harvey, camichel bergeron, caalain sansregret, caCorporate Advisors
marie-claude champagne, cma marie-claude lamarre, ca alain bouchard Advisors
Jean-claude Joseph, cGasophie tremblayAnalysts
stéphanie deslongchamps rémi desrochers anne-marie samson Technicians
luc tremblay, caTreasurer and Executive Director Finance and Control

4 stm2011 annual financial report
michel labrecque Chairman Representative for public transit users
marvin rotrand Vice-Chairman Councillor of the City of Montreal Borough of Côte-des-Neiges /Notre-Dame-de-Grâce bernard blanchet Borough Councillor City of Montreal/ Borough of Lachine
francesco mieleCouncillor of the City of Montreal -District of Côte-de-Liesse Borough of Saint-Laurent
edward Janiszewski Mayor of Dollard-des-Ormeaux dominic perri Councillor of the City of Montreal Borough of Saint-Léonard monica ricourt Borough Councillor - District of Ovide-ClermontBorough of Montréal-Nord marie turcotte Representative for paratransit users
claudia lacroix perron Representative for public transit users –below age 35
members of the board of directors

5stm2011 annual financial report
members of the audit committee
yves Gauthier, fca Chairman Director, International Programs CCAF – FCVI inc. michel labrecque Vice-Chairman Chairman of the Board of Directors francesco miele Member Councillor of the City of Montreal - District of Côte-de-Liesse Borough of Saint-Laurent yves J. beauchesne, ca, mba, d. fisc. External Member Senior Vice-President - Finance and Administration DATSIT Studios inc.

6 stm2011 annual financial report
missionA public transit authority, the Société de transport de Montréal (hereafter the “Société”) is a driver of economic development in the Montreal area and contributes to the quality of life of citizens as well as to sustainable development.
It develops and operates an integrated transit system for users and provides courteous, reliable, fast, safe and comfortable transportation via bus and metro as well as through its paratransit services.
Passengers, employees, and institutional and business partners are proud of their association with the Société, as it is known for providing quality service at a fair price.
GovernanceThe Board of Directors of the Société is appointed by the City of Montreal’s Urban Agglomeration Council from among the members of its regular council and the councils of other municipalities within the agglomeration. In addition, three Board members are selected from among the agglomeration residents, namely two users of public transit services and one user of paratransit services. In appointing the two public transit users, at least one of the appointees must be below age 35 at the time of appointment. The Chairman of the Board, Michel Labrecque, performs his duties on a full-time basis.
The Board’s membership is representative of the values of diversity and plurality advocated by the Société. The Board is made up of three women and six men, consisting of six municipal elected officials and three passenger representatives.
roles and responsibilities of the board of directorsThe Board of Directors exercises the functions and powers of the Société and sets the key directions. It adopts the strategic development plan for public transit on its territory and each year adopts a budget, workforce plan, and three-year capital expenditures programs. It establishes the different types of passes and sets the fares. It approves, abolishes or replaces public transit lines and approves permanent changes to routes. It also approves the consolidated financial statements of the Société.
board of director commitees and their roles
To ensure the sound governance of the Société and obtain assistance in exercising its functions, the Board set up eight technical committees, each of which focuses on a specific area. Most of these committees were created between 2006 and 2008, as part of a review of governance rules, to ensure that the Société performs its activities effectively. They consist of Board of Director members and independent external members.
The Chairman of the Board is an ex officio member of all the committees. The general secretary attends all the meetings and serves as the permanent secretary on all committees without actually being a member.
orGanization of the stm
7stm2011 annual financial report
orGanization of the stm audit committee
The Audit Committee’s mandate is to examine the needs, methods and solutions relevant to assuring the Board of Directors that the Société’s financial affairs are being managed in an effective, efficient and economical manner and to make sure the information needed to accurately reflect the organization’s activities and results is available. It examines and reviews the consolidated financial statements on behalf of the Board, recommends they be approved by the Board, and recommends the appointment of independent auditors.
finance committee
The Finance Committee’s mandate is to examine the needs, methods and solutions relevant to managing the Société’s financial activities and to submit recommendations to the Board. In so doing, it examines the financial framework that supports the Société’s business plan and reviews the budget, three-year capital expenditures program and related funding requirements.
Governance and ethics committee
The Governance and Ethics Committee’s mandate is to examine the needs, methods and solutions relevant to embedding sound governance and ethics into the Société’s activities and to submit recommendations to the Board.
human resources committee
The Human Resources Committee’s mandate is to examine the needs, methods and solutions relevant to managing the Société’s human resources and to submit recommendations to the Board.
customer service committee
The Customer Service Committee’s mandate is to examine the needs, methods and solutions relevant to the public transit services that the Société provides to passengers and to submit recommendations to the Board. Two subcommittees were formed to specifically address matters of accessibility and diversity. To gauge passenger satisfaction, the committee organizes public consultations every year.
8 stm2011 annual financial report
asset maintenance, maJor proJects, and environment committee
This committee’s mandate is to examine the needs, methods and solutions relevant to maintaining the Société’s assets (operating equipment and systems, infrastructures and computer equipment), to executing the major projects needed to carry out the Société’s business plan, and to managing the environmental policy. The committee also submits recommendations to the Board.
operational committee
The Operational Committee’s mandate is to examine the needs, methods and solutions relevant to managing the Société’s operations and to submit recommendations to the Board.
arts and heritaGe committee
The Arts and Heritage Committee’s mandate is to promote and incorporate art into the Société’s transit system, to focus on the protection, conservation, proper use and promotion of the Société’s heritage property, and to submit recommendations to the Board.
transGesco lp (commercial activities)
The Board of Partners of Transgesco LP, three members of which are on the Société’s Board of Directors, sets its strategic direction and adopts its strategic development plan. In addition to preparing its own financial statements, Transgesco LP consolidates the following entities: Société en commandite Transconseil (99.9 %-owned) and its general partner 9141-1348 Québec Inc. (wholly owned), Société en commandite Collectif Média (99.9 %-owned) and its general partner 9211-8512 Québec Inc. (wholly owned), and Société en commandite Transimmobilier (99.9 %-owned) and its general partner 9223-1240 Québec Inc. (wholly owned).
orGanization of the stm
9stm2011 annual financial report
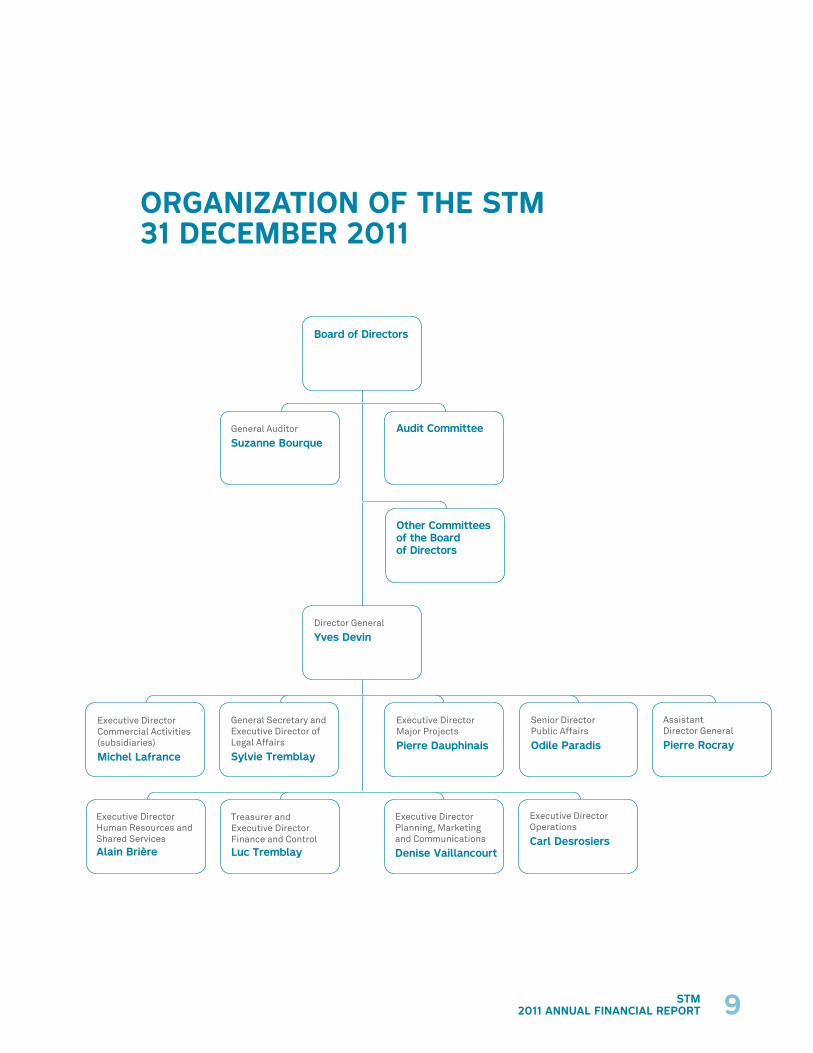
yves devin
Director General
Yves Devin
Board of Directors
Audit Committee
Other Committeesof the Board of Directors
General Auditor
Suzanne Bourque
Treasurer andExecutive DirectorFinance and ControlLuc Tremblay
Executive DirectorMajor Projects
Pierre Dauphinais
Assistant Director General
Pierre Rocray
General Secretary and Executive Director of Legal Affairs
Sylvie Tremblay
Executive DirectorCommercial Activities(subsidiaries)
Michel Lafrance
Senior DirectorPublic Affairs
Odile Paradis
Executive DirectorPlanning, Marketing and Communications
Denise Vaillancourt
Executive DirectorOperations
Carl Desrosiers
Executive DirectorHuman Resources and Shared ServicesAlain Brière
orGanization of the stm 31 december 2011

10 stm2011 annual financial report
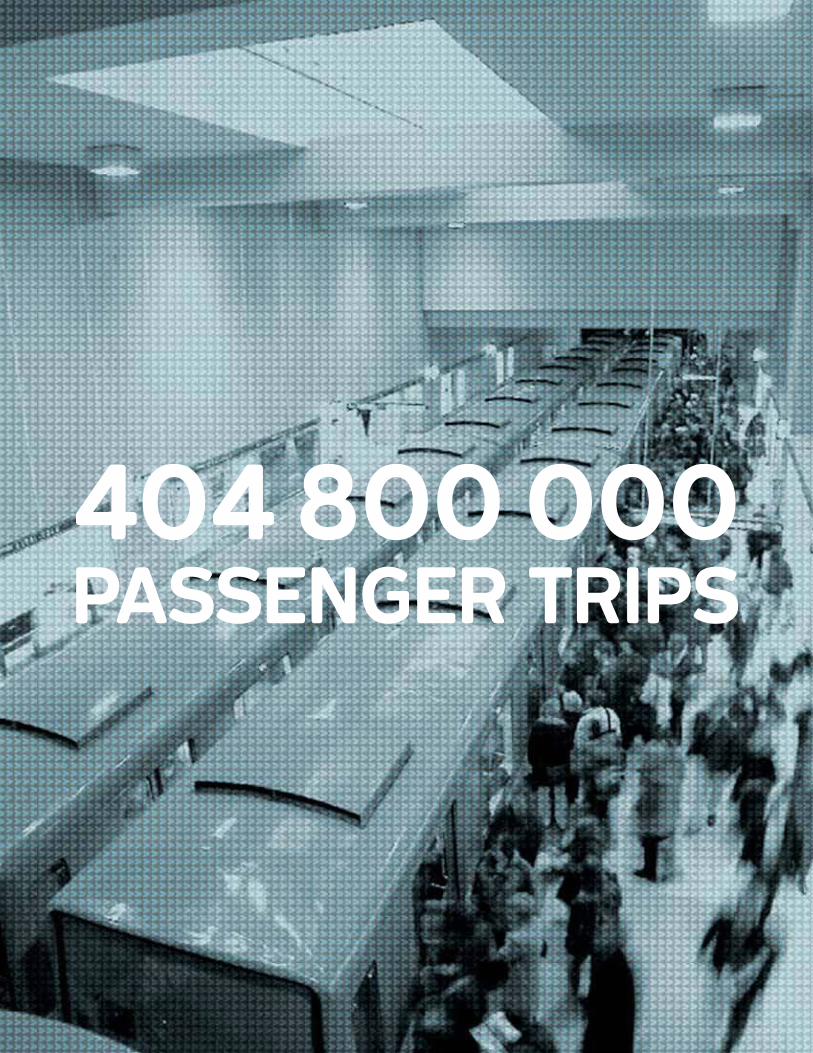
With 404.8 million passenger trips on its bus and metro system in 2011, which represents an increase of 16.2 million trips or 4.2 % versus 2010—an all-time record in the history of Montreal public transit—the STM’s efforts to develop services and increase ridership have clearly produced results.
Much of this excellent performance is due to the public transit service improvement program (PASTEC), funded in equal parts by the Ministère des Transports du Québec (MTQ) and the Montreal Urban Agglomeration. From 2007 to 2011, the STM increased its supply of public transit services by 24.9 % and ridership by 11.4 %. PASTEC originated from the MTQ’s Quebec Public Transit Policy, the goal of which was to raise the supply of public transit services by 16 % in order to achieve 8 % growth in ridership between 2007 and 2011. The MTQ confirmed its intention to extend this program in 2012 while work continues on a new program to be implemented in 2013.
The STM closed the year with a slight surplus, that is, $5.7 million operating surplus for tax purposes. The excellent ridership results generated $27.1 million in passenger revenues over and above the 2011 budget forecasts. These results should also be examined against the 2011 budget, which, although balanced, had anticipated $31.6 million in revenues from the share of the fuel tax to cover the structural deficit. However, fuel tax revenues only amounted to $11.8 million, representing a shortfall of $19.8 million in 2011.
Since 2010, contributions from the regions and non-Agglomeration municipalities have been subject to an agreement between the municipalities of the Montreal Metropolitan Community (MMC) in order to review the distribution of metropolitan sources of revenues. While the required legislative changes related to this agreement are being prepared, revenues from the 1.5¢/litre fuel tax implemented on May 1, 2010 are shared according to the terms and conditions set by decree for 2010 and 2011. The STM continues to receive the metropolitan subsidies paid by the AMT and the contribution from non-Agglomeration municipalities to fund the metro deficit. Although the fundamentals of this decree are valid, some parameters cause the share of the additional fuel tax allocated to the STM to be significantly less than forecast. In 2012, the STM intends to make the necessary representations to correct the unfavourable parameters.
In the area of spending, sustained cost-control efforts combined with the postponement of certain investments resulted in budget savings of more than $30.0 million on expenses and allocations for tax purposes.
messaGe from manaGementa historic year
record ridership and better than expected results

11stm2011 annual financial report
Despite the period of global financial instability, rating agencies Moody’s and Standard & Poor’s have once again recognized the quality, efficiency and performance of the STM’s management and maintained its excellent credit ratings of Aa2 and A+.
In 2011, the STM made significant capital investments. The year’s main acquisitions consisted of $167.4 million in bus purchases, $70.4 million for the renovation program for fixed equipment in the metro, $25.2 million for the project to prepare the plans and specifications as well as the infrastructures that will serve to maintain the new metro cars, $22.7 million in engineering and land acquisition costs to add a new bus depot, and $15.6 million for the metro station renovation program to replace and upgrade metro infrastructures.
In order to meet the objectives of its 2020 Strategic Plan, the STM depends on the financial support of its partners, provincial and federal governments, the Montreal Urban Agglomeration and the Montreal Metropolitan Community. The plan calls for total investments of $11.5 billion. Despite the importance of funding from partners, these investments will have a significant impact on debt servicing. Unless there are significant changes to the nature and level of current financial resources, funding will, however, remain insufficient to meet the 2020 Strategic Plan objectives. The STM must therefore be able to count on current sources being increased and even on the creation of new dedicated, indexed and recurring sources of funding to finance the development of its service supply, implement new modes of transportation and invest in the replacement of its aging infrastructures. This will ensure that the STM carries out its 2020 Strategic Plan and makes public transit a sustainable success.
messaGe from manaGement (cont’d)
yves devin, fellow cria Director General
luc tremblay, caTreasure and Executive Director Finance and Control

analysis of the consolidated financial statements
13stm2011 annual financial report
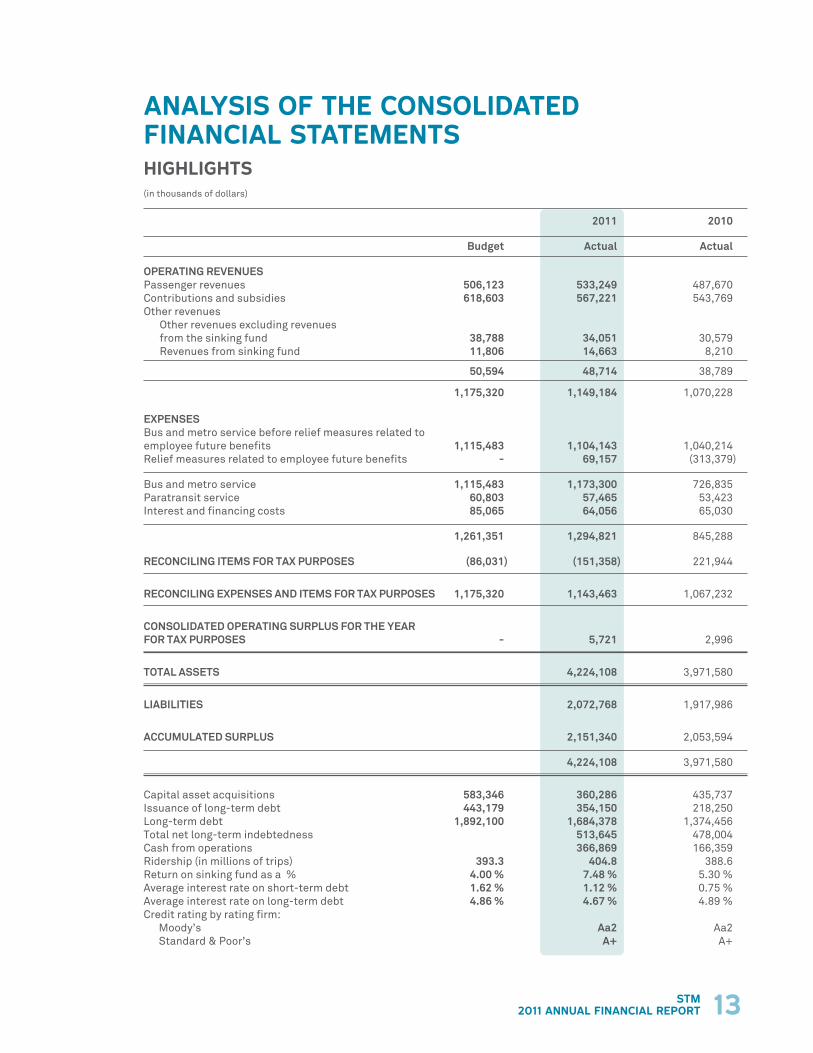
analysis of the consolidated financial statementshiGhliGhts(in thousands of dollars)
2011 2010
Budget Actual Actual
OPERATING REVENUES Passenger revenues 506,123 533,249 487,670Contributions and subsidies 618,603 567,221 543,769Other revenues
Other revenues excluding revenues from the sinking fund 38,788 34,051 30,579Revenues from sinking fund 11,806 14,663 8,210
50,594 48,714 38,789
1,175,320 1,149,184 1,070,228
EXPENSES Bus and metro service before relief measures related to employee future benefits 1,115,483 1,104,143 1,040,214Relief measures related to employee future benefits - 69,157 (313,379)
Bus and metro service 1,115,483 1,173,300 726,835Paratransit service 60,803 57,465 53,423Interest and financing costs 85,065 64,056 65,030
1,261,351 1,294,821 845,288
REcONcIlING ITEmS fOR TAX PURPOSES (86,031) (151,358) 221,944
REcONcIlING EXPENSES AND ITEmS fOR TAX PURPOSES 1,175,320 1,143,463 1,067,232
cONSOlIDATED OPERATING SURPlUS fOR THE YEAR fOR TAX PURPOSES - 5,721 2,996
TOTAl ASSETS 4,224,108 3,971,580
lIABIlITIES 2,072,768 1,917,986
AccUmUlATED SURPlUS 2,151,340 2,053,594
4,224,108 3,971,580
Capital asset acquisitions 583,346 360,286 435,737Issuance of long-term debt 443,179 354,150 218,250Long-term debt 1,892,100 1,684,378 1,374,456Total net long-term indebtedness 513,645 478,004Cash from operations 366,869 166,359Ridership (in millions of trips) 393.3 404.8 388.6Return on sinking fund as a % 4.00 % 7.48 % 5.30 %Average interest rate on short-term debt 1.62 % 1.12 % 0.75 %Average interest rate on long-term debt 4.86 % 4.67 % 4.89 %Credit rating by rating firm: Moody’s Aa2 Aa2 Standard & Poor’s A+ A+
14 stm2011 annual financial report
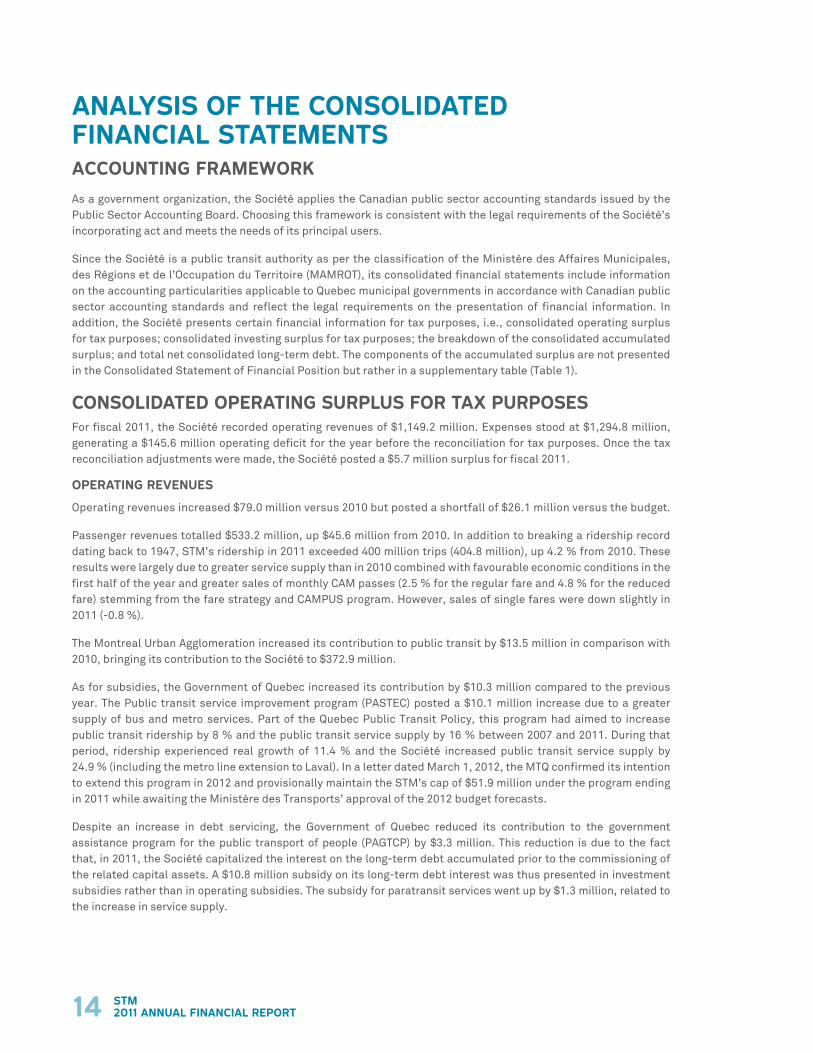
analysis of the consolidated financial statementsaccountinG framework
As a government organization, the Société applies the Canadian public sector accounting standards issued by the Public Sector Accounting Board. Choosing this framework is consistent with the legal requirements of the Société’s incorporating act and meets the needs of its principal users.
Since the Société is a public transit authority as per the classification of the Ministère des Affaires Municipales, des Régions et de l’Occupation du Territoire (MAMROT), its consolidated financial statements include information on the accounting particularities applicable to Quebec municipal governments in accordance with Canadian public sector accounting standards and reflect the legal requirements on the presentation of financial information. In addition, the Société presents certain financial information for tax purposes, i.e., consolidated operating surplus for tax purposes; consolidated investing surplus for tax purposes; the breakdown of the consolidated accumulated surplus; and total net consolidated long-term debt. The components of the accumulated surplus are not presented in the Consolidated Statement of Financial Position but rather in a supplementary table (Table 1).
consolidated operatinG surplus for tax purposesFor fiscal 2011, the Société recorded operating revenues of $1,149.2 million. Expenses stood at $1,294.8 million, generating a $145.6 million operating deficit for the year before the reconciliation for tax purposes. Once the tax reconciliation adjustments were made, the Société posted a $5.7 million surplus for fiscal 2011.
operatinG revenues
Operating revenues increased $79.0 million versus 2010 but posted a shortfall of $26.1 million versus the budget.
Passenger revenues totalled $533.2 million, up $45.6 million from 2010. In addition to breaking a ridership record dating back to 1947, STM’s ridership in 2011 exceeded 400 million trips (404.8 million), up 4.2 % from 2010. These results were largely due to greater service supply than in 2010 combined with favourable economic conditions in the first half of the year and greater sales of monthly CAM passes (2.5 % for the regular fare and 4.8 % for the reduced fare) stemming from the fare strategy and CAMPUS program. However, sales of single fares were down slightly in 2011 (-0.8 %).
The Montreal Urban Agglomeration increased its contribution to public transit by $13.5 million in comparison with 2010, bringing its contribution to the Société to $372.9 million.
As for subsidies, the Government of Quebec increased its contribution by $10.3 million compared to the previous year. The Public transit service improvement program (PASTEC) posted a $10.1 million increase due to a greater supply of bus and metro services. Part of the Quebec Public Transit Policy, this program had aimed to increase public transit ridership by 8 % and the public transit service supply by 16 % between 2007 and 2011. During that period, ridership experienced real growth of 11.4 % and the Société increased public transit service supply by 24.9 % (including the metro line extension to Laval). In a letter dated March 1, 2012, the MTQ confirmed its intention to extend this program in 2012 and provisionally maintain the STM’s cap of $51.9 million under the program ending in 2011 while awaiting the Ministère des Transports’ approval of the 2012 budget forecasts.
Despite an increase in debt servicing, the Government of Quebec reduced its contribution to the government assistance program for the public transport of people (PAGTCP) by $3.3 million. This reduction is due to the fact that, in 2011, the Société capitalized the interest on the long-term debt accumulated prior to the commissioning of the related capital assets. A $10.8 million subsidy on its long-term debt interest was thus presented in investment subsidies rather than in operating subsidies. The subsidy for paratransit services went up by $1.3 million, related to the increase in service supply.
15stm2011 annual financial report
analysis of the consolidated financial statementsoperatinG revenues (cont’d)
The regional contributions and contributions from non-Agglomeration municipalities decreased by $0.4 million year over year. This decrease is largely due to two items: a $1.7 million decrease in the share of the fuel tax and a $1.2 million increase in contributions from non-Agglomeration municipalities stemming from the 2007-2011 metro agreement. Since 2010, contributions from the regions and non-Agglomeration municipalities were subject to an agreement between transit operating authorities (AOTs) of the MMC in order to review the distribution of metropolitan sources of revenue.
While the required legislative changes related to this agreement are being prepared, revenues from the 1.5¢/litre fuel tax emplemeted on May 1, 2010 are shared according to the terms and conditions set by decree for 2010 and 2011. The STM continues to receive the metropolitain subsidies paid by AMT and the contribution from non-Agglomeration municipalities to finance the metro deficit.
Although the fundamentals of this agreement are sound, certain parameters have resulted in a lower-than-anticipated share of the fuel tax being allocated to STM. Specifically, the STM’s budget had forecast an amount of $31.6 million for 2011 whereas the amounts recognized in the Société’s consolidated financial statements totalled $11.8 million ($15.6 million for 2011 minus a $3.8 million adjustment for 2010). STM intends to make the necessary representations to correct the unfavourable parameters.
Other revenues increased $9.9 million from 2010, particularly due to a $6.5 million increase in revenues from the sinking fund and $2.2 million growth in the advertising revenues of Transgesco Limited Partnership. In 2010, the Limited Partnership’s advertising revenues had been included in the share of profit from a subsidiary.
expenses
When compared to 2010, expenses were up $449.5 million. This significant increase stems from a $446.5 million increase in bus and metro service costs. Paratransit service expenses were up $4.0 million and interest and financing costs were down $1.0 million. The substantial $446.5 million increase in bus and metro service expenses stems from the application of an accounting standard on employee future benefits, which resulted in the recording of a $69.2 million increase in 2011 compared to a significant $313.4 million decrease in 2010. As per the tax relief permitted by MAMROT, this change in expense does not affect the year’s operating surplus for tax purposes, as it was offset by an allocation to a provision for future amounts. If not for this change in employee future benefits expense, the actual bus and metro service expense would have been $1,104.1 million compared to $1,040.2 million in 2010, an increase of $63.9 million and a favourable variance of $11.4 million against the budget.
Excluding the above-described change in employee future benefits expense, the year-over-year increase in bus and metro service costs are essentially tied to the greater supply of public transit services, which resulted in a 4.6 % increase in bus kilometrage and additional costs of $23.3 million (50 % of which is assumed by the Government of Quebec), and a payroll indexing exercise that resulted in an increase of $14.7 million, as set out in the collective agreements.
The year-over-year increase in paratransit service expenses resulted from an overall growth of 6.5 % in trips carried out largely by the taxi service.
Although $354.2 million in new long-term debt was issued to finance the investments needed to rehabilitate the Société’s aging infrastructures, there was a $1.0 million decrease in interest and financing costs, i.e., a $2.0 million decrease in interest on long-term debt and a $1.0 million increase in short-term financing costs. The decrease in interest on long-term debt was mainly attributable to the capitalized interest on capital assets in progress totalling $14.3 million following a significant long-term financing operation carried out to cover the liquidity needs as a result of ($172.6 million) deposits made as part of the procurement contract for the new metro cars. Excluding the

16 stm2011 annual financial report
analysis of the consolidated financial statementsexpenses (cont’d)
capitalized long-term interest, the increase from 2010 would have been $12.3 million, owing largely to the new issuances in 2011 for a total impact of $7.9 million.
These financing costs were $21.0 million below budget, as the Société had anticipated greater investment and therefore greater borrowing in 2011. Certain investments were also entirely funded through SOFIL (Program for the financing of local infrastructure in Quebec), which reduced the funding needs.
consolidated investinG surplus (deficit) for tax purposesCapital asset acquisitions totalled $360.3 million in 2011, $223.1 million less than budgeted and $75.4 million less than in 2010. The variance against the budget stems mainly from a postponement of certain projects in the asset maintenance program for fixed equipment in the metro and the construction of new infrastructures due to the late approval of funding and smoothing of project costs required by the MTQ in order to lessen its 2011-2015 financial commitments.
As a direct consequence of the lower level of capital asset acquisitions, investment revenue totalled $243.4 million in 2011, representing an unfavourable variance of $227.4 million against the budget and $134.0 million year over year. The same is true for long-term financing, which was $48.4 million less than budgeted and $4.2 million less than in 2010.
Subsidies from the Government of Quebec totalled $225.7 million (i.e., $127.0 million from the government assistance program for the public transport of people, $95.6 million from the program for financing of local infrastructures in Quebec and $3.1 million from the assistance program for improving energy efficiency in passenger road transportation). The balance of funding was provided by the Société (i.e., $97.0 million from the long-term debt issued in 2011 or forthcoming and $20.0 million from its operating activities), by the Montreal Urban Agglomeration (i.e., $16.1 million from the program for financing of local infrastructures in Quebec) and by the federal government (i.e., $1.5 million from the Building Canada fund).
consolidated statement of financial position
financial assets
Financial assets decreased $14.0 million from 2010, mainly due to a $25.0 million decrease in contributions receivable from the Montreal Urban Agglomeration, a $29.0 million decrease in regional contributions and contributions from non-Agglomeration municipalities receivable, and a $63.2 million decrease in the employee future benefits asset offset by a net increase of $105.3 million in sinking fund investments. The Société’s financial assets consist essentially of the following:
sinkinG fund investments
The sinking fund investments constitute investments in 16 funds earmarked for the repayment of certain long-term debts. At December 31, 2010, the sinking fund investments totalled $261.1 million. During 2011, contributions totalled $90.6 million ($83.7 million in 2010), and the investments generated revenues of $14.7 million ($8.2 million in 2010), representing a return of 7.48 % (5.30 % in 2010), which is above the 4.0 % target set for 2011. This excellent performance was due to a sound investment strategy. The balance of the sinking fund investments thus totalled $366.4 million as at December 31, 2011.

17stm2011 annual financial report
analysis of the consolidated financial statementscontribution receivable from the montreal urban aGGlomeration
The $25.0 million decrease was due to the equivalent decrease in the contribution receivable from the SOFIL program as a result of the lower investments in 2011 versus 2010, primarily with respect to bus purchases.
subsidies receivable
The $11.6 million increase in subsidies receivable is related to the capital asset subsidy amounts receivable from the Government of Quebec under various assistance programs and those receivable from the Government of Canada. There was a $111.4 million increase in receivables to be allocated to the repayment of long-term debt arising from massive infrastructure investment; a $70.2 million decrease in subsidies receivable under the SOFIL program stemming from a smaller amount of eligible expenses under this program, mainly related to the bus purchases; and a $34.3 million decrease in subsidies receivable under the PASTEC program.
employee future benefits asset
This item consists of amounts in the Statement of Financial Position that were recognized with respect to pension plans as well as other supplementary retirement benefits and post-employment benefits. As at December 31, 2011, the employee future benefits asset stood at $251.4 million ($314.6 million in 2010). The amount of $251.4 million is comprised of the following: a $361.9 million asset for the pension plans and a $110.5 million liability for supplementary retirement benefits and post-employment benefits.
The $361.9 million asset for the pension plans stems essentially from $380.6 million in unamortized actuarial losses that will be amortized in subsequent years over the expected average remaining service life (EARSL). These losses constitute the limit on the accrued benefit asset, as required under the employee future benefits accounting standards. The $380.6 million decrease in this asset ($445.1 million in 2010) results in a higher employee future benefits expense in the Statement of Operations. As per the tax relief permitted by MAMROT following the financial crisis that was prevailing in 2008, this change in expense was allocated to the provision for future amounts in the Consolidated Operating Surplus for Tax Purposes.
With respect to other employee future benefits (supplementary retirement benefits and post-employment benefits), the liability increased by $2.4 million, representing the difference between the $4.4 million in contributions paid and the $6.9 million expense, bringing the liability to $110.5 million.
liabilities
Liabilities rose $154.8 million, mainly due to a $309.9 million increase in long-term debt and a $158.6 million decrease in short-term loans. The increase in liabilities was directly related to the capital asset acquisitions.
lonG-term debt
As at December 31, 2010, long-term debt stood at $1,374.4 million. In 2011, the Société issued $354.2 million in new long-term debt and repaid $44.2 million of its long-term debt. Therefore, as at December 31, 2011, long-term debt stood at $1,684.4 million.
Total net indebtedness, which stood at $513.6 million in 2011, increased by $35.6 million from 2010, whereas the net value of the Société’s capital assets increased by $196.5 million.

18 stm2011 annual financial report
analysis of the consolidated financial statementsnon-financial assets
Non-financial assets rose by $266.5 million owing mainly to a $196.5 million increase in capital assets and to a $76.2 million deposits on the new metro cars.
capital assets
This item represents the net value of the Société’s capital assets. The change between the 2010 value of $2,220.5 million and the 2011 value of $2,417.0 million stems from $360.4 million in acquisitions less $159.9 million in amortization and the $4.0 million unamortized value of disposed tangible capital assets.
The year’s main acquisitions consisted of $167.4 million for the purchase of 273 buses, $70.4 million for the program to recondition fixed metro equipment, $25.2 million for the project to prepare the plans and specifications as well as the infrastructures that will serve to maintain the new metro cars that will be replaced over the coming years, $22.7 million in costs related to a new bus depot, and $15.6 million for the metro station renovation program to replace and upgrade metro infrastructures. The remaining balance of $59.1 million consists of smaller-scale projects.
purchase of metro cars
On October 7, 2010, the Quebec National Assembly unanimously voted for special legislation permitting the Société to award, to a consortium, a contract for the purchase of 468 metro cars.
Under resolution CA-2010-322, the Société’s Board of Directors approved a loan by-law of $2,474.4 million on October 18, 2010 to cover the estimated cost of the cars ($1,235.5 million), related expenses ($970.9 million) and the costs of modifying metro repair centres and equipment ($268.0 million), i.e., modifications that were made necessary by the acquisition of these new cars.
On October 22, 2010, the consortium and the Société signed a contract to purchase 468 metro cars at a unit price set at $2.64 million per car in December 2009, pending approval of the loan by-law by the various government authorities and pending confirmation that the Ministère des Transport du Québec would finance up to 75 % of the purchase costs. The STM obtained these approvals on November 15, 2010.
With all the conditions having been met, the Société’s Board of Directors held an extraordinary meeting on November 15 to confirm, by way of resolution (CA-2010-357), the commencement of the contract as at November 16, 2010 ($1,811.6 million) and the setting of the final purchase price of the cars ($2.54 million), as the contract had provided for a purchase price review clause to adjust the 40 % portion of the price subject to foreign currency fluctuations (EURO and USD). Meanwhile, the Société, through a hedging strategy, had protected itself against foreign currency fluctuations that proved favourable between the date on which the initial price per car ($2.64 million) had been set in December 2009 and the date on which the loan by-law was adopted.
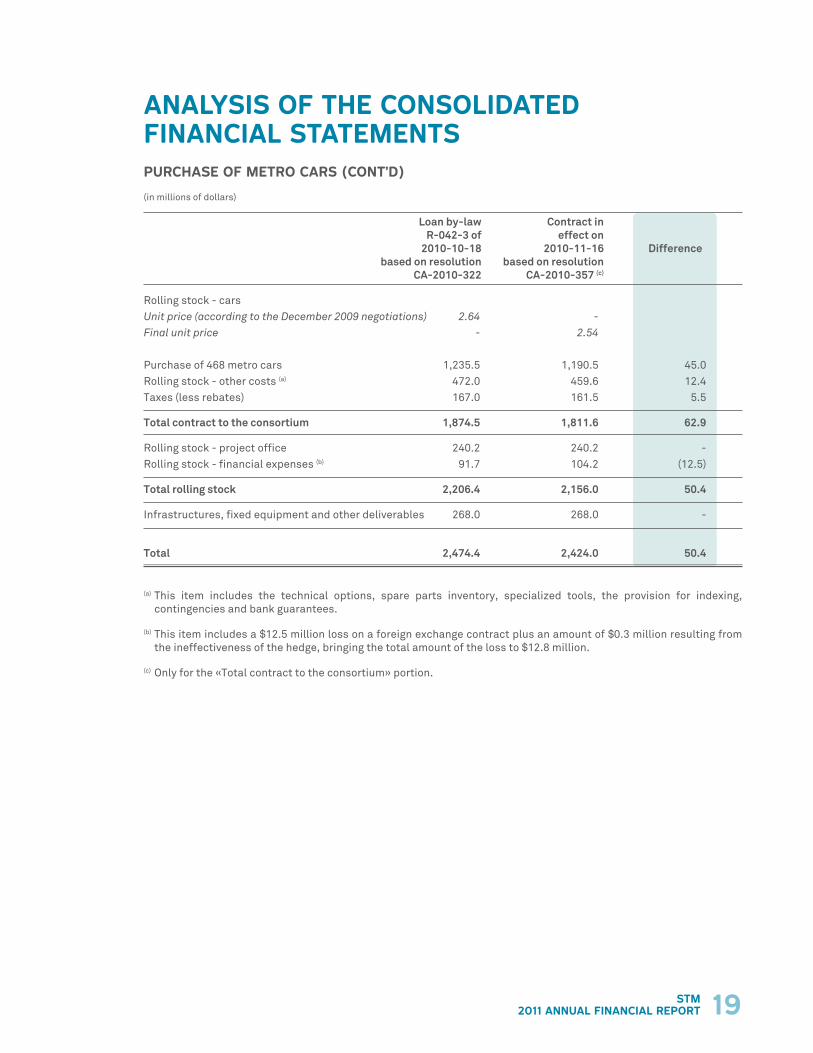
Through intense negotiations undertaken for this major capital asset project and proactive management of the associated financial risks, the total budget was reduced by $50.4 million when compared to the initial forecast.
19stm2011 annual financial report
(in millions of dollars)
loan by-law contract in R-042-3 of effect on 2010-10-18 2010-11-16 Difference based on resolution based on resolution cA-2010-322 cA-2010-357 (c)
Rolling stock - cars Unit price (according to the December 2009 negotiations) 2.64 - Final unit price - 2.54 Purchase of 468 metro cars 1,235.5 1,190.5 45.0Rolling stock - other costs (a) 472.0 459.6 12.4Taxes (less rebates) 167.0 161.5 5.5
Total contract to the consortium 1,874.5 1,811.6 62.9
Rolling stock - project office 240.2 240.2 -Rolling stock - financial expenses (b) 91.7 104.2 (12.5)
Total rolling stock 2,206.4 2,156.0 50.4
Infrastructures, fixed equipment and other deliverables 268.0 268.0 -
Total 2,474.4 2,424.0 50.4
(a) This item includes the technical options, spare parts inventory, specialized tools, the provision for indexing, contingencies and bank guarantees.
(b) This item includes a $12.5 million loss on a foreign exchange contract plus an amount of $0.3 million resulting from the ineffectiveness of the hedge, bringing the total amount of the loss to $12.8 million.
(c) Only for the «Total contract to the consortium» portion.
analysis of the consolidated financial statementspurchase of metro cars (cont’d)
financial information

21stm2011 annual financial report
financial information
manaGement’s responsibility for financial reportinG
Pursuant to sections 136 and 138 of An act respecting public transit authorities (R.S.Q. chapter S-30.01), the consolidated financial statements for the year ended December 31, 2011 included in the Annual Financial Report of the Société de transport de Montréal were certified by the treasurer and submitted at a meeting of the Board of Directors on May 2, 2012.
The consolidated financial statements and all other information in this financial report are the responsibility of the Société’s management. Management has also ensured that there is consistency between the consolidated financial statements and all other information disclosed in the financial report.
The consolidated financial statements contain certain amounts that are based on the use of professional judgment and estimates, the presentation of which gives due consideration to their materiality. Management has established these amounts in a reasonable manner so as to ensure that the consolidated financial statements present fairly, in all material respects, the financial position of the Société.
The Société’s management maintains internal accounting and administrative control systems to ensure the integrity and objectivity of the financial information. Management considers that these internal control systems, the purpose of which is to provide a reasonable degree of certainty that the financial information is pertinent, reliable and exact; that the policies of the organization are followed; that operations are carried out in accordance with the appropriate authorizations; and that the Société’s assets are properly recorded and safeguarded, provide reasonable assurance that the accounting records are reliable and an appropriate foundation for the preparation of the consolidated financial statements.
The Board of Directors exercises its responsibility with regard to the consolidated financial statements contained in the financial report primarily through its audit committee, which is composed of members of the Board of Directors and external members. The Audit Committee examines the consolidated financial statements and recommends their approval by the Board of Directors.
The consolidated financial statements have been audited jointly by the Auditor General of the Ville de Montréal and by Samson Bélair/Deloitte & Touche s.e.n.c.r.l., whose services were retained by the Board of Directors on the recommendation of the Audit Committee.
luc tremblay, ca angèle dubé, caTreasurer and Executive Director Director Finance and Control Financial Management and Systems Framework

22 stm2011 annual financial report
auditor General of montréal reportTo the members of the Board of Directors of Société de transport de Montréal
I have audited the accompanying consolidated financial statements of the Société de transport de Montréal (the «Société»), which comprise the consolidated statement of financial position as at December 31, 2011, and the consolidated statements of operations, change in net debt and cash flows for the year then ended, and a summary of significant accounting policies and other explanatory information.
manaGement’s responsibility for the financial statements
Management is responsible for the preparation and fair presentation of these consolidated financial statements in accordance with Canadian public sector accounting standards, and for such internal control as management determines is necessary to enable the preparation of consolidated financial statements that are free from material misstatement, whether due to fraud or error.
auditors’ responsibility
My responsibility is to express an opinion on these consolidated financial statements based on my audit. We conducted our audit in accordance with Canadian generally accepted auditing standards. Those standards require that we comply with ethical requirements and plan and perform the audit to obtain reasonable assurance about whether the consolidated financial statements are free from material misstatement.
An audit involves performing procedures to obtain audit evidence about the amounts and disclosures in the consolidated financial statements. The procedures selected depend on the auditor’s judgment, including the assessment of the risks of material misstatement of the consolidated financial statements, whether due to fraud or error. In making those risk assessments, the auditor considers internal control relevant to the entity’s preparation and fair presentation of the consolidated financial statements in order to design audit procedures that are appropriate in the circumstances, but not for the purpose of expressing an opinion on the effectiveness of the entity’s internal control. An audit also includes evaluating the appropriateness of accounting policies used and the reasonableness of accounting estimates made by management, as well as evaluating the overall presentation of the consolidated financial statements.
I believe that the audit evidence I have obtained is sufficient and appropriate to provide a basis for my audit opinion.

23stm2011 annual financial report
auditor General of montréal report
opinion
In my opinion, the consolidated financial statements present fairly, in all material respects, the financial position of the Société de transport de Montréal as at December 31, 2011, and of the results of its operations, change in its net debt, and cash flows for the year then ended, in accordance with Canadian public sector accounting standards.
observations
Without modifying my opinion, I draw attention to “Table 1 – Accumulated surplus” of the consolidated financial statements in which the Société includes certain financial information prepared for tax purposes. Management has decided to present this information, which is not required under Canadian public sector accounting standards, as it deems such information necessary in order to provide a more appropriate and comprehensive analysis of the results of operations.
Auditor General of Montréal,Jacques bergeron, ca auditor
Montréal, May 2, 2012
24 stm2011 annual financial report
independent auditors’ report
To the members of the Board of Directors of Société de transport de Montréal
We have audited the accompanying consolidated financial statements of the Société de transport de Montréal (the «Société»), which comprise the consolidated statement of financial position as at December 31, 2011, and the consolidated statements of operations, change in net debt and cash flows for the year then ended, and a summary of significant accounting policies and other explanatory information.
manaGement’s responsibility for the financial statements
Management is responsible for the preparation and fair presentation of these consolidated financial statements in accordance with Canadian public sector accounting standards, and for such internal control as management determines is necessary to enable the preparation of consolidated financial statements that are free from material misstatement, whether due to fraud or error.
auditors’ responsibility
Our responsibility is to express an opinion on these consolidated financial statements based on our audit. We conducted our audit in accordance with Canadian generally accepted auditing standards. Those standards require that we comply with ethical requirements and plan and perform the audit to obtain reasonable assurance about whether the consolidated financial statements are free from material misstatement.
An audit involves performing procedures to obtain audit evidence about the amounts and disclosures in the consolidated financial statements. The procedures selected depend on the auditor’s judgment, including the assessment of the risks of material misstatement of the consolidated financial statements, whether due to fraud or error. In making those risk assessments, the auditor considers internal control relevant to the entity’s preparation and fair presentation of the consolidated financial statements in order to design audit procedures that are appropriate in the circumstances, but not for the purpose of expressing an opinion on the effectiveness of the entity’s internal control. An audit also includes evaluating the appropriateness of accounting policies used and the reasonableness of accounting estimates made by management, as well as evaluating the overall presentation of the consolidated financial statements.
We believe that the audit evidence we have obtained is sufficient and appropriate to provide a basis for our audit opinion.

25stm2011 annual financial report
opinion
In our opinion, the consolidated financial statements present fairly, in all material respects, the financial position of the Société de transport de Montréal as at December 31, 2011, and of the results of its operations, change in its net debt, and cash flows for the year then ended, in accordance with Canadian public sector accounting standards.
observations
Without modifying our opinion, we draw attention to «Table 1 – Accumulated Surplus» of the consolidated financial statements, which states that the Société includes, in its consolidated financial statements, certain financial information prepared for tax purposes that is compliant with the model developed by the Ministère des Affaires municipales, des Régions et de l’Occupation du territoire. This information, which is not required under Canadian public sector accounting standards, is presented in order to provide a more appropriate and comprehensive analysis of the results of operations.
independent auditors’ report
samson bélair/deloitte & touche s.e.n.c.r.l.1CA auditor permit no. 10881
Montréal, May 2, 2012
1
consolidated financial statements as at december 31, 2011
27stm2011 annual financial report
2011 2010
Notes Budget Actual Actual
(unaudited)
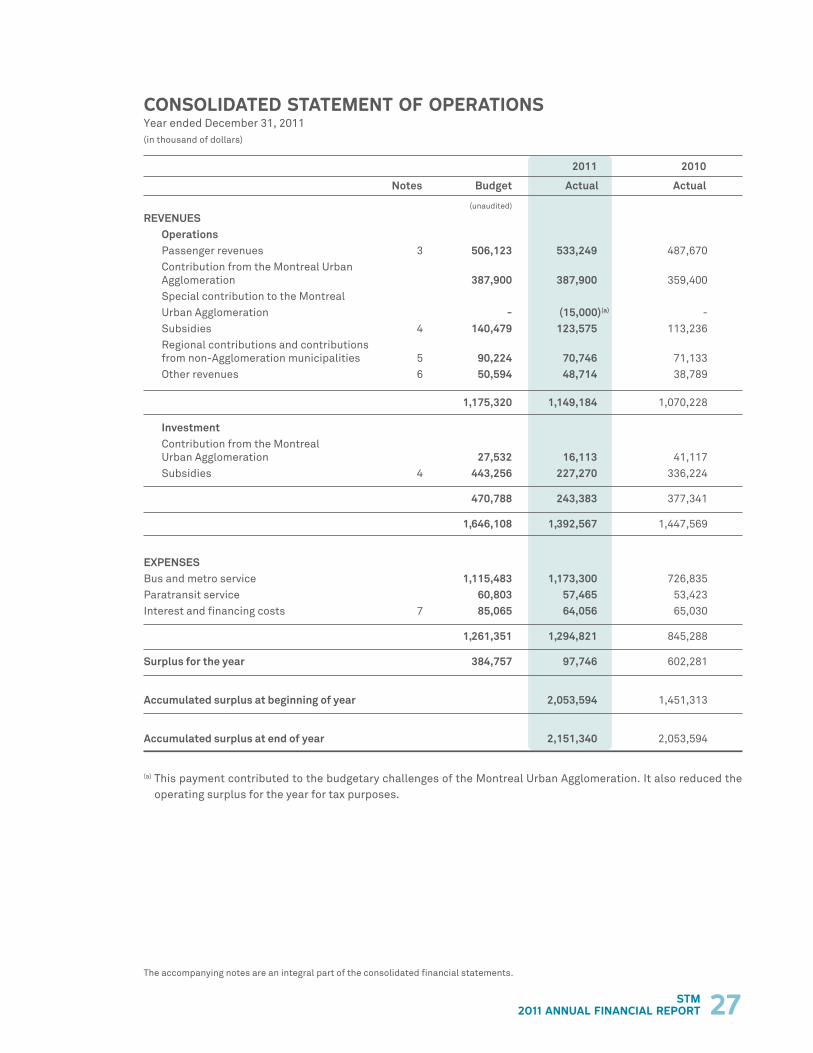
REVENUESOperationsPassenger revenues 3 506,123 533,249 487,670Contribution from the Montreal Urban Agglomeration 387,900 387,900 359,400Special contribution to the MontrealUrban Agglomeration - (15,000)(a) - Subsidies 4 140,479 123,575 113,236Regional contributions and contributions from non-Agglomeration municipalities 5 90,224 70,746 71,133Other revenues 6 50,594 48,714 38,789
1,175,320 1,149,184 1,070,228
InvestmentContribution from the Montreal Urban Agglomeration 27,532 16,113 41,117Subsidies 4 443,256 227,270 336,224
470,788 243,383 377,341
1,646,108 1,392,567 1,447,569
EXPENSESBus and metro service 1,115,483 1,173,300 726,835 Paratransit service 60,803 57,465 53,423Interest and financing costs 7 85,065 64,056 65,030
1,261,351 1,294,821 845,288
Surplus for the year 384,757 97,746 602,281
Accumulated surplus at beginning of year 2,053,594 1,451,313
Accumulated surplus at end of year 2,151,340 2,053,594
(a) This payment contributed to the budgetary challenges of the Montreal Urban Agglomeration. It also reduced the operating surplus for the year for tax purposes.
consolidated statement of operationsYear ended December 31, 2011(in thousand of dollars)
The accompanying notes are an integral part of the consolidated financial statements.

28 stm2011 annual financial report
2011 2010
Budget Actual Actual
(unaudited)
SURPlUS fOR THE YEAR 384,757 97,746 602,281Less: investment revenues (470,788) (243,383) (377,341)
Operating surplus (deficit) for the year before reconciliation for tax purposes (86,031) (145,637) 224,940
REcONcIlIATION fOR TAX PURPOSEScapital assetsProceeds from disposal - 4,296 7,909Amortization 152,000 159,873 158,852Loss (gain) on disposal - (289) 486
152,000 163,880 167,247
financingRepayment of long-term debt, net of refinancing (32,575) (44,228) (27,402) Subsidy on the repayment of long-term debt and on the contribution to the sinking fund 88,182 88,219 63,610Long-term financing of operating activities - - (1)
55,607 43,991 36,207
AllocationsInvesting activities (2,602) (21,130) (17,864) Sinking fund (116,623) (105,321) (91,877)Working capital fund (851) (1,326) 1,525Unrestricted operating surplus - 2,996 -Provision for future amounts (1,500) 68,268 (317,182)
(121,576) (56,513) (425,398)
86,031 151,358 (221,944)
Operating surplus for the year for tax purposes - 5,721 2,996
consolidated operatinG surplus for tax purposesYear ended December 31, 2011(in thousand of dollars)
The accompanying notes are an integral part of the consolidated financial statements.

29stm2011 annual financial report
2011 2010
Budget Actual Actual
(unaudited)
INVESTmENT REVENUES 470,788 243,383 377,341
REcONcIlIATION fOR TAX PURPOSEScapital assets
AcquisitionsBuildings (13,232) (22,617) (22,735) Metro infrastructures (150,809) (112,026) (209,688) Local and regional infrastructures (41,727) (437) (3,850) Rolling stock - metro cars - (3,295) - Rolling stock - buses (117,479) (167,445) (267,444) Rolling stock - service vehicles (3,736) (4,205) (3,041) Leasehold improvements - (1,475) - Office equipment and software (8,902) (9,343) 6,971 Machinery, tools and equipment (130,792) (11,052) (3,067) Capital assets in progress (116,669) (28,391) 67,117
(583,346) (360,286) (435,737)
financing Long-term financing of investing activities 109,956 61,569 65,767
Allocations Operating activities 2,602 21,130 17,864Balances available from closed loan by-laws - (1,128) -
2,602 20,002 17,864
(470,788) (278,715) (352,106)
Investing suplus (deficit) for the year for tax purposes - (35,332) 25,235
consolidated investinG surplus (deficit) for tax purposesYear ended December 31, 2011 (in thousands of dollars)
The accompanying notes are an integral part of the consolidated financial statements.

30 stm2011 annual financial report
Notes 2011 2010
fINANcIAl ASSETS Cash 23,705 23,565
Sinking fund investments 8 366,375 261,054
Contribution receivable from the Montreal Urban Agglomeration 16,113 41,117
Subsidies receivable 9 842,784 831,153
Regional contributions and contributions from non-Agglomeration municipalities receivable 10 28,238 57,216
Other receivables 11 41,433 46,572
Long-term investments 12 - 8,733
Employee future benefits asset 13 251,369 314,557
1,570,017 1,583,967
lIABIlITIESShort-term loans 14 172,853 331,414
Accounts payable and accrued liabilities 15 200,537 212,116
Special contribution payable to the Montreal Urban Agglomeration 15,000 -
Long-term debt 16 1,684,378 1,374,456
2,072,768 1,917,986
NET DEBT (502,751) (334,019)
NON-fINANcIAl ASSETSCapital assets 17 2,416,968 2,220,492
Inventories 40,983 36,161
Other non-financial assets 18 196,140 130,960
2,654,091 2,387,613
AccUmUlATED SURPlUS 2,151,340 2,053,594
Commitments (Note 22)Contingencies (Note 23)
consolidated statement of financial positionAs at December 31, 2011 (in thousands of dollars)
The accompanying notes are an integral part of the consolidated financial statements.
31stm2011 annual financial report
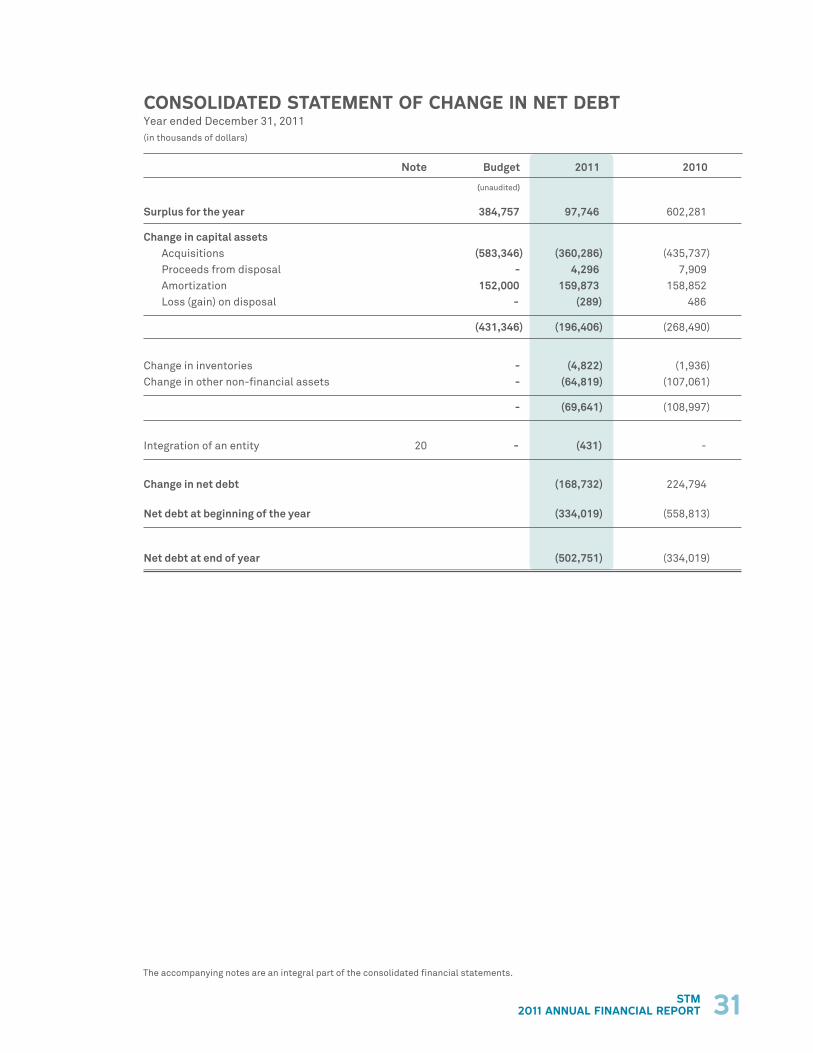
Note Budget 2011 2010
(unaudited)
Surplus for the year 384,757 97,746 602,281
change in capital assetsAcquisitions (583,346) (360,286) (435,737) Proceeds from disposal - 4,296 7,909 Amortization 152,000 159,873 158,852 Loss (gain) on disposal - (289) 486
(431,346) (196,406) (268,490)
Change in inventories - (4,822) (1,936) Change in other non-financial assets - (64,819) (107,061)
- (69,641) (108,997)
Integration of an entity 20 - (431) -
change in net debt (168,732) 224,794
Net debt at beginning of the year (334,019) (558,813)
Net debt at end of year (502,751) (334,019)
consolidated statement of chanGe in net debtYear ended December 31, 2011 (in thousands of dollars)
The accompanying notes are an integral part of the consolidated financial statements.

32 stm2011 annual financial report
Notes 2011 2010
Operating activitiesSurplus for the year 97,746 602,281 Non-cash items
Share of profit from a subsidiary - (17,218) Amortization of capital assets 159,873 158,852 Loss (gain) on disposal of capital assets (289) 486
257,330 744,401
Net change in non-cash items 19 109,539 (578,042)
366,869 166,359
capital investing activitiesAcquisitions (360,286) (435,737) Proceeds from disposal 4,296 7,909 Change in deposits for bus purchases 14,826 2,022 Change in deposits for metro car purchases (76,245) (96,316)
(417,409) (522,122)
Investing activitiesAmortization of premiums and discounts on sinking fund investments 4,375 772 Acquisition of sinking fund investments (109,696) (92,649) Distribution from a subsidiary - 13,490 Integration of an entity 20 6,561 -
(98,760) (78,387)
financing activitiesNet change in short-term loans (158,561) 244,453 Issuance of long-term debt 354,150 218,250 Repayment of long-term debt (44,228) (25,642) Change in issuance costs for long-term debt (1,921) 96
149,440 437,157
Increase in cash 140 3,007
cash at beginning of year 23,565 20,558
cash at end of year 23,705 23,565
The cash item consists solely of cash.
consolidated statement of cash flowsYear ended December 31, 2011 (in thousands of dollars)
The accompanying notes are an integral part of the consolidated financial statements.

33stm2011 annual financial report
2011 2010
Budget Actual Actual
(unaudited)
compensation 581,862 590,643 554,355
Benefits 163,460 222,976 (a) (164,366) (a)
Goods and services 278,664 257,018 230,692
Interest and financing costs Short-term financing costs 4,182 2,925 1,929 Interest on long-term debt borne by:
The Société 32,110 18,002 27,480 Government of Quebec and its enterprises 48,773 43,129 35,621
85,065 64,056 65,030
Amortization of capital assets 152,000 159,873 158,852
Other 300 255 725
1,261,351 1,294,821 845,288
(a) See the «Analysis of the Consolidated Financial Statements - Operating Surplus for Tax Purposes» section under the «Expenses» heading (p.15).
consolidated expenses by itemYear ended December 31, 2011 (in thousands of dollars)
The accompanying notes are an integral part of the consolidated financial statements.
34 stm2011 annual financial report
1. GoverninG statutes and nature of activities
The Société de transport de Montréal (hereafter the «Société») is incorporated under An act respecting public transit authorities (R.S.Q. chapter S-30.01) and is responsible for organizing and providing public transit services, primarily on the Island of Montreal.
The Société is exempt from corporate income tax under paragraph 149(1)(c) of the Income Tax Act and under Section 984 of the Taxation Act (Quebec).
2. siGnificant accountinG policies
Like other government organizations, the Société’s consolidated financial statements have been prepared in accordance with Canadian public sector accounting standards.
The significant accounting policies used are as follows:
a) Principles of consolidation
The consolidated financial statements include the assets, liabilities, operating results and cash flows of the Société and the organizations it controls, i.e., 9130-8593 Québec inc. (wholly owned) and Transgesco Limited Partnership (99.9 %-owned). All inter-organizational transactions and balances are eliminated. As at January 1, 2011, the Société initiated full consolidation of Transgesco Limited Partnership (Note 20).
b) Accounting method
Transactions are recorded in the Société’s accounts using the accrual basis of accounting. Under this method, assets, liabilities, revenues and expenses are recorded in the period in which the events and transactions occur.
c) Use of estimates
Preparation of the consolidated financial statements in accordance with Canadian public sector accounting standards requires management to make estimates and assumptions that affect the reported amounts of assets and liabilities, the presentation of contingent assets and liabilities at the date of the consolidated financial statements and the revenue and expense amounts recorded during the period covered by the consolidated financial statements. Actual results could differ from these estimates.
The main items for which management must make estimates are regional revenues, regional contributions, subsidies, the useful lives of capital assets for amortization purposes, the receivables to be allocated to the repayment of long-term debt, assumptions relative to the employee future benefits asset and expenses, and provisions for liabilities and legal claims.
d) foreign currency translation
The Société uses the temporal method to translate its accounts expressed in foreign currencies. Monetary assets and liabilities denominated in foreign currencies are translated at the exchange rate in effect on the date of the Statement of Financial Position.
Revenues and expenses related to foreign currency transactions are translated into Canadian dollars at the exchange rate in effect on the transaction date. Exchange gains and losses are included in surplus for the year.
notes to the consolidated financial statements As at December 31, 2011 (in thousands of dollars)

35stm2011 annual financial report
2. siGnificant accountinG policies (cont’d)
e) Revenue recognition
Revenues from passenger transportation are recognized in the Statement of Operations when the passes are used by passengers. For weekly and monthly passes, revenues are recognized in the period for which the passes are valid.
Contributions and subsidies are recognized in the Statement of Operations when the eligibility conditions for this government or municipal assistance are met.
Other revenues consist essentially of advertising income, recoveries, rights to reduced fares and smart cards as well as revenues from sinking fund investments that will be used to repay long-term debt. They are recognized when the operation underlying their recognition is carried out.
f) cash
Cash consists of bank balances and bank overdrafts.
g) Sinking fund investments
The sinking fund investments consist mainly of bonds and bond coupons that are recorded at amortized cost and written down when there has been an other-than-temporary decline in their value. Discounts or premiums on acquired investments are amortized on a straight-line basis until the maturity of the investment to which that item is related.
h) contributions and subsidies receivable
Receivables to be allocated to the repayment of long-term debt are created at the time of a current or future long-term debt issuance based on the subsidy rates of the capital assets being financed. These rates are established using the terms of the Government of Quebec’s assistance program for the public transport of people and other agreements.
i) Employee future benefits asset and expenses
All of the Société’s employee future benefit plans are defined benefit plans.
The asset related to these plans reflects the year-end difference between the value of the accrued benefit obligation and the value of the plan assets, net of unamortized actuarial gains and losses and the valuation allowance. The actuarial valuation of this asset is determined using the projected benefit method prorated on years of service with salary projection. It is also based on actuarial assumptions that include management’s best estimates on, among other factors, discount rates, the expected rate of return on plan assets and the rate of increase in salaries and healthcare costs.
Plan assets are valued using a market-related value, determined over a period not exceeding five years.
Past service costs related to plan amendments are recognized in the year in which the amendments are made.
Actuarial gains or losses resulting from the difference between the actual and anticipated returns on the plan assets or resulting from changes in actuarial assumptions are deferred and amortized over the average remaining service life of active employees. As at December 31, 2011, the average remaining service life varied from three to thirteen years.
notes to the consolidated financial statements As at December 31, 2011 (in thousands of dollars)

36 stm2011 annual financial report
2. siGnificant accountinG policies (cont’d)
j) capital assets
Capital assets are recorded at cost and amortized over their estimated useful lives using the straight-line method over the following periods:
Buildings 20 and 40 years
Metro infrastructures 20, 25, 30, 40 and 100 years
Local and regional infrastructures 10, 20 and 40 years
Rolling stock – metro cars 40 years
Rolling stock – buses 5 and 16 years
Rolling stock – service vehicles 5, 10 and 25 years
Leasehold improvements remaining term of the lease
Office equipment and software 5 and 10 years
Machinery, tools and equipment 15 and 20 years
During the year, the Société revised the useful lives of certain capital assets based on its past experience. Consequently, as of the beginning of the year, buildings are being amortized over a period of 20 and 40 years, whereas they had previously been amortized over a period of 40 years; metro infrastructures are being amortized over 25, 30, 40 and 100 years, whereas they had previously been amortized over 15, 25, 40 and 100 years; local and regional infrastructures are being amortized over 10, 20 and 40 years, whereas they had previously been amortized over 20 and 40 years; buses are being amortized over 5 and 16 years, whereas they had previously been amortized over a period of 13 to 16 years; service vehicles are being amortized over 5, 10 and 25 years, whereas they had previously been amortized over 5 and 10 years; and machinery, tools and equipment are being amortized over 15 and 20 years, whereas they had previously been amortized over 15 years. The revised estimates have increased amortization expense by $12.2 million for the year ended December 31, 2011.
Capital assets are amortized starting from the date they are put into service. Capital assets in progress (projects being carried out) and retired capital assets are not amortized.
Capital assets received without consideration are recorded at the cost incurred by the government authority responsible for building or developing them.
Interest on the amounts used to finance capital asset purchases is capitalized until the assets are put into service.
k) Inventories
Inventories of supplies and replacement parts consist mainly of the parts used to maintain the Société’s rolling stock and infrastructures. They are measured at the lower of average cost and net realizable value, the latter corresponding to the replacement cost.
l) Issuance costs for long-term debt
Issuance costs for long-term debt are amortized on a straight-line basis over the term of the loans.
m) Environmental obligations
The Société recognizes an environmental liability when it is likely that corrective measures will be taken and the costs of these measures can be reasonably estimated.
notes to the consolidated financial statements As at December 31, 2011 (in thousands of dollars)

37stm2011 annual financial report
notes to the consolidated financial statements As at December 31, 2011 (in thousands of dollars)
2. siGnificant accountinG policies (cont’d)
n) Derivative financial instruments
The Société periodically enters into currency and interest rate swaps as well as commodity swaps with major financial institutions to partially protect itself against fluctuations in exchange rates, interest rates, and the prices of certain purchases (e.g., fuel). The Société does not use financial instruments for speculative purposes.
To manage the currency and interest rate risk on long-term debt, the Société formally documents the risk management objective and strategy upon which its hedging activities are based as well the relationship between the hedging instruments and the hedged items. This process consists of linking these derivative financial instruments to specific assets and liabilities, to firm commitments, or to specific forecasted transactions. The Société uses various derivative instruments to translate the cash flow from debt denominated in a foreign currency and having a variable interest rate into cash flow from debt at a fixed rate denominated in Canadian dollars, thereby creating a synthetic instrument. Synthetic instrument accounting is used to account for the assets and liabilities that make up the synthetic instrument. As a result, the Société records these to emulate the debt.
The Société periodically uses commodity swaps to protect itself from fuel price fluctuations. Related gains and losses are recorded in the Statement of Operations in the period in which they are realized and are presented with the expense related to the hedged item.
o) Budgetary data (unaudited)
The Consolidated Statement of Operations and the Consolidated Statement of Change in Net Debt provide a comparison against the budget figures, adjusted in accordance with Canadian public sector accounting standards.

38 stm2011 annual financial report
notes to the consolidated financial statements As at December 31, 2011 (in thousands of dollars)
3. passenGer revenues 2011 2010
Bus and metro service 477,047 438,158 Paratransit service 3,113 2,819 Regional revenues (a) 53,089 46,693
533,249 487,670
(a) The regional revenues attributable to the Société come from the sharing of metropolitan transit pass sales made by the Agence métropolitaine de transport.
4. subsidies 2011 2010
OperatingGovernment assistance program for the public transport of people (a) 32,319 35,621 Public transit service improvement program (b) 50,022 39,883 Paratransit service (c) 38,656 37,334 Program for the financing of local infrastructures in Quebec (d) 1,549 -Other 1,029 398
123,575 113,236
InvestingGovernment assistance program for the public transport of people (a) 127,063 105,697 Public transit service improvement program (b) - 7,605 Program for the financing of local infrastructures in Quebec (d) 95,550 223,139 Building Canada Fund (e) 1,517 -Government assistance program for improving
energy efficiency in passenger road transportation (f) 3,140 -
Other - (217)
227,270 336,224
350,845 449,460
(a) Government assistance program for the public transport of people (PAGTCP)
Under the Government of Quebec’s assistance program for the public transport of people and under other agreements, the Société is eligible for subsidies at rates of 50 %, 75 % or 100 % for acquisitions of eligible capital assets, including long-term debt interest related to bus purchases, the construction of buildings, metro station and metro car upgrades, and other eligible expenses.
39stm2011 annual financial report
notes to the consolidated financial statements As at December 31, 2011 (in thousands of dollars)
4. subsidies (cont’d)
b) Public transit service improvement program (PASTEC)
The Société has been eligible for a subsidy of up to 50 % of the operating expenses (or, in certain cases, investing expenses) deemed admissible by the Ministère des Transports, over a period of five years beginning in 2007. Part of the Quebec Public Transit Policy, the program had aimed to increase the public transit service supply by 16 % and public transit ridership by 8 % between 2007 and 2011.
(c) Paratransit service
Under the Government of Quebec’s paratransit assistance program, the Société is eligible for a subsidy that includes an annually indexed amount as well as an amount based on increases in the number of trips.
(d) Program for the financing of local infrastructures in Quebec (SOFIL)
Under the powers granted to SOFIL, the Société is eligible for a subsidy on capital asset acquisitions deemed admissible by the Ministère des Transports in addition to a contribution from the Montreal Urban Agglomeration, bringing the total subsidy for eligible acquisitions to 100 %. Acquisitions for which subsidy applications involved amounts already available or reserved as at March 31, 2010 are subject to a cash subsidy of 84.5 % from the Ministère des Transports and 15.5 % from the Montreal Urban Agglomération (SOFIL-1). Acquisitions related to projects approved after April 1, 2010 are eligible for an 85 % cash or debt servicing subsidy from the Ministère des Transports and 15 % cash subsidy from the Montreal Urban Agglomeration (SOFIL-2). This program is slated to remain in effect until 2014.
(e) Building Canada Fund (BCF)
This federal government program supports investments in public infrastructures owned by provincial, territorial and municipal governments, and in certain cases, private sector and not-for-profit organizations. The federal contribution can reach one-third of the Société’s total eligible costs.
(f) Government assistance program for improving energy efficiency in passenger road transportation (PAGAAEE)
Under this provincial government program, the Société may apply for a 50 % subsidy of eligible capital expenditures. The program’s mission is to promote the use of new technologies and improve energy efficiency in passenger road transportation.
40stm2011 annual financial report
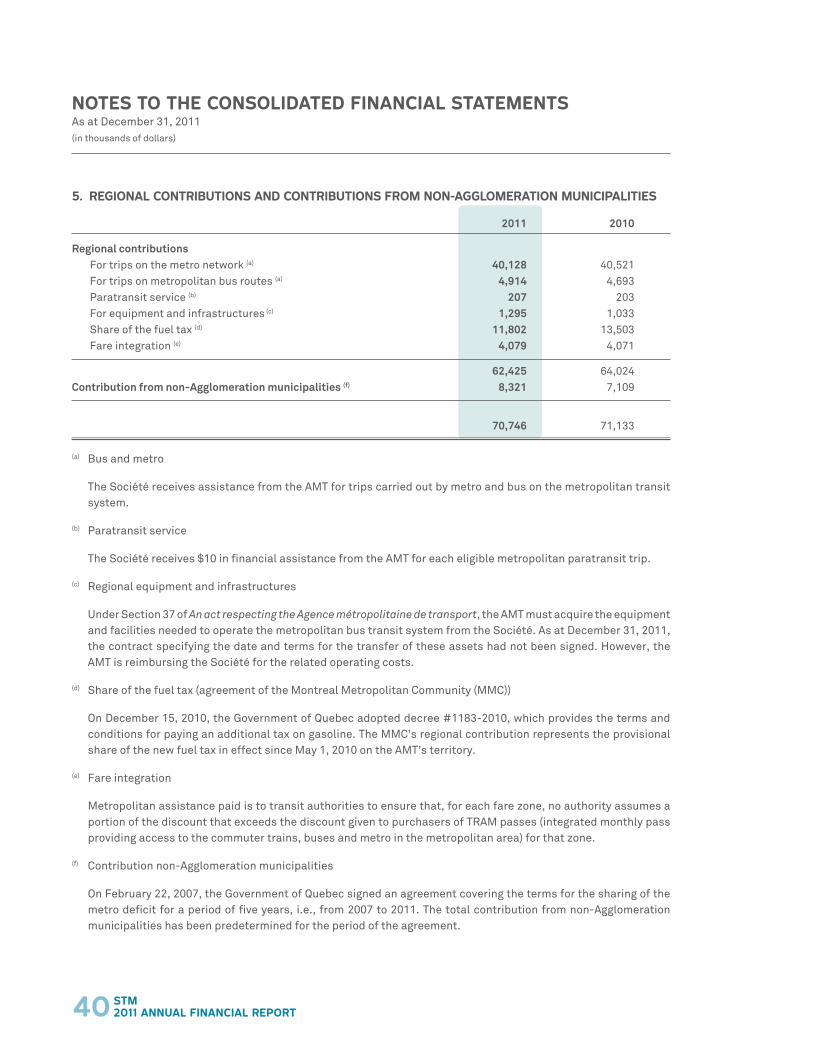
5. reGional contributions and contributions from non-aGGlomeration municipalities 2011 2010
Regional contributionsFor trips on the metro network (a) 40,128 40,521 For trips on metropolitan bus routes (a) 4,914 4,693 Paratransit service (b) 207 203
For equipment and infrastructures (c) 1,295 1,033 Share of the fuel tax (d) 11,802 13,503 Fare integration (e) 4,079 4,071
62,425 64,024 contribution from non-Agglomeration municipalities (f) 8,321 7,109
70,746 71,133
(a) Bus and metro
The Société receives assistance from the AMT for trips carried out by metro and bus on the metropolitan transit system.
(b) Paratransit service
The Société receives $10 in financial assistance from the AMT for each eligible metropolitan paratransit trip.
(c) Regional equipment and infrastructures
Under Section 37 of An act respecting the Agence métropolitaine de transport, the AMT must acquire the equipment and facilities needed to operate the metropolitan bus transit system from the Société. As at December 31, 2011, the contract specifying the date and terms for the transfer of these assets had not been signed. However, the AMT is reimbursing the Société for the related operating costs.
(d) Share of the fuel tax (agreement of the Montreal Metropolitan Community (MMC))
On December 15, 2010, the Government of Quebec adopted decree #1183-2010, which provides the terms and conditions for paying an additional tax on gasoline. The MMC’s regional contribution represents the provisional share of the new fuel tax in effect since May 1, 2010 on the AMT’s territory.
(e) Fare integration
Metropolitan assistance paid is to transit authorities to ensure that, for each fare zone, no authority assumes a portion of the discount that exceeds the discount given to purchasers of TRAM passes (integrated monthly pass providing access to the commuter trains, buses and metro in the metropolitan area) for that zone.
(f) Contribution non-Agglomeration municipalities
On February 22, 2007, the Government of Quebec signed an agreement covering the terms for the sharing of the metro deficit for a period of five years, i.e., from 2007 to 2011. The total contribution from non-Agglomeration municipalities has been predetermined for the period of the agreement.
notes to the consolidated financial statements As at December 31, 2011 (in thousands of dollars)
41stm2011 annual financial report
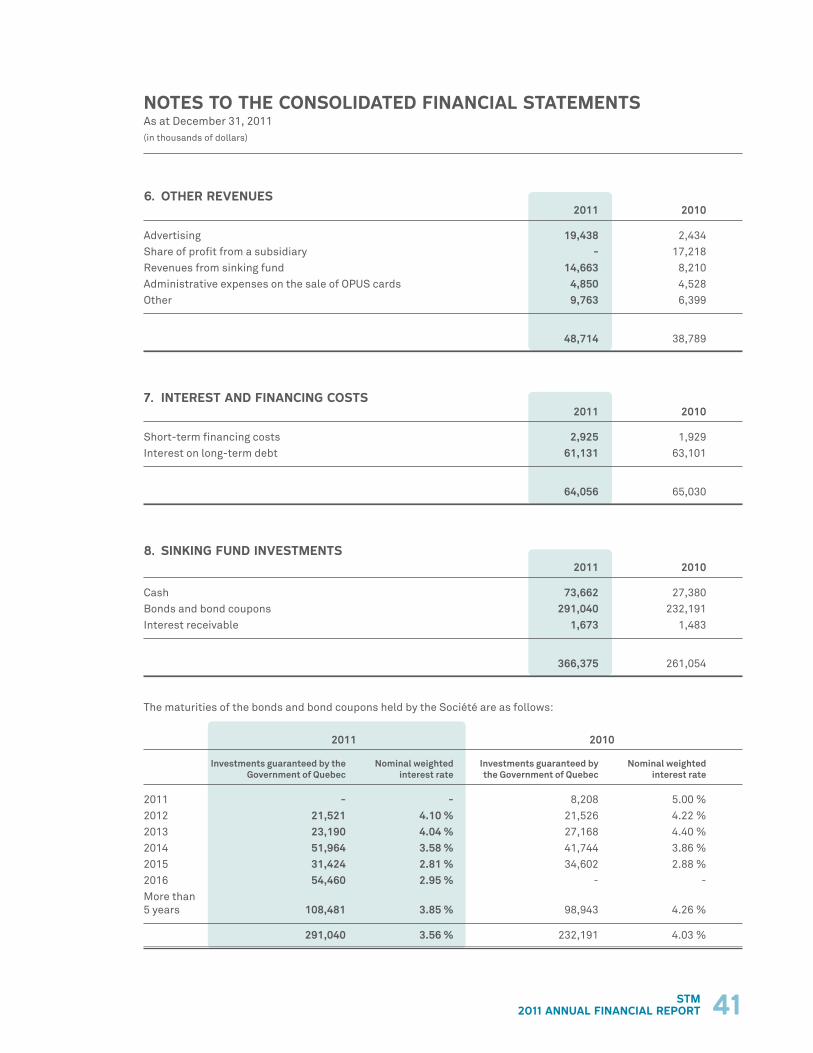
6. other revenues 2011 2010
Advertising 19,438 2,434 Share of profit from a subsidiary - 17,218 Revenues from sinking fund 14,663 8,210 Administrative expenses on the sale of OPUS cards 4,850 4,528 Other 9,763 6,399
48,714 38,789
7. interest and financinG costs 2011 2010
Short-term financing costs 2,925 1,929 Interest on long-term debt 61,131 63,101
64,056 65,030
8. sinkinG fund investments 2011 2010
Cash 73,662 27,380 Bonds and bond coupons 291,040 232,191 Interest receivable 1,673 1,483
366,375 261,054
The maturities of the bonds and bond coupons held by the Société are as follows:
2011 2010
Investments guaranteed by the Nominal weighted Investments guaranteed by Nominal weighted Government of Quebec interest rate the Government of Quebec interest rate
2011 - - 8,208 5.00 %2012 21,521 4.10 % 21,526 4.22 %2013 23,190 4.04 % 27,168 4.40 %2014 51,964 3.58 % 41,744 3.86 %2015 31,424 2.81 % 34,602 2.88 %2016 54,460 2.95 % - - More than 5 years 108,481 3.85 % 98,943 4.26 %
291,040 3.56 % 232,191 4.03 %
notes to the consolidated financial statements As at December 31, 2011 (in thousands of dollars)

42 stm2011 annual financial report
notes to the consolidated financial statements As at December 31, 2011 (in thousands of dollars)
9. subsidies receivable 2011 2010
Government of Quebec
Receivables to be allocated to the repayment of long-term debt (a) 833,338 628,976 Receivables to be allocated to the repayment of long-term debt not yet issued (b) 72,110 38,280 Receivables related to the long-term debt issued for future capital assets (c) (151,292) (24,510) Program for the financing of local infrastructures 58,089 128,283 Government assistance program for the public transport of people 7,748 9,643
Paratransit service 17,144 12,021
Public transit service improvement program 4,130 38,460
841,267 831,153 Government of canada
Building Canada Fund 1,517 -
842,784 831,153
(a) An amount of $39.6 million related to the SOFIL-2 program ($0.0 million in 2010).
(b) An amount of $39.4 million related to the SOFIL-2 program ($0.0 million in 2010).
(c) An amount of $138.7 million related to deposits for the purchase of metro cars, as indicated in Note 18 ($0.0 million in 2010).
Receipts of receivables to be allocated to the repayment of long-term debt, the terms and conditions ofr which have been established as at December 31, 2011, are as follows:
2011 2010
Receipts Nominal weighted Receipts Nominal weighted interest rate interest rate
2011 - - 17,732 4.42 %2012 52,659 4.76 % 40,042 5.06 %2013 29,881 4.32 % 17,641 4.70 %2014 113,819 4.77 % 100,187 4.89 %2015 21,410 4.04 % 9,311 4.41 %2016 45,163 4.42 % - -
1 to 5 years 262,932 4.60 % 184,913 4.84 % 6 to 10 years 570,406 4.57 % 444,063 4.80 %
833,338 4.58 % 628,976 4.81 %

43stm2011 annual financial report
notes to the consolidated financial statements As at December 31, 2011 (in thousands of dollars)
10. reGional contributions and contributions from non-aGGlomeration municipalities receivable
2011 2010
Regional contributions 28,238 48,230 Contribution from non-Agglomeration municipalities - 8,986
28,238 57,216
11. other receivables 2011 2010
Regional revenues 5,575 12,026 Tax claims from governments 4,122 9,806 Trade accounts receivable 30,681 22,922 Other 1,055 1,818
41,433 46,572
A $9.5 million allowance for bad debt ($9.7 million in 2010) has been deducted from other receivables.
12. lonG-term investments 2011 2010
Investment in a subsidiary, recognized using the modified equity method (Note 20) - 8,718 Other subsidiary - 15
- 8,733
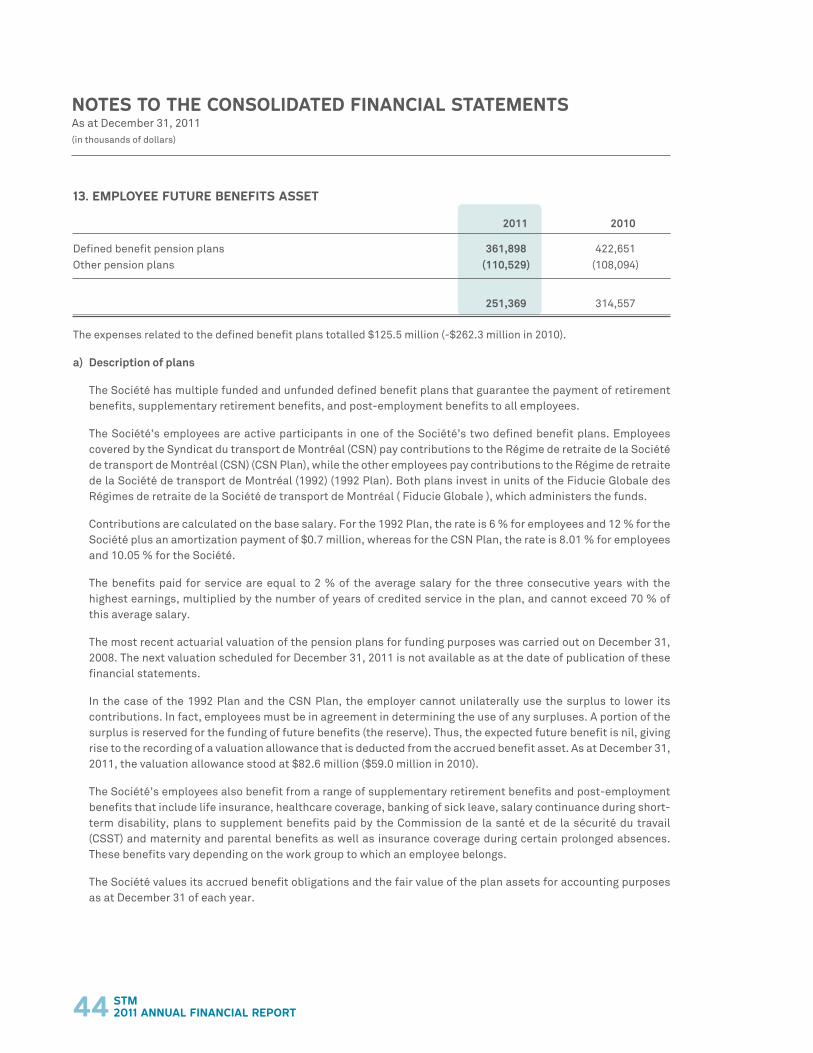
44 stm2011 annual financial report
13. employee future benefits asset
2011 2010
Defined benefit pension plans 361,898 422,651 Other pension plans (110,529) (108,094)
251,369 314,557
The expenses related to the defined benefit plans totalled $125.5 million (-$262.3 million in 2010).
a) Description of plans
The Société has multiple funded and unfunded defined benefit plans that guarantee the payment of retirement benefits, supplementary retirement benefits, and post-employment benefits to all employees.
The Société’s employees are active participants in one of the Société’s two defined benefit plans. Employees covered by the Syndicat du transport de Montréal (CSN) pay contributions to the Régime de retraite de la Société de transport de Montréal (CSN) (CSN Plan), while the other employees pay contributions to the Régime de retraite de la Société de transport de Montréal (1992) (1992 Plan). Both plans invest in units of the Fiducie Globale des Régimes de retraite de la Société de transport de Montréal ( Fiducie Globale ), which administers the funds.
Contributions are calculated on the base salary. For the 1992 Plan, the rate is 6 % for employees and 12 % for the Société plus an amortization payment of $0.7 million, whereas for the CSN Plan, the rate is 8.01 % for employees and 10.05 % for the Société.
The benefits paid for service are equal to 2 % of the average salary for the three consecutive years with the highest earnings, multiplied by the number of years of credited service in the plan, and cannot exceed 70 % of this average salary.
The most recent actuarial valuation of the pension plans for funding purposes was carried out on December 31, 2008. The next valuation scheduled for December 31, 2011 is not available as at the date of publication of these financial statements.
In the case of the 1992 Plan and the CSN Plan, the employer cannot unilaterally use the surplus to lower its contributions. In fact, employees must be in agreement in determining the use of any surpluses. A portion of the surplus is reserved for the funding of future benefits (the reserve). Thus, the expected future benefit is nil, giving rise to the recording of a valuation allowance that is deducted from the accrued benefit asset. As at December 31, 2011, the valuation allowance stood at $82.6 million ($59.0 million in 2010).
The Société’s employees also benefit from a range of supplementary retirement benefits and post-employment benefits that include life insurance, healthcare coverage, banking of sick leave, salary continuance during short-term disability, plans to supplement benefits paid by the Commission de la santé et de la sécurité du travail (CSST) and maternity and parental benefits as well as insurance coverage during certain prolonged absences. These benefits vary depending on the work group to which an employee belongs.
The Société values its accrued benefit obligations and the fair value of the plan assets for accounting purposes as at December 31 of each year.
notes to the consolidated financial statements As at December 31, 2011 (in thousands of dollars)
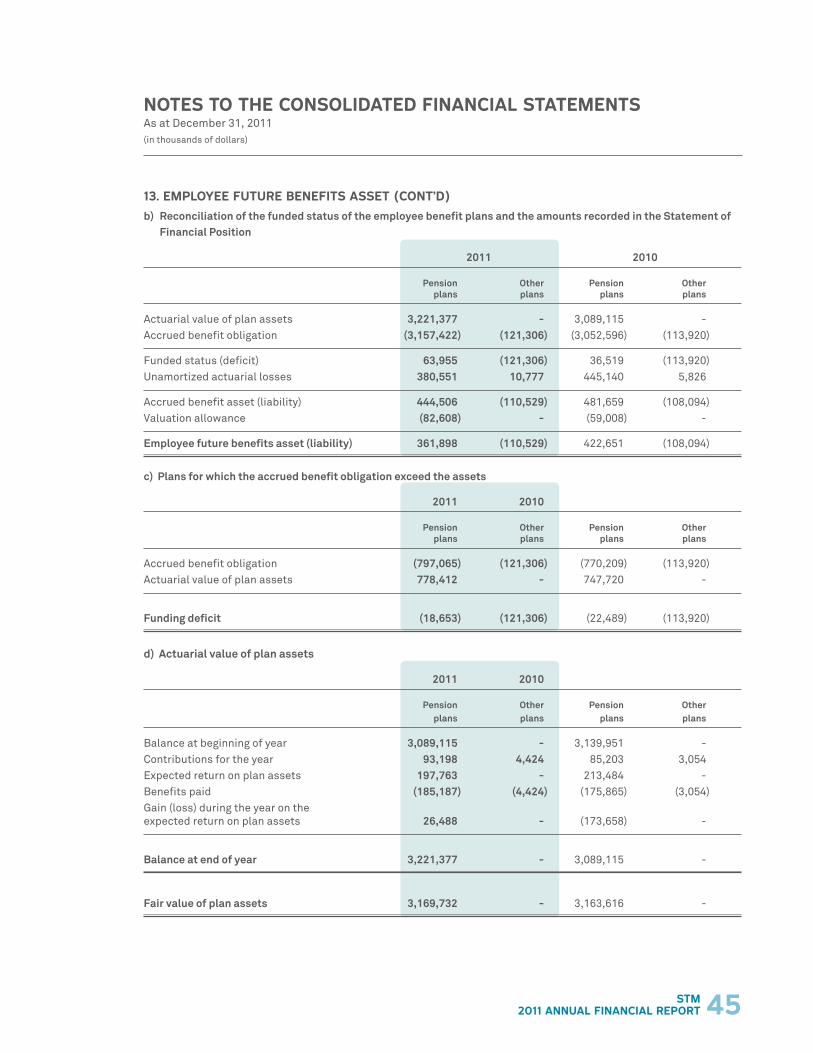
45stm2011 annual financial report
13. employee future benefits asset (cont’d)
b) Reconciliation of the funded status of the employee benefit plans and the amounts recorded in the Statement of financial Position
2011 2010
Pension Other Pension Other plans plans plans plans
Actuarial value of plan assets 3,221,377 - 3,089,115 - Accrued benefit obligation (3,157,422) (121,306) (3,052,596) (113,920)
Funded status (deficit) 63,955 (121,306) 36,519 (113,920) Unamortized actuarial losses 380,551 10,777 445,140 5,826
Accrued benefit asset (liability) 444,506 (110,529) 481,659 (108,094) Valuation allowance (82,608) - (59,008) -
Employee future benefits asset (liability) 361,898 (110,529) 422,651 (108,094)
c) Plans for which the accrued benefit obligation exceed the assets
2011 2010
Pension Other Pension Other plans plans plans plans
Accrued benefit obligation (797,065) (121,306) (770,209) (113,920) Actuarial value of plan assets 778,412 - 747,720 -
funding deficit (18,653) (121,306) (22,489) (113,920)
d) Actuarial value of plan assets
2011 2010
Pension Other Pension Other plans plans plans plans
Balance at beginning of year 3,089,115 - 3,139,951 - Contributions for the year 93,198 4,424 85,203 3,054 Expected return on plan assets 197,763 - 213,484 - Benefits paid (185,187) (4,424) (175,865) (3,054) Gain (loss) during the year on the expected return on plan assets 26,488 - (173,658) -
Balance at end of year 3,221,377 - 3,089,115 -
fair value of plan assets 3,169,732 - 3,163,616 -
notes to the consolidated financial statements As at December 31, 2011 (in thousands of dollars)

46 stm2011 annual financial report
notes to the consolidated financial statements As at December 31, 2011 (in thousands of dollars)
13. employee future benefits asset (cont’d)
e) Accrued benefit obligation
2011 2010
Pension Other Pension Other plans plans plans plans
Balance at beginning of year 3,052,596 113,920 2,775,666 119,608 Cost of services rendered during the year 94,157 3,586 77,239 3,390 Benefits paid (185,187) (4,424) (175,865) (3,054) Interest cost on the obligation 195,256 5,675 187,871 4,806 Loss (gain) on the obligation during the year 600 2,549 187,685 (10,830)
Balance at end of year 3,157,422 121,306 3,052,596 113,920
f) components of the defined benefit plans expense
2011 2010
Pension Other Pension Other plans plans plans plans
Cost of services rendered during the year 94,157 3,586 77,239 3,390 Employee contributions (35,357) - (31,376) - Amortization of actuarial losses (gains) 38,701 (2,402) 9,294 (1,899)
Retirement benefits expense 97,501 1,184 55,157 1,491
Interest cost on the obligation 195,256 5,675 187,871 4,806 Expected return on plan assets (197,763) - (213,484) -
Interest expense (revenue) (2,507) 5,675 (25,613) 4,806
Change in valuation allowance 23,600 - (298,150) -
Total expense 118,594 6,859 (268,606) 6,297

47stm2011 annual financial report
13. employee future benefits asset (cont’d)
g) Significant actuarial assumptions (weighted rates)
The significant actuarial assumptions used in the actuarial valuations performed from December 31, 2010 to December 31, 2011, are as follows:
2011 2010
Pension Others Pension Other plans plans plans plans
Long-term inflation rate 2.50 % 2.50 % 2.50 % 2.50 %Discount rate 6.20 % 5.00 % 6.49 % 5.00 %Expected rate of return on plan assets 6.25 % - 6.50 % - Rate of compensation increase 2.96 % 3.23 % 3.00 % 3.21 %Initial growth rate for healthcare costs - 9.42 % - 9.69 %Ultimate growth rate for healthcare costs - 4.98 % - 5.01 %Year when rate is expected to stabilize - 2025 - 2025
notes to the consolidated financial statements As at December 31, 2011 (in thousands of dollars)

48 stm2011 annual financial report
notes to the consolidated financial statements As at December 31, 2011 (in thousands of dollars)
14. short-term loans
The Société has an authorized loan up to a maximum of $600.0 million for its current operating expenses and for expenses incurred under a loan by-law.
Of this amount, $500.0 million can be borrowed, in whole or in part, by way of notes, bankers’ acceptances, or other instruments negotiable through the chartered banks or on the open short-term loan market at a rate not exceeding the prime rate of the chartered banks. The repayment term of each of the notes, bankers’ acceptances, or other instruments shall not exceed one year from the date of their issuance. As at December 31, 2011, the nominal value of commercial paper issuances totalled $172.9 million ($331.4 million in 2010), and the average rate for the 2011 fiscal year was 1.12 % (0.75 % in 2010).
The Société also has access to a line of credit of $100.0 million in the form of demand notes. The interest rate on this line of credit is the banking institution’s base rate plus 0.3 %, calculated on a daily basis and payable on the last day of each month. The average rate for fiscal 2011 was 3.30 % (2.89 % in 2010). As at December 31, 2011, the line of credit was unused and was bearing interest at a rate of 3.30 % (3.30 % in 2010).
An act respecting public transit authorities stipulates that the Montreal Urban Agglomeration is the guarantor of the Société’s commitments and obligations, including short-term loans contracted by the Société.
15. accounts payable and accrued liabilities
2011 2010
Trade accounts payable and accrued liabilities 83,213 105,516 Salaries and benefits 63,134 57,887 Prepaid revenues 17,967 17,353 Accrued interest on long-term debt 13,890 13,066 Other 22,333 18,294
200,537 212,116

49stm2011 annual financial report
16. lonG-term debt 2011 2010
Bonds, loans and bank loans, at fixed interest rates ranging from 1.65 % to 5.85 % (1.00 % to 5.85 % in 2010), maturing from January 2012 to November 2027 1,684,378 1,374,456
The long-term debt consists of bonds and bank loans that are direct and general obligations of the Société. An act respecting public transit authorities stipulates that the Montreal Urban Agglomeration is the guarantor of the Société’s commitments and obligations, including long-term debt contracted by the Société.
Since the enactment of An Act to amend the Act respecting the Régie du logement and various Acts concerning municipal affairs (2010, Section 42), the Société must borrow the portion of the investments subsidized by the Government of Quebec from the Minister of Finance. The other borrowings are contracted by the City of Montreal. During the year, an amount of $57.5 million was contracted by the City of Montreal on behalf of the Société.
The Société used currency and interest rate swaps for loans totalling $207.0 million ($207.0 million in 2010). The swaps eliminate nearly all exchange and interest rate risks.
Estimated long-term debt payments for future years are as follows:
2011 2010
Year of canadian To be Net Nominal weighted canadian Nominal weighted maturity dollars (a) refinanced maturity interest rate dollars (a) interest rate
2011 - - - - 32,566 4.42 % 2012 95,108 15,400 79,708 4.76 % 73,540 5.06 % 2013 53,967 14,340 39,627 4.32 % 32,400 4.70 % 2014 205,568 27,900 177,668 4.77 % 184,000 4.89 % 2015 38,667 7,800 30,867 4.04 % 17,100 4.41 % 2016 81,568 8,400 73,168 4.42 % - -
1 to 5 years 474,878 73,840 401,038 4.60 % 339,606 4.84 % 6 to 10 years 1,030,202 151,450 878,752 4.57 % 815,552 4.80 % 11 years and thereafter 179,298 14,000 165,298 5.40 % 219,298 5.31 %
1,684,378 239,290 1,445,088 4.67 % 1,374,456 4.89 %
(a) Including loans contracted in foreign currencies and subject to hedging.
change in long-term debt 2011 2010
Balance at beginning of year 1,374,456 1,181,848 New loans 354,150 218,250 Repayments (44,228) (25,642)
Balance at end of year 1,684,378 1,374,456
Breakdown of long-term debtAmounts accumulated in the sinking fund 366,375 261,054
Amounts to be recovered for repayment of long-term debt:Montreal Urban Agglomeration 484,665 484,426Government of Quebec 833,338 628,976
1,318,003 1,113,402
1,684,378 1,374,456
notes to the consolidated financial statements As at December 31, 2011 (in thousands of dollars)

50 stm2011 annual financial report
17. capital assets
Balance at Disposal/ Balance beginning Increase Write-off at end
costLand 7,352 - - 7,352 Buildings 288,965 22,617 - 311,582 Metro infrastructures 1,879,398 112,026 323 1,991,101 Local and regional infrastructures 29,904 437 103 30,238 Rolling stock - metro cars 496,468 3,295 - 499,763 Rolling stock - buses 841,576 167,445 104,981 904,040 Rolling stock - service vehicles 46,760 4,205 551 50,414 Leasehold improvements - 1,475 - 1,475 Office equipment and software 123,113 9,391 16,905 115,599 Machinery, tools and equipment 146,586 11,074 1,017 156,643
3,860,122 331,965 123,880 4,068,207 Capital assets in progress 302,524 28,391 - 330,915
4,162,646 360,356 123,880 4,399,122
Accumulated amortization
Buildings 91,268 12,229 - 103,497
Metro infrastructures 1,020,788 46,856 323 1,067,321
Local and regional infrastructures 14,733 2,854 50 17,537
Rolling stock - metro cars 416,619 13,371 - 429,990
Rolling stock - buses 271,289 57,015 101,040 227,264
Rolling stock - service vehicles 31,613 4,442 538 35,517
Leasehold improvements - 10 - 10
Office equipment and software 54,164 13,753 16,905 51,012 Machinery, tools and equipment 41,680 9,343 1,017 50,006
1,942,154 159,873 119,873 1,982,154
Net carrying value 2,220,492 2,416,968
A total of $16.1 million in interest ($0.3 million in 2010) was capitalized to the cost of capital assets in progress.
notes to the consolidated financial statements As at December 31, 2011 (in thousands of dollars)

51stm2011 annual financial report
notes to the consolidated financial statements As at December 31, 2011 (in thousands of dollars)
18. other non-financial assets 2011 2010
Deposits for bus purchases 400 15,226 Deposits for metro car purchases 172,561 96,316 Loss on foreign exchange contracts (a) 12,796 12,796 Prepaid expenses 2,605 945 Issuance costs for long-term debt 6,600 4,679 Other 1,178 998
196,140 130,960
(a) Loss on foreign exchange contract incurred in 2010 to protect against currency fluctuations prior to the signing of a contract to purchase new metro cars. The loss will be fully charged to capital assets upon delivery of the metro cars, which is scheduled for 2014.
19. supplementary cash flow information
Net change in non-cash items 2011 2010
Contribution receivable from the Montreal Urban Agglomeration 25,004 (13,691) Subsidies receivable (11,631) (139,044) Regional contributions and contributions from non-Agglomeration municipalities receivable 28,978 (27,558) Other receivables 11,482 (13,894) Accounts payable and accrued liabilities (16,181) (49,866) Special contribution payable to the Montreal Urban Agglomeration 15,000 -Employee future benefits asset 63,188 (319,190) Inventories (4,822) (1,936) Other non-financial assets (excluding the deposits on bus and metro car purchases and the issuance costs for long-term debt) (1,479) (12,863)
109,539 (578,042)
Other information
2011 2010
Interest paid on short-term loans not attributable to capital assets in progress 2,925 1,929 Interest paid on long-term debt 60,307 62,441
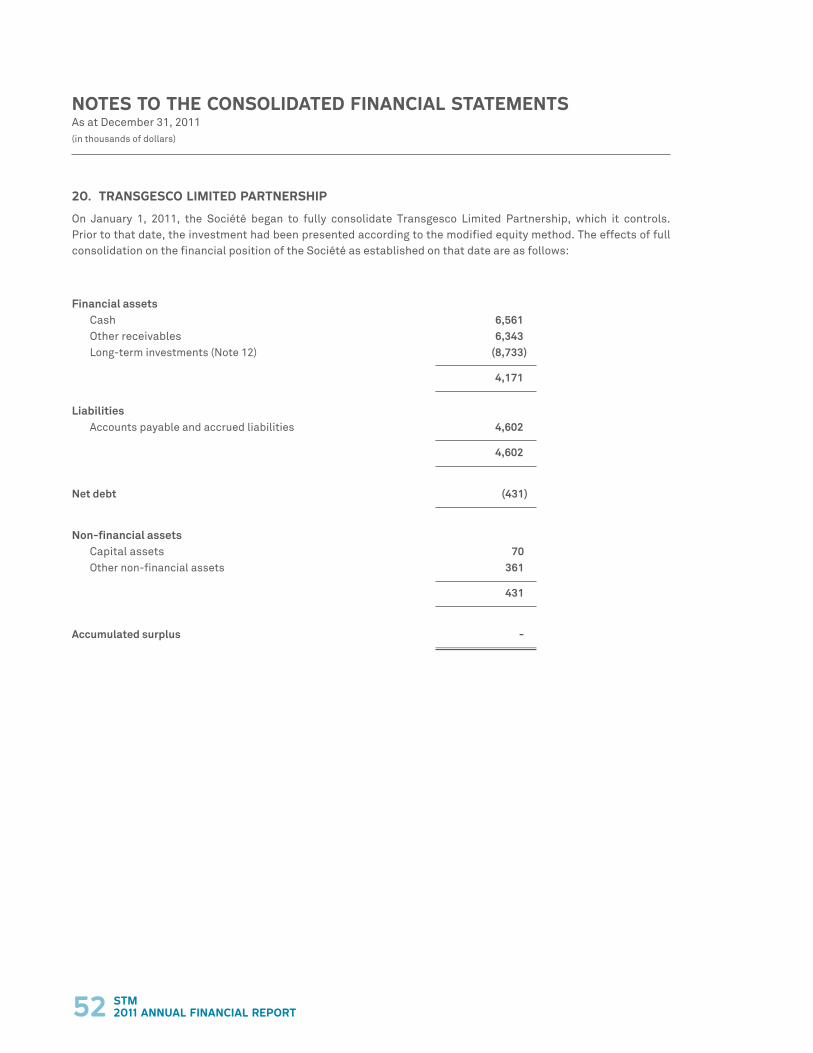
52 stm2011 annual financial report
20. transGesco limited partnership
On January 1, 2011, the Société began to fully consolidate Transgesco Limited Partnership, which it controls. Prior to that date, the investment had been presented according to the modified equity method. The effects of full consolidation on the financial position of the Société as established on that date are as follows:
financial assets Cash 6,561 Other receivables 6,343 Long-term investments (Note 12) (8,733)
4,171
liabilities
Accounts payable and accrued liabilities 4,602
4,602
Net debt (431)
Non-financial assets
Capital assets 70Other non-financial assets 361
431
Accumulated surplus -
notes to the consolidated financial statements As at December 31, 2011 (in thousands of dollars)

53stm2011 annual financial report
21. financial instruments
Use of derivative instruments
The Société uses derivative financial instruments to reduce the exchange and interest rate risks of its long-term debt and the commodity risk on the price of fuel. It does not use financial instruments for speculative purposes.
Exchange and interest positions
As at December 31, 2011, given the use of currency and interest rate swaps, all of the Société’s loans are denominated in Canadian dollars and bear interest at fixed rates.
credit risk
In using derivative financial instruments, the Société is exposed to credit losses arising from third-party defaults on payment. The Société believes that these parties will be able to meet their obligations, as it deals only with recognized financial institutions whose credit ratings are higher than its own.
liquidity risk
The Société believes that its credit facilities are sufficient to meet its current and long-term financial needs at a reasonable cost.
fair value
The fair value of cash, the contribution receivable from the Montreal Urban Agglomeration, the subsidies receivable other than receivables to be allocated to the repayment of long-term debt, the regional contributions and contributions from non-Agglomeration municipalities receivable, other receivables, short-term loans, accounts payable and accrued liabilities, and the special contribution payable to the Montreal Urban Agglomeration approximate their carrying values due to the short maturities of these financial instruments.
The following table shows the fair values and carrying values of other financial instruments:
2011 2010
fair carrying fair carrying value value value value
Sinking fund investments 380,993 366,375 267,422 261,054
Receivables to be allocated to the repayment of long-term debt 909,249 833,338 665,639 628,976
Long-term debt 1,852,224 1,684,378 1,454,570 1,374,456
The fair value of sinking fund investments is the amount at which they could be exchanged on the market between independent parties. The fair value of receivables to be allocated to the repayment of long-term debt as well as the fair value of long-term debt are essentially based on a discounted cash flow calculation that uses rates of return or the year-end market price of similar instruments with the same maturity. The fair value of the currency and interest rate swaps is the amount the Société would receive or pay if these contracts had closed at that date. As at December 31, 2011, the fair value and carrying value of the financial liabilities associated with currency and interest rate swaps sto od at $65.7 million and $48.6 million ($56.7 million and $48.0 million in 2010). They are included in the long-term debt amounts.
notes to the consolidated financial statements As at December 31, 2011 (in thousands of dollars)
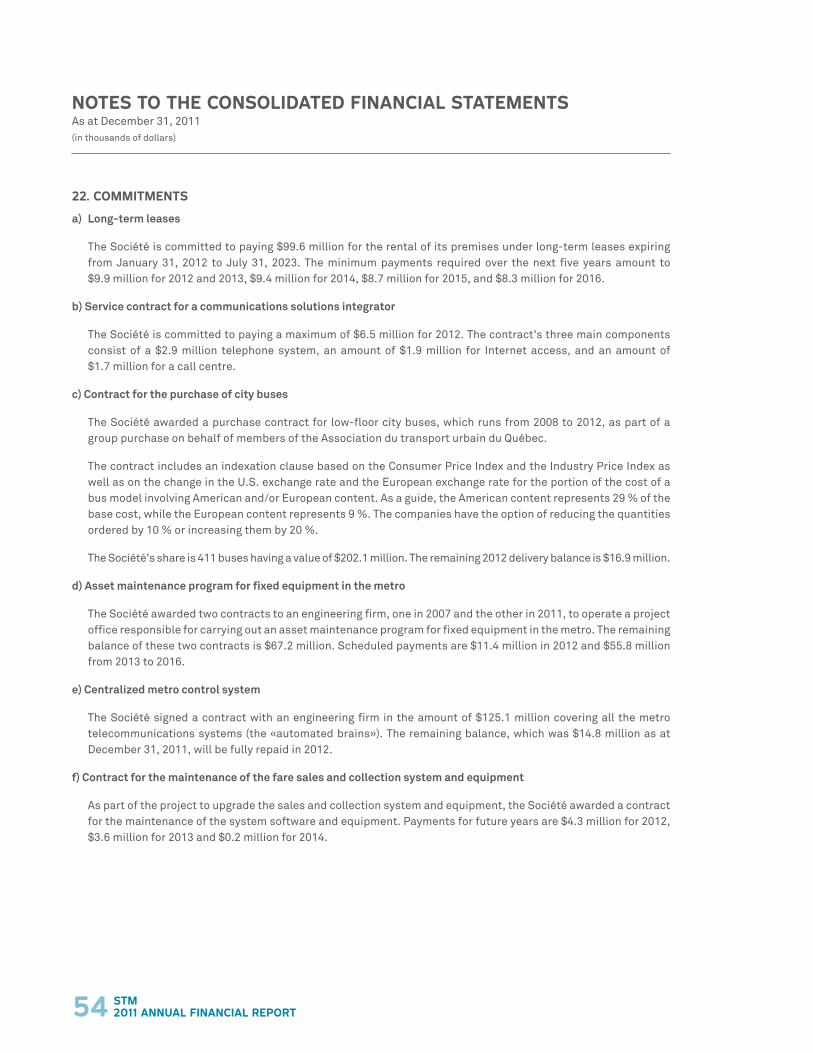
54 stm2011 annual financial report
22. commitments
a) long-term leases
The Société is committed to paying $99.6 million for the rental of its premises under long-term leases expiring from January 31, 2012 to July 31, 2023. The minimum payments required over the next five years amount to $9.9 million for 2012 and 2013, $9.4 million for 2014, $8.7 million for 2015, and $8.3 million for 2016.
b) Service contract for a communications solutions integrator
The Société is committed to paying a maximum of $6.5 million for 2012. The contract’s three main components consist of a $2.9 million telephone system, an amount of $1.9 million for Internet access, and an amount of $1.7 million for a call centre.
c) contract for the purchase of city buses
The Société awarded a purchase contract for low-floor city buses, which runs from 2008 to 2012, as part of a group purchase on behalf of members of the Association du transport urbain du Québec.
The contract includes an indexation clause based on the Consumer Price Index and the Industry Price Index as well as on the change in the U.S. exchange rate and the European exchange rate for the portion of the cost of a bus model involving American and/or European content. As a guide, the American content represents 29 % of the base cost, while the European content represents 9 %. The companies have the option of reducing the quantities ordered by 10 % or increasing them by 20 %.
The Société’s share is 411 buses having a value of $202.1 million. The remaining 2012 delivery balance is $16.9 million.
d) Asset maintenance program for fixed equipment in the metro
The Société awarded two contracts to an engineering firm, one in 2007 and the other in 2011, to operate a project office responsible for carrying out an asset maintenance program for fixed equipment in the metro. The remaining balance of these two contracts is $67.2 million. Scheduled payments are $11.4 million in 2012 and $55.8 million from 2013 to 2016.
e) centralized metro control system
The Société signed a contract with an engineering firm in the amount of $125.1 million covering all the metro telecommunications systems (the «automated brains»). The remaining balance, which was $14.8 million as at December 31, 2011, will be fully repaid in 2012.
f) contract for the maintenance of the fare sales and collection system and equipment
As part of the project to upgrade the sales and collection system and equipment, the Société awarded a contract for the maintenance of the system software and equipment. Payments for future years are $4.3 million for 2012, $3.6 million for 2013 and $0.2 million for 2014.
notes to the consolidated financial statements As at December 31, 2011 (in thousands of dollars)

55stm2011 annual financial report
22. commitments (cont’d)
g) contract for the supply of fuel
The Société has negotiated a fuel supply contract with a supplier for a predetermined period. To protect itself from fuel price fluctuations, the Société negotiated swap agreements with financial institutions. For the duration of these agreements, i.e., January 2009 to December 2014 (72 months), the Société is committed to purchasing 197.2 million litres at a fixed price, representing an amount of approximately $137.6 million.
As at December 31, 2011, the balance of the Société’s commitment was 96.7 million litres (13.1 million litres at $0.67/litre, 15.1 million litres at $0.65/litre, 26.4 million litres at $0.78/litre, and 42.1 million litres at $0.58/litre), representing an amount of $63.6 million.
h) contract for the purchase of rubber-tired metro cars
During 2010, the Société awarded a contract for the purchase metro cars to a consortium. In accordance with this contract, the Société is committed to purchasing 468 rubber-tired metro cars valued at $1,811.6 million. The purchase contract contains a price adjustment clause for the metro cars based on the change in certain indexes, mainly the Consumer Price Index and the Industrial Product Price Index. It also provides for a deposit of 7.5 %, which was paid during 2010, as well as an additional monthly deposit of 0.5 % to be paid over the next 28 months. The remaining balance as at December 31, 2011 was $1,638.9 million. The amounts for future deliveries will be paid as follows: $88.2 million in 2012, $56.5 million in 2013, $263.9 million in 2014, $322.9 million in 2015, $326.9 million in 2016, and $580.5 million from 2017 to 2020.
23. continGencies
a) Possible claims
TThe total of the amounts claimed by plaintiffs stood at $36.4 million ($77.3 million in 2010) following the settlement, after the end of the reporting period, of a major $40.0M class action suit from users inconvenienced during the 2003 strike. Claims now consist of two class action suits totalling $30.5 million from users inconvenienced during the strike in 2007. The other $5.9 million in claims consists of contractual or extracontractual suits by companies or individuals. As at December 31, 2011, the Société made a provision for an amount deemed sufficient for these claims.
b) Environmental obligations
As an owner of contaminated land, the Société could be required to take certain actions to comply with An act to amend the Environment Quality Act and other legislative provisions with regard to land protection and rehabilitation (2002, Section 11). It could involve identifying and, if necessary, rehabilitating certain lands. The Société cannot establish the total cost of the measures to be taken at this time. It has developed a contingency plan, including characterization studies, groundwater quality monitoring, and rehabilitation work that will extend until 2013 in order to comply with the legislation.
notes to the consolidated financial statements As at December 31, 2011 (in thousands of dollars)

56 stm2011 annual financial report
notes to the consolidated financial statements As at December 31, 2011 (in thousands of dollars)
23. continGencies (cont’d)
c) Transfer of property relating to the extension of the metro on the territory of the city of laval
On April 28, 2007, the AMT transferred the property relating to the extension of the metro to the City of Laval to the Société at no cost under Section 47 of An act respecting the Agence métropolitaine de transport («deed evidencing the transfer dated April 28, 2007»). On December 21, 2007, this transfer was cancelled on the condition that a new agreement be negotiated by the parties before February 28, 2008 («reconveyance agreement dated December 21, 2007»).
The expiry date of the reconveyance agreement dated December 21, 2007, has been re-extended to June 30, 2012.
The purpose of this postponement is to allow for the conveyance of the property as well as the related debt at the carrying value according to terms that will have no financial impact on the two parties. Thus, if the agreement is concluded, the Société will become owner of the assets and the corresponding debt for the metro extension on the territory of the City of Laval without, however, having to repay the debt, as it is subsidized in its entirety by the Ministère des Transports du Québec.
This transfer would increase the Société’s assets by an amount of approximately $1,100.0 million excluding taxes, i.e., $550.0 million in capital assets and receivables to be allocated to the repayment of long-term debt, and would increase the long-term debt liability by $550.0 million, with the $550.0 million balance being allocated to the accumulated surplus.
24. subseQuent event
On April 23, 2012, the Société entered into loans of $7.5 million and $103.6 million to finance capital assets in progress. This long-term debt will respectively mature on December 1, 2021 and December 1, 2032 and bear interest at 4.50 % and 4.25 %, respectively.
25. comparative fiGures
Certain figures from the previous year have been restated to conform to the current year’s presentation.
26. independent auditors’ opinion
The opinion of the independent auditors does not cover the supplementary information or the budget.

57stm2011 annual financial report
2011 2010
Accumulated surplus
Unrestricted operating surplus 5,721 2,996 Restricted operating surplus 999 - Sinking fund 366,375 261,054 Working capital fund 4,592 3,266 Balances available from closed loan by-laws 1,251 123 Financing of investments in progress (29,010) 6,392 Provision for future amounts 235,454 303,722 Net investment in long-term items 1,565,958 1,476,041
2,151,340 2,053,594
In accordance with the model drawn up by Quebec’s Ministère des Affaires Municipales, des Régions et de l’Occupation du Territoire, the Société presents certain financial information for tax purposes. In addition to a breakdown of the accumulated surplus into various items specified below, this financial information is reflected in the operating surplus and investing surplus for tax purposes.
change in the accumulated surplus items
Unrestricted operating surplus
The unrestricted operating surplus includes the portion of the accumulated surplus that has no restriction on its use.
2011 2010
Balance at beginning of year 2,996 -Operating surplus for the year for tax purposes 5,721 2,996 Allocation to operating activities (2,996) -
Balance at end of year 5,721 2,996
Restricted operating surplus
The restricted operating surplus includes the portion of the accumulated surplus whose use is reserved for specific purposes.
2011 2010
Balance at beginning of year - - Net investment in long-term items 999 -
Balance at end of year 999 -
table 1 - consolidated accumulated surplusAs at December 31, 2011 (in thousands of dollars)

58 stm2011 annual financial report
table 1 - consolidated accumulated surplusAs at December 31, 2011 (in thousands of dollars)
Sinking fund
The sinking fund consists of amounts accumulated to repay long-term debt and the interest income on these amounts.
2011 2010
Balance at beginning of year 261,054 169,177 Contribution from operating activities, including revenue of $14.7 million ($8.2 million in 2010) 105,321 91,877 Repayment of long-term debt - -
Balance at end of year 366,375 261,054
Working capital fund
This fund consists of uncommitted capital that is reserved for the acquisition of certain capital assets.
2011 2010
Balance at beginning of year 3,266 4,791 Financing of capital expenditures - (2,376) Contribution from operating activities 1,326 851
Balance at end of year 4,592 3,266
Balances available from closed loan by-laws
This item represents all amounts available following the closing of loan by-laws.
2011 2010
Balance at beginning of year 123 123 Contribution to investing activities 1,128 -
Balance at end of year 1,251 123
financing of investments in progress
The financing of investments in progress relates to the surplus of the capital asset acquisitions over their permanent realized financing.
2011 2010
Balance at beginning of year 6,392 (18,843)Investing surplus (deficit) for tax purposes (35,332) 25,235 Integration of an entity (70) -
Balance at end of year (29,010) 6,392

59stm2011 annual financial report
Provision for future amounts
The provision for future amounts corresponds to the net balance of the expenses recognized in the Statement of Operations that will be transferred in the future to the operating surplus for tax purposes. The provision results from the following items:
- Payroll liabilities: Application of transitional measures relating to the move to accrual accounting as of January 1, 2000 (vacation amortized over a maximum period of 20 years).
- Employee future benefits: Application of relief measures related to employee future benefits (amortization over a period estimated to run until 2019).
2011 2010
Balance at beginning of yearPayroll liabilities (7,053) (10,856) Employee future benefits 310,775 (2,604)
303,722 (13,460)
Change for the yearPayroll liabilities 889 3,803 Employee future benefits (69,157) 313,379
(68,268) 317,182
Balance at end of year Payroll liabilities (6,164) (7,053) Employee future benefits 241,618 310,775
235,454 303,722
table 1 - consolidated accumulated surplusAs at December 31, 2011 (in thousands of dollars)
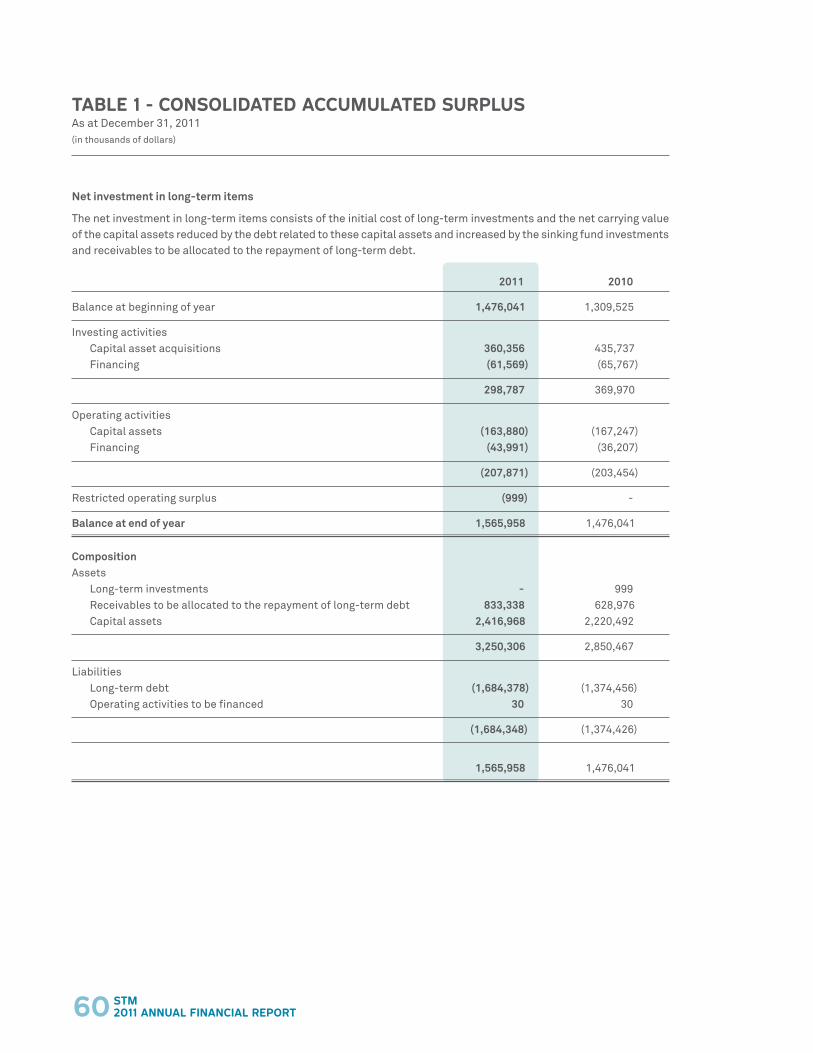
60 stm2011 annual financial report
Net investment in long-term items
The net investment in long-term items consists of the initial cost of long-term investments and the net carrying value of the capital assets reduced by the debt related to these capital assets and increased by the sinking fund investments and receivables to be allocated to the repayment of long-term debt.
2011 2010
Balance at beginning of year 1,476,041 1,309,525
Investing activitiesCapital asset acquisitions 360,356 435,737 Financing (61,569) (65,767)
298,787 369,970
Operating activitiesCapital assets (163,880) (167,247) Financing (43,991) (36,207)
(207,871) (203,454)
Restricted operating surplus (999) -
Balance at end of year 1,565,958 1,476,041
compositionAssets
Long-term investments - 999 Receivables to be allocated to the repayment of long-term debt 833,338 628,976 Capital assets 2,416,968 2,220,492
3,250,306 2,850,467
LiabilitiesLong-term debt (1,684,378) (1,374,456) Operating activities to be financed 30 30
(1,684,348) (1,374,426)
1,565,958 1,476,041
table 1 - consolidated accumulated surplusAs at December 31, 2011 (in thousands of dollars)
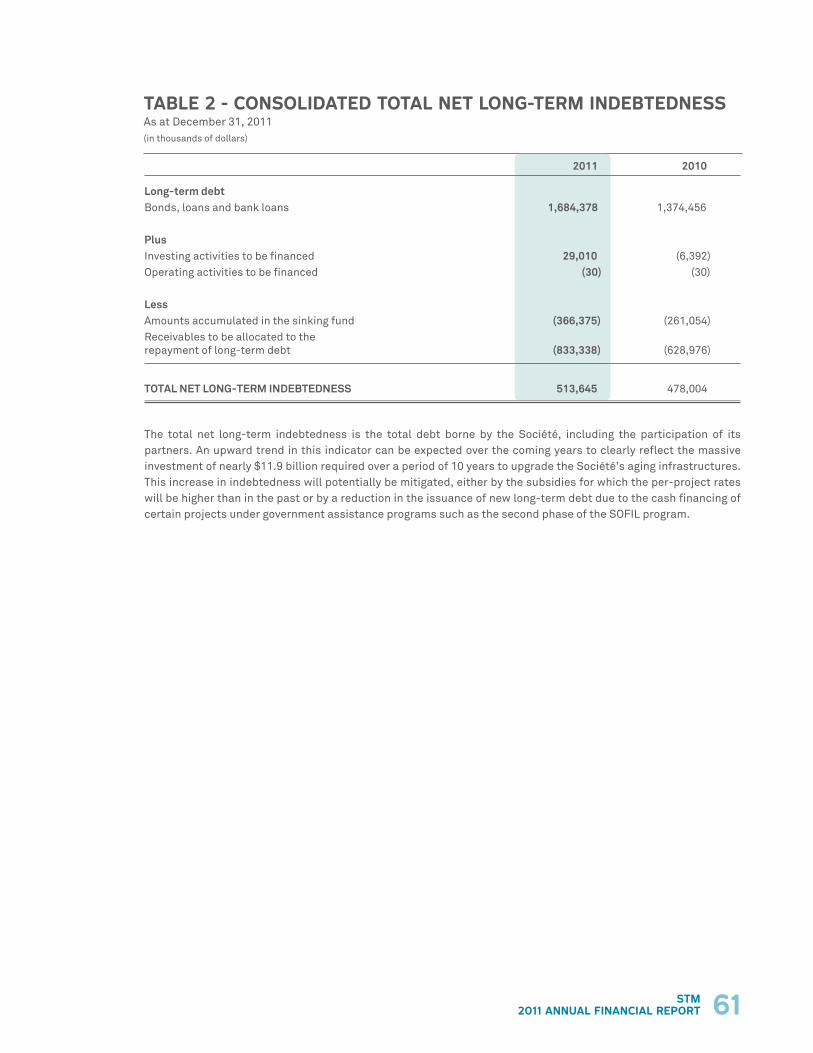
61stm2011 annual financial report
table 2 - consolidated total net lonG-term indebtednessAs at December 31, 2011 (in thousands of dollars)
2011 2010
long-term debtBonds, loans and bank loans 1,684,378 1,374,456
PlusInvesting activities to be financed 29,010 (6,392) Operating activities to be financed (30) (30)
lessAmounts accumulated in the sinking fund (366,375) (261,054) Receivables to be allocated to the repayment of long-term debt (833,338) (628,976)
TOTAl NET lONG-TERm INDEBTEDNESS 513,645 478,004
The total net long-term indebtedness is the total debt borne by the Société, including the participation of its partners. An upward trend in this indicator can be expected over the coming years to clearly reflect the massive investment of nearly $11.9 billion required over a period of 10 years to upgrade the Société’s aging infrastructures. This increase in indebtedness will potentially be mitigated, either by the subsidies for which the per-project rates will be higher than in the past or by a reduction in the issuance of new long-term debt due to the cash financing of certain projects under government assistance programs such as the second phase of the SOFIL program.

unaudited supplementary information

63stm2011 annual financial report
unaudited supplementary information
consolidated results of operationsYear ended December 31, 2011(in thousands of dollars)
2011 2010 2009 2008 2007
Budget Actual Actual Actual Actual Actual
Revenues Passenger revenues 506,123 533,249 487,670 463,187 444,717 415,655 Contribution from the Montreal Urban Agglomeration 387,900 387,900 359,400 332,000 301,700 277,038 Subsidies 140,479 134,385 113,236 94,760 74,829 55,400 Regional contributions and contributions from non-Agglomeration municipalities 90,224 70,746 71,133 58,617 57,536 57,291 Deferred surplus (deficit) - 2,996 - 3,821 1,582 (13,606)
Other revenues 38,788 33,439 31,120 28,809 26,412 25,376
1,163,514 1,162,715 1,062,559 981,194 906,776 817,154
ExpensesCompensation 751,426 745,351 707,171 660,325 615,538 584,135 Energy costs, taxes and licences 114,881 118,905 95,829 93,980 85,718 76,529 Professional services 75,542 85,896 66,487 67,742 61,610 43,268 Equipment and supplies 53,303 56,266 52,143 48,740 48,672 43,807 Rentals 12,702 10,737 9,309 8,302 8,212 8,160 Interest and financing costs 129,725 110,724 112,489 103,538 88,100 76,504 Miscellaneous expenses 25,935 14,115 16,135 17,510 17,105 12,169
1,163,514 1,141,994 1,059,563 1,000,137 924,955 844,572
Operating surplus (deficit) for tax purposes before additional contribution from (special contribution to) the Montreal Urban Agglomeration - 20,721 2,996 (18,943) (18,179) (27,418) Additional contribution from (special contribution to) the Montreal Urban Agglomeration - (15,000) - 18,943 22,000 29,000
Operating surplus for the year for tax purposes - 5,721 2,996 - 3,821 1,582
The opinion of the independent auditors does not cover the supplementary information or the budget.

64 stm2011 annual financial report
consolidated revenues by typeYear ended December 31, 2011(in thousands of dollars)
2011 2010 2009 2008 2007
Budget Actual Actual Actual Actual Actual
operations
PASSENGER REVENUES
Bus and metro serviceRegular1, 2, 6 and 10 trips 131,919 158,304 148,850 138,496 129,744 122,843 CAM 180,085 185,752 173,912 171,278 161,068 148,744 Weekly CAM 31,250 31,941 30,009 27,960 28,646 27,146
343,254 375,997 352,771 337,734 319,458 298,733
Reduced1, 2, 6 and 10 trips 14,535 15,696 13,911 13,728 18,272 17,832 CAM 65,201 68,070 61,700 58,637 57,948 57,262 Weekly CAM 1,702 1,773 1,549 1,718 2,491 2,437
81,438 85,539 77,160 74,083 78,711 77,531
Day passes and special offers 29,549 15,511 8,227 2,463 1,690 1,352
454,241 477,047 438,158 414,280 399,859 377,616
Paratransit service 3,152 3,113 2,819 2,686 2,325 2,144 Regional revenues 48,730 53,089 46,693 46,221 42,533 35,895
506,123 533,249 487,670 463,187 444,717 415,655
cONTRIBUTION fROm THE mONTREAl URBAN AGGlOmERATION Base contribution 387,900 387,900 359,400 332,000 301,700 277,038 Additional from (special to) contribution - (15,000) - 18,943 22,000 29,000
387,900 372,900 359,400 350,943 323,700 306,038
Amount to be carried forward 894,023 906,149 847,070 814,130 768,417 721,693
The opinion of the independent auditors does not cover the supplementary information or the budget.

65stm2011 annual financial report
consolidated revenues by typeYear ended December 31, 2011(in thousands of dollars)
2011 2010 2009 2008 2007
Budget Actual Actual Actual Actual Actual
Amount carried forward 894 ,023 906,149 847,070 814,130 768,417 721,693
SUBSIDIESGovernment assistance program for the public transport of people (PAGTCP) 48,773 32,319 35,621 29,675 25,804 19,024 Public transit service improvement program (PASTEC) 51,949 50,022 39,883 29,724 16,558 5,086 Paratransit service 39,757 38,656 37,334 34,779 32,467 30,793 Program for the financing of local infrastructures in Quebec (SOFIL) - 1,549 - - - - Other - 1,029 398 582 - 497
140,479 123,575 113,236 94,760 74,829 55,400
REGIONAl cONTRIBUTIONS AND cONTRIBUTIONS fROm NON-AGGlOmERATION mUNIcIPAlITIES
Regional contributions For trips on the metro network 40,308 40,128 40,521 45,073 43,933 44,260For trips on metropolitan bus routes 4,634 4,914 4,693 5,447 5,714 5,504Paratransit service 207 207 203 - - -For equipment and infrastructures 1,294 1,295 1,033 1,207 1,267 1,296Share of the fuel tax 31,601 11,802 13,503 - - -Fare integration 3,858 4,079 4,071 1,497 2,286 2,292
81,902 62,425 64,024 53,224 53,200 53,352
contribution from non-Agglomeration municipalities 8,322 8,321 7,109 5,393 4,336 3,939
90,224 70,746 71,133 58,617 57,536 57,291
OTHER REVENUES 50,594 48,714 38,789 34,769 30,225 32,031
Amount to be carried forward 1,175,320 1,149,184 1,070,228 1,002,276 931,007 866,415
The opinion of the independent auditors does not cover the supplementary information or the budget.

66 stm2011 annual financial report
2011 2010 2009 2008 2007
Budget Actual Actual Actual Actual Actual
Amount carried forward 1,175,320 1,149,184 1,070,228 1,002,276 931,007 866,415
investment
cONTRIBUTION fROm THE mONTREAl URBAN AGGlOmERATION Contribution for capital assets from the program for the financing of local infrastructures in Quebec (SOFIL) 27,532 16,113 41,117 8,483 10,417 16,544
SUBSIDIES Government assistance program for improving the public transport of people (PAGTCP) 261,438 127,063 105,697 169,039 102,081 235,476 Public transit service improvement program (PASTEC) - - 7,605 - 20,299 - Program for the financing of local infrastructures in Quebec (SOFIL) 181,818 95,550 223,139 46,246 56,816 90,168 Program to improve transportation security (Transit-Secure) - - - 6,523 5,842 - Building Canada Fund (BCF) - 1,517 - - - - Government assistance program for energy efficiency in passenger road transportation (PAGAAEE) - 3,140 - - - - Urban Transportation Showcase Program (UTSP) - - (217) 66 1,375 - Canada-Quebec Infrastructure Program (CQIP) - - - - - 16,547
443,256 227,270 336,224 221,874 186,413 342,191
1,646,108 1,392,567 1,447,569 1,232,633 1,127,837 1,225,150
consolidated revenues by typeYear ended December 31, 2011(in thousands of dollars)
The opinion of the independent auditors does not cover the supplementary information or the budget.

67stm2011 annual financial report
consolidated expenses by functionYear ended December 31, 2011(in thousands of dollars)
2011 2010 2009 2008 2007
Budget Actual Actual Actual Actual Actual
NETWORK OPERATIONSBus networkCompensation 366,165 356,798 337,238 322,551 304,306 288,166 Goods and services 78,942 78,148 71,174 69,141 58,917 52,677
445,107 434,946 408,412 391,692 363,223 340,843
metro networkCompensation 174,018 176,256 169,765 162,901 155,011 144,323 Goods and services 49,647 53,557 45,744 44,651 43,618 38,235
223,665 229,813 215,509 207,552 198,629 182,558
Paratransit (a)
Compensation 19,319 19,125 21,379 20,562 19,083 17,776 Goods and services 34,470 32,751 31,073 26,724 24,370 22,831
53,789 51,876 52,452 47,286 43,453 40,607
722,561 716,635 676,373 646,530 605,305 564,008
OPERATIONS SUPPORTmanagement and engineeringCompensation 28,846 26,507 24,540 22,347 20,357 18,398 Goods and services 3,450 4,521 2,769 1,877 1,575 1,829
32,296 31,028 27,309 24,224 21,932 20,227
Security and control Compensation 14,135 11,444 11,305 10,957 9,142 14,035 Goods and services 16,404 16,622 14,978 14,763 13,366 2,707
30,539 28,066 26,283 25,720 22,508 16,742
Infrastructure maintenance Compensation 26,336 24,667 23,347 21,633 20,689 20,597 Goods and services 13,174 13,946 4,187 7,831 6,653 5,890
39,510 38,613 27,534 29,464 27,342 26,487
102,345 97,707 81,126 79,408 71,782 63,456
Amount to be carried forward 824,906 814,342 757,499 725,938 677,087 627,464
The opinion of the independent auditors does not cover the supplementary information or the budget.

68 stm2011 annual financial report
consolidated expenses by functionYear ended December 31, 2011(in thousands of dollars)
2011 2010 2009 2008 2007
Budget Actual Actual Actual Actual Actual
Amount carried forward 824,906 814,342 757,499 725,938 677,087 627,464
ADmINISTRATIVE SERVIcESfinance and controlCompensation 17,252 17,805 16,210 15,066 13,943 13,459 Goods and services 6,730 6,267 4,749 7,264 7,534 4,150
23,982 24,072 20,959 22,330 21,477 17,609
Planning, marketing and communicationsCompensation 17,684 18,187 16,772 13,762 10,969 9,957 Goods and services 11,871 14,298 9,718 8,678 8,045 4,981
29,555 32,485 26,490 22,440 19,014 14,938
Human Resources and Shared Services Compensation 45,065 45,203 42,315 38,829 35,683 33,000 Goods and services 17,766 19,751 17,068 14,545 12,636 11,847
62,831 64,954 59,383 53,374 48,319 44,847
corporate services Compensation 11,054 12,203 9,708 8,527 7,600 7,126 Goods and services 6,895 3,915 3,396 2,412 2,098 1,898
17,949 16,118 13,104 10,939 9,698 9,024
134,317 137,629 119,936 109,083 98,508 86,418
SPEcIAl PROJEcTS AND OTHER EXPENSESCompensation 26,948 36,267 30,789 21,472 21,746 10,049Goods and services 38,328 13,497 26,561 29,305 39,170 35,843
65,276 49,764 57,350 50,777 60,916 45,892
AllOcATION - PROVISION fOR fUTURE AmOUNTS (employee future benefits) Compensation (1,500) 69,157 (313,379) (96,419) - -
fINANcING cOSTS Goods and services 85,065 64,056 65,030 61,058 47,747 43,540
AmORTIZATION Goods and services 152,000 159,873 158,852 119,650 100,400 94,249
UNfORESEEN EXPENSES Goods and services 1,287 - - - - -
1,261,351 1,294,821 845,288 970,087 984,658 897,563
(a) ParatransitParatransit service in the Statement of Operations 60,803 57,465 53,423 48,475 44,696 41,741Expenses included in other functions (7,014) (5,589) (971) (1,189) (1,243) (1,134)
53,789 51,876 52,452 47,286 43,453 40,607
The opinion of the independent auditors does not cover the supplementary information or the budget.

69stm2011 annual financial report
financinG of capital assetsAs at December 31, 2011(in thousands of dollars)
2011 2010 2009 2008 2007
Budget Actual Actual Actual Actual Actual
cAPITAl ASSET AcQUISITIONS (583,346) (360,286) (435,737) (368,173) (316,673) (225,240)
fINANcINGfederal government
Program to improve transportation security (Transit-Secure) - - - 6,523 5,842 - Urban Transportation Showcase Program (UTSP) - - (217) 66 1,375 - Building Canada Fund (BCF) - 1,517 - - - -
- 1,517 (217) 6,589 7,217 -
Provincial government Government assistance program for the public transport of people (PAGTCP) 261,438 127,063 105,697 169,039 102,081 235,476 Public transit service improvement program (PASTEC) - - 7,605 - 20,299 - Program for the financing of local infrastructures in Quebec (SOFIL) 181,818 95,550 223,139 46,246 56,816 90,168 Government assistance program for improving energy efficiency in passenger road transportation (PAGAAEE) - 3,140 - - - - Canada-Quebec Infrastructure Program (CQIP) - - - - - 16,547
443,256 225,753 336,441 215,285 179,196 342,191
municipal contribution Program for the financing of local infrastructures in Quebec (SOFIL) 27,532 16,113 41,117 8,483 10,417 16,544
Société de transport de montréal Long-term financing of investing activities 109,956 61,569 65,767 149,263 6,560 103,773 Allocations to operating activities 2,602 21,130 17,864 6,786 6,273 5,560 Closed loan by-laws - (1,128) - - 1,073 2,542
112,558 81,571 83,631 156,049 13,906 111,875
583,346 324,954 460,972 386,406 210,736 470,610
Investing surplus (deficit) for the year for tax purposes - (35,332) 25,235 18,233 (105,937) 245,370
The opinion of the independent auditors does not cover the supplementary information or the budget.

70 stm2011 annual financial report
lonG-term debt As at December 31, 2011(in thousands of dollars)
2011 2010
Bond, 60,000 $5.75 %, maturing November 15, 2011 - 9,586
Bond, 40,000 $5.15 %, maturing October 24, 2011 - 3,430 5.25 %, maturing October 24, 2012 9,110 9,110 Bond, 75,000 $5.15 %, maturing May 6, 2011 - 5,7005.30 %, maturing May 6, 2012 6,000 6,0005.40 %, maturing May 6, 2013 20,600 20,600 Bond, 75,000 $4.00 %, maturing April 27, 2011 - 6,3004.15 %, maturing April 27, 2012 6,500 6,5004.35 %, maturing April 27, 2013 6,800 6,8004.50 %, maturing April 27, 2014 7,100 7,1004.60 %, maturing April 27, 2015 15,100 15,100 Bond, 14,000 $4.00 %, maturing November 8, 2011 - 3,000 Bond, 300,000 $ 5.00 %, maturing December 1, 2019 (a) 300,000 300,000 Bond, 47,130 $ (b) 5.46 %, maturing January 9, 2012 (a) 47,130 47,130 Bond, 75,350 $ (b) 4.74 %, maturing June 7, 2017 54,252 54,2524.92 %, maturing June 7, 2027 21,098 21,098
Bond, 84,500 $ (b) 5.85 %, maturing January 29, 2024 84,500 84,500
Bond, 100,000 $4.71 %, maturing April 21,2014(a) 100,000 100,000
Bond, 75,000 $5.22 %, maturing October 22, 2014(a) 75,000 75,000
Bank loan, 100,000 $4.67 %, maturing February 24, 2016(a) 60,000 60,000 4.89 %, maturing February 24, 2021 40,000 40,000
Bank loan, 100,000 $ 4.36 %, maturing January 19, 2017(a) 73,200 73,200 4.55 %, maturing January 19, 2022 16,300 16,3004.60 %, maturing January 19, 2027 10,500 10,500
Amount to be carried forward 953,190 981,206
The opinion of the independent auditors does not cover the supplementary information or the budget.
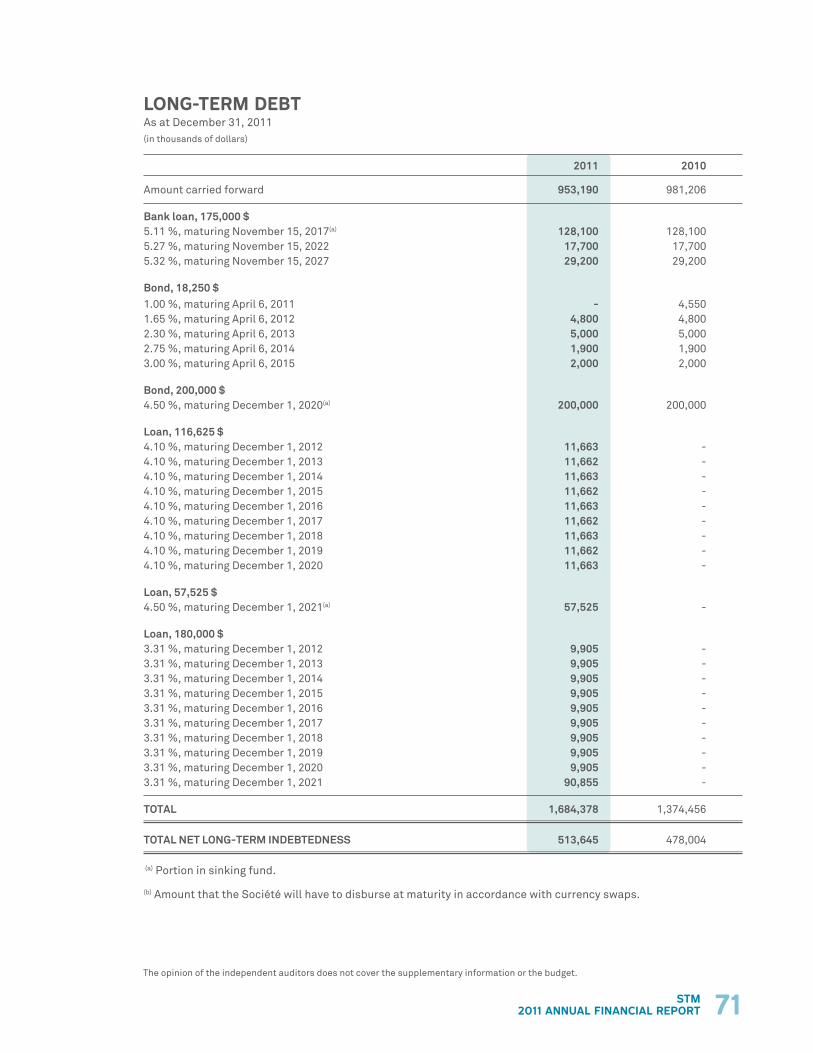
71stm2011 annual financial report
2011 2010
Amount carried forward 953,190 981,206
Bank loan, 175,000 $5.11 %, maturing November 15, 2017(a) 128,100 128,100 5.27 %, maturing November 15, 2022 17,700 17,700 5.32 %, maturing November 15, 2027 29,200 29,200 Bond, 18,250 $ 1.00 %, maturing April 6, 2011 - 4,5501.65 %, maturing April 6, 2012 4,800 4,8002.30 %, maturing April 6, 2013 5,000 5,0002.75 %, maturing April 6, 2014 1,900 1,9003.00 %, maturing April 6, 2015 2,000 2,000 Bond, 200,000 $ 4.50 %, maturing December 1, 2020(a) 200,000 200,000 loan, 116,625 $ 4.10 %, maturing December 1, 2012 11,663 -4.10 %, maturing December 1, 2013 11,662 -4.10 %, maturing December 1, 2014 11,663 -4.10 %, maturing December 1, 2015 11,662 -4.10 %, maturing December 1, 2016 11,663 -4.10 %, maturing December 1, 2017 11,662 -4.10 %, maturing December 1, 2018 11,663 -4.10 %, maturing December 1, 2019 11,662 -4.10 %, maturing December 1, 2020 11,663 - loan, 57,525 $4.50 %, maturing December 1, 2021(a) 57,525 - loan, 180,000 $ 3.31 %, maturing December 1, 2012 9,905 -3.31 %, maturing December 1, 2013 9,905 -3.31 %, maturing December 1, 2014 9,905 -3.31 %, maturing December 1, 2015 9,905 -3.31 %, maturing December 1, 2016 9,905 -3.31 %, maturing December 1, 2017 9,905 -3.31 %, maturing December 1, 2018 9,905 -3.31 %, maturing December 1, 2019 9,905 -3.31 %, maturing December 1, 2020 9,905 -3.31 %, maturing December 1, 2021 90,855 - TOTAl 1,684,378 1,374,456
TOTAl NET lONG-TERm INDEBTEDNESS 513,645 478,004
(a) Portion in sinking fund.
(b) Amount that the Société will have to disburse at maturity in accordance with currency swaps.
lonG-term debt As at December 31, 2011(in thousands of dollars)
The opinion of the independent auditors does not cover the supplementary information or the budget.
72 stm2011 annual financial report
The Société formalized the normal management practices on which it bases its financing decisions. To do so, it adopted and implemented a corporate policy and segment guidelines, including debt management and financial risk management segment guidelines. The debt management segment guideline favours the use of financial ratios that will serve as long-term indicators of the Société’s financial health. Among these indicators are the indebtedness ratios.
The three ratios chosen are indicators that illustrate how investing decisions impact the Société’s long-term financial position.
These ratios must be compared on a historical basis. Following international benchmarking against same-size entities, the Société set limits for each of the ratios. The Société uses these to demonstrate the impact of investing decisions on its financial position.
All financial statements items used to calculate ratios have been adjusted so that they represent only expenses exclusive to the Société. As such, for comparison purposes, any impact from subsidies related to capital assets has been eliminated.
As at December 31, 2011, all of the ratios are within the limits set by the Société.
The opinion of the independent auditors does not cover the supplementary information or the budget.
financial ratiosAs at December 31, 2011

73stm2011 annual financial report
Debt servicing assumed by Société / net operating expenses of the subsidies earmarked for debt servicing
This ratio represents the portion of expenses allocated to debt servicing. The ratio is currently 5.77 %, which is below the 16 % limit set by the Société. The ratio shows that the portion of expenses earmarked for debt servicing is reasonable and under control. The decline in the ratio for 2011 is due to the higher level of net operating expenses, as debt servicing remained almost at the same level; the significant increase in expenses is attributable to a substantial year-over-year increase in employee future benefits.
The opinion of the independent auditors does not cover the supplementary information or the budget.
0 %
2 %
4 %
6 %
8 %
10 %
20112010200920082007
financial ratiosAs at December 31, 2011

74 stm2011 annual financial report
Debt excluding the financial partners’ portion / Net annual revenues from the subsidies earmarked for debt servicing
The long-term debt must increase in proportion to revenues. The ratio is currently 50.70 %, which is below the 100 % limit set by the Société. The four-year growth trend for this ratio shows the Société’s significant financing requirements but the revenues are also growing, albeit at a slower pace.
financial ratiosAs at December 31, 2011
The opinion of the independent auditors does not cover the supplementary information or the budget.
0 %
6 %
12 %
18 %
24 %
30 %
36 %
42 %
48 %
54 %
60 %
20112010200920082007

75stm2011 annual financial report
financial ratiosAs at December 31, 2011
Debt excluding the financial partners’ portion / Net assets from the subsidies earmarked for debt servicing
This ratio is an indicator of the leverage used by the Société. The ratio is currently 18.17 %, which is below the 100 % limit set by the Société. This ratio is at a reasonable level and shows that the financial partners are making larger contributions to asset financing, particularly with respect to cash subsidies.
The opinion of the independent auditors does not cover the supplementary information or the budget.
0 %
5 %
10 %
15 %
20 %
25 %
20112010200920082007

77stm2011 annual financial report

stm.info You can also view the 2011 Sustainable Development Report, the 2011 Activities Report, as well as the 2011 Budget and 2011-2013 Three-year Capital Expenditures Program in the Documentation Centre section of our website.
PUBLISHED BY THE SOCIÉTÉ DE TRANSPORT DE MONTRÉAL
Executive Division - Finance and Control Division - Financial Management and Systems Framework800 De La Gauchetière Street West Suite 9100 Montreal, Quebec H5A 1J6 Legal DepositBibliothèque nationale1st quarter
Ce document est disponible en français
Annual Financial Report
20
11 AN
NU
AL F
INA
NC
IAL R
EP
OR
T S
OC
IÉT
É D
E T
RA
NS
PO
RT
DE
MO
NT
RÉ
AL