annual financial statements 2016 - seeking alpha
TRANSCRIPT

ANNUAL FINANCIAL STATEMENTS 2016
3 3 3

ANNUAL FINANCIAL STATEMENTS
CONTENTS
FORWARD-LOOKING STATEMENTSSome of the information in this report may contain projections or other forward-looking statements regarding future events or other financial performance, including
information relating to our company, that are based on the beliefs of our management, as well as assumptions made by and information currently available to our
management. When used in this report, the words “estimate”, “project”, “believe”, “anticipate”, “intend”, “expect” and similar expressions are intended to identify forward-
looking statements. Such statements reflect our current views with respect to future events and are subject to risks, uncertainties and assumptions. Many factors could
cause the actual results, performance or achievements to be materially different from any future results, performance or achievements that may be expressed or implied
by such forward-looking statements, including, among others, adverse changes or uncertainties in general economic conditions in the markets we serve, a drop in the gold
price, a prolonged strengthening of the rand against the dollar, regulatory developments adverse to DRDGOLD or difficulties in maintaining necessary licences or other
governmental approvals, changes in DRDGOLD’s competitive position, changes in business strategy, any major disruption in production at key facilities or adverse changes
in foreign exchange rates and various other factors.
These risks include, without limitation, those described in the section entitled “Risk Factors” included in our Form 20-F for the fiscal year ended 30 June 2015, which we filed
with the United States Securities and Exchange Commission (SEC) on 30 October 2015. You should not place undue reliance on these forward-looking statements, which
speak only as of the date thereof. We do not undertake any obligation to publicly update or revise these forward-looking statements to reflect events or circumstances
after the date of this report or the occurrence of unanticipated events. Any forward-looking statement included in this report has not been reviewed or reported on by
DRDGOLD’s auditors.
Annual Financial Statements
(Supervised by CFO: Mr AJ Davel CA (SA))
(Authorised for issue on 21 September 2016)
Directors’ report 2
Directors’ responsibility statement and approval 4
Company Secretary’s statement 5
Report of the Audit and Risk Committee 6
Independent Auditor’s report 7
Financial statements* 8
Other information
Administration and contact details IBC
* Audited
1DRDGOLD LIMITED ANNUAL FINANCIAL STATEMENTS 2016

DIRECTORS’ REPORT
NATURE OF BUSINESSDRDGOLD Limited (DRDGOLD or the “company“), which was incorporated on 16 February 1895, owns assets that are primarily involved in the
retreatment of surface gold. Based in South Africa, the company does not have a major or controlling shareholder and its directors provide strategic
direction on behalf of its shareholders.
DRDGOLD is a public company with its primary listing on the JSE Limited (JSE), and its secondary listing on the New York Stock Exchange Limited (NYSE).
The company’s shares are also traded on the Marché Libre Paris, the Regulated Unofficial Market on the Frankfurt Stock Exchange and the Berlin and
Stuttgart OTC markets.
SHARE CAPITALDetails of the 546 000 new shares that were issued and listed during the financial year (2015: 45 500 000) as well as the authorised, issued and unissued
share capital of the company as at 30 June 2016 are set out in note 16.1 to the financial statements.
The control over the unissued shares of the company is vested in the directors, in specific terms with regard to allotments in terms of the DRDGOLD
(1996) share option scheme (as amended) and the allotment of shares for cash, and in general terms with respect to all other allotments.
The authorities granted to directors in respect of control over unissued shares expire on the date of the annual general meeting (AGM) of members to
be held on 25 November 2016. Members will, therefore, be requested to consider resolutions at the forthcoming AGM, placing under the control of the
directors the then remaining unissued ordinary shares.
DIRECTORATEAs at 30 June 2016, the board of directors comprised of two executive directors and four non-executive directors.
The directorate remained unchanged during the year under review and up to the date of this report.
The following changes to the company secretary were implemented during the year under review and up to the date of this report:
TJ Gwebu Resigned 31 December 2015
R Masemene Appointed 9 March 2016
In accordance with the provisions of the company’s Memorandum of Incorporation (MOI), DJ Pretorius, JA Holtzhausen and J Turk will retire at the
forthcoming annual general meeting. They are eligible and have offered themselves for re-election.
DIRECTORS’ INTERESTS IN SHARESThe interests of the directors during the year ended, up to the date of this report, in the ordinary share capital of the company were as follows:
30 JUNE 2016 30 JUNE 2015
Beneficial direct
Beneficial indirect
Beneficial direct
Beneficial indirect
Executive directors
DJ Pretorius (1,2,3) 376 167 – 401 167 –
F van der Westhuizen – – – –
AT Meyer – – – –
AJ Davel – – – –
376 167 – 401 167 –
Non-executive directors
GC Campbell 200 000 – 200 000 –
J Turk – 243 000 – 243 000
EA Jeneker – – – –
JA Holtzhausen – – – –
200 000 243 000 200 000 243 000
Total 576 167 243 000 601 167 243 000
(1) 100 000 shares were acquired in the market during the year ended 30 June 2016.(2) 125 000 shares were disposed in the market during the year ended 30 June 2016.(3) 370 734 shares were disposed in the market subsequent to 30 June 2016 up to the date of this report.
The full details of the total executive and non-executive directors’ remuneration for the year ended 30 June 2016 are provided in note 5 to the financial
statements.
32DRDGOLD LIMITED ANNUAL FINANCIAL STATEMENTS 2016
ANNUAL FINANCIAL STATEMENTS
REVIEW OF OPERATIONSThe performance of our operations is reviewed in the financial capital section of the Integrated Report 2016.
SIGNIFICANT EVENTS
Brakpan/Withok Tailings Deposition FacilityA legal review of the existing authorisations was undertaken for increasing the deposition capacity of the Brakpan/Withok Tailings Deposition Facility.
The results indicated that most of the current authorisations are sufficient, however certain documentation will need to be amended. Refer to the
discussion of the life of mine potential in the strategy section of the Integrated Report 2016.
DIVIDENDSDividends are proposed and approved by the board of directors of DRDGOLD based on the quarterly management accounts presented to the board.
Dividends are recognised when declared by the board of directors of DRDGOLD. The payment of future dividends will depend upon the board’s ongoing
assessment of DRDGOLD’s earnings, after providing for long-term growth, cash and funding resources and the amount of reserves available for a dividend
based on the going-concern assessment.
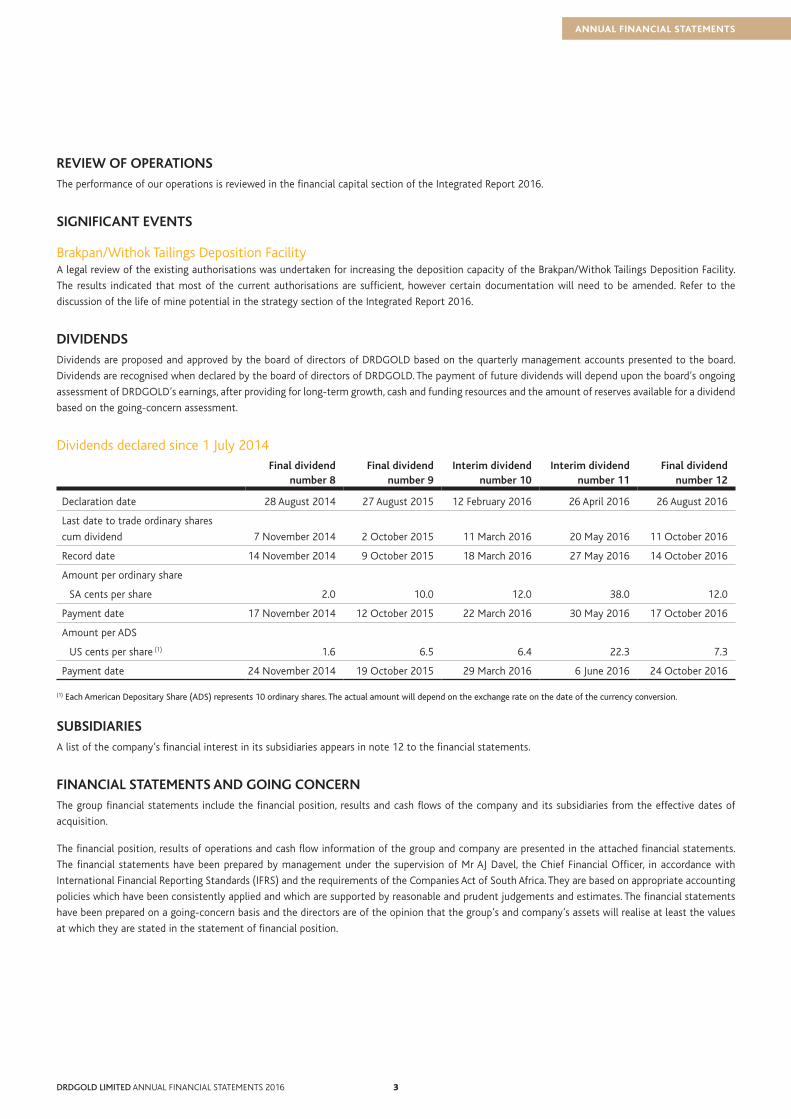
Dividends declared since 1 July 2014Final dividend
number 8Final dividend
number 9Interim dividend
number 10Interim dividend
number 11Final dividend
number 12
Declaration date 28 August 2014 27 August 2015 12 February 2016 26 April 2016 26 August 2016
Last date to trade ordinary shares
cum dividend 7 November 2014 2 October 2015 11 March 2016 20 May 2016 11 October 2016
Record date 14 November 2014 9 October 2015 18 March 2016 27 May 2016 14 October 2016
Amount per ordinary share
SA cents per share 2.0 10.0 12.0 38.0 12.0
Payment date 17 November 2014 12 October 2015 22 March 2016 30 May 2016 17 October 2016
Amount per ADS
US cents per share (1) 1.6 6.5 6.4 22.3 7.3
Payment date 24 November 2014 19 October 2015 29 March 2016 6 June 2016 24 October 2016
(1) Each American Depositary Share (ADS) represents 10 ordinary shares. The actual amount will depend on the exchange rate on the date of the currency conversion.
SUBSIDIARIESA list of the company’s financial interest in its subsidiaries appears in note 12 to the financial statements.
FINANCIAL STATEMENTS AND GOING CONCERNThe group financial statements include the financial position, results and cash flows of the company and its subsidiaries from the effective dates of
acquisition.
The financial position, results of operations and cash flow information of the group and company are presented in the attached financial statements.
The financial statements have been prepared by management under the supervision of Mr AJ Davel, the Chief Financial Officer, in accordance with
International Financial Reporting Standards (IFRS) and the requirements of the Companies Act of South Africa. They are based on appropriate accounting
policies which have been consistently applied and which are supported by reasonable and prudent judgements and estimates. The financial statements
have been prepared on a going-concern basis and the directors are of the opinion that the group’s and company’s assets will realise at least the values
at which they are stated in the statement of financial position.
3DRDGOLD LIMITED ANNUAL FINANCIAL STATEMENTS 20162

DIRECTORS’ RESPONSIBILITY STATEMENT AND APPROVAL
The directors are responsible for the preparation and fair presentation of the group and company annual financial statements of DRDGOLD Limited,
comprising the statements of financial position at 30 June 2016, and the statements of profit or loss and other comprehensive income, changes in equity
and cash flows for the year then ended, and the notes to the financial statements which include a summary of significant accounting policies and other
explanatory notes, in accordance with International Financial Reporting Standards and the requirements of the Companies Act of South Africa, and the
directors’ report.
The directors are also responsible for such internal control as the directors determine is necessary to enable the preparation of financial statements that
are free from material misstatement, whether due to fraud or error, and for maintaining adequate accounting records and an effective system of risk
management.
The directors have made an assessment of the ability of the company and its subsidiaries to continue as going concerns and have no reason to believe
that the businesses will not be going concerns in the year ahead.
The auditor is responsible for reporting on whether the group and company financial statements are fairly presented in accordance with the applicable
financial reporting framework.
APPROVAL OF GROUP AND COMPANY ANNUAL FINANCIAL STATEMENTSThe group and company annual financial statements of DRDGOLD Limited, as identified in the first paragraph, were approved by the board of directors
on 21 September 2016 and signed by:
JA Holtzhausen AJ Davel
Chairman: Audit and Risk Committee Chief Financial Officer
Authorised director Authorised director
54DRDGOLD LIMITED ANNUAL FINANCIAL STATEMENTS 2016

ANNUAL FINANCIAL STATEMENTS
COMPANY SECRETARY’S STATEMENT
I certify, in accordance with Section 88(2)(e) of the Companies Act of South Africa, that to the best of my knowledge and belief, the company has lodged
with the Companies and Intellectual Property Commission for the financial year ended 30 June 2016 all such returns as are required of a public company
in terms of the Companies Act, and that all such returns appear to be true, correct and up to date.
R Masemene
Company Secretary
21 September 2016
5DRDGOLD LIMITED ANNUAL FINANCIAL STATEMENTS 20164

REPORT OF THE AUDIT AND RISK COMMITTEE
The legal responsibilities of the Audit and Risk Committee of the DRDGOLD Limited group are set out in the Companies Act. These responsibilities,
together with the requirements of the JSE and compliance with appropriate governance and international best practice, are incorporated in the Audit
and Risk Committee’s charter. The Audit and Risk Committee has regulated its affairs in compliance with this mandate, and has discharged all of the
responsibilities set out therein.
The members of the committee responsible for audit related matters were formally appointed by the shareholders at the AGM held on 4 November 2015.
The biographical details of the committee’s members are set out on pages 55 and 56 of the 2016 Integrated Report and the members’ fees are set out
on page 61 of the same report.
CHIEF FINANCIAL OFFICERAs required by the JSE Listings Requirement 3.84(h), the Audit and Risk Committee has satisfied itself that the Chief Financial Officer, Riaan Davel, has
the appropriate expertise and experience.
EXTERNAL AUDITORSThe Audit and Risk Committee considered the matters set out in the Companies Act, and:
• is satisfied with the independence and objectivity of the external auditors;
• has approved the external auditor’s fees and terms of engagement for the year ended 30 June 2015 and budgeted fees and terms of engagement for
the financial year ended 30 June 2016; and
• has approved the non-audit related services performed by the external auditors in accordance with the policy established and approved by the board.
INTERNAL AUDITORSThe Audit and Risk Committee considered and confirmed the audit plan for the 2016 financial year and reviewed the results of the internal audits
conducted during the 2016 financial year.
GENERALSeparate meetings are held with management and external and internal audit representatives to discuss any problems and other matters that they wish
to discuss. The head of internal audit and risk and the external auditors have unlimited access to the chairman of the Audit and Risk Committee. The
chairman of the Audit and Risk Committee attends AGMs and is available to answer any questions.
To the best of their knowledge, and on the basis of the information and explanations given by management and the group internal audit function as well
as discussions with the independent external auditors on the results of their audits, the Audit and Risk Committee is satisfied that there was no material
breakdown in the internal accounting controls during the financial year under review.
The Audit and Risk Committee has evaluated the financial statements of DRDGOLD Limited for the year ended 30 June 2016 and based on the
information provided to the Audit and Risk Committee, considers that the group complies, in all material respects, with the requirements of the
Companies Act, IFRS and the JSE Listings Requirements.
The Audit and Risk Committee has recommended the financial statements to the board for approval. The board has subsequently approved the financial
statements which will be open for discussion at the forthcoming AGM.
J A Holtzhausen
Chairman: Audit and Risk Committee
21 September 2016
76DRDGOLD LIMITED ANNUAL FINANCIAL STATEMENTS 2016

ANNUAL FINANCIAL STATEMENTS
INDEPENDENT AUDITOR’S REPORT
TO THE SHAREHOLDERS OF DRDGOLD LIMITED
REPORT ON THE GROUP AND COMPANY FINANCIAL STATEMENTSWe have audited the group and company financial statements of DRDGOLD Limited, which comprise the group and company statements of financial
position at 30 June 2016, and the group and company statements of profit or loss and other comprehensive income, changes in equity and cash flows
for the year then ended, and the notes to the group and company financial statements which include a summary of significant accounting policies and
other explanatory notes, as set out on pages 8 to 62.
DIRECTORS’ RESPONSIBILITY FOR THE GROUP AND COMPANY FINANCIAL STATEMENTSThe company’s directors are responsible for the preparation and fair presentation of these financial statements in accordance with International Financial Reporting Standards and the requirements of the Companies Act of South Africa, and for such internal control as the directors determine is necessary to enable the preparation of financial statements that are free from material misstatement, whether due to fraud or error.
AUDITOR’S RESPONSIBILITYOur responsibility is to express an opinion on these financial statements based on our audit. We conducted our audit in accordance with International Standards on Auditing. Those standards require that we comply with ethical requirements and plan and perform the audit to obtain reasonable assurance about whether the financial statements are free from material misstatement.
An audit involves performing procedures to obtain audit evidence about the amounts and disclosures in the financial statements. The procedures selected depend on the auditor’s judgement, including the assessment of the risks of material misstatement of the financial statements, whether due to fraud or error. In making those risk assessments, the auditor considers internal control relevant to the entity’s preparation and fair presentation of the financial statements in order to design audit procedures that are appropriate in the circumstances, but not for the purpose of expressing an opinion on the effectiveness of the entity’s internal control. An audit also includes evaluating the appropriateness of accounting policies used and the reasonableness of accounting estimates made by management, as well as evaluating the overall presentation of the financial statements.
We believe that the audit evidence we have obtained is sufficient and appropriate to provide a basis for our audit opinion.
OPINIONIn our opinion, these financial statements present fairly, in all material respects, the consolidated and separate financial position of DRDGOLD Limited at 30 June 2016, and its consolidated and separate financial performance and consolidated and separate cash flows for the year then ended in accordance
with International Financial Reporting Standards and the requirements of the Companies Act of South Africa.
OTHER REPORTS REQUIRED BY THE COMPANIES ACTAs part of our audit of the financial statements for the year ended 30 June 2016, we have read the Directors’ report, the Company Secretary’s statement and the Report of the Audit and Risk Committee for the purpose of identifying whether there are material inconsistencies between these reports and the audited financial statements. These reports are the responsibility of the respective preparers. Based on reading these reports we have not identified material inconsistencies between these reports and the audited financial statements. However, we have not audited these reports and accordingly do
not express an opinion on these reports.
REPORT ON OTHER LEGAL AND REGULATORY REQUIREMENTSIn terms of the IRBA Rule published in Government Gazette Number 39475 dated 4 December 2015, we report that KPMG Inc. has been the auditor of
DRDGOLD Limited for 14 years.
KPMG Inc.Registered Auditor
Per OC PotgieterChartered Accountant (SA)Registered AuditorDirector
26 September 2016
Suite 301 Secunda Medforum BuildingHeunis StreetSecunda
2302
7DRDGOLD LIMITED ANNUAL FINANCIAL STATEMENTS 20166

GROUP STATEMENT OF PROFIT OR LOSS AND OTHER COMPREHENSIVE INCOME FOR THE YEAR ENDED 30 JUNE 2016
2016 2015
Note R'000 R'000
Revenue 3 2 433 064 2 105 298
Cost of sales (2 236 790) (1 946 331)
Operating costs (2 030 289) (1 786 880)
Depreciation 10 (180 167) (193 301)
Retrenchment costs 4 – (7 150)
Movement in provision for environmental rehabilitation 15, 17 (19 259) 20 443
Movement in gold in process (7 075) 20 557
Gross profit from operating activities 196 274 158 967
Impairments 4 – (7 904)
Administration expenses and general costs (76 695) (56 162)
Results from operating activities 4 119 579 94 901
Finance income 6 36 849 51 497
Finance expenses 7 (47 576) (49 603)
Profit before tax 108 852 96 795
Income tax 8 (46 923) (28 599)
Profit for the year 61 929 68 196
Attributable to:
Equity owners of the parent 61 929 67 807
Non-controlling interest 16.2 – 389
Profit for the year 61 929 68 196
Other comprehensive income
Items that are or may be reclassified to profit or loss, net of tax
Net fair value adjustment on available-for-sale investments 4 342 (757)
Fair value adjustment on available-for-sale investments 11 4 342 19 118
Fair value adjustment on available-for-sale investment reclassified to profit or loss – (19 875)
Foreign exchange translation reserve reclassified to profit or loss 6 – (5 882)
Items that will never be reclassified to profit or loss, net of tax
Actuarial loss 18 – (539)
Total comprehensive income for the year 66 271 61 018
Attributable to:
Equity owners of the parent 66 271 60 629
Non-controlling interest – 389
Total comprehensive income for the year 66 271 61 018
Earnings per share attributable to equity owners of the parent
Basic earnings per share (cents) 9 15 17
Diluted earnings per share (cents) 9 15 17
The accompanying notes are an integral part of these financial statements.
98DRDGOLD LIMITED ANNUAL FINANCIAL STATEMENTS 2016

ANNUAL FINANCIAL STATEMENTS
COMPANY STATEMENT OF PROFIT OR LOSS AND OTHER COMPREHENSIVE INCOME FOR THE YEAR ENDED 30 JUNE 2016
2016 2015
Note R'000 R'000
Revenue 3 20 088 10 560
Operating costs (20 177) (10 649)
Depreciation 10 (58) (144)
Retrenchment costs 4 – (2 974)
Impairments 4 – (4 829)
Administration expenses and general costs (57 659) (36 236)
Results from operating activities 4 (57 806) (44 272)
Finance income 6 81 385 95 145
Finance expenses 7 (358) (7 468)
Profit before tax 23 221 43 405
Income tax 8 487 4 185
Profit for the year 23 708 47 590
Other comprehensive income
Items that are or may be reclassified to profit or loss, net of tax
Net fair value adjustment on available-for-sale investments 4 342 (757)
Fair value adjustment on available-for-sale investments 11 4 342 19 118
Fair value adjustment on available-for-sale investment reclassified to profit or loss – (19 875)
Total comprehensive income for the year 28 050 46 833
The accompanying notes are an integral part of these financial statements.
9DRDGOLD LIMITED ANNUAL FINANCIAL STATEMENTS 20168

STATEMENTS OF FINANCIAL POSITION AT 30 JUNE 2016
GROUP COMPANY
2015 2016 2016 2015
R'000 R'000 Note R'000 R'000
ASSETS1 894 054 1 818 383 Non-current assets 773 391 1 049 806
1 698 774 1 600 476 Property, plant and equipment 10 118 84
194 082 211 088 Non-current investments and other assets 11 9 033 5 881
– – Investments in subsidiaries 12 757 421 1 042 643
1 198 6 819 Deferred tax asset 19 6 819 1 198
608 984 600 692 Current assets 298 194 249 859
168 729 160 669 Inventories 13 – –
93 273 66 515 Trade and other receivables 14 13 005 8 051
13 241 6 749 Current tax asset 6 584 13 241
324 375 351 796 Cash and cash equivalents 23 278 605 228 567
9 366 14 963 Assets held for sale 15 – –
2 503 038 2 419 075 TOTAL ASSETS 1 071 585 1 299 665
EQUITY AND LIABILITIES 1 529 925 1 339 556 Equity of the owners of the parent 16.1 1 034 910 1 262 594
669 495 765 971 Non-current liabilities 8 550 454
493 291 522 905 Provision for environmental rehabilitation 17 – –
9 242 31 583 Post-retirement and other employee benefits 18 8 550 454
147 801 194 677 Deferred tax liability 19 – –
19 161 16 806 Finance lease obligation 21 – –
303 618 313 548 Current liabilities 28 125 36 617
258 353 289 023 Trade and other payables 26 948 12 790
2 000 2 355 Finance lease obligation 21 – –
23 096 – Loans and borrowings 20 – 23 096
2 557 6 568 Post-retirement and other employee benefits 18 1 177 731
17 612 15 602 Liabilities held for sale 15 – –
973 113 1 079 519 TOTAL LIABILITIES 36 675 37 071
2 503 038 2 419 075 TOTAL EQUITY AND LIABILITIES 1 071 585 1 299 665
The accompanying notes are an integral part of these financial statements.
1110DRDGOLD LIMITED ANNUAL FINANCIAL STATEMENTS 2016

ANNUAL FINANCIAL STATEMENTS
GROUP STATEMENT OF CHANGES IN EQUITY FOR THE YEAR ENDED 30 JUNE 2016
Ordinary
shares
Cumulative preference
shares Share
capital
Cumulative preference
share capital
Revaluation and other
reserves (1)
Retained earnings
Equity of the owners
of the parent
Non- controlling
interest Total
equity
Note Number Number R’000 R’000 R’000 R’000 R’000 R’000 R’000
Balance at 30 June 2014 385 383 767 5 000 000 4 088 474 500 172 856 (3 012 759) 1 249 071 232 140 1 481 211
Total comprehensive income
Profit for the year 67 807 67 807 389 68 196
Other comprehensive income (6 639) (539) (7 178) (7 178)
Fair value adjustment on
available-for-sale investments 11 19 118 19 118 19 118
Fair value adjustment on
available-for-sale investments
reclassified to profit or loss 11 (19 875) (19 875) (19 875)
Foreign exchange translation
reserve reclassified to profit
or loss 6 (5 882) (5 882) (5 882)
Actuarial loss 18 (539) (539) (539)
Transactions with the owners
of the parent
Acquisition of non-controlling
interest without a change in
control
Share issue 45 500 000 96 460 135 189 231 649 (232 529) (880)
Transaction costs (4 015) (4 015) (4 015)
Dividend on ordinary share capital 16 .1 (7 585) (7 585) (7 585)
Share-based payments 176 176 176
Share option reserve transferred
to retained earnings (2) (30 563) 30 563 – –
Balance at 30 June 2015 430 883 767 5 000 000 4 180 919 500 135 830 (2 787 324) 1 529 925 – 1 529 925
Total comprehensive income
Profit for the year 61 929 61 929 61 929
Other comprehensive income 4 342 4 342 4 342
Fair value adjustment on
available-for-sale investments 11 4 342 4 342 4 342
Transactions with the owners of
the parent
Issued shares for cash 18 546 000 2 796 2 796 2 796
Treasury shares acquired through
subsidiary 16 .1 (6 521) (6 521) (6 521)
Dividend on ordinary share capital 16 .1 (252 915) (252 915) (252 915)
Balance at 30 June 2016 431 429 767 5 000 000 4 177 194 500 140 172 (2 978 310) 1 339 556 – 1 339 556
(1) Revaluation and other reserves at 30 June 2016 comprise asset revaluation reserves (refer note 16.1).
(2) The share option reserve was transferred to retained earnings upon the last of the outstanding options vesting during the year ended 30 June 2015.
The accompanying notes are an integral part of these financial statements.
11DRDGOLD LIMITED ANNUAL FINANCIAL STATEMENTS 201610

COMPANY STATEMENT OF CHANGES IN EQUITY FOR THE YEAR ENDED 30 JUNE 2016
Ordinary
shares
Cumulative preference
shares Share capital
Cumulative preference
share capital
Revaluation and other
reserves (1)
Retained earnings
Total equity
Note Number Number R’000 R’000 R’000 R’000 R’000
Balance at 30 June 2014 385 383 767 5 000 000 4 132 627 500 14 350 (3 016 629) 1 130 848
Total comprehensive income
Profit for the year 47 590 47 590
Other comprehensive income (757) – (757)
Fair value adjustment on available-for-
sale investments 11 19 118 19 118
Fair value adjustment on available-for-
sale investments reclassified to profit
or loss 11 (19 875) (19 875)
Transactions with the owners of the
parent
Share issue 45 500 000 96 460 96 460
Transaction costs – (4 015) (4 015)
Dividend on ordinary share capital 16.1 (7 708) (7 708)
Share-based payments 176 176
Share option reserve transferred to retained
earnings (2) (13 012) 13 012 –
Balance at 30 June 2015 430 883 767 5 000 000 4 225 072 500 757 (2 963 735) 1 262 594
Total comprehensive income
Profit for the year 23 708 23 708
Other comprehensive income 4 342 4 342
Fair value adjustment on available-for-
sale investments 11 4 342 4 342
Transactions with the owners of the
parent
Issued shares for cash 18 546 000 2 796 2 796
Dividend on ordinary share capital 16.1 (258 530) (258 530)
Balance at 30 June 2016 431 429 767 5 000 000 4 227 868 500 5 099 (3 198 557) 1 034 910
(1) Revaluation and other reserves at 30 June 2016 comprise asset revaluation reserves (refer note 16.1).
(2) The share option reserve was transferred to retained earnings upon the last of the outstanding options vesting during the year ended 30 June 2015.
The accompanying notes are an integral part of these financial statements.
1312DRDGOLD LIMITED ANNUAL FINANCIAL STATEMENTS 2016

ANNUAL FINANCIAL STATEMENTS
STATEMENTS OF CASH FLOWS FOR THE YEAR ENDED 30 JUNE 2016
GROUP COMPANY
2015 2016 2016 2015
R'000 R'000 Note R'000 R'000
CASH FLOWS FROM OPERATING ACTIVITIES 2 087 926 2 476 066 Cash received from sales of precious metals/corporate services fees 20 088 10 560
(1 802 729) (2 077 851) Cash paid to suppliers and employees (55 163) (50 906)
285 197 398 215 Cash generated by/(applied to) operations 22 (35 075) (40 346)
13 883 22 331 Finance income 19 387 12 779
(11 944) (4 965) Finance expenses (596) (10 568)
(3 523) 362 Income tax received/(paid) 1 522 (7 348)
283 613 415 943 Net cash inflow/(outflow) from operating activities (14 762) (45 483)
CASH FLOWS FROM INVESTING ACTIVITIES 46 387 12 Proceeds on disposal of non-current investments and other assets 12 46 387
17 392 7 021 Proceeds on disposal of property, plant and equipment 2 –
(90 856) (99 780) Additions to property, plant and equipment (92) (102)
(9 034) (10 591) Environmental rehabilitation payments 17 – –
(803) – Contribution to environmental obligation funds – –
(851) – Acquisition of non-controlling interest – (851)
– – Repayments of amounts owing by subsidiaries 347 156 167 069
96 (3 854) Other (3 854) 96
(37 669) (107 192) Net cash (outflow)/inflow from investing activities 343 224 212 599
CASH FLOWS FROM FINANCING ACTIVITIES– 2 796 Proceeds from the issue of shares 2 796 –
– (6 521) Acquisition of treasury shares – –
(416) (2 000) Repayment of finance lease obligation – –
(122 500) (22 500) Repayments of loans and borrowings (22 500) (122 500)
(7 585) (252 915) Dividends paid on ordinary share capital (258 530) (7 708)
(130 501) (281 140) Net cash outflow from financing activities (278 234) (130 208)
115 443 27 611 Net increase in cash and cash equivalents 50 228 36 908
208 932 324 375 Cash and cash equivalents at the beginning of the year 228 567 191 659
– (190) Foreign exchange movements (190) –
324 375 351 796 CASH AND CASH EQUIVALENTS AT THE END OF THE YEAR 23 278 605 228 567
The accompanying notes are an integral part of these financial statements.
13DRDGOLD LIMITED ANNUAL FINANCIAL STATEMENTS 201612
NOTES TO THE FINANCIAL STATEMENTS FOR THE YEAR ENDED 30 JUNE 2016
1 ACCOUNTING POLICIES
Reporting entityDRDGOLD Limited is domiciled in South Africa with a registration number of 1895/000926/06. The address of the company is Off Crownwood Road,
Crown Mines, Johannesburg 2092. The group is primarily involved in the retreatment of surface gold.
The group financial statements comprise the company and its subsidiaries (collectively the “group” and individually “group companies”).
Basis of accountingThe group and company financial statements have been prepared in accordance with International Financial Reporting Standards (IFRS) and its
interpretations adopted by the International Accounting Standards Board (IASB), SAICA Financial Reporting Guides as issued by the Accounting Practices
Committee and Financial Reporting Pronouncements as issued by the Financial Reporting Standards Council (FRSC) as well as the requirements of the
Companies Act of South Africa.
The group and company financial statements were approved by the board of directors on 21 September 2016. Details of the group’s accounting policies
are outlined in this note.
Functional and presentation currencyThe group and company financial statements are presented in South African rands, which is the group’s functional currency. All financial information
presented in South African rands has been rounded to the nearest thousand, unless otherwise stated.
Use of estimates and judgementsThe preparation of the group and company financial statements in conformity with IFRS requires management to make judgements, estimates and
assumptions that affect the application of accounting policies and reported amounts of assets and liabilities, income and expenses.
The estimates and associated assumptions are based on historical experience and various other factors that are believed to be reasonable under the
circumstances, the results of which form the basis of making the judgements about carrying values of assets and liabilities that are not readily apparent
from other sources. Actual results may differ from these estimates.
The estimates and underlying assumptions are reviewed on an ongoing basis. Revisions to accounting estimates are recognised in the period in which
the estimate is revised if the revision affects only that period, or in the period of the revision and future periods if the revision affects both current and
future periods.
Information about critical judgements in applying accounting policies that have the most significant effect on the amounts recognised in the group and
company financial statements is outlined below:
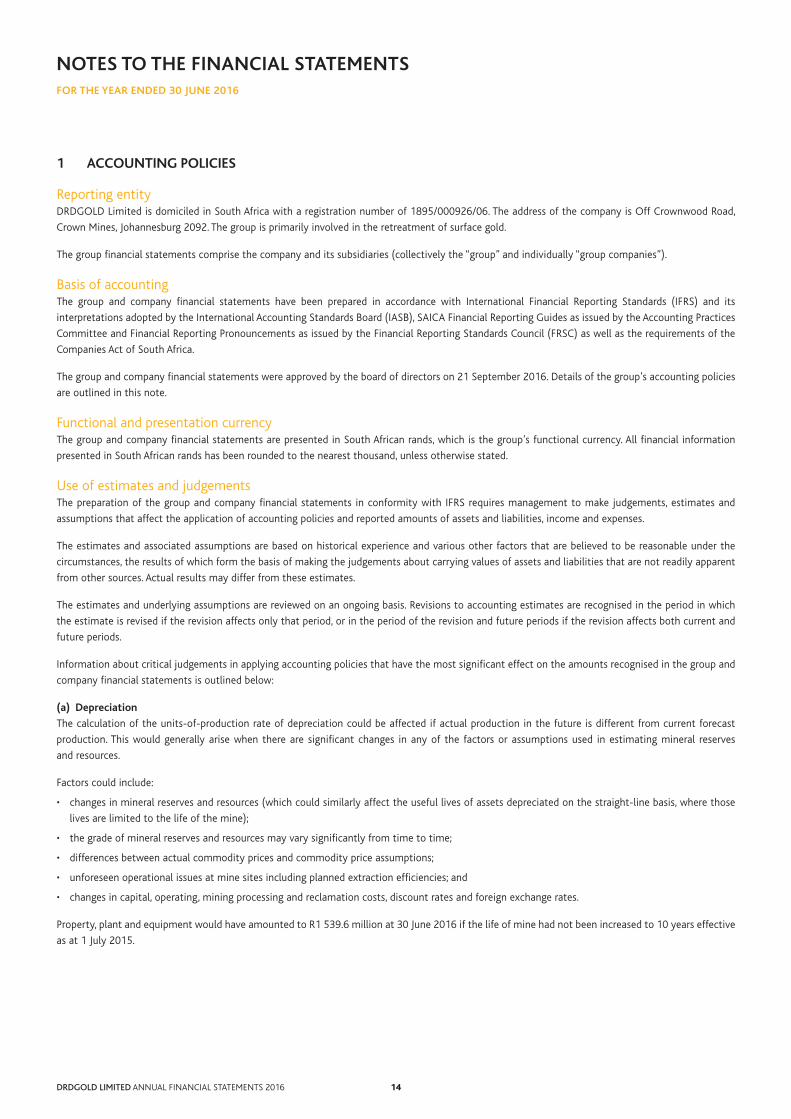
(a) Depreciation
The calculation of the units-of-production rate of depreciation could be affected if actual production in the future is different from current forecast
production. This would generally arise when there are significant changes in any of the factors or assumptions used in estimating mineral reserves
and resources.
Factors could include:
• changes in mineral reserves and resources (which could similarly affect the useful lives of assets depreciated on the straight-line basis, where those
lives are limited to the life of the mine);
• the grade of mineral reserves and resources may vary significantly from time to time;
• differences between actual commodity prices and commodity price assumptions;
• unforeseen operational issues at mine sites including planned extraction efficiencies; and
• changes in capital, operating, mining processing and reclamation costs, discount rates and foreign exchange rates.
Property, plant and equipment would have amounted to R1 539.6 million at 30 June 2016 if the life of mine had not been increased to 10 years effective
as at 1 July 2015.
1514DRDGOLD LIMITED ANNUAL FINANCIAL STATEMENTS 2016

ANNUAL FINANCIAL STATEMENTS
(b) Estimate of exposure and liabilities with regard to rehabilitation costs
Estimated provisions for environmental rehabilitation, comprising pollution control, rehabilitation and mine closure, are based on the group’s
environmental management plans in compliance with current technological, environmental and regulatory requirements.
An average discount rate of 8.8% (2015: 8.4%), average inflation rate of 6.3% (2015: 6.0%) and the discount periods as per the expected life-of-mine
were used in the calculation of the estimated net present value of the rehabilitation liability (refer to note 17).
(c) Estimate of tax
The effective gold mining tax rate applied to calculate the deferred tax liability is based on expected future profitability. A 100 basis points increase in
the effective tax rate will result in an increase in the deferred tax liability at 30 June 2016 of approximately R8.1 million (2015: R7.3 million).
Basis of measurementThe financial statements are prepared on the historical cost basis, unless otherwise stated.
Changes in accounting policiesThe group has consistently applied the accounting policies set out below to all periods presented in these group and company financial statements.
New standards, amendments to standards and interpretations adoptedThe group adopted all the new standards, amendments to standards and interpretations, which are applicable to the group, with a date of initial
application of 1 July 2015. The adoption of these standards did not have a significant impact on these financial statements.
Basis of consolidationNon-controlling interests (NCI)
NCI are measured at their proportionate share of the acquirer’s identifiable net assets at the acquisition date. Subsequently, the carrying amount of
non-controlling interest is the amount of the interest at initial recognition plus the non-controlling interest’s subsequent share of changes in equity.
Changes in the group’s interest in a subsidiary which do not lead to loss of control are accounted for as equity transactions with equity owners in their
capacity as equity owners and no profit or loss is recognised.
Subsidiaries
Subsidiaries are entities controlled by the group. The group controls an entity when it is exposed to, or has rights to, variable returns from its involvement
with the entity and has the ability to affect those returns through its power over the entity. The financial statements of subsidiaries are included in the
group financial statements from the date that control commences until the date that control ceases.
Investments in subsidiaries are carried at cost less any accumulated impairment in the company financial statements of the company.
Transactions eliminated on consolidation
Intra-group balances, transactions and any unrealised gains and losses or income and expenses arising from intra-group transactions, are eliminated in
preparing the group financial statements.
Foreign currencyForeign currency transactions
Transactions in foreign currencies undertaken by group entities are translated to the functional currency at the exchange rates ruling at the dates of
these transactions. Monetary assets and liabilities denominated in foreign currencies are translated to the functional currency at the exchange rate at
the reporting date. Non-monetary assets and liabilities that are measured at historical cost are translated using the exchange rate at the date of the
transaction. Non-monetary assets and liabilities denominated in foreign currencies, measured at fair value, are translated at foreign exchange rates ruling
at the date that the fair value was determined. Foreign exchange differences arising on translation are recognised in profit or loss.
Foreign currency differences arising from the translation of available-for-sale equity investments (except on impairment in which case the foreign
currency differences that have been recognised in other comprehensive income (“OCI”) are reclassified to profit or loss) are recognised in OCI.
15DRDGOLD LIMITED ANNUAL FINANCIAL STATEMENTS 201614

NOTES TO THE FINANCIAL STATEMENTS continued FOR THE YEAR ENDED 30 JUNE 2016
1 ACCOUNTING POLICIES continued
Financial instrumentsThe entity classifies non-derivative financial assets into the following categories: financial assets at fair value through profit or loss, held-to-maturity
financial assets, loans and receivables and available-for-sale financial assets.
The entity classifies non-derivative financial liabilities into the financial liabilities measured at amortised cost category.
(i) Non derivative financial assets and financial liabilities – recognition and derecognition
The entity initially recognises loans and receivables on the date when they are originated. All other financial assets and financial liabilities are initially
recognised on the trade date.
Financial assets are derecognised when the contractual rights to the cash flows from the financial asset expire or to the extent that the group or company
transfers substantially all the risks and rewards of ownership of the financial asset. Any interest in such derecognised financial assets that is created or
retained by the entity is recognised as a separate asset or liability.
Financial liabilities are derecognised when the obligation specified in the contract is discharged or cancelled or has expired. Any gain or loss on
derecognition is taken to profit or loss.
Financial assets and financial liabilities are offset and the net amount presented in the statement of financial position when, and only when, the entity
has a legal right to offset the amounts and intends either to settle them on a net basis or to realise the asset and settle the liability simultaneously.
(ii) Non-derivative financial assets – measurement
Loans and receivables
These assets are initially recognised at fair value plus any directly attributable transaction costs. Subsequent to initial recognition, they are measured at
amortised cost using the effective interest method less any impairment losses.
Cash and cash equivalents
Cash and cash equivalents comprise cash on hand, demand deposits, and highly liquid investments which are readily convertible to known amounts of
cash and subject to insignificant risk of changes in value. Cash and cash equivalents are initially measured at fair value. Subsequent to initial recognition,
cash and cash equivalents are measured at amortised cost, which is equivalent to their fair value. Bank overdrafts that are repayable on demand and
form an integral part of the group’s cash management are included as a component of cash and cash equivalents for the purpose of the statement of
cash flows. Cash and cash equivalents include restricted cash and are short-term in nature. Restricted cash which is long-term in nature is classified as
non-current and is similar in nature to rehabilitation trust funds. Restricted cash would typically be long-term in nature when it is expected not to be
able to be utilised for at least 12 months after the reporting date.
Available-for-sale financial assets
The group’s investments in equity securities are classified as available-for-sale financial assets.
These assets are initially recognised at fair value plus any directly attributable transaction costs. Subsequent to initial recognition they are measured
at fair value and changes therein, other than impairment losses are recognised in OCI and accumulated in the fair value reserve. When these assets are
derecognised, the gain or loss accumulated in equity is reclassified to profit or loss. The group applies settlement date accounting to the regular way
purchase or sale of financial assets.
(iii) Non-derivative financial liabilities – measurement
Non-derivative financial liabilities are initially recognised at fair value less any directly attributable transaction costs. Subsequent to initial recognition,
these liabilities are measured at amortised cost using the effective interest method.
Property, plant and equipmentRecognition and measurement
The group’s property, plant and equipment consist mainly of mining assets which comprise mining property and development (including mineral rights),
mine plant facilities, exploration assets and equipment and vehicles.
Items of property, plant and equipment are measured at cost, less accumulated depreciation and accumulated impairment losses.
Development costs, which are capitalised, consist primarily of expenditure that gives access to mineral reserves and resources. Where funds have been
1716DRDGOLD LIMITED ANNUAL FINANCIAL STATEMENTS 2016

ANNUAL FINANCIAL STATEMENTS
borrowed specifically to finance a project, the amount of interest capitalised represents the actual borrowing costs incurred. Mine development costs
capitalised, include acquired, proved and probable mineral reserves at the acquisition date.
Exploration and evaluation costs, including the costs of acquiring licenses, property and qualifying borrowing costs, are capitalised as exploration
assets on a project-by-project basis, pending determination of the technical feasibility and commercial viability of the project. The capitalised costs are
presented as tangible assets according to the nature of the assets acquired. When a license is relinquished or a project is abandoned, the related costs
are recognised in profit or loss immediately.
Cost includes expenditure that is directly attributable to the acquisition of the asset. The cost of self-constructed assets includes the cost of materials
and direct labour, any other costs directly attributable to bringing an asset to a working condition for its intended use, as well as the costs of dismantling
and removing an asset and restoring the site on which it is located.
Where parts of an item of property, plant and equipment, with costs that are significant in relation to the total cost of the item, have different useful
lives, they are accounted for as separate items of property, plant and equipment.
Any gains or losses on disposal of an item of property, plant and equipment are determined by comparing the net proceeds from disposal with the
carrying amount of property, plant and equipment and are recognised in profit or loss. When assets are sold which have been revalued on acquisition for
consolidation purposes, the amounts included in the asset revaluation reserve are transferred to retained earnings (refer to note 16.1).
Subsequent expenditure
The group recognises in the carrying amount of an item of property, plant and equipment, the cost of replacing part of an item when that cost is incurred,
if it is probable that the future economic benefits embodied within the part will flow to the group and the cost of the item can be measured reliably.
The carrying amount of the replaced part is derecognised. All other costs are recognised in profit or loss as an expense incurred.
Depreciation
Depreciation of mining property and development (including mineral rights) and mine plant facilities is calculated using the units of production method
which is based on the life of mine.
The group’s life of mine is primarily based on proved and probable mineral reserves and may include some resources. It reflects the estimated quantities
of economically recoverable gold that can be recovered from reclamation sites based on the gold price prevailing at the end of the financial year. Changes
in the life of mine will impact depreciation on a prospective basis. The life of mine is prepared using a methodology that takes account of current
information to assess the economically recoverable gold from specific reclamation sites and includes the consideration of historical experience.
Other assets are depreciated using the straight-line basis over the estimated useful lives of each part of an item of property, plant and equipment.
Leased assets are depreciated over the shorter of the lease term and their estimated useful lives, unless it is reasonably certain that the group will obtain
ownership by the end of the lease term. Land is not depreciated.
The current estimated useful lives for the current and comparative periods are:
• mine properties – life-of-mine, currently between seven (2015: six) and 10 (2015: 10) years;
• mine development – life-of-mine, currently between seven (2015: six) and 10 (2015: 10) years;
• mine plant facilities – life-of-mine, currently between seven (2015: six) and 10 (2015: 10) years; and
• equipment and vehicles – two to five years.
The residual values, estimated useful lives and depreciation method are reassessed annually and adjusted if appropriate.
Leased assets
Leases in terms of which the group assumes substantially all the risks and rewards of ownership are classified as finance leases. Upon initial recognition,
the leased asset and liability are measured at amounts equal to the lower of the fair value of the leased asset and the present value of the minimum lease
payments. Subsequent to initial recognition, the asset is accounted for in the same manner as owned property, plant and equipment.
17DRDGOLD LIMITED ANNUAL FINANCIAL STATEMENTS 201616

NOTES TO THE FINANCIAL STATEMENTS continued FOR THE YEAR ENDED 30 JUNE 2016
1 ACCOUNTING POLICIES continued
ImpairmentFinancial assets
A financial asset not classified at fair value through profit or loss is assessed at each reporting date to determine whether there is any objective evidence
(e.g. delinquency of a debtor and indications that a debtor will enter bankruptcy) that it is impaired. A financial asset is considered to be impaired if
objective evidence indicates that one or more events have had a negative effect on the estimated future cash flows of that asset.
Financial assets measured at amortised cost
An impairment loss in respect of a financial asset measured at amortised cost is calculated as the difference between its carrying amount and the
present value of the estimated future cash flows discounted at the original effective interest rate, that is, the effective interest rate computed at initial
recognition of these financial assets.
Available-for-sale financial assets
An impairment loss in respect of an available-for-sale financial asset is calculated by reference to its fair value. When a decline in the fair value of an
available-for-sale financial asset has been recognised directly in OCI, and there is objective evidence (e.g. significant or prolonged decline in the fair value
below the cost of the investment) that the asset is impaired, the cumulative loss that had been recognised in OCI is recognised in profit or loss even
though the financial asset has not been derecognised. The amount of the cumulative loss that is recognised in profit or loss is the difference between
the acquisition cost and current fair value, less any impairment loss on that financial asset previously recognised in profit or loss. Financial assets that
are individually significant are tested for impairment on an individual basis. The remaining financial assets are assessed collectively in groups that share
similar credit risk characteristics. All impairment losses are recognised in profit or loss.
An impairment loss is reversed if the reversal can be related objectively to an event occurring after the impairment loss was recognised. For financial
assets measured at amortised cost, the reversal is recognised in profit or loss. For available-for-sale financial assets that are equity securities, the reversal
is recognised in OCI.
Non-financial assets
The carrying amounts of the group’s assets, other than inventories and deferred tax assets are reviewed at each reporting date to determine whether
there is any indication of impairment. If any such indication exists, the asset’s recoverable amount is estimated.
The recoverable amount of an asset or cash-generating unit is the greater of its value in use and its fair value less costs to sell. In assessing value in use,
the estimated future cash flows are discounted to their present value using a pre-tax discount rate that reflects current market assessments of the time
value of money and the risks specific to the asset. For purposes of impairment testing, assets are grouped together into the smallest group of assets
which generates cash flows from continuing use that is largely independent of the cash inflows of other assets or groups of assets (cash-generating units).
An impairment loss is recognised directly against the carrying amount of the asset whenever the carrying amount of an asset, or its cash generating unit,
exceeds its recoverable amount. Impairment losses are recognised in profit or loss.
Impairment losses recognised in respect of cash-generating units are allocated to the carrying amounts of the assets in the unit (group of units) on a
pro rata basis. Impairment losses recognised in prior periods are assessed at each reporting date for any indications that the loss has decreased or no
longer exists. An impairment loss is reversed if there has been a change in the estimates used to determine the recoverable amount. An impairment loss is
reversed only to the extent that the asset’s carrying amount does not exceed the carrying amount that would have been determined, net of depreciation,
if no impairment loss had been recognised.
Exploration assets
Exploration assets are assessed for impairment if facts and circumstances suggest that the carrying amount exceeds the recoverable amount. For
purposes of impairment testing, exploration assets are allocated to cash-generating units consistent with the determination of reportable segments.
The technical feasibility and commercial viability of extracting a mineral resource is considered to be determinable when proven and probable reserves
are determined to exist. Upon determination of proven and probable reserves, exploration assets attributable to those reserves are first tested for
impairment and then reclassified from exploration assets to a separate category within tangible assets.
1918DRDGOLD LIMITED ANNUAL FINANCIAL STATEMENTS 2016

ANNUAL FINANCIAL STATEMENTS
InventoriesGold in process is stated at the lower of cost and net realisable value. Costs are assigned to gold in process on a weighted average cost basis. Costs
comprise all costs incurred to the stage immediately prior to smelting, including costs of extraction and processing as they are reliably measurable at
that point.
Gold bullion is stated at the lower of cost and net realisable value. Selling and general administration costs are excluded from inventory valuation.
Consumable stores are stated at the lower of cost and net realisable value. Cost of consumables is based on the weighted average cost principle and
includes expenditure incurred in acquiring inventories and bringing them to their existing location and condition.
Net realisable value is the estimated selling price in the ordinary course of business, less the estimated cost of completion and selling expenses.
Income taxIncome tax expense comprises current and deferred tax. Income tax is recognised in profit or loss except to the extent that it relates to business
combinations, or to items recognised directly in equity or OCI.
Current tax
Current tax is the expected tax payable on the taxable income for the year, using tax rates enacted, or substantively enacted, at the reporting date, and
any adjustment to tax payable in respect of previous years.
Deferred tax
Deferred tax is recognised in respect of temporary differences between the carrying amounts of assets and liabilities for financial reporting purposes
and the amounts recognised for tax purposes. Deferred tax is not recognised for the following temporary differences: the initial recognition of assets
or liabilities in a transaction that is not a business combination and that affects neither accounting nor taxable profit; and differences relating to
investments in subsidiaries to the extent that it is probable that they will not reverse in the foreseeable future. In addition, deferred tax is not recognised
for taxable temporary differences arising on the initial recognition of goodwill. Deferred tax is measured at the tax rates that are expected to be applied
to the temporary differences, based on the expected manner of realisations or settlement of the carrying amounts of assets and liabilities, and based on
the laws that have been enacted or substantively enacted at the reporting date.
Deferred tax assets and liabilities are offset if there is a legally enforceable right to offset current tax liabilities and assets, if these relate to income taxes
levied by the same tax authority on the same taxable entity or on different tax entities, if the company intends to settle current tax liabilities and assets
on a net basis, or if their tax assets and liabilities will be realised simultaneously.
A deferred tax asset is recognised only to the extent that it is probable that future taxable profits will be available against which the temporary difference
can be utilised. Deferred tax assets are reviewed at each reporting date and are reduced to the extent that it is no longer probable that the related tax
benefit will be realised.
Dividend withholding tax
Dividend withholding tax is a tax on certain shareholders receiving dividends and is applicable to all dividends declared on or after 1 April 2012.
The company withholds dividends tax on behalf of certain of its shareholders at a rate of 15% on dividends declared. Amounts withheld are not
recognised as part of the company’s tax charge but rather as part of the dividend paid recognised directly in equity. Where withholding tax is withheld
on dividends received, the dividend is recognised at the gross amount with the related withholdings tax recognised as part of tax expense unless it is
otherwise reimbursable in which case, it is recognised as an asset.
Share capitalOrdinary share capital
Ordinary shares are classified as equity. Incremental costs directly attributable to the issue of ordinary shares are recognised as a deduction from equity,
net of any tax effect.
19DRDGOLD LIMITED ANNUAL FINANCIAL STATEMENTS 201618

NOTES TO THE FINANCIAL STATEMENTS continued FOR THE YEAR ENDED 30 JUNE 2016
1 ACCOUNTING POLICIES continued
Share capital continued
Preference share capital
Preference share capital is classified as equity if it is non-redeemable, or redeemable only at the company’s option, and any dividends are discretionary.
Dividends on preference share capital classified as equity are recognised as distributions within equity. Preference share capital is classified as a liability if
it is redeemable on a specified date or at the option of the shareholders, or if dividend payments are not discretionary. Dividends thereon are recognised
as interest expense in profit or loss as accrued.
Repurchase and reissue of ordinary shares (treasury shares)
When shares recognised as equity are repurchased, the amount of the consideration paid, which includes directly attributable costs is recognised as a
deduction from equity. Repurchased shares are classified as treasury shares and are presented in the treasury share reserve. When treasury shares are sold
or reissued subsequently, the amount received is recognised as an increase in equity and the resulting surplus or deficit on the transaction is presented
within share premium.
Dividends
Dividends are recognised as a liability on the date on which they are declared which is the date when the shareholders’ right to the dividends accrue.
Employee benefitsDefined contribution plans
A defined contribution plan is a post-employment benefit plan under which an entity pays fixed contributions into a separate entity and has no legal or
constructive obligation to pay further amounts. Pension plans, which are multi-employer plans in the nature of defined contribution plans, are funded
through monthly contributions to these defined contribution plans. Obligations for contributions are recognised as an employee benefit expense in profit
or loss as the service is rendered.
Long-service benefits
The group makes long-service bonus payments (long-service awards) for certain eligible employees under the Chamber of Mines of South Africa long
Service Award Scheme. The amount of the award is based on both the employee’s skill level and years of service with gold mining companies that qualify
for the scheme. The obligation is accrued over the service life of the employees and is calculated using a projected unit credit method. Any actuarial gains
or losses are recognised in OCI in the period in which they arise.
Post-retirement medical benefits
Post-retirement medical benefits in respect of qualifying employees are recognised over the expected remaining service lives of relevant employees
and the remaining life expectancies of retirees. The group has an obligation to provide medical benefits to certain of its pensioners and dependents of
ex-employees. These liabilities are provided in full, calculated on an actuarial basis and discounted using the projected unit credit method. The discount
rate is the yield at the reporting date on corporate bonds that have maturity dates approximating the terms of the group’s obligations and that are
denominated in the same currency in which the benefits are expected to be paid. Periodic valuation of these obligations is carried out by independent
actuaries using appropriate mortality tables, long-term estimates of increases in medical costs and appropriate discount rates. The fair value of any plan
assets is deducted. Actuarial gains and losses are recognised immediately in OCI. When the calculation results in a benefit to the group, the recognised
asset is limited to the net total of any unrecognised past service costs and the present value of any future refunds from the plan or reductions in future
contributions to the plan.
When the benefits of a plan are changed, the portion of the changed benefit relating to past service by employees is recognised in profit or loss
immediately.
Termination benefits
Termination benefits are recognised as an expense when the group is demonstrably committed, without realistic possibility of withdrawal, to a formal
detailed plan to either terminate employment before the normal retirement date, or to provide termination benefits as a result of an offer made to
encourage voluntary redundancy.
Termination benefits for voluntary redundancies are recognised as an expense if the group has made an offer for voluntary redundancy, it is probable
that the offer will be accepted, and the number of acceptances can be estimated reliably. If benefits are payable more than 12 months after the reporting
period, they are discounted to their present value.
2120DRDGOLD LIMITED ANNUAL FINANCIAL STATEMENTS 2016

ANNUAL FINANCIAL STATEMENTS
Share-based payment transactionsEquity settled share based payment awards
The group granted share options to certain employees under an employee share plan to acquire shares of the company. The fair value of options granted
was recognised as an employee expense with a corresponding increase in equity. The fair value was measured at grant date and spread over the period
during which the employees become unconditionally entitled to the options.
The fair value of the options granted was measured using the Black Scholes option pricing model, taking into account the terms and conditions upon
which the options were granted. The amount recognised as an expense was adjusted to reflect the actual number of share options that vest, except where
forfeiture is only due to market conditions such as share prices not achieving the threshold for vesting.
Cash settled share based payment awards
The group operates a cash-settled long term incentive scheme in which certain employees of the group participate.
The fair value of the awards made in terms of this cash-settled long term scheme is based on the quoted DRDGOLD Limited share price, taking into
account the terms and conditions upon which the awards were granted. The fair value of the award is estimated using appropriate valuation models and
appropriate assumptions at the grant date.
The grant date fair value of the awards is recognised as an employee benefit expense over the vesting period based on the group’s estimate of the number
of instruments that will eventually vest, with a corresponding increase in the share-based payment obligation. At each reporting date the obligation is
remeasured to the fair value of the instrument, to reflect the potential outflow of cash resources to settle the liability, with a corresponding adjustment
to profit or loss. Vesting assumptions for non-market conditions are reviewed at each reporting date to ensure they reflect current expectations.
ProvisionsA provision is recognised in the statement of financial position when the group has present legal or constructive obligations resulting from past events
that can be estimated reliably and it is probable that an outflow of economic benefits will be required to settle the obligation. Provisions are determined
by discounting the expected future cash flows at a pre-tax rate that reflects current market assessments of the time value of money and, where
appropriate, the risks specific to the liability.
Provision for environmental rehabilitation
Provision for environmental rehabilitation includes decommissioning and restoration liabilities.
Decommissioning and restoration liabilities are measured at the present value of the expenditures expected to be incurred to settle the obligation, using
estimated cash flows based on current prices. The unwinding of the decommissioning and restoration obligation is included in profit or loss. Estimated
future costs of decommissioning and restoration liabilities are reviewed regularly and adjusted as appropriate for new circumstances or changes in law
or technology.
Decommissioning liabilities
The provision for decommissioning represents the cost that will arise from rectifying damage caused before production commenced. Accordingly, an asset
is recognised and included within mining properties. Changes in estimates are capitalised or reversed against the relevant asset. Expenditures actually
incurred to settle such liabilities are recognised as cash outflows from investing activities.
Gains or losses from the expected disposal of assets are not taken into account when determining the provision.
Restoration liabilities
The provision for restoration represents the cost of restoring site damage after the start of production. Increases in the provision are recognised in profit
or loss as a cost of production. Expenditures actually incurred to settle such liabilities are recognised as cash outflows from operating activities.
Rehabilitation obligation funds
Rehabilitation obligation funds are used to cover the estimated cost of rehabilitation at the end of the life of the relevant mine. These contributions are
recognised as a right to receive a reimbursement from the fund and measured at the lower of the amount of the environmental rehabilitation liability
recognised and the fair value of the fund assets. Changes in the carrying value of the fund assets, other than contributions to and payments from the
fund, are recognised in profit or loss.
21DRDGOLD LIMITED ANNUAL FINANCIAL STATEMENTS 201620

NOTES TO THE FINANCIAL STATEMENTS continued FOR THE YEAR ENDED 30 JUNE 2016
1 ACCOUNTING POLICIES continued
Revenue recognitionGold bullion and by-products
The group recognises revenue from the sale of gold bullion and by-products at the fair value of the consideration received or receivable. Revenue is
recognised in profit or loss when the significant risks and rewards of ownership have been transferred to the buyer, recovery of the consideration is
probable, the associated costs can be estimated reliably, there is no continuing management involvement with the goods, and the amount of revenue
can be measured reliably. These criteria are usually met when Rand Refinery sells the refined gold.
Company revenue
The company recognises revenue from rendering corporate services to subsidiary companies when the services have been rendered and to the stage of
completion thereof and is measured at fair value. Revenue from the receipt of dividends is recognised when the company’s right to receive payment has
been established.
Government grantsGovernment grants are not recognised until there is reasonable assurance that the entity will comply with the conditions attaching to them and the
grant will be received. Grants that compensate the group for expenses incurred are recognised in profit or loss as a deduction against the related expense.
Finance incomeFinance income includes dividends received (except in the company’s separate financial statements where this is recognised as revenue), interest
received, growth in the environmental rehabilitation obligation funds, net gains on financial instruments measured at amortised cost, net foreign
exchange gains, and other profits and losses arising on disposal of investments.
Dividends are recognised when the group’s right to receive payment is established. Interest is recognised on a time proportion basis, taking account of
the principal outstanding and the effective rate to maturity on the accrual basis.
Operating lease paymentsPayments made under operating leases are recognised in profit or loss on a straight-line basis over the period of the lease.
Finance lease paymentsMinimum lease payments are apportioned between the finance charge and the reduction of the outstanding liability. The finance charge is allocated to
each period during the lease term so as to produce a constant periodic rate of interest on the remaining balance of the liability.
Finance expensesFinance expenses comprise interest payable on borrowings calculated using the effective interest method, unwinding of the provision for environmental
rehabilitation, net foreign exchange losses, net losses on financial instruments measured at amortised cost, and interest on finance leases.
Segment reportingOperating segments are identified on the basis of internal reports that the group’s chief operating decision maker (CODM) reviews regularly in allocating
resources to segments and in assessing their performance. The CODM for the group has been identified as the group’s Executive Committee. Reportable
segments are identified based on quantitative thresholds of revenue, profit or loss, and assets. The amounts disclosed for each reportable segment are the
measures reported to the CODM, which are not necessarily based on the same accounting policies as the amounts recognised in the financial statements.
Aggregation of operating segments is implemented where disclosure of information enables users of the group’s financial statements to evaluate the
nature and effects of the business activities in which it engages and the economic environment in which it operates, where the operating segments have
characteristics so similar that they can be expected to have essentially the same future prospects and where they are similar in the following respects:
• the nature of products;
• the nature of the production process;
• the type or class of customer for the products;
• the methods used to distribute the products; and
• if applicable, the nature of the regulatory environment.
2322DRDGOLD LIMITED ANNUAL FINANCIAL STATEMENTS 2016

ANNUAL FINANCIAL STATEMENTS
Assets held for saleNon-current assets, or disposal groups comprising asset and liabilities, are classified as held for sale if it is highly probable that they will be recovered
primarily through sale rather than continuing use.
Such assets, or disposal groups are generally measured at the lower of their carrying amount and fair value less cost to sell. Any impairment loss on
the disposal group is allocated first to goodwill, and then to the remaining assets and liabilities on a pro rata basis, except that no loss is allocated to
inventories, financial assets, deferred tax assets, employee benefit assets and investment property, which continue to be measured in accordance with
the group’s other accounting policies. Impairment losses on initial application as held for sale and subsequent gains and losses on premeasurement are
recognised in profit or loss.
Once classified as held for sale, intangible assets and property, plant and equipment, are no longer amortised or depreciated.
Earnings or loss per shareThe group presents basic and diluted earnings per share data for its ordinary shares. Basic earnings or loss per share is calculated based on the net profit
or loss after tax for the year attributable to ordinary shareholders of the company, divided by the weighted average number of ordinary shares in issue
during the year. Diluted earnings or loss per share is presented when the inclusion of ordinary shares that may be issued in the future, which comprise
share options granted to employees, has a dilutive effect on earnings or loss per share.
New standards, amendments to standards and interpretations not yet adoptedAt the date of authorisation of these financial statements, the following relevant standards, amendments to standards and interpretations that may
be applicable to the business of the entity were in issue but not yet effective and may therefore have an impact on future financial statements. These
new standards, amendments to standards and interpretations have not been early adopted by the group and an estimate of the impact of the adoption
thereof for the group is in the process of being finalised. These Standards and Interpretations will be adopted at their effective date.
Standard/interpretation Effective date
IAS 1 Disclosure Initiative 1 January 2016
IAS 12 Income tax amendments 1 January 2017
IFRS 2 Share-based payment amendments 1 January 2018
IFRS 15 Revenue from contracts with customers 1 January 2018
IFRS 9 Financial Instruments 1 January 2018
IFRS 16 Leases 1 January 2019
Management is of the opinion that the impact of the application of the Standards and Interpretations will be as follows:
IAS 1 Disclosure Initiative
Key clarifications included in this amendment includes the following:
• There is an emphasis on materiality. Specific single disclosures that are not material do not have to be presented – even if they are a minimum
requirement of a standard.
• The order of notes to the financial statements is not prescribed. Instead, companies can choose their own order, and can also combine, for example,
accounting policies with notes on related subjects.
• It has been made explicit that companies:
– should disaggregate line items on the statement of financial position and in the statement of profit or loss and OCI if this provides helpful
information to users; and
– can aggregate line items on the statement of financial position if the line items specified by IAS 1 are immaterial.
• Specific criteria are provided for presenting sub-totals on the statement of financial position and in the statement of profit or loss and OCI, with
additional reconciliation requirements for the statement of profit or loss and OCI.
IAS 12 Income taxes amendments (Recognition of deferred tax assets for unrealised losses)
The amendments provide additional guidance on the existence of deductible temporary differences, which depend solely on a comparison of the carrying
amount of an asset and its tax base at the end of the reporting period, and is not affected by possible future changes in the carrying amount or expected
manner of recovery of the asset.
23DRDGOLD LIMITED ANNUAL FINANCIAL STATEMENTS 201622

NOTES TO THE FINANCIAL STATEMENTS continued FOR THE YEAR ENDED 30 JUNE 2016
1 ACCOUNTING POLICIES continued
New standards, amendments to standards and interpretations not yet adopted continued
IAS 12 Income taxes amendments (Recognition of deferred tax assets for unrealised losses) continued
The amendments also provide additional guidance on the methods used to calculate future taxable profit to establish whether a deferred tax asset can
be recognised.
Guidance is provided where an entity may assume that it will recover an asset for more than its carrying amount, provided that there is sufficient
evidence that it is probable that the entity will achieve this.
Guidance is provided for the recognition of deductible temporary differences related to unrealised losses. These are to be assessed on a combined basis,
unless a tax law restricts the use of losses to deductions against income of a specific type.
IFRS 2 Share-based payment amendments
Measurement of cash-settled share-based payments – There is currently no guidance in IFRS 2 on how to measure the fair value of the liability in a
cash-settled share based payment. The amendments clarify that a cash-settled share-based payment is measured using the same approach as for equity-
settled share-based payments – i.e. the modified grant date method. Therefore, in measuring the liability market and non-vesting conditions are taken
into account in measuring its fair value and the number of awards to receive cash is adjusted to reflect the best estimate of those expected to vest as a
result of satisfying service and any non-market performance conditions.
Classification of share-based payments settled net of tax withholdings – The company may be obligated to collect or withhold tax related to a share-
based payment, even though the tax obligation is often a liability of the employee and not the company. Currently, it is unclear whether the portion
of the share-based payment that is withheld in these instances should be accounted for as equity-settled or cash-settled. The amendments introduce
an exception stating that, for classification purposes, a share-based payment transaction with employees is accounted for as equity-settled if certain
criteria are met.
IFRS 15 Revenue from contracts with customers
The standard contains a single model that applies to contracts with customers and two approaches to recognising revenue: at a point in time or over time.
The model features a contract-based five-step analysis of transactions to determine whether, how much and when revenue is recognised.
IFRS 9 Financial Instruments
This standard will include changes in the measurement bases of the group’s financial assets to amortised cost, fair value through other comprehensive
income or fair value through profit or loss. Even though these measurement categories are similar to IAS 39, the criteria for classification into these
categories are different. In addition, the IFRS 9 impairment model has been changed from an “incurred loss” model from IAS 39 to an “expected credit
loss” model.
IFRS 16 Leases
It sets out the principles for the recognition, measurement, presentation and disclosure of leases for both parties to a contract, ie the customer (‘lessee’)
and the supplier (‘lessor’). IFRS 16 replaces the previous leases Standard, IAS 17 Leases, and related Interpretations. IFRS 16 has one model for lessees
which will result in almost all leases being included on the Statement of Financial position. No significant changes have been included for lessors.
2 OPERATING SEGMENTSThe following summary describes the operations in the group’s reportable operating segment:
– Ergo is a surface retreatment operation and treats old slime and sand dumps to the south of Johannesburg’s central business district as well as the East
and Central Rand goldfields. The operation comprises four plants. Ergo and Knights continue to operate as metallurgical plants and Crown and City Deep
continue as pump/milling stations feeding the metallurgical plants.
Corporate office and other reconciling items are taken into consideration in the strategic decision-making process of the CODM and are therefore
included in the disclosure here, even though they do not earn revenue. They do not represent a separate segment.
The group’s revenue stream consists mainly of the sale of gold bullion.
2524DRDGOLD LIMITED ANNUAL FINANCIAL STATEMENTS 2016

ANNUAL FINANCIAL STATEMENTS
Ergo
Corporate office and other
reconciling items Total
2016 R’000 R’000 R’000
Financial performance
Revenue 2 433 064 – 2 433 064
Cash operating costs (1 991 180) – (1 991 180)
Movement in gold in process (7 075) – (7 075)
Operating profit 434 809 – 434 809
Interest income 2 772 19 648 22 420
Interest expense (4 122) (438) (4 560)
Administration expenses and general costs (4 450) (82 759) (87 209)
Income tax (1) (535) (5 134) (5 669)
Working profit/(loss) before capital expenditure 428 474 (68 683) 359 791
Additions to property, plant and equipment (99 922) (92) (100 014)
Additions to listed investments – (1 318) (1 318)
Working profit/(loss) after capital expenditure 328 552 (70 093) 258 459
(1) Income tax excludes deferred tax.
Reconciliation of profit/(loss) for the year
Working profit/(loss) before capital expenditure 428 474 (68 683) 359 791
– Depreciation (180 095) (72) (180 167)
– Movement in provision for environmental rehabilitation (21 371) 2 112 (19 259)
– Growth in environmental rehabilitation trust funds and reimbursive right 9 756 4 673 14 429
– Profit on disposal of property, plant and equipment 9 265 1 249 10 514
– Unwinding of provision for environmental rehabilitation (41 491) (1 525) (43 016)
– Ongoing rehabilitation expenditure (27 833) – (27 833)
– Other operating (costs)/income (29 608) 18 332 (11 276)
– Deferred tax (46 876) 5 622 (41 254)
Profit/(loss) for the year 100 221 (38 292) 61 929
Statement of cash flows
Cash flows from operating activities 414 825 1 118 415 943
Cash flows from investing activities (105 584) (1 608) (107 192)
Cash flows from financing activities (2 000) (279 140) (281 140)
Geographical information and information about major customers
Due to regulatory requirements, the group has only one major gold customer in South Africa, being the only geographical area in which it operates.
25DRDGOLD LIMITED ANNUAL FINANCIAL STATEMENTS 201624

NOTES TO THE FINANCIAL STATEMENTS continued FOR THE YEAR ENDED 30 JUNE 2016
Ergo
Corporate office and other
reconciling items Total
2015 R’000 R’000 R’000
Financial performance
Revenue 2 105 298 – 2 105 298
Cash operating costs (1 741 512) – (1 741 512)
Movement in gold in process 20 557 – 20 557
Operating profit 384 343 – 384 343
Interest income 808 13 599 14 407
Interest expense (3 095) (7 517) (10 612)
Retrenchment costs (2 794) (4 356) (7 150)
Administration expenses and general costs (3 466) (66 106) (69 572)
Income tax (1) (1 067) 4 412 3 345
Working profit/(loss) before capital expenditure 374 729 (59 968) 314 761
Additions to property, plant and equipment (113 233) (102) (113 335)
Additions to reimbursive right (803) – (803)
Working profit/(loss) after capital expenditure 260 693 (60 070) 200 623
(1) Income tax excludes deferred tax.
Reconciliation of profit/(loss) for the year
Working profit/(loss) before capital expenditure 374 729 (59 968) 314 761
– Depreciation (193 144) (157) (193 301)
– Movement in provision for environmental rehabilitation 15 840 4 603 20 443
– Impairments (3 075) (4 829) (7 904)
– Fair value adjustment on available-for-sale investment reclassified to profit or loss – 19 875 19 875
– Profit on disposal of equity accounted investment – 5 882 5 882
– Growth in environmental rehabilitation trust funds and reimbursive right 7 586 3 748 11 334
– Profit on disposal of property, plant and equipment 2 344 10 823 13 167
– Unwinding of provision for environmental rehabilitation (37 306) (1 685) (38 991)
– Ongoing rehabilitation expenditure (30 630) (1 098) (31 728)
– Net other operating costs (961) (12 437) (13 398)
– Deferred tax (31 717) (227) (31 944)
Profit/(loss) for the year 103 666 (35 470) 68 196
Statement of cash flows
Cash flows from operating activities 284 961 (1 348) 283 613
Cash flows from investing activities (98 030) 60 361 (37 669)
Cash flows from financing activities (416) (130 085) (130 501)
Geographical information and information about major customers
Due to regulatory requirements, the group has only one major gold customer in South Africa, being the only geographical area in which it operates.
2 OPERATING SEGMENTS continued
2726DRDGOLD LIMITED ANNUAL FINANCIAL STATEMENTS 2016

ANNUAL FINANCIAL STATEMENTS
GROUP COMPANY
2015 2016 2016 2015
R'000 R'000 R'000 R'000
3 REVENUERevenue consists of the following principal categories:
2 103 046 2 429 682 Gold revenue – –
2 252 3 382 By-product revenue – –
– – Corporate services fees 20 088 10 560
2 105 298 2 433 064 Total revenue 20 088 10 560
4 RESULTS FROM OPERATING ACTIVITIESInclude the following:
(7 580) (8 055) Auditors’ remuneration (6 093) (5 844)
(6 539) (7 230) Audit fees – current year (5 188) (4 878)
(966) (825) Under provision – prior year (905) (966)
(75) – Fees for other services – –
(7 061) (8 062) Management, technical, administrative and secretarial service fees (4 501) (3 465)
Staff costs
(366 761) (405 612) Included in staff costs are: (29 063) (20 273)
(337 235) (354 386) Salaries and wages (19 615) (17 052)
(1 753) (29 874) Share-based payments (a) (9 448) (247)
(7 150) – Retrenchment costs – (2 974)
(20 623) (21 352) Post-retirement and other employee benefits – –
13 166 10 514 Profit on disposal of property, plant and equipment 2 –
(2 768) (1 794) Operating leases (12) (1 179)
– 22 659 Reversal of accrual (b) – –
(7 904) – Impairments – (4 829)
(3 075) – Property, plant and equipment (c) – –
(3 614) – Non-current investments and other assets (d) – (3 614)
(1 215) – Cash and cash equivalents – (1 215)
21 428 23 760 Learnership grant – –
Grants received from the Mining Qualifications Authority (“MQA”)
offset against cost incurred by Ergo Business Development Academy NPC
(“EBDA”)
GROUP
(a) Share-based payments (refer note 18)
The Share-based payments expense relates mainly to the grant made during November 2015 under the amended cash-settled long term incentive
scheme (“LTI”) and has been driven by the increase in the DRDGOLD share price to R8.53 at reporting date.
(b) Reversal of accrual
In 2010 the Ekurhuleni Metropolitan Municipality (“Municipality”) brought an action against East Rand Proprietary Mines Limited (“ERPM”) claiming
an amount of R43 million in respect of outstanding rates and taxes which were allegedly owing. ERPM employed experts to investigate the allegations
and concluded that this claim was without merit and therefore that an outflow of resources was remote. ERPM deferred payment of rates and taxes for
which it recognised an accrual of R22.7 million.
The February and March 2016 statements issued by the Municipality reflected that all rates and taxes and interest thereon had been written off and the
balance owing by ERPM was reduced to zero. As a result the accrual was reversed.
27DRDGOLD LIMITED ANNUAL FINANCIAL STATEMENTS 201626

NOTES TO THE FINANCIAL STATEMENTS continued FOR THE YEAR ENDED 30 JUNE 2016
4 RESULTS FROM OPERATING ACTIVITIES continued
GROUP AND COMPANY
During the year ended 30 June 2015, the following impairments were recognised:
(c) Property, plant and equipment (refer note 10):
R3.1 million in the Ergo operating segment related to the Soweto cluster included under mine development costs which was assessed to be uneconomical
to mine.
(d) Non-current investments and other assets (refer note 11):
R3.6 million due to the fair value of listed shares having remained significantly lower than its original cost price for a pro-longed period. These include:
– Village Main Reef Limited (“VMR”): R2.3 million; and
– West Wits Mining Limited (“WWM”): R1.3 million.
5 DIRECTORS’ AND PRESCRIBED OFFICERS’ EMOLUMENTS
2016 2015
Remuneration paid during
the year
Pre-tax gain on share options
exercised
Incentives related to this cycle
Total remuneration
related to this cycle
Remuneration paid during
the year
Incentives related to this cycle
Total remuneration
related to this cycle
R’000 R’000 R’000 R’000 R’000 R’000 R’000
COMPANY
Executive directors
DJ Pretorius 5 478 – 4 988 10 466 5 544 3 588 9 132
FD van der Westhuizen – – – – 2 079 – 2 079
AT Meyer – – – – 893 – 893
AJ Davel 3 077 – 2 949 6 026 1 427 1 096 2 523
8 555 – 7 937 16 492 9 943 4 684 14 627
Non-executive directors
GC Campbell 1 499 – – 1 499 1 453 – 1 453
RP Hume – – – – 262 – 262
J Turk 672 – – 672 676 – 676
EA Jeneker 869 – – 869 763 – 763
JA Holtzhausen 703 – – 703 690 – 690
3 743 – – 3 743 3 844 – 3 844
GROUP
Prescribed officers
CM Symons (1) 3 059 (2) – 2 668 5 727 3 256 (2) 1 144 4 400
TJ Gwebu – – – – 3 446 – 3 446
WJ Schoeman 2 929 304 2 949 6 182 3 072 2 187 5 259
R Masemene 1 968 55 1 360 3 383 1 768 492 2 260
7 956 359 6 977 15 292 11 542 3 823 15 365
Total 20 254 359 14 914 35 527 25 329 8 507 33 836
(1) Fixed-term contract concluded on 31 July 2016.
(2) Includes pension scheme contributions of R 329 552 (2015: R309 139).
The remuneration of executive directors and prescribed officers comprises an all inclusive salary, short-term incentives and long-term incentive rewards.
Non-executive directors receive board fees which are approved at each annual general meeting of the company.
2928DRDGOLD LIMITED ANNUAL FINANCIAL STATEMENTS 2016

ANNUAL FINANCIAL STATEMENTS
DRDGOLD Phantom Share SchemeOpening balance Granted Vested
Exerciseprice Proceeds
Forfeited/ lapsed
Closing balance
2016 Number Number Number R R Number Number
COMPANY
Executive directors
DJ Pretorius – 2 323 009 – – – – 2 323 009
AJ Davel 205 207 1 305 033 (34 201) 1.90 64 845 – 1 476 039
205 207 3 628 042 (34 201) 64 845 – 3 799 048
GROUP
Prescribed officers
CM Symons 204 757 – (34 124) 1.90 64 703 – 170 633
WJ Schoeman 451 038 1 305 033 (222 630) 2.09 464 460 – 1 533 441
R Masemene 175 632 796 460 (66 174) 2.09 138 174 – 905 918
Subtotal 831 427 2 101 493 (322 928) 667 337 – 2 609 922
Total 1 036 634 5 729 535 (357 129) 732 182 – 6 409 040
2015
COMPANY
Executive directors
FD van der Westhuizen (1) 172 294 – – – – (172 294) –
AJ Davel – 205 207 – – – – 205 207
172 294 205 207 – – (172 294) 205 207
GROUP
Prescribed officers
CM Symons 106 425 204 757 (106 425) 1.51 160 420 – 204 757
TJ Gwebu (2) 251 749 – (85 395) 1.47 125 879 (50 600) 115 754
WJ Schoeman 372 457 205 207 (126 626) 1.48 187 066 – 451 038
R Masemene 108 564(3) 101 351 (34 283) 1.37 46 915 – 175 632
Subtotal 839 135 511 315 (352 729) 520 280 (50 600) 947 181
Total 1 011 489 716 522 (352 729) 520 280 (222 894) 1 152 388
(1) Granted prior to appointment as a director on 1 January 2014.
(2) Retrenched 31 August 2014. Continued in office as prescribed officer on a fixed term contract basis until 31 December 2014. Closing balance phantom shares as at 31 December 2014.
(3) Granted prior to appointment as a prescribed officer during August 2014.
29DRDGOLD LIMITED ANNUAL FINANCIAL STATEMENTS 201628

NOTES TO THE FINANCIAL STATEMENTS continued FOR THE YEAR ENDED 30 JUNE 2016
5 DIRECTORS’ AND PRESCRIBED OFFICERS’ EMOLUMENTS continued
DRDGOLD (1996) Share SchemeOpening balance
Average strike price
Exercised
Forfeited/ lapsed
Average strike price
Closing balance
Average strike price
2016 Number R Number Number R Number R
GROUP
Prescribed officers
W J Schoeman 99 175 5.12 (99 175) – 5.12 – –
R Masemene (1) 17 300 5.12 (17 300) – 5.12 – –
116 475 (116 475) – –
2015
COMPANY
Executive directors
F D van der Westhuizen (2) 18 550 5.12 – (18 550) 5.12 – –
18 550 – (18 550) –
GROUP
Prescribed officers
C M Symons (3) 85 050 5.12 – (85 050) 5.12 – –
T J Gwebu (4) 66 750 5.12 – – – 66 750 5.12
W J Schoeman 99 175 5.12 – – – 99 175 5.12
R Masemene (1) 17 300 5.12 – – – 17 300 5.12
268 275 – (85 050) 183 225
286 825 – (103 600) 183 225
(1) Granted prior to appointment as a prescribed officer during August 2014.
(2) Granted prior to appointment as a director on 1 January 2014.
(3) Retrenched during FY2014. Subsequently appointed on a fixed-term contract basis.
(4) Retrenched 31 August 2014. Continued in office as prescribed officer on a fixed term contract basis until 31 December 2014. Closing balance share options as at 31 December 2014.
3130DRDGOLD LIMITED ANNUAL FINANCIAL STATEMENTS 2016

ANNUAL FINANCIAL STATEMENTS
GROUP COMPANY
2015 2016 2016 2015
R'000 R'000 R'000 R'000
6 FINANCE INCOME 14 406 22 420 Interest on loans and receivables 19 453 13 297
– – Interest on loans and receivables from subsidiaries 61 932 61 973
5 562 6 456 Growth in environmental rehabilitation trust funds (refer note 11 and 15) – –
5 772 7 973 Growth in reimbursive right (refer note 11) – –
19 875 –
Fair value adjustment on available-for-sale investments reclassified to profit
or loss (refer note 11) – 19 875
5 882 – Profit on disposal of equity accounted investment (a) – –
51 497 36 849 81 385 95 145
(a) During the year ended 30 June 2015, DRDGOLD disposed of its Chizim Gold (Pvt) Limited shares and loan account for US$1. The foreign exchange
translation reserve amounting to R5.9 million was reclassified to profit or loss on the disposal.
7 FINANCE EXPENSES (10 612) (4 370) Interest accrued (168) (7 468)
(38 991) (43 016)
Unwinding of provision for environmental rehabilitation
(refer note 15 and 17) – –
– (190) Unrealised foreign exchange loss (190) –
(49 603) (47 576) (358) (7 468)
8 INCOME TAX (31 805) (46 876) Mining tax – –
3 206 (47) Non-mining tax 487 4 185
(28 599) (46 923) 487 4 185
Comprising:
(1 067) (534) Current tax – current year – –
4 412 (5 134) – prior year (5 134) 4 412
(28 857) (42 088) Deferred tax – current year 5 621 (227)
(3 087) 833 – prior year – –
(28 599) (46 923) 487 4 185
In South Africa, mining tax on mining income is determined based on a formula which takes into account the profit and revenue from a gold mining
company during the year. The formula for determining the South African gold mining tax rate for the years ended 30 June 2016 and 30 June 2015 is:
Y = 34 - 170/X where Y is the percentage rate of tax payable and X is the ratio of taxable income, net of any qualifying capital expenditure that bears
to mining income derived, expressed as a percentage. Non-mining income, which consists primarily of interest, is taxed at a standard rate of 28%
(2015: 28%).
For deferred tax purposes the group applies the expected average effective tax rate. The expected average effective tax rates for the respective companies
are based on the current estimate when temporary differences will reverse. Depending on the profitability of the companies, the tax rate can consequently
be significantly different from year to year.
Each company is taxed as a separate entity and no tax set-off is allowed between the companies.
All mining capital expenditure is deducted to the extent that it does not result in an assessed loss and depreciation is ignored when calculating the mining
income. Capital expenditure not deducted from mining income is carried forward as unredeemed capital expenditure to be deducted from future mining
income. The Ergo operation is treated as one tax paying operation pursuant to the relevant ring-fencing legislation.
31DRDGOLD LIMITED ANNUAL FINANCIAL STATEMENTS 201630

NOTES TO THE FINANCIAL STATEMENTS continued FOR THE YEAR ENDED 30 JUNE 2016
GROUP COMPANY
2015 2016 2016 2015
R'000 R'000 R'000 R'000
8 INCOME TAX continued
Tax reconciliation
Major items causing the group’s income tax expense to differ from the
statutory rate were:
(27 103) (30 478) Tax on net profit before tax at South African corporate tax rate of 28% (6 503) (12 153)
8 580 4 425 Rate adjustment to reflect the actual realised company tax rates – –
(10 028) (21 696) Deferred tax rate adjustment (a) – –
(3 726) (1 818) Non-deductable expenditure (b) (115) (1 646)
8 423 – Exempt income and other non-taxable income (c, e) 11 262 22 917
1 326 (4 301) (Under)/over provided in prior periods (5 134) 4 412
3 126 685 Tax incentives – –
1 789 (1 272) Other differences 39 (49)
– 7 543
Utilisation of tax losses for which deferred tax assets were previously
unrecognised (d) 938 –
(10 986) (11) Current year tax losses for which no deferred tax asset was recognised – (9 296)
(28 599) (46 923) Income tax 487 4 185
1 469 638 1 208 650
Estimated unredeemed capital expenditure at year-end (available for
deduction against future mining income) 131 504 131 504
1 452 383 1 452 383
Estimated gross capital losses at year-end (available to reduce future
capital gains) 1 452 383 1 452 383
165 357 146 911
Estimated assessed tax losses at year-end (available to reduce future
taxable income) 29 849 33 199
3 087 378 2 807 944 Estimated tax losses and unredeemed capital expenditure carried forward (1) 1 613 736 1 617 086
GROUP (a) Deferred tax rate adjustment The effective gold mining tax rate increased from 20.07% to 23.07% (2015: 18.46% to 20.07%) due to the impact of the higher forecasted gold price.
(b) Non-deductable expenditureThe group’s non-deductable expenditure for the year ended 30 June 2016 includes R4.6 million related to depreciation on non-redeemable assets (2015: R6.6 million related to depreciation on non-redeemable assets and R4.8 million relating to impairments of available-for-sale investments and other assets).
(c) Exempt income and other non-taxable income Included in the group’s exempt income for the year ended 30 June 2015 are:
– R19.8 million relating to the fair value adjustment on available-for-sale investments reclassified to profit or loss; and
– R5.9 million relating to the foreign exchange translation reserve reclassified to profit or loss.
(d) Tax losses and unredeemed CAPEX for which deferred tax assets were previously unrecognised Group entities that do not generate recurring taxable income, and therefore have unrecognised deferred tax assets, generated taxable income during the year ended 30 June 2016 resulting from the following non-recurring, taxable items:
– R22.6 million relating to a reversal of an accrual (refer note 4); and
– R9.8 million recoupment of capital allowances.
COMPANY (e) Exempt income and other non-taxable income The company’s exempt income for the year ended 30 June 2016 includes R40.2 million interest received from subsidiaries that is not taxable.
Included in the company’s exempt income for the year ended 30 June 2015 are:
– R19.8 million relating to the fair value adjustment on available-for-sale investments reclassified to profit or loss; and
– R62.0 million relating to interest received from subsidiaries that is no longer taxable due to changes in income tax legislation.
(1) The extent to which it is probable that future taxable profits will be available against which the tax losses and unredeemed capital expenditure can be utilised is reflected in note 19.
3332DRDGOLD LIMITED ANNUAL FINANCIAL STATEMENTS 2016

ANNUAL FINANCIAL STATEMENTS
GROUP
2016 2015
R’000 R’000
9 EARNINGS PER SHAREBasic
The calculation of earnings per ordinary share is based on the following:
Basic earnings attributable to equity owners of the parent 61 929 67 807
Headline
Basic earnings attributable to equity owners of the parent
The basic earnings has been adjusted by the following to arrive at headline earnings: 61 929 67 807
Net impairments – 6 488
– Gross impairment – 7 904
– Non-controlling interest – (799)
– Tax thereon – (617)
Net profit on disposal of property, plant and equipment (8 153) (9 869)
– Gross profit on disposal of property, plant and equipment (10 514) (13 166)
– Non-controlling interest – 2 838
– Tax thereon 2 361 459
Profit on disposal of equity accounted investment – (5 882)
Fair value adjustment on available-for-sale investments reclassified to profit or loss – (19 875)
Headline earnings attributable to ordinary shareholders 53 776 38 669
Diluted
Basic earnings attributable to equity owners of the parent 61 929 67 807
Diluted basic earnings 61 929 67 807
Headline earnings adjustments (8 153) (29 138)
Diluted headline earnings 53 776 38 669
Number of shares
Number of shares
Reconciliation of weighted average number of ordinary shares to diluted weighted average
number of ordinary shares
Weighted average number of ordinary shares in issue 422 157 987 389 699 441
Number of staff options allocated (1) 34 075 –
Diluted weighted average number of ordinary shares 422 192 062 389 699 441
Cents per share
Cents per share
Basic earnings per share 15 17
Diluted earnings per share 15 17
Headline earnings per share 13 10
Diluted headline earnings per share 13 10 (1) At 30 June 2015, 0.8 million options were excluded from the diluted weighted average number of ordinary shares calculation as their effect would have been
anti-dilutive.
33DRDGOLD LIMITED ANNUAL FINANCIAL STATEMENTS 201632

NOTES TO THE FINANCIAL STATEMENTS continued FOR THE YEAR ENDED 30 JUNE 2016
GROUP COMPANY
2015 2016 2016 2015
R’000 R’000 R’000 R’000
10 PROPERTY, PLANT AND EQUIPMENTTotal
2 840 335 2 904 706 Cost 3 512 3 432
2 702 984 2 840 335 Opening balance 3 432 3 330
113 335 100 014 Additions 92 102
(5 640) (17 728) Disposals (12) –
29 656 (12 893) Change in estimate of decommissioning asset (refer note 17) – –
– (5 022) Transferred to assets held for sale (refer note 15) – –
(1 141 561) (1 304 230) Accumulated depreciation and impairment (3 394) (3 348)
(947 481) (1 141 561) Opening balance (3 348) (3 204)
(193 301) (180 167) Depreciation (58) (144)
(3 075) – Impairment (refer note 4) – –
2 296 17 498 Disposals 12 –
1 698 774 1 600 476 Carrying value 118 84
Mine property and development
1 321 607 1 310 291 Cost – –
1 325 761 1 321 607 Opening balance – –
6 628 3 489 Additions – –
(3 326) (225) Disposals – –
(7 456) (9 558) Change in estimate of decommissioning asset – –
– (5 022) Transferred to assets held for sale – –
(624 645) (693 171) Accumulated depreciation and impairment – –
(525 451) (624 645) Opening balance – –
(99 194) (68 526) Depreciation (a) – –
696 962 617 120 Carrying value – –
Mine plant facilities (b)
1 420 816 1 488 757 Cost – –
1 276 207 1 420 816 Opening balance – –
103 734 91 925 Additions – –
(2 250) (17 440) Disposals – –
43 125 (6 544) Change in estimate of decommissioning asset – –
(481 711) (571 534) Accumulated depreciation and impairment – –
(390 515) (481 711) Opening balance – –
(90 371) (107 263) Depreciation (a) – –
(3 075) – Impairment – –
2 250 17 440 Disposals – –
939 105 917 223 Carrying value – –
3534DRDGOLD LIMITED ANNUAL FINANCIAL STATEMENTS 2016

ANNUAL FINANCIAL STATEMENTS
GROUP COMPANY
2015 2016 2016 2015
R’000 R’000 R’000 R’000
10 PROPERTY, PLANT AND EQUIPMENT continued
Equipment and vehicles
26 988 30 770 Cost 3 512 3 432
24 079 26 988 Opening balance 3 432 3 330
2 973 3 845 Additions 92 102
(64) (63) Disposals (12) –
(22 828) (27 148) Accumulated depreciation and impairment (3 394) (3 348)
(19 138) (22 828) Opening balance (3 348) (3 204)
(3 736) (4 378) Depreciation (58) (144)
46 58 Disposals 12 –
4 160 3 622 Carrying value 118 84
Exploration assets
70 924 74 888 Cost – –
76 937 70 924 Opening balance – –
– 755 Additions – –
(6 013) 3 209 Change in estimate of decommissioning asset – –
(12 377) (12 377) Accumulated depreciation and impairment losses – –
(12 377) (12 377) Opening balance – –
58 547 62 511 Carrying value – –
GROUP
(a) Depreciation
The increase in the expected units-of-production in Ergo’s life of mine that became effective on 1 July 2015 resulted in a net decrease in the depreciation
charge recognised (refer note 1 use of estimates and judgements).
(b) Plant facilities acquired under finance lease
Mine plant facilities includes power generation equipment with a carrying value of R19.6 million (2015: R22.6 million) that was acquired during the year
ended 30 June 2015 by way of a finance lease (refer note 21).
35DRDGOLD LIMITED ANNUAL FINANCIAL STATEMENTS 201634
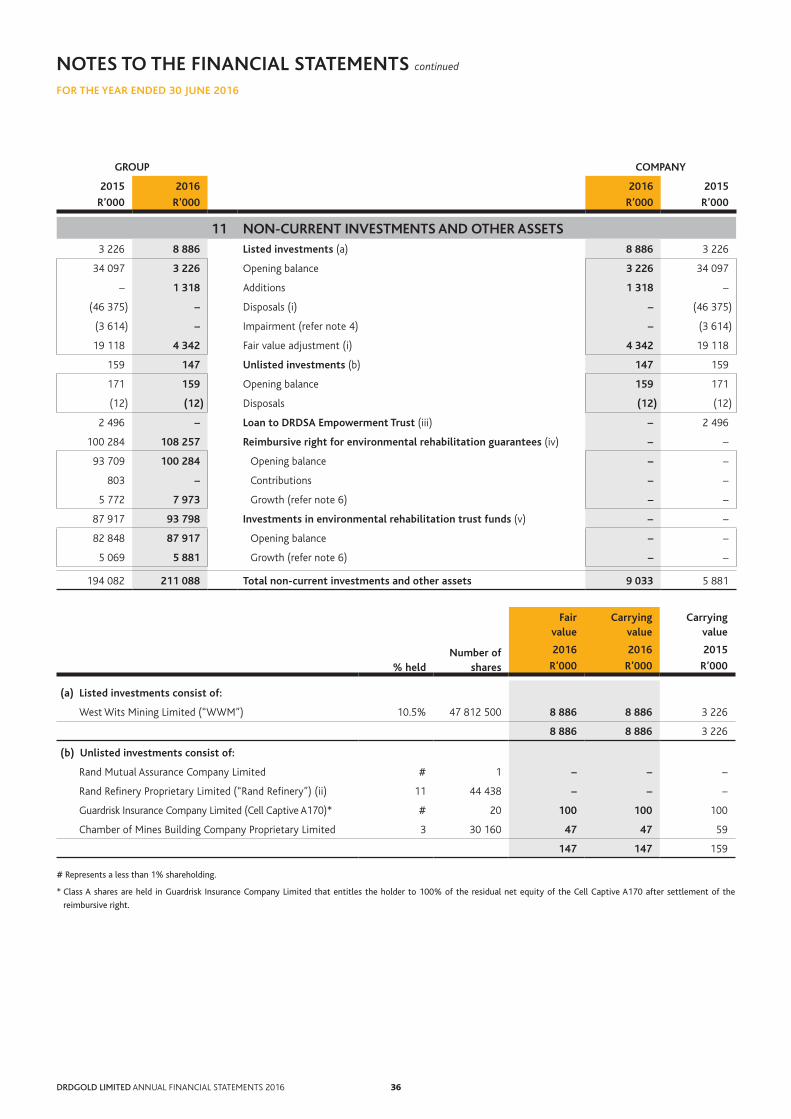
NOTES TO THE FINANCIAL STATEMENTS continued FOR THE YEAR ENDED 30 JUNE 2016
GROUP COMPANY
2015 2016 2016 2015
R’000 R’000 R’000 R’000
11 NON-CURRENT INVESTMENTS AND OTHER ASSETS 3 226 8 886 Listed investments (a) 8 886 3 226
34 097 3 226 Opening balance 3 226 34 097
– 1 318 Additions 1 318 –
(46 375) – Disposals (i) – (46 375)
(3 614) – Impairment (refer note 4) – (3 614)
19 118 4 342 Fair value adjustment (i) 4 342 19 118
159 147 Unlisted investments (b) 147 159
171 159 Opening balance 159 171
(12) (12) Disposals (12) (12)
2 496 – Loan to DRDSA Empowerment Trust (iii) – 2 496
100 284 108 257 Reimbursive right for environmental rehabilitation guarantees (iv) – –
93 709 100 284 Opening balance – –
803 – Contributions – –
5 772 7 973 Growth (refer note 6) – –
87 917 93 798 Investments in environmental rehabilitation trust funds (v) – –
82 848 87 917 Opening balance – –
5 069 5 881 Growth (refer note 6) – –
194 082 211 088 Total non-current investments and other assets 9 033 5 881
Fair
valueCarrying
valueCarrying
value
% heldNumber of
shares
2016 2016 2015
R’000 R’000 R’000
(a) Listed investments consist of:
West Wits Mining Limited (“WWM”) 10.5% 47 812 500 8 886 8 886 3 226
8 886 8 886 3 226
(b) Unlisted investments consist of:
Rand Mutual Assurance Company Limited # 1 – – –
Rand Refinery Proprietary Limited (“Rand Refinery”) (ii) 11 44 438 – – –
Guardrisk Insurance Company Limited (Cell Captive A170)* # 20 100 100 100
Chamber of Mines Building Company Proprietary Limited 3 30 160 47 47 59
147 147 159
# Represents a less than 1% shareholding.
* Class A shares are held in Guardrisk Insurance Company Limited that entitles the holder to 100% of the residual net equity of the Cell Captive A170 after settlement of the
reimbursive right.
3736DRDGOLD LIMITED ANNUAL FINANCIAL STATEMENTS 2016

ANNUAL FINANCIAL STATEMENTS
(i) During the year ended 30 June 2015, all the Village Main Reef Limited (“VMR”) shares held were sold to Heaven-Sent Capital Management Group
Company Limited as part of their offer to acquire the entire issued share capital of VMR for a cash consideration of R12.25 per VMR share. Fair value
adjustments amounting to R19.9 million were reclassified to profit or loss on the disposal.
(ii) Following the adoption of a new Enterprise Resource Planning (ERP) system in 2013, Rand Refinery Proprietary Limited (“Rand Refinery”) identified
an imbalance between physical gold and silver on hand and what Rand Refinery owed its depositors and bullion bankers per the metallurgical trial
balance. Rand Refinery’s investigations have to date not determined the root cause of the imbalance. Various corrective measures have subsequently
been implemented to improve Rand Refinery’s operational performance.
As a precautionary measure following the challenges experienced by the implementation of the software system, Rand Refinery’s major shareholders
have extended Rand Refinery an irrevocable, subordinated loan facility of up to R1.2 billion. The facility is convertible to equity after a period of
two years. DRDGOLD declined the option to provide funding on a pro-rate basis with other major shareholders which may result in its shareholding
being diluted, if the funding provided by the other shareholders are converted into equity. During late calendar year 2015, Rand Refinery drew down
R1.02 billion on the shareholders’ loan.
Management therefore maintains its conclusion reached during the year ended 30 June 2015 that the estimated fair value of the investment in Rand
Refinery shares is zero as at 30 June 2016.
(iii) The terms and conditions of the loans to the DRDSA Empowerment Trust were linked to the payments of dividends from Ergo Mining Operations
Proprietary Limited to the trust up to the completion of the flip-up (refer note 16.2) and thereafter the payment of dividends from DRDGOLD to the
trust. The loan was settled in full during the year ended 30 June 2016.
(iv) Cell Captive cell A170, to which DRDGOLD is a shareholder (refer to unlisted investments), holds funds that may only be applied towards the
settlement of DRDGOLD group’s environmental rehabilitation obligations under financial guarantees issued by Guardrisk Insurance Company
Limited to the DMR (refer note 17).
(v) The monies in the environmental rehabilitation trust funds are held in the Crown Rehabilitation Trust (refer note 12) and are invested primarily in
low-risk interest-bearing debt securities and may only be used for environmental rehabilitation purposes (refer note 17).
COMPANY
2016 2015
R’000 R’000
12 INVESTMENTS IN SUBSIDIARIESShares at cost, less impairment loss (1) 210 488 210 488
Net indebtedness, less impairment loss 546 933 832 155
Interest bearing loans owing by subsidiaries directly held 258 443 544 279
Interest bearing loans owing by subsidiaries not directly held 599 949 599 335
Non-interest bearing loans owing by subsidiaries 143 920 143 920
Impairments (143 920) (143 920)
Non-interest bearing loans owing to subsidiaries (311 459) (311 459)
Interest bearing loans bear interest at the prime interest rate minus four percentage points. The loans are
unsecured and without any fixed repayment arrangements unless stated otherwise.
Net investment in subsidiaries 757 421 1 042 643
37DRDGOLD LIMITED ANNUAL FINANCIAL STATEMENTS 201636
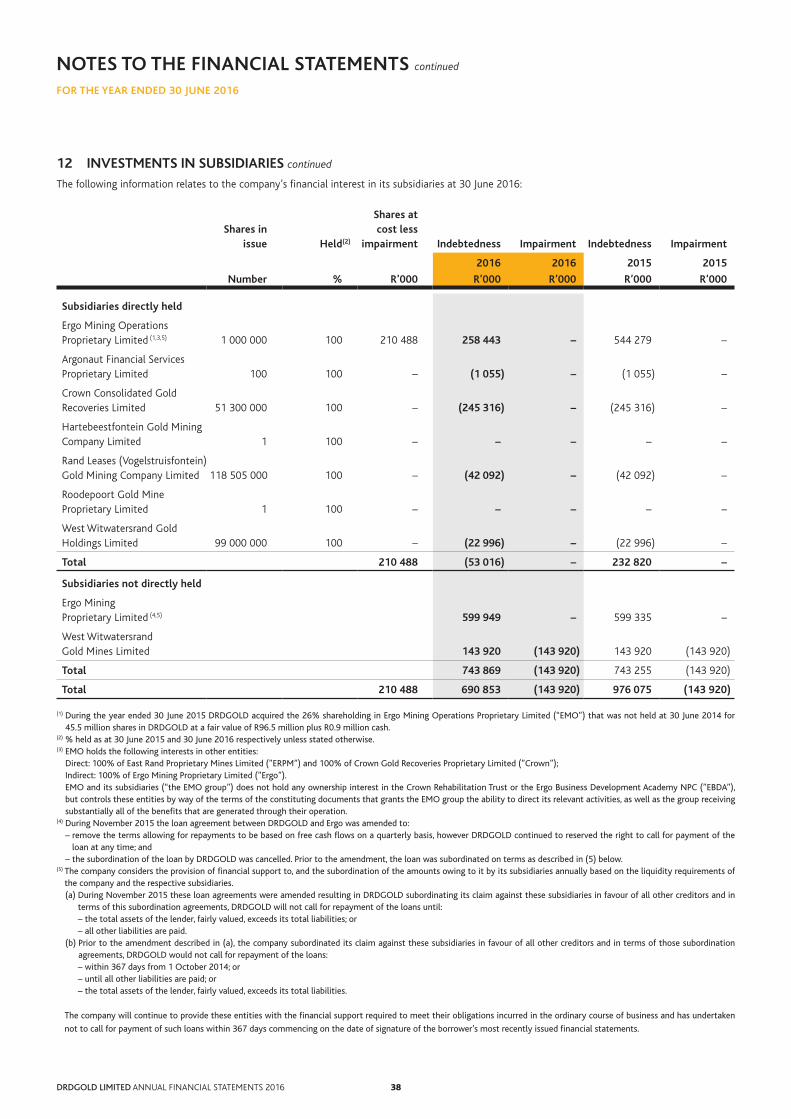
NOTES TO THE FINANCIAL STATEMENTS continued FOR THE YEAR ENDED 30 JUNE 2016
12 INVESTMENTS IN SUBSIDIARIES continued
The following information relates to the company’s financial interest in its subsidiaries at 30 June 2016:
Shares inissue
Held(2)
Shares atcost less
impairment Indebtedness Impairment Indebtedness Impairment
2016 2016 2015 2015
Number % R’000 R’000 R’000 R’000 R’000
Subsidiaries directly held
Ergo Mining Operations Proprietary Limited (1,3,5) 1 000 000 100 210 488 258 443 – 544 279 –
Argonaut Financial Services Proprietary Limited 100 100 – (1 055) – (1 055) –
Crown Consolidated Gold Recoveries Limited 51 300 000 100 – (245 316) – (245 316) –
Hartebeestfontein Gold Mining Company Limited 1 100 – – – – –
Rand Leases (Vogelstruisfontein) Gold Mining Company Limited 118 505 000 100 – (42 092) – (42 092) –
Roodepoort Gold Mine Proprietary Limited 1 100 – – – – –
West Witwatersrand Gold Holdings Limited 99 000 000 100 – (22 996) – (22 996) –
Total 210 488 (53 016) – 232 820 –
Subsidiaries not directly held
Ergo Mining Proprietary Limited (4,5) 599 949 – 599 335 –
West Witwatersrand Gold Mines Limited 143 920 (143 920) 143 920 (143 920)
Total 743 869 (143 920) 743 255 (143 920)
Total 210 488 690 853 (143 920) 976 075 (143 920)
(1) During the year ended 30 June 2015 DRDGOLD acquired the 26% shareholding in Ergo Mining Operations Proprietary Limited (“EMO”) that was not held at 30 June 2014 for 45.5 million shares in DRDGOLD at a fair value of R96.5 million plus R0.9 million cash.
(2) % held as at 30 June 2015 and 30 June 2016 respectively unless stated otherwise.(3) EMO holds the following interests in other entities:
Direct: 100% of East Rand Proprietary Mines Limited (”ERPM”) and 100% of Crown Gold Recoveries Proprietary Limited (”Crown”); Indirect: 100% of Ergo Mining Proprietary Limited (”Ergo”). EMO and its subsidiaries (“the EMO group”) does not hold any ownership interest in the Crown Rehabilitation Trust or the Ergo Business Development Academy NPC (”EBDA”), but controls these entities by way of the terms of the constituting documents that grants the EMO group the ability to direct its relevant activities, as well as the group receiving substantially all of the benefits that are generated through their operation.
(4) During November 2015 the loan agreement between DRDGOLD and Ergo was amended to: – remove the terms allowing for repayments to be based on free cash flows on a quarterly basis, however DRDGOLD continued to reserved the right to call for payment of the
loan at any time; and – the subordination of the loan by DRDGOLD was cancelled. Prior to the amendment, the loan was subordinated on terms as described in (5) below.
(5) The company considers the provision of financial support to, and the subordination of the amounts owing to it by its subsidiaries annually based on the liquidity requirements of the company and the respective subsidiaries. (a) During November 2015 these loan agreements were amended resulting in DRDGOLD subordinating its claim against these subsidiaries in favour of all other creditors and in
terms of this subordination agreements, DRDGOLD will not call for repayment of the loans until: – the total assets of the lender, fairly valued, exceeds its total liabilities; or – all other liabilities are paid. (b) Prior to the amendment described in (a), the company subordinated its claim against these subsidiaries in favour of all other creditors and in terms of those subordination
agreements, DRDGOLD would not call for repayment of the loans: – within 367 days from 1 October 2014; or – until all other liabilities are paid; or – the total assets of the lender, fairly valued, exceeds its total liabilities.
The company will continue to provide these entities with the financial support required to meet their obligations incurred in the ordinary course of business and has undertaken
not to call for payment of such loans within 367 days commencing on the date of signature of the borrower’s most recently issued financial statements.
3938DRDGOLD LIMITED ANNUAL FINANCIAL STATEMENTS 2016

ANNUAL FINANCIAL STATEMENTS
GROUP COMPANY
2015 2016 2016 2015
R’000 R’000 R’000 R’000
13 INVENTORIES60 555 48 758 Gold in process – –
90 689 87 074 Consumable stores – –
17 485 24 837 Finished stock – Bullion – –
168 729 160 669 – –
GROUP
Inventory carried at net realisable value includes gold in process amounting to nil (2015: R5.3 million) and finished stock – bullion amounting to nil
(2015: R15 million) after a nil (2015: R1.8 million) write down to net realisable value.
GROUP COMPANY
2015 2016 2016 2015
R’000 R’000 R’000 R’000
14 TRADE AND OTHER RECEIVABLES 43 002 – Trade receivables (gold sales) – –
22 892 23 573 Value added tax 22 –
3 589 7 976 Prepayments 5 032 208
2 804 2 947 Receivables from related parties 2 749 2 703
1 545 1 633 Interest receivable 1 611 1 545
25 906 41 493 Other receivables 3 591 3 595
(6 465) (11 107) Allowance for impairment – –
93 273 66 515 13 005 8 051
GROUP
Included in other receivables are receivables relating to property sales amounting to R6.5 million (2015: nil) and MQA grants receivable of R10.9 million
(2015: R0.9 million).
GROUP COMPANY
2015 2016 2016 2015
R’000 R’000 R’000 R’000
15 ASSETS AND LIABILITIES CLASSIFIED AS HELD FOR SALEAssets held for sale
747 5 769 Property, plant and equipment – –
747 747 Opening balance – –
– 5 022 Transferred from property, plant and equipment (refer note 10) – –
8 619 9 194 Non-current investments and other assets – –
8 126 8 619 Opening balance – –
493 575 Growth (refer note 6) – –
9 366 14 963 – –
Liabilities held for sale
17 612 15 602 Provisions – –
20 530 17 612 Opening balance – –
1 685 1 525 Unwinding of provision (refer note 7) – –
(4 603) (2 112) Benefit to profit or loss – –
– (1 423) Environmental rehabilitation payments – –
17 612 15 602 – –
39DRDGOLD LIMITED ANNUAL FINANCIAL STATEMENTS 201638
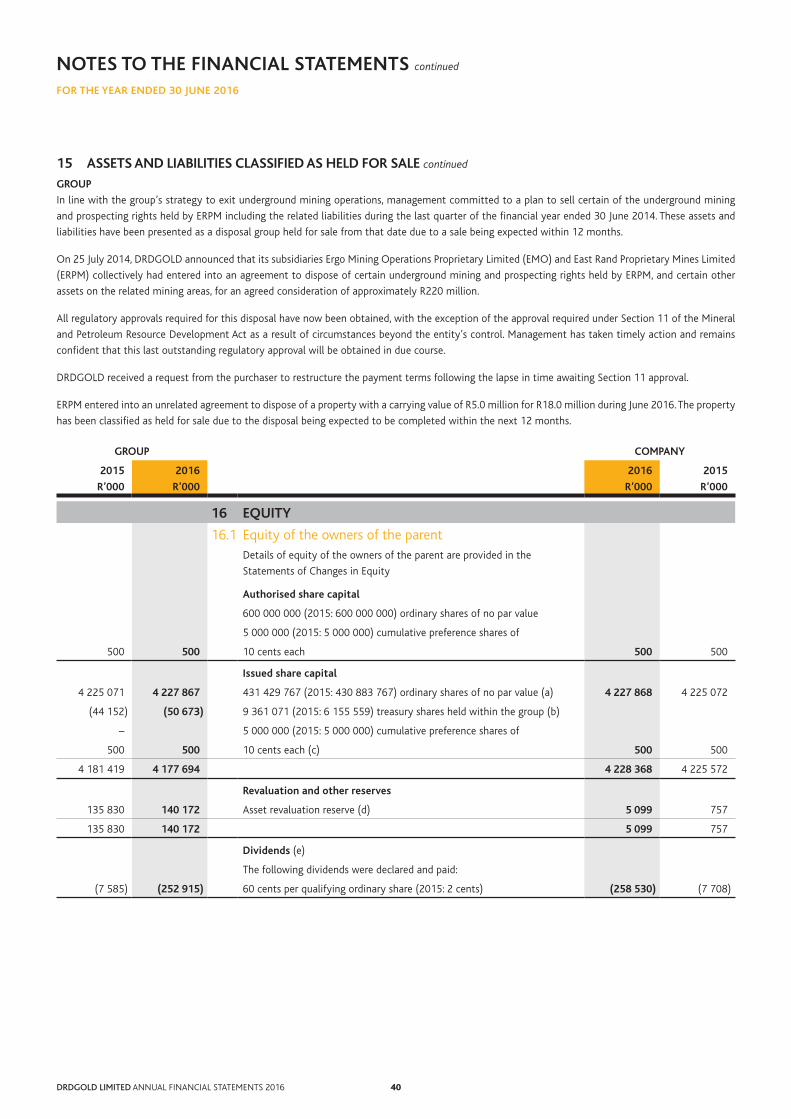
NOTES TO THE FINANCIAL STATEMENTS continued FOR THE YEAR ENDED 30 JUNE 2016
15 ASSETS AND LIABILITIES CLASSIFIED AS HELD FOR SALE continued
GROUP
In line with the group’s strategy to exit underground mining operations, management committed to a plan to sell certain of the underground mining
and prospecting rights held by ERPM including the related liabilities during the last quarter of the financial year ended 30 June 2014. These assets and
liabilities have been presented as a disposal group held for sale from that date due to a sale being expected within 12 months.
On 25 July 2014, DRDGOLD announced that its subsidiaries Ergo Mining Operations Proprietary Limited (EMO) and East Rand Proprietary Mines Limited
(ERPM) collectively had entered into an agreement to dispose of certain underground mining and prospecting rights held by ERPM, and certain other
assets on the related mining areas, for an agreed consideration of approximately R220 million.
All regulatory approvals required for this disposal have now been obtained, with the exception of the approval required under Section 11 of the Mineral
and Petroleum Resource Development Act as a result of circumstances beyond the entity’s control. Management has taken timely action and remains
confident that this last outstanding regulatory approval will be obtained in due course.
DRDGOLD received a request from the purchaser to restructure the payment terms following the lapse in time awaiting Section 11 approval.
ERPM entered into an unrelated agreement to dispose of a property with a carrying value of R5.0 million for R18.0 million during June 2016. The property
has been classified as held for sale due to the disposal being expected to be completed within the next 12 months.
GROUP COMPANY
2015 2016 2016 2015
R’000 R’000 R’000 R’000
16 EQUITY
16.1 Equity of the owners of the parentDetails of equity of the owners of the parent are provided in the
Statements of Changes in Equity
Authorised share capital
600 000 000 (2015: 600 000 000) ordinary shares of no par value
5 000 000 (2015: 5 000 000) cumulative preference shares of
500 500 10 cents each 500 500
Issued share capital
4 225 071 4 227 867 431 429 767 (2015: 430 883 767) ordinary shares of no par value (a) 4 227 868 4 225 072
(44 152) (50 673) 9 361 071 (2015: 6 155 559) treasury shares held within the group (b)
– 5 000 000 (2015: 5 000 000) cumulative preference shares of
500 500 10 cents each (c) 500 500
4 181 419 4 177 694 4 228 368 4 225 572
Revaluation and other reserves
135 830 140 172 Asset revaluation reserve (d) 5 099 757
135 830 140 172 5 099 757
Dividends (e)
The following dividends were declared and paid:
(7 585) (252 915) 60 cents per qualifying ordinary share (2015: 2 cents) (258 530) (7 708)
4140DRDGOLD LIMITED ANNUAL FINANCIAL STATEMENTS 2016

ANNUAL FINANCIAL STATEMENTS
GROUP AND COMPANY unless stated otherwise
Share capital
(a) Unissued shares
In terms of an ordinary resolution passed at the previous annual general meeting, the remaining unissued ordinary shares in the company are under the
control of the directors until the next annual general meeting.
546 000 shares were issued during the year ended 30 June 2016 relating to share options exercised under the DRDGOLD (1996) share scheme (2015: nil).
(b) Treasury shares
3 205 512 shares were acquired in the market during the year ended 30 June 2016 and are held in treasury (2015: nil).
(c) Cumulative preference shares
The terms of issue of the cumulative preference shares were that they carried the right, in priority to the company’s ordinary shares, to receive a
dividend equal to 3% of the gross future revenue generated by the exploitation or the disposal of Argonaut’s mineral rights acquired from Randgold
and Exploration Company Limited in September 1997. The Department of Mineral Resources (DMR) granted DRDGOLD a prospecting right over an area
which was going to be too small to mine. When an application for a greater area was lodged, the DMR stated that the additional area is in an urban
location and an application for a prospecting right cannot be granted. The development of the resource is not expected to materialise and therefore no
dividend is expected to be paid.
(d) Asset revaluation reserve
Group: Included in the asset revaluation reserve is an amount of R133.3 million that was taken to the asset revaluation reserve on the acquisition of
ErgoGold in the year ended 30 June 2009. This amount represented the increase in the fair value of ErgoGold’s net assets after the acquisition of the
group’s initial interest, which was attributable to that initial interest.
(e) Dividends
After 30 June 2016, a dividend of 12 cents per qualifying share (R51.8 million) was approved by the directors as a final dividend for 2016. The dividend
has not been provided for and does not have any tax impact on the company. Dividend withholding tax is levied at 15% (2015: 15%) (certain exemptions
apply) and will be withheld from the dividend depending on the classification of the beneficial owner of the relevant share.
GROUP COMPANY
2015 2016 2016 2015
R’000 R’000 R’000 R’000
16.2 Non-controlling interest (“NCI”)DRDGOLD acquired the 26% shareholding in EMO that it did not already
hold at the end of the third quarter of the year ended 30 June 2015,
making it a wholly-owned subsidiary of DRDGOLD with no remaining
NCI in the group subsequent to this date (refer to note 12).
The following table summarises the information relating to the group’s
NCI up to the date of EMO becoming a wholly owned subsidiary.
1 495 – Profit for the period – –
1 495 – Total comprehensive income – –
389 – Profit allocated to NCI – –
– – OCI allocated to NCI – –
389 – Total comprehensive income allocated to NCI – –
65 726 – Net cash flows from operating activities – –
(48 805) – Net cash flows from investing activities – –
– – Net cash flows from financing activities – –
16 921 – Net increase in cash and cash equivalents – –
41DRDGOLD LIMITED ANNUAL FINANCIAL STATEMENTS 201640

NOTES TO THE FINANCIAL STATEMENTS continued FOR THE YEAR ENDED 30 JUNE 2016
GROUP COMPANY
2015 2016 2016 2015
R’000 R’000 R’000 R’000
17 PROVISION FOR ENVIRONMENTAL REHABILITATION 451 203 493 291 Opening balance – –
29 656 (12 893) (Decrease)/increase in provision (a) – –
37 306 41 491 Unwinding of provision (refer note 7) – –
(9 034) (20 355) Environmental rehabilitation payments – –
(9 034) (10 591) – Incurred on decommissioning liabilities – –
– (9 764) – Incurred on restoration liabilities – –
(15 840) 21 371 Charge/(benefit) to profit or loss (b) – –
493 291 522 905 Closing balance – –
GROUP
(a) (Decrease)/increase in provision
– The R12.9 million decrease in the decommissioning liability recognised to property, plant and equipment is mostly attributable to the decrease in the
expected costs to rehabilitate the Ergo plant and the Elsburg tailings complex (2015: The R29.7 million increase in the decommissioning liability was
mostly due to the costs expected to be incurred to rehabilitate the additional capacity of the Brakpan deposition site that was constructed during the
year (refer note 10)).
(b) Charge/(benefit) to profit or loss
– The R21.4 million increase in the restoration liability charged to profit or loss is mostly attributable to the increase in the estimated costs to rehabilitate
historical spills and dumps that are not considered to be economically viable to mine (2015: The R15.8 million benefit recognised to profit or loss was
mostly attributable to a decrease in the oversized material that management expects to rehabilitate).
The group intends to fund the ultimate rehabilitation costs from the money invested in environmental rehabilitation trust funds, the Guardrisk Cell
Captive and, at the time of mine closure, the proceeds on sale of remaining assets and gold from plant clean-up.
At 30 June 2016 the group held funds in rehabilitation trust funds amounting to R93.8 million (2015: R87.9 million) and in the Guardrisk Cell Captive
amounting to R108.3 million (2015: R100.3 million). In addition, Guardrisk Insurance Company Limited issued environmental guarantees to the DMR
amounting to R427.2 million (2015: R404 million). These guarantees are funded by the funds held in the Guardrisk Cell Captive.
The rehabilitation is expected to occur progressively towards the end-of-life of the respective dumps mined.
4342DRDGOLD LIMITED ANNUAL FINANCIAL STATEMENTS 2016

ANNUAL FINANCIAL STATEMENTS
GROUP COMPANY
2015 2016 2016 2015
R’000 R’000 R’000 R’000
18 POST-RETIREMENT AND OTHER EMPLOYEE BENEFITSNon-current post-retirement and other employee benefits
7 563 7 918 Liability for post-retirement medical benefits (a) – –
1 679 23 665 Liability for long term employee incentive scheme (b) 8 550 454
9 242 31 583 8 550 454
Current post-retirement and other employee benefits
2 557 6 568 Liability for long term employee incentive scheme (b) 1 177 731
2 557 6 568 1 177 731
Contribution funds
The group participates in a number of multi-employer, industry-based
retirement plans. All plans are governed by the Pension Funds Act, 1956.
The group pays fixed contributions to external institutions and will have no
legal or constructive obligation to pay further amounts.
Amount recognised in profit or loss is as follows:
(19 952) (20 648) Contribution payments – –
(a) Post-retirement medical benefits
A provision for post-retirement medical benefits has been raised, based on
the latest calculations using a projected unit credit method, of independent
actuaries performed as at 30 June 2015. Post-retirement medical benefits
are actuarially valued every three years. The obligation is unfunded.
Amounts recognised in the statement of financial position are as follows:
6 657 7 563 Opening balance – –
101 101 Current service cost (recognised in profit or loss) – –
570 603 Interest costs (recognised in profit or loss) – –
539 – Actuarial loss (recognised in other comprehensive income) – –
(304) (349) Benefits paid – –
7 563 7 918 Closing balance – –
Principal actuarial assumptions at the statement of financial position date:
7.37% 7.37% Health care cost inflation
8.16% 8.16% Discount rate
0.74% 0.74% Real discount rate
60.0 60.0 Normal retirement age
63.3 63.3 Expected average retirement age
3 years 3 years Spouse age gap
100% 100% Continuation at retirement
100% 100% Proportion married at retirement
There are currently no long-term assets set aside in respect of post-retirement medical benefit liabilities.
43DRDGOLD LIMITED ANNUAL FINANCIAL STATEMENTS 201642

NOTES TO THE FINANCIAL STATEMENTS continued FOR THE YEAR ENDED 30 JUNE 2016
GROUP COMPANY
2015 2016 2016 2015
R’000 R’000 R’000 R’000
18 POST-RETIREMENT AND OTHER EMPLOYEE BENEFITS continued
(b) Liability for long term employee incentive scheme
4 576 4 236 Opening balance 1 185 1 982
1 577 29 874 Increase in liability 9 448 71
(1 917) (3 877) Benefits paid (906) (868)
4 236 30 233 Total liability of employee incentive scheme 9 727 1 185
(2 557) (6 568) Short term portion of employee incentive scheme (1 177) (731)
1 679 23 665 Long term portion of employee incentive scheme 8 550 454
DRDGOLD Phantom Share Scheme (the Phantom Share Scheme)(i) Details of the scheme
The Phantom Share Scheme is an incentive tool for the group’s executive directors and senior employees whose skills and experience are recognised
as being essential to the group’s performance. The Phantom Share Scheme was introduced during the year ended 30 June 2013 and is classified as
cash settled. In terms of the Phantom Share Scheme rules, 50% of the phantom shares granted will be valued based on the group meeting certain
pre-determined performance criteria and the remaining 50% to defined retention periods of which the maximum incentive pay-out per annum to any
single employee may not exceed 75% of that employee’s gross remuneration package. The participants in the scheme are fully taxed at their marginal
tax rate on any gains realised on the exercise of their options.
The Phantom Share Scheme was amended during November 2015 as follows:
– Shares granted during November 2015 will vest after 3 years (20%), 4 years (30%) and 5 years (50%);
– The scheme has a finite term of 5 years and thus no top-up awards are made when the shares vest;
– The vesting of the shares in years 3, 4 and 5 is subject to:
• Individual performance conditions being met; and
• Individual “service” conditions being met.
– The phantom shares will be settled at the 7 day volume weighted average price of the DRDGOLD share on vesting date.
Shares granted before the amendment are not affected by this amendment.
(ii) Reconciliation of outstanding phantom shares
Shares Number
Weighted average price
per share
R
Balance at 30 June 2014 3 706 102
Granted 2 615 207 1.31
Vested (1 292 833) 1.48
Forfeited/lapsed (502 826) 2.70
Balance at 30 June 2015 4 525 650
Granted 20 527 978 2.26
Vested (1 858 491) 2.09
Forfeited/lapsed (25 946) 2.09
Balance at 30 June 2016 23 169 191
4544DRDGOLD LIMITED ANNUAL FINANCIAL STATEMENTS 2016

ANNUAL FINANCIAL STATEMENTS
(iii) Aging of outstanding phantom shares
NUMBER OF UNVESTED SHARES
Financial year grantedYears to
expiry 30 June
201730 June
201830 June
201930 June
202030 June
2021 Total
2014 1 535 292 535 292
2015 1 – 2 1 052 967 1 052 954 2 105 921
2016 3 – 5 4 105 596 6 158 393 10 263 989 20 527 978
1 588 259 1 052 954 4 105 596 6 158 393 10 263 989 23 169 191
(iv) Fair value
The fair value of the cash-settled share based payment provision has been measured using the Black Scholes option pricing model. Service and non-
market performance conditions attached to the arrangements have not been taken into account in measuring the fair value.
The inputs used in the measurement of the fair values at grant date and measurement date of the phantom shares are as follows:
GRANTED DURING FINANCIAL YEAR
2016 2015 2014
Grant date
Expected term (years) 3 – 5 1 – 3 1 – 3
Expected volatility* 51.1% 22.1% 17.7%
Expected dividend yield 4.3% 0.7% 5.3%
Weighted average risk free interest rate (based on South African interest rates) 8.7% 6.4% 6.1%
Valuation date
Expected term (months) 31 – 52 4 – 16 4
Expected volatility* 52.7% 57.3% 54.5%
Expected dividend yield 2.6% 2.6% 2.6%
Weighted average risk free interest rate (based on South African interest rates) 7.7% 7.7% 6.7%
The minimum performance criteria of the phantom share options granted before the November
2015 amendments to the scheme determined against the group performance are as follows:
Headline earnings per share – 0.08 0.08
Return on equity – 15% 15%
Free cash flow – 10% 10%
Cash flows from operating activities less cash flow from investing activities expressed as a
percentage of revenue
Share price performance:
Outperform the annual movement in the JSE Gold index – 3 3
* Expected volatility has been based on an evaluation of the historical volatility of the company’s share price, particularly over the historical period commensurate with the expected
term. The expected term of the instruments has been based on historical experience and general option holder behaviour.
Share Option Scheme(i) Details of the DRDGOLD (1996) share scheme
During FY2013, the company introduced a new incentive tool called the DRDGOLD Phantom Share Scheme which replaced the DRDGOLD (1996) Share
Scheme and no new share options will be granted under the replaced scheme.
The rules of the DRDGOLD (1996) share scheme do not grant employees the choice of settlement of their vested share options in cash or equity
instruments.
Any options not exercised within a period of five years from grant date will expire.
All options outstanding at 30 June 2016 have vested, have a strike price of R5.12 and will expire on 31 October 2016.
45DRDGOLD LIMITED ANNUAL FINANCIAL STATEMENTS 201644

NOTES TO THE FINANCIAL STATEMENTS continued FOR THE YEAR ENDED 30 JUNE 2016
18 POST-RETIREMENT AND OTHER EMPLOYEE BENEFITS continued
Share Option Scheme continued
(ii) Reconciliation of outstanding share options
Shares Number
Average strike price per share
R
Balance at 30 June 2014 1 238 028 5.96
Forfeited/lapsed (470 678) 7.81
Balance at 30 June 2015 767 350 5.12
Exercised (1) (546 000) 5.12
Forfeited/lapsed (187 275) 5.12
Balance at 30 June 2016 34 075 5.12
(1) The weighted average share price during the period in which the options were exercised was R7.83.
GROUP COMPANY
2015 2016 2016 2015
R’000 R’000 R’000 R’000
19 DEFERRED TAXBalances arose from the following temporary differences:
Deferred tax asset
19 7 Property, plant and equipment 7 19
1 179 6 812 Provisions 6 812 1 179
1 198 6 819 6 819 1 198
Deferred tax liability
(234 709) (306 928) Property, plant and equipment – –
82 661 107 831 Provisions, including rehabilitation provision – –
4 247 4 420 Other temporary differences (a) – –
(147 801) (194 677) – –
(146 603) (187 858) Net deferred mining and income tax (liability)/asset 6 819 1 198
Reconciliation between deferred tax opening and closing balances
(114 660) (146 603) Opening balance 1 198 1 424
(31 943) (41 255) Recognised in profit or loss 5 621 (226)
(47 916) (72 231) Property, plant and equipment (12) 23
13 023 30 803 Provisions, including rehabilitation provision 5 633 (249)
2 950 173 Other temporary differences (a) – –
(146 603) (187 858) Closing balance 6 819 1 198
(a) Includes the temporary differences on the finance lease obligation.
GROUPThe group provides for deferred tax at the rates which are expected to apply for temporary differences. The group uses the expected average effective tax rates, resulting from the mining tax formula for mining income based on forecasts per individual entity.
Deferred tax assets have not been recognised in respect of tax losses of R28.5 million (2015: R46.3 million), unredeemed capital expenditure of R272.9 million (2015: R275.6 million) and capital losses of R271.1 million (2015: R271.1 million).
COMPANYDeferred tax assets have not been recognised in respect of tax losses of R8.4 million (2015: R9.3 million), unredeemed capital expenditure of R36.8 million (2015: R36.8 million) and capital losses of R271.1 million (2015: R271.1 million).
The deferred tax relating to the investment in subsidiaries is nil (2015: nil). These investments are expected to be realised through dividend distributions which are exempt under current tax legislation. As a result there are also no temporary differences.
4746DRDGOLD LIMITED ANNUAL FINANCIAL STATEMENTS 2016

ANNUAL FINANCIAL STATEMENTS
GROUP COMPANY
2015 2016 2016 2015
R’000 R’000 R’000 R’000
20 LOANS AND BORROWINGS 23 096 – Domestic Medium Term Note Programme – 23 096
23 096 – – 23 096
(23 096) – Less: payable within one year included under current liabilities – (23 096)
– – – –
Loans and borrowings repayment schedule for capital amounts payable in the 12 months to:
23 096 – 30 June 2016 – 23 096
23 096 – – 23 096
GROUP AND COMPANY
During June 2012, the group entered into a Domestic Medium Term Note Programme (“DMTN Programme“) with ABSA Capital, a division of ABSA
Bank Limited, under which DRDGOLD may from time to time issue notes and R165 million was raised in total during July 2012 and September 2012.
The different notes issued matured 12 (R20.0 million), 24 (R69.5 million) and 36 (R75.5 million) months from the date of issue and bear interest at the
three-month Johannesburg Inter-bank Acceptance Rate (JIBAR) plus a margin ranging from 4% to 5% a year. The effective interest rates were 10.8% – 11.1%.
The DMTN Programme was unsecured but did have certain covenants attached to it regarding acquiring additional indebtedness, significant disposal of
assets and in the form of a guarantor coverage threshold. On 3 July 2015, DRDGOLD repaid R23.1 million including capital and interest.
GROUP COMPANY
2015 2016 2016 2015
R’000 R’000 R’000 R’000
21 FINANCE LEASE OBLIGATION 21 161 19 161 Aggreko Energy Rental Proprietary Limited – –
21 161 19 161 – –
(2 000) (2 355) Less: payable within one year included under current liabilities – –
19 161 16 806 – –
GROUP
During the year ended 30 June 2015 Ergo entered into an agreement with Aggreko Energy Rental Proprietary Limited for the supply of temporary power
generation through the provision of specified temporary power generation equipment and services.
The finance lease is secured by power generation equipment with a carrying value of R19.6 million at 30 June 2016 (2015: R22.6 million). The finance lease
has an effective interest rate of 17.9% and Ergo has the option to acquire the temporary power generation equipment at the end of the 5 year lease for
approximately R9.9 million. Contingent rentals are payable for usage of the equipment in excess of the usage inclusive in the minimum lease payments.
Finance lease liabilities are payable as follows:
FUTURE MINIMUM LEASE PAYMENTS INTEREST
PRESENT VALUE OF MINIMUM LEASE PAYMENTS
2016 2015 2016 2015 2016 2015
R’000 R’000 R’000 R’000 R’000 R’000
Within one year 5 304 5 304 2 949 3 304 2 355 2 000
Between one and five years 21 801 27 105 4 995 7 944 16 806 19 161
27 105 32 409 7 944 11 248 19 161 21 161
47DRDGOLD LIMITED ANNUAL FINANCIAL STATEMENTS 201646

NOTES TO THE FINANCIAL STATEMENTS continued FOR THE YEAR ENDED 30 JUNE 2016
GROUP COMPANY
2015 2016 2016 2015
R’000 R’000 R’000 R’000
22 CASH GENERATED BY/(APPLIED TO) OPERATIONS 96 795 108 852 Profit before tax 23 221 43 405
Adjusted for:
193 301 180 167 Depreciation 58 144
(20 443) 19 259 Movement in provision for environmental rehabilitation – –
(20 557) 7 075 Movement in gold in process – –
6 689 – Impairments – 3 614
(13 166) (10 514) Profit on disposal of property, plant and equipment (2) –
1 753 29 874 Share-based payment expense 9 448 247
(74) 4 642 Impairment/(reversal of impairment) of other receivables – –
367 – Post-retirement employee benefits – –
– (22 659) Reversal of accrual (refer note 4) – –
– (11 187) Environmental rehabilitation payments (refer note 17) – –
(51 497) (36 849) Finance income (81 385) (95 145)
49 603 47 576 Finance expenses 358 7 468
242 771 316 236 Operating cash flows before working capital changes (48 302) (40 267)
42 426 81 979 Working capital changes 13 227 (79)
1 926 33 725 Change in trade and other receivables 145 1 895
(984) 986 Change in inventories – –
41 484 47 268 Change in trade and other payables 13 082 (1 974)
285 197 398 215 Cash generated by/(applied to) operations (35 075) (40 346)
23 CASH AND CASH EQUIVALENTS 103 888 99 688 Bank Balances 36 029 11 872
220 487 252 108 Call deposits 242 576 216 695
324 375 351 796 278 605 228 567
GROUP
Included in cash and cash equivalents is restricted cash of:
• R15.2 million (30 June 2015: R14.3 million) set aside for guarantees;
• R47.7 million (30 June 2015: R11.4 million) relating to cash held in escrow relating to the electricity dispute with Ekurhuleni Metropolitan Municipality
discussed under Note 25 including interest thereon; and
• R4.8 million (30 June 2015: R1.9 million) held on behalf of the DRDSA Empowerment Trust.
An overdraft facility of R100 million is available to the group.
4948DRDGOLD LIMITED ANNUAL FINANCIAL STATEMENTS 2016
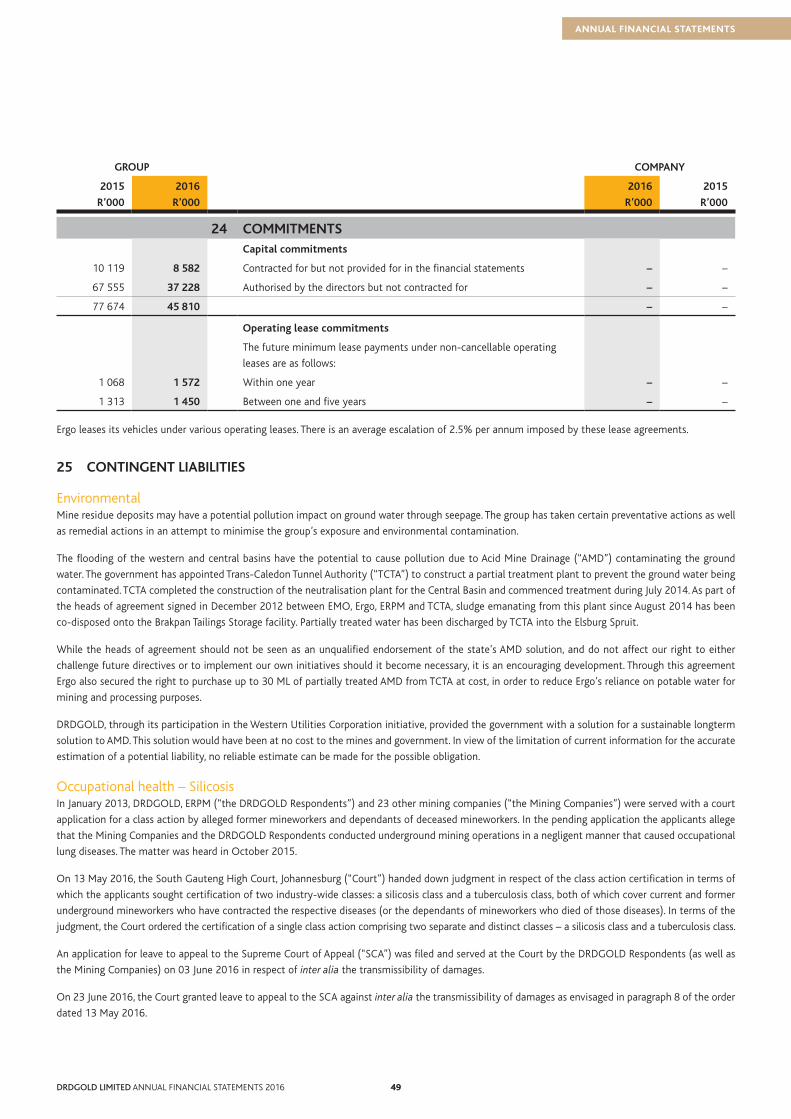
ANNUAL FINANCIAL STATEMENTS
GROUP COMPANY
2015 2016 2016 2015
R’000 R’000 R’000 R’000
24 COMMITMENTSCapital commitments
10 119 8 582 Contracted for but not provided for in the financial statements – –
67 555 37 228 Authorised by the directors but not contracted for – –
77 674 45 810 – –
Operating lease commitments
The future minimum lease payments under non-cancellable operating
leases are as follows:
1 068 1 572 Within one year – –
1 313 1 450 Between one and five years – –
Ergo leases its vehicles under various operating leases. There is an average escalation of 2.5% per annum imposed by these lease agreements.
25 CONTINGENT LIABILITIES
EnvironmentalMine residue deposits may have a potential pollution impact on ground water through seepage. The group has taken certain preventative actions as well
as remedial actions in an attempt to minimise the group’s exposure and environmental contamination.
The flooding of the western and central basins have the potential to cause pollution due to Acid Mine Drainage (“AMD”) contaminating the ground
water. The government has appointed Trans-Caledon Tunnel Authority (“TCTA”) to construct a partial treatment plant to prevent the ground water being
contaminated. TCTA completed the construction of the neutralisation plant for the Central Basin and commenced treatment during July 2014. As part of
the heads of agreement signed in December 2012 between EMO, Ergo, ERPM and TCTA, sludge emanating from this plant since August 2014 has been
co-disposed onto the Brakpan Tailings Storage facility. Partially treated water has been discharged by TCTA into the Elsburg Spruit.
While the heads of agreement should not be seen as an unqualified endorsement of the state’s AMD solution, and do not affect our right to either
challenge future directives or to implement our own initiatives should it become necessary, it is an encouraging development. Through this agreement
Ergo also secured the right to purchase up to 30 ML of partially treated AMD from TCTA at cost, in order to reduce Ergo’s reliance on potable water for
mining and processing purposes.
DRDGOLD, through its participation in the Western Utilities Corporation initiative, provided the government with a solution for a sustainable longterm
solution to AMD. This solution would have been at no cost to the mines and government. In view of the limitation of current information for the accurate
estimation of a potential liability, no reliable estimate can be made for the possible obligation.
Occupational health – SilicosisIn January 2013, DRDGOLD, ERPM (“the DRDGOLD Respondents”) and 23 other mining companies (“the Mining Companies”) were served with a court
application for a class action by alleged former mineworkers and dependants of deceased mineworkers. In the pending application the applicants allege
that the Mining Companies and the DRDGOLD Respondents conducted underground mining operations in a negligent manner that caused occupational
lung diseases. The matter was heard in October 2015.
On 13 May 2016, the South Gauteng High Court, Johannesburg (“Court”) handed down judgment in respect of the class action certification in terms of
which the applicants sought certification of two industry-wide classes: a silicosis class and a tuberculosis class, both of which cover current and former
underground mineworkers who have contracted the respective diseases (or the dependants of mineworkers who died of those diseases). In terms of the
judgment, the Court ordered the certification of a single class action comprising two separate and distinct classes – a silicosis class and a tuberculosis class.
An application for leave to appeal to the Supreme Court of Appeal (“SCA”) was filed and served at the Court by the DRDGOLD Respondents (as well as
the Mining Companies) on 03 June 2016 in respect of inter alia the transmissibility of damages.
On 23 June 2016, the Court granted leave to appeal to the SCA against inter alia the transmissibility of damages as envisaged in paragraph 8 of the order
dated 13 May 2016.
49DRDGOLD LIMITED ANNUAL FINANCIAL STATEMENTS 201648

NOTES TO THE FINANCIAL STATEMENTS continued FOR THE YEAR ENDED 30 JUNE 2016
25 CONTINGENT LIABILITIES continued
Occupational health – Silicosis continued
On 15 July 2016, the DRDGOLD Respondents filed and served its petition to the SCA in respect of the certification issue. The notice of appeal in respect
of the transmissibility of damages was filed and served on 25 July 2016.
On 13 September 2016, the SCA granted the DRDGOLD Respondents leave to appeal on both the certification and transmissibility of damages.
It is not possible at this stage to ascertain what the probable outcome of the matter will be.
Ekurhuleni Metropolitan Municipality (“Ekurhuleni”) Electricity Tariff DisputeIn December 2014, an application (in the South Gauteng High Court) was filed and served on inter alia the Ekurhuleni Metropolitan Municipality
(“Municipality”) and Eskom Holdings SOC Limited (“Eskom”) in terms of which Ergo Mining Proprietary Limited (“Ergo”) contends, amongst other things,
that the Municipality does not “supply” electricity to ERGO from a “supply main” as contemplated in the Municipality’s Electricity By-Laws of 2002. The
Municipality is not licensed to supply electricity to ERGO in terms of the Municipality’s Temporary Distribution Licence. The Municipality is not entitled
to render tax invoices to ERGO for the supply and consumption of electricity from the substation. The Municipality is furthermore not competent to
add a surcharge or premium of approximately 40% (forty percent) of the rate at which Eskom ordinarily charges ERGO on its Megaflex rate. ERGO is not
indebted to the Municipality for the supply and consumption of electricity and is not obliged to tender payment for any amounts claimed in the invoices
rendered by the Municipality in excess of its actual consumption thereof as determined by Eskom on a monthly basis. The Municipality is indebted to
ERGO in the amount of approximately R43 million in respect of the surcharges and premiums that were erroneously paid to the Municipality in the bona
fide and reasonable belief that the Municipality was competent to supply electricity to it.
Subsequent to December 2014 up to 30 June 2016, the Municipality has invoiced ERGO for approximately R51.4 million in surcharges of which
R45.7 million has been paid into an attorney’s trust account at 30 June 2016 pending the final determination of the dispute.
26 FINANCIAL INSTRUMENTS
OverviewThe group (which includes the company unless the context implies differently) has exposure to credit risk, liquidity risks, as well as other market risks
from its use of financial instruments. This note presents information about the group’s exposure to each of the above risks, the group’s objectives and
policies and processes for measuring and managing risk. The group’s management of capital is disclosed in note 27. Further quantitative disclosures are
included throughout these group and company financial statements.
Risk management frameworkThe board of directors (“Board”) has overall responsibility for the establishment and oversight of the group’s risk management framework. The Board
has established the Audit and Risk Committee, which is responsible for developing and monitoring the group’s risk management policies. The committee
reports regularly to the Board on its activities.
The group’s risk management policies are established to identify and analyse the risks faced by the group, to set appropriate risk limits and controls,
and to monitor risks and adherence to limits. Risk management policies and systems are reviewed regularly to reflect changes to market conditions and
the group’s activities. The group, through its training and management standards and procedures, aims to develop a disciplined and constructive control
environment in which all employees understand their roles and obligations.
The Audit and Risk Committee oversees how management monitors compliance with the group’s risk management policies and procedures, and reviews
the adequacy of the risk management framework in relation to the risks faced by the group. The Audit and Risk Committee is assisted in its oversight role
by the internal audit function. The internal audit function undertakes both regular and ad hoc reviews of risk management controls and procedures, the
results of which are reported to the Audit and Risk Committee.
Credit riskCredit risk is the risk of financial loss to the group if a customer or counterparty to a financial instrument fails to meet its contractual obligations, and
arises principally from the group’s receivables from customers and investment securities.
The group’s financial instruments do not represent a concentration of credit risk, because the group deals with a variety of major banks and financial
institutions located in South Africa after evaluating the credit ratings of the representative financial institutions. Furthermore, its trade receivables and
loans are regularly monitored and assessed for recoverability. Where it is appropriate an impairment loss is raised.
5150DRDGOLD LIMITED ANNUAL FINANCIAL STATEMENTS 2016
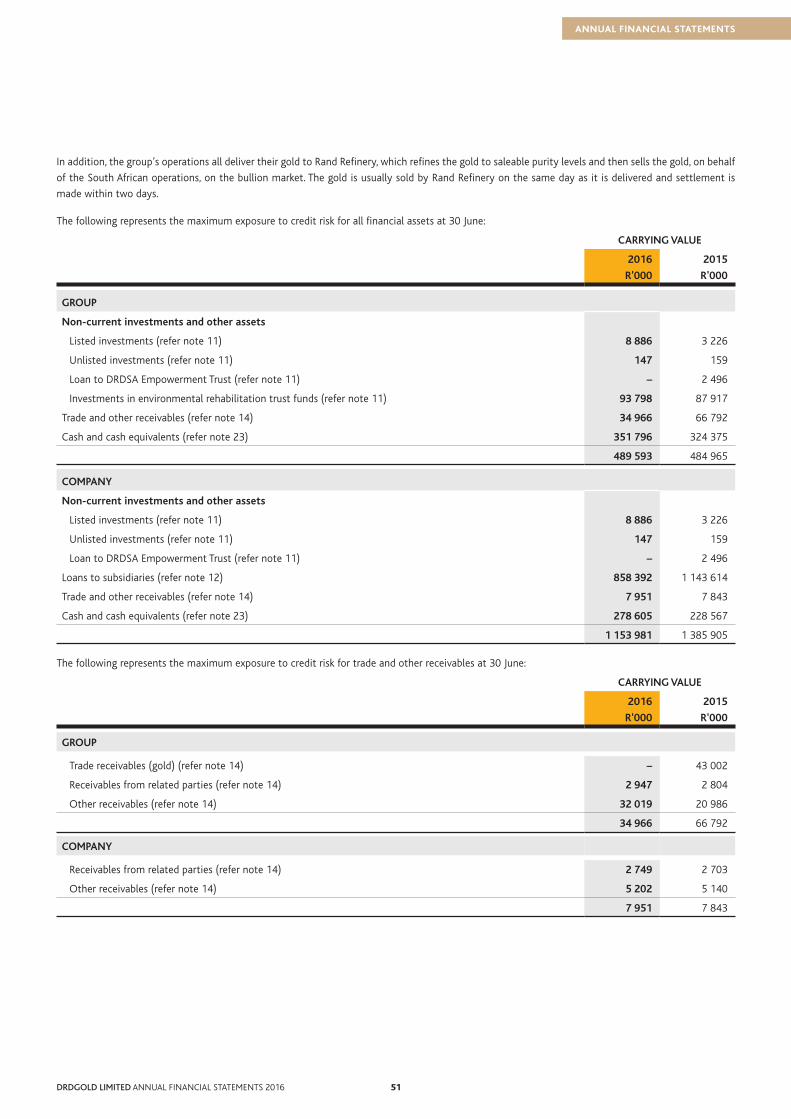
ANNUAL FINANCIAL STATEMENTS
In addition, the group’s operations all deliver their gold to Rand Refinery, which refines the gold to saleable purity levels and then sells the gold, on behalf
of the South African operations, on the bullion market. The gold is usually sold by Rand Refinery on the same day as it is delivered and settlement is
made within two days.
The following represents the maximum exposure to credit risk for all financial assets at 30 June:
CARRYING VALUE
2016 2015
R'000 R'000
GROUP
Non-current investments and other assets
Listed investments (refer note 11) 8 886 3 226
Unlisted investments (refer note 11) 147 159
Loan to DRDSA Empowerment Trust (refer note 11) – 2 496
Investments in environmental rehabilitation trust funds (refer note 11) 93 798 87 917
Trade and other receivables (refer note 14) 34 966 66 792
Cash and cash equivalents (refer note 23) 351 796 324 375
489 593 484 965
COMPANY
Non-current investments and other assets
Listed investments (refer note 11) 8 886 3 226
Unlisted investments (refer note 11) 147 159
Loan to DRDSA Empowerment Trust (refer note 11) – 2 496
Loans to subsidiaries (refer note 12) 858 392 1 143 614
Trade and other receivables (refer note 14) 7 951 7 843
Cash and cash equivalents (refer note 23) 278 605 228 567
1 153 981 1 385 905
The following represents the maximum exposure to credit risk for trade and other receivables at 30 June:
CARRYING VALUE
2016 2015
R'000 R'000
GROUP
Trade receivables (gold) (refer note 14) – 43 002
Receivables from related parties (refer note 14) 2 947 2 804
Other receivables (refer note 14) 32 019 20 986
34 966 66 792
COMPANY
Receivables from related parties (refer note 14) 2 749 2 703
Other receivables (refer note 14) 5 202 5 140
7 951 7 843
51DRDGOLD LIMITED ANNUAL FINANCIAL STATEMENTS 201650

NOTES TO THE FINANCIAL STATEMENTS continued FOR THE YEAR ENDED 30 JUNE 2016
26 FINANCIAL INSTRUMENTS continued
Credit risk continued
The ageing of trade and other receivables at 30 June:
GROSS VALUE IMPAIRMENT GROSS VALUE IMPAIRMENT
2016 2016 2015 2015
R’000 R’000 R’000 R’000
GROUP
Not past due 18 183 – 53 630 (14)
Past due 0 – 30 days 6 796 (269) 1 149 (55)
Past due 31 – 120 days 4 434 (925) 2 754 (1 105)
Past due more than 120 days 16 660 (9 913) 15 724 (5 291)
46 073 (11 107) 73 257 (6 465)
COMPANY
Not past due 4 385 – 4 272 –
Past due 0 – 30 days 23 – 23 –
Past due 31 – 120 days 23 – 23 –
Past due more than 120 days 3 520 – 3 525 –
7 951 – 7 843 –
Management believes that the unimpaired amounts that are past due by more than 30 days are still collectible in full based on historical payment
behaviour.
Impairments were raised due to the uncertainty around the recoverability and timing of the expected cash flows.
Movement in the allowance for impairment in respect of other receivables during the year was as follows:
IMPAIRMENT
2016 2015
R’000 R’000
GROUP
Balance at 1 July (6 465) (6 981)
Impairments (recognised)/reversed (4 642) 74
Bad debt written off against related receivable – 442
Balance at 30 June (11 107) (6 465)
No impairments were recognised on trade receivables.
The group has no significant concentration of credit risk as the majority of the group’s receivables are from debtors with a good track record.
The company has no significant concentration of credit risk.
5352DRDGOLD LIMITED ANNUAL FINANCIAL STATEMENTS 2016
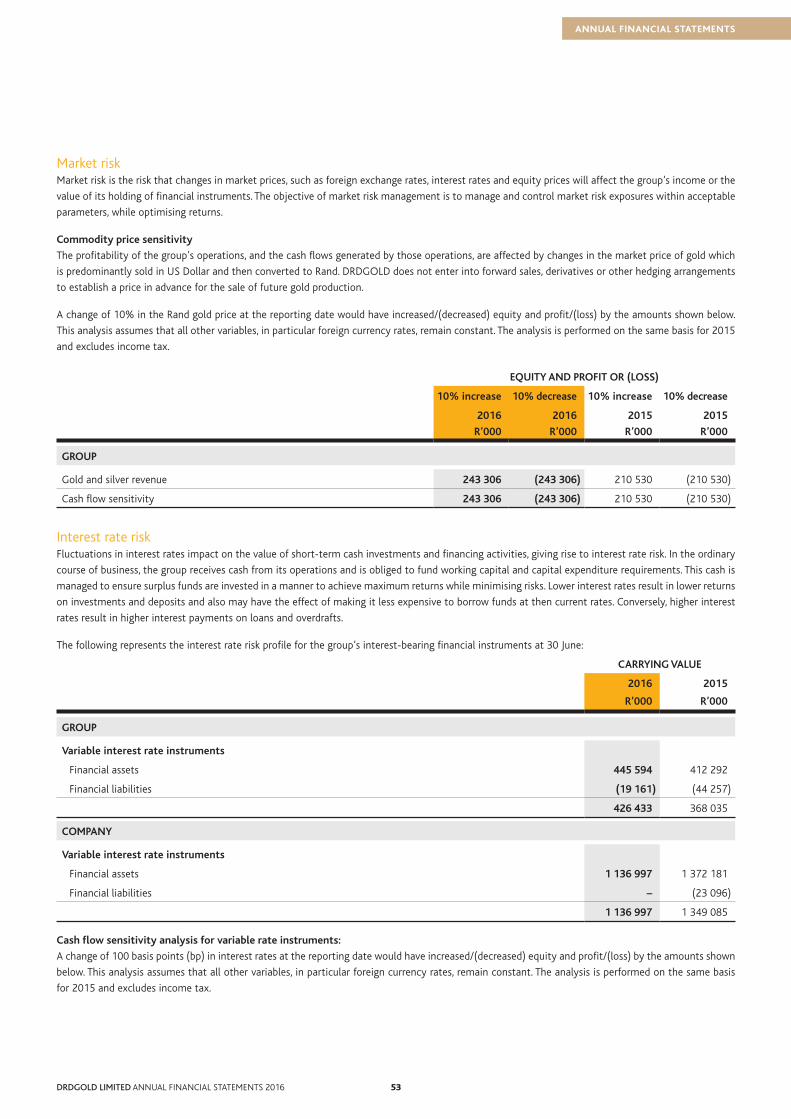
ANNUAL FINANCIAL STATEMENTS
Market riskMarket risk is the risk that changes in market prices, such as foreign exchange rates, interest rates and equity prices will affect the group’s income or the
value of its holding of financial instruments. The objective of market risk management is to manage and control market risk exposures within acceptable
parameters, while optimising returns.
Commodity price sensitivity
The profitability of the group’s operations, and the cash flows generated by those operations, are affected by changes in the market price of gold which
is predominantly sold in US Dollar and then converted to Rand. DRDGOLD does not enter into forward sales, derivatives or other hedging arrangements
to establish a price in advance for the sale of future gold production.
A change of 10% in the Rand gold price at the reporting date would have increased/(decreased) equity and profit/(loss) by the amounts shown below.
This analysis assumes that all other variables, in particular foreign currency rates, remain constant. The analysis is performed on the same basis for 2015
and excludes income tax.
EQUITY AND PROFIT OR (LOSS)
10% increase 10% decrease 10% increase 10% decrease
2016 2016 2015 2015
R’000 R’000 R’000 R’000
GROUP
Gold and silver revenue 243 306 (243 306) 210 530 (210 530)
Cash flow sensitivity 243 306 (243 306) 210 530 (210 530)
Interest rate riskFluctuations in interest rates impact on the value of short-term cash investments and financing activities, giving rise to interest rate risk. In the ordinary
course of business, the group receives cash from its operations and is obliged to fund working capital and capital expenditure requirements. This cash is
managed to ensure surplus funds are invested in a manner to achieve maximum returns while minimising risks. Lower interest rates result in lower returns
on investments and deposits and also may have the effect of making it less expensive to borrow funds at then current rates. Conversely, higher interest
rates result in higher interest payments on loans and overdrafts.
The following represents the interest rate risk profile for the group’s interest-bearing financial instruments at 30 June:
CARRYING VALUE
2016 2015
R’000 R’000
GROUP
Variable interest rate instruments
Financial assets 445 594 412 292
Financial liabilities (19 161) (44 257)
426 433 368 035
COMPANY
Variable interest rate instruments
Financial assets 1 136 997 1 372 181
Financial liabilities – (23 096)
1 136 997 1 349 085
Cash flow sensitivity analysis for variable rate instruments:
A change of 100 basis points (bp) in interest rates at the reporting date would have increased/(decreased) equity and profit/(loss) by the amounts shown
below. This analysis assumes that all other variables, in particular foreign currency rates, remain constant. The analysis is performed on the same basis
for 2015 and excludes income tax.
53DRDGOLD LIMITED ANNUAL FINANCIAL STATEMENTS 201652

NOTES TO THE FINANCIAL STATEMENTS continued FOR THE YEAR ENDED 30 JUNE 2016
26 FINANCIAL INSTRUMENTS continued
Interest rate risk continued
EQUITY AND PROFIT OR (LOSS)
100bp increase
100bp decrease
100bp increase
100bp decrease
2016 2016 2015 2015
R’000 R’000 R’000 R’000
GROUP
Variable interest rate instruments 4 264 (4 264) 3 680 (3 680)
Cash flow sensitivity 4 264 (4 264) 3 680 (3 680)
COMPANY
Variable interest rate instruments 11 370 (11 370) 13 491 (13 491)
Cash flow sensitivity 11 370 (11 370) 13 491 (13 491)
Foreign currency risk
The group’s reporting currency is the South African Rand. Although gold is sold in US Dollars, the group is obliged to convert this into South African
Rand. The company is thus exposed to fluctuations in the US Dollar/South African Rand exchange rate. The company conducted its operations in South
Africa during the current year. Foreign exchange fluctuations affect the cash flow that it will realise from its operations as gold is sold in US Dollars, while
production costs are incurred primarily in South African Rands. The company’s results are positively affected when the US Dollar strengthens against the
Rand and adversely affected when the US Dollar weakens against the Rand. The group does not hedge against foreign currency fluctuations and considers
the risk to be low due to foreign currency normally being disposed of on the same day.
The following significant exchange rates applied during the year:
SPOT RATE AT YEAR END AVERAGE RATE
2016 2015 2016 2015
1 US Dollar 14.6800 12.1649 14.4989 11.4475
The following represents the exposure to foreign currency risks of the group:
2016 2015
USD’000 USD’000
GROUP
Trade and other receivables – 3 535
Cash and cash equivalents 2 320 –
Net statement of financial position exposure 2 320 3 535
COMPANY
Cash and cash equivalents 2 320 –
Net statement of financial position exposure 2 320 –
5554DRDGOLD LIMITED ANNUAL FINANCIAL STATEMENTS 2016

ANNUAL FINANCIAL STATEMENTS
Sensitivity analysisA 10 percent strengthening of the Rand against the US dollar at 30 June would have increased/(decreased) equity and profit/(loss) by the amounts
shown below. This analysis assumes that all other variables, in particular interest rates, remain constant. The analysis is performed on the same basis for
2015. A 10% weakening of the rand against the US dollar at 30 June would have had the equal but opposite effect, on the basis that all other variables
remain constant.
2016 2015
R’000 R’000
GROUP
Equity (3 405) (4 300)
Loss (3 405) (4 300)
COMPANY
Equity (3 405) –
Loss (3 405) –
Other market price risk
Equity price risk arises from available-for-sale equity securities fair value adjustments accounted for in other comprehensive income. Investments within
the portfolio are managed on an individual basis.
The following table represents the carrying amounts and net profit/(loss), finance income and finance expense recognised in profit or loss and/or equity
as well as other comprehensive income per category of financial instruments at 30 June:
Carrying
value
Profit/
(loss) OCI
Total
equity
Carrying
value
Profit/
(loss) OCI
Total
equity
2016 2016 2016 2016 2015 2015 2015 2015
R’000 R’000 R’000 R’000 R’000 R’000 R’000 R’000
GROUP
Financial assets
Available-for-sale
financial assets 9 033 – 4 342 4 342 3 385 16 261 (757) 15 504
Loans and receivables 480 560 28 686 – 28 686 481 580 18 754 – 18 754
489 593 28 686 4 342 33 028 484 965 35 015 (757) 34 258
Financial liabilities
Financial liabilities measured
at amortised cost 245 197 (4 370) – (4 370) 256 129 (10 612) – (10 612)
245 197 (4 370) – (4 370) 256 129 (10 612) – (10 612)
COMPANY
Financial assets
Available-for-sale financial
assets 9 033 – 4 342 4 342 3 385 16 261 (757) 15 504
Loans and receivables 1 144 948 81 195 – 81 195 1 382 520 74 055 – 74 055
1 153 981 81 195 4 342 85 537 1 385 905 90 316 (757) 89 559
Financial liabilities
Financial liabilities measured
at amortised cost 327 946 (168) – (168) 344 321 (7 468) – (7 468)
327 946 (168) – (168) 344 321 (7 468) – (7 468)
55DRDGOLD LIMITED ANNUAL FINANCIAL STATEMENTS 201654

NOTES TO THE FINANCIAL STATEMENTS continued FOR THE YEAR ENDED 30 JUNE 2016
26 FINANCIAL INSTRUMENTS continued
Liquidity riskLiquidity risk is the risk that the group will not be able to meet its financial obligations as they fall due. The group’s approach to managing liquidity is to
ensure, as far as possible, that it will always have sufficient liquidity to meet its liabilities when due, under both normal and stressed conditions, without
incurring unacceptable losses or risking damage to the group’s reputation.
The group ensures that it has sufficient cash on demand to meet expected operational expenses, including the servicing of financial obligations; this
excludes the potential impact of extreme circumstances that cannot reasonably be predicted, such as natural disasters.
Unless otherwise stated the following are the contractual maturities of financial liabilities, including estimated interest payments and excluding the
impact of netting agreements:
Carrying amount
Contractual cash flows
6 months or less
6-12 months
2-5 years
R’000 R’000 R’000 R’000 R’000
GROUP
30 June 2016
Finance lease obligation 19 161 (27 105) (2 652) (2 652) (21 801)
Trade and other payables (1) 226 036 (226 036) (226 036) – –
245 197 (253 141) (228 688) (2 652) (21 801)
30 June 2015
Loans and borrowings 23 096 (23 096) (23 096) – –
Finance lease obligation 21 161 (32 409) (2 652) (2 652) (27 105)
Trade and other payables (1) 211 872 (211 872) (211 872) – –
256 129 (267 377) (237 620) (2 652) (27 105)
(1) Excludes payroll related liabilities of R63.0 million (2015: R45.9 million).
COMPANY
30 June 2016
Amounts owing to subsidiaries 311 459 (311 459) (311 459) – –
Trade and other payables (2) 16 487 (16 487) (16 487) – –
327 946 (327 946) (327 946) – –
30 June 2015
Amounts owing to subsidiaries 311 459 (311 459) (311 459) – –
Loans and borrowings 23 096 (23 096) (23 096) – –
Trade and other payables (2) 9 766 (9 766) (9 766) – –
344 321 (344 321) (344 321) – –
(2) Excludes payroll related liabilities of R10.5 million (2015: R3.0 million).
5756DRDGOLD LIMITED ANNUAL FINANCIAL STATEMENTS 2016
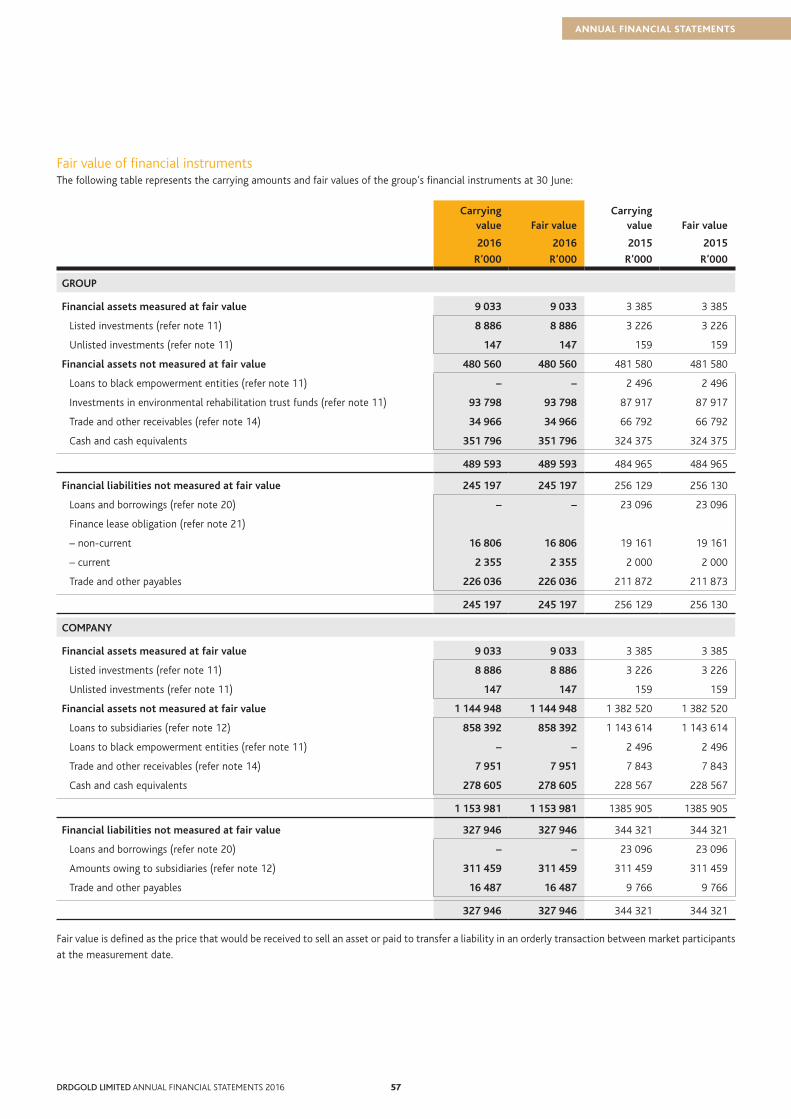
ANNUAL FINANCIAL STATEMENTS
Fair value of financial instrumentsThe following table represents the carrying amounts and fair values of the group’s financial instruments at 30 June:
Carrying value Fair value
Carrying value Fair value
2016 2016 2015 2015
R’000 R’000 R’000 R’000
GROUP
Financial assets measured at fair value 9 033 9 033 3 385 3 385
Listed investments (refer note 11) 8 886 8 886 3 226 3 226
Unlisted investments (refer note 11) 147 147 159 159
Financial assets not measured at fair value 480 560 480 560 481 580 481 580
Loans to black empowerment entities (refer note 11) – – 2 496 2 496
Investments in environmental rehabilitation trust funds (refer note 11) 93 798 93 798 87 917 87 917
Trade and other receivables (refer note 14) 34 966 34 966 66 792 66 792
Cash and cash equivalents 351 796 351 796 324 375 324 375
489 593 489 593 484 965 484 965
Financial liabilities not measured at fair value 245 197 245 197 256 129 256 130
Loans and borrowings (refer note 20) – – 23 096 23 096
Finance lease obligation (refer note 21)
– non-current 16 806 16 806 19 161 19 161
– current 2 355 2 355 2 000 2 000
Trade and other payables 226 036 226 036 211 872 211 873
245 197 245 197 256 129 256 130
COMPANY
Financial assets measured at fair value 9 033 9 033 3 385 3 385
Listed investments (refer note 11) 8 886 8 886 3 226 3 226
Unlisted investments (refer note 11) 147 147 159 159
Financial assets not measured at fair value 1 144 948 1 144 948 1 382 520 1 382 520
Loans to subsidiaries (refer note 12) 858 392 858 392 1 143 614 1 143 614
Loans to black empowerment entities (refer note 11) – – 2 496 2 496
Trade and other receivables (refer note 14) 7 951 7 951 7 843 7 843
Cash and cash equivalents 278 605 278 605 228 567 228 567
1 153 981 1 153 981 1385 905 1385 905
Financial liabilities not measured at fair value 327 946 327 946 344 321 344 321
Loans and borrowings (refer note 20) – – 23 096 23 096
Amounts owing to subsidiaries (refer note 12) 311 459 311 459 311 459 311 459
Trade and other payables 16 487 16 487 9 766 9 766
327 946 327 946 344 321 344 321
Fair value is defined as the price that would be received to sell an asset or paid to transfer a liability in an orderly transaction between market participants
at the measurement date.
57DRDGOLD LIMITED ANNUAL FINANCIAL STATEMENTS 201656

NOTES TO THE FINANCIAL STATEMENTS continued FOR THE YEAR ENDED 30 JUNE 2016
26 FINANCIAL INSTRUMENTS continued
Fair value of financial instruments continued
Financial instruments measured at fair value
The financial instruments measured at fair value are measured using the following valuation methodologies.
Listed investments
The fair value of listed investments are determined by reference to published price quotations from recognised securities exchanges.
Unlisted investments
The valuations are based on the net asset values of these investments and constitute the investments’ fair value as most of the assets in these investment
companies are carried at fair value. The valuations have been compared to information available in the market regarding other market participants’ view
on the value of the underlying investment.
Financial instruments measured at amortised cost
The group applied the discounted cash flow valuation technique in the measurement of loans and receivables as well as financial liabilities measured at
amortised cost. No significant unobservable inputs are used in this measurement.
Loan to DRDSA Empowerment Trust
The fair value of the loan is not readily determinable and are therefore carried at cost.
Inter-company loans
Interest bearing: The fair value of these loans approximate its carrying amounts as the impact of credit risk is included in the measurement of carrying
amounts.
Non-interest bearing loans without any fixed repayment arrangements: The fair value of these loans are not readily determinable and are therefore
carried at cost.
Cash and cash equivalents and investments in environmental trust funds
The carrying value of cash and cash equivalents approximates their fair value due to the short-term maturity of these deposits. The carrying value of the
environmental trust funds approximate their fair value due to these investments being cash in nature.
Trade and other receivables
The fair value approximates the carrying value due to their short-term maturities.
Loans and borrowings
The loan bears interest at the three month Johannesburg Inter-bank Acceptance Rate plus a margin ranging from 4% to 5% per annum. Fair value is
calculated by reference to quoted prices for floating interest instruments.
Trade and other payables
The fair value approximates the carrying value due to their short-term maturities.
5958DRDGOLD LIMITED ANNUAL FINANCIAL STATEMENTS 2016

ANNUAL FINANCIAL STATEMENTS
Fair value hierarchy
The table below analyses financial instruments carried at fair value, by valuation method. The different levels have been defined as follows:
Level 1 Quoted prices (unadjusted) in active markets for identical assets or liabilities;
Level 2 Inputs other than quoted prices included within Level 1 that are observed for the asset or liability, either directly (i.e. as prices) or indirectly
(i.e. derived from prices);
Level 3 Inputs for the asset or liability that are not based on observed market data (unobserved inputs).
Level 1 Level 3 Total
R’000 R’000 R’000
GROUP
30 June 2016
Available-for-sale financial assets
Listed securities 8 886 – 8 886
Unlisted securities – 147 147
8 886 147 9 033
30 June 2015
Available-for-sale financial assets
Listed securities 3 226 – 3 226
Unlisted securities – 159 159
3 226 159 3 385
COMPANY
30 June 2016
Available-for-sale financial assets
Listed securities 8 886 – 8 886
Unlisted securities – 147 147
8 886 147 9 033
30 June 2015
Available-for-sale financial assets
Listed securities 3 226 – 3 226
Unlisted securities – 159 159
3 226 159 3 385
The unobservable inputs considered in the fair value measurement of Level 3 financial instruments are discussed in note 11.
59DRDGOLD LIMITED ANNUAL FINANCIAL STATEMENTS 201658

NOTES TO THE FINANCIAL STATEMENTS continued FOR THE YEAR ENDED 30 JUNE 2016
26 FINANCIAL INSTRUMENTS continued
Fair value of financial instruments continued
Fair value hierarchy continued
Reconciliation of fair value measurements in Level 2 and Level 3 during the year:
2016 2016 2015 2015
Level 2 Level 3 Level 2 Level 3
Available-for-sale financial assets R’000 R’000 R’000 R’000
GROUP
Balance at beginning of the year – 159 4 000 171
Acquired during the year – – – –
Fair value adjustment – – 2 425 –
Impairment – – (300) –
Disposed – (12) (6 125) (12)
Balance at end of year – 147 – 159
Fair value adjustment reclassified to profit or loss – – 2 625 –
Impairment recognised in profit or loss – – (300) –
Loss recognised in other comprehensive income – – (200) –
– Fair value adjustment recognised in other comprehensive income – – 2 425 –
– Fair value adjustment reclassified to profit or loss – – (2 625) –
– – 2 125 –
COMPANY
Balance at beginning of the year – 159 4 000 171
Acquired during the year – – – –
Fair value adjustment – – 2 425 –
Impairment – – (300) –
Disposed – (12) (6 125) (12)
Balance at end of year – 147 – 159
Fair value adjustment reclassified to profit or loss – – 2 625 –
Impairment recognised in profit or loss – – (300) –
Loss recognised in other comprehensive income – – (200) –
– Fair value adjustment recognised in other comprehensive income – – 2 425 –
– Fair value adjustment reclassified to profit or loss – – (2 625) –
– – 2 125 –
The gain or loss on the fair value adjustment is recognised in other comprehensive income net of deferred tax.
The available-for-sale financial assets Level 3 comprises investments in unlisted shares for which no reasonable alternative measure for fair value is
available. Therefore no sensitivity analysis has been prepared.
6160DRDGOLD LIMITED ANNUAL FINANCIAL STATEMENTS 2016

ANNUAL FINANCIAL STATEMENTS
27 CAPITAL MANAGEMENTThe primary objective of the Board in managing the group’s capital is to ensure that there is sufficient capital available to support the funding
requirements of the group, including capital expenditure, in a way that optimises the cost of capital, maximises shareholders’ returns and ensures that
the group remains in a sound financial position. There were no changes to the group’s overall capital management approach during the current year.
The group manages and makes adjustments to the capital structure as opportunities arise in the market place, as and when borrowings mature or as and
when funding is required. This may take the form of raising equity, market or bank debt or hybrids thereof.
The board monitors the return on capital, which the group defines as net operating income divided by total shareholders’ equity, excluding non-
redeemable preference shares and non-controlling interest from continued operations, and seeks to maintain a balance between the higher returns that
might be possible with higher levels of borrowings and the advantages and security afforded by a sound capital position. The board also monitors the
level of dividends to ordinary shareholders.
The group’s net liabilities and total equity, or capital, at June was as follows:
2016 2015
R’000 R’000
Total liabilities 1 079 519 973 114
Less: Cash and cash equivalents (351 796) (324 375)
Net liabilities 727 723 648 739
Total equity 1 339 556 1 529 924
GROUP COMPANY
2015 2016 2016 2015
R’000 R’000 R’000 R’000
28 RELATED PARTY TRANSACTIONS
Key management personnel remuneration
Short-term benefits
54 496 51 505 – Salaries paid 15 775 11 981
3 844 3 743 – Board fees paid 3 743 3 844
17 750 33 767 – Incentives relating to this cycle 11 327 7 259
– 1 741 – Pre-tax gain on share option excersised 210 –
7 150 – – Retrenchment payments – 2 974
83 240 90 756 31 055 26 058
Long service awards
1 753 29 874 – Share-based payment expense 9 448 247
304 349 – Post-retirement medical benefits – –
2 057 30 223 9 448 247
GROUP
The group has related party relationships with its subsidiaries and with its directors and key management personnel. Key management personnel are
those persons having authority and responsibility for planning, directing and controlling the activities of the company, directly or indirectly, including any
director (whether executive or otherwise) of the company.
Prior to the awarding of a contract to a related party for the supply of goods and services the group procurement manager reviews the pricing, quality
and the reliability of that party. The contract terms are compared to similar suppliers of goods and services to ensure that the contract is on market
related terms.
Details of prescribed officers’ emoluments are set out in note 5.
Contributions to, and the total of post-retirement medical benefits as well as long term employee incentive scheme liabilities for key management
personnel as at 30 June 2016 are disclosed in note 18.
Treasury shares held by EMO are outlined in note 16.1. Dividends amounting to R5.6 million (2015: R0.1 million) were received by EMO on these shares.
61DRDGOLD LIMITED ANNUAL FINANCIAL STATEMENTS 201660

NOTES TO THE FINANCIAL STATEMENTS continued FOR THE YEAR ENDED 30 JUNE 2016
28 RELATED PARTY TRANSACTIONS continued
Transactions with other entities in which an ownership interest is held:
GuardriskDuring the year ended 30 June 2016, Ergo paid fees to the Guardrisk Cell Captive relating to the environmental guarantees issued by Guardrisk to the
DMR as outlined in note 17 amounting to R7.8 million (2015: R9.9 million), which included a contribution of nil (2015: R0.8 million) (refer note 11).
Rand RefineryThe group has entered into an agreement with Rand Refinery Limited (“Rand Refinery“), for the refining and sale of all of its gold produced in South
Africa. Under the agreement, Rand Refinery performs the final refining of the group’s gold and casts it into troy ounce bars. Rand Refinery then sells the
gold for the London afternoon fixed price on the day the refined gold is delivered and sold. In exchange for this service, the group pays Rand Refinery a
variable refining fee plus fixed marketing, loan and administration fees. Mr Gwebu, who held the position of executive: legal, compliance and company
secretary of DRDGOLD up to 31 December 2014, was a director of Rand Refinery, a member of its Remuneration Committee and chairman of the Social
and Ethics Committee until 5 September 2014 when he resigned as director. Mr Charles Symons has been appointed to replace him as director of Rand
Refinery effective 5 September 2014. Mr Mark Burrell who is the financial director of Ergo is an alternate director of Rand Refinery and a member of
Rand Refinery’s Audit Committee.
• The group currently owns shares in Rand Refinery (which is jointly owned by South African mining companies) (refer note 11);
• Trade receivables to the amount of nil (2015: R43.0 million) relate to metals sold; and
• The group received a dividend of nil (2015: nil) from Rand Refinery.
Consultancy agreementOn 23 June 2008, EMO approved a consultancy agreement with Khumo Gold, which owned 20% of EMO at that date. The agreement provides for a
monthly retainer of R0.3 million (2015: R0.3 million) and will conclude on 31 December 2016.
Sale of sharesDuring the year ended 30 June 2015, DRDGOLD acquired the 20% and 6% interest in the issued share capital of EMO held by Khumo and the
Empowerment Trust respectively (refer note 16.2).
COMPANY
Details of director’s emoluments are set out in note 5.
Long term employee incentive scheme liabilities for key management personnel as at 30 June 2016 are disclosed in note 18.
Transactions with subsidiaries:During the year ended 30 June 2016 the company earned:
• corporate services fees from EMO amounting to nil (2015: R10.6 million);
• corporate services fees from Ergo amounting to R20.1 million (2015: nil);
• interest from EMO amounting to R26.5 million (2015: R30.7 million) and from Ergo amounting to R35.4 million (2015: R31.3 million).
Balances outstanding at 30 June 2016:
• Subsidiaries – refer to note 12;
• Loans to black empowerment entities – refer to note 11;
• Receivables from other related parties – refer to note 14;
• Cash held on behalf of black empowerment entities – refer to note 23.
29 SUBSEQUENT EVENTSThere were no significant subsequent events between the year-end reporting date of 30 June 2016 and the date of issue of these financial statements.
6362DRDGOLD LIMITED ANNUAL FINANCIAL STATEMENTS 2016

ANNUAL FINANCIAL STATEMENTS
SHAREHOLDER INFORMATION AS AT 30 JUNE 2016
No. of shareholders
% of total shareholders No. of shares
% of total issued share capital
1) Analysis of shareholdings
1 – 5 000 4 507 81.27 3 415 294 0.79
5 001 – 10 000 340 6.13 2 666 356 0.62
10 001 – 50 000 444 8.00 10 477 542 2.43
50 001 – 100 000 92 1.66 6 874 929 1.59
100 001 – 1 000 000 123 2.80 137 313 042 31.83
1 000 001 – And more 41 0.14 270 682 604 62.74
Totals 5 547 100.00 431 429 767 100.00
2) Major shareholders
(1% and more of the shares in issue)
Bank of New York 175 228 569 40.62
Khumo Gold SPV (Pty) Limited 35 000 000 8.11
BNYMSANV 18 191 596 4.22
Investec 15 638 626 3.62
Citiclient Nominees No 8 NY GW 13 745 058 3.19
Clearstream Banking S.A. luxembourg 11 080 124 2.57
DRDSA Empowerment Trust 10 500 000 2.43
Ergo Mining Operations (Pty) Limited 9 361 071 2.17
KBC Securities N.V Clients 7 586 424 1.76
Peregrine Equities (Pty) Limited 6 140 668 1.42
ABAX Investments 4 953 034 1.15
JPMC-Vanguard BBH lending account 4 836 810 1.12
State Street Bank and Trust 4 526 986 1.05
3) Shareholder spread
Non-public: 4 0.07 10 180 238 2.36
Directors 3 0.05 819 167 0.19
Subsidiary 1 0.02 9 361 071 2.17
Public 5 543 99.93 421 249 529 97.64
Totals 5 547 100.00 431 429 767 100.00
4) Distribution of shareholders
Individuals 4 969 89.58 33 640 960 7.80
Institutions and bodies corporate 578 10.42 397 788 807 92.20
Total 5 547 100.00 431 429 767 100.00
63DRDGOLD LIMITED ANNUAL FINANCIAL STATEMENTS 201662

ANNUAL FINANCIAL STATEMENTS
ADMINISTRATION AND CONTACT DETAILS
OFFICES
Registered and corporate
Off Crownwood Road
Crown Mines, 2092
Johannesburg
South Africa
(PO Box 390, Maraisburg, 1700)
South Africa
Tel: +27 (0) 11 470 2600
Fax: +27 (0) 86 524 3061
OPERATIONS
Ergo Mining Proprietary Limited
PO Box 390
Maraisburg
1700
South Africa
Tel: +27 (0) 11 742 1003
Fax: +27 (0) 11 743 1544
East Rand Proprietary Mines LimitedPO Box 2227Boksburg1460South AfricaTel: +27 (0) 11 742 1003 Fax: +27 (0) 11 743 1544
DIRECTORS
Geoffrey Campbell*
Independent Non-executive
Chairman 1, 2#
Niël Pretorius
Chief Executive Officer 3
Riaan Davel
Chief Financial Officer 3
Johan Holtzhausen
Independent Non-executive
Director 1#,2
Edmund Jeneker
Independent Non-executive
Director 1,2#,3#
James Turk**
Independent Non-executive
Director 1, 2
COMPANY SECRETARYReneiloe Masemene
INVESTOR AND MEDIA RELATIONS
South Africa and North America
James Duncan
Russell and Associates
Tel: +27 (0) 11 880 3924
Fax: +27 (0) 11 880 3788
Mobile: +27 (0) 79 336 4010
E-mail: [email protected]
United Kingdom/Europe
Phil Dexter
St James’s Corporate Services
Limited
Suite 31, Second Floor
107 Cheapside
London EC2V 6DN
United Kingdom
Tel: +44 (0) 20 7796 8644
Fax: +44 (0) 20 7796 8645
Mobile: +44 (0) 7798 634 398
E-mail: [email protected]
STOCK EXCHANGE LISTINGS
JSE
Ordinary shares
Share Code: DRD
ISIN: ZAE000058723
NYSE
ADRs
Trading Symbol: DRD
CUSIP: 26152H301
Marché Libre Paris
Ordinary shares
Share Code: MLDUR
ISIN: ZAE000058723
DRDGOLD’s ordinary shares
are listed on the Johannesburg
Stock Exchange (JSE) and on
the New York Stock Exchange
(NYSE), in the form of American
Depositary Receipts (ADRs). The
company’s shares are also traded
on the Marché Libre in Paris, the
Regulated Unofficial Market on
the Frankfurt Stock Exchange, the
Berlin and Stuttgart OTC markets.
SHARE TRANSFER SECRETARIES
South Africa
Link Market Service South Africa
Proprietary Limited
13th Floor, Rennie House
19 Ameshoff Street
Braamfontein
2001 Johannesburg
South Africa
Tel: +27 (0) 11 713 0800
Fax: +27 (0) 86 674 2450
United Kingdom
(and bearer office)
Capita Asset Services
The Registry PXS
34 Beckenham Road
Beckenham BR3 4TU
United Kingdom
Tel: +44 (0) 20 8639 3399
Fax: +44 (0) 20 8639 2487
AustraliaComputershare Investor Service Proprietary LimitedLevel 245 St George’s TerracePerth, WA 6000AustraliaTel: +61 8 9323 2000Tel: 1300 55 2949 (within Australia)Fax: +61 8 9323 2033
ADR depositary
The Bank of New York Mellon
101 Barclay Street
New York 10286
United States of America
Tel: +1 212 815 8223
Fax: +1 212 571 3050
French agents
CACEIS Corporate Trust
14 rue Rouget de Lisle
92862 Issy-les-Moulineaux
Cedex 9
France
Tel: +33 1 5530 5900
Fax: +33 1 5530 5910
GENERAL
JSE sponsor
One Capital
Auditor
KPMG Inc.
Attorneys
ENSafrica
Malan Scholes
Mendelow Jacobs
Norton Rose
Skadden, Arps, Slate, Meagher
and Flom
Bankers
Standard Bank of South Africa
Limited
ABSA Capital
Website
www.drdgold.com
* British
** American
Committee memberships
during FY2016# Denotes committee chairman
1 Member or the Audit and Risk
Committee
2 Member of the Remuneration and
Nominations Committee
3 Member of the Social and Ethics
Committee
DRDGOLD Limited(Incorporated in the Republic of South Africa)
(Registration Number: 1895/000926/06)

WWW.DRDGOLD.COM