annual fleet statistics · the light fleet is made up of cars, vans, utes, four wheel drives,...
TRANSCRIPT
Annual fleetstatistics
ISBN
: 2324-2116 (Online)
New Zealand Vehicle Fleet
1
Table of contents
2017 fleet report highlights .................................................................................................................................................. 2
Accessing the graphs and information in this report ............................................................................................................ 4
Describing the vehicle fleet.................................................................................................................................................. 4
1. Setting the scene – the vehicle fleet in context ................................................................................................................ 6
How much is the fleet growing?................................................................................................................................... 6
What are the trends in travel? ..................................................................................................................................... 7
How does the age of the New Zealand fleet compare internationally? ........................................................................ 9
Light petrol fleet fuel economy................................................................................................................................... 10
Vehicle fleet CO2 emissions ...................................................................................................................................... 10
Population increase and the light fleet ....................................................................................................................... 11
2. Composition of the fleet ................................................................................................................................................. 12
3. Vehicle travel and age ................................................................................................................................................... 23
4. Light fleet engine capacity trends .................................................................................................................................. 27
5. Vehicles entering and exiting the fleet ........................................................................................................................... 32
6. Vehicles entering the fleet ............................................................................................................................................. 36
7. Vehicles exiting the fleet ................................................................................................................................................ 39
8. The diesel fleet, diesel and petrol travel, CNG/LPG/electric vehicles ............................................................................ 43
9. How fuel-efficient is the light fleet? ................................................................................................................................ 47
10. The engine size and age of the vehicles in use ........................................................................................................... 54
11. Road freight ................................................................................................................................................................. 55
Appendix A: Comparability with other published data ....................................................................................................... 56
Appendix B: Vehicles in the fleet ....................................................................................................................................... 58
Disclaimer:
All reasonable endeavours have been made to ensure the accuracy of the information in this report. However, the information is provided without warranties of any kind including accuracy, completeness, timeliness or fitness for any particular purpose.
The Ministry of Transport excludes liability for any loss, damage or expense, direct or indirect, and however caused, whether through negligence or otherwise, resulting from any person or organisation’s use of, or reliance on, the information provided in this report.
Under the terms of the Creative Commons Attribution 4.0 International (BY) licence, this document, and the information contained within it, can be copied, distributed, adapted and otherwise used provided that:
• the Ministry of Transport is attributed as the source of the material
• the material is not misrepresented or distorted through selective use of the material
• images contained in the material are not copied
The terms of the Ministry’s Copyright and disclaimer apply.
Enquires relating to this data may be directed to the Ministry of Transport, PO Box 3175, Wellington, or by email on [email protected]
For more information about vehicles and travel check out www.transport.govt.nz/research.

New Zealand Vehicle Fleet
2
2017 fleet report highlights
Light vehicle registrations and travel Light vehicle registrations increased markedly in 2013 and have continued to grow each year since then. New vehicle registrations have set record after record, and used registrations have reached the previously record levels of 2003-2005.
The key light fleet metrics (fleet size, vehicles per capita, travel, travel per capita) are all rising.
Light fleet size
The light fleet has grown significantly since registrations first picked up in 2013.
Light vehicles per 1000 people
Vehicle ownership rates started increasing in 2012 after dropping from 2007 to 2011, and have kept on increasing. They are now at their highest ever level.
Light fleet growth rate
The rate of fleet growth in 2017 was even higher than the very high growth in 2002-2005.
Travel growth
Light fleet growth has resulted in travel growth of 6% in 2017.
Travel growth per person
The kilometres travelled per person in light vehicles has increased every year since 2013.
Travel per light vehicle
Annual travel per light vehicle has generally declined, as light vehicle numbers have increased by a greater rate than travel.
1,500,000
2,000,000
2,500,000
3,000,000
3,500,000
4,000,000
2000 2002 2004 2006 2008 2010 2012 2014 2016 550
600
650
700
750
800
850
2001 2003 2005 2007 2009 2011 2013 2015 2017
-1%
0%
1%
2%
3%
4%
5%
2001 2003 2005 2007 2009 2011 2013 2015 2017
30
35
40
45
50
2001 2003 2005 2007 2009 2011 2013 2015 2017
Bill
ion
km
7000
8000
9000
10000
2001 2003 2005 2007 2009 2011 2013 2015 201711000
12000
13000
14000
2001 2003 2005 2007 2009 2011 2013 2015 2017
New Zealand Vehicle Fleet
3
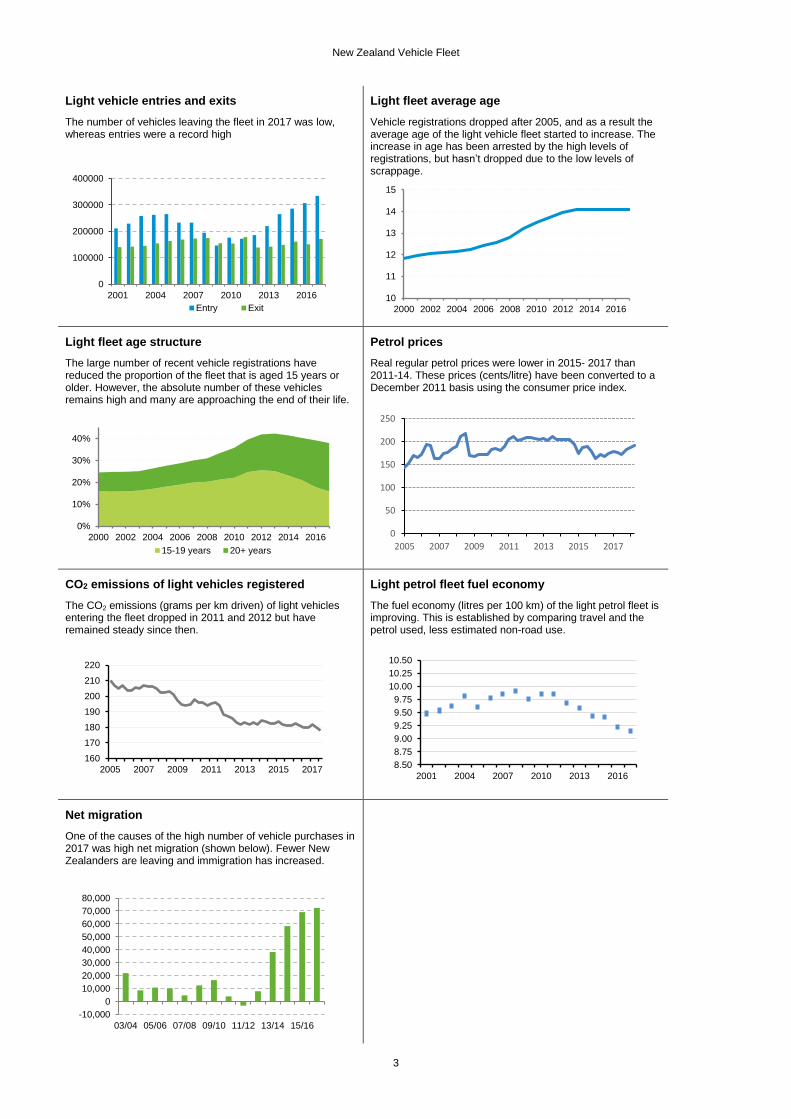
Light vehicle entries and exits
The number of vehicles leaving the fleet in 2017 was low, whereas entries were a record high
Light fleet average age
Vehicle registrations dropped after 2005, and as a result the average age of the light vehicle fleet started to increase. The increase in age has been arrested by the high levels of registrations, but hasn’t dropped due to the low levels of scrappage.
Light fleet age structure
The large number of recent vehicle registrations have reduced the proportion of the fleet that is aged 15 years or older. However, the absolute number of these vehicles remains high and many are approaching the end of their life.
Petrol prices
Real regular petrol prices were lower in 2015- 2017 than 2011-14. These prices (cents/litre) have been converted to a December 2011 basis using the consumer price index.
CO2 emissions of light vehicles registered
The CO2 emissions (grams per km driven) of light vehicles entering the fleet dropped in 2011 and 2012 but have remained steady since then.
Light petrol fleet fuel economy
The fuel economy (litres per 100 km) of the light petrol fleet is improving. This is established by comparing travel and the petrol used, less estimated non-road use.
Net migration
One of the causes of the high number of vehicle purchases in 2017 was high net migration (shown below). Fewer New Zealanders are leaving and immigration has increased.
0
100000
200000
300000
400000
2001 2004 2007 2010 2013 2016
Entry Exit10
11
12
13
14
15
2000 2002 2004 2006 2008 2010 2012 2014 2016
0%
10%
20%
30%
40%
2000 2002 2004 2006 2008 2010 2012 2014 2016
15-19 years 20+ years
0
50
100
150
200
250
2005 2007 2009 2011 2013 2015 2017
160
170
180
190
200
210
220
2005 2007 2009 2011 2013 2015 20178.50
8.75
9.00
9.25
9.50
9.75
10.00
10.25
10.50
2001 2004 2007 2010 2013 2016
-10,000
0
10,000
20,000
30,000
40,000
50,000
60,000
70,000
80,000
03/04 05/06 07/08 09/10 11/12 13/14 15/16
New Zealand Vehicle Fleet
4
Accessing the graphs and information in this report The graphs and information presented in this report, and the report itself, are available at www.transport.govt.nz/resources. A series of brief quarterly fleet reports is also available there. The Ministry has developed a set of transport Indicators, which include further information on the vehicle fleet, including some
regional breakdowns. They are available on the Transport Dashboard (https://www.transport.govt.nz/resources/transport-dashboard/).
Describing the vehicle fleet
This report is based on data from the Motor Vehicle Register (MVR). The statistics presented in this publication have been categorised differently to the traditional motor vehicle statistics produced by the New Zealand Transport Agency (NZTA)1. The objective was to produce a categorisation better suited to the estimation of fuel use and levels of emissions. Points (1) and (2) below are the significant differences.
1) Vehicle categorisation
The vehicle categories used in this report are:
Light passenger (with a gross vehicle mass (GVM) up to 3500kg)
Light commercial (with a GVM up to 3500kg)
Truck
Bus
Motorcycle
NZTA categorisation Categorisation used in this report
Passenger car/van Light passenger
Goods vans/trucks/utilities Light commercial if GVM up to 3500kg
Truck if GVM over 3500kg
Buses Light commercial if GVM up to 3500kg
Bus if GVM over 3500kg
Motor caravans Light commercial if GVM up to 3500kg
Truck if GVM over 3500kg
Motorcycles Motorcycles
Mopeds Motorcycles
2) Vehicles leaving the fleet
The second difference is in judging when a vehicle has left the fleet. Unless a vehicle owner actively de-registers it, or the vehicle has not been re-licensed for 12 months, then NZTA’s practice has been to include those vehicles in fleet statistics. This over-estimates the size of the active fleet, as some vehicles will become inactive well within the 12 months.
In this report vehicles are considered to have left the fleet when their licence expires and is not renewed within 12 months (using a probability approach) or they are cancelled, whichever comes first. This provides for better travel estimates More detailed description about these approaches can be found in Appendix A and B.
1https://www.nzta.govt.nz/resources/new-zealand-motor-vehicle-register-statistics/
New Zealand Vehicle Fleet
5
3) Travel estimation
The vehicle travel estimates in this report are derived from the odometer readings recorded when vehicles undergo inspection (warrant of fitness and certificate of fitness). These readings were first recorded in this way in 2000 and the estimates derived from them become usable from 2001 onwards.
Although the current method of collecting data generally provides accurate data, a range of matters, discussed below, mean that all figures presented are estimates and may be revised in subsequent years in light of more complete data.
The travel estimates for a year are calculated in July/August the following year, and make use of 6 months of inspections data after the end of that analysis period. This approach results in a high number of vehicles having an inspection after the end of the analysis period, but it is still a compromise.
One reason that travel estimates vary from year to year is the new longer warrant of fitness (WoF) cycles. For instance, a new vehicle that entered the fleet in August 2014 will not be inspected for three years. Therefore average travel distances for similar vehicles will be used for that vehicle until it is eventually inspected.
Other vehicles that have had a series of inspections, may not have an inspection in the six months after the analysis period. That means that their travel has to be projected to the end of the analysis period. This is more common now that many vehicles are subject to annual WoF inspections.
Eventually these vehicles are likely to undergo more inspections, and the estimated travel for the analysis period can firmed up. That is why there is a limited degree of change when estimates for previous years are republished.
It also means that similar overall annual travel estimates (for instance 39.9 billion and 40.1 billion) are best regarded as the same, as that level of difference may disappear when extra inspections lead to better estimates.
New Zealand Vehicle Fleet
6
1. Setting the scene – the vehicle fleet in context
How much is the fleet growing?
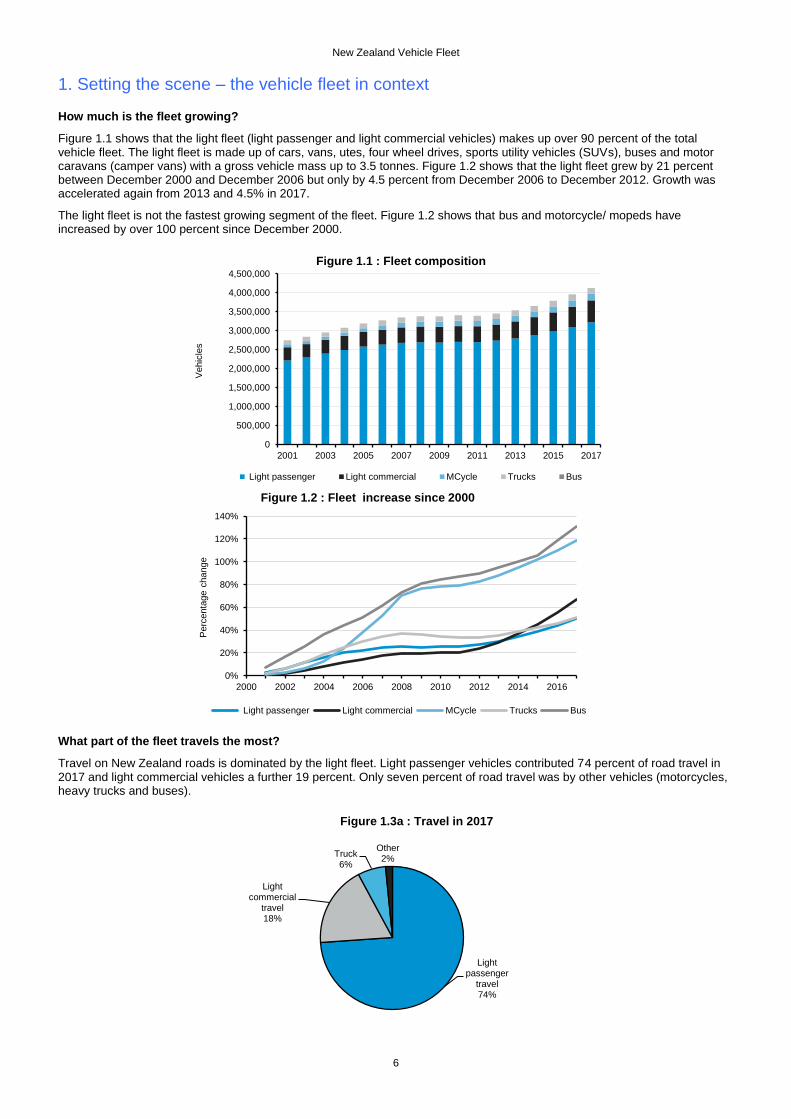
Figure 1.1 shows that the light fleet (light passenger and light commercial vehicles) makes up over 90 percent of the total vehicle fleet. The light fleet is made up of cars, vans, utes, four wheel drives, sports utility vehicles (SUVs), buses and motor caravans (camper vans) with a gross vehicle mass up to 3.5 tonnes. Figure 1.2 shows that the light fleet grew by 21 percent between December 2000 and December 2006 but only by 4.5 percent from December 2006 to December 2012. Growth was accelerated again from 2013 and 4.5% in 2017.
The light fleet is not the fastest growing segment of the fleet. Figure 1.2 shows that bus and motorcycle/ mopeds have increased by over 100 percent since December 2000.
What part of the fleet travels the most?
Travel on New Zealand roads is dominated by the light fleet. Light passenger vehicles contributed 74 percent of road travel in 2017 and light commercial vehicles a further 19 percent. Only seven percent of road travel was by other vehicles (motorcycles, heavy trucks and buses).
0
500,000
1,000,000
1,500,000
2,000,000
2,500,000
3,000,000
3,500,000
4,000,000
4,500,000
2001 2003 2005 2007 2009 2011 2013 2015 2017
Vehic
les
Figure 1.1 : Fleet composition
Light passenger Light commercial MCycle Trucks Bus
0%
20%
40%
60%
80%
100%
120%
140%
2000 2002 2004 2006 2008 2010 2012 2014 2016
Perc
enta
ge c
hange
Figure 1.2 : Fleet increase since 2000
Light passenger Light commercial MCycle Trucks Bus
Light passenger
travel74%
Light commercial
travel18%
Truck6%
Other2%
Figure 1.3a : Travel in 2017
New Zealand Vehicle Fleet
7
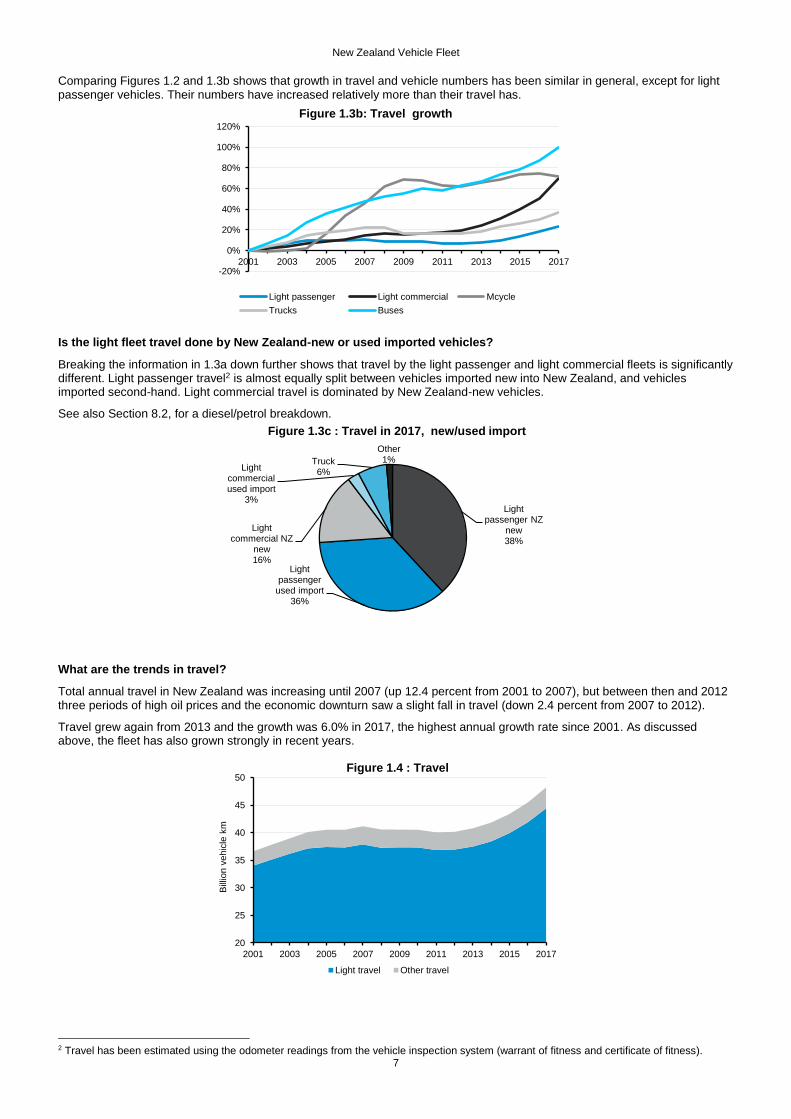
Comparing Figures 1.2 and 1.3b shows that growth in travel and vehicle numbers has been similar in general, except for light passenger vehicles. Their numbers have increased relatively more than their travel has.
Is the light fleet travel done by New Zealand-new or used imported vehicles?
Breaking the information in 1.3a down further shows that travel by the light passenger and light commercial fleets is significantly different. Light passenger travel2 is almost equally split between vehicles imported new into New Zealand, and vehicles imported second-hand. Light commercial travel is dominated by New Zealand-new vehicles.
See also Section 8.2, for a diesel/petrol breakdown.
What are the trends in travel?
Total annual travel in New Zealand was increasing until 2007 (up 12.4 percent from 2001 to 2007), but between then and 2012 three periods of high oil prices and the economic downturn saw a slight fall in travel (down 2.4 percent from 2007 to 2012).
Travel grew again from 2013 and the growth was 6.0% in 2017, the highest annual growth rate since 2001. As discussed above, the fleet has also grown strongly in recent years.
2 Travel has been estimated using the odometer readings from the vehicle inspection system (warrant of fitness and certificate of fitness).
-20%
0%
20%
40%
60%
80%
100%
120%
2001 2003 2005 2007 2009 2011 2013 2015 2017
Figure 1.3b: Travel growth
Light passenger Light commercial Mcycle
Trucks Buses
Light passenger NZ
new38%
Light passenger
used import36%
Light commercial NZ
new16%
Light commercial used import
3%
Truck6%
Other1%
Figure 1.3c : Travel in 2017, new/used import
20
25
30
35
40
45
50
2001 2003 2005 2007 2009 2011 2013 2015 2017
Bill
ion v
ehic
le k
m
Period
Figure 1.4 : Travel
Light travel Other travel
New Zealand Vehicle Fleet
8
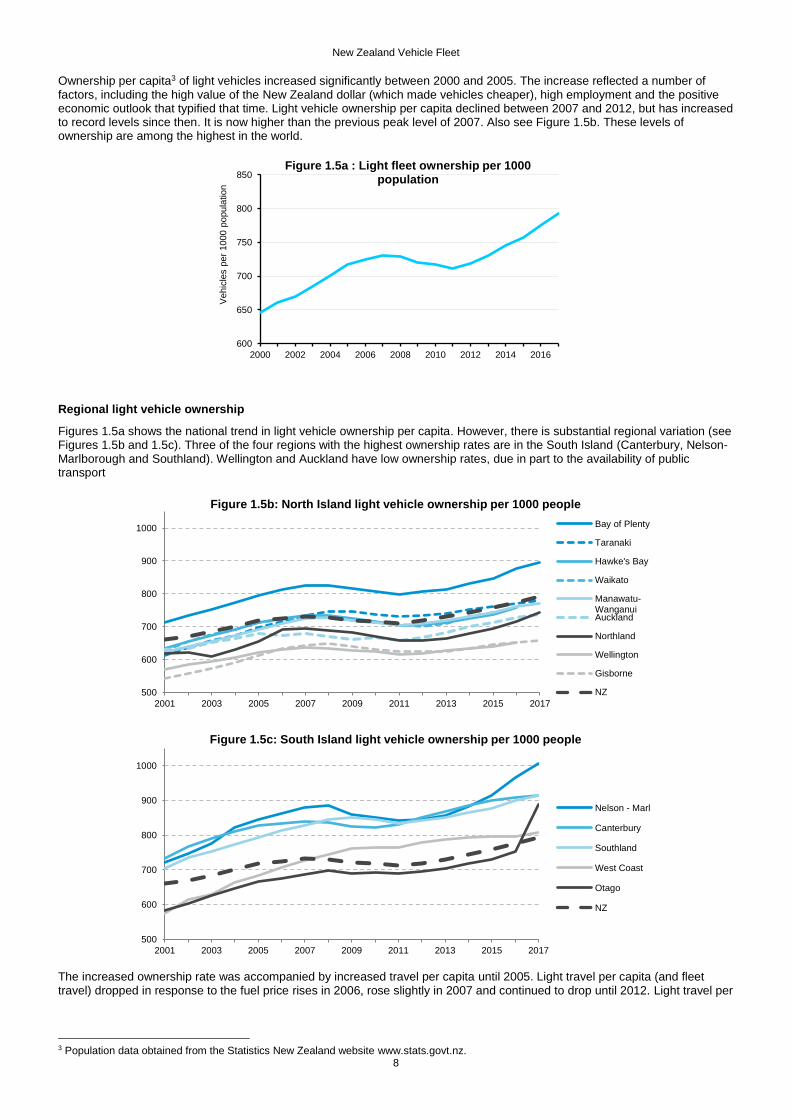
Ownership per capita3 of light vehicles increased significantly between 2000 and 2005. The increase reflected a number of factors, including the high value of the New Zealand dollar (which made vehicles cheaper), high employment and the positive economic outlook that typified that time. Light vehicle ownership per capita declined between 2007 and 2012, but has increased to record levels since then. It is now higher than the previous peak level of 2007. Also see Figure 1.5b. These levels of ownership are among the highest in the world.
Regional light vehicle ownership
Figures 1.5a shows the national trend in light vehicle ownership per capita. However, there is substantial regional variation (see Figures 1.5b and 1.5c). Three of the four regions with the highest ownership rates are in the South Island (Canterbury, Nelson-Marlborough and Southland). Wellington and Auckland have low ownership rates, due in part to the availability of public transport
The increased ownership rate was accompanied by increased travel per capita until 2005. Light travel per capita (and fleet travel) dropped in response to the fuel price rises in 2006, rose slightly in 2007 and continued to drop until 2012. Light travel per
3 Population data obtained from the Statistics New Zealand website www.stats.govt.nz.
600
650
700
750
800
850
2000 2002 2004 2006 2008 2010 2012 2014 2016
Vehic
les p
er
1000 p
opula
tion
Figure 1.5a : Light fleet ownership per 1000 population
500
600
700
800
900
1000
2001 2003 2005 2007 2009 2011 2013 2015 2017
Figure 1.5b: North Island light vehicle ownership per 1000 people
Bay of Plenty
Taranaki
Hawke's Bay
Waikato
Manawatu-WanganuiAuckland
Northland
Wellington
Gisborne
NZ
500
600
700
800
900
1000
2001 2003 2005 2007 2009 2011 2013 2015 2017
Figure 1.5c: South Island light vehicle ownership per 1000 people
Nelson - Marl
Canterbury
Southland
West Coast
Otago
NZ
New Zealand Vehicle Fleet
9
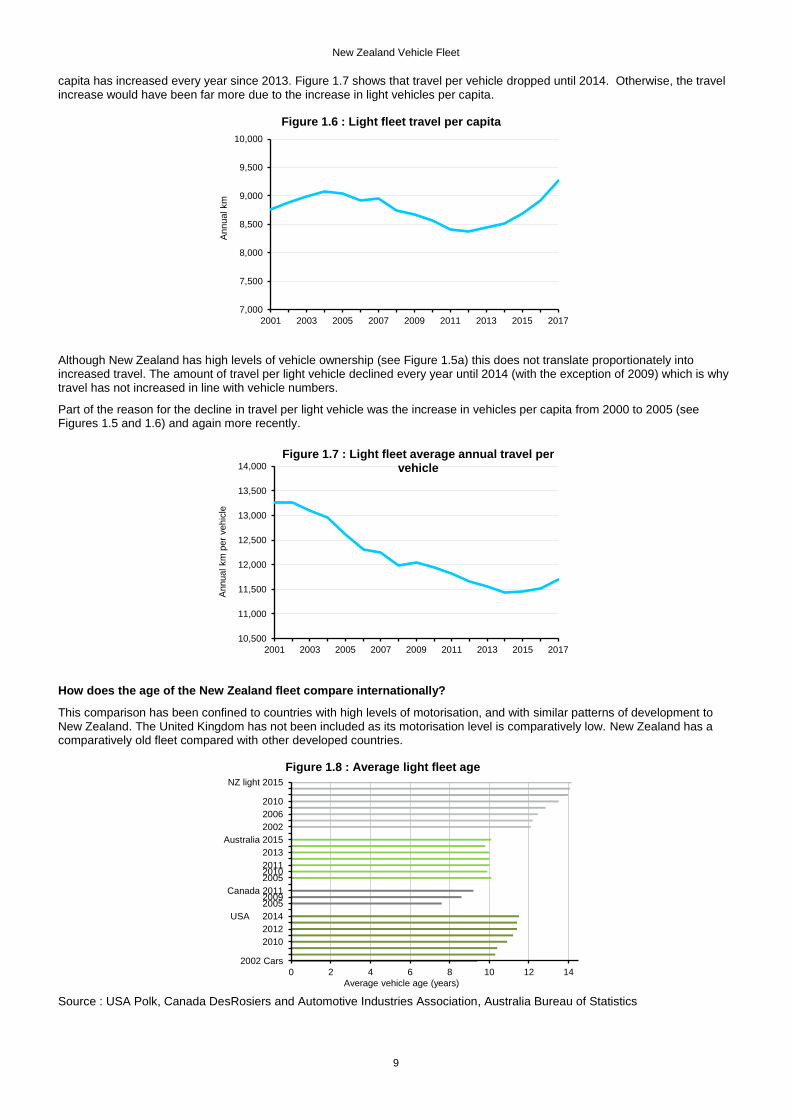
capita has increased every year since 2013. Figure 1.7 shows that travel per vehicle dropped until 2014. Otherwise, the travel increase would have been far more due to the increase in light vehicles per capita.
Although New Zealand has high levels of vehicle ownership (see Figure 1.5a) this does not translate proportionately into increased travel. The amount of travel per light vehicle declined every year until 2014 (with the exception of 2009) which is why travel has not increased in line with vehicle numbers.
Part of the reason for the decline in travel per light vehicle was the increase in vehicles per capita from 2000 to 2005 (see Figures 1.5 and 1.6) and again more recently.
How does the age of the New Zealand fleet compare internationally?
This comparison has been confined to countries with high levels of motorisation, and with similar patterns of development to New Zealand. The United Kingdom has not been included as its motorisation level is comparatively low. New Zealand has a comparatively old fleet compared with other developed countries.
Source : USA Polk, Canada DesRosiers and Automotive Industries Association, Australia Bureau of Statistics
7,000
7,500
8,000
8,500
9,000
9,500
10,000
2001 2003 2005 2007 2009 2011 2013 2015 2017
Annual km
Figure 1.6 : Light fleet travel per capita
10,500
11,000
11,500
12,000
12,500
13,000
13,500
14,000
2001 2003 2005 2007 2009 2011 2013 2015 2017
Annual km
per
vehic
le
Figure 1.7 : Light fleet average annual travel per vehicle
0 2 4 6 8 10 12 14
2002 Cars
2010
2012
USA 2014
20052009
Canada 2011
200520102011
2013
Australia 2015
2002
2006
2010
NZ light 2015
Average vehicle age (years)
Figure 1.8 : Average light fleet age
New Zealand Vehicle Fleet
10
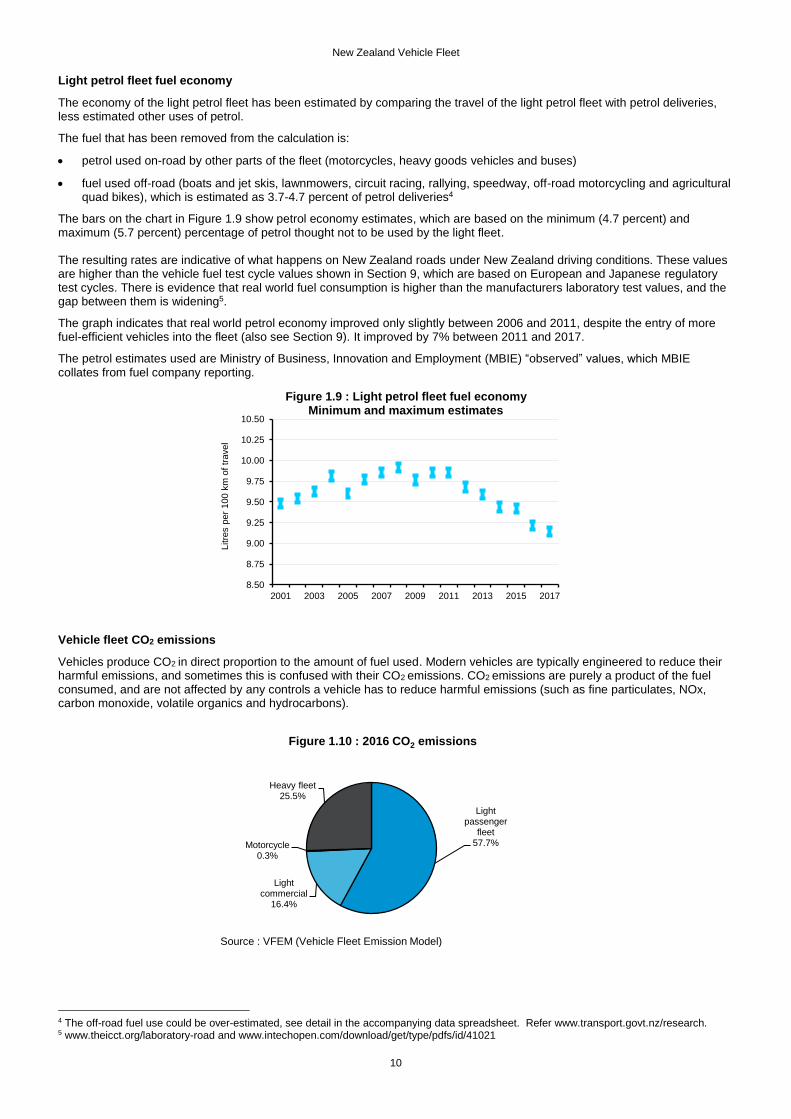
Light petrol fleet fuel economy
The economy of the light petrol fleet has been estimated by comparing the travel of the light petrol fleet with petrol deliveries, less estimated other uses of petrol.
The fuel that has been removed from the calculation is:
petrol used on-road by other parts of the fleet (motorcycles, heavy goods vehicles and buses)
fuel used off-road (boats and jet skis, lawnmowers, circuit racing, rallying, speedway, off-road motorcycling and agricultural quad bikes), which is estimated as 3.7-4.7 percent of petrol deliveries4
The bars on the chart in Figure 1.9 show petrol economy estimates, which are based on the minimum (4.7 percent) and maximum (5.7 percent) percentage of petrol thought not to be used by the light fleet. The resulting rates are indicative of what happens on New Zealand roads under New Zealand driving conditions. These values are higher than the vehicle fuel test cycle values shown in Section 9, which are based on European and Japanese regulatory test cycles. There is evidence that real world fuel consumption is higher than the manufacturers laboratory test values, and the gap between them is widening5.
The graph indicates that real world petrol economy improved only slightly between 2006 and 2011, despite the entry of more fuel-efficient vehicles into the fleet (also see Section 9). It improved by 7% between 2011 and 2017.
The petrol estimates used are Ministry of Business, Innovation and Employment (MBIE) “observed” values, which MBIE collates from fuel company reporting.
Vehicle fleet CO2 emissions
Vehicles produce CO2 in direct proportion to the amount of fuel used. Modern vehicles are typically engineered to reduce their
harmful emissions, and sometimes this is confused with their CO2 emissions. CO2 emissions are purely a product of the fuel consumed, and are not affected by any controls a vehicle has to reduce harmful emissions (such as fine particulates, NOx, carbon monoxide, volatile organics and hydrocarbons).
4 The off-road fuel use could be over-estimated, see detail in the accompanying data spreadsheet. Refer www.transport.govt.nz/research. 5 www.theicct.org/laboratory-road and www.intechopen.com/download/get/type/pdfs/id/41021
8.50
8.75
9.00
9.25
9.50
9.75
10.00
10.25
10.50
2001 2003 2005 2007 2009 2011 2013 2015 2017
Litre
s p
er
100 k
m o
f tr
avel
Figure 1.9 : Light petrol fleet fuel economyMinimum and maximum estimates
Light passenger
fleet57.7%
Light commercial
16.4%
Motorcycle0.3%
Heavy fleet25.5%
Figure 1.10 : 2016 CO2 emissions
Source : VFEM (Vehicle Fleet Emission Model)
New Zealand Vehicle Fleet
11
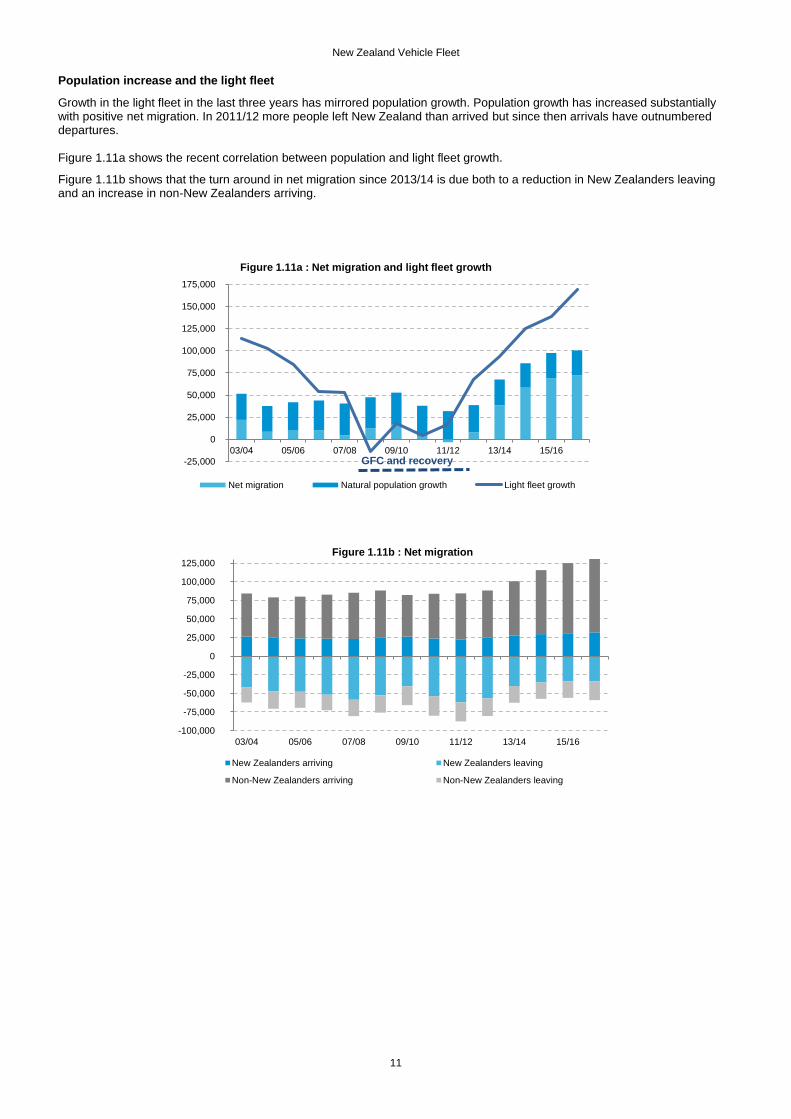
Population increase and the light fleet
Growth in the light fleet in the last three years has mirrored population growth. Population growth has increased substantially with positive net migration. In 2011/12 more people left New Zealand than arrived but since then arrivals have outnumbered departures. Figure 1.11a shows the recent correlation between population and light fleet growth.
Figure 1.11b shows that the turn around in net migration since 2013/14 is due both to a reduction in New Zealanders leaving and an increase in non-New Zealanders arriving.
-25,000
0
25,000
50,000
75,000
100,000
125,000
150,000
175,000
03/04 05/06 07/08 09/10 11/12 13/14 15/16
Figure 1.11a : Net migration and light fleet growth
Net migration Natural population growth Light fleet growth
GFC and recovery
-100,000
-75,000
-50,000
-25,000
0
25,000
50,000
75,000
100,000
125,000
03/04 05/06 07/08 09/10 11/12 13/14 15/16
Figure 1.11b : Net migration
New Zealanders arriving New Zealanders leaving
Non-New Zealanders arriving Non-New Zealanders leaving
New Zealand Vehicle Fleet
12
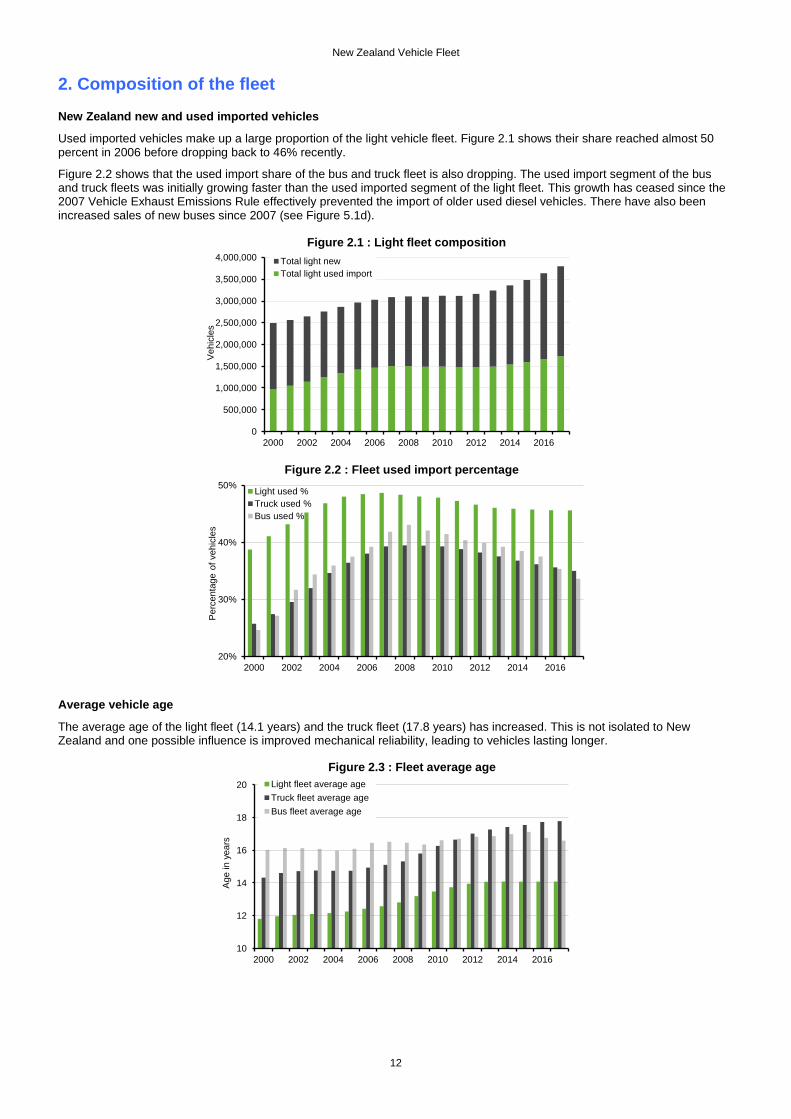
2. Composition of the fleet
New Zealand new and used imported vehicles
Used imported vehicles make up a large proportion of the light vehicle fleet. Figure 2.1 shows their share reached almost 50 percent in 2006 before dropping back to 46% recently.
Figure 2.2 shows that the used import share of the bus and truck fleet is also dropping. The used import segment of the bus and truck fleets was initially growing faster than the used imported segment of the light fleet. This growth has ceased since the 2007 Vehicle Exhaust Emissions Rule effectively prevented the import of older used diesel vehicles. There have also been increased sales of new buses since 2007 (see Figure 5.1d).
Average vehicle age
The average age of the light fleet (14.1 years) and the truck fleet (17.8 years) has increased. This is not isolated to New Zealand and one possible influence is improved mechanical reliability, leading to vehicles lasting longer.
0
500,000
1,000,000
1,500,000
2,000,000
2,500,000
3,000,000
3,500,000
4,000,000
2000 2002 2004 2006 2008 2010 2012 2014 2016
Vehic
les
Figure 2.1 : Light fleet composition
Total light new
Total light used import
20%
30%
40%
50%
2000 2002 2004 2006 2008 2010 2012 2014 2016
Perc
enta
ge o
f vehic
les
Figure 2.2 : Fleet used import percentage
Light used %
Truck used %
Bus used %
10
12
14
16
18
20
2000 2002 2004 2006 2008 2010 2012 2014 2016
Age in y
ears
Figure 2.3 : Fleet average age
Light fleet average age
Truck fleet average age
Bus fleet average age
New Zealand Vehicle Fleet
13
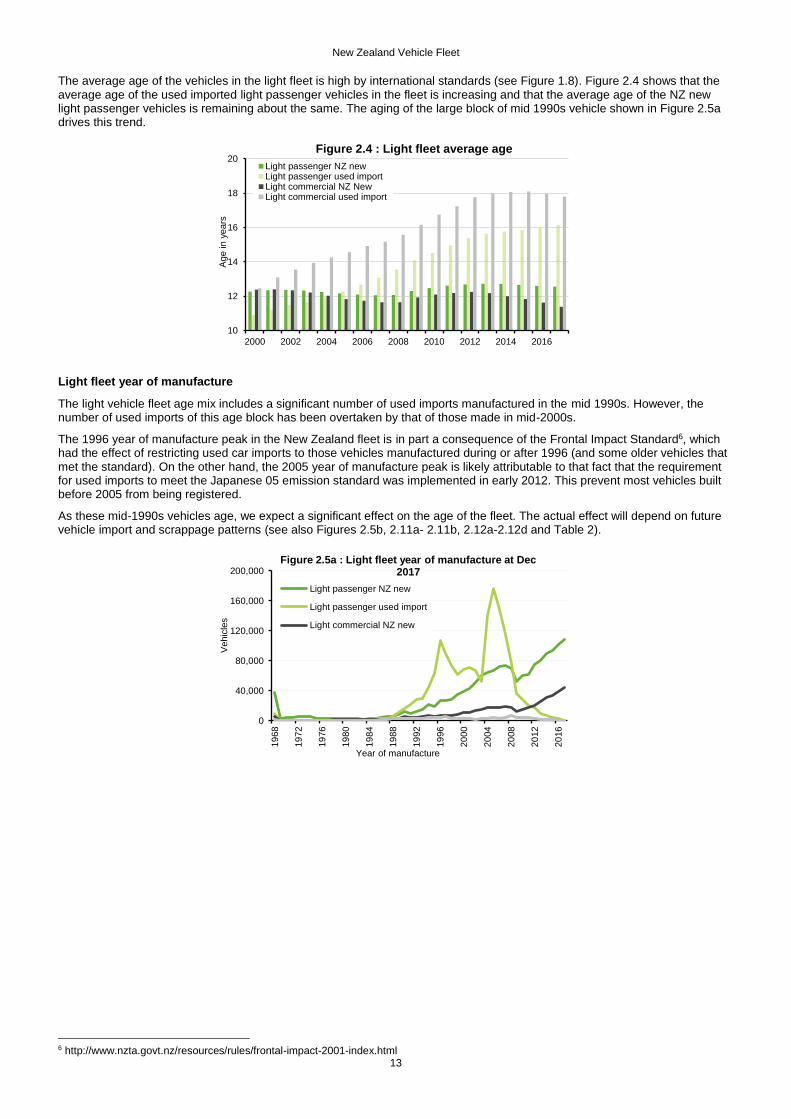
The average age of the vehicles in the light fleet is high by international standards (see Figure 1.8). Figure 2.4 shows that the average age of the used imported light passenger vehicles in the fleet is increasing and that the average age of the NZ new light passenger vehicles is remaining about the same. The aging of the large block of mid 1990s vehicle shown in Figure 2.5a drives this trend.
Light fleet year of manufacture
The light vehicle fleet age mix includes a significant number of used imports manufactured in the mid 1990s. However, the number of used imports of this age block has been overtaken by that of those made in mid-2000s.
The 1996 year of manufacture peak in the New Zealand fleet is in part a consequence of the Frontal Impact Standard6, which had the effect of restricting used car imports to those vehicles manufactured during or after 1996 (and some older vehicles that met the standard). On the other hand, the 2005 year of manufacture peak is likely attributable to that fact that the requirement for used imports to meet the Japanese 05 emission standard was implemented in early 2012. This prevent most vehicles built before 2005 from being registered.
As these mid-1990s vehicles age, we expect a significant effect on the age of the fleet. The actual effect will depend on future vehicle import and scrappage patterns (see also Figures 2.5b, 2.11a- 2.11b, 2.12a-2.12d and Table 2).
6 http://www.nzta.govt.nz/resources/rules/frontal-impact-2001-index.html
10
12
14
16
18
20
2000 2002 2004 2006 2008 2010 2012 2014 2016
Age in y
ears
Figure 2.4 : Light fleet average age
Light passenger NZ newLight passenger used importLight commercial NZ NewLight commercial used import
0
40,000
80,000
120,000
160,000
200,000
19
68
19
72
19
76
19
80
19
84
19
88
19
92
19
96
20
00
20
04
20
08
20
12
20
16
Vehic
les
Year of manufacture
Figure 2.5a : Light fleet year of manufacture at Dec 2017
Light passenger NZ new
Light passenger used import
Light commercial NZ new
New Zealand Vehicle Fleet
14
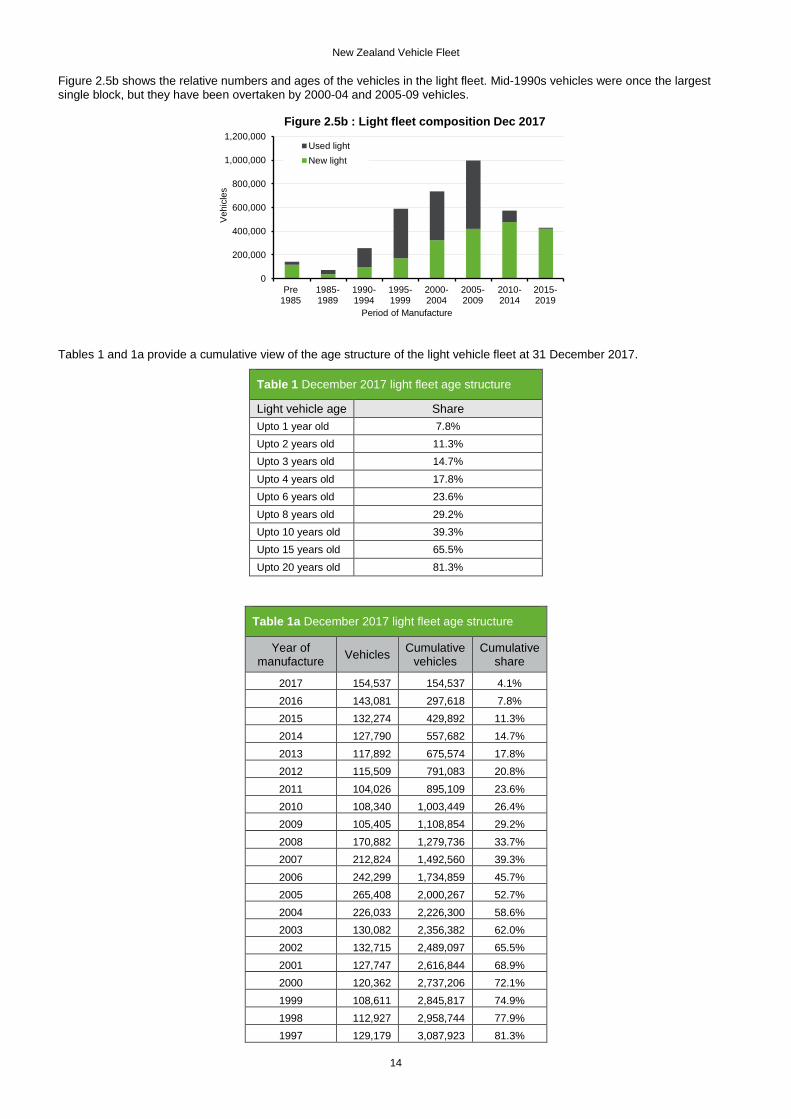
Figure 2.5b shows the relative numbers and ages of the vehicles in the light fleet. Mid-1990s vehicles were once the largest single block, but they have been overtaken by 2000-04 and 2005-09 vehicles.
Tables 1 and 1a provide a cumulative view of the age structure of the light vehicle fleet at 31 December 2017.
Table 1 December 2017 light fleet age structure
Light vehicle age Share
Upto 1 year old 7.8%
Upto 2 years old 11.3%
Upto 3 years old 14.7%
Upto 4 years old 17.8%
Upto 6 years old 23.6%
Upto 8 years old 29.2%
Upto 10 years old 39.3%
Upto 15 years old 65.5%
Upto 20 years old 81.3%
Table 1a December 2017 light fleet age structure
Year of manufacture
Vehicles Cumulative
vehicles Cumulative
share
2017 154,537 154,537 4.1%
2016 143,081 297,618 7.8%
2015 132,274 429,892 11.3%
2014 127,790 557,682 14.7%
2013 117,892 675,574 17.8%
2012 115,509 791,083 20.8%
2011 104,026 895,109 23.6%
2010 108,340 1,003,449 26.4%
2009 105,405 1,108,854 29.2%
2008 170,882 1,279,736 33.7%
2007 212,824 1,492,560 39.3%
2006 242,299 1,734,859 45.7%
2005 265,408 2,000,267 52.7%
2004 226,033 2,226,300 58.6%
2003 130,082 2,356,382 62.0%
2002 132,715 2,489,097 65.5%
2001 127,747 2,616,844 68.9%
2000 120,362 2,737,206 72.1%
1999 108,611 2,845,817 74.9%
1998 112,927 2,958,744 77.9%
1997 129,179 3,087,923 81.3%
0
200,000
400,000
600,000
800,000
1,000,000
1,200,000
Pre1985
1985-1989
1990-1994
1995-1999
2000-2004
2005-2009
2010-2014
2015-2019
Vehic
les
Period of Manufacture
Figure 2.5b : Light fleet composition Dec 2017
Used light
New light
New Zealand Vehicle Fleet
15
1996 146,188 3,234,111 85.1%
1995 92,381 3,326,492 87.6%
1994 76,981 3,403,473 89.6%
1993 53,270 3,456,743 91.0%
1992 49,328 3,506,071 92.3%
1991 39,703 3,545,774 93.3%
1990 37,699 3,583,473 94.3%
1989 25,606 3,609,079 95.0%
1988 16,081 3,625,160 95.4%
1987 11,961 3,637,121 95.7%
1986 9,860 3,646,981 96.0%
1985 8,659 3,655,640 96.2%
1984 7,135 3,662,775 96.4%
1983 5,388 3,668,163 96.6%
1982 5,310 3,673,473 96.7%
1981 4,892 3,678,365 96.8%
1980 and earlier 120,474 3,798,839 100.0%
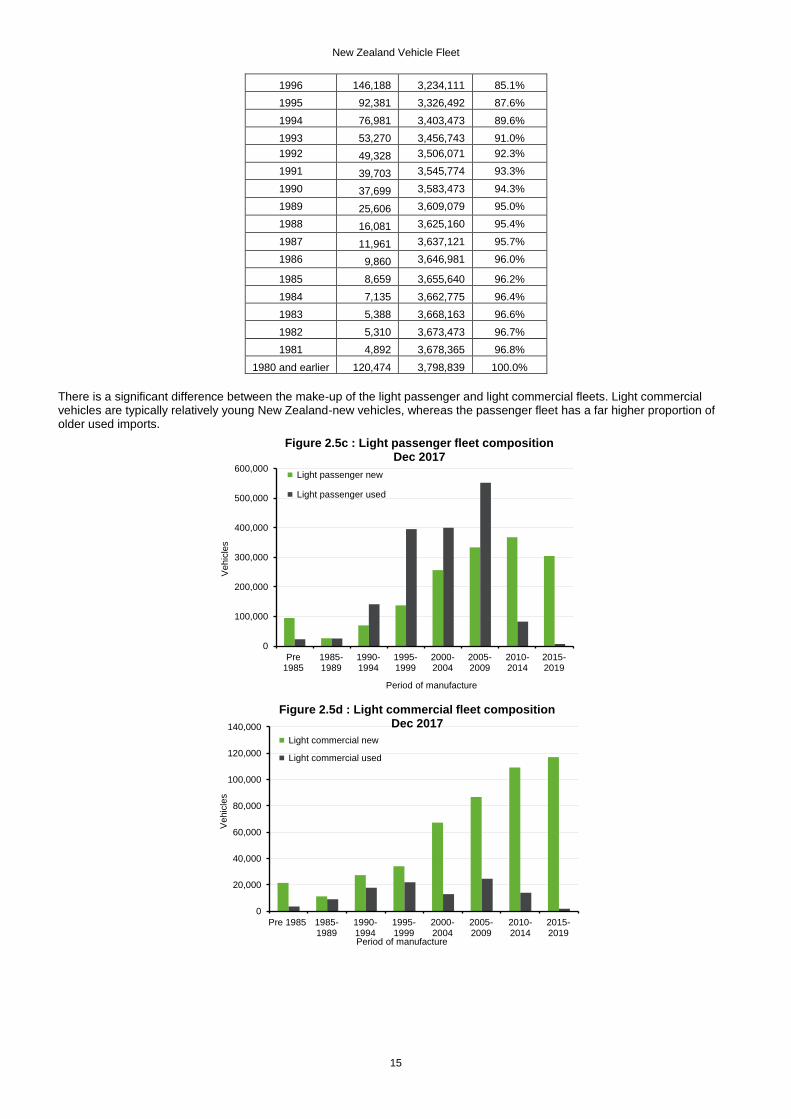
There is a significant difference between the make-up of the light passenger and light commercial fleets. Light commercial vehicles are typically relatively young New Zealand-new vehicles, whereas the passenger fleet has a far higher proportion of older used imports.
0
100,000
200,000
300,000
400,000
500,000
600,000
Pre1985
1985-1989
1990-1994
1995-1999
2000-2004
2005-2009
2010-2014
2015-2019
Vehic
les
Period of manufacture
Figure 2.5c : Light passenger fleet composition Dec 2017
Light passenger new
Light passenger used
0
20,000
40,000
60,000
80,000
100,000
120,000
140,000
Pre 1985 1985-1989
1990-1994
1995-1999
2000-2004
2005-2009
2010-2014
2015-2019
Vehic
les
Period of manufacture
Figure 2.5d : Light commercial fleet composition Dec 2017
Light commercial new
Light commercial used
New Zealand Vehicle Fleet
16
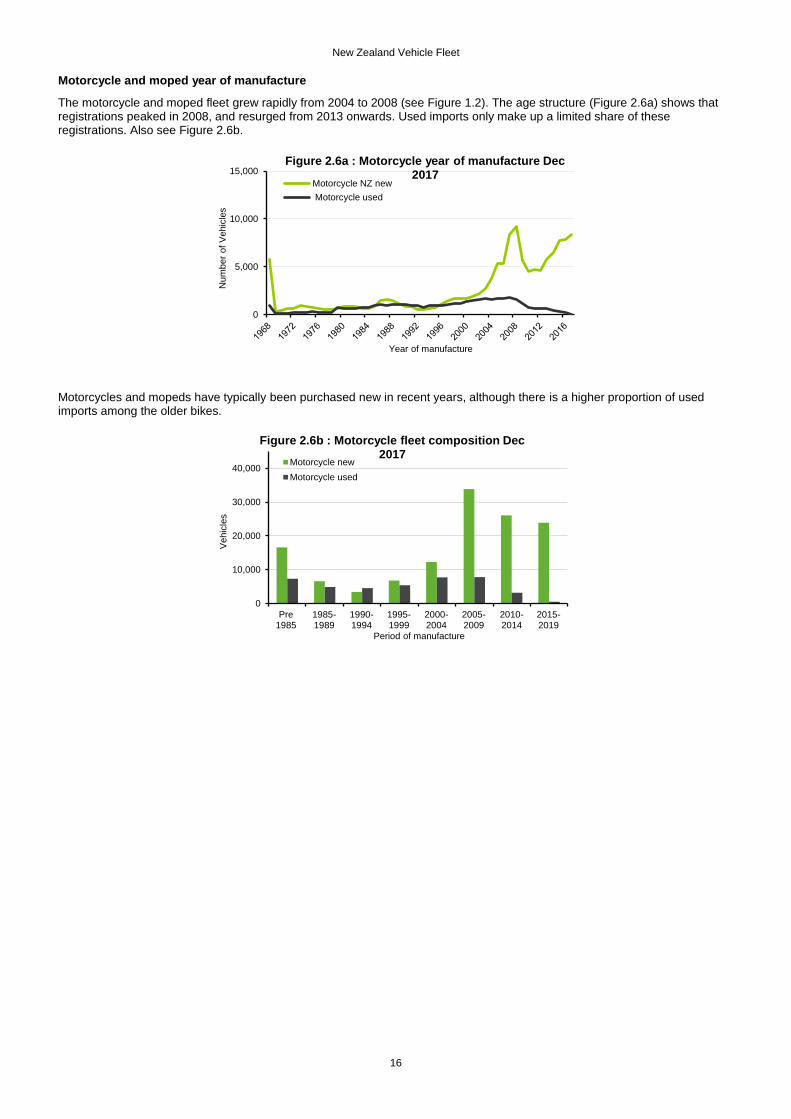
Motorcycle and moped year of manufacture
The motorcycle and moped fleet grew rapidly from 2004 to 2008 (see Figure 1.2). The age structure (Figure 2.6a) shows that registrations peaked in 2008, and resurged from 2013 onwards. Used imports only make up a limited share of these registrations. Also see Figure 2.6b.
Motorcycles and mopeds have typically been purchased new in recent years, although there is a higher proportion of used imports among the older bikes.
0
5,000
10,000
15,000
Num
ber
of
Vehic
les
Year of manufacture
Figure 2.6a : Motorcycle year of manufacture Dec 2017
Motorcycle NZ new
Motorcycle used
0
10,000
20,000
30,000
40,000
Pre1985
1985-1989
1990-1994
1995-1999
2000-2004
2005-2009
2010-2014
2015-2019
Vehic
les
Period of manufacture
Figure 2.6b : Motorcycle fleet composition Dec 2017
Motorcycle new
Motorcycle used

New Zealand Vehicle Fleet
17
Truck year of manufacture
The truck age structure (Figure 2.7a) shows large numbers of 1990s used imports in that fleet, which is a characteristic of the light fleet as well. See also Figure 2.7b.
The peaks in used vehicle models that were made in the mid-1990s reflected the effective banning of these vehicles in many Japanese cities for air quality reasons. This was achieved by a retrospective requirement for vehicles to meet more recent emission standards. Many owners chose to export their vehicles rather than fit aftermarket emission controls. Imports of used diesel trucks fell after 2005 (see Figure 5.1c). Truck registrations have increased significantly since the low point from 2009 to 2010.
0
5,000
10,000
15,000
20,000
Pre 1985 1985-1989
1990-1994
1995-1999
2000-2004
2005-2009
2010-2014
2015-2019
Vehic
les
Period of manufacture
Figure 2.7b : Truck fleet composition Dec 2017
Truck NZ new
Truck used
0
2,500
5,000
7,500
Num
ber
of
Vehic
les
Year of manufacture
Figure 2.7a : Truck year of manufacture Dec 2017
Truck NZ new
Truck used
New Zealand Vehicle Fleet
18
Bus year of manufacture
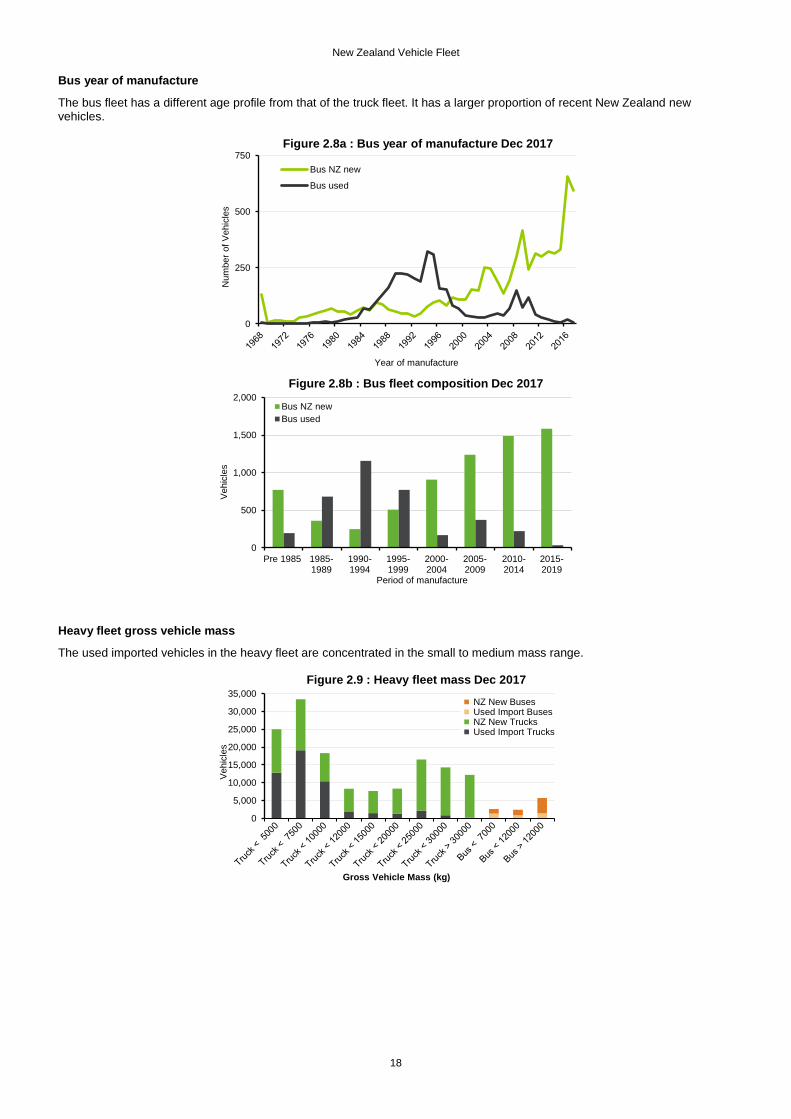
The bus fleet has a different age profile from that of the truck fleet. It has a larger proportion of recent New Zealand new vehicles.
Heavy fleet gross vehicle mass
The used imported vehicles in the heavy fleet are concentrated in the small to medium mass range.
0
250
500
750
Num
ber
of
Vehic
les
Year of manufacture
Figure 2.8a : Bus year of manufacture Dec 2017
Bus NZ new
Bus used
0
500
1,000
1,500
2,000
Pre 1985 1985-1989
1990-1994
1995-1999
2000-2004
2005-2009
2010-2014
2015-2019
Vehic
les
Period of manufacture
Figure 2.8b : Bus fleet composition Dec 2017
Bus NZ new
Bus used
0
5,000
10,000
15,000
20,000
25,000
30,000
35,000
Vehic
les
Gross Vehicle Mass (kg)
Figure 2.9 : Heavy fleet mass Dec 2017
NZ New Buses Used Import Buses NZ New Trucks Used Import Trucks
New Zealand Vehicle Fleet
19
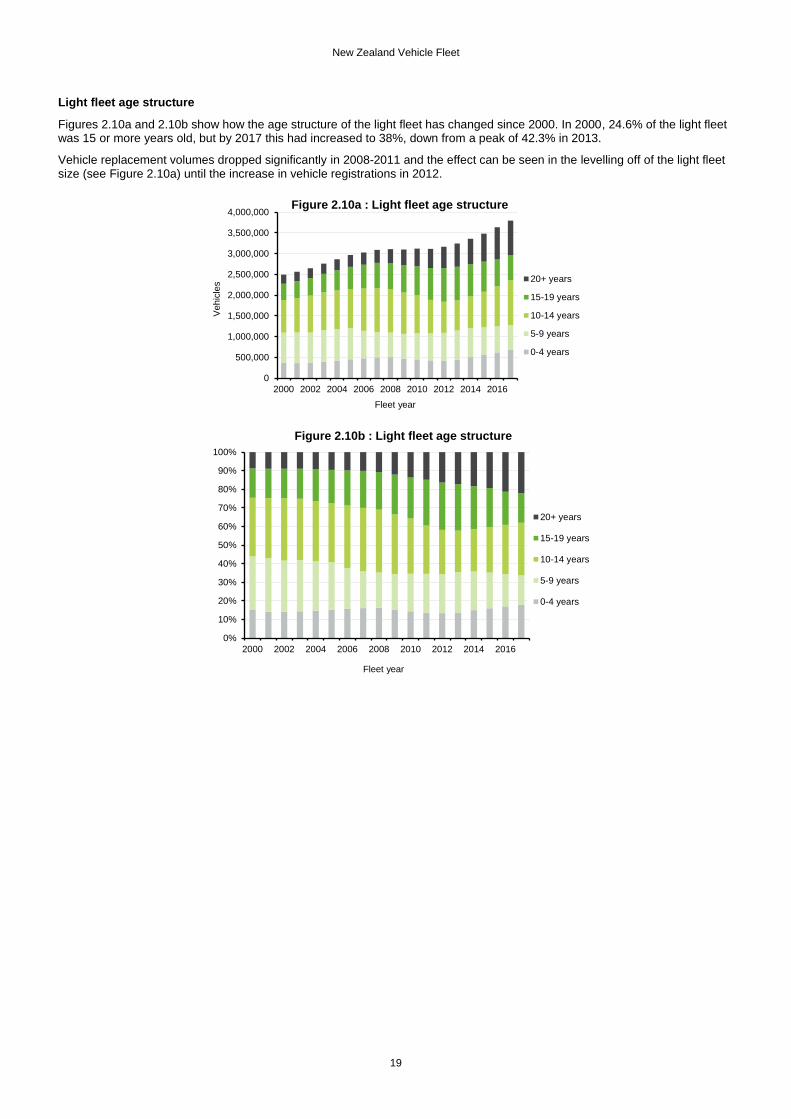
Light fleet age structure
Figures 2.10a and 2.10b show how the age structure of the light fleet has changed since 2000. In 2000, 24.6% of the light fleet was 15 or more years old, but by 2017 this had increased to 38%, down from a peak of 42.3% in 2013.
Vehicle replacement volumes dropped significantly in 2008-2011 and the effect can be seen in the levelling off of the light fleet size (see Figure 2.10a) until the increase in vehicle registrations in 2012.
0
500,000
1,000,000
1,500,000
2,000,000
2,500,000
3,000,000
3,500,000
4,000,000
2000 2002 2004 2006 2008 2010 2012 2014 2016
Vehic
les
Fleet year
Figure 2.10a : Light fleet age structure
20+ years
15-19 years
10-14 years
5-9 years
0-4 years
0%
10%
20%
30%
40%
50%
60%
70%
80%
90%
100%
2000 2002 2004 2006 2008 2010 2012 2014 2016
Fleet year
Figure 2.10b : Light fleet age structure
20+ years
15-19 years
10-14 years
5-9 years
0-4 years
New Zealand Vehicle Fleet
20
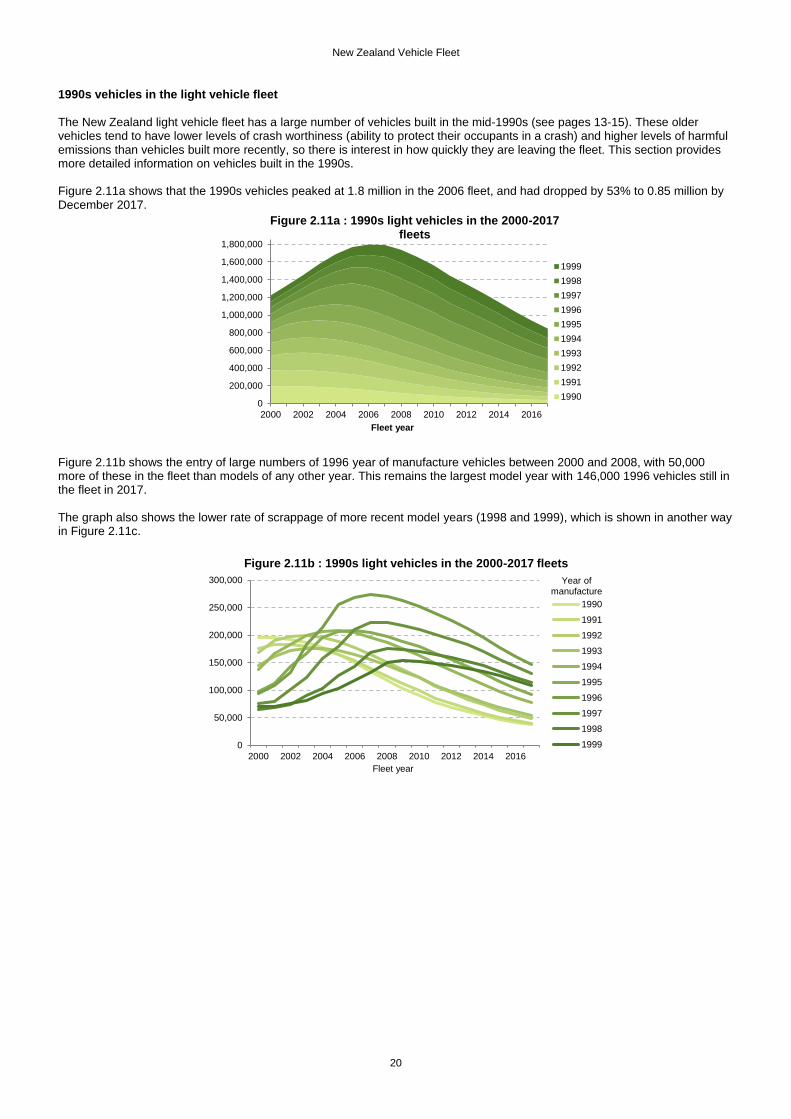
1990s vehicles in the light vehicle fleet
The New Zealand light vehicle fleet has a large number of vehicles built in the mid-1990s (see pages 13-15). These older vehicles tend to have lower levels of crash worthiness (ability to protect their occupants in a crash) and higher levels of harmful emissions than vehicles built more recently, so there is interest in how quickly they are leaving the fleet. This section provides more detailed information on vehicles built in the 1990s. Figure 2.11a shows that the 1990s vehicles peaked at 1.8 million in the 2006 fleet, and had dropped by 53% to 0.85 million by December 2017.
Figure 2.11b shows the entry of large numbers of 1996 year of manufacture vehicles between 2000 and 2008, with 50,000 more of these in the fleet than models of any other year. This remains the largest model year with 146,000 1996 vehicles still in the fleet in 2017. The graph also shows the lower rate of scrappage of more recent model years (1998 and 1999), which is shown in another way in Figure 2.11c.
0
200,000
400,000
600,000
800,000
1,000,000
1,200,000
1,400,000
1,600,000
1,800,000
2000 2002 2004 2006 2008 2010 2012 2014 2016
Fleet year
Figure 2.11a : 1990s light vehicles in the 2000-2017 fleets
1999
1998
1997
1996
1995
1994
1993
1992
1991
1990
0
50,000
100,000
150,000
200,000
250,000
300,000
2000 2002 2004 2006 2008 2010 2012 2014 2016
Fleet year
Figure 2.11b : 1990s light vehicles in the 2000-2017 fleets
1990
1991
1992
1993
1994
1995
1996
1997
1998
1999
Year of manufacture
New Zealand Vehicle Fleet
21
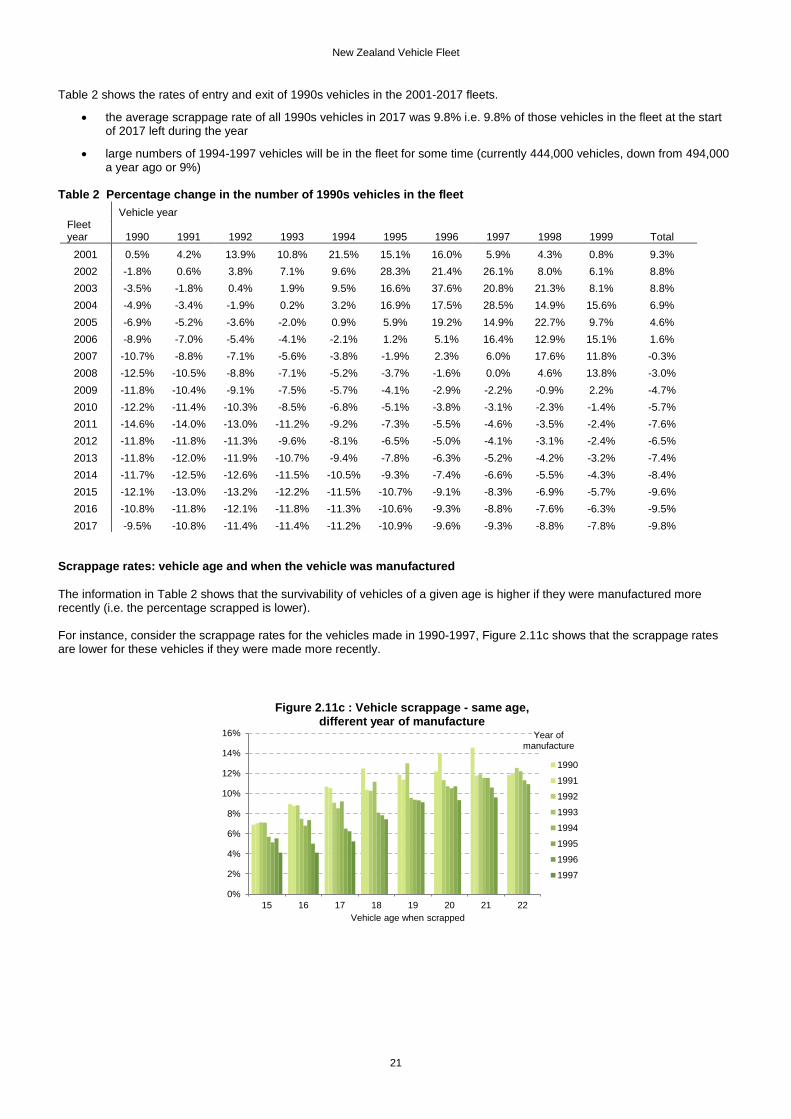
Table 2 shows the rates of entry and exit of 1990s vehicles in the 2001-2017 fleets.
the average scrappage rate of all 1990s vehicles in 2017 was 9.8% i.e. 9.8% of those vehicles in the fleet at the start of 2017 left during the year
large numbers of 1994-1997 vehicles will be in the fleet for some time (currently 444,000 vehicles, down from 494,000 a year ago or 9%)
Table 2 Percentage change in the number of 1990s vehicles in the fleet
Vehicle year Fleet year 1990 1991 1992 1993 1994 1995 1996 1997 1998 1999 Total
2001 0.5% 4.2% 13.9% 10.8% 21.5% 15.1% 16.0% 5.9% 4.3% 0.8% 9.3%
2002 -1.8% 0.6% 3.8% 7.1% 9.6% 28.3% 21.4% 26.1% 8.0% 6.1% 8.8%
2003 -3.5% -1.8% 0.4% 1.9% 9.5% 16.6% 37.6% 20.8% 21.3% 8.1% 8.8%
2004 -4.9% -3.4% -1.9% 0.2% 3.2% 16.9% 17.5% 28.5% 14.9% 15.6% 6.9%
2005 -6.9% -5.2% -3.6% -2.0% 0.9% 5.9% 19.2% 14.9% 22.7% 9.7% 4.6%
2006 -8.9% -7.0% -5.4% -4.1% -2.1% 1.2% 5.1% 16.4% 12.9% 15.1% 1.6%
2007 -10.7% -8.8% -7.1% -5.6% -3.8% -1.9% 2.3% 6.0% 17.6% 11.8% -0.3%
2008 -12.5% -10.5% -8.8% -7.1% -5.2% -3.7% -1.6% 0.0% 4.6% 13.8% -3.0%
2009 -11.8% -10.4% -9.1% -7.5% -5.7% -4.1% -2.9% -2.2% -0.9% 2.2% -4.7%
2010 -12.2% -11.4% -10.3% -8.5% -6.8% -5.1% -3.8% -3.1% -2.3% -1.4% -5.7%
2011 -14.6% -14.0% -13.0% -11.2% -9.2% -7.3% -5.5% -4.6% -3.5% -2.4% -7.6%
2012 -11.8% -11.8% -11.3% -9.6% -8.1% -6.5% -5.0% -4.1% -3.1% -2.4% -6.5%
2013 -11.8% -12.0% -11.9% -10.7% -9.4% -7.8% -6.3% -5.2% -4.2% -3.2% -7.4%
2014 -11.7% -12.5% -12.6% -11.5% -10.5% -9.3% -7.4% -6.6% -5.5% -4.3% -8.4%
2015 -12.1% -13.0% -13.2% -12.2% -11.5% -10.7% -9.1% -8.3% -6.9% -5.7% -9.6%
2016 -10.8% -11.8% -12.1% -11.8% -11.3% -10.6% -9.3% -8.8% -7.6% -6.3% -9.5%
2017 -9.5% -10.8% -11.4% -11.4% -11.2% -10.9% -9.6% -9.3% -8.8% -7.8% -9.8%
Scrappage rates: vehicle age and when the vehicle was manufactured
The information in Table 2 shows that the survivability of vehicles of a given age is higher if they were manufactured more recently (i.e. the percentage scrapped is lower). For instance, consider the scrappage rates for the vehicles made in 1990-1997, Figure 2.11c shows that the scrappage rates are lower for these vehicles if they were made more recently.
0%
2%
4%
6%
8%
10%
12%
14%
16%
15 16 17 18 19 20 21 22
Vehicle age when scrapped
Figure 2.11c : Vehicle scrappage - same age, different year of manufacture
1990
1991
1992
1993
1994
1995
1996
1997
Year of manufacture
New Zealand Vehicle Fleet
22
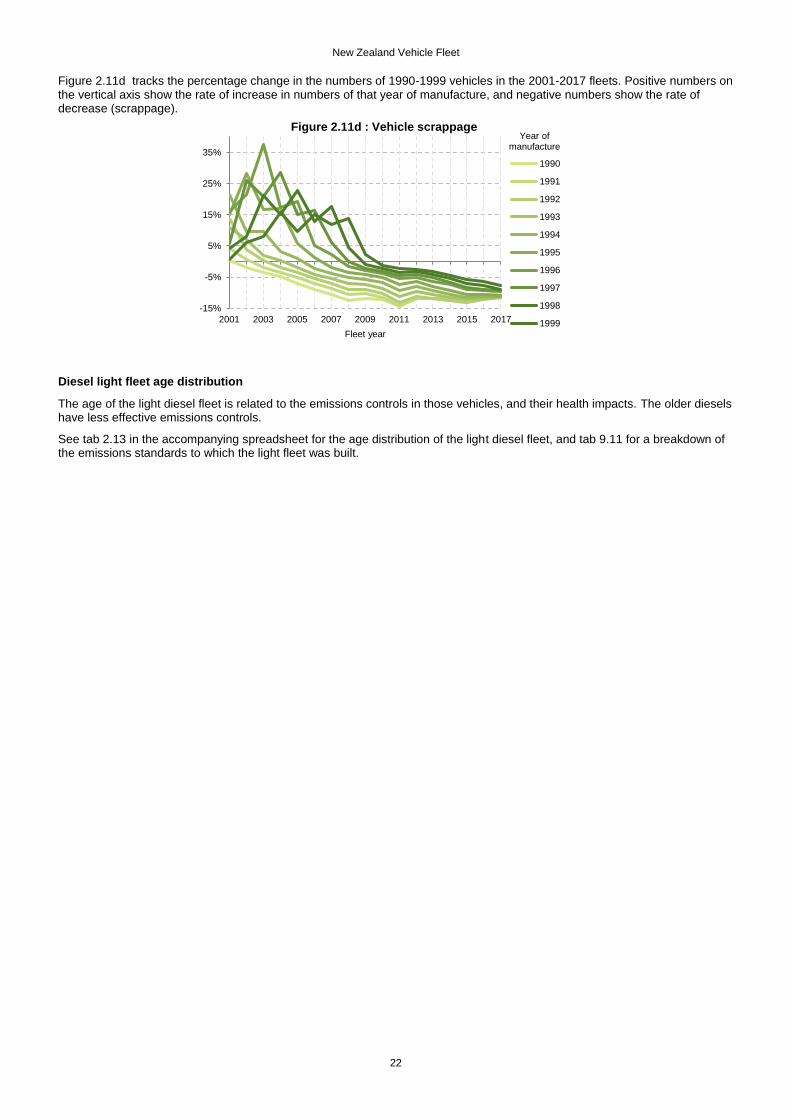
Figure 2.11d tracks the percentage change in the numbers of 1990-1999 vehicles in the 2001-2017 fleets. Positive numbers on the vertical axis show the rate of increase in numbers of that year of manufacture, and negative numbers show the rate of decrease (scrappage).
Diesel light fleet age distribution
The age of the light diesel fleet is related to the emissions controls in those vehicles, and their health impacts. The older diesels have less effective emissions controls.
See tab 2.13 in the accompanying spreadsheet for the age distribution of the light diesel fleet, and tab 9.11 for a breakdown of the emissions standards to which the light fleet was built.
-15%
-5%
5%
15%
25%
35%
2001 2003 2005 2007 2009 2011 2013 2015 2017
Fleet year
Figure 2.11d : Vehicle scrappage
1990
1991
1992
1993
1994
1995
1996
1997
1998
1999
Year of manufacture
New Zealand Vehicle Fleet
23
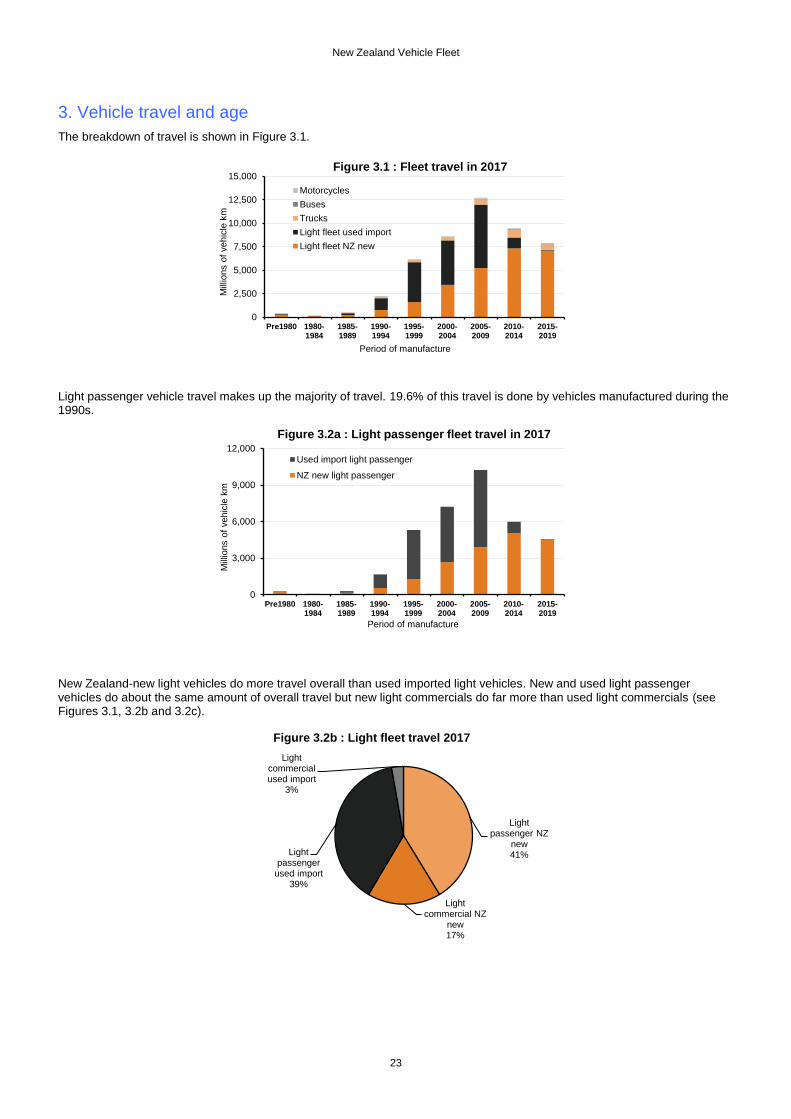
3. Vehicle travel and age
The breakdown of travel is shown in Figure 3.1.
Light passenger vehicle travel makes up the majority of travel. 19.6% of this travel is done by vehicles manufactured during the 1990s.
New Zealand-new light vehicles do more travel overall than used imported light vehicles. New and used light passenger vehicles do about the same amount of overall travel but new light commercials do far more than used light commercials (see Figures 3.1, 3.2b and 3.2c).
0
2,500
5,000
7,500
10,000
12,500
15,000
Pre1980 1980-1984
1985-1989
1990-1994
1995-1999
2000-2004
2005-2009
2010-2014
2015-2019
Mill
ions o
f vehic
le k
m
Period of manufacture
Figure 3.1 : Fleet travel in 2017
Motorcycles
Buses
Trucks
Light fleet used import
Light fleet NZ new
0
3,000
6,000
9,000
12,000
Pre1980 1980-1984
1985-1989
1990-1994
1995-1999
2000-2004
2005-2009
2010-2014
2015-2019
Mill
ions o
f vehic
le k
m
Period of manufacture
Figure 3.2a : Light passenger fleet travel in 2017
Used import light passenger
NZ new light passenger
Light passenger NZ
new41%
Light commercial NZ
new17%
Light passenger
used import39%
Light commercial used import
3%
Figure 3.2b : Light fleet travel 2017
New Zealand Vehicle Fleet
24
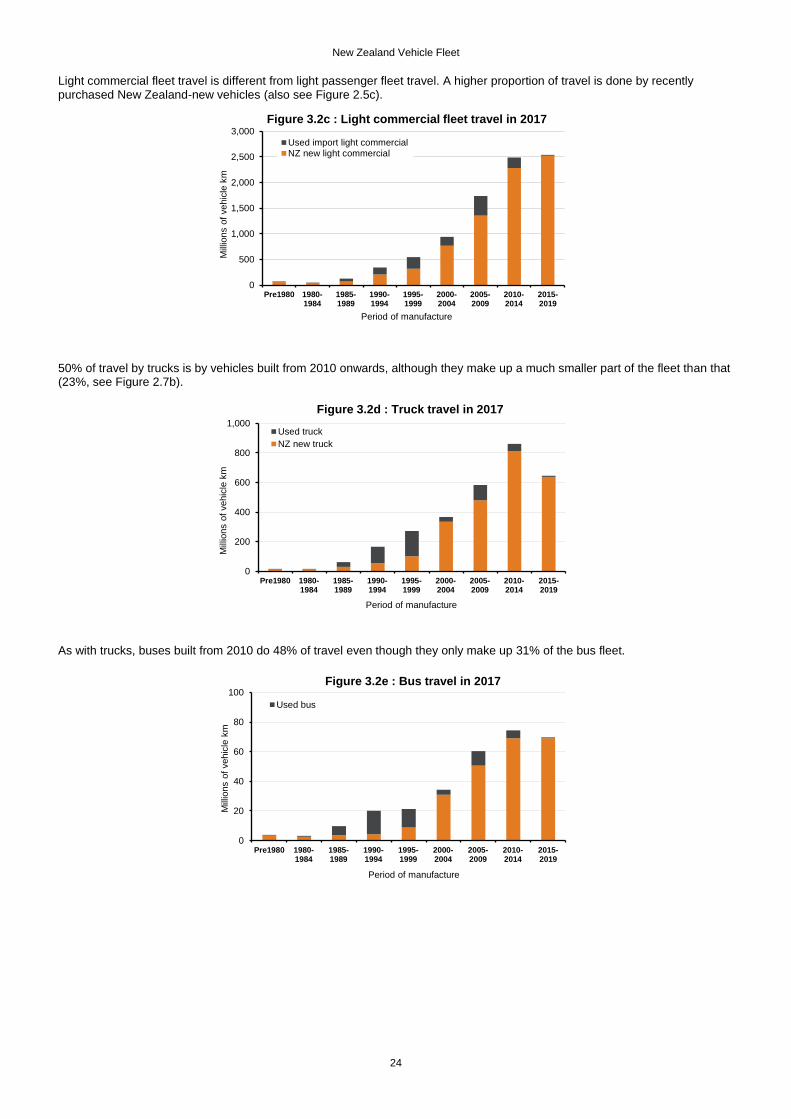
Light commercial fleet travel is different from light passenger fleet travel. A higher proportion of travel is done by recently purchased New Zealand-new vehicles (also see Figure 2.5c).
50% of travel by trucks is by vehicles built from 2010 onwards, although they make up a much smaller part of the fleet than that (23%, see Figure 2.7b).
As with trucks, buses built from 2010 do 48% of travel even though they only make up 31% of the bus fleet.
0
500
1,000
1,500
2,000
2,500
3,000
Pre1980 1980-1984
1985-1989
1990-1994
1995-1999
2000-2004
2005-2009
2010-2014
2015-2019
Mill
ions o
f vehic
le k
m
Period of manufacture
Figure 3.2c : Light commercial fleet travel in 2017
Used import light commercialNZ new light commercial
0
200
400
600
800
1,000
Pre1980 1980-1984
1985-1989
1990-1994
1995-1999
2000-2004
2005-2009
2010-2014
2015-2019
Mill
ions o
f vehic
le k
m
Period of manufacture
Figure 3.2d : Truck travel in 2017
Used truck
NZ new truck
0
20
40
60
80
100
Pre1980 1980-1984
1985-1989
1990-1994
1995-1999
2000-2004
2005-2009
2010-2014
2015-2019
Mill
ions o
f vehic
le k
m
Period of manufacture
Figure 3.2e : Bus travel in 2017
Used bus
New Zealand Vehicle Fleet
25
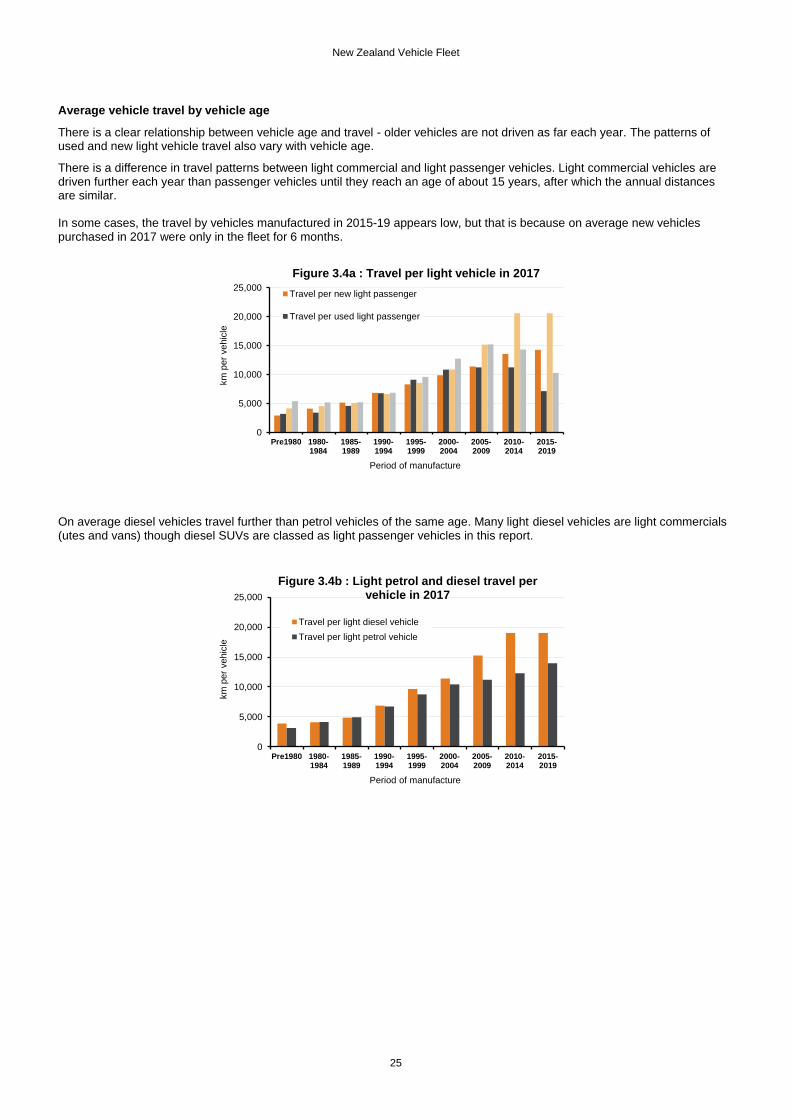
Average vehicle travel by vehicle age
There is a clear relationship between vehicle age and travel - older vehicles are not driven as far each year. The patterns of used and new light vehicle travel also vary with vehicle age.
There is a difference in travel patterns between light commercial and light passenger vehicles. Light commercial vehicles are driven further each year than passenger vehicles until they reach an age of about 15 years, after which the annual distances are similar. In some cases, the travel by vehicles manufactured in 2015-19 appears low, but that is because on average new vehicles purchased in 2017 were only in the fleet for 6 months.
On average diesel vehicles travel further than petrol vehicles of the same age. Many light diesel vehicles are light commercials (utes and vans) though diesel SUVs are classed as light passenger vehicles in this report.
0
5,000
10,000
15,000
20,000
25,000
Pre1980 1980-1984
1985-1989
1990-1994
1995-1999
2000-2004
2005-2009
2010-2014
2015-2019
km
per
vehic
le
Period of manufacture
Figure 3.4a : Travel per light vehicle in 2017
Travel per new light passenger
Travel per used light passenger
0
5,000
10,000
15,000
20,000
25,000
Pre1980 1980-1984
1985-1989
1990-1994
1995-1999
2000-2004
2005-2009
2010-2014
2015-2019
km
per
vehic
le
Period of manufacture
Figure 3.4b : Light petrol and diesel travel per vehicle in 2017
Travel per light diesel vehicle
Travel per light petrol vehicle
New Zealand Vehicle Fleet
26
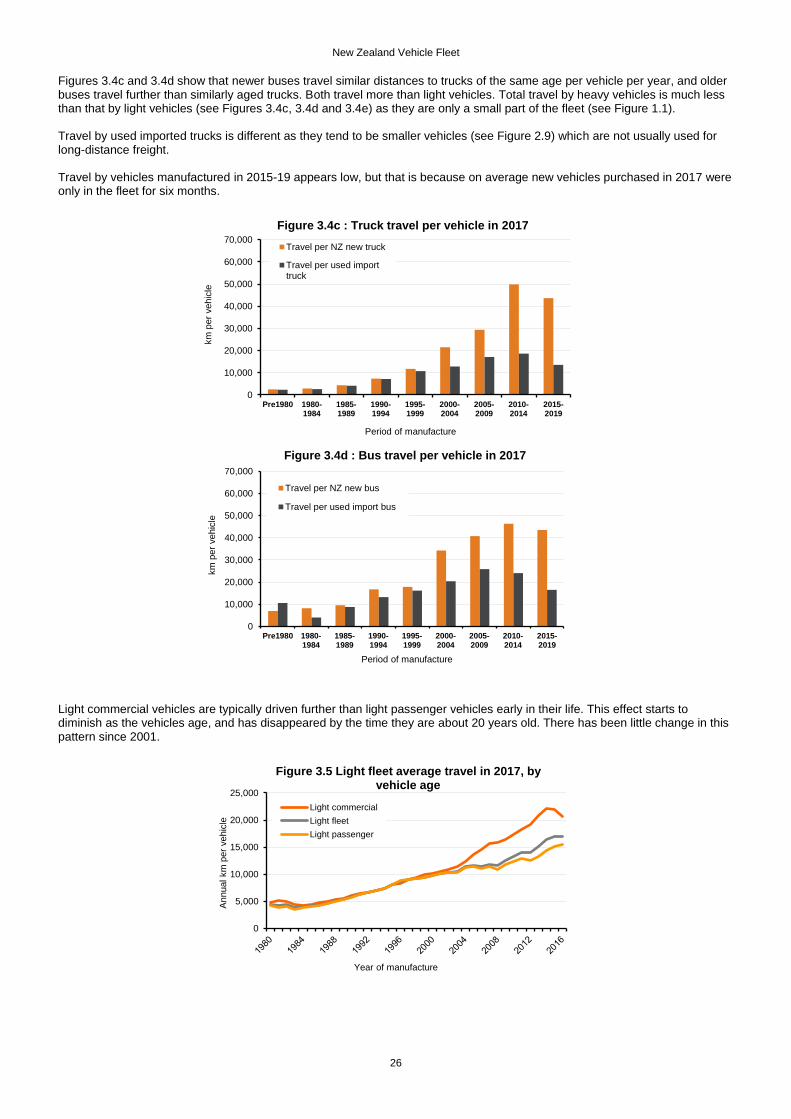
Figures 3.4c and 3.4d show that newer buses travel similar distances to trucks of the same age per vehicle per year, and older buses travel further than similarly aged trucks. Both travel more than light vehicles. Total travel by heavy vehicles is much less than that by light vehicles (see Figures 3.4c, 3.4d and 3.4e) as they are only a small part of the fleet (see Figure 1.1). Travel by used imported trucks is different as they tend to be smaller vehicles (see Figure 2.9) which are not usually used for long-distance freight. Travel by vehicles manufactured in 2015-19 appears low, but that is because on average new vehicles purchased in 2017 were only in the fleet for six months.
Light commercial vehicles are typically driven further than light passenger vehicles early in their life. This effect starts to diminish as the vehicles age, and has disappeared by the time they are about 20 years old. There has been little change in this pattern since 2001.
0
10,000
20,000
30,000
40,000
50,000
60,000
70,000
Pre1980 1980-1984
1985-1989
1990-1994
1995-1999
2000-2004
2005-2009
2010-2014
2015-2019
km
per
vehic
le
Period of manufacture
Figure 3.4c : Truck travel per vehicle in 2017
Travel per NZ new truck
Travel per used importtruck
0
10,000
20,000
30,000
40,000
50,000
60,000
70,000
Pre1980 1980-1984
1985-1989
1990-1994
1995-1999
2000-2004
2005-2009
2010-2014
2015-2019
km
per
vehic
le
Period of manufacture
Figure 3.4d : Bus travel per vehicle in 2017
Travel per NZ new bus
Travel per used import bus
0
5,000
10,000
15,000
20,000
25,000
Annual km
per
vehic
le
Year of manufacture
Figure 3.5 Light fleet average travel in 2017, by vehicle age
Light commercial
Light fleet
Light passenger
New Zealand Vehicle Fleet
27
4. Light fleet engine capacity trends
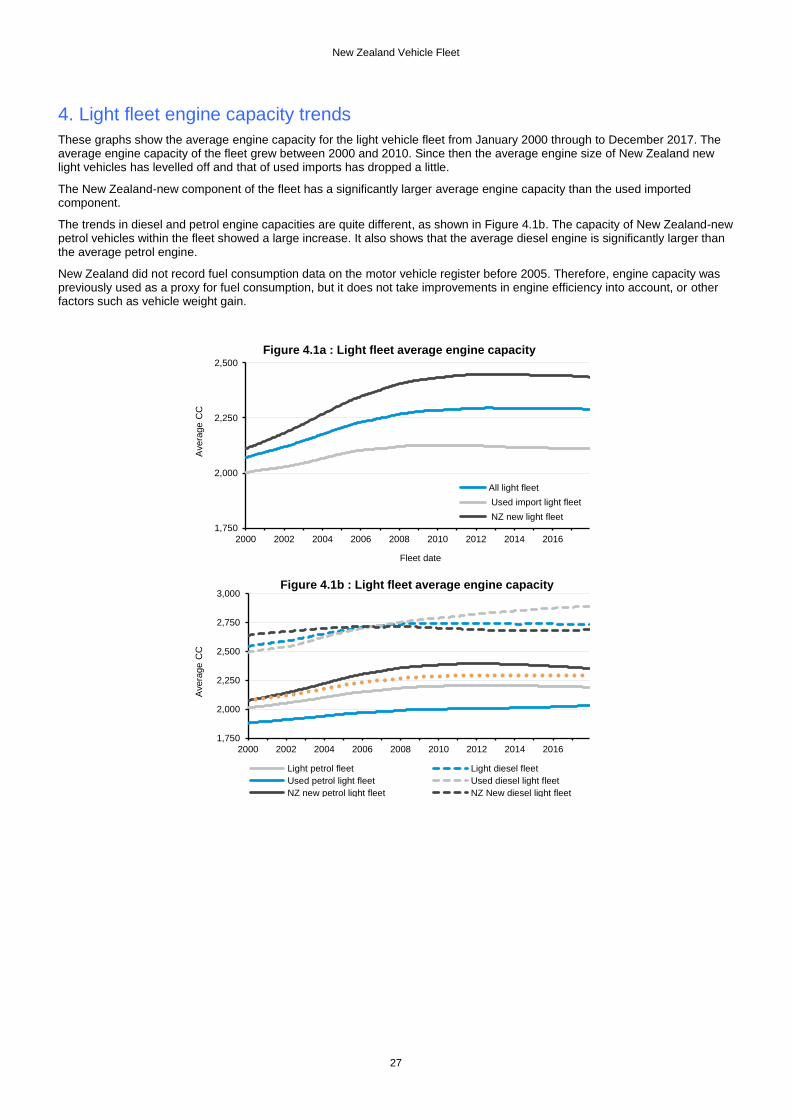
These graphs show the average engine capacity for the light vehicle fleet from January 2000 through to December 2017. The average engine capacity of the fleet grew between 2000 and 2010. Since then the average engine size of New Zealand new light vehicles has levelled off and that of used imports has dropped a little.
The New Zealand-new component of the fleet has a significantly larger average engine capacity than the used imported component.
The trends in diesel and petrol engine capacities are quite different, as shown in Figure 4.1b. The capacity of New Zealand-new petrol vehicles within the fleet showed a large increase. It also shows that the average diesel engine is significantly larger than the average petrol engine.
New Zealand did not record fuel consumption data on the motor vehicle register before 2005. Therefore, engine capacity was previously used as a proxy for fuel consumption, but it does not take improvements in engine efficiency into account, or other factors such as vehicle weight gain.
1,750
2,000
2,250
2,500
2000 2002 2004 2006 2008 2010 2012 2014 2016
Avera
ge C
C
Fleet date
Figure 4.1a : Light fleet average engine capacity
All light fleet
Used import light fleet
NZ new light fleet
1,750
2,000
2,250
2,500
2,750
3,000
2000 2002 2004 2006 2008 2010 2012 2014 2016
Avera
ge C
C
Figure 4.1b : Light fleet average engine capacity
Light petrol fleet Light diesel fleet
Used petrol light fleet Used diesel light fleet
NZ new petrol light fleet NZ New diesel light fleet
Light fleet average
New Zealand Vehicle Fleet
28
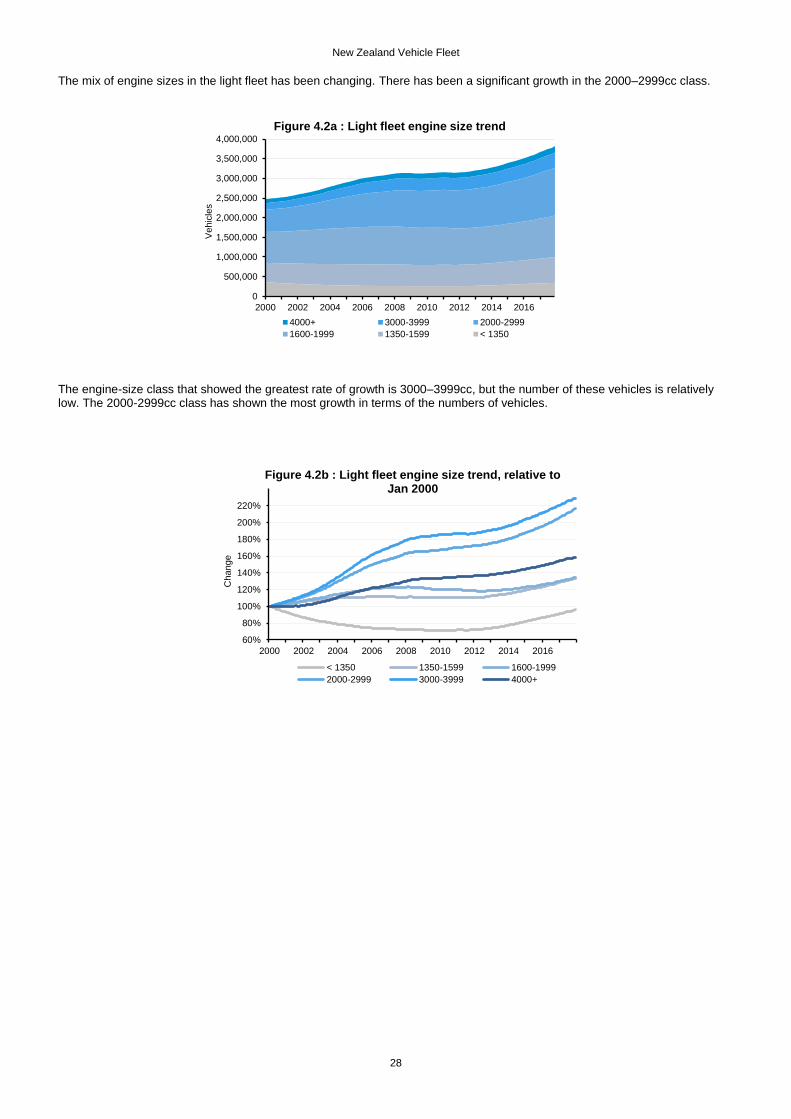
The mix of engine sizes in the light fleet has been changing. There has been a significant growth in the 2000–2999cc class.
The engine-size class that showed the greatest rate of growth is 3000–3999cc, but the number of these vehicles is relatively low. The 2000-2999cc class has shown the most growth in terms of the numbers of vehicles.
0
500,000
1,000,000
1,500,000
2,000,000
2,500,000
3,000,000
3,500,000
4,000,000
2000 2002 2004 2006 2008 2010 2012 2014 2016
Vehic
les
Figure 4.2a : Light fleet engine size trend
4000+ 3000-3999 2000-2999
1600-1999 1350-1599 < 1350
60%
80%
100%
120%
140%
160%
180%
200%
220%
2000 2002 2004 2006 2008 2010 2012 2014 2016
Change
Figure 4.2b : Light fleet engine size trend, relative to Jan 2000
< 1350 1350-1599 1600-1999
2000-2999 3000-3999 4000+
New Zealand Vehicle Fleet
29
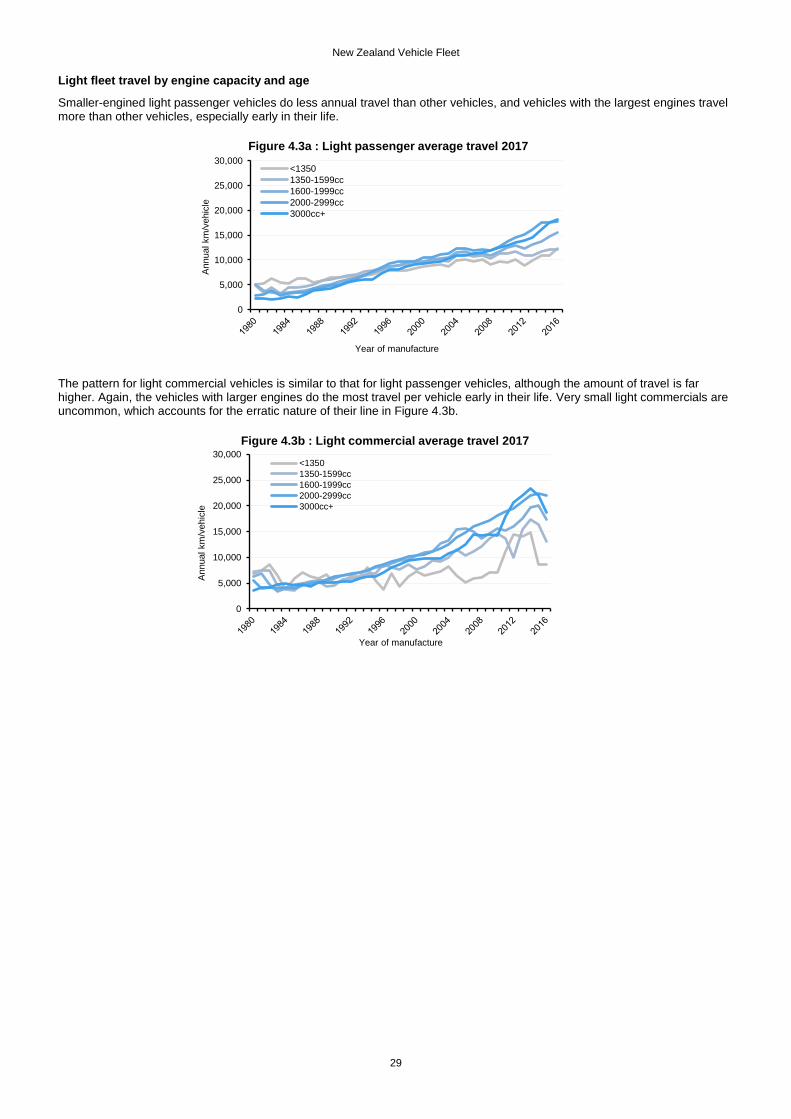
Light fleet travel by engine capacity and age
Smaller-engined light passenger vehicles do less annual travel than other vehicles, and vehicles with the largest engines travel more than other vehicles, especially early in their life.
The pattern for light commercial vehicles is similar to that for light passenger vehicles, although the amount of travel is far higher. Again, the vehicles with larger engines do the most travel per vehicle early in their life. Very small light commercials are uncommon, which accounts for the erratic nature of their line in Figure 4.3b.
0
5,000
10,000
15,000
20,000
25,000
30,000
Annual km
/vehic
le
Year of manufacture
Figure 4.3a : Light passenger average travel 2017
<1350
1350-1599cc
1600-1999cc
2000-2999cc
3000cc+
0
5,000
10,000
15,000
20,000
25,000
30,000
Annual km
/vehic
le
Year of manufacture
Figure 4.3b : Light commercial average travel 2017
<1350
1350-1599cc
1600-1999cc
2000-2999cc
3000cc+
New Zealand Vehicle Fleet
30
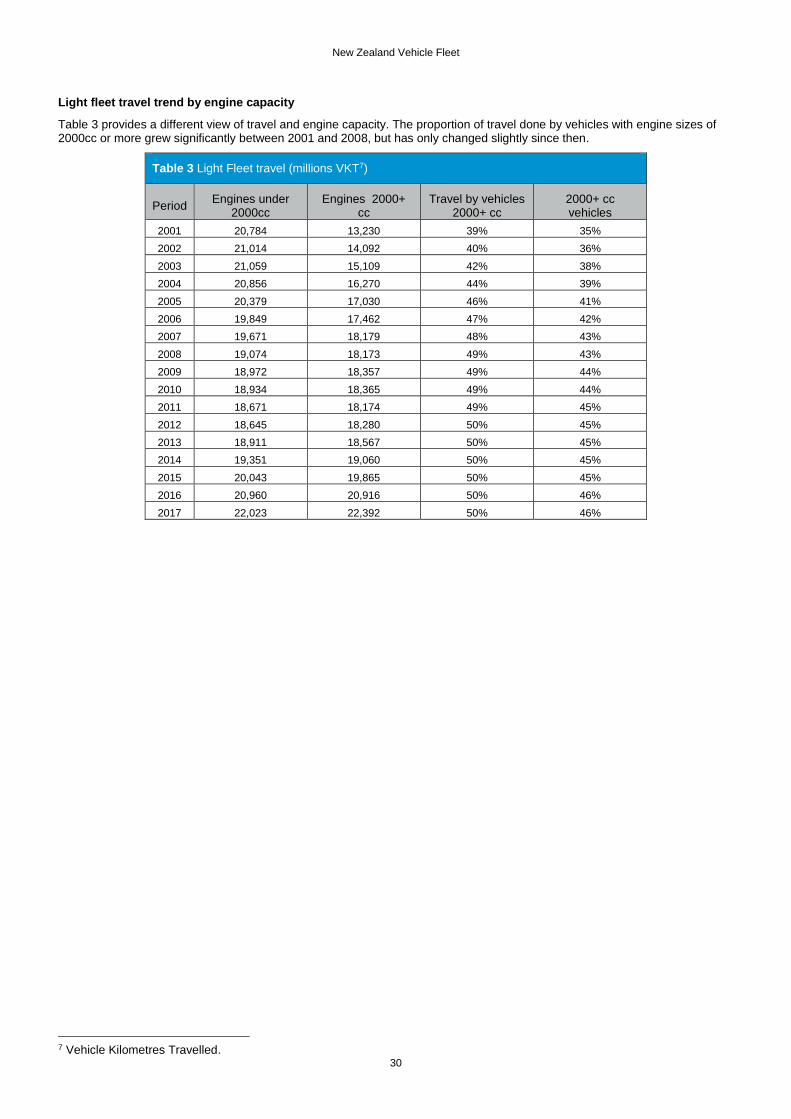
Light fleet travel trend by engine capacity
Table 3 provides a different view of travel and engine capacity. The proportion of travel done by vehicles with engine sizes of 2000cc or more grew significantly between 2001 and 2008, but has only changed slightly since then.
Table 3 Light Fleet travel (millions VKT7)
Period Engines under
2000cc Engines 2000+
cc Travel by vehicles
2000+ cc 2000+ cc vehicles
2001 20,784 13,230 39% 35%
2002 21,014 14,092 40% 36%
2003 21,059 15,109 42% 38%
2004 20,856 16,270 44% 39%
2005 20,379 17,030 46% 41%
2006 19,849 17,462 47% 42%
2007 19,671 18,179 48% 43%
2008 19,074 18,173 49% 43%
2009 18,972 18,357 49% 44%
2010 18,934 18,365 49% 44%
2011 18,671 18,174 49% 45%
2012 18,645 18,280 50% 45%
2013 18,911 18,567 50% 45%
2014 19,351 19,060 50% 45%
2015 20,043 19,865 50% 45%
2016 20,960 20,916 50% 46%
2017 22,023 22,392 50% 46%
7 Vehicle Kilometres Travelled.
New Zealand Vehicle Fleet
31
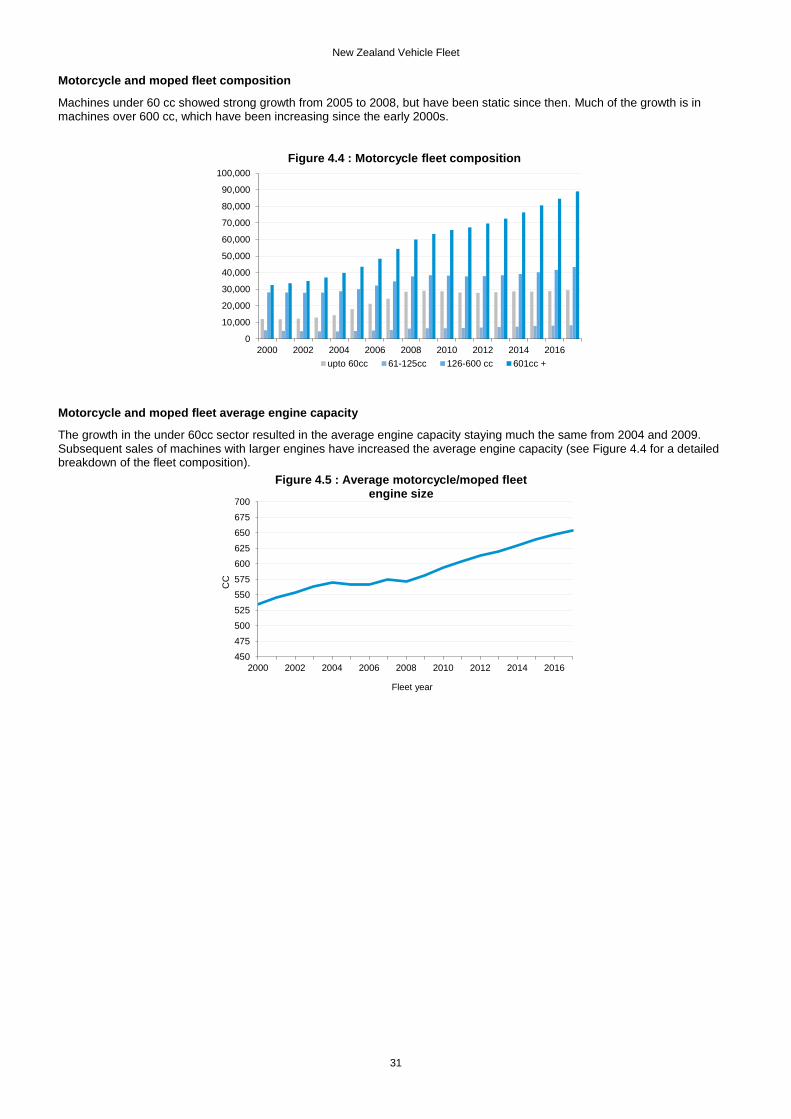
Motorcycle and moped fleet composition
Machines under 60 cc showed strong growth from 2005 to 2008, but have been static since then. Much of the growth is in machines over 600 cc, which have been increasing since the early 2000s.
Motorcycle and moped fleet average engine capacity
The growth in the under 60cc sector resulted in the average engine capacity staying much the same from 2004 and 2009. Subsequent sales of machines with larger engines have increased the average engine capacity (see Figure 4.4 for a detailed breakdown of the fleet composition).
0
10,000
20,000
30,000
40,000
50,000
60,000
70,000
80,000
90,000
100,000
2000 2002 2004 2006 2008 2010 2012 2014 2016
Figure 4.4 : Motorcycle fleet composition
upto 60cc 61-125cc 126-600 cc 601cc +
450
475
500
525
550
575
600
625
650
675
700
2000 2002 2004 2006 2008 2010 2012 2014 2016
CC
Fleet year
Figure 4.5 : Average motorcycle/moped fleet engine size
New Zealand Vehicle Fleet
32
5. Vehicles entering and exiting the fleet
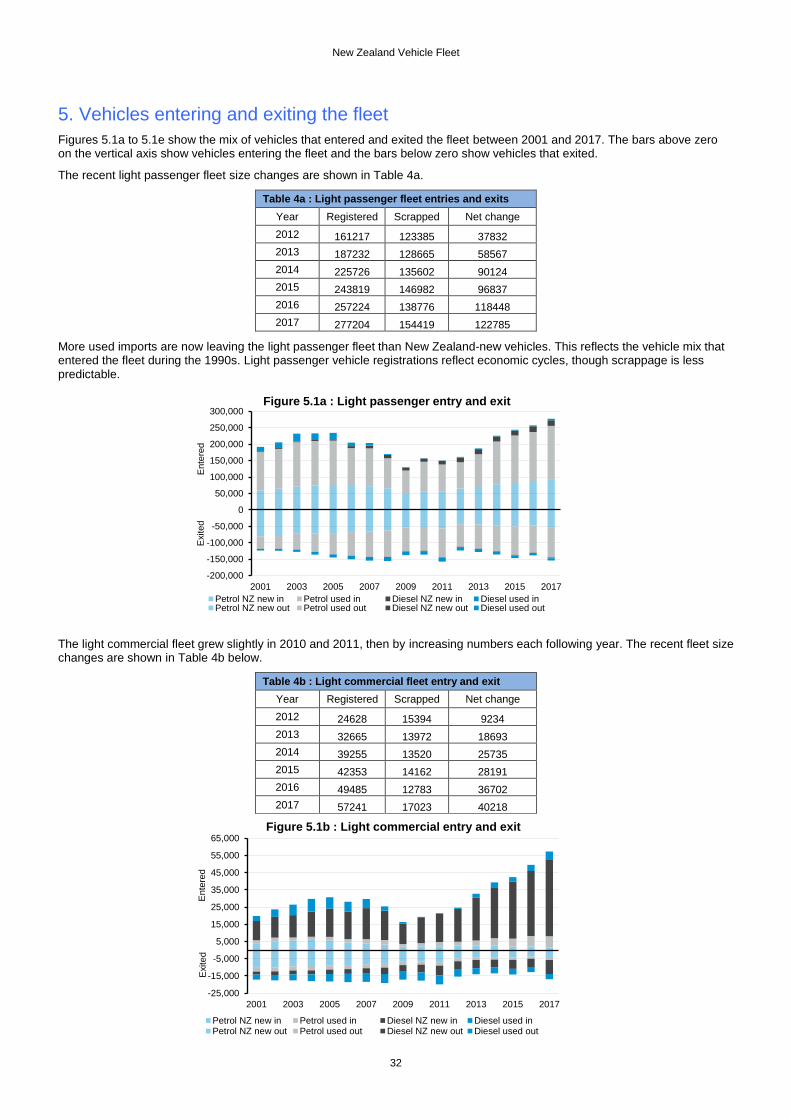
Figures 5.1a to 5.1e show the mix of vehicles that entered and exited the fleet between 2001 and 2017. The bars above zero on the vertical axis show vehicles entering the fleet and the bars below zero show vehicles that exited.
The recent light passenger fleet size changes are shown in Table 4a.
Table 4a : Light passenger fleet entries and exits
Year Registered Scrapped Net change
2012 161217 123385 37832
2013 187232 128665 58567
2014 225726 135602 90124
2015 243819 146982 96837
2016 257224 138776 118448
2017 277204 154419 122785
More used imports are now leaving the light passenger fleet than New Zealand-new vehicles. This reflects the vehicle mix that entered the fleet during the 1990s. Light passenger vehicle registrations reflect economic cycles, though scrappage is less predictable.
The light commercial fleet grew slightly in 2010 and 2011, then by increasing numbers each following year. The recent fleet size changes are shown in Table 4b below.
Table 4b : Light commercial fleet entry and exit
Year Registered Scrapped Net change
2012 24628 15394 9234
2013 32665 13972 18693
2014 39255 13520 25735
2015 42353 14162 28191
2016 49485 12783 36702
2017 57241 17023 40218
-200,000
-150,000
-100,000
-50,000
0
50,000
100,000
150,000
200,000
250,000
300,000
2001 2003 2005 2007 2009 2011 2013 2015 2017
Figure 5.1a : Light passenger entry and exit
Petrol NZ new in Petrol used in Diesel NZ new in Diesel used inPetrol NZ new out Petrol used out Diesel NZ new out Diesel used out
Ente
red
Exited
-25,000
-15,000
-5,000
5,000
15,000
25,000
35,000
45,000
55,000
65,000
2001 2003 2005 2007 2009 2011 2013 2015 2017
Figure 5.1b : Light commercial entry and exit
Petrol NZ new in Petrol used in Diesel NZ new in Diesel used inPetrol NZ new out Petrol used out Diesel NZ new out Diesel used out
Ente
red
Exited
New Zealand Vehicle Fleet
33
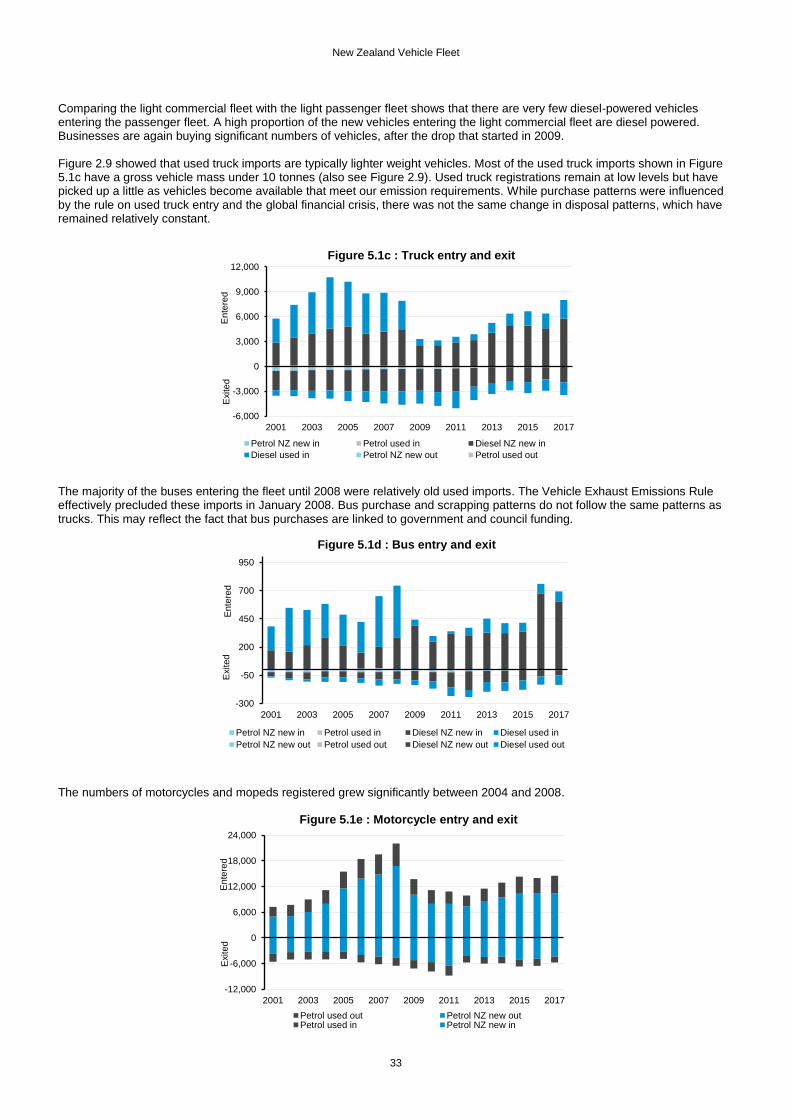
Comparing the light commercial fleet with the light passenger fleet shows that there are very few diesel-powered vehicles entering the passenger fleet. A high proportion of the new vehicles entering the light commercial fleet are diesel powered. Businesses are again buying significant numbers of vehicles, after the drop that started in 2009. Figure 2.9 showed that used truck imports are typically lighter weight vehicles. Most of the used truck imports shown in Figure 5.1c have a gross vehicle mass under 10 tonnes (also see Figure 2.9). Used truck registrations remain at low levels but have picked up a little as vehicles become available that meet our emission requirements. While purchase patterns were influenced by the rule on used truck entry and the global financial crisis, there was not the same change in disposal patterns, which have remained relatively constant.
The majority of the buses entering the fleet until 2008 were relatively old used imports. The Vehicle Exhaust Emissions Rule effectively precluded these imports in January 2008. Bus purchase and scrapping patterns do not follow the same patterns as trucks. This may reflect the fact that bus purchases are linked to government and council funding.
The numbers of motorcycles and mopeds registered grew significantly between 2004 and 2008.
-6,000
-3,000
0
3,000
6,000
9,000
12,000
2001 2003 2005 2007 2009 2011 2013 2015 2017
Figure 5.1c : Truck entry and exit
Petrol NZ new in Petrol used in Diesel NZ new in
Diesel used in Petrol NZ new out Petrol used out
Ente
red
Exited
-300
-50
200
450
700
950
2001 2003 2005 2007 2009 2011 2013 2015 2017
Figure 5.1d : Bus entry and exit
Petrol NZ new in Petrol used in Diesel NZ new in Diesel used in
Petrol NZ new out Petrol used out Diesel NZ new out Diesel used out
Ente
red
Exited
-12,000
-6,000
0
6,000
12,000
18,000
24,000
2001 2003 2005 2007 2009 2011 2013 2015 2017
Figure 5.1e : Motorcycle entry and exit
Petrol used out Petrol NZ new outPetrol used in Petrol NZ new in
Ente
red
Exited
New Zealand Vehicle Fleet
34
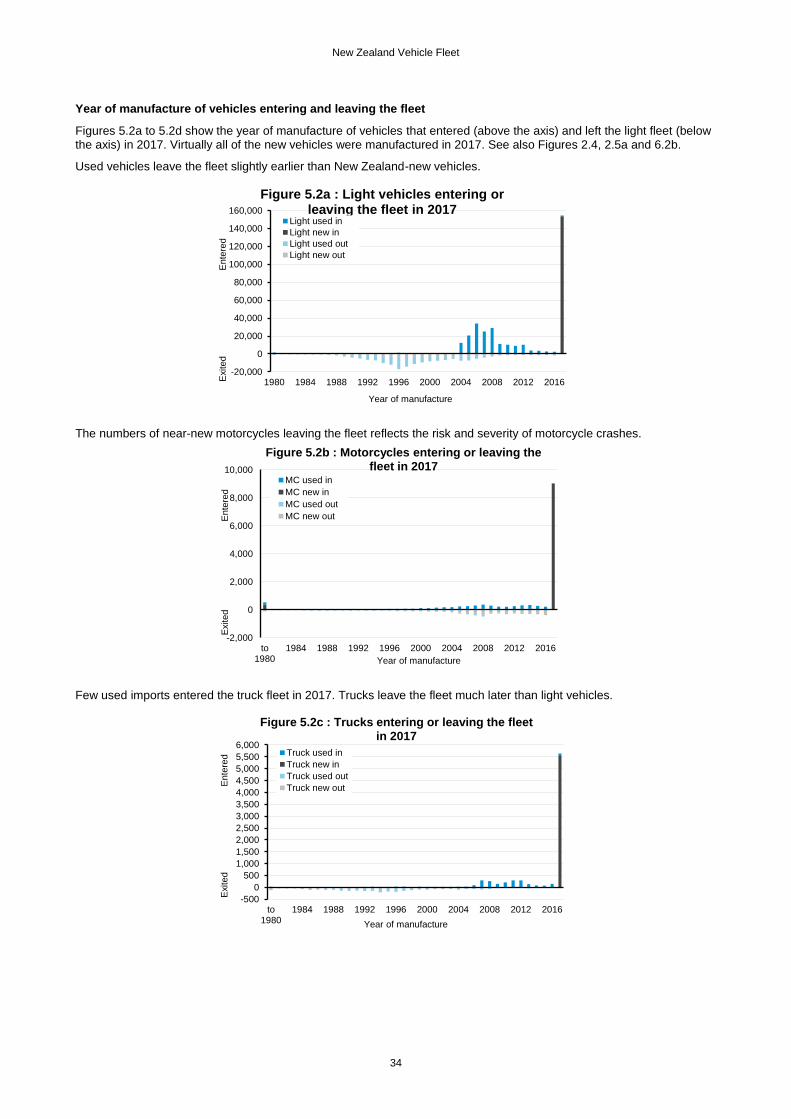
Year of manufacture of vehicles entering and leaving the fleet
Figures 5.2a to 5.2d show the year of manufacture of vehicles that entered (above the axis) and left the light fleet (below the axis) in 2017. Virtually all of the new vehicles were manufactured in 2017. See also Figures 2.4, 2.5a and 6.2b.
Used vehicles leave the fleet slightly earlier than New Zealand-new vehicles.
The numbers of near-new motorcycles leaving the fleet reflects the risk and severity of motorcycle crashes.
Few used imports entered the truck fleet in 2017. Trucks leave the fleet much later than light vehicles.
-20,000
0
20,000
40,000
60,000
80,000
100,000
120,000
140,000
160,000
1980 1984 1988 1992 1996 2000 2004 2008 2012 2016Exited
Ente
red
Year of manufacture
Figure 5.2a : Light vehicles entering or leaving the fleet in 2017
Light used in
Light new in
Light used out
Light new out
-2,000
0
2,000
4,000
6,000
8,000
10,000
to1980
1984 1988 1992 1996 2000 2004 2008 2012 2016
Exited
E
nte
red
Year of manufacture
Figure 5.2b : Motorcycles entering or leaving the fleet in 2017
MC used in
MC new in
MC used out
MC new out
-500
0
500
1,000
1,500
2,000
2,500
3,000
3,500
4,000
4,500
5,000
5,500
6,000
to1980
1984 1988 1992 1996 2000 2004 2008 2012 2016
Exited
Ente
red
Year of manufacture
Figure 5.2c : Trucks entering or leaving the fleet in 2017
Truck used in
Truck new in
Truck used out
Truck new out

New Zealand Vehicle Fleet
35
Extremely few used bus imports entered the fleet in 2017. Few buses leave the fleet, which may be influenced by vehicles eventually being converted into mobile homes.
Engine size of vehicles entering and leaving the light fleet
The detailed breakdowns in Figure 5.3 show the engine sizes of light fleet entries and exits in 2017.
-100
0
100
200
300
400
500
600
to 1980 1984 1988 1992 1996 2000 2004 2008 2012 2016
Exited
Ente
red
Year of manufacture
Figure 5.2d : Buses entering or leaving the fleet in 2017
Bus used in
Bus new in
Bus used out
Bus new out
0 10,000 20,000 30,000 40,000 50,000 60,000 70,000 80,000 90,000100,000
< 1350
< 1600
< 2000
< 3000
< 4000
4000+
Vehicles
CC
Figure 5.3a : Petrol vehicles entering/leaving the light 2017 fleet
Petrol new in
Petrol used in
Petrol new out
Petrol used out
0 10,000 20,000 30,000 40,000
< 1350
< 1600
< 2000
< 3000
< 4000
4000+
Vehicles
CC
Figure 5.3b : Diesel vehicles entering/leaving the light 2017 fleet
Diesel new in
Diesel used in
Diesel new out
Diesel used out
New Zealand Vehicle Fleet
36
6. Vehicles entering the fleet
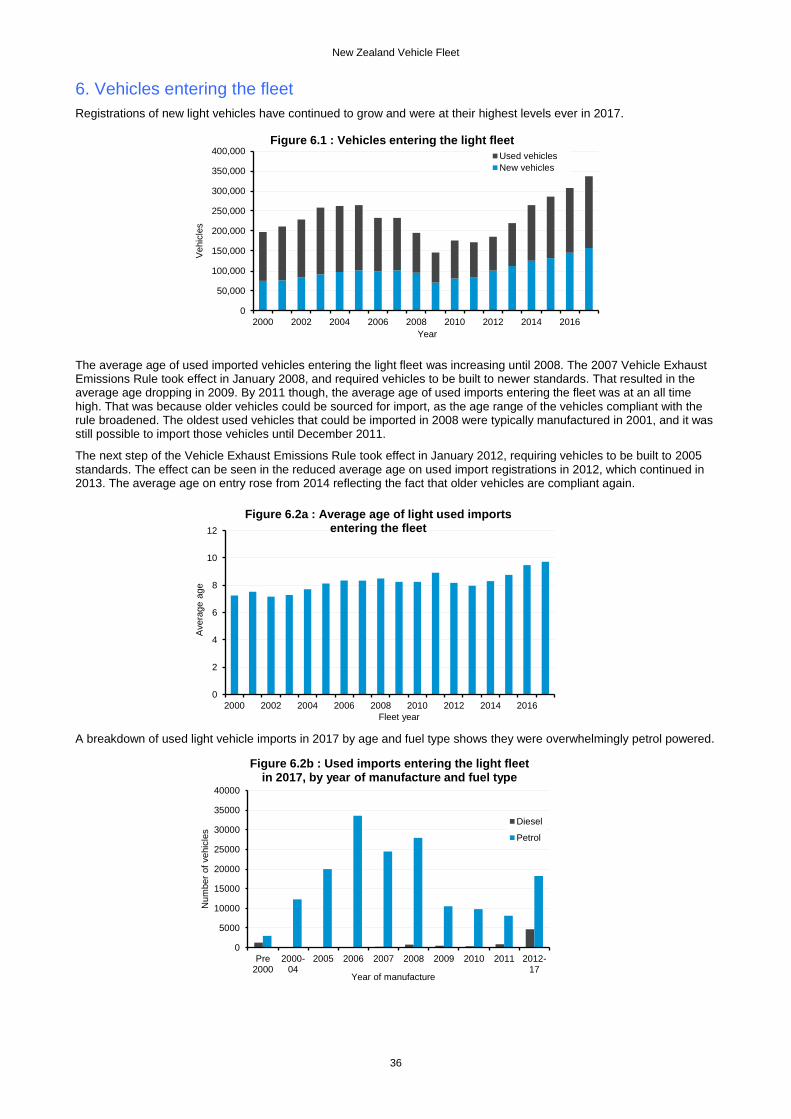
Registrations of new light vehicles have continued to grow and were at their highest levels ever in 2017.
The average age of used imported vehicles entering the light fleet was increasing until 2008. The 2007 Vehicle Exhaust Emissions Rule took effect in January 2008, and required vehicles to be built to newer standards. That resulted in the average age dropping in 2009. By 2011 though, the average age of used imports entering the fleet was at an all time high. That was because older vehicles could be sourced for import, as the age range of the vehicles compliant with the rule broadened. The oldest used vehicles that could be imported in 2008 were typically manufactured in 2001, and it was still possible to import those vehicles until December 2011.
The next step of the Vehicle Exhaust Emissions Rule took effect in January 2012, requiring vehicles to be built to 2005 standards. The effect can be seen in the reduced average age on used import registrations in 2012, which continued in 2013. The average age on entry rose from 2014 reflecting the fact that older vehicles are compliant again.
A breakdown of used light vehicle imports in 2017 by age and fuel type shows they were overwhelmingly petrol powered.
0
50,000
100,000
150,000
200,000
250,000
300,000
350,000
400,000
2000 2002 2004 2006 2008 2010 2012 2014 2016
Vehic
les
Year
Figure 6.1 : Vehicles entering the light fleet
Used vehicles
New vehicles
0
2
4
6
8
10
12
2000 2002 2004 2006 2008 2010 2012 2014 2016
Avera
ge a
ge
Fleet year
Figure 6.2a : Average age of light used imports entering the fleet
0
5000
10000
15000
20000
25000
30000
35000
40000
Pre2000
2000-04
2005 2006 2007 2008 2009 2010 2011 2012-17
Num
ber
of
vehic
les
Year of manufacture
Figure 6.2b : Used imports entering the light fleet in 2017, by year of manufacture and fuel type
Diesel
Petrol
New Zealand Vehicle Fleet
37
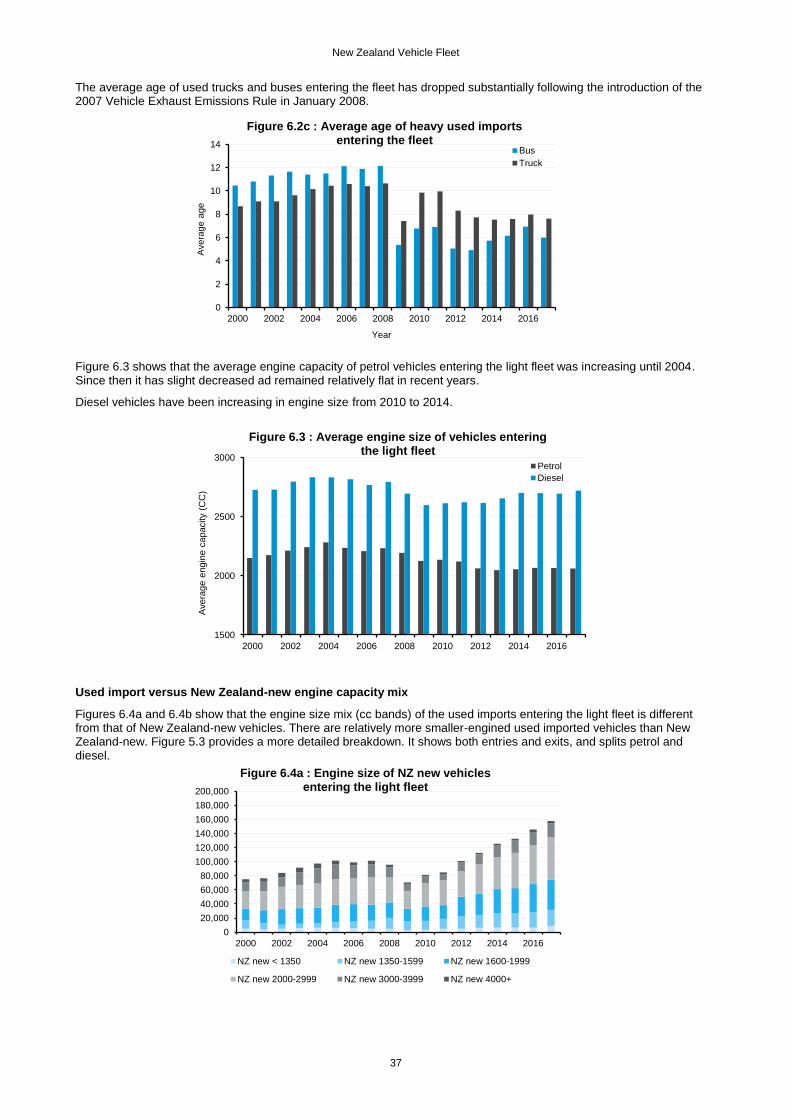
The average age of used trucks and buses entering the fleet has dropped substantially following the introduction of the 2007 Vehicle Exhaust Emissions Rule in January 2008.
Figure 6.3 shows that the average engine capacity of petrol vehicles entering the light fleet was increasing until 2004. Since then it has slight decreased ad remained relatively flat in recent years.
Diesel vehicles have been increasing in engine size from 2010 to 2014.
Used import versus New Zealand-new engine capacity mix
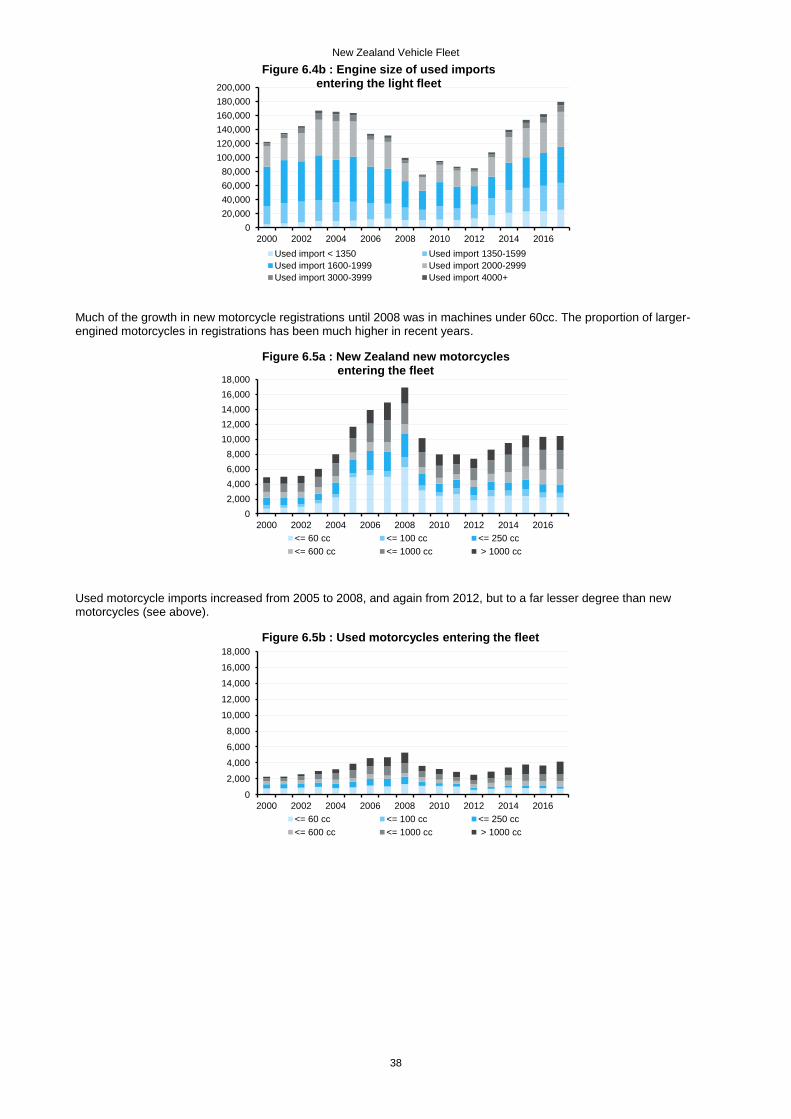
Figures 6.4a and 6.4b show that the engine size mix (cc bands) of the used imports entering the light fleet is different from that of New Zealand-new vehicles. There are relatively more smaller-engined used imported vehicles than New Zealand-new. Figure 5.3 provides a more detailed breakdown. It shows both entries and exits, and splits petrol and diesel.
0
2
4
6
8
10
12
14
2000 2002 2004 2006 2008 2010 2012 2014 2016
Avera
ge a
ge
Year
Figure 6.2c : Average age of heavy used imports entering the fleet
Bus
Truck
1500
2000
2500
3000
2000 2002 2004 2006 2008 2010 2012 2014 2016
Avera
ge e
ngin
e c
apacity
(CC
)
Figure 6.3 : Average engine size of vehicles entering the light fleet
Petrol
Diesel
0
20,000
40,000
60,000
80,000
100,000
120,000
140,000
160,000
180,000
200,000
2000 2002 2004 2006 2008 2010 2012 2014 2016
Figure 6.4a : Engine size of NZ new vehicles entering the light fleet
NZ new < 1350 NZ new 1350-1599 NZ new 1600-1999
NZ new 2000-2999 NZ new 3000-3999 NZ new 4000+
New Zealand Vehicle Fleet
38
Much of the growth in new motorcycle registrations until 2008 was in machines under 60cc. The proportion of larger-engined motorcycles in registrations has been much higher in recent years.
Used motorcycle imports increased from 2005 to 2008, and again from 2012, but to a far lesser degree than new motorcycles (see above).
0
20,000
40,000
60,000
80,000
100,000
120,000
140,000
160,000
180,000
200,000
2000 2002 2004 2006 2008 2010 2012 2014 2016
Figure 6.4b : Engine size of used imports entering the light fleet
Used import < 1350 Used import 1350-1599
Used import 1600-1999 Used import 2000-2999
Used import 3000-3999 Used import 4000+
0
2,000
4,000
6,000
8,000
10,000
12,000
14,000
16,000
18,000
2000 2002 2004 2006 2008 2010 2012 2014 2016
Figure 6.5a : New Zealand new motorcycles entering the fleet
<= 60 cc <= 100 cc <= 250 cc
<= 600 cc <= 1000 cc > 1000 cc
0
2,000
4,000
6,000
8,000
10,000
12,000
14,000
16,000
18,000
2000 2002 2004 2006 2008 2010 2012 2014 2016
Figure 6.5b : Used motorcycles entering the fleet
<= 60 cc <= 100 cc <= 250 cc
<= 600 cc <= 1000 cc > 1000 cc
New Zealand Vehicle Fleet
39
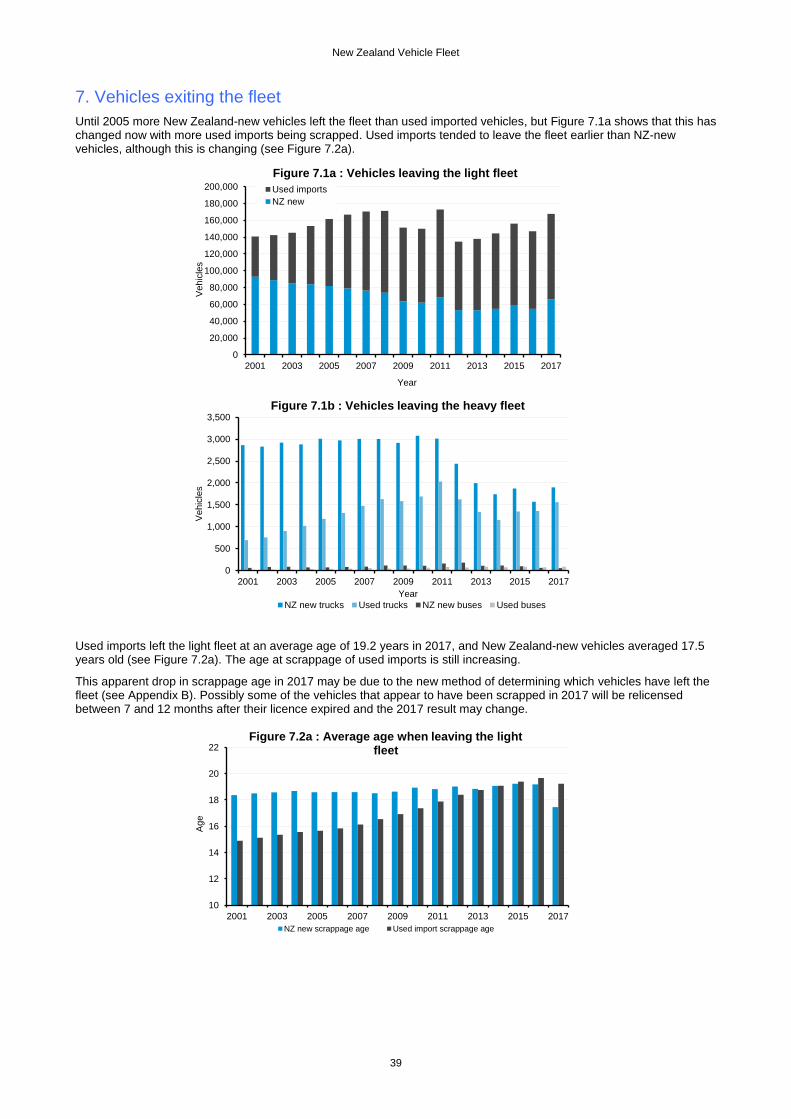
7. Vehicles exiting the fleet
Until 2005 more New Zealand-new vehicles left the fleet than used imported vehicles, but Figure 7.1a shows that this has changed now with more used imports being scrapped. Used imports tended to leave the fleet earlier than NZ-new vehicles, although this is changing (see Figure 7.2a).
Used imports left the light fleet at an average age of 19.2 years in 2017, and New Zealand-new vehicles averaged 17.5 years old (see Figure 7.2a). The age at scrappage of used imports is still increasing.
This apparent drop in scrappage age in 2017 may be due to the new method of determining which vehicles have left the fleet (see Appendix B). Possibly some of the vehicles that appear to have been scrapped in 2017 will be relicensed between 7 and 12 months after their licence expired and the 2017 result may change.
0
20,000
40,000
60,000
80,000
100,000
120,000
140,000
160,000
180,000
200,000
2001 2003 2005 2007 2009 2011 2013 2015 2017
Vehic
les
Year
Figure 7.1a : Vehicles leaving the light fleet
Used imports
NZ new
0
500
1,000
1,500
2,000
2,500
3,000
3,500
2001 2003 2005 2007 2009 2011 2013 2015 2017
Vehic
les
Year
Figure 7.1b : Vehicles leaving the heavy fleet
NZ new trucks Used trucks NZ new buses Used buses
10
12
14
16
18
20
22
2001 2003 2005 2007 2009 2011 2013 2015 2017
Age
Figure 7.2a : Average age when leaving the light fleet
NZ new scrappage age Used import scrappage age
New Zealand Vehicle Fleet
40
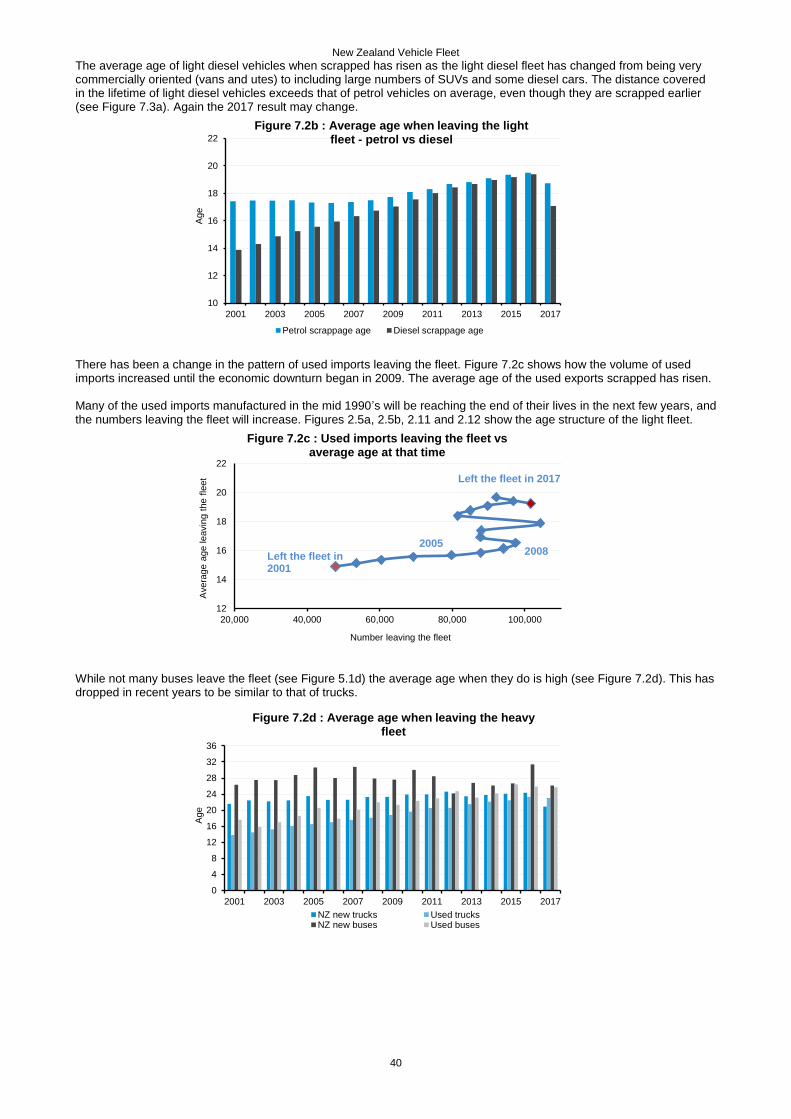
The average age of light diesel vehicles when scrapped has risen as the light diesel fleet has changed from being very commercially oriented (vans and utes) to including large numbers of SUVs and some diesel cars. The distance covered in the lifetime of light diesel vehicles exceeds that of petrol vehicles on average, even though they are scrapped earlier (see Figure 7.3a). Again the 2017 result may change.
There has been a change in the pattern of used imports leaving the fleet. Figure 7.2c shows how the volume of used imports increased until the economic downturn began in 2009. The average age of the used exports scrapped has risen. Many of the used imports manufactured in the mid 1990’s will be reaching the end of their lives in the next few years, and the numbers leaving the fleet will increase. Figures 2.5a, 2.5b, 2.11 and 2.12 show the age structure of the light fleet.
While not many buses leave the fleet (see Figure 5.1d) the average age when they do is high (see Figure 7.2d). This has dropped in recent years to be similar to that of trucks.
10
12
14
16
18
20
22
2001 2003 2005 2007 2009 2011 2013 2015 2017
Age
Figure 7.2b : Average age when leaving the light fleet - petrol vs diesel
Petrol scrappage age Diesel scrappage age
12
14
16
18
20
22
20,000 40,000 60,000 80,000 100,000
Avera
ge a
ge leavin
g t
he f
leet
Number leaving the fleet
Figure 7.2c : Used imports leaving the fleet vs average age at that time
Left the fleet in 2017
Left the fleet in 2001
20082005
0
4
8
12
16
20
24
28
32
36
2001 2003 2005 2007 2009 2011 2013 2015 2017
Age
Figure 7.2d : Average age when leaving the heavy fleet
NZ new trucks Used trucksNZ new buses Used buses
New Zealand Vehicle Fleet
41
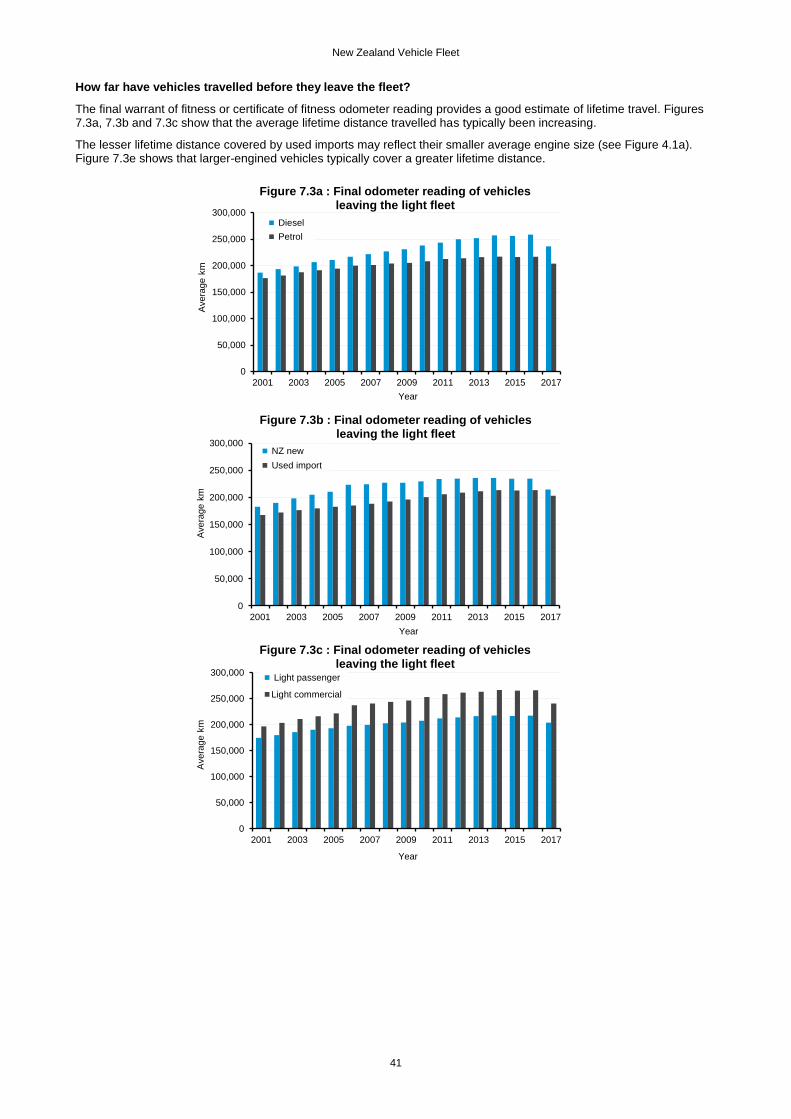
How far have vehicles travelled before they leave the fleet?
The final warrant of fitness or certificate of fitness odometer reading provides a good estimate of lifetime travel. Figures 7.3a, 7.3b and 7.3c show that the average lifetime distance travelled has typically been increasing.
The lesser lifetime distance covered by used imports may reflect their smaller average engine size (see Figure 4.1a). Figure 7.3e shows that larger-engined vehicles typically cover a greater lifetime distance.
0
50,000
100,000
150,000
200,000
250,000
300,000
2001 2003 2005 2007 2009 2011 2013 2015 2017
Avera
ge k
m
Year
Figure 7.3a : Final odometer reading of vehicles leaving the light fleet
Diesel
Petrol
0
50,000
100,000
150,000
200,000
250,000
300,000
2001 2003 2005 2007 2009 2011 2013 2015 2017
Avera
ge k
m
Year
Figure 7.3b : Final odometer reading of vehicles leaving the light fleet
NZ new
Used import
0
50,000
100,000
150,000
200,000
250,000
300,000
2001 2003 2005 2007 2009 2011 2013 2015 2017
Avera
ge k
m
Year
Figure 7.3c : Final odometer reading of vehicles leaving the light fleet
Light passenger
Light commercial
New Zealand Vehicle Fleet
42
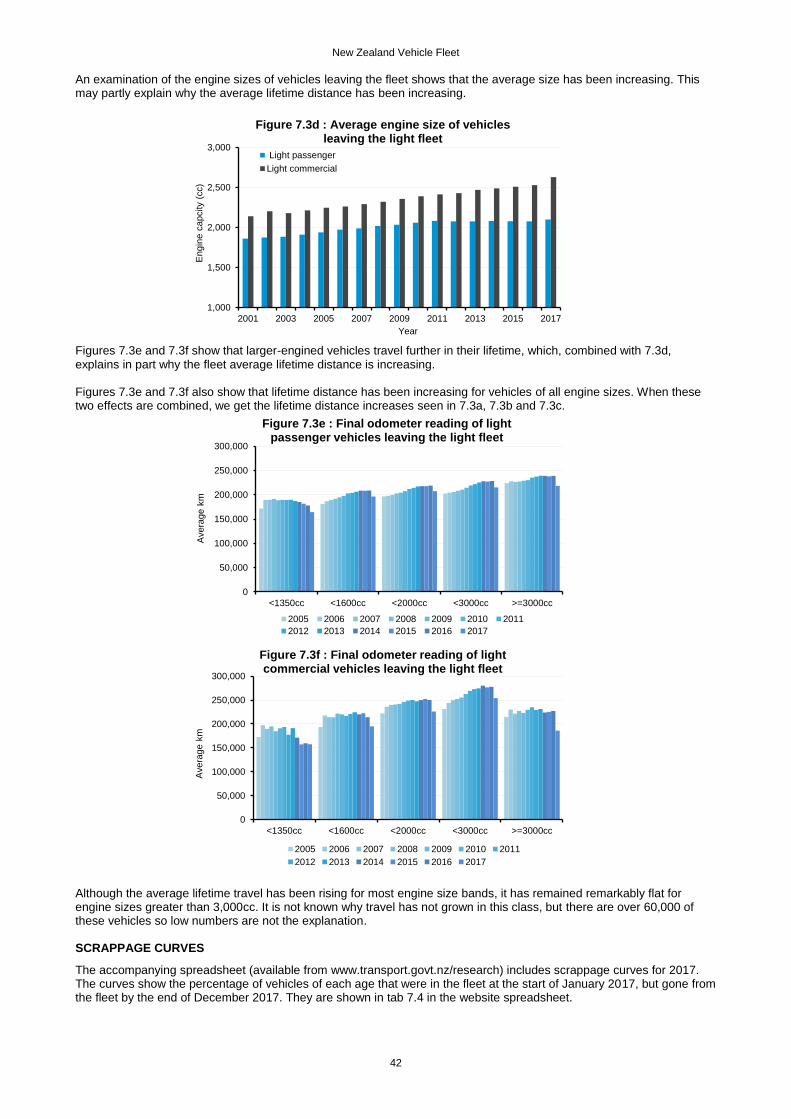
An examination of the engine sizes of vehicles leaving the fleet shows that the average size has been increasing. This may partly explain why the average lifetime distance has been increasing.
Figures 7.3e and 7.3f show that larger-engined vehicles travel further in their lifetime, which, combined with 7.3d, explains in part why the fleet average lifetime distance is increasing. Figures 7.3e and 7.3f also show that lifetime distance has been increasing for vehicles of all engine sizes. When these two effects are combined, we get the lifetime distance increases seen in 7.3a, 7.3b and 7.3c.
Although the average lifetime travel has been rising for most engine size bands, it has remained remarkably flat for engine sizes greater than 3,000cc. It is not known why travel has not grown in this class, but there are over 60,000 of these vehicles so low numbers are not the explanation. SCRAPPAGE CURVES
The accompanying spreadsheet (available from www.transport.govt.nz/research) includes scrappage curves for 2017. The curves show the percentage of vehicles of each age that were in the fleet at the start of January 2017, but gone from the fleet by the end of December 2017. They are shown in tab 7.4 in the website spreadsheet.
1,000
1,500
2,000
2,500
3,000
2001 2003 2005 2007 2009 2011 2013 2015 2017
Engin
e c
apcity
(cc)
Year
Figure 7.3d : Average engine size of vehicles leaving the light fleet
Light passenger
Light commercial
0
50,000
100,000
150,000
200,000
250,000
300,000
<1350cc <1600cc <2000cc <3000cc >=3000cc
Avera
ge k
m
Figure 7.3e : Final odometer reading of light passenger vehicles leaving the light fleet
2005 2006 2007 2008 2009 2010 2011
2012 2013 2014 2015 2016 2017
0
50,000
100,000
150,000
200,000
250,000
300,000
<1350cc <1600cc <2000cc <3000cc >=3000cc
Avera
ge k
m
Figure 7.3f : Final odometer reading of light commercial vehicles leaving the light fleet
2005 2006 2007 2008 2009 2010 2011
2012 2013 2014 2015 2016 2017
New Zealand Vehicle Fleet
43
8. The diesel fleet, diesel and petrol travel, CNG/LPG/electric vehicles
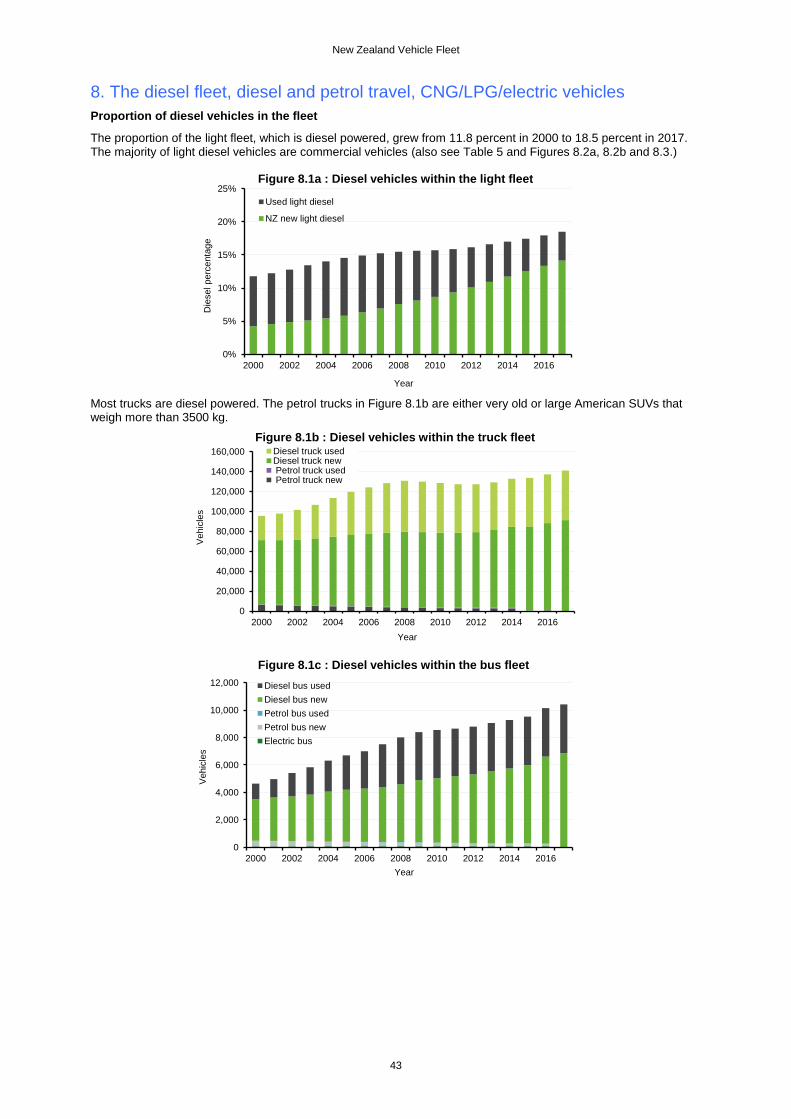
Proportion of diesel vehicles in the fleet
The proportion of the light fleet, which is diesel powered, grew from 11.8 percent in 2000 to 18.5 percent in 2017. The majority of light diesel vehicles are commercial vehicles (also see Table 5 and Figures 8.2a, 8.2b and 8.3.)
Most trucks are diesel powered. The petrol trucks in Figure 8.1b are either very old or large American SUVs that weigh more than 3500 kg.
0%
5%
10%
15%
20%
25%
2000 2002 2004 2006 2008 2010 2012 2014 2016
Die
sel perc
enta
ge
Year
Figure 8.1a : Diesel vehicles within the light fleet
Used light diesel
NZ new light diesel
0
20,000
40,000
60,000
80,000
100,000
120,000
140,000
160,000
2000 2002 2004 2006 2008 2010 2012 2014 2016
Vehic
les
Year
Figure 8.1b : Diesel vehicles within the truck fleetDiesel truck usedDiesel truck new Petrol truck used Petrol truck new
0
2,000
4,000
6,000
8,000
10,000
12,000
2000 2002 2004 2006 2008 2010 2012 2014 2016
Vehic
les
Year
Figure 8.1c : Diesel vehicles within the bus fleet
Diesel bus used
Diesel bus new
Petrol bus used
Petrol bus new
Electric bus
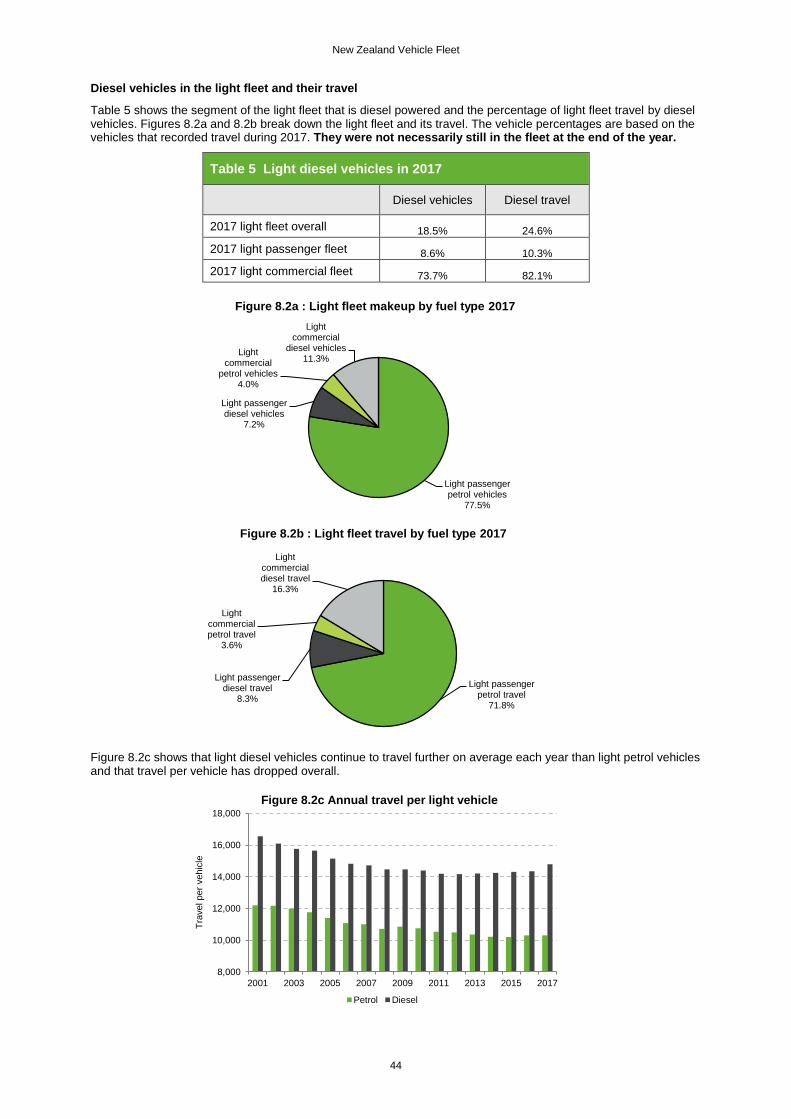
New Zealand Vehicle Fleet
44
Diesel vehicles in the light fleet and their travel
Table 5 shows the segment of the light fleet that is diesel powered and the percentage of light fleet travel by diesel vehicles. Figures 8.2a and 8.2b break down the light fleet and its travel. The vehicle percentages are based on the vehicles that recorded travel during 2017. They were not necessarily still in the fleet at the end of the year.
Table 5 Light diesel vehicles in 2017
Diesel vehicles Diesel travel
2017 light fleet overall 18.5% 24.6%
2017 light passenger fleet 8.6% 10.3%
2017 light commercial fleet 73.7% 82.1%
Figure 8.2c shows that light diesel vehicles continue to travel further on average each year than light petrol vehicles and that travel per vehicle has dropped overall.
Light passenger petrol vehicles
77.5%
Light passenger diesel vehicles
7.2%
Light commercial
petrol vehicles4.0%
Light commercial
diesel vehicles11.3%
Figure 8.2a : Light fleet makeup by fuel type 2017
Light passenger petrol travel
71.8%
Light passenger diesel travel
8.3%
Light commercial petrol travel
3.6%
Light commercial diesel travel
16.3%
Figure 8.2b : Light fleet travel by fuel type 2017
8,000
10,000
12,000
14,000
16,000
18,000
2001 2003 2005 2007 2009 2011 2013 2015 2017
Tra
vel per
vehic
le
Figure 8.2c Annual travel per light vehicle
Petrol Diesel
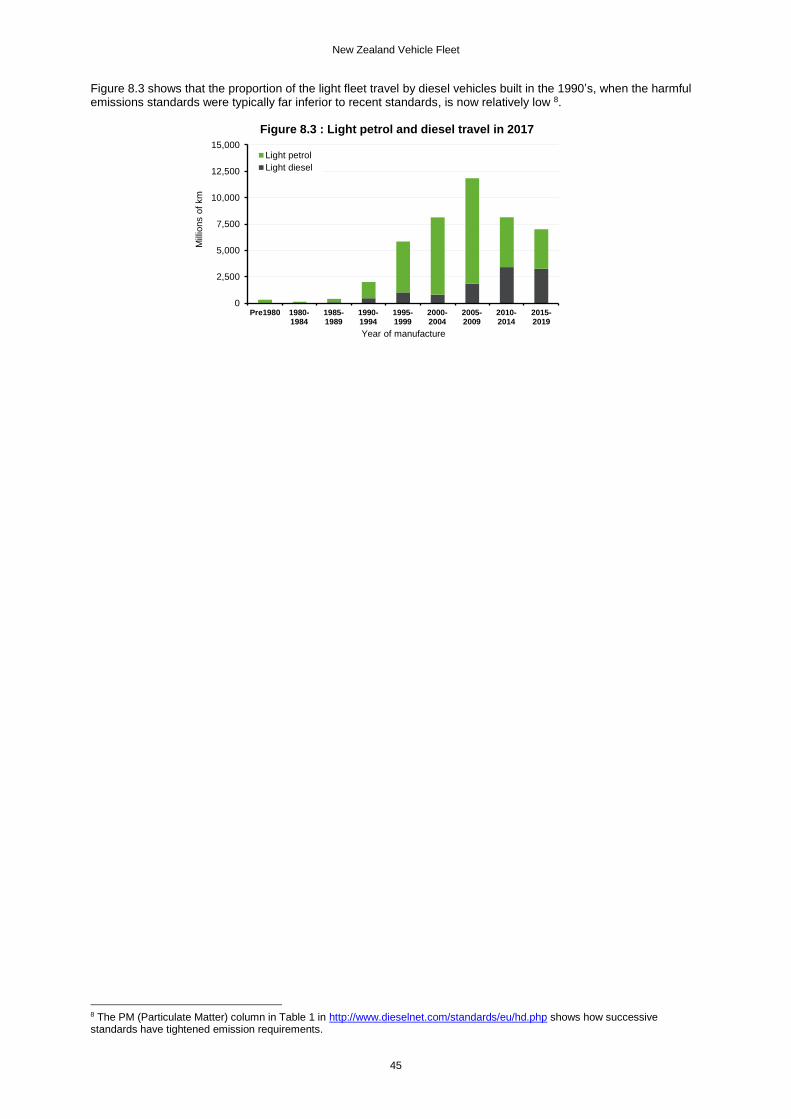
New Zealand Vehicle Fleet
45
Figure 8.3 shows that the proportion of the light fleet travel by diesel vehicles built in the 1990’s, when the harmful emissions standards were typically far inferior to recent standards, is now relatively low 8.
8 The PM (Particulate Matter) column in Table 1 in http://www.dieselnet.com/standards/eu/hd.php shows how successive standards have tightened emission requirements.
0
2,500
5,000
7,500
10,000
12,500
15,000
Pre1980 1980-1984
1985-1989
1990-1994
1995-1999
2000-2004
2005-2009
2010-2014
2015-2019
Mill
ions o
f km
Year of manufacture
Figure 8.3 : Light petrol and diesel travel in 2017
Light petrol
Light diesel
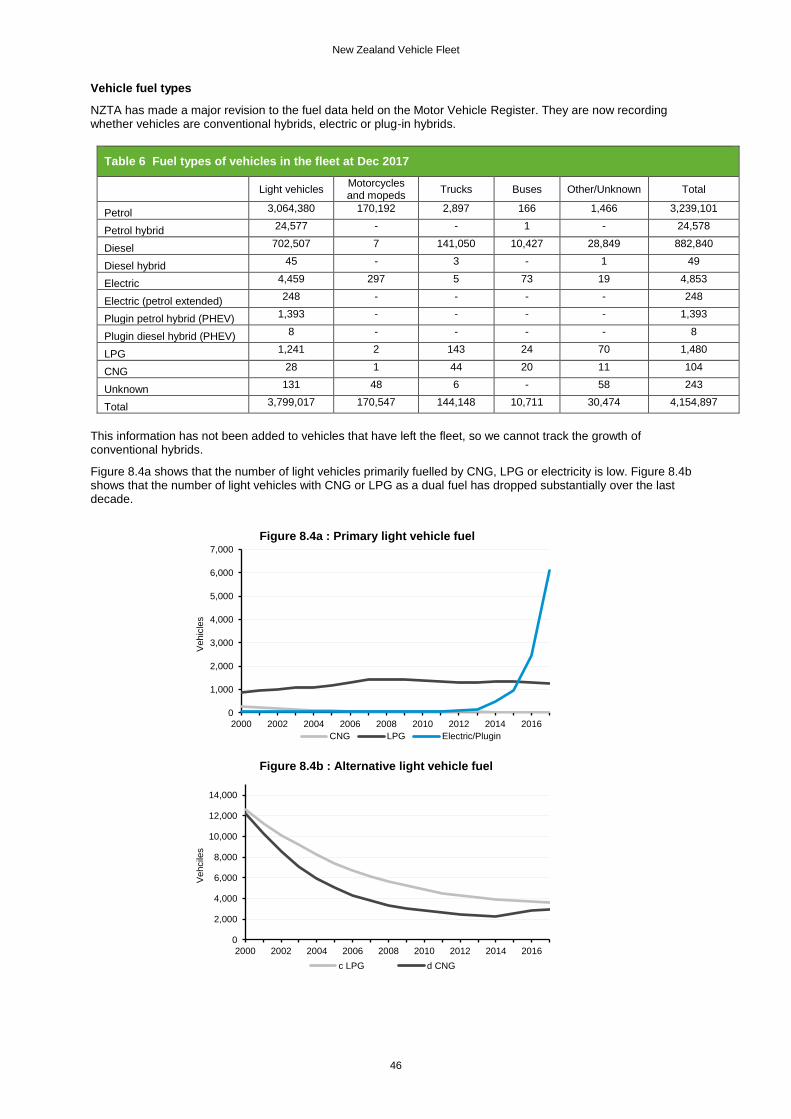
New Zealand Vehicle Fleet
46
Vehicle fuel types
NZTA has made a major revision to the fuel data held on the Motor Vehicle Register. They are now recording whether vehicles are conventional hybrids, electric or plug-in hybrids.
Table 6 Fuel types of vehicles in the fleet at Dec 2017
Light vehicles Motorcycles and mopeds
Trucks Buses Other/Unknown Total
Petrol 3,064,380 170,192 2,897 166 1,466 3,239,101
Petrol hybrid 24,577 - - 1 - 24,578
Diesel 702,507 7 141,050 10,427 28,849 882,840
Diesel hybrid 45 - 3 - 1 49
Electric 4,459 297 5 73 19 4,853
Electric (petrol extended) 248 - - - - 248
Plugin petrol hybrid (PHEV) 1,393 - - - - 1,393
Plugin diesel hybrid (PHEV) 8 - - - - 8
LPG 1,241 2 143 24 70 1,480
CNG 28 1 44 20 11 104
Unknown 131 48 6 - 58 243
Total 3,799,017 170,547 144,148 10,711 30,474 4,154,897
This information has not been added to vehicles that have left the fleet, so we cannot track the growth of conventional hybrids.
Figure 8.4a shows that the number of light vehicles primarily fuelled by CNG, LPG or electricity is low. Figure 8.4b shows that the number of light vehicles with CNG or LPG as a dual fuel has dropped substantially over the last decade.
0
1,000
2,000
3,000
4,000
5,000
6,000
7,000
2000 2002 2004 2006 2008 2010 2012 2014 2016
Vehic
les
Figure 8.4a : Primary light vehicle fuel
CNG LPG Electric/Plugin
0
2,000
4,000
6,000
8,000
10,000
12,000
14,000
2000 2002 2004 2006 2008 2010 2012 2014 2016
Vehcile
s
Figure 8.4b : Alternative light vehicle fuel
c LPG d CNG
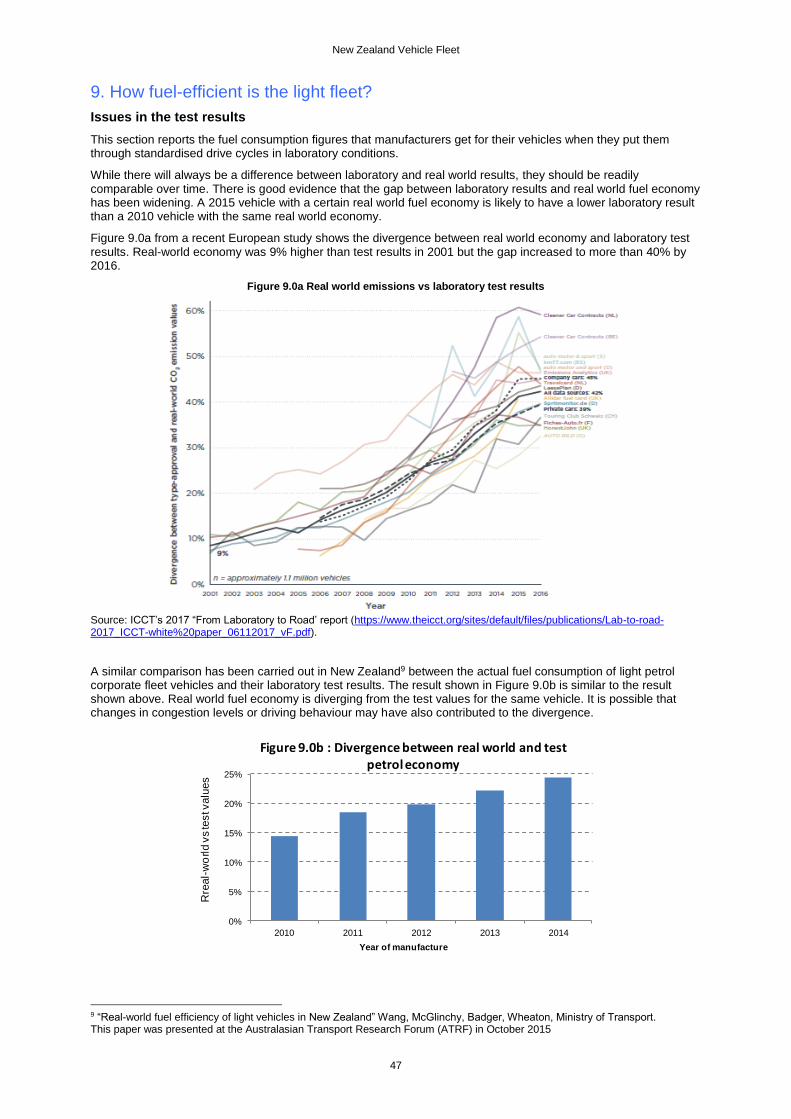
New Zealand Vehicle Fleet
47
9. How fuel-efficient is the light fleet?
Issues in the test results
This section reports the fuel consumption figures that manufacturers get for their vehicles when they put them through standardised drive cycles in laboratory conditions.
While there will always be a difference between laboratory and real world results, they should be readily comparable over time. There is good evidence that the gap between laboratory results and real world fuel economy has been widening. A 2015 vehicle with a certain real world fuel economy is likely to have a lower laboratory result than a 2010 vehicle with the same real world economy.
Figure 9.0a from a recent European study shows the divergence between real world economy and laboratory test results. Real-world economy was 9% higher than test results in 2001 but the gap increased to more than 40% by 2016.
Figure 9.0a Real world emissions vs laboratory test results
Source: ICCT’s 2017 “From Laboratory to Road’ report (https://www.theicct.org/sites/default/files/publications/Lab-to-road-2017_ICCT-white%20paper_06112017_vF.pdf).
A similar comparison has been carried out in New Zealand9 between the actual fuel consumption of light petrol corporate fleet vehicles and their laboratory test results. The result shown in Figure 9.0b is similar to the result shown above. Real world fuel economy is diverging from the test values for the same vehicle. It is possible that changes in congestion levels or driving behaviour may have also contributed to the divergence.
9 “Real-world fuel efficiency of light vehicles in New Zealand” Wang, McGlinchy, Badger, Wheaton, Ministry of Transport. This paper was presented at the Australasian Transport Research Forum (ATRF) in October 2015
0%
5%
10%
15%
20%
25%
2010 2011 2012 2013 2014
Rre
al-
wo
rld v
s te
st v
alu
es
Year of manufacture
Figure 9.0b : Divergence between real world and test petrol economy
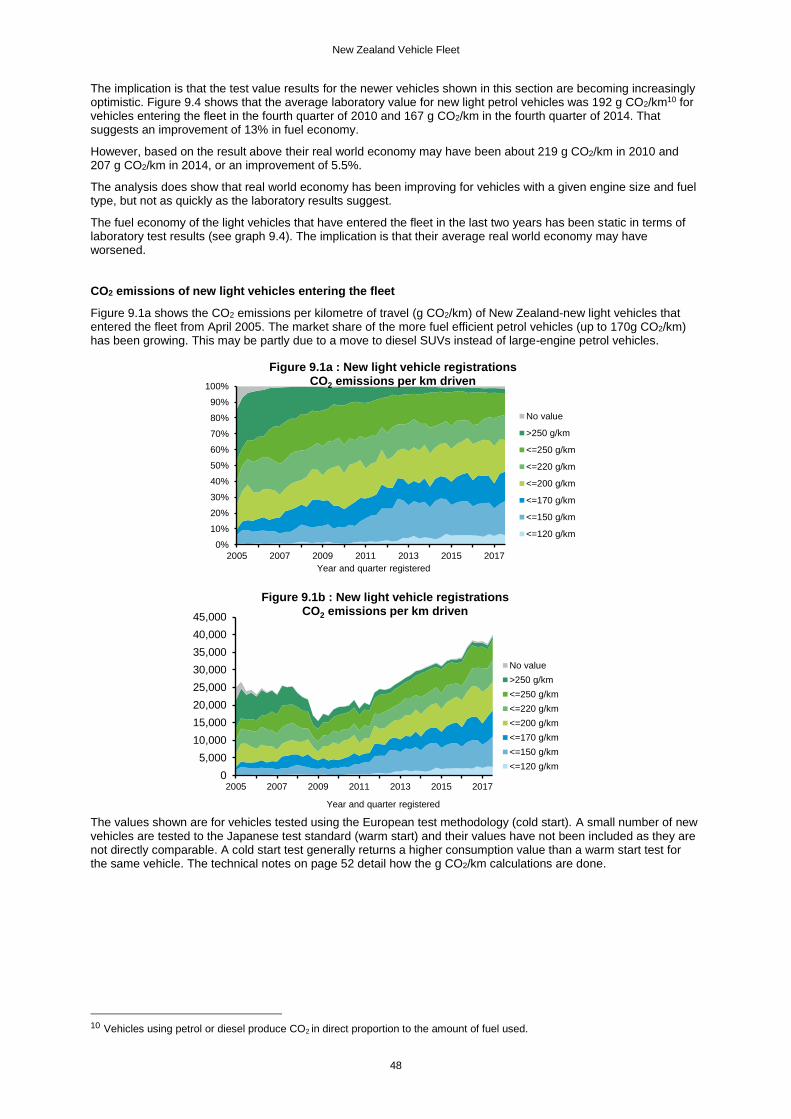
New Zealand Vehicle Fleet
48
The implication is that the test value results for the newer vehicles shown in this section are becoming increasingly optimistic. Figure 9.4 shows that the average laboratory value for new light petrol vehicles was 192 g CO2/km10 for vehicles entering the fleet in the fourth quarter of 2010 and 167 g CO2/km in the fourth quarter of 2014. That suggests an improvement of 13% in fuel economy.
However, based on the result above their real world economy may have been about 219 g CO2/km in 2010 and 207 g CO2/km in 2014, or an improvement of 5.5%.
The analysis does show that real world economy has been improving for vehicles with a given engine size and fuel type, but not as quickly as the laboratory results suggest.
The fuel economy of the light vehicles that have entered the fleet in the last two years has been static in terms of laboratory test results (see graph 9.4). The implication is that their average real world economy may have worsened. CO2 emissions of new light vehicles entering the fleet
Figure 9.1a shows the CO2 emissions per kilometre of travel (g CO2/km) of New Zealand-new light vehicles that entered the fleet from April 2005. The market share of the more fuel efficient petrol vehicles (up to 170g CO2/km) has been growing. This may be partly due to a move to diesel SUVs instead of large-engine petrol vehicles.
The values shown are for vehicles tested using the European test methodology (cold start). A small number of new vehicles are tested to the Japanese test standard (warm start) and their values have not been included as they are not directly comparable. A cold start test generally returns a higher consumption value than a warm start test for the same vehicle. The technical notes on page 52 detail how the g CO2/km calculations are done.
10 Vehicles using petrol or diesel produce CO2
in direct proportion to the amount of fuel used.
0%
10%
20%
30%
40%
50%
60%
70%
80%
90%
100%
2005 2007 2009 2011 2013 2015 2017
Year and quarter registered
Figure 9.1a : New light vehicle registrationsCO2 emissions per km driven
No value
>250 g/km
<=250 g/km
<=220 g/km
<=200 g/km
<=170 g/km
<=150 g/km
<=120 g/km
0
5,000
10,000
15,000
20,000
25,000
30,000
35,000
40,000
45,000
2005 2007 2009 2011 2013 2015 2017
Year and quarter registered
Figure 9.1b : New light vehicle registrationsCO2 emissions per km driven
No value
>250 g/km
<=250 g/km
<=220 g/km
<=200 g/km
<=170 g/km
<=150 g/km
<=120 g/km
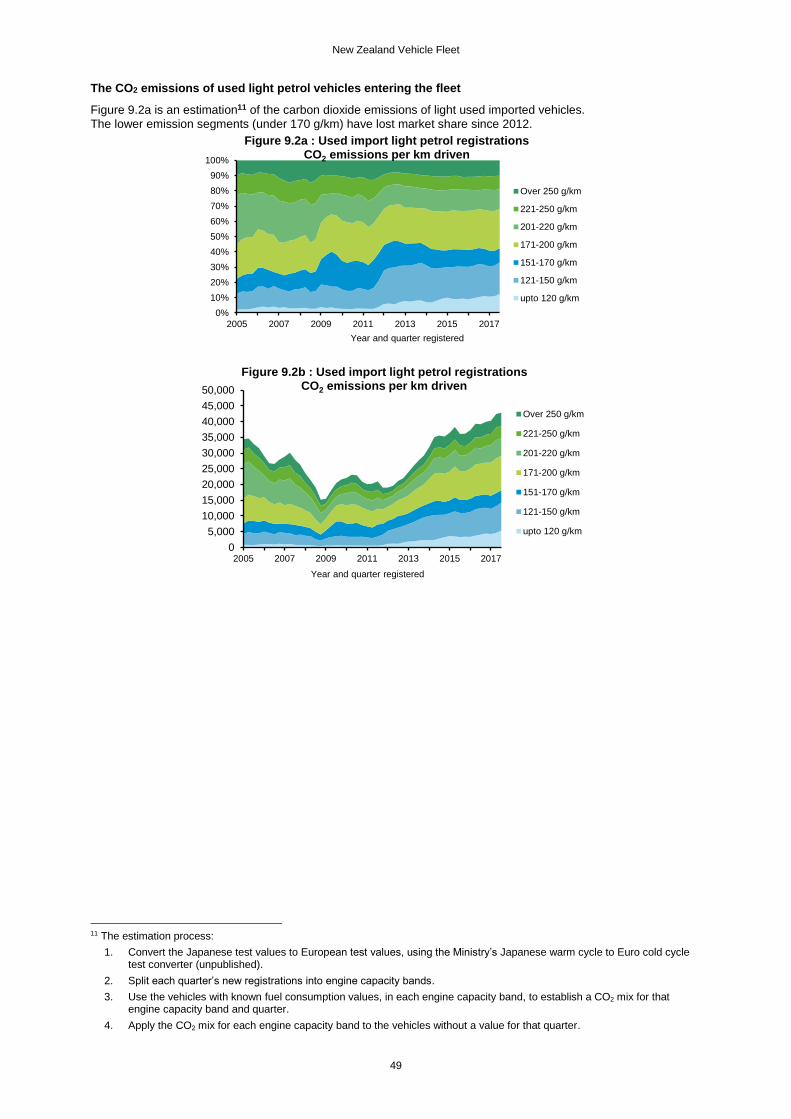
New Zealand Vehicle Fleet
49
The CO2 emissions of used light petrol vehicles entering the fleet
Figure 9.2a is an estimation11 of the carbon dioxide emissions of light used imported vehicles.
The lower emission segments (under 170 g/km) have lost market share since 2012.
11 The estimation process:
1. Convert the Japanese test values to European test values, using the Ministry’s Japanese warm cycle to Euro cold cycle test converter (unpublished).
2. Split each quarter’s new registrations into engine capacity bands.
3. Use the vehicles with known fuel consumption values, in each engine capacity band, to establish a CO2 mix for that engine capacity band and quarter.
4. Apply the CO2 mix for each engine capacity band to the vehicles without a value for that quarter.
0%
10%
20%
30%
40%
50%
60%
70%
80%
90%
100%
2005 2007 2009 2011 2013 2015 2017
Year and quarter registered
Figure 9.2a : Used import light petrol registrationsCO2 emissions per km driven
Over 250 g/km
221-250 g/km
201-220 g/km
171-200 g/km
151-170 g/km
121-150 g/km
upto 120 g/km
0
5,000
10,000
15,000
20,000
25,000
30,000
35,000
40,000
45,000
50,000
2005 2007 2009 2011 2013 2015 2017
Year and quarter registered
Figure 9.2b : Used import light petrol registrationsCO2 emissions per km driven
Over 250 g/km
221-250 g/km
201-220 g/km
171-200 g/km
151-170 g/km
121-150 g/km
upto 120 g/km
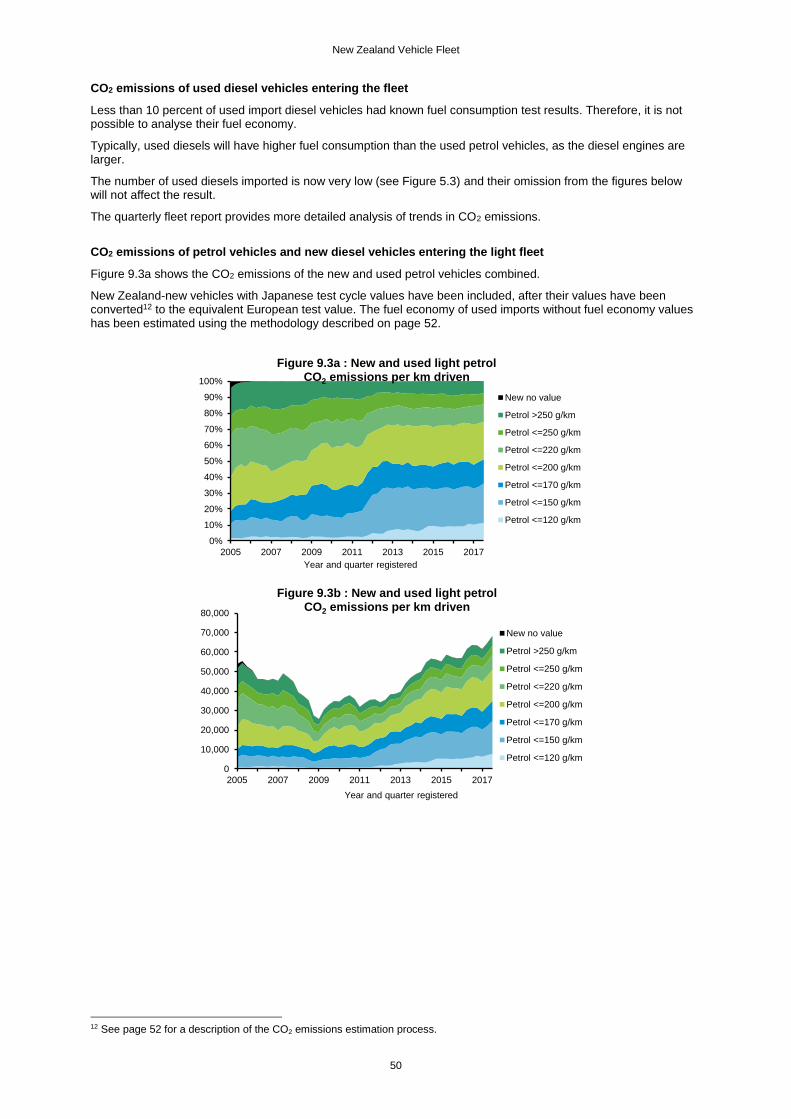
New Zealand Vehicle Fleet
50
CO2 emissions of used diesel vehicles entering the fleet
Less than 10 percent of used import diesel vehicles had known fuel consumption test results. Therefore, it is not possible to analyse their fuel economy.
Typically, used diesels will have higher fuel consumption than the used petrol vehicles, as the diesel engines are larger.
The number of used diesels imported is now very low (see Figure 5.3) and their omission from the figures below will not affect the result.
The quarterly fleet report provides more detailed analysis of trends in CO2 emissions.
CO2 emissions of petrol vehicles and new diesel vehicles entering the light fleet
Figure 9.3a shows the CO2 emissions of the new and used petrol vehicles combined.
New Zealand-new vehicles with Japanese test cycle values have been included, after their values have been converted12 to the equivalent European test value. The fuel economy of used imports without fuel economy values has been estimated using the methodology described on page 52.
12 See page 52 for a description of the CO2 emissions estimation process.
0%
10%
20%
30%
40%
50%
60%
70%
80%
90%
100%
2005 2007 2009 2011 2013 2015 2017
Year and quarter registered
Figure 9.3a : New and used light petrol CO2 emissions per km driven
New no value
Petrol >250 g/km
Petrol <=250 g/km
Petrol <=220 g/km
Petrol <=200 g/km
Petrol <=170 g/km
Petrol <=150 g/km
Petrol <=120 g/km
0
10,000
20,000
30,000
40,000
50,000
60,000
70,000
80,000
2005 2007 2009 2011 2013 2015 2017
Year and quarter registered
Figure 9.3b : New and used light petrol CO2 emissions per km driven
New no value
Petrol >250 g/km
Petrol <=250 g/km
Petrol <=220 g/km
Petrol <=200 g/km
Petrol <=170 g/km
Petrol <=150 g/km
Petrol <=120 g/km
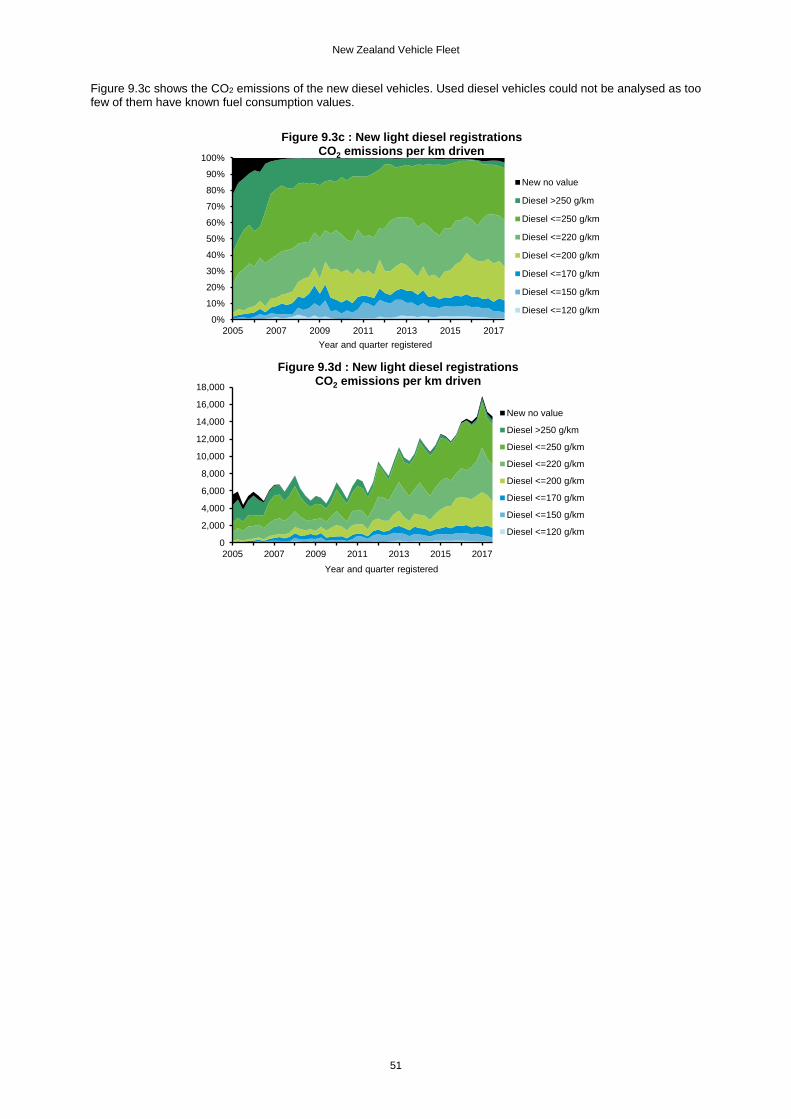
New Zealand Vehicle Fleet
51
Figure 9.3c shows the CO2 emissions of the new diesel vehicles. Used diesel vehicles could not be analysed as too few of them have known fuel consumption values.
0%
10%
20%
30%
40%
50%
60%
70%
80%
90%
100%
2005 2007 2009 2011 2013 2015 2017
Year and quarter registered
Figure 9.3c : New light diesel registrationsCO2 emissions per km driven
New no value
Diesel >250 g/km
Diesel <=250 g/km
Diesel <=220 g/km
Diesel <=200 g/km
Diesel <=170 g/km
Diesel <=150 g/km
Diesel <=120 g/km
0
2,000
4,000
6,000
8,000
10,000
12,000
14,000
16,000
18,000
2005 2007 2009 2011 2013 2015 2017
Year and quarter registered
Figure 9.3d : New light diesel registrationsCO2 emissions per km driven
New no value
Diesel >250 g/km
Diesel <=250 g/km
Diesel <=220 g/km
Diesel <=200 g/km
Diesel <=170 g/km
Diesel <=150 g/km
Diesel <=120 g/km
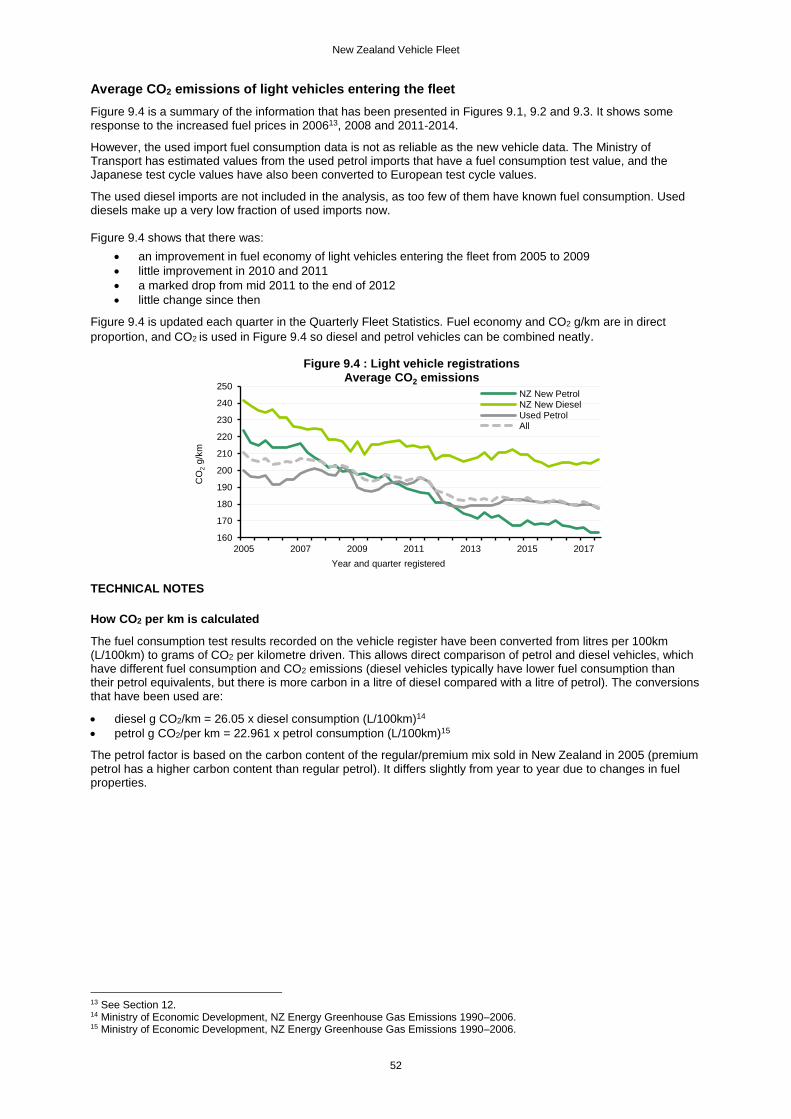
New Zealand Vehicle Fleet
52
Average CO2 emissions of light vehicles entering the fleet
Figure 9.4 is a summary of the information that has been presented in Figures 9.1, 9.2 and 9.3. It shows some response to the increased fuel prices in 200613, 2008 and 2011-2014.
However, the used import fuel consumption data is not as reliable as the new vehicle data. The Ministry of Transport has estimated values from the used petrol imports that have a fuel consumption test value, and the Japanese test cycle values have also been converted to European test cycle values.
The used diesel imports are not included in the analysis, as too few of them have known fuel consumption. Used diesels make up a very low fraction of used imports now. Figure 9.4 shows that there was:
an improvement in fuel economy of light vehicles entering the fleet from 2005 to 2009
little improvement in 2010 and 2011
a marked drop from mid 2011 to the end of 2012
little change since then
Figure 9.4 is updated each quarter in the Quarterly Fleet Statistics. Fuel economy and CO2 g/km are in direct
proportion, and CO2 is used in Figure 9.4 so diesel and petrol vehicles can be combined neatly.
TECHNICAL NOTES
How CO2 per km is calculated
The fuel consumption test results recorded on the vehicle register have been converted from litres per 100km (L/100km) to grams of CO2 per kilometre driven. This allows direct comparison of petrol and diesel vehicles, which have different fuel consumption and CO2 emissions (diesel vehicles typically have lower fuel consumption than their petrol equivalents, but there is more carbon in a litre of diesel compared with a litre of petrol). The conversions that have been used are:
diesel g CO2/km = 26.05 x diesel consumption (L/100km)14
petrol g CO2/per km = 22.961 x petrol consumption (L/100km)15
The petrol factor is based on the carbon content of the regular/premium mix sold in New Zealand in 2005 (premium petrol has a higher carbon content than regular petrol). It differs slightly from year to year due to changes in fuel properties.
13 See Section 12. 14 Ministry of Economic Development, NZ Energy Greenhouse Gas Emissions 1990–2006. 15 Ministry of Economic Development, NZ Energy Greenhouse Gas Emissions 1990–2006.
160
170
180
190
200
210
220
230
240
250
2005 2007 2009 2011 2013 2015 2017
CO
2g/k
m
Year and quarter registered
Figure 9.4 : Light vehicle registrations Average CO2 emissions
NZ New PetrolNZ New DieselUsed PetrolAll
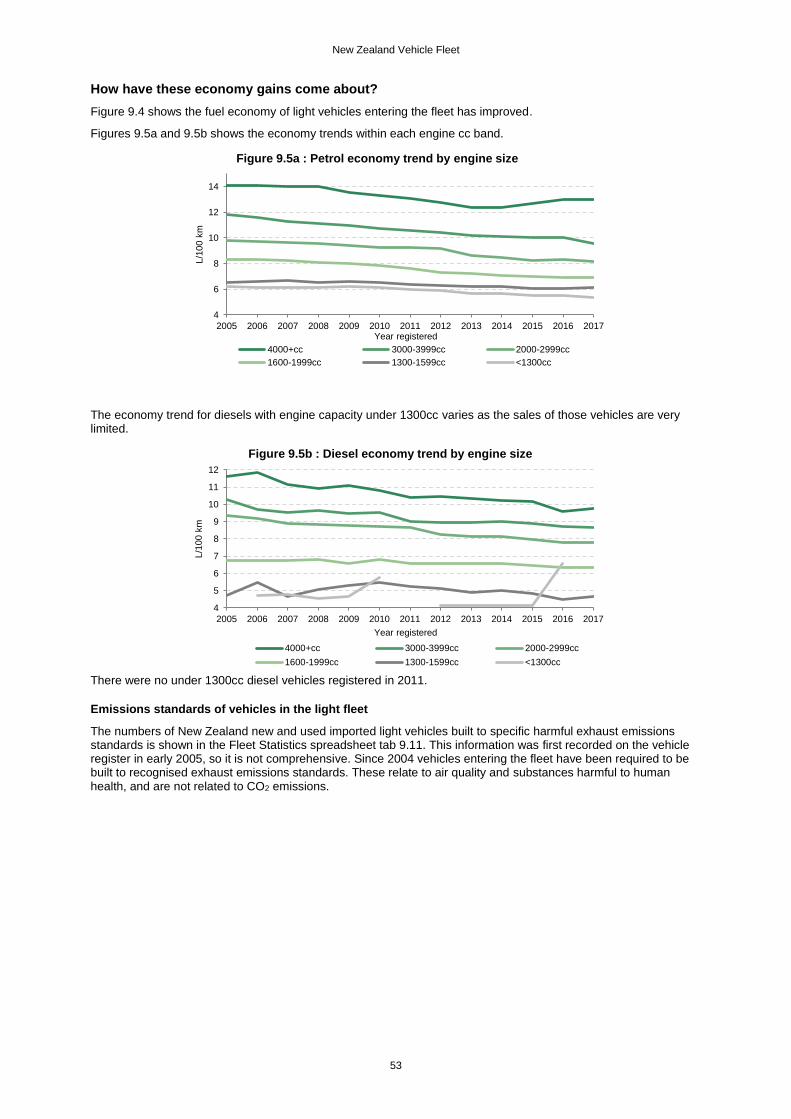
New Zealand Vehicle Fleet
53
How have these economy gains come about?
Figure 9.4 shows the fuel economy of light vehicles entering the fleet has improved.
Figures 9.5a and 9.5b shows the economy trends within each engine cc band.
The economy trend for diesels with engine capacity under 1300cc varies as the sales of those vehicles are very limited.
There were no under 1300cc diesel vehicles registered in 2011.
Emissions standards of vehicles in the light fleet
The numbers of New Zealand new and used imported light vehicles built to specific harmful exhaust emissions standards is shown in the Fleet Statistics spreadsheet tab 9.11. This information was first recorded on the vehicle register in early 2005, so it is not comprehensive. Since 2004 vehicles entering the fleet have been required to be built to recognised exhaust emissions standards. These relate to air quality and substances harmful to human health, and are not related to CO2 emissions.
4
6
8
10
12
14
2005 2006 2007 2008 2009 2010 2011 2012 2013 2014 2015 2016 2017
L/1
00 k
m
Year registered
Figure 9.5a : Petrol economy trend by engine size
4000+cc 3000-3999cc 2000-2999cc
1600-1999cc 1300-1599cc <1300cc
4
5
6
7
8
9
10
11
12
2005 2006 2007 2008 2009 2010 2011 2012 2013 2014 2015 2016 2017
L/1
00 k
m
Year registered
Figure 9.5b : Diesel economy trend by engine size
4000+cc 3000-3999cc 2000-2999cc
1600-1999cc 1300-1599cc <1300cc
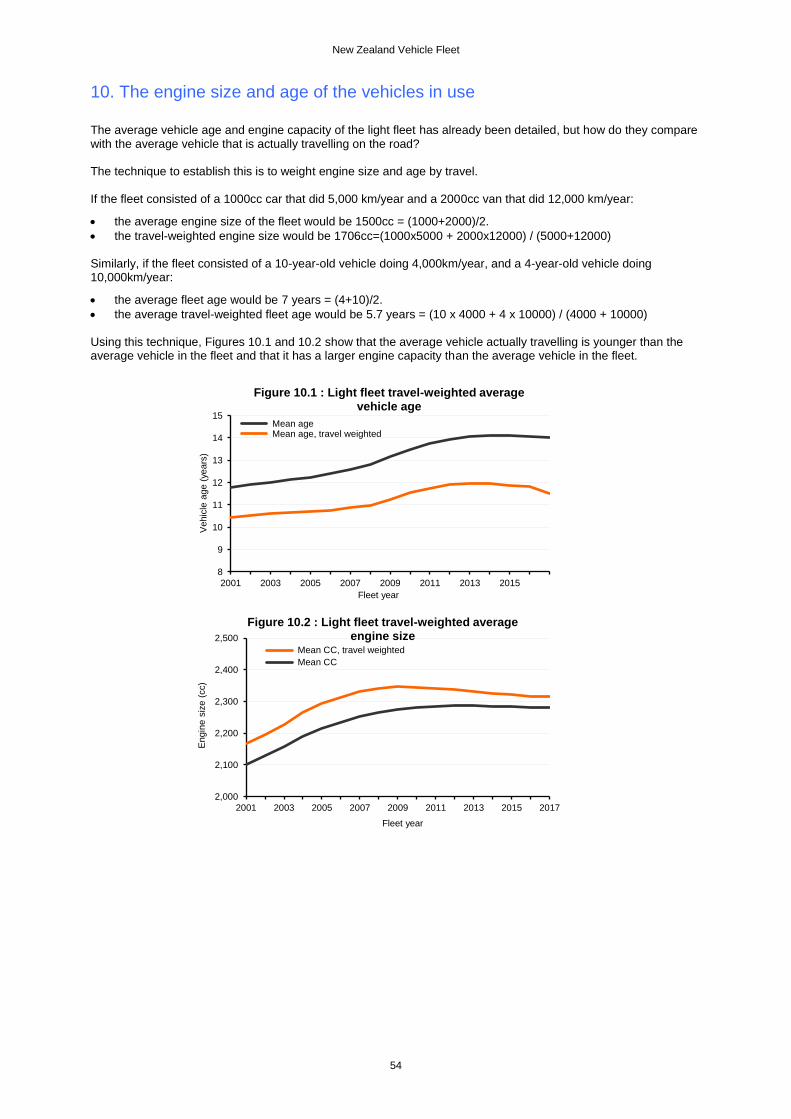
New Zealand Vehicle Fleet
54
10. The engine size and age of the vehicles in use
The average vehicle age and engine capacity of the light fleet has already been detailed, but how do they compare with the average vehicle that is actually travelling on the road? The technique to establish this is to weight engine size and age by travel. If the fleet consisted of a 1000cc car that did 5,000 km/year and a 2000cc van that did 12,000 km/year:
the average engine size of the fleet would be 1500cc = (1000+2000)/2.
the travel-weighted engine size would be 1706cc=(1000x5000 + 2000x12000) / (5000+12000) Similarly, if the fleet consisted of a 10-year-old vehicle doing 4,000km/year, and a 4-year-old vehicle doing 10,000km/year:
the average fleet age would be 7 years = (4+10)/2.
the average travel-weighted fleet age would be 5.7 years = (10 x 4000 + 4 x 10000) / (4000 + 10000) Using this technique, Figures 10.1 and 10.2 show that the average vehicle actually travelling is younger than the average vehicle in the fleet and that it has a larger engine capacity than the average vehicle in the fleet.
8
9
10
11
12
13
14
15
2001 2003 2005 2007 2009 2011 2013 2015
Vehic
le a
ge (
years
)
Fleet year
Figure 10.1 : Light fleet travel-weighted average vehicle age
Mean age Mean age, travel weighted
2,000
2,100
2,200
2,300
2,400
2,500
2001 2003 2005 2007 2009 2011 2013 2015 2017
Engin
e s
ize (
cc)
Fleet year
Figure 10.2 : Light fleet travel-weighted average engine size
Mean CC, travel weighted
Mean CC
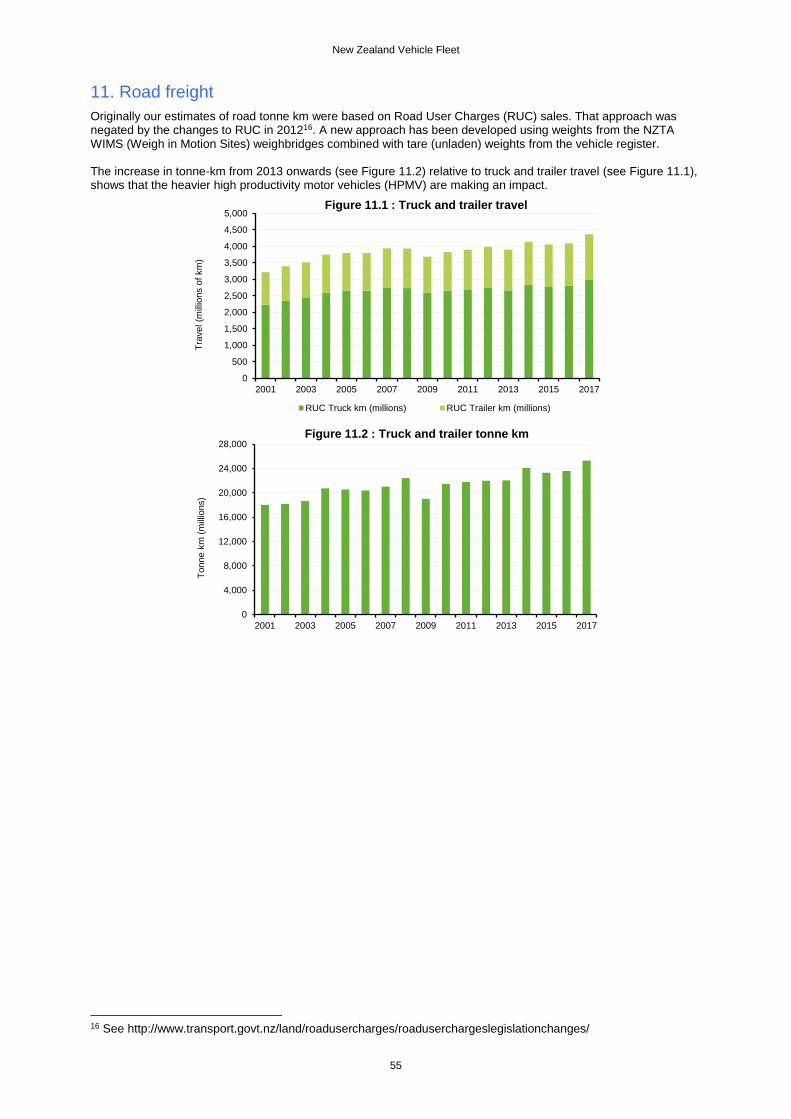
New Zealand Vehicle Fleet
55
11. Road freight
Originally our estimates of road tonne km were based on Road User Charges (RUC) sales. That approach was negated by the changes to RUC in 201216. A new approach has been developed using weights from the NZTA WIMS (Weigh in Motion Sites) weighbridges combined with tare (unladen) weights from the vehicle register. The increase in tonne-km from 2013 onwards (see Figure 11.2) relative to truck and trailer travel (see Figure 11.1), shows that the heavier high productivity motor vehicles (HPMV) are making an impact.
16 See http://www.transport.govt.nz/land/roadusercharges/roaduserchargeslegislationchanges/
0
500
1,000
1,500
2,000
2,500
3,000
3,500
4,000
4,500
5,000
2001 2003 2005 2007 2009 2011 2013 2015 2017
Tra
vel (m
illio
ns o
f km
)Figure 11.1 : Truck and trailer travel
RUC Truck km (millions) RUC Trailer km (millions)
0
4,000
8,000
12,000
16,000
20,000
24,000
28,000
2001 2003 2005 2007 2009 2011 2013 2015 2017
Tonne k
m (
mill
ions)
Figure 11.2 : Truck and trailer tonne km
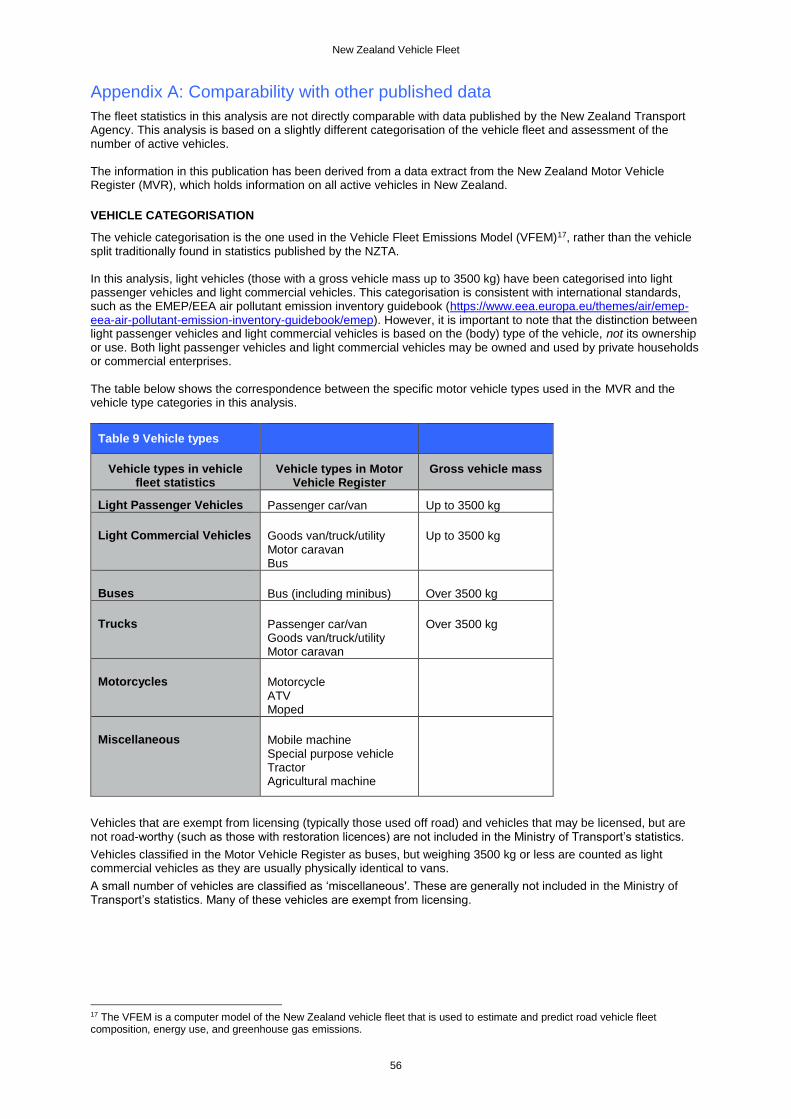
New Zealand Vehicle Fleet
56
Appendix A: Comparability with other published data
The fleet statistics in this analysis are not directly comparable with data published by the New Zealand Transport Agency. This analysis is based on a slightly different categorisation of the vehicle fleet and assessment of the number of active vehicles. The information in this publication has been derived from a data extract from the New Zealand Motor Vehicle Register (MVR), which holds information on all active vehicles in New Zealand.
VEHICLE CATEGORISATION
The vehicle categorisation is the one used in the Vehicle Fleet Emissions Model (VFEM)17, rather than the vehicle split traditionally found in statistics published by the NZTA. In this analysis, light vehicles (those with a gross vehicle mass up to 3500 kg) have been categorised into light passenger vehicles and light commercial vehicles. This categorisation is consistent with international standards, such as the EMEP/EEA air pollutant emission inventory guidebook (https://www.eea.europa.eu/themes/air/emep-eea-air-pollutant-emission-inventory-guidebook/emep). However, it is important to note that the distinction between light passenger vehicles and light commercial vehicles is based on the (body) type of the vehicle, not its ownership or use. Both light passenger vehicles and light commercial vehicles may be owned and used by private households or commercial enterprises. The table below shows the correspondence between the specific motor vehicle types used in the MVR and the vehicle type categories in this analysis.
Table 9 Vehicle types
Vehicle types in vehicle fleet statistics
Vehicle types in Motor Vehicle Register
Gross vehicle mass
Light Passenger Vehicles Passenger car/van Up to 3500 kg
Light Commercial Vehicles Goods van/truck/utility Motor caravan Bus
Up to 3500 kg
Buses Bus (including minibus) Over 3500 kg
Trucks Passenger car/van Goods van/truck/utility Motor caravan
Over 3500 kg
Motorcycles Motorcycle ATV Moped
Miscellaneous Mobile machine Special purpose vehicle Tractor Agricultural machine
Vehicles that are exempt from licensing (typically those used off road) and vehicles that may be licensed, but are not road-worthy (such as those with restoration licences) are not included in the Ministry of Transport’s statistics.
Vehicles classified in the Motor Vehicle Register as buses, but weighing 3500 kg or less are counted as light commercial vehicles as they are usually physically identical to vans.
A small number of vehicles are classified as ‘miscellaneous'. These are generally not included in the Ministry of Transport’s statistics. Many of these vehicles are exempt from licensing.
17 The VFEM is a computer model of the New Zealand vehicle fleet that is used to estimate and predict road vehicle fleet composition, energy use, and greenhouse gas emissions.
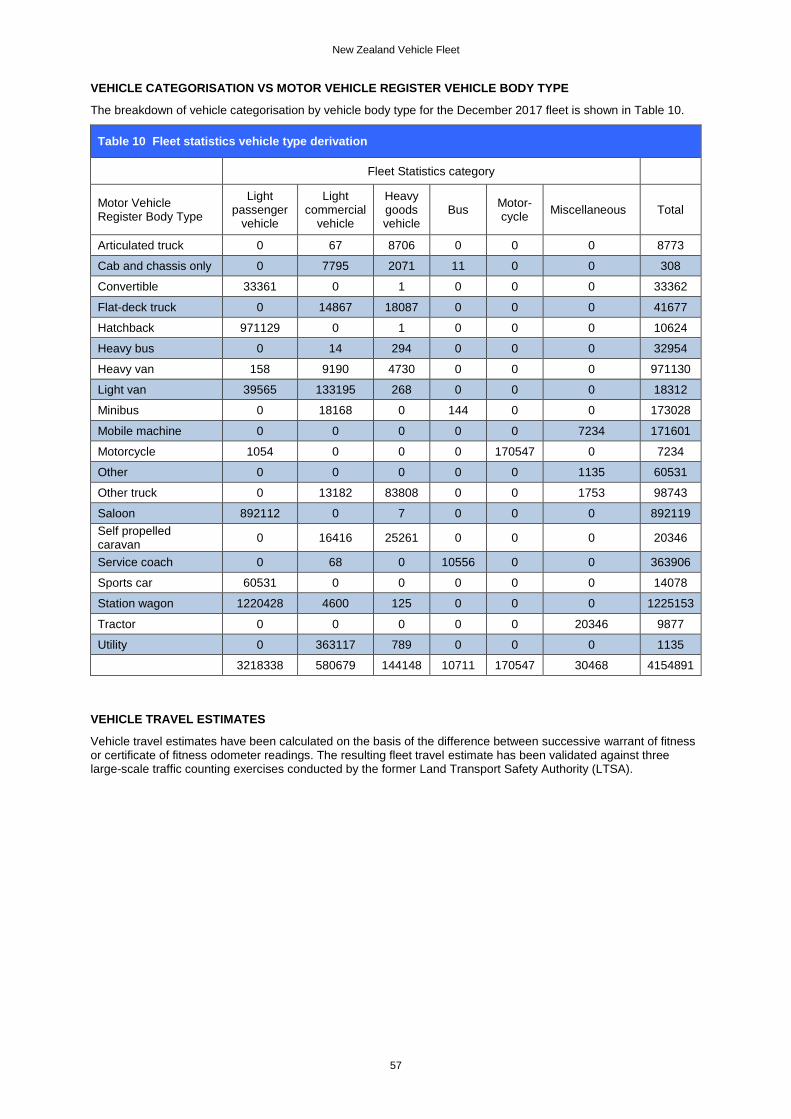
New Zealand Vehicle Fleet
57
VEHICLE CATEGORISATION VS MOTOR VEHICLE REGISTER VEHICLE BODY TYPE
The breakdown of vehicle categorisation by vehicle body type for the December 2017 fleet is shown in Table 10.
Table 10 Fleet statistics vehicle type derivation
Fleet Statistics category
Motor Vehicle Register Body Type
Light passenger
vehicle
Light commercial
vehicle
Heavy goods vehicle
Bus Motor-cycle
Miscellaneous Total
Articulated truck 0 67 8706 0 0 0 8773
Cab and chassis only 0 7795 2071 11 0 0 308
Convertible 33361 0 1 0 0 0 33362
Flat-deck truck 0 14867 18087 0 0 0 41677
Hatchback 971129 0 1 0 0 0 10624
Heavy bus 0 14 294 0 0 0 32954
Heavy van 158 9190 4730 0 0 0 971130
Light van 39565 133195 268 0 0 0 18312
Minibus 0 18168 0 144 0 0 173028
Mobile machine 0 0 0 0 0 7234 171601
Motorcycle 1054 0 0 0 170547 0 7234
Other 0 0 0 0 0 1135 60531
Other truck 0 13182 83808 0 0 1753 98743
Saloon 892112 0 7 0 0 0 892119
Self propelled caravan
0 16416 25261 0 0 0 20346
Service coach 0 68 0 10556 0 0 363906
Sports car 60531 0 0 0 0 0 14078
Station wagon 1220428 4600 125 0 0 0 1225153
Tractor 0 0 0 0 0 20346 9877
Utility 0 363117 789 0 0 0 1135
3218338 580679 144148 10711 170547 30468 4154891
VEHICLE TRAVEL ESTIMATES
Vehicle travel estimates have been calculated on the basis of the difference between successive warrant of fitness or certificate of fitness odometer readings. The resulting fleet travel estimate has been validated against three large-scale traffic counting exercises conducted by the former Land Transport Safety Authority (LTSA).
New Zealand Vehicle Fleet
58
Appendix B: Vehicles in the fleet
Background
Each year the Ministry produces a comprehensive set of vehicle fleet statistics; the New Zealand Annual Vehicle Fleet Statistics. It is accompanied by less detailed Quarterly Fleet Reports18. Both publications report road travel, which is derived from the change of odometer readings between Warrant of Fitness (WOF) and Certificate of Fitness (CoF) inspections. The vehicles reported on are those that are licensed to be used on the road, so vehicles exempt from licensing (not used on the roads) or not currently licensed are excluded. The key trends are fleet size, travel, road travel per vehicle and road travel per person. These trends underlie understanding of transport and transport infrastructure demand. It is important to determine when vehicles leave the fleet
Central to the fleet statistics are accurate measures of the total fleet size, fleet age and total distance travelled. There is good information on vehicles entering the fleet, but it is less certain when vehicles leave the fleet. Only around half the vehicles leaving the fleet are actively delicensed by their owners. Other vehicles which have not been relicensed remain active on the vehicle register for 12 months, for administrative reasons (henceforth the administrative approach). Most of those vehicles are not being used and if they are regarded as live we will overestimate the number of vehicles on the road. More importantly we will also overestimate travel, as these vehicles will be assumed to travel the typical distances that vehicle of their type and age do. Unlicensed vehicles cannot undergo WoF/CoF so there will not be any odometer readings for them, hence the use of averages. The Ministry’s approach used to take vehicles out of the fleet (and travel estimation) when their WoF/CoF was overdue by 6 months (the WoF-based approach). The WoF-based approach to removing vehicles was chosen because it gave a good match with the traffic counting survey estimates19. However, the WoF-based approach is no longer viable. Changes to the WoF that took effect in 201420 mean much of the fleet is now on 3 year (vehicles under 3 years old) and 1 year WoF cycle (vehicles manufactured from 2000 onwards) rather than a 6 monthly cycle. Developing a new approach to determining when vehicles leave the fleet
Under the old WoF regime the vast majority of vehicles that were not actively deregistered would have left the fleet because they failed their 6 monthly WoF test and the owner elected to scrap rather than repair the vehicle. However, the growing number of vehicles on longer WoF cycles means using overdue WoF as a guide to scrappage will overestimate the size of the fleet and distort the statistics. This distortion will grow with time as more vehicles move to an annual WoF/CoF Cycle. The Ministry has therefore needed to develop a new mechanism to provide estimates of the fleet size and travel. We have reviewed several options for determining when vehicles leave the fleet. Adjust scrap dates to align vehicle removal more closely with the WoF approach
We know that there will be a relationship between when vehicles are removed using the administrative approach, and when the WoF-based approach would have taken the vehicle out of the fleet. We considered pushing the eventual administrative removal dates forward by a number of months to align them with the old approach, but we are not confident that relationship will endure as more vehicles move to one year WoF/CoF cycles. This method would also involve waiting a year until lapsed status is definite, which would have delayed reporting unreasonably. It was not considered further.
18 https://www.transport.govt.nz/resources/vehicle-fleet-statistics/ 19 The survey points in the road travel graph are from a series of large-scale traffic-counting exercises conducted by the LTSA then the Ministry of Transport. A sample frame was devised so that the counts done at those locations could provide a good national travel estimate and they are considered to be robust estimates. 20 www.transport.govt.nz/land/vehiclelicensingreformconsultation/
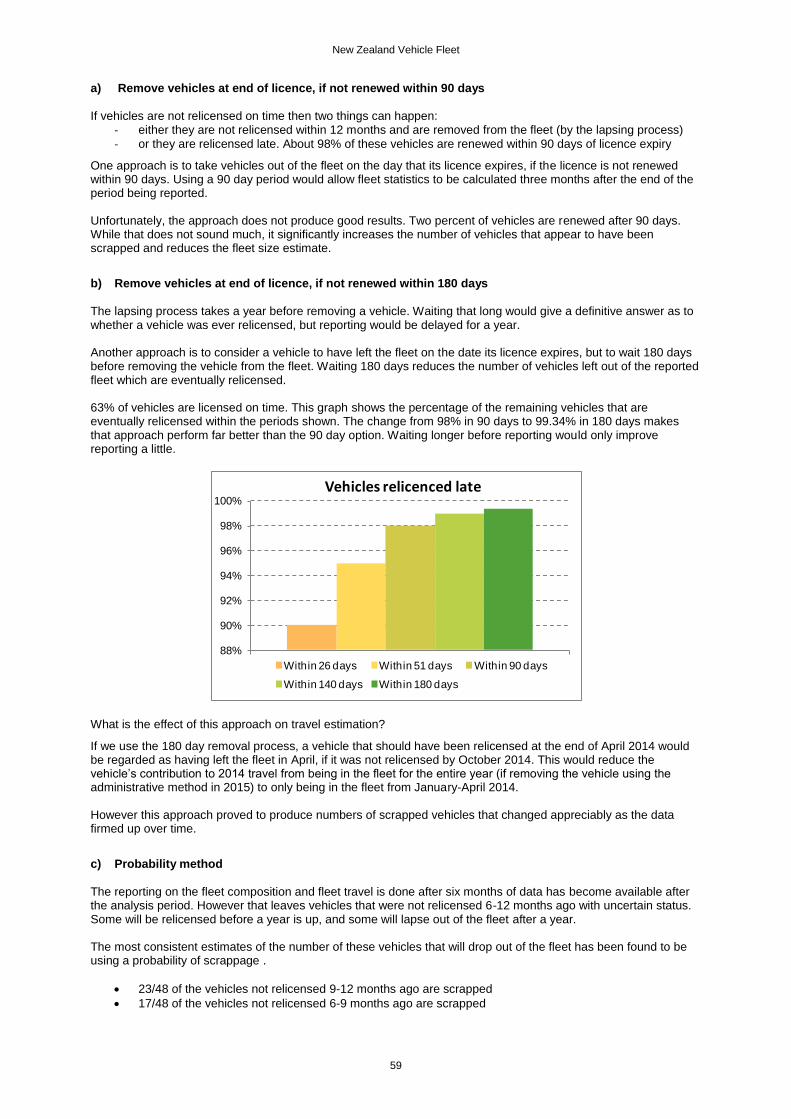
New Zealand Vehicle Fleet
59
a) Remove vehicles at end of licence, if not renewed within 90 days
If vehicles are not relicensed on time then two things can happen:
- either they are not relicensed within 12 months and are removed from the fleet (by the lapsing process)
- or they are relicensed late. About 98% of these vehicles are renewed within 90 days of licence expiry
One approach is to take vehicles out of the fleet on the day that its licence expires, if the licence is not renewed within 90 days. Using a 90 day period would allow fleet statistics to be calculated three months after the end of the period being reported. Unfortunately, the approach does not produce good results. Two percent of vehicles are renewed after 90 days. While that does not sound much, it significantly increases the number of vehicles that appear to have been scrapped and reduces the fleet size estimate.
b) Remove vehicles at end of licence, if not renewed within 180 days
The lapsing process takes a year before removing a vehicle. Waiting that long would give a definitive answer as to whether a vehicle was ever relicensed, but reporting would be delayed for a year. Another approach is to consider a vehicle to have left the fleet on the date its licence expires, but to wait 180 days before removing the vehicle from the fleet. Waiting 180 days reduces the number of vehicles left out of the reported fleet which are eventually relicensed. 63% of vehicles are licensed on time. This graph shows the percentage of the remaining vehicles that are eventually relicensed within the periods shown. The change from 98% in 90 days to 99.34% in 180 days makes that approach perform far better than the 90 day option. Waiting longer before reporting would only improve reporting a little.
What is the effect of this approach on travel estimation?
If we use the 180 day removal process, a vehicle that should have been relicensed at the end of April 2014 would be regarded as having left the fleet in April, if it was not relicensed by October 2014. This would reduce the vehicle’s contribution to 2014 travel from being in the fleet for the entire year (if removing the vehicle using the administrative method in 2015) to only being in the fleet from January-April 2014.
However this approach proved to produce numbers of scrapped vehicles that changed appreciably as the data firmed up over time.
c) Probability method
The reporting on the fleet composition and fleet travel is done after six months of data has become available after the analysis period. However that leaves vehicles that were not relicensed 6-12 months ago with uncertain status. Some will be relicensed before a year is up, and some will lapse out of the fleet after a year. The most consistent estimates of the number of these vehicles that will drop out of the fleet has been found to be using a probability of scrappage .
23/48 of the vehicles not relicensed 9-12 months ago are scrapped
17/48 of the vehicles not relicensed 6-9 months ago are scrapped
88%
90%
92%
94%
96%
98%
100%
Vehicles relicenced late
Within 26 days Within 51 days Within 90 days
Within 140 days Within 180 days

New Zealand Vehicle Fleet
60
There is a limited amount of change as the data firms up 9 and 12 months past the period being analysed – that is the price of reporting 6 months after the analysis period.