annual reportinvestors.bemis.com/.../files/doc_library/file/031802ar.pdf · net income 140,325...
TRANSCRIPT

®
Bemis Company Inc.
222 South 9th Street
Suite 2300
Minneapolis, MN 55402
w w w. b e m i s. co m a n n u a l re p o r t
2001

45
Shareholder Information
Financial Information
Upon written request, the Company
will, at no charge, provide a copy of its
most recent Form 10-K filed with the
Securities and Exchange Commission.
Additional financial information is
available on the Bemis web site
(www.bemis.com) or by contacting:
Melanie E.R. Miller
Director of Investor Relations
Bemis Company, Inc.
222 South Ninth Street
Suite 2300
Minneapolis, MN 55402-4099
612-376-3000
E-mail: [email protected]
Dividend Reinvestment Plan
Information on the Company’s
Dividend Reinvestment Plan is
available by contacting:
Wells Fargo Bank Minnesota
Dividend Reinvestment Department
161 North Concord Exchange
South St. Paul, MN 55075
651-450-4064 or 1-800-468-9716
Transfer Agent and Registrar
Wells Fargo Bank Minnesota
Wells Fargo Shareowner Services
161 North Concord Exchange
South St. Paul, MN 55075
651-450-4064 or 1-800-468-9716
Bemis Common Stock
Bemis stock is traded on the New York
Stock Exchange under the symbol
BMS, and is a component of the S&P
500 index.
Annual Meeting
May 2, 2002, at 9:00 a.m. in the
Main Lounge of the Minneapolis
Club, 729 2nd Avenue South,
Minneapolis, Minnesota.
© Bemis Company, Inc. 2002Brownberry® is a registered trademark of Arnold Products, Inc., used with permission.
Bemis Company, Inc. and Subsidiariesfinancial highlights
Years Ended December 31,(dollars in thousands, except per share amounts) 2001 2000 % Change
Sales and Earnings:
Net sales $2,293,104 $2,164,583 6%
Income before income taxes 227,425 211,502 8
Provision for income taxes 87,100 80,900 8
Net income 140,325 130,602 7
Per Share:
Basic earnings per share $ 2.66 $ 2.46 8%
Diluted earnings per share 2.64 2.44 8
Dividends paid 1.00 .96 4
Book value 16.76 15.18 10
Ratios:
Net income to net sales 6.1% 6.0%
Return on average stockholders’ equity 16.7% 17.1%
Return on average total capital 10.0% 10.8%
Total debt to total capital 37.3% 42.7%
Additional Information:
Capital expenditures $ 117,481 $ 100,420 17%
EBITDA* $ 381,915 $ 351,241 9
Stock price/earnings ratio range 11-20x 10-16x
Weighted-average common shares outstanding
for computation of diluted earnings per share 53,121,798 53,552,703 (1)
Common shares outstanding at year-end 52,869,929 52,602,414 1
Number of employees 11,012 10,969
*EBITDA is defined as earnings before interest, income taxes, depreciation, and amortization. It is not a measure of operating results, nor is it presented in our consolidated financial statements. EBITDA is not considered a qualified financial measurement under U.S. generally acceptedaccounting principles (GAAP).

Bemis Business Segments
Bemis is the leading manufacturer of flexible packaging
in the Americas. We provide multinational and North
American food and consumer products companies with
packaging solutions that protect contents during ship-
ment, extend shelf life, and offer attractive, consumer
friendly designs. Over 60% of Flexible Packaging sales
are printed film materials. The balance are sold as
plain film for retail and institutional food as well as a
variety of other markets.
High barrier products include controlled and modifiedatmosphere packaging for food, medical, personalcare and non-food applications consisting of complexbarrier, multi-layer polymer film structures and lami-nates. Value is added through flexographic androtogravure printing as well as pouch making.
Primary markets are processed and fresh meat, liquids,snacks, cheese, coffee, condiments, candy, pet food,personal care and medical packaging.
Polyethylene products include monolayer and coex-truded polymer films that have been converted tobags, roll stock or shrink overwrap. Value is addedthrough flexographic printing.
Primary markets are bakery products, seed, retail,lawn and garden, ice, fresh produce, frozen vegetables,shrink wrap, tissue and sanitary products.
Paper products include multi-wall and single plypaper bags, balers, printed paper roll stock, and bagclosing materials.
Primary markets are pet products, seed, chemicals,dairy products, fertilizers, feed, minerals, flour, rice and sugar.
Note: Certain products which had been previously included in “polyethylene products” have been moved to “high barrier products” to reflect the
increased complexity of the package technology in 2001.
Bemis is a major worldwide manufacturer of pressure
sensitive adhesive coated materials for a variety of markets.
Under the brand name MACtac, Bemis delivers
advanced product performance to the pressure sensitive
industry. Examples of these products include labeling for
cold temperature food packaging, harsh environmental
conditions, wet manufacturing processes, miniature
electronic components, tamper evident packaging and
technologically advanced fastener applications.
Printing products include unprinted rolls of pressure sensitive adhesive coated papers and films.Our productsare sold to converters who print labels for bar coding,product decoration, identification, safety marking andproduct instructions.
Decorative and sheet products include unprinted rollsor sheets of pressure sensitive adhesive coated papersand films. Offset printers, sign makers and photo labsuse our products with short-run and/or digital printingtechnology to create labels, signs, or vehicle graphics.
Technical products include pressure sensitive adhesivecoated tapes used for mounting, bonding and fasten-ing. Tapes sold to medical markets feature medical-grade adhesives suitable for direct skin contact.
Primary markets are food packaging, personal careproduct packaging, inventory control labeling andlaser/ink jet printed labels.
Primary markets are printed sheets, shipping labels,indoor and outdoor signage, photograph and digitalprint overlaminates and vehicle graphics.
Primary markets are batteries,electronics,automotive,construction, medical and pharmaceuticals.
49%
21%
9%
11 %7 %
3 %
flexible packaging pressure sensitive materials
High Barrier Products
Polyethylene Products
Paper Products Technical Products
Decorative and Sheet Products
Printing Products
21 %
79%

Bemis Business Segments
Bemis is the leading manufacturer of flexible packaging
in the Americas. We provide multinational and North
American food and consumer products companies with
packaging solutions that protect contents during ship-
ment, extend shelf life, and offer attractive, consumer
friendly designs. Over 60% of Flexible Packaging sales
are printed film materials. The balance are sold as
plain film for retail and institutional food as well as a
variety of other markets.
High barrier products include controlled and modifiedatmosphere packaging for food, medical, personalcare and non-food applications consisting of complexbarrier, multi-layer polymer film structures and lami-nates. Value is added through flexographic androtogravure printing as well as pouch making.
Primary markets are processed and fresh meat, liquids,snacks, cheese, coffee, condiments, candy, pet food,personal care and medical packaging.
Polyethylene products include monolayer and coex-truded polymer films that have been converted tobags, roll stock or shrink overwrap. Value is addedthrough flexographic printing.
Primary markets are bakery products, seed, retail,lawn and garden, ice, fresh produce, frozen vegetables,shrink wrap, tissue and sanitary products.
Paper products include multi-wall and single plypaper bags, balers, printed paper roll stock, and bagclosing materials.
Primary markets are pet products, seed, chemicals,dairy products, fertilizers, feed, minerals, flour, rice and sugar.
Note: Certain products which had been previously included in “polyethylene products” have been moved to “high barrier products” to reflect the
increased complexity of the package technology in 2001.
2000
Bemis is a major worldwide manufacturer of pressure
sensitive adhesive coated materials for a variety of markets.
Under the brand name MACtac, Bemis delivers
advanced product performance to the pressure sensitive
industry. Examples of these products include labeling for
cold temperature food packaging, harsh environmental
conditions, wet manufacturing processes, miniature
electronic components, tamper evident packaging and
technologically advanced fastener applications.
Printing products include unprinted rolls of pressure sensitive adhesive coated papers and films.Our productsare sold to converters who print labels for bar coding,product decoration, identification, safety marking andproduct instructions.
Decorative and sheet products include unprinted rollsor sheets of pressure sensitive adhesive coated papersand films. Offset printers, sign makers and photo labsuse our products with short-run and/or digital printingtechnology to create labels, signs, or vehicle graphics.
Technical products include pressure sensitive adhesivecoated tapes used for mounting, bonding and fasten-ing. Tapes sold to medical markets feature medical-grade adhesives suitable for direct skin contact.
Primary markets are food packaging, personal careproduct packaging, inventory control labeling andlaser/ink jet printed labels.
Primary markets are printed sheets, shipping labels,indoor and outdoor signage, photograph and digitalprint overlaminates and vehicle graphics.
Primary markets are batteries,electronics,automotive,construction, medical and pharmaceuticals.
49%
21%
9%
11 %7 %
3 %flexible packaging pressure sensitive materials
High Barrier Products
Polyethylene Products
Paper Products Technical Products
Decorative and Sheet Products
Printing Products
21 %
79%

2
A Message to Our
We are very pleased to report that 2001 was another record year for Bemis. This strong performance in a difficult economic environment reflects our diligent adherence to a successful long-term business strategy and the resilience of our selected markets.
Highlights of the past year include:• Record sales of $2.3 billion, an increase of 6% over 2000;• 8% earnings growth to $2.64 per share;• 9% increase in earnings before interest, income taxes, depreciation and amortization
(EBITDA) to $382 million;• Strong 9% sales growth and 23% operating profit growth in our largest business segment,
Flexible Packaging, representing 79% of company sales;• Cash flow from operating activities increased to $318 million from $210 in the prior year;• Our high barrier product line expanded with the purchase of Duralam, Inc.;• Our Pressure Sensitive Materials business segment was reorganized for improved efficiency.
Flexible PackagingOur flexible packaging business provides packaging primarily to food and consumer productsindustries, making it less sensitive to economic cycles than other businesses. Operating profitmargins in this business improved to 15% in 2001 compared to about 13% in 2000.Expanded capacity allowing more efficient use of plant facilities, excellent cost managementand new product innovation all contributed to this profitability in 2001.
Our high barrier product line continues to be the beneficiary of most of our packaging innovations. New packaging concepts introduced during the year spread quickly through theproduct categories, prompting more value added consumer convenience features and productline extensions. The division between our high barrier and polyethylene product lines isbecoming blurred, as more and more customers are looking to extend shelf life with barrierfilms and increase the visibility of their products on store shelves by offering consumer convenience features and high quality brand graphics. This gives Bemis additional opportunities
1
the company
Letter to Shareholders 2
Management’s Discussion & Analysis 19
Five-Year Consolidated Review 25
Consolidated Financial Statements 27
Notes to Consolidated Financial Statements 33
Company Operations 43
Directors, Officers & Operations Management 44
Shareholder Information 45
table of contents
Bem
is Bemis is a leading manufacturer of flexible packaging and pressure
sensitive materials. More than 75 percent of the Company’s sales
are packaging related.
The primary market for the Company’s products is the food industry,
which accounts for over sixty-five percent of sales. Other markets
include medical, pharmaceutical, chemical, agribusiness, printing
and graphic arts, and a variety of other industrial end uses. Bemis
holds a strong position in many of its markets and actively seeks
new market segments where its technical skill and other capabilities
provide a competitive advantage.
The Company has a strong technical base in polymer chemistry,
film extrusion, coating and laminating, printing and converting, and
pressure sensitive adhesive technologies. These capabilities are being
integrated to provide greater innovation and accelerated growth in
the Company’s core businesses.
Bemis’ management philosophy is to emphasize long-term develop-
ment and profitability and to position the Company in product
and market segments where above average revenue growth and
profit potential can be realized. Emphasis is placed on market
selection, product innovation, and continued efficient and
environmentally sound manufacturing processes. The Company’s
more technically oriented, higher margin, flexible packaging
and pressure sensitive materials businesses are being actively
expanded through a strong capital investment program and
selected strategic acquisitions.

3
Shareholders
to integrate our proprietary film structures and value-added technologies into the sales mixand drives operating margin growth. At the same time, we continue to see a steady migrationof products from rigid into flexible packaging.
Our shrink packaging business, acquired in 2000, has been successfully integrated into ourmarketing efforts to provide a substantially broader product offering to our meat and cheesecustomers. We are merging this patented shrink technology with our existing high barriertechnology to bring new products to many food, consumer products and industrial markets.
We continue to look for opportunities to profitably expand in international markets.Enhancements of technology at our existing European and South American operations willcomplement our product lines.
The September, 2001 acquisition of Duralam, a meat, cheese and confectionery packagingcompany located very near our existing high barrier operations in Wisconsin, brought with it aloyal customer base and efficient but underutilized production facilities. The rapid integrationof these facilities allowed us to readily capture synergies and successfully transition the Duralambusiness.
The polyethylene packaging business continued to deliver strong performance this year. Bemisis the leading supplier of polyethylene packaging for food and consumer products such asbread, ice, frozen foods, tissue products, and sanitary products. Printed shrink film is also agrowing market, used primarily for unitizing multipacks of canned food products, bottled waterand other beverages. Our emphasis on cost management coupled with the ongoing success ofour focused factory approach led to solid profit improvement for the year.
In July of 2001, we purchased a packaging plant in Prattville, Alabama, which had been closedearlier in the year. We have reopened this modern facility with a skilled, local workforce, andplan to establish this as a focused factory for our polyethylene product lines.

4
Operating profits in the paper packaging product line nearly doubled this year thanks to costmanagement and improved production efficiency. We continue to focus on pet food productswith a focused factory dedicated to that market. Our marketing efforts have effectively integratedour high barrier expertise with that of paper packaging, offering pet product customers a broad array of packaging options from both product lines. In pet food as well as agricultureand chemical products markets, we are bringing innovation to our customers in the form ofstronger materials and improved features to increase bag filling speeds and incorporate easyopening features.
Pressure Sensitive Materials SegmentThis business is entering 2002 a much stronger business than it was in 2001. During 2001, aweak industrial economy and decreased demand for pressure sensitive materials adverselyaffected the performance of our pressure sensitive materials business segment. The changeswe made in 2001 have positioned this business to successfully meet those market challengesand deliver improving results.
We have realigned the organization, centralizing common functions and reducing overhead.We have identified products and markets where the technologies of our pressure sensitivematerials segment can create unique marketing solutions for our customers. Our research anddevelopment function was enhanced with experience from our successful flexible packagingbusiness, and is supporting the business with renewed emphasis on product development and innovation.
New plant management at three of our facilities implemented six sigma programs that haveimproved quality control, manufacturing waste, and customer service. Six sigma programsthroughout the pressure sensitive materials facilities (and in several flexible packaging facilities)are leading the drive for increased profitability and product quality.
The Kanzaki product lines that were purchased in 2000 were successfully transitioned to our facilities during the second quarter of 2001. We also qualified for and began production on ourfirst contract for United States Postal Service stamp materials.
We expect 2002 to benefit from the improving manufacturing performance of this business,better focus and strengthening customer relationships.
Our Formula for Business ExcellenceOur leadership position in flexible packaging and in our pressure sensitive materials markets is supported by our dedication to using technology and innovation to influence the selected marketsthat we serve. Our technical personnel use the latest technology and state-of-the-art facilities todevelop solutions that improve the quality of our products and create growth opportunities forboth Bemis and our customers. We are dedicated to being the leading innovator of the packagingindustry, and applying our knowledge and expertise to create unique, proprietary solutions forour customers.
Manufacturing excellence represents a goal of continuous improvement in production efficiencyand product quality. Capacity expansion in 2001 relieved the scheduling conflicts of 2000 andwill allow plants to create additional focused production lines, further improving productionand scheduling efficiencies. The plants that we acquired in 2000 and 2001 were effectivelyintegrated into our focused factory blueprint, with production equipment dedicated to specificprocesses or markets to promote the highest levels of quality and operating efficiency. Ourfocused factory approach allows us to tailor our state-of-the-art facilities to the specific needsof a particular market, giving us a competitive advantage in that marketplace.

5
John H. Roe, Chairman Jeffrey H. Curler, President and Chief Executive Officer
A Formula forBusiness Excellence
The third important component of our formula is customer focus. Bemis operates in the marketplace as many decentralized businesses, each with their own market focused expertiseand identity. Many of our customers work with more than one of the Bemis businesses. Our“One Bemis” program combines the talents and expertise of each of our decentralized businesses to “bring the best of what Bemis has to offer to each and every customer.” By dedicating asenior account executive to coordinate all of the resources and products of Bemis, customersare able to find all of their solutions in one place. Our customers work closely with Bemistechnicians to develop and test new products, design package graphics, implement electronicexchange of information, and improve efficiency on their packaging lines.
We believe that the combination of these three disciplines will differentiate Bemis in the marketplace, secure our position as the leading supplier of flexible packaging in theAmericas, and build strong customer relationships. Using this formula for business excellence,we will continue to deliver value to our customers, our shareholders and our employees.
Business OutlookWe enter 2002 in a strong financial and competitive position, having just achieved recordsales, earnings, and cash flow levels for 2001. The acquisitions that we have made over the lasttwo years have been fully integrated, transitions of production facilities are complete, andmarketing efforts continue to capitalize on the “One Bemis” philosophy. Cash flow improvedconsiderably during 2001, reflecting our strong operating performance and improved workingcapital management. Future capital investments will focus on developing new technology andproducts to support our ongoing commitment to innovation in key markets. The addition oftwo new facilities purchased in 2001 has provided additional capacity for the future. Strategicacquisitions will continue to be a key part of our growth strategy to add value and strengthenour leadership position in the industry.
Our long-term financial goals remain unchanged: deliver consistent, double-digit growth inearnings per share and cash flow, improve return on capital ratios, and maintain a strong capitalstructure to maximize our financial flexibility.
We are pleased with the success of the company and the achievements of over 11,000 dedicatedand talented employees. We are grateful to all of them for their efforts and would like to expressour appreciation for the continued support and confidence of our customers, suppliers andshareholders.
6
Since 1858, Bemis has used material science and ingenuity to deliver innovationto our customers and maintain our competi-tive advantage.
sci.ence ( ) latin: siencia; n.1. Knowledge, especially when
gained through experience.

7
“Holiday Santas” and “United WeStand” are two of the first postageissues manufactured by MACtac since receiving US Post Office qualifi-cation. The material constructionshad to meet rigorous performancerequirements set by the Postal Service including water removability,repulpability,and phosphor levels con-sistent in providing a high caliberpostage stamp.
Bemis is bringing innovation to itspaper bag product line through theuse of high performance papers and unique package design whichincreases package filling rates,reduces product loss, and improveshandling and logistics for customers.
Bemis is the leading provider of chunkcheese packaging in North America.We use proprietary film structuresdesigned to provide a reliable sealand extend the product shelf life. Ourbarrier shrink film is also ideal forchunk cheese sizes that are too largefor regular packaging lines.
Our proprietary ICE® film coextrusiontechnology delivers superior memoryretention, gloss, and clarity for premium food products. Specialtyresins are incorporated into the filmto ensure excellent seal integrity onhigh speed packaging equipment.
Stamp Design ©2001 U.S. Postal Service.Reproduced with Permission. All rights reserved.
technology & innovation
Material science is the foundation of our business. Using ourextensive knowledge of plastic and plastic resins, film structure,
paper characteristics, adhesive coatings, and extrusion and coating
manufacturing processes, we focus our efforts on finding the right
combination of materials to maximize product performance.
In our flexible packaging business segment, our high barrier and
polyethylene product lines are vertically integrated. We buy a
variety of plastic resins from which we create proprietary film
structures. This significantly improves our cost structure as well as
our ability to provide the market with our own proprietary products.
We custom design film packages to meet the special needs of each
customer application, protecting the contents of the package and
incorporating convenience features that are in high demand from
consumers. Our paper packaging products incorporate specialty
papers and unique valve features to deliver package characteristics
that bring innovation to the market, improve performance and
reduce cost.
In our pressure sensitive materials business, we seek out film, paper
and adhesive products with specific characteristics that combine
with our lamination processes to create unique, superior products
in niche markets.
Bemis’ market innovation is supported by a talented team of technical
personnel, including chemical, process, mechanical and electrical
engineers, chemists, and product development experts. These people
are problem solvers, working directly with product teams to develop
unique film structures that meet the packaging needs of our cus-
tomers. Development of new products is carried out primarily on
our production equipment, not in small-scale pilot plants, so solu-
tions are tested with real production variances and tolerances and can
be quickly moved to market. Our technical teams also interact with
our customers’ technical and manufacturing personnel in their
manufacturing plants to provide service and technical support.
We believe that through Bemis’ focus on technology and innovation,
we can provide unique solutions for our customers and give both
Bemis and our customers a competitive advantage in the marketplace.

8
sci.ence ( ) latin: siencia; n.2. Learning or study concerned with
phenomena of physical science.
Understanding the characteristics of theapplication is key to delivering a high quality,innovative product. At Bemis, we under-stand the nature of each product application,from filling process to distribution; fromshelf life to consumer environment.

9
science & research
Bemis studies the physical characteristics of both the products we
produce and the applications to which our products will be applied.
Package contents may be damaged by oxygen, light, heat or moisture.
The contents may give off gases. The filling process may require the
package to seal through grease, moisture, or product shavings, or
withstand the abuse of sharp, frozen objects. The distribution
process may cause friction on the outside of the package or subject
it to sunlight or weather. The product may be stored under pressure,
in a freezer or heated in a microwave oven. The contents may be
powdery, greasy or corrosive. All of these factors impact our design
of the package or the appropriate label adhesive product.
Understanding the physical nature of an application, Bemis delivers
a product that is custom designed to maximize product performance.
As the demand for prepared foodsand meal kits grows, the need forsophisticated high barrier film struc-tures increases. This film has beencustom designed to protect the shelflife of ground beef and prevent theflavor aromas from escaping thepackage.
Shredded cheese requires a high techpackage to protect its shelf life whileincorporating convenience features.This easy open package uses ourIntegraScore® opening feature toaccess a recloseable slider.The barrierfilm is customized based upon thetype of cheese inside. Some cheesesgive off gases as they age, and theirpackage is custom designed to allowthose gases to be released while pre-venting oxygen from entering.
Our MACmark® brand marking films are used extensively in fleetgraphics. Our proprietary adhesives and films are easy to apply andprovide exceptional visual appeal, durability and performance.
This package incorporates a special,breathable barrier that allows theoxygen released by the produce toescape and extends shelf life.
The plastic liners for cereals keep contents fresh and extend shelf life.Fruity cereals require additional barrier film qualities to lock in the aromas and release a burst of flavorwhen opened.

10
art (art) n.1. To become skilled at doing something
through constant repetition or practice.
Bemis uses a “focused factory” manufacturingblueprint to create a level of manufacturingexpertise and efficiency that is unmatched inthe industry. We dedicate certain productionlines and entire manufacturing facilities to production of a particular type ofproduct or process.

11
focused manufacturing
A machine that is devoted to a specific type of product experiences
less downtime, can be tailored to meet industry specific customer
needs, and allows the operator to become an expert at its operation. In
our focused factories, tailored production equipment improves
efficiency and reduces cost, while delivering a customized, value-added
product to the customer at a competitive price.
We maintain focused factories in flexible packaging for shrink film, cold
seal processes, bakery bags, pet food multiwall paper bags, and
medical device packaging. In our pressure sensitive materials business,
we dedicate plants to printing, distribution, and decorative products.
In our other facilities, we also apply this philosophy on a smaller
scale to dedicate certain production lines within a plant to a particular
type of packaging.
Our six medical packaging facilitiesare located in North America, Europeand Asia, and meet the medicaldevice industry’s stringent manufac-turing quality standards for sterilepackaging.
Our packaging plants tailor packagegraphics for the latest promotionsand offer customized package con-veniences such as built in handles andeasy opening features.
Bakery bags are an important marketfor Bemis. Our focused polyethylenebakery bag factory produces over 4 billion bags annually.
About fifty percent of our multiwallpaper packaging products are used inthe pet food industry. Bemis' focusedpaper bag factory for pet food hasimproved manufacturing efficiencyand customer service.
Self-adhesive vinyls are used for interior decoration. This Italian restaurant window display depicts underwater and treasure island themes creating a colorful atmospherefor patrons.

12
Using premium materials,customized for a particularapplication, and manufacturedin state-of-the-art facilities, Bemis
delivers high performanceproducts to our customers.
art (art) n.2. High quality
of execution.

13
customer focus
Our customers rely on our products to build their brand recognition
and maximize their market share. A high percentage of the pack-
aging that we produce is printed, often with complex, high quality
graphics that require experience and skill to reproduce. Bemis
operates more color printing presses than any other packaging
company in the world. Our highly trained technicians are recog-
nized for their superior quality graphic design and color separation
expertise. Reliability is also key to delivering a premium product.
Our focused factories meet the special needs of particular industries
without sacrificing the needs of other customers. Our engineers
focus on understanding the nature of each application, to provide
both support and consultation in package and adhesive design
and performance. Our pressure sensitive materials optimize the
benefits of the latest printing technology to maintain our customers’
competitive edge.
At Bemis, we proudly support our customers with practical
solutions to the challenges of today and deliver the innovations of
tomorrow.
As a leading supplier of packagingto the processed meat industry,Bemis has expanded the market forits superior puncture resistant film topet treats, pizza and liquid packaging.
Our peelable package system isdesigned to display a “clean peel”lacquer transfer when opened. Thisis ideal for tamper evident packagesand “Peel & Stop” applications.
As consumers look for economicalbulk packages, our customers wanthigh visibility for their brand name.Our shrink film holds multipackssecurely while retaining high qualitybrand graphics.
These colorful packages incorporatebarrier film to protect freshness and aconvenient zipper closure. Bemisgraphic designers separate these newhigh quality graphic images into aseries of color dots that are preciselyreproduced to deliver a brilliantimage.
Our pressure sensitive marking films and laminates were ideal for this high profile buildingdecoration celebrating the official launch of the Euro. The 2000 square meter decorationswere installed on selected buildings in Brussels, Athens, Berlin, Madrid and Vienna in diffi-cult weather conditions including snow, wind and freezing temperatures.

14
“One Bemis”
BEMIS PAPER PACKAGING GROUP
A Bemis Company
15
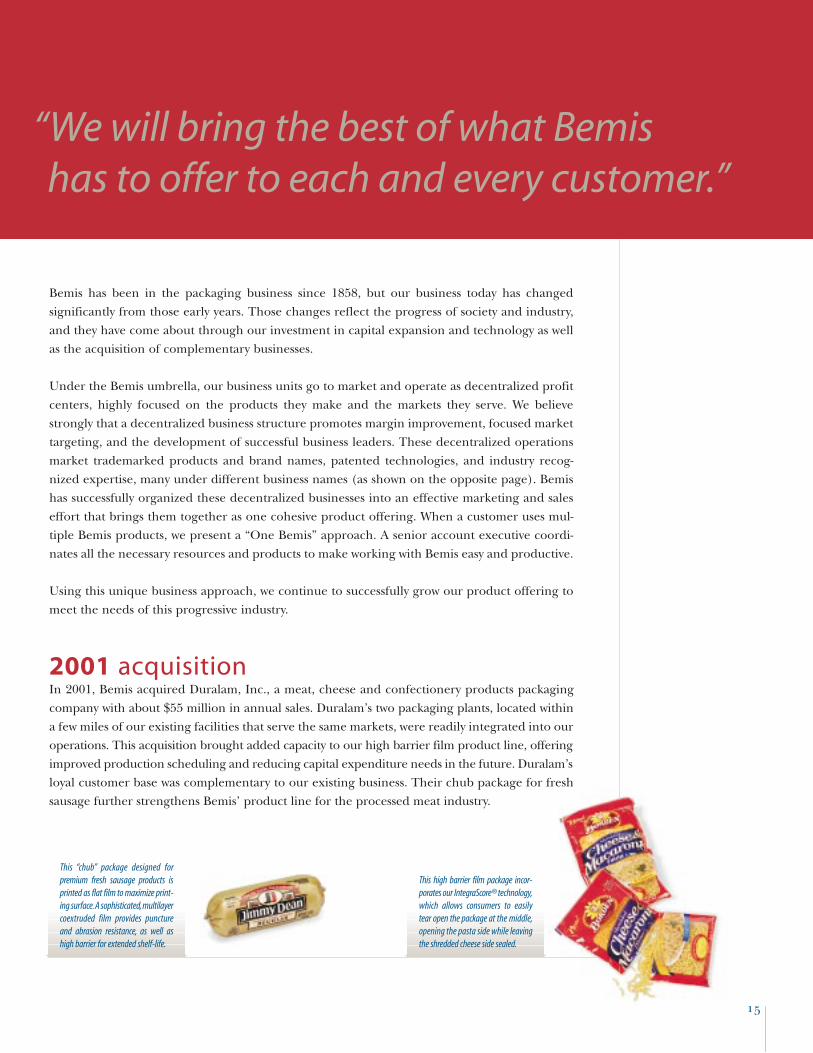
“We will bring the best of what Bemis has to offer to each and every customer.”
Bemis has been in the packaging business since 1858, but our business today has changed
significantly from those early years. Those changes reflect the progress of society and industry,
and they have come about through our investment in capital expansion and technology as well
as the acquisition of complementary businesses.
Under the Bemis umbrella, our business units go to market and operate as decentralized profit
centers, highly focused on the products they make and the markets they serve. We believe
strongly that a decentralized business structure promotes margin improvement, focused market
targeting, and the development of successful business leaders. These decentralized operations
market trademarked products and brand names, patented technologies, and industry recog-
nized expertise, many under different business names (as shown on the opposite page). Bemis
has successfully organized these decentralized businesses into an effective marketing and sales
effort that brings them together as one cohesive product offering. When a customer uses mul-
tiple Bemis products, we present a “One Bemis” approach. A senior account executive coordi-
nates all the necessary resources and products to make working with Bemis easy and productive.
Using this unique business approach, we continue to successfully grow our product offering to
meet the needs of this progressive industry.
2001 acquisitionIn 2001, Bemis acquired Duralam, Inc., a meat, cheese and confectionery products packaging
company with about $55 million in annual sales. Duralam’s two packaging plants, located within
a few miles of our existing facilities that serve the same markets, were readily integrated into our
operations. This acquisition brought added capacity to our high barrier film product line, offering
improved production scheduling and reducing capital expenditure needs in the future. Duralam’s
loyal customer base was complementary to our existing business. Their chub package for fresh
sausage further strengthens Bemis’ product line for the processed meat industry.
This “chub” package designed for premium fresh sausage products isprinted as flat film to maximize print-ing surface.A sophisticated,multilayercoextruded film provides punctureand abrasion resistance, as well ashigh barrier for extended shelf-life.
This high barrier film package incor-porates our IntegraScore® technology,which allows consumers to easily tear open the package at the middle,opening the pasta side while leavingthe shredded cheese side sealed.

16
Bemis’ primary markets have consistently grown, even duringtimes of economic weakness.
With over sixty-five percent of our products used in the food industry, and another ten percent
for packaging consumer products like diapers and paper towels, one has only to stroll through
the grocery store to witness the continuing growth of our business segments.
Bemis continues to introduce new flexible packaging designs promoting consumer convenience
features and improved freshness. Each new package creates a wave of innovation that ripples
through the aisles of the grocery store. Single serving sizes to meal kits, easy open and
recloseable packages to stand up pouches, each customer's successful new packaging introduction
can innovate an entire product category. Even when the package structure remains the same,
new promotions and improved graphics catch the consumers’ attention. Some products have
used flexible packaging for decades, while others have only recently made a change from a rigid
container. The scene continues to change.
A small percentage of our business is dependent upon the industrial economy. For example,
flexible packaging is used in applications such as mattress bags for the hotel industry, shingle
overwrap for the housing industry, and paper packaging for minerals and chemicals. Our pressure
sensitive materials business provides labels for all types of consumer products, including computers,
tractors and toys. Our adhesive materials are used as fasteners in cell phones, autos and electronics.
Our decorative products are used on billboards and for trade show displays. These markets have
been depressed during the past year but as economic activity begins to increase, these markets
should also provide new growth opportunities for the company.
Global modernization continues to provide opportunities for our operations in
South America, Europe and Asia, as the need for improved food packaging
increases demand for high barrier film structures. In addition, many of these
markets need pressure sensitive materials for multilingual labels and advertising.
Our strategic manufacturing operations in each of these regions provide us
with excellent platforms from which to expand our marketing reach and,
ultimately, our global market share.

17
market expansion
Bemis rotogravure printing and in-linelamination capability provides thepremium appearance this productdeserves at a value our customersappreciate. The sophisticated threeply lamination construction withBemis metalized materials adds barrier protection to keep the producttasting fresh.
This product is packaged using thermoformable laminates that areproduced by our European flexiblepackaging operations. The packageincorporates a seal that can be visually confirmed by its color andincludes an easy peel feature thatdoes not deform the thermoformedpackaging on opening.
The eye-catching graphics on this diaper package are used to marketthis product in Europe.
The side gusseted pillow package isquickly becoming the standard forquality in the frozen food section, asare these bright, delicious-lookinggraphics.
Working closely with Owens Corningresearch and development,Bemis usedits proven expertise in adhesives tosupport the design of an innovativenew insulation product. Vaporwick® is designed for use in high humidityconditions and utilizes a moistureresistant MACtac tape as a self-sealing feature.
This shuttle train between Malpensa airport and the center of Milan, Italy, is covered with MACtac special protective films to keep the decoration perfect and make graffiti removal easier.

Bemis Company, Inc. and Subsidiaries
Business Segments (dollars in millions) 2001 2000 1999 1998 1997
Flexible Packaging
Net sales $1,801.9 1,658.6 $1,469.6 $1,399.8 $1,428.6
Operating profit* 273.2 221.3 187.2 156.3 142.6
Average investment 1,331.5 1,285.1 1,007.4 984.4 912.0
Operating profit as % of net sales 15.2% 13.3% 12.7% 11.2% 10.0%
Operating profit as % of average investment 20.5% 17.2% 18.6% 15.9% 15.6%
Pressure Sensitive Materials
Net sales $ 491.2 $ 506.0 $ 493.0 $ 489.6 $ 489.0
Operating profit 12.1 40.1 44.3 51.0 67.2
Average investment 296.4 274.0 236.6 230.4 222.5
Operating profit as % of net sales 2.5% 7.9% 9.0% 10.4% 13.7%
Operating profit as % of average investment 4.1% 14.6% 18.7% 22.1% 30.2%
Total Company
Net sales $2,293.1 $2,164.6 $ 1,962.6 $ 1,889.4 $1,917.6
Operating profit* 285.3 261.4 231.5 207.3 209.8
Average investment 1,627.9 1,559.1 1,244.0 1,214.8 1,134.5
Operating profit as % of net sales 12.4% 12.1% 11.8% 11.0% 10.9%
Operating profit as % of average investment 17.5% 16.8% 18.6% 17.1% 18.5%
Note: Operating profit is defined as profit before general corporate expense, interest expense, income taxes, and minority interest.
*Reflects a gain of $5.8 million realized on the sale of machinery operations and restructuring charges of $7.8 million in 1997.
Five-Year Summary
18

19
Management’s Discussion and Analysis
Three-Year Review of ResultsPercent
2001 2000 1999
Net sales 100.0% 100.0% 100.0%
Cost of products sold 79.2 79.3 78.4
Gross margin 20.8 20.7 21.6
Selling, general, and administrative expenses 9.0 8.9 9.9
All other expenses 1.9 2.0 2.2
Income before income taxes 9.9 9.8 9.5
Provision for income taxes 3.8 3.8 3.7
Net income 6.1% 6.0% 5.8%
Effective tax rate 38.3% 38.3% 38.3%
SummaryIn 2001, the Company continued its history of meeting
customer needs through technological innovation, customerintimacy, and manufacturing excellence. Manufacturing capacityexpansion continued via internal investment, business unitacquisition, and an internal focus on manufacturing efficiency.Capital expenditures for 2001 were $117.5 million compared to$100.4 million in 2000 and $137.4 million in 1999. This three-year period reflects a continuation of the Company’s focus onbuilding and expanding its manufacturing capacity to supportits technological strengths. In addition to this capital investment,the Company also invested in strategic business acquisitions.During the past five-years the Company has invested more than$1.0 billion in capacity and capability improvements throughcapital expenditures and business unit acquisitions.
During 2001, the Company successfully integrated newstrategic businesses acquired during 2001 and the latter half of2000, while maintaining profit margins and customer servicelevels during the transition. Capacity has been added wheregrowth opportunities are imminent, and manufacturingimprovements have been made in the pressure sensitive mate-rials business which are expected to lead to improved results in2002.
On September 7, 2001, the Company purchased all out-standing stock of Duralam, Inc., which had annual sales ofapproximately $55.0 million, for a cash purchase price of $68.4 million. Duralam manufactures films for packaging meat,cheese, candy, and other food products at facilities in Appletonand Neenah, Wisconsin. The total cash purchase price hasbeen accounted for under the purchase method of accountingin accordance with Statement of Financial AccountingStandard (SFAS) Nos. 141 and 142 which discusses accountingtreatment for acquisitions initiated after June 30, 2001.
On July 19, 2001, the Company purchased the land, building,and manufacturing equipment of the Prattville, Alabama facilityof Wright Plastics that had been closed earlier in 2001. Theadded capacity provided by this modern manufacturing facilityis used to produce polyethylene packaging products.
Overall results for 2001 produced net sales of $2.29 billioncompared to $2.16 billion and $1.96 billion in 2000 and 1999,respectively. The net sales increase of 5.9 percent in 2001 wasled by volume growth in the Flexible Packaging Segment’s highbarrier products principally due to business unit acquisitionsmade in the third quarters of 2001 and 2000. Net income for2001 totaled $140.3 million compared with $130.6 million and$114.8 million for 2000 and 1999 respectively. Diluted earningsper share were $2.64 for 2001, $2.44 for 2000, and $2.18 for1999. Excluding the effects of business acquisitions and dispo-sitions, 2001 net sales decreased 1.9 percent from 2000.
Net sales for the Flexible Packaging segment increased 8.6percent with operating profits increasing 23.4 percent from thelevels achieved in 2000. Strong sales increases in high barrierproducts, further supported by polyethylene and paper prod-ucts, provided the base for improved operating profits. FlexiblePackaging operating profits were $273.2 million in 2001, or15.2 percent of net sales, compared to $221.3 million, or 13.3percent of net sales in 2000, and $187.2 million, or 12.7 percentof net sales in 1999. A continuing focus on lowering costs anddeveloping unique products to meet customer needs largelyaccount for the improvements in operating profit.
Net sales for the Pressure Sensitive Materials segmentdecreased 2.9 percent below the 2000 level. The weakenedeconomy and general overcapacity in the pressure sensitivematerials industry have impacted sales in this business segmentthroughout 2001. Operating profit decreased 69.9 percent asthis business segment continued to face less favorable economicconditions in North America and increased price competitionin certain markets. Pressure Sensitive Materials operating profits were $12.1 million in 2001, or 2.5 percent of net sales,compared to $40.1 million, or 7.9 percent of net sales in 2000,and $44.3 million, or 9.0 percent of net sales in 1999.
OutlookIn 2001, the successful integration of strategic acquisitions
made during 2001 and the second half of 2000 furtherstrengthened the Company’s core capabilities and capacity tobetter meet the ever changing needs of our growing customerbase. The Company’s goal is for sales to rise six to eight percentannually. During the next several years we expect the FlexiblePackaging business to benefit from continuing trends such asflexible packaging replacing rigid packaging, enhanced prod-uct protection, end-user convenience, product presentation,easy-to-handle features, and the unitization of single-pack tomulti-pack as well as from the ongoing consolidation of customerswith which the Company has strong relationships. Futureacquisitions could further enhance sales growth. In 2002,industrial markets are expected to remain weak. These marketsare served primarily by our Pressure Sensitive Materials busi-ness and portions of our polyethylene packaging product line.The Company expects, however, that with greater than 65 percentof our products used in the food industry, our exposure to thismarket limits the adverse impact of any downturn in the economy.
Bemis Company, Inc. and Subsidiaries

20
Costs and ExpensesCost of products sold as a percentage of net sales was 79.2
percent for 2001 compared to 79.3 percent for 2000 and 78.4percent for 1999. The increase experienced in 2000 was due toincreasing material costs which were partially offset by lowerproduct conversion costs and employee benefit costs.
Selling, general, and administrative expenses increased$14.9 million in absolute dollars in 2001 versus 2000 afterdecreasing $1.5 million in 2000 versus 1999. The 2001 increaseis principally due to business unit acquisitions during the thirdquarters of 2001 and 2000. Expressed as a percent of net sales,selling, general, and administrative expenses were 9.0 percent,8.9 percent, and 9.9 percent for 2001, 2000, and 1999, respec-tively. The Company’s focus on improved cost control togetherwith lower employee benefit costs largely accounted for theimprovements achieved in 2000.
Research and development expense was $10.3 million in2001, $10.1 million in 2000, and $11.7 million in 1999. Thisexpense for the Flexible Packaging segment increased $1.2 mil-lion in 2001 reflecting continued commitment to productdevelopment. Within the Pressure Sensitive Materials segmentthis expense decreased $1.0 million as the primary focus wasdirected at improving operational efficiency.
Lower interest rates more than offset the impact of higheraverage debt levels to lower 2001 interest expense to $30.3 mil-lion compared to $31.6 million in 2000 and $21.2 million in1999. Business unit acquisitions and common stock repurchas-es during 2000 resulted in increased debt levels and associatedinterest expense compared to 1999.
Other costs reflect expense of $1.9 million for 2001 versusexpense of $1.4 million and $6.9 million in 2000 and 1999,respectively. The 1999 expense was principally due to lossesfrom our Brazilian joint venture that included $1.7 million forcurrency losses and $2.6 million for relocation and reorganiza-tion costs. The results in 2000 reflect both improved operatingperformance and reduced currency effects. The increasedexpense in 2001 results from a loss attributable to our Brazilianjoint venture.
The year 2000 reduction in minority interest is due to theJanuary 2000 purchase of the 13 percent minority interest inMACtac. Upon the acquisition of these minority shares, MACtacbecame a wholly-owned subsidiary of Bemis Company, Inc.
Return on InvestmentReturn on average stockholders’ equity in 2001 was 16.7
percent compared to 17.1 percent in 2000 and 16.2 percent in1999. Operating profit as a percent of average investment was17.5 percent in 2001 compared to 16.8 percent in 2000 and18.6 percent in 1999.
Operating profit as a percent of average investment for theFlexible Packaging segment was 20.5 percent in 2001 comparedto 17.2 percent in 2000 and 18.6 percent in 1999. This sameratio for the Pressure Sensitive Materials segment was 4.1 percentin 2001 compared to 14.6 percent in 2000 and 18.7 percent in 1999.
Return on average total capital was 10.0 percent in 2001,10.8 percent in 2000, and 10.9 percent in 1999. Total capital isdefined as the sum of all short-term and long-term interest-bearing debt, including obligations under capital leases, stock-holders’ equity, and deferred taxes. Return on total capital isbased on net income adjusted for interest expense on an after-tax basis.
Capital ExpendituresCapital expenditures in 2001 were $117.5 million com-
pared to $100.4 million in 2000 and $137.4 million in 1999,including capitalized interest of $0.2 million, $1.7 million, and$1.6 million for 2001, 2000, and 1999, respectively. In 2002,management anticipates expenditures of approximately $105million. The majority of these expenditures are expected to bemade from internally generated funds and will be for contin-ued expansion and enhancement of the Company’s growthbusinesses.
Capital Structure, Liquidity, and Cash Flow Stockholders’ equity increased in 2001 to $886.1 million,
up from $798.8 million in 2000 and $725.9 million in 1999, primarily due to earnings reduced by dividend payments andcommon stock repurchases. In 2001, $1.2 million of commonstock was repurchased compared to $42.8 million in 2000 and$4.1 million in 1999. Common stock totaling $7.9 million and$0.48 million was issued in 2001 and 2000, respectively, in connection with the Company’s stock-based compensation programs. Additionally, common stock totaling $54.8 millionwas issued in 2000 in connection with the acquisition of theminority interest of MACtac.
Total debt decreased $70.3 million in 2001 to $600.9 million, resulting in a total debt to total capital ratio of 37.3 percent compared to 42.7 percent in 2000 and 31.7 percent in1999. The significant debt increase in 2000 is due to businessunit acquisitions and common stock repurchases. In 2002, totaldebt is expected to decrease due to continuing strong cash flowfrom operations.
On August 10, 2001, the Company completed the place-ment of $250.0 million of 6.5 percent Notes due August 15,2008. The total proceeds were used to pay-down outstandingcommercial paper.
On September 6, 2001, to obtain greater exposure to short-term floating interest rates, the Company entered into long-term interest rate swap agreements for a total notional amountof $350.0 million with three major U.S. banks. These interestrate swap agreements have been designated as hedges ofchanges in the fair value of the Company’s existing $350.0 million fixed rate long-term debt obligations.
Under these interest rate swap agreements the Companywill receive a fixed rate of interest and pay a variable rate ofinterest over the term without the exchange of the underlyingnotional amounts. The fixed rate of interest, which theCompany will receive, is equal to the interest rate of theCompany’s long-term notes which is being hedged. The variablerate of interest which the Company will pay is based on the

21
six-months London Interbank Offered Rate (LIBOR), set inarrears, plus a fixed spread which is unique to each agreement.The variable rates are reset semiannually at each net settlementdate. At December 31, 2001, the net settlement receivable of$4.0 million was recorded as a reduction in interest expense.This position for the Company would become less favorable asshort-term interest rates increase. At December 31, 2001, thefair value of these interest rate swaps was $1.3 million in thebanks’ favor and is included with other liabilities and deferredcredits with a corresponding decrease in long-term debt.
The current ratio was 2.5:1 in 2001 compared to 1.3:1 in2000 and 2.3:1 in 1999, reflecting the short-term debt increasein 2000 associated with acquisitions, which was refinanced withlong-term notes in 2001. Working capital (excluding short-termborrowings and the current portion of long-term debt)decreased by $25.3 million to $354.4 million in 2001 followingan increase of $42.6 million to $379.7 million in 2000 and anincrease of $29.3 million to $337.1 million in 1999.
The Company’s cash flow remained strong in 2001 as cashprovided by operating activities was $317.9 million compared to$210.2 million in 2000 and $186.1 million in 1999. The follow-ing schedule presents the major sources and uses of cash forthe Company in 2001.
Sources and Uses of Cash (in millions)Principal sources
Net income $140.3Depreciation and amortization 124.1Deferred income taxes 16.5Decrease in working capital
(net of effects of acquisitions) 41.1Other (4.1)
Total sources 317.9
Principal usesCapital expenditures 117.5Business acquisitions, net of cash acquired 72.2Decrease in total debt 70.3Dividends 52.8Other (1.1)
Total Uses 311.7
Net increase in cash $ 6.2
The Company believes that cash generated by operatingactivities together with cash available through commercialpaper issuance will be more than adequate to fund all of therequirements which are reasonably foreseeable for 2002.
At year-end 2001, the Company had credit lines of $584million, including a $334 million revolving credit facility and a$250 million short-term 364-day bridge credit facility. Theselines are used primarily to support the Company’s issuance ofcommercial paper which carries an A-1, P-1 credit rating. TheCompany also has the capability of issuing up to approximately$100 million of Extendable Commercial Notes (ECNs) whichare short-term instruments whose maturity can be extended to
390 days from the date of issuance. As of December 31, 2001, theCompany had $229 million of commercial paper outstanding.
The Company’s favorable credit rating is important to itsability to issue commercial paper at favorable rates of interest.While not anticipated, a downgrade in the Company’s creditrating would increase the cost of borrowing and could limit theCompany’s ability to issue commercial paper and require theCompany to draw upon existing credit facilities.
Cash required to meet the Company’s short-term and long-term debt obligations and operating lease payments issummarized in the following table:
Debt LeasePayments Payments Total
Payments due in 2002 $ 5,663,000 $ 7,155,000 $ 12,818,000Payments due in 2003 658,000 4,850,000 5,508,000Payments due in 2004 640,000 3,730,000 4,370,000Payments due in 2005 100,855,000 2,823,000 103,678,000Payments due in 2006 229,100,000 2,000,000 231,100,000Payments due beyond 2006 263,996,000 14,057,000 278,053,000
Commercial paper outstanding at December 31, 2001, hasbeen classified as long-term debt, to the extent of availablelong-term backup credit agreements which expire in 2006, in accordance with the Company’s intention and ability to refinance such obligations on a long-term basis.
The Company’s pretax interest coverage was 8.5 times in2001 compared to 7.7 times in 2000 and 9.8 times in 1999.Pretax income increased to $227.4 million in 2001 from $211.5million in 2000 and $185.9 million in 1999. Interest expensewas $30.3 million in 2001, $31.6 million in 2000, and $21.2 million in 1999. Following are pretax interest coverage ratiosfor the last five years:
Coverage of Pretax Interest by Pretax Income and Interest
1997 1998 1999 2000 20019.7 8.6 9.8 7.7 8.5
Market Risks and Foreign Currency ExposuresThe Company enters into contractual arrangements
(derivatives) in the ordinary course of business to manage foreign currency exposure and interest rate risks. TheCompany does not enter into derivatives for trading purposes.The Company’s use of derivatives is subject to internal policiesthat provide guidelines for control, counterparty risk, and ongoingreporting and is designed to reduce the income statementvolatility associated with movements in foreign exchange ratesand to achieve greater exposure to short-term interest rates.
During the third quarter 2001, to obtain greater exposureto short-term floating interest rates the Company entered intolong-term interest rate swap agreements for a total notionalamount of $350.0 million with three major U.S. banks. Underthese interest rate swap agreements the Company will receive afixed rate of interest and pay a variable rate of interest over theterm without the exchange of the underlying notional amounts.At December 31, 2001, the net settlement receivable of

22
$4.0 million was recorded as a reduction in interest expense.This position for the Company would become less favorable asshort-term interest rates increase.
These interest rate swap agreements have been designatedas hedges of changes in the fair value of the Company’s exist-ing $350.0 million fixed rate long-term debt obligations. Theterms of the interest rate swap agreements have been specifi-cally designed to conform with the applicable terms of thehedged items and with the requirements of paragraph 68 ofSFAS No. 133 to support the assumption of no ineffectiveness(changes in fair value of the debt and the swaps exactly offset)and to simplify the computations necessary to make theaccounting entries. At December 31, 2001, the fair value ofthese interest rate swaps was $1.3 million in the banks’ favor, asdetermined by the respective bank using discounted cash flowor other appropriate methodologies, and is included withother liabilities and deferred credits with a correspondingdecrease in long-term debt.
The Company’s international operations enter into forwardforeign currency exchange contracts to manage foreign currencyexchange rate exposures associated with certain foreign currencydenominated receivables and payables, principally for transac-tions in non-euro zone countries. At December 31, 2001 and2000, the Company had outstanding forward foreign currencyexchange contracts aggregating $3,166,000 and $7,270,000,respectively. The introduction of the “euro” on January 1, 1999,by the European Economic and Monetary Union has reducedthe exposure to currency fluctuations among participatingcountries resulting in reduced volume of forward foreign currency exchange contracts. Forward foreign currencyexchange contracts generally have maturities of less than ninemonths and relate primarily to major Western European cur-rencies. Counterparties to the forward foreign currencyexchange contracts are major financial institutions. Credit lossfrom counterparty nonperformance is not anticipated. OnJanuary 1, 2001, SFAS No. 133, “Accounting for DerivativeInstruments and Hedging Activities,” was adopted by theCompany. SFAS No. 133 requires that the fair value of derivativeinstruments, such as forward foreign currency exchange contracts,be recorded on the balance sheet with subsequent changesreflected in income or deferred as an element of equity. TheCompany has not designated these derivative instruments ashedging instruments. The $6,600 net settlement expense (fairvalue) related to active forward foreign currency exchange contracts is recorded on the balance sheet and as an expenseelement of other costs (income), net.
The Company has a one-third interest in a Brazilian jointventure, ITAP/Bemis Ltda. The joint venture has foreigndenominated debt exposures that are substantially hedged. Net conversion losses or gains on the debt are recorded as an expense.
Income TaxesThe Company’s effective tax rate was 38.3 percent in 2001,
2000, and 1999. The difference between the Company’s overalltax rate and the U.S. statutory tax rate of 35 percent in 2001,
2000, and 1999 principally relates to state and local incometaxes net of the federal income tax benefit.
New Accounting PronouncementsIn July 2001, the Financial Accounting Standards Board
(FASB) issued SFAS No. 141, “Business Combinations” andSFAS No. 142, “Goodwill and Other Intangible Assets”. SFASNo. 141 requires that the purchase method be used for busi-ness combinations initiated after June 30, 2001. SFAS No. 142requires that goodwill no longer be amortized to earnings, butinstead be reviewed for impairment. The provisions of SFASNo. 142 are effective for fiscal years beginning after December15, 2001, and any business combination initiated after June 30,2001. In January of 2002, the Company will adopt the reportingrequirements of SFAS No. 142 and has already applied itsrequirements to the purchase of Duralam, Inc. which was completed on September 7, 2001. Based upon the Company’sassessment of recorded goodwill and intangible assets, had thestandard been in effect January 1, 2001, the Company estimatesthat the full year 2001 impact would have been approximately$0.17 of additional diluted earnings per share. In lieu of amortization, the Company will be required to perform an initial impairment review of its goodwill in 2002 and an annualimpairment review thereafter. The Company expects to completethis initial review by June 30, 2002.
In July 2001, the FASB also issued SFAS No. 143,“Accounting for Asset Retirement Obligations” which providesaccounting requirements for retirement obligations associatedwith tangible long-lived assets. SFAS No. 143 is effective for fiscal years beginning after June 15, 2002. Management believesthe adoption of SFAS No. 143 will not have a material impact onthe Company’s financial position or results of operations.
In October 2001, the FASB issued SFAS No. 144,“Accounting for Impairment of Long-Lived Assets”. SFAS No.144, effective for financial statements for fiscal years beginningafter December 15, 2001, addresses issues relating to the imple-mentation of SFAS No. 121, “Accounting for the Impairment ofLong-Lived Assets and for Long-Lived Assets to be DisposedOf”, and develops a single accounting model for long-livedassets to be disposed of by sale, whether previously held andused or newly acquired. Based on management’s assessment,the adoption of SFAS No. 144 will not have a material impacton the Company’s financial position or results of operations.
Effective January 1, 2001, the Company adopted SFAS No.133, “Accounting for Derivative Instruments and HedgingActivities,” as amended by SFAS Nos. 137 and 138. This newaccounting standard requires that all derivative instruments berecorded on the balance sheet at fair value and establishes criteriafor designation and effectiveness of hedging relationships. Theeffect of adopting this standard was not material to theCompany’s consolidated financial statements. Upon adoption, theCompany recorded the immaterial impact as interest expense.
Market Prices and DividendsThe Bemis quarterly dividend was increased by 4.2 percent
in the first quarter of 2001 to 25 cents per share from 24 cents.

23
This followed first quarter increases of 4.3 percent in 2000 to 24 cents per share from 23 cents, and 4.5 percent in 1999 to 23 cents per share from 22 cents in 1998.
Common dividends for 2001 were $1.00 per share, up from96 cents in 2000 and 92 cents in 1999. The 2001 dividend payoutratio was 37.9 percent compared to 39.3 percent in 2000 and42.2 percent in 1999. Based on the market price of $33.56 pershare at the end of 2000, the dividend yield was 3.0 percent.
Stockholders’ equity per common share (book value pershare) increased to $16.76 per share in 2001, up from $15.18per share in 2000 and $13.91 per share in 1999. Trading volumein Bemis common stock was 43.8 million shares in 2001.
In January 2002, the Board of Directors increased the quarterly cash dividend on common stock to 26 cents per sharefrom 25 cents, a 4.0 percent increase.
Critical Accounting Policies and EstimatesManagement’s discussion and analysis of its financial
condition and results of operations are based upon theCompany’s consolidated financial statements, which have beenprepared in accordance with accounting principles generallyaccepted in the United States. The preparation of these financialstatements requires management to make estimates andassumptions that affect the reported amounts of assets and liabilities and the disclosure of contingent assets and liabilitiesat the date of the financial statements and the reportedamounts of revenues and expenses during the reporting period.On an on-going basis, management evaluates its estimates andjudgements, including those related to customer incentives,product returns, doubtful accounts, inventories, investments,intangible assets, income taxes, financing operations, retirementbenefits, and contingencies and litigation. Management basesits estimates and judgements on historical experience and onvarious other factors that are believed to be reasonable underthe circumstances, the results of which form the basis for makingjudgements about the carrying values of assets and liabilitiesthat are not readily apparent from other sources. Actual resultsmay differ from these estimates under different assumptions orconditions. Management believes the following criticalaccounting policies affect its more significant judgements andestimates used in the preparation of its consolidated financialstatements.
• Revenue recognition, including customer based programs and incentives
• Estimating valuation allowances and accrued liabilities,specifically sales returns and allowances, the allowancefor doubtful accounts, reserves for old, excess, orpotentially obsolete inventory, and litigation and environmental accruals
• The determination of actuarially determined liabilitiesrelated to pension plans, other postretirement benefitobligations, and self-insurance reserves
• Accounting for income taxes• Valuation and useful lives of long-lived and intangible
assets and goodwill• Determining functional currencies for the purpose of
consolidating our international operations
The Company recognizes sales and costs of sales at thetime title transfers to the customer which is generally whenproduct is shipped. Approximately one percent of sales may berecognized prior to shipment as a result of customers’ requestnecessitated by the customers’ changing business conditions.The Company records estimated reductions to revenue for customer programs and incentive offerings including specialpricing agreements, promotions, and other volume-basedincentives. If market conditions were to decline, the Companymay take actions to increase customer incentive offerings, possibly resulting in a reduction of gross profit margins at thetime the incentive is offered.
Management estimates sales returns and allowances byanalyzing historical returns and credits and known problems tocalculate appropriate reserves for future credits. Managementestimates the allowance for doubtful accounts by analyzingaccounts receivable balances by age, applying historical trendrates to the most recent 12 months’ sales, less actual write-offsto date. When it is deemed probable that a customer account isuncollectible, that balance is added to the calculated reserve.Actual results could differ from these estimates under differentassumptions.
Management’s current estimated ranges of liabilities relatedto the pending litigation and environmental claims are basedon management’s best estimate of future costs. While the finalresolution of the litigation and environmental contingenciescould result in amounts different than current accruals, andtherefore have an impact on the Company’s consolidated financialresults in a future reporting period, management believes theultimate outcome will not have a significant effect on theCompany’s consolidated results of operations, financial positionor cash flows.
Pension and other postretirement benefit obligations areactuarially determined. This calculation includes assumptionsrelated to the discount rate, projected salary increases, and theexpected return on assets. The Company is self-insured inNorth America for most workers compensation, general liabilityand automotive liability losses subject to per occurrence andaggregate annual liability limitations. The Company is also self-insured for health care claims for eligible participating employeessubject to certain deductibles and limitations. The Companydetermines its liabilities for claims incurred but not reportedon an actuarial basis. A change in these assumptions couldcause actual results to differ from those reported.
Judgment by management is required in determining theprovision for income taxes and deferred tax assets and liabilities.As part of the process of preparing the Company’s consolidatedfinancial statements, management is required to estimateincome taxes in each of the jurisdictions in which the Companyoperates. This process involves estimating actual current taxexposure together with assessing temporary differences resultingfrom differing treatment of items for tax and accounting purposes. These differences result in deferred tax assets andliabilities, which are included within the Company’s consolidat-ed balance sheet. Management must then assess the likelihoodthat deferred tax assets will be recovered from future taxableincome and to the extent management believes that recovery isnot likely, a valuation allowance must be established.

24
Management periodically reviews its long-lived assets,intangible assets, and goodwill for impairment and assesseswhether significant events or changes in business circumstancesindicate that the carrying value of the assets may not be recoverable. An impairment loss is recognized when the carryingamount of an asset exceeds the anticipated future cash flowsexpected to result from the use of the asset and its eventual disposition. The amount of the impairment loss to be recorded,if any, is calculated by the excess of the asset’s carrying valueover its fair value. Management also periodically reassesses theestimated remaining useful lives of its long-lived assets.Changes to estimated useful lives would impact the amount ofdepreciation and amortization expense recorded in earnings.
In 2002, SFAS No. 142, “Goodwill and Other IntangibleAssets” became effective and as a result, the Company will ceaseto amortize goodwill in 2002. Had this standard been in effecton January 1, 2001, the Company estimates the impact of notamortizing historical goodwill to be an after-tax benefit ofapproximately $9.3 million, or $0.17 per diluted share for theyear ended December 31, 2001. In lieu of amortization, theCompany will be required to perform an initial impairmentreview of its goodwill in 2002 and an annual impairment reviewthereafter. The Company expects to complete this initial reviewby June 30, 2002.
In preparing the consolidated financial statements, theCompany is required to translate the financial statements of itsforeign subsidiaries from the currency in which they keep theiraccounting records, generally the local currency, into UnitedStates dollars. Assets and liabilities of these operations aretranslated at the exchange rates in effect at each fiscal year end.The translation adjustments related to assets and liabilities thatarise from the use of differing exchange rates from period toperiod are included in accumulated other comprehensiveincome in shareholders’ equity. Income statement accounts aretranslated at the average rates of exchange prevailing duringthe year. The different exchange rates from period to periodimpact the amount of reported income from the Company’sinternational operations.
Forward-Looking StatementsThis Annual Report contains certain estimates, predictions,
and other “forward-looking statements” (as defined in thePrivate Securities Litigation Reform Act of 1995, and within the meaning of Section 27A of the Securities Act of 1933, asamended, and Section 21E of the Securities Act of 1934). Thewords “believe,” “expect,” “anticipate,” “intend,” “estimate,”“target,” “may,” “will,” “plan,” “project,” “should,” “continue,”
or the negative thereof or other similar expressions, or discus-sion of future goals or aspirations, which are predictions of or indicate future events and trends and which do not relate tohistorical matters, identify forward-looking statements. Suchstatements are based on information available to managementas of the time of such statements and relate to, among otherthings, expectations of the business environment in which theCompany operates, projections of future performance, perceivedopportunities in the market, and statements regarding theCompany’s mission and vision. Forward-looking statementsinvolve known and unknown risks, uncertainties, and other factors, which may cause the actual results, performance, orachievements of the Company to differ materially from anticipated future results, performance, or achievementsexpressed or implied by such forward-looking statements. TheCompany undertakes no obligation to publicly update or reviseany forward-looking statement, whether as a result of new information, future events, or otherwise.
Factors that could cause actual results to differ from thoseexpected include, but are not limited to, general economicconditions such as inflation, interest rates, and foreign currencyexchange rates; results from acquisitions may differ from whatthe Company anticipates; competitive conditions within theCompany’s markets, including the acceptance of new and existingproducts offered by the Company; price changes for raw mate-rials and the ability of the Company to pass these price changeson to its customers or otherwise manage commodity pricefluctuation risks; the presence of adequate cash available forinvestment in the Company’s business in order to maintaindesired debt levels; unanticipated consequences of theEuropean Monetary Union’s conversion to the euro; changesin governmental regulation, especially in the areas ofenvironmental, health and safety matters, and foreign investment;unexpected outcomes in the Company’s current and futurelitigation proceedings; and changes in the Company’s laborrelations. These and other risks, uncertainties, and assumptionsidentified from time to time in the Company’s filings with theSecurities and Exchange Commission, including without limitation, its Annual Report on Form 10-K and its quarterlyreports on Form 10-Q, could cause the Company’s actual futureresults to differ materially from those projected in the forward-looking statements. In addition, the Company’s actual futureresults could differ materially from those projected in theforward-looking statement as a result of changes in theassumptions used in making such forward-looking statements.
BEMIS COMMON STOCK PERFORMANCE *2001 2000 1999
Dividend Dividend DividendHigh Low Paid High Low Paid High Low Paid
First Quarter $35.99 $28.69 $.25 $36.88 $27.50 $.24 $38.69 $31.06 $.23
Second Quarter 40.65 31.60 .25 38.50 33.13 .24 39.94 30.44 .23
Third Quarter 44.99 35.85 .25 37.13 31.19 .24 39.88 32.81 .23
Fourth Quarter 52.47 39.34 .25 34.50 24.06 .24 34.94 30.94 .23
*New York Stock Exchange: BMS

25
Five-Year Consolidated Review
Years Ended December 31,(dollars in millions, except per share amounts) 2001 2000 1999 1998 1997
Operating Data
Net sales $ 2,293.1 $ 2,164.6 $ 1,962.6 $ 1,889.4 $ 1,917.6
Cost of products sold and other expenses 2,035.4 1,921.5 1,755.5 1,702.5 1,733.8
Interest expense 30.3 31.6 21.2 21.9 18.9
Income before income taxes 227.4 211.5 185.9 165.0 164.9
Provision for income taxes 87.1 80.9 71.1 63.9 63.5
Net income 140.3 130.6 114.8 101.1 101.4
Net income as a percent of net sales 6.1% 6.0% 5.8% 5.4% 5.3%
Common Share Data
Basic earnings per share $ 2.66 $ 2.46 $ 2.19 $ 1.91 $ 1.91
Diluted earnings per share 2.64 2.44 2.18 1.90 1.88
Dividends per share 1.00 .96 .92 .88 .80
Book value per share 16.76 15.18 13.91 13.16 12.60
Stock price/earnings ratio range 11-20x 10-16x 14-18x 18-25x 19-25x
Weighted-average shares outstanding
for computation of diluted earnings
per share 53,121,798 53,552,703 52,657,068 53,323,704 53,879,948
Common shares outstanding at December 31, 52,869,929 52,602,414 52,188,715 52,269,158 52,967,511
Capital Structure and Other Data
Current ratio 2.5 1.3 2.3 2.2 2.2
Working capital 348.7 144.9 330.3 301.3 311.0
Total assets 1,923.0 1,888.6 1,532.1 1,482.0 1,408.4
Short-term debt 5.7 234.8 6.8 6.5 4.3
Long-term debt 595.2 438.0 372.3 371.4 316.8
Stockholders’ equity 886.1 798.8 725.9 687.9 667.2
Return on average stockholders’ equity 16.7% 17.1% 16.2% 14.9% 16.0%
Return on average total capital 10.0% 10.8% 10.9% 10.3% 11.3%
Depreciation and amortization 124.1 108.1 97.7 88.9 78.9
Capital expenditures 117.5 100.4 137.4 139.8 167.5
Number of common stockholders 4,747 5,005 5,316 5,721 5,874
Number of employees 11,012 10,969 9,534 9,364 9,275
Bemis Company, Inc. and Subsidiaries

26
Management’s Responsibility Statement Bemis Company, Inc. and Subsidiaries
The management of Bemis Company, Inc., is responsible for the integrity, objectivity, and accuracy of the financial statements ofthe Company. The financial statements are prepared by the Company in accordance with accounting principles generally acceptedin the United States of America, and using management's best estimates and judgments, where appropriate. The financial informationpresented throughout the Annual Report is consistent with that in the financial statements.
Management is also responsible for maintaining a system of internal accounting controls and procedures designed to provide reasonable assurance that the books and records reflect the transactions of the Company, and that assets are protected against lossfrom unauthorized use or disposition. Such a system is maintained through written accounting policies and procedures, administeredby trained Company personnel and updated on a continuing basis to ensure their adequacy to meet the changing requirements ofour business. The Company also maintains an internal audit department that evaluates the adequacy of and investigates adherenceto these controls and procedures. In addition, the Company requires that all of its affairs, as reflected by the actions of its employees,will be conducted on a high ethical plane.
PricewaterhouseCoopers LLP, independent accountants, are retained to audit the financial statements. Their audit is conducted inaccordance with auditing standards generally accepted in the United States of America and includes selective reviews of internalaccounting controls.
The Audit Committee of the Board of Directors, which is composed solely of outside directors, meets quarterly with management,the internal audit manager, and independent accountants to review the work of each and to satisfy itself that the respective partiesare properly discharging their responsibilities. Both PricewaterhouseCoopers LLP and the internal audit manager have had andcontinue to have unrestricted access to the Audit Committee, without the presence of Company management, for the purpose ofdiscussing the results of their examination and their opinions on the adequacy of internal accounting controls and the quality offinancial reporting.
John H. Roe Jeffrey H. Curler Benjamin R. Field, III Gene C. WulfChairman President and Senior Vice President Vice President and Controller
Chief Executive Officer Chief Financial Officerand Treasurer
Report of Independent AccountantsTo the Stockholders and the Board of Directors of Bemis Company, Inc.:
In our opinion, the accompanying consolidated balance sheets and the related consolidated statements of income, of stockholders'equity, and of cash flows present fairly, in all material respects, the financial position of Bemis Company, Inc., and its subsidiariesat December 31, 2001 and 2000, and the results of their operations and their cash flows for each of the three years in the periodended December 31, 2001, in conformity with accounting principles generally accepted in the United States of America. Thesefinancial statements are the responsibility of the Company's management; our responsibility is to express an opinion on these financialstatements based on our audits. We conducted our audits of these statements in accordance with auditing standards generallyaccepted in the United States of America, which require that we plan and perform the audit to obtain reasonable assurance aboutwhether the financial statements are free of material misstatement. An audit includes examining, on a test basis, evidence supportingthe amounts and disclosures in the financial statements, assessing the accounting principles used and significant estimates madeby management, and evaluating the overall financial statement presentation. We believe that our audits provide a reasonable basisfor our opinion.
PricewaterhouseCoopers LLPJanuary 23, 2002

27
Consolidated Statement of Income Bemis Company, Inc. and Subsidiaries
Years Ended December 31,(in thousands, except per share amounts) 2001 2000 1999
Net sales $2,293,104 $2,164,583 $1,962,628
Costs and expenses:
Cost of products sold 1,815,442 1,717,259 1,538,957
Selling, general, and administrative expenses 207,158 192,275 193,793
Research and development 10,313 10,080 11,684
Interest expense 30,343 31,609 21,218
Other costs (income), net 1,869 1,362 6,877
Minority interest in net income 554 496 4,224
Income before income taxes 227,425 211,502 185,875
Provision for income taxes 87,100 80,900 71,100
Net income $ 140,325 $ 130,602 $ 114,775
Basic earnings per share $ 2.66 $ 2.46 $ 2.19
Diluted earnings per share $ 2.64 $ 2.44 $ 2.18
See accompanying notes to consolidated financial statements.

28
Consolidated Balance Sheet Bemis Company, Inc. and Subsidiaries
(dollars in thousands, except per share amounts)
December 31,
Assets 2001 2000
Current assets:
Cash $ 35,101 $ 28,910
Accounts receivable, less $14,434 and $13,189
for doubtful accounts and allowances 258,397 301,974
Inventories, less reserves of $14,494 and $8,331 259,755 274,323
Prepaid expenses 33,644 34,752
Total current assets 586,897 639,959
Property and equipment:
Land and land improvements 20,369 17,258
Buildings and leasehold improvements 268,470 247,965
Machinery and equipment 1,108,275 1,046,998
Total property and equipment 1,397,114 1,312,221
Less - accumulated depreciation 544,394 486,467
Net property and equipment 852,720 825,754
Other long-term assets:
Goodwill, less accumulated
amortization of $41,059 and $29,938 333,275 297,898
Other intangible assets, less accumulated
amortization of $10,231 and $3,905 88,614 95,913
Deferred charges and other assets 61,468 29,119
Total other long-term assets 483,357 422,930
Total assets $1,922,974 $1,888,643
See accompanying notes to consolidated financial statements. continued

29
December 31,
Liabilities and Stockholders’ Equity 2001 2000
Current liabilities:
Current portion of long-term debt $ 3,572 $ 227,459
Short-term borrowings 2,091 7,353
Accounts payable 173,766 207,115
Accrued liabilities:
Salaries and wages 45,241 43,661
Income taxes 4,151 471
Other taxes 9,361 9,038
Total current liabilities 238,182 495,097
Long-term debt, less current portion 595,249 437,952
Deferred taxes 121,979 103,621
Other liabilities and deferred credits 79,288 51,646
Total liabilities 1,034,698 1,088,316
Minority interest 2,128 1,570
Commitments and contingencies
Stockholders’ equity:
Common stock, $.10 par value:
Authorized - 248,000,000 shares
Issued - 61,270,317 and 60,972,802 shares 6,127 6,097
Capital in excess of par value 244,978 237,100
Retained earnings 942,019 854,506
Accumulated other comprehensive income (loss) (56,659) (49,855)
Common stock held in treasury,
8,400,388 and 8,370,388 shares, at cost (250,317) (249,091)
Total stockholders’ equity 886,148 798,757
Total liabilities and stockholders’ equity $1,922,974 $1,888,643
See accompanying notes to consolidated financial statements.

30
Consolidated Statement of Cash Flows Bemis Company, Inc. and Subsidiaries
(in thousands) Years Ended December 31,
2001 2000 1999
Cash flows from operating activities:
Net income $ 140,325 $ 130,602 $ 114,775
Adjustments to reconcile net income to net cash
provided by operating activities:
Depreciation and amortization 124,147 108,130 97,717
Minority interest in net income 554 496 4,224
Deferred income taxes, noncurrent portion 16,499 14,783 5,478
Losses of unconsolidated affiliated companies 2,320 2,732 7,874
Tax benefits related to stock incentive programs 2,023 2,725 960
Loss (gain) on sale of property and equipment 1,221 234 624
Changes in operating assets and liabilities,
net of acquisitions:
Accounts receivable 48,973 (50,915) (22,064)
Inventories 19,403 19,525 (36,554)
Prepaid expenses 2,142 1,034 1,362
Accounts payable (42,989) (6,790) 1,333
Accrued salaries and wages 7,565 5,233 9,045
Accrued income taxes 5,759 (4,173) 2,831
Accrued other taxes 257 (145) 752
Changes in other liabilities and deferred credits 26,182 33 (3,250)
Changes in deferred charges and
other investments (36,442) (13,320) 992
Net cash provided by operating activities 317,939 210,184 186,099
Cash flows from investing activities:
Additions to property and equipment (117,481) (100,420) (137,382)
Business acquisitions, net of cash acquired (72,155) (295,075) (1,424)
Proceeds from sale of property and equipment 867 1,943 2,201
Other (1,082) 61
Net cash used by investing activities $(188,769) $(394,634) $(136,544)
See accompanying notes to consolidated financial statements. continued

31
Years Ended December 31,
2001 2000 1999
Cash flows from financing activities:
Proceeds from long-term debt $ 160,001 $ 66,713 $ 3,130
Repayment of long-term debt (1,295) (973) (2,204)
Change in short-term borrowings (5,135) 2,034 2,520
Change in current portion of long-term debt (223,889) 226,410 (1,897)
Cash dividends paid (52,812) (51,158) (48,126)
Purchase of common stock for the treasury (1,226) (42,752) (4,133)
Stock incentive programs 687 (2,726) (957)
Net cash provided (used) by financing activities (123,669) 197,548 (51,667)
Effect of exchange rates on cash 690 (2,375) (3,439)
Net increase (decrease) in cash 6,191 10,723 (5,551)
Cash balance at beginning of year 28,910 18,187 23,738
Cash balance at end of year $ 35,101 $ 28,910 $ 18,187
Supplemental disclosure of cash flow information:
Fair value of assets acquired $ 80,684 $ 339,144
Less liabilities assumed 8,529 27,608
Minority interest acquired 38,388 $ 1,424
Net value acquired 72,155 349,924 1,424
Common stock issued 54,849
Cash used for acquisition $ 72,155 $ 295,075 $ 1,424
Interest paid during the year $ 23,209 $ 33,275 $ 22,941
Income taxes paid during the year $ 63,632 $ 70,638 $ 62,504
See accompanying notes to consolidated financial statements.

32
Consolidated Statement of Stockholders’ Equity Bemis Company, Inc. and Subsidiaries
(dollars in thousands, except per share amounts) Capital In Accumulated Other Common TotalCommon Excess Of Retained Comprehensive Stock Held Stockholders’
Stock Par Value Earnings Income (Loss) In Treasury Equity
Balance at December 31, 1998 $ 5,906 $181,908 $708,362 $ (6,116) $(202,206) $ 687,854
Net income for 1999 114,775 114,775
Translation adjustment for 1999 (24,353) (24,353)
Pension liability adjustment, net of $(536) tax benefit (175) (175)
Total comprehensive income 90,247
Cash dividends paid on common stock $.92 per share (48,126) (48,126)
Stock incentive programs and related tax effects 4 49 53
Purchase of 122,599 shares of common stock (4,133) (4,133)
Balance at December 31, 1999 5,910 181,957 775,011 (30,644) (206,339) 725,895
Net income for 2000 130,602 130,602
Translation adjustment for 2000 (19,178) (19,178)
Pension liability adjustment, net of $(642) tax benefit (33) (33)
Total comprehensive income 111,391
Cash dividends paid on common stock $.96 per share (51,107) (51,107)
1,730,952 shares of common stock issued
in acquisition of minority interest 173 54,676 54,849
Stock incentive programs and related tax effects 14 467 481
Purchase of 1,460,900 shares of common stock (42,752) (42,752)
Balance at December 31, 2000 6,097 237,100 854,506 (49,855) (249,091) 798,757
Net income for 2001 140,325 140,325
Translation adjustment for 2001 (6,634) (6,634)
Pension liability adjustment, net of $(108) tax benefit (170) (170)
Total comprehensive income 133,521
Cash dividends paid on common stock $1.00 per share (52,812) (52,812)
Stock incentive programs and related tax effects 30 7,878 7,908
Purchase of 30,000 shares of common stock (1,226) (1,226)
Balance at December 31, 2001 $ 6,127 $244,978 $942,019 $ (56,659) $(250,317) $886,148
See accompanying notes to consolidated financial statements.

33
Notes to Consolidated Financial Statements
Note 1 - Description of the BusinessBemis Company, Inc., a Missouri corporation, was founded in1858 and incorporated in 1885 as Bemis Bro. Bag Company. In1965 the name was changed to Bemis Company, Inc. TheCompany is a principal manufacturer of flexible packagingproducts and pressure sensitive materials selling to customersthroughout the United States, Canada, and Europe with agrowing presence in Asia Pacific, South America, and Mexico.
The Company’s business activities are organized around its twobusiness segments, Flexible Packaging, which accounted forapproximately 79 percent of 2001 net sales, and PressureSensitive Materials, which accounted for the remaining netsales. The primary market for its products is the food industrywhich accounted for approximately 65 percent of 2001 netsales. Other markets include chemical, agribusiness, medical,pharmaceutical, personal care products, batteries, electronics,automotive, construction, graphic industries, and other consumergoods. All markets are considered to be highly competitive asto price, innovation, quality, and service.
Note 2 - Significant Accounting PoliciesPrinciples of consolidation: The consolidated financial state-ments include the accounts of the Company and its majorityowned subsidiaries. All significant intercompany transactionsand accounts have been eliminated in consolidation.
Revenue recognition: Sales and related cost of sales are recog-nized primarily upon shipment of products. Approximatelyone percent of sales were recognized prior to shipment as aresult of customers’ request necessitated by the customers’changing business conditions. In all such instances theCompany has accounted for these transactions in accordancewith U.S. generally accepted accounting principles as well asthe Securities and Exchange Commission’s Staff AccountingBulletin No. 101.
Research and development: Research and development expen-ditures are expensed as incurred.
Earnings per share: Basic earnings per common share are computed by dividing net income by the weighted-averagenumber of common shares outstanding during the year.Diluted earnings per share are computed by dividing net incomeby the weighted-average number of common shares outstandingduring the year including common stock equivalents, if dilutive.
Inventory valuation: Inventories are valued at the lower of cost,determined by the first-in, first-out (FIFO) method, or market.
Property and equipment: Property and equipment are stated atcost. Plant and equipment are depreciated for financial reportingpurposes principally using the straight-line method over theestimated useful lives of assets as follows: land improvements,
15-30 years; buildings, 15-45 years; leasehold and buildingimprovements, 8-20 years; and machinery and equipment, 3-16years. For tax purposes, the Company generally uses accelerat-ed methods of depreciation. The tax effect of the differencebetween book and tax depreciation has been provided asdeferred income taxes. On sale or retirement, the asset costand related accumulated depreciation are removed from theaccounts and any related gain or loss is reflected in income.Maintenance and repairs that do not improve efficiency orextend economic life are expensed currently. Interest costs arecapitalized for major capital expenditures during construction.
Goodwill: Goodwill represents the excess of cost over net assetsof businesses acquired. Goodwill acquired prior to 1971 is notamortized against income unless a loss of value becomes evident.Goodwill resulting from investments made subsequent to 1970is amortized against income using the straight line method overvarious periods ranging from 20 to 40 years. The Companyperiodically reviews goodwill for impairment and assesseswhether significant events or changes in business circumstancesindicate that the carrying value of the assets may not be fullyrecoverable. Recoverability is assessed by comparing anticipatedundiscounted future cash flows from operations to net book value.
In January of 2002, the Company will adopt the reportingrequirements of Statement of Financial Accounting Standards(SFAS) No. 141, “Business Combinations” and SFAS No. 142,“Goodwill and Other Intangible Assets” and, as required foracquisitions after June 30, 2001, has already applied its require-ments to the purchase of Duralam, Inc. which was completedon September 7, 2001.
Intangible assets: Intangible assets are being amortized againstincome using the straight line method over their estimated useful lives, with periods ranging up to 20 years. The Companyperiodically reviews intangible assets for impairment and assesses whether significant events or changes in business circumstances indicate that the carrying value of the assets maynot be fully recoverable. Recoverability is assessed by comparinganticipated undiscounted future cash flows from operations tonet book value.
Taxes on undistributed earnings: No provision is made for U.S.income taxes on earnings of non-U.S. subsidiary companieswhich the Company controls but does not include in the consolidated federal income tax return since it is management’spractice and intent to permanently reinvest the earnings.
Translation of foreign currencies: Assets and liabilities aretranslated at the exchange rate as of the balance sheet date. Allrevenue and expense accounts are translated at averageexchange rates in effect during the year. Translation adjustmentsare recorded as a separate component of equity.

34
Accumulated other comprehensive income (loss): The compo-nents of accumulated other comprehensive income (loss) areas follows as of December 31:
(in thousands) 2001 2000 1999Foreign currency translation $(54,758) $(48,124) $(28,946)Minimum pension liability (1,901) (1,731) (1,698)Accumulated other comprehensive income (loss) $(56,659) $(49,855) $(30,644)
Statement of Cash Flows: For purposes of reporting cash flows,cash includes cash on hand and demand deposit accounts.
Preferred Stock Purchase Rights: On July 29, 1999, theCompany’s Board of Directors adopted a Shareholder RightsPlan by declaring a dividend of one preferred share purchaseright for each outstanding share of common stock. Under certaincircumstances, a right may be exercised to purchase one two-hundredth of a share of Series A Junior Preferred Stock for$120, subject to adjustment. The rights become exercisable if,subject to certain exceptions, a person or group acquires beneficialownership of 15 percent or more of the Company’s outstandingcommon stock or announces an offer which would result insuch person acquiring beneficial ownership of 15 percent ormore of the Company’s outstanding common stock. If a personor group acquires beneficial ownership of 15 percent or moreof the Company’s outstanding common stock, subject to cer-tain exceptions, each right will entitle its holder to buy com-mon stock of the Company having a market value of twice theexercise price of the right. The rights expire August 23, 2009,and may be redeemed by the Company for $.001 per right atany time before a person becomes a beneficial owner of 15 per-cent or more of the Company’s outstanding common stock.The Company’s Board of Directors has designated 600,000shares of Series A Junior Preferred Stock with a par value of $1per share that relate to the Shareholder Rights Plan. AtDecember 31, 2001, none of these shares were issued or out-standing.
Financial Instruments: In June 1998, the Financial AccountingStandards Board (FASB) issued SFAS No. 133, “Accounting forDerivative Instruments and Hedging Activities.” This statement,as amended, establishes standards for recognition and meas-urement of derivatives and hedging activities and requires thatall derivative instruments be recorded on the balance sheet atfair value. The fair value of all derivative instruments, such asforward foreign currency exchange contracts and interest rateswap arrangements are recorded. Implementation of this standardas required on January 1, 2001, did not have a material effecton the Company’s financial position or results of operation.
Environmental cost: The Company is involved in a number ofenvironmental related disputes and claims. The Companyaccrues for environmental costs when it is probable that thesecosts will be incurred and can be reasonably estimated. AtDecember 31, 2001 and 2000, reserves were $778,000 and
$401,000, respectively. Adjustments to the reserve accounts andcosts which were directly expensed for environmental remediationmatters resulted in charges to the income statements for 2001,2000, and 1999 of $406,000, $183,000, and $2,046,000, net ofthird party reimbursements totaling $5,000, $150,000, and$442,000, for 2001, 2000, and 1999, respectively.
Estimates and assumptions required: The preparation of financialstatements in conformity with U.S. generally accepted accountingprinciples requires management to make estimates andassumptions that affect the reported amounts of assets and liabilities at the date of the financial statements and the reportedamounts of revenues and expenses during the reporting period.Actual results could differ from those estimates.
Note 3 - Changes in Accounting PrinciplesIn July 2001, the FASB issued SFAS No. 141, “BusinessCombinations” and SFAS No. 142, “Goodwill and OtherIntangible Assets”. SFAS No. 141 requires that the purchasemethod be used for business combinations initiated after June30, 2001. SFAS No. 142 requires that goodwill no longer beamortized to earnings, but instead be reviewed for impairment.The provisions of SFAS No. 142 are effective for fiscal years beginning after December 15, 2001, and any business combinationinitiated after June 30, 2001. In January of 2002, the Company willadopt the reporting requirements of SFAS No. 142 and hasalready applied its requirements to the purchase of Duralam, Inc.which was completed on September 7, 2001. Based upon theCompany’s assessment of recorded goodwill and intangible assets,had the standard been in effect January 1, 2001, the Companyestimates that the full year 2001 impact would have been approx-imately $0.17 of additional diluted earnings per share. In lieu ofamortization, the Company will be required to perform an initialimpairment review of its goodwill in 2002 and an annual impairmentreview thereafter. The Company expects to complete this initialreview by June 30, 2002.
In July 2001, the FASB also issued SFAS No. 143, “Accountingfor Asset Retirement Obligations” which provides accountingrequirements for retirement obligations associated with tangi-ble long-lived assets. SFAS No. 143 is effective for fiscal yearsbeginning after June 15, 2002. Management believes the adoptionof SFAS No. 143 will not have a material impact on theCompany’s financial position or results of operations.
In October 2001, the FASB issued SFAS No. 144, “Accountingfor Impairment of Long-Lived Assets”. SFAS No. 144, effectivefor financial statements for fiscal years beginning afterDecember 15, 2001, addresses issues relating to the implemen-tation of SFAS No. 121, “Accounting for the Impairment ofLong-Lived Assets and for Long-Lived Assets to be DisposedOf”, and develops a single accounting model for long-livedassets to be disposed of by sale, whether previously held andused or newly acquired. Based on management’s assessment,the adoption of SFAS No. 144 will not have a material impacton the Company’s financial position or results of operations.

35
Effective January 1, 2001, the Company adopted SFAS No. 133,“Accounting for Derivative Instruments and HedgingActivities,” as amended by SFAS Nos. 137 and 138. This newaccounting standard requires that all derivative instruments berecorded on the balance sheet at fair value and establishes criteriafor designation and effectiveness of hedging relationships. Theeffect of adopting this standard was not material to the Company’sconsolidated financial statements. Upon adoption, the Companyrecorded the immaterial impact as interest expense.
Note 4 - Business Acquisitions and DispositionsOn September 7, 2001, the Company purchased all of the outstanding stock of Duralam, Inc., which had annual sales of approximately $55.0 million, for a cash purchase price of$68.4 million. Duralam manufactures films for packaging meat,cheese, candy, and other food products at facilities in Appletonand Neenah, Wisconsin. The total cash purchase price hasbeen accounted for under the purchase method of accountingreflecting the provision of SFAS No. 141 and SFAS No. 142regarding such acquisitions initiated after June 30, 2001. In apreliminary allocation of the purchase price, $20.0 million wasallocated to tangible assets and $48.4 million to goodwill, ofwhich approximately $15.8 million is tax deductible goodwill.This preliminary purchase price allocation will be finalized inearly 2002 when the valuation of assets acquired is completed.Results of operations subsequent to September 7, 2001, areincluded in these financial statements.
On September 8, 2000, the Company purchased the pressuresensitive materials product line of Kanzaki Specialty Papers,Inc. which had approximately $78.0 million in sales in 1999.This business supplies direct thermal pressure sensitive prod-ucts to printers for labels used for bar coding, shipping andinventory labeling, and a variety of other end uses. Assetsacquired with this business include a long-term supply agree-ment to purchase Kanzaki’s high quality face paper to whichadhesive will be applied using already available state-of-the-artequipment. No equipment or facilities were acquired with thisbusiness. The total cash purchase price of $45.2 million hasbeen accounted for under the purchase method of accounting,and results of operations subsequent to September 7, 2000, areincluded in these financial statements.
On August 31, 2000, the Company purchased the specialty plastic films business of Viskase Companies, Inc., which suppliesa variety of shrinkable barrier bags, films, and cook-in bags tobeef, pork, poultry, and cheese processors. It had net sales ofapproximately $150.0 million in 1999. This acquisition hasstrong and complex technologies that both complement andextend the technologies employed in the Company’s very successful flexible packaging business. In addition, this acquisitionbrings to the Company immediate access to important freshmeat markets and is a natural extension of the strong positionand relationships already established in the processed meat,cheese, and poultry markets. Included in the acquisition aremanufacturing facilities in Centerville, Iowa; Pauls Valley,Oklahoma; Swansea, Wales; and São Paulo, Brazil. The total
cash purchase price of $226.2 million has been accounted forunder the purchase method of accounting, and results of operations subsequent to August 30, 2000, are included inthese financial statements.
Effective August 1, 2000, the Company purchased the assets ofthe flexible packaging business of Arrow Industries, which hadnet sales of approximately $33.0 million during the precedingtwelve months. Equipment acquired with this business has beenstrategically deployed into existing facilities to provide additionalcapacity. The total cash purchase price of $18.8 million hasbeen accounted for under the purchase method of accounting,and results of operations subsequent to July 31, 2000, areincluded in these financial statements.
On January 6, 2000, the Company purchased the remaining 13percent minority interest in Morgan Adhesives Company(MACtac). The Company issued 1,730,952 shares of its commonstock, valued at $54.8 million, and paid $3.4 million in cash.Upon the acquisition of these minority shares, MACtac becamea wholly owned subsidiary of Bemis Company, Inc.
On January 13, 1999, the Company purchased the remainingminority interest in voting preference shares of PerfecsealLimited in accordance with an agreement dated April 29, 1996,relating to the acquisition of Perfecseal Healthcare PackagingDivision (Perfecseal) of Paper Manufacturers Company, Inc. A cash payment of $1.4 million was made to acquire theremaining outstanding minority interest.
Supplemental pro forma results of operations giving effect tothe acquisitions are not presented because they are not material.
Note 5 - InventoriesThe Company’s inventories are valued at the lower of cost,determined by the first-in, first-out (FIFO) method, or market.Inventories are summarized at December 31, as follows:
(in thousands) 2001 2000
Raw materials and supplies $ 82,210 $ 86,345Work in process and finished goods 192,039 196,309 Total inventories, gross 274,249 282,654Less inventory reserves (14,494) (8,331)Total inventories, net $259,755 $274,323
Note 6 - Pension PlansDefined contribution plans cover employees at eight differentmanufacturing or administrative locations and provide for contributions ranging from 2 percent to 6 percent of coveredemployees’ salaries or wages and totaled $841,000 in 2001,$845,000 in 2000, and $695,000 in 1999. Multiemployer planscover employees at two different manufacturing locations andprovide for contributions to a union administered defined benefit pension plan. Amounts charged to pension cost andcontributed to the plans in 2001, 2000, and 1999 totaled$667,000, $771,000, and $1,136,000, respectively.
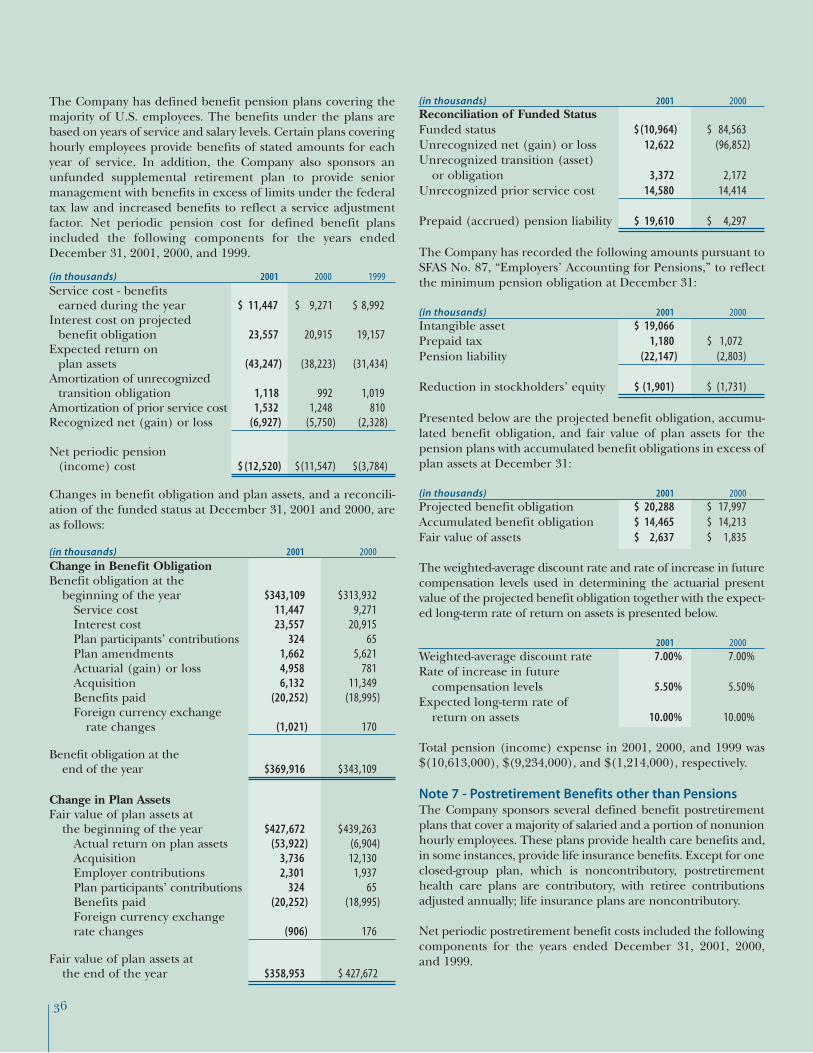
36
The Company has defined benefit pension plans covering themajority of U.S. employees. The benefits under the plans arebased on years of service and salary levels. Certain plans coveringhourly employees provide benefits of stated amounts for eachyear of service. In addition, the Company also sponsors anunfunded supplemental retirement plan to provide seniormanagement with benefits in excess of limits under the federaltax law and increased benefits to reflect a service adjustmentfactor. Net periodic pension cost for defined benefit plansincluded the following components for the years endedDecember 31, 2001, 2000, and 1999.
(in thousands) 2001 2000 1999
Service cost - benefits earned during the year $ 11,447 $ 9,271 $ 8,992
Interest cost on projected benefit obligation 23,557 20,915 19,157
Expected return on plan assets (43,247) (38,223) (31,434)
Amortization of unrecognizedtransition obligation 1,118 992 1,019
Amortization of prior service cost 1,532 1,248 810Recognized net (gain) or loss (6,927) (5,750) (2,328)
Net periodic pension (income) cost $ (12,520) $ (11,547) $(3,784)
Changes in benefit obligation and plan assets, and a reconcili-ation of the funded status at December 31, 2001 and 2000, areas follows:
(in thousands) 2001 2000
Change in Benefit ObligationBenefit obligation at the
beginning of the year $343,109 $313,932Service cost 11,447 9,271 Interest cost 23,557 20,915Plan participants’ contributions 324 65Plan amendments 1,662 5,621Actuarial (gain) or loss 4,958 781Acquisition 6,132 11,349Benefits paid (20,252) (18,995)Foreign currency exchange
rate changes (1,021) 170
Benefit obligation at the end of the year $369,916 $343,109
Change in Plan AssetsFair value of plan assets at
the beginning of the year $427,672 $439,263Actual return on plan assets (53,922) (6,904)Acquisition 3,736 12,130Employer contributions 2,301 1,937Plan participants’ contributions 324 65Benefits paid (20,252) (18,995)Foreign currency exchange rate changes (906) 176
Fair value of plan assets at the end of the year $358,953 $ 427,672
(in thousands) 2001 2000Reconciliation of Funded StatusFunded status $ (10,964) $ 84,563Unrecognized net (gain) or loss 12,622 (96,852)Unrecognized transition (asset)
or obligation 3,372 2,172Unrecognized prior service cost 14,580 14,414
Prepaid (accrued) pension liability $ 19,610 $ 4,297
The Company has recorded the following amounts pursuant toSFAS No. 87, “Employers’ Accounting for Pensions,” to reflectthe minimum pension obligation at December 31:
(in thousands) 2001 2000 Intangible asset $ 19,066Prepaid tax 1,180 $ 1,072 Pension liability (22,147) (2,803)
Reduction in stockholders’ equity $ (1,901) $ (1,731)
Presented below are the projected benefit obligation, accumu-lated benefit obligation, and fair value of plan assets for thepension plans with accumulated benefit obligations in excess ofplan assets at December 31:
(in thousands) 2001 2000 Projected benefit obligation $ 20,288 $ 17,997Accumulated benefit obligation $ 14,465 $ 14,213Fair value of assets $ 2,637 $ 1,835
The weighted-average discount rate and rate of increase in futurecompensation levels used in determining the actuarial presentvalue of the projected benefit obligation together with the expect-ed long-term rate of return on assets is presented below.
2001 2000Weighted-average discount rate 7.00% 7.00%Rate of increase in future
compensation levels 5.50% 5.50%Expected long-term rate of
return on assets 10.00% 10.00%
Total pension (income) expense in 2001, 2000, and 1999 was$(10,613,000), $(9,234,000), and $(1,214,000), respectively.
Note 7 - Postretirement Benefits other than PensionsThe Company sponsors several defined benefit postretirementplans that cover a majority of salaried and a portion of nonunionhourly employees. These plans provide health care benefits and,in some instances, provide life insurance benefits. Except for oneclosed-group plan, which is noncontributory, postretirementhealth care plans are contributory, with retiree contributionsadjusted annually; life insurance plans are noncontributory.
Net periodic postretirement benefit costs included the followingcomponents for the years ended December 31, 2001, 2000, and 1999.
14,580

37
(in thousands) 2001 2000 1999Service cost - benefits
earned during the year $ 291 $ 292 $ 217Interest cost on accumulated
postretirement benefit obligation 1,012 924 794Amortization of prior service cost 48 48 11Recognized net (gain) or loss (31) (60) (266)
Net periodic postretirement benefit cost $ 1,320 $ 1,204 $ 756
Changes in benefit obligation and plan assets, and a reconcili-ation of the funded status at December 31, 2001 and 2000, areas follows:
(in thousands) 2001 2000 Change in Benefit ObligationBenefit obligation at the
beginning of the year $ 15,038 $ 14,222Service cost 291 292Interest cost 1,012 924Plan amendmentsActuarial (gain) or loss 312 285 Benefits paid (915) (685)
Benefit obligation at the end of the year $ 15,738 $ 15,038
Change in Plan AssetsFair value of plan assets at
the beginning of the year $ 0 $ 0Employer contribution 915 685Benefits paid (915) (685)
Fair value of plan assets at the end of the year $ 0 $ 0
Reconciliation of Funded StatusFunded status $ (15,738) $ (15,038)Unrecognized net actuarial
(gain) or loss (1,555) (1,898)Unrecognized prior service cost 391 439
Accrued postretirement benefit liability $ (16,902) $ (16,497)
The health care cost trend rate assumption has a significanteffect on the amounts reported. A one-percentage point changein assumed health care trends would have the following effects:
1 Percentage 1 Percentage(in thousands) Point Increase Point DecreaseEffect on total of service and
interest cost components $ 138 $ (119)Effect on postretirement
benefit obligation $ 1,327 $ (1,164)
For measurement purposes, a 7.0 percent annual rate of increasein the per capita cost of covered health care benefits wasassumed for 2001; the rate was assumed to decrease gradually to5.5 percent by the year 2003 and remain at that level thereafter.The weighted-average discount rate used in determining theaccumulated postretirement benefit obligation was 7.0 percentin 2001 and 7.0 percent in 2000.
Note 8 - Stock Option and Incentive PlansSince 1987, the Company’s stock option and stock award planshave provided for the issuance of up to 6,900,000 shares ofcommon stock to key employees. As of December 31, 2001,2000, and 1999, respectively, 1,921,364, 199,535, and 711,194shares were available for future grants under these plans.
Options are granted at prices equal to fair market value on thedate of the grant and are exercisable over varying periods up to ten years from the date of grant. Shares subject to optionsgranted but not exercised become available for future grants.
At December 31, 2001, nineteen participants held options withexpiration dates ranging from 2003 to 2011 with a weighted-average remaining contractual life of 6.3 years and at optionprices ranging from $20.38 to $45.03 per share with a weighted-average price of $34.74 per share.
Details of the stock option plans at December 31, 2001, 2000,and 1999, are:
Per Share Weighted-Number of Option Price Average Price
Shares Range Per Share
Outstanding at December 31, 1998 1,140,127 $12.63 - $45.03 $24.32
Granted in 1999 168,346 35.56 - 37.63 37.26Exercised in 1999 (100,000) 12.63 12.63
Outstanding at December 31, 1999 1,208,473 $14.94 - $45.03 $27.09
Exercisable at December 31, 1999 990,127 $14.94 - $45.03 $24.45
Granted in 2000 412,349 31.72 - 37.63 35.46Exercised in 2000 (380,000) 14.94 14.94
Outstanding at December 31, 2000 1,240,822 $18.72 - $45.03 $33.59
Exercisable at December 31, 2000 1,005,968 $18.72 - $45.03 $32.85
Granted in 2001 142,052 33.56 - 44.07 34.96Exercised in 2001 (134,363) 18.72 - 32.31 24.38
Outstanding at December 31, 2001 1,248,511 $20.38 - $45.03 $34.74
Exercisable at December 31, 2001 942,705 $20.38 - $45.03 $34.44

38
The Company has adopted the disclosure-only provisions ofSFAS No. 123, “Accounting for Stock-Based Compensation.”Accordingly, no compensation cost has been recognized forthe stock option plan. Had compensation cost for theCompany’s stock-based compensation plans been determinedbased on the fair value at the grant date for stock options in2001, 2000, and 1999 consistent with the provisions of SFASNo. 123, the Company’s net earnings and earnings per sharewould have been reduced to the pro forma amounts indicatedbelow:
(dollars in thousands, except per share amounts) 2001 2000 1999Net earnings - as reported $ 140,325 $ 130,602 $114,775Net earnings - pro forma $ 139,090 $ 126,659 $112,426Diluted earnings
per share - as reported $ 2.64 $ 2.44 $ 2.18Diluted earnings
per share - pro forma $ 2.62 $ 2.37 $ 2.14
Dividend yield 2.9% 2.7% 2.4%Expected volatility 29.5% 28.3% 27.6%
Risk-free interest rate 7.0% 7.0% 7.0%Expected lives (in years) 10.0 8.0 8.1
The fair value of each grant made in 2001, 2000, and 1999 isestimated on the date of grant using the Black-Scholes option-pricing model using the above indicated weighted-averageassumptions for dividend yield, expected volatility, risk-freeinterest rate, and expected lives. The weighted-average fairvalue of stock options granted during 2001, 2000, and 1999used in computing pro forma compensation expense was$12.92, $11.82, and $13.10 per share, respectively.
In 1994 and in 2001, the Company adopted a Stock IncentivePlan for certain key executive employees. The 1994 and 2001Plans provide for the issuance of up to 2,000,000 and 2,500,000grants, respectively. Each Plan expires 10 years after its incep-tion, at which point no further stock options or performanceunits may be granted. Since 1994, 1,972,636 and 606,000 grantsof either stock options or performance units (commonlyreferred to as restricted stock) have been made under the 1994and 2001 plans, respectively. Distribution of the performanceunits is normally made in the form of shares of the Company’scommon stock on a one for one basis. Distribution of the shareswill normally be made not less than three years nor more thansix years from the date of the performance unit grant. All per-formance units granted under the plan are subject to restric-tions as to continuous employment, except in the case of death,permanent disability, or retirement. In addition, cash paymentsare made during the grant period on outstanding performanceunits equal to the dividend on Bemis common stock. The costof the awards is charged to income over the period of the grant:$11,332,000 was expensed in 2001, $6,339,000 in 2000, and$7,548,000 in 1999.
Details of the stock award plan at December 31, 2001, 2000,and 1999, are: Number
of Shares
Outstanding at December 31, 1998 1,052,157
Granted 103,558Canceled (60,919)
Outstanding at December 31, 1999 1,094,796
Granted 244,492Paid (14,000)Canceled (145,182)
Outstanding at December 31, 2000 1,180,106
Granted 676,869Paid (320,170)Canceled (40,750)
Outstanding at December 31, 2001 1,496,055
Note 9 - LeasesAll noncancelable leases have been categorized as capital oroperating leases. The Company has leases for manufacturingplants, warehouses, machinery and equipment, and adminis-trative offices with terms (including renewal options) rangingfrom one to 42 years. Under most leasing arrangements, theCompany pays the property taxes, insurance, maintenance, andexpenses related to the leased property. Total rental expenseunder operating leases was $12,476,000 in 2001, $9,296,000 in2000, and $11,281,000 in 1999.
The present values of minimum future obligations shown inthe following chart are calculated based on an interest rate of11 percent determined to be applicable at the inception of thelease. Interest expense on the outstanding obligations undercapital leases was $1,000 in 2001, $0 in 2000, and $13,000 in1999.
Minimum future obligations on leases in effect at December31, 2001, are:
Capital Operating(in thousands) Leases Leases
2002 $ 29 $ 7,1552003 20 4,8502004 0 3,7302005 0 2,8232006 0 2,000Thereafter 0 14,057
Total minimum obligations 49 $34,615Less amount representing interest 7Present value of net minimum obligations 42Less current portion 25Long-term obligations $ 17
Note 10 - Long Term DebtLong-term debt maturing in years 2002 through 2006 is$3,572,000, $658,000, $640,000, $100,855,000, and $229,100,000,respectively.
Under the terms of a revolving credit agreement with fivebanks, the Company may borrow up to $334 million through

39
August 1, 2006. The Company currently pays a facility fee of .12 percent annually on the entire amount of the commitment.In addition to the revolving long-term credit agreement, theCompany has a 364-day bridge credit agreement with six banksunder which it may borrow up to $250 million. The Companypays a facility fee of .10 percent annually on the entire amountof the commitment. There were no borrowings outstandingunder these agreements at December 31, 2001. These creditfacilities are used primarily to support the Company’s issuanceof commercial paper.
During the third quarter 2001, to obtain greater exposure toshort-term floating interest rates, the Company entered intolong-term interest rate swap agreements for a total notionalamount of $350.0 million with three major U.S. banks. Theseinterest rate swap agreements have been designated as hedgesof changes in the fair value of the Company’s $350.0 millionfixed rate long-term debt obligations ($100.0 million, 6.7 per-cent notes due July 1, 2005, and $250.0 million, 6.5 percentnotes due August 15, 2008). Counterparties to these agree-ments are major U.S. banks who also participate in theCompany’s bank credit facilities. Credit loss from counterpartynonperformance is not anticipated.
Under these interest rate swap agreements the Company willreceive a fixed rate of interest and pay a variable rate of inter-est over the term without the exchange of the underlyingnotional amounts. The fixed rate of interest, which theCompany will receive, is equal to the interest rate of theCompany’s long-term debt which is being hedged. The variablerate of interest which the Company will pay is based on the six-months London Interbank Offered Rate (LIBOR), set inarrears, plus a fixed spread which is unique to each agreement.The variable rates are reset semiannually at each net settlementdate. At December 31, 2001, the net settlement receivable of$4.0 million was recorded as a reduction in interest expense.
The terms of the interest rate swap agreements have beenspecifically designed to conform with the applicable terms ofthe hedged items and with the requirements of paragraph 68 ofSFAS No. 133 to support the assumption of no ineffectiveness(changes in fair value of the debt and the swaps exactly offset)and to simplify the computations necessary to make theaccounting entries. At December 31, 2001, the fair value ofthese interest rate swaps was $1.3 million in the banks’ favor, asdetermined by the respective bank using discounted cash flowor other appropriate methodologies, and is included withother liabilities and deferred credits with a correspondingdecrease in long-term debt.Debt consisted of the following at December 31,
(dollars in thousands) 2001 2000Commercial paper payable through
2002 at an interest rate of 1.9% (1) $229,100 $ 545,037Note payable in 2008 at an interest
rate of 6.5% 250,000Note payable in 2005 at an interest
rate of 6.7% 100,000 100,000Interest rate swap agreement (1,290)Industrial revenue bonds payable
through 2015 at interest rates of 1.8% to 1.9% (2) 15,500 15,500
Debt of subsidiary companies payable through 2005 at interest rates of 4.75% to 9.25% 5,469 4,874
Obligations under capital leases 42
Total debt 598,821 665,411 Less current portion 3,572 227,459Total long-term debt $595,249 $ 437,952
(1)The commercial paper has been classified as long-term debt,to the extent of available long-term backup credit agreements, inaccordance with the Company’s intention and ability to refinancesuch obligations on a long-term basis. The interest rate of com-mercial paper outstanding at December 31, 2001, was 1.9 percent.The maximum outstanding during 2001 was $561,439,000, andthe average outstanding during 2001 was $418,026,000. Theweighted-average interest rate during 2001 was 4.3 percent.
(2)Two industrial revenue bonds for which the variable interestrate is determined weekly by a “Remarketing Agent” based onsimilar debt then available. The weighted-average interest rateat December 31, 2001 was 1.8 percent. The weighted-averageinterest rate during 2001 was 2.9 percent.
Note 11 - Income Taxes(in thousands) 2001 2000 1999U.S. income before income taxes $ 196,652 $ 183,037 $169,210Non-U.S. income before
income taxes 31,101 31,204 26,068Consolidating eliminations (328) (2,739) (9,403)
Income before income taxes $ 227,425 $ 211,502 $185,875
Income tax expense consists of the following components:
Current tax expense:U.S. federal $ 54,861 $ 44,294 $ 50,032Foreign 7,864 11,354 7,095State and local 10,272 8,716 8,442Total current tax expense $ 72,997 64,364 $ 65,569
Deferred (prepaid) tax expense:
U.S. federal $ 11,545 13,876 $ 3,375Foreign (53) 150 1,556State 2,611 2,510 600Total deferred (prepaid) tax expense 14,103 16,536 5,531
Total income tax expense $ 87,100 $ 80,900 $ 71,100

40
The tax effects of temporary differences that give rise to signifi-cant portions of the deferred tax assets and deferred tax liabilitiesare presented below.
(in thousands) 2001 2000 1999
Deferred tax assets:Accounts receivable,
principally due to allowances for returns and doubtful accounts $ 4,798 $ 4,742 $ 4,589
Inventories, principally due to additional costs inventoried for tax purposes 4,470 3,291 3,593
Employee compensation and benefits accrued for financialreporting purposes 12,507 13,892 14,404
Other 3,843 4,099 1,149Total deferred tax assets
(included in prepaid expenses and deferred charges) $ 25,618 $ 26,024 $ 23,735
Deferred tax liabilities:Plant and equipment, principally due to differences in depreciation, capitalized interest, and capitalized overhead $ 132,479 $ 112,282 $102,262
Noncurrent employee compensation and benefitsaccrued for financial reporting purposes (12,269) (11,413) (17,424)
Other 1,769 2,752 4,797
Total deferred tax liabilities $ 121,979 $ 103,621 $ 89,635
The Company’s federal income tax returns for the years priorto 1998 have been audited and completely settled. Provisionhas not been made for U.S. or additional foreign taxes on$172,209,000 of undistributed earnings of foreign subsidiariesbecause those earnings are considered to be permanently rein-vested in the operations of those subsidiaries. It is not practica-ble to estimate the amount of tax that might be payable on theeventual remittance of such earnings.
Note 12- Segments of BusinessThe Company’s business activities are organized around its twoprincipal business segments, Flexible Packaging and PressureSensitive Materials. Both internal and external reporting conform to this organizational structure with no significant differences in accounting policies applied. Minor intersegmentsales are generally priced to reflect nominal markups. TheCompany evaluates the performance of its segments and allocates resources to them based on operating profit which isdefined as profit before general corporate expense, interestexpense, income taxes, and minority interest. While there aresimilarities in selected technology and manufacturing processesutilized, notable differences exist in products, application anddistribution of products, and customer base.
Products produced within the Flexible Packaging business segment include high barrier, polyethylene, and paper productsfor food, medical, personal care, agribusiness, chemicals, petfood, and sanitary products. Products produced within thePressure Sensitive Materials business segment include film,paper, and metalized plastic film printing stocks used for primary package labeling, promotional decoration, bar codeinventory control labels, and laser printing for administrativeoffice and promotional applications. This segment alsoincludes micro-thin film adhesives used in delicate electronicparts assembly and graphic films for decorative signage.
A summary of the Company’s business activities reported by itstwo business segments follows:
The Company’s effective tax rate differs from the federal statutory rate due to the following items:(dollars in thousands) 2001 2000 1999
% of Income % of Income % of IncomeAmount Before Tax Amount Before Tax Amount Before Tax
Computed “expected” tax expense on income before taxes at statutory rate $79,599 35.0% $74,026 35.0% $65,056 35.0%
Increase (decrease) in taxes resulting from:State and local income taxes net of federal income tax benefit 8,374 3.7 7,297 3.5 5,877 3.2Foreign tax rate differential (2,955) (1.3) 144 0.1 (776) (0.4)Minority interest 194 0.1 174 0.1 1,478 0.8Other 1,888 0.8 (741) (0.4) (535) (0.3)
Actual income tax expense $87,100 38.3% $80,900 38.3% $71,100 38.3%

41
BUSINESS SEGMENTS(in millions) 2001 2000 1999
Net Sales to Unaffiliated Customers:
Flexible Packaging $ 1,802.3 $ 1,660.2 $1,469.9Pressure Sensitive Materials 491.2 506.0 493.2
Intersegment Sales:Flexible Packaging (0.4) (1.6) (0.3)Pressure Sensitive Materials (0.2)
Total $ 2,293.1 $ 2,164.6 $1,962.6
Operating Profit and Pretax Profit:
Flexible Packaging $ 273.2 $ 221.3 $ 187.2 Pressure Sensitive Materials 12.1 40.1 44.3
Total operating profit (1) 285.3 261.4 231.5 General corporate expenses (27.0) (17.8) (20.2)Interest expense (30.3) (31.6) (21.2)Minority interest in net income (0.6) (0.5) (4.2)
Income before income taxes $ 227.4 $ 211.5 $ 185.9
Identifiable Assets:Flexible Packaging $ 1,486.7 $ 1,481.3 $1,180.8 Pressure Sensitive Materials 347.6 352.4 310.5
Total identifiable assets (2) 1,834.3 1,833.7 1,491.3Corporate assets (3) 88.7 54.9 40.8
Total $ 1,923.0 $ 1,888.6 $1,532.1
Depreciation and Amortization:Flexible Packaging $ 102.0 $ 86.6 $ 76.1Pressure Sensitive Materials 20.2 19.9 20.1Corporate 1.9 1.6 1.5
Total $ 124.1 $ 108.1 $ 97.7
Expenditures for Property and Equipment:
Flexible Packaging $ 106.4 $ 86.5 $ 101.4Pressure Sensitive Materials 9.7 13.1 34.9Corporate 1.4 0.8 1.1
Total $ 117.5 $ 100.4 $ 137.4
OPERATIONS BY GEOGRAPHIC AREAS(in millions) 2001 2000 1999 Net Sales to Unaffiliated Customers: (4)
United States $ 1,920.8 $ 1,821.5 $1,653.9Canada 85.9 77.6 72.6Europe 239.4 229.3 211.3Other 47.0 36.2 24.8
Total $ 2,293.1 $ 2,164.6 $1,962.6
Identifiable Assets:United States $ 1,532.2 $ 1,542.2 $1,237.8Canada 33.4 34.8 31.0Europe 210.4 195.9 196.3Other 58.3 60.8 26.2
Total $ 1,834.3 $ 1,833.7 $1,491.3
(1) Operating profit is defined as profit before general corporateexpense, interest expense, income taxes, and minority interest.(2) Identifiable assets by business segment include only those assetsthat are specifically identified with each segment’s operations.(3) Corporate assets are principally cash and short-term invest-ments, prepaid expenses, and corporate property.(4) Net sales are attributed to countries based on location ofthe Company’s manufacturing or selling operation.
Note 13 - ContingenciesThe Company is a defendant in lawsuits incidental to its business.The management of the Company believes, however, that thedisposition of these lawsuits will not have any material impacton the financial position or operating results of the Company.
During 2000, the Company settled a lawsuit brought by theUnited States Environmental Protection Agency in FederalDistrict Court for the District of Connecticut in relation to thedisposal of liquid industrial wastes at the Yaworski Lagoon sitein Canterbury, Connecticut. The settlement involved theCompany’s payment of $3,160,000 in 2000 which was fully provided for in prior years.
Note 14 - Foreign OperationsThe foreign countries in which the Company conducts opera-tions generally impose no significant restrictions on transfers offunds. Amounts attributable to foreign operations included inthe consolidated statements are as follows:
(in thousands) 2001 2000 1999Net sales of consolidated foreign subsidiaries $ 372,326 $ 343,079 $308,681Net income of consolidated foreign subsidiaries 22,190 20,090 16,336Foreign earnings in excess of dividends received 21,861 17,351 6,931Equity in net assets 228,084 193,318 135,034Equity in total assets 302,029 278,712 214,792
Note 15 - Financial InstrumentsThe Company enters into forward foreign currency exchangecontracts to manage foreign currency exchange rate exposuresassociated with certain foreign currency denominated receiv-ables and payables. At December 31, 2001 and 2000, theCompany had outstanding forward foreign currency exchangecontracts aggregating $3,166,000 and $7,270,000, respectively.Forward foreign currency exchange contracts generally havematurities of less than nine months and relate primarily tomajor Western European currencies. Counterparties to the forward foreign currency exchange contracts are major financialinstitutions. Credit loss from counterparty nonperformance is not anticipated. On January 1, 2001, SFAS No. 133,“Accounting for Derivative Instruments,” was adopted by theCompany. SFAS No. 133 requires that the fair value of derivativeinstruments, such as forward foreign currency exchange contracts, be recorded on the balance sheet with subsequentchanges reflected in income or deferred as an element of equity.The Company has not designated these derivative instruments

42
as hedging instruments. The $6,600 net settlement expense(fair value) related to active forward foreign currency exchangecontracts is recorded on the balance sheet and as an expenseelement of other costs (income), net.
During the third quarter 2001, to obtain greater exposure toshort-term floating interest rates the Company entered intolong-term interest rate swap agreements for a total notionalamount of $350.0 million with three major U.S. banks. Theseinterest rate swap agreements have been designated as hedgesof changes in the fair value of the Company’s existing $350.0million fixed rate long-term debt obligations ($100.0 million,6.7 percent note due July 1, 2005, and $250.0 million, 6.5 percentnote due August 15, 2008). Counterparties to these agreementsare major financial institutions who also participate in theCompany’s bank credit facilities. Credit loss from counterpartynonperformance is not anticipated.
Under these interest rate swap agreements the Company willreceive a fixed rate of interest and pay a variable rate of interestover the term without the exchange of the underlying notionalamounts. The fixed rate of interest, which the Company willreceive, is equal to the interest rate of the Company’s long-termdebt which is being hedged. The variable rate of interest whichthe Company will pay is based on the six-months LondonInterbank Offered Rate (LIBOR), set in arrears, plus a fixedspread which is unique to each agreement. The variable ratesare reset semiannually at each net settlement date. AtDecember 31, 2001, the net settlement receivable of $4.0 millionwas recorded as a reduction in interest expense. This position forthe Company would become less favorable as short-term interestrates increase.
The terms of the interest rate swap agreements have beenspecifically designed to conform with the applicable terms ofthe hedged items and with the requirements of paragraph 68 ofSFAS No. 133 to support the assumption of no ineffectiveness(changes in fair value of the debt and the swaps exactly offset)and to simplify the computations necessary to make theaccounting entries. At December 31, 2001, the fair value ofthese interest rate swaps was $1.3 million in the banks’ favor, asdetermined by the respective bank using discounted cash flowor other appropriate methodologies, and is included withother liabilities and deferred credits with a correspondingdecrease in long-term debt.
At December 31, 2001 and 2000, the carrying value approxi-mates the fair value of financial instruments such as cash, tradereceivables and payables, and short-term debt because of theshort-term maturities of these instruments. The fair value of theCompany’s long-term debt, including current maturities butexcluding capitalized leases, is estimated to be $599,097,000and $665,448,000 at December 31, 2001 and 2000, respectively,using discounted cash flow analyses, based on the incrementalborrowing rates currently available to the Company for similardebt with similar terms and maturity.
Concentrations of credit risk with respect to trade accountsreceivable are limited due to the large number of entities comprising the Company’s customer base and their dispersionacross many different industries and countries. As of December31, 2001 and 2000, the Company had no significant concentra-tions of credit risk.
Note 16 – Earnings Per Share Computations (in thousands, except per share amounts)2001 2000 1999
Income Shares Per Share Income Shares Per Share Income Shares Per Share(Numerator) (Denominator) Amount (Numerator) (Denominator) Amount (Numerator) (Denominator) Amount
Basic EPSIncome available to common stockholders $140,325 52,816 $2.66 $130,602 53,178 $2.46 $114,775 52,307 $2.19
Dilutive effects of stock optionand stock award plans 306 375 350
Diluted EPSIncome available to common stockholders $140,325 53,122 $2.64 $130,602 53,553 $2.44 $114,775 52,657 $2.18
Note 17 - Quarterly Financial Information – Unaudited (dollars in millions, except per share amounts)
Net Sales Gross Profits Net Income Diluted Earnings Per Share% % % %
Quarter 2001 2000 Change 2001 2000 Change 2001 2000 Change 2001 2000 Change
First $ 577.4 $ 512.6 13% $ 117.2 $107.6 9% $ 29.7 $ 29.6 $ .56 $ .55 2%Second 581.6 537.3 8 122.3 114.1 7 35.5 35.4 .67 .66 2Third 575.6 542.8 6 117.6 108.9 8 36.1 32.2 12% .68 .60 13Fourth 558.5 571.9 (2) 120.6 116.7 3 39.0 33.4 17 .73 .63 16
Total $2,293.1 $2,164.6 6% $477.7 $447.3 7% $140.3 $130.6 7% $2.64 $2.44 8%

Global Company Operations
Flexible Packaging
High Barrier ProductsCurwood
Oshkosh,WisconsinNew London, WisconsinMurphysboro, IllinoisFremont, OhioAppleton, WisconsinNeenah, WisconsinCenterville, IowaPauls Valley, OklahomaGeorgetown, Ontario,
CanadaSwansea, WalesSão Paulo, Brazil
MilprintOshkosh, WisconsinDenmark, WisconsinLancaster, WisconsinNew London, WisconsinLebanon, Pennsylvania
Banner PackagingOshkosh, Wisconsin
PerfecsealPhiladelphia, PennsylvaniaOshkosh, WisconsinMankato, MinnesotaLondonderry, Northern
IrelandCarolina, Puerto RicoSelangor, Malaysia
MacKayFlorence, KentuckyOmaha, NebraskaNew London, WisconsinMurfreesboro, Tennessee
Techy Bemis, S.A.Charleroi, Belgium
ITAP/Bemis Ltda. (affiliate)São Paulo, BrazilLondrina, Brazil
Polyethylene ProductsPolyethylene Packaging
Terre Haute, IndianaHazleton, PennsylvaniaFlemington, New JerseyUnion City, CaliforniaPrattville, Alabama
Bemis Custom ProductsOshkosh, WisconsinLongview, TexasShelbyvilIe, TennesseeBrigg, North Lincolnshire,
England
Paper ProductsPaper Packaging
Crossett, ArkansasPeoria, IllinoisOmaha, NebraskaVancouver, WashingtonSan Luis Potosi, Mexico
BemistapeMinneapolis, Minnesota
Pressure SensitiveMaterials
MACtac AmericasStow, OhioColumbus, IndianaNellis, NevadaScranton, PennsylvaniaHopkins, MinnesotaDallas, TexasGreen, OhioKansas City, MissouriLawrenceville, GeorgiaVancouver, WashingtonBrampton, Ontario,
CanadaSan Luis Potosi, Mexico
MACtac EuropeSoignies, BelgiumNorthampton, EnglandParis, FranceKöln, GermanyMilan, ItalyBarcelona, SpainMalmo, SwedenFrauenfeld, SwitzerlandWarsaw, Poland
MACtac Asia PacificSingapore
43
Selangor, Malaysia
Singapore

Directors, Officers and Operations Management
44
Board of Directors (year elected)
John H. Roe (1978)Chairman,Bemis Company, Inc. 1*
Nancy P. McDonald (1982)Director, Hillcrest Corp. 2, 4*, 5
Edward N. Perry (1992)Partner, Perkins, Smith & Cohen, LLP 2, 4, 5
Jeffrey H. Curler (1992)President and Chief Executive Officer,Bemis Company, Inc. 1
Loring W. Knoblauch (1993)President and Chief Executive Officer,Underwriters Laboratories, Inc. 2, 5
Winslow H. Buxton (1993)Chairman,Pentair, Inc. 1, 3* 5
C. Angus Wurtele (1994)Retired Chairman, Valspar Corporation 1, 3, 5*
Roger D. O’Shaughnessy (1997)President and Chief Executive Officer,Cardinal Glass Industries, Inc. 1, 3, 5
John G. Bollinger (1999)John Bascom Professor of IndustrialEngineering, Emeritus, Emeritus Dean, College of Engineering, University of Wisconsin-Madison 4, 5
William J. Bolton (2000)Consultant, Food Industry, formerly Executive Vice President,SuperValu, Inc. 2, 5
William J. Scholle (2001)Chairman and Chief Executive Officer,Scholle Corporation 5
Barbara L. Johnson (elected 2002)Vice President and Treasurer,Carleton College 2, 5
1. Executive and Finance Committee2. Audit Committee3. Compensation Committee4. Community Relations Committee5. Nominating Committee
*Chairperson
Corporate Officers
Jeffrey H. CurlerPresident, Chief Executive Officer and Director
John H. RoeChairman and Director
Scott W. JohnsonSenior Vice President, General Counsel and Secretary
Benjamin R. Field, IIISenior Vice President, Chief Financial Officer and Treasurer
Thomas L. SallVice President, Operations
Gene C. WulfVice President and Controller
Eugene H. Seashore, Jr.Vice President, Human Resources
Stanley A. JaffyVice President, Tax and Assistant Controller
Operations Management
Flexible PackagingThomas L. Sall, President
High Barrier ProductsCurwoodHenry J. Theisen, President
MilprintDon E. Nimis, President
Banner PackagingJames A. Russler, President
PerfecsealPaul R. Verbeten, President,
North AmericaAlan D. McClure, President,
International
MacKayJames A. Elliott, President
Flexible Packaging–EuropeMarc Dussart, President
Techy Bemis, S.A.Maurice Dangotte, President andGeneral Manager
Polyethylene ProductsPolyethylene PackagingGary V. Stone, President
Bemis Custom ProductsChristopher C. Martin, President
Paper ProductsPaper PackagingNeal J. Ganly, President
BemistapeWilliam M. Zenner, Vice President andGeneral Manager
Pressure Sensitive MaterialsWilliam F. Austen, President and CEO
MACtac AmericasWilliam F. Austen, President
MACtac MexicoJose Martin Alba, President
Electronic Printing ProductsJodi A. Westphal, General Manager
MACtac EuropeMarc Dussart, President

45
Shareholder Information
Financial Information
Upon written request, the Company
will, at no charge, provide a copy of its
most recent Form 10-K filed with the
Securities and Exchange Commission.
Additional financial information is
available on the Bemis web site
(www.bemis.com) or by contacting:
Melanie E.R. Miller
Director of Investor Relations
Bemis Company, Inc.
222 South Ninth Street
Suite 2300
Minneapolis, MN 55402-4099
612-376-3000
E-mail: [email protected]
Dividend Reinvestment Plan
Information on the Company’s
Dividend Reinvestment Plan is
available by contacting:
Wells Fargo Bank Minnesota
Dividend Reinvestment Department
161 North Concord Exchange
South St. Paul, MN 55075
651-450-4064 or 1-800-468-9716
Transfer Agent and Registrar
Wells Fargo Bank Minnesota
Wells Fargo Shareowner Services
161 North Concord Exchange
South St. Paul, MN 55075
651-450-4064 or 1-800-468-9716
Bemis Common Stock
Bemis stock is traded on the New York
Stock Exchange under the symbol
BMS, and is a component of the S&P
500 index.
Annual Meeting
May 2, 2002, at 9:00 a.m. in the
Main Lounge of the Minneapolis
Club, 729 2nd Avenue South,
Minneapolis, Minnesota.
© Bemis Company, Inc. 2002Brownberry® is a registered trademark of Arnold Products, Inc., used with permission.
Bemis Company, Inc. and Subsidiariesfinancial highlights
Years Ended December 31,(dollars in thousands, except per share amounts) 2001 2000 % Change
Sales and Earnings:
Net sales $2,293,104 $2,164,583 6%
Income before income taxes 227,425 211,502 8
Provision for income taxes 87,100 80,900 8
Net income 140,325 130,602 7
Per Share:
Basic earnings per share $ 2.66 $ 2.46 8%
Diluted earnings per share 2.64 2.44 8
Dividends paid 1.00 .96 4
Book value 16.76 15.18 10
Ratios:
Net income to net sales 6.1% 6.0%
Return on average stockholders’ equity 16.7% 17.1%
Return on average total capital 10.0% 10.8%
Total debt to total capital 37.3% 42.7%
Additional Information:
Capital expenditures $ 117,481 $ 100,420 17%
EBITDA* $ 381,915 $ 351,241 9
Stock price/earnings ratio range 11-20x 10-16x
Weighted-average common shares outstanding
for computation of diluted earnings per share 53,121,798 53,552,703 (1)
Common shares outstanding at year-end 52,869,929 52,602,414 1
Number of employees 11,012 10,969
*EBITDA is defined as earnings before interest, income taxes, depreciation, and amortization. It is not a measure of operating results, nor is it presented in our consolidated financial statements. EBITDA is not considered a qualified financial measurement under U.S. generally acceptedaccounting principles (GAAP).

®
Bemis Company Inc.
222 South 9th Street
Suite 2300
Minneapolis, MN 55402
w w w. b e m i s. co m a n n u a l re p o r t
2001