annual investment report - state treasurer
TRANSCRIPT

ANNUAL INVESTMENT REPORTFiscal Year Ending June 30, 2020


The following report was prepared pursuant to Act 53 of 2008 (Act), which amended various provisions of the Act of April 9, 1929 (P.L. 343, No. 176), known as the Fiscal Code. Specifically, Section 301.3 of the Act requires the State Treasurer to submit an Annual Investment Report by November 30 to the Governor and to the State House and State Senate Chairperson and Minority Chairperson of both the Appropriations and Finance committees for the most recently-ended fiscal year.
Additional information pertaining to the custodial and investment functions performed by the Pennsylvania Treasury, along with an overview of the Commonwealth Investment Program, are also included herein.
ii


iv
November 30, 2020
The Honorable Thomas W. WolfGovernorCommonwealth of PennsylvaniaRoom 225 Main Capitol BuildingHarrisburg, Pennsylvania 17120
RE: Pennsylvania Treasury Annual Investment Report
Dear Governor Wolf:
I am pleased to present the Pennsylvania Treasury 2020 Annual Investment Report pursuant to Act 53 of 2008.
As State Treasurer it is my fiduciary responsibility and top priority to make sure Commonwealth investments are carefully monitored. Every Pennsylvania taxpayer deserves the most prudent investment decisions to be made on their behalf with their hard earned dollars.
Treasury’s consumer savings programs continue to see significant growth and participation by Pennsylvania families. The PA 529 College and Career Savings Program saw record contributions for calendar year 2019, making it the second consecutive year for record contributions. Minimum contributions to both the Investment Plan (IP) and Guaranteed Savings Plan (GSP) were lowered to just $10 to make the savings plans more affordable.
With continued asset growth, the IP saw another fee reduction of one basis point (0.01%) resulting in $310,000 in savings for IP account owners. The IP received a Morningstar Silver RatingTM — an upgrade from last year’s first-ever Morningstar Bronze RatingTM — reflecting the work at Treasury since I took office in 2017 to include age-based investment options, diversify portfolios, fee reductions and better oversight of the plan. The GSP continues to be fully funded at 123% and exceeded its benchmark of 6% earnings in the 2018-2019 fiscal year — earning an annual return rate of 6.45%, net of fees. To further secure the health of the plan, the GSP actuarial return rate was lowered to 5.5%. This reduction allows for more allocation of lower risk investments in the GSP portfolio.
PA ABLE now has more than 3,500 account owners who have saved more than $31 million since the program began in 2017. PA ABLE continues to be the largest program in the National ABLE Alliance — empowering Pennsylvanians with disabilities and their families to save and build their own wealth.
Treasury continued the transition of its portfolio to low-cost, index-based investment strategies with an exit from hedge fund investments. This change brings $14 million in annual fee savings, and $404 million in savings over 20 years. This in combination with previous moves to index-based investments results in more than $700 million in savings over 20 years.
Treasury authorized a $250 million line of credit from Treasury’s Short-Term Investment Pool (STIP) to the Pennsylvania Higher Education Assistance Agency (PHEAA) to help underwrite its PA Forward Student Loan Program and provide financial support to its student loan rehabilitation initiative. Treasury has extended lines of credit to PHEAA to support higher education funding for Pennsylvanians since 1990.
Treasury reached settlement agreements with 16 of the nation’s largest banks after leading a class action lawsuit claiming these banks colluded to fix prices of Fannie Mae and Freddie Mac bonds from 2009 to 2016. The lawsuit was initiated after Treasury became aware of online chatroom discussions between the banks’ traders that demonstrated agreements to set prices of the bonds before they went to market. Settlements included monetary compensation to plaintiffs in the case, but more importantly banks agreed to structural reforms to prevent this type of behavior in the future. These changes will protect Treasury’s future investments of taxpayer dollars.

Through shareholder engagement efforts we have tirelessly worked for change at companies we invest in – like repeatedly calling for the separation of the board chair and CEO positions at Facebook. Without this separation, Mark Zuckerberg retains full control of the company, despite differing shareholder votes from outside the company. The separation of these roles would better serve investors and the millions of Pennsylvanians who use the platform every day. The Facebook proposal continues to gain majority votes of shareholders outside of the company. Treasury’s most recent effort was co-filed along with our fiduciary counterparts in Illinois, New York City, Rhode Island, Connecticut, and Trillium Asset Management. Treasury also supported efforts initiated by Walmart employees, requesting consideration of the company’s essential employees for board director positions. With the uncertain times of COVID-19 pandemic, it is more important than ever to make sure the companies we invest in are doing their part to demonstrate dedication to long-term shareholder value — instead of just short-term profits.
In response to the pandemic, Treasury worked to help approve and establish the Hospital Emergency Loan Program or HELP through the Pennsylvania Infrastructure Investment Authority (PENNVEST), to offer $450 million to the Commonwealth’s non-profit and public hospitals. These bonds were made available with interest rates of no more than 2% to help hospitals maintain staffing, equipment and other necessities to continue essential services to save the lives of Pennsylvanians without extra financial burden.
Treasury joined with other fiduciaries across the nation to call for easy access to repair information from two dozen ventilator manufacturers to allow for more efficient repairs to be done by hospitals who were in dire need of the life-saving devices. Treasury has most recently lead an effort of nearly a dozen state fiscal officers to demand drug manufacturer Gilead price their COVID-19 drug Remdesivir fairly.
Treasury also worked closely with its banking partners to formulate an agreement to provide Pennsylvanians access to federal stimulus check cashing without fees regardless of their banking status. To further ease the burden of COVID-19 related expenses, Treasury worked to create a bond buying program to help Pennsylvania’s non-profit and public healthcare systems maintain secure financial footing.
Treasury’s employees work tirelessly and are committed to improving the financial well-being of the Commonwealth by ensuring the most cost-effective and prudent investments of Pennsylvania’s public funds.
If you have any questions, please do not hesitate to contact me.
Sincerely,
Joseph M. TorsellaState Treasurer
v

About Pennsylvania Treasury
Pennsylvania Treasury Page 1
Overview of the Commonwealth Investment Program
Commonwealth Investment Program Page 11
Short Term Investment Pool – STIP (Pool 99) Page 11
Long Term Investment Pool – LTIP (Pool 198) Page 11
Commonwealth Investment Program Summary Page 12
Statutory Annual Investment Reporting Requirements
Short Term Investment Pool – STIP (Pool 99) Page 15
Long Term Investment Pool – LTIP (Pool 198) Page 15
Quarterly Asset Allocation Page 16
Investment Performance: Standards, Measures, and Benchmarks Page 17
Returns by Asset Class Page 17
External Investment Managers: Selection, Fees, and Performance Page 18
Long Term Investment Pool: External Investment Manager List as of June 30, 2020 Page 19
Long Term Investment Pool: External Investment Manager Fees for Fiscal Year 2019-2020 Page 20
Long Term Investment Pool: External Investment Manager Fees and Performance Summary Page 21
as of June 30, 2020
Brokerage Fees Page 22
Long Term Investment Pool: Broker Commissions Fiscal Year 2019-20 Page 22
Top Ten Long Term Investment Pool Broker Commissions Fiscal Year 2019-20 Page 23
Security Lending Page 23
Responsible Investing and Proxy Voting Page 24
Litigation Page 25
Commonwealth Investment Program Participant Holdings Pages 26-31
TABLE OF CONTENTS
vi


ANNUAL INVESTMENT REPORTAbout Pennsylvania Treasury


Joseph M. Torsella, Pennsylvania State Treasurer
1
Pennsylvania Treasury
Pennsylvania’s Constitution established the Pennsylvania Treasury Department as an independent executive office. The State Treasurer serves as the department’s chief executive, as well as the Commonwealth’s chief financial officer. Additionally, the Treasurer serves, among other things, as statutory custodian and investor.
(1) Treasury Total includes those Treasury programs and pools that directly fall under Treasury’s investment authority, including Pool 198, Pool 99, PA 529 College and Career Savings Program, and others.(2) Not reflected in the chart due to the small portfolio NAV in relation to the other portfolios.* Percentages may not sum to 100% due to rounding.
As statutory custodian, the State Treasurer monitors and safeguards virtually all state agency funds, which totaled in excess of $119 billion as of June 30, 2020. The composition of those funds is provided in the following chart. This role also requires the Treasurer to collect interest and dividends, execute securities transactions, and oversee daily trade settlements.
SERS25.10%
PSERS47.74%
TREASURY19.21%
PROGRAMS % UNDER CUSTODYNET ASSET VALUE
TOTAL UNDER CUSTODY $119,419,728,619 100.00%*
Public School Employees' Retirement System
State Employees' Retirement System
Treasury Total (1)
Pennsylvania Municipal Retirement System
State Workers' Insurance Fund
Refunding Bond Issuances
Deferred Compensation
Commonwealth Financing Authority
Workers' Compensation Security Fund
Post Employment Bene�ts Other Than Pensions (2)
Underground Storage Tank Indemni�cation Fund (2)
Pennsylvania Industrial Development Authority (2)
Achieving a Better Life Experience (2)
Deferred Compensation 401A (2)
State Employees' Retirement System Bene�t Completion Plan (2)
$57,011,530,190
$29,970,794,748
$22,940,465,655
$2,655,565,883
$1,436,584,939
$1,399,480,051
$1,189,738,471
$885,036,567
$856,051,066
$594,775,212
$263,479,674
$180,699,137
$31,003,550
$3,392,101
$1,131,374
47.74%
25.10%
19.21%
2.22%
1.20%
1.17%
1.00%
0.74%
0.72%
0.50%
0.22%
0.15%
0.03%
0.00%
0.00%

The Pennsylvania Treasury, Annual Investment Report: About the Pennsylvania Treasury
2
In his investing function, the Treasurer manages and invests any funds in excess of the Commonwealth’s current operational needs, unless those funds are explicitly under the control of another board, commission, or state official.
Of the approximately $119 billion plus in state agency and other program funds under Treasury custody on June 30, 2020, Treasury directly managed $25.3 billion, as illustrated here:
PA 529 COLLEGE SAVINGS PROGRAM
(TAP) 21.63%
POOL 9934.94%
POOL 19811.67%
PROGRAMS % UNDER CUSTODYNET ASSET VALUE
TOTAL UNDER CUSTODY $114,992,703,072 100%
Pool 99
PA 529 College Savings Program (TAP) (1)
Pool 198
Float
State Workers' Insurance Fund
INVEST
Pool 124
Commonwealth Financing Authority
Workers' Compensation Security Fund
Post Employment Bene�ts Other Than Pensions
Underground Storage Tank Indemni�cation Fund
Pennsylvania Industrial Development Authority
Fund 65 (2)
Treasury Programs (2)
Pennvest (2)
PennSef (2)
TOTAL DIRECTLY MANAGED
$8,839,468,895
$5,473,428,770
$2,952,063,242
$1,550,072,531
$1,436,584,939
$1,090,195,542
$1,074,458,508
$885,036,567
$856,051,066
$594,775,212
$263,479,674
$180,699,137
$84,877,434
$12,901,479
$5,407,879
$9,653
$25,299,510,529
34.94%
21.63%
11.67%
6.13%
5.68%
4.31%
4.25%
3.50%
3.38%
2.35%
1.04%
0.71%
0.34%
0.05%
0.02%
0.00%
100.00%*
Pool 99 is the Commonwealth Operating Funds Liquidity Pool.Pool 198 is the Commonwealth Operating Funds Investment Pool.Pool 124 is comprised of uninvested cash of Commonwealth agencies’ investment managers as of June 30, 2018.CFA is an independent agency of the Commonwealth administering Pennsylvania’s economic stimulus packages.OPEB is a pool for other post-employment benefits.PIDA is an independent agency of the Commonwealth that provides low interest loans and lines of credits to eligible businesses that commit to creating and retaining full time jobs and for the development of industrial parks and multi-tenant facilities.Fund 65 is the Workers Compensation Administration Fund.Treasury Programs are comprised of multiple internally managed programs.Float is a one-day investment of expended but uncashed payments at Commonwealth depositories.
(1) TAP NAV does not include $45,937,569 investment in Pool 124. Total TAP NAV including 124 investment is $5,519,366,340.(2) Not reflected in the chart due to the small portfolio NAV in relation to the other portfolios.* Percentages may not sum to 100% due to rounding.

Joseph M. Torsella, Pennsylvania State Treasurer
3
Investment Philosophy:
Treasury maintains a set of investment beliefs about its own office, the companies and securities in which it invests to earn a return, and the capital markets through which Treasury transacts. These investment beliefs inform specific investment policies and guidelines which guide the investment activities of Treasury as fiduciary of Commonwealth assets for Commonwealth agencies, taxpayers, current and future Pennsylvanians, and other stakeholders. Treasury Investment staff are governed by these investment beliefs in their partnership with managers and in selection of investment securities. In order to integrate fully these investment beliefs, Investment staff partner with Policy, General Counsel, and other offices within Treasury. Treasury Investment Office staff invest across multiple asset classes and security types in their stewardship of investment programs under Prudent Investor guidelines. These beliefs hold across all assets. Treasury investments benefit from well-functioning capital markets, where those investing and seeking investment can do so fairly. Pennsylvania, a large state with significant financial assets, has a responsibility to advance healthy capital markets.
Treasury Investment Beliefs:
1. Transparency provides a basis for trust.
2. Accountability enforces trust.
3. Costs have a material impact on returns.
4. Simplicity facilitates responsible stewardship of funds.
5. Time Horizons of portfolios and stakeholders influence portfolio management.
6. Risk is both qualitative and quantitative, and future risks may differ from historical risks.
When prioritizing issues of investment strategy, Treasury will address issues which are material, consistent with policy and these investment beliefs, and for which the Investment Office has the expertise and capacity to improve outcomes.
Investment Changes in the Last Year:
1. Treasury terminated its Hedge Fund managers.
With the goal of continuing the transition of its portfolio to low-cost index-based investment strategies, Treasury decided to exit Hedge Funds. Hedge Fund investments were around 7% of Pool 198, yet generated approximately 75% of the fees paid, and generated long-term returns comparable to U.S. Treasury Bonds. Treasury’s investment team performed an analysis that concluded the risk and return profile of hedge funds could be replicated in the public markets with higher liquidity and lower fees. This analysis contributed to Treasury’s decision to exit Hedge Fund investments; however, due to the illiquid nature of these investments, it will take nearly two years for Treasury to fully redeem and redeploy these assets.

The Pennsylvania Treasury, Annual Investment Report: About the Pennsylvania Treasury
4
2. Pennsylvania Treasury established a Service Level Agreement (SLA) with the Commonwealth’s sub-custodian bank, Bank of New York Mellon (BNYM).
The SLA establishes performance standards and Key Performance Indicators (KPI) on the basis of the overall services contract. A monthly review of the KPI’s is provided via a scorecard. Failure by BNYM to meet the established service levels are documented. A tiered structure for Fees-at-Risk is in place to address issues that are not resolved in timely fashion or continue to worsen. Each of the three pension systems, PSERS, SERS, and PMRS have agency specific KPI’s for services unique to the organization.
3. Treasury simplified the structure of its Fixed Income exposure and hired two managers to implement Separately Managed Accounts (SMAs) for the Bloomberg Barclays Aggregate Index.
Treasury hired two investment managers to implement its bond index exposure through a Separately Managed Account (SMA), which can be implemented at a lower cost than an index fund or ETF. Because Treasury has billions of dollars invested in fixed income across its portfolios, it selected two different managers in an effort to reduce the risk associated with concentrating assets in one particular investment manager.
4. Treasury and PHEAA renewed the Interagency Agreement providing support to the PA Forward student loan program.
Treasury and PHEAA continued a decades long relationship in which Pool 198 earns a market rate of return while providing liquidity for PHEAA to serve Pennsylvania’s student borrowers. In addition to the existing loan and loan rehabilitation programs previously offered, PHEAA introduced the PA Forward loans. This investment is a large portion of the Economically Targeted Investments (ETI’s) in the Pool’s asset allocation.
5. Treasury adopted a new Investment Policy Statement (IPS) for the Pennsylvania INVEST Program.
The purpose of the INVEST IPS is to define and assign the responsibilities of all parties involved with the management of the INVEST Program’s assets, document the investment goals and objectives of INVEST, provide guidelines and procedures for the investment of assets, and to establish a basis for evaluating investment results.
a. Creating a standalone IPS for INVEST is intended to separate the documentation and procedures for the management of non-Commonwealth assets in addition to simplify the governance of the portfolios and their management.
6. Treasury implemented new software systems and procedures for the internally managed portfolios.
New systems allow for streamlining processes, improve Treasury’s ability to scale, and have proven paramount to Treasury’s ability to successfully execute an investment program while working remotely during the COVID-19 pandemic.

Joseph M. Torsella, Pennsylvania State Treasurer
5
a. Security settlement details are now communicated to Treasury’s custodian BNYM using a web-based platform called Instruction Capture Online (ICO) instead of faxing, which allows for Treasury’s trade instructions to auto-match with counterparty trade instructions resulting in reduced trade settlement times, increased accuracy, and fewer trade fails.
b. Treasury has implemented electronic trade execution with counterparties greatly reducing trade execution times and improving best execution.

The Pennsylvania Treasury, Annual Investment Report: About the Pennsylvania Treasury
6
For the fiscal year 2019-20, Treasury had operating budgets of approximately $45 million and authorized staff of 365 employees (across all line-item appropriations under the Treasury Department). The Commonwealth’s current Treasurer, Joseph M. Torsella, took office in January 2017.
In addition to managing funds and investments on behalf of state agencies, the Treasurer’s investment function also serves families and local governments, as well as charitable and nonprofit organizations through three specialized Treasury programs: the ABLE Program, the PA 529 College and Career Savings Program, and the INVEST Program.
Treasury’s ABLE Program provides individuals with qualified disabilities and their families a tax-advantaged means to save for disability-related expenses while maintaining government benefits. The Pennsylvania ABLE program was authorized by the Federal Achieving a Better Life Experience (ABLE) Act of 2013. The ABLE Act amends Section 529 of the Internal Revenue Service Code of 1986. These accounts can be used to cover qualified expenses such as, but not limited to, education, housing and transportation.
The Pennsylvania General Assembly enacted legislation in 2016, signed into law by Governor Wolf, authorizing Treasury to create ABLE accounts under the Federal ABLE Act. Treasury launched PA ABLE in April 2017, and has to date enrolled more than 3,500 accounts with a net asset value over $31 million, making it the largest in the National ABLE Alliance. PA ABLE funds are invested in products offered by Blackrock, Charles Schwab, Sallie Mae, Vanguard, and in an FDIC insured bank account provided by Fifth Third Bank.
Treasury’s PA 529 College and Career Savings Program consists of two plans: the PA 529 Guaranteed Savings Plan (GSP) and the PA 529 Investment Plan (IP). Treasury is responsible for investing contributions to GSP accounts, while savings in the IP are invested in 17 different mutual fund options from The Vanguard Group with oversight from Treasury. As of June 30, 2020, more than 109,400 accounts comprised the PA 529 GSP and over 141,500 accounts used the IP to help save for education.
Treasury’s INVEST Program offers a high-quality and liquid investment alternative to local government and nonprofit groups. The Program offers two pools: the INVEST Daily Pool and the INVEST Community Pool. The Program also provides periodic custom investment opportunities for longer-term investment needs. Treasury administers the INVEST Daily Pool on behalf of local governments within Pennsylvania. The INVEST Community Pool is very similar and administered on behalf of Pennsylvania non-profits.
TREASURER’S INVESTMENT AUTHORITY
The Pennsylvania Fiscal Code grants the Treasurer the exclusive management and full power to invest funds that are beyond the ordinary needs of the Commonwealth and that are not otherwise authorized to be invested by any other board, commission or public official. The Treasurer is directed to exercise his authority as a fiduciary with care, skill, prudence and diligence under the circumstances then prevailing, specifically including the general economic conditions and the anticipated needs of the funds.
Treasury’s investment mandate means the department must exercise careful judgment when determining which investments are appropriate for each Commonwealth fund based upon different criteria such as income needs, cash flow requirements, investment time horizons, and risk tolerance. These judgments must also take into account different legal standards that limit the particular kinds of investments each fund could hold.
Treasurer Torsella continually seeks quality investments – those that safeguard principal over appropriate time horizons while tracking the performance of benchmarks - in order to maximize the benefits to the Commonwealth and its citizens. At the same time, the Treasurer actively pursues promising investment opportunities that offer a reasonable risk-adjusted rate of return, but also help to strengthen certain strategically important segments of Pennsylvania’s economy.
Act 20 of 2019 passed in 2018 extended the standard of time to provide the authority to invest or reinvest the moneys of any fund pursuant to this act to December 31, 2024.

Joseph M. Torsella, Pennsylvania State Treasurer
7
Treasury’s investment staff manages and administers both pools, which do not require minimum investment periods, minimum account balances, or notifications before redeeming funds.
Both pools are rated “AAAm” by Standard and Poor’s, which is the highest rating for such funds and signifies each pool’s extremely strong capacity to maintain principal value and limit exposure to losses due to credit, market, or liquidity risks.
Combined, the INVEST Program’s two pools distributed over $15 million in earnings to participants in the fiscal year 2019-20. As of June 30, 2020, the INVEST Daily Pool had 285 participants and a net asset value of over $1 billion; the INVEST Community Pool had 181 participants and a net asset value of over $76 million.


ANNUAL INVESTMENT REPORTOverview of the Commonwealth Investment Program


Joseph M. Torsella, Pennsylvania State Treasurer
11
Commonwealth Investment Program
When managing the Commonwealth’s assets, Treasury does more than simply act as a checking account. It looks for opportunities to generate returns using a variety of investment strategies and vehicles. In doing so, Treasury takes into account the liquidity needs of each operating fund. Accordingly, the Commonwealth Investment Program consists of two separate pools, the Short-Term Investment Pool (Pool 99) and the Long-Term Investment Pool (Pool 198).
Short Term Investment Pool – STIP (Pool 99)
Pool 99 is organized similarly to a money market fund, and seeks to maintain a stable net asset value (NAV) of $1.000 per share. The value of a share in Pool 99 is calculated daily, incorporating all realized and unrealized gains and losses, and any cash returned from investments.
Pool 99 will consist of fixed-income securities, primarily of short duration, time deposits and other statutory programs, money market funds, or a line of credit, which are held either directly or through the Consolidated Cash Pool (CCP), a separate investment instrument used to invest all short-term assets of the Commonwealth. Depending on the daily net activity, Pool 99 purchases or sells shares of the CCP at $1.0000 per share. Income earned on the CCP’s investments is accrued daily and distributed monthly to each participant of the CCP.
Long Term Investment Pool – LTIP (Pool 198)
Pool 198 is designed to provide an opportunity for participants that do not have a short-term liquidity need and that can tolerate a higher degree of volatility to earn higher investment returns. The primary investment objective of Pool 198 is to preserve the long-term purchasing power of the funds. Pool 198 can diversify across a wide variety of asset classes to conserve and enhance the value of Pool 198 through capital appreciation and income generation, while maintaining a reasonable investment risk profile.
Pool 198 operates much like a mutual fund: depending on market conditions, a participant that makes a withdrawal may realize a gain or a loss. Shares in Pool 198 are priced at the most recent net asset value per share, which fluctuates daily. Consequently, if a participant’s average cost per share (based on its own history of purchases and redemptions) is less than the share price on the day of redemption, the participant will realize a capital gain on the shares redeemed. Conversely, if a participant’s average cost per share exceeds the share price on the day of redemption, the participant will realize a capital loss on the shares redeemed.
VS.
CAPITALLOSS
CAPITALGAIN Participant’s average cost per
share is less than the share price on the day of redemption.
Participant’s average cost per share is greater than the share price on the day of redemption.

The Pennsylvania Treasury, Annual Investment Report: Overview of the Commonwealth Investment Program
12
Commonwealth Investment Program Summary
The fiscal year end 2019–20 combined balance for the Commonwealth Investment Programs decreased by $1.1 billion to $11.8 billion from the 2018–19 yearend balance of $12.9 billion. This represents an 8.58% decrease. Of the $1.1 billion decrease, approximately $765 million was in Pool 99 and $341 million was Pool 198. The Pools’ balances were significantly impacted as a result of COVID-19. The initial cases of COVID-19 were reported in early March 2020. As the pandemic spread, the General Fund was impacted with unbudgeted expenditures to procure emergency supplies for hospitals and government facilities. Additionally, businesses closed and unemployment skyrocketed as Pennsylvania began to “shelter-in-place” with quarantines in all 67 counties.
The decrease in the Pool 99 balance reflects significant COVID-19 related cash activities, including a decrease of approximately $1.8 billion in Fiscal Year revenue for Personal Income Tax and Corporate Net Income Tax. The Commonwealth deferred the respective tax filing deadlines to align with the federal government’s July 15th and August 15th extended deadlines. The deficit created by the deferment, increased expenses, and other regular activity was partially offset by the receipt of $3.9 billion in federal CARES Act funding and resulted in a General Fund balance of $3.2 billion. The General Assembly will appropriate the CARES moneys by the end of calendar year 2020.
The decrease in the Pool 198 balance reflects withdrawals from PENNVEST Water Pollution and Underground Storage Tank, partially offset by positive investment performance. The withdrawals were utilized to assist in the Commonwealth’s response to COVID-19, including the Hospital Emergency Loan Program.
AS OF JUNE 30, 2019
INVESTMENT POOL NET ASSET VALUE PROGRAM %
Pool 99 $9,604,906,012 74.47%
Pool 198 3,292,620,741 25.53%
TOTAL $12,897,526,753 100.00%
AS OF JUNE 30, 2020
INVESTMENT POOL NET ASSET VALUE PROGRAM %
Pool 99 $8,839,468,895 74.96%
Pool 198 2,952,063,242 25.04%
TOTAL $11,791,532,137 100.00%

ANNUAL INVESTMENT REPORTStatutory Annual Investment Reporting Requirements


Joseph M. Torsella, Pennsylvania State Treasurer
15
Short Term Investment Pool – STIP (Pool 99)
Pool 99 seeks to generate income and minimize investment volatility and therefore invests in only fixed income securities and cash equivalents¹, such as commercial paper, certificates of deposit, money market funds, and repurchase agreements. The portfolio is managed to not exceed a weighted average maturity (WAM) of 130 days and performance is compared to the ICE Bank of America Merrill Lynch 91 Day Treasury Bill Index—an index that measures the performance of the 3-month U.S. Treasury Bill.
Pool 99’s one-year return was 1.63% which equaled its benchmark’s return of 1.63%. In total, the Short-Term Investment Pool distributed $107 million to its participants during the fiscal year. The graph below shows the current and historical fiscal year returns for the Short-Term Investment Pool and its benchmark.
Pool 99
Long Term Investment Pool – LTIP (Pool 198)
Pool 198 seeks to preserve capital and purchasing power, by generating income and capital appreciation over extended periods. Due to the longer-term nature of the funds, Pool 198 can diversify across a wide variety of asset classes while maintaining a reasonable investment risk profile. Treasury’s Strategic Asset Allocation for Pool 198 targets an expected annual return of 4.14%, with an expected 4.13% volatility.
Pool 198’s one-year return was 5.90%, which outperformed the expected annual return, underperformed the policy benchmark’s 6.55% return, and underperformed the reference portfolio’s 7.49% return. The reference portfolio is a simple two security portfolio consisting of 25% in a Russell 3000 Index and 75% in the Bloomberg Barclay’s Aggregate Bond Index. The policy portfolio consists of broad asset class benchmarks that more closely represent the asset allocation.
(1) A portion of the Short-Term Investment Pool is invested in time deposits held within Pennsylvania banking institutions.
2.50%
2.25%
2.00%
1.75%
1.50%
1.25%
1.00%
0.75%
0.50%
0.25%
0.00%
RAT
E O
F R
ET
UR
N
POOL 99
FYE
ICE BofAML 91 Day T-BillPool 99
06/2006/1906/16 06/17 06/18

The Pennsylvania Treasury, Annual Investment Report: Statutory Annual Investment Reporting Requirements
16
Investment earnings distributed to participants of Pool 198 for the fiscal year ended June 30, 2020 totaled $81 million. One-year returns for the Long-Term Investment Pool and its benchmarks for the most recent and prior four fiscal years are displayed in the graph below.
Pool 198
12%
10%
8%
6%
4%
2%
0%
RAT
E O
F R
ET
UR
N
POOL 198
FYE 06/2006/1906/16 06/17 06/18
25% Russell 3000/75% Barclays AggregatePool 198 Policy IndexPool 198
Quarterly Asset Allocation
Treasury adopted a new Strategic Asset Allocation, which it began implementing on October 1, 2019. Several important changes were made to the portfolio in an effort to increase diversification of the pool, reduce volatility, and lower management costs. Treasury terminated its Hedge Fund investments and began liquidating the portfolio. Of the $15 million in estimated fee savings, $7 million is attributed to savings in Pool 198. Treasury also de-risked the portfolios by reducing the amount allocated to Equities, while increasing the Fixed Income allocation.
The portfolio is rebalanced to targets monthly. In 2020, the timing of rebalancing trades was changed from the beginning of the month to the end of the previous month to better align reporting with the allocation targets. Some deviations from the targets will persist as hedge funds are wound down, and PHEAA ramps up its PA Forward program.
The table below shows the Long-Term Investment Pool’s actual asset allocations compared to their corresponding targets for the quarters ended on the dates shown.
LONG TERM INVESTMENT POOL ASSET CLASS
TARGETALLOCATION
9/30/19TARGET
ALLOCATION12/31/19 3/31/20 6/30/20
Fixed Income 52.0 57.4% 64.0 62.4 64.2 66.5
Equity 25.0 25.0 20.5 23.2 20.5 20.1
Real Estate 7.0 7.1 7.0 7.2 7.4 7.0
Private Equity/Absolute Return 5.0 5.3 0.0 4.1 2.5 1.4
ETIs 9.0 1.4 6.5 1.4 3.4 3.0
Cash & Cash Equivalents 2.0 3.8 2.0 1.7 2.0 2.0

Joseph M. Torsella, Pennsylvania State Treasurer
17
Approximately 87% of the Long-Term Investment Pool is invested in passive strategies, which utilize exchange-traded funds (ETFs), separately managed accounts (SMAs), and mutual funds to obtain exposure to certain asset classes in a cost-efficient manner.
Treasury historically invests a portion of its Long-Term Investment Pool in Economically Targeted Investments (ETIs). ETIs allow Treasury to earn market rates of return on the Commonwealth’s assets to benefit Pennsylvania’s economy, create jobs, and make progress towards positive policy objectives. Treasury’s ETIs include the Keystone Home Energy Loan Program, the PHEAA HelpStart Program, and PHEAA’s PA Forward Program. Approximately 3% of the Long-Term Investment Pool’s assets were invested in ETIs on June 30, 2020.
Investment Performance Standards, Measures and Benchmarks
Treasury applies different benchmarks for each class of assets in Pools 99 and Pool 198, a summary of which follows. The department constructs each benchmark to offer a comparative analysis of performance or risk by reflecting a representative asset class or allocation.
Short-Term Investment Pool Benchmark
ASSET CLASS DATES BENCHMARK
Total January 2004 to present ICE BofA 91 Days T-Bills TR
Long-Term Investment Pool Benchmark(s)
ASSET CLASS DATES BENCHMARK(S)
Equity 10/1/2019 to present 41.5% Russell 3000 / 19.5% MSCI ACWI ex USA IMI / 39% MSCI ACWI IMI Net USD
7/31/2001 to 9/30/2019 60% Russell 3000 / 40% MSCI ACWI ex USA IMI
Fixed Income 7/31/2001 to present BBgBarc US Aggregate TR
Real Estate 8/31/2011 to present NCREIF Property Index
Hedge Funds 2/1/2013 to present HFRI Fund of Funds Composite +50bps
Cash 7/1/2002 to present ICE BofA 91 Days T-Bills TR
Total Fund 10/1/2019 to present8.5% Russell 3000 / 4% MSCI ACWI ex USA / 8% MSCI ACWI IMI Net USD / 7% NCREIF Property Index / 6.5% Libor +75bp / 64% BBgBarc US Aggregate TR / 2% ICE BofA 91 Days T-Bills TR
6/30/2002 to 9/30/201915% Russell 3000 / 10% MSCI ACWI ex USA IMI / 5% HFRI Fund of Funds Composite +200bps / 7% NCREIF Property Index / 9% BBgBarc US High Yield TR / 52% BBgBarc US Aggregate TR / 2% ICE BofA 91 Days T-Bills TR
Returns by Asset Class
Treasury measures the performance of its asset classes against the respective benchmarks. For the fiscal year ended June 30, 2020, Treasury matched its benchmark for Pool 99.

The Pennsylvania Treasury, Annual Investment Report: Statutory Annual Investment Reporting Requirements
18
1 YEAR 3 YEAR 5 YEAR 10 YEAR 15 YEARSINCE
INCEPTIONINCEPTION
DATE
Fund 99 1.63 1.87 1.35 0.78 1.52 1.55 Jan-04
Benchmark 1.63 1.77 1.19 0.64 1.32 1.38
1 YEAR 3 YEAR 5 YEAR 10 YEAR 15 YEARSINCE
INCEPTIONINCEPTION
DATE
Equity -0.20 6.79 7.91 11.29 7.73 6.90 Jul-01
Benchmark 2.13 6.45 6.98 10.30 7.20 6.83
Fixed Income 8.38 5.13 4.27 4.38 4.66 4.75 Jul-01
Benchmark 8.74 5.32 4.30 3.82 4.39 4.73
Real Estate -4.10 3.87 7.03 - - 9.13 Aug-11
Benchmark 2.69 5.44 6.77 - - 9.12
Hedge Funds -1.67 2.48 2.12 - - 3.10 Feb-13
Benchmark 1.00 2.77 2.00 - - 3.23
Cash 2.20 2.28 1.68 - - 1.81 Dec-10
Benchmark 1.63 1.77 1.19 - - 0.66
TOTAL 5.90 5.67 5.49 6.55 5.90 5.61 Jun-02
Benchmark 6.55 5.83 5.45 6.35 5.82 6.29
Short-Term Investment Pool Net Returns as of June 30, 2020
Treasury invests to track broad asset class benchmarks and examines all tracking error in detail. In the Equity allocation, the deviation from the benchmark was driven by exposure to the Global Minimum Volatility Fund, which was added as a way to achieve global diversification while minimizing volatility inherent in the exposure. In the Fixed income portfolio, Treasury’s Bank Loan and High Yield investments detracted from fixed income performance and are not in the Aggregate Bond Index. Real Estate performance differed due to Treasury’s exposure to the segment through a REIT Index, which is more liquid and priced daily, which results in more volatility compared to the NCREIF Property Index benchmark.
Treasury’s allocations and performance may deviate from the benchmark in the short term because strategic asset allocations are based off long-term time horizons. Historically these exposure have generated performance that is similar to the benchmark and further diversify the overall risk in the portfolio.
Long-Term Investment Pool Net Returns as of June 30, 2020
External Investment Managers: Selection, Fees, and Performance
Pennsylvania Treasury employed seven external investment managers for the Long-Term Investment Pool as of June 30, 2020. The list includes principals and key staff, as well as the date each received funding for investments.

Joseph M. Torsella, Pennsylvania State Treasurer
19
Long-Term Investment Pool: External Investment Manager List as of June 30, 2020
INVESTMENT MANAGERS
PRINCIPALS/KEY STAFF
TITLEFUNDING
DATESELECTIONMETHOD (1)
INVESTMENTSTYLE
Aksia LLC (Aksia manages the COPA Keystone portfolio)
Jim Vos Chief Executive Officer
01/13 Negotiated Alternative
Joseph Larucci Head of Equity Strategies
Simon Fludgate Head of Operational Due Diligence
Matt Mullarkey Co-Head, Advisory Americas
BlackRock
Larry Fink Chairman, Chief Executive Officer
11/17 Negotiated Equity
Rob Kapito President
Gary Shedlin Chief Financial Officer
Christopher Meade Chief Legal Officer
Blue Hill Investment Partners, LP
Joyce Ferris Managing Partner & Founder
11/06 Negotiated AlternativeEmily Landsburg Managing Partner
Karen Naughton Business Manager
Chartwell Investment Partners
Michael J. McCloskey Dir. of Client Services, Managing Partner
09/03 Negotiated Fixed Income
Timothy J. Riddle CEO, Managing Partner
G. Gregory Hagar CFO, Managing Partner
Michael P. Magee Chief Operating Officer
Credit Suisse
Thomas Gottstein Chief Executive Officer
12/09 Negotiated Fixed Income
David Mathers Chief Financial Officer
James B. Walker Chief Operating Officer
Lara J. Warner Chief Risk and Compliance Officer
Intercontinental
Paul J. Nasser CFO, COO
08/11 Negotiated AlternativeThomas R. Taranto Jr. Chief Investment Officer
Peter A. Palandjian Chairman & CEO
RhumbLine Advisers
Wayne T. Owen Chief Executive Officer, General Partner
1/16 Negotiated Equity
Kim Roger McCant Chief Financial Officer, General Partner
Alexander D. Ryer Chief Investment Officer
John P. Pilgrim Director of Investment Operations
(1) The Commonwealth Procurement Code (62 PA.C.S.A. § 515(9)) permits contracts to be awarded for a supply, service or construction itemwithout competition if the contracting officer first determines in writing that the contract is for financial or investment experts to be used and selected by the Treasury Department.

The Pennsylvania Treasury, Annual Investment Report: Statutory Annual Investment Reporting Requirements
20
Long Term Investment Pool: External Investment Manager Fees for Fiscal Year 2019-2020
* Includes carried interest, profit sharing, and other fees charged to the fund.(1) Transition Manager fees.
MANAGERS3Q 2019
INVOICE AMT.4Q 2019
INVOICE AMT.1Q 2020
INVOICE AMT.2Q 2020
INVOICE AMT. YTD TOTALS
Aksia (COPA) $180,917.74 $159,968.83 $95,515.45 $47,559.22 $483,961.24
BlackRock $10,042.68 $10,569.48 $9,444.72 $8,680.67 $38,737.55
Chartwell $44,524.30 $44,906.63 $44,129.71 $39,765.05 $173,325.69
Credit Suisse Alternative Capital $56,757.59 $57,649.43 $55,608.57 $52,330.23 $222,345.82
Intercontinental $45,206.82 $46,308.25 $46,873.63 $46,620.46 $185,009.16
Rhumbline $30,582.00 $32,179.00 $24,486.00 $24,915.00 $112,162.00
TOTALS $368,031.13 $351,581.62 $276,058.08 $219,870.63 $1,215,541.46
ETF / MF / SUB-MANAGERS CALCULATED ESTIMATES
Aksia (COPA) Sub-managers* $3,214,744.00
Abel Noser (1) $- $52,017.35 $- $- $52,017.35
iShares Core S&P Small-Cap $9,510.85 $3,265.54 $- $- $12,776.39
iShares CMBS ETF $35,838.02 $36,574.14 $30,920.57 $17,738.73 $121,071.47
iShares 0-5 Year Investment Grade Corp Bond
$69,465.35 $71,641.63 $69,334.99 $52,178.38 $262,620.36
iShares MSCI IXUS ETF $8,693.32 $8,505.15 $- $- $17,198.47
iShares U.S. Aggregate Bond ETF $- $253.09 $39,908.17 $48,287.35 $88,448.61
Vanguard Intermediate-Term Treasury ETF $- $- $2,784.36 $16,982.07 $19,766.43
Vanguard REIT $59,432.47 $59,657.11 $60,943.05 $52,932.02 $232,964.66
Vanguard TIPS Fund Institutional Shares $4,646.34 $4,655.07 $4,780.38 $4,911.24 $18,993.03
Vanguard Mortgage-Backed Securities ETF $103,000.23 $105,651.16 $98,797.76 $64,836.73 $372,285.88
Vanguard Min Volatility Fund Admiral Shares $113,625.76 $116,001.21 $109,448.94 $100,360.01 $439,435.92
ETF & MUTUAL FUNDS SUBTOTAL $404,212.34 $458,221.46 $416,918.23 $358,226.54 $4,852,322.57
GRAND TOTAL 772,243.47 809,803.08 692,976.31 578,097.17 6,067,864.02

Joseph M. Torsella, Pennsylvania State Treasurer
21
Long Term Investment Pool: External Investment Manager Fees and Performance Summary as of June 30, 2020 (1)
(1) Performance information obtained from Marquette Associates.
INVESTMENT MANAGERS
ASSET CLASS
INVESTMENT MANDATE
FY 19-20 MANAGER
FEES
ASSIGNED BENCHMARK
FY 19-20 PORTFOLIO
RETURN (Net of Fees)
FY 19-20 BENCHMARK
RETURN
OVER/UNDER PERFORMANCE
VS. BENCHMARK
Aksia (COPA Keystone) AlternativeAbsoluteReturn
$483,961 HFRI Fund of FundsComposite Index + 50bp
-1.67 1.00 -2.67
BlackRock Equity Large Cap Core $38,738 S&P 500 Index 7.40 7.50 -0.10
Blue Hill Investment Partners, LP
Alternative Private Equity $- Cambridge Associates Private Equity Index
0.00 -3.87 3.87
Blue Hill EEP Alternative Private Equity $- Cambridge Associates Private Equity Index
0.00 -3.87 3.87
Chartwell Investment Partners
Fixed Income
High Yield $173,326 ICE BofAML 1-3 Yrs BB-B US High Yield
1.50 1.88 -0.38
Credit SuisseFixed
IncomeSenior Secured
Debt $222,346
S&P/LSTALeveraged Loan Total Return Index
-1.95 -1.99 0.04
Intercontinental Alternative REIT $185,009 NCREIF ODCE 5.17 1.34 3.83
PWP Rhumbline MSCI Equity Int'l Equity $83,573 MSCI ACWI ex USA -5.48 -4.80 -0.68
PWP Rhumbline Russell
Equity Large Cap Core $28,589 Russell 1000 7.21 7.48 -0.27
Total Fees Paid $1,215,541

The Pennsylvania Treasury, Annual Investment Report: Statutory Annual Investment Reporting Requirements
22
96.79% of the total trade commissions paid in fiscal year 2019-20, or $406,723, were made to 10 of the 31 brokers that placed such trades. A list of the top 10 brokers Treasury’s external investment managers utilized for Pool 198 appears on the following page.
BROKER COMMISSION
BARCLAYS CAPITAL INC./LE, NEW JERSEY $6,902
BNY CAPITAL MARKETS INC, NEW YORK $269,940
CABRERA CAPITAL MARKETS, CHICAGO $76
CIBC WORLD MKTS INC, TORONTO $2,640
CITIGROUP GLOBAL MARKETS, INC., NEW YORK $337
COWEN AND CO LLC, NEW YORK $24
CREDIT SUISSE, NEW YORK (CSUS) $1,307
FIDELITY CAPITAL MARKETS, NEW YORK $10
GOLDMAN SACHS & CO, NY $74
ICBC FINCL SVCS, NEW YORK $17,892
INSTINET AUSTRALIA CLEARING SERV, SYDNEY $2,450
INSTINET CLEARING SER INC, NEW YORK $12,135
INSTINET CORP, NEW YORK $429
INSTINET EUROPE LIMITED, LONDON $25,837
INSTINET PACIFIC LTD, HONG KONG $6,969
INSTINET, HONG KONG $106
BROKER COMMISSION
INSTINET, SINGAPORE $669
INVESTMENT TECH GROUP INC, NEW YORK $3,497
J.P. MORGAN SECURITIES LLC, NEW YORK $1,590
JEFFERIES & CO INC, NEW YORK $25,778
JEFFERIES & CO LTD, LONDON $19
JEFFERIES PARTNR OPPORTUNITY'S, NEW YORK $31
JONESTRADING INST SVCS LLC, NEW YORK $162
LIQUIDNET INC, NEW YORK $5,667
LOOP CAPITAL MARKETS, JERSEY CITY $1,020
MERRILL LYNCH PIERCE FENNER SMITH INC NY $129
MORGAN STANLEY & CO INC, NY $1,327
PERSHING LLC, JERSEY CITY $32,105
UBS SECURITIES LLC, STAMFORD $641
WELLS FARGO SECURITIES LLC, CHARLOTTE $336
WILLIAMS CAPITAL GROUP LP, JERSEY CITY $132
TOTAL COMMISSIONS PAID FY 19-20 $420,232
Brokerage Fees
Treasury requires its investment managers to seek the best possible execution of orders through responsible brokerage firms at competitive prices when placing portfolio transaction orders on behalf of the Commonwealth.
In fiscal year 2019-20, 31 brokers placed 15,761 trades, resulting in gross commissions of $420,232 for the Long-Term Investment Pool. On a per-share-basis, the gross equity commissions translated into an average gross commission price of just $0.0089 per share. A summary of commissions paid to brokers for the Long-Term Investment Pool is reflected in the following table.
Long Term Investment Pool: Broker Commissions Fiscal Year 2019-20

Joseph M. Torsella, Pennsylvania State Treasurer
23
Top Ten Long Term Investment Pool Broker Commissions Fiscal Year 2019-20
Security Lending
Treasury makes the portfolios of the Commonwealth Investment Program available for security lending to generate additional revenue for Pennsylvania. In fiscal year 2019-20 the program generated $219,401 with 1.89% of the Long-Term Investment Pool’s securities on loan as of June 30, 2020. The table below provides a snapshot of Treasury’s Security Lending Program as of that date.
Treasury will only accept cash collateral on loans of securities related to Treasury funds. This cash collateral can be invested in U.S. Treasury notes, bonds, and bills; federal agency securities; and repurchase agreements backed by the above securities subject to a minimum of 102% collateralization with daily updated valuation. As of June 30, 2020, repurchase agreements composed 100% of the Cash Collateral Reinvestment Pool.
BROKER COMMISSION
BNY CAPITAL MARKETS INC, NEW YORK $269,940
PERSHING LLC, JERSEY CITY $32,105
INSTINET EUROPE LIMITED, LONDON $25,837
JEFFERIES & CO INC, NEW YORK $25,778
ICBC FINCL SVCS, NEW YORK $17,892
INSTINET CLEARING SER INC, NEW YORK $12,135
INSTINET PACIFIC LTD, HONG KONG $6,969
BARCLAYS CAPITAL INC./LE, NEW JERSEY $6,902
LIQUIDNET INC, NEW YORK $5,667
INVESTMENT TECH GROUP INC, NEW YORK $3,497
TOTAL $406,723
POOLMARKET VALUE OF
LENDABLE SECURITIESMARKET VALUE OF
SECURITIES ON LOAN% OF LENDABLE SECURITIES
ON LOAN
Pool 99 $- $- 0.00%
Pool 198 2,351,330,287 44,484,374 1.89%
TOTAL $2,351,330,287 $44,484,374

The Pennsylvania Treasury, Annual Investment Report: Statutory Annual Investment Reporting Requirements
24
Responsible Investing and Proxy Voting
As an index investor, Treasury is a long-term, universal owner, obligated to consider material governance as well as environmental and social factors to prudently manage risk and return. Rather than divestment, Treasury seeks to actively vote its proxies and work with coalitions of like-minded institutional investors to engage with portfolio companies to mitigate risks by promoting good governance and risk management of environmental and social considerations.
Treasury has been actively involved with 11 different coalitions of peer institutional investors, including groups focused on best practices in governance such as the Council of Institutional Investors and Institutional Limited Partners Association, environmental risk (Ceres, Sustainability Accounting Standards Board, We Are Still In, Climate Majority Project), diversity (Thirty Percent Coalition), the opioid crisis (Investors for Opioid Accountability), and firearm responsibility (signatory to Principles for a Responsible Civilian Firearms Industry). Treasury also participates in the National Association of State Treasurers.
Specifically, Treasury led a shareholder action against Walmart on behalf of the Investors for Opioid and Pharmaceutical Accountability coalition, which brought change to Walmart’s disclosure of executive compensation claw-backs. In addition, Treasury worked with the Thirty Percent Coalition to expand their board diversity mandate to engage with Private Equity General Partners (GPs) on the issue of board diversity.
Through equity separately managed accounts which track indices, Treasury is a partial owner of public companies. As an active owner, Treasury votes its shares every year on various topics so that corporate boards, which represent shareholders, put in place policies and actions consistent with long-term value creation. Treasury retains an advisor, Glass Lewis, to assist in the execution of proxy voting consistent with Treasury’s guidelines.
In fiscal year 2019-20, Glass Lewis voted 509 ballots. Those ballots contained 6,508 proposals, of which 6,153 represented management proposals and 355 represented shareholder proposals.
Treasury continues to be committed to responsible investments to improve long-term value creation at companies we partially own as shareholders. Through work with 11 different coalitions of institutional investors, and through its proxy voting advisor, Glass Lewis, Treasury is able to address issues of good governance, environmental risk, diversity, the opioid crisis and firearm responsibility through shareholder calls to action and voting in favor of these actions. An example of Treasury’s efforts at companies we invest in is our repeated call for the separation of the board chair and CEO positions at Facebook. Without this separation, Mark Zuckerberg retains full control of the company, despite differing shareholder votes from outside the company. The separation of these roles is an example of good governance that would benefit investors and the millions of Pennsylvanians who use the platform every day. The Facebook proposal continues to gain majority votes of shareholders outside of the company. Treasury’s most recent effort was co-filed along with our fiduciary counterparts in Illinois, New York City, Rhode Island, Connecticut, and Trillium Asset Management. Treasury also supported efforts initiated by Walmart employees, requesting consideration of the company’s essential employees for board director positions. With the uncertain times of COVID-19 pandemic, it is more important than ever to make sure the companies we invest in are doing their part to demonstrate dedication to long-term shareholder value — instead of just short-term profits.
Joseph M. Torsella, Pennsylvania State Treasurer
25
Litigation
Proceedings:
Philadelphia Entertainment Development Partners (PEDP), LP d/b/a Foxwoods Casino Philadelphia v. Commonwealth Department of Revenue, Commonwealth of Pennsylvania, United States Bankruptcy Court Eastern District Philadelphia Docket Nos. 14-12482 and 14-00255 mdc
Both the Plaintiffs and Defendants in this bankruptcy action have stated that they may join the Pennsylvania Treasury Department in this action. Treasury has yet to be sued in this action. This case is a bankruptcy action involving PEDP which received a Category 2 gaming license from the Pennsylvania Gaming Control Board in 2006, which was later revoked by the board. PEDP later filed bankruptcy. PEDP is suing the Commonwealth Parties as part of the bankruptcy to try and retrieve the $50 million license fee that the Plaintiff was required to put up to obtain the license.
Claims Asserted:
PEDP asserts violations of the U.S. and state constitutions, federal statutes, and common law.
Amount of Money Sought:
The licensing fee was $50 million deposited into the General Fund. PEDP is also seeking interest and attorney’s fees.
Progress:
• The Defendants applied for a Motion to Dismiss and memorandums of law as well as supplements have been submitted by both parties.
• 9/15/16: The Bankruptcy Court dismissed the case against the Commonwealth. However, the case was appealed to the U.S. District Court for the Eastern District of Pennsylvania.
• 9/15/17: The U.S. District Court for the Eastern District affirmed the Bankruptcy Court’s ruling. However, in May, the Appellant appealed the case to the Third Circuit Court of Appeals.
• 3/5/18: On January 11, 2018, the Third Circuit reversed and remanded the case back to the Eastern District for further proceedings unless the Eastern District remands the case back to Bankruptcy Court.
• 9/13/18: The Eastern District remanded the case back to Bankruptcy Court.
• 9/13/19: A series of briefs was filed and a hearing was held on the Defendants’ Motion to Dismiss Adversary complaint. The Commonwealth is awaiting a decision.
• 12/31/19: The Bankruptcy Court dismissed the complaint and issued an opinion.
• 1/14/20: The case was appealed to the District Court.
Likelihood of an Unfavorable Outcome: REMOTE

The Pennsylvania Treasury, Annual Investment Report: Statutory Annual Investment Reporting Requirements
26
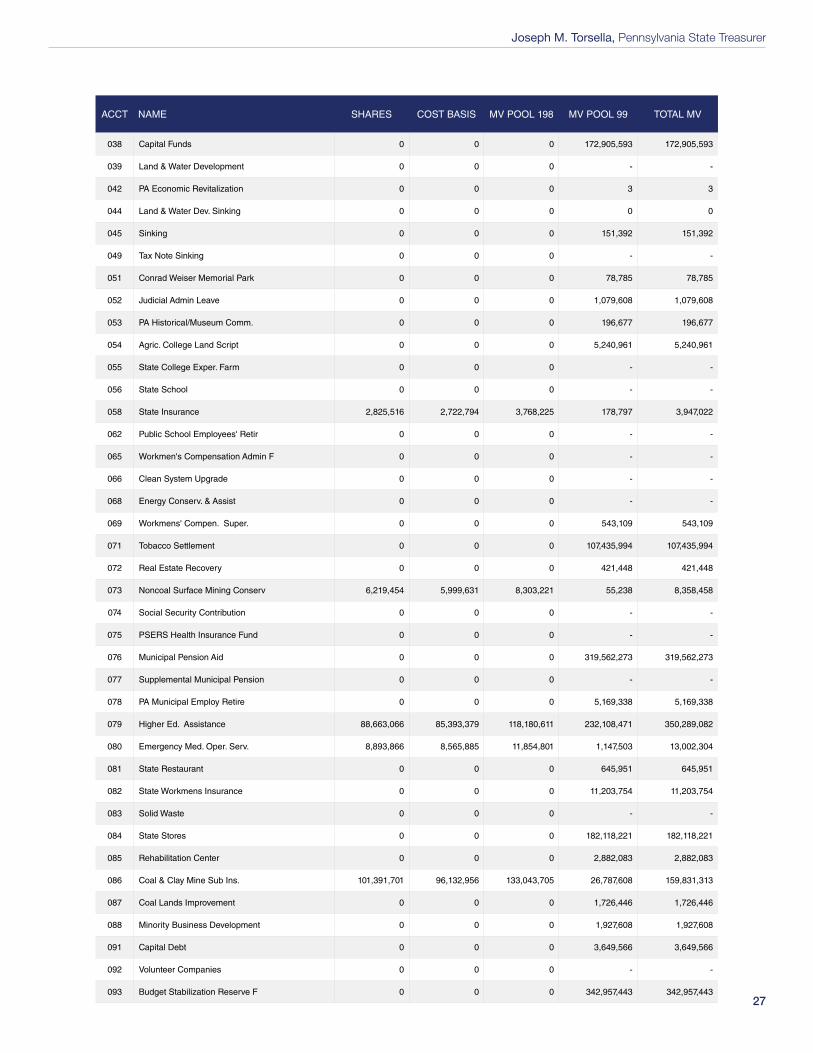
Commonwealth Investment Program Participant Holdings as of June 30, 2020
ACCT NAME SHARES COST BASIS MV POOL 198 MV POOL 99 TOTAL MV
001 General 0 0 0 3,194,954,021 3,194,954,021
002 Lottery 2,626 2,224 3,078 304,114,046 304,117,123
003 Wild Resource 0 0 0 293,171 293,171
004 Energy Development 3,275,060 3,155,419 4,366,958 204,705 4,571,664
005 State Racing 10,951,110 10,547,258 14,596,933 25,647,391 40,244,324
006 Hazardous Sites Cleanup 38,889,625 35,175,984 48,681,986 38,377,147 87,059,134
007 Highway Beautification 0 0 0 394,012 394,012
008 Environmental Stewardship 79,448,689 73,479,497 101,692,332 81,990,998 183,683,330
009 Recycling Fund 70,867,446 66,256,367 91,695,845 25,952,271 117,648,116
010 Motor License 147,442,658 125,476,361 173,653,663 732,545,479 906,199,143
011 Game 64,420,117 54,689,384 75,687,658 41,551,958 117,239,616
012 Fish 57,301,612 52,930,859 73,253,939 22,812,140 96,066,079
013 Banking 12,863,401 12,389,028 17,145,860 14,147,322 31,293,182
014 Milk Marketing Board 0 0 0 2,658,686 2,658,686
015 State Farm Products 0 0 0 3,398,263 3,398,263
016 Oil & Gas Lease 3,812,224 3,395,709 4,699,509 315,183 5,014,692
017 State Treasury Armory 0 0 0 1,274,648 1,274,648
018 Historical Preservation 0 0 0 7,603,418 7,603,418
019 PA Infrastructure Bank 27,909,271 26,889,698 37,214,137 8,512,157 45,726,294
020 Surface Mining Conserv. 65,883,806 63,454,165 87,817,723 399,955 88,217,678
021 Special Administration 0 0 0 12,686,747 12,686,747
022 Capitol Restoration Trust 0 0 0 479,347 479,347
023 Vocational Rehabilitation 0 0 0 15,849,373 15,849,373
024 Pharmaceutical Assis 1,342,765 1,293,283 1,789,845 29,460,925 31,250,771
025 Boating 25,784,942 24,834,054 34,369,218 40,577,339 74,946,557
026 Administration 0 0 0 742,222 742,222
027 Liquid Fuels Tax 0 0 0 3,694,611 3,694,611
028 Liquor License 0 0 0 1,929,573 1,929,573
029 Fire Insurance Tax 0 0 0 76,400,287 76,400,287
030 Volunteer Companies Loan 29,671,698 28,587,765 39,564,186 11,734,216 51,298,402
031 Manufacturing 19,295,101 18,583,543 25,718,791 13,573,042 39,291,832
032 Purchasing 0 0 0 5,642,877 5,642,877
033 Employment for the Blind 0 0 0 2,721,696 2,721,696
034 Industrial Development 0 0 0 111 111
037 Pennvest Drinking Water 171,155,486 152,652,518 211,264,248 68,333,224 279,597,471
Joseph M. Torsella, Pennsylvania State Treasurer
27
ACCT NAME SHARES COST BASIS MV POOL 198 MV POOL 99 TOTAL MV
038 Capital Funds 0 0 0 172,905,593 172,905,593
039 Land & Water Development 0 0 0 - -
042 PA Economic Revitalization 0 0 0 3 3
044 Land & Water Dev. Sinking 0 0 0 0 0
045 Sinking 0 0 0 151,392 151,392
049 Tax Note Sinking 0 0 0 - -
051 Conrad Weiser Memorial Park 0 0 0 78,785 78,785
052 Judicial Admin Leave 0 0 0 1,079,608 1,079,608
053 PA Historical/Museum Comm. 0 0 0 196,677 196,677
054 Agric. College Land Script 0 0 0 5,240,961 5,240,961
055 State College Exper. Farm 0 0 0 - -
056 State School 0 0 0 - -
058 State Insurance 2,825,516 2,722,794 3,768,225 178,797 3,947,022
062 Public School Employees' Retir 0 0 0 - -
065 Workmen's Compensation Admin F 0 0 0 - -
066 Clean System Upgrade 0 0 0 - -
068 Energy Conserv. & Assist 0 0 0 - -
069 Workmens' Compen. Super. 0 0 0 543,109 543,109
071 Tobacco Settlement 0 0 0 107,435,994 107,435,994
072 Real Estate Recovery 0 0 0 421,448 421,448
073 Noncoal Surface Mining Conserv 6,219,454 5,999,631 8,303,221 55,238 8,358,458
074 Social Security Contribution 0 0 0 - -
075 PSERS Health Insurance Fund 0 0 0 - -
076 Municipal Pension Aid 0 0 0 319,562,273 319,562,273
077 Supplemental Municipal Pension 0 0 0 - -
078 PA Municipal Employ Retire 0 0 0 5,169,338 5,169,338
079 Higher Ed. Assistance 88,663,066 85,393,379 118,180,611 232,108,471 350,289,082
080 Emergency Med. Oper. Serv. 8,893,866 8,565,885 11,854,801 1,147,503 13,002,304
081 State Restaurant 0 0 0 645,951 645,951
082 State Workmens Insurance 0 0 0 11,203,754 11,203,754
083 Solid Waste 0 0 0 - -
084 State Stores 0 0 0 182,118,221 182,118,221
085 Rehabilitation Center 0 0 0 2,882,083 2,882,083
086 Coal & Clay Mine Sub Ins. 101,391,701 96,132,956 133,043,705 26,787,608 159,831,313
087 Coal Lands Improvement 0 0 0 1,726,446 1,726,446
088 Minority Business Development 0 0 0 1,927,608 1,927,608
091 Capital Debt 0 0 0 3,649,566 3,649,566
092 Volunteer Companies 0 0 0 - -
093 Budget Stabilization Reserve F 0 0 0 342,957,443 342,957,443

The Pennsylvania Treasury, Annual Investment Report: Statutory Annual Investment Reporting Requirements
28
ACCT NAME SHARES COST BASIS MV POOL 198 MV POOL 99 TOTAL MV
094 Tax Stabilization Reserve 0 0 0 - -
096 PA Vets Monu&Memor Trust Fund 0 0 0 123,329 123,329
097 Anthracite Emergency Bond 0 0 0 715,676 715,676
101 Low Level Waste 0 0 0 - -
104 PA Infrastucture Invest. Autho 254,277,128 230,330,891 318,767,637 17,717,945 336,485,583
105 Pennvest Bonds Authority 0 0 0 6,179,134 6,179,134
106 Pennvest Revolving 0 0 0 - -
107 Pennvest Non Revolving Equity 0 0 0 - -
108 Pennvest Redemption 0 0 0 1,060,742 1,060,742
109 Pennvest Water Pollution 291,428,440 264,796,265 366,466,171 291,515,584 657,981,754
111 Machinery & Equipment Loan 15,132,267 14,574,224 20,170,073 21,550,743 41,720,816
112 Insurance Liquidation 0 0 0 94,804,912 94,804,912
113 Agricultural Conservation 0 0 0 40,541,262 40,541,262
115 Children's Trust 0 0 0 1,208,515 1,208,515
116 Revolving Aid Fund 0 0 0 10,200,664 10,200,664
117 Catastrophic Loss Benefit 77,904,911 75,249,705 104,142,222 20,775 104,162,997
118 Storage Tank Fund 0 0 0 5,338,216 5,338,216
119 Underground Storage Tank 21,835,092 19,793,868 27,393,826 5,008,140 32,401,966
121 Resting Facilities Siting 0 0 0 - -
123 Motor Vehicle Trans. Rec. 0 0 0 2,478,729 2,478,729
125 Hazardous Material Response 685,389 660,113 913,567 332,879 1,246,446
126 PHFA Home Buyer Fund 0 0 0 - -
127 Local Govt. Cap. Loan 0 0 0 3,691,055 3,691,055
128 Local Sales and Use Tax 0 0 0 24,413,704 24,413,704
129 PICA 0 0 0 11,507,120 11,507,120
130 Public Transportation 0 0 0 7,074,850 7,074,850
131 Acid Mine Drain 65,424,172 57,732,768 79,899,565 9,453,976 89,353,541
133 Local Crime Justice 0 0 0 - -
134 Local Crime Justice Sink 0 0 0 0 0
138 Clean Air 35,060,287 33,497,046 46,358,412 259,517 46,617,929
139 Home Investment Trust 0 0 0 88,925 88,925
140 Phila. Reg. Port Author. 0 0 0 587,259 587,259
141 Port of PGH Commission 0 0 0 2,417,581 2,417,581
144 Pennvest Trustee 0 0 0 - -
145 Remining Environment 0 0 0 - -
146 Remining Financial Assurance 0 0 0 4,605,494 4,605,494
147 Environmental Education 0 0 0 2,312,036 2,312,036
148 Self-Ins. Guaranty 51,453,603 49,556,114 68,583,442 13,455,857 82,039,299
149 Keystone Recreation, Park 124,340,341 115,611,669 160,001,372 55,386,555 215,387,927

Joseph M. Torsella, Pennsylvania State Treasurer
29
ACCT NAME SHARES COST BASIS MV POOL 198 MV POOL 99 TOTAL MV
151 PA Employee Benefit Trust 10,290,721 9,911,223 13,716,688 4,371,672 18,088,360
152 Nutrient Mgmt 0 0 0 4,299,111 4,299,111
153 Allegh. Reg. Asset Tax 0 0 0 15,414,863 15,414,863
155 Organ Donation 0 0 0 1,238,792 1,238,792
156 Insurance Fraud 0 0 0 7,446,848 7,446,848
157 Automobile Theft 0 0 0 6,152,575 6,152,575
158 Industrial Sites Cleanup 12,863,401 12,389,028 17,145,860 2,933,595 20,079,455
159 DNA Detection 0 0 0 5,782,110 5,782,110
160 Small Business First 0 0 0 6,995,093 6,995,093
161 Ben Franklin Tech Development 0 0 0 24,844,974 24,844,974
162 M-Care 0 0 0 87,143,024 87,143,024
163 Patient Safety Trust Fund 0 0 0 6,870,314 6,870,314
164 Substance Abuse Education & De 7,003,906 6,745,594 9,335,600 703,505 10,039,104
166 E-911 0 0 0 110,092,900 110,092,900
167 Rightful Owners Claims Payment 0 0 0 19,129 19,129
168 State Gaming Fund 0 0 0 174,324,971 174,324,971
169 Compulsive and Problem Gamblin 0 0 0 8,104,765 8,104,765
170 Property Tax Relief Fund 0 0 0 122,968,376 122,968,376
171 PA Gaming Econ Dev & Tourism F 0 0 0 25,794,767 25,794,767
172 PA Race Horse Dev Trust Fund 0 0 0 5,901,050 5,901,050
173 Emergency Energy Assistance Fu 0 0 0 - -
174 Broadband Outreach and Aggrega 0 0 0 - -
175 Education Technology Fund 0 0 0 - -
176 Educational Assistance Program 0 0 0 5,812,941 5,812,941
177 Job Training Fund 0 0 0 379,545 379,545
178 Community College Capital Fund 0 0 0 3,280,224 3,280,224
179 Growing Greener Bond Fund 0 0 0 6,049,641 6,049,641
180 Growing Greener Bond Sinking F 0 0 0 5,568 5,568
181 Water Supply and Wastewater Tr 0 0 0 22,110,193 22,110,193
182 Water Supply and Wastewater Tr 0 0 0 1 1
183 Conservation District Fund 0 0 0 6,562,146 6,562,146
184 Uninsured Employers Guaranty F 0 0 0 1,969,661 1,969,661
185 Persian Gulf Conflict Veterans 0 0 0 2,129 2,129
186 Persian Gulf Conflict Veterans 0 0 0 - -
187 The Public Transportation Trus 291,306,157 251,564,420 348,153,890 706,933,372 1,055,087,262
188 Neighborhood Improvement Zone 0 0 0 14,168 14,168
189 OPEB- Other Post Employ Benefi 0 0 0 - -
190 Fire Prevention and Public Saf 0 0 0 - -
191 Cigarette Fire Safety and Fire 0 0 0 369,451 369,451

The Pennsylvania Treasury, Annual Investment Report: Statutory Annual Investment Reporting Requirements
30
ACCT NAME SHARES COST BASIS MV POOL 198 MV POOL 99 TOTAL MV
192 Mine Safety Fund 0 0 0 149,573 149,573
193 Water Resources Fund 0 0 0 - -
194 Water and Sewer Assistance Bon 0 0 0 2,732,043 2,732,043
195 Water and Sewer Assistance Bon 0 0 0 1,963 1,963
196 Keystone Help Program 578,632 521,430 721,636 - 721,636
197 Special Juvenile Victim Compen 0 0 0 - -
201 Housing Affordability and Reha 0 0 0 6,697,380 6,697,380
202 Unconventional Gas Well Fund 0 0 0 25,070,931 25,070,931
203 Marcellus Legacy Fund 0 0 0 6,777,724 6,777,724
204 Homeowner Asst Stlmt Fund 0 0 0 10,450 10,450
205 Pa. eHealth Partnership Fund 0 0 0 - -
206 Veterans' Trust Fund 0 0 0 2,448,233 2,448,233
207 Justice Reinvestment Fund 0 0 0 738,711 738,711
208 Insurance Regulation&Oversight 0 0 0 33,423,194 33,423,194
209 Philly Taxicab Limousine Regul 0 0 0 30,547 30,547
210 Philadelphia Taxicab Medallion 0 0 0 6,885 6,885
211 Multimodal Transportation Fund 0 0 0 257,471,797 257,471,797
212 City Revital & Improve Fund 0 0 0 482 482
213 Local Cigarette Tax Fund 0 0 0 2,730,598 2,730,598
215 Monetary Penalty Endowments 43,660,327 37,171,342 51,443,472 41,734 51,485,207
216 Achieving Better Life Exp Fund 0 0 0 1,000,769 1,000,769
217 Medical Marijuana Program Fund 0 0 0 - -
218 PlanCon Bond Projects Fund 0 0 0 200,366,968 200,366,968
220 PSERS-Defined Cont Fund 0 0 0 - -
221 Video Gaming Fund 0 0 0 1,108,540 1,108,540
222 Fantasy Contest Fund 0 0 0 659,606 659,606
223 School Safety & Security Fund 0 0 0 52,856,371 52,856,371
224 PA Health Insurance Exc Fund 0 0 0 2,570,769 2,570,769
451 Chester Downs 0 0 0 1,339,275 1,339,275
452 Pocono Downs 0 0 0 1,337,858 1,337,858
453 Philadelphia Park 0 0 0 1,210,538 1,210,538
454 Penn National 0 0 0 1,354,697 1,354,697
455 The Meadows 0 0 0 1,329,263 1,329,263
456 Sugar House Casino 0 0 0 1,552,854 1,552,854
457 Foxwoods Casino Philadelphia 0 0 0 - -
458 PITG Gaming Casino 0 0 0 1,357,801 1,357,801
459 Mount Airy Casino 0 0 0 1,377,484 1,377,484
460 Sands Bethworks Casino 0 0 0 1,303,444 1,303,444
461 Presque Isle Downs 0 0 0 1,411,595 1,411,595

Joseph M. Torsella, Pennsylvania State Treasurer
31
ACCT NAME SHARES COST BASIS MV POOL 198 MV POOL 99 TOTAL MV
466 Valley Forge Casino 0 0 0 1,028,103 1,028,103
468 Nemacolin 0 0 0 997,179 997,179
469 Presque Isle-Churchill Downs 0 0 0 1,500,000 1,500,000
470 Nemacolin Churchill Downs 0 0 0 1,000,000 1,000,000
896 896 90,244 76,507 105,883 - 105,883
TOTALS 2,341,646,254 2,132,789,966 2,951,685,789 8,835,084,440 11,786,770,229