annual management practice implementation and nitrogen
TRANSCRIPT

[Type here]
1
Annual Management Practice Implementation and Nitrogen Application Report 2018 Crop Year
East San Joaquin Water Quality Coalition
Central Valley Regional Water Quality Control Board
August 1, 2019

ESJWQC Annual Management Practice Implementation and Evaluation Report August 1, 2019
i
TABLE OF CONTENTS
List of Appendices ............................................................................................................................................................ i Introduction ...................................................................................................................................................................... 1 Available Data .................................................................................................................................................................. 1
Farm Evaluation Reports ......................................................................................................................................... 1 Nitrogen Management Plan Summary Reports ............................................................................................... 2 Management Practice Implementation Reports ............................................................................................. 4
Surface Water ......................................................................................................................................................... 4 Groundwater ........................................................................................................................................................... 5
NMP Summary Report Evaluation ............................................................................................................................ 5 Data Quality Control ................................................................................................................................................. 5
Completeness .......................................................................................................................................................... 5 Data Verification and Corrections ................................................................................................................... 5 Data Excluded from the Analysis...................................................................................................................... 6
Methods ......................................................................................................................................................................... 7 Yield Estimation and Units .................................................................................................................................. 7 Crop Classification ................................................................................................................................................ 7 Nitrogen Removal Calculations ........................................................................................................................ 8 Multi-Year AR Calculations ............................................................................................................................. 11 Identification of Outliers .................................................................................................................................. 14 Statistical Methods............................................................................................................................................. 15
Results ......................................................................................................................................................................... 15 Evaluation of Nitrogen Applied and Removed by Soil Type ................................................................. 18 Irrigation and Nitrogen Management Practices ...................................................................................... 23 Caveats ................................................................................................................................................................... 24
Nitrogen Use Evaluation Packets ...................................................................................................................... 24 References ...................................................................................................................................................................... 26
LIST OF APPENDICES
Appendix I Surface Water MPIR Example Packet
Appendix II NMP SR Evaluations of Nitrogen Applied and Nitrogen Removed Data (2018 Crop Year)
Appendix III Example Nitrogen Use Evaluation Packet

ESJWQC Annual Management Practice Implementation and Nitrogen Application Report August 1, 2019
ii
LIST OF ATTACHMENTS
Attachment A Management Practice Implementation Data
Attachment B Nitrogen Management Plan Summary Report Data
LIST OF TABLES Table 1. Summary of acreage and membership counts for received and not received 2017 FEs. ..... 2 Table 2. Summary of acreage and membership counts for received and not received 2018 NMP
Summary Reports. ............................................................................................................................................ 3 Table 3. Number of reported MUs and associated acreage excluded from the analysis due to
incomplete data or unverified yields or nitrogen applications. ........................................................ 6 Table 4. CN coefficients applied to each of the specific crop types used by the Coalition. .................... 9 Table 5. Counts of parcels contributing to multi-year AR calculations. .................................................... 13 Table 6. List of crop groups and specific crop types (not including permanent crop age) reported by
growers in the Coalition region. ............................................................................................................... 16 Table 7. 2018 CY ranges for A-R, R, and AWS 150. .......................................................................................... 21 Table 8. Simple linear regression results for crop-specific models of A – R ~ AWS 150 using 2018
CY data for the top 13 crops...................................................................................................................... 22 Table 9. Simple linear regression results for crop-specific models of R ~ AWS150 using 2018 CY
data for the top 13 crops. ........................................................................................................................... 22
LIST OF FIGURES Figure 1. Multi-year AR calculation decision tree. ............................................................................................ 13
LIST OF ACRONYMS
A Nitrogen Applied A/R Nitrogen Applied over Nitrogen Removed A/Y Nitrogen Applied over Yield A-R Nitrogen Applied minus Nitrogen Removed APN Assessor Parcel Number AR Nitrogen Applied and Removed AWC Available Water Capacity AWS Available Water Storage CN Crop-Specific Nitrogen (Coefficient) CY Crop Year ESJWQC East San Joaquin Water Quality Coalition FE Farm Evaluation GQMP Groundwater Quality Management Plan GW Groundwater HVA High Vulnerability Area INMP Irrigation and Nitrogen Management Plan

ESJWQC Annual Management Practice Implementation and Nitrogen Application Report August 1, 2019
iii
IQR Interquartile Range Ksat Saturated Hydraulic Conductivity MC Medcouple MPIR Management Practice Implementation Report MU Management Unit NB Non-Bearing NMP Nitrogen Management Plan NR Not Reported NY No Yield Harvested QC Quality Control R Nitrogen Removed SQMP Surface Water Quality Management Plan SSURGO Soil Survey Geographic Database SR Summary Report SW Surface Water TR Township and Range WDR Waste Discharge Requirements Y Yield

ESJWQC Annual Management Practice Implementation and Nitrogen Application Report August 1, 2019
1
INTRODUCTION The East San Joaquin Water Quality Coalition (ESJWQC or Coalition) is submitting the Annual Report on Management Practice Implementation and Nitrogen Application for the 2018 Crop
Year (CY) as required by the Waste Discharge Requirements General Order for Growers within the Eastern San Joaquin River Watershed (WDR or Order; Order No. R5-2012-0116-R4,
approved February 7, 2018).
The Coalition received approval on June 7, 2019 from the Central Valley Regional Water Quality Control Board (Regional Board) to extend the submittal date from July 1 to August 1, 2019 which
allowed for additional data from growers to be included in the analysis of nitrogen data.
This report includes the following required elements listed within the WDR:
• Summary of Management Practice Information (2017 CY) • NMP SR Evaluation (2018 CY)
The following Excel files are included with this report:
• Attachment A: Management Practice Implementation Data • Attachment B: Nitrogen Management Plan Summary Report Data
AVAILABLE DATA For the 2018 crop year (CY), members in groundwater High Vulnerability Areas (HVAs) were
required to submit an NMP SR to the Coalition. Members were not required to submit an FE or an MPIR (either surface or groundwater) for the 2018 CY. Included in this report is an update on the
most recent FE data, an NMP SR evaluation, and an update on the MPIR template development.
FARM EVALUATION REPORTS
Farm Evaluations for the 2017 CY were mailed to all Coalition members; members are not required to submit FEs again until March 1, 2021 for the 2020 CY. A small percentage of members
(7%) were not required to complete an FE for one of three possible reasons:
1. the member had no irrigated acreage enrolled in the Coalition during 2017 (enrolled after September 2017),
2. they did not farm in 2017, or 3. the member is no longer enrolled in the Coalition.
The Coalition has received surveys from 96% of members (3108 members), representing 98% of Coalition acreage as of July 9, 2019 (Table 1). Only 4% of the members (146 members) have not submitted their 2017 CY FE to the Coalition. The Coalition continues to follow up with these
members. It is noted on the participant list that these members have not provided requested management practice information.

ESJWQC Annual Management Practice Implementation and Nitrogen Application Report August 1, 2019
2
Table 1. Summary of acreage and membership counts for received and not received 2017 FEs.
SURVEY STATUS VULNERABILITY OVERALL
VULNERABILITY1 SUM OF ACREAGE COUNT OF MEMBERS
Received
Both SW and GW - High High 408,020 1,327 GW - High High 175,406 1,339 SW - High High 71,434 199
Both SW and GW - Low Low 37,446 213 Unknown Unknown 1,708 30
RECEIVED TOTAL 694,014 3,108
Not Received
Both SW and GW - High High 6,318 64 GW - High High 3,423 63 SW - High High 86 3
Both SW and GW - Low Low 1,684 16 Unknown Unknown 0 0
NOT RECEIVED TOTAL 11,511 146 GRAND TOTAL 705,526 3,254
% RECEIVED 98% 96% 1 When one or more parcels in a membership is in a surface or groundwater HVA, a survey was required for all parcels enrolled under the membership. GW – Groundwater SW – Surface Water
Farm Evaluation data for the 2017 CY are included in Attachment A, Management Practice
Implementation Data.
Attachment A includes the following information by anonymous member identification:
a) Crop
b) Pesticide, irrigation, nitrogen and sediment and erosion practices c) Presence of irrigation wells
d) Presence of abandoned wells e) Well practices
f) Acreage
As a result of the most recent revisions to the WDR, the Coalition submitted a revised FE template (approved on April 30, 2019). Starting with the 2020 CY, all members are required to submit a FE
every 5 years using the new template due March 1, 2021.
NITROGEN MANAGEMENT PLAN SUMMARY REPORTS
All Coalition members are required to prepare and implement a Nitrogen Management Plan (NMP) for their farms by March 1 of each year (template approved December 23, 2015). Growers
in HVAs are required to have their NMP Worksheets certified and to submit them to the Coalition as an NMP SR for the previous crop year’s NMP. Worksheets can be certified by either a nitrogen
specialist, a crop specialist, or self-certified if the member passes the NMP self-certification course.
On October 19, 2018, a new template was approved by the Regional Board for an Irrigation and
Nitrogen Management Plan Summary (INMP SR). The INMP SR must be completed by Coalition members by March 1, 2020 for the 2019 CY.

ESJWQC Annual Management Practice Implementation and Nitrogen Application Report August 1, 2019
3
Nitrogen Management Plan Summary Reports were sent to members in groundwater HVAs and,
as of June 25, 2019, the ESJWQC received NMP SRs for the 2018 CY from 88% of the members representing 91% of the acreage (Table 2).
The ESJWQC will continue to reach out to members to receive their 2018 CY NMP SRs; any
outstanding surveys received in the next year will be reported with the 2020 Annual Management Practice Implementation and Nitrogen Use Report to be submitted on July 1, 2020.
Table 2. Summary of acreage and membership counts for received and not received 2018 NMP Summary Reports.
NMP SUMMARY REPORTS STATUS COUNT OF MEMBERS SUM OF ACREAGE Not Received 344 28,016
Received - Not Required 80 19,965 Received - Required 2,443 472,506
TOTAL RECEIVED 2,523 492,470 TOTAL REQUIRED 2,787 520,486
% OF REQUIRED REPORTS RECEIVED 88% 91%
The WDR requires that the Coalition submit an evaluation of the ratio of nitrogen applied to
removed (A/R) and the difference between nitrogen applied and nitrogen removed (A-R). The evaluation for A/R must include, at a minimum, a comparison of A/R ratios by crop type.
Comparisons may also include irrigation method, soil conditions, and farming size operations as directed by the Executive Officer (EO).
Growers report their nitrogen use by Management Unit (MU). An NMP MU consists of a field and
a parcel (or a group of parcels) that are comprised of the same crop and are managed the same way with respect to nitrogen applications.
Data reported by MU are then associated with a specific Assessor Parcel Number (APN). The NMP SRs for the 2018 CY include the total available nitrogen applied (A) in pounds per acre, and
the ratio of total available nitrogen applied to yield per acre (A/Y). Growers may also provide their yield per acre (Y), though this information is not required. The A/Y ratio is an indicator of the
proportion of nitrogen removed from the field at harvest.
For each comparison, a histogram of the data must be provided including a mean and standard deviation. A box and whisker plot (or equivalent tabular or graphical presentation of the data as
approved by the EO) may be used when comparing the A/R ratio and the A-R difference.
The NMP SR Analysis includes a reporting of A/R and A-R values by crop type, including histograms illustrating the mean and standard deviations and identification of outliers with box
and whisker plots (Appendix II). When possible, the Coalition converts the reported yield to the amount of nitrogen removed (R), and evaluates A/R and A-R. When there are three years of data,
a multi-year, three year running total is calculated for both A/R and A-R. All methods and calculations are explained in the Methods section below.
Once the data are analyzed, the Coalition provides a Nitrogen Use Evaluation report to each member. The Nitrogen Use Evaluation reports provide an estimate of the nitrogen removed per
acre for each the member’s NMP MUs and provide summary statistics that place their nitrogen use and nitrogen removal performance in the context of other growers with the same crop. These
efforts are explained in the Nitrogen Use Evaluation Packets section.
ESJWQC Annual Management Practice Implementation and Nitrogen Application Report August 1, 2019
4
MANAGEMENT PRACTICE IMPLEMENTATION REPORTS
The MPIR is to be completed by members in areas subject to a Surface Water Quality
Management Plan (SQMP) or Groundwater Quality Management Plan (GQMP) according to a schedule specified in the SQMP and GQMP. The purpose of the MPIR is to document management practices implemented by members to comply with requirements of the SQMP and
GQMP.
Each of the sections below includes an update on the status of MPIR data, an overview of the
strategy for MPIR implementation, and next steps for the coming year.
Surface Water The Coalition submitted an amendment to the 2014 SQMP with a surface water MPIR template to the Regional Board (approved on November 19, 2018). Included in the amendment was a
description of how the MPIR is incorporated into the Coalition’s current SQMP strategy with a timeline for MPIR reporting activities.
The Coalition’s SQMP strategy for addressing surface water quality impairments includes
conducting Focused Outreach. The Focused Outreach process consists of sourcing exceedances, conducting individual meetings with targeted growers for outreach and education, tracking the
implementation of management practices, and monitoring to track improvements in water quality. The Coalition continues to use the current process with members now completing an MPIR survey
to track management practice implementation in place of the original Focused Outreach survey.
The MPIR survey documents management practices that targeted growers already have in place
and is used to identify additional practices that can be implemented to address water quality impairments. Members complete the MPIR survey with Coalition staff, responding to questions
that are specific to the constituents of concern. The Coalition reviews the completed MPIR to determine if additional practices were recommended for the targeted grower. If additional
practices were recommended, the Coalition contacts the member with a follow-up survey a year later to document if the recommended practices were implemented.
In May 2019, the Coalition sent MPIR packets to 15 growers in the Cottonwood Creek @ Rd 20
site subwatershed based on the approved MPIR template (Appendix I). A summary of management practices currently implemented by targeted growers and recommended practices
will be reported in the ESJWQC Annual Report to be submitted May 1, 2020 as part of the Management Plan Progress Report.
This report includes Attachment A, Management Practice Implementation Data; however, only FE
data from the 2017 CY are included. The Coalition is in the process of collecting SW MPIR data and has not yet submitted a GW MPIR template for approval. Irrigation and nitrogen
management practice information from the INMP SR will not be available until 2020. As the Coalition tracks management practice information from the FE surveys, INMP SRs, and MPIRs,
the data will be included in Attachment A based on anonymous member ID.

ESJWQC Annual Management Practice Implementation and Nitrogen Application Report August 1, 2019
5
Groundwater The Coalition’s GQMP strategy for addressing nitrate in groundwater includes conducting Focused Outreach with members with high multi-year A/R ratios. The GQMP Focused Outreach
process consists of identifying members with high multi-year A/R ratios, conducting crop specific meetings with targeted growers for outreach and education, using the GW MPIR to track the
implementation of management practices, and re-evaluating members multi-year A/R ratios after five years.
On March 21, 2019 the Coalition submitted an extension request for the development and
implementation of the GW MPIR template which will be an amendment to the comprehensive GQMP (approved April 3, 2019). The Coalition will submit an amendment to the GQMP and GW
MPIR template for approval on September 15, 2019. The GW MPIRs will be sent in December 2019 to growers identified in the GQMP Focused Outreach process. Completed GW MPIRs will
be returned by March 1, 2020.
NMP SUMMARY REPORT EVALUATION
DATA QUALITY CONTROL
Completeness Coalition members can submit their NMP SRs on a hardcopy or through the online ESJWQC Member Portal. The ESJWQC Member Portal only allows submission if all required fields are
populated. Any NMP SR received as a hardcopy is reviewed for completeness. An NMP SR is considered incomplete and follow-up with the grower is required if one or more of the following
occurs:
1. Not all APNs designated as high vulnerability to groundwater were reported.
2. A crop was not provided. For example, a grower may have reported “row crops” and therefore the Coalition could not determine the specific crop type to assign to the field.
3. Acreage of an APN was not provided and/or could not be determined through enrolled acreage.
4. NMP SR data could not be associated with a specific APN. 5. The NMP SR was missing any of the requisite NMP data, including amount nitrogen applied
per acre, A/Y ratio, or a production unit for the yield.
Complete data were further reviewed for consistency by ensuring all reported APNs were associated with the correct membership ID and were within the ESJWQC boundary. Duplicated
entries based on APN or MU were reconciled or removed from the analysis.
Data Verification and Corrections The Coalition reviewed the yield per acre (Y) and the nitrogen applied per acre (A) to determine if the reported data appeared reasonable. Yields varied by orders of magnitude across all crops,
ranging from 0 pounds per acre to more than 100,000 lbs/acre for some crops. Yields reported at higher than 250,000 lbs/acre and nitrogen application rates higher than 1,000 lbs/acre were

ESJWQC Annual Management Practice Implementation and Nitrogen Application Report August 1, 2019
6
determined likely to represent errors in the reporting and were flagged for review and follow up.
Additionally, the Coalition identified MUs with data quality concerns by comparing reported A and Y values to the distribution of values reported for each crop. The Coalition estimated that any NMP MU with an A or Y value greater than twice the 75th percentile of all other data for the same
crop was most likely reported incorrectly. The MUs identified as having an unlikely A or Y were flagged for review and follow-up; suspect data that were not reconciled were marked as
incomplete and not included in the analysis.
All data flagged for follow-up due to incompleteness, inconsistencies, or unlikely yield or nitrogen
applications were reviewed against the original submission to ensure these values were not the result of data-entry errors. Additional NMP SRs were selected at random for verification against
the original submittal. In total, 20% of NMP SRs were reviewed for data entry accuracy.
Data Excluded from the Analysis Some data received by the Coalition were not analyzed due to the type of crop reported. Parcels excluded from the analyses due to inconsistencies with the reported crop type include one or
more the following situations:
1. APNs were reported as not farmed (fallow, open). 2. Cover crops, because they receive no nitrogen applications and have no yield.
3. Rice fields, excluded because they are reported by the California Rice Commission. 4. Nurseries and grass sod, excluded as they have no yield in the traditional sense.
5. Pastures have no yield in the traditional sense, but farmers can estimate yields using available tools. Currently growers with pasture are not required to submit NMP SRs if
fertilizers are not applied. The Coalition excluded pastures most of the time, but included some forage MUs where the growers reported A and Y.
The NMP MUs with incomplete data or data flagged as suspect (see Data Verification and Corrections) were also excluded from the analysis. The number of NMP MUs and acreage
excluded due to quality concerns are listed in Table 3. In total, 292 NMP MUs were excluded from the analysis due to data quality issues.
After follow-ups and exclusions, the Coalition used complete NMP SR data from 2,327 members
farming 438,585 irrigated acres and 107 crops (Table 5).
Table 3. Number of reported MUs and associated acreage excluded from the analysis due to incomplete data or unverified yields or nitrogen applications.
CROP COUNT OF MUS TOTAL ACRES ALFALFA 13 856
ALMONDS 120 9,718 APPLES 1 122 BEANS 1 40 BERRY 4 96 CITRUS 4 129 CORN 14 455
COTTON 4 1,030 FIGS 3 404
FORAGE GRASS 1 28 GRAPES 22 1,596 GRASS 1 379

ESJWQC Annual Management Practice Implementation and Nitrogen Application Report August 1, 2019
7
CROP COUNT OF MUS TOTAL ACRES KIWIFRUIT 1 48
MELONS 2 17 NURSERY 2 137
OATS 16 401 OLIVES 2 303
PEACHES 10 357 PISTACHIOS 22 2,039 POTATOES 1 244 PUMPKINS 1 10
RICE 1 285 SMALL GRAIN (EXCL WHEAT AND OATS) 1 50
SORGHUM/SUDAN 1 18 STRAWBERRIES 6 137
SWEET POTATOES 6 522 WALNUTS 29 1,948
WHEAT 3 183 Total 292 21,554
METHODS
Yield Estimation and Units Growers were not required to report their yields on their 2018 NMP SRs. In cases where yield
was not provided, the Coalition used nitrogen applied and the A/Y ratio values submitted on the NMP SR to calculate the yield per acre. If the crop yield was reported in a production unit other
than pounds, the Coalition converted the yield to pounds prior to analysis.
Crop Classification The statistical analysis of NMP SR data and the identification of outliers are strongly dependent on comparing NMP SR data from similar crops, necessitating an accurate classification of crops. In
addition to the crop species (e.g., corn, alfalfa), many of the crops grown in the region can be harvested in different ways (e.g., hay vs. silage) or from different varieties (e.g. corn grain vs. sweet
corn). Some of these differences in harvest types and varieties have important implications for this analysis.
In field crops, different harvest types result in significantly different yields. For example, field
crops harvested as hay have lower moisture content (usually around 12%) than the same crop harvested as silage (usually around 70%). As a result, the yields reported for hay harvests are
significantly lower than the yields reported for silage harvests, even if both harvests remove the same dry matter and nitrogen content from the field; therefore, hay and silage harvests cannot be
compared to each other. Additionally, different types of harvest remove different amounts of nitrogen per pound of yield. For example, corn harvested as grain have a higher nitrogen content
than the same crop harvested as silage. Therefore, field crops harvest types must be reported for the data to be useable in the analysis and correctly calculate A/R and A-R.
Some fruit crops are grown and harvested for different purposes (e.g., wine grapes vs. table
grapes; or processing tomatoes vs. fresh market tomatoes). These fruit varieties may differ in moisture content and nitrogen concentration, making the distinction important for the correct

ESJWQC Annual Management Practice Implementation and Nitrogen Application Report August 1, 2019
8
analysis and identification of outliers. Current crop-specific nitrogen (CN) coefficients and
preliminary analysis of the yields suggest that these differences are not as large as the differences seen among field crop harvest types. However, as the quality of the data improves over time, some distinctions may become more apparent. Tree crops also have smaller yields per acre for
younger trees that have not reached full maturity.
To account for those crop differences and facilitate an accurate analysis, the Coalition classifies
crops using a specific crop type that includes the harvest type, crop variety, and crop age, when applicable. When a grower provides an ambiguous crop name associated with a field crop for
which different harvest types can result in vastly different yields and nitrogen removal contents (e.g., “Corn” with no harvest information), the Coalition excluded these MUs from the statistical
analysis (see “Ambiguous Crop Types” on Table 6). However, when a grower reports ambiguous crop names for crops that are less variable (e.g., grapes or tomatoes), the Coalition includes them
in the analysis. For example, the specific crop options for grapes are: grapes, wine; grapes, table; grape, raisins. If a grower just reports “grapes”, the specific crop is recorded as “Grapes, NR”
where “NR” indicates not recorded. The Coalition expects that crop classification will become more accurate over time.
Nitrogen Removal Calculations All CN coefficients were obtained from Dr. Daniel Geisseler’s 2016 report (with the single exception of berries). The CN coefficients for strawberries, blackberries, and blueberries come from CDFA, as no values were reported by Geisseler for these crops. In his report, Geisseler
performed an extensive literature review of nitrogen concentrations for a wide variety of crops, providing an average nitrogen removal value for each crop studied. In addition, Geisseler
provided a coefficient of variation to assess the variability of the data around each mean, and an assessment of the quality, completeness, and relevance of the dataset. However, as the author
noted, many of the values are poor or unreliable estimates for crops grown in the Central Valley.
The Coalition also utilized the average CN coefficients reported in Geisseler (2016) with the understanding that many of the values are poor estimates and will change in the future. After
further review, the Coalition also considered the coefficient of variation provided by Geisseler not to be a proper statistic to estimate variability. Instead, to assess variability, the Coalition used the
range of values from all studies reviewed by Geisseler for each crop. A summary of Geisseler’s mean CN coefficients, the range of values, and both Geisseler’s and the Coalition’s quality
assessments, are provided in Table 4. The Coalition plans on updating and improving these values over time, as more, higher quality data become available.
In some cases, the crop types reported by Geisseler were more specific than those used by the Coalition. For example, while the Coalition reported wheat as a single crop type, Geisseler has
two separate (albeit similar) values for durum and common grain wheat. In such cases, the Coalition calculated an average of the multiple values provided by Geisseler. Averages calculated
by the Coalition are identified in Table 4.
In some cases where the Coalition calculated average CN coefficients for groups of similar crops, the Coalition’s quality assessment of the average differed from Geisseler’s individual assessments
of the more specific crops. For example, Geisseler noted that there are insufficient data for black-

ESJWQC Annual Management Practice Implementation and Nitrogen Application Report August 1, 2019
9
eyed and garbanzo beans from the Central Valley, and it is not possible to determine if the average
provided is a good estimate for the region. However, the Coalition observed that those values overlap substantially with values from lima beans, which are considered by Geisseler to be reasonable estimates for the region. Given the strong overlap in means and ranges, the Coalition
considers the average for dry beans to likely be a reasonable estimate for the region. The same group quality assessment was made for citrus based on the overlap in values between grapefruit,
lemons, oranges, and tangerines, for market tomatoes based on its overlap with processing tomatoes from California, and for oat grain based on its overlap with other small grains from
California.
The specific CN coefficients applied to each specific crop type reported by Coalition members are
included in Table 4. Crops with available CN coefficients in this report covered 447,287 acres within the Coalition region and comprised 96% of the available data (based on the total number of
received and complete reports).
Table 4. CN coefficients applied to each of the specific crop types used by the Coalition. Some of the values used are not good estimates. The CN coefficients and their quality assessments are sourced directly from Geisseler (2016) or are combined Coalition averages of multiple coefficients provided in Geisseler (2016).
COALITION SPECIFIC
CROP TYPE CN COEFFICIENT
COMMODITY CN COEFFICIENT
SOURCE QUALITY
ASSESSMENT CN
COEFFICIENT UNITS
ALFALFA, HAY Alfalfa - Hay Geisseler (2016) Good 0.0311 lbs N/lbs @ 12% moisture ALFALFA, HAYLAGE Alfalfa - Haylage Geisseler (2016) Good 0.012 lbs N/lbs @ 65% moisture
ALMONDS Almonds Geisseler (2016) Good 0.068 lbs N/lbs of marketable
kernels APPLES Apples Geisseler (2016) Poor 0.0005 lbs N/lbs of fruits
APRICOTS Apricots Geisseler (2016) Poor 0.0028 lbs N/lbs of fruits BEANS, DRY, BLACK-EYED
Beans, dry - Blackeye Geisseler (2016) Poor 0.0365 lbs N/lbs of mature dry beans @ 12% moisture
BERRY, BLACKBERRY
Strawberries CDFA FREP1 -- 0.0013 lbs N/lbs of fruit
BERRY, BLUEBERRY Strawberries CDFA FREP1 -- 0.0013 lbs N/lbs of fruit BERRY,
RASPBERRIES Strawberries CDFA FREP1 -- 0.0013 lbs N/lbs of fruit
CARROT Carrots Geisseler (2016) Poor 0.0016 lbs N/lbs of carrot root CHARD Lettuce - average Coalition average Reasonable 0.0016 lbs N/lbs of fresh weight
CHERRY Cherries Geisseler (2016) Poor 0.0022 lbs N/lbs of fruits CITRUS,
CLEMENTINES Citrus, average Coalition average Reasonable 0.0014 lbs N/lbs of fruits
CITRUS, MANDARINS
Citrus, average Coalition average Reasonable 0.0014 lbs N/lbs of fruits
CITRUS, ORANGES Oranges Geisseler (2016) Reasonable 0.0015 lbs N/lbs of fruits CITRUS, TANGELO Citrus, average Coalition average Reasonable 0.0014 lbs N/lbs of fruits
CITRUS, TANGERINES
Tangerines Geisseler (2016) Poor 0.0013 lbs N/lbs of fruits
CORN, GRAIN Corn - Grain Geisseler (2016) Poor 0.012 lbs N/lbs of grain @ 15.5%
moisture CORN, SILAGE Corn - Silage Geisseler (2016) Good 0.0038 lbs N/lbs @ 70% moisture CORN, SWEET Corn - Sweet Geisseler (2016) Reasonable 0.0036 lbs N/lbs of fresh ears
COTTON Cotton Geisseler (2016) Good 0.0219 lbs N/lbs lint & seed COTTON, PIMA Cotton Geisseler (2016) Good 0.0219 lbs N/lbs lint & seed
COTTON, UPLAND Cotton Geisseler (2016) Good 0.0219 lbs N/lbs lint & seed FIGS Figs Geisseler (2016) Poor 0.0013 lbs N/lbs of fruits
FORAGE GRASS, HAY
Foragegrass - Hay, average
Coalition average Poor 0.0267 lbs N/lbs @ 12% moisture
GARLIC Garlic Geisseler (2016) Poor 0.0076 lbs N/lbs of bulb weight GRAPES, NR Grapes - average Coalition average Reasonable 0.0015 lbs N/lbs of grapes

ESJWQC Annual Management Practice Implementation and Nitrogen Application Report August 1, 2019
10
COALITION SPECIFIC
CROP TYPE CN COEFFICIENT
COMMODITY CN COEFFICIENT
SOURCE QUALITY
ASSESSMENT CN
COEFFICIENT UNITS
GRAPES, RAISINS Grapes - Raisins Geisseler (2016) Reasonable 0.0051 lbs N/lbs of grapes @ 15%
moisture GRAPES, TABLE Grapes - Table Geisseler (2016) Reasonable 0.0011 lbs N/lbs of grapes GRAPES, WINE Grapes - Wine Geisseler (2016) Poor 0.0018 lbs N/lbs of grapes
GREENS, COLLARD Lettuce - average Coalition average Reasonable 0.0016 lbs N/lbs of fresh weight KALE Lettuce - average Coalition average Reasonable 0.0016 lbs N/lbs of fresh weight
LETTUCE Lettuce - average Coalition average Reasonable 0.0016 lbs N/lbs of fresh weight MELONS,
CANTALOUP Melons - Cantaloupe Geisseler (2016) Poor 0.0024 lbs N/lbs of melons
MELONS, WATERMELON
Melons, Water Geisseler (2016) Poor 0.0007 lbs N/lbs of melons
MUSTARD, GREENS Lettuce - average Coalition average Reasonable 0.0016 lbs N/lbs of fresh weight NECTARINES Nectarines Geisseler (2016) Reasonable 0.0018 lbs N/lbs of fruits
OATS, GRAIN Oat - Grain Geisseler (2016) Poor 0.0189 lbs N/lbs of grain @ 12%
moisture OATS, HAY Oat - Hay Geisseler (2016) Good 0.0109 lbs N/lbs @ 12% moisture
OATS, SILAGE Small grains - Silage,
average Coalition average Good 0.0049 lbs N/lbs @ 70% moisture
OLIVES Olives Geisseler (2016) Reasonable 0.0031 lbs N/lbs of olives ONIONS, BULB Onions Geisseler (2016) Poor 0.002 lbs N/lbs of bulb weight
PEACHES, FRESH MARKET
Peaches Geisseler (2016) Reasonable 0.0011 lbs N/lbs of fruits
PEACHES, NR Peaches Geisseler (2016) Reasonable 0.0011 lbs N/lbs of fruits PEACHES,
PROCESSING Peaches Geisseler (2016) Reasonable 0.0011 lbs N/lbs of fruits
PECANS Walnuts Geisseler (2016) Reasonable 0.016 lbs N/lbs with shells PISTACHIOS Pistachios Geisseler (2016) Good 0.0281 lbs N/lbs dry yield (CPC)
PLUM-APRICOT HYBRIDS
Plums Geisseler (2016) Poor 0.0014 lbs N/lbs of fruits
PLUMS Plums Geisseler (2016) Poor 0.0014 lbs N/lbs of fruits POMEGRANATES Pomegranate Geisseler (2016) Poor 0.0076 lbs N/lbs of fruits
POTATOES Potatoes Geisseler (2016) Poor 0.0031 lbs N/lbs of fresh weight PRUNES Prunes Geisseler (2016) Good 0.0056 lbs N/lbs of dried fruits
PUMPKINS Pumpkin Geisseler (2016) Poor 0.0037 lbs N/lbs of fresh weight
SAFFLOWER Safflower Geisseler (2016) Poor 0.0284 lbs N/lbs of seed @ 8%
moisture SMALL GRAIN
(EXCL WHEAT AND OATS), GRAIN
Small grains - Grain, average
Coalition average Good 0.0197 lbs N/lbs of grain @ 12%
moisture
SMALL GRAIN (EXCL WHEAT AND
OATS), SILAGE
Small grains - Silage, average
Coalition average Good 0.0049 lbs N/lbs @ 70% moisture
SORGHUM/SUDAN, GRAIN
Sorghum - Grain Geisseler (2016) Reasonable 0.0165 lbs N/lbs of grain @ 13.5%
moisture SORGHUM/SUDAN,
SILAGE Sorghum - Silage Geisseler (2016) Reasonable 0.0037 lbs N/lbs @ 65% moisture
SPINACH Lettuce - average Coalition average Reasonable 0.0016 lbs N/lbs of fresh weight SQUASH, NR Squash Geisseler (2016) Poor 0.0018 lbs N/lbs of fresh weight
SQUASH, SUMMER Squash Geisseler (2016) Poor 0.0018 lbs N/lbs of fresh weight SQUASH, WINTER Squash Geisseler (2016) Poor 0.0018 lbs N/lbs of fresh weight
STRAWBERRIES Strawberries CDFA FREP1 -- 0.0013 lbs N/lbs of fruit SUDAN, SILAGE Sorghum - Silage Geisseler (2016) Reasonable 0.0037 lbs N/lbs @ 65% moisture
SWEET POTATOES Sweet potatoes Geisseler (2016) Good 0.0024 lbs N/lbs of fresh weight TOMATILLOS Tomatoes - average Coalition average Good 0.0013 lbs N/lbs of fresh weight
TOMATOES, FRESH MARKET
Tomatoes - Fresh market
Geisseler (2016) Poor 0.0013 lbs N/lbs of fresh weight
TOMATOES, NR Tomatoes - average Coalition average Good 0.0013 lbs N/lbs of fresh weight

ESJWQC Annual Management Practice Implementation and Nitrogen Application Report August 1, 2019
11
COALITION SPECIFIC
CROP TYPE CN COEFFICIENT
COMMODITY CN COEFFICIENT
SOURCE QUALITY
ASSESSMENT CN
COEFFICIENT UNITS
TOMATOES, PROCESSING
Tomatoes - Processing
Geisseler (2016) Good 0.0014 lbs N/lbs of fresh weight
WALNUTS Walnuts Geisseler (2016) Reasonable 0.016 lbs N/lbs with shells
WHEAT, GRAIN Wheat - Grain,
average Coalition average Good 0.0213
lbs N/lbs of grain @ 12% moisture
WHEAT, SILAGE Wheat - Silage Geisseler (2016) Reasonable 0.0053 lbs N/lbs @ 70% moisture 1 CDFA FREP values were obtained from http://apps.cdfa.ca.gov/frep/docs/N_Strawberry.html. No data quality assessment exists for this value.
Multi-Year AR Calculations For each A and R value, the Order requires that the Coalition calculate the pounds of nitrogen applied divided by the pounds of nitrogen removed (A/R ratio) and the pounds of nitrogen applied
minus pounds of nitrogen removed (A-R difference). The A/R ratio represents a measure of agronomic efficiency, with values near or equal to 1 indicating that the nitrogen applied to a field is
roughly the same as the amount of nitrogen removed from the field through harvested plant material and/or sequestration in permanent tissue. The A-R difference is a mass balance which
estimates the amount nitrogen unused by the crop with the potential to leach past the root zone.
In addition to calculating these values for the current reporting year, the Order also requires the calculation of multi-year A/R ratio and A-R difference values, wherever feasible. Per the Order,
multi-year metrics are to be running totals of the A and R data for the current crop year and the previous two crop years for any fields for which three consecutive years of data are available,
according to the following formulae:
A/R3 year Ratio = Sum of Nitrogen Applied during current and two previous reporting cycles
Sum of Nitrogen Removed during current and two previous reporting cycles=
(An + An-1 + An-2)
(Rn + Rn-1 + Rn-2)
A-R3 year Difference = [Sum of Nitrogen Applied (current and two previous reporting cycles)]
– [Sum of Nitrogen Removed (current and two previous reporting cycles)] = (An + An−1 + An−2) – (Rn + Rn−1 + Rn−2)
Where n is the current reporting cycle.
Utilizing A and R values over several years is intended to account for yearly variations in yield that are outside of a grower’s control and for the carryover of nitrogen in soil. The multi-year
performance metrics simplify some of the inherent complexity of assessing nitrogen efficiency on the basis of a single cropping-cycle and account for nitrogen present in its many varied states
within a field and crop system.
However, for such multi-year evaluations to be meaningful, it is critical that the A and R values
contributing to the running totals be comparable across all three years. Ensuring comparable data are being evaluated can present a significant challenge as field, membership, and nitrogen
management information can be dynamic, especially over multiple years. As such, the multi-year calculations must be made on a parcel level, as APNs are the most reliable spatial scale to ensure
the same fields are being compared over three years, and APNs are also the most precise geospatial unit available for the NMP SR data.

ESJWQC Annual Management Practice Implementation and Nitrogen Application Report August 1, 2019
12
The process for assessing whether a parcel is associated with enough data to calculate the multi-
year running totals is outlined in Figure 1. The number of parcels eliminated by each criterion are provided in Table 5. Below are the key factors in determining if the running totals can be calculated:
• Nitrogen applied (A) was reported for three consecutive years
• Nitrogen removed (R) could be calculated for three consecutive years
• The parcel was reported on by the same membership for three consecutive years
• The same crop was grown on the parcel for three consecutive years
For multi-year calculations, both A and R must be available for three consecutive years for a single
parcel. Nitrogen applied is reported by the grower while R must be calculated from reported yields. There are two scenarios in which this is not possible (excluding suspect or erroneous
reporting, as discussed above in Data Quality Control). The first involves crops for which there is no CN coefficient available for the calculation. The majority of crops reported by Coalition
members do have an available CN coefficient (Table 4); however, some crops do not have sufficient data for a coefficient to be defined. These crops are reported as A/Y ratios in Attachment B,
Nitrogen Management Plan Summary Data. The second scenario is that in which a yield could not be calculated. Under previous NMP reporting requirements, growers are only required to report
A and A/Y to complete their nitrogen reporting. When growers report a nitrogen application rate of zero pounds per acre and a resulting A/Y ratio of zero, the original denominator of the ratio
cannot be back calculated as it can when A/Y is greater than zero. Some growers do still provide the yield; however, when no yield is available, R cannot be calculated. These records are excluded
due to insufficient data.
The same parcel must also be farmed by the same member who is growing the same crop. Multi-year calculations are ultimately performance metrics meant to evaluate the grower’s management
of farming operations. Subsequent evaluations using multi-year metrics must be applied to a specific Coalition member. Therefore, the membership associated with the parcel must be the
same for three consecutive years. Similarly, different crops necessitate different management practices and strategies to achieve maximum nitrogen efficiency. Any performance metric must
be applied to a single crop type to be a useful metric for such purposes.
Additionally, permanent orchard and vine crops must be assessed not only for a consistent crop type but also for consistent crop ages. Juvenile perennial crops generally have lower yields than
mature producing trees and vines. Nitrogen is still being taken up by the plant, though it is contributing to additional growth rather than harvested material. There are currently no
numerical adjustments to be made for juvenile crops to account for this difference in nitrogen usage.
The CN coefficients used to convert yield to R account for nitrogen removal based on the sequestration rate expected of mature crops in full production. Variable sequestration rates mean
that nitrogen removed rates between juvenile and mature crops, or even variably aged juvenile crops, are not comparable to each other. The A/R and A-R values for juvenile crops where lower
yields are to be expected are not valid metrics of grower performance. Any evaluations of trends in nitrogen applications compared to harvested yield using such values would be artificially
skewed towards growers with juvenile crops, rather than being a useful tool for identifying parcels

ESJWQC Annual Management Practice Implementation and Nitrogen Application Report August 1, 2019
13
with legitimately lower grower performance and efficiency. Therefore, only perennial crops with
three consecutive mature years of consistent data are selected for multi-year AR calculations.
Figure 1. Multi-year AR calculation decision tree.
The management and reporting of different sections of the same field or parcels may be variable
throughout the years, with some areas reported together under a single MU one year and then split into multiple MUs in subsequent years (or vice versa). Where a reported MU consists of
multiple parcels (the parcel unit is smaller than the MU), the A and R values for the MU are applied to each parcel individually. Where a reported parcel consists of more than one MU for the same
crop for one or more years (the parcel unit is larger than the MU), acreage-weighted averages of nitrogen applied and removed data are calculated to avoid duplicated records.
Table 5. Counts of parcels contributing to multi-year AR calculations. CRITERIA INELIGIBLE ELIGIBLE
2018 Crop Year Parcel with NMP Data -- 10,174

ESJWQC Annual Management Practice Implementation and Nitrogen Application Report August 1, 2019
14
CRITERIA INELIGIBLE ELIGIBLE A and A/Y reported for previous three years 4780 5,394
R can be calculated 164 5,230
Farmed by same member 115 5,115
Same crop reported 763 4,352
Mature perennial crop reported 350 4,002
Multi-year calculations Unique Parcels 4,002
Records 4,182
Identification of Outliers The WDR requires that outliers be identified annually based on the INMP SR data using an approach approved by the Regional Board Executive Officer after public notice and comment. Per
the proposed methodology submitted by the Coalition on Arpil12, the Coalition identified outliers for the 2018 CY using an adjusted Interquartile Range (IQR) method for the multi-year A/R ratio
(approved July 3, 2019).
The IQR is a distribution-free method that does not depend on an estimate of the mean or
standard deviation of the data (Tukey., 1977). The IQR is not based on a statistical test and therefore can be performed across a wide range of sample sizes and data distributions. The IQR
method has a long history of use in identifying outliers in a variety of different settings in both the biomedical and environmental science fields. One of the advantages of the IQR method is the data
and outliers can be easily visualized in a boxplot format.
The IQR of any data distribution is the difference between the 25th percentile value of the data and the 75th percentile value of the data. Using the standard approach, outliers are determined to
be any data points outside of the 25th/75th percentile data values ±1.5*IQR. While this method is a commonly used for determining outliers of a dataset, it is relatively insensitive to skewness and
extreme values. A skewed data distribution can result in a boxplot that is an inaccurate representation of the data and outliers.
To avoid skewness causing a mischaracterization of the data, modifications to the standard IQR
calculations can be made. One of such modifications is the medcouple statistic (MC), a measure of the skewness of a univariate distribution. The MC is defined as the scaled median difference of
the left and right halves of a distribution. If the distribution is skewed to the right, MC ≥ 0; if the distribution is skewed to the left, MC < 0. As developed by Hubert and Vandervieren (2008),
outliers in a distribution skewed to the right (MC ≥ 0) are identified as any data points outside of the interval:
[Q1 – (1.5e-4MC) * IQR; Q3 + (1.5e3MC) * IQR] Eq. 1 And for distributions skewed to the left (MC < 0), outliers are data points outside of the interval:
[Q1 – (1.5e-3MC) * IQR; Q3 + (1.5e4MC) * IQR] Eq. 2
Where Q1 and Q3 are the 25th and 75th percentiles of the data, respectively, and e is the natural exponential
function.

ESJWQC Annual Management Practice Implementation and Nitrogen Application Report August 1, 2019
15
When the distribution of data is perfectly symmetrical, MC = 0 and the range remains exactly the
standard (non-modified) IQR outlier method. However, where the multi-year A/R data are skewed, the adjusted method applies the MC statistic using the equations above and generates an upper and lower fence, which represent outlier thresholds. For the purpose of this analysis, only
values above the upper fence are considered outliers, as higher values for the multi-year A/R ratios represent lower nitrogen use efficiency. Per the WDR, members farming parcels that are
identified as outliers will be subject to additional certification requirements and tracking of management practices.
Statistical Methods Outlier analyses were performed using R software for statistical computing. The Coalition used standard box and whisker plots to visualize multi-year A/R ratios grouped by crop (Appendix II). In
the box and whisker plots, the “boxes” indicate the 25th, 50th (median noted by the horizontal line), and 75th percentiles, and “whiskers” the data range. The default box and whisker plot method in R
calculates the percentiles per the quantile method for continuous variables, where the quantiles are obtained by linear interpolation between data points. The upper fence was calculated from
the medcouple, using the adjboxStats function in the "robustbase" package for R. Multi-year A/R ratios above this upper fence value are considered outliers (See Identification of Outliers).
In addition to the multi-year A/R box plots, the Coalition generated histograms of A/R and A-R
data for both the 2018 CY and the multi-year calculations. All statistics and graphics are provided in Appendix II for each specific crop type. Multi-year data aggregation methodologies are outlined
above (See Multi-Year AR Calculations).
Data were also aggregated by Township and Range (TR) to comply with the Order requirements. Each TR represents 36 sections (23,040 acres). The NMP data were associated with a TR location
using ArcGIS software by overlaying the TRS layer with the county parcel layers. There were 173 APNs that could not be associated to a TR, which were labeled as TR unknown and treated as a
single TR. Some NMP parcels were associated with more than one TR because different parcels or parts of a parcel overlapped with multiple TRs. These data were assigned to the TR that included
most of the parcel area to avoid duplication. The TR aggregations results are provided in Attachment B, Nitrogen Management Plan Summary Data along with field-level reporting of
nitrogen applied and removed rates for the 2018 CY.
RESULTS
Result were reported by growers at the MU level, which represents field-level management of nitrogen by Coalition members. After Quality Control (QC), there were 5,827 NMP MUs with
complete data (Table 6). Of these, 706 MUs were associated with non-yield (NY) or non-bearing (NB) crops that have no nitrogen removed value due to no harvest. The NY/NB crops cover
36,999 acres and had reported applications of approximately 1.7 million lbs of nitrogen (Table 6). In addition, there were 38 MUs (1,940 acres, Table 6) that were reported with ambiguous crop
types that excluded them from the analysis (e.g. only reporting “Corn” without a harvest type). While some MUs with ambiguous crop types had A and R values that could be accurately analyzed,
the Coalition determined that some crop types could not be used to calculate summary statistics

ESJWQC Annual Management Practice Implementation and Nitrogen Application Report August 1, 2019
16
and estimate outliers as their yields could not be reliably compared to similar crops that were
properly reported (See Crop Classification). After the Coalition excluded MUs with NY/NB crops or those with ambiguous crop types, the outlier analysis includes nitrogen applied and removed values of 5,083 NMP MUs associated with 8,189 parcels covering 399,645 acres (Table 6).
Table 6. List of crop groups and specific crop types (not including permanent crop age) reported by growers in the Coalition region. Additional information includes the total number of MUs reported, total nitrogen applied, yield, nitrogen removed, and acreage for each Specific Crop Type. Sorted alphabetically by Crop Group.
CROP GROUP SPECIFIC CROP TYPE NUMBER OF
MUS TOTAL N
APPLIED (LBS) TOTAL YIELD
HARVESTED (LBS)
TOTAL N
REMOVED
(LBS)
TOTAL
ACRES
Alfalfa ALFALFA, GREENCHOP 22 410,482 15,403,718 -- 2,418 Alfalfa ALFALFA, HAY 151 293,944 123,312,788 3,841,187 10,224 Alfalfa ALFALFA, HAYLAGE 4 8,295 3,817,842 45,814 492
Almonds ALMONDS 2,901 35,733,918 438,843,704 29,841,232 207,411 Apples APPLES 6 3,118 245,088 132 70
Apricots APRICOTS 5 8,183 644,554 1,792 104 Beans BEANS, DRY, BLACK-EYED 11 7,570 320,408 11,695 211 Beets BEETS 1 18,114 3,873,025 -- 119
Berries BERRY, BLACKBERRY 1 0 -- -- 1 Berries BERRY, BLUEBERRY 3 2,459 188,627 245 29 Berries STRAWBERRIES 6 11,953 4,264,675 5,544 119
Bok choy BOK CHOY 2 10,438 2,443,230 -- 64 Bok choy BOK CHOY, BABY 1 11,823 2,050,200 -- 68 Cabbage CABBAGE 4 49,825 9,846,910 -- 234
Carrot CARROT 1 112,524 51,261,105 84,325 719 Celery Root CELERY ROOT 1 4,128 1,211,250 -- 19
Cherries CHERRY 22 59,740 5,645,115 12,476 973 Chestnuts CHESTNUTS 4 614 30,173 -- 13
Citrus CITRUS, CLEMENTINES 1 11,475 3,042,900 4,199 135 Citrus CITRUS, MANDARINS 7 370,066 100,118,362 138,165 2,591 Citrus CITRUS, ORANGES 6 333,932 81,403,029 120,477 2,189 Citrus CITRUS, TANGELO 2 82,293 22,511,061 31,065 676 Citrus CITRUS, TANGERINES 2 1,855 348,238 442 35 Corn CORN, GRAIN 5 108,619 8,572,090 102,865 506 Corn CORN, SILAGE 229 3,083,084 808,325,984 3,055,472 14,145 Corn CORN, SWEET 1 28,200 1,494,459 5,358 141
Cotton COTTON 8 131,751 1,837,147 40,143 1,024 Cotton COTTON, PIMA 2 32,535 300,437 6,566 299 Cotton COTTON, UPLAND 6 112,546 1,530,944 33,451 828 Daikon DAIKON 1 1,408 749,700 -- 8 Endive ENDIVE 1 1,735 219,336 -- 10
Escarole ESCAROLE 1 1,794 169,238 -- 10 Fennel FENNEL 1 724 65,321 -- 5
Figs FIGS 15 121,649 8,276,339 10,511 1,534 Forage Grass FORAGE GRASS, FORAGE 26 74,554 18,554,004 -- 1,957 Forage Grass FORAGE GRASS, HAY 12 7,989 1,754,176 46,837 450 Forage Grass FORAGE GRASS, SILAGE 1 0 2,083,480 -- 70
Garlic GARLIC 1 68,814 4,700,124 35,486 299 Grapes GRAPES, NR 28 225,616 111,273,337 163,015 4,767 Grapes GRAPES, RAISINS 101 784,330 99,277,189 501,347 11,654 Grapes GRAPES, TABLE 40 110,169 42,696,993 48,248 1,980 Grapes GRAPES, WINE 222 2,352,428 881,395,837 1,586,512 38,075 Greens CHARD 3 22,526 4,223,700 6,600 148 Greens GREENS, COLLARD 1 29,909 4,949,805 7,734 140 Greens KALE 4 29,475 3,585,892 5,603 138 Greens LETTUCE 4 63,395 7,790,405 12,173 373

ESJWQC Annual Management Practice Implementation and Nitrogen Application Report August 1, 2019
17
CROP GROUP SPECIFIC CROP TYPE NUMBER OF
MUS TOTAL N
APPLIED (LBS) TOTAL YIELD
HARVESTED (LBS)
TOTAL N
REMOVED
(LBS)
TOTAL
ACRES
Greens MUSTARD, GREENS 3 31,398 5,345,422 8,352 171 Greens SPINACH 2 9,742 1,012,133 1,581 84 Herbs HERBS, FRESH CUT 2 28,261 1,282,836 -- 81 Kiwis KIWIFRUIT 1 1,448 92,096 -- 8
Kohlrabi KOHLRABI 1 6,522 1,188,572 -- 39 Leeks LEEKS 1 10,899 1,535,100 -- 51
Melons MELONS, CANTALOUP 1 80 10,000 24 1 Melons MELONS, NR 1 100 32,000 -- 4 Melons MELONS, WATERMELON 1 100 30,000 21 1
Nectarines NECTARINES 7 3,794 1,176,967 2,142 85 Oats OATS, FORAGE 6 38,080 7,556,786 -- 312 Oats OATS, GRAIN 4 2,195 1,825,888 34,418 130 Oats OATS, GREENCHOP 3 63,680 17,802,658 -- 712 Oats OATS, HAY 24 34,982 5,548,818 60,205 656 Oats OATS, SILAGE 113 769,063 222,826,581 1,087,951 6,519
Olives OLIVES 15 12,743 1,731,451 5,437 534 Onions ONIONS, BULB 3 48,899 4,120,871 8,118 159
Peaches PEACHES, FRESH MARKET 22 42,039 14,549,357 16,441 573 Peaches PEACHES, NR 15 18,876 7,087,122 8,008 241 Peaches PEACHES, PROCESSING 78 294,579 108,792,240 122,935 3,312 Pecans PECANS 7 4,317 33,527 535 60
Persimmons PERSIMMONS 9 3,165 526,378 -- 50 Pistachios PISTACHIOS 164 4,169,173 76,529,955 2,146,738 34,076
Plums PLUM-APRICOT HYBRIDS 2 60 63 0 0.8 Plums PLUMS 4 5,280 666,620 943 46
Pomegranates POMEGRANATES 8 13,032 5,450,937 41,427 352 Prunes PRUNES 10 191,490 7,103,440 39,780 1,537
Pumpkins PUMPKINS 3 6,400 2,258,375 8,311 54 Radicchio RADICCHIO 2 45,780 4,680,000 -- 220 Safflower SAFFLOWER 1 0 -- -- 570
Small Grain SMALL GRAIN (EXCL WHEAT
AND OATS), FORAGE 1 0 -- -- 31
Small Grain SMALL GRAIN (EXCL WHEAT
AND OATS), GRAIN 7 25,459 2,668,850 52,522 413
Small Grain SMALL GRAIN (EXCL WHEAT
AND OATS), HAY 3 54,556 3,539,579 -- 246
Small Grain SMALL GRAIN (EXCL WHEAT
AND OATS), SILAGE 3 44,612 6,468,384 31,582 190
Sorghum and Sudan
SORGHUM/SUDAN, GRAIN 1 456 36,234 598 7
Sorghum and Sudan
SORGHUM/SUDAN, GREENCHOP
2 75,852 17,612,400 -- 603
Sorghum and Sudan
SORGHUM/SUDAN, HAY 2 3,902 1,502,000 -- 80
Sorghum and Sudan
SORGHUM/SUDAN, SILAGE 5 10,014 2,914,480 10,696 118
Squash SQUASH, NR 1 0 161,000 295 23 Squash SQUASH, SUMMER 1 105 3,000 6 1 Squash SQUASH, WINTER 1 950 1,140,000 2,092 38
Sweet Potatoes SWEET POTATOES 105 1,363,727 471,906,881 1,118,419 9,583 Tomatillos TOMATILLOS 1 270 36,000 48 9 Tomatoes TOMATOES, FRESH MARKET 13 371,130 67,555,922 88,160 1,943 Tomatoes TOMATOES, NR 5 226,992 108,241,944 144,503 859 Tomatoes TOMATOES, PROCESSING 10 447,872 252,913,688 345,227 2,249
Turnips TURNIPS 1 11,607 1,545,300 -- 69 Walnuts WALNUTS 473 2,758,786 83,407,590 1,330,358 19,938

ESJWQC Annual Management Practice Implementation and Nitrogen Application Report August 1, 2019
18
CROP GROUP SPECIFIC CROP TYPE NUMBER OF
MUS TOTAL N
APPLIED (LBS) TOTAL YIELD
HARVESTED (LBS)
TOTAL N
REMOVED
(LBS)
TOTAL
ACRES
Wheat WHEAT, FORAGE 4 28,116 10,464,920 -- 355 Wheat WHEAT, GRAIN 18 336,342 14,552,948 309,618 2,354 Wheat WHEAT, GREENCHOP 5 66,715 19,865,603 -- 570 Wheat WHEAT, HAY 5 16,483 1,848,880 -- 246 Wheat WHEAT, SILAGE 26 114,149 50,903,032 267,241 1,606
TOTAL 5083 56,754,271 4,504,736,767 47,101,443 399,645 EXCLUDED FROM ANALYSIS
Ambiguous Crop Types2
CLOVER, NR 1 0 -- -- 23 CORN, NR 7 38,505 17,232,375 -- 384 OATS, NR 14 10,964 5,618,082 -- 426
SMALL GRAIN (EXCL WHEAT AND OATS), NR
2 0 835,000 -- 159
SORGHUM/SUDAN, NR 2 0 0 -- 106 TREE, FRUIT NR 3 1,236 32,369 -- 24
WHEAT, NR 9 52,876 20,004,630 -- 818 AMBIGUOUS CROPS SUBTOTAL 38 103,581 43,722,456 0 1,940
NB3 NON-BEARING 585 1,440,131 0 0 29,401 NY3 NO YIELD 121 274,617 0 0 7,598
NB AND NY SUBTOTAL 706 1,714,748 0 0 36,999 NR – Crop or crop age not reported. 1Additional age categories are reported in Appendix I for perennial following crops. 2 Not included in the analysis because the harvest type is necessary to compare data appropriately. 3 Not included in the analysis because these MUs have no A/Y.
Evaluation of Nitrogen Applied and Removed by Soil Type
Previous Efforts Using data collected from 2015 and 2016 CY NMP SRs, the ESJWQC provided an analysis of the relationship between soils and the ratio of applied nitrogen to crop yield (A/Y). The soils
parameter used was saturated hydraulic conductivity (Ksat) of the least conductive soil layer in the upper 1 meter of the soil profile.
The Ksat is the amount of water that can move vertically through a unit area of saturated soil in a
unit time. Higher Ksat values indicate high saturated hydraulic conductivity and therefore higher potential for leaching (e.g., sand) while low Ksat soils tend to impede the downward movement of
water and reduce leaching (e.g., clay).
The analyses involved binning the Ksat values into categories that roughly corresponded to low, moderate, and high conductivity with the concomitant risk of leaching of low, moderate, and high.
The differences between A/Y across the bins was the basis for the analyses. The goal was to establish a relationship between leaching potential of soils and values of A/Y. If soils affect A/Y,
high leaching potential soils would be associated with elevated values of A/Y, i.e., high leaching potential soils would result in either elevated application rates to overcome losses to leaching, or
reduced yield due to the loss of nitrogen from the root zone.
While some crops had significant associations between Ksat and A/Y, overall there were no
consistent relationships between the Ksat, the surrogate for the potential risk of leaching, and A/Y.

ESJWQC Annual Management Practice Implementation and Nitrogen Application Report August 1, 2019
19
The results were similar across all three years and the conclusion of the Coalition was that soil
leaching potential as measured by Ksat was not a determinant of A/Y.
Limitations of Previous Soils Analyses Several reasons exist for the lack of a relationship between Ksat and A/Y including:
• Averaging of Ksat across multiple soil types of a single Management Unit, • Binning of the Ksat values prior to testing for an association, • Ksat is not an appropriate measure of leaching potential of the soil, • A/Y is not an appropriate measure of leaching potential, and • No relationship exists between Ksat and A/Y.
Averaging Ksat values across multiple soils
Management Units can cover several soil types and the Ksat value assigned to each parcel was an area-weighted average of the minimum Ksat values for soil horizons to 1-meter depth for all soil types in the MU. Because the soils data available are reported at a significantly finer scale than
the NMP data, the averaging of the Ksat values and yields across multiple parcels in a single MU likely obscured any relationship between A/Y and Ksat.
Binning of A/Y
The Ksat values were assigned to three bins (low, medium, and high) to facilitate visualization and subsequent analysis which further obscures any potential associations between Ksat and A/Y.
Ksat is not an appropriate surrogate for leaching potential of soils
Soil horizons are not a standardized depth, meaning that the most restrictive layer with respect to leaching (low Ksat) can be between a few centimeters to tens of centimeters deep. Thicker
horizons with lower Ksat values would impede the downward movement of nitrate much more than thin layers. The inability to correct for differences in the depth of the lowest Ksat layer likely
results in a somewhat crude measure of leaching potential of the soil.
A/Y is not an appropriate measure of leaching potential
The A/Y ratio is a measure of grower performance and not necessarily a measure of potential leaching. Low values of A/Y indicate the grower is generating a larger yield per unit of nitrogen
applied, and therefore indicates higher grower performance. It is likely that there is some relationship between grower performance and leaching such that lower grower performance
(high A/Y) means that relatively more nitrogen may leach; however, A/Y is not a direct representation of leaching.
No relationship exists between A/Y and leaching potential of soils
It is possible that the results of the analysis are correct despite all of the averaging, binning, use of A/Y as an index of leaching, and the imprecision of Ksat as an index of leaching potential of the soil.
However, given the potential obscuring of a relationship between A/Y and soils due to the weighted average-binning approach, and the possibility that A/Y and Ksat are not appropriate
metrics leaching potential, the Coalition conducted another analysis in an attempt to link soil properties and leaching potential for the 2018 CY.

ESJWQC Annual Management Practice Implementation and Nitrogen Application Report August 1, 2019
20
Current Soil Evaluation Methods The soils evaluation in this report uses the available water storage (AWS) of the volume of soil between the surface and a depth of 150 cm to represent the relative leaching potential of the soils
analyzed. The depth of 150 cm was chosen since it is the standard depth to which soil survey data are consistently available. Lower AWS 150 values are associated with sandy soils, indicating a
lower water holding potential and a higher potential for leaching of nutrients to groundwater. Higher AWS 150 values are associated with clayey soils with low porosity, and lower potential for
leaching of nutrients to the groundwater.
The AWS is computed as the available water capacity (AWC), or the maximum amount of plant available water a soil can provide, for a specific thickness of soil. The AWC values, like Ksat values,
are available for each soil horizon represented in the soil survey. The AWC is expressed as units of water per units of soil thickness (e.g., cm/cm) and can be multiplied by the thickness of each
horizon to produce the AWS in cm of water. The AWS can then be aggregated for the total desired soil thickness (in this case 150 cm), accounting for each component horizon in the desired profile.
This ability for aggregation allows the total AWS value to be more representative of the entire soil profile than a single Ksat value that does not account for horizon thickness. Averaging is still
required to summarize AWS 150 to the parcel level for comparison to information from the NMP SR. However, AWS 150 is a more wholistic measure of leaching potential on the parcel level and is
less prone to obfuscation of true soil characteristics compared to averaging and binning of Ksat values. The final AWS 150 values for each parcel can be considered the amount of water per unit
area that can be stored by the entire parcel.
The Coalition obtained soils data from the USDA Soil Survey Geographic Database (SSURGO: http://www.soils.usda.gov/survey/geography/ssurgo/). The AWS 150 values were calculated by
aggregating the AWS values for each soil layer in the parcel down to 150 cm to obtain the total water holding capacity of the top 150 cm of the soil. The AWS 150 values were further
aggregated by taking weighted averages of component characteristics for each soil map unit, and finally, area-weighted averages for each map unit value on the parcel level.
Soil information was assigned to each parcel by linking the map unit from the soil data to each APN. The Coalition compared the parcel-level AWS 150 values with the 2018 CY A-R and R
values reported for each parcel. The A-R is an index of leaching potential from the crop and R is a measure of the amount of nitrogen removed by the crop at harvest. The comparison was made for
13 crops (Table 7) that had the largest number of parcels with 2018 CY NMP SR data. For permanent crops such as almonds, walnuts, and grapes, the analysis was performed using data
from crops greater than 4 years old, or from crops with no reported age but with a reported yield greater than 1000 pounds. These top 13 crops account for 87% of the irrigated acreage
associated with 2018 CY NMP SR data for which there was nitrogen removed information.
To identify any relationship between A-R (or R) and AWS 150, the Coalition performed standard linear regressions by crop. Response variables were A-R and R, and the predictor variable in the
regressions was AWS 150. The Coalition examined if AWS 150 influenced R, and if AWS 150 influenced A-R in separate simple linear models for 13 crops (26 models in total, see Table 8 and
Table 9). These analyses tested the hypothesis that a significant linear relationship between the response and predictor variables exists, which in this case is a test of whether the index of

ESJWQC Annual Management Practice Implementation and Nitrogen Application Report August 1, 2019
21
potential leaching (A-R) or the amount of nitrogen removed from the parcel is a linear function of
the water holding capacity of the soil.
The relationship between AWS 150 and R is expected to be positive such that higher water holding capacity and lower leaching potential soils would result in more nitrogen reaching the
crop. In other words, the higher the water holding capacity, the greater the amount of time the plant has to use the nitrogen resulting in greater yields and a larger amount of nitrogen removed.
The relationship between AWS 150 and A-R is expected to be negative such that higher water
holding capacity and lower leaching potential soils would result in lower A-R values (index of leaching potential). It is expected that R will be increased due to a greater amount of time that the
plant has to use the nitrogen before it leaches past the root zone, resulting in a smaller difference between A and R. If this is correct, the sign of the AWS 150 regression coefficient will be negative
meaning that the higher the AWS 150 value, the lower the value of A-R.
Ranges of A-R, R, and AWS 150 There was a wide range of A-R and R values for the crops included in the analysis (Table 7). All ranges for all parameters for all crops were quite similar, indicating that the results of the analyses are not skewed by a crop that tended to have extremely large A-R values relative to other crops.
However, data indicated a significant number of negative A-R values. It’s not clear if these results will be maintained over time or if they are a result of misreporting (e.g., yield calculated
incorrectly, all sources of nitrogen not reported) that will be corrected in future years. It is unlikely from an agronomic perspective that A-R values can continue to be negative for a long
period of time.
Table 7. 2018 CY ranges for A-R, R, and AWS 150.
CROP A-R RANGE R RANGE AWS 150 RANGE
MIN MAX MIN MAX MIN MAX Almonds -324.59 343.81 0 380.6 5.60 25.74 Walnuts -117.60 352.10 0 159.50 6.42 24.39
Grapes, Wine -43.92 256.80 0 96.73 2.21 24.96 Corn, Silage -278.00 213.63 9.37 378.00 5.64 24.82 Pistachios -115.25 215.38 0 181.82 8.98 24.88
Oats, Silage -240.25 81.24 0 322.30 10.50 22.27 Sweet Potatoes -62.20 309.63 0 174.31 9.35 20.82 Grapes, Raisins -102.26 413.10 0 161.68 9.98 22.92
Peaches, Processing -29.72 234.85 0 79.10 10.50 22.22 Grapes, Table -24.86 141.82 0 28.97 10.50 21.43
Cherry -23.48 90.55 0 33.48 10.50 21.97 Grapes, NR -1.83 199.07 7.33 48.83 6.25 21.32
Wheat, Silage -144.00 -17.00 105.00 257.20 10.50 22.72
Nitrogen Applied minus Removed (A-R) There is no consistent relationship between A-R and AWS 150 across all of the crops examined (Table 8). Eleven of the 13 crops had an intercept that is significantly different from 0, which is
expected if there is a general negative relationship between A-R and AWS 150. For four of the 13 crops, there was a significant relationship between AWS 150 and A-R, and in all cases the
relationship is negative. There is no relationship between AWS 150 and A-R for any of the orchard crops; however, there is a significant negative relationship between AWS 150 and A-R for
wine grapes and table grapes. The coefficient for grapes, NR (variety not reported) is negative and

ESJWQC Annual Management Practice Implementation and Nitrogen Application Report August 1, 2019
22
nearly significant at p = 0.06. The other two significant negative relationships are for corn silage
and oat silage. There is no significant relationship for wheat silage.
Table 8. Simple linear regression results for crop-specific models of A – R ~ AWS 150 using 2018 CY data for the top 13 crops. An asterisk indicates a significant relationship.
MODEL N PARCELS COEFFICIENT ESTIMATE STD. ERROR T VALUE P-VALUE
Almonds 4612 Intercept 26.32 4.31 6.11 0.00* AWS150 0.03 0.26 0.10 0.92
Walnuts 615 Intercept 63.28 11.82 5.35 0.00* AWS150 0.32 0.65 0.48 0.63
Grapes, Wine 488 Intercept 36.86 7.09 5.20 0.00* AWS150 -0.92 0.43 -2.11 0.04*
Corn, Silage 361 Intercept 62.59 24.25 2.58 0.01* AWS150 -3.74 1.43 -2.62 0.01*
Pistachios 403 Intercept 44.09 17.93 2.46 0.01* AWS150 -0.38 1.21 -0.32 0.75
Oats, Silage 191 Intercept 40.72 31.51 1.29 0.20 AWS150 -5.27 1.88 -2.80 0.01*
Sweet Potatoes 316 Intercept 57.81 20.51 2.82 0.01* AWS150 -1.43 1.40 -1.02 0.31
Grapes, Raisins 167 Intercept 38.88 25.51 1.52 0.13 AWS150 -2.16 1.78 -1.21 0.28
Peaches, Processing 116 Intercept 46.55 17.77 2.62 0.01* AWS150 0.40 1.03 0.39 0.70
Grapes, Table 31 Intercept 131.01 43.44 3.02 0.01* AWS150 -6.53 3.05 -2.15 0.04*
Cherry 31 Intercept 105.10 45.95 2.29 0.03* AWS150 -4.20 2.60 -1.61 0.12
Grapes, NR 79 Intercept 50.66 17.64 2.87 0.01* AWS150 -2.19 1.13 -1.94 0.06
Wheat, Silage 34 Intercept -132.50 38.30 -3.46 0.00* AWS150 3.01 2.22 1.36 0.18
Nitrogen Removed (R) There is no relationship between R and AWS 150 (Table 9). As with the A-R analysis, the intercepts are significant in almost every crop, the exceptions being raisin grapes, table grapes,
and cherries. There are several significant AWS 150 regression coefficients, and for almonds, the coefficient is positive indicating that a higher AWS 150 value results in a higher yield and
therefore a larger amount of nitrogen removed. The coefficient for wheat silage is negative, indicating that higher water holding capacity resulted in lower yields and a lower amount of
nitrogen removed. All other coefficients are not significantly different from 0 indicating no relationship between water holding capacity and yield.
Table 9. Simple linear regression results for crop-specific models of R ~ AWS150 using 2018 CY data for the top 13 crops. An asterisk indicates a significant relationship.
MODEL N PARCELS COEFFICIENT ESTIMATE STD. ERROR T VALUE P-VALUE
Almonds 4614 Intercept 132.87 3.20 41.59 <0.00* AWS150 0.78 0.19 4.02 0.00*
Walnuts 616 Intercept 65.08 5.62 11.59 <0.00* AWS150 0.21 0.31 0.69 0.49

ESJWQC Annual Management Practice Implementation and Nitrogen Application Report August 1, 2019
23
MODEL N PARCELS COEFFICIENT ESTIMATE STD. ERROR T VALUE P-VALUE
Grapes, Wine 488 Intercept 36.69 3.08 11.90 <0.00* AWS150 0.24 0.19 1.27 0.20
Corn, Silage 361 Intercept 235.82 14.86 15.87 <0.00* AWS150 -1.02 0.88 -1.16 0.25
Pistachios 404 Intercept 72.95 10.71 6.81 0.00* AWS150 -0.33 0.72 -0.46 0.65
Oats, Silage 191 Intercept 157.85 22.75 6.94 0.00* AWS150 0.47 1.36 0.35 0.73
Sweet Potatoes 316 Intercept 116.36 11.59 10.04 <0.00* AWS150 -0.48 0.79 -0.61 0.54
Grapes, Raisins 167 Intercept 18.26 14.42 1.27 0.21 AWS150 1.76 1.00 1.76 0.08
Peaches, Processing 116 Intercept 37.84 5.90 6.41 0.00* AWS150 0.158 0.34 0.46 0.65
Grapes, Table 31 Intercept 8.52 11.32 0.75 0.46 AWS150 0.71 0.79 0.89 0.38
Cherry 31 Intercept 7.30 14.49 0.50 0.62 AWS150 0.23 0.82 0.28 0.78
Grapes, NR 79 Intercept 24.14 5.95 4.06 0.00* AWS150 0.59 0.38 1.56 0.12
Wheat, Silage 34 Intercept 287.75 40.51 7.10 0.00* AWS150 -6.30 2.34 -2.69 0.01*
Conclusions This is the first year the Coalition is using the AWS 150 metric as a measure of leaching potential of the soil. Although some of the regression analyses indicates that higher values of AWS 150 (higher water holding potential and characteristic of clayey soils with low porosity) are associated
with lower values of A-R, the results are not consistent across all crops evaluated. Currently, the results are inconclusive and there is no simple relationship between soils and leaching potential
(as measured by A-R). These results could be a result of misreporting or because growers implement management practices that obscure a simple relationship between soil properties and
leaching potential.
The data evaluated for this analysis are still based on the reporting requirements of the NMP SR.
In 2020, the Coalition receives nitrogen data as a part of the INMP SR, which requires additional information about nitrogen application sources and irrigation and nitrogen management.
In addition, the Coalition will request that members in HVAs complete an MPIR, which, over the
next few years, will provide additional information on management practices from growers of the crops used in these analyses. Finally, as growers become more competent in their reporting, and
the level of misreporting drops, data quality will improve. If a relationship between soils and leaching potential exists, it will likely emerge in future analyses.
Irrigation and Nitrogen Management Practices The Coalition will provide an analysis on management practices and nitrogen applied and removed data in the July 1, 2020 report. The Coalition did not conduct an analysis of nitrogen and irrigation practices compared to data reported on the NMP SR due to the most recent nitrogen and
irrigation practices being reported from 2017. The association of irrigation and nitrogen

ESJWQC Annual Management Practice Implementation and Nitrogen Application Report August 1, 2019
24
management practices from 2017 FEs to 2018 NMP SRs is inadequate for inferring any
relationship.
Beginning with reporting for the 2019 CY, INMP SRs returned by growers will include irrigation and nitrogen management practices directly associated with the reported nitrogen applied and
yield data. Future analyses will be able to draw more meaningful conclusions regarding the relationship between nitrogen data and management practices once these data are consistently
reported and can be reliably compared.
Caveats There are several caveats that compromise our interpretation of the results including:
1. Even with an NMP SR return rate of 88%, many crops still have only a few (ten or less) MUs with multiple years of data that meet the criteria to conduct the multi-year AR
calculations. The identification of outliers in these cases is not a meaningful evaluation.
2. Some of the reported information is clearly in error. The Coalition made every effort to
flag data with QC concerns. It is likely that some errors were not identified which now contribute to the variability and uncertainty of the data. All summary statistics, box and
whisker plots, and outliers, could change as better data become available over time.
3. The Coalition has made a concerted effort to verify the CN coefficients used in this report. However, Dr. Daniel Geisseler, the author of the document from which the CN coefficients
were obtained, points out that a large number of the coefficients are only rough estimates, and it is unknown the extent to which some values are a good representation of nitrogen
removal in the Central Valley. In addition, there are uncertainties in the reporting of the yield by the growers that make it difficult to apply appropriate CN coefficients.
4. The association of soils characteristics to specific APN is inexact. Soil types can vary
substantially even within a single field. Even though the Coalition changed the soil parameter being analyzed to allow for more reliable aggregation across larger areas, it is
difficult to assign representative soils properties to entire parcels with any degree of precision.
NITROGEN USE EVALUATION PACKETS
The Coalition informs its members about the potential effects of nitrogen applications on
groundwater quality by mailing Nitrogen Use Evaluation Packets to each member for whom NMP data were received and analyzed.
In April of 2019, the Coalition mailed Nitrogen Use Evaluation Packets for 2017 CY data to 2,418
growers. An example of the packet that these growers received is provided in Appendix III. These packets included the NMP SR data reported for the 2017 CY, summary statistics by crop type for
all MUs across the Coalition, nitrogen removal estimates for crops with available R values, bell curves comparing each member’s MUs to others reporting on the same crop across the Coalition.
The Nitrogen Use Evaluations are meant to illustrate nitrogen use efficiency for each grower who has the potential to leach nitrates into groundwater. The analysis places each of these grower’s
practices within the context of other growers of the same commodity in the Coalition.

ESJWQC Annual Management Practice Implementation and Nitrogen Application Report August 1, 2019
25
Additionally, reporting the data back to each grower provides the opportunity for growers to
address any data quality concerns that may not have been identified in the quality control and follow-up processes outlined above. Growers are encouraged to contact the Coalition with data change requests, questions, and concerns with their Nitrogen Use Evaluation, and as such, the
packets will aid in more accurate and comprehensive data over time.
Packets containing the result of the current analysis will be mailed to growers in early 2020.
Outliers identified using the adjusted IQR method will be alerted to the status of their parcels as outliers within these packets. Per the ESJWQC Order, outliers for the 2018 CY will be subject to
additional certification requirements. Members will receive notification if they will need to attend additional INMP self-certification trainings or have their next INMP certified by a specialist in
irrigation and nitrogen management. They may also be the focus of additional ESJWQC education and outreach and be required to complete a GW MPIR survey as described above in the
Management Practice Implementation Reports section.

ESJWQC Annual Management Practice Implementation and Nitrogen Application Report August 1, 2019
26
REFERENCES "California Fertilization Guidelines for Strawberries." Fertilizer Research and Education Program.
California Department of Food and Agriculture.
<https://apps1.cdfa.ca.gov/FertilizerResearch/docs/Strawberry.html>.
Geisseler, D. 2016. Nitrogen concentrations in harvested plant parts – A literature overview. Available online:
https://apps1.cdfa.ca.gov/FertilizerResearch/docs/Geisseler_Report_2016_12_02.pdf (Accessed July 1, 2019).
Hubert, M., E. Vandervieren. 2008. An adjusted boxplot for skewed distributions. Computational
Statistics & Data Analysis 52 (12): 5186-5201.
R Core Team. 2016. R: A language and environment for statistical computing. R Foundation for
Statistical Computing, Vienna, Austria. https://www.R-project.org/.
Tukey, J. W. 1977. Exploratory data analysis. Reading, Mass: Addison-Wesley Pub. Co.

Appendix I SURFACE WATER MANAGEMENT PRACTICE IMPLEMENTATION REPORT TEMPLATE

PLEASE RETURN TO COALITION
Page 1 of 9 ESJWQC SW MPIR Template – November 8, 2018
[MemberID]
[Subwatershed]
[Year]
Management Practice Implementation Report
ESJWQC Member ID# [Prepopulated]
Date: _____________________
Attendees: ____________________________________ ____________________________________
____________________________________ ____________________________________
____________________________________ ____________________________________
Packet Contents
Member Watershed Parcel Information ........................................................................................................... 3
Decision for Targeting Grower…………………………………...………………………………………………….…..3
Watershed Exceedance Tally .......................................................................................................................... 3
Map – [Subwatershed] Member Parcels in Relation to Monitoring Locations ................................................... 4
Map – [Subwatershed] Member Number Parcels............................................................................................. 5
Irrigation, Storm, and Erosion Management Questions .................................................................................... 6
Pest / Dormant Spray Management and Irrigated Pasture Questions .............................................................. 7
Information Request and Notes ....................................................................................................................... 8
NOTIFICATION:
The management practices discussed during initial meetings will be recorded and participating members will be
questioned in one year to determine which, if any, new practices were implemented. This information will be
used to evaluate water quality monitoring results to assess any trends/associations between water quality and
improved management practices.

Page 2 of 9 ESJWQC SW MPIR Template – November 8, 2018
[MemberID]
Table 1. Parcel Information. [prepopulated with enrolled parcel information]
APN(s) Commodity Enrolled Irrigated
Acres
Total Acres
Table 2: Decision for Targeting Member. [prepopulated with yes/no for the questions below to indicate why
the member is receiving the MPIR]
Questions Used to Determine Contact List Yes No
Member parcel(s) located in a watershed that will not meet 10-year compliance deadline for a
management plan constituent?
Member parcel(s) have the potential to drain to the waterbody?*
Member parcel(s) irrigated agriculture and not “pastureland only.”
Member’s 2017 Farm Evaluation outstanding?
Member parcel(s) are directly associated via Ag Permits with recent exceedances (Indicated in Table 3).
*The Coalition defines the potential to drain as being located within 200 yards from a body of water.
Table 3. [Site Subwatershed] Management Plan constituent exceedances. October 2015 - July 2018.
Sample Date Chlorpyrifos,
>0.015 µg/L Malathion, ND
Copper, dissolved
(hardness based
WQTL)
11/7/2017 1.7 (1.67)
6/12/2018 0.025 0.03
7/10/2018 4.8 (4.6)
2016-2018 Total Exceedances 1 1 2
2004-2018 Total Exceedances 4 1 26

Page 3 of 9 ESJWQC SW MPIR Template – November 8, 2018
[MemberID]
Figure 1. Member parcels selected for focused outreach in relation to monitoring location [map included showing the member parcels receiving an
MPIR relative to the monitoring location; member parcels are identified in a legend associated with the map].

Page 4 of 9 ESJWQC SW MPIR Template – November 8, 2018
[MemberID]
Figure 2. Map of member parcels. [map of only the member parcels zoomed into identify the APN, TRS, and nearby roads] The 9-digit numbers are APNs and 7-digit numbers are the TRSs associated with the parcel(s).

PLEASE RETURN TO COALITION
Page 5 of 9 ESJWQC SW MPIR Template – November 8, 2018
[MemberID]
Management Practice Implementation Report
Irrigation Questions
1. Irrigation System:
Surface
Sprinkler
Microirrigation
Drip
None
Other:
2. Do you have irrigation drainage?
Yes
No
Notes:
3. Irrigation management practices:
N/A Already
Implemented Recommended
Laser leveled fields
Use drainage basins (sediment ponds) to capture and retain runoff
Recirculation – tail water return system
Use of polyacrylamide (PAM) to increase water infiltration and reduce furrow erosion
4. Which do you base your irrigation schedule on:
Irrigation district deliveries
Actual moisture levels in soil/crop needs
Storm Drainage Questions
1. When do you have storm water drainage from your field (select one option)?
Only in heavy storms (For Example: > 3 inches of precipitation over 24 hours)
After soil is saturated in late winter
On most rain events (For Example: > 0.25 inches of precipitation over 24 hours)
No storm drainage
2. How are you able to manage storm drainage, if you have any?
N/A Already
Implemented Recommended
Settling pond
Recirculation – tail water return system
Pump/Drain into waterway - able to control timing of release
Pump/Drain into waterway - NOT able to control timing of release
Berms between fields/waterway are able to control water

PLEASE RETURN TO COALITION
Page 6 of 9 ESJWQC SW MPIR Template – November 8, 2018
[MemberID]
Erosion and Sediment Question
1. Sediment management practices:
N/A Already
Implemented Recommended
Vegetation is planted or allowed to grow in and along ditches
Maintain vegetated filter strips around field perimeter at least 10’ wide
Constructed wetlands
Grass row centers (orchards, vineyards)
Pest Management Questions
1. Spray mangement practices :
N/A Already
Implemented Recommended
Adjust spray nozzles to match crop canopy profile
Outside nozzles shut off when spraying outer rows next to sensitive sites
Use of nozzles that provide the largest effective droplet size to minimize drift
Spray areas close to waterbodies when the wind is blowing away from the waterbody
Use of electronically controlled spray nozzles
Use air blast applications when wind is between 3-10 mph upwind of sensitive sites
2. How often is spray equipment calibrated?
Prior to each application
Once per month
Once per year
Never
3. Do you follow pesticide label restrictions especially related to timing of application and timing of irrigation?
Yes
No Not Applicable because:
4. Do you plan to use any of the following? If so, which crops are chemicals applied to? The active ingredients listed below are chemicals that have been or are currently under a management plan for this site subwatershed. Chemicals in red text are currently in a management plan within the subwatershed. [Updated based on site and management plans]
Dormant
Season
Irrigation
Season
Plan to use
in future? Crops Applied To:
[Chlorpyrifos]
[Copper]
[Diazinon]
[Diuron]
[Malathion]

PLEASE RETURN TO COALITION
Page 7 of 9 ESJWQC SW MPIR Template – November 8, 2018
[MemberID]
Dormant Spray Management Questions
1. How many acres are sprayed with dormant insecticides? _____________________________________
2. Prior to applying winter dormant sprays, what is the condition of your orchard floor?
Vegetative cover
Vegetative cover with sprayed berms
No vegetation and not disked
Some vegetation
Disked
3. Do you apply when soil moisture is at field capacity?
Yes
No Not Applicable because:
4. Dormant spray management practices:
N/A Already
Implemented Recommended
Check weather conditions prior to spraying (precipitation status)
Maintain setbacks
5. Have you been informed of DPR’s Dormant Spray Regulations?
Yes
No
Information Request
I would like information about:
Best Management Practices (BMPs) to protect water quality
Potential funding to install BMPs
Other ___________________________________________
Notes

PLEASE RETURN TO COALITION
Page 8 of 9 ESJWQC SW MPIR Template – November 8, 2018
[MemberID]
REQUIRED Follow-Up Survey to On-Farm Visit
This survey is in follow-up to the meeting on [Date] for the following property near [Site Subwatershed]. Based on the information received during your meeting with [Coalition Representative Name], the Coalition would like to know if you implemented additional management practices to address recent exceedances in the site subwatershed.
Survey responses for which you selected N/A on the initial Management Practice Implementation Report are
shown below by category. Check the box for anything you have changed since meeting with Coalition
representatives. Fill out the bottom of the page if you were recommended additional practices.
Attendee(s):
[Member/Member Representative Name], [Coalition Representative Name]
Parcel Number Acreage [XXX-XX-XXX] [XX]
Section 1: Irrigation Water Management
Irrigation Management Practices: Original Response Change
Laser leveled fields Recommended
Use drainage basins (sediment ponds) to capture and retain runoff N/A
Recirculation - Tailwater return system N/A
Use of Polyacrylamide (PAM) to increase water infiltration and reduce furrow erosion
N/A
Section 2: Storm Drainage
How are you able to manage storm drainage? Original Response Change
Settling Pond N/A
Recirculation – Tailwater return system N/A
Pump/Drain into waterway & able to control timing N/A
Berms between field and waterway (install and/or improve) N/A
Section 3: Erosion & Sediment Management
Sediment Management Practices: Original Response Change
Maintain vegetated filter strips around field perimeter at least 10’ wide Recommended
Constructed wetlands N/A
Section 4: Pest Management
Spray Management Practices: Original Response Change
Adjust spray nozzles to match crop canopy profile N/A
Use of nozzles that provide the largest effective droplet size to minimize drift Recommended
Use electronic controlled sprayer nozzles N/A

PLEASE RETURN TO COALITION
Page 9 of 9 ESJWQC SW MPIR Template – November 8, 2018
[MemberID]
Did you implement the recommended practices? (If Any) _________________________
If not, why not? If planning, when?

Appendix II NMP SR EVALUATIONS OF NITROGEN APPLIED AND NITROGEN REMOVED DATA BY CROP (2018 CROP YEAR)

ESJWQC Annual Management Practice Implementation and Nitrogen Application Report i Appendix II
TABLE OF CONTENTS
List of Figures..................................................................................................................................................................... i List of Tables ..................................................................................................................................................................... v Introduction ...................................................................................................................................................................... 1
I. Alfalfa ..................................................................................................................................................................... 2 II. Almonds ................................................................................................................................................................ 6 III. Apples .................................................................................................................................................................... 9 IV. Apricots .............................................................................................................................................................. 11 V. Beans, Dry, Black-Eyed ................................................................................................................................. 13 VI. Berries ................................................................................................................................................................ 15 VII. Cherries ......................................................................................................................................................... 18 VIII. Citrus .............................................................................................................................................................. 21 IX. Corn ..................................................................................................................................................................... 27 X. Cotton ................................................................................................................................................................. 31 XI. Figs ....................................................................................................................................................................... 35 XII. Forage Grass, Hay ...................................................................................................................................... 38 XIII. Grapes ............................................................................................................................................................ 40 XIV. Greens ............................................................................................................................................................ 51 XV. Nectarines .................................................................................................................................................... 56 XVI. Oats ................................................................................................................................................................ 58 XVII. Olives ............................................................................................................................................................. 64 XVIII. Onions ............................................................................................................................................................ 66 XIX. Peaches .......................................................................................................................................................... 68 XX. Pecans ............................................................................................................................................................ 75 XXI. Pistachios ...................................................................................................................................................... 77 XXII. Plums .............................................................................................................................................................. 80 XXIII. Pomegranate ............................................................................................................................................... 82 XXIV. Prunes ....................................................................................................................................................... 85 XXV. Pumpkins ...................................................................................................................................................... 88 XXVI. Small Grains ............................................................................................................................................. 90 XXVII. Sorghum and Sudan .............................................................................................................................. 92 XXVIII. Sweet Potatoes ...................................................................................................................................... 94 XXIX. Tomatoes ...................................................................................................................................................... 97 XXX. Walnuts ...................................................................................................................................................... 101 XXXI. Wheat.......................................................................................................................................................... 104 XXXII. Other crops........................................................................................................................................... 107
LIST OF FIGURES
Figure I-1. Box and Whisker plot of multi-year A/R for Alfalfa, Hay parcels. ............................................. 2 Figure I-2. Histogram plot of A/R values for Alfalfa, Hay for the 2018 Crop Year. .................................. 3 Figure I-3. Histogram plot of multi-year A/R values for Alfalfa, Hay. ........................................................... 3 Figure I-4. Histogram plot of A-R values for Alfalfa, Hay for the 2018 Crop Year. .................................. 4 Figure I-5. Histogram plot of multi-year A-R values for Alfalfa, Hay. ........................................................... 4 Figure I-6. Histogram plot of A/R values for Alfalfa, Haylage for the 2018 Crop Year. .......................... 5 Figure I-7. Histogram plot of A-R values for Alfalfa, Haylage for the 2018 Crop Year. .......................... 5

ESJWQC Annual Management Practice Implementation and Nitrogen Application Report ii Appendix II
Figure II-1. Box and Whisker plot of multi-year A/R for Almonds parcels. ................................................. 6 Figure II-2. Histogram plot of A/R values for Almonds for the 2018 Crop Year. ...................................... 7 Figure II-3. Histogram plot of multi-year A/R values for Almonds. ............................................................... 7 Figure II-4. Histogram plot of A-R values for Almonds for the 2018 Crop Year. ...................................... 8 Figure II-5. Histogram plot of multi-year A-R values for Almonds. ............................................................... 8 Figure III-1. Histogram plot of A/R values for Apples for the 2018 Crop Year. ........................................ 9 Figure III-2. Histogram plot of A-R values for Apples for the 2018 Crop Year. ...................................... 10 Figure IV-1. Histogram plot of A/R values for Apricots for the 2018 Crop Year. .................................. 11 Figure IV-2. Histogram plot of A-R values for Apricots for the 2018 Crop Year. .................................. 12 Figure V-1. Histogram plot of A/R values for Beans, Dry, Black-Eyed for the 2018 Crop Year. ...... 13 Figure V-2. Histogram plot of A-R values for Beans, Dry, Black-Eyed for the 2018 Crop Year. ...... 14 Figure VI-1. Histogram plot of A/R values for Berry, Blueberry for the 2018 Crop Year. .................. 15 Figure VI-2. Histogram plot of A-R values for Berry, Blueberry for the 2018 Crop Year. .................. 16 Figure VI-3. Histogram plot of A/R values for Berry, Strawberry for the 2018 Crop Year. ............... 16 Figure VI-4. Histogram plot of A-R values for Strawberries for the 2018 Crop Year. ......................... 17 Figure VII-1. Box and Whisker plot of multi-year A/R for Cherry parcels. .............................................. 18 Figure VII-2. Histogram plot of A/R values for Cherries for the 2018 Crop Year. ................................ 19 Figure VII-3. Histogram plot of multi-year A/R values for Cherry. ............................................................. 19 Figure VII-4. Histogram plot of A-R values for Cherries for the 2018 Crop Year. ................................ 20 Figure VII-5. Histogram plot of multi-year A-R values for Cherry. ............................................................. 20 Figure VIII-1. Histogram plot of A-R values for Citrus, Clementines for the 2018 Crop Year. ......... 22 Figure VIII-2. Histogram plot of A/R values for Citrus, Mandarins for the 2018 Crop Year. ............ 22 Figure VIII-3. Histogram plot of A-R values for Citrus, Mandarins for the 2018 Crop Year. ............ 23 Figure VIII-4. Box and Whisker plot of multi-year A/R for Citrus, Orange parcels. .......................... 23 Figure VIII-5. Histogram plot of A/R values for Citrus, Orange for the 2018 Crop Year. ................... 24 Figure VIII-6. Histogram plot of multi-year A/R values for Citrus, Orange. ............................................ 24 Figure VIII-7. Histogram plot of A-R values for Citrus, Orange for the 2018 Crop Year. ................... 25 Figure VIII-8. Histogram plot of multi-year A-R values for Citrus, Orange. ............................................ 25 Figure VIII-9. Histogram plot of A/R values for Citrus, Tangelo for the 2018 Crop Year. .................. 26 Figure VIII-10. Histogram plot of A-R values for Citrus, Tangelo for the 2018 Crop Year. ............... 26 Figure IX-1. Histogram plot of A/R values for Corn, Grain for the 2018 Crop Year. ............................ 27 Figure IX-2. Histogram plot of A-R values for Corn, Grain for the 2018 Crop Year. ............................ 28 Figure IX-3. Box and Whisker plot of multi-year A/R for Corn, Silage parcels. ...................................... 28 Figure IX-4. Histogram plot of A/R values for Corn, Silage for the 2018 Crop Year. ........................... 29 Figure IX-5. Histogram plot of multi-year A/R values for Corn, Silage. ..................................................... 29 Figure IX-6. Histogram plot of A-R values for Corn, Silage for the 2018 Crop Year. ........................... 30 Figure IX-7. Histogram plot of multi-year A-R values for Corn, Silage. ..................................................... 30 Figure X-1. Histogram plot of A/R values for Cotton for the 2018 Crop Year. ...................................... 31 Figure X-2. Histogram plot of A-R values for Cotton for the 2018 Crop Year. ...................................... 32 Figure X-3. Histogram plot of A/R values for Cotton, Pima for the 2018 Crop Year. .......................... 32 Figure X-4. Histogram plot of A-R values for Cotton, Pima for the 2018 Crop Year. .......................... 33 Figure X-5. Histogram plot of A/R values for Cotton, Upland for the 2018 Crop Year. ...................... 33 Figure X-6. Histogram plot of A-R values for Cotton, Upland for the 2018 Crop Year. ...................... 34 Figure XI-1. Box and Whisker plot of multi-year A/R for Figs parcels. ...................................................... 35 Figure XI-2. Histogram plot of A/R values for Figs for the 2018 Crop Year. ........................................... 36 Figure XI-3. Histogram plot of multi-year A/R values for Figs. .................................................................... 36 Figure XI-4. Histogram plot of A-R values for Figs for the 2018 Crop Year. ........................................... 37 Figure XI-5. Histogram plot of multi-year A-R values for Figs. ..................................................................... 37 Figure XII-1. Histogram plot of A/R values for Forage Grass, Hay for the 2018 Crop Year. ............. 38

ESJWQC Annual Management Practice Implementation and Nitrogen Application Report iii Appendix II
Figure XII-2. Histogram plot of A-R values for Forage Grass, Hay for the 2018 Crop Year. ............. 39 Figure XIII-1. Histogram plot of A/R values for Grapes, NR for the 2018 Crop Year. .......................... 41 Figure XIII-2. Histogram plot of A-R values for Grapes, NR for the 2018 Crop Year. .......................... 41 Figure XIII-3. Box and Whisker plot of multi-year A/R for Grapes, Raisin parcels. ............................... 42 Figure XIII-4. Histogram plot of A/R values for Grapes, Raisins for the 2018 Crop Year. .................. 43 Figure XIII-5. Histogram plot of multi-year A/R values for Grapes, Raisins. ........................................... 43 Figure XIII-6. Histogram plot of A-R values for Grapes, Raisins for the 2018 Crop Year. .................. 44 Figure XIII-7. Histogram plot of multi-year A-R values for Grapes, Raisins. ........................................... 44 Figure XIII-8. Box and Whisker plot of multi-year A/R for Grapes, Table parcels. ................................ 45 Figure XIII-9. Histogram plot of A/R values for Grapes, Table for the 2018 Crop Year. ..................... 46 Figure XIII-10. Histogram plot of multi-year A/R values for Grapes, Table............................................. 46 Figure XIII-11. Histogram plot of A-R values for Grapes, Table for the 2018 Crop Year. .................. 47 Figure XIII-12. Histogram plot of multi-year A-R values for Grapes, Table. ............................................ 47 Figure XIII-13. Box and Whisker plot of multi-year A/R for Grapes, Wine parcels. ............................. 48 Figure XIII-14. Histogram plot of A/R values for Grapes, Wine for the 2018 Crop Year. .................. 49 Figure XIII-15. Histogram plot of multi-year A/R values for Grapes, Wine. ............................................ 49 Figure XIII-16. Histogram plot of A-R values for Grapes, Wine for the 2018 Crop Year. ................... 50 Figure XIII-17. Histogram plot of multi-year A-R values for Grapes, Wine. ............................................ 50 Figure XIV-1. Histogram plot of A/R values for Kale for the 2018 Crop Year. ....................................... 52 Figure XIV-2. Histogram plot of A-R values for Kale for the 2018 Crop Year. ....................................... 52 Figure XIV-3. Histogram plot of A/R values for Lettuce for the 2018 Crop Year. ................................. 53 Figure XIV-4. Histogram plot of A-R values for Lettuce for the 2018 Crop Year. ................................. 53 Figure XIV-5. Histogram plot of A/R values for Mustard Greens for the 2018 Crop Year. ............... 54 Figure XIV-6. Histogram plot of A-R values for Mustard Greens for the 2018 Crop Year. ............... 54 Figure XIV-7. Histogram plot of A/R values for Spinach for the 2018 Crop Year. ................................ 55 Figure XIV-8. Histogram plot of A-R values for Spinach for the 2018 Crop Year. ................................ 55 Figure XV-1. Histogram plot of A/R values for Nectarines for the 2018 Crop Year. ........................... 56 Figure XV-2. Histogram plot of A-R values for Nectarines for the 2018 Crop Year. ........................... 57 Figure XVI-1. Histogram plot of A/R values for Oats, Grain for the 2018 Crop Year. ......................... 59 Figure XVI-2. Histogram plot of A-R values for Oats, Grain for the 2018 Crop Year. ......................... 59 Figure XVI-3. Histogram plot of A/R values for Oats, Hay for the 2018 Crop Year. ............................ 60 Figure XVI-4. Histogram plot of A-R values for Oats, Hay for the 2018 Crop Year. ............................ 60 Figure XVI-5. Box and Whisker plot of multi-year A/R for Oats, Silage parcels. ................................... 61 Figure XVI-6. Histogram plot of A/R values for Oats, Silage for the 2018 Crop Year. ......................... 62 Figure XVI-7. Histogram plot of multi-year A/R values for Oats, Silage. .................................................. 62 Figure XVI-8. Histogram plot of A-R values for Oats, Silage for the 2018 Crop Year. ......................... 63 Figure XVI-9. Histogram plot of multi-year A-R values for Oats, Silage. .................................................. 63 Figure XVII-1. Histogram plot of A/R values for Olives for the 2018 Crop Year. .................................. 64 Figure XVII-2. Histogram plot of A-R values for Olives for the 2018 Crop Year. .................................. 65 Figure XVIII-1. Histogram plot of A/R values for Onions, Bulb for the 2018 Crop Year. .................... 66 Figure XVIII-2. Histogram plot of A-R values for Onions, Bulb for the 2018 Crop Year. .................... 67 Figure XIX-1. Box and Whisker plot of multi-year A/R for Peaches, Fresh Market parcels. ............. 68 Figure XIX-2. Histogram plot of A/R values for Peaches, Fresh Market for the 2018 Crop Year.... 69 Figure XIX-3. Histogram plot of multi-year A/R values for Peaches, Fresh Market. ............................ 69 Figure XIX-4. Histogram plot of A-R values for Peaches, Fresh Market for the 2018 Crop Year. ... 70 Figure XIX-5. Histogram plot of multi-year A-R values for Peaches, Fresh Market. ............................ 70 Figure XIX-6. Histogram plot of A/R values for Peaches, NR for the 2018 Crop Year. ....................... 71 Figure XIX-7. Histogram plot of A-R values for Peaches, NR for the 2018 Crop Year. ....................... 71 Figure XIX-8. Box and Whisker plot of multi-year A/R for Peaches, Processing parcels. ................... 72

ESJWQC Annual Management Practice Implementation and Nitrogen Application Report iv Appendix II
Figure XIX-9. Histogram plot of A/R values for Peaches, Processing for the 2018 Crop Year. ........ 73 Figure XIX-10. Histogram plot of multi-year A/R values for Peaches, Processing. ............................... 73 Figure XIX-11. Histogram plot of A-R values for Peaches, Processing for the 2018 Crop Year. ..... 74 Figure XIX-12. Histogram plot of multi-year A-R values for Peaches, Processing. ............................... 74 Figure XX-1. Histogram plot of A/R values for Pecans for the 2018 Crop Year. ................................... 75 Figure XX-2. Histogram plot of A-R values for Pecans for the 2018 Crop Year..................................... 76 Figure XXI-1. Box and Whisker plot of multi-year A/R for Pistachios parcels. ....................................... 77 Figure XXI-2. Histogram plot of A/R values for Pistachios for the 2018 Crop Year. ............................ 78 Figure XXI-3. Histogram plot of multi-year A/R values for Pistachios. ..................................................... 78 Figure XXI-4. Histogram plot of A-R values for Pistachios for the 2018 Crop Year. ............................ 79 Figure XXI-5. Histogram plot of multi-year A-R values for Pistachios. ..................................................... 79 Figure XXII-1. Histogram plot of A/R values for Plums for the 2018 Crop Year. .................................. 80 Figure XXII-2. Histogram plot of A-R values for Plums for the 2018 Crop Year. ................................... 81 Figure XXIII-1. Box and Whisker plot of multi-year A/R for Pomegranate parcels. ............................. 82 Figure XXIII-2. Histogram plot of A/R values for Pomegranates for the 2018 Crop Year. ................ 83 Figure XXIII-3. Histogram plot of multi-year A/R values for Pomegranates. .......................................... 83 Figure XXIII-4. Histogram plot of A-R values for Pomegranates for the 2018 Crop Year. ................ 84 Figure XXIII-5. Histogram plot of multi-year A-R values for Pomegranates. .......................................... 84 Figure XXIV-1. Box and Whisker plot of multi-year A/R for Prune parcels. ............................................ 85 Figure XXIV-2. Histogram plot of A/R values for Prunes for the 2018 Crop Year. ............................... 86 Figure XXIV-3. Histogram plot of multi-year A/R values for Prunes. ........................................................ 86 Figure XXIV-4. Histogram plot of A-R values for Prunes for the 2018 Crop Year. ............................... 87 Figure XXIV-5. Histogram plot of multi-year A-R values for Prunes. ........................................................ 87 Figure XXV-1. Histogram plot of A/R values for Pumpkins for the 2018 Crop Year. ........................... 88 Figure XXV-2. Histogram plot of A-R values for Pumpkins for the 2018 Crop Year. ........................... 89 Figure XXVI-1. Histogram plot of A/R values for Small Grains (Excl Wheat and Oats), Grain for the
2018 Crop Year. ............................................................................................................................................. 90 Figure XXVI-2. Histogram plot of A-R values for Small Grains (Excl Wheat and Oats), Grain for the
2018 Crop Year. ............................................................................................................................................. 91 Figure XXVII-1. Histogram plot of A/R values for Sorghum and Sudan, Silage for the 2018 Crop
Year. ................................................................................................................................................................... 92 Figure XXVII-2. Histogram plot of A-R values for Sorghum and Sudan, Silage for the 2018 Crop
Year. ................................................................................................................................................................... 93 Figure XXVIII-1. Box and Whisker plot of multi-year A/R for Sweet Potatoes parcels. ...................... 94 Figure XXVIII-2. Histogram plot of A/R values for Sweet Potatoes for the 2018 Crop Year. ........... 95 Figure XXVIII-3. Histogram plot of multi-year A/R values for Sweet Potatoes. .................................... 95 Figure XXVIII-4. Histogram plot of A-R values for Sweet Potatoes for the 2018 Crop Year. ........... 96 Figure XXVIII-5. Histogram plot of multi-year A-R values for Sweet Potatoes. .................................... 96 Figure XXIX-1. Histogram plot of A/R values for Tomatoes, Fresh Market for the 2018 Crop Year.
.............................................................................................................................................................................. 98 Figure XXIX-2. Histogram plot of A-R values for Tomatoes, Fresh Market for the 2018 Crop Year.
.............................................................................................................................................................................. 98 Figure XXIX-3. Histogram plot of A/R values for Tomatoes, NR for the 2018 Crop Year. ................. 99 Figure XXIX-4. Histogram plot of A-R values for Tomatoes, NR for the 2018 Crop Year. ................. 99 Figure XXIX-5. Histogram plot of A/R values for Tomatoes, Processing for the 2018 Crop Year.100 Figure XXIX-6. Histogram plot of A-R values for Tomatoes, Processing for the 2018 Crop Year.100 Figure XXX-1. Box and Whisker plot of multi-year A/R for Walnuts parcels....................................... 101 Figure XXX-2. Histogram plot of A/R values for Walnuts for the 2018 Crop Year. ........................... 102 Figure XXX-3. Histogram plot of multi-year A/R values for Walnuts. .................................................... 102
ESJWQC Annual Management Practice Implementation and Nitrogen Application Report v Appendix II
Figure XXX-4. Histogram plot of A-R values for Walnuts for the 2018 Crop Year. ........................... 103 Figure XXX-5. Histogram plot of multi-year A-R values for Walnuts. .................................................... 103 Figure XXXI-1. Histogram plot of A/R values for Wheat, Grain for the 2018 Crop Year. ............... 105 Figure XXXI-2. Histogram plot of A-R values for Wheat, Grain for the 2018 Crop Year. ................ 105 Figure XXXI-3. Histogram plot of A/R values for Wheat, Silage for the 2018 Crop Year. ............... 106 Figure XXXI-4. Histogram plot of A-R values for Wheat, Silage for the 2018 Crop Year. ............... 106
LIST OF TABLES
Table 1. Crops evaluated for outliers for the 2018 crop year. ........................................................................ 1 Table I-1. Summary statistics for Alfalfa. ................................................................................................................ 2 Table II-1. Summary statistics for Almond. ............................................................................................................ 6 Table III-1. Summary statistics for Apples. ............................................................................................................. 9 Table IV-1. Summary statistics for Apricots. ...................................................................................................... 11 Table V-1. Summary statistics for Beans, Dry, Black-Eyed. ........................................................................... 13 Table VI-1. Summary statistics for Berries. ......................................................................................................... 15 Table VII-1. Summary statistics for Cherries. ..................................................................................................... 18 Table VIII-1. Summary statistics for Citrus. ........................................................................................................ 21 Table IX-1. Summary statistics for Corn. ............................................................................................................. 27 Table X-1. Summary statistics for Cotton. ........................................................................................................... 31 Table XI-1. Summary statistics for Figs. ............................................................................................................... 35 Table XII-1. Summary statistics for Forage Grass, Hay. .................................................................................. 38 Table XIII-1. Summary statistics for Grapes. ...................................................................................................... 40 Table XIV-1. Summary statistics for Greens. ...................................................................................................... 51 Table XV-1. Summary statistics for Nectarines. ................................................................................................ 56 Table XVI-1. Summary statistics for Oats. ........................................................................................................... 58 Table XVII-1. Summary statistics for Olives. ...................................................................................................... 64 Table XVIII-1. Summary statistics for Onions, Bulb. ........................................................................................ 66 Table XIX-1. Summary statistics for Peaches. .................................................................................................... 68 Table XX-1. Summary statistics for Pecans. ........................................................................................................ 75 Table XXI-1. Summary statistics for Pistachios. ................................................................................................ 77 Table XXII-1. Summary statistics for Plums. ....................................................................................................... 80 Table XXIII-1. Summary statistics for Pomegranate. ....................................................................................... 82 Table XXIV-1. Summary statistics for Prunes. ................................................................................................... 85 Table XXV-1. Summary statistics for Pumpkins. ............................................................................................... 88 Table XXVI-1. Summary statistics for Small Grains. ........................................................................................ 90 Table XXVII-1. Summary statistics for Sorghum and Sudan. ........................................................................ 92 Table XXVIII-1. Summary statistics for Sweet Potatoes. ............................................................................... 94 Table XXIX-1. Summary statistics for Tomatoes. .............................................................................................. 97 Table XXX-1. Summary statistics for Walnuts. ............................................................................................... 101 Table XXXI-1. Summary statistics for Wheat. ................................................................................................. 104 Table XXXII-1Summary statistics for crops with limited representation in the ESJWQC region. 107

ESJWQC Annual Management Practice Implementation and Nitrogen Application Report Appendix II
1
INTRODUCTION This appendix comprises the Coalition’s evaluation of single-year and multi-year AR metrics by
crop. Each section contains summary statistics and plots for a unique crop type, though a single crop can contain multiple specific crops (e.g., alfalfa, hay and alfalfa, silage). Some unique crops did not have sufficient data to calculate statistics and/or generate images. These crops are listed in
the “Other Crops” section.
The focus of this appendix is to report summary statistics representing the relationship between
nitrogen applied and nitrogen removed. Therefore, the analysis does not include management units with crops that were not harvested in 2018 (e.g., no yield reported). As such, the total
acreage and number of parcels reported for each crop here may or may not match the acreage for all the received summary reports.
Each section contains summary statistic calculations for each crop in the Coalition region.
Wherever enough data were available, a box plot of the multi-year A/R with outliers is provided, including a count of parcels identified as outliers (Table 1). The methodology for determining
outliers is explained in the “Identification of Outliers” section of the Annual Management Practice Implementation and Nitrogen Application Report. As explained in the main document, growers
associated with parcels identified as outliers will be subject to further follow-up action by the Coalition. Each section also contains histogram plots of the data reported for single-year and
multi-year A/R ratios and A-R differences.
Table 1. Crops evaluated for outliers for the 2018 crop year. CROP N PARCELS ACREAGE N OUTLIER PARCELS
ALFALFA, HAY 100 4,595 1 ALMONDS 2,538 125,756 139
CHERRY 20 695 0 CITRUS, ORANGES 10 2,243 0
CORN, SILAGE 137 6,637 16 FIGS 9 1,420 2
GRAPES, RAISINS 70 5,578 17 GRAPES, TABLE 16 599 0 GRAPES, WINE 294 20,398 38
PEACHES, PROCESSING 61 1,867 2 PISTACHIOS 121 15,794 6
PRUNES 47 993 4 SWEET POTATOES 157 4,881 21
WALNUTS 353 11,939 1

ESJWQC Annual Management Practice Implementation and Nitrogen Application Report Appendix II
2
I. ALFALFA
Important analysis considerations: The calculation of nitrogen removed at harvest for Alfalfa, Hay assumes that 0.03115 lbs N/lbs @ 12% moisture are removed at harvest. This estimate is obtained from Geisseler (2016). The author
considers that the dataset used for this report can be considered a very good estimate for alfalfa hay produced in California. However, the range probably includes sites outside the Central Valley.
The calculation of nitrogen removed at harvest for Alfalfa, Haylage assumes that 0.012 lbs N/lbs @
65% moisture are removed at harvest. This estimate is obtained from Geisseler (2016). The author considers the estimate a very good estimate of alfalfa silage produced in California.
However, the dataset is small and more samples are needed.
Table I-1. Summary statistics for Alfalfa.
Figure I-1. Box and Whisker plot of multi-year A/R for Alfalfa, Hay parcels. The number of parcels (n), mean, and standard deviation (SD) are provided. The dotted blue line represents the medcouple upper fence. Multi-year A/R ratios exceeding the upper fence are considered outliers and are represented by red dots.
SPECIFIC CROP PARAMETER N PARCELS ACREAGE MEAN STANDARD
DEVIATION MIN MAX
N OUTLIER
PARCELS
ALFALFA, HAY
A/R 256 10,241 0.08 0.15 0 2 -- Multi-year A/R 100 4,595 0.09 0.08 0 0.56 1
A-R 197 8,557 -408 131.45 -753 78.1 -- Multi-year A-R 100 4,595 -1264 264.8 -2003 -447 --
ALFALFA, HAYLAGE
A/R 13 492 0.06 0.09 0 0.31 -- Multi-year A/R 3 111 0.12 0 0.12 0.12 --
A-R 5 189 -197 29.61 -250 -184 -- Multi-year A-R 3 111 -573 0 -573 -573 --

ESJWQC Annual Management Practice Implementation and Nitrogen Application Report Appendix II
3
Figure I-2. Histogram plot of A/R values for Alfalfa, Hay for the 2018 Crop Year.
The dotted blue line represents the mean. The number of parcels (n) and Standard deviation (SD) are provided.
Figure I-3. Histogram plot of multi-year A/R values for Alfalfa, Hay. The dotted blue line represents the mean. The number of parcels (n) and Standard deviation (SD) are provided.

ESJWQC Annual Management Practice Implementation and Nitrogen Application Report Appendix II
4
Figure I-4. Histogram plot of A-R values for Alfalfa, Hay for the 2018 Crop Year. The dotted blue line represents the mean. The number of parcels (n) and Standard deviation (SD) are provided.
Figure I-5. Histogram plot of multi-year A-R values for Alfalfa, Hay. The dotted blue line represents the mean. The number of parcels (n) and Standard deviation (SD) are provided.
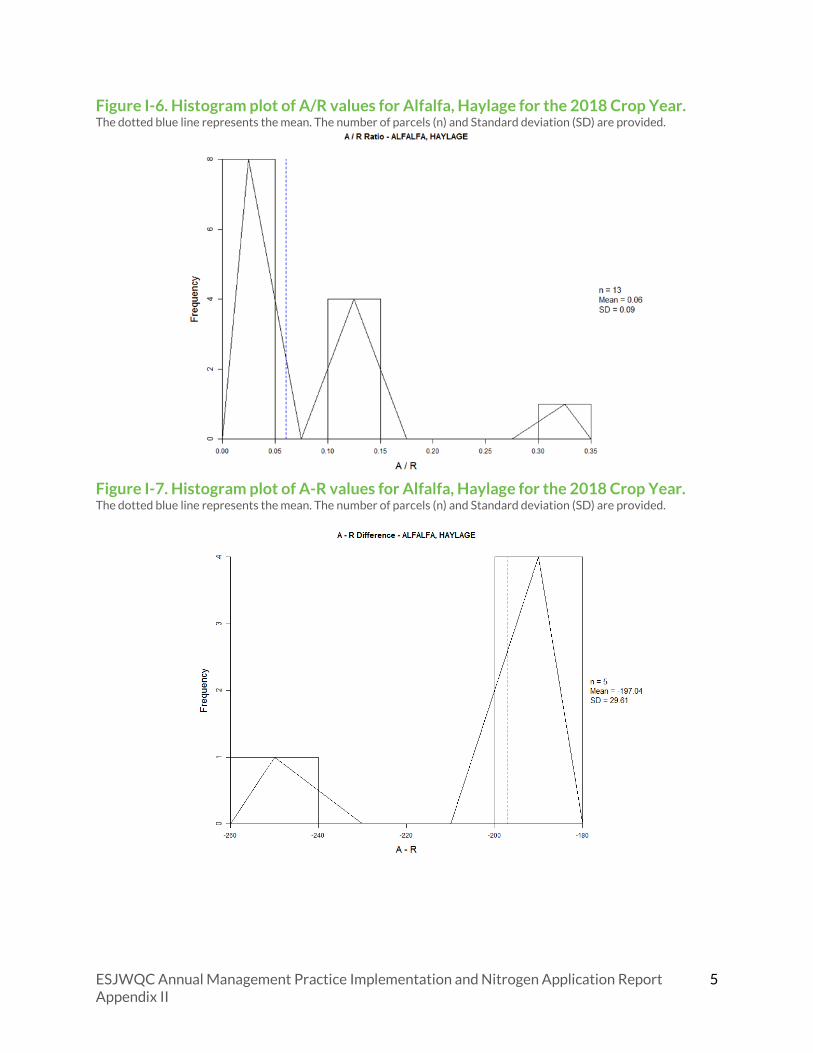
ESJWQC Annual Management Practice Implementation and Nitrogen Application Report Appendix II
5
Figure I-6. Histogram plot of A/R values for Alfalfa, Haylage for the 2018 Crop Year.
The dotted blue line represents the mean. The number of parcels (n) and Standard deviation (SD) are provided.
Figure I-7. Histogram plot of A-R values for Alfalfa, Haylage for the 2018 Crop Year. The dotted blue line represents the mean. The number of parcels (n) and Standard deviation (SD) are provided.

ESJWQC Annual Management Practice Implementation and Nitrogen Application Report Appendix II
6
II. ALMONDS
Important analysis considerations: The calculation of nitrogen removed at harvest for Almonds assumes that 0.068 lbs N/lbs of marketable kernels are removed at harvest. This estimate is obtained from Geisseler (2016). The
author considers that the value is a good estimate for nitrogen removed from almond orchards in the Central Valley.
Table II-1. Summary statistics for Almond.
SPECIFIC CROP PARAMETER N PARCELS ACREAGE MEAN STANDARD
DEVIATION MIN MAX N OUTLIERS
ALMONDS
A/R 5,859 231,185 1.27 0.88 0 21.6 -- Multi-year A/R 2,538 125,756 1.25 0.35 0 4.54 139
A-R 5,775 228,482 28.78 58.08 -325 480 -- Multi-year A-R 2,538 125,756 90.74 140.41 -1374 770 --
Figure II-1. Box and Whisker plot of multi-year A/R for Almonds parcels. The number of parcels (n), mean, and standard deviation (SD) are provided. The dotted blue line represents the medcouple upper fence. Multi-year A/R ratios exceeding the upper fence are considered outliers and are represented by red dots.

ESJWQC Annual Management Practice Implementation and Nitrogen Application Report Appendix II
7
Figure II-2. Histogram plot of A/R values for Almonds for the 2018 Crop Year. The dotted blue line represents the mean. The number of parcels (n) and Standard deviation (SD) are provided.
Figure II-3. Histogram plot of multi-year A/R values for Almonds. The dotted blue line represents the mean. The number of parcels (n) and Standard deviation (SD) are provided.

ESJWQC Annual Management Practice Implementation and Nitrogen Application Report Appendix II
8
Figure II-4. Histogram plot of A-R values for Almonds for the 2018 Crop Year. The dotted blue line represents the mean. The number of parcels (n) and Standard deviation (SD) are provided.
Figure II-5. Histogram plot of multi-year A-R values for Almonds. The dotted blue line represents the mean. The number of parcels (n) and Standard deviation (SD) are provided.

ESJWQC Annual Management Practice Implementation and Nitrogen Application Report Appendix II
9
III. APPLES
Important analysis considerations: The calculation of nitrogen removed at harvest for Apples assumes that 0.00054 lbs N/lbs of fruits are removed at harvest. This estimate is obtained from Geisseler (2016). The author considers
that the value is only a rough estimate.
Table III-1. Summary statistics for Apples.
SPECIFIC CROP PARAMETER N PARCELS ACREAGE MEAN STANDARD
DEVIATION MIN MAX
N
OUTLIERS
APPLES A/R 6 72 313.9 717.29 0 1778 -- A-R 6 71 93.1 79.5 14.5 240 --
Figure III-1. Histogram plot of A/R values for Apples for the 2018 Crop Year. The dotted blue line represents the mean. The number of parcels (n) and Standard deviation (SD) are provided.

ESJWQC Annual Management Practice Implementation and Nitrogen Application Report Appendix II
10
Figure III-2. Histogram plot of A-R values for Apples for the 2018 Crop Year. The dotted blue line represents the mean. The number of parcels (n) and Standard deviation (SD) are provided.

ESJWQC Annual Management Practice Implementation and Nitrogen Application Report Appendix II
11
IV. APRICOTS
Important analysis considerations: The calculation of nitrogen removed at harvest for Apricots assumes that 0.00278 lbs N/lbs of fruits are removed at harvest. This estimate is obtained from Geisseler (2016). The author
considers that the value is only a rough estimate.
Table IV-1. Summary statistics for Apricots.
SPECIFIC CROP PARAMETER N PARCELS ACREAGE MEAN STANDARD
DEVIATION MIN MAX
N
OUTLIERS
APRICOTS
A/R 8 175 8.66 7.45 1.8 18 -- Multi-year A/R 1 1 6.33 -- 6.33 6.33 --
A-R 8 175 63.71 41.5 33.1 144 -- Multi-year A-R 1 1 289.7 -- 290 290 --
Figure IV-1. Histogram plot of A/R values for Apricots for the 2018 Crop Year. The dotted blue line represents the mean. The number of parcels (n) and Standard deviation (SD) are provided.

ESJWQC Annual Management Practice Implementation and Nitrogen Application Report Appendix II
12
Figure IV-2. Histogram plot of A-R values for Apricots for the 2018 Crop Year. The dotted blue line represents the mean. The number of parcels (n) and Standard deviation (SD) are provided.

ESJWQC Annual Management Practice Implementation and Nitrogen Application Report Appendix II
13
V. BEANS, DRY, BLACK-EYED
Important analysis considerations: The calculation of nitrogen removed at harvest for Beans, Dry, Black-Eyed assumes that 0.0365 lbs N/lbs of mature dry beans @ 12% moisture are removed at harvest. This estimate is obtained
from Geisseler (2016). The author considers that it is not possible to determine the degree to which the average value is representative as there is need for a more representative sample from
the Central Valley. However, values overlap substantially with lima beans from California.
Table V-1. Summary statistics for Beans, Dry, Black-Eyed.
SPECIFIC CROP PARAMETER N PARCELS ACREAGE MEAN STANDARD
DEVIATION MIN MAX N OUTLIERS
BEANS, DRY, BLACK-EYED
A/R 12 211 0.77 0.72 0 1.66 -- A-R 11 193 -25.1 51.12 -106 24.3 --
Figure V-1. Histogram plot of A/R values for Beans, Dry, Black-Eyed for the 2018 Crop Year. The dotted blue line represents the mean. The number of parcels (n) and Standard deviation (SD) are provided.

ESJWQC Annual Management Practice Implementation and Nitrogen Application Report Appendix II
14
Figure V-2. Histogram plot of A-R values for Beans, Dry, Black-Eyed for the 2018 Crop Year. The dotted blue line represents the mean. The number of parcels (n) and Standard deviation (SD) are provided.

ESJWQC Annual Management Practice Implementation and Nitrogen Application Report Appendix II
15
VI. BERRIES
Important analysis considerations: The calculation of nitrogen removed at harvest for Strawberries assumes that 0.0013 lbs N/lbs of fruit are removed at harvest. This estimate is obtained from Geisseler (2016). The Coalition used
this Strawberry average CN coefficient in cases when the grower reported berry varieties not included in the Geisseler report.
Table VI-1. Summary statistics for Berries.
SPECIFIC CROP PARAMETER N PARCELS ACREAGE MEAN STANDARD
DEVIATION MIN MAX
N
OUTLIERS
BERRY, BLUEBERRY
A/R 3 29 29.91 35.79 8.88 71.2 -- Multi-year A/R 2 20 16.75 5.97 12.5 21 --
A-R 3 29 64.94 42.44 29.6 112 -- Multi-year A-R 2 20 267 331.7 32.4 502 --
STRAWBERRY
A/R 8 119 12.61 21.54 1.54 63.9 -- Multi-year A/R 5 48 6.04 9.2 1.72 22.5 --
A-R 8 119 49.16 26.49 24.6 98.9 -- Multi-year A-R 5 48 197.3 94.82 125 364 --
Figure VI-1. Histogram plot of A/R values for Berry, Blueberry for the 2018 Crop Year. The dotted blue line represents the mean. The number of parcels (n) and Standard deviation (SD) are provided.

ESJWQC Annual Management Practice Implementation and Nitrogen Application Report Appendix II
16
Figure VI-2. Histogram plot of A-R values for Berry, Blueberry for the 2018 Crop Year. The dotted blue line represents the mean. The number of parcels (n) and Standard deviation (SD) are provided.
Figure VI-3. Histogram plot of A/R values for Berry, Strawberry for the 2018 Crop Year. The dotted blue line represents the mean. The number of parcels (n) and Standard deviation (SD) are provided.

ESJWQC Annual Management Practice Implementation and Nitrogen Application Report Appendix II
17
Figure VI-4. Histogram plot of A-R values for Strawberries for the 2018 Crop Year. The dotted blue line represents the mean. The number of parcels (n) and Standard deviation (SD) are provided.

ESJWQC Annual Management Practice Implementation and Nitrogen Application Report Appendix II
18
VII. CHERRIES
Important analysis considerations: The calculation of nitrogen removed at harvest for Cherries assumes that 0.00221 lbs N/lbs of fruits are removed at harvest. This estimate is obtained from Geisseler (2016). The author
considers that the value is only a rough estimate.
Table VII-1. Summary statistics for Cherries.
SPECIFIC CROP PARAMETER N PARCELS ACREAGE MEAN STANDARD
DEVIATION MIN MAX
N
OUTLIERS
CHERRIES
A/R 46 1,333 5.48 9.12 0 37.1 -- Multi-year A/R 20 695 5.6 4.11 0.74 13.7 0
A-R 43 1,296 35.01 42.18 -23.5 158 -- Multi-year A-R 20 695 121.8 115.95 -31.9 280 --
Figure VII-1. Box and Whisker plot of multi-year A/R for Cherry parcels. The number of parcels (n), mean, and standard deviation (SD) are provided. The dotted blue line represents the medcouple upper fence. Multi-year A/R ratios exceeding the upper fence are considered outliers and are represented by red dots.

ESJWQC Annual Management Practice Implementation and Nitrogen Application Report Appendix II
19
Figure VII-2. Histogram plot of A/R values for Cherries for the 2018 Crop Year. The dotted blue line represents the mean. The number of parcels (n) and Standard deviation (SD) are provided.
Figure VII-3. Histogram plot of multi-year A/R values for Cherry. The dotted blue line represents the mean. The number of parcels (n) and Standard deviation (SD) are provided.

ESJWQC Annual Management Practice Implementation and Nitrogen Application Report Appendix II
20
Figure VII-4. Histogram plot of A-R values for Cherries for the 2018 Crop Year. The dotted blue line represents the mean. The number of parcels (n) and Standard deviation (SD) are provided.
Figure VII-5. Histogram plot of multi-year A-R values for Cherry. The dotted blue line represents the mean. The number of parcels (n) and Standard deviation (SD) are provided.

ESJWQC Annual Management Practice Implementation and Nitrogen Application Report Appendix II
21
VIII. CITRUS
Important analysis considerations: The calculation of nitrogen removed at harvest for Citrus assumes that 0.00138 lbs N/lbs of fruits are removed at harvest. This estimate is obtained from Geisseler (2016). The Coalition calculated
an average of grapefruit, lemons, oranges, and tangerines, as means and ranges for the different citrus overlap substantially. The Coalition used this citrus average CN coefficient in cases when
the grower reported other citrus fruits not included in that list. Since means and ranges overlap substantially, this average can be considered a reasonable estimate for citrus
Table VIII-1. Summary statistics for Citrus.
SPECIFIC CROP PARAMETER N PARCELS ACREAGE MEAN STANDARD
DEVIATION MIN MAX
N
OUTLIERS
CITRUS, CLEMENTINES
A/R 1 314 2.73 -- 2.73 2.73 -- A-R 6 314 36.98 15.75 22 53.9 --
CITRUS, MANDARINS
A/R 35 2,650 3.01 1.75 0.64 11 -- Multi-year A/R 1 25 1.02 -- 1.02 1.02 --
A-R 35 2,650 87.89 25.07 -12.5 160 -- Multi-year A-R 1 25 1.9 -- 1.9 1.9 --
CITRUS, ORANGES
A/R 55 2,200 2.72 0.55 0 3.31 -- Multi-year A/R 10 2,243 3.87 0.73 1.8 4.13 0
A-R 55 2,200 95.06 23.99 0 119 -- Multi-year A-R 10 2,243 302.7 91.65 43.5 340 --
CITRUS, TANGELO
A/R 14 676 2.65 0.93 1.45 3.32 -- Multi-year A/R 3 314 5.18 0 5.18 5.18 --
A-R 14 676 74.02 40.23 22 103 -- Multi-year A-R 3 314 394.8 0 395 395 --

ESJWQC Annual Management Practice Implementation and Nitrogen Application Report Appendix II
22
Figure VIII-1. Histogram plot of A-R values for Citrus, Clementines for the 2018 Crop Year. The dotted blue line represents the mean. The number of parcels (n) and Standard deviation (SD) are provided.
Figure VIII-2. Histogram plot of A/R values for Citrus, Mandarins for the 2018 Crop Year. The dotted blue line represents the mean. The number of parcels (n) and Standard deviation (SD) are provided.

ESJWQC Annual Management Practice Implementation and Nitrogen Application Report Appendix II
23
Figure VIII-3. Histogram plot of A-R values for Citrus, Mandarins for the 2018 Crop Year. The dotted blue line represents the mean. The number of parcels (n) and Standard deviation (SD) are provided.
Figure VIII-4. Box and Whisker plot of multi-year A/R for Citrus, Orange parcels. The number of parcels (n), mean, and standard deviation (SD) are provided. The dotted blue line represents the medcouple upper fence. Multi-year A/R ratios exceeding the upper fence are considered outliers and are represented by red dots.

ESJWQC Annual Management Practice Implementation and Nitrogen Application Report Appendix II
24
Figure VIII-5. Histogram plot of A/R values for Citrus, Orange for the 2018 Crop Year.
The dotted blue line represents the mean. The number of parcels (n) and Standard deviation (SD) are provided.
Figure VIII-6. Histogram plot of multi-year A/R values for Citrus, Orange. The dotted blue line represents the mean. The number of parcels (n) and Standard deviation (SD) are provided.

ESJWQC Annual Management Practice Implementation and Nitrogen Application Report Appendix II
25
Figure VIII-7. Histogram plot of A-R values for Citrus, Orange for the 2018 Crop Year. The dotted blue line represents the mean. The number of parcels (n) and Standard deviation (SD) are provided.
Figure VIII-8. Histogram plot of multi-year A-R values for Citrus, Orange. The dotted blue line represents the mean. The number of parcels (n) and Standard deviation (SD) are provided.

ESJWQC Annual Management Practice Implementation and Nitrogen Application Report Appendix II
26
Figure VIII-9. Histogram plot of A/R values for Citrus, Tangelo for the 2018 Crop Year. The dotted blue line represents the mean. The number of parcels (n) and Standard deviation (SD) are provided.
Figure VIII-10. Histogram plot of A-R values for Citrus, Tangelo for the 2018 Crop Year. The dotted blue line represents the mean. The number of parcels (n) and Standard deviation (SD) are provided.

ESJWQC Annual Management Practice Implementation and Nitrogen Application Report Appendix II
27
IX. CORN
Important analysis considerations: The calculation of nitrogen removed at harvest for Corn, Grain assumes that 0.012 lbs N/lbs of
grain @ 15.5% moisture are removed at harvest. This estimate is obtained from Geisseler (2016). The author considers that more corn grain samples from Central Valley fields are necessary to determine whether the value is a good estimate for the region.
The calculation of nitrogen removed at harvest for Corn, Silage assumes that 0.00378 lbs N/lbs @ 70% moisture are removed at harvest. This estimate is obtained from Geisseler (2016). The
author considers that This value can be considered a very good estimate of Central Valley corn silage.
Table IX-1. Summary statistics for Corn.
SPECIFIC CROP PARAMETER N PARCELS ACREAGE MEAN STANDARD
DEVIATION MIN MAX
N
OUTLIERS
CORN, GRAIN
A/R 20 506 1.31 0.39 0.33 1.51 -- Multi-year A/R 1 40 1.08 -- 1.08 1.08 --
A-R 20 506 19.29 157.17 -518 82.8 -- Multi-year A-R 1 40 28.6 -- 28.6 28.6 --
CORN, SILAGE
A/R 367 14,145 1.11 1.32 0 23.81 -- Multi-year A/R 137 6637 1.03 0.28 0.41 2.05 16
A-R 363 14,060 -0.06 78.8 -278 213.63 -- Multi-year A-R 137 6,637 20.48 182.85 -431.7 549.2 --
Figure IX-1. Histogram plot of A/R values for Corn, Grain for the 2018 Crop Year. The dotted blue line represents the mean. The number of parcels (n) and Standard deviation (SD) are provided.

ESJWQC Annual Management Practice Implementation and Nitrogen Application Report Appendix II
28
Figure IX-2. Histogram plot of A-R values for Corn, Grain for the 2018 Crop Year. The dotted blue line represents the mean. The number of parcels (n) and Standard deviation (SD) are provided.
Figure IX-3. Box and Whisker plot of multi-year A/R for Corn, Silage parcels. The number of parcels (n), mean, and standard deviation (SD) are provided. The dotted blue line represents the medcouple upper fence. Multi-year A/R ratios exceeding the upper fence are considered outliers and are represented by red dots.

ESJWQC Annual Management Practice Implementation and Nitrogen Application Report Appendix II
29
Figure IX-4. Histogram plot of A/R values for Corn, Silage for the 2018 Crop Year.
The dotted blue line represents the mean. The number of parcels (n) and Standard deviation (SD) are provided.
Figure IX-5. Histogram plot of multi-year A/R values for Corn, Silage. The dotted blue line represents the mean. The number of parcels (n) and Standard deviation (SD) are provided.
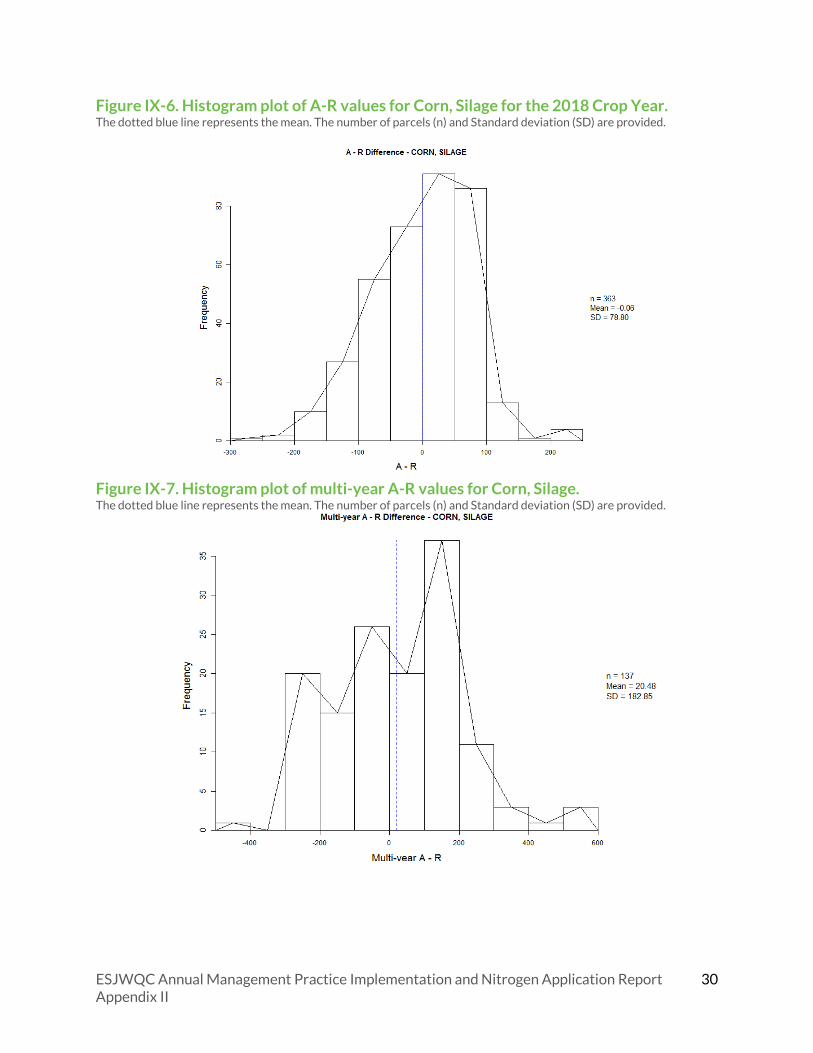
ESJWQC Annual Management Practice Implementation and Nitrogen Application Report Appendix II
30
Figure IX-6. Histogram plot of A-R values for Corn, Silage for the 2018 Crop Year. The dotted blue line represents the mean. The number of parcels (n) and Standard deviation (SD) are provided.
Figure IX-7. Histogram plot of multi-year A-R values for Corn, Silage. The dotted blue line represents the mean. The number of parcels (n) and Standard deviation (SD) are provided.
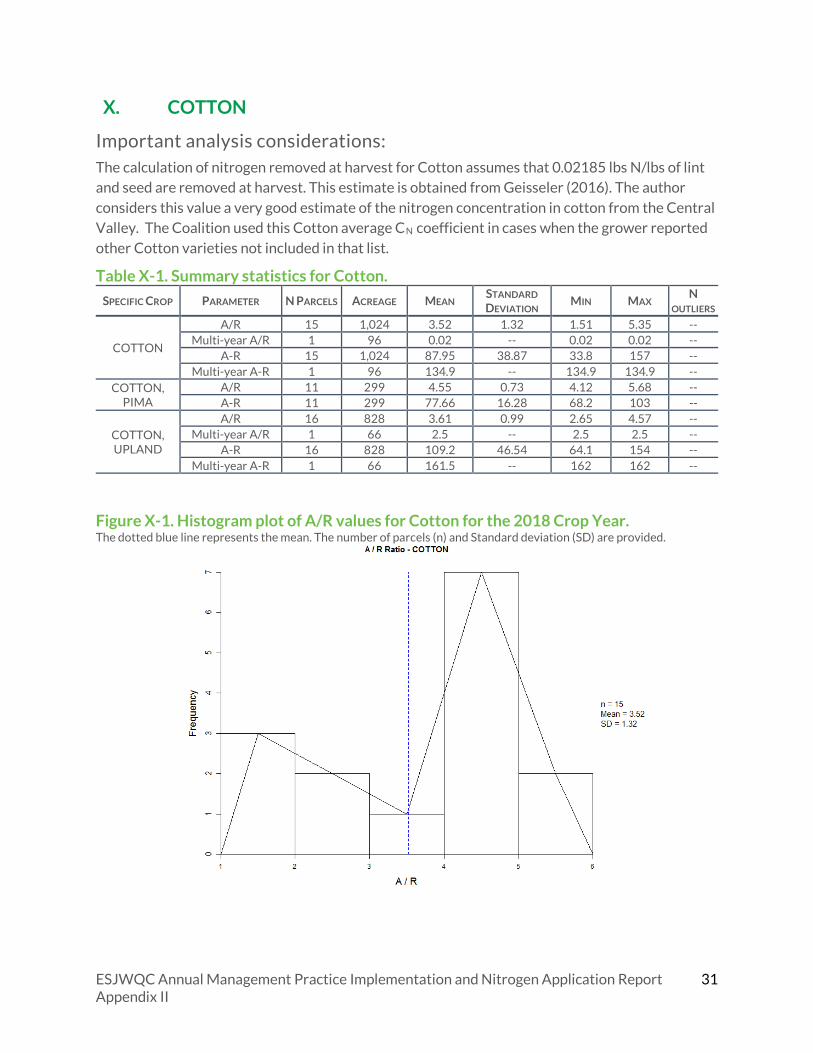
ESJWQC Annual Management Practice Implementation and Nitrogen Application Report Appendix II
31
X. COTTON
Important analysis considerations: The calculation of nitrogen removed at harvest for Cotton assumes that 0.02185 lbs N/lbs of lint and seed are removed at harvest. This estimate is obtained from Geisseler (2016). The author
considers this value a very good estimate of the nitrogen concentration in cotton from the Central Valley. The Coalition used this Cotton average CN coefficient in cases when the grower reported
other Cotton varieties not included in that list.
Table X-1. Summary statistics for Cotton.
SPECIFIC CROP PARAMETER N PARCELS ACREAGE MEAN STANDARD
DEVIATION MIN MAX
N
OUTLIERS
COTTON
A/R 15 1,024 3.52 1.32 1.51 5.35 -- Multi-year A/R 1 96 0.02 -- 0.02 0.02 --
A-R 15 1,024 87.95 38.87 33.8 157 -- Multi-year A-R 1 96 134.9 -- 134.9 134.9 --
COTTON, PIMA
A/R 11 299 4.55 0.73 4.12 5.68 -- A-R 11 299 77.66 16.28 68.2 103 --
COTTON, UPLAND
A/R 16 828 3.61 0.99 2.65 4.57 -- Multi-year A/R 1 66 2.5 -- 2.5 2.5 --
A-R 16 828 109.2 46.54 64.1 154 -- Multi-year A-R 1 66 161.5 -- 162 162 --
Figure X-1. Histogram plot of A/R values for Cotton for the 2018 Crop Year. The dotted blue line represents the mean. The number of parcels (n) and Standard deviation (SD) are provided.

ESJWQC Annual Management Practice Implementation and Nitrogen Application Report Appendix II
32
Figure X-2. Histogram plot of A-R values for Cotton for the 2018 Crop Year. The dotted blue line represents the mean. The number of parcels (n) and Standard deviation (SD) are provided.
Figure X-3. Histogram plot of A/R values for Cotton, Pima for the 2018 Crop Year. The dotted blue line represents the mean. The number of parcels (n) and Standard deviation (SD) are provided.

ESJWQC Annual Management Practice Implementation and Nitrogen Application Report Appendix II
33
Figure X-4. Histogram plot of A-R values for Cotton, Pima for the 2018 Crop Year. The dotted blue line represents the mean. The number of parcels (n) and Standard deviation (SD) are provided.
Figure X-5. Histogram plot of A/R values for Cotton, Upland for the 2018 Crop Year. The dotted blue line represents the mean. The number of parcels (n) and Standard deviation (SD) are provided.

ESJWQC Annual Management Practice Implementation and Nitrogen Application Report Appendix II
34
Figure X-6. Histogram plot of A-R values for Cotton, Upland for the 2018 Crop Year. The dotted blue line represents the mean. The number of parcels (n) and Standard deviation (SD) are provided.

ESJWQC Annual Management Practice Implementation and Nitrogen Application Report Appendix II
35
XI. FIGS
Important analysis considerations: The calculation of nitrogen removed at harvest for Figs assumes that 0.00127 lbs N/lbs of fruit are removed at harvest. This estimate is obtained from Geisseler (2016). The author concedes that it
cannot be determined how well the average value in the table represents figs from California.
Table XI-1. Summary statistics for Figs.
SPECIFIC CROP PARAMETER N PARCELS ACREAGE MEAN STANDARD
DEVIATION MIN MAX
N
OUTLIERS
FIGS
A/R 22 1,536 28.4 28.49 0 78.7 -- Multi-year A/R 9 1,420 20.93 12.64 2.96 47.9 2
A-R 22 1,536 72.31 48.66 0 212 -- Multi-year A-R 9 1,420 220.5 105.26 72.8 400 --
Figure XI-1. Box and Whisker plot of multi-year A/R for Figs parcels. The number of parcels (n), mean, and standard deviation (SD) are provided. The dotted blue line represents the medcouple upper fence. Multi-year A/R ratios exceeding the upper fence are considered outliers and are represented by red dots.

ESJWQC Annual Management Practice Implementation and Nitrogen Application Report Appendix II
36
Figure XI-2. Histogram plot of A/R values for Figs for the 2018 Crop Year.
The dotted blue line represents the mean. The number of parcels (n) and Standard deviation (SD) are provided.
Figure XI-3. Histogram plot of multi-year A/R values for Figs. The dotted blue line represents the mean. The number of parcels (n) and Standard deviation (SD) are provided.

ESJWQC Annual Management Practice Implementation and Nitrogen Application Report Appendix II
37
Figure XI-4. Histogram plot of A-R values for Figs for the 2018 Crop Year. The dotted blue line represents the mean. The number of parcels (n) and Standard deviation (SD) are provided.
Figure XI-5. Histogram plot of multi-year A-R values for Figs. The dotted blue line represents the mean. The number of parcels (n) and Standard deviation (SD) are provided.

ESJWQC Annual Management Practice Implementation and Nitrogen Application Report Appendix II
38
XII. FORAGE GRASS, HAY
Important analysis considerations: The calculation of nitrogen removed at harvest for Forage Grass, Hay assumes that 0.0267 lbs N/lbs of moisture are removed at harvest. This estimate is obtained from Geisseler (2016). The
author evaluated tall fescue, orchard grass and ryegrass separately. The Coalition created a forage grass average CN coefficient and applied that to grass hay reported. Means and ranges for
the different grass CN coefficients overlap substantially. However, they are all from the same trial, and may overestimate the nitrogen concentrations in the Central Valley.
Table XII-1. Summary statistics for Forage Grass, Hay.
SPECIFIC CROP PARAMETER N PARCELS ACREAGE MEAN STANDARD
DEVIATION MIN MAX
N
OUTLIERS
FORAGE GRASS, HAY
A/R 13 450 0.08 0.15 0 0.54 -- Multi-year A/R 2 29 0.16 0 0.16 0.16 --
A-R 7 177 -195 97.97 -324 -86.9 -- Multi-year A-R 2 29 -801 17.39 -813 -788 --
Figure XII-1. Histogram plot of A/R values for Forage Grass, Hay for the 2018 Crop Year. The dotted blue line represents the mean. The number of parcels (n) and Standard deviation (SD) are provided.

ESJWQC Annual Management Practice Implementation and Nitrogen Application Report Appendix II
39
Figure XII-2. Histogram plot of A-R values for Forage Grass, Hay for the 2018 Crop Year. The dotted blue line represents the mean. The number of parcels (n) and Standard deviation (SD) are provided.

ESJWQC Annual Management Practice Implementation and Nitrogen Application Report Appendix II
40
XIII. GRAPES
Important analysis considerations: The calculation of nitrogen removed at harvest for Grapes assumes that 0.001465 lbs N/lbs of grapes are removed at harvest. This estimate is obtained from Geisseler (2016). The author
considers that this is an average value of nitrogen removed for wine and table grapes. Although nitrogen removal might be higher in wine grapes, there is substantial overlap, and this mean value
may be reasonable for grapes in the Central Valley. The Coalition applied this value to cases when the grower did not specify the kind of grapes reported.
The calculation of nitrogen removed at harvest for Grapes, Raisins assumes that 0.00505 lbs N/lbs
of grapes at 15% moisture are removed at harvest. This estimate is obtained from Geisseler (2016). The author considers that the value is a good estimate of nitrogen removed with
‘Thompson Seedless’ grapes from California vineyards. However, it likely underestimates the variability of grape nitrogen concentrations in commercial vineyards.
The calculation of nitrogen removed at harvest for Grapes, Table assumes that 0.00113 lbs N/lbs
of grapes are removed at harvest. This estimate is obtained from Geisseler (2016). The author considers that the value is a good estimate of nitrogen removed with ‘Thompson Seedless’ grapes
from California vineyards. However, it likely underestimates the variability of grape nitrogen concentrations in commercial vineyards.
The calculation of nitrogen removed at harvest for Grapes, Wine assumes that 0.0018 lbs N/lbs of grapes are removed at harvest. This estimate is obtained from Geisseler (2016). The author
concedes that it cannot be determined if value is representative for wine grapes from California.
Table XIII-1. Summary statistics for Grapes.
SPECIFIC CROP PARAMETER N PARCELS ACREAGE MEAN STANDARD
DEVIATION MIN MAX
N
OUTLIERS
GRAPES, NR
A/R 87 4,821 1.98 2.94 0 24.6 -- Multi-year A/R 4 190 4.04 3.52 1.98 9.3 --
A-R 85 4,820 18.89 31.18 -4.02 199 -- Multi-year A-R 4 190 103.3 64.5 50.3 182 --
GRAPES, RAISINS
A/R 203 11,722 1.52 1.41 0 9.91 -- Multi-year A/R 70 5,578 2.36 0.75 0.47 4.7 17
A-R 189 11,184 10.38 55.35 -102 413 -- Multi-year A-R 70 5,578 119.8 67.35 -40.2 224 --
GRAPES, TABLE
A/R 55 2,329 8.21 36.21 0 258.11 -- Multi-year A/R 16 599 4.93 3.65 1.09 10.87 0
A-R 51 2,247 36.7 33.16 -24.86 141.82 -- Multi-year A-R 16 599 137.37 65.58 6.4 237.1 --
GRAPES, WINE
A/R 526 39,525 1.56 1.4 0 17.5 -- Multi-year A/R 294 20,398 1.53 0.71 0.08 3.3 38
A-R 514 39,097 22.34 32.82 -43.9 257 -- Multi-year A-R 294 20,398 56.54 90.3 -462 202 --
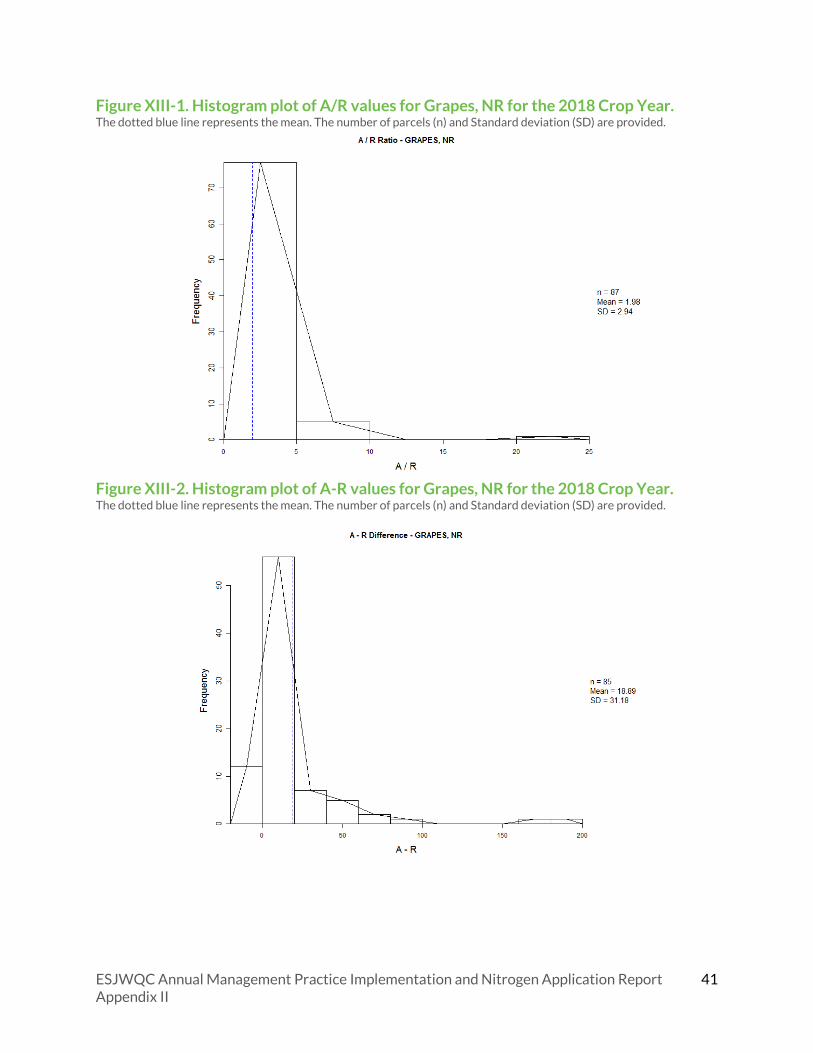
ESJWQC Annual Management Practice Implementation and Nitrogen Application Report Appendix II
41
Figure XIII-1. Histogram plot of A/R values for Grapes, NR for the 2018 Crop Year. The dotted blue line represents the mean. The number of parcels (n) and Standard deviation (SD) are provided.
Figure XIII-2. Histogram plot of A-R values for Grapes, NR for the 2018 Crop Year. The dotted blue line represents the mean. The number of parcels (n) and Standard deviation (SD) are provided.
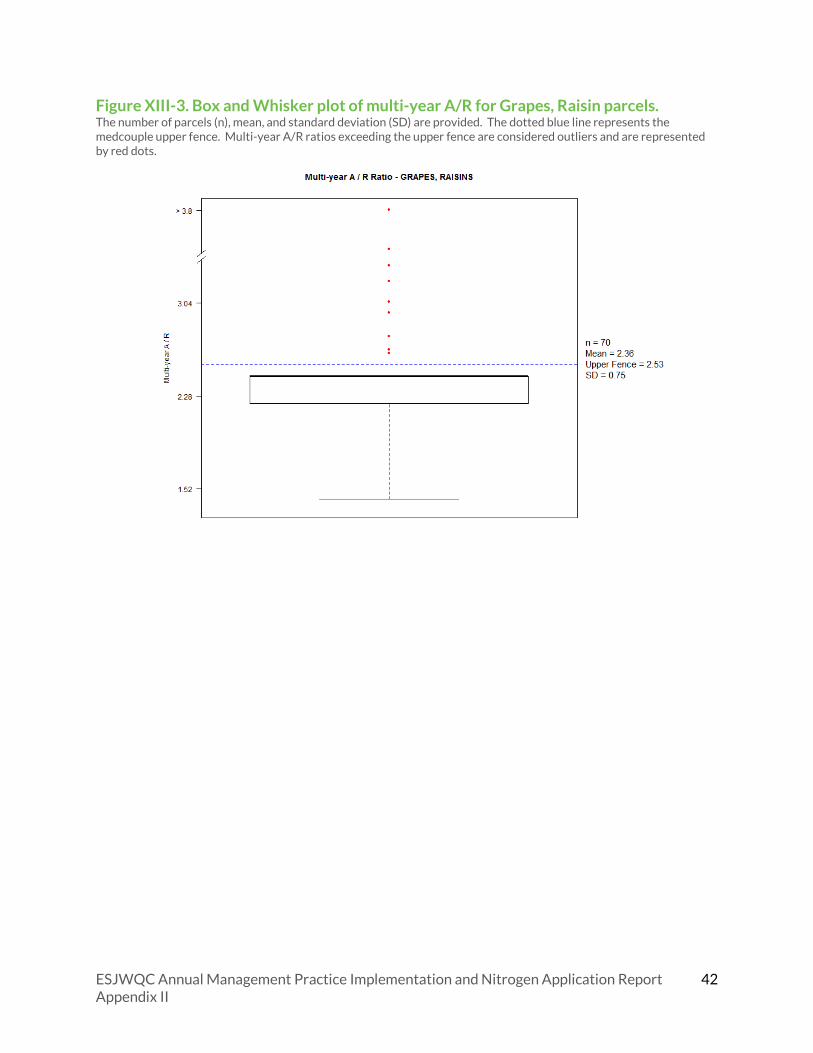
ESJWQC Annual Management Practice Implementation and Nitrogen Application Report Appendix II
42
Figure XIII-3. Box and Whisker plot of multi-year A/R for Grapes, Raisin parcels. The number of parcels (n), mean, and standard deviation (SD) are provided. The dotted blue line represents the medcouple upper fence. Multi-year A/R ratios exceeding the upper fence are considered outliers and are represented by red dots.

ESJWQC Annual Management Practice Implementation and Nitrogen Application Report Appendix II
43
Figure XIII-4. Histogram plot of A/R values for Grapes, Raisins for the 2018 Crop Year.
The dotted blue line represents the mean. The number of parcels (n) and Standard deviation (SD) are provided.
Figure XIII-5. Histogram plot of multi-year A/R values for Grapes, Raisins. The dotted blue line represents the mean. The number of parcels (n) and Standard deviation (SD) are provided.

ESJWQC Annual Management Practice Implementation and Nitrogen Application Report Appendix II
44
Figure XIII-6. Histogram plot of A-R values for Grapes, Raisins for the 2018 Crop Year. The dotted blue line represents the mean. The number of parcels (n) and Standard deviation (SD) are provided.
Figure XIII-7. Histogram plot of multi-year A-R values for Grapes, Raisins. The dotted blue line represents the mean. The number of parcels (n) and Standard deviation (SD) are provided.

ESJWQC Annual Management Practice Implementation and Nitrogen Application Report Appendix II
45
Figure XIII-8. Box and Whisker plot of multi-year A/R for Grapes, Table parcels. The number of parcels (n), mean, and standard deviation (SD) are provided. The dotted blue line represents the medcouple upper fence. Multi-year A/R ratios exceeding the upper fence are considered outliers and are represented by red dots.

ESJWQC Annual Management Practice Implementation and Nitrogen Application Report Appendix II
46
Figure XIII-9. Histogram plot of A/R values for Grapes, Table for the 2018 Crop Year.
The dotted blue line represents the mean. The number of parcels (n) and Standard deviation (SD) are provided.
Figure XIII-10. Histogram plot of multi-year A/R values for Grapes, Table. The dotted blue line represents the mean. The number of parcels (n) and Standard deviation (SD) are provided.

ESJWQC Annual Management Practice Implementation and Nitrogen Application Report Appendix II
47
Figure XIII-11. Histogram plot of A-R values for Grapes, Table for the 2018 Crop Year. The dotted blue line represents the mean. The number of parcels (n) and Standard deviation (SD) are provided.
Figure XIII-12. Histogram plot of multi-year A-R values for Grapes, Table. The dotted blue line represents the mean. The number of parcels (n) and Standard deviation (SD) are provided.

ESJWQC Annual Management Practice Implementation and Nitrogen Application Report Appendix II
48
Figure XIII-13. Box and Whisker plot of multi-year A/R for Grapes, Wine parcels. The number of parcels (n), mean, and standard deviation (SD) are provided. The dotted blue line represents the medcouple upper fence. Multi-year A/R ratios exceeding the upper fence are considered outliers and are represented by red dots.
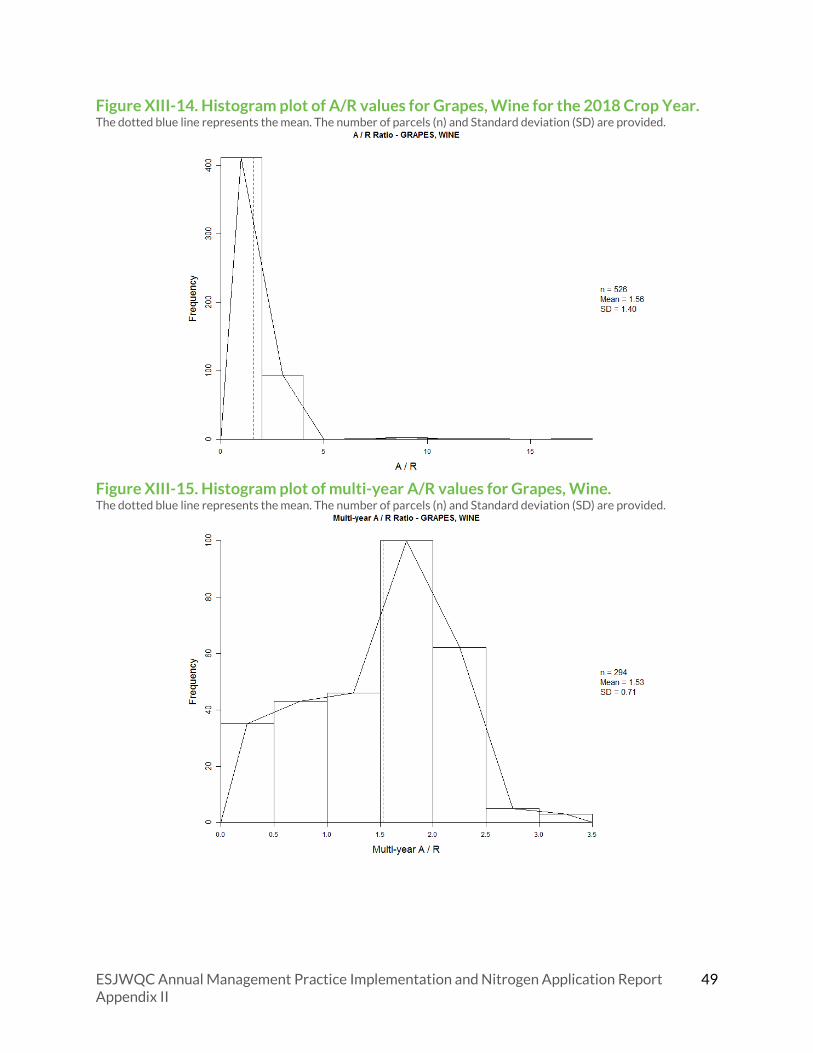
ESJWQC Annual Management Practice Implementation and Nitrogen Application Report Appendix II
49
Figure XIII-14. Histogram plot of A/R values for Grapes, Wine for the 2018 Crop Year.
The dotted blue line represents the mean. The number of parcels (n) and Standard deviation (SD) are provided.
Figure XIII-15. Histogram plot of multi-year A/R values for Grapes, Wine. The dotted blue line represents the mean. The number of parcels (n) and Standard deviation (SD) are provided.

ESJWQC Annual Management Practice Implementation and Nitrogen Application Report Appendix II
50
Figure XIII-16. Histogram plot of A-R values for Grapes, Wine for the 2018 Crop Year. The dotted blue line represents the mean. The number of parcels (n) and Standard deviation (SD) are provided.
Figure XIII-17. Histogram plot of multi-year A-R values for Grapes, Wine. The dotted blue line represents the mean. The number of parcels (n) and Standard deviation (SD) are provided.

ESJWQC Annual Management Practice Implementation and Nitrogen Application Report Appendix II
51
XIV. GREENS
Important analysis considerations: The calculation of nitrogen removed at harvest for Lettuce, Average assumes that 0.001563 lbs N/lbs of fresh weight are removed at harvest. This estimate is obtained from Geisseler (2016).
Geisseler evaluated iceberg and romaine lettuce separately. Means and ranges for the two CN coefficients overlap substantially. The Coalition created a lettuce average CN coefficient and
applied that to salad greens reported by the growers. Geisseler believes the value is likely a reasonable estimate of nitrogen concentrations in the Central Valley, even though most of the
data are from the Salinas Valley.
Table XIV-1. Summary statistics for Greens.
SPECIFIC CROP PARAMETER N PARCELS ACREAGE MEAN STANDARD
DEVIATION MIN MAX
N
OUTLIERS
KALE
A/R 68 138 5.82 1.3 5.07 8.06 -- Multi-year A/R 17 138 4.84 0 4.84 4.84 --
A-R 68 138 174.9 6.79 171 187 -- Multi-year A-R 17 138 461.9 0 462 462 --
LETTUCE
A/R 68 373 5.44 0.9 4.34 6.32 -- Multi-year A/R 17 373 4.72 0 4.72 4.72 --
A-R 68 373 136.1 10.62 120 146 -- Multi-year A-R 17 373 361.5 0 362 362 --
SPINACH
A/R 18 84 6.6 1.65 0 6.99 -- Multi-year A/R 17 64 6.2 0 6.2 6.2 --
A-R 18 84 122.5 32.91 -9.38 130 -- Multi-year A-R 17 64 339.6 0 340 340 --
MUSTARD GREENS
A/R 35 171 3.7 0.66 0 3.97 -- Multi-year A/R 17 171 3.31 0 3.31 3.31 --
A-R 34 171 140.8 2.14 139 143 -- Multi-year A-R 17 171 351.8 0 352 352 --

ESJWQC Annual Management Practice Implementation and Nitrogen Application Report Appendix II
52
Figure XIV-1. Histogram plot of A/R values for Kale for the 2018 Crop Year.
The dotted blue line represents the mean. The number of parcels (n) and Standard deviation (SD) are provided.
Figure XIV-2. Histogram plot of A-R values for Kale for the 2018 Crop Year. The dotted blue line represents the mean. The number of parcels (n) and Standard deviation (SD) are provided.

ESJWQC Annual Management Practice Implementation and Nitrogen Application Report Appendix II
53
Figure XIV-3. Histogram plot of A/R values for Lettuce for the 2018 Crop Year.
The dotted blue line represents the mean. The number of parcels (n) and Standard deviation (SD) are provided.
Figure XIV-4. Histogram plot of A-R values for Lettuce for the 2018 Crop Year. The dotted blue line represents the mean. The number of parcels (n) and Standard deviation (SD) are provided.

ESJWQC Annual Management Practice Implementation and Nitrogen Application Report Appendix II
54
Figure XIV-5. Histogram plot of A/R values for Mustard Greens for the 2018 Crop Year.
The dotted blue line represents the mean. The number of parcels (n) and Standard deviation (SD) are provided.
Figure XIV-6. Histogram plot of A-R values for Mustard Greens for the 2018 Crop Year. The dotted blue line represents the mean. The number of parcels (n) and Standard deviation (SD) are provided.

ESJWQC Annual Management Practice Implementation and Nitrogen Application Report Appendix II
55
Figure XIV-7. Histogram plot of A/R values for Spinach for the 2018 Crop Year.
The dotted blue line represents the mean. The number of parcels (n) and Standard deviation (SD) are provided.
Figure XIV-8. Histogram plot of A-R values for Spinach for the 2018 Crop Year. The dotted blue line represents the mean. The number of parcels (n) and Standard deviation (SD) are provided.

ESJWQC Annual Management Practice Implementation and Nitrogen Application Report Appendix II
56
XV. NECTARINES
Important analysis considerations: The calculation of nitrogen removed at harvest for Nectarines assumes that 0.00182 lbs N/lbs of fruits are removed at harvest. This estimate is obtained from Geisseler (2016). The author
considers that the value may be a reasonable estimate of nitrogen removal in nectarines form the Central Valley. However, the dataset may not fully capture the variability.
Table XV-1. Summary statistics for Nectarines.
SPECIFIC CROP PARAMETER N PARCELS ACREAGE MEAN STANDARD
DEVIATION MIN MAX
N
OUTLIERS
NECTARINES
A/R 11 86 2.51 5.27 0 17.2 -- Multi-year A/R 3 26 1.21 0.38 0.99 1.65 --
A-R 7 86 42.75 48.74 -3.07 118 -- Multi-year A-R 3 26 18.37 35.28 -2 59.1 --
Figure XV-1. Histogram plot of A/R values for Nectarines for the 2018 Crop Year.
The dotted blue line represents the mean. The number of parcels (n) and Standard deviation (SD) are provided.

ESJWQC Annual Management Practice Implementation and Nitrogen Application Report Appendix II
57
Figure XV-2. Histogram plot of A-R values for Nectarines for the 2018 Crop Year. The dotted blue line represents the mean. The number of parcels (n) and Standard deviation (SD) are provided.
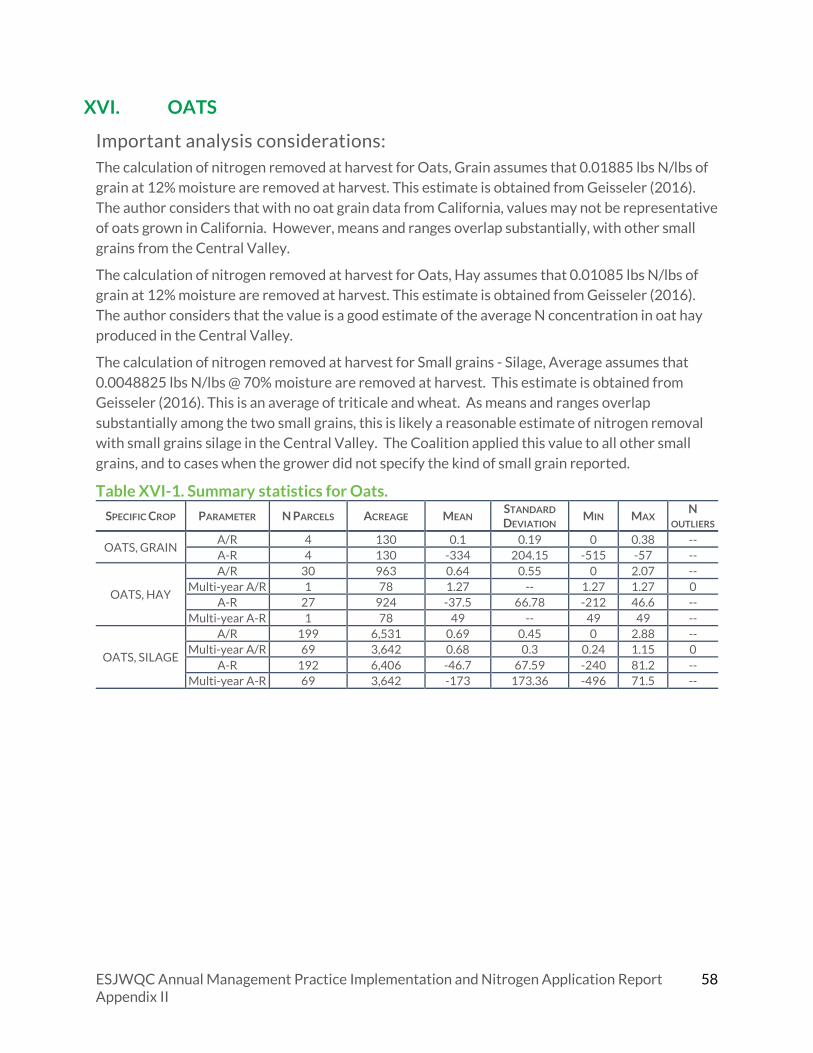
ESJWQC Annual Management Practice Implementation and Nitrogen Application Report Appendix II
58
XVI. OATS
Important analysis considerations: The calculation of nitrogen removed at harvest for Oats, Grain assumes that 0.01885 lbs N/lbs of grain at 12% moisture are removed at harvest. This estimate is obtained from Geisseler (2016).
The author considers that with no oat grain data from California, values may not be representative of oats grown in California. However, means and ranges overlap substantially, with other small
grains from the Central Valley.
The calculation of nitrogen removed at harvest for Oats, Hay assumes that 0.01085 lbs N/lbs of grain at 12% moisture are removed at harvest. This estimate is obtained from Geisseler (2016).
The author considers that the value is a good estimate of the average N concentration in oat hay produced in the Central Valley.
The calculation of nitrogen removed at harvest for Small grains - Silage, Average assumes that
0.0048825 lbs N/lbs @ 70% moisture are removed at harvest. This estimate is obtained from Geisseler (2016). This is an average of triticale and wheat. As means and ranges overlap
substantially among the two small grains, this is likely a reasonable estimate of nitrogen removal with small grains silage in the Central Valley. The Coalition applied this value to all other small
grains, and to cases when the grower did not specify the kind of small grain reported.
Table XVI-1. Summary statistics for Oats.
SPECIFIC CROP PARAMETER N PARCELS ACREAGE MEAN STANDARD
DEVIATION MIN MAX
N
OUTLIERS
OATS, GRAIN A/R 4 130 0.1 0.19 0 0.38 -- A-R 4 130 -334 204.15 -515 -57 --
OATS, HAY
A/R 30 963 0.64 0.55 0 2.07 -- Multi-year A/R 1 78 1.27 -- 1.27 1.27 0
A-R 27 924 -37.5 66.78 -212 46.6 -- Multi-year A-R 1 78 49 -- 49 49 --
OATS, SILAGE
A/R 199 6,531 0.69 0.45 0 2.88 -- Multi-year A/R 69 3,642 0.68 0.3 0.24 1.15 0
A-R 192 6,406 -46.7 67.59 -240 81.2 -- Multi-year A-R 69 3,642 -173 173.36 -496 71.5 --

ESJWQC Annual Management Practice Implementation and Nitrogen Application Report Appendix II
59
Figure XVI-1. Histogram plot of A/R values for Oats, Grain for the 2018 Crop Year.
The dotted blue line represents the mean. The number of parcels (n) and Standard deviation (SD) are provided.
Figure XVI-2. Histogram plot of A-R values for Oats, Grain for the 2018 Crop Year. The dotted blue line represents the mean. The number of parcels (n) and Standard deviation (SD) are provided.

ESJWQC Annual Management Practice Implementation and Nitrogen Application Report Appendix II
60
Figure XVI-3. Histogram plot of A/R values for Oats, Hay for the 2018 Crop Year.
The dotted blue line represents the mean. The number of parcels (n) and Standard deviation (SD) are provided.
Figure XVI-4. Histogram plot of A-R values for Oats, Hay for the 2018 Crop Year. The dotted blue line represents the mean. The number of parcels (n) and Standard deviation (SD) are provided.

ESJWQC Annual Management Practice Implementation and Nitrogen Application Report Appendix II
61
Figure XVI-5. Box and Whisker plot of multi-year A/R for Oats, Silage parcels. The number of parcels (n), mean, and standard deviation (SD) are provided. The dotted blue line represents the medcouple upper fence. Multi-year A/R ratios exceeding the upper fence are considered outliers and are represented by red dots.

ESJWQC Annual Management Practice Implementation and Nitrogen Application Report Appendix II
62
Figure XVI-6. Histogram plot of A/R values for Oats, Silage for the 2018 Crop Year.
The dotted blue line represents the mean. The number of parcels (n) and Standard deviation (SD) are provided.
Figure XVI-7. Histogram plot of multi-year A/R values for Oats, Silage. The dotted blue line represents the mean. The number of parcels (n) and Standard deviation (SD) are provided.

ESJWQC Annual Management Practice Implementation and Nitrogen Application Report Appendix II
63
Figure XVI-8. Histogram plot of A-R values for Oats, Silage for the 2018 Crop Year. The dotted blue line represents the mean. The number of parcels (n) and Standard deviation (SD) are provided.
Figure XVI-9. Histogram plot of multi-year A-R values for Oats, Silage. The dotted blue line represents the mean. The number of parcels (n) and Standard deviation (SD) are provided.
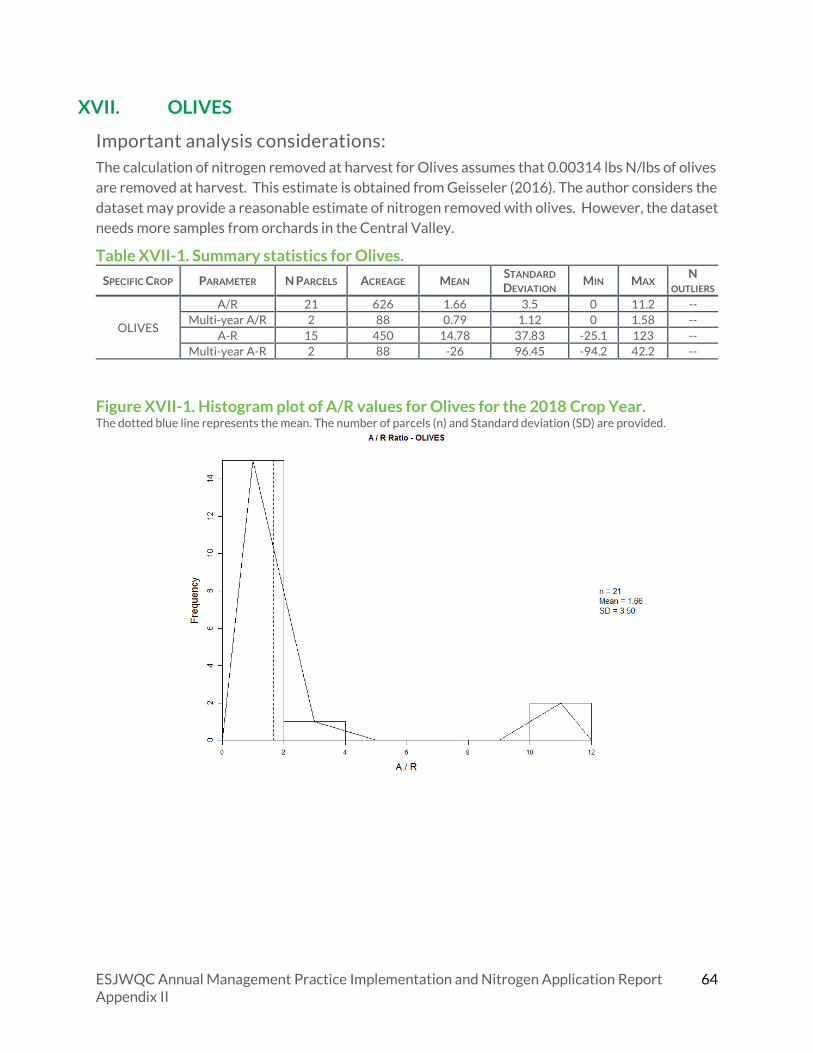
ESJWQC Annual Management Practice Implementation and Nitrogen Application Report Appendix II
64
XVII. OLIVES
Important analysis considerations: The calculation of nitrogen removed at harvest for Olives assumes that 0.00314 lbs N/lbs of olives are removed at harvest. This estimate is obtained from Geisseler (2016). The author considers the
dataset may provide a reasonable estimate of nitrogen removed with olives. However, the dataset needs more samples from orchards in the Central Valley.
Table XVII-1. Summary statistics for Olives.
SPECIFIC CROP PARAMETER N PARCELS ACREAGE MEAN STANDARD
DEVIATION MIN MAX
N
OUTLIERS
OLIVES
A/R 21 626 1.66 3.5 0 11.2 -- Multi-year A/R 2 88 0.79 1.12 0 1.58 --
A-R 15 450 14.78 37.83 -25.1 123 -- Multi-year A-R 2 88 -26 96.45 -94.2 42.2 --
Figure XVII-1. Histogram plot of A/R values for Olives for the 2018 Crop Year.
The dotted blue line represents the mean. The number of parcels (n) and Standard deviation (SD) are provided.

ESJWQC Annual Management Practice Implementation and Nitrogen Application Report Appendix II
65
Figure XVII-2. Histogram plot of A-R values for Olives for the 2018 Crop Year. The dotted blue line represents the mean. The number of parcels (n) and Standard deviation (SD) are provided.

ESJWQC Annual Management Practice Implementation and Nitrogen Application Report Appendix II
66
XVIII. ONIONS
Important analysis considerations: The calculation of nitrogen removed at harvest for Onions, Bulb assumes that 0.00197 lbs N/lbs of bulb weight are removed at harvest. This estimate is obtained from Geisseler (2016). The author
considers that the value may not be representative of nitrogen concentrations in onions harvested in the Central Valley.
Table XVIII-1. Summary statistics for Onions, Bulb.
SPECIFIC CROP PARAMETER N PARCELS ACREAGE MEAN STANDARD
DEVIATION MIN MAX
N
OUTLIERS
ONIONS, BULB A/R 3 159 25.1 16.75 5.76 34.8 -- A-R 3 159 216.8 39.03 194 262 --
Figure XVIII-1. Histogram plot of A/R values for Onions, Bulb for the 2018 Crop Year.
The dotted blue line represents the mean. The number of parcels (n) and Standard deviation (SD) are provided.

ESJWQC Annual Management Practice Implementation and Nitrogen Application Report Appendix II
67
Figure XVIII-2. Histogram plot of A-R values for Onions, Bulb for the 2018 Crop Year. The dotted blue line represents the mean. The number of parcels (n) and Standard deviation (SD) are provided.

ESJWQC Annual Management Practice Implementation and Nitrogen Application Report Appendix II
68
XIX. PEACHES
Important analysis considerations: The calculation of nitrogen removed at harvest for Peaches assumes that 0.00113 lbs N/lbs of fruits are removed at harvest. This estimate is obtained from Geisseler (2016). The author
considers that the average nitrogen concentration may be a reasonable estimate of nitrogen in California peaches. However, this needs more data from the Central Valley.
Table XIX-1. Summary statistics for Peaches.
SPECIFIC CROP PARAMETER N PARCELS ACREAGE MEAN STANDARD
DEVIATION MIN MAX
N
OUTLIERS
PEACHES, FRESH MARKET
A/R 34 583 29.68 149.67 0 850 -- Multi-year A/R 15 324 2.09 0.75 0.75 3.2 0
A-R 30 552 55.22 43.69 -13.8 240 -- Multi-year A-R 15 324 122.3 80.33 -41.1 196 --
PEACHES, NR
A/R 22 270 3.99 5.83 0 19.7 -- Multi-year A/R 1 15 1.74 -- 1.74 1.74 --
A-R 22 270 35.8 46.45 -43.5 128 -- Multi-year A-R 1 15 140.2 -- 140 140 --
PEACHES, PROCESSING
A/R 148 3,551 2.45 1.63 0 15.6 -- Multi-year A/R 61 1,867 2.39 0.99 0.87 6 2
A-R 146 3,527 51.56 40.67 -29.7 235 -- Multi-year A-R 61 1,867 172.1 130.32 -12.8 639 --
Figure XIX-1. Box and Whisker plot of multi-year A/R for Peaches, Fresh Market parcels. The number of parcels (n), mean, and standard deviation (SD) are provided. The dotted blue line represents the medcouple upper fence. Multi-year A/R ratios exceeding the upper fence are considered outliers and are represented by red dots.
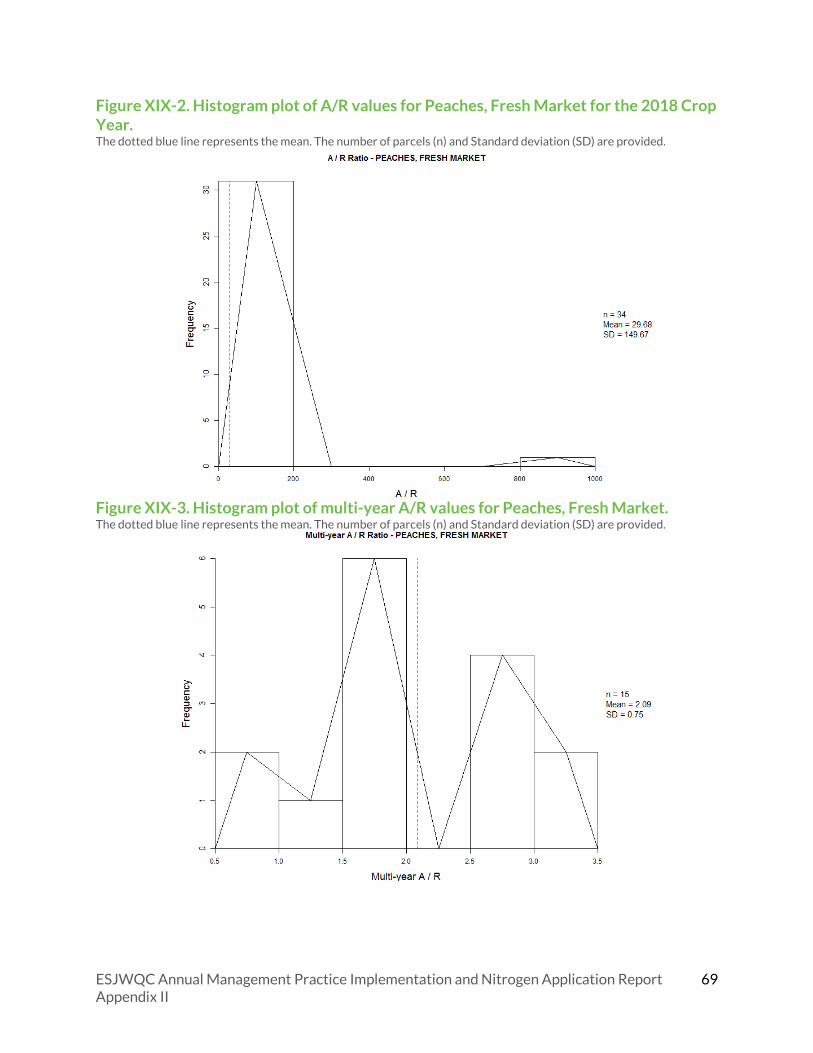
ESJWQC Annual Management Practice Implementation and Nitrogen Application Report Appendix II
69
Figure XIX-2. Histogram plot of A/R values for Peaches, Fresh Market for the 2018 Crop Year.
The dotted blue line represents the mean. The number of parcels (n) and Standard deviation (SD) are provided.
Figure XIX-3. Histogram plot of multi-year A/R values for Peaches, Fresh Market. The dotted blue line represents the mean. The number of parcels (n) and Standard deviation (SD) are provided.
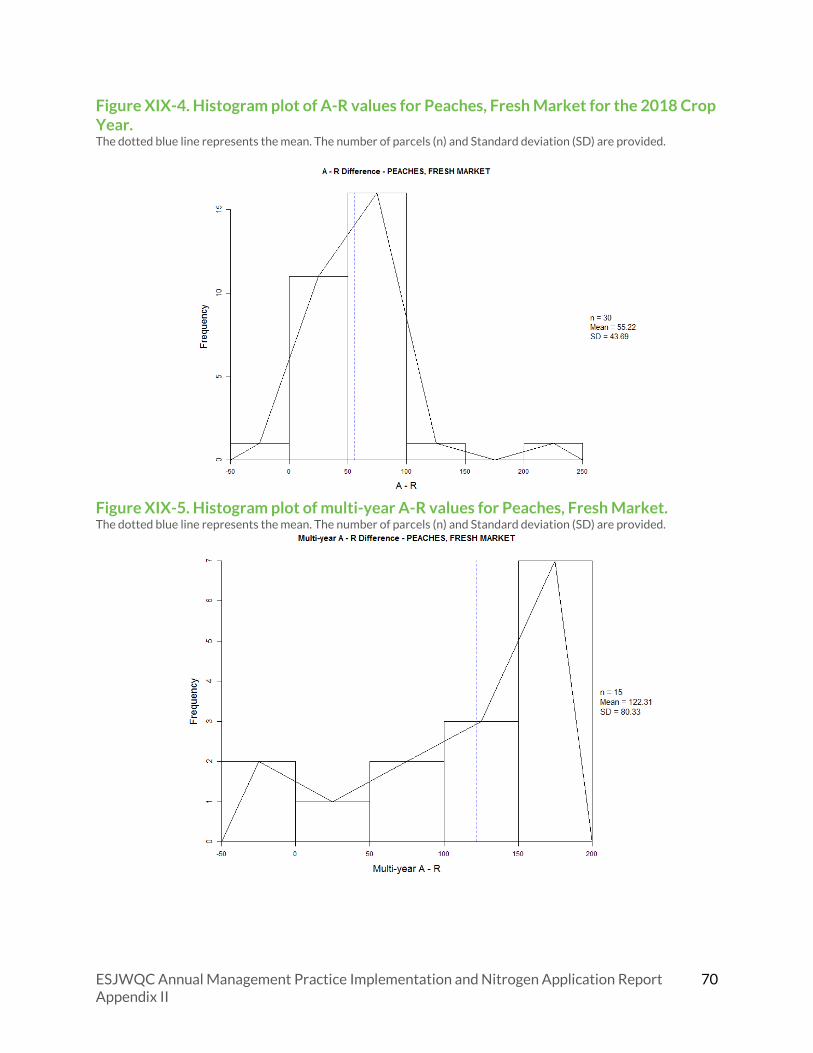
ESJWQC Annual Management Practice Implementation and Nitrogen Application Report Appendix II
70
Figure XIX-4. Histogram plot of A-R values for Peaches, Fresh Market for the 2018 Crop Year. The dotted blue line represents the mean. The number of parcels (n) and Standard deviation (SD) are provided.
Figure XIX-5. Histogram plot of multi-year A-R values for Peaches, Fresh Market. The dotted blue line represents the mean. The number of parcels (n) and Standard deviation (SD) are provided.
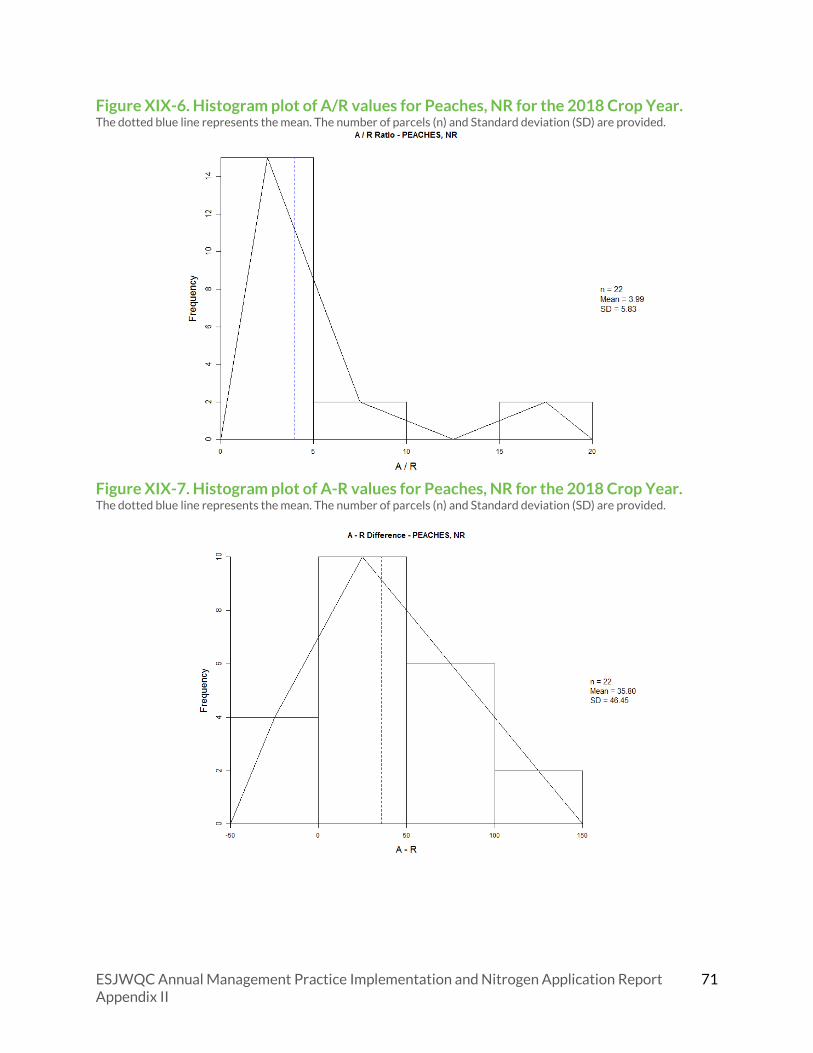
ESJWQC Annual Management Practice Implementation and Nitrogen Application Report Appendix II
71
Figure XIX-6. Histogram plot of A/R values for Peaches, NR for the 2018 Crop Year.
The dotted blue line represents the mean. The number of parcels (n) and Standard deviation (SD) are provided.
Figure XIX-7. Histogram plot of A-R values for Peaches, NR for the 2018 Crop Year. The dotted blue line represents the mean. The number of parcels (n) and Standard deviation (SD) are provided.

ESJWQC Annual Management Practice Implementation and Nitrogen Application Report Appendix II
72
Figure XIX-8. Box and Whisker plot of multi-year A/R for Peaches, Processing parcels. The number of parcels (n), mean, and standard deviation (SD) are provided. The dotted blue line represents the medcouple upper fence. Multi-year A/R ratios exceeding the upper fence are considered outliers and are represented by red dots.

ESJWQC Annual Management Practice Implementation and Nitrogen Application Report Appendix II
73
Figure XIX-9. Histogram plot of A/R values for Peaches, Processing for the 2018 Crop Year.
The dotted blue line represents the mean. The number of parcels (n) and Standard deviation (SD) are provided.
Figure XIX-10. Histogram plot of multi-year A/R values for Peaches, Processing. The dotted blue line represents the mean. The number of parcels (n) and Standard deviation (SD) are provided.

ESJWQC Annual Management Practice Implementation and Nitrogen Application Report Appendix II
74
Figure XIX-11. Histogram plot of A-R values for Peaches, Processing for the 2018 Crop Year. The dotted blue line represents the mean. The number of parcels (n) and Standard deviation (SD) are provided.
Figure XIX-12. Histogram plot of multi-year A-R values for Peaches, Processing. The dotted blue line represents the mean. The number of parcels (n) and Standard deviation (SD) are provided.

ESJWQC Annual Management Practice Implementation and Nitrogen Application Report Appendix II
75
XX. PECANS
Important analysis considerations: The calculation of nitrogen removed at harvest for Walnuts assumes that 0.01595 lbs N/lbs with shells are removed at harvest. This estimate is obtained from Geisseler (2016). The Coalition used
this value for nitrogen removal for Pecans as Pecans are not provided in the Geissler report.
Table XX-1. Summary statistics for Pecans.
SPECIFIC CROP PARAMETER N PARCELS ACREAGE MEAN STANDARD
DEVIATION MIN MAX
N
OUTLIERS
PECANS
A/R 10 242 16.51 34.95 0 100 -- Multi-year A/R 1 2 1.94 -- 1.94 1.94 --
A-R 7 227 88.33 80.63 0 238 -- Multi-year A-R 1 2 106.8 -- 107 107 --
Figure XX-1. Histogram plot of A/R values for Pecans for the 2018 Crop Year.
The dotted blue line represents the mean. The number of parcels (n) and Standard deviation (SD) are provided.

ESJWQC Annual Management Practice Implementation and Nitrogen Application Report Appendix II
76
Figure XX-2. Histogram plot of A-R values for Pecans for the 2018 Crop Year. The dotted blue line represents the mean. The number of parcels (n) and Standard deviation (SD) are provided.

ESJWQC Annual Management Practice Implementation and Nitrogen Application Report Appendix II
77
XXI. PISTACHIOS
Important analysis considerations: The calculation of nitrogen removed at harvest for Pistachios assumes that 0.02805 lbs N/lbs of dry yield are removed at harvest. This estimate is obtained from Geisseler (2016). The author
considers that this value is a good estimate for nitrogen removed from pistachio orchards in the Central Valley.
Table XXI-1. Summary statistics for Pistachios.
SPECIFIC CROP PARAMETER N PARCELS ACREAGE MEAN STANDARD
DEVIATION MIN MAX
N
OUTLIERS
PISTACHIOS
A/R 513 38,915 2.13 2.73 0 23.8 -- Multi-year A/R 121 15,794 2.48 1.55 0.87 8.22 6
A-R 508 38,657 39.43 60.02 -115 215 -- Multi-year A-R 121 15,794 229.2 123.58 -27.8 501 --
Figure XXI-1. Box and Whisker plot of multi-year A/R for Pistachios parcels. The number of parcels (n), mean, and standard deviation (SD) are provided. The dotted blue line represents the medcouple upper fence. Multi-year A/R ratios exceeding the upper fence are considered outliers and are represented by red dots.

ESJWQC Annual Management Practice Implementation and Nitrogen Application Report Appendix II
78
Figure XXI-2. Histogram plot of A/R values for Pistachios for the 2018 Crop Year.
The dotted blue line represents the mean. The number of parcels (n) and Standard deviation (SD) are provided.
Figure XXI-3. Histogram plot of multi-year A/R values for Pistachios. The dotted blue line represents the mean. The number of parcels (n) and Standard deviation (SD) are provided.

ESJWQC Annual Management Practice Implementation and Nitrogen Application Report Appendix II
79
Figure XXI-4. Histogram plot of A-R values for Pistachios for the 2018 Crop Year. The dotted blue line represents the mean. The number of parcels (n) and Standard deviation (SD) are provided.
Figure XXI-5. Histogram plot of multi-year A-R values for Pistachios. The dotted blue line represents the mean. The number of parcels (n) and Standard deviation (SD) are provided.

ESJWQC Annual Management Practice Implementation and Nitrogen Application Report Appendix II
80
XXII. PLUMS
Important analysis considerations: The calculation of nitrogen removed at harvest for Plums assumes that 0.001415 lbs N/lbs of fruits are removed at harvest. This estimate is obtained from Geisseler (2016). The author
considers that it is not possible to determine how well the dataset represents nitrogen concentrations in the Central Valley.
Table XXII-1. Summary statistics for Plums.
SPECIFIC CROP PARAMETER N PARCELS ACREAGE MEAN STANDARD
DEVIATION MIN MAX
N
OUTLIERS
PLUMS
A/R 8 52 6.96 5.97 1.06 17.7 -- Multi-year A/R 2 6 6.56 7.28 1.41 11.7 --
A-R 8 52 73.91 45.37 2.55 118 -- Multi-year A-R 2 6 190.1 176.14 65.5 315 --
Figure XXII-1. Histogram plot of A/R values for Plums for the 2018 Crop Year.
The dotted blue line represents the mean. The number of parcels (n) and Standard deviation (SD) are provided.

ESJWQC Annual Management Practice Implementation and Nitrogen Application Report Appendix II
81
Figure XXII-2. Histogram plot of A-R values for Plums for the 2018 Crop Year. The dotted blue line represents the mean. The number of parcels (n) and Standard deviation (SD) are provided.

ESJWQC Annual Management Practice Implementation and Nitrogen Application Report Appendix II
82
XXIII. POMEGRANATE
Important analysis considerations: The calculation of nitrogen removed at harvest for Pomegranates assumes that 0.0076 lbs N/lbs of fruits are removed at harvest. This estimate is obtained from Geisseler (2016). The author
considers that it is not possible to determine the degree to which the value is representative of pomegranates harvested in the Central Valley.
Table XXIII-1. Summary statistics for Pomegranate.
SPECIFIC CROP PARAMETER N PARCELS ACREAGE MEAN STANDARD
DEVIATION MIN MAX
N
OUTLIERS
POMEGRANATE
A/R 19 533 0.77 1.08 0 2.45 -- Multi-year A/R 14 373 1.37 1.32 0.04 3.19 0
A-R 18 517 -75.5 282.75 -1163 56.2 -- Multi-year A-R 14 373 -78.6 257.33 -803 144 --
Figure XXIII-1. Box and Whisker plot of multi-year A/R for Pomegranate parcels. The number of parcels (n), mean, and standard deviation (SD) are provided. The dotted blue line represents the medcouple upper fence. Multi-year A/R ratios exceeding the upper fence are considered outliers and are represented by red dots.

ESJWQC Annual Management Practice Implementation and Nitrogen Application Report Appendix II
83
Figure XXIII-2. Histogram plot of A/R values for Pomegranates for the 2018 Crop Year.
The dotted blue line represents the mean. The number of parcels (n) and Standard deviation (SD) are provided.
Figure XXIII-3. Histogram plot of multi-year A/R values for Pomegranates. The dotted blue line represents the mean. The number of parcels (n) and Standard deviation (SD) are provided.

ESJWQC Annual Management Practice Implementation and Nitrogen Application Report Appendix II
84
Figure XXIII-4. Histogram plot of A-R values for Pomegranates for the 2018 Crop Year. The dotted blue line represents the mean. The number of parcels (n) and Standard deviation (SD) are provided.
Figure XXIII-5. Histogram plot of multi-year A-R values for Pomegranates. The dotted blue line represents the mean. The number of parcels (n) and Standard deviation (SD) are provided.

ESJWQC Annual Management Practice Implementation and Nitrogen Application Report Appendix II
85
XXIV. PRUNES
Important analysis considerations: The calculation of nitrogen removed at harvest for Prunes assumes that 0.0056 lbs N/lbs of dried fruit are removed at harvest. This estimate is obtained from Geisseler (2016). The author
considers that the value is likely a good estimate of the nitrogen concentration from Central Valley.
Table XXIV-1. Summary statistics for Prunes.
SPECIFIC CROP PARAMETER N PARCELS ACREAGE MEAN STANDARD
DEVIATION MIN MAX
N
OUTLIERS
PRUNES
A/R 92 1,823 5.99 1.58 2.08 17.9 -- Multi-year A/R 47 993 5 0.28 3.34 5.48 4
A-R 92 1,823 77.8 28.29 41 167 -- Multi-year A-R 47 993 370.6 50.71 284 531 --
Figure XXIV-1. Box and Whisker plot of multi-year A/R for Prune parcels. The number of parcels (n), mean, and standard deviation (SD) are provided. The dotted blue line represents the medcouple upper fence. Multi-year A/R ratios exceeding the upper fence are considered outliers and are represented by red dots.

ESJWQC Annual Management Practice Implementation and Nitrogen Application Report Appendix II
86
Figure XXIV-2. Histogram plot of A/R values for Prunes for the 2018 Crop Year.
The dotted blue line represents the mean. The number of parcels (n) and Standard deviation (SD) are provided.
Figure XXIV-3. Histogram plot of multi-year A/R values for Prunes. The dotted blue line represents the mean. The number of parcels (n) and Standard deviation (SD) are provided.

ESJWQC Annual Management Practice Implementation and Nitrogen Application Report Appendix II
87
Figure XXIV-4. Histogram plot of A-R values for Prunes for the 2018 Crop Year. The dotted blue line represents the mean. The number of parcels (n) and Standard deviation (SD) are provided.
Figure XXIV-5. Histogram plot of multi-year A-R values for Prunes. The dotted blue line represents the mean. The number of parcels (n) and Standard deviation (SD) are provided.

ESJWQC Annual Management Practice Implementation and Nitrogen Application Report Appendix II
88
XXV. PUMPKINS
Important analysis considerations: The calculation of nitrogen removed at harvest for Pumpkins assumes that 0.00368 lbs N/lbs of fresh weight are removed at harvest. This estimate is obtained from Geisseler (2016). The author
considers that this value is likely not representative of nitrogen concentration of pumpkins in the Central Valley.
Table XXV-1. Summary statistics for Pumpkins.
SPECIFIC CROP PARAMETER N PARCELS ACREAGE MEAN STANDARD
DEVIATION MIN MAX
N
OUTLIERS
PUMPKINS
A/R 3 54 1.58 1.57 0.65 3.4 -- Multi-year A/R 1 9 3.4 -- 3.4 3.4 --
A-R 3 54 -14.3 73.51 -59.4 70.6 -- Multi-year A-R 1 9 211.8 -- 212 212 --
Figure XXV-1. Histogram plot of A/R values for Pumpkins for the 2018 Crop Year.
The dotted blue line represents the mean. The number of parcels (n) and Standard deviation (SD) are provided.
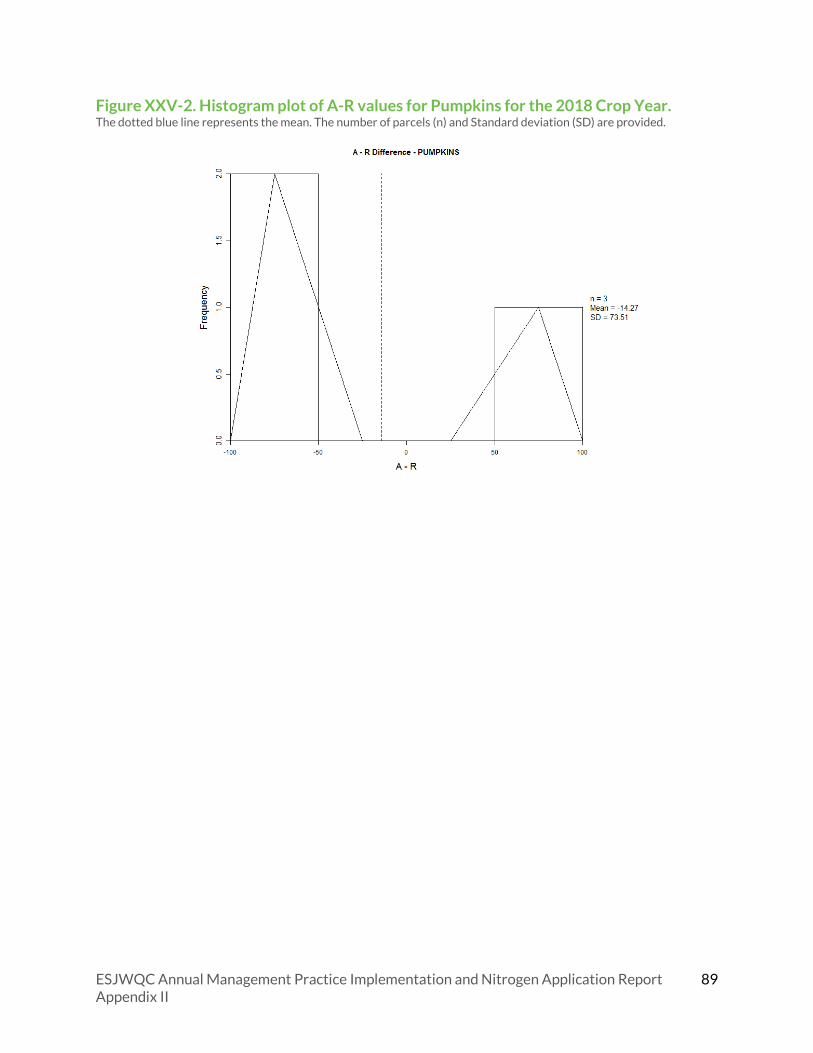
ESJWQC Annual Management Practice Implementation and Nitrogen Application Report Appendix II
89
Figure XXV-2. Histogram plot of A-R values for Pumpkins for the 2018 Crop Year. The dotted blue line represents the mean. The number of parcels (n) and Standard deviation (SD) are provided.

ESJWQC Annual Management Practice Implementation and Nitrogen Application Report Appendix II
90
XXVI. SMALL GRAINS
Important analysis considerations: The calculation of nitrogen removed at harvest for Small Grains – Grain, Average assumes that 0.01968 lbs N/lbs of grain at 12% moisture are removed at harvest. This estimate is obtained from
Geisseler (2016). This is an average of barley, triticale, oats, common wheat and durum wheat. The Coalition applied this value to small grains reported. As means and ranges overlap
substantially among the different small grains, this is likely a reasonable estimate of nitrogen removal with small grains grain in the Central Valley.
Table XXVI-1. Summary statistics for Small Grains.
SPECIFIC CROP PARAMETER N PARCELS ACREAGE MEAN STANDARD
DEVIATION MIN MAX
N
OUTLIERS
SMALL GRAINS (EXCL WHEAT
AND OATS), GRAIN
A/R 31 1,104 0.14 0.35 0 1.5 -- Multi-year A/R 2 80 0 0 0 0 --
A-R 31 1,104 -23.2 63.31 -236 18.9 -- Multi-year A-R 2 80 -1496 0 -1496 -1496 --
Figure XXVI-1. Histogram plot of A/R values for Small Grains (Excl Wheat and Oats), Grain for the 2018 Crop Year.
The dotted blue line represents the mean. The number of parcels (n) and Standard deviation (SD) are provided.

ESJWQC Annual Management Practice Implementation and Nitrogen Application Report Appendix II
91
Figure XXVI-2. Histogram plot of A-R values for Small Grains (Excl Wheat and Oats), Grain for the 2018 Crop Year. The dotted blue line represents the mean. The number of parcels (n) and Standard deviation (SD) are provided.
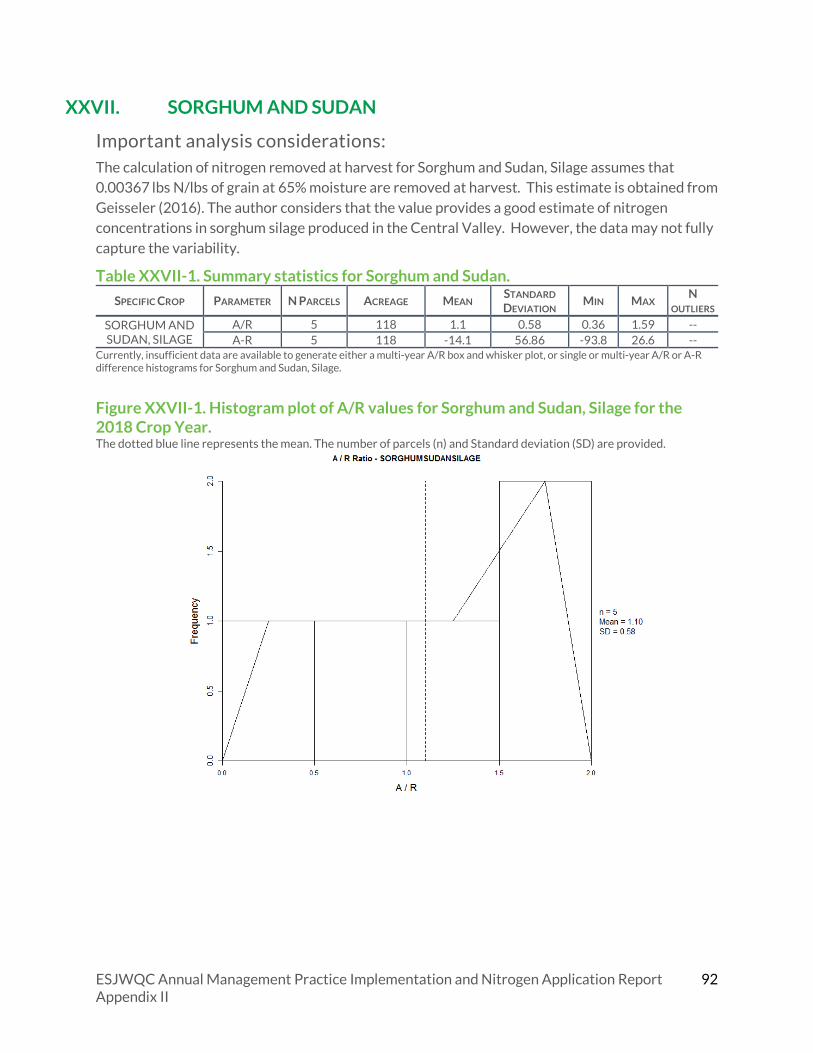
ESJWQC Annual Management Practice Implementation and Nitrogen Application Report Appendix II
92
XXVII. SORGHUM AND SUDAN
Important analysis considerations: The calculation of nitrogen removed at harvest for Sorghum and Sudan, Silage assumes that 0.00367 lbs N/lbs of grain at 65% moisture are removed at harvest. This estimate is obtained from
Geisseler (2016). The author considers that the value provides a good estimate of nitrogen concentrations in sorghum silage produced in the Central Valley. However, the data may not fully
capture the variability.
Table XXVII-1. Summary statistics for Sorghum and Sudan.
SPECIFIC CROP PARAMETER N PARCELS ACREAGE MEAN STANDARD
DEVIATION MIN MAX
N
OUTLIERS
SORGHUM AND SUDAN, SILAGE
A/R 5 118 1.1 0.58 0.36 1.59 -- A-R 5 118 -14.1 56.86 -93.8 26.6 --
Currently, insufficient data are available to generate either a multi-year A/R box and whisker plot, or single or multi-year A/R or A-R difference histograms for Sorghum and Sudan, Silage.
Figure XXVII-1. Histogram plot of A/R values for Sorghum and Sudan, Silage for the 2018 Crop Year.
The dotted blue line represents the mean. The number of parcels (n) and Standard deviation (SD) are provided.

ESJWQC Annual Management Practice Implementation and Nitrogen Application Report Appendix II
93
Figure XXVII-2. Histogram plot of A-R values for Sorghum and Sudan, Silage for the 2018 Crop Year. The dotted blue line represents the mean. The number of parcels (n) and Standard deviation (SD) are provided.

ESJWQC Annual Management Practice Implementation and Nitrogen Application Report Appendix II
94
XXVIII. SWEET POTATOES
Important analysis considerations: The calculation of nitrogen removed at harvest for Sweet Potatoes assumes that 0.00237 lbs N/lbs of fresh weight are removed at harvest. This estimate is obtained from Geisseler (2016).
The author considers that the value is a good estimate for nitrogen removed with sweet potatoes from Central Valley fields.
Table XXVIII-1. Summary statistics for Sweet Potatoes.
SPECIFIC CROP PARAMETER N PARCELS ACREAGE MEAN STANDARD
DEVIATION MIN MAX
N
OUTLIERS
SWEET POTATOES
A/R 327 9,612 2.62 9.85 0 132 -- Multi-year A/R 157 4,881 1.91 2.1 1.06 27.9 21
A-R 320 9,528 37.02 67.25 -62.2 310 -- Multi-year A-R 157 4,881 258.5 63.13 17.2 368 --
Figure XXVIII-1. Box and Whisker plot of multi-year A/R for Sweet Potatoes parcels. The number of parcels (n), mean, and standard deviation (SD) are provided. The dotted blue line represents the medcouple upper fence. Multi-year A/R ratios exceeding the upper fence are considered outliers and are represented by red dots.

ESJWQC Annual Management Practice Implementation and Nitrogen Application Report Appendix II
95
Figure XXVIII-2. Histogram plot of A/R values for Sweet Potatoes for the 2018 Crop Year.
The dotted blue line represents the mean. The number of parcels (n) and Standard deviation (SD) are provided.
Figure XXVIII-3. Histogram plot of multi-year A/R values for Sweet Potatoes. The dotted blue line represents the mean. The number of parcels (n) and Standard deviation (SD) are provided.

ESJWQC Annual Management Practice Implementation and Nitrogen Application Report Appendix II
96
Figure XXVIII-4. Histogram plot of A-R values for Sweet Potatoes for the 2018 Crop Year. The dotted blue line represents the mean. The number of parcels (n) and Standard deviation (SD) are provided.
Figure XXVIII-5. Histogram plot of multi-year A-R values for Sweet Potatoes. The dotted blue line represents the mean. The number of parcels (n) and Standard deviation (SD) are provided.

ESJWQC Annual Management Practice Implementation and Nitrogen Application Report Appendix II
97
XXIX. TOMATOES
Important analysis considerations: The calculation of nitrogen removed at harvest for Tomatoes, Fresh Market assumes that 0.001305 lbs N/lbs of fresh weight are removed at harvest. This estimate is obtained from
Geisseler (2016). The author considers that it is not possible to determine the degree to which the dataset is representative of tomatoes harvested in the Central Valley. However, means and
ranges overlap substantially, with processing tomatoes from the Central Valley.
The calculation of nitrogen removed at harvest for Tomatoes, Average assumes that 0.001335 lbs N/lbs of fresh weight are removed at harvest. This estimate is obtained from Geisseler (2016).
The author evaluated market and processing tomatoes separately. Means and ranges for the two CN coefficients overlap substantially. The Coalition created a tomato average CN coefficient and
applied that to cases when the grower did not specify the kind of tomato reported. As values overlap substantially, and there is good representation for processing tomatoes in the Central
Valley, this is likely a reasonable estimate for tomato nitrogen removal in the region.
The calculation of nitrogen removed at harvest for Tomatoes, Processing assumes that 0.001365 lbs N/lbs of fresh weight are removed at harvest. This estimate is obtained from Geisseler (2016).
The author considers that the average value can be considered a very good estimate for the Central Valley.
Table XXIX-1. Summary statistics for Tomatoes.
SPECIFIC CROP PARAMETER N PARCELS ACREAGE MEAN STANDARD
DEVIATION MIN MAX
N
OUTLIERS
TOMATOES, FRESH
MARKET
A/R 24 1,943 4.69 1.37 1.97 9.2 -- Multi-year A/R 3 279 3.9 1.06 2.68 4.51 --
A-R 24 1,943 140.4 23.69 87 194 -- Multi-year A-R 3 279 485.4 104.9 364 546 --
TOMATOES, NR
A/R 9 859 1.57 1.04 0 3.95 -- Multi-year A/R 1 35 1.38 -- 1.38 1.38 --
A-R 8 829 85.23 46.58 -10.2 116 -- Multi-year A-R 1 35 173.5 -- 174 174 --
TOMATOES, PROCESSING
A/R 27 2,249 1.37 0.28 1.15 2.45 -- Multi-year A/R 2 270 1.33 0 1.33 1.33 --
A-R 27 2,249 53.14 37.14 26 207 -- Multi-year A-R 2 270 139.8 0 140 140 --

ESJWQC Annual Management Practice Implementation and Nitrogen Application Report Appendix II
98
Figure XXIX-1. Histogram plot of A/R values for Tomatoes, Fresh Market for the 2018 Crop Year.
The dotted blue line represents the mean. The number of parcels (n) and Standard deviation (SD) are provided.
Figure XXIX-2. Histogram plot of A-R values for Tomatoes, Fresh Market for the 2018 Crop Year. The dotted blue line represents the mean. The number of parcels (n) and Standard deviation (SD) are provided.
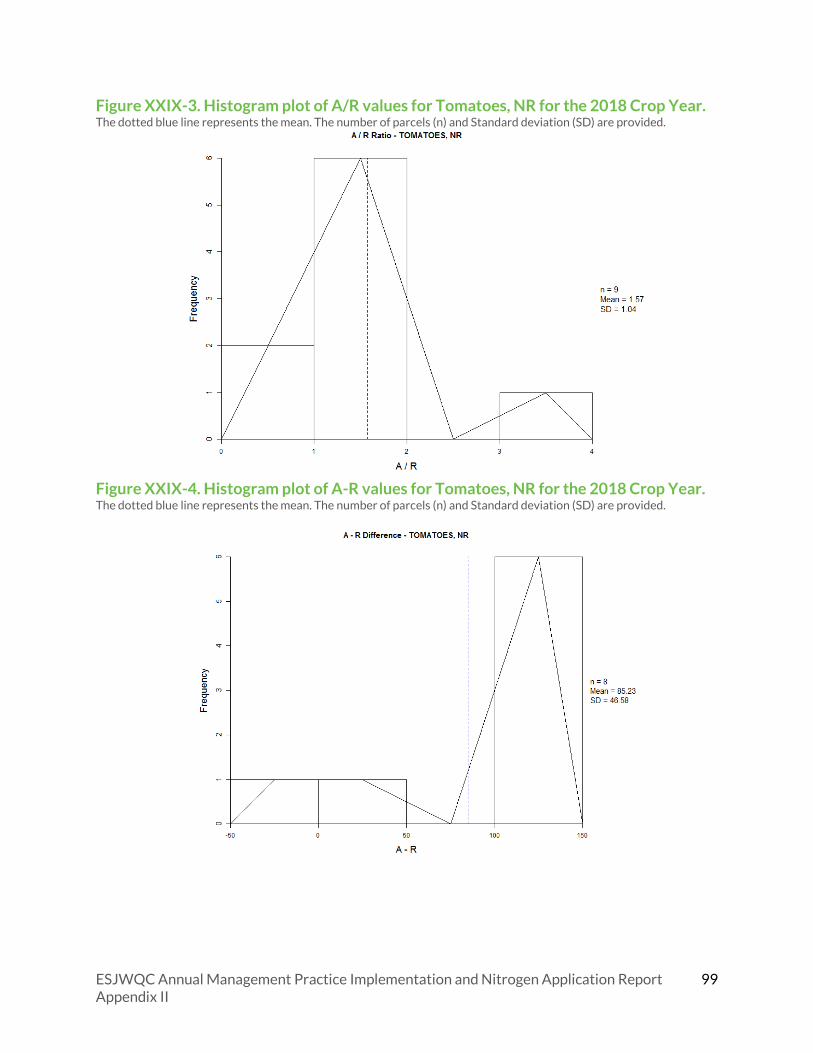
ESJWQC Annual Management Practice Implementation and Nitrogen Application Report Appendix II
99
Figure XXIX-3. Histogram plot of A/R values for Tomatoes, NR for the 2018 Crop Year.
The dotted blue line represents the mean. The number of parcels (n) and Standard deviation (SD) are provided.
Figure XXIX-4. Histogram plot of A-R values for Tomatoes, NR for the 2018 Crop Year. The dotted blue line represents the mean. The number of parcels (n) and Standard deviation (SD) are provided.

ESJWQC Annual Management Practice Implementation and Nitrogen Application Report Appendix II
100
Figure XXIX-5. Histogram plot of A/R values for Tomatoes, Processing for the 2018 Crop Year.
The dotted blue line represents the mean. The number of parcels (n) and Standard deviation (SD) are provided.
Figure XXIX-6. Histogram plot of A-R values for Tomatoes, Processing for the 2018 Crop Year. The dotted blue line represents the mean. The number of parcels (n) and Standard deviation (SD) are provided.

ESJWQC Annual Management Practice Implementation and Nitrogen Application Report Appendix II
101
XXX. WALNUTS
Important analysis considerations: The calculation of nitrogen removed at harvest for Walnuts assumes that 0.01595 lbs N/lbs with shells are removed at harvest. This estimate is obtained from Geisseler (2016). The author
considers that the value can be considered a good estimate of nitrogen removed with walnuts in the Central Valley. However, the data range may not fully capture the variability.
Table XXX-1. Summary statistics for Walnuts.
SPECIFIC CROP PARAMETER N PARCELS ACREAGE MEAN STANDARD
DEVIATION MIN MAX
N
OUTLIERS
WALNUTS
A/R 791 22,579 2.66 5.77 0 100 -- Multi-year A/R 353 11,939 2.2 0.97 0.52 12.2 1
A-R 772 22,339 64.87 50.22 -118 352 -- Multi-year A-R 353 11,939 221.4 121.67 -154 622 --
Figure XXX-1. Box and Whisker plot of multi-year A/R for Walnuts parcels. The number of parcels (n), mean, and standard deviation (SD) are provided. The dotted blue line represents the medcouple upper fence. Multi-year A/R ratios exceeding the upper fence are considered outliers and are represented by red dots.

ESJWQC Annual Management Practice Implementation and Nitrogen Application Report Appendix II
102
Figure XXX-2. Histogram plot of A/R values for Walnuts for the 2018 Crop Year.
The dotted blue line represents the mean. The number of parcels (n) and Standard deviation (SD) are provided.
Figure XXX-3. Histogram plot of multi-year A/R values for Walnuts. The dotted blue line represents the mean. The number of parcels (n) and Standard deviation (SD) are provided.

ESJWQC Annual Management Practice Implementation and Nitrogen Application Report Appendix II
103
Figure XXX-4. Histogram plot of A-R values for Walnuts for the 2018 Crop Year. The dotted blue line represents the mean. The number of parcels (n) and Standard deviation (SD) are provided.
Figure XXX-5. Histogram plot of multi-year A-R values for Walnuts. The dotted blue line represents the mean. The number of parcels (n) and Standard deviation (SD) are provided.

ESJWQC Annual Management Practice Implementation and Nitrogen Application Report Appendix II
104
XXXI. WHEAT
Important analysis considerations: The calculation of nitrogen removed at harvest for Wheat, Grain assumes that 0.021275 lbs N/lbs of grain at 12% moisture are removed at harvest. This estimate is obtained from Geisseler (2016).
The author evaluated grains from common wheat and durum wheat separately. Coalition growers did not differentiate between the two types of wheat. The Coalition applied this average to all
wheat reported by the growers. Both values overlap substantially, and results are highly representative of wheat grown in Central Valley.
The calculation of nitrogen removed at harvest for Wheat, Silage assumes that 0.00525 lbs N/lbs
of grain at 70% moisture are removed at harvest. This estimate is obtained from Geisseler (2016). The author considers that the dataset likely provides a good estimate of the average nitrogen
concentration in wheat silage produced in the Central Valley. However, the data may not fully capture the variability.
Table XXXI-1. Summary statistics for Wheat.
SPECIFIC CROP PARAMETER N PARCELS ACREAGE MEAN STANDARD
DEVIATION MIN MAX
N
OUTLIERS
WHEAT, GRAIN
A/R 27 2,354 0.91 0.76 0 2.22 -- A-R 26 2,204 -5.07 105.86 -149 177 --
WHEAT, SILAGE
A/R 35 1,606 0.52 0.23 0 0.91 -- Multi-year A/R 5 90 0.48 0.04 0.44 0.54 --
A-R 34 1,559 -81 34.24 -144 -17 -- Multi-year A-R 5 90 -295 22.5 -306 -255 --

ESJWQC Annual Management Practice Implementation and Nitrogen Application Report Appendix II
105
Figure XXXI-1. Histogram plot of A/R values for Wheat, Grain for the 2018 Crop Year.
The dotted blue line represents the mean. The number of parcels (n) and Standard deviation (SD) are provided.
Figure XXXI-2. Histogram plot of A-R values for Wheat, Grain for the 2018 Crop Year. The dotted blue line represents the mean. The number of parcels (n) and Standard deviation (SD) are provided.

ESJWQC Annual Management Practice Implementation and Nitrogen Application Report Appendix II
106
Figure XXXI-3. Histogram plot of A/R values for Wheat, Silage for the 2018 Crop Year.
The dotted blue line represents the mean. The number of parcels (n) and Standard deviation (SD) are provided.
Figure XXXI-4. Histogram plot of A-R values for Wheat, Silage for the 2018 Crop Year. The dotted blue line represents the mean. The number of parcels (n) and Standard deviation (SD) are provided.

ESJWQC Annual Management Practice Implementation and Nitrogen Application Report Appendix II
107
XXXII. OTHER CROPS
Table XXXII-1Summary statistics for crops with limited representation in the ESJWQC region. Crops with only one management unit with complete data (Count = 1) or more than one management units with identical values, have no summary statistics because a range of values is necessary to estimate percentiles.
CROP PARAMETER N PARCELS ACREAGE MEAN STANDARD
DEVIATION MIN MAX
ALFALFA, GREENCHOP A/Y 49 2614 0.03 0.02 0 0.13 BEETS A/Y 17 119 0 0 0 0
BERRY, BLACKBERRY A/R 1 1 0 -- 0 0 A-R 0 -- -- -- -- --
BOK CHOY A/Y 18 64 0 0 0 0.01 BOK CHOY, BABY A/Y 17 68 0.01 0 0.01 0.01
CABBAGE A/Y 17 234 0 0 0 0.01
CARROTS A/R 5 719 1.33 0 1.33 1.33 A-R 5 719 39.2 0 39.2 39.2
CELERY ROOT A/Y 17 19 0 0 0 0
CHARD
A/R 51 148 3.41 0 3.41 3.41 Multi-year A/R 17 148 3.03 0 3.03 3.03
A-R 51 148 107.5 0 107 107 Multi-year A-R 17 148 271.5 0 272 272
CHESTNUTS A/Y 4 28 0.54 0.91 0.01 1.6
CITRUS, TANGERINES A/R 2 35 2.64 -- 2.64 2.64 A-R 2 35 42.95 14.22 32.9 53
CLOVER, NR A/Y 1 23 -- -- -- -- CORN, NR A/Y 9 402 0 0 0 0.01
CORN, SWEET A/R 1 141 5.26 -- 5.26 5.26 A-R 1 141 162 -- 162 162
DAIKON A/Y 17 8 0 0 0 0 ENDIVE A/Y 17 10 0.01 0 0.01 0.01
ESCAROLE A/Y 17 10 0.01 0 0.01 0.01 FENNEL A/Y 17 5 0.01 0 0.01 0.01
FLOWERS (LAVENDER) A/Y 1 1 -- -- -- -- FORAGE GRASS, FORAGE A/Y 57 2784 0.04 0.2 0 1.06 FORAGE GRASS, SILAGE A/Y 2 70 0 0 0 0
GARLIC A/R 2 299 1.94 0 1.94 1.94 A-R 2 299 111.5 0 112 112
GREENS, COLLARD
A/R 17 140 3.87 0 3.87 3.87 Multi-year A/R 17 140 3.56 0 3.56 3.56
A-R 17 140 157.9 0 158 158 Multi-year A-R 17 140 422.7 0 423 423
HERBS, FRESH CUT A/Y 19 81 0.07 0.02 0.02 0.08 KIWIFRUIT A/Y 1 8 0.02 -- 0.02 0.02 KOHLRABI A/Y 17 39 0.01 0 0.01 0.01
LEEKS A/Y 17 51 0.01 0 0.01 0.01
MELONS, CANTALOUPE A/R 1 1 3.29 -- 3.29 3.29 A-R 1 1 55.65 -- 55.7 55.7
MELONS, NR A/Y 1 4 0 -- 0 0
MELONS, WATERMELON A/R 1 1 4.8 -- 4.8 4.8 A-R 1 1 79.15 -- 79.2 79.2
OATS, FORAGE A/Y 6 312 0 0 0 0.01 OATS, GREENCHOP A/Y 6 712 0 0 0 0
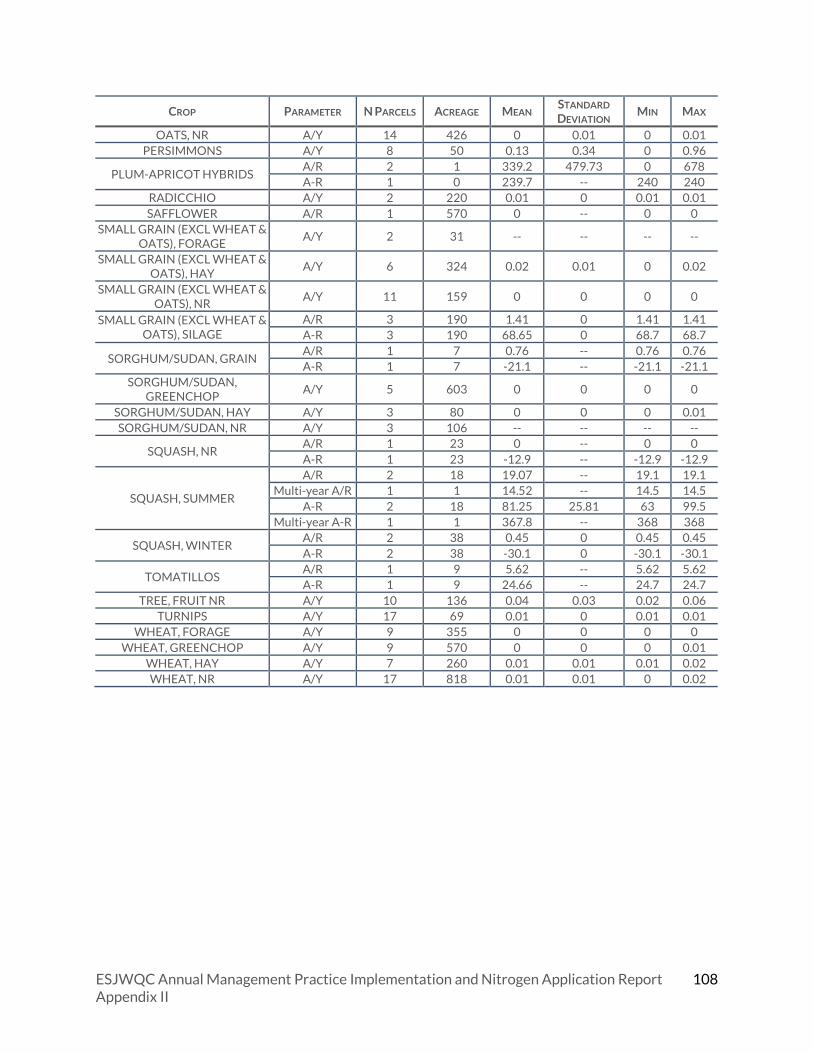
ESJWQC Annual Management Practice Implementation and Nitrogen Application Report Appendix II
108
CROP PARAMETER N PARCELS ACREAGE MEAN STANDARD
DEVIATION MIN MAX
OATS, NR A/Y 14 426 0 0.01 0 0.01 PERSIMMONS A/Y 8 50 0.13 0.34 0 0.96
PLUM-APRICOT HYBRIDS A/R 2 1 339.2 479.73 0 678 A-R 1 0 239.7 -- 240 240
RADICCHIO A/Y 2 220 0.01 0 0.01 0.01 SAFFLOWER A/R 1 570 0 -- 0 0
SMALL GRAIN (EXCL WHEAT & OATS), FORAGE
A/Y 2 31 -- -- -- --
SMALL GRAIN (EXCL WHEAT & OATS), HAY
A/Y 6 324 0.02 0.01 0 0.02
SMALL GRAIN (EXCL WHEAT & OATS), NR
A/Y 11 159 0 0 0 0
SMALL GRAIN (EXCL WHEAT & OATS), SILAGE
A/R 3 190 1.41 0 1.41 1.41 A-R 3 190 68.65 0 68.7 68.7
SORGHUM/SUDAN, GRAIN A/R 1 7 0.76 -- 0.76 0.76 A-R 1 7 -21.1 -- -21.1 -21.1
SORGHUM/SUDAN, GREENCHOP
A/Y 5 603 0 0 0 0
SORGHUM/SUDAN, HAY A/Y 3 80 0 0 0 0.01 SORGHUM/SUDAN, NR A/Y 3 106 -- -- -- --
SQUASH, NR A/R 1 23 0 -- 0 0 A-R 1 23 -12.9 -- -12.9 -12.9
SQUASH, SUMMER
A/R 2 18 19.07 -- 19.1 19.1 Multi-year A/R 1 1 14.52 -- 14.5 14.5
A-R 2 18 81.25 25.81 63 99.5 Multi-year A-R 1 1 367.8 -- 368 368
SQUASH, WINTER A/R 2 38 0.45 0 0.45 0.45 A-R 2 38 -30.1 0 -30.1 -30.1
TOMATILLOS A/R 1 9 5.62 -- 5.62 5.62 A-R 1 9 24.66 -- 24.7 24.7
TREE, FRUIT NR A/Y 10 136 0.04 0.03 0.02 0.06 TURNIPS A/Y 17 69 0.01 0 0.01 0.01
WHEAT, FORAGE A/Y 9 355 0 0 0 0 WHEAT, GREENCHOP A/Y 9 570 0 0 0 0.01
WHEAT, HAY A/Y 7 260 0.01 0.01 0.01 0.02 WHEAT, NR A/Y 17 818 0.01 0.01 0 0.02

Appendix III NITROGEN EVALUATION PACKET EXAMPLE

Dear Member,
You submitted to the ESJWQC in Spring of 2018 a Nitrogen Management Plan (NMP) Summary Report that contained information on the nitrogen applied to your crop in 2017. Enclosed is a summary of the nitrogen use information you submitted plus an analysis of that information. This includes a comparison to other members in high vulnerability areas who produce the same crop. This data was part of a summarized report submitted to the Central Valley Regional Water Board in compliance with the Irrigated Lands Regulatory Program. No personal information (e.g., name, address, parcels) were included in this report.
In previous years, the ESJWQC identified fields or management units that were statistical outliers. For the 2017 crop year, the ESJWQC did not identify outliers due to the outlier identification method being revised. The Coalition, along with all other Central Valley Coalitions, is proposing a new method for determining which values should be considered outliers. Although no outliers were identified for the 2017 crop year, it is important to understand how your reported nitrogen and yield data compare to other members growing the same crop. In the future, outliers will be subject to additional responsibilities, such as focused outreach meetings and additional surveys on nitrogen management practices.
Information in this packet includes:
The Coalition held crop-specific meetings in February 2019. You can watch the meeting or find out when the next meetings will be held at www.esjcoalition.org. These meetings count toward your required one Coalition event per year.
Thank you for your cooperation and please contact us if you have questions.
Thank you,
East San Joaquin Water Quality Coalition1201 L Street Modesto, CA 95354
(209) [email protected]
Section 1:Section 2:Section 3:
Analysis of Nitrogen Fertilizer Use in 2017No Action Required - Information Only
April 12, 2019
ID #: XXXX
Joe Farmer
1234 Farm RdTurlock CA
Your 2017 Summary ReportYour Nitrogen Use Evaluation (one for each crop)How to Interpret Your Nitrogen Use Evaluation, the Importance of Crop Coefficients
Parry Klassen Wayne Zipser
Mail to ID: XXXX

ID #: XXXXBelow is the information you reported to the ESJWQC in your Nitrogen Management Plan (NMP) Summary Report. If any of this information does not match your records, please contact the Coalition to update your information.
Management Unit Applied-N (pounds/acre)
Applied-N/ Yield
Yield per acre
Name Crop Age Acres A A/Y Y Units NotesAlmonds ALMONDS > 4 10 180 0.1125 1600 Pounds -
Code Definitions:NB = Non-Bearing crop.NC = Non Crop including experimental plots.NI = Units reported as not irrigated or dry farming.Y = If not reported, yield was calculated from your A/Y.
NR = Crop age or harvest type not reported.NY = No Yield harvested.PS = Plant stress resulted in lower than expected yield.
Section 1
Your 2017 NMP Summary Report
XXXX
NNA = No nitrogen applied.

Member ID#: XXXX
Management Unit Crop Age Applied-N/ Yield-pounds
Applied-N (pounds/acre)
Removed-N (pounds/acre)
Applied-N – Removed-N
Name Age A/Y-lbs* A R** A – RAlmonds > 4 112.5 180 109 71
How Do Your Management Units Compare To All Other ALMONDS Growers?1727 Coalition members reported on 3477 ALMONDS Management Units.Median A/Y-lbs x 1000 = 84.6986Median A = 150 pounds/acre
If you have two or more Management Units with the same A/Y-lbs or A, the points will overlap in the figures.
** R estimates are based on the assumption that nitrogen removed at harvest for ALMONDS is 0.068lbs N/lbs of marketable kernels.
* All Yields were converted to units of 1000 pounds. A/Y-lbs may differ from your reported A/Y if you reported yield in units other thanpounds.
Nitrogen Use Evaluation: ALMONDS (Page 1 of 1)
Section 2XXXX

Section 3 - How to Interpret Your Nitrogen Use Evaluation
Variable Definitions: A/Y (Applied/Yield) - A/Y is the ratio of nitrogen Applied divided by crop Yield. The A/Y ratio
is standardized by converting all units to pounds and multiplying by 1000 to allow for comparison of management units across the Coalition region (A/Y*).
R (Removed) - R is an estimate of how much nitrogen the crop used based on the reported yield. It is calculated by multiplying Yield by a Crop Coefficient.
A - R (Applied minus Removed) - Pounds of nitrogen applied minus the amount of nitrogen Removed. A-R estimates the amount of nitrogen not removed from the field as crop yield, which could potentially be “excess” nitrogen applied to the crop.
Bell Curves The bell curve represents all members with the same crop who reported A/Y values. The peak of the bell represents the most commonly reported values.
The peak of this curve shows the most commonly reported per acre nitrogen
Applied (A) values for the crop reported.
The further to the left on this curve a Management Unit falls, the more efficient the nitrogen usage - fields to the left get more yield per unit of N.

Section 3 – The Importance of Crop-Specific Nitrogen Coefficients
Overall, the majority of high-acreage crops in the Coalition region are considered to have “Good” nitrogen coefficients:
Here are how the nitrogen coefficients compare for some of the major crops in the region:
Good Reasonable Poor Not Available Almonds Citrus Cherries Forage Cotton Grapes Figs Greenchop Grains Grapes, raisins Grains, Corn Oats Hay, Alfalfa Greens Hay Rice Pistachios Olives Wheat Potatoes Peaches Prunes Walnuts Silage Silage, Corn Tomatoes
75%21%
2%3%
Percent of Coalition Acreage with Nitrogen Coefficients
GoodReasonablePoorNot Available
Crop-Specific Nitrogen Coefficients Crop-specific nitrogen coefficients are used to convert the reported yield to an estimate of the amount of nitrogen removed from the field at harvest. The resulting “removed” (R) value is then compared to the amount of nitrogen applied (A) to evaluate the relative efficiency of a field or management unit.
Since the R value is only as accurate as the nitrogen coefficient used to calculate it, the Coalition has evaluated each available crop-specific coefficient to determine if they are:
Good – sufficiently accurate to produce good removed estimates.
Reasonable – could be improved but likely to produce reasonable removed estimates.
Poor – need further development to produce accurate removed estimates.

Frequently Asked Questions FAQ 1. What does my A/Y mean?
A/Y (Applied divided by Yield) represents how much nitrogen you applied per unit of crop yield harvested. The lower this number is, the more efficient your nitrogen usage, and the lower the likelihood that excess nitrogen is leaching into groundwater.
FAQ 2. What is a ‘good’ A/Y?
Currently there are no target A/Y values. This is because not only is more information needed to know the optimal range for each crop type, but the A/Y value is a simplified way of looking at nitrogen usage on a farm. Think of it as an index. Therefore, A/Y is not always reflective of the actual conditions in the field. There are many factors that can contribute to nitrogen efficiency that are not captured by the A/Y value. Generally speaking, however, the lower the A/Y, the more efficient a grower is in managing their nitrogen applications (less applied and more harvested yield).
FAQ 3. What is “R” and how is that number determined?
“R” (or nitrogen removed) is an estimate of how much nitrogen is removed from the field at harvest. A crop-specific nitrogen coefficient is based on available literature and studies that determine the amount of nitrogen removed per pound of yield. For each crop with an available crop-specific nitrogen coefficient, the Coalition multiplies yield (pounds/acre) by the coefficient (nitrogen removed/pound) to determine the amount of nitrogen removed per acre or “R”. For some Central Valley crops, coefficients are in development or being further refined, and as such are subject to change.
FAQ 4. What does my ‘A-R’ tell me?
The ‘A-R’ value reported in Section 2 is a comparison of how much nitrogen was applied versus the estimated amount that was removed at harvest (based on yield). If the A-R value is positive, there may be nitrogen applied to the field that was not removed at harvest or used by the plant. The A-R calculation is the best estimate of the amount of nitrogen that could leach to groundwater. It is recognized that there may be field specific variability that would result in either more or less nitrogen being used by the crop than estimated with A-R.
FAQ 5. What should I do if my reported information in Section 1 is incorrect?
If the data in Section 1 does not accurately reflect the information submitted to the Coalition on your NMP Summary Report, please contact the Coalition to update your information.
FAQ 6. What should I do with this information?
The content of this packet is informational only. We encourage you to use it to inform your nitrogen management decisions in the future.
FAQ 7. What is an outlier?
The Coalition is currently proposing to the Regional Water Board a new outlier determination approach based on the statistical distribution of the values reported. This new approach will evaluate A/R ratios. A/R values determined to be significantly higher than the rest of those reported by other growers with the same crop will be considered outliers. If a crop-specific nitrogen coefficient is unknown for a certain crop, A/Y will utilized to determine the outlier.

FAQ 8. What is the difference between A/Y and A/R?
A/R will be used to determine outliers in the future. Since R is calculated using Y (A/R = A divided by yield x nitrogen coefficient), the distributions for evaluating outliers are similar. However, since R is calculated using a crop-specific nitrogen coefficient the values are more comparable across crops types with vastly different yields. Crop-specific nitrogen coefficients are still being developed and refined for some crops; if the nitrogen coefficient is not available, A/Y will be used to determine outliers.
FAQ 9. When will outliers be determined?
There are currently no outliers identified for the 2017 crop year, as the new outlier determination approach is still being reviewed. Outliers will be determined under the new approach using data from the 2018 crop year (NMP Summary Reports due in Spring 2019). The N Evaluation Reports reflecting outliers from 2018 crop year will be mailed to members in early 2020 after data have been reviewed and statistics calculated.
FAQ 10. How can I improve my A/Y ratio?
Notwithstanding abnormal crop scenarios (frost damage, insect infestations, etc.), an A/Y value can be improved by reducing the amount of nitrogen applied and maintaining crop yields, or by increasing yields at the same nitrogen application rate through more efficient nitrogen management practices.
FAQ 11. What will you do with my nitrogen use information?
The Coalition stores your reported nitrogen applied and A/Y ratios from year to year. This information is evaluated and summarized in a report to the Regional Water Board, in compliance with the Order. The report includes an evaluation of outliers, most recent crop year summary statistics, and trends in nitrogen applied and A/Y ratios; member names, addresses, and other personal information are not reported.
FAQ 12. Will the Regional Water Board take action against members with outlier management units?
It is not anticipated that a single season A/Y number that is considered an “outlier” will mean that the management unit or field is “out of compliance” or subject to enforcement actions. The Coalition will evaluate data using running averages over multiple years and work with growers to better understand reasons for high A/R ratios such as seasonal variability of production, unexpected low yields, and weather conditions.
FAQ 13. How can I learn more?
There are many resources about fertilizer guidelines and recommendations available for growers to use. In particular, good places to start are either your commodity organization or the California Department of Food and Agriculture (CDFA) Fertilizer Research and Education (FREP) program (https://www.cdfa.ca.gov/is/ffldrs/frep/index.html) and the UC Cooperative Extension (http://ucanr.edu) .
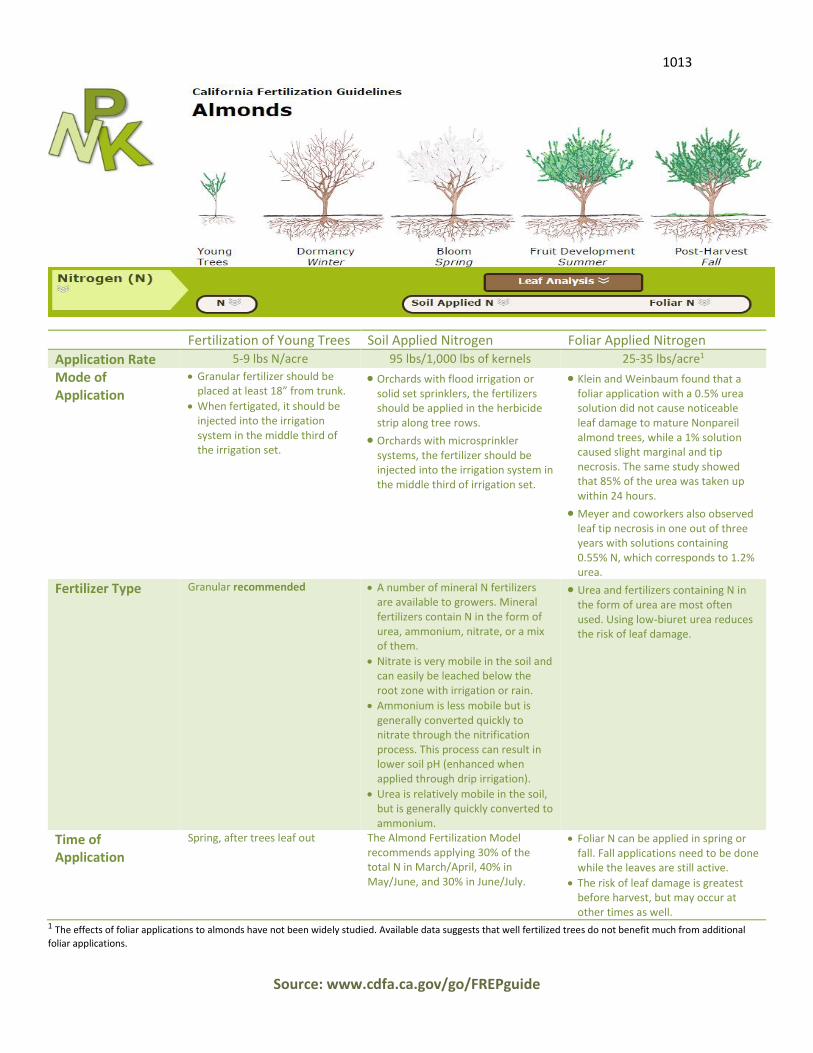
Source: www.cdfa.ca.gov/go/FREPguide
Fertilization of Young Trees Soil Applied Nitrogen Foliar Applied Nitrogen
Application Rate 5-9 lbs N/acre 95 lbs/1,000 lbs of kernels 25-35 lbs/acre1
Mode of Application
• Granular fertilizer should be placed at least 18” from trunk.
• When fertigated, it should be injected into the irrigation system in the middle third of the irrigation set.
• Orchards with flood irrigation or solid set sprinklers, the fertilizers should be applied in the herbicide strip along tree rows.
• Orchards with microsprinkler systems, the fertilizer should be injected into the irrigation system in the middle third of irrigation set.
• Klein and Weinbaum found that a foliar application with a 0.5% urea solution did not cause noticeable leaf damage to mature Nonpareil almond trees, while a 1% solution caused slight marginal and tip necrosis. The same study showed that 85% of the urea was taken up within 24 hours.
• Meyer and coworkers also observed leaf tip necrosis in one out of three years with solutions containing 0.55% N, which corresponds to 1.2% urea.
Fertilizer Type Granular recommended • A number of mineral N fertilizers are available to growers. Mineral fertilizers contain N in the form of urea, ammonium, nitrate, or a mix of them.
• Nitrate is very mobile in the soil and can easily be leached below the root zone with irrigation or rain.
• Ammonium is less mobile but is generally converted quickly to nitrate through the nitrification process. This process can result in lower soil pH (enhanced when applied through drip irrigation).
• Urea is relatively mobile in the soil, but is generally quickly converted to ammonium.
• Urea and fertilizers containing N in the form of urea are most often used. Using low-biuret urea reduces the risk of leaf damage.
Time of Application
Spring, after trees leaf out The Almond Fertilization Model recommends applying 30% of the total N in March/April, 40% in May/June, and 30% in June/July.
• Foliar N can be applied in spring or fall. Fall applications need to be done while the leaves are still active.
• The risk of leaf damage is greatest before harvest, but may occur at other times as well.
1 The effects of foliar applications to almonds have not been widely studied. Available data suggests that well fertilized trees do not benefit much from additional
foliar applications.
1013