annual network operations report 2016 - … · annual network operations report 2016 ... annex ii:...
TRANSCRIPT

ANNUAL NETWORK OPERATIONS REPORT 2016 ANNEX II - ACC

NETWORK OPERATIONS REPORT – 2016
1
©2017 European Organisation for the Safety of Air Navigation (EUROCONTROL)
ANNEX II: ACC CAPACITY EVOLUTION INTRODUCTION .......................................................................................................................................... 3
1. ALBANIA - TIRANA ACC ............................................................................................................. 5
2. ARMENIA - YEREVAN ACC ....................................................................................................... 6
3. AUSTRIA - VIENNA ACC ............................................................................................................. 7
4. AZERBAIJAN - BAKU ACC ......................................................................................................... 8
5. BELGIUM - BRUSSELS ACC ..................................................................................................... 9
6. BOSNIA & HERZEGOVINA - SARAJEVO ACC ..................................................................10
7. BULGARIA - SOFIA ACC ............................................................................................................11
8. CROATIA - ZAGREB ACC..........................................................................................................13
9. CYPRUS - NICOSIA ACC ...........................................................................................................14
10. CZECH REPUBLIC - PRAGUE ACC ......................................................................................15
11. DENMARK - COPENHAGEN ACC ..........................................................................................16
12. ESTONIA - TALLINN ACC ..........................................................................................................17
13. EUROCONTROL - MAASTRICHT ACC .................................................................................18
14. FINLAND - TAMPERE ACC .......................................................................................................19
15. FRANCE - BORDEAUX ACC ....................................................................................................20
16. FRANCE - BREST ACC ..............................................................................................................21
17. FRANCE - MARSEILLE ACC ....................................................................................................22
18. FRANCE - PARIS ACC ................................................................................................................23
19. FRANCE - REIMS ACC ...............................................................................................................24
20. FYROM - SKOPJE ACC ..............................................................................................................25
21. GEORGIA - TBILISI ACC ............................................................................................................26
22. GERMANY - BREMEN ACC ......................................................................................................27
23. GERMANY - KARLSRUHE ACC ..............................................................................................28
24. GERMANY - LANGEN ACC .......................................................................................................29
25. GERMANY - MUNICH ACC .......................................................................................................30
26. GREECE - ATHENS ACC ...........................................................................................................31
27. GREECE - MAKEDONIA ACC ..................................................................................................32
28. HUNGARY - BUDAPEST ACC..................................................................................................33
29. IRELAND - DUBLIN ACC ............................................................................................................34
30. IRELAND - SHANNON ACC ......................................................................................................35
31. ITALY - BRINDISI ACC ................................................................................................................36
32. ITALY - MILAN ACC .....................................................................................................................37
33. ITALY - PADOVA ACC ................................................................................................................38
34. ITALY - ROME ACC ......................................................................................................................39

NETWORK OPERATIONS REPORT – 2016
2
©2017 European Organisation for the Safety of Air Navigation (EUROCONTROL)
35. LATVIA - RIGA ACC .....................................................................................................................40
36. LITHUANIA - VILNIUS ACC .......................................................................................................41
37. MALTA - MALTA ACC ..................................................................................................................42
38. MOLDOVA - CHISINAU ACC ....................................................................................................43
39. THE NETHERLANDS - AMSTERDAM ACC .........................................................................44
40. NORWAY - BODO ACC ..............................................................................................................45
41. NORWAY - OSLO ACC ...............................................................................................................46
42. NORWAY - STAVANGER ACC ................................................................................................47
43. POLAND - WARSAW ACC .........................................................................................................48
44. PORTUGAL - LISBON ACC .......................................................................................................49
45. ROMANIA - BUCHAREST ACC ................................................................................................50
46. SERBIA & MONTENEGRO - BELGRADE ACC ..................................................................51
47. SLOVAK REPUBLIC - BRATISLAVA ACC............................................................................52
48. SLOVENIA - LJUBLJANA ACC .................................................................................................53
49. SPAIN - BARCELONA ACC ......................................................................................................54
50. SPAIN - CANARIAS ACC ..........................................................................................................55
51. SPAIN - MADRID ACC ...............................................................................................................56
52. SPAIN - PALMA ACC ..................................................................................................................57
53. SPAIN - SEVILLA ACC ...............................................................................................................58
54. SWEDEN - MALMO ACC ............................................................................................................59
55. SWEDEN - STOCKHOLM ACC ................................................................................................60
56. SWITZERLAND - GENEVA ACC .............................................................................................61
57. SWITZERLAND - ZURICH ACC ...............................................................................................62
58. TURKEY - ANKARA /ISTANBUL ACC....................................................................................63
59. UKRAINE - DNIPROPRETROVSK ACC ................................................................................64
60. UKRAINE - KYIV ACC .................................................................................................................65
61. UKRAINE - L’VIV ACC .................................................................................................................66
62. UKRAINE - ODESA ACC ............................................................................................................67
63. UNITED KINGDOM - LONDON ACC ......................................................................................68
64. UNITED KINGDOM - LONDON TC .........................................................................................69
65. UNITED KINGDOM - PRESTWICK ACC ...............................................................................70

NETWORK OPERATIONS REPORT – 2016
3
©2017 European Organisation for the Safety of Air Navigation (EUROCONTROL)
INTRODUCTION
The following annex provides a detailed analysis of ATC capacity evolution in 2016 for ACCs within the ECAC States for which data is available. The source of statistics is the NMOC unless otherwise indicated. The analysis covers:
• Traffic & Delay
The chart and data table provide comprehensive information concerning the evolution of traffic and delay from 2012 to 2016 (where data is available). It includes the following values:
─ Peak day traffic is the number of flight entries to the ACC on the peak day of each year.
─ Summer & Yearly Traffic is the daily average number of flight entries during the summer season (May to October inclusive) and over the whole year (January to December).
─ Summer & Yearly En-route Delay is the average En-route delay per flight (including weather and special events e.g. industrial action), attributed to the ACC during the summer season (May to October inclusive) and over the whole year (January to December).
• 2016 Realisation of Capacity Plan
─ Traffic Evolution gives the percentage difference between the total traffic (number of flight entries) in 2016 compared to 2015, for the summer and the full year.
─ En-route Delay gives the number of minutes per flight of En-route delay attributed to all causes and also excluding delays attributed to weather and special events. Values are provided for the summer and the full year.
─ ACC Reference value per ACC is the delay breakdown to achieve the European delay target of 0.5 min/flight for the full year, and 0.7 min/flight in the Summer season, as published in the NOP 2016-2019/20.
─ ACC Capacity Baseline – Offered:
ACCESS or Reverse CASA was used to measure the capacity actually offered by the ACC during the reference periods (6-19 June 2016, 4-17 July 2016). This is calculated from actual delay (Reverse CASA) or from projected delay (ACCESS). Projected delay is obtained by increasing the traffic and creating a regulation scheme for the studied ACC using traffic volume capacities and configuration data (sector opening schemes) provided by ANSPs.
─ Capacity Plan (increase for Summer 2016) is the percentage value provided by ANSPs in the Network Operations Plan 2016-2019/20. This figure represents the ANSP commitment to increasing ACC capacity for Summer 2016, when compared to Summer 2015.
─ Capacity enhancement: planned enablers
This information was taken from the local capacity plan in the Network Operations Plan 2016-2019/20. An indication is given as to whether each measure was implemented as planned.
─ Summer 2016 Performance Assessment
This provides an analysis of the observed performance and of the achievement of the planned capacity increase. ACC performance has been assessed by analysing traffic and delay statistics for each ACC and the evolution of the capacity baseline. Where relevant, other significant factors were also taken into account, such as industrial action or planned major events that resulted in a temporary reduction in capacity.

NETWORK OPERATIONS REPORT – 2016
4
©2017 European Organisation for the Safety of Air Navigation (EUROCONTROL)
• Allocation of and reasons for En-route delay
The table lists the reference locations (sectors) causing most of the ACC delay, the number of minutes of En-route delay attributed to each location and the percentage of the total ACC En-route delay. The graph shows the total ATFM En-route delay generated by each ACC, broken down into the 5 most significant reasons given for the delay in 2016 compared to 2015.
Note: The scale on all graphs varies from ACC to ACC - graphs should not be directly compared.

NETWORK OPERATIONS REPORT – 2016
5
©2017 European Organisation for the Safety of Air Navigation (EUROCONTROL)
1. ALBANIA - TIRANA ACC
Traffic & Delay
2012 2013 2014 2015 2016
Peak Day Traffic 926 984 959 1020 1014
Summer Traffic 666 704 692 705 670
Yearly Traffic 533 550 543 553 510
Summer enroute delay (all causes) 0.00 0.00 0.00 0.00 0.00
Yearly enroute delay (all causes) 0.06 0.00 0.00 0.00 0.00
0.0
0.1
0.2
0.3
0.4
0.5
0.6
0.7
0.8
0.9
1.0
0
200
400
600
800
1000
1200
Enro
ute
De
lay
(min
ute
s p
er
flig
ht)
IFR
flig
hts
(D
aily
Ave
rage
)
LAAAACC - Traffic and en-route ATFM delays
2016 Realisation of Capacity Plan
The average en-route delay per flight remained at zero minutes per flight in Summer 2016.
Capacity Plan +8% Achieved Comments
ATS route network improvements Yes
Maximum configuration: 3/4 ENR + 1 APP sectors Yes 3 ENR + 1 APP sectors were sufficient
Summer 2016 performance assessment
The ACC capacity baseline was estimated at 65, the same level as last year. During the measured period, the average peak 1 hour demand was 53 and the average peak 3 hour demand was 47.
Tirana
LAAA ACC
Traffic Evolution
(2016 v 2015)
En-route Delay (min. per flight)
Capacity gap?
ACC Capacity Baseline
(% difference v 2015) Traffic Forecast
Actual Traffic
All reasons ACC Reference
Value Current Routes
Shortest Routes
Year H: 3.2%
B: 0.0%
L: -1.7%
-19%
-7.8% 0.00 0.09
Summer -5.0% 0.00 0.13 No 65 (0%)
NETWORK OPERATIONS REPORT – 2016
6
©2017 European Organisation for the Safety of Air Navigation (EUROCONTROL)
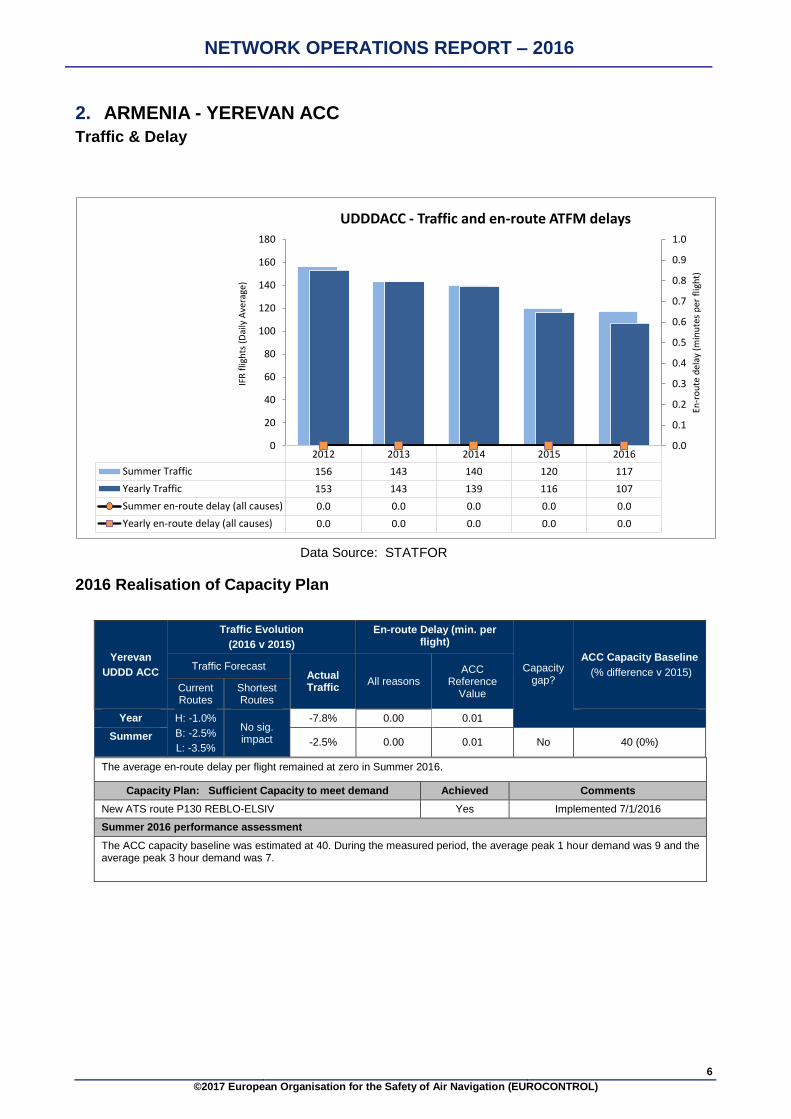
2. ARMENIA - YEREVAN ACC
Traffic & Delay
2012 2013 2014 2015 2016
Summer Traffic 156 143 140 120 117
Yearly Traffic 153 143 139 116 107
Summer en-route delay (all causes) 0.0 0.0 0.0 0.0 0.0
Yearly en-route delay (all causes) 0.0 0.0 0.0 0.0 0.0
0.0
0.1
0.2
0.3
0.4
0.5
0.6
0.7
0.8
0.9
1.0
0
20
40
60
80
100
120
140
160
180
En-r
ou
te d
elay
(m
inu
tes
per
flig
ht)
IFR
flig
hts
(D
aily
Ave
rage
)
UDDDACC - Traffic and en-route ATFM delays
Data Source: STATFOR
2016 Realisation of Capacity Plan
The average en-route delay per flight remained at zero in Summer 2016.
Capacity Plan: Sufficient Capacity to meet demand Achieved Comments
New ATS route P130 REBLO-ELSIV Yes Implemented 7/1/2016
Summer 2016 performance assessment
The ACC capacity baseline was estimated at 40. During the measured period, the average peak 1 hour demand was 9 and the average peak 3 hour demand was 7.
Yerevan
UDDD ACC
Traffic Evolution
(2016 v 2015)
En-route Delay (min. per flight)
Capacity gap?
ACC Capacity Baseline
(% difference v 2015) Traffic Forecast
Actual Traffic
All reasons ACC
Reference Value
Current Routes
Shortest Routes
Year H: -1.0%
B: -2.5%
L: -3.5%
No sig. impact
-7.8% 0.00 0.01
Summer -2.5% 0.00 0.01 No 40 (0%)

NETWORK OPERATIONS REPORT – 2016
7
©2017 European Organisation for the Safety of Air Navigation (EUROCONTROL)
3. AUSTRIA - VIENNA ACC Traffic & Delay
2012 2013 2014 2015 2016
Peak Day Traffic 2788 2733 3060 2946 2906
Summer Traffic 2303 2275 2481 2493 2499
Yearly Traffic 1961 1916 2057 2092 2144
Summer enroute delay (all causes) 0.27 0.28 0.04 0.15 0.12
Yearly enroute delay (all causes) 0.16 0.26 0.03 0.09 0.07
0.0
0.1
0.2
0.3
0.4
0.5
0.6
0.7
0.8
0.9
1.0
0
500
1000
1500
2000
2500
3000
3500
Enro
ute
De
lay
(min
ute
s p
er
flig
ht)
IFR
flig
hts
(D
aily
Ave
rage
)
LOVVACC - Traffic and en-route ATFM delays
2016 Realisation of Capacity Plan
The average en-route delay per flight decreased from 0.15 to 0.12 minutes per flight in Summer 2016.
84% of the delays were due to Weather, 10% due to staffing and 6% due to ATC capacity.
Capacity Plan +5% Achieved Comments
DCTs H24/7 165+ in parallel ops with ATS routes
Cross border DCTs FAB intern & with adjacent ACCs where possible Yes
November 2016 SAXFRA Yes
Improved ATFCM techniques, including STAM Yes
Enhanced sectorisation according to the FAB CE Airspace Plan Yes
Stepped improved sectorisation according to on-going projects Yes
Improved operational procedures including FMP/AMC Yes
Recruitment to maintain staff level Yes
Additional sectors as required, depending on traffic demand levels Yes
Maximum configuration: 14 sectors Yes Even though 14 is max, 12 sectors were sufficient to cope with demand
Summer 2016 performance assessment
The ACC capacity baseline was measured with ACCESS at 194, same value as in 2015. During the measured period, the average peak 1 hour demand was 181 and the average peak 3 hour demand was 168.
Allocation of and Reasons for En-route Delay
YearReference
Location
Avg Daily
ER Delays
% of Total ACC
ER Delay
2016 LOVVE15 33 22.3%
2016 LOVVS15 25 17.4%
2016 LOVVWB12 24 16.7%
2016 LOVVWB35 16 11.1%
2016 LOVVN15 13 8.8%
2016 LOVVW35 11 7.6%
0
50
100
150
CAPACITY STAFFING DISRUPTION EVENTS WEATHER
Av
g d
ail
y d
ela
y (m
in)
Vienna ACC en-route delays in 2016
Vienna
LOVV ACC
Traffic Evolution (2016 v 2015) En-route Delay (min. per flight)
Capacity gap?
ACC Capacity Baseline
(% difference v 2015) Traffic Forecast
Actual Traffic
All reasons ACC Reference
Value Current Routes
Shortest Routes
Year H: 2.4%
B: 0.8%
L: -1.1%
+15%
+2.5% 0.07 0.21
Summer +0.2% 0.12 0.32 No 194 (0%)

NETWORK OPERATIONS REPORT – 2016
8
©2017 European Organisation for the Safety of Air Navigation (EUROCONTROL)
4. AZERBAIJAN - BAKU ACC
Traffic & Delay
2012 2013 2014 2015 2016
Summer Traffic 367 410 353 367 388
Yearly Traffic 357 352 348 353 371
Summer en-route delay (all causes) 0.0 0.0 0.0 0.0 0.0
Yearly en-route delay (all causes) 0.0 0.0 0.0 0.0 0.0
0.0
0.1
0.2
0.3
0.4
0.5
0.6
0.7
0.8
0.9
1.0
0
50
100
150
200
250
300
350
400
450
Enro
ute
Del
ay (m
inut
es p
er fl
ight
)
IFR
flig
hts
(Dai
ly A
vera
g)e
UBBAACC - Traffic and en-route ATFM delays
Data Source: STATFOR
2016 Realisation of Capacity Plan
The average en-route delay per flight remained at zero in Summer 2016.
Capacity Plan: Sufficient Capacity to meet demand Achieved Comments
ATS route network optimisation - an on-going process in co-operation with neighboring States
Yes
Maximum configuration: 5 + 3APP Yes 3 + 3 APP were sufficient
Summer 2016 performance assessment
The ACC capacity baseline was estimated at 65. During the measured period, the average peak 1 hour demand was 34 and the average peak 3 hour demand was 25.
Baku
UBBA ACC
Traffic Evolution (2016 v 2015) En-route Delay (min. per flight)
Capacity gap?
ACC Capacity Baseline
(% difference v 2015) Traffic Forecast
Actual Traffic
All reasons ACC Reference
Value Current Routes
Shortest Routes
Year H: 2.4%
B: 1.2%
L: 0.5%
No significant
impact
+5.1% 0.00 0.01
Summer +5.7% 0.00 0.01 No 65 (0%)

NETWORK OPERATIONS REPORT – 2016
9
©2017 European Organisation for the Safety of Air Navigation (EUROCONTROL)
5. BELGIUM - BRUSSELS ACC Traffic & Delay
2012 2013 2014 2015 2016
Peak Day Traffic 1926 1916 1964 2039 2072
Summer Traffic 1644 1634 1691 1769 1789
Yearly Traffic 1503 1483 1525 1602 1605
Summer enroute delay (all causes) 0.05 0.13 0.03 0.22 0.71
Yearly enroute delay (all causes) 0.03 0.08 0.02 0.14 0.49
0.0
0.1
0.2
0.3
0.4
0.5
0.6
0.7
0.8
0.9
1.0
0
500
1000
1500
2000
2500
Enro
ute
De
lay
(min
ute
s p
er
flig
ht)
IFR
flig
hts
(D
aily
Ave
rage
)
EBBUACC - Traffic and en-route ATFM delays
2016 Realisation of Capacity Plan
The average en-route delay per flight increased from 0.22 minutes per flight in Summer 2015 to 0.71 minutes per flight in 2016.
71% of the delays were due to ATC staffing, 16% due to ATC capacity and 11% due to weather.
Capacity Plan +1% Achieved Comments
Civ/Mil AMC Cell Yes
Improved use of the route network as a result of FUA enhancement Ongoing
FUA-L3 continued to provide benefits but FUA-L2 remains as is UFN (i.e. airspace bookings based on priority rules)
FABEC XMAN Step 1 No
Redefined as FABEC Enhanced AMAN/XMAN, foreseen benefits by 2019
Enhancement of ATFCM procedures, including STAM Yes
Implementation of DCTs below FL245 Yes
Minor upgrades of CANAC2 system Yes
Maximum configuration: 6/7 sectors Yes
Summer 2016 performance assessment
The ACC capacity baseline was estimated to be at 118 in summer 2016. During the measured period, the average peak 1 hour demand was 122 and the average peak 3 hour demand was 111.
Unforeseen staffing issues affected performance in Quarter 2 of 2016. As from Quarter 3 measures were implemented to solve such issues.
At the same time the particularly high growth of traffic on the Southwest axis resulted in some capacity gaps in the West sector group.
Allocation of and Reasons for En-route Delay
YearReference
Location
Avg Daily
ER Delays
% of Total ACC
ER Delay
2016 EBBUNWC 389 49.4%
2016 EBBUEEC 179 22.8%
2016 EBBUHLC 71 9.1%
2016 EBBUWSC 58 7.3%
2016 EBBRTA 43 5.5%
2016 EBBUESC 30 3.8%
0
200
400
600
800
CAPACITY STAFFING DISRUPTION EVENTS WEATHER
Av
g d
ail
y d
ela
y (
min
)
Brussels ACC en-route delays in 2016
Brussels
EBBU ACC
Traffic Evolution (2016 v 2015) En-route Delay (min. per flight)
Capacity gap?
ACC Capacity Baseline
(% difference v 2015) Traffic Forecast
Actual Traffic
All reasons ACC Reference
Value Current Routes
Shortest Routes
Year H: 4.6%
B: 3.5%
L: 2.5%
No significant
impact
+0.2% 0.49 0.05
Summer +1.1% 0.71 0.05 No 118 (-12%)
NETWORK OPERATIONS REPORT – 2016
10
©2017 European Organisation for the Safety of Air Navigation (EUROCONTROL)
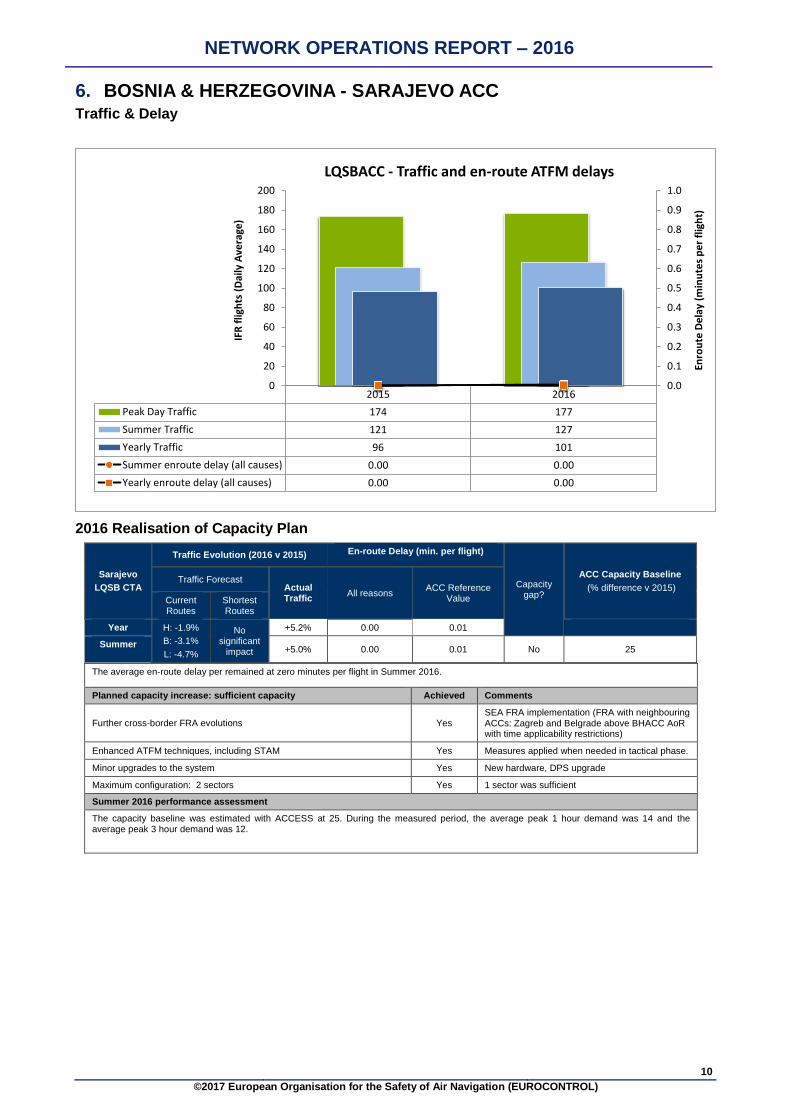
6. BOSNIA & HERZEGOVINA - SARAJEVO ACC Traffic & Delay
2015 2016
Peak Day Traffic 174 177
Summer Traffic 121 127
Yearly Traffic 96 101
Summer enroute delay (all causes) 0.00 0.00
Yearly enroute delay (all causes) 0.00 0.00
0.0
0.1
0.2
0.3
0.4
0.5
0.6
0.7
0.8
0.9
1.0
0
20
40
60
80
100
120
140
160
180
200
Enro
ute
De
lay
(min
ute
s p
er
flig
ht)
IFR
flig
hts
(D
aily
Ave
rage
)
LQSBACC - Traffic and en-route ATFM delays
2016 Realisation of Capacity Plan
The average en-route delay per remained at zero minutes per flight in Summer 2016.
Planned capacity increase: sufficient capacity Achieved Comments
Further cross-border FRA evolutions Yes SEA FRA implementation (FRA with neighbouring ACCs: Zagreb and Belgrade above BHACC AoR with time applicability restrictions)
Enhanced ATFM techniques, including STAM Yes Measures applied when needed in tactical phase.
Minor upgrades to the system Yes New hardware, DPS upgrade
Maximum configuration: 2 sectors Yes 1 sector was sufficient
Summer 2016 performance assessment
The capacity baseline was estimated with ACCESS at 25. During the measured period, the average peak 1 hour demand was 14 and the average peak 3 hour demand was 12.
Sarajevo
LQSB CTA
Traffic Evolution (2016 v 2015) En-route Delay (min. per flight)
Capacity gap?
ACC Capacity Baseline
(% difference v 2015) Traffic Forecast
Actual Traffic
All reasons ACC Reference
Value Current Routes
Shortest Routes
Year H: -1.9%
B: -3.1%
L: -4.7%
No significant
impact
+5.2% 0.00 0.01
Summer +5.0% 0.00 0.01 No 25

NETWORK OPERATIONS REPORT – 2016
11
©2017 European Organisation for the Safety of Air Navigation (EUROCONTROL)
7. BULGARIA - SOFIA ACC Traffic & Delay
2012 2013 2014 2015 2016
Peak Day Traffic 2253 2316 2875 3179 2915
Summer Traffic 1807 1871 2355 2513 2405
Yearly Traffic 1422 1460 1822 2046 2010
Summer enroute delay (all causes) 0.00 0.00 0.00 0.01 0.01
Yearly enroute delay (all causes) 0.00 0.00 0.00 0.01 0.01
0.0
0.1
0.2
0.3
0.4
0.5
0.6
0.7
0.8
0.9
1.0
0
500
1000
1500
2000
2500
3000
3500
Enro
ute
De
lay
(min
ute
s p
er
flig
ht)
IFR
flig
hts
(D
aily
Ave
rage
)
LBSRACC - Traffic and en-route ATFM delays
2016 Realisation of Capacity Plan
The en-route delay per flight remained at 0.01 minutes per flight during Summer 2016.
Planned capacity increase: +8% Achieved Comments
Stepped implementation of full FRA Yes Implementation on track. Night Cross-border operations within SEEN FRA starting 20 Mar 2017.
Gradual implementation of AFUA functionalities
Yes
ASMGCS at Sofia airport Yes
LNAV Procedures at Bulgarian airports Yes
Improved ATFCM, including use of occupancy counts and STAM
Yes Fully implemented as of Summer 2016
Implementation of Traffic Complexity Tool Yes Project on track. Final implementation is planned 2020.
ATS route network development Yes Reorganisation of interfaces between FS Sofia and Turkey, combined with new sectorisation provided significant additional capacity in VADEN/ADORU area.
New airspace structure in the western part of Black sea
Yes
New interface between FS Varna and Ankara ACC, combined with revision of sector organisation, provided additional capacity for the Middle East traffic flows. As a result complexity is reduced significantly and the delays from previous summer (generated by Turkey) are reduced to zero. The new interface organisation will ensure unimpeded traffic growth for the flows to/from Middle East for the next few years.
Additional sector layers Yes DFL 315-395 implemented. The DFL is flexibly changed throughout the day and increases adaptability of sector configurations to traffic demand.
Cross sector training Yes
Additional ATCOs Yes Updated training plan adopted. Training on schedule.
Increase of simulator training capabilities Yes SATCAS simulator number of position has been increased
New back-up Ops system Yes
Back-up VCS Yes
Sofia
LBSR ACC
Traffic Evolution (2016 v 2015) En-route Delay (min. per flight)
Capacity gap?
ACC Capacity Baseline
(% difference v 2015) Traffic Forecast
Actual Traffic
All reasons ACC Reference
Value Current Routes
Shortest Routes
Year H: 3.4%
B: 1.9%
L: 0.5%
-4%
-1.8% 0.01 0.05
Summer -4.3% 0.01 0.07 No 186 (0%)
NETWORK OPERATIONS REPORT – 2016
12
©2017 European Organisation for the Safety of Air Navigation (EUROCONTROL)
New VORs/DMEs Yes
New Ground-Air Radios Yes
Surveillance Data Distribution System, WAM and ADS-B
Yes Implemented as planned. Coverage on the Black Sea airports TMAs
ATM System Upgrade including CPDLC functionalities
Yes
Modernisation of en-route radar Yes One en-route radar replaced. Project is on track and continues in 2017
Gradual increase of maximum sector configurations available up to 18 sectors
Yes
Maximum configuration: 12 sectors Yes 10 sectors were sufficient
Summer 2016 performance assessment
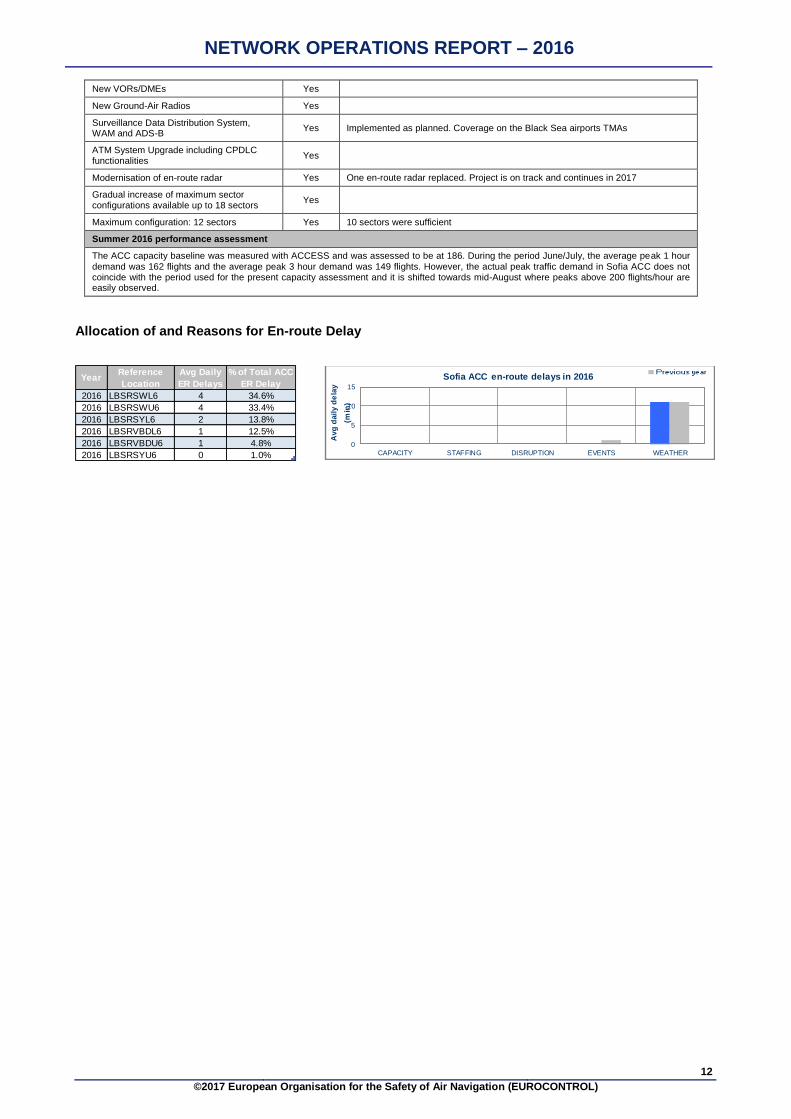
The ACC capacity baseline was measured with ACCESS and was assessed to be at 186. During the period June/July, the average peak 1 hour demand was 162 flights and the average peak 3 hour demand was 149 flights. However, the actual peak traffic demand in Sofia ACC does not coincide with the period used for the present capacity assessment and it is shifted towards mid-August where peaks above 200 flights/hour are easily observed.
Allocation of and Reasons for En-route Delay
YearReference
Location
Avg Daily
ER Delays
% of Total ACC
ER Delay
2016 LBSRSWL6 4 34.6%
2016 LBSRSWU6 4 33.4%
2016 LBSRSYL6 2 13.8%
2016 LBSRVBDL6 1 12.5%
2016 LBSRVBDU6 1 4.8%
2016 LBSRSYU6 0 1.0%
0
5
10
15
CAPACITY STAFFING DISRUPTION EVENTS WEATHER
Avg
dail
y d
ela
y
(min
)
Sofia ACC en-route delays in 2016

NETWORK OPERATIONS REPORT – 2016
13
©2017 European Organisation for the Safety of Air Navigation (EUROCONTROL)
8. CROATIA - ZAGREB ACC Traffic & Delay
2012 2013 2014 2015 2016
Peak Day Traffic 2407 2410 2498 2486 2462
Summer Traffic 1635 1666 1775 1746 1781
Yearly Traffic 1286 1281 1355 1366 1363
Summer enroute delay (all causes) 0.41 0.14 0.49 0.89 0.07
Yearly enroute delay (all causes) 0.27 0.10 0.33 0.57 0.04
0.0
0.1
0.2
0.3
0.4
0.5
0.6
0.7
0.8
0.9
1.0
0
500
1000
1500
2000
2500
3000
Enro
ute
De
lay
(min
ute
s p
er
flig
ht)
IFR
flig
hts
(D
aily
Ave
rage
)
LDZOACC - Traffic and en-route ATFM delays
2016 Realisation of Capacity Plan
The average en-route delay per flight decreased from 0.89 minutes per flight in Summer 2015 to 0.07 minutes per flight in Summer 2016.
60% of the delays were for the reason weather, 35% for ATC Capacity and 5% for ATC Staffing.
Capacity plan: +5% Achieved Comments
Further cross-border FRA evolutions Yes SEAFRA H24 Implemented on 8 December 2016
LARA (end 2015) No Postponed to Spring 2017
Integration of TMAs in the network through the implementation of the FABCE concept of seamless operations for the TMAs within Zagreb FIR
Yes
Enhanced ATFM techniques (STAM Phase I) No Postponed to Spring 2017
Enhanced sectorisation according to the FAB CE Airspace Plan Yes Implementation of Central sector
Further optimisation of ATS route network Yes
Long Range DCTs (FRD) CROSS BORDER evolution Yes
Optimization of manpower planning Yes
Additional ATCOs as required (~6 per year) Yes
Full dynamic DFL management consideration Yes
Re-assessment of sector capacities according to new CAPAN study Yes
Improved sector opening times Yes
Maximum configuration: 10 sectors Yes 11 sectors were opened
Summer 2016 performance assessment
The capacity baseline was measured using ACCESS at 145. During the measured period, the average peak 1 hour demand was 138, and the average peak 3 hour demand was 127.
Allocation of and Reasons for En-route Delay
YearReference
Location
Avg Daily
ER Delays
% of Total ACC
ER Delay
2016 LDZON 12 21.0%
2016 LDZOULA 7 11.6%
2016 LDZOHW 7 11.5%
2016 LDZOULW 6 10.6%
2016 LDZOTHW 6 10.6%
2016 LDZOTHS 5 7.9%
0
200
400
600
CAPACITY STAFFING DISRUPTION EVENTS WEATHER
Av
g d
ail
y d
ela
y (m
in)
Zagreb ACC en-route delays in 2016
Zagreb
LDZO ACC
Traffic Evolution (2016 v 2015) En-route Delay (min. per flight)
Capacity gap?
ACC Capacity Baseline
(% difference v 2015) Traffic Forecast
Actual Traffic
All reasons ACC Reference
Value Current Routes
Shortest Routes
Year H: 3.1%
B: 1.1%
L: -1.3%
No significant
impact
-0.2% 0.04 0.25
Summer +2.0% 0.07 0.35 Yes 145 (+5%)

NETWORK OPERATIONS REPORT – 2016
14
©2017 European Organisation for the Safety of Air Navigation (EUROCONTROL)
9. CYPRUS - NICOSIA ACC Traffic & Delay
2012 2013 2014 2015 2016
Peak Day Traffic 1049 1095 1175 1298 1246
Summer Traffic 819 844 944 991 1001
Yearly Traffic 736 760 834 874 880
Summer enroute delay (all causes) 1.62 2.69 1.38 2.77 0.72
Yearly enroute delay (all causes) 1.59 2.16 1.91 2.47 0.63
0.00.20.40.60.81.01.21.41.61.82.02.22.42.62.8
0
200
400
600
800
1000
1200
1400
Enro
ute
De
lay
(min
ute
s p
er
flig
ht)
IFR
flig
hts
(D
aily
Ave
rage
)
LCCCACC - Traffic and en-route ATFM delays
2016 Realisation of Capacity Plan
The average en-route delay per flight decreased from 2.77 minutes per flight in Summer 2015 to 0.72 minutes per flight in Summer 2016.
47% of the delays were due to ATC staffing, 43% of delays were due to ATC capacity, 8% due to airspace management and 2% due to equipment.
Capacity Plan +10 % Achieved Comments
Application of FRA DCT +FL285 for specific N/X points Yes 5 implemented new batch in Spring 2017
Improved ATFCM, including STAM Yes
Continuous improvement of ATS route network No Limited due to lack of agreement from Ankara ACC
New SIDs and STARs LCPH Yes September 2016
7 additional ATCOs Yes
OLDI with Egypt No
More flexibility in sector configuration openings Yes
Improve Civil-Military cooperation in the South-East part of the FIR Yes
Operation of a 6th en-route sector during peaks No
Revision of sector capacities Yes
Transition to the new ACC No Decision pending and dependant extension of AT system
Operation of corporatized ANSP No Progress ongoing
Maximum configuration: 5/6 sectors Yes 5 sectors opened
Summer 2016 performance assessment
The ACC capacity baseline was measured with ACCESS/Reverse CASA at 59, 13% higher than in 2015. During the measured period, the average peak 1 hour demand was 61 and the average peak 3 hour demand was 56.
Allocation of and Reasons for En-route Delay
YearReference
Location
Avg Daily
ER Delays
% of Total ACC
ER Delay
2016 LCCCES0 228 40.9%
2016 LCCCS12 102 18.3%
2016 LCCCS12W 79 14.3%
2016 LCCCS1 59 10.6%
2016 LCCCW 37 6.7%
2016 LCCCS2 32 5.8%
0
500
1000
1500
CAPACITY STAFFING DISRUPTION EVENTS WEATHER
Av
g d
ail
y d
ela
y (m
in)
Nicosia ACC en-route delays in 2016
Nicosia
LCCC ACC
Traffic Evolution (2016 v 2015) En-route Delay (min. per flight)
Capacity gap?
ACC Capacity Baseline
(% difference v 2015) Traffic Forecast
Actual Traffic
All reasons ACC Reference
Value Current Routes
Shortest Routes
Year H: 2.4%
B: 0.5%
L: -1.3%
No significant
impact
+0.7% 0.63 0.26
Summer +1.0% 0.72 0.32 Yes 59 (+13%)
NETWORK OPERATIONS REPORT – 2016
15
©2017 European Organisation for the Safety of Air Navigation (EUROCONTROL)
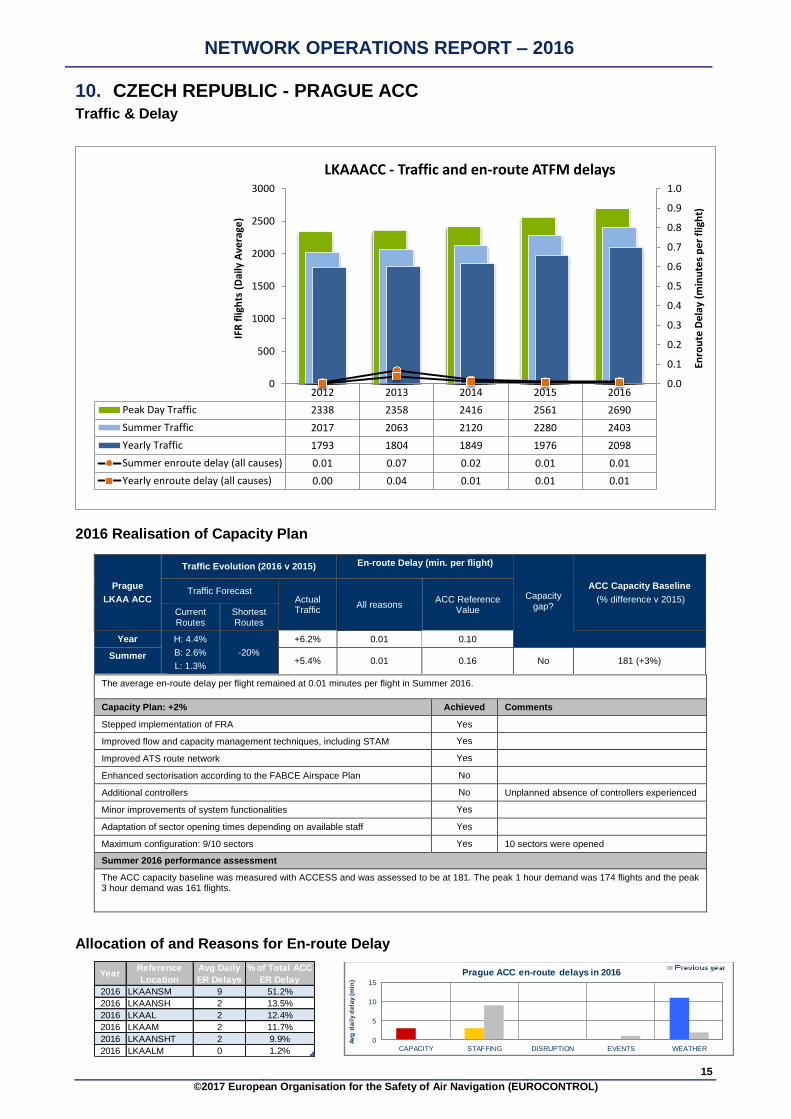
10. CZECH REPUBLIC - PRAGUE ACC Traffic & Delay
2012 2013 2014 2015 2016
Peak Day Traffic 2338 2358 2416 2561 2690
Summer Traffic 2017 2063 2120 2280 2403
Yearly Traffic 1793 1804 1849 1976 2098
Summer enroute delay (all causes) 0.01 0.07 0.02 0.01 0.01
Yearly enroute delay (all causes) 0.00 0.04 0.01 0.01 0.01
0.0
0.1
0.2
0.3
0.4
0.5
0.6
0.7
0.8
0.9
1.0
0
500
1000
1500
2000
2500
3000
Enro
ute
De
lay
(min
ute
s p
er
flig
ht)
IFR
flig
hts
(D
aily
Ave
rage
)
LKAAACC - Traffic and en-route ATFM delays
2016 Realisation of Capacity Plan
The average en-route delay per flight remained at 0.01 minutes per flight in Summer 2016.
Capacity Plan: +2% Achieved Comments
Stepped implementation of FRA Yes
Improved flow and capacity management techniques, including STAM Yes
Improved ATS route network Yes
Enhanced sectorisation according to the FABCE Airspace Plan No
Additional controllers No Unplanned absence of controllers experienced
Minor improvements of system functionalities Yes
Adaptation of sector opening times depending on available staff Yes
Maximum configuration: 9/10 sectors Yes 10 sectors were opened
Summer 2016 performance assessment
The ACC capacity baseline was measured with ACCESS and was assessed to be at 181. The peak 1 hour demand was 174 flights and the peak 3 hour demand was 161 flights.
Allocation of and Reasons for En-route Delay
YearReference
Location
Avg Daily
ER Delays
% of Total ACC
ER Delay
2016 LKAANSM 9 51.2%
2016 LKAANSH 2 13.5%
2016 LKAAL 2 12.4%
2016 LKAAM 2 11.7%
2016 LKAANSHT 2 9.9%
2016 LKAALM 0 1.2%
0
5
10
15
CAPACITY STAFFING DISRUPTION EVENTS WEATHER
Av
g d
ail
y d
ela
y (m
in)
Prague ACC en-route delays in 2016
Prague
LKAA ACC
Traffic Evolution (2016 v 2015) En-route Delay (min. per flight)
Capacity gap?
ACC Capacity Baseline
(% difference v 2015) Traffic Forecast
Actual Traffic
All reasons ACC Reference
Value Current Routes
Shortest Routes
Year H: 4.4%
B: 2.6%
L: 1.3%
-20%
+6.2% 0.01 0.10
Summer +5.4% 0.01 0.16 No 181 (+3%)

NETWORK OPERATIONS REPORT – 2016
16
©2017 European Organisation for the Safety of Air Navigation (EUROCONTROL)
11. DENMARK - COPENHAGEN ACC
Traffic & Delay
2012 2013 2014 2015 2016
Peak Day Traffic 1688 1781 1765 1792 1879
Summer Traffic 1485 1580 1571 1592 1622
Yearly Traffic 1409 1459 1464 1488 1513
Summer enroute delay (all causes) 0.00 0.00 0.00 0.00 0.00
Yearly enroute delay (all causes) 0.00 0.00 0.00 0.00 0.00
0.0
0.1
0.2
0.3
0.4
0.5
0.6
0.7
0.8
0.9
1.0
0
200
400
600
800
1000
1200
1400
1600
1800
2000
Enro
ute
De
lay
(min
ute
s p
er
flig
ht)
IFR
flig
hts
(D
aily
Ave
rage
)
EKDKACC - Traffic and en-route ATFM delays
2016 Realisation of Capacity Plan
The average en-route delay per flight remained at zero minutes per flight in Summer 2016.
Capacity Plan +2 % Achieved Comments
Possible alignment with FRA within NEFAB Yes
Final completion May 2017 together with full NEFRA implementation
Optimizing the use of FRA when military areas are active Yes
A – CDM at EKCH Yes Full A-CDM was implemented on December 19, 2016
Improved ATFCM, working with occupancy counts Yes
Continuous improvements on the ATS route network Yes
Upgrade CDR2s to CDR1s Yes
OLDI extension to field 15 FPL Yes
Maintain appropriate level of staffing to open up to 8 sectors Yes
Minor updates of COOPANS Yes
Sector configurations adapted to traffic demand Yes
Maximum configuration: 4/5 (E) + 3 (W) Yes 3 (E) + 2 (W) were sufficient
Summer 2016 performance assessment
The ACC capacity baseline was measured with ACCESS at 127, same as in 2015. During the measured period, the average peak 1 hour demand was 120 and the average peak 3 hour demand was 111.
Copenhagen
EKDK ACC
Traffic Evolution
(2016 v 2015)
En-route Delay
(min. per flight)
Capacity gap?
ACC Capacity Baseline
(% difference v 2015) Traffic Forecast
Actual Traffic
All reasons ACC Reference
Value Current Routes
Shortest Routes
Year H: 4.2%
B: 2.9%
L: 2.0%
No significant impact
+1.7% 0.00 0.08
Summer +1.9% 0.00 0.11 No 127 (0%)

NETWORK OPERATIONS REPORT – 2016
17
©2017 European Organisation for the Safety of Air Navigation (EUROCONTROL)
12. ESTONIA - TALLINN ACC
Traffic & Delay
2012 2013 2014 2015 2016
Peak Day Traffic 632 621 651 649 674
Summer Traffic 544 537 567 569 583
Yearly Traffic 493 485 508 516 530
Summer enroute delay (all causes) 0.09 0.02 0.05 0.02 0.04
Yearly enroute delay (all causes) 0.11 0.02 0.03 0.01 0.03
0.0
0.1
0.2
0.3
0.4
0.5
0.6
0.7
0.8
0.9
1.0
0
100
200
300
400
500
600
700
800
Enro
ute
De
lay
(min
ute
s p
er
flig
ht)
IFR
flig
hts
(D
aily
Ave
rage
)
EETTACC - Traffic and en-route ATFM delays
2016 Realisation of Capacity Plan
The average en-route delay per flight increased from 0.02 minutes per flight in Summer 2015 to 0.04 minutes per flight in Summer 2016.
100% of the delays were for the reason ATC capacity.
Capacity Plan: Sufficient capacity to meet demand Achieved Comments
NEFRA Yes
SYSCO –full OLDI with Latvia, Sweden No Postponed to 2017/2018
LARA implementation Yes
Additional staff and controller rating Yes
Adaptation of sector opening times Yes
Adding new routes crossing the boundary with Sankt-Petersburg FIR Yes
Maximum configuration: 3 (+1 FEEDER) No 2 sectors opened
Summer 2016 performance assessment
The capacity baseline was estimated to be 63. During the measured period, the average peak 1 hour demand was 59 and the average peak 3 hour demand was 50.
Allocation of and Reasons for En-route Delay
YearReference
Location
Avg Daily
ER Delays
% of Total ACC
ER Delay
2016 EETTEST 10 73.3%
2016 EETTFEEDER 3 24.6%
2016 EETTWES 0 2.1%
0
5
10
15
CAPACITY STAFFING DISRUPTION EVENTS WEATHER
Av
g d
ail
y d
ela
y (
min
)
Tallinn ACC en-route delays in 2016
Tallinn
EETT ACC
Traffic Evolution (2016 v 2015) En-route Delay (min. per flight)
Capacity gap?
ACC Capacity Baseline
(% difference v 2014) Traffic Forecast
Actual Traffic
All reasons ACC Reference
Value Current Routes
Shortest Routes
Year H: 2.5%
B: 0.9%
L: -0.4%
No sig.
impact
+2.7% 0.03 0.03
Summer +2.5% 0.04 0.04 No 63 (0%)

NETWORK OPERATIONS REPORT – 2016
18
©2017 European Organisation for the Safety of Air Navigation (EUROCONTROL)
13. EUROCONTROL - MAASTRICHT ACC Traffic & Delay
2012 2013 2014 2015 2016
Peak Day Traffic 5244 5349 5526 5552 5760
Summer Traffic 4793 4941 5043 5096 5330
Yearly Traffic 4389 4474 4579 4664 4863
Summer enroute delay (all causes) 0.04 0.07 0.25 0.53 0.86
Yearly enroute delay (all causes) 0.04 0.07 0.17 0.34 0.55
0.0
0.1
0.2
0.3
0.4
0.5
0.6
0.7
0.8
0.9
1.0
0
1000
2000
3000
4000
5000
6000
7000
Enro
ute
De
lay
(min
ute
s p
er
flig
ht)
IFR
flig
hts
(D
aily
Ave
rage
)
EDYYUAC - Traffic and en-route ATFM delays
2016 Realisation of Capacity Plan
The average en-route delay per flight increased from 0.53 minutes per flight in Summer 2015 to 0.86 minutes per flight in 2016.
45% of the delays were for the reason Weather, 42% for ATC Capacity, 7% for the reason Other, 4% for ATC Staffing, 1% for Equipment and 1% for Airspace Management.
Capacity Plan +2% Achieved Comments
FABEC FRA Step 1: WE DCTs Yes
Initial FUA Implementation above FL365 Yes Step 1 has been implemented. Step 2 is envisaged for the end of 2017 and Step 3 in 2018
Improved ATFCM including STAM Yes Ongoing
ATC2ATM Program Yes Ongoing
Brussels UIR DFL Change Yes The DFL changes has been successfully introduced in Feb 2016
Advanced tactical ATFCM measures Yes
Cross training of ATCOs Yes
iFMP (integrated Flow Management Position) Yes
NVCS No Implementation delayed until Q1, 2017
SRAT (Super Role Allocation Tool) Yes
RDFS No Implementation delayed: 2017
Stepped implementation of XMAN (possible negative impact on capacity)
Yes
Maximum configuration: 20 sectors Yes BRU: 6 DECO: 6 HANN: 8
Max sectors not necessarily all opened simultaneously across sector groups
Summer 2016 performance assessment
The capacity baseline was measured with ACCESS/Reverse CASA at 322. During the same period, the peak 3 hour demand was 325 and the peak 1 hour was 346.
Allocation of and Reasons for En-route Delay
YearReference
Location
Avg Daily
ER Delays
% of Total ACC
ER Delay
2016 EDYYBOLN 526 19.5%
2016 EDYYD5WH 430 16.0%
2016 EDYYB3EH 399 14.8%
2016 EDYYD5WL 314 11.6%
2016 EDYYB5KL 198 7.4%
2016 EDYYHMNS 147 5.4%
0
500
1000
1500
CAPACITY STAFFING DISRUPTION EVENTS WEATHER
Av
g d
ail
y d
ela
y (
min
)
Maastricht UAC en-route delays in 2016
Maastricht
EDYY UAC
Traffic Evolution (2016 v 2015) En-route Delay (min. per flight)
Capacity gap?
ACC Capacity Baseline
(% difference v 2015) Traffic Forecast
Actual Traffic
All reasons ACC Reference
Value Current Routes
Shortest Routes
Year H: 3.5%
B: 2.4%
L: 1.4%
+3%
+4.3% 0.55 0.17
Summer +4.6% 0.86 0.27 Yes 322 (0%)

NETWORK OPERATIONS REPORT – 2016
19
©2017 European Organisation for the Safety of Air Navigation (EUROCONTROL)
14. FINLAND - TAMPERE ACC
Traffic & Delay
2012 2013 2014 2015 2016
Peak Day Traffic 620 592 594 579 590
Summer Traffic 480 451 465 452 451
Yearly Traffic 485 451 459 445 451
Summer enroute delay (all causes) 0.02 0.00 0.00 0.00 0.00
Yearly enroute delay (all causes) 0.02 0.00 0.16 0.03 0.00
0.0
0.1
0.2
0.3
0.4
0.5
0.6
0.7
0.8
0.9
1.0
0
100
200
300
400
500
600
700
Enro
ute
De
lay
(min
ute
s p
er
flig
ht)
IFR
flig
hts
(D
aily
Ave
rage
)
EFINCTA - Traffic and en-route ATFM delays
2016 Realisation of Capacity Plan
The average en-route delay per remained at zero minutes per flight in Summer 2016.
Capacity Plan: Sufficient capacity to meet demand Achieved Comments
NEFRA phase2 (ES and EK to join) Yes
Maintain number of controllers Yes
Partial move of ACC functions to new ACC at EFHK (10 ATCOs) Yes
Maximum configuration: 6 sectors Yes 5 sectors were sufficient
Summer 2016 performance assessment
The capacity baseline was estimated at the same level as last year. During the measured period, the average peak 1 hour demand was 40 and the average peak 3 hour demand was 33.
Tampere
EFIN CTA
Traffic Evolution (2016 v 2015) En-route Delay (min. per flight)
Capacity gap?
ACC Capacity Baseline
(% difference v 2015) Traffic Forecast
Actual Traffic
All reasons ACC Reference
Value Current Routes
Shortest Routes
Year H: 3.3%
B: 2.3%
L: -1.3%
No significant
impact
+1.3% 0.00 0.09
Summer -0.2% 0.00 0.07 No 58 (0%)

NETWORK OPERATIONS REPORT – 2016
20
©2017 European Organisation for the Safety of Air Navigation (EUROCONTROL)
15. FRANCE - BORDEAUX ACC Traffic & Delay
2012 2013 2014 2015 2016
Peak Day Traffic 2978 3066 3183 3197 3394
Summer Traffic 2575 2615 2668 2744 2936
Yearly Traffic 2222 2238 2282 2349 2476
Summer enroute delay (all causes) 0.13 0.51 0.34 0.34 0.79
Yearly enroute delay (all causes) 0.27 0.30 0.23 0.34 0.70
0.0
0.1
0.2
0.3
0.4
0.5
0.6
0.7
0.8
0.9
1.0
0
500
1000
1500
2000
2500
3000
3500
4000
Enro
ute
De
lay
(min
ute
s p
er
flig
ht)
IFR
flig
hts
(D
aily
Ave
rage
)
LFBBALL - Traffic and en-route ATFM delays
2016 Realisation of Capacity Plan
The average en-route delay per flight increased from 0.34 minutes per flight in Summer 2015 to 0.79 minutes per flight during the same period in 2016.
70% of the delays were due to ATC Capacity, 15% due to Weather, 11% due to Industrial action and 3% due to Staffing.
Capacity Plan; +1 % Achieved Comments
FABEC FRA Step 1 : WE DCTs No
Improved Airspace Management / FUA Yes
Improved ATFCM Procedures and STAM Yes
CDM processes and procedures Yes
MAC (Collaborative ATFCM Measures) Yes
5th layer in some sectors No Postponed to March 2017
Staff deployment / Flexible rostering Partially
Re-evaluation of sector capacities No Re-evaluation will be done in 2017 following
ERATO implementation
Maximum configuration: 21 UCESO Yes 21 sectors
Summer 2016 performance assessment
The ACC capacity baseline was assessed with ACCESS to be at 201. During the measured period, the average peak 1 hour demand was 213 and the average peak 3 hour demand was 198.
Allocation of and Reasons for En-route Delay
YearReference
Location
Avg Daily
ER Delays
% of Total ACC
ER Delay
2016 LFBBNH12 210 12.1%
2016 LFBBUSUD 198 11.4%
2016 LFBBR4 127 7.3%
2016 LFBBT14 93 5.4%
2016 LFBBZX4 78 4.5%
2016 LFBBP1234 65 3.8%
0
500
1000
CAPACITY STAFFING DISRUPTION EVENTS WEATHER
Av
g d
ail
y d
ela
y (m
in)
Bordeaux ACC en-route delays in 2016
Bordeaux
LFBB ACC
Traffic Evolution (2016 v 2015) En-route Delay (min. per flight)
Capacity gap?
ACC Capacity Baseline
(% difference v 2015) Traffic Forecast
Actual Traffic
All reasons ACC Reference
Value Current Routes
Shortest Routes
Year H: 4.7%
B: 3.3%
L: 1.8%
No significant
impact
+5.4% 0.70 0.12
Summer +7.0% 0.79 0.20 Yes 201 (0%)

NETWORK OPERATIONS REPORT – 2016
21
©2017 European Organisation for the Safety of Air Navigation (EUROCONTROL)
16. FRANCE - BREST ACC Traffic & Delay
2012 2013 2014 2015 2016
Peak Day Traffic 3294 3345 3550 3429 3632
Summer Traffic 2752 2850 2980 2975 3169
Yearly Traffic 2398 2457 2559 2538 2697
Summer enroute delay (all causes) 0.11 0.50 0.63 1.04 1.60
Yearly enroute delay (all causes) 0.19 0.35 0.53 1.41 1.76
0.0
0.2
0.4
0.6
0.8
1.0
1.2
1.4
1.6
1.8
2.0
0
500
1000
1500
2000
2500
3000
3500
4000
Enro
ute
De
lay
(min
ute
s p
er
flig
ht)
IFR
flig
hts
(D
aily
Ave
rage
)
LFRRACC - Traffic and en-route ATFM delays
2016 Realisation of Capacity Plan
The average en-route delay increased from 1.04 minutes per flight in Summer 2015 to 1.60 minutes per flight over the same period in 2016.
79% of the delays were due to the reason ATC Capacity, 15% due to Industrial Actions and 2% due to Staffing.
Capacity Plan : +1% Achieved Comments
FABEC FRA Step 1 : WE DCTs No
Improved airspace management / FUA Yes
Improvement of ATFCM procedures and STAM Yes
CDM processes and procedures Yes
MAC (Collaborative ATFCM Measures) Yes
Reorganisation of airspace below FL145 (1st step) No Postponed to 2017
Revised NAT/Brest interface Yes
Staff redeployment / flexible rostering Partially
ERATO (stripless, MTCD) Yes
Re-evaluation of sector capacities Yes
Maximum configuration: 18 UCESO Yes 18 sectors were opened
Summer 2016 performance assessment
The ACC capacity baseline was measured with ACCESS/Reverse CASA at 204, 3% higher than in 2015. During the measured period, the average peak 1 hour demand was 227 and the average peak 3 hour demand was 211.
Allocation of and Reasons for En-route Delay
YearReference
Location
Avg Daily
ER Delays
% of Total ACC
ER Delay
2016 LFRRMZSI 651 13.7%
2016 LFRRN 314 6.6%
2016 LFRRA 294 6.2%
2016 LFRRQXSI 285 6.0%
2016 LFRRG 276 5.8%
2016 LFRRESTU 251 5.3%
0
1000
2000
3000
CAPACITY STAFFING DISRUPTION EVENTS WEATHER
Av
g d
ail
y d
ela
y (m
in)
Brest ACC en-route delays in 2016
Brest
LFRR ACC
Traffic Evolution (2016 v 2015) En-route Delay (min. per flight)
Capacity gap?
ACC Capacity Baseline
(% difference v 2015) Traffic Forecast
Actual Traffic
All reasons ACC Reference
Value Current Routes
Shortest Routes
Year H: 6.6%
B: 5.2%
L: 3.8%
No significant
impact
+6.3% 1.76 0.10
Summer +6.5% 1.60 0.17 Yes 204 (+3%)

NETWORK OPERATIONS REPORT – 2016
22
©2017 European Organisation for the Safety of Air Navigation (EUROCONTROL)
17. FRANCE - MARSEILLE ACC Traffic & Delay
2012 2013 2014 2015 2016
Peak Day Traffic 3929 3999 4032 4030 4178
Summer Traffic 3268 3271 3269 3270 3456
Yearly Traffic 2763 2746 2730 2743 2871
Summer enroute delay (all causes) 0.52 0.72 0.86 0.19 0.46
Yearly enroute delay (all causes) 0.55 0.44 0.57 0.20 0.44
0.0
0.1
0.2
0.3
0.4
0.5
0.6
0.7
0.8
0.9
1.0
0
500
1000
1500
2000
2500
3000
3500
4000
4500
Enro
ute
De
lay
(min
ute
s p
er
flig
ht)
IFR
flig
hts
(D
aily
Ave
rage
)
LFMMACC - Traffic and en-route ATFM delays
2016 Realisation of Capacity Plan
The average en-route delay increased from 0.19 minutes per flight in Summer 2015 to 0.46 minutes per flight in Summer 2016.
53% of the delays were due to the reason ATC Capacity, 27% due to Weather, 7% due to Industrial Actions, 7% due to Airspace Management and 4% due to Staffing.
Capacity Plan: +2% Achieved Comments
FABEC FRA Step 1 : WE DCTs No
Improved airspace management / FUA Yes
Improvement of ATFCM procedures and STAM Yes
CDM Processes and procedures Yes
MAC (Collaborative ATFCM Measures) Yes
Creation of 4th layer (East) Yes
Staff redeployment / flexible rostering Partially
Maximum configuration: 28 UCESO Yes Maximum configuration: 15 + 13 sectors
Summer 2016 performance assessment
The ACC capacity baseline was assessed with ACCESS to be at 248, 2% higher compared to Summer 2015. During the measured period, the average peak 1 hour demand was 256 and the average peak 3 hour demand was 245.
Allocation of and Reasons for En-route Delay
YearReference
Location
Avg Daily
ER Delays
% of Total ACC
ER Delay
2016 LFMMWM 161 12.6%
2016 LFMMFDZ 146 11.5%
2016 LFMMMALY 76 5.9%
2016 LFMMRAEE 61 4.8%
2016 LFMMAB12 61 4.8%
2016 LFMMEK12 50 3.9%
0
200
400
600
CAPACITY STAFFING DISRUPTION EVENTS WEATHER
Av
g d
ail
y d
ela
y (m
in)
Marseille ACC en-route delays in 2016
Marseille
LFMM ACC
Traffic Evolution (2016 v 2015) En-route Delay (min. per flight)
Capacity gap?
ACC Capacity Baseline
(% difference v 2015) Traffic Forecast
Actual Traffic
All reasons ACC Reference
Value Current Routes
Shortest Routes
Year H: 3.7%
B: 2.3%
L: 0.8%
No significant
impact
+4.7% 0.44 0.15
Summer +5.7% 0.46 0.24 No 248 (+2%)

NETWORK OPERATIONS REPORT – 2016
23
©2017 European Organisation for the Safety of Air Navigation (EUROCONTROL)
18. FRANCE - PARIS ACC Traffic & Delay
2012 2013 2014 2015 2016
Peak Day Traffic 4000 3863 3904 3925 4122
Summer Traffic 3429 3309 3353 3502 3574
Yearly Traffic 3227 3107 3125 3205 3266
Summer enroute delay (all causes) 0.27 0.17 0.20 0.17 0.40
Yearly enroute delay (all causes) 0.27 0.17 0.17 0.14 0.34
0.0
0.1
0.2
0.3
0.4
0.5
0.6
0.7
0.8
0.9
1.0
0
500
1000
1500
2000
2500
3000
3500
4000
4500
Enro
ute
De
lay
(min
ute
s p
er
flig
ht)
IFR
flig
hts
(D
aily
Ave
rage
)
LFFFALL - Traffic and en-route ATFM delays
2016 Realisation of Capacity Plan
The average en-route delay increased from 0.17 minutes per flight in Summer 2015 to 0.40 minutes per flight over the same period in 2016.
48% of the delays were due to the reason Industrial Action, 30% due to Weather, and 20% due to ATC Capacity.
Capacity Plan : +2% Achieved Comments
FABEC FRA Step 1 : WE DCTs No
Improved airspace management / FUA Yes
Bilini trial (until spring 2016) Yes
Improved ATFCM procedures and STAM / GF project Yes GF project is part of iStream
iStream Yes
CDM Processes and procedures Yes
MAC (Collaborative ATFCM Measures) Yes
Reorganisation of lower airspace and delegation of ATS to APP units below FL145 (for relevant airspace)
No Postponed to 2018
Staff redeployment / flexible rostering Partially
Maximum configuration: 21 UCESO Yes Maximum configuration: 20 sectors (10+10) was sufficient
Summer 2016 performance assessment
The ACC capacity baseline was assessed with ACCESS to be at 281, 2% higher than in Summer 2015. During the measured period, the average peak 1 hour demand was 277 and the average peak 3 hour demand was 251.
Allocation of and Reasons for En-route Delay
YearReference
Location
Avg Daily
ER Delays
% of Total ACC
ER Delay
2016 LFFFUZ 119 10.8%
2016 LFFFLMHJ 107 9.7%
2016 LFFFUJ 88 8.0%
2016 LFFFTE 87 7.9%
2016 LFFFAOML 74 6.7%
2016 LFFFLMH 69 6.2%
0
200
400
600
CAPACITY STAFFING DISRUPTION EVENTS WEATHER
Av
g d
ail
y d
ela
y (m
in)
Paris ACC en-route delays in 2016
Paris
LFFF ACC
Traffic Evolution (2016 v 2015) En-route Delay (min. per flight)
Capacity gap?
ACC Capacity Baseline
(% difference v 2015) Traffic Forecast
Actual Traffic
All reasons ACC Reference
Value Current Routes
Shortest Routes
Year H: 2.5%
B: 1.3%
L: 0.1%
No significant
impact
+1.9% 0.34 0.15
Summer +2.1% 0.40 0.19 No 281 (+2%)

NETWORK OPERATIONS REPORT – 2016
24
©2017 European Organisation for the Safety of Air Navigation (EUROCONTROL)
19. FRANCE - REIMS ACC Traffic & Delay
2012 2013 2014 2015 2016
Peak Day Traffic 2903 3030 3193 3267 3377
Summer Traffic 2587 2719 2832 2899 3021
Yearly Traffic 2334 2430 2522 2574 2668
Summer enroute delay (all causes) 0.37 0.47 0.60 0.66 0.40
Yearly enroute delay (all causes) 0.26 0.31 0.42 0.55 0.26
0.0
0.1
0.2
0.3
0.4
0.5
0.6
0.7
0.8
0.9
1.0
0
500
1000
1500
2000
2500
3000
3500
4000
Enro
ute
De
lay
(min
ute
s p
er
flig
ht)
IFR
flig
hts
(D
aily
Ave
rage
)
LFEEACC - Traffic and en-route ATFM delays
2016 Realisation of Capacity Plan
The average en-route delay decreased from 0.66 minutes per flight in Summer 2015 to 0.40 minutes per flight in Summer 2016.
54% of the delays were due to ATC Capacity, 29% due to Weather, 7% due to Staffing and 6% due to Industrial Action.
Capacity Plan : +1% Achieved Comments
FABEC FRA Step 1: WE DCTs No
Improved airspace management / FUA Yes
FABEC XMAN Step 1 : Basic Yes
Improved ATFCM procedures and STAM Yes
CDM Processes and procedures Yes
MAC (Collaborative ATFCM Measures) Yes
Reorganisation of lower airspace ELLX interface Yes
Staff redeployment / Flexible rostering Yes As from end July 2016
Maximum configuration: 19 UCESO Yes Maximum configuration: 19 sectors
Summer 2016 performance assessment
The ACC capacity baseline was measured with ACCESS at 199. During the measured period, the average peak 1 hour demand was 212 and the average peak 3 hour demand was 195.
Allocation of and Reasons for En-route Delay
YearReference
Location
Avg Daily
ER Delays
% of Total ACC
ER Delay
2016 LFEE2F 91 13.1%
2016 LFEEHYR 90 12.9%
2016 LFEE4E 73 10.5%
2016 LFEE5EH 50 7.2%
2016 LFEE4H 48 6.9%
2016 LFEEKR 46 6.6%
0
500
1000
CAPACITY STAFFING DISRUPTION EVENTS WEATHER
Av
g d
ail
y d
ela
y (m
in)
Reims ACC en-route delays in 2016
Reims
LFEE ACC
Traffic Evolution (2016 v 2015) En-route Delay (min. per flight)
Capacity gap?
ACC Capacity Baseline
(% difference v 2015) Traffic Forecast
Actual Traffic
All reasons ACC Reference
Value Current Routes
Shortest Routes
Year H: 4.1%
B: 2.8%
L: 1.3%
+6%
+3.7% 0.26 0.18
Summer +4.2% 0.40 0.25 Yes 199 (+5%)

NETWORK OPERATIONS REPORT – 2016
25
©2017 European Organisation for the Safety of Air Navigation (EUROCONTROL)
20. FYROM - SKOPJE ACC
Traffic & Delay
2012 2013 2014 2015 2016
Peak Day Traffic 642 661 834 859 769
Summer Traffic 418 424 566 568 542
Yearly Traffic 306 301 389 401 379
Summer enroute delay (all causes) 0.00 0.00 0.00 0.02 0.01
Yearly enroute delay (all causes) 0.00 0.00 0.00 0.01 0.01
0.0
0.1
0.2
0.3
0.4
0.5
0.6
0.7
0.8
0.9
1.0
0
100
200
300
400
500
600
700
800
900
1000
Enro
ute
De
lay
(min
ute
s p
er
flig
ht)
IFR
flig
hts
(D
aily
Ave
rage
)
LWSSACC - Traffic and en-route ATFM delays
2016 Realisation of Capacity Plan
The delays decreased from 0.02 minutes per flight in during Summer 2015 to 0.01 minutes per flight during Summer 2016
Capacity Plan: +15% Achieved Comments
Free route airspace – Implementation June 2016 Yes
Maximum configuration: 3 sectors Yes
Summer 2016 performance assessment
The ACC capacity baseline was estimated to be at the same level as in Summer 2015. During the measured period the average peak 1 hour was 45 and the average peak 3 hour was 40.
Allocation of and Reasons for En-route Delay
YearReference
Location
Avg Daily
ER Delays
% of Total ACC
ER Delay
2016 LWSSLOW 3 100.0%
0
1
2
3
CAPACITY STAFFING DISRUPTION EVENTS WEATHER
Avg
daily d
ela
y
(min
)
Skopje ACC en-route delays in 2016
Skopje
LWSS ACC
Traffic Evolution (2016 v 2015) En-route Delay (min. per flight)
Capacity gap?
ACC Capacity Baseline
(% difference v 2015) Traffic Forecast
Actual Traffic
All reasons ACC Reference
Value Current Routes
Shortest Routes
Year H: 5.8%
B: 2.3%
L: 0.2%
+35%
-0.1% 0.01 0.19
Summer 0% 0.01 0.26 No 59 (0%)

NETWORK OPERATIONS REPORT – 2016
26
©2017 European Organisation for the Safety of Air Navigation (EUROCONTROL)
21. GEORGIA - TBILISI ACC
Traffic & Delay
2015 2016
Peak Day Traffic 404 453
Summer Traffic 346 365
Yearly Traffic 328 340
Summer enroute delay (all causes) 0.00 0.00
Yearly enroute delay (all causes) 0.00 0.00
0.0
0.1
0.2
0.3
0.4
0.5
0.6
0.7
0.8
0.9
1.0
0
50
100
150
200
250
300
350
400
450
500
Enro
ute
De
lay
(min
ute
s p
er
flig
ht)
IFR
flig
hts
(D
aily
Ave
rage
)
UGGGACC - Traffic and en-route ATFM delays
2016 Realisation of Capacity Plan
The average en-route delay per flight remained at zero during Summer 2016.
Capacity Plan : Sufficient capacity to meet demand Achieved Comments
FRAG concept approval Yes FRAG concept is approved. Implementation date of the Step One will be 1Q-2Q of 2017
Further implementation of FRAG Yes Further implementation of FRAG Step Two is planned in 2018+
Implementing a rational use of ASM CDM MIL No Implementation expected in 2017-2018
Implement ATFCM measures and improve FMP issues No Implementation expected in 2Q 2017
Further optimisation and implementation of ATS route network
Yes Further optimisation and implementation of ATS Route network is ongoing process.
Reorganisation of lower and upper airspace Yes Full reorganization of the airspace will be implemented on January the 5th 2017
Finalisation of OLDI connection with adjacent units No
Currently only one OLDI connection is existing with adjacent sector (ANKARA ACC). Finalisation of OLDI connections with all adjacent sectors is expected after new ATM automated system implementation in Tbilisi ACC centre (2017+)
ATS contingency plan approval Yes Approved in 05.01.2016
Conversion of lower airspace to RNAV5 No In accordance with PBN implementation plan expected in 2017+
Optimization of manpower planning No
According to policy and procedures for determination number of staff required in ATS provision, approved in 04.04.2016
Optimization of manpower planning will commence in 2017
Additional staff recruitment to cope with demand Yes Planned from 2017+
Technical implementation of new ATM system No Planned 2017+
Traffic management improvements No Implementation expected 2017+
Maximum configuration: 2 sectors Yes Sectors re-configuration is expected after new ATM system implementation
Summer 2016 performance assessment
The ACC capacity baseline was estimated to be 50. During the measured period, the average peak 1 hour demand was 35 and the average peak 3 hour demand was 23.
Tbilisi
UGGG ACC
Traffic Evolution (2016 v 2015) En-route Delay (min. per flight)
Capacity gap?
ACC Capacity Baseline
(% difference v 2015) Traffic Forecast
Actual Traffic
All reasons ACC Reference
Value Current Routes
Shortest Routes
Year H: 0.1%
B: -1.2%
L: -1.8%
No significant
impact
+3.7% 0.00 0.01
Summer +5.5% 0.00 0.01 No 50 (+25%)

NETWORK OPERATIONS REPORT – 2016
27
©2017 European Organisation for the Safety of Air Navigation (EUROCONTROL)
22. GERMANY - BREMEN ACC
Traffic & Delay
2012 2013 2014 2015 2016
Peak Day Traffic 2239 2136 2192 2185 2293
Summer Traffic 1826 1777 1839 1864 1927
Yearly Traffic 1674 1628 1683 1720 1778
Summer enroute delay (all causes) 0.07 0.08 0.11 0.08 0.20
Yearly enroute delay (all causes) 0.06 0.06 0.09 0.08 0.13
0.0
0.1
0.2
0.3
0.4
0.5
0.6
0.7
0.8
0.9
1.0
0
500
1000
1500
2000
2500
Enro
ute
De
lay
(min
ute
s p
er
flig
ht)
IFR
flig
hts
(D
aily
Ave
rage
)
EDWWACC - Traffic and en-route ATFM delays
2016 Realisation of Capacity Plan
Capacity Plan: 0% Achieved Comments
Maximum configuration: 14 +3 sectors Yes 16 sectors were opened
Summer 2016 performance assessment
The summer traffic increased by 3.4%. The traffic development was in line with the STATFOR Baseline scenario for the year 2016. The Average ATFM Delay En-route per Movement was increased to 0.20 min/flight in Summer 2016. The delays were mainly due to “ATC Capacity” (42%), “Weather” (36%) and “ATC Staffing” (21%). The offered capacity was the same as in 2015, but the strong traffic growth led to a certain capacity deficit. Therefore, the ADM Summer is above the EU reference value. The capacity deficit was only due to the unexpectedly strong traffic growth in the BERLIN area.
The maximum configuration of 16+4 consisted of 13 en-route sectors, 3 en-route/APP- sectors (Hamburg, Hannover) and 4 APP/TMA- sectors (Berlin). The offered configuration of 10+3+3 was opened during the whole year. The sectors EIDER EAST and MÜRITZ LOW were only open for military exercises. The sectors BERLIN DEPARTURE NORTH and SOUTH were always combined. In the SF South was one sector always combined.
Allocation of and Reasons for En-route Delay
YearReference
Location
Avg Daily
ER Delays
% of Total ACC
ER Delay
2016 EDWWDBAS 105 45.9%
2016 EDWWHAMC 68 29.5%
2016 EDWWFLG 40 17.3%
2016 EDWWHEIC 9 4.1%
2016 EDWWDBAT 2 0.8%
2016 EDWWSOUTH 2 0.8%
0
50
100
150
CAPACITY STAFFING DISRUPTION EVENTS WEATHER
Av
g d
ail
y d
ela
y (m
in)
Bremen ACC en-route delays in 2016
Bremen
EDWW ACC
Traffic Evolution (2016 v 2015) En-route Delay (min. per flight)
Capacity gap?
ACC Capacity Baseline
(% difference v 2015) Traffic Forecast
Actual Traffic
All reasons ACC Reference
Value Current Routes
Shortest Routes
Year H: 5.0%
B: 3.5%
L: 2.3%
No significant
impact
+3.4% 0.13 0.07
Summer +3.4% 0.20 0.08 No 151 (0%)
NETWORK OPERATIONS REPORT – 2016
28
©2017 European Organisation for the Safety of Air Navigation (EUROCONTROL)
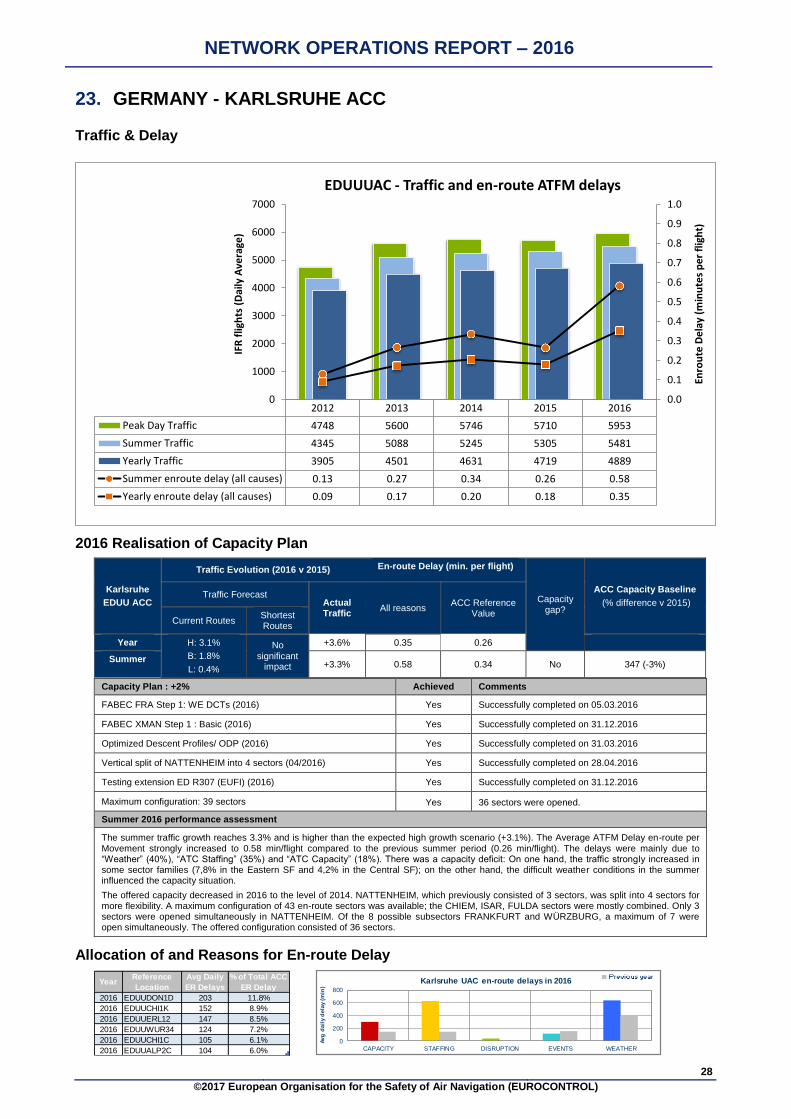
23. GERMANY - KARLSRUHE ACC
Traffic & Delay
2012 2013 2014 2015 2016
Peak Day Traffic 4748 5600 5746 5710 5953
Summer Traffic 4345 5088 5245 5305 5481
Yearly Traffic 3905 4501 4631 4719 4889
Summer enroute delay (all causes) 0.13 0.27 0.34 0.26 0.58
Yearly enroute delay (all causes) 0.09 0.17 0.20 0.18 0.35
0.0
0.1
0.2
0.3
0.4
0.5
0.6
0.7
0.8
0.9
1.0
0
1000
2000
3000
4000
5000
6000
7000
Enro
ute
De
lay
(min
ute
s p
er
flig
ht)
IFR
flig
hts
(D
aily
Ave
rage
)
EDUUUAC - Traffic and en-route ATFM delays
2016 Realisation of Capacity Plan
Capacity Plan : +2% Achieved Comments
FABEC FRA Step 1: WE DCTs (2016) Yes Successfully completed on 05.03.2016
FABEC XMAN Step 1 : Basic (2016) Yes Successfully completed on 31.12.2016
Optimized Descent Profiles/ ODP (2016) Yes Successfully completed on 31.03.2016
Vertical split of NATTENHEIM into 4 sectors (04/2016) Yes Successfully completed on 28.04.2016
Testing extension ED R307 (EUFI) (2016) Yes Successfully completed on 31.12.2016
Maximum configuration: 39 sectors Yes 36 sectors were opened.
Summer 2016 performance assessment
The summer traffic growth reaches 3.3% and is higher than the expected high growth scenario (+3.1%). The Average ATFM Delay en-route per Movement strongly increased to 0.58 min/flight compared to the previous summer period (0.26 min/flight). The delays were mainly due to “Weather” (40%), “ATC Staffing” (35%) and “ATC Capacity” (18%). There was a capacity deficit: On one hand, the traffic strongly increased in some sector families (7,8% in the Eastern SF and 4,2% in the Central SF); on the other hand, the difficult weather conditions in the summer influenced the capacity situation.
The offered capacity decreased in 2016 to the level of 2014. NATTENHEIM, which previously consisted of 3 sectors, was split into 4 sectors for more flexibility. A maximum configuration of 43 en-route sectors was available; the CHIEM, ISAR, FULDA sectors were mostly combined. Only 3 sectors were opened simultaneously in NATTENHEIM. Of the 8 possible subsectors FRANKFURT and WÜRZBURG, a maximum of 7 were open simultaneously. The offered configuration consisted of 36 sectors.
Allocation of and Reasons for En-route Delay
YearReference
Location
Avg Daily
ER Delays
% of Total ACC
ER Delay
2016 EDUUDON1D 203 11.8%
2016 EDUUCHI1K 152 8.9%
2016 EDUUERL12 147 8.5%
2016 EDUUWUR34 124 7.2%
2016 EDUUCHI1C 105 6.1%
2016 EDUUALP2C 104 6.0%
0
200
400
600
800
CAPACITY STAFFING DISRUPTION EVENTS WEATHER
Av
g d
ail
y d
ela
y (
min
)
Karlsruhe UAC en-route delays in 2016
Karlsruhe
EDUU ACC
Traffic Evolution (2016 v 2015) En-route Delay (min. per flight)
Capacity gap?
ACC Capacity Baseline
(% difference v 2015) Traffic Forecast
Actual Traffic
All reasons ACC Reference
Value Current Routes
Shortest Routes
Year H: 3.1%
B: 1.8%
L: 0.4%
No significant
impact
+3.6% 0.35 0.26
Summer +3.3% 0.58 0.34 No 347 (-3%)

NETWORK OPERATIONS REPORT – 2016
29
©2017 European Organisation for the Safety of Air Navigation (EUROCONTROL)
24. GERMANY - LANGEN ACC Traffic & Delay
2012 2013 2014 2015 2016
Peak Day Traffic 4190 4073 4122 4179 4110
Summer Traffic 3688 3640 3642 3679 3689
Yearly Traffic 3377 3319 3317 3343 3361
Summer enroute delay (all causes) 0.88 0.29 0.34 0.15 0.46
Yearly enroute delay (all causes) 0.64 0.24 0.24 0.14 0.30
0.0
0.1
0.2
0.3
0.4
0.5
0.6
0.7
0.8
0.9
1.0
0
500
1000
1500
2000
2500
3000
3500
4000
4500
Enro
ute
De
lay
(min
ute
s p
er
flig
ht)
IFR
flig
hts
(D
aily
Ave
rage
)
EDGGACC - Traffic and en-route ATFM delays
2016 Realisation of Capacity Plan
Capacity Plan 0% Achieved Comments
New P2-System Langen ACC Yes Successfully completed on 14./15.12.2015
FABEC XMAN Step 1 : Basic (2016) Yes Successfully completed on 31.04.2016
Upgrade of P1/ATCAS system (PSS) SF07 Yes Successfully completed on 14.05.2016
Upgrade of P1/ATCAS system PSS SF10 Yes Successfully completed on 17./18.12.2016
Maximum configuration: 22+12 Yes 33 sectors were opened.
Summer 2016 performance assessment
The summer traffic increased in 2016 compared to 2015 by 0.3%. The Average ATFM Delay en-route per Movement significantly increased to 0.46 min/flight in summer 2016 compared to the last year (0.15 min/flight), and was therefore above the reference value (0.30 min/flight). The delays were mainly due to “Weather” (37%), “ATC Staffing” (28%), “Special Events” (19.5%) and “ATC Capacity” (13%). The high proportion of
delay caused by “special events” can be explained by the introduction of PSS in SF 07. Overall, the capacity deficit was mainly caused by PSS implementation in the Summer season.
The maximum configuration of 23+13 consisted of 23 en-route sectors (including 3 sectors with predominantly military traffic), 2 en-route /APP- sectors (Stuttgart) and 11 APP/TMA- sectors (Düsseldorf, Frankfurt and Cologne/Bonn). The offered configuration was 21+12 sectors (the en-route sectors NECKAR HIGH and LOW, KITZINGEBN and HAMMELBURG were always combined; in Cologne/Bonn APP, two sectors were always combined - either DKAE and DKAW or DKAW and NOR).
Allocation of and Reasons for En-route Delay
YearReference
Location
Avg Daily
ER Delays
% of Total ACC
ER Delay
2016 EDGG7 345 34.6%
2016 EDGGNOR 163 16.3%
2016 EDGG1 74 7.5%
2016 EDGGDKA 67 6.7%
2016 EDGGDLSN 63 6.3%
2016 EDGGDLA 50 5.0%
0
100
200
300
400
CAPACITY STAFFING DISRUPTION EVENTS WEATHER
Av
g d
ail
y d
ela
y (
min
)
Langen ACC en-route delays in 2016
Langen
EDGG ACC
Traffic Evolution (2016 v 2015) En-route Delay (min. per flight)
Capacity gap?
ACC Capacity Baseline
(% difference v 2015) Traffic Forecast
Actual Traffic
All reasons ACC Reference
Value Current Routes
Shortest Routes
Year H: 2.8%
B: 1.7%
L: 0.3%
No significant
impact
+0.5% 0.30 0.23
Summer +0.3% 0.46 0.30 No 244 (-6%)

NETWORK OPERATIONS REPORT – 2016
30
©2017 European Organisation for the Safety of Air Navigation (EUROCONTROL)
25. GERMANY - MUNICH ACC Traffic & Delay
2012 2013 2014 2015 2016
Peak Day Traffic 4798 3593 3543 3560 3724
Summer Traffic 4390 3126 3099 3204 3245
Yearly Traffic 3911 2876 2846 2923 2974
Summer enroute delay (all causes) 0.51 0.08 0.04 0.08 0.08
Yearly enroute delay (all causes) 0.32 0.05 0.02 0.04 0.04
0.0
0.1
0.2
0.3
0.4
0.5
0.6
0.7
0.8
0.9
1.0
0
1000
2000
3000
4000
5000
6000
Enro
ute
De
lay
(min
ute
s p
er
flig
ht)
IFR
flig
hts
(D
aily
Ave
rage
)
EDMMACC - Traffic and en-route ATFM delays
2016 Realisation of Capacity Plan
Capacity Plan: +2% Achieved Comments
FABEC CC XMAN Step 1: Basic
Link: EDDM - EDUU (100NM) Yes Successfully completed on 04/2016.
P1-HW upgrade ATS system P2i during ongoing operation Yes Successfully completed on 18./19.09.2016
Integration SF North + South to SF West (INSEL) (End of 2020)
Ongoing Ongoing
Maximum configuration: 14+4 Yes 18 sectors open
Summer 2016 performance assessment
The Average ATFM Delay En-route per Movement reached 0.08 min/flight, as in the previous summer period. The delays were exclusively due to “Weather” (100%). The ADM summer 2016 was below the reference value.
The maximum configuration, of 17+4 sectors, consisted of 14 en-route sectors, 3 en-route /APP- sectors (Nuremberg, Dresden and Leipzig) and 4 APP/TMA- sectors (Munich). The offered configuration consisted of 14+4 sectors – three en-route sectors were mostly combined (FRANKEN Upper/High, NÖRDLINGEN/WALDA and SACHSEN Low/High).
Allocation of and Reasons for En-route Delay
YearReference
Location
Avg Daily
ER Delays
% of Total ACC
ER Delay
2016 EDMMCN2 35 26.8%
2016 EDMMTEG 16 12.0%
2016 EDMMALB 14 10.7%
2016 EDMMFRKHU 13 10.4%
2016 EDMMZUS 13 10.2%
2016 EDMMFUE 11 8.9%
0
50
100
150
CAPACITY STAFFING DISRUPTION EVENTS WEATHER
Av
g d
ail
y d
ela
y (
min
)
Munich ACC en-route delays in 2016
Munich
EDMM ACC
Traffic Evolution (2016 v 2015) En-route Delay (min. per flight)
Capacity gap?
ACC Capacity Baseline
(% difference v 2015) Traffic Forecast
Actual Traffic
All reasons ACC Reference
Value Current Routes
Shortest Routes
Year H: 3.0%
B: 1.9%
L: 0.5%
-10%
+1.7% 0.04 0.19
Summer +1.3% 0.08 0.25 No 250 (0%)

NETWORK OPERATIONS REPORT – 2016
31
©2017 European Organisation for the Safety of Air Navigation (EUROCONTROL)
26. GREECE - ATHENS ACC Traffic & Delay
2012 2013 2014 2015 2016
Peak Day Traffic 2197 2306 2419 2430 2492
Summer Traffic 1521 1561 1720 1779 1774
Yearly Traffic 1195 1195 1291 1365 1342
Summer enroute delay (all causes) 0.29 0.11 0.67 1.46 0.24
Yearly enroute delay (all causes) 0.19 0.07 0.45 0.96 0.16
0.0
0.2
0.4
0.6
0.8
1.0
1.2
1.4
1.6
0
500
1000
1500
2000
2500
3000
Enro
ute
De
lay
(min
ute
s p
er
flig
ht)
IFR
flig
hts
(D
aily
Ave
rage
)
LGGGACC - Traffic and en-route ATFM delays
2016 Realisation of Capacity Plan
The average en-route delay per flight decreased from 1.46 minutes per flight in Summer 2015 to 0.24 minutes per flight in Summer 2016.
87% of delays were due to the reason ATC capacity and 13% due ATC staffing.
Capacity Plan +18% Achieved Comments
Night DCTs / FRA Yes Full FRA implementation foreseen after 2020
Improved civil/military coordination Yes Stepped implementation of LARA system
PBN procedures implemented at 4 airports (Kerkira, Heraklion, Santorini, Mikonos)
Ongoing Fully implemented for Kerkira, other three airports planned to be operational in summer 2017
Improved ATFCM, including STAM Yes
Improved ATS route network and airspace management Yes
Airspace reorganisation/resectorisation project No New sectorisation foreseen for 2018
Reduction in number of ATCOs No
FPL 2012 upgrade Yes
Maximum configuration: 6/7 sectors Yes 7 sectors open
Summer 2016 performance assessment
The ACC capacity baseline was measured with ACCESS/Reverse CASA at 124, 5% higher than 2015. During the measured period, the average peak 1 hour demand was 125 and the average peak 3 hour demand was 116.
Allocation of and Reasons for En-route Delay
YearReference
Location
Avg Daily
ER Delays
% of Total ACC
ER Delay
2016 LGGGRDSL 90 41.7%
2016 LGGGMILL 71 32.6%
2016 LGGGKRK 19 8.8%
2016 LGGGMIL 17 7.8%
2016 LGGGKFPL 13 5.8%
2016 LGGGRDS 3 1.2%
0
500
1000
CAPACITY STAFFING DISRUPTION EVENTS WEATHER
Av
g d
ail
y d
ela
y (m
in)
Athens ACC en-route delays in 2016
Athens
LGGG ACC
Traffic Evolution (2016 v 2015) En-route Delay (min. per flight)
Capacity gap?
ACC Capacity Baseline
(% difference v 2015) Traffic Forecast
Actual Traffic
All reasons ACC Reference
Value Current Routes
Shortest Routes
Year H: 4.6%
B: 2.4%
L: 0.5%
No significant
impact
-1.7% 0.16 0.20
Summer -0.3% 0.24 0.28 Yes 124 (+5%)

NETWORK OPERATIONS REPORT – 2016
32
©2017 European Organisation for the Safety of Air Navigation (EUROCONTROL)
27. GREECE - MAKEDONIA ACC Traffic & Delay
2012 2013 2014 2015 2016
Peak Day Traffic 1708 1721 1942 1996 1960
Summer Traffic 1268 1264 1413 1452 1415
Yearly Traffic 961 939 1032 1075 1041
Summer enroute delay (all causes) 0.07 0.03 0.24 0.75 0.06
Yearly enroute delay (all causes) 0.04 0.02 0.17 0.51 0.04
0.0
0.1
0.2
0.3
0.4
0.5
0.6
0.7
0.8
0.9
1.0
0
500
1000
1500
2000
2500
Enro
ute
De
lay
(min
ute
s p
er
flig
ht)
IFR
flig
hts
(D
aily
Ave
rage
)
LGMDACC - Traffic and en-route ATFM delays
2016 Realisation of Capacity Plan
The average en-route delay decreased from 0.75 minutes per flight in Summer 2015 to 0.06 minutes per flight in Summer 2016.
56% of delays were due to the reason ATC staffing, and 44% due ATC capacity.
Capacity Plan : +11% Achieved Comments
Night DCTs / FRA Yes Full FRA implementation foreseen after 2020
Improved civil/military coordination Yes Stepped implementation of LARA system
PBN procedures implemented at 4 airports (Kerkira, Heraklion, Santorini, Mikonos)
Ongoing Fully implemented for Kerkira, other three airports planned to be operational in summer 2017
Improved ATFCM, including STAM Yes
Improved ATS route network and airspace management Yes
Airspace reorganisation/resectorisation project No New sectorisation foreseen for 2018
Reduction in number of ATCOs No
FPL 2012 upgrade Yes
Maximum configuration: 4/5 sectors Yes 4 sectors were sufficient due to actual traffic distribution
Summer 2016 performance assessment
The ACC capacity baseline was measured with ACCESS/Reverse CASA at 104, 4% higher than in 2015. During the measured period, the average peak 1 hour demand was 101 and the average peak 3 hour demand was 92.
Allocation of and Reasons for En-route Delay
YearReference
Location
Avg Daily
ER Delays
% of Total ACC
ER Delay
2016 LGMDW 36 78.2%
2016 LGMDWU 5 9.9%
2016 LGMDE 2 4.4%
2016 LGMDELM 2 3.6%
2016 LGMDEU 1 2.5%
2016 LGMDWLSK 1 1.4%
0
100
200
300
400
CAPACITY STAFFING DISRUPTION EVENTS WEATHER
Av
g d
ail
y d
ela
y (m
in)
Makedonia ACC en-route delays in 2016
Makedonia
LGMD ACC
Traffic Evolution (2016 v 2015) En-route Delay (min. per flight)
Capacity gap?
ACC Capacity Baseline
(% difference v 2015) Traffic Forecast
Actual Traffic
All reasons ACC Reference
Value Current Routes
Shortest Routes
Year H: 6.0%
B: 3.7%
L: 1.5%
No significant
impact
-3.2% 0.04 0.16
Summer -2.5% 0.06 0.21 Yes 104 (+4%)

NETWORK OPERATIONS REPORT – 2016
33
©2017 European Organisation for the Safety of Air Navigation (EUROCONTROL)
28. HUNGARY - BUDAPEST ACC
Traffic & Delay
2012 2013 2014 2015 2016
Peak Day Traffic 2316 2353 2808 2893 2915
Summer Traffic 1847 1904 2147 2364 2405
Yearly Traffic 1526 1566 1754 1951 2016
Summer enroute delay (all causes) 0.00 0.00 0.00 0.04 0.13
Yearly enroute delay (all causes) 0.00 0.00 0.00 0.03 0.08
0.0
0.1
0.2
0.3
0.4
0.5
0.6
0.7
0.8
0.9
1.0
0
500
1000
1500
2000
2500
3000
3500
Enro
ute
De
lay
(min
ute
s p
er
flig
ht)
IFR
flig
hts
(D
aily
Ave
rage
)
LHCCACC - Traffic and en-route ATFM delays
2016 Realisation of Capacity Plan
The average en-route delay per flight increased from 0.04 minutes per flight in Summer 2015 to 0.13 minutes per flight during the same period in 2016.
56% of the delays were due to Weather and 44% due to ATC capacity.
Capacity Plan +2.5% Achieved Comments
Optimization of airspace structure Full FRA
New geographical sectors are planned with step by step implementation
Recruitment and training of controllers Yes 7 new ATCOs expected after the summer season 2017 with uncertain (0-5) retirements
CPDLC operational Yes Very low usage from the operators
Maximum configuration: 10 sectors Yes max. 8 sectors with level capping
Summer 2016 performance assessment
The ACC capacity baseline was measured with ACCESS at 195, 5% lower than in 2015. During the measured period, the average peak 1 hour demand was 180 and the average peak 3 hour demand was 162.
Allocation of and Reasons for En-route Delay
YearReference
Location
Avg Daily
ER Delays
% of Total ACC
ER Delay
2016 LHCCEASTH 45 28.5%
2016 LHCCEASTU 31 19.7%
2016 LHCCWLM 20 12.9%
2016 LHCCEHT 19 11.9%
2016 LHCCELM 13 8.4%
2016 LHCCWHT 8 4.9%
0
50
100
CAPACITY STAFFING DISRUPTION EVENTS WEATHER
Av
g d
ail
y d
ela
y (m
in)
Budapest ACC en-route delays in 2016
Budapest
LHCC ACC
Traffic Evolution (2016 v 2015) En-route Delay (min. per flight)
Capacity gap?
ACC Capacity Baseline
(% difference v 2015) Traffic Forecast
Actual Traffic
All reasons ACC Reference
Value Current Routes
Shortest Routes
Year H: 3.8%
B: 2.2%
L: 0.9%
-11%
+3.3% 0.08 0.05
Summer +1.7% 0.13 0.08 No 195 (-5%)

NETWORK OPERATIONS REPORT – 2016
34
©2017 European Organisation for the Safety of Air Navigation (EUROCONTROL)
29. IRELAND - DUBLIN ACC Traffic & Delay
2012 2013 2014 2015 2016
Peak Day Traffic 624 634 659 715 778
Summer Traffic 544 568 595 642 708
Yearly Traffic 491 509 537 578 635
Summer enroute delay (all causes) 0.00 0.00 0.00 0.00 0.00
Yearly enroute delay (all causes) 0.00 0.00 0.00 0.00 0.00
0.0
0.1
0.2
0.3
0.4
0.5
0.6
0.7
0.8
0.9
1.0
0
100
200
300
400
500
600
700
800
900
Enro
ute
De
lay
(min
ute
s p
er
flig
ht)
IFR
flig
hts
(D
aily
Ave
rage
)
EIDWACC - Traffic and en-route ATFM delays
2016 Realisation of Capacity Plan
Average En-route delay per flight remained at zero minutes per flight in Summer 2016 as in 2015.
Capacity Plan: +3% Achieved Comments
A-CDM at Dublin airport No Implementation due 2017
Improved ATFCM, including STAM Yes
UK / Ireland FAB initiatives Yes
On-going recruitment to maintain staff levels Yes
Cross rating training Yes
Tower electronic strips No Implementation due 2017 linked to A-CDM
Minor upgrade of the ATM system Yes
Sector capacity re-evaluation (CAPAN) Yes
Maximum configuration: 4 sectors Yes 4 sectors were opened
Summer 2016 performance assessment
The ACCESS measured baseline of 64 indicates the capacity available during the measured period. The peak 1 hour demand was 57 and the peak 3 hour demand was 47.
Dublin
EIDW ACC
Traffic Evolution (2016 v 2015) En-route Delay (min. per flight)
Capacity gap?
ACC Capacity Baseline
(% difference v 2015) Traffic Forecast
Actual Traffic
All reasons ACC Reference
Value Current Routes
Shortest Routes
Year H: 5.1%
B: 3.5%
L: 3.1%
No significant
impact
+9.9% 0.00 0.03
Summer +10.3% 0.00 0.03 No 64 (+8%)

NETWORK OPERATIONS REPORT – 2016
35
©2017 European Organisation for the Safety of Air Navigation (EUROCONTROL)
30. IRELAND - SHANNON ACC
Traffic & Delay
2012 2013 2014 2015 2016
Peak Day Traffic 1381 1467 1578 1495 1632
Summer Traffic 1189 1199 1250 1279 1378
Yearly Traffic 1075 1074 1086 1127 1211
Summer enroute delay (all causes) 0.00 0.00 0.00 0.00 0.00
Yearly enroute delay (all causes) 0.00 0.00 0.00 0.00 0.00
0.0
0.1
0.2
0.3
0.4
0.5
0.6
0.7
0.8
0.9
1.0
0
200
400
600
800
1000
1200
1400
1600
1800
Enro
ute
De
lay
(min
ute
s p
er
flig
ht)
IFR
flig
hts
(D
aily
Ave
rage
)
EISNACC - Traffic and en-route ATFM delays
2016 Realisation of Capacity Plan
Average En-route delay per flight remained at zero minutes per flight in Summer 2016 as in 2015.
Capacity Plan: +2% Achieved Comments
Low level FRA No Planned October 2017
Improved ATFCM, including STAM Yes
UK / Ireland FAB initiatives Yes
R-LAT (Dec 2015) Yes
CPDLC (FANS and ATN) Yes
Developing Queue Management programme (London Heathrow XMAN) Yes
SPO Yes
On-going recruitment to maintain staff levels Yes
Minor ATM system upgrade Yes
Sector capacity re-evaluation (CAPAN) Yes
Extra sectors as required – Dynamic sectorisation available Yes
Maximum configuration: 12 sectors Yes 10 sectors open
Summer 2016 performance assessment
The ACCESS measured baseline of 128 indicates the capacity available during the measured period. The peak 1 hour demand was 117 and the peak 3 hour demand was 106.
Shannon
EISN ACC
Traffic Evolution (2016 v 2015) En-route Delay (min. per flight)
Capacity gap?
ACC Capacity Baseline
(% difference v 2015) Traffic Forecast
Actual Traffic
All reasons ACC Reference
Value Current Routes
Shortest Routes
Year H: 3.3%
B: 2.6%
L: 2.0%
No significant
impact
+7.5% 0.00 0.04
Summer +7.7% 0.00 0.05 No 128 (+3%)

NETWORK OPERATIONS REPORT – 2016
36
©2017 European Organisation for the Safety of Air Navigation (EUROCONTROL)
31. ITALY - BRINDISI ACC
Traffic & Delay
2012 2013 2014 2015 2016
Peak Day Traffic 1349 1377 1273 1226 1247
Summer Traffic 978 961 884 864 924
Yearly Traffic 808 786 730 697 733
Summer enroute delay (all causes) 0.00 0.00 0.01 0.00 0.00
Yearly enroute delay (all causes) 0.00 0.00 0.01 0.00 0.00
0.0
0.1
0.2
0.3
0.4
0.5
0.6
0.7
0.8
0.9
1.0
0
200
400
600
800
1000
1200
1400
1600
Enro
ute
De
lay
(min
ute
s p
er
flig
ht)
IFR
flig
hts
(D
aily
Ave
rage
)
LIBBACC - Traffic and en-route ATFM delays
2016 Realisation of Capacity Plan
Average en-route delay per flight remained at zero, the same as during Summer 2015.
Capacity Plan: +8% Achieved Comments
Free-route implementation program Yes
Improved airspace management Yes
PBN Program Yes
Improved ATFCM, including STAM Yes
Airspace management and ATS route assessment and/or improvements according to network needs, Airspace Users expectations, ENAV’s Flight Efficiency Plan and BLUEMED FAB implementation
Yes
TMA reorganisation Yes
Additional capacity benefits from VDL Mode 2 implementation by all stakeholders
Yes
LINK IT (Data Link implementation) Yes
MTCD No Planned 2017
Flexible opening scheme according to traffic demand and system enablers implementation
Yes
Maximum configuration: 5/6 sectors Yes 4 sectors were sufficient
Summer 2016 performance assessment
The ACC capacity baseline was measured at 87. During the measured period (June and July), the average peak 1 hour demand was 69 and the average peak 3 hour demand was 63.
Brindisi
LIBB ACC
Traffic Evolution (2016 v 2015) En-route Delay (min. per flight)
Capacity gap?
ACC Capacity Baseline
(% difference v 2015) Traffic Forecast
Actual Traffic
All reasons ACC Reference
Value Current Routes
Shortest Routes
Year H: 5.5%
B: 3.6%
L: 1.9%
+19%
+5.2% 0.00 0.01
Summer +6.9% 0.00 0.01 No 87 (+1%)

NETWORK OPERATIONS REPORT – 2016
37
©2017 European Organisation for the Safety of Air Navigation (EUROCONTROL)
32. ITALY - MILAN ACC Traffic & Delay
2012 2013 2014 2015 2016
Peak Day Traffic 2165 2020 2893 2843 2943
Summer Traffic 1853 1754 2441 2496 2579
Yearly Traffic 1659 1567 1973 2166 2226
Summer enroute delay (all causes) 0.00 0.00 0.00 0.00 0.00
Yearly enroute delay (all causes) 0.00 0.00 0.03 0.00 0.00
0.0
0.1
0.2
0.3
0.4
0.5
0.6
0.7
0.8
0.9
1.0
0
500
1000
1500
2000
2500
3000
3500
Enro
ute
De
lay
(min
ute
s p
er
flig
ht)
IFR
flig
hts
(D
aily
Ave
rage
)
LIMMACC - Traffic and en-route ATFM delays
2016 Realisation of Capacity Plan
Average en-route delay per flight remained at zero, the same as during Summer 2015.
Capacity Plan: +5% Achieved Comments
Free-route implementation program Yes
Improved airspace management Yes
PBN Program Yes
Evaluation and implementation of AMAN//Extended AMAN Yes
Improved ATFCM, including STAM Yes
Airspace management and ATS route assessment and/or improvements according to network needs, Airspace Users, ENAV’s Flight Efficiency Plan and/or BLUEMED FAB implementation
Yes
TMA reorganisation Yes
Additional ATCOs (from TWRs to ACC) Yes
MTCD No Planned 2017
Flexible opening scheme according to traffic demand and system enablers implementation
Yes
Maximum configuration: 21 sectors Yes 19 sectors were sufficient
Summer 2016 performance assessment
The ACC capacity baseline was measured with ACCESS at 197. During the measured period (June and July), the average peak 1 hour demand was 192 and the average peak 3 hour demand was 181.
Milan
LIMM
ACC
Traffic Evolution (2016 v 2015) En-route Delay
(min. per flight)
Capacity gap?
ACC Capacity Baseline
(% difference v 2015) Traffic Forecast
Actual Traffic
All reasons ACC Reference
Value Current Routes
Shortest Routes
Year H: 4.1%
B: 2.5%
L: 0.7%
No significant
impact
+2.8% 0.00 0.08
Summer +3.3% 0.00 0.13 No 197 (+3%)

NETWORK OPERATIONS REPORT – 2016
38
©2017 European Organisation for the Safety of Air Navigation (EUROCONTROL)
33. ITALY - PADOVA ACC
Traffic & Delay
2012 2013 2014 2015 2016
Peak Day Traffic 2826 2869 2904 2694 2839
Summer Traffic 2220 2207 2264 2129 2218
Yearly Traffic 1844 1821 1854 1764 1815
Summer enroute delay (all causes) 0.00 0.00 0.01 0.00 0.01
Yearly enroute delay (all causes) 0.00 0.00 0.01 0.00 0.00
0.0
0.1
0.2
0.3
0.4
0.5
0.6
0.7
0.8
0.9
1.0
0
500
1000
1500
2000
2500
3000
3500
Enro
ute
De
lay
(min
ute
s p
er
flig
ht)
IFR
flig
hts
(D
aily
Ave
rage
)
LIPPACC - Traffic and en-route ATFM delays
2016 Realisation of Capacity Plan
Average en-route delay per flight slightly increased from zero minutes per flight during summer 2015 to 0.01 minutes per flight in summer 2016.
Capacity Plan: +2% Achieved Comments
Free-route implementation program Yes
Improved airspace management Yes
PBN Program Yes
Improved ATFCM including STAM Yes
Airspace management and ATS route assessment and/or improvements according to network needs, Airspace Users expectations, ENAV’s Flight Efficiency Plan and/or BLUEMED FAB implementation
Yes
TMA reorganisation Yes
MTCD No Planned 2017
Flexible opening scheme according to traffic demand and system enablers implementation
Yes
Maximum configuration: 13 sectors Yes 12 sectors were sufficient
Summer 2016 performance assessment
The ACC capacity baseline was measured at 194. During the measured period (June and July) the average peak 1 hour demand was 173 and the average peak 3 hour demand was 163.
Allocation of and Reasons for En-route Delay
YearReference
Location
Avg Daily
ER Delays
% of Total ACC
ER Delay
2016 LIPPCTA 7 84.2%
2016 LIPPN5 0 5.9%
2016 LIPPCS35 0 3.9%
2016 LIPPN34 0 3.1%
2016 LIPPSD36 0 2.0%
2016 LIPPNCS56 0 0.7%
0
5
10
CAPACITY STAFFING DISRUPTION EVENTS WEATHER
Av
g d
ail
y d
ela
y (m
in)
Padova ACC en-route delays in 2016
Padova
LIPP ACC
Traffic Evolution (2016 v 2015) En-route Delay (min. per flight)
Capacity gap?
ACC Capacity Baseline
(% difference v 2015) Traffic Forecast
Actual Traffic
All reasons ACC Reference
Value Current Routes
Shortest Routes
Year H: 3.8%
B: 2.3%
L: 0.7%
No significant
impact
+2.9% 0.00 0.09
Summer +4.2% 0.01 0.13 No 194 (+1%)

NETWORK OPERATIONS REPORT – 2016
39
©2017 European Organisation for the Safety of Air Navigation (EUROCONTROL)
34. ITALY - ROME ACC
Traffic & Delay
2012 2013 2014 2015 2016
Peak Day Traffic 3798 3799 3060 3070 3105
Summer Traffic 3068 3054 2477 2512 2568
Yearly Traffic 2583 2565 2239 2144 2164
Summer enroute delay (all causes) 0.00 0.01 0.00 0.03 0.00
Yearly enroute delay (all causes) 0.00 0.00 0.00 0.02 0.00
0.0
0.1
0.2
0.3
0.4
0.5
0.6
0.7
0.8
0.9
1.0
0
500
1000
1500
2000
2500
3000
3500
4000
Enro
ute
De
lay
(min
ute
s p
er
flig
ht)
IFR
flig
hts
(D
aily
Ave
rage
)
LIRRACC - Traffic and en-route ATFM delays
2016 Realisation of Capacity Plan
Average en-route delay per flight decreased from 0.03 minutes per flight in Summer 2015 to zero minutes per flight in Summer 2016.
Capacity Plan: +2% Achieved Comments
Free-route implementation program Yes
Improved airspace management Yes
PBN Program Yes
Evaluation and implementation of AMAN/Extended AMAN Yes
Improved ATFCM including STAM Yes
Airspace management and ATS route assessment and/or improvements according to network needs, Airspace Users expectations, ENAV’s Flight Efficiency Plan and/or BLUEMED FAB implementation
Yes
MTCD No Planned 2017
Flexible opening scheme according to traffic demand and system enablers implementation
Yes
Maximum configuration: 21 sectors Yes 18 sectors were sufficient
Summer 2016 performance assessment
The ACC capacity baseline was assessed measured at 214. During the measured period (June and July), the average peak 1 hour demand was 190 and the average peak 3 hour demand was 180.
Rome
LIRR ACC
Traffic Evolution (2016 v 2015) En-route Delay (min. per flight)
Capacity gap?
ACC Capacity Baseline
(% difference v 2015) Traffic Forecast
Actual Traffic
All reasons ACC Reference
Value Current Routes
Shortest Routes
Year H: 2.3%
B: 1.0%
L: -0.6%
No significant
impact
+0.9% 0.00 0.04
Summer +2.2% 0.00 0.06 No 214 (0%)
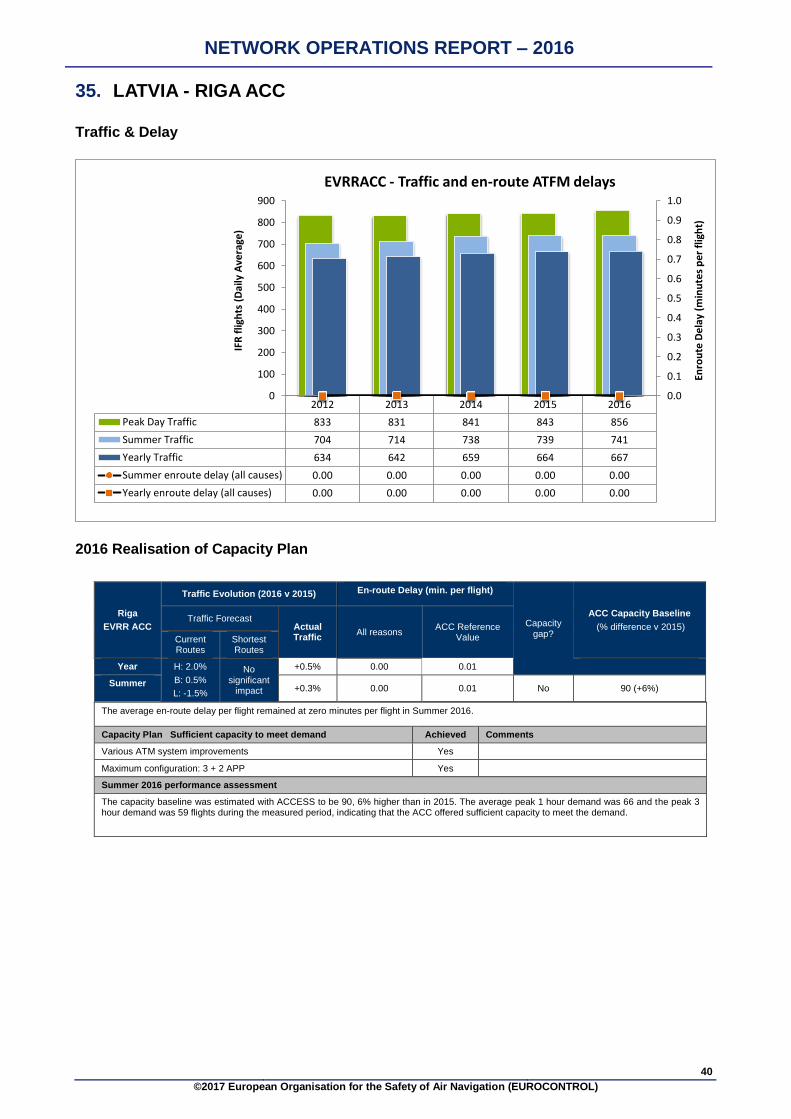
NETWORK OPERATIONS REPORT – 2016
40
©2017 European Organisation for the Safety of Air Navigation (EUROCONTROL)
35. LATVIA - RIGA ACC
Traffic & Delay
2012 2013 2014 2015 2016
Peak Day Traffic 833 831 841 843 856
Summer Traffic 704 714 738 739 741
Yearly Traffic 634 642 659 664 667
Summer enroute delay (all causes) 0.00 0.00 0.00 0.00 0.00
Yearly enroute delay (all causes) 0.00 0.00 0.00 0.00 0.00
0.0
0.1
0.2
0.3
0.4
0.5
0.6
0.7
0.8
0.9
1.0
0
100
200
300
400
500
600
700
800
900
Enro
ute
De
lay
(min
ute
s p
er
flig
ht)
IFR
flig
hts
(D
aily
Ave
rage
)
EVRRACC - Traffic and en-route ATFM delays
2016 Realisation of Capacity Plan
The average en-route delay per flight remained at zero minutes per flight in Summer 2016.
Capacity Plan Sufficient capacity to meet demand Achieved Comments
Various ATM system improvements Yes
Maximum configuration: 3 + 2 APP Yes
Summer 2016 performance assessment
The capacity baseline was estimated with ACCESS to be 90, 6% higher than in 2015. The average peak 1 hour demand was 66 and the peak 3 hour demand was 59 flights during the measured period, indicating that the ACC offered sufficient capacity to meet the demand.
Riga
EVRR ACC
Traffic Evolution (2016 v 2015) En-route Delay (min. per flight)
Capacity gap?
ACC Capacity Baseline
(% difference v 2015) Traffic Forecast
Actual Traffic
All reasons ACC Reference
Value Current Routes
Shortest Routes
Year H: 2.0%
B: 0.5%
L: -1.5%
No significant
impact
+0.5% 0.00 0.01
Summer +0.3% 0.00 0.01 No 90 (+6%)

NETWORK OPERATIONS REPORT – 2016
41
©2017 European Organisation for the Safety of Air Navigation (EUROCONTROL)
36. LITHUANIA - VILNIUS ACC
Traffic & Delay
2012 2013 2014 2015 2016
Peak Day Traffic 685 738 804 776 763
Summer Traffic 602 633 672 664 675
Yearly Traffic 545 566 598 599 607
Summer enroute delay (all causes) 0.00 0.00 0.00 0.00 0.00
Yearly enroute delay (all causes) 0.00 0.00 0.00 0.00 0.00
0.0
0.1
0.2
0.3
0.4
0.5
0.6
0.7
0.8
0.9
1.0
0
100
200
300
400
500
600
700
800
900
Enro
ute
De
lay
(min
ute
s p
er
flig
ht)
IFR
flig
hts
(D
aily
Ave
rage
)
EYVCACC - Traffic and en-route ATFM delays
2016 Realisation of Capacity Plan
The average en-route delay per flight remained at zero minutes per flight in Summer 2016.
Capacity Plan Sufficient capacity to meet demand Achieved Comments
FRA implementation above FL95 in Vilnius FIR Yes
Maximum configuration: 3 sectors Yes 3 sectors were opened
Summer 2016 performance assessment
The ACC capacity baseline was assessed to be at the same level as in Summer 2015. The peak 1 hour demand was 57 and the peak 3 hour demand was 51 during the measured period.
Vilnius
EYVC ACC
Traffic Evolution (2016 v 2015) En-route Delay (min. per flight)
Capacity gap?
ACC Capacity Baseline
(% difference v 2015) Traffic Forecast
Actual Traffic
All reasons ACC Reference
Value Current Routes
Shortest Routes
Year H: 1.0%
B: -0.3%
L: -1.6%
No significant
impact
+1.3% 0.00 0.02
Summer +1.7% 0.00 0.02 No 77 (0%)

NETWORK OPERATIONS REPORT – 2016
42
©2017 European Organisation for the Safety of Air Navigation (EUROCONTROL)
37. MALTA - MALTA ACC
Traffic & Delay
2012 2013 2014 2015 2016
Peak Day Traffic 389 415 392 379 425
Summer Traffic 305 331 297 312 333
Yearly Traffic 264 298 277 279 298
Summer enroute delay (all causes) 0.00 0.00 0.00 0.00 0.00
Yearly enroute delay (all causes) 0.00 0.00 0.00 0.00 0.00
0.0
0.1
0.2
0.3
0.4
0.5
0.6
0.7
0.8
0.9
1.0
0
50
100
150
200
250
300
350
400
450
Enro
ute
De
lay
(min
ute
s p
er
flig
ht)
IFR
flig
hts
(D
aily
Ave
rage
)
LMMMACC - Traffic and en-route ATFM delays
2016 Realisation of Capacity Plan
The average en-route delay per flight remained at zero minutes per flight in Summer 2016.
Capacity Plan Sufficient capacity to meet demand Achieved Comments
New ATM system No
Maximum configuration: 2 sectors Yes 2 sectors
Summer 2016 performance assessment
The ACC capacity baseline was measured with ACCESS. During June and July, the average peak 1 hour demand was 28 flights and the peak 3 hour demand was 24 flights per hour.
Malta
LMMM ACC
Traffic Evolution (2016 v 2015) En-route Delay (min. per flight)
Capacity gap?
ACC Capacity Baseline
(% difference v 2015) Traffic Forecast
Actual Traffic
All reasons ACC Reference
Value Current Routes
Shortest Routes
Year H:0.7%
B: -1.3%
L: -3.8%
No significant
impact
+6.8% 0.00 0.02
Summer +6.7% 0.00 0.02 No 42 (0%)

NETWORK OPERATIONS REPORT – 2016
43
©2017 European Organisation for the Safety of Air Navigation (EUROCONTROL)
38. MOLDOVA - CHISINAU ACC
Traffic & Delay
2012 2013 2014 2015 2016
Peak Day Traffic 284 330 279 190 193
Summer Traffic 202 241 165 146 131
Yearly Traffic 171 198 149 119 108
Summer enroute delay (all causes) 0.00 0.00 0.00 0.00 0.00
Yearly enroute delay (all causes) 0.00 0.00 0.00 0.00 0.00
0.0
0.1
0.2
0.3
0.4
0.5
0.6
0.7
0.8
0.9
1.0
0
50
100
150
200
250
300
350
Enro
ute
De
lay
(min
ute
s p
er
flig
ht)
IFR
flig
hts
(D
aily
Ave
rage
)
LUUUACC - Traffic and en-route ATFM delays
2016 Realisation of Capacity Plan
Average En-route delay per flight remained at zero, as in Summer 2015.
Capacity Plan: Sufficient capacity to meet demand Achieved Comments
Airspace structure changes No
WAM / MLAT systems Yes
Maximum configuration: 3 sectors Yes 2 sectors were sufficient for the levels of traffic in 2016 - Sectors 2 and 3 are collapsed (H24)
Summer 2016 performance assessment
The ACC capacity baseline was estimated at 40. The peak 1 hour demand was 13 flights and the peak 3 hour demand was 11.
Chisinau
LUUU ACC
Traffic Evolution (2016 v 2015) En-route Delay (min. per flight)
Capacity gap?
ACC Capacity Baseline
(% difference v 2015) Traffic Forecast
Actual Traffic
All reasons ACC Reference
Value Current Routes
Shortest Routes
Year H: 3.2%
B: 1.2%
L: -0.1%
No significant
impact
-9.2% 0.00 0.01
Summer -10.3% 0.00 0.02 No 40 (0%)

NETWORK OPERATIONS REPORT – 2016
44
©2017 European Organisation for the Safety of Air Navigation (EUROCONTROL)
39. THE NETHERLANDS - AMSTERDAM ACC Traffic & Delay
2012 2013 2014 2015 2016
Peak Day Traffic 1645 1657 1698 1764 1885
Summer Traffic 1509 1534 1565 1632 1733
Yearly Traffic 1393 1408 1441 1499 1582
Summer enroute delay (all causes) 0.26 0.15 0.17 0.13 0.14
Yearly enroute delay (all causes) 0.18 0.12 0.13 0.10 0.10
0.0
0.1
0.2
0.3
0.4
0.5
0.6
0.7
0.8
0.9
1.0
0
200
400
600
800
1000
1200
1400
1600
1800
2000
Enro
ute
De
lay
(min
ute
s p
er
flig
ht)
IFR
flig
hts
(D
aily
Ave
rage
)
EHAAACC - Traffic and en-route ATFM delays
2016 Realisation of Capacity Plan
The average en-route delay per flight slightly increased from 0.13 minutes per flight during Summer 2015 to 0.14 minutes per flight in Summer 2016.
63% of the delays were for the reason ATC Capacity and 30% for the reason Weather.
Capacity Plan 0% Achieved Comments
Maximum configuration: 5 sectors Yes
Summer 2016 performance assessment
The ACC capacity baseline was measured with ACCESS at 146, representing the delivered capacity. This was sufficient to accommodate the traffic demand, with an average peak 1 hour of 135 during the measured period and an average peak 3 hour of 118.
Allocation of and Reasons for En-route Delay
YearReference
Location
Avg Daily
ER Delays
% of Total ACC
ER Delay
2016 EHAACBAS 91 58.0%
2016 EHAASECT3 58 37.0%
2016 EHAASECT2 7 4.6%
2016 EHAASECT2E 1 0.4%
0
50
100
150
CAPACITY STAFFING DISRUPTION EVENTS WEATHER
Av
g d
ail
y d
ela
y (m
in)
Amsterdam ACC en-route delays in 2016
Amsterdam
EHAA ACC
Traffic Evolution (2016 v 2015) En-route Delay (min. per flight)
Capacity gap?
ACC Capacity Baseline
(% difference v 2015) Traffic Forecast
Actual Traffic
All reasons ACC Reference
Value Current Routes
Shortest Routes
Year H: 2.7%
B: 2.5%
L: 2.6%
No sig. impact
+5.5% 0.10 0.14
Summer +6.2% 0.14 0.14 No 146 (+2%)

NETWORK OPERATIONS REPORT – 2016
45
©2017 European Organisation for the Safety of Air Navigation (EUROCONTROL)
40. NORWAY - BODO ACC Traffic & Delay
2012 2013 2014 2015 2016
Peak Day Traffic 729 753 753 765 749
Summer Traffic 572 588 609 614 616
Yearly Traffic 555 565 589 590 597
Summer enroute delay (all causes) 0.04 0.05 0.04 0.00 0.00
Yearly enroute delay (all causes) 0.03 0.03 0.02 0.00 0.00
0.0
0.1
0.2
0.3
0.4
0.5
0.6
0.7
0.8
0.9
1.0
0
100
200
300
400
500
600
700
800
900
Enro
ute
De
lay
(min
ute
s p
er
flig
ht)
IFR
flig
hts
(D
aily
Ave
rage
)
ENBDACC - Traffic and en-route ATFM delays
2016 Realisation of Capacity Plan
Average En-route delay per flight slightly decreased to zero min/flight in Summer 2016.
Capacity Plan: Sufficient capacity to meet expected demand Achieved Comments
Free Route Airspace Yes
Flexible rostering of ATC staff Yes
Recruitment and training to maintain number of air traffic controllers Yes
Maximum configuration: 7 + 1 oceanic Yes 4 sectors were sufficient
Summer 2016 performance assessment
The ACC capacity baseline was assessed to be at the same level as in Summer 2015. During the measured period, the average peak hour demand was 49 and the average peak 3 hour demand was 45.
Allocation of and Reasons for En-route Delay
YearReference
Location
Avg Daily
ER Delays
% of Total ACC
ER Delay
2016 ENBD1819 1 58.9%
2016 ENOBOA80 0 41.1%
0
1
2
3
CAPACITY STAFFING DISRUPTION EVENTS WEATHER
Av
g d
ail
y d
ela
y (m
in)
Bodo ACC en-route delays in 2016
Bodo
ENBD ACC
Traffic Evolution (2016 v 2015) En-route Delay (min. per flight)
Capacity gap?
ACC Capacity Baseline
(% difference v 2015) Traffic Forecast
Actual Traffic
All reasons ACC Reference
Value Current Routes
Shortest Routes
Year H: 0.2%
B: -0.9%
L: -1.6%
No sig. impact
+1.2% 0.00 0.09
Summer +0.3% 0.00 0.05 No 57 (0%)

NETWORK OPERATIONS REPORT – 2016
46
©2017 European Organisation for the Safety of Air Navigation (EUROCONTROL)
41. NORWAY - OSLO ACC Traffic & Delay
2012 2013 2014 2015 2016
Peak Day Traffic 1135 1200 1224 1184 1249
Summer Traffic 947 1018 1025 982 1050
Yearly Traffic 898 949 961 931 985
Summer enroute delay (all causes) 0.83 0.00 0.01 0.10 0.20
Yearly enroute delay (all causes) 0.47 0.00 0.01 0.06 0.15
0.0
0.1
0.2
0.3
0.4
0.5
0.6
0.7
0.8
0.9
1.0
0
200
400
600
800
1000
1200
1400
Enro
ute
De
lay
(min
ute
s p
er
flig
ht)
IFR
flig
hts
(D
aily
Ave
rage
)
ENOSACC - Traffic and en-route ATFM delays
2016 Realisation of Capacity Plan
Average En-route delay per flight increased from 0.10 minutes per flight in Summer 2015 to 0.20 minutes per flight in Summer 2016.
63% of the delays were for reason ATC capacity, 22% for ATC staffing 13% for equipment and 3% for weather.
Planned Capacity Increase: sufficient to meet demand Achieved Comments
Free Route Airspace Yes
Recruitment and training of air traffic controllers Yes
Flexible rostering of ATC staff Yes
Maximum configuration: 6 sectors Yes 6 sectors were opened
Summer 2016 performance assessment
The capacity offered was measured with ACCESS at a level of 88, for an average peak demand of 81 (peak 1 hour) and 76 (peak 3 hour)
Allocation of and Reasons for En-route Delay
YearReference
Location
Avg Daily
ER Delays
% of Total ACC
ER Delay
2016 ENOS8 48 26.0%
2016 ENOSE345 35 18.9%
2016 ENOSW9012 26 14.0%
2016 ENOSE67 26 13.9%
2016 ENOSE1267 22 11.8%
2016 ENOSE3458 5 2.5%
0
50
100
150
CAPACITY STAFFING DISRUPTION EVENTS WEATHER
Av
g d
ail
y d
ela
y (m
in)
Oslo ACC en-route delays in 2016
Oslo
ENOS
ACC
Traffic Evolution (2016 v 2015) En-route Delay (min. per flight)
Capacity gap?
ACC Capacity Baseline
(% difference v 2015) Traffic Forecast
Actual Traffic
All reasons ACC Reference
Value Current Routes
Shortest Routes
Year H: 1.7%
B: 0.3%
L: -0.9%
No significant
impact
+5.8% 0.15 0.13
Summer +6.9% 0.20 0.13 No 88 (0%)

NETWORK OPERATIONS REPORT – 2016
47
©2017 European Organisation for the Safety of Air Navigation (EUROCONTROL)
42. NORWAY - STAVANGER ACC Traffic & Delay
2012 2013 2014 2015 2016
Peak Day Traffic 831 880 900 883 867
Summer Traffic 653 696 708 697 682
Yearly Traffic 625 663 677 661 641
Summer enroute delay (all causes) 0.02 0.12 0.08 0.06 0.09
Yearly enroute delay (all causes) 0.01 0.07 0.05 0.03 0.06
0.0
0.1
0.2
0.3
0.4
0.5
0.6
0.7
0.8
0.9
1.0
0
100
200
300
400
500
600
700
800
900
1000
Enro
ute
De
lay
(min
ute
s p
er
flig
ht)
IFR
flig
hts
(D
aily
Ave
rage
)
ENSVACC - Traffic and en-route ATFM delays
2016 Realisation of Capacity Plan
Average En-route delay per flight increased from 0.06 minutes per flight in Summer 2015 to 0.09 minutes per flight in Summer 2016.
Capacity Plan: sufficient capacity to meet demand Achieved Comments
Free Route Airspace Yes
Recruitment and training to maintain number of air traffic controllers Yes
Flexible rostering of ATC staff Yes
Maximum configuration: 4 + 2 helicopter Yes 5 sectors were opened
Summer 2016 performance assessment
The capacity baseline of 64 was measured with ACCESS, indicating the capacity actually offered. During the measured period, the average peak demand was 57 (peak 1 hour) and 52 (peak 3 hour).
Allocation of and Reasons for En-route Delay
Year
Reference
Location
Avg Daily
ER Delays
% of Total ACC ER
Delay
2016 ENOSW9012 26 68.5%
2016 ENOSW567 3 9.0%
2016 ENOSW347 2 4.6%
2016 ENOS17 1 3.9%
2016 ENOSWOEBS 1 3.6%
2016 ENOSW34567 1 3.4%
0
10
20
30
CAPACITY STAFFING DISRUPTION EVENTS WEATHER
Avg
daily d
ela
y
(min
)
Stavanger ACC en-route delays in 2016
Stavanger
ENSV ACC
Traffic Evolution (2016 v 2015) En-route Delay (min. per flight)
Capacity gap?
ACC Capacity Baseline
(% difference v 2015) Traffic Forecast
Actual Traffic
All reasons ACC Reference
Value Current Routes
Shortest Routes
Year H: 0.2%
B: -0.5%
L: -1.2%
No significant
impact
-3.0% 0.06 0.13
Summer -2.2% 0.09 0.13 No 64 (0%)

NETWORK OPERATIONS REPORT – 2016
48
©2017 European Organisation for the Safety of Air Navigation (EUROCONTROL)
43. POLAND - WARSAW ACC Traffic & Delay
2012 2013 2014 2015 2016
Peak Day Traffic 2395 2414 2456 2333 2589
Summer Traffic 2017 2063 2107 2073 2256
Yearly Traffic 1806 1829 1851 1841 1974
Summer enroute delay (all causes) 0.80 0.51 1.14 0.27 0.66
Yearly enroute delay (all causes) 0.53 0.52 0.81 0.19 0.40
0.0
0.1
0.2
0.3
0.4
0.5
0.6
0.7
0.8
0.9
1.0
1.1
1.2
0
500
1000
1500
2000
2500
3000
Enro
ute
De
lay
(min
ute
s p
er
flig
ht)
IFR
flig
hts
(D
aily
Ave
rage
)
EPWWACC - Traffic and en-route ATFM delays
2016 Realisation of Capacity Plan
The average en-route delay per flight increased from 0.27 minutes per flight in Summer 2015 to 0.66 minutes per flight in Summer 2016.
75% of delays were for the reason ATC Staffing, 16% for ATC Capacity, and 7% for Weather.
Capacity Plan +5% Achieved Comments
Stepped implementation of FRA Yes
Implementation of A-CDM at Warsaw Chopin airport No Completion expected in autumn 2017
Advanced ATFCM techniques, including STAM Yes
Stepped implementation of vertical sectorisation Yes
7 additional controllers Yes Eight new, three expected by December
23 students on OJT
Re-evaluation of sector capacities in new vertical split airspace No CAPAN in progress in 2016
Improved flexibility in vertical sectorisation, new configurations responding to flow demand
Yes
Improved sector configurations and management of configurations Yes
Maximum configuration: 9/10 sectors Yes 10 sectors opened
Summer 2016 performance assessment
The ACC capacity baseline was measured with ACCESS/Reverse CASA at 144, 1% higher than in 2015. During the measured period, the average peak 1 hour demand was 161 and the average peak 3 hour demand was 152.
Allocation of and Reasons for En-route Delay
YearReference
Location
Avg Daily
ER Delays
% of Total ACC
ER Delay
2016 EPWWBD 198 24.8%
2016 EPWWTC 98 12.3%
2016 EPWWBDL 67 8.4%
2016 EPWWTCL 66 8.2%
2016 EPWWERL 44 5.5%
2016 EPWWD 34 4.3%
0
200
400
600
CAPACITY STAFFING DISRUPTION EVENTS WEATHER
Av
g d
ail
y d
ela
y (
min
)
Warsaw ACC en-route delays in 2016
Warsaw
EPWW ACC
Traffic Evolution (2016 v 2015) En-route Delay (min. per flight)
Capacity gap?
ACC Capacity Baseline
(% difference v 2015) Traffic Forecast
Actual Traffic
All reasons ACC Reference
Value Current Routes
Shortest Routes
Year H: 2.9%
B: 1.3%
L: 0.2%
-6%
+7.2% 0.40 0.23
Summer +8.8% 0.66 0.34 Yes 144 (+1%)

NETWORK OPERATIONS REPORT – 2016
49
©2017 European Organisation for the Safety of Air Navigation (EUROCONTROL)
44. PORTUGAL - LISBON ACC Traffic & Delay
2012 2013 2014 2015 2016
Peak Day Traffic 1516 1448 1669 1672 1783
Summer Traffic 1178 1213 1312 1370 1528
Yearly Traffic 1121 1150 1229 1292 1429
Summer enroute delay (all causes) 0.76 0.23 0.29 0.74 0.23
Yearly enroute delay (all causes) 0.69 0.29 0.53 0.51 0.23
0.0
0.1
0.2
0.3
0.4
0.5
0.6
0.7
0.8
0.9
1.0
0
200
400
600
800
1000
1200
1400
1600
1800
2000
Enro
ute
De
lay
(min
ute
s p
er
flig
ht)
IFR
flig
hts
(D
aily
Ave
rage
)
LPPCACC - Traffic and en-route ATFM delays
2016 Realisation of Capacity Plan
The average en-route delay per flight decreased from 0.74 minutes per flight in Summer 2015 to 0.23 minutes per flight in Summer 2016.
63% of the delays were for the reason ATC Staffing, 24% for ATC Capacity, and 6% for Weather.
Capacity Plan +7% Achieved Comments
Enhanced ASM/AFUA System Support No
PBN LPFR Ongoing Technical part ready – RNAV1 procedures
achieved
Enhanced ATFCM procedures, including STAM Partially Full implementation still required
Vertical split of South sector No Postponed to 2018
Flexibility of DFL West sector No Postponed to 2020
Flexible rostering Partially
Maintain appropriate level of staffing to open up to 10 sectors Yes
APW Ongoing To be implemented March 2017
Increase capacity in MAD sector No Postponed to 2017
Dynamic split of West and South sectors No Postponed to 2020
Flexible sector opening schemes Yes
Maximum configuration: 10 (8 ENR+2 TMA) Yes 10 sectors were opened
Summer 2016 performance assessment
The ACC capacity baseline was measured with ACCESS / Reverse CASA at 105. During the measured period (June and July AIRAC cycles), the average peak 1 hour demand was 111 and the average peak 3 hour demand was 99.
Allocation of and Reasons for En-route Delay
YearReference
Location
Avg Daily
ER Delays
% of Total ACC
ER Delay
2016 LPPCNORTH 88 26.9%
2016 LPPCNXUPP 57 17.5%
2016 LPPCSOUTH 53 16.2%
2016 LPPCWEST 43 13.3%
2016 LPPCCEU 43 13.1%
2016 LPPCNOL 14 4.5%
0
200
400
600
CAPACITY STAFFING DISRUPTION EVENTS WEATHER
Av
g d
ail
y d
ela
y (m
in)
Lisbon ACC en-route delays in 2016
Lisbon
LPPC ACC
Traffic Evolution (2016 v 2015) En-route Delay (min. per flight)
Capacity gap?
ACC Capacity Baseline
(% difference v 2015) Traffic Forecast
Actual Traffic
All reasons ACC Reference
Value Current Routes
Shortest Routes
Year H: 7.8%
B: 5.8%
L: 3.9%
No sig. impact
+0.1% 0.23 0.10
Summer +0.1% 0.23 0.11 Yes 105 (+14%)

NETWORK OPERATIONS REPORT – 2016
50
©2017 European Organisation for the Safety of Air Navigation (EUROCONTROL)
45. ROMANIA - BUCHAREST ACC
Traffic & Delay
2012 2013 2014 2015 2016
Peak Day Traffic 1982 2057 2362 2403 2307
Summer Traffic 1566 1676 1975 2021 1915
Yearly Traffic 1308 1383 1617 1717 1671
Summer enroute delay (all causes) 0.00 0.00 0.00 0.05 0.00
Yearly enroute delay (all causes) 0.00 0.00 0.00 0.03 0.00
0.0
0.1
0.2
0.3
0.4
0.5
0.6
0.7
0.8
0.9
1.0
0
500
1000
1500
2000
2500
3000
Enro
ute
De
lay
(min
ute
s p
er
flig
ht)
IFR
flig
hts
(D
aily
Ave
rage
)
LRBBACC - Traffic and en-route ATFM delays
2016 Realisation of Capacity Plan
Average En-route ATFM delay per flight decreased from 0.05 minutes perf light in Summer 2015 to zero minutes per flight.
Note: There was no need for extended capacity due to traffic decrease during summer season 2016, mainly caused by the UDROS/ODERO area reorganisation
Capacity Plan : +4% Achieved Comments
Stepped Implementation of FRA in accordance with Danube FAB plans Yes
All military aviation areas are TRAs which will improve pre-tactical and tactical coordination
Yes
Revision and re-design process for military reserved areas No In progress
New TMA NAPOC implementation Yes
SIDs and STARs optimisation within Bucharest TMA – shorter routes to.from M987 (RNDSG 80.036/19.007)
No Project postponed.
Improved ATFCM, including use of occupancy counts Yes
ATS route network and sectorisation improvements Yes
Sectorisation improvements Yes Corresponding to TMA NAPOC implementation
LoAs and ATS Instructions for Bucharest ACC Sectors review on regular basis
Yes
Staff increased in line with capacity requirements Yes New ATCOs training in progress
Automated Support for Traffic Load (Density) Management (FCM06) No
Automated Support for Traffic Complexity Assessment (FCM06) No
4 layers vertically split for the most loaded sectors/family sectors Yes
Maximum configuration: 16 sectors Yes 11 sectors were sufficient for traffic demand during summer 2016
Summer 2016 performance assessment
The ACC capacity baseline was assessed to be at 183 the same level as in Summer 2015. During the measured period, the peak 1 hour demand was 133 flights and the peak 3 hour demand was 124.
Bucharest
LRBB ACC
Traffic Evolution (2016 v 2015) En-route Delay (min. per flight)
Capacity gap?
ACC Capacity Baseline
(% difference v 2015) Traffic Forecast
Actual Traffic
All reasons ACC Reference
Value Current Routes
Shortest Routes
Year H: 3.6%
B: 1.9%
L: 0.7%
+7%
-2.7% 0.00 0.01
Summer -5.2% 0.00 0.01 No 183 (0%)

NETWORK OPERATIONS REPORT – 2016
51
©2017 European Organisation for the Safety of Air Navigation (EUROCONTROL)
46. SERBIA & MONTENEGRO - BELGRADE ACC Traffic & Delay
2012 2013 2014 2015 2016
Peak Day Traffic 2435 2441 2610 2943 2744
Summer Traffic 1803 1792 1930 2080 2125
Yearly Traffic 1435 1393 1491 1621 1650
Summer enroute delay (all causes) 0.00 0.02 0.00 0.04 0.01
Yearly enroute delay (all causes) 0.00 0.02 0.00 0.03 0.01
0.0
0.1
0.2
0.3
0.4
0.5
0.6
0.7
0.8
0.9
1.0
0
500
1000
1500
2000
2500
3000
3500
Enro
ute
De
lay
(min
ute
s p
er
flig
ht)
IFR
flig
hts
(D
aily
Ave
rage
)
LYBAACC - Traffic and en-route ATFM delays
2016 Realisation of Capacity Plan
En-route delay decreased to 0.01 minutes per flight in Summer 2016.
Capacity Plan +2% Achieved Comments
CIMACT No Postponed for 2017
ATCC sectorisation change Yes
DPS Software improvement Yes
Maximum configuration: 14 sectors Yes
Summer 2016 performance assessment
The ACC capacity baseline was measured with ACCESS at 181. The peak 1 hour demand was 157 and the peak 3 hour demand was 147 during the measurement period.
Allocation of and Reasons for En-route Delay
YearReference
Location
Avg Daily
ER Delays
% of Total ACC
ER Delay
2016 LYBAMIL01 15 100.0%
0
10
20
30
CAPACITY STAFFING DISRUPTION EVENTS WEATHER
Av
g d
ail
y d
ela
y (m
in)
Belgrade ACC en-route delays in 2016
Belgrade
LYBA ACC
Traffic Evolution (2016 v 2015) En-route Delay (min. per flight)
Capacity gap?
ACC Capacity Baseline
(% difference v 2015) Traffic Forecast
Actual Traffic
All reasons ACC Reference
Value Current Routes
Shortest Routes
Year H: 3.8%
B: 1.8%
L: -0.6%
-7%
+1.8% 0.01 0.10
Summer +2.2% 0.01 0.14 No 181 (0%)

NETWORK OPERATIONS REPORT – 2016
52
©2017 European Organisation for the Safety of Air Navigation (EUROCONTROL)
47. SLOVAK REPUBLIC - BRATISLAVA ACC Traffic & Delay
2012 2013 2014 2015 2016
Peak Day Traffic 1553 1563 1924 1832 2002
Summer Traffic 1217 1276 1419 1500 1596
Yearly Traffic 1004 1055 1161 1243 1323
Summer enroute delay (all causes) 0.00 0.00 0.23 0.12 0.05
Yearly enroute delay (all causes) 0.00 0.00 0.14 0.08 0.03
0.0
0.1
0.2
0.3
0.4
0.5
0.6
0.7
0.8
0.9
1.0
0
500
1000
1500
2000
2500
Enro
ute
De
lay
(min
ute
s p
er
flig
ht)
IFR
flig
hts
(D
aily
Ave
rage
)
LZBBACC - Traffic and en-route ATFM delays
2016 Realisation of Capacity Plan
The average en-route delay per flight decreased from 0.12 to 0.05 minutes per flight in Summer 2016.
57% of the delays were for the reason ATC Capacity, and 42% for weather.
Capacity Plan +5% Achieved Comments
Free Route DCTs within LZBB Yes
Implement Rolling ASM/ATFCM process No Full implementation expected in 1Q 2017
Improved ATFCM techniques, including STAM Yes
Continuous improvements of the route network and sectorisation Yes
Enhanced sectorisation according to FABCE airspace plan Yes
Continuous recruitment to increase staff level Yes
Optimisation of sector opening times Yes
East/West sector configuration No Already limited manpower involved in other projects. Postponed until 2018.
Maximum configuration: 5 sectors Yes 5 sectors opened
Summer 2016 performance assessment
The ACC capacity baseline was measured with ACCESS at 133, 2% higher than in 2015. During the measured period, the average peak 1 hour demand was 123 and the average peak 3 hour demand was 111.
Allocation of and Reasons for En-route Delay
YearReference
Location
Avg Daily
ER Delays
% of Total ACC
ER Delay
2016 LZBBU3 23 55.6%
2016 LZBBU36 6 15.4%
2016 LZBBU38 6 14.8%
2016 LZBBL35 6 13.9%
2016 LZBBL28 0 0.3% 0
20
40
60
80
CAPACITY STAFFING DISRUPTION EVENTS WEATHER
Avg
dail
y d
ela
y
(min
)
Bratislava ACC en-route delays in 2016
Bratislava
LZBB ACC
Traffic Evolution (2016 v 2015) En-route Delay (min. per flight)
Capacity gap?
ACC Capacity Baseline
(% difference v 2015) Traffic Forecast
Actual Traffic
All reasons ACC Reference
Value Current Routes
Shortest Routes
Year H: 4.3%
B: 2.2%
L: 1.5%
-22%
+6.4% 0.03 0.10
Summer +6.4% 0.05 0.15 No 133 (+2%)

NETWORK OPERATIONS REPORT – 2016
53
©2017 European Organisation for the Safety of Air Navigation (EUROCONTROL)
48. SLOVENIA - LJUBLJANA ACC
Traffic & Delay
2012 2013 2014 2015 2016
Peak Day Traffic 1262 1254 1351 1305 1242
Summer Traffic 909 890 962 914 952
Yearly Traffic 735 703 743 725 745
Summer enroute delay (all causes) 0.00 0.00 0.00 0.00 0.02
Yearly enroute delay (all causes) 0.00 0.00 0.00 0.00 0.01
0.0
0.1
0.2
0.3
0.4
0.5
0.6
0.7
0.8
0.9
1.0
0
200
400
600
800
1000
1200
1400
1600
Enro
ute
De
lay
(min
ute
s p
er
flig
ht)
IFR
flig
hts
(D
aily
Ave
rage
)
LJLAACC - Traffic and en-route ATFM delays
2016 Realisation of Capacity Plan
The average en-route delay per flight slighty increased from zero minutes per flight in Summer 2015 to 0.02 minutes per flight during Summer 2016.
Capacity Plan +3% to 15% Achieved Comments
Stepped implementation of FRA according to the FAB CE Airspace Plan. SAXFRA project will be reflected in FAB CE Airspace Plan
Yes SAXFRA project implemented 10.11.2016
Enhanced ATFCM techniques, including STAM No STAM implementation planned
ATS route network and traffic organisation changes Yes After 10.11.2016 ATS route network deleted with
SAXFRA
Enhanced sectorization according to the FAB CE Airspace Plan Yes According to FAB CE airspace plan
Mode S Yes
Additional ATCOs will be recruited as necessary Yes
Minor system upgrades as necessary Yes
Flexible sector configurations Yes
Maximum configuration: 5 sectors Yes 4 sectors actually used
Summer 2016 performance assessment
The capacity baseline was estimated at the same level as last year. The peak 1 hour demand was 74 and the peak 3 hour demand was 67 during the measurement period.
Allocation of and Reasons for En-route Delay Year
Reference
Location
Avg Daily
ER Delays
% of Total ACC
ER Delay
2016 LJLA2535 3 31.1%
2016 LJLA3566 2 20.7%
2016 LJLA2536 2 20.3%
2016 LJLA3766 1 12.0%
2016 LJLAONE 1 6.1%
2016 LJLA0034 1 5.9%
0
2
4
6
CAPACITY STAFFING DISRUPTION EVENTS WEATHER
Av
g d
ail
y d
ela
y (m
in)
Ljubljana ACC en-route delays in 2016
Ljubljana
LJLA ACC
Traffic Evolution (2016 v 2015) En-route Delay (min. per flight)
Capacity gap?
ACC Capacity Baseline
(% difference v 2015) Traffic Forecast
Actual Traffic
All reasons ACC Reference
Value Current Routes
Shortest Routes
Year H: 1.7%
B: -0.3%
L: -2.9%
+30%
+2.8% 0.01 0.21
Summer +4.2% 0.02 0.31 No 87 (0%)

NETWORK OPERATIONS REPORT – 2016
54
©2017 European Organisation for the Safety of Air Navigation (EUROCONTROL)
49. SPAIN - BARCELONA ACC Traffic & Delay
2012 2013 2014 2015 2016
Peak Day Traffic 3138 3187 3333 3294 3553
Summer Traffic 2523 2533 2599 2628 2857
Yearly Traffic 2013 2007 2042 2085 2261
Summer enroute delay (all causes) 0.83 0.67 0.55 0.70 0.69
Yearly enroute delay (all causes) 0.63 0.47 0.37 0.46 0.49
0.0
0.1
0.2
0.3
0.4
0.5
0.6
0.7
0.8
0.9
1.0
0
500
1000
1500
2000
2500
3000
3500
4000
Enro
ute
De
lay
(min
ute
s p
er
flig
ht)
IFR
flig
hts
(D
aily
Ave
rage
)
LECBACC - Traffic and en-route ATFM delays
2016 Realisation of Capacity Plan
Average en-route delay per flight slightly decreased from 0.70 minutes per flight in Summer 2015 to 0.69 minutes per flight in Summer 2016.
84% of the delays were for the reason ATC Capacity and 11% for Weather.
Capacity Plan: +8% Achieved Comments
Use of FUA restrictions Yes Not FUA but EU restrictions
Improved ATFCM, including STAM Yes
Use of OCC in PONENT sectors No Trials with NM ongoing
LECM-LECB interface (sectorisation, procedures) No
Improve arrivals to LEBL Yes
Staff increase Yes
Full implementation of SACTA CF2 version (Nov 2015) Yes
Safety Nets (STCA) Yes
Review (increase in sector capacities) Yes
Maximum configuration: 12 sectors Yes 12 sectors
Summer 2016 performance assessment
The ACC capacity baseline was measured with ACCESS/Reverse CASA at 156. During the measured period, the peak 1 hour demand was 160 and the peak 3 hour demand was 151.
Allocation of and Reasons for En-route Delay
YearReference
Location
Avg Daily
ER Delays
% of Total ACC
ER Delay
2016 LECBP1U 226 20.4%
2016 LECBBAS 152 13.7%
2016 LECBMNI 73 6.6%
2016 LEBLT1E 55 4.9%
2016 LEBLDDI 53 4.7%
2016 LECBP1I 49 4.5%
0
500
1000
CAPACITY STAFFING DISRUPTION EVENTS WEATHER
Av
g d
ail
y d
ela
y (m
in)
Barcelona ACC en-route delays in 2016
Barcelona
LECB ACC
Traffic Evolution (2016 v 2015) En-route Delay (min. per flight)
Capacity gap?
ACC Capacity Baseline
(% difference v 2015) Traffic Forecast
Actual Traffic
All reasons ACC Reference
Value Current Routes
Shortest Routes
Year H: 9.9%
B: 7.7%
L: 5.8%
No significant
impact
+8.4% 0.49 0.23
Summer +8.7% 0.69 0.32 Yes 156 (+8%)
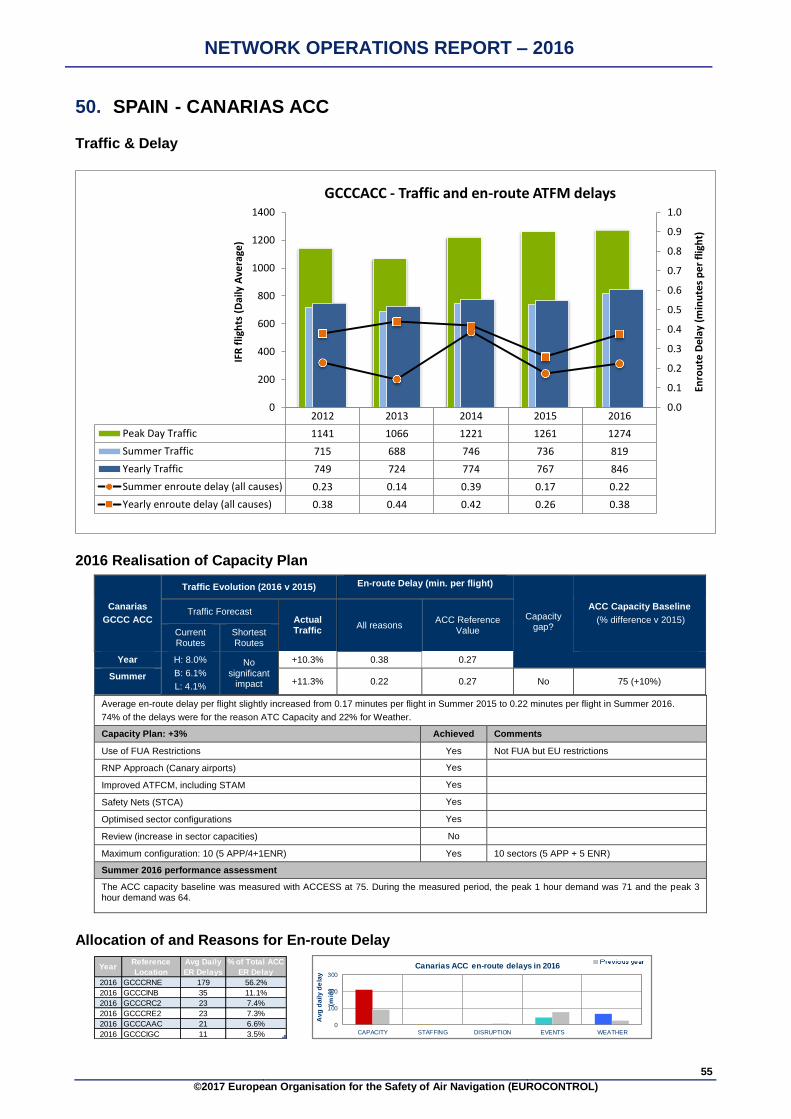
NETWORK OPERATIONS REPORT – 2016
55
©2017 European Organisation for the Safety of Air Navigation (EUROCONTROL)
50. SPAIN - CANARIAS ACC
Traffic & Delay
2012 2013 2014 2015 2016
Peak Day Traffic 1141 1066 1221 1261 1274
Summer Traffic 715 688 746 736 819
Yearly Traffic 749 724 774 767 846
Summer enroute delay (all causes) 0.23 0.14 0.39 0.17 0.22
Yearly enroute delay (all causes) 0.38 0.44 0.42 0.26 0.38
0.0
0.1
0.2
0.3
0.4
0.5
0.6
0.7
0.8
0.9
1.0
0
200
400
600
800
1000
1200
1400
Enro
ute
De
lay
(min
ute
s p
er
flig
ht)
IFR
flig
hts
(D
aily
Ave
rage
)
GCCCACC - Traffic and en-route ATFM delays
2016 Realisation of Capacity Plan
Average en-route delay per flight slightly increased from 0.17 minutes per flight in Summer 2015 to 0.22 minutes per flight in Summer 2016.
74% of the delays were for the reason ATC Capacity and 22% for Weather.
Capacity Plan: +3% Achieved Comments
Use of FUA Restrictions Yes Not FUA but EU restrictions
RNP Approach (Canary airports) Yes
Improved ATFCM, including STAM Yes
Safety Nets (STCA) Yes
Optimised sector configurations Yes
Review (increase in sector capacities) No
Maximum configuration: 10 (5 APP/4+1ENR) Yes 10 sectors (5 APP + 5 ENR)
Summer 2016 performance assessment
The ACC capacity baseline was measured with ACCESS at 75. During the measured period, the peak 1 hour demand was 71 and the peak 3 hour demand was 64.
Allocation of and Reasons for En-route Delay
YearReference
Location
Avg Daily
ER Delays
% of Total ACC
ER Delay
2016 GCCCRNE 179 56.2%
2016 GCCCINB 35 11.1%
2016 GCCCRC2 23 7.4%
2016 GCCCRE2 23 7.3%
2016 GCCCAAC 21 6.6%
2016 GCCCIGC 11 3.5%
0
100
200
300
CAPACITY STAFFING DISRUPTION EVENTS WEATHER
Avg
daily d
ela
y
(min
)
Canarias ACC en-route delays in 2016
Canarias
GCCC ACC
Traffic Evolution (2016 v 2015) En-route Delay (min. per flight)
Capacity gap?
ACC Capacity Baseline
(% difference v 2015) Traffic Forecast
Actual Traffic
All reasons ACC Reference
Value Current Routes
Shortest Routes
Year H: 8.0%
B: 6.1%
L: 4.1%
No significant
impact
+10.3% 0.38 0.27
Summer +11.3% 0.22 0.27 No 75 (+10%)

NETWORK OPERATIONS REPORT – 2016
56
©2017 European Organisation for the Safety of Air Navigation (EUROCONTROL)
51. SPAIN - MADRID ACC
Traffic & Delay
2012 2013 2014 2015 2016
Peak Day Traffic 2877 2794 2951 3062 3250
Summer Traffic 2677 2578 2720 2840 3019
Yearly Traffic 2500 2395 2514 2616 2777
Summer enroute delay (all causes) 0.19 0.25 0.09 0.11 0.14
Yearly enroute delay (all causes) 0.18 0.18 0.07 0.10 0.15
0.0
0.1
0.2
0.3
0.4
0.5
0.6
0.7
0.8
0.9
1.0
0
500
1000
1500
2000
2500
3000
3500
Enro
ute
De
lay
(min
ute
s p
er
flig
ht)
IFR
flig
hts
(D
aily
Ave
rage
)
LECMALL - Traffic and en-route ATFM delays
2016 Realisation of Capacity Plan
Average en-route delay per flight slightly increased from 0.11 minutes per flight in Summer 2015 to 0.14 minutes per flight in Summer 2016.
58% of the delays were for the reason ATC Capacity and 39% for the reason Other.
Capacity Plan: +2% Achieved Comments
Use of FUA Restrictions Yes Not FUA but EU restrictions
Improved ATFCM including STAM Yes
LECM-LECB interface No
Safety nets (STCA) Yes
Optimised sector configurations Yes
New sector configuration Santiago-Asturias Yes
Maximum configuration: 17/18 sectors Yes 17 sectors
Summer 2016 performance assessment
The ACC capacity baseline was measured with ACCESS at 213. During the measured period, the peak 1 hour demand was 206 and the peak 3 hour demand was 192.
Allocation of and Reasons for En-route Delay
YearReference
Location
Avg Daily
ER Delays
% of Total ACC
ER Delay
2016 LECMSAN 122 30.0%
2016 LEMDALL 60 14.7%
2016 BEGAS 59 14.5%
2016 LECMPAU 29 7.1%
2016 LECMDGU 24 5.8%
2016 LECMZGZ 17 4.2%
0
100
200
300
CAPACITY STAFFING DISRUPTION EVENTS WEATHER
Av
g d
ail
y d
ela
y (m
in)
Madrid ACC en-route delays in 2016
Madrid
LECM ACC
Traffic Evolution (2016 v 2015) En-route Delay (min. per flight)
Capacity gap?
ACC Capacity Baseline
(% difference v 2015) Traffic Forecast
Actual Traffic
All reasons ACC Reference
Value Current Routes
Shortest Routes
Year H: 7.2%
B: 5.3%
L: 3.6%
No significant
impact
+6.2% 0.15 0.16
Summer +6.3% 0.14 0.20 No 213 (+5%)

NETWORK OPERATIONS REPORT – 2016
57
©2017 European Organisation for the Safety of Air Navigation (EUROCONTROL)
52. SPAIN - PALMA ACC
Traffic & Delay
2012 2013 2014 2015 2016
Peak Day Traffic 1527 1573 1651 1697 1802
Summer Traffic 1011 1009 1058 1084 1214
Yearly Traffic 682 674 695 721 804
Summer enroute delay (all causes) 0.25 0.17 0.15 0.23 0.32
Yearly enroute delay (all causes) 0.19 0.13 0.11 0.17 0.24
0.0
0.1
0.2
0.3
0.4
0.5
0.6
0.7
0.8
0.9
1.0
0
200
400
600
800
1000
1200
1400
1600
1800
2000
Enro
ute
De
lay
(min
ute
s p
er
flig
ht)
IFR
flig
hts
(D
aily
Ave
rage
)
LECPACC - Traffic and en-route ATFM delays
2016 Realisation of Capacity Plan
Average En-route delay per flight increased from 0.23 minutes in Summer 2015 to 0.32 minutes per flight in Summer 2016.
99% of the delays were for the reason ATC Capacity.
Capacity Plan: +4% Achieved Comments
Improved ATFCM, including STAM Yes
Enhance Feeder 1 capacity Yes
Full implementation of SACTA CF2 version (Nov 2015) Yes
Safety nets (STCA) Yes
Optimised sector configurations Yes
LEPA arrival capacity increase Yes
Maximum configuration: 8 (4 APP + 4 ENR) Yes 8 sectors
Summer 2016 performance assessment
The ACC capacity baseline was measured with ACCESS at 101. During the measured period, the peak 1 hour demand was 103, the peak 3 hour demand was 93.
Allocation of and Reasons for En-route Delay
YearReference
Location
Avg Daily
ER Delays
% of Total ACC
ER Delay
2016 LECPMXX 171 88.6%
2016 LECPGMX 13 6.6%
2016 LECPGIX 6 3.2%
2016 LECPIXX 3 1.5%
0
100
200
300
CAPACITY STAFFING DISRUPTION EVENTS WEATHER
Av
g d
ail
y d
ela
y (m
in)
Palma ACC en-route delays in 2016
Palma
LECP ACC
Traffic Evolution (2016 v 2015) En-route Delay (min. per flight)
Capacity gap?
ACC Capacity Baseline
(% difference v 2015) Traffic Forecast
Actual Traffic
All reasons ACC Reference
Value Current Routes
Shortest Routes
Year H: 10.5%
B: 8.4%
L: 6.1%
No significant
impact
+11.5% 0.24 0.17
Summer +12.0% 0.32 0.21 No 101 (+7%)

NETWORK OPERATIONS REPORT – 2016
58
©2017 European Organisation for the Safety of Air Navigation (EUROCONTROL)
53. SPAIN - SEVILLA ACC
Traffic & Delay
2012 2013 2014 2015 2016
Peak Day Traffic 1195 1190 1164 1237 1312
Summer Traffic 984 986 998 1015 1091
Yearly Traffic 894 879 901 909 972
Summer enroute delay (all causes) 0.06 0.08 0.02 0.05 0.13
Yearly enroute delay (all causes) 0.06 0.05 0.03 0.04 0.09
0.0
0.1
0.2
0.3
0.4
0.5
0.6
0.7
0.8
0.9
1.0
0
200
400
600
800
1000
1200
1400
Enro
ute
De
lay
(min
ute
s p
er
flig
ht)
IFR
flig
hts
(D
aily
Ave
rage
)
LECSACC - Traffic and en-route ATFM delays
2016 Realisation of Capacity Plan
Average En-route delay increased from 0.05 min/flight in Summer 2015 to 0.13 min/flight in Summer 2016.
90% of the delays were for the reason ATC Capacity.
Capacity Plan: +1% Achieved Comments
Use of FUA Restrictions Yes Not FUA but EU Restrictions
Improved ATFCM including STAM Yes
Northern Sector Splitting Yes
Safety Nets (STCA) Yes
Optimised sector configurations Yes
Maximum configuration: 7/8 (5/6 ACC+2 APP) Yes 8 sectors
Summer 2016 performance assessment
The ACC capacity baseline was measured with ACCESS at 91. During the measured period, the peak 1 hour demand was 82 and the peak 3 hour demand was 74.
Allocation of and Reasons for En-route Delay
YearReference
Location
Avg Daily
ER Delays
% of Total ACC
ER Delay
2016 LECSCEN 32 34.7%
2016 LECSMA4 23 25.1%
2016 LECSNO1 16 17.2%
2016 LECSSEV 8 8.5%
2016 LECSNCS 5 5.1%
2016 LECSCES 4 4.1%
0
50
100
CAPACITY STAFFING DISRUPTION EVENTS WEATHER
Av
g d
ail
y d
ela
y (m
in)
Seville ACC en-route delays in 2016
Sevilla
LECS
ACC
Traffic Evolution (2016 v 2015) En-route Delay (min. per flight)
Capacity gap?
ACC Capacity Baseline
(% difference v 2015) Traffic Forecast
Actual Traffic
All reasons ACC Reference
Value Current Routes
Shortest Routes
Year H: 7.8%
B: 5.6%
L: 3.6%
No sig. impact
+6.9% 0.09 0.12
Summer +7.5% 0.13 0.16 No 91 (+2%)

NETWORK OPERATIONS REPORT – 2016
59
©2017 European Organisation for the Safety of Air Navigation (EUROCONTROL)
54. SWEDEN - MALMO ACC Traffic & Delay
2012 2013 2014 2015 2016
Peak Day Traffic 1698 1713 1729 1742 1758
Summer Traffic 1451 1488 1505 1517 1539
Yearly Traffic 1359 1377 1386 1401 1425
Summer enroute delay (all causes) 0.00 0.00 0.01 0.00 0.07
Yearly enroute delay (all causes) 0.04 0.00 0.01 0.00 0.04
0.0
0.1
0.2
0.3
0.4
0.5
0.6
0.7
0.8
0.9
1.0
0
200
400
600
800
1000
1200
1400
1600
1800
2000
Enro
ute
De
lay
(min
ute
s p
er
flig
ht)
IFR
flig
hts
(D
aily
Ave
rage
)
ESMMACC - Traffic and en-route ATFM delays
2016 Realisation of Capacity Plan
The average en-route delay per flight increased from zero in Summer 2015 to 0.07 minutes per flight in Summer 2016.
96% of the delays were for the reason Equipment (ATC).
Capacity Plan +5 % Achieved Comments
Possible alignment with FRA within NEFAB Yes
Final completion May 2017 together with full NEFRA implementation
Optimizing the use of FRA when military areas are active Yes
Improved ATFCM, working with occupancy counts Yes
Continuous improvements on the ATS route network Yes
Vertical split of sector 2 (at 355) Yes
OLDI extension to field 15 FPL Yes
Finalised with Copenhagen and Oslo, ongoing for other neighbouring ACCs
Maintain appropriate level of staffing to open up to 11 sectors Yes
Training for 3 to 2 sector groups controller ratings Yes
Sector configurations adapted to traffic demand Yes
Minor updates of COOPANS Yes
Maximum configuration: 12 (2 sector groups) Yes 4E + 4W +2L, sufficient to meet traffic demand.
Summer 2016 performance assessment
The ACC capacity baseline was estimated to be at the same level as in Summer 2015. During the measured period, the average peak 1 hour demand was 121 and the average peak 3 hour demand was 110.
Allocation of and Reasons for En-route Delay
YearReference
Location
Avg Daily
ER Delays
% of Total ACC
ER Delay
2016 ESMMACCWT 21 37.8%
2016 ESMMACCET 8 14.3%
2016 ESMMKL 6 10.0%
2016 ESMM23W 4 7.2%
2016 ESMMW 3 5.8%
2016 ESMML 3 5.1%
0
20
40
60
CAPACITY STAFFING DISRUPTION EVENTS WEATHER
Av
g d
ail
y d
ela
y (m
in)
Malmo ACC en-route delays in 2016
Malmo
ESMM ACC
Traffic Evolution
(2016 v 2015)
En-route Delay (min. per flight)
Capacity gap?
ACC Capacity Baseline
(% difference v 2015) Traffic Forecast
Actual Traffic
All reasons ACC Reference
Value Current Routes
Shortest Routes
Year H: 3.4%
B: 2.0%
L: 0.7%
No sig. impact
+1.7% 0.04 0.07
Summer +1.5% 0.07 0.10 No 124 (0%)

NETWORK OPERATIONS REPORT – 2016
60
©2017 European Organisation for the Safety of Air Navigation (EUROCONTROL)
55. SWEDEN - STOCKHOLM ACC Traffic & Delay
2012 2013 2014 2015 2016
Peak Day Traffic 1428 1451 1426 1422 1436
Summer Traffic 1090 1113 1119 1124 1140
Yearly Traffic 1062 1069 1078 1077 1104
Summer enroute delay (all causes) 0.04 0.04 0.09 0.02 0.12
Yearly enroute delay (all causes) 0.02 0.05 0.05 0.03 0.07
0.0
0.1
0.2
0.3
0.4
0.5
0.6
0.7
0.8
0.9
1.0
0
200
400
600
800
1000
1200
1400
1600
Enro
ute
De
lay
(min
ute
s p
er
flig
ht)
IFR
flig
hts
(D
aily
Ave
rage
)
ESOSACC - Traffic and en-route ATFM delays
2016 Realisation of Capacity Plan
The average en-route delay per flight increased from 0.02 minutes per flight in Summer 2015 to 0.12 minutes per flight in Summer 2016.
82% of the delays were for the reason Equipment (ATC) and 16% for Weather.
Capacity Plan +2 % Achieved Comments
Possible alignment with FRA within NEFAB Yes Final completion May 2017 together with full NEFRA implementation
Optimizing the use of FRA when military areas are active Yes
Airport CDM at ESSA (Jan 2016) No Expected by 2017
Improved ATFCM, working with occupancy counts Yes
Continuous improvements on the ATS route network Yes
Maintain appropriate level of staffing to open up to 11 sectors Yes
Training for 3 to 2 sector groups controller ratings Yes Completed
Sector configurations adapted to traffic demand Yes
Minor updates of COOPANS Yes
Maximum configuration: 6 (N) + 5 (S) Yes 10 sectors (2 (M) + 2(N) + 4 (S)), sufficient to meet traffic demand
Summer 2016 performance assessment
The ACC capacity baseline was estimated to be at the same level as in Summer 2015. During the measured period, the average peak 1 hour demand was 88 and the average peak 3 hour demand was 79.
Allocation of and Reasons for En-route Delay
YearReference
Location
Avg Daily
ER Delays
% of Total ACC
ER Delay
2016 ESSATMA 16 20.0%
2016 ESOS2 15 19.0%
2016 ESOS3 15 18.4%
2016 ESOS6 11 14.3%
2016 ESOS7 8 9.4%
2016 ESOS4 4 5.2%
0
20
40
60
80
CAPACITY STAFFING DISRUPTION EVENTS WEATHER
Av
g d
ail
y d
ela
y (m
in)
Stockholm ACC en-route delays in 2016
Stockholm
ESOS ACC
Traffic Evolution (2016 v 2015) En-route Delay (min. per flight)
Capacity gap?
ACC Capacity Baseline
(% difference v 2015) Traffic Forecast
Actual Traffic
All reasons ACC Reference
Value Current Routes
Shortest Routes
Year H: 3.3%
B: 2.0%
L: 0.9%
No significant
impact
+2.5% 0.07 0.02
Summer +1.4% 0.12 0.03 No 112 (0%)

NETWORK OPERATIONS REPORT – 2016
61
©2017 European Organisation for the Safety of Air Navigation (EUROCONTROL)
56. SWITZERLAND - GENEVA ACC Traffic & Delay
2012 2013 2014 2015 2016
Peak Day Traffic 2072 2050 2145 2154 2173
Summer Traffic 1848 1837 1876 1890 1937
Yearly Traffic 1654 1627 1654 1676 1710
Summer enroute delay (all causes) 0.04 0.14 0.15 0.09 0.12
Yearly enroute delay (all causes) 0.06 0.10 0.10 0.06 0.09
0.0
0.1
0.2
0.3
0.4
0.5
0.6
0.7
0.8
0.9
1.0
0
500
1000
1500
2000
2500
Enro
ute
De
lay
(min
ute
s p
er
flig
ht)
IFR
flig
hts
(D
aily
Ave
rage
)
LSAGACC - Traffic and en-route ATFM delays
2016 Realisation of Capacity Plan
The average en-route delay per flight increased from 0.09 minutes per flight in summer 2015 to 0.12 minutes per flight in summer 2016.
43% of delays were for the reason ATC Staffing, 29% for ATC Capacity, and 24% for weather.
Capacity Plan 0% Achieved Comments
FABEC FRA Step 1 : WE and WD DCTs Yes
Improved ATFCM Procedures and STAM Yes
Crystal – Traffic and complexity prediction tool Yes “What if” still to be implemented Jan 2017
Cross qualification of ATCOs (Upper/Lower) Yes
Recruitment as necessary to maintain the staffing levels Yes
Stripless step 4 (New Lower – Upgrade Upper) Yes
Virtual centre Yes Concept elaborated
Maximum configuration: 8/9 sectors (5/6 + 2/3) Yes 6 + 3
Summer 2016 performance assessment
The capacity baseline was measured using ACCESS at 154, which represents the capacity delivered during the Summer season in the ACC. During the measured period, the peak 1 hour demand was 144, and the peak 3 hour demand was 136.
Allocation of and Reasons for En-route Delay
YearReference
Location
Avg Daily
ER Delays
% of Total ACC
ER Delay
2016 LSAGSE 24 16.0%
2016 LSAGL12 17 11.6%
2016 LSAGL34 17 11.4%
2016 LSAGL56 16 10.7%
2016 LSAGL4 16 10.5%
2016 LSAGL5 12 8.3%
0
20
40
60
80
CAPACITY STAFFING DISRUPTION EVENTS WEATHER
Avg
dail
y d
ela
y
(min
)
Geneva ACC en-route delays in 2016
Geneva
LSAG ACC
Traffic Evolution (2016 v 2015) En-route Delay (min. per flight)
Capacity gap?
ACC Capacity Baseline
(% difference v 2015) Traffic Forecast
Actual Traffic
All reasons ACC Reference
Value Current Routes
Shortest Routes
Year H: 3.4%
B: 1.8%
L: -0.5%
No significant
impact
+2.0% 0.09 0.19
Summer +2.5% 0.12 0.28 No 154 (0%)

NETWORK OPERATIONS REPORT – 2016
62
©2017 European Organisation for the Safety of Air Navigation (EUROCONTROL)
57. SWITZERLAND - ZURICH ACC Traffic & Delay
2012 2013 2014 2015 2016
Peak Day Traffic 2504 2485 2499 2508 2573
Summer Traffic 2249 2211 2241 2249 2309
Yearly Traffic 2031 1975 1984 2004 2039
Summer enroute delay (all causes) 0.29 0.21 0.11 0.11 0.10
Yearly enroute delay (all causes) 0.19 0.14 0.08 0.10 0.08
0.0
0.1
0.2
0.3
0.4
0.5
0.6
0.7
0.8
0.9
1.0
0
500
1000
1500
2000
2500
3000
Enro
ute
De
lay
(min
ute
s p
er
flig
ht)
IFR
flig
hts
(D
aily
Ave
rage
)
LSAZACC - Traffic and en-route ATFM delays
2016 Realisation of Capacity Plan
The average en-route delay per flight slightly decreased from 0.11 minutes per flight in Summer 2015 to 0.10 minutes per flight in Summer 2016.
72% of delays were for the reason ATC Capacity, 21% for Weather, and 5% for ATC Staffing.
Capacity Plan : +1% Achieved Comments
FABEC FRA Step 1 : WE and WD DCTs Yes
LSZH iLVP Yes 25% increase in capacity at LSZH during LVP
Improved ATFCM Procedures and STAM Yes
Crystal – Traffic and complexity prediction tool Yes
Harmonisation Release / Upper Airspace Harmonisation and Optimisation (UHO)
No Planned March 2017
Recruitment as necessary to maintain the staffing levels Yes
Stripless step 4 Yes
Virtual centre Yes
Maximum configuration: 9 sectors Yes 9 sectors opened (4 + 5)
Summer 2016 performance assessment
The capacity baseline was measured using ACCESS at 178. During the period June/July, the peak 1 hour demand was 173, and the peak 3 hour demand was 163.
Allocation of and Reasons for En-route Delay
YearReference
Location
Avg Daily
ER Delays
% of Total ACC
ER Delay
2016 LSZHTMA 50 30.8%
2016 LSAZM4 35 21.6%
2016 LSZBTA 32 19.9%
2016 LSAZM123 22 13.5%
2016 LSAZM5 16 9.8%
2016 LSAZM56 2 1.3%
0
50
100
150
CAPACITY STAFFING DISRUPTION EVENTS WEATHER
Av
g d
ail
y d
ela
y (m
in)
Zurich ACC en-route delays in 2016
Zurich
LSAZ ACC
Traffic Evolution (2016 v 2015) En-route Delay (min. per flight)
Capacity gap?
ACC Capacity Baseline
(% difference v 2015) Traffic Forecast
Actual Traffic
All reasons ACC Reference
Value Current Routes
Shortest Routes
Year H: 2.5%
B: 1.0%
L: -0.7%
+9%
+1.7% 0.08 0.18
Summer +2.7% 0.10 0.29 No 178 (+1%)
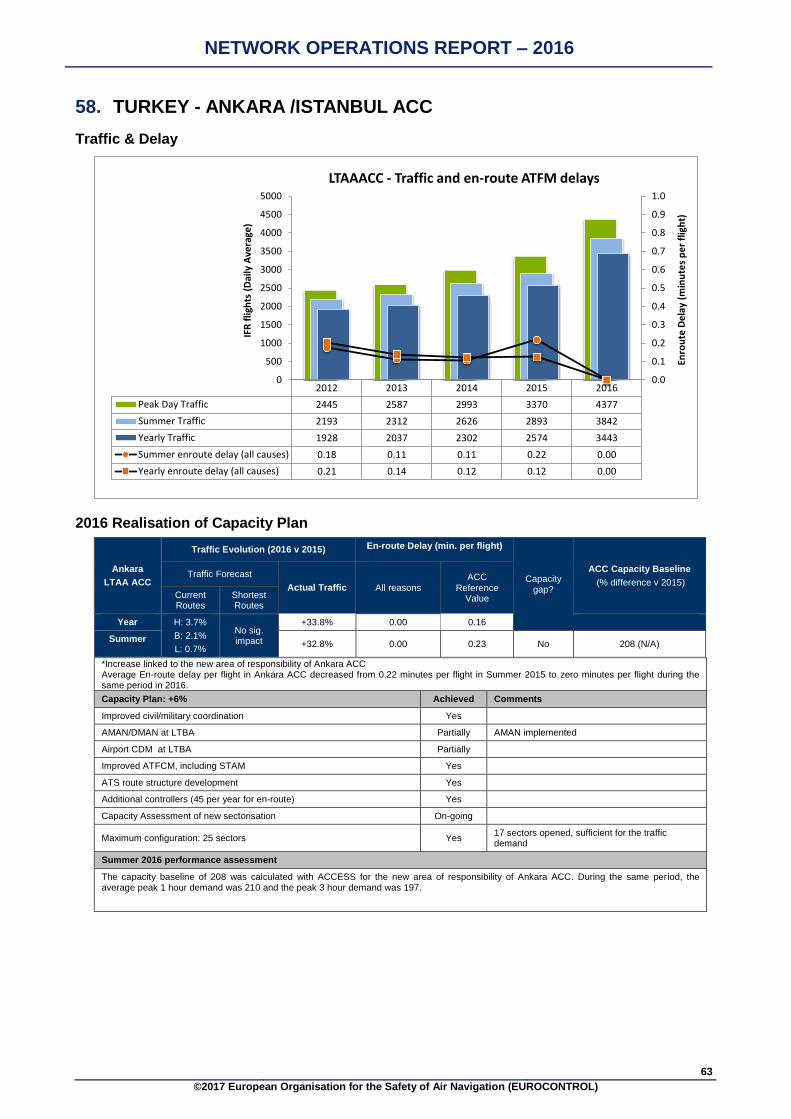
NETWORK OPERATIONS REPORT – 2016
63
©2017 European Organisation for the Safety of Air Navigation (EUROCONTROL)
58. TURKEY - ANKARA /ISTANBUL ACC
Traffic & Delay
2012 2013 2014 2015 2016
Peak Day Traffic 2445 2587 2993 3370 4377
Summer Traffic 2193 2312 2626 2893 3842
Yearly Traffic 1928 2037 2302 2574 3443
Summer enroute delay (all causes) 0.18 0.11 0.11 0.22 0.00
Yearly enroute delay (all causes) 0.21 0.14 0.12 0.12 0.00
0.0
0.1
0.2
0.3
0.4
0.5
0.6
0.7
0.8
0.9
1.0
0
500
1000
1500
2000
2500
3000
3500
4000
4500
5000
Enro
ute
De
lay
(min
ute
s p
er
flig
ht)
IFR
flig
hts
(D
aily
Ave
rage
)
LTAAACC - Traffic and en-route ATFM delays
2016 Realisation of Capacity Plan
*Increase linked to the new area of responsibility of Ankara ACC Average En-route delay per flight in Ankara ACC decreased from 0.22 minutes per flight in Summer 2015 to zero minutes per flight during the same period in 2016.
Capacity Plan: +6% Achieved Comments
Improved civil/military coordination Yes
AMAN/DMAN at LTBA Partially AMAN implemented
Airport CDM at LTBA Partially
Improved ATFCM, including STAM Yes
ATS route structure development Yes
Additional controllers (45 per year for en-route) Yes
Capacity Assessment of new sectorisation On-going
Maximum configuration: 25 sectors Yes 17 sectors opened, sufficient for the traffic demand
Summer 2016 performance assessment
The capacity baseline of 208 was calculated with ACCESS for the new area of responsibility of Ankara ACC. During the same period, the average peak 1 hour demand was 210 and the peak 3 hour demand was 197.
Ankara
LTAA ACC
Traffic Evolution (2016 v 2015) En-route Delay (min. per flight)
Capacity gap?
ACC Capacity Baseline
(% difference v 2015) Traffic Forecast
Actual Traffic All reasons ACC
Reference Value Current
Routes Shortest Routes
Year H: 3.7%
B: 2.1%
L: 0.7%
No sig. impact
+33.8% 0.00 0.16
Summer +32.8% 0.00 0.23 No 208 (N/A)

NETWORK OPERATIONS REPORT – 2016
64
©2017 European Organisation for the Safety of Air Navigation (EUROCONTROL)
59. UKRAINE - DNIPROPETROVSK ACC
Traffic & Delay
2012 2013 2014 2015 2016
Peak Day Traffic 703 645 476 72 73
Summer Traffic 522 540 200 49 55
Yearly Traffic 446 467 233 43 48
Summer enroute delay (all causes) 0.00 0.00 0.00 0.00 0.00
Yearly enroute delay (all causes) 0.00 0.00 0.00 0.00 0.00
0.0
0.1
0.2
0.3
0.4
0.5
0.6
0.7
0.8
0.9
1.0
0
100
200
300
400
500
600
700
800
Enro
ute
De
lay
(min
ute
s p
er
flig
ht)
IFR
flig
hts
(D
aily
Ave
rage
)
UKDVACC - Traffic and en-route ATFM delays
2016 Realisation of Capacity Plan
Average En-route ATFM delay remained at zero, as in Summer 2015.
Planned Capacity Increase: sufficient to meet demand Achieved Comments
Free Route Airspace Implementation Yes Except of UTA Dnipropetrovs’k-South
Advanced Flexible Use of Airspace related objectives (LSSIP AOM19.1, AOM 19.2, AOM 19.3)
No Full operational capability is expected in 2021
Implementation of enhanced tactical flow management services (LSSIP FCM01) and collaborative flight planning (LSSIP FCM03)
No
FCM03 will be implemented after LSSIP COM 10 “Migrate from AFTN to AMHS” is completed
FCM01 is partially implemented
Sector configurations management, ATFCM measures development Yes
Maximum configuration: 6 sectors Yes 5 sectors were sufficient
Summer 2016 performance assessment
The ACC capacity baseline was estimated at 54, the same level as last year. During the measured period, the average peak 1 hour demand was 6 and the average peak 3 hour demand was 5.
Dnipro-petrovsk
UKDV ACC
Traffic Evolution (2016 v 2015) En-route Delay (min. per flight)
Capacity gap?
ACC Capacity Baseline
(% difference v 2015) Traffic Forecast
Actual Traffic
All reasons ACC Reference
Value Current Routes
Shortest Routes
Year H: 0.4%
B: -3.9%
L: -5.8%
No significant
impact
+11.6% 0.00 0.01
Summer +12.2% 0.00 0.01 No 54 (0%)

NETWORK OPERATIONS REPORT – 2016
65
©2017 European Organisation for the Safety of Air Navigation (EUROCONTROL)
60. UKRAINE - KYIV ACC
Traffic & Delay
2012 2013 2014 2015 2016
Peak Day Traffic 1099 1004 945 603 533
Summer Traffic 754 783 604 496 386
Yearly Traffic 650 666 544 410 332
Summer enroute delay (all causes) 0.00 0.00 0.00 0.00 0.00
Yearly enroute delay (all causes) 0.00 0.00 0.00 0.00 0.00
0.0
0.1
0.2
0.3
0.4
0.5
0.6
0.7
0.8
0.9
1.0
0
200
400
600
800
1000
1200
Enro
ute
De
lay
(min
ute
s p
er
flig
ht)
IFR
flig
hts
(D
aily
Ave
rage
)
UKBVACC - Traffic and en-route ATFM delays
2016 Realisation of Capacity Plan
Average En-route ATFM delay remained at zero, as in Summer 2015.
Planned Capacity Increase: sufficient to meet demand Achieved Comments
Free Route Airspace Implementation Yes During night period only
Advanced Flexible Use of Airspace related objectives (LSSIP AOM19.1, AOM 19.2, AOM 19.3)
No Full operational capability is expected in 2021
Implementation of collaborative flight planning (LSSIP FCM03) No FCM03 will be implemented after LSSIP COM 10 “Migrate from AFTN to AMHS” is completed
Sector configurations management, ATFCM measures development Yes
Maximum configuration: 7 sectors Yes 6 sectors were sufficient
Summer 2016 performance assessment
The ACC capacity baseline was estimated at 73, the same level as last year. During the measured period, the average peak 1 hour demand was 29 and the average peak 3 hour demand was 23.
Kyiv
UKBV ACC
Traffic Evolution (2016 v 2015) En-route Delay (min. per flight)
Capacity gap?
ACC Capacity Baseline
(% difference v 2015) Traffic Forecast
Actual Traffic
All reasons ACC Reference
Value Current Routes
Shortest Routes
Year H: -5.7%
B: -8.2%
L: -10.6%
+25%
-19.0% 0.00 0.01
Summer -22.2% 0.00 0.01 No 73 (0%)

NETWORK OPERATIONS REPORT – 2016
66
©2017 European Organisation for the Safety of Air Navigation (EUROCONTROL)
61. UKRAINE - L’VIV ACC
Traffic & Delay
2012 2013 2014 2015 2016
Peak Day Traffic 757 796 697 411 405
Summer Traffic 554 574 379 289 315
Yearly Traffic 488 503 364 240 260
Summer enroute delay (all causes) 0.00 0.00 0.00 0.00 0.00
Yearly enroute delay (all causes) 0.00 0.00 0.00 0.00 0.00
0.0
0.1
0.2
0.3
0.4
0.5
0.6
0.7
0.8
0.9
1.0
0
100
200
300
400
500
600
700
800
900
Enro
ute
De
lay
(min
ute
s p
er
flig
ht)
IFR
flig
hts
(D
aily
Ave
rage
)
UKLVACC - Traffic and en-route ATFM delays
2016 Realisation of Capacity Plan
Average En-route ATFM delay remained at zero, as in Summer 2015.
Planned Capacity Increase: sufficient to meet demand Achieved Comments
Free Route Airspace Implementation Yes During night period only
Advanced Flexible Use of Airspace related objectives (LSSIP AOM19.1, AOM 19.2, AOM 19.3)
No Full operational capability is expected in 2021
Implementation of enhanced tactical flow management services (LSSIP FCM01) and collaborative flight planning (LSSIP FCM03)
No
FCM03 will be implemented after LSSIP COM 10 “Migrate from AFTN to AMHS” is completed
FCM01 is expected to be implemented in 2017
Installation of new ATM system Yes
Sector configurations management, ATFCM measures development Yes
Maximum configuration: 4 sectors Yes 2 sectors were sufficient
Summer 2016 performance assessment
The ACC capacity baseline was estimated at 72, the same level as last year. The peak 1 hour demand was 27 flights, and the peak 3 hour demand was 23 flights.
L’viv
UKLV ACC
Traffic Evolution (2016 v 2015) En-route Delay (min. per flight)
Capacity gap?
ACC Capacity Baseline
(% difference v 2015) Traffic Forecast
Actual Traffic
All reasons ACC Reference
Value Current Routes
Shortest Routes
Year H: 3.0%
B: 0.9%
L: -3.6%
+8%
+8.3% 0.00 0.01
Summer +9.0% 0.00 0.01 No 72 (0%)

NETWORK OPERATIONS REPORT – 2016
67
©2017 European Organisation for the Safety of Air Navigation (EUROCONTROL)
62. UKRAINE - ODESA ACC
Traffic & Delay
2012 2013 2014 2015 2016
Peak Day Traffic 480 543 556 413 382
Summer Traffic 332 387 361 315 243
Yearly Traffic 272 302 287 245 198
Summer enroute delay (all causes) 0.00 0.00 0.00 0.00 0.00
Yearly enroute delay (all causes) 0.00 0.00 0.00 0.00 0.00
0.0
0.1
0.2
0.3
0.4
0.5
0.6
0.7
0.8
0.9
1.0
0
100
200
300
400
500
600
Enro
ute
De
lay
(min
ute
s p
er
flig
ht)
IFR
flig
hts
(D
aily
Ave
rage
)
UKOVACC - Traffic and en-route ATFM delays
2016 Realisation of Capacity Plan
Average En-route ATFM delay remained at zero, as in Summer 2015.
Planned Capacity Increase: sufficient to meet demand Achieved Comments
Free Route Airspace Implementation Yes Except of UTA Odesa-South
Advanced Flexible Use of Airspace related objectives (LSSIP AOM19.1, AOM 19.2, AOM 19.3)
No Full operational capability is expected in 2021
Implementation of collaborative flight planning (LSSIP FCM03) No FCM03 will be implemented after LSSIP COM 10 “Migrate from AFTN to AMHS” is completed
Sector configurations management, ATFCM measures development Yes
Maximum configuration: 5 sectors Yes 4 sectors were sufficient
Summer 2016 performance assessment
The ACC capacity baseline was estimated at 61, the same level as last year. During the measured period, the peak 1 hour demand was 19 flights and the the peak 3 hour demand was 15 flights.
Odesa
UKOV ACC
Traffic Evolution (2016 v 2015) En-route Delay (min. per flight)
Capacity gap?
ACC Capacity Baseline
(% difference v 2015) Traffic Forecast
Actual Traffic
All reasons ACC Reference
Value Current Routes
Shortest Routes
Year H: -5.0%
B: -7.0%
L: -9.5%
+35%
-19.2% 0.00 0.01
Summer -22.9% 0.00 0.01 No 61 (0%)

NETWORK OPERATIONS REPORT – 2016
68
©2017 European Organisation for the Safety of Air Navigation (EUROCONTROL)
63. UNITED KINGDOM - LONDON ACC Traffic & Delay
2012 2013 2014 2015 2016
Peak Day Traffic 6028 6040 6206 6300 6617
Summer Traffic 5426 5534 5655 5784 6076
Yearly Traffic 4894 4927 5033 5172 5411
Summer enroute delay (all causes) 0.09 0.12 0.07 0.09 0.11
Yearly enroute delay (all causes) 0.07 0.14 0.05 0.06 0.08
0.0
0.1
0.2
0.3
0.4
0.5
0.6
0.7
0.8
0.9
1.0
0
1000
2000
3000
4000
5000
6000
7000
Enro
ute
De
lay
(min
ute
s p
er
flig
ht)
IFR
flig
hts
(D
aily
Ave
rage
)
EGTTACC - Traffic and en-route ATFM delays
2016 Realisation of Capacity Plan
Average En-route delay per flight slightly increased from 0.09 minutes per flight in Summer 2015 to 0.11 minutes per flight in Summer 2016 (May to October inclusive). 47% of the delays were for the reason Weather, 42% for ATC capacity, 8% for other, 1% for the reason airspace management and 1% for ATC Staffing.
Capacity Plan: +2% Achieved Comments
TMA transition sectors enhancement – RNP development No Planned for 2017
Improved ATFCM, including STAM Yes
UK / Ireland FAB initiatives Yes
Implementation of LAMP 1A Yes
R-LAT (Nov 2015) Yes
CPDLC Yes
Developing Queue Management programme Yes
Maintain progress to 18000ft TA No
Flexible use of existing staff (including cross-sector training) more closely related to sector demand Yes
On-going recruitment to maintain agreed business service levels Yes
Complexity reduction and improved traffic presentation between sectors / ANSPs Yes
Traffic Management Improvements Yes
Adaptation of sector configurations to demand Yes
Maximum configuration: 23 sectors Yes
Summer 2016 performance assessment
The capacity of 433 was calculated with ACCESS. During the period June/July, the peak hour demand was 438, the peak 3 hour demand was 392.
Allocation of and Reasons for En-route Delay Year
Reference
Location
Avg Daily
ER Delays
% of Total ACC
ER Delay
2016 EGTT15DVR 55 12.9%
2016 EGTT02LUE 42 9.9%
2016 EGTTNOR 33 7.7%
2016 EGTT17LYD 26 6.1%
2016 EGTT14CLW 25 5.8%
2016 EGTTDTS 21 4.9%
0
50
100
150
200
CAPACITY STAFFING DISRUPTION EVENTS WEATHER
Av
g d
ail
y d
ela
y (m
in)
London ACC en-route delays in 2016
London
EGTT ACC
Traffic Evolution (2016 v 2015) En-route Delay (min. per flight)
Capacity gap?
ACC Capacity Baseline
(% difference v 2015) Traffic Forecast
Actual Traffic
All reasons ACC Reference
Value Current Routes
Shortest Routes
Year H: 3.7%
B: 2.7%
L: 1.7%
No significant
impact
+4.6% 0.08 0.19
Summer +5.0% 0.11 0.26 No 433 (+2%)

NETWORK OPERATIONS REPORT – 2016
69
©2017 European Organisation for the Safety of Air Navigation (EUROCONTROL)
64. UNITED KINGDOM - LONDON TC Traffic & Delay
2012 2013 2014 2015 2016
Peak Day Traffic 4059 4071 4198 4319 4563
Summer Traffic 3663 3714 3819 3935 4109
Yearly Traffic 3386 3408 3511 3626 3767
Summer enroute delay (all causes) 0.03 0.02 0.02 0.09 0.22
Yearly enroute delay (all causes) 0.02 0.01 0.01 0.06 0.19
0.0
0.1
0.2
0.3
0.4
0.5
0.6
0.7
0.8
0.9
1.0
0
500
1000
1500
2000
2500
3000
3500
4000
4500
5000
Enro
ute
De
lay
(min
ute
s p
er
flig
ht)
IFR
flig
hts
(D
aily
Ave
rage
)
EGTTTC - Traffic and en-route ATFM delays
2016 Realisation of Capacity Plan
Average En-route delay per flight increased from 0.09 minutes per flight in Summer 2015 to 0.22 minutes per flight in Summer 2016.
41% of the delays were for the reason Weather, 29% of the delays were for the reason ATC Staffing, 28% for ATC Capacity and 2% for Equipment.
Capacity Plan: +2% Achieved Comments
Improved ATFCM, including STAM Yes
Implementation of LAMP 1A Yes
Developing Queue Management programme Yes
Maintain progress to 18000ft TA No
Flexible use of existing staff Yes
On-going recruitment to maintain agreed business service levels Yes
Adaptation of sector configurations to demand Yes
Traffic Management Improvements Yes
Complexity reduction and improved traffic presentation between sectors / ANSPs Yes
Maximum configuration: 44 (27 ENR + 17 APP) Yes
Summer 2016 performance assessment
The ACC capacity baseline was measured with ACCESS at 286. During the period June/July, the peak hour demand was 297, the peak 3 hour demand was 267.
NB: Increased Capacity delays in 2016 were due to the introduction of LAMP 1A Airspace Development.
Allocation of and Reasons for En-route Delay
YearReference
Location
Avg Daily
ER Delays
% of Total ACC
ER Delay
2016 EGTTRED 110 15.5%
2016 EGTTSAB 92 12.9%
2016 EGTTSAJ 91 12.8%
2016 EGTTLOR 60 8.4%
2016 EGTTJAC 52 7.3%
2016 EGTTGJT 40 5.6%
0
100
200
300
CAPACITY STAFFING DISRUPTION EVENTS WEATHER
Av
g d
ail
y d
ela
y (m
in)
London TMA TC en-route delays in 2016
London
EGTT TC
Traffic Evolution (2016 v 2015) En-route Delay (min. per flight)
Capacity gap?
ACC Capacity Baseline
(% difference v 2015) Traffic Forecast
Actual Traffic
All reasons ACC Reference
Value Current Routes
Shortest Routes
Year H: 2.9%
B: 2.0%
L: 1.0%
No significant
impact
+3.9% 0.19 0.11
Summer +4.4% 0.22 0.11 No 286 (0%)
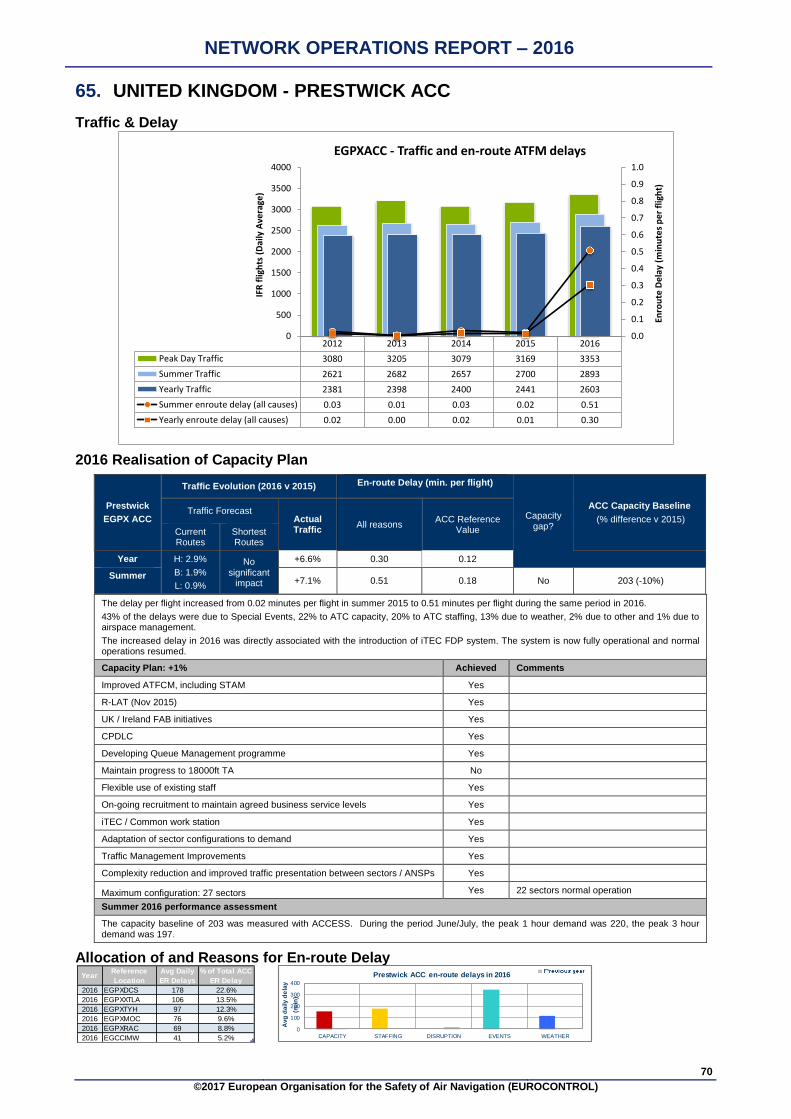
NETWORK OPERATIONS REPORT – 2016
70
©2017 European Organisation for the Safety of Air Navigation (EUROCONTROL)
65. UNITED KINGDOM - PRESTWICK ACC
Traffic & Delay
2012 2013 2014 2015 2016
Peak Day Traffic 3080 3205 3079 3169 3353
Summer Traffic 2621 2682 2657 2700 2893
Yearly Traffic 2381 2398 2400 2441 2603
Summer enroute delay (all causes) 0.03 0.01 0.03 0.02 0.51
Yearly enroute delay (all causes) 0.02 0.00 0.02 0.01 0.30
0.0
0.1
0.2
0.3
0.4
0.5
0.6
0.7
0.8
0.9
1.0
0
500
1000
1500
2000
2500
3000
3500
4000
Enro
ute
De
lay
(min
ute
s p
er
flig
ht)
IFR
flig
hts
(D
aily
Ave
rage
)
EGPXACC - Traffic and en-route ATFM delays
2016 Realisation of Capacity Plan
The delay per flight increased from 0.02 minutes per flight in summer 2015 to 0.51 minutes per flight during the same period in 2016.
43% of the delays were due to Special Events, 22% to ATC capacity, 20% to ATC staffing, 13% due to weather, 2% due to other and 1% due to airspace management.
The increased delay in 2016 was directly associated with the introduction of iTEC FDP system. The system is now fully operational and normal operations resumed.
Capacity Plan: +1% Achieved Comments
Improved ATFCM, including STAM Yes
R-LAT (Nov 2015) Yes
UK / Ireland FAB initiatives Yes
CPDLC Yes
Developing Queue Management programme Yes
Maintain progress to 18000ft TA No
Flexible use of existing staff Yes
On-going recruitment to maintain agreed business service levels Yes
iTEC / Common work station Yes
Adaptation of sector configurations to demand Yes
Traffic Management Improvements Yes
Complexity reduction and improved traffic presentation between sectors / ANSPs Yes
Maximum configuration: 27 sectors Yes 22 sectors normal operation
Summer 2016 performance assessment
The capacity baseline of 203 was measured with ACCESS. During the period June/July, the peak 1 hour demand was 220, the peak 3 hour demand was 197.
Allocation of and Reasons for En-route Delay
YearReference
Location
Avg Daily
ER Delays
% of Total ACC
ER Delay
2016 EGPXDCS 178 22.6%
2016 EGPXXTLA 106 13.5%
2016 EGPXTYH 97 12.3%
2016 EGPXMOC 76 9.6%
2016 EGPXRAC 69 8.8%
2016 EGCCIMW 41 5.2%
0
100
200
300
400
CAPACITY STAFFING DISRUPTION EVENTS WEATHER
Avg
daily d
ela
y
(min
)
Prestwick ACC en-route delays in 2016
Prestwick
EGPX ACC
Traffic Evolution (2016 v 2015) En-route Delay (min. per flight)
Capacity gap?
ACC Capacity Baseline
(% difference v 2015) Traffic Forecast
Actual Traffic
All reasons ACC Reference
Value Current Routes
Shortest Routes
Year H: 2.9%
B: 1.9%
L: 0.9%
No significant
impact
+6.6% 0.30 0.12
Summer +7.1% 0.51 0.18 No 203 (-10%)

NETWORK OPERATIONS REPORT – 2016
March 2017 2016 NOR ANNEX
©2017 European Organisation for the Safety of Air Navigation (EUROCONTROL)
INTENTIONALLY LEFT BLANK