annual performance plan 2019/20 2020/21 indicator …
TRANSCRIPT

ANNUAL PERFORMANCE PLAN 2019/20 – 2020/21
INDICATOR DESCRIPTIONS
[TIDS] Page 1
PROGRAMME 1: ADMINISTRATION
Indicator Short Definition Purpose of
Indicator
Primary
Source
APP Source Method of
Calculation
Calculatio
n Type
Indicator
Type
Reporting
Cycle
Data
Limitations
New
indicator
Desired
Performanc
e
Indicator
Responsibilit
y
Audit opinion
from Auditor
General
Audit opinion
for Provincial
Departments of
Health for
financial
performance
To strengthen
financial
management
monitoring and
evaluation
Documente
d Evidence:
Annual
Report
Auditor
General’s
Report
Annual
Report –
AGSA
Findings
N/A
Categoric
al
Outcome Annual None No Unqualified
audit
opinion from
the Auditor
General of
SA.
CFO; All
Senior
Managers
Provincial
Department
s of Health
Percentage of
Hospitals with
broadband
access
Percentage of
Hospitals with
broadband
access
To track
broadband
access to
hospitals
Network
reports that
confirm
availability
of
broadband;
OR
Network
rollout report
for sites that
are not yet
live
ICT
database
Numerator:
Total Number of
hospitals with
minimum 2 Mbps
connectivity
Denominator
Total Number of
Hospitals
% Output Quarterly None No Higher
Proportion
of
broadband
access is
more
favorable
for
connectivity
to ensure
that South
African
health
system can
implement
the eHealth
Programme
ICT
Directorate/
Chief
Director

ANNUAL PERFORMANCE PLAN 2019/20 – 2020/21
INDICATOR DESCRIPTIONS
[TIDS] Page 2
Indicator Short Definition Purpose of
Indicator
Primary
Source
APP Source Method of
Calculation
Calculatio
n Type
Indicator
Type
Reporting
Cycle
Data
Limitations
New
indicator
Desired
Performanc
e
Indicator
Responsibilit
y
Percentage of
fixed PHC
facilities with
broadband
access
Percentage of
fixed PHC
facilities with
broadband
access
To ensure
broadband
access to PHC
facilities
Network
reports that
confirm
availability
of
broadband;
OR
Network
rollout report
for sites that
are not yet
live
ICT
database
Numerator:
Total Number of fixed
PHC facilities with
minimum 1Mbps
connectivity
Denominator
Total Number of fixed
PHC Facilities
% Output Quarterly None No Higher
Proportion
of
broadband
access is
more
favourable
for
connectivity
ICT
Directorate/
Chief
Director
Approved
annual
Procurement
Plan
A costed
Procurement
Plan making
provision for
minor and
major assets for
a specific
reporting cycle
(financial year).
To inform
budget
allocation and
effective
budget/
financial
management
and control in
procurement of
goods.
Approved
Annual
Procurement
Plan
Approved
Annual
Procurement
Plan
N/A
Categoric
al
Annual None No Annual
costed
Procuremen
t Plan.
CFO and
District/
Facility
Managers
The number of
organisational/
post structures
that have been
reviewed and
approved
The number of
organisational/
post structures
that have been
reviewed and
approved
Ensures
alignment of
post
establishments
Approved
organisation
al structures
Approved
organisation
al structures
SUM:
Number of approved
reviewed
establishments.
The number includes
structures for Head
Office, Regional and
District Offices,
Clinics, CHCs and
Hospitals
Number Annual None No The ideal is
to have all
structures
reviewed
and
approved.
HRMS
Manager

ANNUAL PERFORMANCE PLAN 2019/20 – 2020/21
INDICATOR DESCRIPTIONS
[TIDS] Page 3
Indicator Short Definition Purpose of
Indicator
Primary
Source
APP Source Method of
Calculation
Calculatio
n Type
Indicator
Type
Reporting
Cycle
Data
Limitations
New
indicator
Desired
Performanc
e
Indicator
Responsibilit
y
Implemented
Community
Based Training
in a PHC Model
New
Decentralised
Community
Based Training
in a PHC Model
for Health
Sciences
Students
(doctors, nurses
and allied
workers) with
focus on PHC
re-engineering
(formal training
from
community to
level 3
platforms).
Monitors
progress in
implementation
of the Model
and the
production of
health care
providers over
time.
Partnership
between the
Department of
Health and
UKZN.
Task Team
Reports
(DOH/UKZN)
Task Team
Reports
(DOH/UKZN)
N/A Categoric
al
Annual None No Model
implemente
d.
Provincial
Task Team
(DOH/UKZN)
Medical
Officers per 100
000 people
The number of
Medical
Officers in posts
on the last day
of March of the
reporting year
per 100 000
population.
Tracks the
availability of
Medical
Officers in the
public sector.
Persal
(Medical
Officers)
DHIS (Stats
SA
population)
Persal
(Medical
Officers)
DHIS (Stats
SA
population)
Numerator
Number of Medical
Officer posts filled in
reporting year
Denominator
Total population
Number
per 100
000
population
Annual Dependant
on
accuracy of
Persal data
and Stats SA
estimates.
No Increase in
the number
of Medical
Officers
contributes
to improving
access to
and quality
of clinical
care.
HRMS
Manager/
DDG’s

ANNUAL PERFORMANCE PLAN 2019/20 – 2020/21
INDICATOR DESCRIPTIONS
[TIDS] Page 4
Indicator Short Definition Purpose of
Indicator
Primary
Source
APP Source Method of
Calculation
Calculatio
n Type
Indicator
Type
Reporting
Cycle
Data
Limitations
New
indicator
Desired
Performanc
e
Indicator
Responsibilit
y
Professional
Nurses per
100,000 people
The number of
Professional
Nurses in posts
on the last day
of March of the
reporting year
per 100 000
population.
Tracks the
availability of
Professional
Nurses in the
public sector.
Persal
(Professional
Nurses)
DHIS (Stats
SA
population)
Persal
(Professional
Nurses)
DHIS (Stats
SA
population)
Numerator
Number of
Professional Nurse
posts filled
Denominator
Total population
Number
per 100
000
population
Annual Dependant
on
accuracy of
Persal data
and Stats SA
estimates.
No Increase in
the number
of
Professional
Nurses
contributes
to improving
access to
and quality
of clinical
care.
HRMS
Manager/
DDG’s
Pharmacists per
100,000 people
The number of
Pharmacists in
posts on the last
day of March
of the reporting
year per 100
000 population.
Tracks the
availability of
Pharmacists in
the public
sector.
Persal
(Pharmacists
)
DHIS (Stats
SA
population)
Persal
(Pharmacists
)
DHIS (Stats
SA
population)
Numerator
Number of
Pharmacist posts
filled
Denominator
Total population
Number
per 100
000
population
Annual Dependant
on
accuracy of
Persal data
and Stats SA
estimates.
No Increase in
the number
of
Pharmacists
contributes
to improving
access to
and quality
of clinical
care.
HRMS
Manager/
DDG’s
Percent of
Hospital
Managers
who have
signed
Performance
Agreements
(PA’s)
Percent of
Hospital
Managers
who have
signed
Performance
Agreements
(PA’s)
Monitors
compliance
with HR
prescripts.
Signed PA’s Signed PA’s Numerator
Hospital Managers
who signed PA’s in
the reporting cycle
Denominator
Number of Hospital
Managers
Number Annual None No All staff sign
annual PA’s
- aligned
with
Department
al priorities in
Strategic,
Annual
Performanc
e, District
and
Institutional
Plans.
HRMS
Manager;
DDGs

ANNUAL PERFORMANCE PLAN 2019/20 – 2020/21
INDICATOR DESCRIPTIONS
[TIDS] Page 5
Indicator Short Definition Purpose of
Indicator
Primary
Source
APP Source Method of
Calculation
Calculatio
n Type
Indicator
Type
Reporting
Cycle
Data
Limitations
New
indicator
Desired
Performanc
e
Indicator
Responsibilit
y
Percent of
District
Managers
who have
signed PA’s
Percent of
District
Managers
who have
signed PA’s
Monitors
compliance
with HR
prescripts.
Signed PA’s Signed PA’s Numerator
District Managers
who signed PA’s in
the reporting cycle
Denominator
Number of District
Managers )
Number Annual None No All staff sign
annual PA’s
- aligned
with
Department
al priorities in
Strategic,
Annual
Performanc
e, District
and
Institutional
Plans.
HRMS
Manager;
DDGs
Percentage of
Head Office
Managers
(Level 13 and
above) who
have signed
PA’s
The
percentage of
Senior
Managers
(level 13 and
above) who
have signed
PA’s.
Monitors
compliance
with HR
prescripts
Signed PA’s Signed PA’s Numerator
Head Office
Managers (level 13
and above) who
signed PA’s in the
reporting cycle
Denominator
Number of Head
Office Managers
(level 13 and above)
% Annual None No All staff sign
annual PA’s
- aligned
with
Department
al priorities in
Strategic,
Annual
Performanc
e, District
and
Institutional
Plans.
HRMS
Manager:
DDGs

ANNUAL PERFORMANCE PLAN 2019/20 – 2020/21
INDICATOR DESCRIPTIONS
[TIDS] Page 6
Indicator Short Definition Purpose of
Indicator
Primary
Source
APP Source Method of
Calculation
Calculatio
n Type
Indicator
Type
Reporting
Cycle
Data
Limitations
New
indicator
Desired
Performanc
e
Indicator
Responsibilit
y
Approved
2017-2027 Long
Term Plan
Ten year health
plan making
provision for
service
transformation,
system
strengthening,
service
provision and
clinical care
based on
imperial
evidence.
Informs service
transformation/
delivery and
resource
allocation over
a ten year
period.
Approved
Long Term
Plan
Approved
Long Term
Plan
N/A Categoric
al
Annual None No Approved
Long Term
Plan
implemente
d and
monitored.
Strategic
Planning
Manager

ANNUAL PERFORMANCE PLAN 2019/20 – 2020/21
INDICATOR DESCRIPTIONS
[TIDS] Page 7
Indicator Short Definition Purpose of
Indicator
Primary
Source
APP Source Method of
Calculation
Calculatio
n Type
Indicator
Type
Reporting
Cycle
Data
Limitations
New
indicator
Desired
Performanc
e
Indicator
Responsibilit
y
Approved
Hospital
Rationalisation
Plan
Integrated and
comprehensive
hospital plan
making
provision for
rationalisation
and
optimisation of
hospital
services and
resources
including
classification,
package of
services,
staffing
(according to
staffing norms),
bed allocation
per clinical
domain,
specialities,
complexes and
centres of
excellence,
etc.
Improves
hospital
efficiencies and
quality.
Approved
Hospital
Rationalisati
on Plan
Approved
Hospital
Rationalisati
on Plan
N/A Categoric
al
Annual None No Hospital
Rationalisati
on Plan
approved
and
implemente
d.
Specialised
Services ,
DHS and
Strategic
Planning
Managers
Percentage of
public health
hospitals that
scored more
than 75% on
the Food
Service
Monitoring
Standards
Grading
System
Percentage of
public health
hospitals that
scored more
than 75% on
the Food
Service
Monitoring
Standards
Grading
System
Monitors the
quality of food
services
Food
services
grading
register
Food
services
grading
register
Numerator:
Public health
hospitals that score
more than 75% on
the FSMSGS
Denominator:
Number of public
health hospitals
assessed
% Quarterly None No Higher
percentage
indicates
better
compliance
to food
services
standards
Food
Services
Manager

ANNUAL PERFORMANCE PLAN 2019/20 – 2020/21
INDICATOR DESCRIPTIONS
[TIDS] Page 8
Indicator Short Definition Purpose of
Indicator
Primary
Source
APP Source Method of
Calculation
Calculatio
n Type
Indicator
Type
Reporting
Cycle
Data
Limitations
New
indicator
Desired
Performanc
e
Indicator
Responsibilit
y
Number of
Community
care Givers
(CCGs)
appointed on
contract
New Indicator
The number of
CCGs
appointed on
contract during
year of
reporting.
Monitors the
number of
CCGs that
participate in
community-
based services.
CCG
database/
Persal
Persal SUM:
Number of CCGs on
Persal
Number Annual None Yes Higher
number
improves
coverage.
Executive
Support
Manager
Number of
ethics
workshops
conducted
New Indicator
Number of
ethics
workshops
conducted
Monitors
coverage of
ethics
education in
the workplace.
Attendance
Registers
Attendance
Registers
SUM:
Total number of
ethics workshops
conducted
Number Quarterly None Yes Full
compliance
indicates
adequate
education
on ethics in
the
workplace.
Executive
Support
Manager
Number of
complete
submissions of
disclosures of
donations,
sponsorships
and gifts
submitted to
Finance
New Indicator
Full disclosure of
all donations,
sponsorships
and gifts
received per
month.
Monitors
compliance to
Legislation.
Gift registers/
Reports to
Finance
Gift
Registers/
Finance
Reports
SUM:
Number of disclosure
reports submitted to
Finance
Number Quarterly None Yes Twelve
Reports.
Executive
Support
Manager
ANNUAL PERFORMANCE PLAN 2019/20 – 2020/21
INDICATOR DESCRIPTIONS
[TIDS] Page 9
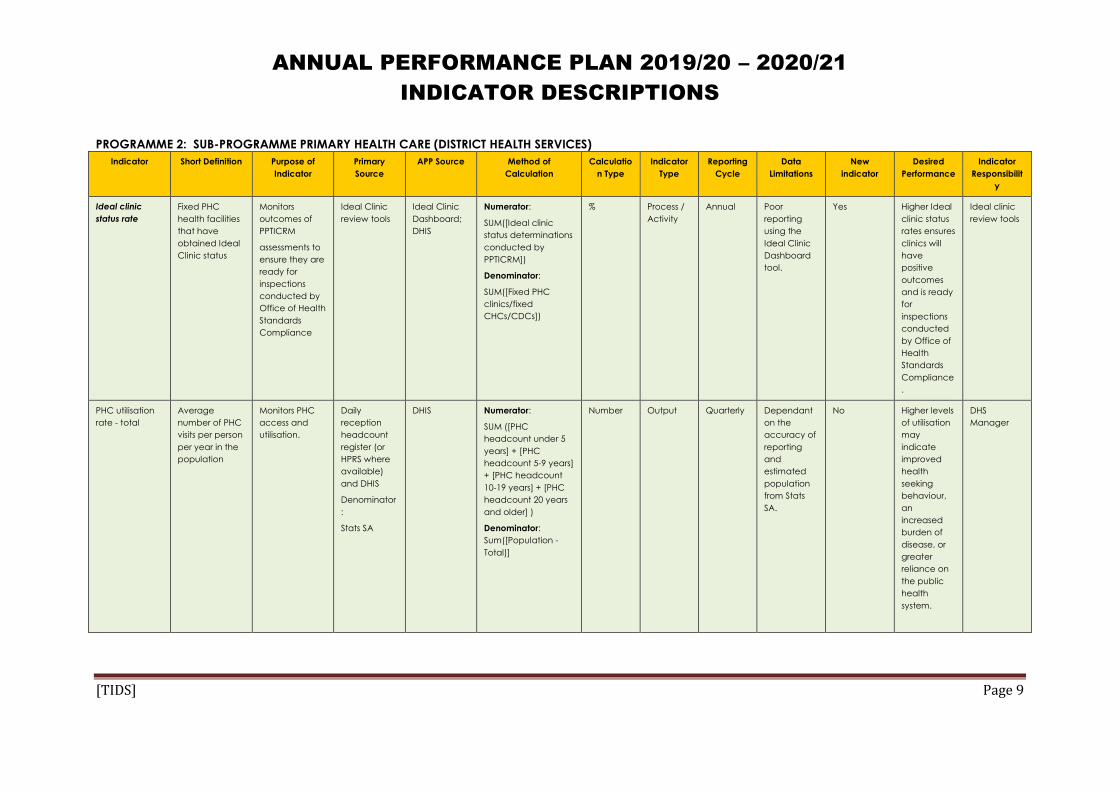
PROGRAMME 2: SUB-PROGRAMME PRIMARY HEALTH CARE (DISTRICT HEALTH SERVICES)
Indicator Short Definition Purpose of
Indicator
Primary
Source
APP Source Method of
Calculation
Calculatio
n Type
Indicator
Type
Reporting
Cycle
Data
Limitations
New
indicator
Desired
Performance
Indicator
Responsibilit
y
Ideal clinic
status rate
Fixed PHC
health facilities
that have
obtained Ideal
Clinic status
Monitors
outcomes of
PPTICRM
assessments to
ensure they are
ready for
inspections
conducted by
Office of Health
Standards
Compliance
Ideal Clinic
review tools
Ideal Clinic
Dashboard;
DHIS
Numerator:
SUM([Ideal clinic
status determinations
conducted by
PPTICRM])
Denominator:
SUM([Fixed PHC
clinics/fixed
CHCs/CDCs])
%
Process /
Activity
Annual Poor
reporting
using the
Ideal Clinic
Dashboard
tool.
Yes Higher Ideal
clinic status
rates ensures
clinics will
have
positive
outcomes
and is ready
for
inspections
conducted
by Office of
Health
Standards
Compliance
.
Ideal clinic
review tools
PHC utilisation
rate - total
Average
number of PHC
visits per person
per year in the
population
Monitors PHC
access and
utilisation.
Daily
reception
headcount
register (or
HPRS where
available)
and DHIS
Denominator
:
Stats SA
DHIS Numerator:
SUM ([PHC
headcount under 5
years] + [PHC
headcount 5-9 years]
+ [PHC headcount
10-19 years] + [PHC
headcount 20 years
and older] )
Denominator:
Sum([Population -
Total)]
Number Output Quarterly Dependant
on the
accuracy of
reporting
and
estimated
population
from Stats
SA.
No Higher levels
of utilisation
may
indicate
improved
health
seeking
behaviour,
an
increased
burden of
disease, or
greater
reliance on
the public
health
system.
DHS
Manager

ANNUAL PERFORMANCE PLAN 2019/20 – 2020/21
INDICATOR DESCRIPTIONS
[TIDS] Page 10
Indicator Short Definition Purpose of
Indicator
Primary
Source
APP Source Method of
Calculation
Calculatio
n Type
Indicator
Type
Reporting
Cycle
Data
Limitations
New
indicator
Desired
Performance
Indicator
Responsibilit
y
Complaint
resolution within
25 working days
rate
Complaints
resolved within
25 working days
as a proportion
of all
complaints
resolved.
Monitors the
time frame in
which the
public health
system
responds to
customer
complaints.
Complaints
register; DHIS
DHIS Numerator:
SUM([Complaint
resolved within 25
working days])
Denominator:
SUM([Complaint
resolved])
% Quality Quarterly Accuracy of
information
is
dependent
on the
accuracy of
time stamp
for each
complaint.
No Higher
percentage
suggest
better
manageme
nt of
complaints
in PHC
Facilities
PHC & QA
Managers;
Facility
Managers;
Ombuds
Complaints
resolution rate
Complaints
resolved as a
proportion of
complaints
received.
Monitors the
public health
system
response to
customer
concerns
Complaints
register; DHIS
DHIS Numerator:
SUM([Complaints
resolved])
Denominator:
SUM([Complaints
received])
% Quality Quarterly Accuracy of
reporting at
facility level.
No Higher
percentage
suggest
better
manageme
nt of
complaints
in PHC
Facilities
PHC & QA
Managers;
Facility
Managers;
Ombuds
Life
expectancy at
birth – Total
The average
number of
years a person
can expect to
live from birth
(age from birth
to death).
Tracks
improved
quality of life –
people living
longer.
Stats SA Mid-
Year
Estimates
Stats SA Mid-
Year
Estimates
A detailed
description of the
methodology that
Stats SA used for
projections is
available at:
www.statssa.gov.za
Years Outcome Annual Accuracy of
estimation.
No Increase in
life
expectancy
indicates
improved
quality of
life.
Planning,
M&E
Managers
Life
expectancy at
birth – Male
The average
number of
years a male
can expect to
live from birth
(age from birth
to death).
Tracks
improved
quality of life -
people living
longer.
Stats SA Mid-
Year
Estimates
Stats SA Mid-
Year
Estimates
A detailed
description of the
methodology that
Stats SA used for
projections is
available at:
www.statssa.gov.za
Years Outcome Annual Accuracy of
estimation.
No Increase in
life
expectancy
indicates
improved
quality of
life.
Planning,
M&E
Managers

ANNUAL PERFORMANCE PLAN 2019/20 – 2020/21
INDICATOR DESCRIPTIONS
[TIDS] Page 11
Indicator Short Definition Purpose of
Indicator
Primary
Source
APP Source Method of
Calculation
Calculatio
n Type
Indicator
Type
Reporting
Cycle
Data
Limitations
New
indicator
Desired
Performance
Indicator
Responsibilit
y
Life
expectancy at
birth – Female
The average
number of
years a female
can expect to
live from birth
(age from birth
to death).
Tracks
improved
quality of life -
people living
longer.
Stats SA Mid-
Year
Estimates
Stats SA Mid-
Year
Estimates
A detailed
description of the
methodology that
Stats SA used for
projections is
available at:
www.statssa.gov.za
Years Outcome Annual Accuracy of
estimation.
No Increase in
life
expectancy
indicates
improved
quality of
life.
Planning,
M&E
Managers
PHC utilisation
rate under 5
years
(annualised)
Average
number of PHC
visits per year
per person
under the age
of 5 years in the
population.
Monitors PHC
access and
utilisation by
children under
the age of 5
years.
PHC register;
DHIS; Stats SA
DHIS Numerator
PHC headcount
under 5 years
Denominator
Population under 5
years
Number
Output Quarterly
(annualise
d)
Dependant
on the
accuracy of
collected
data and
estimated
population
under 5
years from
Stats SA.
No Higher levels
of uptake
may
indicate
improved
health
seeking
behaviour,
increased
burden of
disease, or
greater
reliance on
public
health
system.
PHC
Manager;
Strategic
Health
Programme
Mangers
Expenditure
per PHC
headcount
Provincial
expenditure
including Sub-
Programmes 2.2
– 2.7 per person
visiting public
health PHC
services.
Monitors PHC
expenditure
trends per
patient visiting
PHC clinics and
CHCs.
BAS; PHC
register
DHIS; BAS Numerator
Total expenditure
PHC for Sub-
Programmes 2.2 - 2.7
Denominator
PHC headcount total
Rand Outcome Quarterly Efficient
record
manageme
nt at facility
level.
No Lower
expenditure
may
indicate
efficient use
of resources;
higher
expenditure
may
indicate
improved
access to
PHC without
concomitan
t resources.
PHC and
Finance
Managers

ANNUAL PERFORMANCE PLAN 2019/20 – 2020/21
INDICATOR DESCRIPTIONS
[TIDS] Page 12
Indicator Short Definition Purpose of
Indicator
Primary
Source
APP Source Method of
Calculation
Calculatio
n Type
Indicator
Type
Reporting
Cycle
Data
Limitations
New
indicator
Desired
Performance
Indicator
Responsibilit
y
Number of
School Health
Teams
(cumulative)
Number of
School Health
Teams
appointed to
render health
services at
schools as part
of PHC re-
engineering.
Minimum
composition of
team: PN, EN
and Health
Promoter – may
include
additional
members. In
absence of a
PN, an EN may
head the team.
Monitors
services
rendered at
schools as part
of PHC re-
engineering.
Persal; BAS
District
Managemen
t
Persal; BAS
District
Managemen
t
SUM:
Total number of
appointed School
Health Teams
(cumulative)
Number Input Quarterly
(cumulati
ve)
School
Health
Teams not
correctly
linked on
BAS or
Persal.
No Higher
number
desired for
improved
school
coverage.
PHC
Manager
Number of
Ward-Based
Outreach
Teams
(cumulative)
The number of
ward-based
outreach teams
appointed to
render PHC
outreach
services.
Team
composition
includes PN, EN,
Health
Promoter or
CCGs. If no PN
is available, EN
can fulfil that
position until PN
can be
appointed.
Monitors
community-
based
outreach
services
rendered by
teams as part
of PHC re-
engineering.
Persal; BAS;
District
Managemen
t
Persal; BAS;
District
Managemen
t
SUM:
Total number of
Ward Based
Outreach Teams
(cumulative)
Number Input Quarterly
(cumulati
ve)
Teams not
accurately
linked with
BAS/ Persal.
No Higher
number
desired for
improved
ward based
coverage of
health
services.
PHC
Manager

ANNUAL PERFORMANCE PLAN 2019/20 – 2020/21
INDICATOR DESCRIPTIONS
[TIDS] Page 13
Indicator Short Definition Purpose of
Indicator
Primary
Source
APP Source Method of
Calculation
Calculatio
n Type
Indicator
Type
Reporting
Cycle
Data
Limitations
New
indicator
Desired
Performance
Indicator
Responsibilit
y
Number of
accredited
Health
Promoting
Schools
(cumulative)
The number of
schools that
have been
officially
accredited as
Health
Promoting
Schools by an
external
Assessment
Authority.
Accreditation is
based on full
compliance to
the national
norms and
standards for
Health
Promoting
Schools.
Monitors
implementation
of community
ownership for
health
promotion at
schools in line
with the
Ottawa
Charter’s 5
Action Areas to
expand the role
of learners as
partners in
health and to
improve
accountability
for health at
household
level.
School
accreditatio
n certificate
Health
Promoting
Schools
database
SUM:
Total number of
schools accredited
as Health Promoting
Schools by an
external assessment
authority
(cumulative)
Number Input Quarterly
(cumulati
ve)
Accuracy
and
completene
ss of the HPS
database.
No Higher
number
desired to
support
community
ownership
for health
promotion.
PHC
Manager
Outreach
Households
(OHH)
registration visit
coverage
OHH registered
by Ward Based
Outreach
Teams as a
proportion of
households in
the population.
Monitors
implementation
of the PHC re-
engineering
strategy –
community-
based services.
Household
registration
visit registers
DHIS Numerator:
SUM([OHH
registration visit])
Denominator:
Households in
population
%
Output Quarterly Household
data from
Stats SA.
No Higher
percentage
indicates
better
access to
services.
PHC
Manager

ANNUAL PERFORMANCE PLAN 2019/20 – 2020/21
INDICATOR DESCRIPTIONS
[TIDS] Page 14
Indicator Short Definition Purpose of
Indicator
Primary
Source
APP Source Method of
Calculation
Calculatio
n Type
Indicator
Type
Reporting
Cycle
Data
Limitations
New
indicator
Desired
Performance
Indicator
Responsibilit
y
Percentage of
fixed PHC
facilities scoring
above 70% on
the ideal clinic
dashboard
The fixed PHC
facilities
(including
clinics and
CHCs) that
score 70% and
more in
compliance
with the Ideal
Clinic core
standards
included on the
Ideal Clinic
Dashboard as a
proportion of
the total PHC
fixed facilities.
Monitors the
service quality
on PHC facility.
Ideal Clinic
assessments
Ideal Clinic
National
Dashboard
Numerator
Number of fixed PHC
facilities scoring
above 70% on the
Ideal Clinic
Dashboard
Denominator
Number of fixed PHC
facilities (including
clinics and CHCs)
% Quality Quarterly
(cumulati
ve)
None No Higher
percentage
indicates
better
compliance
to core
standards.
DHS
Manager

ANNUAL PERFORMANCE PLAN 2019/20 – 2020/21
INDICATOR DESCRIPTIONS
[TIDS] Page 15
PROGRAMMES 2, 4 AND 5: ALL HOSPITAL SERVICES
Indicator Short Definition Purpose of
Indicator
Primary
Source
APP Source Method of
Calculation
Calculatio
n Type
Indicator
Type
Reporting
Cycle
New
indicator
Data
Limitations
Desired
Performance
Indicator
Responsibilit
y
Hospital
achieved 75%
and more on
National Core
Standards
(NCS) self-
assessment rate
(All Hospitals)
New indicator
Fixed health
facilities
(category) that
have
conducted
annual National
Core Standards
self-assessment
as a proportion
of (category)
public health
hospitals.
Monitors
whether health
establishments
are measuring
their own level
of compliance
with core
standards in
order to close
gaps in
preparation for
an external
assessment by
the Office of
Health
Standards
Compliance.
Assessment
records; QA
reports
DHIS, NCS
Reports
DHIS Numerator:
SUM([Hospital
achieved 75% and
more on National
Core Standards self-
assessment])
Denominator:
SUM([Hospitals
conducted National
Core Standards self-
assessment])
% Quality Quarterly No Immature
QA
information
system and
process.
Higher
assessment
indicates
commitment
of facilities
to comply
with NCS
QA, DHS &
SS&CS
Managers
Average
Length of Stay
(All Hospitals)
The average
number of
client days an
admitted client
spends in
hospital before
separation.
Inpatient
separation is
the total of
Inpatient
discharges,
Inpatient
deaths and
Inpatient
transfers out.
Include all
specialities
Monitors
effectiveness
and efficiency
of inpatient
management.
Proxy indicator
because ideally
it should only
include
Inpatient days
for those clients
separated
during the
reporting
month.
Use in all
hospitals and
CHCs with
inpatient beds
Midnight
census;
Admission &
Discharge
Register; DHIS
DHIS Numerator:
Sum ([Inpatient days
total x 1])+([Day
patient total x 0.5])
Denominator:
SUM([inpatient
deaths-
total])+([inpatient
discharges-
total])+([inpatient
transfers out-total])
Days Efficiency Quarterly No None A low
average
length of
stay reflects
high levels of
efficiency.
But these
high
efficiency
levels might
also
compromise
quality of
hospital
care. High
ALOS might
reflect
inefficient
quality of
care.
Hospital
Services
Manager
DHS &
SS&CS
Managers

ANNUAL PERFORMANCE PLAN 2019/20 – 2020/21
INDICATOR DESCRIPTIONS
[TIDS] Page 16
Indicator Short Definition Purpose of
Indicator
Primary
Source
APP Source Method of
Calculation
Calculatio
n Type
Indicator
Type
Reporting
Cycle
New
indicator
Data
Limitations
Desired
Performance
Indicator
Responsibilit
y
Inpatient Bed
Utilisation Rate
(All Hospitals)
Inpatient bed
days used as
proportion of
maximum
Inpatient bed
days (inpatient
beds x days in
period)
available.
Include all
specialities
Track the
over/under
utilisation of
district hospital
beds
Midnight
census;
Admission &
Discharge
Register; DHIS
DHIS Numerator:
Sum ([Inpatient days
total x 1])+([Day
patient total x 0.5])
Denominator:
Inpatient bed days
(Inpatient beds *
30.42) available
% Efficiency Quarterly No Accurate
reporting
sum of daily
usable beds
Higher bed
utilisation
indicates
efficient use
of bed
utilisation
and/or
higher
burden of
disease
and/or
better
service
levels. Lower
bed
utilization
rate
indicates
inefficient
utilization of
the facility
Hospital
Services
Manager
DHS &
SS&CS
Managers

ANNUAL PERFORMANCE PLAN 2019/20 – 2020/21
INDICATOR DESCRIPTIONS
[TIDS] Page 17
Indicator Short Definition Purpose of
Indicator
Primary
Source
APP Source Method of
Calculation
Calculatio
n Type
Indicator
Type
Reporting
Cycle
New
indicator
Data
Limitations
Desired
Performance
Indicator
Responsibilit
y
Expenditure per
patient day
equivalent
(PDE) (all
Hospitals)
Average cost
per patient day
equivalent
(PDE). PDE is the
Inpatient days
total + Day
Patients * 0.5 +
(Emergency
headcount +
OPD
headcount
total) *
0.33333333.
Monitors
effective and
efficient
management
of inpatient
facilities. Note
that multiplied
by 0.5 is the
same as division
by 2, and
multiplied by
0.33333333 is
the same as
division by 3.
BAS, Stats SA,
Council for
Medical
Scheme
data, DHIS,
facility
registers,
patient
records
Admission,
expenditure,
midnight
census
DHIS; BAS Numerator:
SUM([Expenditure -
total])
Denominator:
Sum ([Inpatient days
total x 1])+([Day
patient total x
0.5])+([OPD
headcount not
referred new x
0.3333333])+
SUM([OPD
headcount referred
new x
0.3333333])+([OPD
headcount follow-up
x
0.3333333])+([Emerg
ency headcount -
total x 0.3333333])
R Outcome Quarterly No None Lower rate
indicates
effective use
of resources.
Hospital
Services
Manager
DHS, SS&CS
& Finance
Mangers
Complaint
resolution within
25 working days
rate (All
Hospitals)
Complaints
resolved within
25 working days
as a proportion
of all
complaints
resolved.
Monitors the
time frame in
which the
public health
system
responds to
complaints.
Complaints
register; QA
registers.
DHIS Numerator:
SUM([Complaint
resolved within 25
working days])
Denominator:
SUM([Complaint
resolved])
% Quality Quarterly No Accuracy of
information
is
dependent
on the
accuracy of
time stamp
for each
complaint
Higher
percentage
suggest
better
manageme
nt of
complaints
in Hospitals
Hospital
Services
QA, DHS &
SS&CS
Managers
Complaints
resolution rate
(All Hospitals)
Complaints
resolved as a
proportion of
complaints
received.
Monitors public
health system
response to
customer
concerns.
Complaints
register; QA
registers.
DHIS Numerator:
SUM([Complaint
resolved])
Denominator:
SUM([Complaint
received])
% Quality Quarterly No Immature
information
system and
processes.
Higher
percentage
indicates
high level
response to
patient
complaints.
QA, DHS &
SS&CS
Managers

ANNUAL PERFORMANCE PLAN 2019/20 – 2020/21
INDICATOR DESCRIPTIONS
[TIDS] Page 18
Indicator Short Definition Purpose of
Indicator
Primary
Source
APP Source Method of
Calculation
Calculatio
n Type
Indicator
Type
Reporting
Cycle
New
indicator
Data
Limitations
Desired
Performance
Indicator
Responsibilit
y
Delivery by
caesarean
section rate
(District,
Regional,
Tertiary &
Central
Hospitals)
Delivery by
caesarean
section as
proportion of
total deliveries
in (Category)
Hospitals.
Monitors
caesarean
section trends
in all categories
of hospitals.
Theatre
register;
Delivery
register
DHIS Numerator
Delivery by
caesarean section
Denominator
Delivery in facility
total
% Efficiency Quarterly No None Lower
percentage
may be an
indication of
improved
antenatal
care – the
burden of
disease may
increase %
DHS &
SS&CS
Managers
OPD
headcount –
total (All
Hospitals)
Total clients
attending
general or
specialist
outpatient
clinics.
Monitors
patient activity
(numbers) at
outpatient
clinics partly to
track burden of
disease trends,
workload and
utilisation/
allocation of
resources.
OPD registers DHIS SUM:
OPD specialist clinic
headcount + OPD
general clinic
headcount
(including follow-up
and new cases not
referred)
No Efficiency Quarterly No None Decrease in
numbers
may be an
indication of
improved
manageme
nt at lower
levels of
care – the
burden of
disease will
impact on
actual
numbers.
DHS &
SS&CS
Managers
OPD
headcount not
referred new
(All hospitals
except Central)
New clients
attending a
general or
specialist
outpatient
clinic without a
referral letter
from a PHC
facility or a
doctor.
Monitors
utilisation trends
of PHC clients
at both hospital
and PHC level -
not including
OPD follow-up
and
emergency
clients.
OPD registers DHIS SUM:
OPD headcount not
referred new
No Efficiency Quarterly No None Lower
numbers an
indication of
clients/
patients
entering the
health
system at
the
appropriate
level of
care.
DHS &
SS&CS
Managers

ANNUAL PERFORMANCE PLAN 2019/20 – 2020/21
INDICATOR DESCRIPTIONS
[TIDS] Page 19
PROGRAMME 2: SUB-PROGRAMME HIV, AIDS, STI AND TB CONTROL
Indicator Short Definition Purpose of
Indicator
Primary
Source
APP Source Method of
Calculation
Type Indicator
Type
Reporting
Cycle
New
indicator
Data
Limitations
Desired
Performance
Indicator
Responsibilit
y
ART client
remain on ART
end of month -
total
Total clients
remaining on
ART are the
sum of the
following:
Any client who
has a current
regiment in the
column
designating the
month reported
on.
Any client who
has a star
without a circle
in the column
designating the
month reported
on.
Clients
remaining on
ART equal
[naïve
(including PEP
and PMTCT) +
Experienced +
transfer in +
Restart] minus
[Died + loss to
follow up +
Transfer out].
Monitors the
total clients
remaining on
life-long ART at
the month.
ART Register;
TIER.Net
DHIS, ART
Register,
Tier.Net
SUM:
SUM([ART adult
remain on ART end
of
period])+SUM([ART
child under 15 years
remain on ART end
of period])
Number Output Quarterly No None Higher total
indicates a
larger
population
on ART
treatment
HIV/ AIDS
Manager

ANNUAL PERFORMANCE PLAN 2019/20 – 2020/21
INDICATOR DESCRIPTIONS
[TIDS] Page 20
Indicator Short Definition Purpose of
Indicator
Primary
Source
APP Source Method of
Calculation
Type Indicator
Type
Reporting
Cycle
New
indicator
Data
Limitations
Desired
Performance
Indicator
Responsibilit
y
TB/HIV co-
infected client
on ART rate
TB/HIV co-
infected clients
on ART as a
proportion of
HIV positive TB
clients
Monitors ART
coverage for TB
clients
TB register;
ETR.Net;
Tier.Net
DHIS Numerator:
SUM([TB/HIV co-
infected client on
ART])
Denominator:
SUM([TB client known
HIV positive])
% Quarterly Availability
of data in
ETR.net, TB
register,
patient
records
Higher
proportion
of TB/HIV co-
infected on
ART
treatment
will reduce
co-infection
rates
HIV/AIDS
and TB
Managers
HIV test done -
total
The total
number of HIV
tests done in all
age groups.
Monitors the
impact of the
pandemic and
assists in better
planning for
effective
combatting of
HIV and AIDS
and decreasing
the burden of
diseases from
TB.
PHC
Comprehensi
ve Register;
HTS Register
(HIV Testing
Services) or
HCT module
in TIER.Net
DHIS SUM:
([Antenatal client
HIV 1st test]) +
([Antenatal client
HIV re-test]) +
SUM([HIV test 19-59
months]) + SUM([HIV
test 5-14 years]) +
SUM([HIV test 15
years and older (excl
ANC)]
Number Quarterly None
Dependent
on the
accuracy of
facility
register
Higher
percentage
number
indicates an
increased
population,
knowing
their HIV
status.
HIV/AIDS
Managers
Male condoms
distributed
Male condoms
distributed from
a primary
distribution site
to health
facilities or
other points in
the community
e.g. during
campaigns, at
non-traditional
outlets, etc.
Monitors
distribution of
male condoms
for prevention
of HIV and
other STIs, and
for
contraceptive
purposes (dual
protection).
Stock/Bin
cards; Stats
SA
DHIS SUM:
([Male condoms
distributed])
Number Process Quarterly No None Higher
number
indicates
wide
distribution
as part of
the
prevention
of HIV, STIs
and
unwanted
pregnancy
(dual
protection).
HIV/AIDS
Cluster &
MC&WH
Managers

ANNUAL PERFORMANCE PLAN 2019/20 – 2020/21
INDICATOR DESCRIPTIONS
[TIDS] Page 21
Indicator Short Definition Purpose of
Indicator
Primary
Source
APP Source Method of
Calculation
Type Indicator
Type
Reporting
Cycle
New
indicator
Data
Limitations
Desired
Performance
Indicator
Responsibilit
y
Medical male
circumcision -
Total
Medical male
circumcisions
performed 10
15 years and
older.
Monitors
medical male
circumcisions
performed
under
supervision
Theatre
Register
PHC tick
register, DHIS
DHIS SUM:
([Medical male
circumcision 10 to 14
years + Medical
male circumcision 15
years and older])
Number Output Quarterly
(annualise
d)
No None
Assumed
that all
MMCs
reported on
DHIS are
conducted
under
supervision
Higher
number
indicates
greater
availability
of the
service or
greater
uptake of
the service
HIV/AIDS
Programme
Manager.
TB client 5 years
and older start
on treatment
rate
TB client 5 years
and older start
on treatment as
a proportion of
TB symptomatic
clients 5 years
older test
positive.
Monitors trends
in early
identification of
children with TB
symptoms in
health care
facilities
PHC
Comprehensi
ve tick
register & TB
Registers;
TIER.Net
DHIS Numerator:
SUM([TB client 5
years and older start
on treatment])
Denominator:
SUM([TB
symptomatic client 5
years and older
tested positive])
% Process /
activity
Quarterly
(cumulativ
e)
No None
Screening
will enable
early
identificatio
n of TB
suspect in
health
facilities
TB
Programme
Managers
TB client
treatment
success rate
TB clients
successfully
completed
treatment
(both cured
and treatment
completed) as
a proportion of
ALL TB clients
started on
treatment. This
applies to ALL
TB clients (New,
Retreatment,
Other,
pulmonary and
extra
pulmonary)
Monitors
success of TB
treatment for
ALL types of TB.
This follows a
cohort analysis
therefore the
clients would
have been
started on
treatment at
least 6 months
prior
TB Register;
ETR.Net
DHIS Numerator:
SUM([TB client
successfully
completed
treatment])
Denominator:
SUM([New smear
positive pulmonary
TB client start on
treatment])
% Outcome Quarterly No None Higher
percentage
indicates
suggests
better
treatment
outcomes.
TB
Programme
Manager

ANNUAL PERFORMANCE PLAN 2019/20 – 2020/21
INDICATOR DESCRIPTIONS
[TIDS] Page 22
Indicator Short Definition Purpose of
Indicator
Primary
Source
APP Source Method of
Calculation
Type Indicator
Type
Reporting
Cycle
New
indicator
Data
Limitations
Desired
Performance
Indicator
Responsibilit
y
TB client lost to
follow up rate
TB clients who
are lost to
follow up
(missed two
months or more
of treatment)
as a proportion
of TB clients
started on
treatment. This
applies to all TB
clients (New,
Retreatment,
Other,
Pulmonary and
Extra-
Pulmonary).
Monitors
effectiveness of
the retention in
care strategies.
This follows a
cohort analysis;
therefore
clients would
have been
started on
treatment at
least 6 months
prior.
TB Register;
ETR.Net
DHIS Numerator:
SUM [TB client lost to
follow up]
Denominator:
SUM [TB client start
on treatment]
% Outcome Quarterly No None Lower levels
of
interruption
reflect
improved
case
holding,
which is
important
for
facilitating
successful TB
treatment
TB
Programme
Manager
TB client death
rate
TB clients who
died during
treatment as a
proportion of TB
clients started
on treatment.
This applies to
ALL TB clients
(New,
Retreatment,
Other,
Pulmonary and
Extra
Pulmonary).
Monitors death
during TB
treatment
period. The
cause of death
may not
necessarily be
due to TB. This
follows a cohort
analysis
therefore the
clients would
have been
started on
treatment at
least 6 months
prior.
TB Register;
ETR.Net
DHIS Numerator:
SUM([TB client died
during treatment])
Denominator:
SUM([TB client start
on treatment])
% Outcome Annual No Accuracy
dependent
on quality of
data from
reporting
facility
Lower levels
of death
desired
TB
Programme
Manager
ANNUAL PERFORMANCE PLAN 2019/20 – 2020/21
INDICATOR DESCRIPTIONS
[TIDS] Page 23
Indicator Short Definition Purpose of
Indicator
Primary
Source
APP Source Method of
Calculation
Type Indicator
Type
Reporting
Cycle
New
indicator
Data
Limitations
Desired
Performance
Indicator
Responsibilit
y
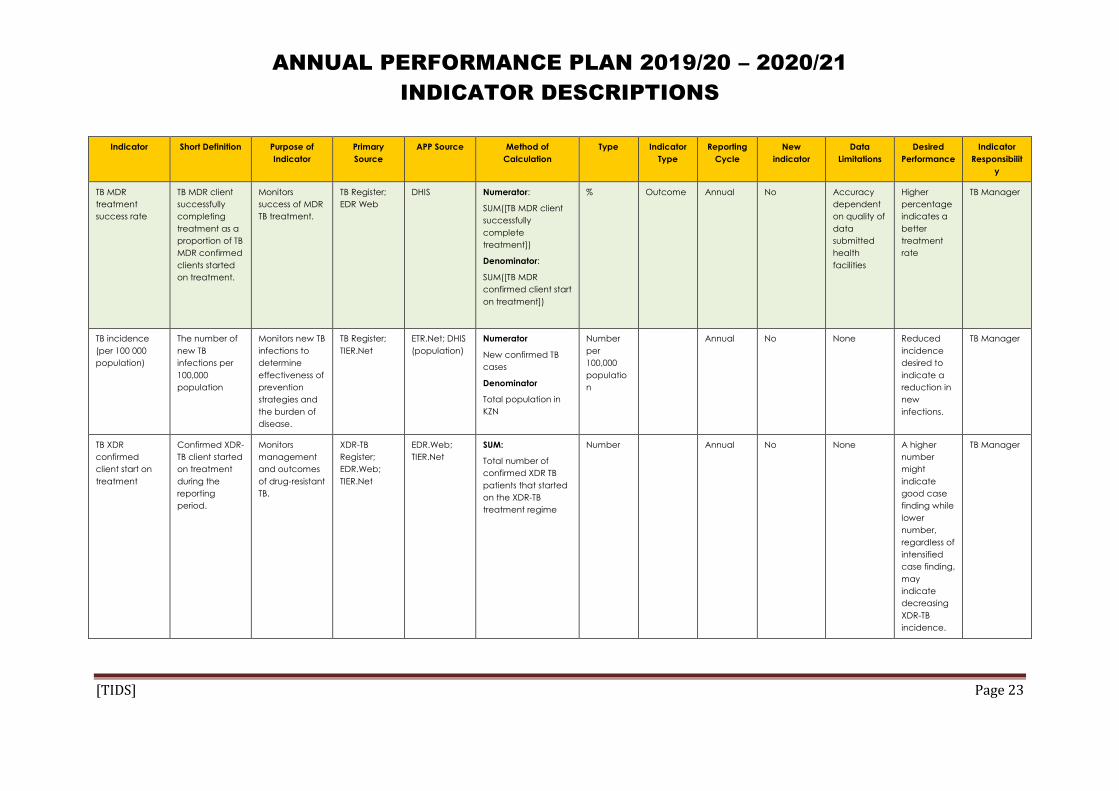
TB MDR
treatment
success rate
TB MDR client
successfully
completing
treatment as a
proportion of TB
MDR confirmed
clients started
on treatment.
Monitors
success of MDR
TB treatment.
TB Register;
EDR Web
DHIS Numerator:
SUM([TB MDR client
successfully
complete
treatment])
Denominator:
SUM([TB MDR
confirmed client start
on treatment])
% Outcome Annual No Accuracy
dependent
on quality of
data
submitted
health
facilities
Higher
percentage
indicates a
better
treatment
rate
TB Manager
TB incidence
(per 100 000
population)
The number of
new TB
infections per
100,000
population
Monitors new TB
infections to
determine
effectiveness of
prevention
strategies and
the burden of
disease.
TB Register;
TIER.Net
ETR.Net; DHIS
(population)
Numerator
New confirmed TB
cases
Denominator
Total population in
KZN
Number
per
100,000
populatio
n
Annual No None Reduced
incidence
desired to
indicate a
reduction in
new
infections.
TB Manager
TB XDR
confirmed
client start on
treatment
Confirmed XDR-
TB client started
on treatment
during the
reporting
period.
Monitors
management
and outcomes
of drug-resistant
TB.
XDR-TB
Register;
EDR.Web;
TIER.Net
EDR.Web;
TIER.Net
SUM:
Total number of
confirmed XDR TB
patients that started
on the XDR-TB
treatment regime
Number Annual No None A higher
number
might
indicate
good case
finding while
lower
number,
regardless of
intensified
case finding,
may
indicate
decreasing
XDR-TB
incidence.
TB Manager

ANNUAL PERFORMANCE PLAN 2019/20 – 2020/21
INDICATOR DESCRIPTIONS
[TIDS] Page 24
Indicator Short Definition Purpose of
Indicator
Primary
Source
APP Source Method of
Calculation
Type Indicator
Type
Reporting
Cycle
New
indicator
Data
Limitations
Desired
Performance
Indicator
Responsibilit
y
New smear
positive PTB
cure rate
New smear
positive
pulmonary TB
clients cured as
a proportion of
new smear
positive
pulmonary TB
clients who
started on
treatment.
Monitor cure of
new infectious
TB cases. The
aim is to
effectively treat
and cure all
new infectious
cases at first
attempt.
Follows a
cohort analysis,
therefore the
clients would
have been
started on
treatment at
least 6 months
prior.
TB Register;
ETR.Net;
TIER.Net
ETR.Net Numerator
SUM [(New smear
positive pulmonary
TB client cured)]
Denominator
SUM [(New smear
positive pulmonary
TB client start on
treatment)]
% Quarterly No None Higher
percentage
indicates
better TB
outcomes.
TB Manager
HIV incidence New HIV
infections in the
general
population.
Monitor new
infections as
part of
monitoring
impact of
prevention
strategies.
ASSA2008
projections
ASSA2008
projections
ASSA2008 published
projections (the
Department is not
collecting this
indicator –
dependent on
research and
projections)
% Annual No Not routinely
collected
therefore
using
ASSA2008 or
Stats SA
projections.
Reduced
incidence
indicating
effective
prevention
programmes
.
HIV/AIDS
Manager
Male urethritis
syndrome
incidence
New Indicator
Male urethritis
syndrome
cases reported
per 1000 male
population 15-
49 years.
Male urethritis
syndrome is the
most accurate
way to reflect
on newly
acquired STIs.
PHC Register DHIS Numerator
SUM [(Male urethritis
syndrome treated –
new episode)]
Denominator
SUM [(Male
population 15-49
years)]
Number
per 1000
Quarterly
(annualise
d)
No None Decrease in
male
urethritis
incidence
indicates
effective
prevention
programmes
and safer
sexual
behaviour.
HIV/AIDS
Manager

ANNUAL PERFORMANCE PLAN 2019/20 – 2020/21
INDICATOR DESCRIPTIONS
[TIDS] Page 25
Indicator Short Definition Purpose of
Indicator
Primary
Source
APP Source Method of
Calculation
Type Indicator
Type
Reporting
Cycle
New
indicator
Data
Limitations
Desired
Performance
Indicator
Responsibilit
y
ART adult
remain on ART
end of period
New Indicator
Total adults
remaining on
ART at the end
of the reporting
month are the
sum of:
Any adult who
has a current
regimen in the
column
designating the
month of
reporting.
Any adult who
has a star
without a circle
(not yet
considered lost
to follow up in
the month of
reporting.
To monitor the
burden of HIV
and treatment
programmes.
HIV registers;
TIER.Net
TIER.Net SUM:
SUM ([Adults (naïve
(including PEP &
PMTCT) +
Experienced +
Transfer in + Restart]
minus (Died + Lost to
follow up + Transfer
out])
Number Quarterly No None Increase in
number
shows
improved
access to
treatment.
HIV/AIDS
Manager

ANNUAL PERFORMANCE PLAN 2019/20 – 2020/21
INDICATOR DESCRIPTIONS
[TIDS] Page 26
Indicator Short Definition Purpose of
Indicator
Primary
Source
APP Source Method of
Calculation
Type Indicator
Type
Reporting
Cycle
New
indicator
Data
Limitations
Desired
Performance
Indicator
Responsibilit
y
ART child under
15 years remain
on ART end of
period
New Indicator
Total children
under 15 years
remaining on
ART at the end
of the reporting
month are the
sum of:
Any child under
15 who has a
current
regimen in the
column
designating the
month of
reporting.
Any child under
15 who has a
star without a
circle (not yet
considered lost
to follow up in
the month of
reporting.
To monitor the
burden of HIV
and treatment
programmes.
HIV registers;
TIER.Net
TIER.Net SUM:
SUM [Children under
15 (naïve (including
PEP & PMTCT) +
Experienced +
Transfer in + Restart]
minus (Died + Lost to
follow up + Transfer
out]
Number Quarterly No None Increase in
number
shows
improved
access to
treatment.
HIV/AIDS
Manager

ANNUAL PERFORMANCE PLAN 2019/20 – 2020/21
INDICATOR DESCRIPTIONS
[TIDS] Page 27
PROGRAMME 2: SUB-PROGRAMME MATERNAL, NEONATAL, CHILD & WOMEN’S HEALTH AND NUTRITION
Indicator Short Definition Purpose of
Indicator
Primary
Source
APP Source Method of
Calculation
Type Indicator
Type
Reporting
Cycle
New
Indicator
Data
Limitations
Desired
Performance
Indicator
Responsibilit
y
Antenatal 1st
visit before 20
weeks rate
Women who
have a booking
visit (first visit)
before they are
20 weeks into
their pregnancy
as proportion of
all antenatal 1st
visits.
Monitors early
utilisation of
antenatal
services.
PHC
Comprehensi
ve tick
Register
DHIS Numerator:
SUM([Antenatal 1st
visit before 20
weeks])
Denominator:
SUM([Antenatal 1st
visit 20 weeks or
later]) +
SUM([Antenatal 1st
visit before 20
weeks])
% Process Quarterly No Accuracy
dependent
on quality of
data
submitted
health
facilities
Higher
percentage
indicates
better
access to
and uptake
of antenatal
care.
MNCWH
Programme
Manager
Mother
postnatal visit
within 6 days
rate
Mothers who
received
postnatal care
within 6 days
after delivery as
proportion of
deliveries in
health facilities.
Monitors access
to and
utilisation of
postnatal
services. May
be more than
100% in areas
with low
delivery in
facility rates if
many mothers
who delivered
outside health
facilities used
postnatal visits
within 6 days
after delivery.
PHC
Comprehensi
ve tick
Register
DHIS Numerator:
SUM([Mother
postnatal visit within
6 days after
delivery])
Denominator:
SUM([Delivery in
facility total])
% Process Quarterly No Accuracy
dependent
on quality of
data
submitted
health
facilities
Higher
percentage
indicates
better
uptake of
postnatal
services
MC&WH
Manager
ANNUAL PERFORMANCE PLAN 2019/20 – 2020/21
INDICATOR DESCRIPTIONS
[TIDS] Page 28
Indicator Short Definition Purpose of
Indicator
Primary
Source
APP Source Method of
Calculation
Type Indicator
Type
Reporting
Cycle
New
Indicator
Data
Limitations
Desired
Performance
Indicator
Responsibilit
y
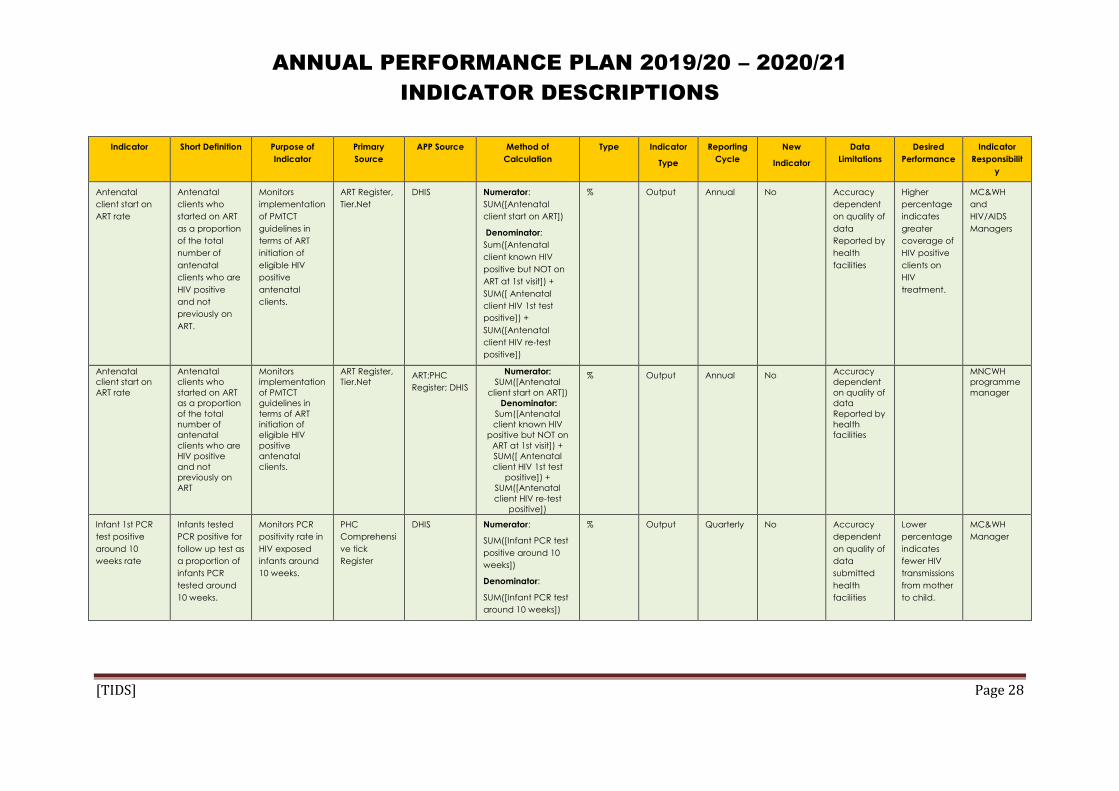
Antenatal
client start on
ART rate
Antenatal
clients who
started on ART
as a proportion
of the total
number of
antenatal
clients who are
HIV positive
and not
previously on
ART.
Monitors
implementation
of PMTCT
guidelines in
terms of ART
initiation of
eligible HIV
positive
antenatal
clients.
ART Register,
Tier.Net
DHIS Numerator:
SUM([Antenatal
client start on ART])
Denominator:
Sum([Antenatal
client known HIV
positive but NOT on
ART at 1st visit]) +
SUM([ Antenatal
client HIV 1st test
positive]) +
SUM([Antenatal
client HIV re-test
positive])
% Output Annual No Accuracy
dependent
on quality of
data
Reported by
health
facilities
Higher
percentage
indicates
greater
coverage of
HIV positive
clients on
HIV
treatment.
MC&WH
and
HIV/AIDS
Managers
Antenatal
client start on
ART rate
Antenatal
clients who
started on ART
as a proportion
of the total
number of
antenatal
clients who are
HIV positive
and not
previously on
ART
Monitors
implementation
of PMTCT
guidelines in
terms of ART
initiation of
eligible HIV
positive
antenatal
clients.
ART Register,
Tier.Net ART;PHC
Register; DHIS
Numerator:
SUM([Antenatal
client start on ART])
Denominator:
Sum([Antenatal
client known HIV
positive but NOT on
ART at 1st visit]) +
SUM([ Antenatal
client HIV 1st test
positive]) +
SUM([Antenatal
client HIV re-test
positive])
% Output Annual No Accuracy
dependent
on quality of
data
Reported by
health
facilities
MNCWH
programme
manager
Infant 1st PCR
test positive
around 10
weeks rate
Infants tested
PCR positive for
follow up test as
a proportion of
infants PCR
tested around
10 weeks.
Monitors PCR
positivity rate in
HIV exposed
infants around
10 weeks.
PHC
Comprehensi
ve tick
Register
DHIS Numerator:
SUM([Infant PCR test
positive around 10
weeks])
Denominator:
SUM([Infant PCR test
around 10 weeks])
% Output Quarterly No Accuracy
dependent
on quality of
data
submitted
health
facilities
Lower
percentage
indicates
fewer HIV
transmissions
from mother
to child.
MC&WH
Manager

ANNUAL PERFORMANCE PLAN 2019/20 – 2020/21
INDICATOR DESCRIPTIONS
[TIDS] Page 29
Indicator Short Definition Purpose of
Indicator
Primary
Source
APP Source Method of
Calculation
Type Indicator
Type
Reporting
Cycle
New
Indicator
Data
Limitations
Desired
Performance
Indicator
Responsibilit
y
Immunisation
under 1 year
coverage
Children under
1 year who
completed
their primary
course of
immunisation as
a proportion of
population
under 1 year.
Track coverage
of immunization
services.
PHC
Comprehensi
ve tick
Register
DHIS; Stats SA Numerator:
SUM([Immunised fully
under 1 year new])
Denominator:
SUM([Female under
1 year]) + SUM([Male
under 1 year])
% 0utput Quarterly
(annualise
d)
No None Higher
percentage
indicates
better
immunisatio
n coverage.
EPI
Programme
Manager
Measles 2nd
dose coverage
Children 1 year
(12 months)
who received
measles 2nd
dose, as a
proportion of
the 1 year
population.
Monitors
protection of
children against
measles.
Because the 1st
measles dose is
only around
85% effective
the 2nd dose is
important as a
booster.
Vaccines given
as part of mass
vaccination
campaigns
should not be
counted here.
PHC
Comprehensi
ve tick
Register
DHIS; Stats SA Numerator:
SUM([Measles 2nd
dose])
Denominator:
SUM([Female 1
year]) + SUM([Male 1
year])
% Output Quarterly
(annualise
d)
No Accuracy
dependent
on quality of
data
submitted
health
facilities
Higher
coverage
rate
indicate
greater
protection
against
measles
MC&WH
Manager
EPI
ANNUAL PERFORMANCE PLAN 2019/20 – 2020/21
INDICATOR DESCRIPTIONS
[TIDS] Page 30
Indicator Short Definition Purpose of
Indicator
Primary
Source
APP Source Method of
Calculation
Type Indicator
Type
Reporting
Cycle
New
Indicator
Data
Limitations
Desired
Performance
Indicator
Responsibilit
y
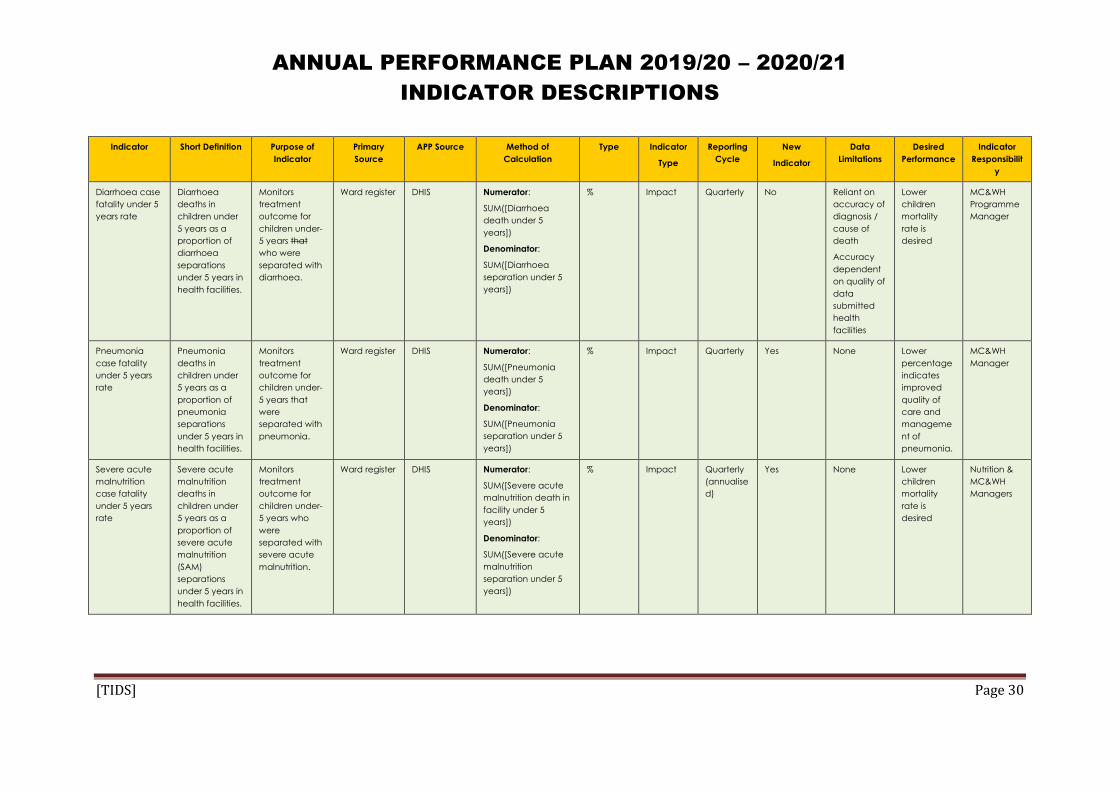
Diarrhoea case
fatality under 5
years rate
Diarrhoea
deaths in
children under
5 years as a
proportion of
diarrhoea
separations
under 5 years in
health facilities.
Monitors
treatment
outcome for
children under-
5 years that
who were
separated with
diarrhoea.
Ward register DHIS Numerator:
SUM([Diarrhoea
death under 5
years])
Denominator:
SUM([Diarrhoea
separation under 5
years])
% Impact Quarterly No Reliant on
accuracy of
diagnosis /
cause of
death
Accuracy
dependent
on quality of
data
submitted
health
facilities
Lower
children
mortality
rate is
desired
MC&WH
Programme
Manager
Pneumonia
case fatality
under 5 years
rate
Pneumonia
deaths in
children under
5 years as a
proportion of
pneumonia
separations
under 5 years in
health facilities.
Monitors
treatment
outcome for
children under-
5 years that
were
separated with
pneumonia.
Ward register DHIS Numerator:
SUM([Pneumonia
death under 5
years])
Denominator:
SUM([Pneumonia
separation under 5
years])
% Impact Quarterly Yes None Lower
percentage
indicates
improved
quality of
care and
manageme
nt of
pneumonia.
MC&WH
Manager
Severe acute
malnutrition
case fatality
under 5 years
rate
Severe acute
malnutrition
deaths in
children under
5 years as a
proportion of
severe acute
malnutrition
(SAM)
separations
under 5 years in
health facilities.
Monitors
treatment
outcome for
children under-
5 years who
were
separated with
severe acute
malnutrition.
Ward register DHIS Numerator:
SUM([Severe acute
malnutrition death in
facility under 5
years])
Denominator:
SUM([Severe acute
malnutrition
separation under 5
years])
% Impact Quarterly
(annualise
d)
Yes None Lower
children
mortality
rate is
desired
Nutrition &
MC&WH
Managers

ANNUAL PERFORMANCE PLAN 2019/20 – 2020/21
INDICATOR DESCRIPTIONS
[TIDS] Page 31
Indicator Short Definition Purpose of
Indicator
Primary
Source
APP Source Method of
Calculation
Type Indicator
Type
Reporting
Cycle
New
Indicator
Data
Limitations
Desired
Performance
Indicator
Responsibilit
y
School Grade 1
learners
screened
Grade 1 learner
in the school
screened by a
nurse in line
with the
Integrated
school Health
Programme
(ISHP) service
package.
Monitors
implementation
of the ISHP.1
School
Health
register
DHIS SUM:
[School Grade 1
learners screened]
No Process Quarterly
(annualise
d)
Yes None Increased
number
indicates
better
learner
coverage
and access
to health
services.
PHC &
MC&WH
Managers
School Grade 8
learners
screened
Grade 8 learner
in the school
screened by a
nurse in line
with the
Integrated
school Health
Programme
(ISHP) service
package.
Monitors
implementation
of the ISHP.2
School
Health
register
DHIS SUM:
[School Grade 8 -
learners screened]
No Process Quarterly
(annualise
d)
Yes None Increased
number
indicates
better
learner
coverage
and access
to health
services.
PHC &
MC&WH
Managers
Delivery in 10 to
19 years in
facility rate
New Indicator
Deliveries to
women under
the age of 20
years as
proportion of
total deliveries
in health
facilities
Monitors the
proportion of
deliveries in
facility by
teenagers
(young women
under 20 years).
Health
Facility
Delivery
register
DHIS Numerator:
SUM [Delivery 10–14
years in facility] +
[Delivery 15–19 years
in facility]
Denominator:
SUM([Delivery in
facility total])
% Process Quarterly
(annualise
d)
Yes None Lower
percentage
indicates
better family
planning
HIV &
Adolescent
Health
MC&WH
Manager
1 Screening includes: oral health, vision, hearing, speech, height & weight, physical assessment, mental health, TB, chronic illnesses & psychological support. On-site services include: deworming, immunisation, oral health, &
minor ailments. Health education: hand-washing, personal & environmental hygiene, nutrition, TB, road safety, poisoning, know your body and abuse
2 Screening includes the same package of services as Grade 1 – mentioned above

ANNUAL PERFORMANCE PLAN 2019/20 – 2020/21
INDICATOR DESCRIPTIONS
[TIDS] Page 32
Indicator Short Definition Purpose of
Indicator
Primary
Source
APP Source Method of
Calculation
Type Indicator
Type
Reporting
Cycle
New
Indicator
Data
Limitations
Desired
Performance
Indicator
Responsibilit
y
Couple year
protection rate
(Int)
Women
protected
against
pregnancy by
using modern
contraceptive
methods,
including
sterilisations, as
proportion of
female
population 15-
49 year. Couple
year protection
are the total of
(Oral pill cycles
/ 15) +
(Medroxyproge
sterone
injection / 4) +
(Norethisterone
enanthate
injection / 6) +
(IUCD x 4.5) +
(Sub dermal
implant x 2.5) +
Male condoms
distributed /
120) + (Female
condoms
distributed /
120) + (Male
sterilisation x 10)
+ (Female
sterilisation x
10).
Monitors access
to and
utilisation of
modern
contraceptives
to prevent
unplanned
pregnancies.
Serves as proxy
for the indicator
contraceptive
prevalence
rate by
monitoring
trends between
official surveys.
PHC
Comprehensi
ve Tick
Register;
Stats SA
DHIS; Stats SA Numerator
(SUM([Oral pill
cycle]) / 15) +
(SUM([Medroxyprog
esterone injection]) /
4) +
(SUM([Norethisterone
enanthate injection])
/ 6) + (SUM([IUCD
inserted]) * 4.5) +
(SUM([Male
condoms
distributed]) / 120) +
(SUM([Sterilisation -
male]) * 10) +
(SUM([Sterilisation -
female]) * 10) +
(SUM([Female
condoms
distributed]) / 120) +
(SUM([Sub-dermal
implant inserted]) *
2.5)
Denominator:
SUM ([Female 15-44
years]} +
SUM{[Female 45-49
years])
% Outcome Annual
Quarterly
No None
Accuracy
dependent
on quality of
data
submitted
health
facilities
Higher
percentage
indicates
higher
usage of
contracepti
ve methods.
MC&WH&N
Programme
Manager,

ANNUAL PERFORMANCE PLAN 2019/20 – 2020/21
INDICATOR DESCRIPTIONS
[TIDS] Page 33
Indicator Short Definition Purpose of
Indicator
Primary
Source
APP Source Method of
Calculation
Type Indicator
Type
Reporting
Cycle
New
Indicator
Data
Limitations
Desired
Performance
Indicator
Responsibilit
y
Cervical
cancer
screening
coverage 30
years and older
Cervical smears
in women 30
years and older
as a proportion
of 10% of the
female
population 30
years and
older.
Monitors
implementation
of the Cervical
Cancer
Screening and
Policy.
PHC
Comprehensi
ve Tick
Register /
OPD Tick
Registers;
Stats SA
DHIS; Stats SA Numerator:
SUM([Cervical
cancer screening 30
years and older])
Denominator:
SUM([Female 30-34
years]) +
SUM([Female 35-39
years]) +
SUM([Female 40-44
years]) +
SUM([Female 45
years and older]) /
10
% Output Annual No Reliant on
population
estimates
from StatsSA,
and
Accuracy
dependent
on quality of
data
submitted
health
facilities
Higher
percentage
indicates
better
cervical
cancer
coverage.
MNC&WH
Programme
Manager
HPV 1st dose
Girls 9 years
and older that
received HPV
1st dose.
This indicator
will provide
overall yearly
coverage
value which will
aggregate as
the campaign
progress and
reflect the
coverage so far
HPV
Campaign
Register –
captured
electronically
on HPV
system
DHIS SUM:
([Agg_Girl 09 yrs HPV
1st dose]) +
SUM([Agg_Girl 10 yrs
HPV 1st dose]) +
SUM([Agg_Girl 11 yrs
HPV 1st dose]) +
SUM([Agg_Girl 12 yrs
HPV 1st dose]) +
SUM([Agg_Girl 13 yrs
HPV 1st dose]) +
SUM([Agg_Girl 14 yrs
HPV 1st dose]) +
SUM([Agg_Girl 15 yrs
and older HPV 1st
dose])
No Output Annual No None Higher
number
indicates
better
coverage.
PHC &
MNCWH
Programme
Managers

ANNUAL PERFORMANCE PLAN 2019/20 – 2020/21
INDICATOR DESCRIPTIONS
[TIDS] Page 34
Indicator Short Definition Purpose of
Indicator
Primary
Source
APP Source Method of
Calculation
Type Indicator
Type
Reporting
Cycle
New
Indicator
Data
Limitations
Desired
Performance
Indicator
Responsibilit
y
HPV 2nd dose
New Indicator
Girls 9 years
and older that
received HPV
2nd dose.
This indicator
will provide
overall yearly
coverage
value which will
aggregate as
the campaign
progress and
reflect the
coverage so far
HPV
Campaign
Register –
captured
electronically
on HPV
system
DHIS SUM:
([Agg_Girl 09 yrs HPV
2nd dose]) +
SUM([Agg_Girl 10 yrs
HPV 2nd dose]) +
SUM([Agg_Girl 11 yrs
HPV 2nd dose]) +
SUM([Agg_Girl 12 yrs
HPV 2nd dose]) +
SUM([Agg_Girl 13 yrs
HPV 2nd dose]) +
SUM([Agg_Girl 14 yrs
HPV 2nd dose]) +
SUM([Agg_Girl 15 yrs
and older HPV 2nd
dose])
No Output Annual No None Higher
number
indicates
better
coverage.
PHC &
MNCWH
Programme
Managers
Vitamin A dose
12-59 months
coverage
Children 12-59
months who
received
Vitamin A
200,000 units,
every six
months as a
proportion of
population 12-
59 months.
Monitors
Vitamin A
supplementatio
n to children
aged 12-59
months. The
denominator is
multiplied by 2
because each
child should
receive
supplementatio
n twice a year.
PHC
Comprehensi
ve Tick
Register;
Stats SA
DHIS Numerator:
SUM([Vitamin A dose
12-59 months])
Denominator:
(SUM([Female 1
year]) +
SUM([Female 02-04
years]) + SUM([Male
1 year]) + SUM([Male
02-04 years])) * 2
% Output Quarterly No PHC register
is not
designed to
collect
longitudinal
record of
patients. The
assumption
is the that
the
calculation
proportion
of children
would have
received
two doses
based on
this
calculation
Higher
proportion
of children
12-29
months who
received Vit
A will
increase
health
MNCWH
Programme
Manager
Nutrition
Manager

ANNUAL PERFORMANCE PLAN 2019/20 – 2020/21
INDICATOR DESCRIPTIONS
[TIDS] Page 35
Indicator Short Definition Purpose of
Indicator
Primary
Source
APP Source Method of
Calculation
Type Indicator
Type
Reporting
Cycle
New
Indicator
Data
Limitations
Desired
Performance
Indicator
Responsibilit
y
Maternal
mortality in
facility ratio
Maternal death
is death
occurring
during
pregnancy,
childbirth and
the puerperium
of a woman
while pregnant
or within 42
days of
termination of
pregnancy,
irrespective of
the duration
and site of
pregnancy and
irrespective of
the cause of
death
(obstetric and
non-obstetric)
per 100,000 live
births in facility.
This is a proxy
for the
population-
based maternal
mortality ratio,
aimed at
monitoring
trends in health
facilities
between
official surveys.
Focuses on
obstetric
causes (around
30% of all
maternal
mortality).
Provides
indication of
health system
results in terms
of prevention of
unplanned
pregnancies,
antenatal care,
delivery and
postnatal
services.
Maternal
death
register,
Delivery
Register
DHIS Numerator:
SUM([Maternal
death in facility])
Denominator:
SUM([Live birth in
facility])+SUM([ Born
alive before arrival
at facility])
Number
per 100
000
Impact Annual No Completene
ss of
reporting
Lower
maternal
mortality
ratio in
facilities
indicate on
better
obstetric
manageme
nt practices
and
antenatal
care
MNCWH
Programme
Manager
Neonatal
death in facility
rate
Neonatal 0-28
days who died
during their stay
in the facility as
a proportion of
live births in
facility.
Monitors
treatment and
health
outcome for
neonates’
under-28 days.
Delivery
register;
Midnight
report; death
register
DHIS Numerator:
SUM([Inpatient
death 0-7 days]) +
SUM([Inpatient
death 8-28 days])
Denominator:
SUM([Live birth in
facility])
Number
per 1000
populatio
n
Impact Annual No None Lower death
rate
required.
MNCWH
Manager

ANNUAL PERFORMANCE PLAN 2019/20 – 2020/21
INDICATOR DESCRIPTIONS
[TIDS] Page 36
Indicator Short Definition Purpose of
Indicator
Primary
Source
APP Source Method of
Calculation
Type Indicator
Type
Reporting
Cycle
New
Indicator
Data
Limitations
Desired
Performance
Indicator
Responsibilit
y
Infant mortality
rate
Proportion of
children less
than 1 year old
that died in one
year per 1000
population
under 1-years.
Monitor trends
in infant
mortality.
Stats SA and
Rapid
Mortality
Surveillance
(RMS) from
2012
onwards
Stats SA and
RMS from
2012
onwards
Numerator
Children less than 1
year that die in one
year in the province
Denominator
Total population
under 1 year
Estimates from Stats
SA and Rapid
Mortality Surveillance
as the Department is
not routinely
monitoring this
population-based
indicator
Number
per 1000
populatio
n
Impact Annual No Empirical
population-
based data
are not
frequently
available –
reporting
estimates.
Lower
mortality
rate desired.
MNCWH
Manager
Under 5
mortality rate
Proportion of
children less
than five years
old that died in
one year per
1000
population
under 5 years.
Monitor trends
in under-5
mortality.
Stats SA and
Rapid
Mortality
Surveillance
(RMS) from
2012
onwards
Stats SA and
RMS from
2012
onwards
Numerator
Children less than
five years that die in
one year in the
province
Denominator
Total population
under 5 years
Estimates from Stats
SA and Rapid
Mortality Surveillance
as the Department is
not routinely
monitoring this
population-based
indicator
Number
per 1000
populatio
n
Impact Annual No Empirical
population-
based data
are not
frequently
available –
reporting
estimates.
Lower
mortality
rate desired.
MNCWH
Manager

ANNUAL PERFORMANCE PLAN 2019/20 – 2020/21
INDICATOR DESCRIPTIONS
[TIDS] Page 37
Indicator Short Definition Purpose of
Indicator
Primary
Source
APP Source Method of
Calculation
Type Indicator
Type
Reporting
Cycle
New
Indicator
Data
Limitations
Desired
Performance
Indicator
Responsibilit
y
Diarrhoea with
dehydration in
child under 5
years incidence
(annualised)
Children under
5 years newly
diagnosed with
diarrhoea with
dehydration
per 1000
children under-
5 years in the
population.
Monitors
prevention of
diarrhoea with
dehydration
(IMCI
classification) in
children under-
5 years. Count
only once
when
diagnosed.
Follow-up visits
for the same
episode of
diarrhoea will
not be counted
here.
PHC register;
DHIS; Stats SA
DHIS; Stats SA Numerator
SUM([Child under 5
years diarrhoea with
dehydration new])
Denominator
SUM([Female under
5 years]) + ([Male
under 5 years])
Number
per 1000
Annual No None Lower
incidence
desired
indicating
improved
child health.
MC&WH
Manager
Pneumonia in
child under 5
years incidence
(annualised)
Children under
5 years newly
diagnosed with
pneumonia per
1000 children
under-5 years in
the population.
Monitor
prevention and
diagnosis of
pneumonia
(IMCI definition)
in children
under-5 years.
Count only
once when
diagnosed.
Follow-up visits
for the same
episode of
pneumonia will
not be counted
here.
PHC register;
DHIS; Stats SA
DHIS; Stats SA Numerator
SUM([Child under 5
years with
pneumonia new])
Denominator
SUM([Female under
5 years]) + ([Male
under 5 years])
Number
per 1000
Annual No None Lower
incidence
desired
indicating
improved
child health.
MC&WH
Manager

ANNUAL PERFORMANCE PLAN 2019/20 – 2020/21
INDICATOR DESCRIPTIONS
[TIDS] Page 38
Indicator Short Definition Purpose of
Indicator
Primary
Source
APP Source Method of
Calculation
Type Indicator
Type
Reporting
Cycle
New
Indicator
Data
Limitations
Desired
Performance
Indicator
Responsibilit
y
Sever acute
malnutrition in
child under 5
incidence
(annualised)
Children under
5 years newly
diagnosed with
severe acute
malnutrition per
1000 children
under-5 years in
the population.
Monitors
prevention and
diagnosis of
severe acute
malnutrition in
children under-
5 years. Count
only once
when
diagnosed.
Follow-up visits
for the same
episode of
malnutrition will
not be counted
here.
PHC register;
DHIS; Stats Sa
DHIS; Stats SA Numerator
SUM([Child under 5
years with severe
acute malnutrition
new])
Denominator
SUM([Female under
5 years]) + ([Male
under 5 years])
Number
per 1000
Annual No None Lower
incidence
desired
indicating
improved
child health.
Nutrition &
MCWH
Managers
Death in facility
under 1 year
rate
(annualised)
Children under
1 year who
died during
their stay in the
facility as a
proportion of
inpatient
separations
under 1 year.
Inpatient
separations
under- year is
the total of
inpatient
discharges,
inpatient
deaths and
inpatient
transfers out.
Monitors
treatment
outcomes for
admitted
children under-
1 year.
Includes
neonatal
deaths.
Midnight
census;
Admission,
Discharge &
Death
registers
DHIS; Stats SA Numerator
SUM([Death in
facility under 1 year
total])
Denominator
SUM([Death in
facility 0-7 days]) +
SUM([Death in
facility 8-28 days]) +
SUM([Death in
facility 29 days-11
months]) +
SUM([Inpatient
discharge under 1
year]) +
SUM([Inpatient
transfer out under 1
year])
% Annual None
Lower rate
desired –
fewer
children
under-1 year
dying in
public
health
facilities.
MNCWH
Manager

ANNUAL PERFORMANCE PLAN 2019/20 – 2020/21
INDICATOR DESCRIPTIONS
[TIDS] Page 39
Indicator Short Definition Purpose of
Indicator
Primary
Source
APP Source Method of
Calculation
Type Indicator
Type
Reporting
Cycle
New
Indicator
Data
Limitations
Desired
Performance
Indicator
Responsibilit
y
Death in facility
under 5 years
rate
(annualised)
Children under
5 years who
died during
their stay in the
facility as a
proportion of
inpatient
separations
under 5 years.
Inpatient
separations
under 5 years is
the total of
inpatient
discharges,
inpatient
deaths and
inpatient
transfers out.
Monitors
treatment
outcome for
admitted
children under-
5 years.
Includes under
1 year deaths.
Midnight
census;
Admission,
Discharge &
Death
registers
DHIS; Stats SA Numerator
SUM([Death in
facility under 5 year
total])
Denominator
SUM([Death in
facility 0-7 days]) +
SUM([Death in
facility 8-28 days]) +
SUM([Death in
facility 29 days-11
months]) +
SUM([Death in
facility 12-59
months]) +
SUM([Inpatient
discharge under 5
years]) + ([Inpatient
transfers out under 5
years])
% Impact Annual No None Lower rate
desired –
fewer
children
under-5
years dying
in public
health
facilities.
MNCWH
Manager
PROGRAMME 2: SUB-PROGRAMME DISEASE PREVENTION AND CONTROL
Indicator Short Definition Purpose of
Indicator
Primary Source APP Source Method of Calculation Type Reporting
Cycle
Data
Limitations
Desired
Performance
Indicator
Responsibility
Cataract surgery
rate (annualised)
Clients who had
cataract surgery
per 1 million
uninsured
populations.
Monitors access to
cataract surgery
(theatres & human
resources) and
prevention of
disability as result
of blindness.
Theatre register;
General
Household
Survey
DHIS Numerator
SUM([cataract surgery
total])
Denominator
SUM([Total population])
minus SUM([Total
population on Medical
AIDS])
Number per
1 million
uninsured
population
Quarterly
(annualised)
None Increased rate
indicates
improved
access to
cataract
services and
prevention of
blindness.
Chronic
Diseases
Manager

ANNUAL PERFORMANCE PLAN 2019/20 – 2020/21
INDICATOR DESCRIPTIONS
[TIDS] Page 40
Indicator Short Definition Purpose of
Indicator
Primary Source APP Source Method of Calculation Type Reporting
Cycle
Data
Limitations
Desired
Performance
Indicator
Responsibility
Malaria case
fatality rate
Deaths from
malaria as a
proportion of the
number of malaria
cases reported.
Monitors the
number of deaths
caused by
malaria.
Malaria
database
Malaria
database
Numerator
SUM([Number of
deaths from malaria])
Denominator
SUM([Total number of
malaria cases
reported])
% Quarterly None Lower
percentage
indicates a
decreasing
burden of
malaria and
improved
management
of malaria
cases.
Malaria
Control
Manager
Malaria incidence
per 1 000
population at risk
New malaria cases
as proportion of
1000 population at
risk (high-risk
malaria areas
(Umkhanyakude)
based on malaria
cases.
Monitors the new
malaria cases in
endemic areas as
proportion of the
population at risk
in that area.
PHC register;
CDC
Surveillance
database;
Malaria
database; Stats
SA; GHS
Malaria
database
Numerator
SUM([Number of
malaria cases – new])
Denominator
SUM([Total population
of Umkhanyakude
District])
Number per
1000
population
at risk
Annual None Lower
incidence
desired –
improved
prevention
towards
elimination of
malaria.
Malaria
Control
Manager
Clients 40 years
and older
screened for
hypertension
Clients 40 years
and older, not
diagnosed with or
on treatment for
hypertension,
screened for
hypertension in the
facility.
This should assist
with increasing the
number of clients
detected and
referred for
treatment.
PHC & OPD
registers
DHIS SUM:
SUM([Client 40 years
and older not
diagnosed with
hypertension and not
on hypertension
treatment screened for
hypertension])
Number Quarterly None Increased
screening
indicates
improved
detection of
clients with
hypertension.
Chronic
Diseases
Managers

ANNUAL PERFORMANCE PLAN 2019/20 – 2020/21
INDICATOR DESCRIPTIONS
[TIDS] Page 41
Indicator Short Definition Purpose of
Indicator
Primary Source APP Source Method of Calculation Type Reporting
Cycle
Data
Limitations
Desired
Performance
Indicator
Responsibility
Hypertension
incidence
(annualised)
Newly diagnosed
hypertension
cases initiated on
treatment per
1000 population 40
years and older.
The number of
hypertension
clients under 40
years is very small
hence monitoring
population 40
years and older as
the main risk
group.
Monitors
hypertension
trends to inform
preventative
strategies.
PHC & OPD
registers; Stats
SA
DHIS Numerator
SUM([Hypertension
client 40 years and
older treatment new])
Denominator
SUM([Total population
40 years and older])
Number per
1000
population
Quarterly
(annualised)
None Lower
incidence
desired –
improved
prevention and
management
of hypertensive
patients.
Chronic
Diseases
Manager
Clients 40 years
and older
screened for
diabetes
Clients 40 years
and older, not on
treatment for
diabetes,
screened for
diabetes in the
facility according
to diabetes
Treatment
Guidelines.
This should assist
with increasing the
number of people
detected and
referred for
treatment for
diabetes.
PHC & OPD
registers
DHIS SUM:
SUM([Client 40 years
and older not on
treatment for diabetes
screened for diabetes])
Number Quarterly None Increased
screening
indicates
improved
detection of
clients with
diabetes.
Chronic
Diseases
Manager
Diabetes
Incidence
(annualised)
Newly diagnosed
diabetes clients
initiated on
treatment per
1000 population.
Monitors diabetes
trends to inform
preventative
strategies.
PHC & OPD
registers; Stats
SA
DHIS Numerator
SUM([Diabetes clients
treatment - new])
Denominator
SUM([Total population])
Number per
1000
population
Quarterly
(annualised)
None Lower
incidence
desired –
improved
prevention and
management
of diabetic
patients.
Chronic
Diseases
Manager

ANNUAL PERFORMANCE PLAN 2019/20 – 2020/21
INDICATOR DESCRIPTIONS
[TIDS] Page 42
Indicator Short Definition Purpose of
Indicator
Primary Source APP Source Method of Calculation Type Reporting
Cycle
Data
Limitations
Desired
Performance
Indicator
Responsibility
Mental disorders
screening rate
New Indicator
Clients screened
for mental
disorders
(depression,
anxiety, dementia,
psychosis, mania,
suicide,
developmental
disorders,
behavioural
disorders and
substance use
disorders) at PHC
facilities.
Monitors access
and quality of
mental health
services in PHC
facilities.
PHC register DHIS Numerator:
SUM([PHC client
screened for mental
disorders])
Denominator:
SUM([PHC headcount
under 5 years]) +
SUM([PHC headcount 5
years and older])
% Quarterly None Increased
screening
numbers
indicates
improved
detection of
mental
disorders.
Mental Health
Manager
Dental extraction
to restoration ratio
The ratio between
the number of
teeth extracted
and the number of
teeth restored by
a health worker
(includes the
actual number of
teeth extracted or
restored and not
the number of
patients – includes
PHC and hospital
data).
Monitors overall
quality of dental
services. Poor
quality dental
services if many
extractions and
few restorations
are reflected
(acceptable ratio
is 10:1).
PHC & OPD
registers;
Theatre registers
DHIS Numerator
SUM([Tooth extraction])
Denominator
SUM([Tooth
restoration])
Number Quarterly None Decreased
ratio indicates
improvement
in dental
health services
(lower ratio
indicates
improved
management).
Oral Health
Manager
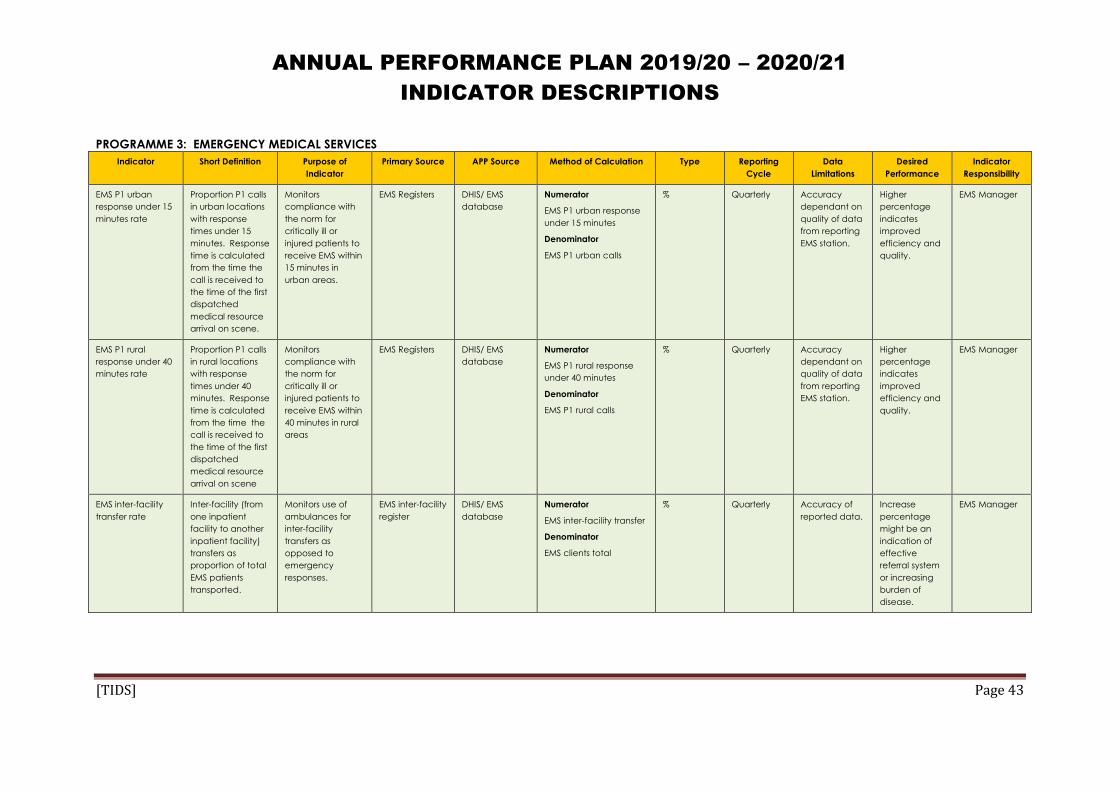
ANNUAL PERFORMANCE PLAN 2019/20 – 2020/21
INDICATOR DESCRIPTIONS
[TIDS] Page 43
PROGRAMME 3: EMERGENCY MEDICAL SERVICES
Indicator Short Definition Purpose of
Indicator
Primary Source APP Source Method of Calculation Type Reporting
Cycle
Data
Limitations
Desired
Performance
Indicator
Responsibility
EMS P1 urban
response under 15
minutes rate
Proportion P1 calls
in urban locations
with response
times under 15
minutes. Response
time is calculated
from the time the
call is received to
the time of the first
dispatched
medical resource
arrival on scene.
Monitors
compliance with
the norm for
critically ill or
injured patients to
receive EMS within
15 minutes in
urban areas.
EMS Registers DHIS/ EMS
database
Numerator
EMS P1 urban response
under 15 minutes
Denominator
EMS P1 urban calls
% Quarterly Accuracy
dependant on
quality of data
from reporting
EMS station.
Higher
percentage
indicates
improved
efficiency and
quality.
EMS Manager
EMS P1 rural
response under 40
minutes rate
Proportion P1 calls
in rural locations
with response
times under 40
minutes. Response
time is calculated
from the time the
call is received to
the time of the first
dispatched
medical resource
arrival on scene
Monitors
compliance with
the norm for
critically ill or
injured patients to
receive EMS within
40 minutes in rural
areas
EMS Registers DHIS/ EMS
database
Numerator
EMS P1 rural response
under 40 minutes
Denominator
EMS P1 rural calls
% Quarterly Accuracy
dependant on
quality of data
from reporting
EMS station.
Higher
percentage
indicates
improved
efficiency and
quality.
EMS Manager
EMS inter-facility
transfer rate
Inter-facility (from
one inpatient
facility to another
inpatient facility)
transfers as
proportion of total
EMS patients
transported.
Monitors use of
ambulances for
inter-facility
transfers as
opposed to
emergency
responses.
EMS inter-facility
register
DHIS/ EMS
database
Numerator
EMS inter-facility transfer
Denominator
EMS clients total
% Quarterly Accuracy of
reported data.
Increase
percentage
might be an
indication of
effective
referral system
or increasing
burden of
disease.
EMS Manager
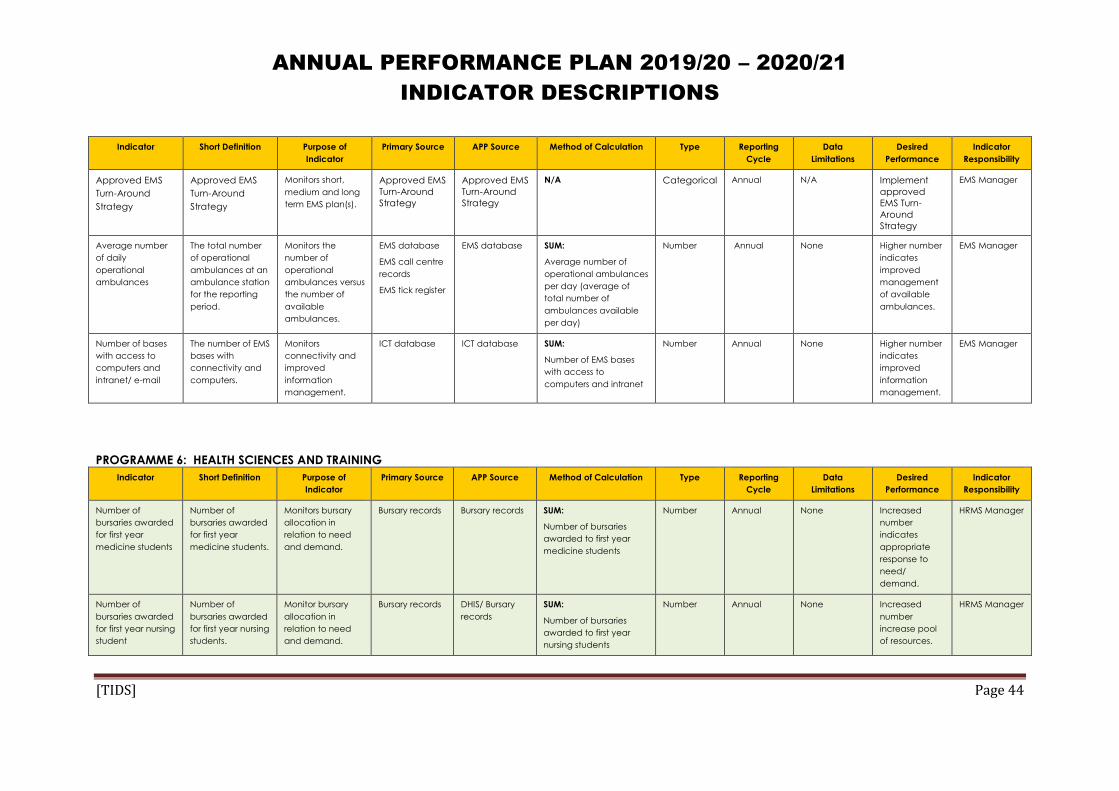
ANNUAL PERFORMANCE PLAN 2019/20 – 2020/21
INDICATOR DESCRIPTIONS
[TIDS] Page 44
Indicator Short Definition Purpose of
Indicator
Primary Source APP Source Method of Calculation Type Reporting
Cycle
Data
Limitations
Desired
Performance
Indicator
Responsibility
Approved EMS
Turn-Around
Strategy
Approved EMS
Turn-Around
Strategy
Monitors short,
medium and long
term EMS plan(s).
Approved EMS
Turn-Around
Strategy
Approved EMS
Turn-Around
Strategy
N/A Categorical Annual N/A Implement
approved
EMS Turn-
Around
Strategy
EMS Manager
Average number
of daily
operational
ambulances
The total number
of operational
ambulances at an
ambulance station
for the reporting
period.
Monitors the
number of
operational
ambulances versus
the number of
available
ambulances.
EMS database
EMS call centre
records
EMS tick register
EMS database SUM:
Average number of
operational ambulances
per day (average of
total number of
ambulances available
per day)
Number Annual None Higher number
indicates
improved
management
of available
ambulances.
EMS Manager
Number of bases
with access to
computers and
intranet/ e-mail
The number of EMS
bases with
connectivity and
computers.
Monitors
connectivity and
improved
information
management.
ICT database ICT database SUM:
Number of EMS bases
with access to
computers and intranet
Number Annual None Higher number
indicates
improved
information
management.
EMS Manager
PROGRAMME 6: HEALTH SCIENCES AND TRAINING
Indicator Short Definition Purpose of
Indicator
Primary Source APP Source Method of Calculation Type Reporting
Cycle
Data
Limitations
Desired
Performance
Indicator
Responsibility
Number of
bursaries awarded
for first year
medicine students
Number of
bursaries awarded
for first year
medicine students.
Monitors bursary
allocation in
relation to need
and demand.
Bursary records Bursary records SUM:
Number of bursaries
awarded to first year
medicine students
Number Annual None Increased
number
indicates
appropriate
response to
need/
demand.
HRMS Manager
Number of
bursaries awarded
for first year nursing
student
Number of
bursaries awarded
for first year nursing
students.
Monitor bursary
allocation in
relation to need
and demand.
Bursary records DHIS/ Bursary
records
SUM:
Number of bursaries
awarded to first year
nursing students
Number Annual None Increased
number
increase pool
of resources.
HRMS Manager

ANNUAL PERFORMANCE PLAN 2019/20 – 2020/21
INDICATOR DESCRIPTIONS
[TIDS] Page 45
Indicator Short Definition Purpose of
Indicator
Primary Source APP Source Method of Calculation Type Reporting
Cycle
Data
Limitations
Desired
Performance
Indicator
Responsibility
KZNCN accredited
as Institution of
Higher Education
KZNCN accredited
by external
Accreditation
Body as compliant
to standards for
Institution of Higher
Education.
Monitors
compliance with
Regulations.
Accreditation
certificate
Accreditation
certificate
N/A Categorical Annual None KZNCN
accredited.
KZNCN
Principal
Number of
advanced
midwifes
graduating per
annum
Number of
students that
obtained a post
basic nursing
qualification in
Advanced
Midwifery.
Monitors
production of
Advanced
Midwifes
Student
registration
KZNCN student
records
SUM:
Number of Advanced
Midwife graduates per
annum
Number Annual None Increased
number implies
increased
human
resources for
health.
KZNCN
Principal
Number of MOPs
that successfully
completed the
degree course at
DUT
Medical Orthotic
and Prosthetic
(MOP) students
that completed
the prescribed
training course
successfully.
Monitors pool of
resources.
Qualification Training register
– Qualification
SUM:
Number of MOP students
successfully completed
the prescribed training
course at Institution of
Higher Education
Number Annual None Increase in
students who
completed
course
indicate
increased in
resource pool.
Orthotic and
Prosthetic
Manager
Number of new
mid-level workers
enrolled in
training courses
per category
Number of new
mid-level workers
enrolled in
training courses
per category
Monitors human
resources for
health.
HRD Training
Records
HRD Training
Records
SUM:
Number of new mid-
level workers enrolled
in training courses per
category
Number Annual None Improved
human
resources for
health.
Pharmacy
Manager
Number of new
Clinical Associates
enrolled in training
courses
The number of
Clinical Associate
students enrolled
for training.
Monitors human
resources for
health.
HRD Training
Records
HRD Training
Records
SUM:
Number of Clinical
Associates enrolled in
training courses
Number Annual Dependent on
reporting of
students
Improved
human
resources for
health
HRMS Manager
Number of
Intermediate Life
Support
graduates per
annum
Number of
Intermediate Life
Support
graduates per
annum
Monitors human
resources for
health.
HRD Training
Records
HRD Training
Records
SUM:
Number of
Intermediate Life
Support graduates per
annum
Number Annual Dependent on
reporting of
students
Improved
human
resources for
health
EMS Manager

ANNUAL PERFORMANCE PLAN 2019/20 – 2020/21
INDICATOR DESCRIPTIONS
[TIDS] Page 46
PROGRAMME 7: HEALTH CARE SUPPORT SERVICES
Indicator Short Definition Purpose of
Indicator
Primary Source APP Source Method of Calculation Type Reporting
Cycle
Data
Limitations
Desired
Performance
Indicator
Responsibility
Percentage of
facilities reporting
clean linen stock
outs
The number of
facilities reporting
clean linen stock
outs as proportion
of the total
number of
facilities.
Monitors
availability of
clean linen at
facility level.
Linen register at
facility level
Provincial
Laundry Reports
Numerator
Number of facilities
reporting clean linen
stock out
Denominator
Facilities total
% Quarterly Accuracy of
reporting at
facility level
and lack of
appropriate
data
information
system for
laundry
services.
Lower
percentage
indicates
improved
availability and
management
of linen.
Laundry
Manager
Forensic Pathology
Rationalisation
Plan
Long term plan
making provision
for rationalisation
of existing
mortuaries and
services to
improve efficiency
and cost benefit.
The plan will make
provision for a
detailed
Implementation
Plan including
allocation of
relevant resources.
Monitors
efficiencies and
cost benefit.
Rationalisation
Plan
FPS Reports/
Infrastructure
Reports
N/A Categorical Annual None Rationalisation
Plan approved
and
implemented.
Forensic
Pathology
Service
Manager
Number of
operational
Orthotic Centres
(cumulative)
Orthotic centres
providing the
package of
services for
Orthotic and
Prosthetic services.
Monitors access to
Orthotic and
Prosthetic services.
Orthotic Centre
data
Orthotic and
Prosthetic
database
SUM:
Number of Orthotic
Centres providing the
basic package of
services
Number
(cumulative)
Annual None Decentralised
access to the
complete
package of
services.
Orthotic and
Prosthetic
Manager
Percentage of
Pharmacies that
obtained A and B
grading on
inspection
The number of
Pharmacies that
comply with
Pharmaceutical
prescripts on
inspection as
Tracks compliance
with
Pharmaceutical
prescripts.
Certificates Certificates Numerator
Number of Pharmacies
with A or B grading
Denominator
Number of Pharmacies
% Annual None Improved
compliance
will improve
quality and
efficiency of
Pharmaceutic
Pharmacy
Manager

ANNUAL PERFORMANCE PLAN 2019/20 – 2020/21
INDICATOR DESCRIPTIONS
[TIDS] Page 47
Indicator Short Definition Purpose of
Indicator
Primary Source APP Source Method of Calculation Type Reporting
Cycle
Data
Limitations
Desired
Performance
Indicator
Responsibility
proportion of the
total number of
pharmacies.
al services.
Tracer medicine
stock-out rate
(PPSD)
Number of tracer
medicines out of
stock as proportion
of medicines
expected to be in
stock (any item on
the Tracer
Medicine List that
had a zero
balance in the
Bulk Store on a
Stock Control
System.
Monitors shortages
in tracer
medicines.
Pharmacy
records
DHIS/ Pharmacy
Records
Numerator
Number of tracer
medicines out of stock
Denominator
Total number of
medicines expected to
be in stock
% Quarterly None Targeting zero
stock-out.
Pharmacy
Manager
Tracer medicine
stock-out rate
(Institutions)
Number of tracer
medicines out of
stock as proportion
of medicines
expected to be in
stock (any item on
Tracer Medicine
List that had a zero
balance in Bulk
Store (facilities) on
the Stock Control
System).
Monitors shortages
in Tracer
medicines.
Pharmacy
records
DHIS/ Pharmacy
Records
Numerator
Number of tracer
medicines stock out in
bulk store
Denominator
Number of tracer
medicines expected to
be stocked in the bulk
store
% Quarterly None Targeting zero
stock-out of all
tracer
medicines.
Pharmacy
Manager
Percentage
facilities on Direct
Delivery Model for
Procurement and
Distribution of
Pharmaceuticals
The percentage of
facilities that
implement the
direct delivery of
pharmaceuticals.
Monitors strategies
to improve
procurement and
distribution for
pharmaceutical
services.
Pharmacy
records
Pharmacy
records
Numerator
Number of facilities on
Direct Delivery Model
Denominator
Total number of facilities
eligible for Direct
Delivery Model
% Quarterly None Targeting
increase in
facilities
implementing
the Direct
Delivery Model.
Pharmacy
Manager

ANNUAL PERFORMANCE PLAN 2019/20 – 2020/21
INDICATOR DESCRIPTIONS
[TIDS] Page 48
Indicator Short Definition Purpose of
Indicator
Primary Source APP Source Method of Calculation Type Reporting
Cycle
Data
Limitations
Desired
Performance
Indicator
Responsibility
Percentage
facilities on Cross-
docking Model for
Procurement and
Distribution of
Pharmaceuticals
The percentage of
facilities that are
linked with the
Cross Docking
system.
Monitors strategies
to improve
procurement and
distribution for
pharmaceutical
services.
Pharmacy
records
Pharmacy
records
Numerator
Number of facilities on
Cross-docking Model
Denominator
Total number of facilities
eligible for Cross-docking
Model
% Quarterly None Expansion of
Cross Docking
Model.
Pharmacy
Manager
Percentage of
items on Direct
Delivery and Cross
Docking Model
The number of
items in the
Provincial Essential
Medicines
Catalogue that
are on Direct
Delivery and Cross
Docking.
Monitors
implementation of
Direct Delivery
and Cross Docking
to improve
pharmaceutical
efficiencies.
Pharmacy
records
Pharmacy
records
Numerator
Number of items on
Direct Delivery and Cross
Docking Model
Denominator
Total number of items in
the Provincial Essential
Medicines Catalogue
% Quarterly None Increase in the
number of
items on Direct
Delivery and
Cross Docking.
Pharmacy
Manager
Number of facilities
implementing the
CCMDD
Programme
The number of
facilities that
implement the
CCMDD
Programme to
improve access to
medication at
community level.
Monitors strategies
to increase
community-based
distribution of
medication and
impact on waiting
times at facility
level.
Pharmacy
records
Pharmacy
records
SUM:
Total number of facilities
implementing the
CCMDD Programme
No Quarterly None Increase in the
number of
facilities
implementing
the CCMDD
Programme.
Pharmacy
Manager
Number of
patients enrolled
on CCMDD
programme
(cumulative)
The total number
of patients that
receive
medication via
community-based
distribution.
Monitors strategies
to increase
community-based
distribution of
medication and
impact on waiting
times.
Pharmacy
records
Pharmacy
records
SUM:
Number of patients
enrolled on the CCMDD
programme
No Quarterly None Increased
number of
patients
benefiting from
the CCMDD
Programme.
Pharmacy
Manager
Number of
external pick-up
points linked to
CCMDD
The number of
community-based
pick-up points used
for distribution of
medicines
(exclusion: Pick up
Monitors the
increased access
through the
CCMDD
Programme.
Pharmacy
records
Pharmacy
records
SUM:
Total number of points
linked to CCMDD (Exc
DoH facilities)
No Quarterly None Increase in the
number of
pick-up points
linked to
CCMDD.
Pharmacy
Manager

ANNUAL PERFORMANCE PLAN 2019/20 – 2020/21
INDICATOR DESCRIPTIONS
[TIDS] Page 49
Indicator Short Definition Purpose of
Indicator
Primary Source APP Source Method of Calculation Type Reporting
Cycle
Data
Limitations
Desired
Performance
Indicator
Responsibility
points at DoH
facilities)
PROGRAMME 8: HEALTH FACILITIES MANAGEMENT
Indicator Short Definition Purpose of
Indicator
Primary Source APP Source Method of Calculation Type Reporting
Cycle
Data
Limitations
Desired
Performance
Indicator
Responsibility
Number of health
facilities that have
undergone major
and minor
refurbishment in
NHI Pilot District
Number of existing
health facilities in
NHI Pilot District
where Capital,
Scheduled
Maintenance, or
Professional Day-
to-day
Maintenance
projects
(Management
Contract projects
only) have been
completed
(excluding new
and replacement
facilities).
Tracks overall
improvement and
maintenance of
existing facilities.
Practical
Completion
Certificate or
equivalent,
Capital
infrastructure
project list,
Scheduled
Maintenance
project list, and
Professional
Day-to-day
Maintenance
project list (only
Management
Contract
projects).
Infrastructure
Report
SUM:
Number of health
facilities in NHI Pilot
District that have
undergone major and
minor refurbishment
Number Quarterly None A higher
number will
indicate that
more facilities
were
refurbished.
Infrastructure
Manager
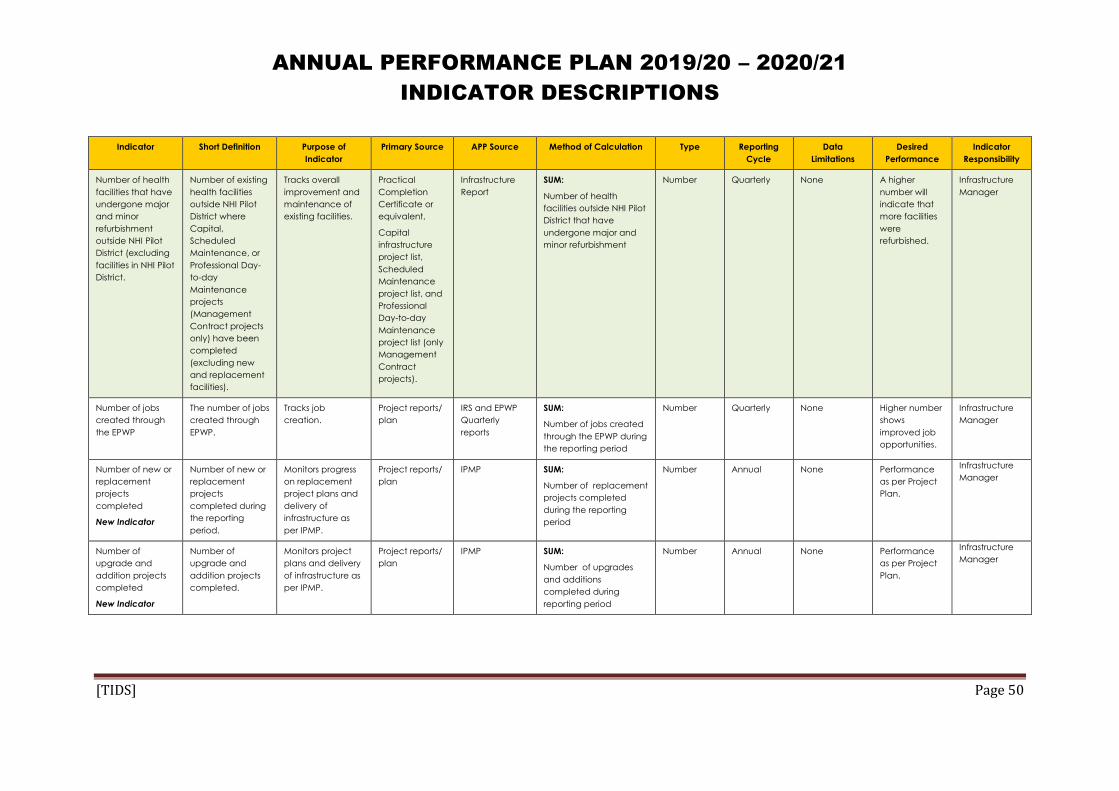
ANNUAL PERFORMANCE PLAN 2019/20 – 2020/21
INDICATOR DESCRIPTIONS
[TIDS] Page 50
Indicator Short Definition Purpose of
Indicator
Primary Source APP Source Method of Calculation Type Reporting
Cycle
Data
Limitations
Desired
Performance
Indicator
Responsibility
Number of health
facilities that have
undergone major
and minor
refurbishment
outside NHI Pilot
District (excluding
facilities in NHI Pilot
District.
Number of existing
health facilities
outside NHI Pilot
District where
Capital,
Scheduled
Maintenance, or
Professional Day-
to-day
Maintenance
projects
(Management
Contract projects
only) have been
completed
(excluding new
and replacement
facilities).
Tracks overall
improvement and
maintenance of
existing facilities.
Practical
Completion
Certificate or
equivalent,
Capital
infrastructure
project list,
Scheduled
Maintenance
project list, and
Professional
Day-to-day
Maintenance
project list (only
Management
Contract
projects).
Infrastructure
Report
SUM:
Number of health
facilities outside NHI Pilot
District that have
undergone major and
minor refurbishment
Number Quarterly None A higher
number will
indicate that
more facilities
were
refurbished.
Infrastructure
Manager
Number of jobs
created through
the EPWP
The number of jobs
created through
EPWP.
Tracks job
creation.
Project reports/
plan
IRS and EPWP
Quarterly
reports
SUM:
Number of jobs created
through the EPWP during
the reporting period
Number Quarterly None Higher number
shows
improved job
opportunities.
Infrastructure
Manager
Number of new or
replacement
projects
completed
New Indicator
Number of new or
replacement
projects
completed during
the reporting
period.
Monitors progress
on replacement
project plans and
delivery of
infrastructure as
per IPMP.
Project reports/
plan
IPMP SUM:
Number of replacement
projects completed
during the reporting
period
Number Annual None Performance
as per Project
Plan.
Infrastructure
Manager
Number of
upgrade and
addition projects
completed
New Indicator
Number of
upgrade and
addition projects
completed.
Monitors project
plans and delivery
of infrastructure as
per IPMP.
Project reports/
plan
IPMP SUM:
Number of upgrades
and additions
completed during
reporting period
Number Annual None Performance
as per Project
Plan.
Infrastructure
Manager

ANNUAL PERFORMANCE PLAN 2019/20 – 2020/21
INDICATOR DESCRIPTIONS
[TIDS] Page 51
Indicator Short Definition Purpose of
Indicator
Primary Source APP Source Method of Calculation Type Reporting
Cycle
Data
Limitations
Desired
Performance
Indicator
Responsibility
Number of
renovation and
refurbishment
projects
completed
New Indicator
Number of
renovation and
refurbishment
projects
completed.
Monitors project
plans and delivery
of infrastructure as
per IPMP.
Project reports/
plan
IPMP SUM:
Number of renovation
and refurbishment
projects completed
during reporting period
Number Annual None Performance
as per Project
Plan.
Infrastructure
Manager
Percentage of
maintenance
budget spent
New Indicator
Percentage of
maintenance
budget spent
during the
reporting period.
Monitors financial
management and
service delivery.
BAS APP: IRM, PMIS
and monthly
reports
Numerator
Maintenance budget
spent
Denominator
Maintenance budget
% Quarterly None 100% budget
spent.
Infrastructure
Manager