annual press conference - amazon web services
TRANSCRIPT

Annual Press Conference
2018
Indian Oil Corporation Ltd.
22nd May 2018


– Crude processed
• at Mathura Refinery (9.24 MMT)
• at Panipat Refinery (15.65 MMT)
– Rajasthan Crude Processing (1.95 MMT)
– Difficult Crude Processing (77%)
2015-16 2016-17 2017-18
58.0
65.2
69.0
Crude Throughput (MMT)
Par
adip
Sta
bili
sati
on
16
2016-17 2017-18
Par
adip
Sta
rt-u
p
Par
adip
Ram
p-u
p
5

2015-16 2016-17 2017-18
76.6
74.9
72.6
Energy Efficiency (MBN)
2015-16 2016-17 2017-18
5.06
7.77 8.49
GRM ($/bbl)
2%
3%
54%
9%
LPG 3.2 MMT
ATF 3.6 MMT
MS 10.2 MMT
HSD 31.3 MMT


2015-16 2016-17 2017-18
79.8
82.5
85.7
POL Pipeline Throughput (MMT)
3%
4%
– POL pipeline throughput
– Gas pipeline throughput
– Crude Handled at Paradip (29 MMT)
– Tankers Handled at Vadinar
– Tankers Handled at Paradip
2015-16 2016-17 2017-18
20.1 26.2 16.4
Kcal/(MT*km)


2015-16 2016-17 2017-18
80.6
88.1
94.2 Pipeline Capacity (MMTPA)
2015-16 2016-17 2017-18
11,746
12,848
13,391 Pipeline Length (km)
– Debottlenecking of SMPL
– Paradip-Raipur-Ranchi pipeline
– KAPL-Navagam pipeline
– Paradip-Balasore section of PHDPL LPG pipeline
– KSPL (157 km)
– BKPL (48 km)
– MPPL (72 km)

2015-16 2016-17 2017-18
3.1 3.3 3.2
35.8 35.4 36.5
4.6 3.6 2.6
9.5 10.1 10.9
9.2 10.1 10.8
72.6 74.1 77.1
Domestic POL Sales (MMT)
LPG
Naphtha
MS
ATF
SKO
HSD
FO/LSHS
Bitumen
Lubes
Others
Seamlessly started BS-VI fuel supply to Delhi NCT on 1st April 2018
4% 2%


3,355 ROs Automated in 2017-18 – Highest-ever in a year
Regular ROs 19,560
KSKs 7,529
Terminals/ Depots
125
LPG Distributors
10,213
LPG Bottling Plants
91
SKO/ LDO Dealers 3,897
AFS 107
Consumer Pumps 6,650
As on 1.4.2018
Network Expansion by over 1,730 in 2017-18
ROs 451
KSKs 502
Terminals/ Depots 3
LPG Distributors 643
AFS 3
Consumer Pumps 130
Over 48,170 Touch Points

– Established Escalation Matrix
– Customer Complaints
– Customer Feedback
Customer Support
Customer Grievance
Enhanced Customer Satisfaction
Online Portal
Leveraging Technology and Social Media – 21st Century Tools
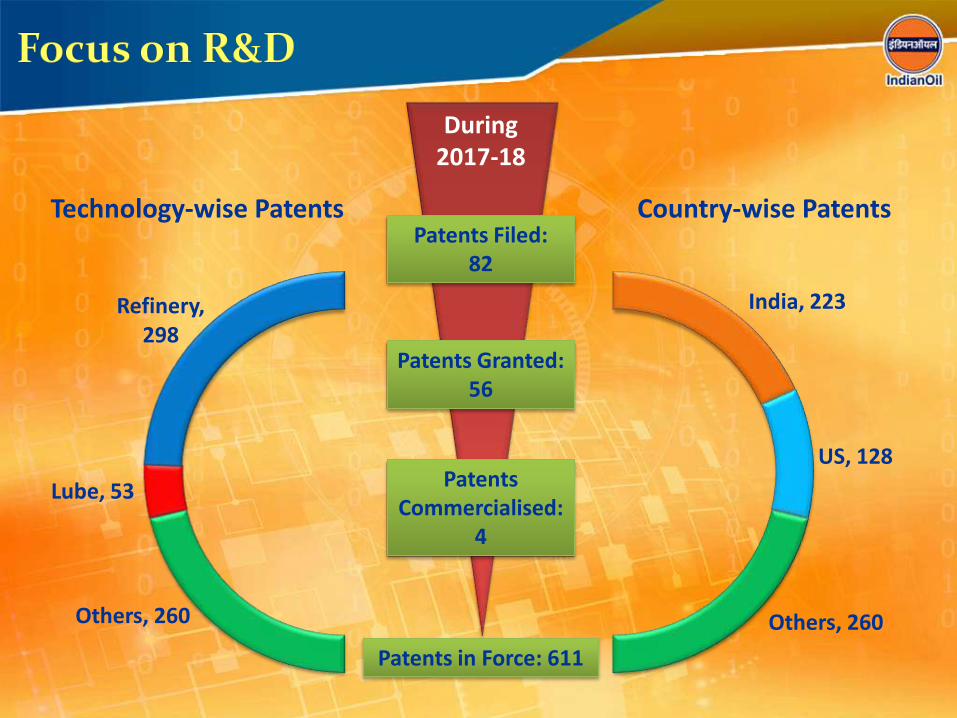
India, 223
US, 128
Others, 260
Country-wise Patents
Others, 260
Lube, 53
Refinery, 298
Technology-wise Patents
During 2017-18
Patents Filed: 82
Patents Granted: 56
Patents Commercialised:
4
Patents in Force: 611

BS-VI Push • Produces BS-VI compliant MS • Instrumental in BS-VI MS supply to Delhi NCT
Plant at Mathura Refinery • 55 TMTPA unit installed • Commissioning: 29th January 2018 Features
• Upgrades C4 Stream to MS • Produces High Octane
(~120 RON) MS feed
Indigenous Technology • Developed by IndianOil R&D • A “Make In India” Initiative


1
2
3
4
5
Start-ups Funded
Technology Process
Re-engineering
Business Process
Re-engineering
1
2
3
4
5
6
Bio-formulation
Fuel Cell based Research
Emissions Reduction
Deriving Fuel Substitutes
Nano particles based Research
Enhanced Fleet Management
Electronic Leak Detection
Automated TT Locking
Enhancing RO Automation
Leveraging IT for Retail
Eco-Toilets

2015-16 2016-17 2017-18
101 137 143
514 530 355
349 360 308
1,228 1,178 1,221
75 84 88
156 180 155
115 102 92
Petrochemicals Sales (TMT)
Exports
Benzene/ Propylene Butadiene
Polymers
Glycols
PX/PTA
LAB
2,538 2,571 2,362
2nd Largest Polymer Player

Investing in Paradip
Paradip Refinery: A Mother Unit
Making Paradip “Energy
Gateway of East India”
680 TMTPA Unit Rs. 3,150 crore
Collaboration with IDCO
Feed from indigenous INDMAX unit
Uninterrupted Supply of Feedstock from IndianOil
Development of Downstream Petrochemical Units in Odisha
Development of Secondary and Tertiary Sectors in Odisha
1st of Many Petrochemical Units at Paradip
Harnessing Local Entrepreneurship Ability

2015-16 2016-17 2017-18
3.64 3.79 3.86
19% share in India’s R-LNG Segment
Data in MMT
Note: Includes Internal Consumption
4%
2%
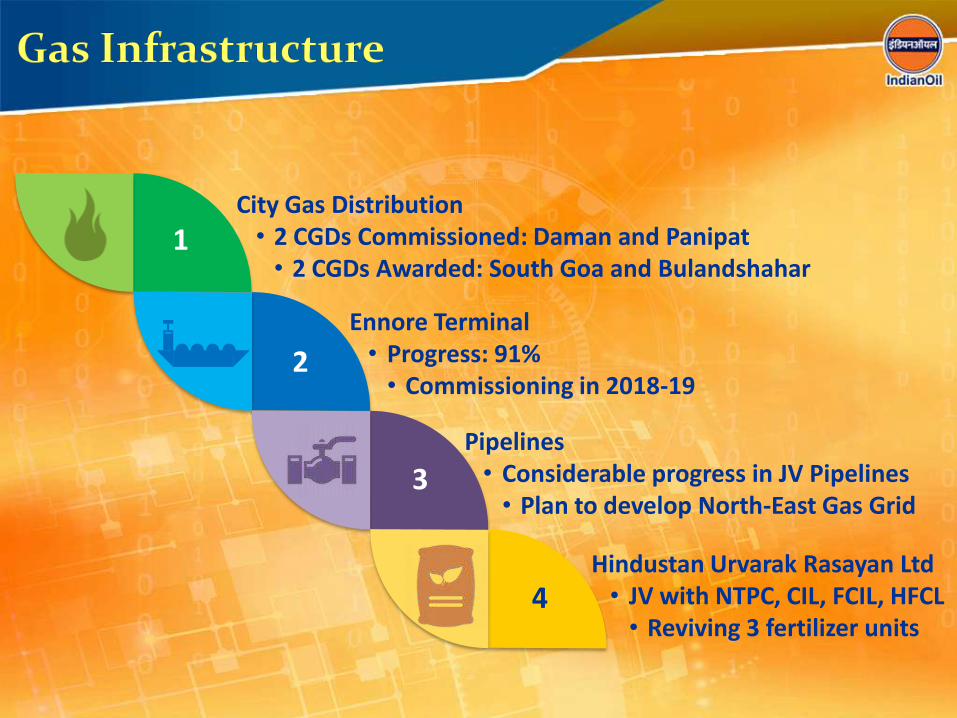
1
2
3
4
City Gas Distribution • 2 CGDs Commissioned: Daman and Panipat • 2 CGDs Awarded: South Goa and Bulandshahar
Ennore Terminal • Progress: 91% • Commissioning in 2018-19
Hindustan Urvarak Rasayan Ltd • JV with NTPC, CIL, FCIL, HFCL • Reviving 3 fertilizer units
Pipelines • Considerable progress in JV Pipelines • Plan to develop North-East Gas Grid

Achieved 1st Equity Oil production from a Domestic Block
Overseas Blocks
Domestic Blocks
1
2
2
1
5
7
1
10
9
Blocks’ Location
Exploration
Discovery
Appraisal
Under Development
Production
0.47
1.45
2.66
0
250
500
750
1000
1250
0.00
0.40
0.80
1.20
1.60
2.00
2015-16 2016-17 2017-18
Reserves & Production
2P Reserves (MMboe)
Production (MMToe)

Location Oman
Block Mukhaizna
Operator Occidental
Reserves 0.6 billion boe
Production 120 kb/d
IOC Stake 17%
IOC Equity Oil 20 kb/d
Location Abu Dhabi
Block Lower Zakum
Operator ADNOC
Reserves 5.1 billion boe
Production 400 kb/d
IOC Stake 3%
IOC Equity Oil 12 kb/d

2015-16 2016-17 2017-18
75.4 76.5
187.1
1.1
110.6
14.5
76.5
187.1
201.6
Renewable Capacity Growth
Renewable Capacity (MW)
Capacity Added (MW)
– 3.23 TWHr generation in
2017-18
– 89% jump in 2017-18
– 2,533 ROs Solarised in
2017-18
– Highest-ever in a year
– Mitigated 236 TMT
equivalent CO2 in 2017-18

– Launched India’s 1st Hydrogen Fuel Cell based Bus
– Developed with TATA Motors
– Installed 3 Waste conversion plants in Varanasi, UP
– Capacity: 5 Tons per day each
– Nagpur: RBI Chowk RO
– Delhi: Sadiq Nagar RO
– Plans to install 2G Ethanol Plants
– Work commenced for 2G Ethanol Plant at Panipat, Haryana

Representative Offices opened in
Myanmar Bangladesh
Operationalised Singapore Office
Crude Oil Purchase
Upstream Investments
Product Trading & Risk Management


Jal-Jeevan: Clean Drinking Water – Providing 1,000 litre/hr RO System – 30 Villages Covered
Surya Prakash: Solar Lighting – 30 Solar Street Lights per Village – 25 Villages Covered
Animal Welfare – Constructed enclosure for
Asiatic Lions at Mangaluru – Veterinary facilities provided
Assistive Devices to Divyangjans – Tricycles, Wheelchairs, artificial limbs
etc provided to 900 Divyangjans – In association with Artificial Limbs
Manufacturing Corporation
Healthcare – AOD Hospital, Digboi – Swarna Jayanti Samudayik
Hospital, Mathura
Education – IndianOil Gyanodaya merit-
cum-means Scholarships – Over 1,300 students covered in
2017-18

Funding Kendriya Vidyalaya – Sustaining KVs at Barauni,
Guwahati, Haldia & Mathura – Providing well-equipped Labs,
Libraries, Playgrounds etc
ICTM-IOC, Bhubaneshwar – Institute of Chemical Technology-
IOC Campus at Bhubaneshwar – Inaugurated by Hon’ble President
of India on 18th March 2018
Skill Development Institute, Bhubaneshwar – Training imparted in 5 trade courses – 150 students per batch – Hon’ble President of India laid foundation
stone on 18th March 2018
Kaushal Vikas Kendra, Barauni – Skill training provided in 5 trades – Classes organized in association
with National Skill Development Corporation (NSDC)
IOC Multi Skill Development Institute, Digboi, Assam – Vocational Skill Training for
local youth – 400 beneficiaries every
year


2015-16 2016-17 2017-18
11,242
19,106
21,346
Profit After Tax (Rs. crore)

Q1 Q2 Q3 Q4
4,549
3,696
7,883
5,218
Profit After Tax (Rs. crore)

2016-17 2017-18
Net Profit/ (Loss) 19,106 21,346
Major Reasons Contributing to the increase in Profit:
Provisions for Contingency (6,975) 2,814
Refinery Margin 13,946 18,723
Inventory Gain / (Loss) 12,477 6,759
Petrochemical Margins 8,681 7,238
Exchange Gain / (Loss) 1,108 304
Tax Expenses (7,215) (11,218)
Key Indicators (Rs. crore)
34
Increase by Rs. 9,789 crore
Increase by Rs. 2,240 crore
Decrease by Rs. 1,443 crore
Decrease by Rs. 804 crore
Offset by Rs. 4,003 crore
Deviations in Annual Profit from Previous Year
Increase by Rs. 4,777 crore
Decrease by Rs. 5,718 crore

Parameter 2015-16 2016-17 2017-18
Under-Recovery on SKO 7,757 5,149 3,196
Claims thru DBTL – LPG 8,192 6,265 10,627
Total 15,949 11,414 13,823
Rs. crore
All under-recoveries are fully compensated.

3,090 3,445 3,448
52,880 54,820
58,030
0.60 0.55 0.53
0.20
0.40
0.60
0.80
1.00
-
10,000
20,000
30,000
40,000
50,000
60,000
2015-16 2016-17 2017-18
D/E
Rat
io
Rs.
cro
re
Interest Cost Borrowings Debt Equity Ratio

2015-16 2016-17 2017-18
67,459
1,02,817 1,02,553
64,605
76,197 87,308 1,32,064
1,79,014
1,89,861
States
Central
Rs. crore

Manika Batra K Srikant
Sharath Kamal Mehuli Ghosh
Sikki Reddy
