annual progress report on the corrective action program in
TRANSCRIPT
Annual Progress Reporton the
Corrective Action Program in Washington State
Hazardous Waste and Toxics Reduction ProgramDecember, 2001
Publication #01-04-031

For a copy of this document, please contact:
Department of EcologyPublications
P.O. Box 47600Olympia, WA 98504-7600
Please include your street address for UPS delivery
The Department of Ecology is an equal opportunity agency and does not discriminate on the basis of race, creed, color, disability, age religion, national origin, sex, marital status, disabled veteran’s status, Vietnam Era veteran’s status or sexual orientation.
If you have special accommodation needs or require this document in alternative format, please contact the Hazardous Waste and Toxics Reduction Program at (360) 407-6700 (voice) or (360) 407-6006 (TDD).Ecology’s telecommunications device for the deaf (TDD) number is (360) 407-6006. Regional TDD numbers are: CRO (TDD) (509) 454-7673 NWRO (TDD) (425) 649-4259 ERO (TDD) (509) 458-2055 SWRO (TDD) (360) 407-6306

Table of ContentsExecutive Summary pg 1
Introduction pg 3
Questions and Answers pg 4
Charts Chart 1 Performance Measures for GPRA Sites ‘00 pg 13 Chart 2 Performance Measures for GPRA Sites ‘01 pg 13 Chart 3 Summary Graph of Performance Measures High Priority (FY’00) pg C2 Chart 4 Summary Graph of Performance Measures High Priority (FY’01) pg C3 Chart 5 Summary Graph of Performance Measures Medium Priority (FY’00) pg C5 Chart 6 Summary Graph of Performance Measures Medium Priority (FY’01) pg C7
Figures Figure 1 Progress in Corrective Action pg 7 Figure 2 Summary Graph of Performance Measures High Priority (FY‘00) pg C1 Figure 3 Summary Graph of Performance Measures High Priority (FY‘01) pg C3 Figure 4 Summary Graph of Performance Measures Medium Priority (FY‘00) pg C5 Figure 5 Summary Graph of Performance Measures Medium Priority (FY‘01) pg C7
Steps Step 1 Cumulative Progress (unweighted) pg B1 Step 2 Cumulative Progress (weighted) pg B2 Step 3 Cumulative Progress at Facility A (weighted) pg B3 Step 4 Cumulative Progress of Two Facilities (weighted) pg B4 Step 5 Adding Progress for Many Areas Across Facilities pg B5 Tables Table 1 Progress in Corrective Action for all Facilities pg A1 Table 2 Individual Fractional Completion Values High Priority (FY ‘00) pg C2 Table 3 Individual Fractional Completion Values High Priority (FY ‘01) pg C4 Table 4 Individual Fractional Completion Values Medium Priority (FY ‘00) pg C6 Table 5 Individual Fractional Completion Values Medium Priority (FY ‘01) pg C8

Annual Progress Report on the Corrective Action Program in WA State 1
Executive SummaryCorrective action is the environmental cleanup program for dangerous waste treatment, storage and disposal facilities (TSDFs). It is a federal program, and the Environmental Protection Agency (EPA) delegated implementation of the program to the Washington State Department of Ecology (Ecology). Ecology uses the state “Superfund” law, the Model Toxics Control Act (MTCA), cleanup procedures and requirements to implement corrective action. Therefore, cleanup at TSDFs under corrective action is consistent with that at other sites requiring cleanup, statewide.
There are 116 known corrective action sites in the state. Unfortunately, Ecology does not have the resources to work on all corrective action sites right now. EPA and Ecology have worked together to identify and prioritize the sites that need attention fi rst. These are the sites that represent a greater threat due to human exposure and/or ongoing contamination of groundwater. Based on those criteria, there are 27 “high priority” sites in this State, and the agencies are working to require cleanup at all of them. Ecology is managing 19 of the “high priority sites”, and EPA is managing the other eight sites. Ecology is also working on 16 “medium priority” sites.
By 2005, the agencies have committed to the following Environmental Indicator (EI) corrective action goals:
● Control direct human exposure to contaminants at 95% of the “high priority” sites. ● Control releases of contaminants to groundwater at 70% of the “high priority” sites.
These 2005 EI goals refl ect interim steps to reduce immediate impacts to human health and the environment. However, the long-term goal of cleaning up such sites completely will take additional effort and time, as discussed below.
The current status at 27 Washington high priority sites is as follows: ● Human exposure controlled: 37% ● Releases to groundwater controlled: 19%
EPA and Ecology are focused on the EI goals and will make signifi cant progress requiring cleanup of the most seriously contaminated sites. There is much work and progress needed to achieve the goals. At this time, it is not certain that the EI goals will be reached by 2005.
Ecology has developed a separate performance measure to assess corrective action progress at TSDFs from beginning to end. It accounts for incremental and ongoing progress being made at the sites. Based on that measure, the following information is provided:
● Overall, the 19 “high priority” sites Ecology is managing are 52% completed with the corrective action process.
● Ecology expects corrective action to be completed at these 19 “high priority” sites by 2011.● Overall, the Ecology 16 “medium priority” sites are 38% completed with the corrective action
process.● Ecology expects corrective action to be completed at the 16 “medium priority” sites by 2032.
Ecology will use this measure to assess ongoing corrective action progress, to discuss progress with interested persons, and to aid in workload planning.

2 Hazardous Waste Toxics Reduction Program
Annual Progress Report on the Corrective Action Program in WA State 3
IntroductionThe purpose of this report is to provide a brief summary of corrective action at Resource Conservation and Recovery Act (RCRA) treatment, storage and disposal facilities (TSDFs) in Washington. It includes a general description of the corrective action environmental cleanup process, including the authority to require cleanup and the various phases of the cleanup process. It also describes how Ecology and EPA work together to conduct corrective action in Washington through various state and federal environmental programs.
The report presents information on the TSDFs that require corrective action in the state, including: ● Total number of known sites;● Breakdown of work status on the sites (i.e., no further action needed, cleanup in progress,
cleanup pending, referred to other authority); ● Priority assigned to the various sites (i.e., high, medium, low), and how that priority was
established;● Discussion of goals and current progress to control direct human exposure and release to
groundwater at high priority sites by 2005;● Discussion of an innovative performance measure developed by Ecology to assess overall
progress in completing cleanup at corrective action sites, and the current status at cleanup sites using that measure;
● Estimates of when corrective action will be completed at high and medium priority corrective action sites in the State.
The report is structured around a set of basic questions about the corrective action program and sites in Washington. There is a very brief and direct response immediately below each question. Then, there is a more complete response to the question in the column to the right of the question. That response includes detailed information and data to answer the question. Finally, there are several appendices that provide more detailed information about the sites, status of the high and medium priority sites in the corrective action process, and the performance measure that Ecology developed.
4 Hazardous Waste Toxics Reduction Program
Questions and AnswersA. What is “corrective action?”
Corrective action is an environmental contamina-tion cleanup program for dangerous waste treatment, storage and disposal facilities (TSDFs).
“Corrective action” is an environmental contamination cleanup pro-gram for former and current dangerous waste treatment, storage and disposal facilities (TSDFs) that are regulated by the Federal Resource Conservation and Recovery Act (RCRA).
Work under “corrective action” is similar to the environmental cleanup work conducted under the Comprehensive Environmental Response, Compensation, and Liability Act (CERCLA), also known as the Federal “Superfund” law and the Washington State Model Toxics Control Act (MTCA). The Federal Superfund and the Washington State MTCA program foster the cleanup of a broad range of contaminated sites resulting from manufacturing, energy production, commercial activ-ity, transportation, military and governmental functions. “Corrective action” addresses a much smaller array of sites, but it has very similar environmental goals. Corrective action is directed at RCRA TSDFs that require environmental cleanup. Cleaning up environmental contami-nation at TSDFs is one of the highest environmental priorities of the EPA and Ecology.
TSDFs are regulated by RCRA, and are relatively few in number -- yet many have a legacy of spills, mismanagement and non-compliance. Many of these TSDFs have closed or are in the process of closing their facilities. Cleaning up contaminated soil, surface water and groundwa-ter at any site is often diffi cult, complex and protracted because the extent of the problem must fi rst be assessed and investigated before the actual implementation of cleanup occurs. Corrective action is further complicated by the number of parties potentially responsible for creating the contamination and the number of public resource and regulatory agencies involved in the cleanup.
Annual Progress Report on the Corrective Action Program in WA State 5
B. What are the stages in the “corrective action” process?
1. RCRA Facility Assessment, or RFA
2. RCRA Facility Investigation, or RFI
3. Corrective Measures Study, or CMS
4. Corrective Measures Imple-mentation, or CMI
Proper corrective action requires a thorough understanding of the nature of the contamination and who is responsible. Corrective action includes a sequence of stages that every site goes through. It typically takes a number of years from the beginning to the end of this process.
The four sequential stages in the corrective action process are as follows:
1. RCRA Facility Assessment (RFA) — This is an initial inves-tigation of releases and potential releases at a facility. It involves an extensive fi le review of the history of the facility, plus a facility inspection. This results in a report that dis-cusses known and potential contamination at the facility, and that recommends additional investigation and/or other corrective action that may be needed.
2. RCRA Facility Investigation (RFI) — This is a detailed facil-ity-wide investigation and characterization of known and potential contamination. It usually involves soil and ground- water investigations, and often involves analyses (e.g., mod-eling) to evaluate the movement of, and risks associated with, the contamination. During the RFI, suffi cient infor-mation must be developed on site contamination to deter-mine the cleanup actions, including cleanup levels.
3. Corrective Measures Study (CMS) — This is a study of potential approaches to address contamination at the facil-ity. Several cleanup options are described and evaluated. The study recommends an approach to accomplish the cleanup.
4. Corrective Measures Implementation (CMI)1 — This is the stage of the corrective action process during which the comprehensive cleanup and/or containment of contamina-tion actually occurs.
Questions and Answers
1 Interim corrective measures can be implemented at any stage during the corrective action process. Interim measures are used to address obvious or particularly dangerous contamination problems. In fact, meeting the 2005 “environmental indicator” goals will require early implementation of interim corrective measures at certain sites.
6 Hazardous Waste Toxics Reduction Program
C. What regulatory authori-ties does Ecology use to con-duct “corrective action,” and what is EPA’s role?
The overall regulatory author-ity for cleanup at these sites is RCRA. However, Ecology uses the procedures and standards in MTCA to conduct cor-rective action. EPA oversees Ecology work on RCRA cor-rective action. EPA also man-ages some of the corrective action sites in Washington.
The RCRA law requires TSDF owners and operators to remediate environmental contamination at their facilities, and that is the basic authority Ecology and EPA uses.
From 1984 to 1994, EPA carried out the provisions of RCRA that deal with corrective action at TSDFs. In 1994, EPA accepted Ecology’s application to conduct corrective action work authorized by RCRA. Therefore, like many other federal environmental programs, much of the corrective action work has been delegated to Ecology along with some federal funding. Also, under the terms of the EPA/State perfor-mance partnership agreement, some corrective action sites remain under the control of EPA until they are transitioned to the state.
Ecology uses the procedures and standards in MTCA to conduct cor-rective action. In 1988, the citizens of Washington State passed MTCA as a statewide ballot initiative. It established the amount and type of cleanup Washington’s citizens have asked their government to ensure at all contaminated sites.
In 1994, EPA conducted a thorough legal and technical review of MTCA and confi rmed that MTCA cleanups provide environmental results that are equivalent to the results achieved by EPA’s corrective action program. That is how Ecology became qualifi ed to conduct cor-rective action work authorized by RCRA. A similar review confi rmed that MTCA cleanups achieve environmental results that are equivalent to the environmental results achieved by the Federal Superfund pro-gram.
With MTCA, the State of Washington has a very thorough and well-established environmental cleanup authority and program. It is very important to Ecology that cleanup at RCRA sites be consistent with procedures and requirements in MTCA. Ecology also enforces regula-tory provisions in RCRA that are essential for adequate cleanups at corrective action sites (e.g., land disposal restrictions).
Under MTCA, Ecology can recover the costs of staff time used to manage corrective action sites from TSDF owners. Ecology would have no such cost recovery authority through RCRA. Ecology is striving to minimize administrative burdens under RCRA at corrective action sites so the cleanups can proceed quicker. For example, Ecology wishes to be able to use MTCA cleanup orders instead of RCRA permits at some corrective action sites. Ecology is working with EPA to improve
Questions and Answers

Annual Progress Report on the Corrective Action Program in WA State 7
D. How many sites (regardless of priority) in Washington require “corrective action?”
There are 116 identifi ed correc-tive action facilities in Washing-ton.
Currently, there are 116 known, identifi ed corrective action facilities in Washington. These are classifi ed according to risk as high, medium, and low.
Some of the known facilities are large. Some have multiple contami-nated areas that need to be managed separately. In effect, some large and complex facilities need to be managed as multiple sites. Others are small, isolated sites that represent a modest or minor risk to human health and the environment in their present condition.
There are probably more sites that will require corrective action in Washington. New facilities, and new areas of known facilities, are very likely to be discovered through ongoing environmental investigations.
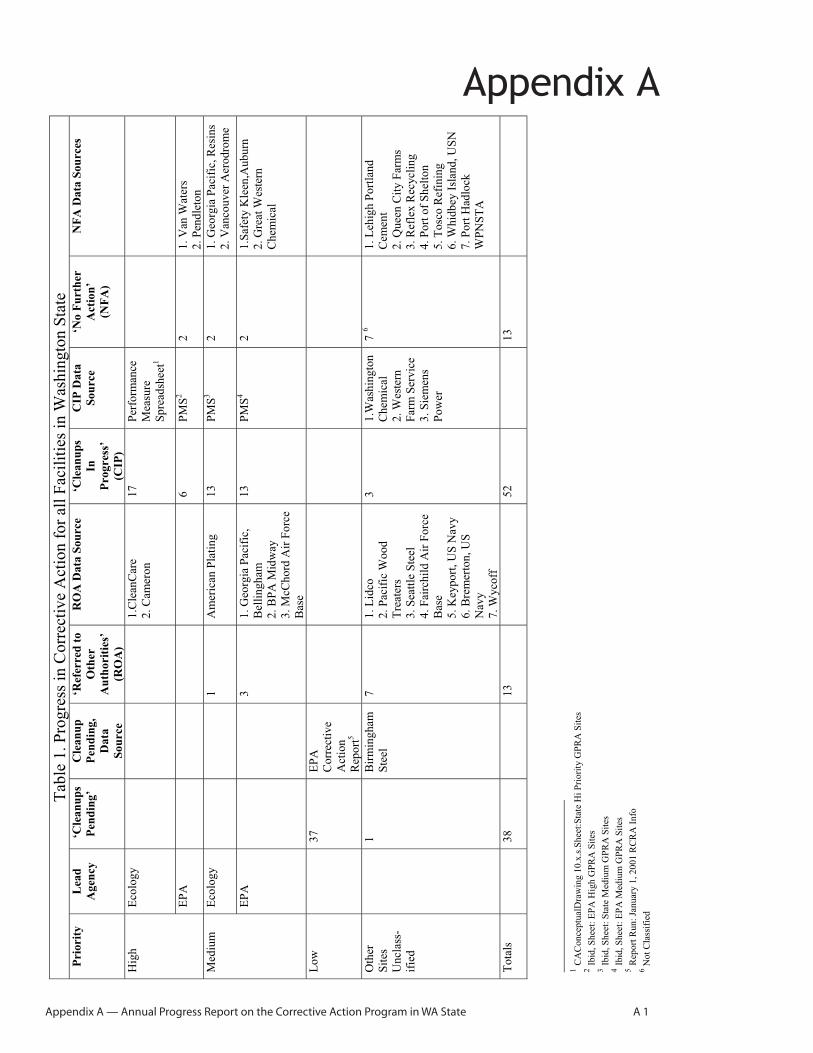
Ecology and EPA are not working on all 116 known sites right now. Figure 1 provides a summary of the status of the sites. Table 1 in Appendix A has more detailed information on the sites.
Questions and Answers
the effi ciency and effectiveness of corrective action cleanups in Washington. Therefore, the two major advantages of using MTCA are (1) the ability to recover Ecology’s management costs, and (2) quicker cleanups that are consistent with other environmental remediation done in Washington.
Figure 1— Progress in Corrective Action for all Facilities in Washington State
Cleanup in Progress52 Sites
45%
Referred to OtherAuthorities13 Sites11%
No Further Action13 Sites
11%
Cleanup Pending38 Sites
33%
8 Hazardous Waste Toxics Reduction Program
E. How do the agencies determine which “corrective action” sites to work on fi rst?
The agencies rank the sites with the greatest risk to human health and the envi-ronment, and work on those fi rst.
In general, the agencies work on “corrective action” sites that represent the greatest risk to human health and the environment fi rst.
In 1997, EPA classifi ed corrective action sites nationwide into three risk categories; high, medium, and low. EPA placed the highest prior-ity on facilities that represent the greatest threats of direct exposure to people and/or ongoing contamination of groundwater. Both Ecology and EPA are using EPA’s classifi cation to help decide which sites to work on fi rst in Washington.
Other, secondary factors, also infl uence which sites that Ecology works on. For example, if the owner of the TSDF is prepared to begin addressing corrective action needed at their site, Ecology tries to assign a project manager to that site.
Unfortunately, the agencies do not have suffi cient staff to work at once on all sites that will ultimately require corrective action.
F. What is the total number of high priority “corrective action” sites Ecology and EPA are working on to ensure cleanup?
Of 27 high priority sites, EPA is working on eight sites and Ecology is working on 19 sites.
EPA and Ecology are currently working on 27 high priority corrective action facilities. Ecology is managing 19 of these sites and EPA is managing eight sites. Both agencies are putting less effort into 16 medium priority sites, until most of the 27 high priority sites are well along in the cleanup process. Thirty-seven low priority sites are classed as “cleanup pending” and will be managed more actively as the medium priority sites fi nish the cleanup process. (See Appendix A, Table 1)
Questions and Answers
Annual Progress Report on the Corrective Action Program in WA State 9
H. Are the agencies on track to meet the 2005 EPA “environ-mental indicator” goals on “cor-rective action” sites?
Ecology and EPA are commit-ting a large effort to achieving the goals. However, meeting the goals is not certain.
The current status is:● Human exposure has been
controlled at 37% of “high pri-ority” sites.
● Releases to groundwater have been controlled at 19% of “high priority” sites.
Although meeting the 2005 goals is not certain, the agencies are focused on the goal and are making signifi cant progress requiring cleanup of the most contaminated sites (i.e., the “high priority” sites).
Environmental remediation is a complex, technology-limited and time-consuming effort at some sites. The agencies may not be able to overcome real constraints on cleanup progress before 2005 for some “high priority” sites.
The current status of achieving EI goals in Washington is as follows:• Control of direct human exposure has been accomplished
at 37% of “high priority” sites. • Control of releases to groundwater has been accomplished
at 19% of “high priority” sites.
Questions and Answers
G. Does Ecology and the EPA have specifi c goals for address-ing immediate threats at high priority corrective action sites?
Yes. By 2005, the agencies have two goals to meet for “high pri-ority” sites:● Control direct human expo-
sure to contaminants at 95% of these sites.
● Control releases of contami-nants to groundwater at 70% of these sites.
Nationwide, EPA has committed to the following progress at high priority corrective action sites:
● Control direct human exposure to contaminants at 95% of “high priority” sites by 2005.
● Control releases of contaminants to groundwater at 70% of “high priority” sites by 2005.
Ecology is working with EPA to meet these commitments in Wash-ington. EPA’s commitments are in response to the Government Productivity and Results Act (GPRA) of 1993. That Act holds federal agencies accountable for achieving results, quality, and customer satisfaction. It requires federal agencies to set goals, measure performance, and report publicly on their progress.2
The agencies are using “control of direct human exposure” and “control of releases of contaminants to groundwater” as “environ-mental indicators” (EIs) of corrective action progress at the 27 “high priority” sites. These EIs focus on whether steps have been taken to address direct human exposures to toxics, such as inges-tion, inhalation and touch, and whether controls are in place to prevent the further spread of contaminated groundwater plumes.
2 See http://www.epa.gov/epahome/issues4_1201.htm
10 Hazardous Waste Toxics Reduction Program
I. Does satisfying the “envi-ronmental indicators” mean that the site is fi nished with “corrective action?”
No. Extensive corrective action may be required even after satisfying these “indica-tors.”
Extensive corrective action work and progress is required over the next couple of years to meet the goals. However, the above numbers do not provide a complete picture of corrective action progress. Whether the EIs are satisfi ed is a simple “yes” or “no” answer. The EIs do not show the incremental progress being made prior to a “yes” response for a site.
While the EI numbers discussed in question G, above, refl ect real progress in protecting human health and the environment, they do not measure the incremental progress being made at sites prior to and after satisfying the environmental indicator. Corrective action is often complex and progress requires a sustained effort. The EIs have limitations in showing ongoing progress and those have led Ecology to consider additional performance measures. Examples of EI limitations are:
● EIs are “yes-no” indicators, and interim progress being made at a site may not be shown for months or even years. Managers and staff need to assess yearly progress in achieving major milestones.
● EIs are typically interim measures; they do not refl ect the entire corrective action process. Satisfying an EI must not be confused with achieving the ultimate long-term cleanup.
● EIs are evaluated on a facility-wide basis. Some facilities are broken into multiple, management cleanup areas. If the EIs for three out of the four areas of one facility can be met, the overall facility still does not meet the EI. In that case there is no apparent EI progress for the site. The site is judged on having met the EI goal only after the entire site meets the EI goal.
Meeting the “environmental indicators” does not mean that all correc-tive action at the facility is over. Meeting the indicators just means that the most serious immediate threats have been addressed.
Although EPA and Ecology try to direct their immediate attention to the most serious threats fi rst, the agencies remain involved in the cor-rective action process at a facility until all contamination is adequately removed or contained.
J. Are there measures of the progress, other than EIs, being made on “corrective action” sites?
Yes. Ecology has developed a measure to evaluate overall completion at sites for those sites being managed by Ecol-ogy.
Ecology believes that correc-tive action is 52% complete for the 19 “high priority” sites.
Annual Progress Report on the Corrective Action Program in WA State 11
Questions and Answers
● Even after the EI is apparently met, ongoing monitoring and investigations may uncover more unexpected contami-nation on site. This requires reversing the earlier EIs status. This phenomenon appears as “backsliding” on corrective action progress when viewed through the EI performance measure when, in fact, it is a positive step to identify all threats to human health and the environment.
● Although the EIs make fundamental sense, Ecology has no authority to require facilities to meet the EIs for that sake alone. Ecology does have authority to push for corrective action progress and for addressing signifi cant threats as soon as possible.
To address these limitations in the EIs, Ecology has developed an additional performance measure to more adequately show overall environmental progress at corrective action facilities.
Several features of the new Ecology performance measurement are:
• Rather than just ask if an EI is satisfi ed for an entire facility, Ecology’s performance measure asks what percentage of each area within each high priority facility for all stages of corrective action has been completed. This gives a collective percent completion number for all 19 high priority sites or any other set of facilities. Each year there should be some visible movement toward 100% completion.3
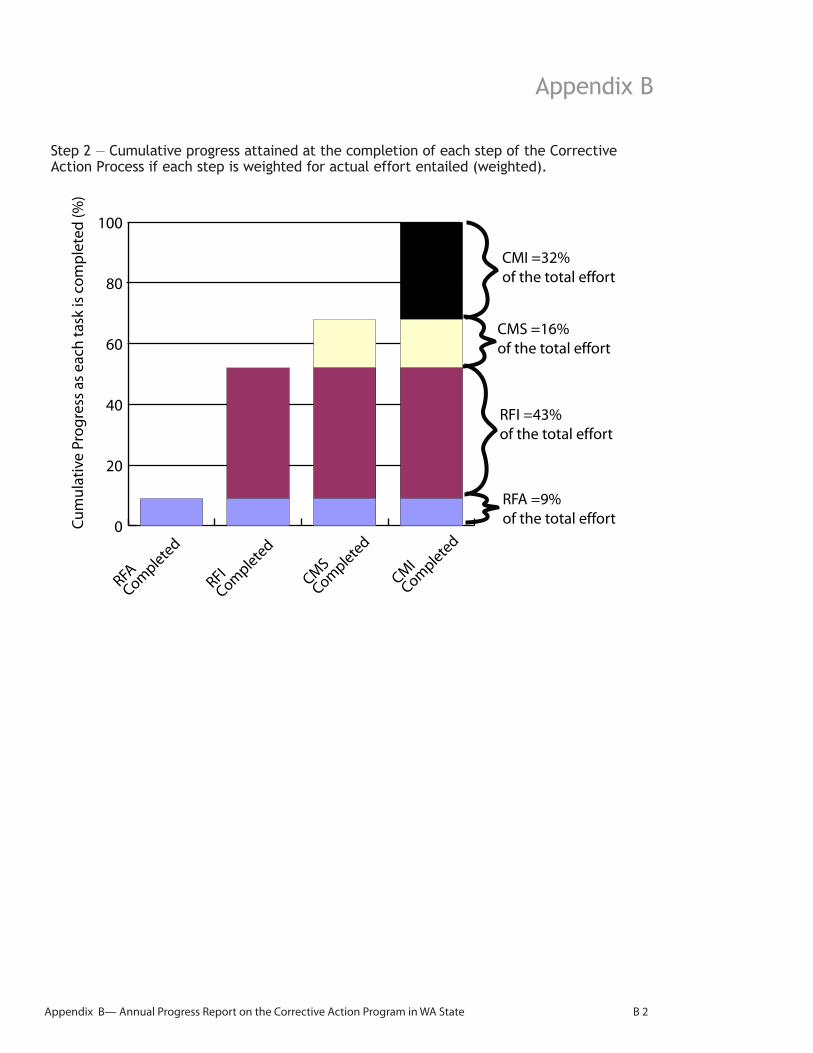
• Progress in achieving cleanup using the four-step process is weighted to refl ect the relative amount of effort needed to accomplish each of the four stages. These weighting values are as follows:
• RCRA Facility Assessment (RFA) refl ects 9% of the effort to complete cleanup.
• RCRA Facility Investigation (RFI) refl ects 43% of the effort to complete cleanup.
• Control Measure Study (CMS) refl ects 16% of the effort to complete cleanup.
• Control Measure Implementation (CMI) refl ects 32% of the effort to complete cleanup.
3Ecology’s performance measure gives partial credit for facilities that are part way through the corrective action process. Another way of viewing Ecology’s perfor-mance measure is to imagine that all cleanups proceed at the same pace.
12 Hazardous Waste Toxics Reduction Program
As shown in Charts 1 and 2 on the next page, the corrective action process is 52% complete for the “high priority” sites in FY 2001. The year 2000 fi gure is 47% complete for the “high priority” sites. The numbers show that there has been progress of 5% in the past year toward completing cleanup of all 19 high priority sites. (See Appendix B for a detailed description of Ecology’s performance measure.)
Ecology’s performance measure provides the agencies, the TSDFs and the public constant feedback on how corrective action is progressing. Performance measurement charts will be used to visualize progress at facilities, and the overall percent complete number can be measured and recalculated at any time. Ecology will use the information as a workload tool during program planning exercises to redeploy staff or other resources to areas of critical need. They will also be useful during discussions with EPA to develop the Performance Partnership Agreement between the two agencies.
Questions and Answers

Annual Progress Report on the Corrective Action Program in WA State 13
Questions and Answers
By comparing the two years’ progress, the reader can see that all three areas in RCRA Facility Assess-ment (RFA) have moved on to subsequent stages during FY01. In addition, fi ve areas have entered Control Measure Studies (CMS) — a signifi cant step that should lead to more progress next year.
3
18
7
7
# of CA
areas*
Sum
of P
rogre
ss T
o D
ate
, F
Bar
0
1
2
3
4
5
6
7
8
3
18
1
7
RFA RFI CMS CMI
* Total number of cleanup areas in all facilities reaching that step of corrective action.
Sum
of P
rogr
ess
To
Dat
e, F
bar
Corrective Action (CA) Steps
# of CA
areas*
0
0
1
2
3
4
5
6
7
8
* Total number of cleanup areas in all facilities reaching that step of corrective action.
RFA RFI CMS CMI
0
18
6
6
Chart 1 — Performance Measure for State High Priority GPRA Sites FY’00Collective Percentage Complete = 47%
Chart 2 — Performance Measure for State High Priority GPRA Sites FY’01Collective Percentage Complete = 52%
14 Hazardous Waste Toxics Reduction Program
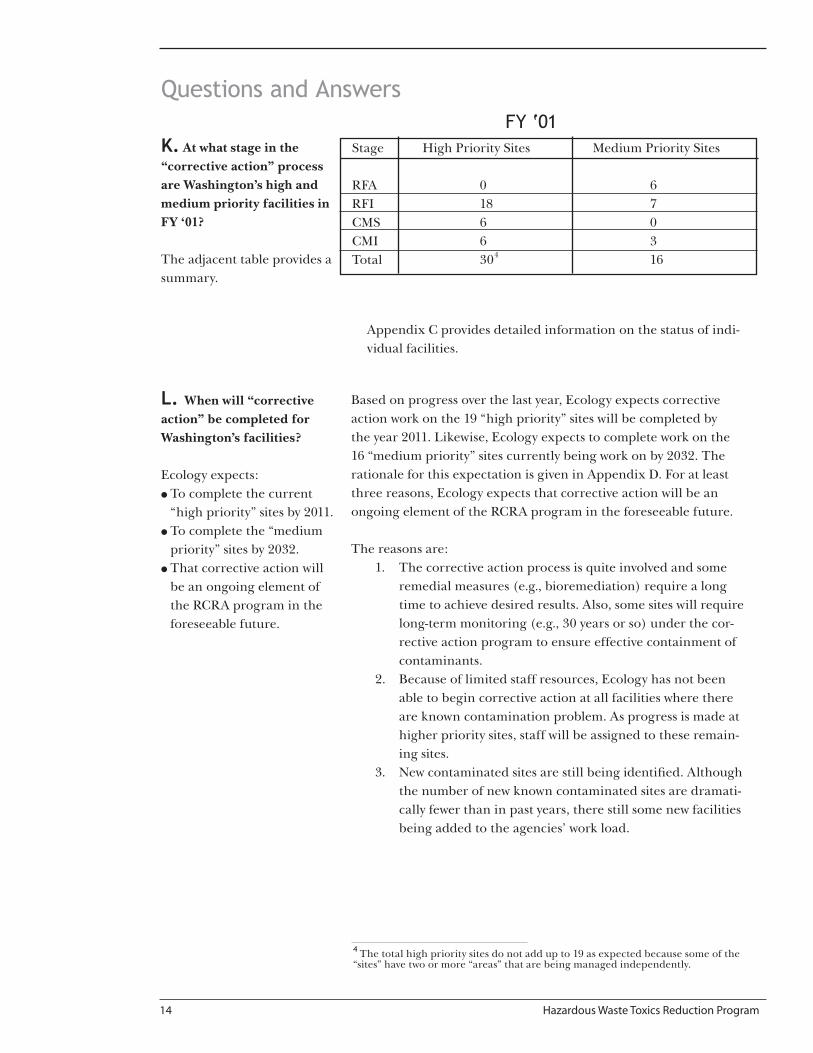
K. At what stage in the “corrective action” process are Washington’s high and medium priority facilities in FY ‘01?
The adjacent table provides a summary.
Appendix C provides detailed information on the status of indi-vidual facilities.
L. When will “corrective action” be completed for Washington’s facilities?
Ecology expects:● To complete the current
“high priority” sites by 2011.● To complete the “medium
priority” sites by 2032.● That corrective action will
be an ongoing element of the RCRA program in the foreseeable future.
Based on progress over the last year, Ecology expects corrective action work on the 19 “high priority” sites will be completed by the year 2011. Likewise, Ecology expects to complete work on the 16 “medium priority” sites currently being work on by 2032. The rationale for this expectation is given in Appendix D. For at least three reasons, Ecology expects that corrective action will be an ongoing element of the RCRA program in the foreseeable future.
The reasons are:1. The corrective action process is quite involved and some
remedial measures (e.g., bioremediation) require a long time to achieve desired results. Also, some sites will require long-term monitoring (e.g., 30 years or so) under the cor-rective action program to ensure effective containment of contaminants.
2. Because of limited staff resources, Ecology has not been able to begin corrective action at all facilities where there are known contamination problem. As progress is made at higher priority sites, staff will be assigned to these remain-ing sites.
3. New contaminated sites are still being identifi ed. Although the number of new known contaminated sites are dramati-cally fewer than in past years, there still some new facilities being added to the agencies’ work load.
Stage High Priority Sites Medium Priority Sites
RFA 0 6RFI 18 7CMS 6 0CMI 6 3Total 304 16
4 The total high priority sites do not add up to 19 as expected because some of the
“sites” have two or more “areas” that are being managed independently.
Questions and AnswersFY ‘01
Appendix A — Annual Progress Report on the Corrective Action Program in WA State A 1
Appendix AT
able
1. P
rog
ress
in
Co
rrec
tiv
e A
ctio
n f
or
all
Fac
ilit
ies
in W
ash
ing
ton
Sta
te
Pri
ori
ty
Lea
d
Ag
ency
‘C
lea
nu
ps
Pen
din
g’
Cle
an
up
Pen
din
g,
Data
So
urc
e
‘Ref
erre
d t
o
Oth
er
Au
tho
riti
es’
(RO
A)
RO
A D
ata
Sou
rce
‘Cle
an
up
s
In
Pro
gre
ss’
(CIP
)
CIP
Da
ta
So
urc
e
‘No F
urt
her
Act
ion
’
(NF
A)
NF
A D
ata
Sou
rces
Eco
log
y
1
.Cle
anC
are
2.
Cam
ero
n
17
P
erfo
rman
ce
Mea
sure
Sp
read
shee
t1
Hig
h
EP
A
6
PM
S2
2
1. V
an W
ater
s
2. P
end
leto
n
Eco
log
y
1
Am
eric
an P
lati
ng
1
3
PM
S3
2
1. G
eorg
ia P
acif
ic,
Res
ins
2. V
anco
uv
er A
ero
dro
me
Med
ium
EP
A
3
1. G
eorg
ia P
acif
ic,
Bel
lin
gh
am
2.
BP
A M
idw
ay
3.
McC
hord
Air
Fo
rce
Bas
e
13
P
MS
4
2
1.S
afet
y K
leen
,Au
bu
rn
2. G
reat
Wes
tern
Chem
ical
Lo
w
3
7
EP
A
Corr
ecti
ve
Act
ion
Rep
ort
5
Oth
er
Sit
es
Un
clas
s-
ifie
d
1
B
irm
ing
ham
Ste
el
7
1. L
idco
2. P
acif
ic W
oo
d
Tre
ater
s
3. S
eatt
le S
teel
4. F
airc
hil
d A
ir F
orc
e
Bas
e
5. K
eyport
, US
Nav
y
6.
Bre
mer
ton
, U
S
Nav
y
7. W
yco
ff
3
1.W
ash
ing
ton
Chem
ical
2. W
este
rn
Far
m S
erv
ice
3. S
iem
ens
Po
wer
7 6
1
. L
ehig
h P
ort
lan
d
Cem
ent
2. Q
uee
n C
ity F
arm
s
3.
Ref
lex
Rec
ycl
ing
4. P
ort
of
Sh
elto
n
5. T
osc
o R
efin
ing
6. W
hid
bey
Isl
and, U
SN
7. P
ort
Had
lock
WP
NS
TA
To
tals
38
13
52
13
1 C
AC
on
cep
tual
Dra
win
g 1
0.x
.s.S
hee
t:S
tate
Hi
Pri
ori
ty G
PR
A S
ites
2 I
bid
, S
hee
t: E
PA
Hig
h G
PR
A S
ites
3 I
bid
, S
hee
t: S
tate
Med
ium
GP
RA
Sit
es
4 I
bid
, S
hee
t: E
PA
Med
ium
GP
RA
Sit
es
5 R
epo
rt R
un
: Ja
nuar
y 1
, 2
00
1 R
CR
A I
nfo
6 N
ot
Cla
ssif
ied
B 1 Hazardous Waste Toxics Reduction Program
Appendix B
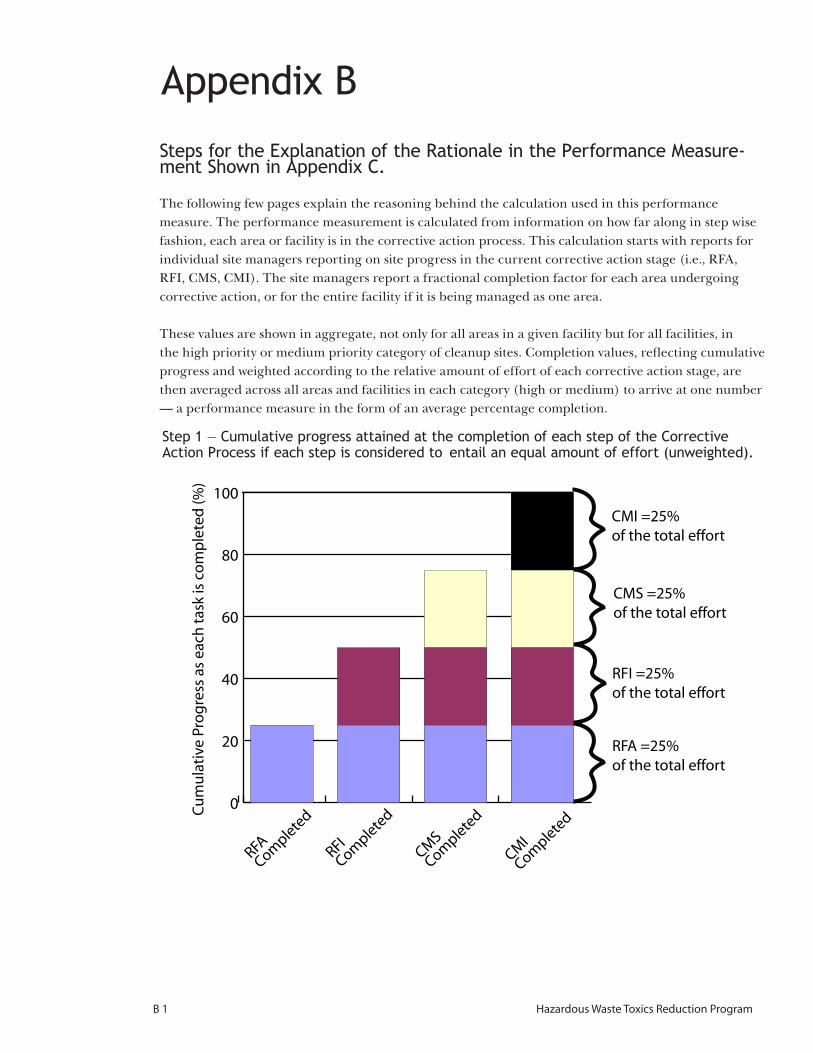
Step 1 — Cumulative progress attained at the completion of each step of the Corrective Action Process if each step is considered to entail an equal amount of effort (unweighted).
CMI =25% of the total effort
CMS =25% of the total effort
RFI =25% of the total effort
RFA =25% of the total effort
Cu
mu
lati
ve P
rog
ress
as
each
tas
k is
co
mp
lete
d (%
)
RFA
Complete
d
RFI
Complete
d
CMS
Complete
d
CMI
Complete
d0
20
40
60
80
100
Steps for the Explanation of the Rationale in the Performance Measure-ment Shown in Appendix C.
The following few pages explain the reasoning behind the calculation used in this performance measure. The performance measurement is calculated from information on how far along in step wise fashion, each area or facility is in the corrective action process. This calculation starts with reports for individual site managers reporting on site progress in the current corrective action stage (i.e., RFA, RFI, CMS, CMI). The site managers report a fractional completion factor for each area undergoing corrective action, or for the entire facility if it is being managed as one area.
These values are shown in aggregate, not only for all areas in a given facility but for all facilities, in the high priority or medium priority category of cleanup sites. Completion values, refl ecting cumulative progress and weighted according to the relative amount of effort of each corrective action stage, are then averaged across all areas and facilities in each category (high or medium) to arrive at one number — a performance measure in the form of an average percentage completion.
Appendix B— Annual Progress Report on the Corrective Action Program in WA State B 2
Appendix B
Step 2 — Cumulative progress attained at the completion of each step of the Corrective Action Process if each step is weighted for actual effort entailed (weighted).
CMI =32% of the total effort
CMS =16% of the total effort
RFI =43% of the total effort
RFA =9% of the total effortC
um
ula
tive
Pro
gre
ss a
s ea
ch t
ask
is c
om
ple
ted
(%)
RFA
Complete
d
RFI
Complete
d
CMS
Complete
d
CMI
Complete
d0
20
40
60
80
100
B 3 Hazardous Waste Toxics Reduction Program
Appendix B
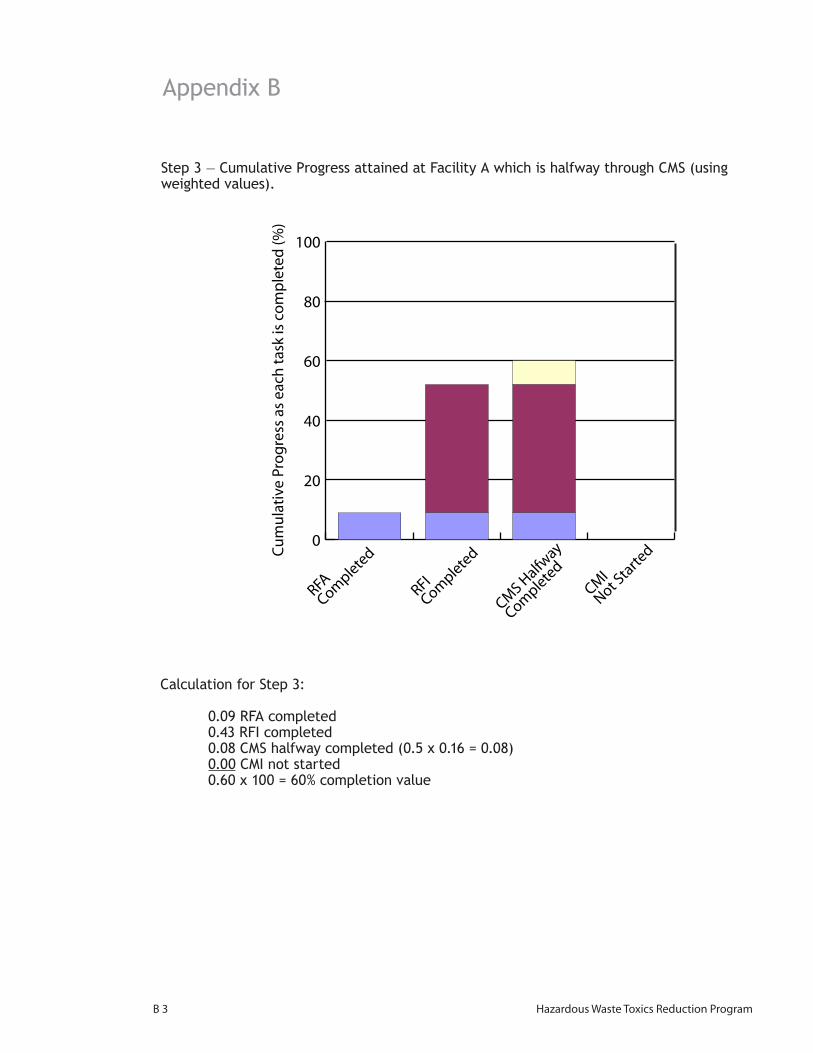
Step 3 — Cumulative Progress attained at Facility A which is halfway through CMS (using weighted values).
Cu
mu
lati
ve P
rog
ress
as
each
tas
k is
co
mp
lete
d (%
)
RFA
Complete
d
RFI
Complete
d
CMS H
alfway
Complete
d
CMI
Not Sta
rted
0
20
40
60
80
100
Calculation for Step 3:
0.09 RFA completed 0.43 RFI completed 0.08 CMS halfway completed (0.5 x 0.16 = 0.08) 0.00 CMI not started 0.60 x 100 = 60% completion value
Appendix B— Annual Progress Report on the Corrective Action Program in WA State B 4
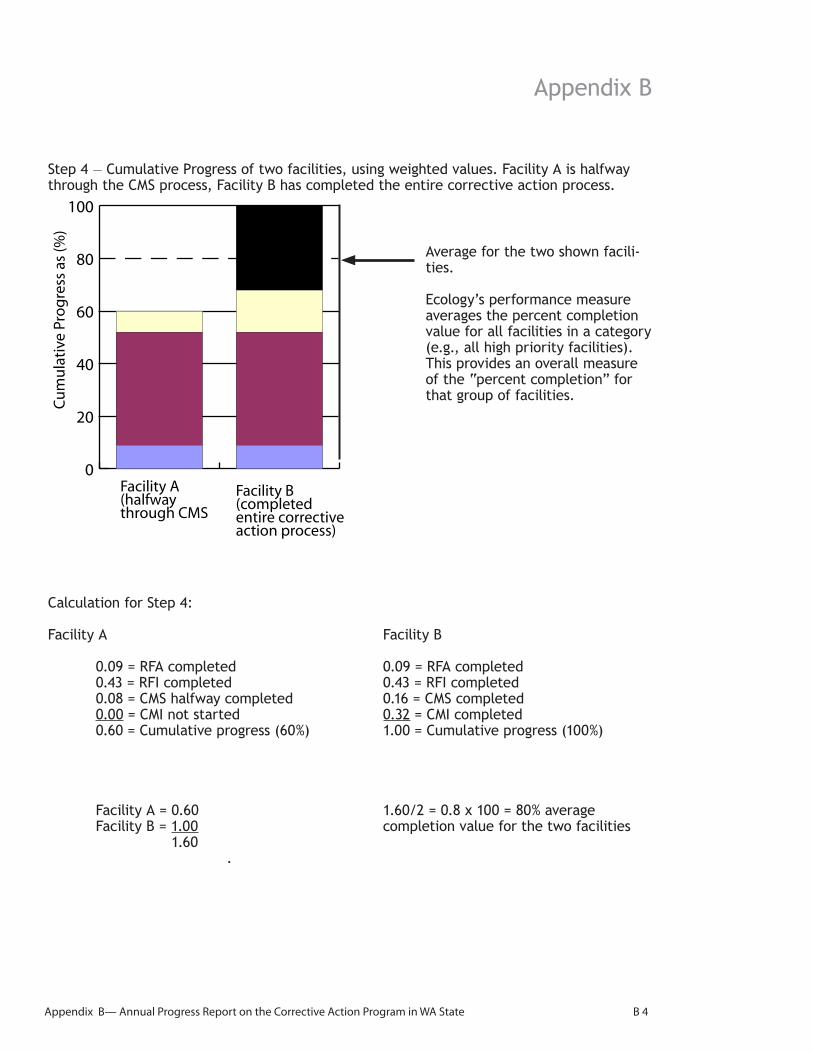
Step 4 — Cumulative Progress of two facilities, using weighted values. Facility A is halfway through the CMS process, Facility B has completed the entire corrective action process.
Appendix BC
um
ula
tive
Pro
gre
ss a
s (%
)
Facility A(halfway through CMS
Facility B(completed entire correctiveaction process)
0
20
40
60
80
100
Average for the two shown facili-ties.
Ecology’s performance measure averages the percent completion value for all facilities in a category (e.g., all high priority facilities). This provides an overall measure of the “percent completion” for that group of facilities.
Calculation for Step 4:
Facility A Facility B 0.09 = RFA completed 0.09 = RFA completed 0.43 = RFI completed 0.43 = RFI completed 0.08 = CMS halfway completed 0.16 = CMS completed 0.00 = CMI not started 0.32 = CMI completed 0.60 = Cumulative progress (60%) 1.00 = Cumulative progress (100%)
Facility A = 0.60 1.60/2 = 0.8 x 100 = 80% average Facility B = 1.00 completion value for the two facilities 1.60 .
B 5 Hazardous Waste Toxics Reduction Program
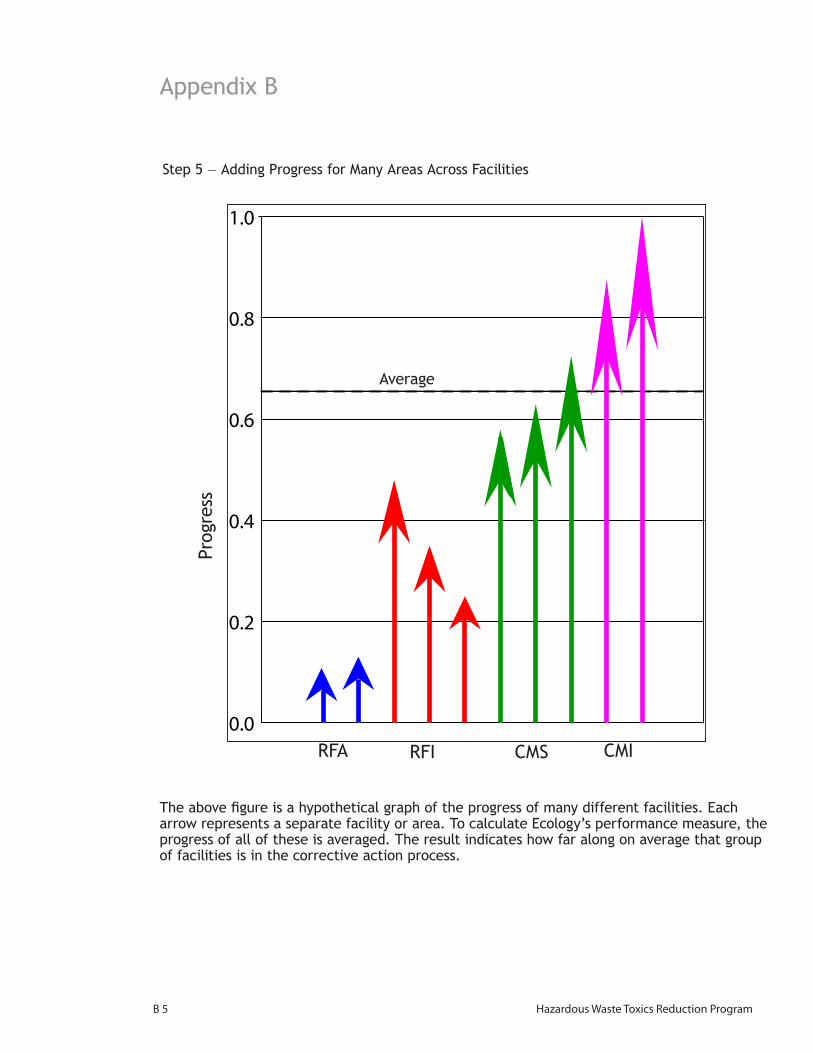
Step 5 — Adding Progress for Many Areas Across Facilities
Appendix B
0.0
0.2
0.4
0.6
0.8
1.0Pr
ogre
ss
RFA RFI CMS CMI
The above fi gure is a hypothetical graph of the progress of many different facilities. Each arrow represents a separate facility or area. To calculate Ecology’s performance measure, the progress of all of these is averaged. The result indicates how far along on average that group of facilities is in the corrective action process.
Average

Appendix C — Annual Progress Report on the Corrective Action Program in WA State C 1
Appendix C
3
18
7
7
# of CA
areas*
Sum
of P
rogre
ss T
o D
ate
, F
Bar
0
1
2
3
4
5
6
7
8
3
18
1
7
RFA RFI CMS CMI
* Total number of cleanup areas in all facilities reaching that step of corrective action.
Figure 2 — Summary Graph of Performance Measure for State High Priority GPRA Sites (FY 00)
Chart 3 — Summary Graph of Performance Measure for State High Priority GPRA Sites (FY 00)
Percent Complete = 47%
High Priority GPRA State Facilities (FY 00)
No. of Sites/Areas F Bar
RCRA Facility Assessment (RFA) 3 0.27
RCRA Facility Investigation (RFI) 18 6.44
Corrective Measure Study (CMS) 1 0.55
Corrective Measure Implementation (CMI) 7 6.34
Total 29 13.6
Percent Complete 47 %
C 2 Hazardous Waste Toxics Reduction Program
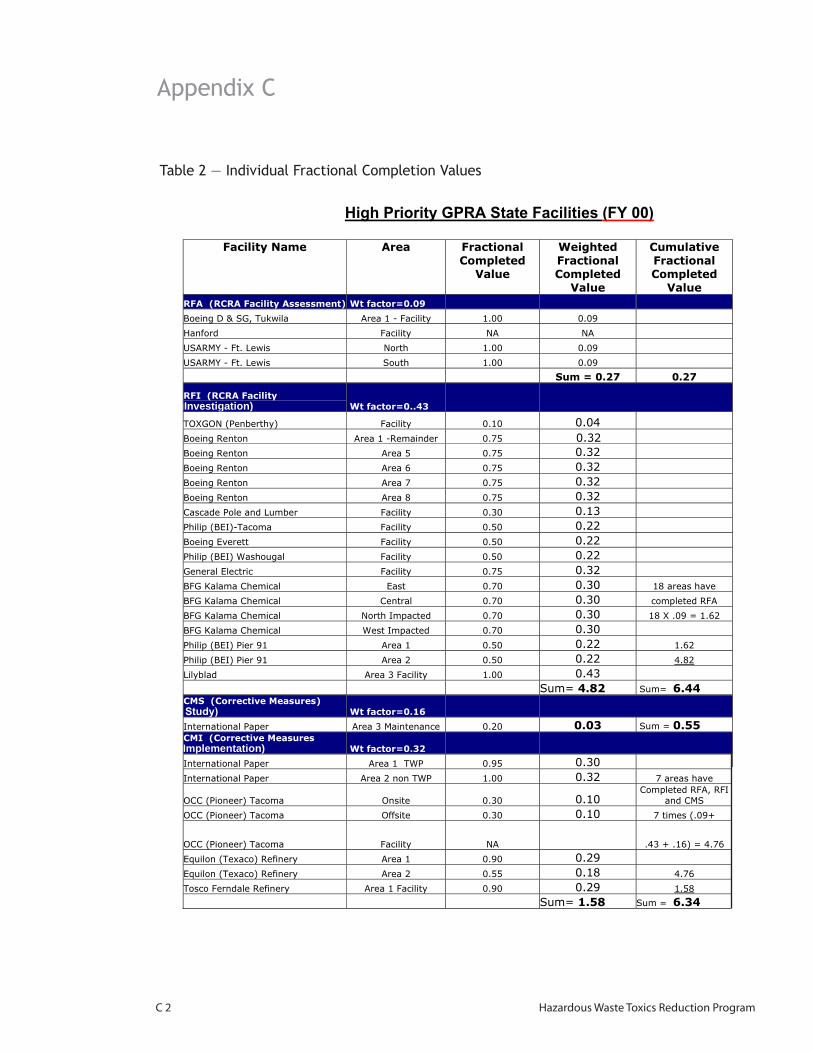
Table 2 — Individual Fractional Completion Values
Appendix C
High Priority GPRA State Facilities (FY 00)
Facility Name Area Fractional
Completed Value
Weighted
Fractional Completed
Value
Cumulative
Fractional Completed
Value
RFA (RCRA Facility Assessment) Wt factor=0.09
Boeing D & SG, Tukwila Area 1 - Facility 1.00 0.09
Hanford Facility NA NA
USARMY - Ft. Lewis North 1.00 0.09
USARMY - Ft. Lewis South 1.00 0.09
Sum = 0.27 0.27
RFI (RCRA Facility
IInvestigation) Wt factor=0..43
TOXGON (Penberthy) Facility 0.10 0.04
Boeing Renton Area 1 -Remainder 0.75 0.32
Boeing Renton Area 5 0.75 0.32
Boeing Renton Area 6 0.75 0.32
Boeing Renton Area 7 0.75 0.32
Boeing Renton Area 8 0.75 0.32
Cascade Pole and Lumber Facility 0.30 0.13
Philip (BEI)-Tacoma Facility 0.50 0.22
Boeing Everett Facility 0.50 0.22
Philip (BEI) Washougal Facility 0.50 0.22
General Electric Facility 0.75 0.32
BFG Kalama Chemical East 0.70 0.30 18 areas have
BFG Kalama Chemical Central 0.70 0.30 completed RFA
BFG Kalama Chemical North Impacted 0.70 0.30 18 X .09 = 1.62
BFG Kalama Chemical West Impacted 0.70 0.30
Philip (BEI) Pier 91 Area 1 0.50 0.22 1.62
Philip (BEI) Pier 91 Area 2 0.50 0.22 4.82
Lilyblad Area 3 Facility 1.00 0.43
Sum= 4.82 Sum= 6.44
CMS (Corrective Measures)
Study) Wt factor=0.16
International Paper Area 3 Maintenance 0.20 0.03 Sum = 0.55
CMI (Corrective Measures
Implementation) Wt factor=0.32
International Paper Area 1 TWP 0.95 0.30
International Paper Area 2 non TWP 1.00 0.32 7 areas have
OCC (Pioneer) Tacoma Onsite 0.30 0.10 Completed RFA, RFI
and CMS
OCC (Pioneer) Tacoma Offsite 0.30 0.10 7 times (.09+
OCC (Pioneer) Tacoma Facility NA .43 + .16) = 4.76
Equilon (Texaco) Refinery Area 1 0.90 0.29
Equilon (Texaco) Refinery Area 2 0.55 0.18 4.76
Tosco Ferndale Refinery Area 1 Facility 0.90 0.29 1.58
Sum= 1.58 Sum = 6.34
Appendix C — Annual Progress Report on the Corrective Action Program in WA State C 3
Appendix C
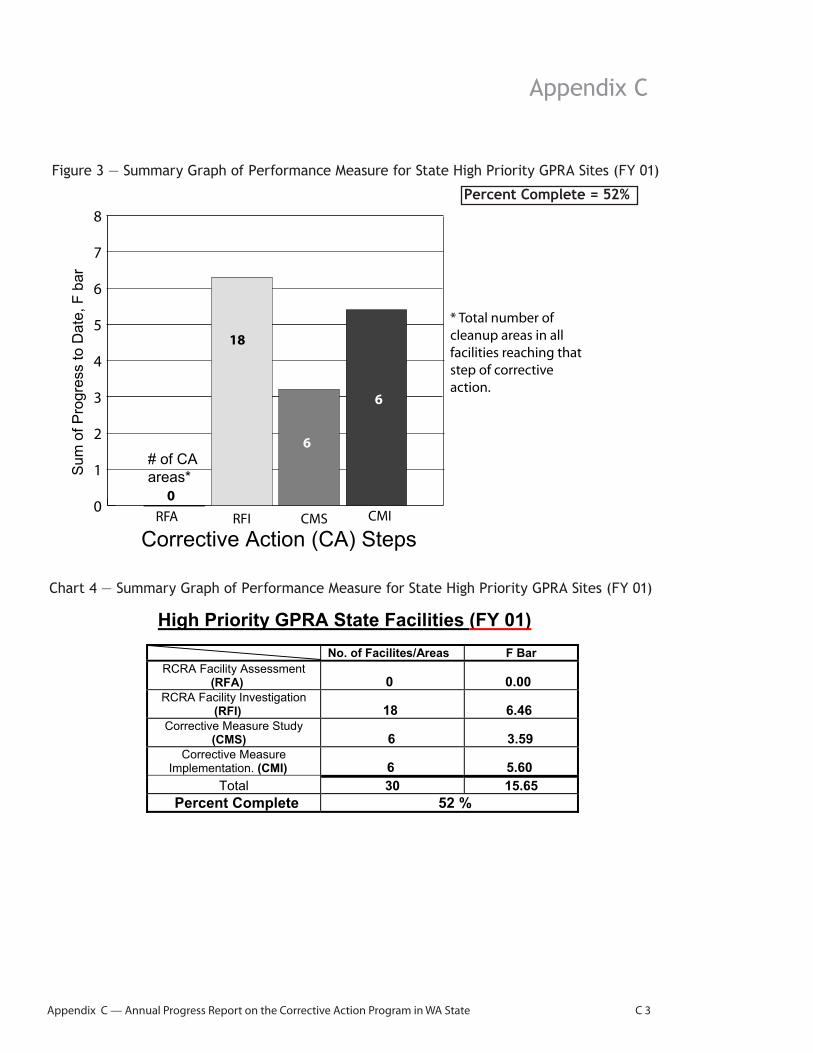
Figure 3 — Summary Graph of Performance Measure for State High Priority GPRA Sites (FY 01)
Chart 4 — Summary Graph of Performance Measure for State High Priority GPRA Sites (FY 01)
Sum
of P
rogre
ss to D
ate
, F
bar
Corrective Action (CA) Steps
# of CA
areas*
0
0
1
2
3
4
5
6
7
8
* Total number of cleanup areas in all facilities reaching that step of corrective action.
RFA RFI CMS CMI
0
18
6
6
Percent Complete = 52%
High Priority GPRA State Facilities (FY 01)
No. of Facilites/Areas F Bar
RCRA Facility Assessment (RFA) 0 0.00
RCRA Facility Investigation (RFI) 18 6.46
Corrective Measure Study (CMS) 6 3.59
Corrective Measure Implementation. (CMI) 6 5.60
Total 30 15.65
Percent Complete 52 %
C 4 Hazardous Waste Toxics Reduction Program
Appendix C
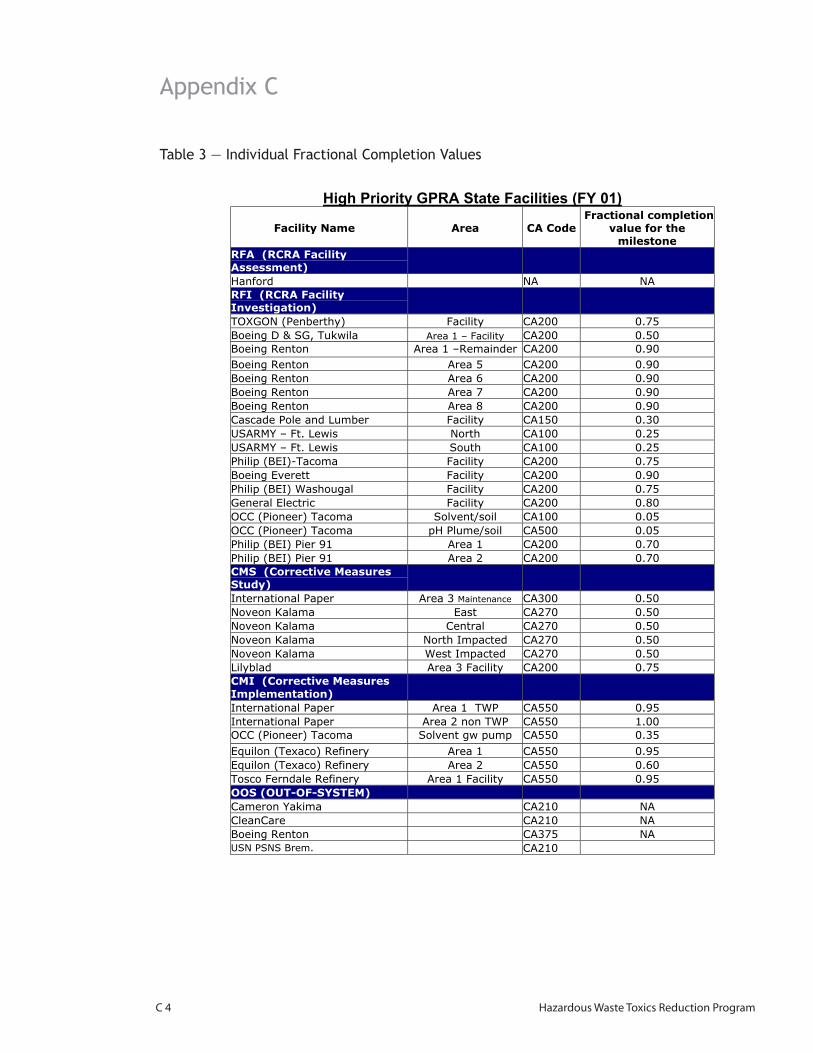
Table 3 — Individual Fractional Completion Values
High Priority GPRA State Facilities (FY 01)
Facility Name
Area
CA Code
Fractional completion
value for the milestone
RFA (RCRA Facility Assessment)
Hanford NA NA
RFI (RCRA Facility Investigation)
TOXGON (Penberthy) Facility CA200 0.75
Boeing D & SG, Tukwila Area 1 – Facility CA200 0.50
Boeing Renton Area 1 –Remainder CA200 0.90
Boeing Renton Area 5 CA200 0.90
Boeing Renton Area 6 CA200 0.90
Boeing Renton Area 7 CA200 0.90
Boeing Renton Area 8 CA200 0.90
Cascade Pole and Lumber Facility CA150 0.30
USARMY – Ft. Lewis North CA100 0.25
USARMY – Ft. Lewis South CA100 0.25
Philip (BEI)-Tacoma Facility CA200 0.75
Boeing Everett Facility CA200 0.90
Philip (BEI) Washougal Facility CA200 0.75
General Electric Facility CA200 0.80
OCC (Pioneer) Tacoma Solvent/soil CA100 0.05
OCC (Pioneer) Tacoma pH Plume/soil CA500 0.05
Philip (BEI) Pier 91 Area 1 CA200 0.70
Philip (BEI) Pier 91 Area 2 CA200 0.70
CMS (Corrective Measures Study)
International Paper Area 3 Maintenance CA300 0.50
Noveon Kalama East CA270 0.50
Noveon Kalama Central CA270 0.50
Noveon Kalama North Impacted CA270 0.50
Noveon Kalama West Impacted CA270 0.50
Lilyblad Area 3 Facility CA200 0.75
CMI (Corrective Measures
Implementation)
International Paper Area 1 TWP CA550 0.95
International Paper Area 2 non TWP CA550 1.00
OCC (Pioneer) Tacoma Solvent gw pump CA550 0.35
Equilon (Texaco) Refinery Area 1 CA550 0.95
Equilon (Texaco) Refinery Area 2 CA550 0.60
Tosco Ferndale Refinery Area 1 Facility CA550 0.95
OOS (OUT-OF-SYSTEM)
Cameron Yakima CA210 NA
CleanCare CA210 NA
Boeing Renton CA375 NA
USN PSNS Brem. CA210
Appendix C — Annual Progress Report on the Corrective Action Program in WA State C 5
Appendix C
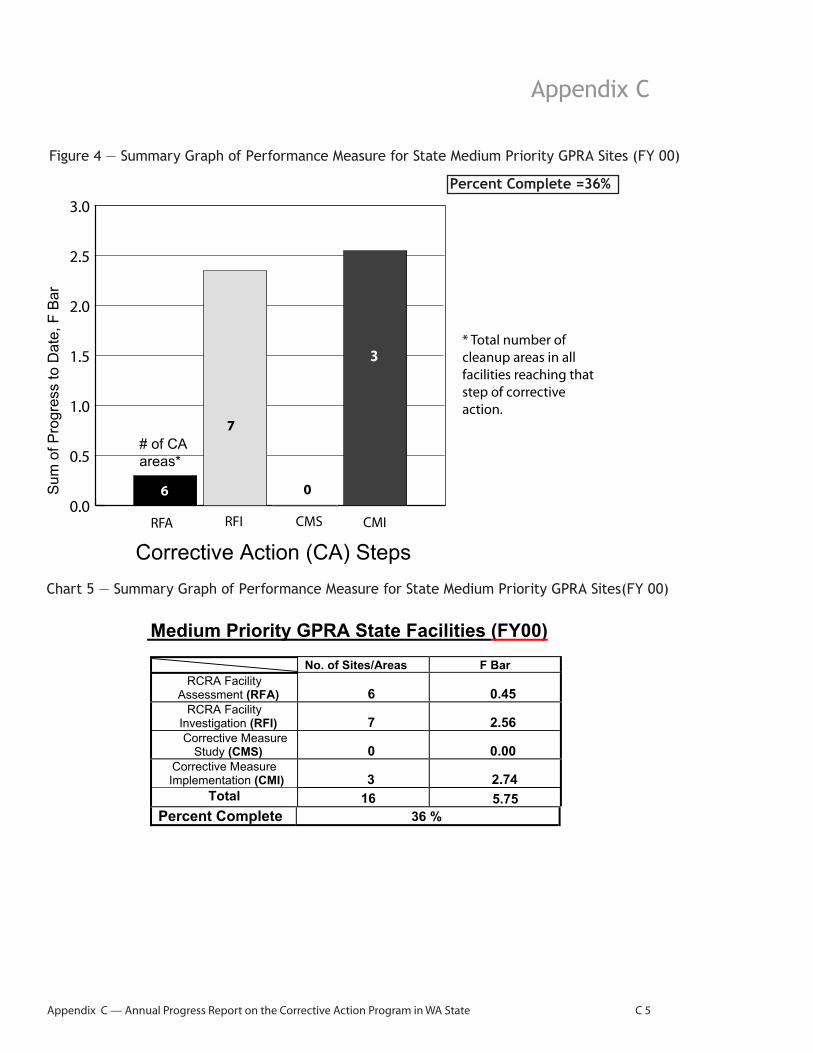
Figure 4 — Summary Graph of Performance Measure for State Medium Priority GPRA Sites (FY 00)
Chart 5 — Summary Graph of Performance Measure for State Medium Priority GPRA Sites(FY 00)
Sum
of P
rogre
ss to D
ate
, F
Bar
Corrective Action (CA) Steps
# of CA
areas*
* Total number of cleanup areas in all facilities reaching that step of corrective action.
RFA RFI CMS CMI0.0
0.5
1.0
1.5
2.0
2.5
3.0
6
7
0
3
Percent Complete =36%
Medium Priority GPRA State Facilities (FY00)
No. of Sites/Areas F Bar
RCRA Facility Assessment (RFA) 6 0.45
RCRA Facility Investigation (RFI) 7 2.56 Corrective Measure
Study (CMS) 0 0.00 Corrective Measure Implementation (CMI) 3 2.74
Total 16 5.75
Percent Complete 36 %
C 6 Hazardous Waste Toxics Reduction Program
Appendix C
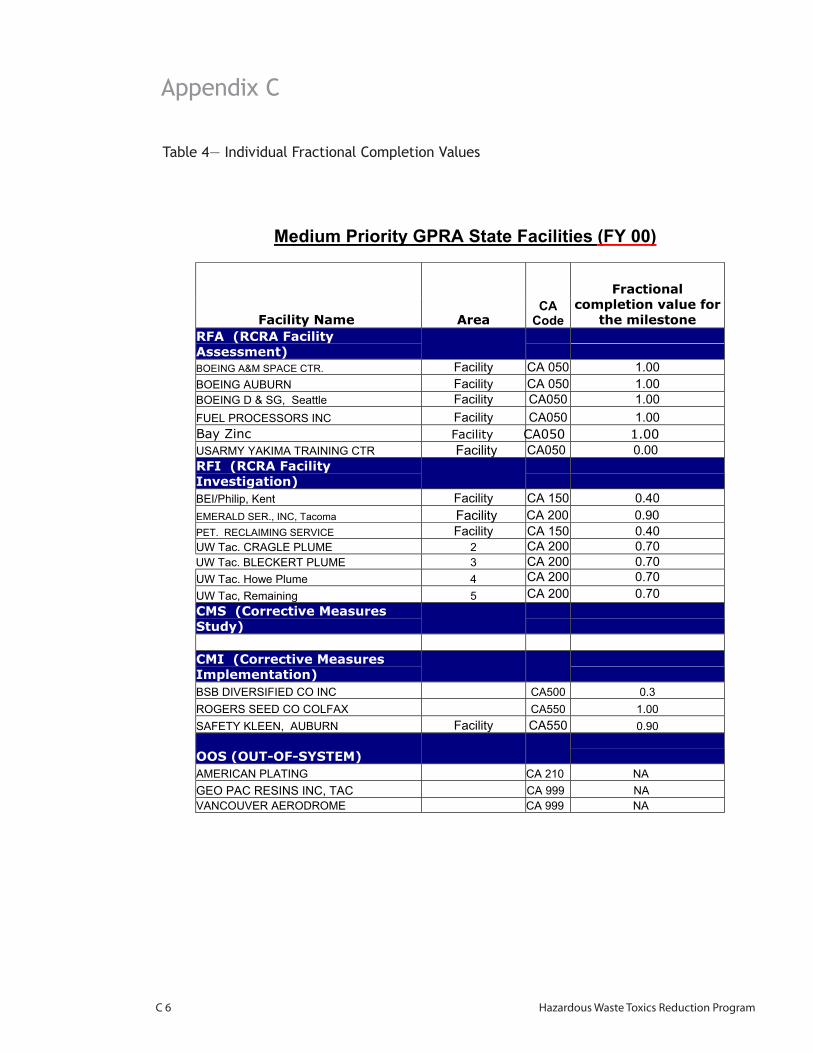
Table 4— Individual Fractional Completion Values
Medium Priority GPRA State Facilities (FY 00)
Facility Name Area CA
Code
Fractional completion value for
the milestone
RFA (RCRA Facility
Assessment)
BOEING A&M SPACE CTR. Facility CA 050 1.00
BOEING AUBURN Facility CA 050 1.00
BOEING D & SG, Seattle Facility CA050 1.00
FUEL PROCESSORS INC Facility CA050 1.00
Bay Zinc Facility CA050 1.00
USARMY YAKIMA TRAINING CTR Facility CA050 0.00
RFI (RCRA Facility
Investigation)
BEI/Philip, Kent Facility CA 150 0.40
EMERALD SER., INC, Tacoma Facility CA 200 0.90
PET. RECLAIMING SERVICE Facility CA 150 0.40
UW Tac. CRAGLE PLUME 2 CA 200 0.70
UW Tac. BLECKERT PLUME 3 CA 200 0.70
UW Tac. Howe Plume 4 CA 200 0.70
UW Tac, Remaining 5 CA 200 0.70
CMS (Corrective Measures
Study)
CMI (Corrective Measures Implementation)
BSB DIVERSIFIED CO INC CA500 0.3
ROGERS SEED CO COLFAX CA550 1.00
SAFETY KLEEN, AUBURN Facility CA550 0.90
OOS (OUT-OF-SYSTEM)
AMERICAN PLATING CA 210 NA
GEO PAC RESINS INC, TAC CA 999 NA
VANCOUVER AERODROME CA 999 NA
Appendix C — Annual Progress Report on the Corrective Action Program in WA State C 7
Appendix C
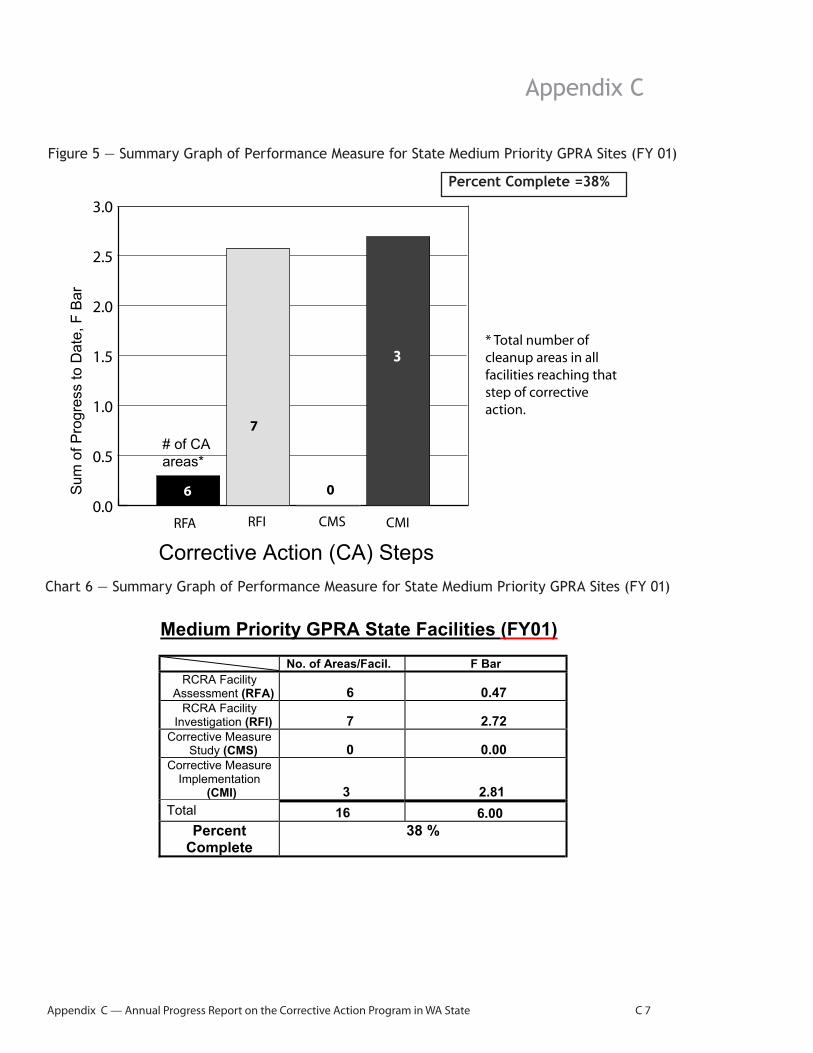
Figure 5 — Summary Graph of Performance Measure for State Medium Priority GPRA Sites (FY 01)
Chart 6 — Summary Graph of Performance Measure for State Medium Priority GPRA Sites (FY 01)
Percent Complete =38%
Sum
of P
rogre
ss to D
ate
, F
Bar
Corrective Action (CA) Steps
# of CA
areas*
* Total number of cleanup areas in all facilities reaching that step of corrective action.
RFA RFI CMS CMI0.0
0.5
1.0
1.5
2.0
2.5
3.0
6
7
0
3
Medium Priority GPRA State Facilities (FY01)
No. of Areas/Facil. F Bar
RCRA Facility Assessment (RFA) 6 0.47
RCRA Facility Investigation (RFI) 7 2.72
Corrective Measure Study (CMS) 0 0.00
Corrective Measure Implementation
(CMI) 3 2.81 Total 16 6.00
Percent Complete
38 %
C 8 Hazardous Waste Toxics Reduction Program
Appendix C
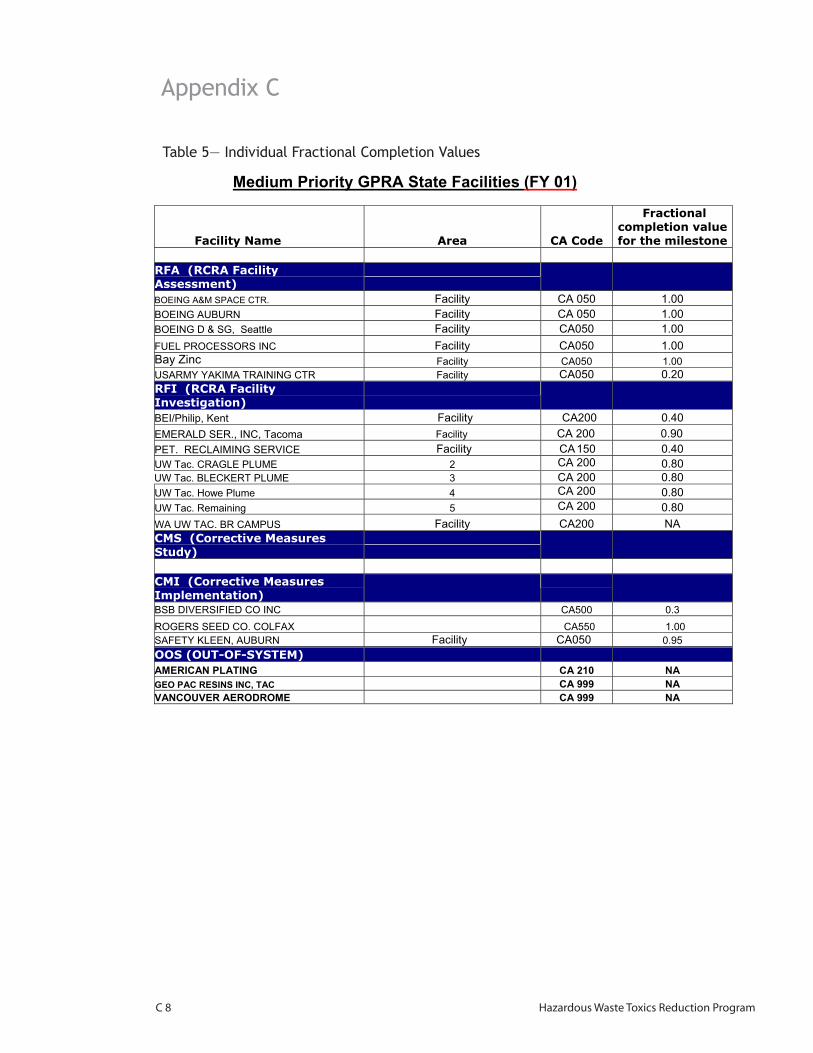
Table 5— Individual Fractional Completion Values
Medium Priority GPRA State Facilities (FY 01)
Facility Name Area CA Code
Fractional completion value
for the milestone
RFA (RCRA Facility Assessment)
BOEING A&M SPACE CTR. Facility CA 050 1.00
BOEING AUBURN Facility CA 050 1.00
BOEING D & SG, Seattle Facility CA050 1.00
FUEL PROCESSORS INC Facility CA050 1.00
Bay Zinc Facility CA050 1.00
USARMY YAKIMA TRAINING CTR Facility CA050 0.20
RFI (RCRA Facility
Investigation)
BEI/Philip, Kent Facility CA200 0.40
EMERALD SER., INC, Tacoma Facility CA 200 0.90
PET. RECLAIMING SERVICE Facility CA 150 0.40
UW Tac. CRAGLE PLUME 2 CA 200 0.80
UW Tac. BLECKERT PLUME 3 CA 200 0.80
UW Tac. Howe Plume 4 CA 200 0.80
UW Tac. Remaining 5 CA 200 0.80
WA UW TAC. BR CAMPUS Facility CA200 NA
CMS (Corrective Measures
Study)
CMI (Corrective Measures
Implementation)
BSB DIVERSIFIED CO INC CA500 0.3
ROGERS SEED CO. COLFAX CA550 1.00
SAFETY KLEEN, AUBURN Facility CA050 0.95
OOS (OUT-OF-SYSTEM)
AMERICAN PLATING CA 210 NA
GEO PAC RESINS INC, TAC CA 999 NA
VANCOUVER AERODROME CA 999 NA
Appendix D— Annual Progress Report on the Corrective Action Program in WA State D 1
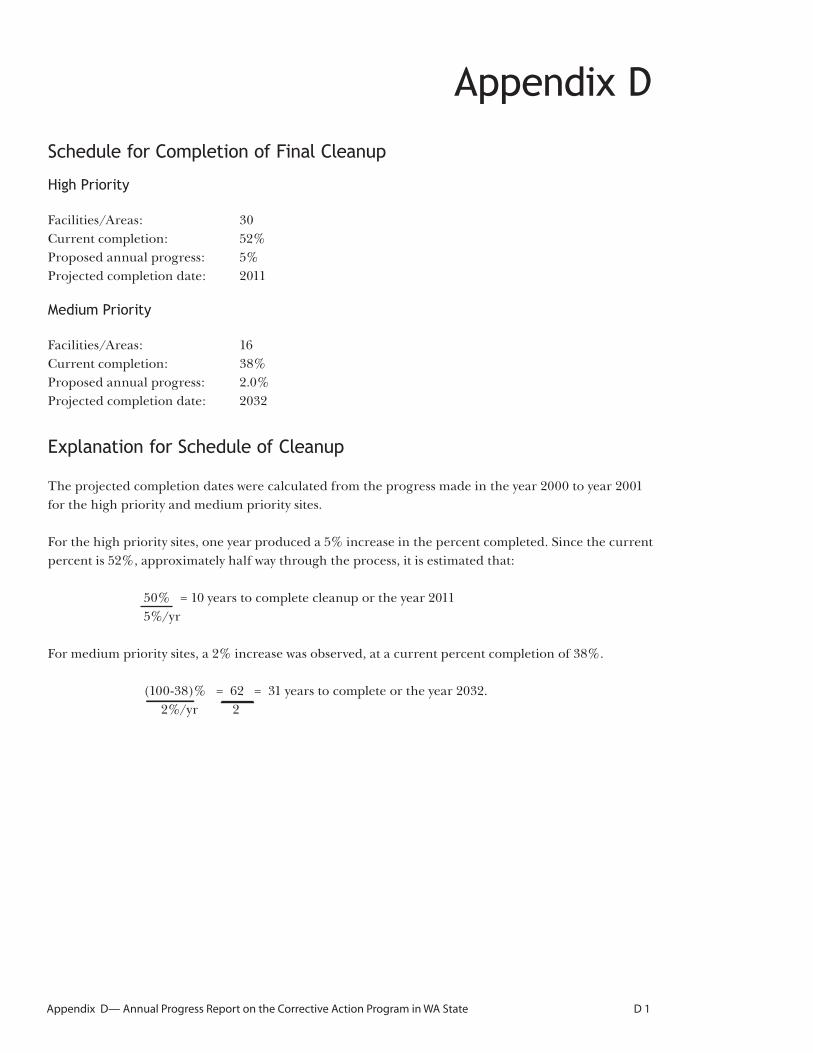
Schedule for Completion of Final Cleanup
High Priority
Facilities/Areas: 30Current completion: 52%Proposed annual progress: 5%Projected completion date: 2011
Medium Priority
Facilities/Areas: 16Current completion: 38%Proposed annual progress: 2.0%Projected completion date: 2032
Explanation for Schedule of Cleanup
The projected completion dates were calculated from the progress made in the year 2000 to year 2001 for the high priority and medium priority sites.
For the high priority sites, one year produced a 5% increase in the percent completed. Since the current percent is 52%, approximately half way through the process, it is estimated that:
50% = 10 years to complete cleanup or the year 2011 5%/yr
For medium priority sites, a 2% increase was observed, at a current percent completion of 38%.
(100-38)% = 62 = 31 years to complete or the year 2032. 2%/yr 2
Appendix D