annual report 2005 - metals x limited · • a development-ready, world class...
TRANSCRIPT

ANNUAL REPORT 2017

CORPORATE DIRECTORY
DIRECTORS Peter Newton (Non-Executive Chairman) Warren Hallam (Managing Director) Stephen Robinson (Executive Director) Simon Heggen (Non-Executive Director) Milan Jerkovic (Non-Executive Director) Yimin Zhang (Non-Executive Director)
COMPANY SECRETARY & CFO Fiona Van Maanen
KEY MANAGEMENT Allan King (Chief Operating Officer) Mark Recklies (General Manager – Renison Tin Operations) Michael Poepjes (Chief Mining Engineer)
REGISTERED OFFICE Level 5, 197 St Georges Terrace Perth WA 6000 Phone: +61 8 9220 5700 Fax: +61 8 9220 5757 Email: [email protected] Web: www.metalsx.com.au
POSTAL ADDRESS PO Box 7248 Cloisters Square PO WA 6850
SECURITIES EXCHANGE Listed on the Australian Securities Exchange ASX Code: MLX
SHARE REGISTRY Security Transfer Registrars Pty Ltd 770 Canning Highway Applecross WA 6153 Phone: 61-8-9315 2333 Fax: 61-8-9315 2233 E-mail: [email protected]
DOMICILE AND COUNTRY OF INCORPORATION Australia

CONTENTS
COMPANY PROFILE 1
REVIEW OF OPERATIONS 3
DIRECTORS’ REPORT 9
AUDITOR’S INDEPENDENCE DECLARATION 30
CONSOLIDATED STATEMENT OF COMPREHENSIVE INCOME FOR THE YEAR ENDED 30 JUNE 2017
31
CONSOLIDATED STATEMENT OF FINANCIAL POSITION AS AT 30 JUNE 2017
32
CONSOLIDATED STATEMENT OF CASH FLOWS FOR THE YEAR ENDED 30 JUNE 2017
33
CONSOLIDATED STATEMENT OF CHANGES IN EQUITY FOR THE YEAR ENDED 30 JUNE 2017
34
NOTES TO THE CONSOLIDATED FINANCIAL STATEMENTS FOR THE YEAR ENDED 30 JUNE 2017
35
DIRECTORS’ DECLARATION 82
INDEPENDENT AUDIT REPORT 83
TABLES OF MINERAL RESOURCES & ORE RESERVES AS AT 30 JUNE 2017
89
SECURITY HOLDER INFORMATION AS AT 28 AUGUST 2017
94

1 |
COMPANY PROFILE
Metals X Limited (Metals X or the Company) is a diversified Australian miner with substantial base metals operations:
• A globally significant tin miner through its 50% owned Tasmanian Joint Venture, producing approximately 7,000 tonnes per annum of tin in concentrate and expanding to approximately 8,500 tonnes per annum of tin in concentrate;
• A significant copper miner, targeting to produce approximately 40,000 tonnes per annum of copper in concentrate;
• A development-ready, world class nickel-cobalt-scandium project;
• A strong balance sheet and fiscal position, with approximately $113 million in cash and working capital.
Metals X currently has two producing assets; the Renison Tin Operations (50%-owned Joint Venture) in Tasmania and the Nifty Copper Operations in Western Australia. The Company also owns the Wingellina nickel-cobalt-scandium deposit (Central Musgrave Nickel Project), one of the world’s largest undeveloped nickel and cobalt resources. The existing operations provide strong cash flow and organic growth opportunities.
The Company is in a unique position as the only significant publicly listed tin producer on the ASX, and remains as one of few publicly listed tin producers in the western world. The Tin Division has aggregated Mineral Resources containing approximately 316,000 tonnes of tin and aggregated Ore Reserves containing approximately 173,000 tonnes of tin*. Renison currently is being expanded by approximately 15-20% with the introduction of ore sorting. In addition, an updated feasibility study for the Rentails Project (tin tailings re-treatment project) has recently been completed which demonstrates a high margin project. Discussions have commenced with various parties in relation to financing options and establishing the timing of long lead time items, final approvals and the capacity of suppliers to service Rentails.
The Nifty Copper Operations (Nifty) were acquired through the Company’s takeover of Aditya Birla Minerals Limited (Aditya Birla) that was completed on 29 August 2016. Nifty produces a clean copper concentrate from an underground copper sulphide mine, with ore processed through a 2.5 million tonne-per-annum copper concentrator. Nifty has aggregated Mineral Resources containing approximately 770,000 tonnes of copper and aggregated Ore Reserves containing approximately 153,500 tonnes of copper**. Metals X has significantly extended the Nifty mine to the east, west and down-plunge with a combination of underground and surface drill programs.
Base Metals Location Map

| 2
COMPANY PROFILE (CONTINUED)
The Copper Division, in addition to Nifty, also has the Maroochydore Copper Project located approximately 85 kilometres to the south-east of Nifty. Maroochydore already hosts aggregated Mineral Resources of approximately 486,000 tonnes of copper and 18,500 tonnes of cobalt, mainly in oxides. A drilling program to define the extent of sulphides, which are located beneath the oxides, will commence during the September 2017 quarter.
The Wingellina nickel–cobalt-scandium project, which forms part of the Company’s Central Musgrave Nickel Project, is a world-class deposit. Wingellina has aggregated Mineral Resources containing approximately 2.0 million tonnes of nickel and over 150,000 of cobalt***. A feasibility study completed in 2008 proposes a minimum 40 year project producing at an annual rate of 40,000 tonnes of nickel and 3,000 tonnes of cobalt. A current focus of activity is a drilling campaign targeting high grade cobalt zones within the orebody.
Metals X has received the required approvals, including Native Title and Environmental, to proceed with the development of Wingellina. Development of the project will be contingent upon nickel price improvement and funding.
* For further details on Total Mineral Resource and Reserve Estimates for the Renison Tin Operations refer to ASX announcement dated 28 August 2017.
** For further details on Total Mineral Resource and Reserve Estimates for the Nifty Copper Operations refer to ASX announcement dated 31 May 2017.
*** For further details on Total Mineral Resource and Reserve Estimates for the Central Musgrave Nickel Project refer to ASX announcement dated 18 August 2016.

3 |
REVIEW OF OPERATIONS
CORPORATE On 1 August 2016 Metals X took control of the Nifty Copper Operations and moved to compulsory acquisition of Aditya Birla. The acquisition was completed on 29 August 2016.
On 4 August 2016 Metals X announced that it would undertake a placement to raise $100,600,000 and a Share Purchase Plan (SPP) to raise up to $15,000,000. In addition, it announced that it proposed to demerge its gold business to create a pure gold company Westgold Resources Limited (Westgold) and a base metals company (Metals X Limited).
The demerger was effective from 1 December 2016 with each shareholder receiving an equivalent ownership in Westgold.
CAPITAL RAISING On 9 August 2016 the Company completed an institutional placement of $100,600,000 and issued 68,000,000 new fully paid ordinary shares in the Company at an issue price of $1.48 per share.
On 8 September 2016 the Company completed a capital raising via a Share Purchase Plan (SPP). Under the SPP, eligible shareholders were invited to invest up to $15,000 at $1.48 per share subject to an overall cap on the SPP of $15,000,000. The SPP closed oversubscribed and the Company issued 10,134,315 new fully paid ordinary shares in the Company to raise $14,999,413.
WESTGOLD RESOURCES LIMITED DEMERGER On 24 November 2016 at an Extraordinary General Meeting Metals X shareholders approved the demerger of Metals X’s gold assets via a capital reduction and in specie distribution of all the shares in Westgold. The demerger was effective on 1 December 2016 and trading of Westgold commenced 6 December 2016 on the Australian Securities Exchange (ASX). ADITYA BIRLA MINERALS LIMITED TAKEOVER OFFER On 15 October 2015 the Company announced an off-market takeover bid to acquire 100% of the ordinary shares in Aditya Birla. The original offer of 1 Metals X share for every 5 Aditya Birla shares was increased on 7 December 2015 to 1 Metals X share for every 4.75 Aditya Birla shares.
On 18 July 2016 the Company announced that Aditya Birla’s 51% major shareholder Hindalco Industries Limited had received regulatory approval from the Reserve Bank of India to accept the Metals X takeover offer. Accordingly, Metals X increased the Offer consideration to 1 Metals X share for every 4.5 Aditya Birla shares, plus $0.08 in cash for every Aditya Birla share.
On 20 July 2016 the Company announced it had obtained 85.18% acceptances under the Aditya Birla off-market takeover offer and that it had gained control of Aditya Birla.
On 21 July 2016 the Company drew down on a $25,000,000 cash advance facility with Citibank N.A. to pay the cash consideration to Aditya Birla shareholders, which was subsequently repaid on 21 October 2016.
On 22 July 2016 the Company announced it had obtained 90.06% acceptances under the Aditya Birla off-market takeover offer and that it would proceed to compulsorily acquire the remaining interests in Aditya Birla.
On 29 July 2016 the Aditya Birla off-market takeover offer closed with the Company obtaining 94.75% acceptances with the Company compulsorily acquiring the remaining interest to gain 100% ownership. The acquisition was completed on 29 August 2016.

| 4
COPPER DIVISION The Copper Division holds two key assets: 1. Nifty Copper Operations; and 2. Maroochydore Copper Project.
NIFTY COPPER OPERATIONS Nifty is an underground copper sulphide mine with an associated 2.5Mtpa copper concentrator. Site infrastructure is extensive, including a powerhouse, camp and airfield, Processing of sulphide copper ore is by conventional comminution, grinding and flotation to produce a clean copper concentrate. A concentrate storage facility is located at Port Hedland where concentrate is accumulated before shipping for smelting and refining.
The focus of the Company since acquisition of Nifty has been to increase the production rate, returning the process plant to continuous operation, and to extend the mine life. The objective is to transform Nifty into a large, long-life mine, with an annualised production rate in excess of 40,000 tonnes of contained copper in concentrate. Currently the plant runs on a campaign basis and has approximately 40% spare capacity.
Metals X is on track to achieve its production objective during 2018. In addition to the productivity improvements there has been a substantial reduction in operational costs at Nifty.
Over 20,000 meters of underground drilling has been completed at Nifty since acquisition. Metals X announced updated Mineral Resource and Ore Reserve estimates at 31 March 2017, increasing Ore Reserves by 59% and extending the current mine life to 4 – 5 years. Only a small percentage of the results of the underground exploration program were available to be incorporated into the March 2017 update and a further Mineral Resource and Ore Reserve update is planned to be completed in September 2017.
The Copper Division has excellent exploration upside potential, with a large land holding of approximately 3,220km2 including the Maroochydore Copper Project. There are a number of defined copper, cobalt and lead/zinc targets, with minimal expenditure having been incurred on these targets over the past 20 years. Metals X has conducted extensive geophysics programs and has developed and commenced a regional exploration program.
MAROOCHYDORE COPPER PROJECT The Maroochydore Copper Project is located 85 km’s from Nifty and manifests as a large copper oxide and secondary chalcocite blanket of mineralisation. Historic drilling has defined a copper oxide Mineral Resource estimate with contained copper and cobalt of approximately 0.5Mt and 19Kt respectively.
A small amount of copper sulphide mineralisation at depth was identified from historic drilling. However, the area is sparsely drilled and inadequately defined, with primary copper sulphide mineralisation remaining open along-strike and down-dip. Geophysical modelling of high resolution aeromagnetic data suggests that the Maroochydore deposit lies within a north-trending structural corridor with the possibility of a structural repetition of the mineralised horizon occurring to the west of the current resource area.
A drill program, as well as baseline environmental studies, is planned to commence at Maroochydore during the September 2017 quarter focused on the sulphide mineralisation.

5 |
REVIEW OF OPERATIONS (CONTINUED)
TIN DIVISION Metals X is a globally significant tin producer through its 50% ownership of the Renison Joint Venture (JV) which holds two key assets:
1. Renison Tin Operations; and 2. The Renison Tailings Retreatment Project.
RENISON TIN OPERATIONS (50%) The Renison Tin Operations (Renison) are located approximately 15km north-east of Zeehan on Tasmania’s west coast. The Renison resource includes over 20 million tonnes of historic tailings, which will be feed for the proposed Rentails Project, proximate to the processing plant.
The focus of the Company’s activities during the year was to continue to improve productivity to lower the overall costs at the operation while continuing to achieve further recovery improvements.
During the year ore sorting trials were completed which indicated that approximately 25% of the Renison underground feed to the processing plant, essentially waste that dilutes ore feed, can be rejected with tin losses of less than 3%. The ore sorter offers a cost effective expansion at Renison with an increase in mining production without the requirement to expand the processing plant. Earthworks commenced for installation of a new crushing circuit and ore sorter in the June 2017 quarter with practical completion scheduled for April 2018.
The ore sorter will require an increase in annualised mine production to approximately 920,000 tonnes while maintaining the processing plant at 720,000 tonnes per annum. Underground development has been ramped up and a significant stockpile of ore created at surface in readiness for commissioning of the ore sorter. Tin production is expected to increase by approximately 15-20% from current levels of approximately 7,000 tonnes per annum. The introduction of ore sorting is also expected to facilitate a re-optimisation of the current resource due to the resulting reduction in overall unit costs for Renison. RENISON TAILINGS RETREATMENT PROJECT (RENTAILS) Rentails provides the opportunity to expand production at the Renison Tin Operations through the re-processing and recovery of tin and copper from the historic tailings at Renison. An updated definitive feasibility study of Rentails was completed during the year based upon an 11-year project with an integrated 2Mtpa tin concentrator and tin fumer plant producing approximately 5,400 tonnes of tin and 2,200 tonnes of copper per year.
Based upon the favourable economics of the updated feasibility, Metals X and its joint venture partners have commenced discussions with various parties in relation to financing options and establishing long lead time items, final approvals and the capacity of suppliers to service Rentails.
When combined with Rentails and the ore sorter project, production from the Renison Tin Operations is anticipated to increase to approximately 13,400 - 13,900 tonnes of tin in concentrate per year, which is approximately 3.75% of the current global primary tin supply. The All-In Sustaining Costs (AISC) for the combined operations is anticipated to be less than A$17,000 per tonne which compares favourably to the prevailing tin price of over A$26,000 per tonne.

| 6
NICKEL DIVISION Metals X’s nickel strategy remains focused on the Central Musgrave Nickel Project that straddles the triple-point of the WA/NT/SA borders. The project represents the Company’s key nickel assets and comprises the globally significant Wingellina nickel-cobalt-scandium limonite deposit, the similar Claude Hills deposit and the Mt Davies exploration prospects. The project encompasses a large tract of prospective exploration tenure encompassing the whole of the Wingellina layered intrusive sub-set of the Giles Complex rocks in Western and Southern Australia.
Wingellina remains one of the largest undeveloped nickel–cobalt–scandium deposits in the world. Metals X has defined an Ore Reserve estimate of approximately 168 million tonnes containing 1.56 million tonnes of nickel, 123,000 tonnes of cobalt and a significant inventory of scandium and iron.
Metals X has completed a feasibility study (+/-25%) and has signed an agreement with the Traditional Owners which provides consent to undertake mining activities. Metals X has also received Environmental Protection Authority (EPA) approval to develop the project.
Despite the current depressed nickel price environment, Metals X has been collaborating with POSCO in regard to applying its propriety Nickel Extraction Process (PosNEP) to the Wingellina project and has tested ore through the PosNEP pilot plant in Korea. The purpose of the pilot was to trial an alternative processing route for high iron, low magnesium nickel ores. The trials were successful and discussions are ongoing as to the next steps in the possible commercialisation of the PosNEP process and the Wingellina project, including a potential modularisation of the process plant to facilitate a smaller scale start-up project, at a lower up-front capital cost, with additional trains to be subsequently added.
During the year Metals X reviewed the potential for high grade cobalt production from Wingellina. The review indicated that within the current resources a high grade cobalt domain of 29.7 million tonnes at 0.14% Co (cut-off grade of 0.1% Co) or 85.9 million tonnes at a grade of 0.11% Co (cut-off grade of 0.05% Co) could be mined. The Company is currently preparing a follow-up drill program and obtaining approvals to commence drilling the higher grade cobalt zones.
At the end of the period the Company completed a recoverable amount assessment that resulted in an impairment of the Central Musgrave Nickel Project of $73,378,360 (refer to note 42). The Company’s strategy is to continue to enhance the option value of the project by continuing to assess metallurgical processing alternatives to reduce the capital hurdle, and continuing its discussions with potential joint venture parties for the co-development of the project.

7 |
REVIEW OF OPERATIONS (CONTINUED)
GOLD DIVISION - DISCONTINUED OPERATION The gold division was demerged from Metals X effective as of 1 December 2016 via an in-specie distribution and capital reduction and subsequent ASX listing of Westgold (refer to note 41). The Gold Division’s key assets were: 1. The Higginsville Gold Operation (HGO); 2. The Central Murchison Gold Project (CMGP); 3. The South Kalgoorlie Operation (SKO); 4. The Fortnum Gold Project (FGP); and 5. The Rover Project.
THE HIGGINSVILLE GOLD OPERATION HGO is centred around the main infrastructure of a modern 1.3Mtpa CIP plant and its infrastructure, and a 300 person village.
Mining at HGO during the period was from the Trident underground mine (which was closed in December 2016), Mt Henry open pit and the Lake Cowan group of open pits.
THE CENTRAL MURCHISON GOLD PROJECT The CMGP is centred upon the refurbished 2.0Mtpa process CIP plant and associated infrastructure. The project has numerous open pit and underground production options.
The overall consolidated CMGP project area has a number of historic gold mining centres and an aggregated gold production of nearly 10 million ounces. These include the Day Dawn, Cuddingwarra, Big Bell, Reedy, Nannine, Yaloginda, Paddy’s Flat and Meekatharra North gold mining centres with the bulk of historic production being sourced from a handful of larger underground mines.
Mining at CMGP during the period was from the Paddy’s Flat underground mine and a series of open pits. Development of the Comet underground mine commenced during the period, with dewatering of the Big Bell underground mine as an additional underground ore source is continuing.
THE SOUTH KALGOORLIE OPERATION The SKO operations are centred upon a 1.2Mtpa CIP plant and infrastructure. Numerous open pits and underground deposits have previously been mined within the tenement area since the late 1980’s.
Mining at SKO during the period was from the HBJ underground mine and George’s Reward open pit. Mining continued at the Cannon open pit mine which was subject to a mine financing and profit sharing agreement with Southern Gold Limited (SAU).
THE FORTNUM GOLD PROJECT The FGP is centred upon the historic mining centres of Labouchere, Fortnum, Horseshoe and Peak Hill, a 1.0M tpa CIL plant and a 100 person village.
Re-permitting was completed and refurbishment of the operation commenced during the period. Production, initially from low grade stockpiles was scheduled to commence by the end of March 2017. Open pit mining and the re-establishment of the Starlight underground mine will commence soon thereafter.
THE ROVER PROJECT The Rover Project is a postulated undercover repetition of the rich Tennant Creek goldfield 80km to the north-east. Exploration to date has so far tested a small number of anomalies and significant mineralised Iron Oxide Copper Gold systems have been discovered at the Rover 1 and Explorer 142 prospects. In addition, significant lead-zinc-silver discoveries have been made at Explorer 108 and recently at the Curiosity Prospect to its south. The project area is proximal to a major infrastructure corridor adjacent to Central Australian Railway, gas pipeline and Stuart Highway.

| 8
INVESTMENTS Metals X’s current investment holdings are:
• Nelson Resources Limited (formerly Mongolian Resource Corporation Limited) (ASX:NES) 21.77% (2016: 14.76%);
• Brainchip Holdings Limited (ASX:BRN) 6.69% (2016: 7.10%); and • Auris Minerals Limited (formerly RNI NL) (ASX:AUR) 0.85% (2016: 1.22%).
CORPORATE STRUCTURE

9 |
DIRECTORS’ REPORT
The Directors submit their report together with the financial and annual report of Metals X Limited and of the Consolidated Entity, being the Company and its controlled entities, for the year ended 30 June 2017.
DIRECTORS The names and details of the Company’s Directors in office during the financial period and until the date of this report are as follows. Directors were in office for this entire period unless otherwise stated.
Names, qualifications, experience and special responsibilities Peter Newton – Independent Non-Executive Chairman Mr Newton was a stockbroker for 25 years until 1994. Since then he has been a significant participant in the Australian resource industry as an investor and a director of a number of listed companies. In past years, he has been the Chairman of both Hill 50 Limited and Abelle Limited. Mr Newton is also the Chairman of the Company’s Remuneration & Nomination Committee and serves on the Audit & Risk Committee.
During the past three years he has served as a director of the following public listed companies: • Westgold Resources Limited *.
Warren Hallam - Managing Director Mr Hallam is a Metallurgist (B. App Sci (Metallurgy)), a Mineral Economist (MSc (Min. Econ)), holds a Graduate Diploma in finance and has around 30 years of technical and commercial experience within the resources industry.
During the past three years he has served as a director of the following public listed companies: • Westgold Resources Limited (Appointed 18 March 2010 – Resigned 2 February 2017).
Stephen Robinson – Executive Director (Appointed 25 November 2016) Mr Robinson holds a BSc and is an experienced Australian mining executive and a Rhodes Scholar. Mr Robinson has extensive international experience at senior executive levels within the mining industry and was recently the Non-Executive Chairman of Sumatra Copper and Gold Plc Previously he has been the Director of Business Development & Strategy at Barrick (Australia Pacific) Limited, Non-Executive Director of Orrex Resources Ltd and Bulletin Resources Ltd. Mr Robinson also served as Group Manager Planning with the leading Australian mineral sands producer Iluka Resources Ltd and was a senior manager in the gold business unit at WMC Resources Ltd.
During the past three years he has served as a director of the following public listed companies: • Sumatra Copper & Gold Plc (Appointed 8 July 2013 - Resigned 30 June 2017).
Simon Heggen – Independent Non-Executive Director Mr Heggen holds a Bachelor of Economics and a Bachelor of Laws Degrees from the Australian National University and has around 30 years proven experience in strategic planning, corporate development, M&A and corporate finance within the Resources sector. Mr Heggen is Chairman of the Company’s Audit Committee and also serves on the Remuneration & Nomination Committee.
During the past three years he has served as a director of the following public listed companies: • Auris Minerals Limited (formerly RNI NL) (Appointed 31 October 2015 – Resigned 25 November
2015).
Yimin Zhang – Non-Executive Director (Appointed 9 January 2017) Mr Zhang is the Chief Representative for Jinchuan Australia and is also an Executive Director of Sino Nickel Pty Limited. Mr Zhang has worked for Jinchuan since 1981 and has been posted to several overseas positions to which he has been involved in numerous Jinchuan co-operative ventures. Mr Zhang holds a Diploma from the Metallurgical and Architectural Institute of Chang Chun. Mr Zhang served as an Alternative Non-Executive Director for Mr Xie Penggen until 9 January 2017, at that time Mr Zhang was appointed a Non-Executive Director of the Company.
Mr Zhang has held no public company directorships in the past three years.
| 10
Xie Penggen – Non-Executive Director (Resigned 9 January 2017) Mr Xie Penggen is a minerals processing engineer with over 25 years of experience in the mining industry. Mr Xie commenced his career within the Jinchuan Group where he has undertaken various operational, technical and management roles. He is currently an executive in Jinchuan’s global investment group which is responsible for the Group’s international investments.
Mr Penggen has held no public company directorships in the past three years.
Milan Jerkovic – Independent Non-Executive Director (Appointed 1 May 2017) Mr Jerkovic has over 30 years of experience in the mining industry involving resource evaluation, operations, financing, acquisition, project development and general management. Mr Jerkovic is a Geologist with post graduate qualifications in Mineral Economics and Mining, is a Fellow of the Australian Institute of Mining and Metallurgy and a member of the Australasian Institute of Company Directors. He was previously the CEO of Straits Resources Limited and was the founding Chairman of Straits Asia Resources Limited which was listed on the Singapore Stock Exchange. Mr Jerkovic has also held positions with WMC, BHP, Nord Pacific, Hargraves, and Tritton. Mr Jerkovic is currently Chairman of both Geopacific Resources Limited and Blackham Resources Limited. Mr Jerkovic also serves on the Company’s Audit and Remuneration & Nomination Committees.
During the past three years he has served as a director of the following public listed companies: • Blackham Resources Limited * and: • Geopacific Resources Limited *.
Peter Cook – Chief Executive Officer and Executive Director (Resigned 2 February 2017) Mr Cook is a Geologist (BSc (Applied Geology)) and a Mineral Economist (MSc (Min. Econ), MAusIMM with over 30 years of experience in the fields of exploration, project, operational and corporate management of mining companies. Upon the demerger of Westgold Resources Limited Mr Cook resigned as an Executive Director and was appointed as a Non-Executive Director on 1 December 2016. Mr Cook resigned as a Non-Executive Director on 2 February 2017.
During the past three years he has served as a director of the following public listed companies: • Westgold Resources Limited; • Pantoro Limited (Appointed 31 August 2009 – Resigned 5 October 2016) and: • Brainchip Holdings Limited (Appointed 30 May 2011 – Resigned 10 September 2015).
Paul Cmrlec – Independent Non-Executive Director (Resigned 5 October 2016) Mr Cmrlec holds a Bachelor of Mining Engineering degree from the University of South Australia. He has considerable experience in feasibility studies, project development and operational management.
During the past three years he has served as a director of the following public listed company:
• Pantoro Limited *.
* Denotes current directorship
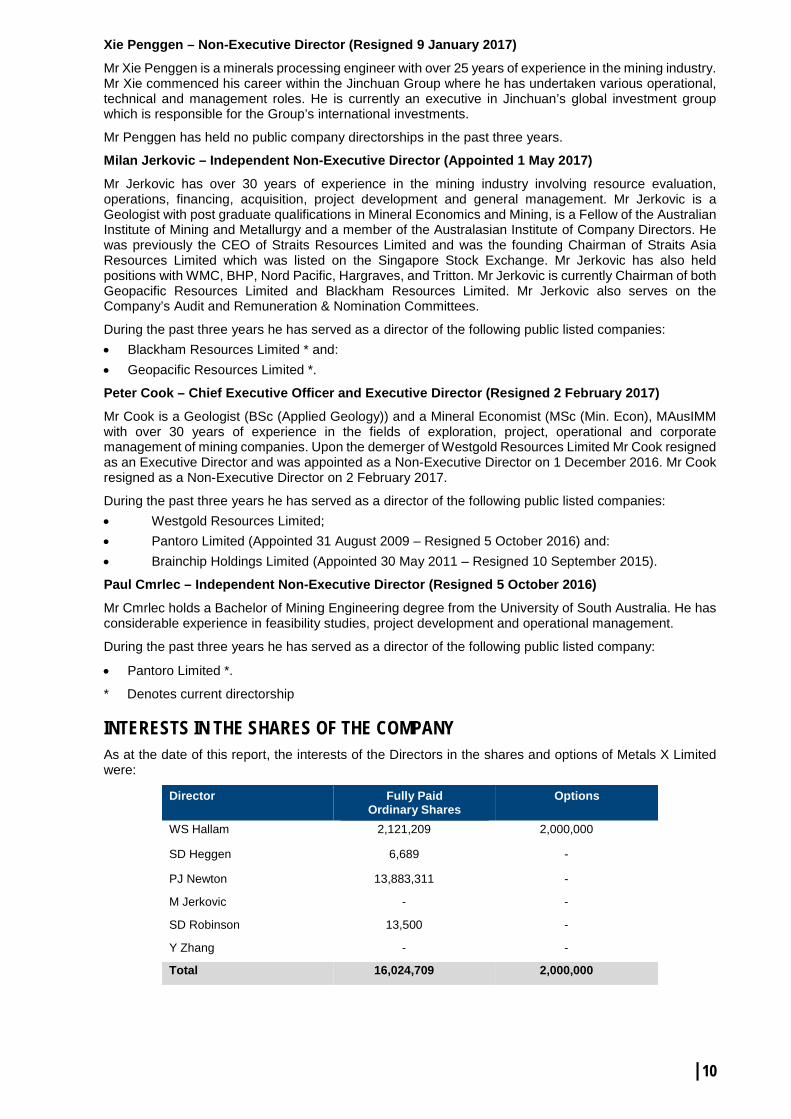
INTERESTS IN THE SHARES OF THE COMPANY As at the date of this report, the interests of the Directors in the shares and options of Metals X Limited were:
Director Fully Paid Ordinary Shares
Options
WS Hallam 2,121,209 2,000,000
SD Heggen 6,689 -
PJ Newton 13,883,311 -
M Jerkovic - -
SD Robinson 13,500 -
Y Zhang - -
Total 16,024,709 2,000,000

11 |
DIRECTORS (CONTINUED) COMPANY SECRETARY Fiona Van Maanen – Chief Financial Officer and Company Secretary Mrs Van Maanen is a CPA, holds a Bachelor of Business (Accounting) degree and a Graduate Diploma in Company Secretarial Practice. Mrs Van Maanen has significant experience in accounting and financial management in the mining and resources industry.
PRINCIPAL ACTIVITIES The principal activities during the year of the Consolidated Entity were: • operation of tin and copper mines in Australia; and • exploration and development of base metals projects in Australia.
EMPLOYEES The Consolidated Entity had 384 employees at 30 June 2017 (2016: 424).
DIVIDENDS No cash dividends were paid to members during the 2017 financial year.
The demerger of Metals X’s gold assets via a capital reduction and in specie distribution of all the shares in Westgold resulted in an in-species dividend of $171,204,652 (refer to note 29). For Australian taxation purposes part of an in-specie distribution can be treated as a dividend. The dividend component is the amount by which the market value of the in-specie distribution exceeded the capital reduction amount. Demerger taxation relief was grant by the Australian Taxation Office and this dividend is not assessable to Metals X shareholders.
Dividends paid to members during the 2016 financial year:
Dividend Rate Record Date Payment Date Franking DRP Discount 2.95 cents per share 2 Sep 2015 25 Sep 2015 26% franked 5% to 5 day VWAP
Dividend Reinvestment Plan The Company operates a dividend reinvestment plan (DRP) which allows eligible shareholders to elect to invest dividends in ordinary shares. The DRP is based on a 5% discount to the 5 day volume weighed average price (VWAP) after the record date. During the year no shares (2016: 2,170,099) were issued as part of the dividend reinvestment plan
After the balance date the following dividend has been proposed by the Directors.
Dividend Rate Record Date Payment Date Franking DRP Discount 1.00 cents per share 7 Sep 2017 19 Sep 2017 Nil 5% to 5 day VWAP
Refer to note 10 for available franking credits.
SHARE OPTIONS Unissued shares As at the date of this report, there were 7,250,000 ordinary shares under options, refer to note 28(e).
Option holders do not have any right, by virtue of the option, to participate in any share issue of the Company or any related body corporate.
Shares issued as a result of exercising options There were no option conversions during the financial year refer to note 28(f) for further details.

| 12
RESULTS OF OPERATIONS • Consolidated total profit after income tax - $134,012,244 (2016: loss $23,624,193);
• Total consolidated revenue of continuing operations - $266,315,113 (2016: $71,962,785);
• Total cost of sales of continuing operations - $257,159,645 (2016: $62,496,576);
• Gain on distribution of controlled entities - $228,503,915 (2016: Nil);
• Impairment losses - $72,682,408 (2016: $105,000);
• Exploration and evaluation expenditure write off - $1,243,736 (2016: $26,816,554)
• Cash flow from operating activities - $26,836,655 (2016: $62,040,162);
• Cash flows used in investing activities - $122,637,730 (2016: $132,027,646); and
• Cash flows from financing activities - $106,741,458 (2016: $10,134,426).
Key results for the period are:
COPPER DIVISION • Revenue from the Nifty Copper Operations was $180,085,727 (2016: nil). The Company took
control of the Nifty Copper Operations on 1 August 2016.
• The cost of sales was $196,793,442 (2016: nil). Performance of the Copper Division from 1 August 2016 when operational control was assumed is summarised below:
30 June 2017 30 June 2016 Physical Summary Units
UG Ore Mined t 1,390,007 -
UG Grade Mined % Cu 1.76 -
Ore Processed t 1,397,534 -
Head Grade g/t 1.77 -
Recovery % Cu 93.87 -
Copper Produced t 23,264 -
Copper Sold t 24,828 -
Achieved Copper Price A$/t Cu 7,168 -
Cost Summary
Mining A$/t Cu 2,797 -
Processing A$/t Cu 1,379 -
Admin A$/t Cu 1,114 -
Stockpile Adj A$/t Cu 55 -
C1 Cash Cost (produced oz) * A$/t Cu 5,345 - Royalties A$/t Cu 313 -
Marketing/Cost of sales A$/t Cu 1,135 -
Sustaining Capital A$/t Cu 387 -
Reclamation & other adj. A$/t Cu 165 -
All-in Sustaining Costs ** A$/t Cu 7,345 - Project Startup Capital A$/t Cu - -
Exploration Holding Cost A$/t Cu 64 -
All-in Cost *** A$/t Cu 7,409 -
• * C1 Cash Cost (C1): represents the cost for mining, processing and administration after accounting for movements in inventory (predominantly ore stockpiles). It includes net proceeds from by-product credits, but excludes the cost of royalties and capital costs for exploration, mine development and plant and equipment.
• ** All-in Sustaining Cost (AISC): is made up of the C1 cash cost plus royalty expense, sustaining capital expense and general corporate and administration expenses. • *** All-in Cost (AIC): is made up of the AISC plus growth (major project) capital and discovery expenditure. • C1, AISC and AIC are non-IFRS financial information and are not subject to audit. These are widely used “industry standard” terms that certain investors use to evaluate
company performance.

13 |
RESULTS OF OPERATIONS (CONTINUED) TIN DIVISION • Revenue from the 50% owned Renison Tin Operations was $84,376,130 (2016: $70,682,179). The
revenue was higher than the previous year as a result of higher production and tin prices.
• The cost of sales was $60,405,718 (2016: $62,496,576) with costs decreasing due to a reduction in costs associated with efficiencies introduced in both mining and processing and the change from contractor to owner-operator mining.
Performance of the Tin Division (50% share) is summarised below:
30 June 2017 30 June 2016
Physical Summary Units
UG Ore Mined t 376,276 342,138
UG Grade Mined % Sn 1.28% 1.29%
Ore Processed t 368,843 344,759
Head Grade g/t 1.29% 1.29%
Recovery % Sn 73.24% 71.22%
Tin Produced t 3,486 3,181
Tin Sold t 3,218 3,236
Achieved Tin Price A$/t 26,581 21,316
Cost Summary
Mining A$/t 6,385 9,112
Processing A$/t 4,620 4,424
Admin A$/t 1,052 952
Stockpile Adj A$/t (246) 174
C1 Cash Cost (produced oz) A$/t 11,810 14,662 Royalties A$/t 1,297 570
Marketing/Cost of sales A$/t 2,227 2,170
Sustaining Capital A$/t 3,228 2,482
Reclamation & other adj. A$/t 5 42
Corporate Costs A$/t 21 25
All-in Sustaining Costs A$/t 18,589 19,951 Project Startup Capital A$/t 815 741
Exploration Holding Cost A$/t - -
All-in Cost A$/t 19,404 20,692
NICKEL DIVISION • A recoverable amounts assessment undertaken at the end of the period resulted in an impairment
of the Central Musgraves Nickel Project of $73,378,360 (2016: $1,984,216) (refer to note 42).

| 14
RESULTS OF OPERATIONS (CONTINUED) GOLD DIVISION – DISCONTINUED OPERATION • Total revenue from the Gold Operations for the period was $163,126,024 (2016: $280,317,331).
The revenue was lower than the previous year due to the demerger of the Gold Division on 1 December 2016.
• Total cost of sales was $155,480,427 (2016: $279,295,243). Performance of the Gold Division for the period 1 July 2016 – 30 November 2016 is summarised below:
Five months Higginsville South Kal CMGP Group Physical Summary Units UG Ore Mined t 288,010 104,726 165,785 558,521 UG Grade Mined g/t 4.06 2.58 3.50 3.61 OP BCM Mined BCM 1,000,080 533,187 2,256,078 3,789,344 OP Ore Mined t 188,787 61,753 499,452 749,992 OP Grade Mined g/t 2.40 2.70 1.81 2.03 Ore Processed t 508,329 207,210 669,224 1,384,763 Head Grade g/t 2.87 2.52 2.06 2.42 Recovery % 93.74% 90.85% 89.24% 91.14% Gold Produced oz 40,150 15,355 39,453 94,957 Gold Sold oz 41,937 16,665 38,431 97,034 Achieved Gold Price A$/oz 1,677 1,677 1,677 1,677 Cost Summary Mining A$/oz 726 1,129 783 815 Processing A$/oz 289 74 320 267 Admin A$/oz 104 44 162 118 Stockpile Adj A$/oz (133) 36 (178) (125) C1 Cash Cost (produced oz) A$/oz 986 1,283 1,087 1,075 Royalties A$/oz 178 46 84 117 Marketing/Cost of sales A$/oz 2 2 0 1 Sustaining Capital A$/oz 59 155 0 50 Corporate Costs A$/oz 8 21 5 9 All-in Sustaining Costs A$/oz 1,233 1,507 1,176 1,252 Project Startup Capital A$/oz 61 363 453 273 Exploration Holding Cost A$/oz 67 143 125 103 All-in Cost A$/oz 1,361 2,013 1,754 1,628
Performance of the Gold Division for the year ended 30 June 2016 is summarised below:
Twelve months Higginsville South Kal CMGP Group
Physical Summary Units UG Ore Mined t 672,732 427,136 203,815 1,303,682 UG Grade Mined g/t 3.35 2.35 2.25 2.85 OP BCM Mined BCM 1,409,986 1,437,269 5,909,584 8,756,839 OP Ore Mined t 342,727 261,072 892,848 1,496,648 OP Grade Mined g/t 1.78 1.98 1.26 1.50 Ore Processed t 1,114,145 884,854 925,069 2,924,068 Head Grade g/t 2.78 1.76 1.36 2.02 Recovery % 91.07% 90.49% 91.94% 91.17% Gold Produced oz 91,371 45,403 37,182 173,956 Gold Sold oz 95,461 44,520 33,757 173,738 Achieved Gold Price A$/oz 1,614 1,614 1,614 1,614 Cost Summary Mining A$/oz 700 877 746 756 Processing A$/oz 310 288 390 322 Admin A$/oz 114 57 187 114 Stockpile Adj A$/oz 30 (73) (68) (18) C1 Cash Cost (produced oz) * A$/oz 1,154 1,149 1,255 1,174 Royalties A$/oz 146 34 60 98 Marketing/Cost of sales A$/oz 2 2 0 2 Sustaining Capital A$/oz 53 98 109 77 Corporate Costs A$/oz 8 18 12 12
All-in Sustaining Costs ** A$/oz 1,363 1,301 1,436 1,363 Project Startup Capital A$/oz 109 436 1,394 469 Exploration Holding Cost A$/oz 42 105 324 119 All-in Cost ** A$/oz 1,514 1,842 3,154 1,951

15 |
RESULTS OF OPERATIONS (CONTINUED) CAPITAL INVESTMENT ACTIVITIES Cash flows used in investing activities across the group totalled $122,637,730, which was lower than the previous period (2016: $132,027,646), mainly due to the cash acquired on the acquisition of the Copper Division ($39,078,178), which was offset by a cash injection into the Gold Division prior to its demerger ($96,323,551). Other capital re-investment during the period:
• Gold Operations $45,157,428;
• Tin Operations $11,430,117;
• Copper Operations $9,756,875; and
• Nickel Project $1,021,233.
REVIEW OF OPERATIONS A full review of the operations of the Consolidated Entity during the year ended 30 June 2017 is set out on page 3 of this report.
SIGNIFICANT CHANGES IN THE STATE OF AFFAIRS Total equity decreased by approximately 50% ($196,162,180) to $198,746,153 (2016: $394,908,333). The movement was mainly due to the demerger of the Gold Division during the period.
SIGNIFICANT EVENTS AFTER THE BALANCE DATE On 26 July 2017 the Company entered into hedges for 1,500 tonnes of copper per month for ten months from October 2017 to July 2018. The Company has granted calls up to A$8,255 per tonne of LME copper and brought puts as low as A$7,600 per tonne of LME copper. Refer to ASX announcement dated 27 July 2017.
LIKELY DEVELOPMENTS AND EXPECTED RESULTS It is expected that the Consolidated Entity will continue its exploration, mining, processing, production and marketing of tin and copper concentrates in Australia, and will continue the development of its nickel exploration projects. These are described in more detail in the Review of Operations on page 3.
ENVIRONMENTAL REGULATION AND PERFORMANCE The Consolidated Entity's operations are subject to the relevant environmental protection legislation (Commonwealth and State legislation). The Consolidated Entity holds various environmental licenses issued under these laws, to regulate its mining and exploration activities in Australia. These licenses include conditions and regulations in relation to specifying limits on discharges into the air, surface water and groundwater, rehabilitation of areas disturbed during the course of mining and exploration activities and the storage of hazardous substances.
All environmental performance obligations are monitored by the board of directors and subjected from time to time to Government agency audits and site inspections. There have been no material breaches of the Consolidated Entity’s licenses and all mining and exploration activities have been undertaken in compliance with the relevant environmental regulations.
INDEMNIFICATION AND INSURANCE OF DIRECTORS AND OFFICERS During the financial year, the Company paid a premium in respect of a contract of insurance to insure Directors and officers of the Company and related bodies corporate against those liabilities for which insurance is permitted under section 199B of the Corporations Act 2001. Disclosure of the nature of the liabilities and the amount of the premium is prohibited under the conditions of the contract of insurance.
INDEMNIFICATION OF AUDITORS To the extent permitted by law, the Company has agreed to indemnify its auditors, Ernst & Young, as part of the terms of its audit engagement agreement against claims by third parties arising from the audit (for an unspecified amount). No payment has been made to indemnify Ernst & Young during or since the financial year.

| 16
REMUNERATION REPORT (AUDITED) This remuneration report for the year ended 30 June 2017 outlines the remuneration arrangements of the Consolidated Entity in accordance with the requirements of the Corporations Act 2001 (“the Act”) and its regulations. This information has been audited as required by section 308(3C) of the Act.
The remuneration report is presented under the following sections:
1. Introduction 2. Remuneration governance 3. Non-executive Director remuneration arrangements 4. Executive remuneration arrangements 5. Company performance and the link to remuneration 6. Executive contractual arrangements 7. Additional statutory disclosures
1. INTRODUCTION The remuneration report details the remuneration arrangements for Key Management Personnel (KMP) who are defined as those persons having authority and responsibility for planning, directing and controlling the major activities of the Consolidated Entity.
For the purposes of this remuneration report, the term ‘executive’ includes the Managing Director (MD), executive directors, senior executives, general managers and secretary of the Consolidated Entity.
Details of KMP of the Consolidated Entity are set out below:
Name Position Appointed Resigned (i) Non-Executive Directors (NEDs) PJ Newton Non-Executive Chairman 14 Dec 2012 -
PM Cmrlec Non-Executive Director 23 Jul 2013 5 Oct 2016 SD Heggen Non-Executive Director 25 Oct 2012 - M Jerkovic Non-Executive Director 1 May 2017 - X Penggen Non-Executive Director 9 Feb 2012 9 Jan 2017 Y Zhang Non-Executive Director 9 Jan 2017 -
(ii) Executive Directors WS Hallam Managing Director 1 Mar 2005 -
PG Cook Executive Director 23 Jul 2004 2 Feb 2017 SD Robinson Executive Director 25 Nov 2016 -
(iii) Other Executives (KMPs) AH King Chief Operating Officer 24 Feb 2014 -
JG Brock Chief Operating Officer - CMGP 21 Mar 2016 1 Dec 2016 PD Hucker Chief Operating Officer - SKO & HGO 17 Oct 2012 1 Dec 2016 MR Poepjes General Manager - NCP 8 Aug 2011 - M Recklies General Manager - Renison 24 Mar 2017 - JW Russell Chief Geologist 17 Oct 2012 1 Dec 2016 FJ Van Maanen CFO & Company Secretary 1 Jul 2005 -
2. REMUNERATION GOVERNANCE
Remuneration and Nomination Committee
The remuneration and nomination committee comprises three NEDs.
The remuneration and nomination committee is responsible for making recommendations to the Board on the remuneration arrangements for non-executive directors and executives.
The remuneration and nomination committee assesses the appropriateness of the nature and amount of remuneration of non-executive directors and executives on a periodic basis by reference to relevant employment market conditions with the overall objective of ensuring maximum stakeholder benefit from the retention of a high performing director and executive team.
17 |
REMUNERATION REPORT (AUDITED) (CONTINUED)
2. REMUNERATION GOVERNANCE (CONTINUED)
Remuneration approval process
The Board approves the remuneration arrangements of the Managing Director (MD) and executives and all awards made under the long-term incentive plan, following recommendations from the remuneration and nomination committee. The Board also sets the aggregate remuneration of non-executive directors which is then subject to shareholder approval. The remuneration and nomination committee approves, having regard to the recommendations made by the MD, the level of the Consolidated Entity’s short-term incentive pool. Remuneration Strategy
The Company’s remuneration strategy is designed to attract, motivate and retain employees and non-executive directors by identifying and rewarding high performers and recognising the contribution of each employee to the continued growth and success of the Consolidated Entity. To this end, the company embodies the following principles in its remuneration framework: • retention and motivation of key executives; • attraction of quality management to the Consolidated Entity; and • performance incentives which allow executives to share the rewards of the success of the
Consolidated Entity.
Remuneration Structure In accordance with best practice corporate governance, the structure of non-executive director and senior executive remuneration is separate and distinct.
Remuneration report at FY16 AGM The FY16 remuneration report received positive shareholder support at the FY16 AGM with a vote of 81% in favour.
3. NON-EXECUTIVE DIRECTOR REMUNERATION ARRANGEMENTS Remuneration Policy
The Board seeks to set aggregate remuneration at a level which provides the Company with the ability to attract and retain directors of the highest calibre, whilst incurring a cost which is acceptable to shareholders. The amount of aggregate remuneration sought to be approved by shareholders and the fee structure is reviewed annually against fees paid to non-executive directors of comparable companies. The Board may consider advice from external consultants, however none were engaged during the year. The board also considers fees paid to non-executive directors of comparable companies when undertaking the annual review process. The Company’s constitution and the ASX listing rules specify that the non-executive director fee pool shall be determined from time to time by a general meeting. The last determination was at the annual general meeting held on 26 November 2014 when shareholders approved an aggregate fee pool of $600,000 per year.
Structure The remuneration of non-executive directors consists of director’s fees. Non-executives are entitled to receive retirement benefits and to participate in any incentive programs. There are currently no specific incentive programs. The non-executive Chairman receives a base fee of $110,000 and each other non-executive director receives a base fee of $80,000 for being a director of the Consolidated Entity. There are no additional fees for serving on any board committees. Non-executive directors have long been encouraged by the Board to hold shares in the Company and align their interests with the Company’s shareholders. The shares are purchased by the directors at the prevailing market share price. The remuneration report for the non-executive directors for the year ending 30 June 2017 and 30 June 2016 is detailed in Table 1 and Table 2 respectively of this report.

| 18
REMUNERATION REPORT (AUDITED) (CONTINUED)
4. EXECUTIVE REMUNERATION ARRANGEMENTS
Remuneration Policy
The Company’s executive remuneration strategy is designed to attract, motivate and retain high performing individuals and align to the interests of executives and shareholders.
Structure
In determining the level and make-up of executive remuneration, the remuneration and nomination committee engages external consultants as needed to provide independent advice.
Remuneration consists of the following key elements:
• Fixed remuneration (base salary and superannuation); and
• Variable remuneration (share options, performance rights and cash bonus).
The proportion of fixed remuneration and variable remuneration for each executive for the period ending 30 June 2017 and 30 June 2016 are set out in Table 1 and Table 2.
Fixed Remuneration
Executive contracts of employment do not include any guaranteed base pay increase. Fixed remuneration is reviewed annually by the remuneration and nomination committee. The process consists of a review of the Company, individual performance, relevant comparative remuneration internally and externally and, where appropriate, external advice independent of management.
Executives are given the opportunity to receive their fixed (primary) remuneration in a variety of forms including cash and fringe benefits such as motor vehicles. It is intended that the manner of payment chosen will be optimal for the recipient without creating undue cost for the Company.
The fixed remuneration component for executives for the period ending 30 June 2017 and 30 June 2016 are set out in Table 1 and Table 2.
Variable Remuneration
Short Term Incentive (STI) – cash bonus
The objective of the STI is to link the increase in shareholder value over the year with the remuneration received by the executives charged with achieving that increase. Executives may from time-to-time receive a discretionary cash bonus approved by the Board as a retrospective reward for exceptional performance in a specific matter of importance. The total potential STI cash bonus available is set at a level so as to provide sufficient incentive to the executives to achieve the performance goals and such that the cost to the Consolidated Entity is reasonable in the circumstances.
Annual STI payments granted to each executive depends on their performance over the year and are based on recommendations from the MD following collaboration with the Board. Typically included are measures such as contribution to strategic initiatives, risk management and leadership/team contribution.
The aggregate of annual STI payments available for executives across the Consolidated Entity is subject to the approval of the Board. The Board has no pre-determined performance criteria against which the amount of a STI is assessed and there are no pre-determined maximum possible values of award under the STI scheme. In assessing the value of an STI award to be granted the Board will give consideration to the contribution of the action being rewarded to the success of the Consolidated Entity. Based on the performance of the individuals and the Consolidated Entity, discretionary STI cash bonuses totaling $23,614 were awarded in respect of the 2017 financial year and no STI cash bonuses were paid in respect of the 2016 financial year. No discretionary STI cash bonuses relating to the 2017 or 2016 financial years will become payable in future financial years.

19 |
REMUNERATION REPORT (AUDITED) (CONTINUED)
4. EXECUTIVE REMUNERATION ARRANGEMENTS (CONTINUED)
Long Term Incentive (LTI) – Share options and Performance Rights The objective of the LTI plan is to reward executives in a manner that aligns remuneration with the creation of shareholder wealth. As such LTI’s are made to executives who are able to influence the generation of shareholder wealth and thus have an impact on the Consolidated Entity’s performance.
LTI awards to executives are made under the Metals X Limited Long Term Incentive Plan and are delivered in the form of options and performance rights over unissued ordinary shares of the Company. The number of options and performance rights issued are determined by the policy set by the remuneration and nomination committee and is based on each executive’s role and position with the Consolidated Entity.
The share options will vest after one year or as determined by the Board of Directors and Executives are able to exercise the share options for up to two years after vesting before the options lapse. Where a participant ceases employment prior to the vesting of their share options, the share options are forfeited. Where a participant ceases employment after the vesting of their share options, the share options automatically lapse after three months of ceasing employment.
The performance rights vest over a period of three years subject to meeting performance measures or as determined by the Board of Directors. Where a participant ceases employment prior to the vesting of their performance rights, the performance rights are forfeited. The performance rights have the following performance hurdles: • The Absolute Total Shareholder Return (TSR) performance rights (50% of total performance rights)
will vest subject to the compound annual growth rate of the Company’s TSR being not less than 15% over the three year service period.
• The Relative TSR performance rights (50% of total performance rights) are measured against a defined peer group of companies over the service period of three years, which the Board considers compete with the Company for the same investment capital, both in Australia and overseas, and which by the nature of their business are influenced by commodity prices and other external factors similar to those that impact on the TSR performance of the Company.
The comparator group of companies for FY15 Performance Rights comprises:
Evolution Mining Limited Oceana Gold Corporation Independence Gold Limited Ramelius Resources Limited Kingsgate Consolidated Limited Regis Resources Limited Kingsrose Mining Limited Saracen Mineral Holdings Limited Medusa Mining Limited Silver Lake Resources Limited Northern Star Resources Ltd Norton Goldfields Limited
The comparator group of companies for FY16 Performance Rights comprises:
Oz Minerals Limited CuDeco Limited Northern Star Resources Ltd Orocobre Limited Independence Group NL Saracen Mineral Holdings Limited Sirius Resources NL Resolute Mining Limited Alacer Gold Corp Beadell Resources Limited Western Areas Limited Perseus Mining Limited Sandfire Resources NL Medusa Mining Ltd Oceana Gold Corporation Kingsgate Consolidated Limited Regis Resources Limited Tiger Resources Limited Evolution Mining Limited Silver Lake Resources Limited
The Board considers that TSR is an appropriate performance hurdle because it ensures that a proportion of each participant’s remuneration is explicitly linked to shareholder value and ensures that participants only receive a benefit where there is a corresponding direct benefit to shareholders.
The Absolute and Relative TSR’s are monitored by an independent external advisor at 30 June each year, with the vesting outcomes ultimately determined at the end of the three year performance period.

| 20
REMUNERATION REPORT (AUDITED) (CONTINUED)
4. EXECUTIVE REMUNERATION ARRANGEMENTS (CONTINUED) Long Term Incentive (LTI) – Share options and Performance Rights
Pursuant to the demerger of Westgold the Board determined on 24 November 2016 that the 3,388,155 FY15 and FY16 Performance Rights on issue would vest and be exercisable prior to the Demerger. The performance rights vested and were converted into shares in the Company on 25 November 2016. The Metals X share price on the date of vesting was $1.51 per share. The cost of accelerating the vesting of the Performance Rights of $3,744,376 was recognised in the consolidated statement of comprehensive income.
Table 3 and Table 4 provide details of LTI options and performance rights granted, exercised and lapsed during the year.
5. COMPANY PERFORMANCE AND THE LINK TO REMUNERATION STI remuneration is linked to the performance of the Company. In the current financial year cash bonuses were awarded to executives based on the Company’s performance in the preceding financial year.
LTI remuneration has been designed to retain, motivate and incentivise executives to drive the Company’s long term performance to deliver greater returns to shareholders. The granting of performance rights and/or share options is a retention and/or performance incentive which allows executives to share in the rewards and success of the Company.
30 June 13 30 June 14 30 June 15 30 June 16 30 June 17
Closing share price $0.39 $1.04 $1.38 $1.40 $0.67 Profit/(loss) per share (cents) 2.24 9.06 9.87 (5.21) 22.51 Net tangible assets per share $0.66 $0.75 $0.72 $0.82 $0.33 Total Shareholder Return (32%) 165% 35% 4% 12% Dividend paid per shares (cents) - 2.715 2.950 - 1.00
6. EXECUTIVE CONTRACTUAL ARRANGEMENTS Remuneration arrangements for KMP are formalised in employment agreements. Details of these contracts are provided below:
Managing Director
The MD, Mr Hallam is employed under an annual salary employment contract and receives a fixed remuneration of $503,700 (including superannuation) per annum.
The other terms of Executive Director’s employment contracts are:
• The MD may resign from their position and thus terminate their contract by giving three months written notice. On resignation, any unvested options and performance rights will be forfeited.
• The Company may terminate the employment agreement by providing three months written notice or providing payment in lieu of notice period (based on the fixed component of the MD’s remuneration). On termination on notice by the Company Mr Hallam will still be entitled to any LTI options and performance rights that have vested or that will vest during the notice period. LTI options and performance rights that have not yet vested will be forfeited.
• The Company may terminate the contract at any time without notice if serious misconduct has occurred. Where termination with cause occurs, the MD is only entitled to that portion of remuneration that is fixed, and only up to the date of termination. On termination with cause by the Company Mr Hallam will still be entitled to any LTI options and performance rights that have vested. LTI options and performance rights that have not yet vested will be forfeited.
Other executive directors
Mr Robinson is employed under an annual salary employment contract and receives a fixed remuneration of $410,625 (including superannuation) per annum.
The other terms of Executive Director’s employment contracts are:
• Executive Directors may resign from their position and thus terminate their contract by giving three months written notice. On resignation, any unvested options and performance rights will be forfeited.

21 |
REMUNERATION REPORT (AUDITED) (CONTINUED)
6. EXECUTIVE CONTRACTUAL ARRANGEMENTS (CONTINUED) • The Company may terminate the employment agreement by providing three months written notice
or providing payment in lieu of notice period (based on the fixed component of the executive director’s remuneration). On termination on notice by the Company Mr Robinson will still be entitled to any LTI options and performance rights that have vested or that will vest during the notice period. LTI options and performance rights that have not yet vested will be forfeited.
• The Company may terminate the contract at any time without notice if serious misconduct has occurred. Where termination with cause occurs, the Executive Director is only entitled to that portion of remuneration that is fixed, and only up to the date of termination. On termination with cause by the Company Mr Robinson will still be entitled to any LTI options and performance rights that have vested. LTI options and performance rights that have not yet vested will be forfeited.
Other KMP
All other executives have standard employment contracts. The other terms of the employment contracts are:
• Executives may resign from their position and thus terminate their contract by giving one to three months written notice. On resignation, any unvested options and performance rights will be forfeited.
• The Company may terminate the employment agreement by providing one to three months written notice or providing payment in lieu of notice period (based on the fixed component of the executive’s remuneration). On termination on notice by the Company other KMP will still be entitled to any LTI options and performance rights that have vested or that will vest during the notice period. LTI options and performance rights that have not yet vested will be forfeited.
• The Company may terminate the contract at any time without notice if serious misconduct has occurred. Where termination with cause occurs, the executive is only entitled to that portion of remuneration that is fixed, and only up to the date of termination. On termination with cause by the Company other KMP will still be entitled to any LTI options and performance rights that have vested. LTI options and performance rights that have not yet vested will be forfeited.
Use of remuneration advisors The Remuneration Committee approved the engagement of Ernst & Young in the prior year to provide remuneration recommendations regarding long term incentives for executives. Both Ernst & Young and the Committee were satisfied the advice received from Ernst & Young was free from undue influence from the KMP to whom the remuneration recommendations apply. The remuneration recommendations were provided to the Committee as an input into decision making only. The Remuneration Committee considered the recommendations, along with other factors, in making its remuneration decisions. In the current year, there were no fees paid to Ernst & Young for the remuneration recommendations (2016: $25,750).
Share trading policy The Metals X trading policy applies to all non-executive directors and executives. The policy prohibits employees from dealing in Metals X securities while in possession of material non-public information relevant to the Consolidated Entity. Executives must not enter into any hedging arrangements over unvested long term incentives under the Consolidated Entity’s long term incentive plan. The Consolidated Entity would consider a breach of this policy as gross misconduct, which may lead to disciplinary action and potentially dismissal.

| 22
REMUNERATION REPORT (AUDITED) (CONTINUED) 6. EXECUTIVE CONTRACTUAL ARRANGEMENTS (CONTINUED)
Table 1: Remuneration for the year ended 30 June 2017
Remuneration of key management personnel of the
Consolidated Entity
Short Term Post employment
Long term benefits
Share based Payment Total
Salary and Fees
Cash Bonus
Non monetary benefits
Superannuation Long service leave
Performance Rights Options % Performance
related
% that consists of
performance rights and
options Non-executive Directors
PJ Newton 110,000 - - 10,450 - - - 120,450 - - PM Cmrlec * 21,087 - - 2,003 - - - 23,090 - - SD Heggen 80,000 - - 7,600 - - - 87,600 - - M Jerkovic 13,333 - - 1,267 - - - 14,600 - - X Penggen * - - - - - - - - - - Y Zhang ** 38,485 - - 3,656 - - - 42,141 - -
262,905 - - 24,976 - - - 287,881 Executive Directors PG Cook * 265,751 - 3,588 13,474 120,064 826,935 - 1,229,812 67 67 WS Hallam 469,967 - 5,656 33,733 13,730 592,268 188,984 1,304,338 60 60 SD Robinson *** 97,372 - 2,828 9,250 - - - 109,450 - - Other key management personnel PD Hucker **** 133,181 - 4,422 12,652 9,833 341,421 - 501,509 68 68 JG Brock **** 178,794 - - - - - - 178,794 - - AH King 250,257 23,614 - 26,018 819 - 113,390 414,098 33 27 MR Poepjes 288,000 - 1,994 27,360 20,545 221,973 56,695 616,567 45 45 M Recklies ** 71,286 - - 6,772 - - - 78,058 - - JW Russell **** 93,750 - 4,676 8,906 32,377 217,895 - 357,604 61 61 FJ Van Maanen 348,560 - 7,939 25,439 9,532 402,250 113,390 907,110 57 57
2,196,918 23,614 31,103 163,604 206,900 2,602,742 472,459 5,697,340
Totals 2,459,823 23,614 31,103 188,580 206,900 2,602,742 472,459 5,985,221
* PM Cmrlec, X Penggen, PG Cook resigned on 5 October 2016, 9 January 2017 and 2 February 2017 respectively. ** Y Zhang, M Recklies and M Jerkovic were appointed on 9 January 2017, 24 March 2017 and 1 May 2017 respectively. *** SD Robinson was appointed as a Non-Executive Director on 25 November 2016 and was subsequently employed as an Executive Director on 1 May 2017. **** PD Hucker, JD Brock and JW Russell were transferred to Westgold Resources Limited on 1 December 2016 as part of the demerger.

23 |
REMUNERATION REPORT (AUDITED) (CONTINUED)
6. EXECUTIVE CONTRACTUAL ARRANGEMENTS (CONTINUED) Table 2: Remuneration for the year ended 30 June 2016
Remuneration of key management personnel of the
Consolidated Entity
Short Term Post employment
Long term benefits
Share based Payment Total
Salary and Fees
Cash Bonus
Non monetary benefits
Superannuation Long service leave
Performance Rights Options % Performance
related
% that consists of
performance rights and
options Non-executive Directors
PJ Newton 110,000 - - 10,450 - - - 120,450 - - PM Cmrlec 80,000 - - 7,600 - - - 87,600 - - AC Ferguson * 60,000 - - - - - - 60,000 - - SD Heggen 80,000 - - 7,600 - - - 87,600 - - X Penggen - - - - - - - - - - Y Zhang (Alt Director) - - - - - - - - - -
330,000 - - 25,650 - - - 355,650 Executive Directors PG Cook ** 599,803 - 5,536 29,941 23,939 124,842 - 784,061 16 16 WS Hallam 468,701 - 6,265 34,999 14,990 88,772 - 613,727 14 14 Other key management personnel PD Hucker 319,635 - 6,099 30,365 12,914 51,557 - 420,570 12 12 JG Brock *** 108,000 - - - - - - 108,000 - - AH King 160,000 - - 15,200 9,392 - - 184,592 - - MR Poepjes 235,000 - 5,502 22,325 9,796 33,072 - 305,695 11 11 JW Russell 225,000 - 6,464 21,375 9,287 32,288 - 294,414 11 11 FJ Van Maanen 287,139 - 7,557 27,278 10,423 60,605 - 393,002 15 15
2,403,278 - 37,423 181,483 90,741 391,136 - 3,104,061
Totals 2,733,278 - 37,423 207,133 90,741 391,136 - 3,459,711
* AC Ferguson resigned on 23 March 2016. ** PG Cook was a Director of Brainchip during the period until 10 September 2015 and Metals X was paid $5,356 for director's fees in relation to Brainchip director duties. These amounts represent the net employment
expense to Metals X. *** JG Brock was appointed on 21 March 2016.

| 24
REMUNERATION REPORT (AUDITED) (CONTINUED)
7. ADDITIONAL STATUTORY DISCLOSURES This section sets out the additional disclosures required under the Corporations Act 2001.
Table 3: Options granted and vested during the year (Consolidated)
Year Options granted
during the year (No.)
Grant date
Fair value per option
at grant date
Value of options at grant date
$
Vesting date
Exercise price
Expiry date
Options vesting
during the period
Options lapsed during
the year
WS Hallam * 2017 2,000,000 24 Nov 2016 $0.19 188,984 20 Jan 2018 $0.76 20 Jan 2020 - -
WS Hallam 2016 - - - - - - -
AH King 2017 1,200,000 20 Jan 2017 $0.19 113,390 20 Jan 2018 $0.76 20 Jan 2020 - -
AH King 2016 - - - - - - -
MR Poepjes 2017 600,000 20 Jan 2017 $0.19 56,695 20 Jan 2018 $0.76 20 Jan 2020 - -
MR Poepjes 2016 - - - - - - -
FJ Van Maanen 2017 1,200,000 20 Jan 2017 $0.19 113,390 20 Jan 2018 $0.76 20 Jan 2020 - -
FJ Van Maanen 2016 - - - - - - -
* Grant of options was subject to shareholder approval at the Annual General Meeting, which occurred on 24 November 2016.
For details on vesting conditions and valuation of the performance rights, including models and assumptions used, please refer to note 31.
The value of the share based payments granted during the period is recognised in compensation over the vesting period of the grant.

25 |
REMUNERATION REPORT (AUDITED) (CONTINUED)
7. ADDITIONAL STATUTORY DISCLOSURES (CONTINUED) Performance Rights Table 4: Performance rights granted and vested during the year (Consolidated)
Year Performance
rights granted during the year
(No.)
Grant date
Value of performance rights
at grant date $ Vesting
date Expiry date
Performance rights vested
during the period **
Performance rights lapsed
during the year
PG Cook 2017 - - - - - 709,092 -
PG Cook * 2016 324,476 23 Nov 2015 218,372 1 Jul 2018 1 Jul 2018 - -
WS Hallam 2017 - - - - - 507,867 -
WS Hallam * 2016 225,175 23 Nov 2015 151,543 1 Jul 2018 1 Jul 2018 - -
PD Hucker 2017 - - - - - 292,767 -
PD Hucker 2016 134,113 23 Nov 2015 90,258 1 Jul 2018 1 Jul 2018 - -
MR Poepjes 2017 - - - - - 190,341 -
MR Poepjes 2016 82,168 23 Nov 2015 55,299 1 Jul 2018 1 Jul 2018 - -
JW Russell 2017 - - - - - 186,934 -
JW Russell 2016 78,761 23 Nov 2015 52,946 1 Jul 2018 1 Jul 2018 - -
FJ Van Maanen 2017 - - - - - 344,927 -
FJ Van Maanen 2016 156,465 23 Nov 2015 105,301 1 Jul 2018 1 Jul 2018 - -
* Grant of performance rights was subject to shareholder approval at the Annual General Meeting, which occurred on 23 November 2015. ** No consideration was paid by Metals X employees for the underlying shares upon vesting of the performance rights.
For details on vesting conditions and valuation of the performance rights, including models and assumptions used, please refer to note 31.
The value of the share based payments granted during the period is recognised in compensation over the vesting period of the grant.

| 26
REMUNERATION REPORT (AUDITED) (CONTINUED)
7. ADDITIONAL STATUTORY DISCLOSURES (CONTINUED) Table 5: Shareholdings of key management personnel (including nominees)
Ordinary shares held in Metals X Limited (number)
30 June 2017 Balance held at
1 July 2016 Performance rights vested
On exercise of options
Net change other ^
Balance held at
30 June 2017
Directors PJ Newton 13,874,697 - - 8,614 13,883,311 PG Cook 18,361,237 709,092 - (19,070,329) - WS Hallam 1,587,500 507,867 - 25,842 2,121,209 PM Cmrlec 91,521 - - (91,521) - SD Heggen 5,000 - - 1,689 6,689 M Jerkovic - - - - - X Penggen 44,000,000 - - (44,000,000) - SD Robinson - - - 13,500 13,500 Y Zhang - - - - -
Executives PD Hucker 19,375 292,767 - (312,142) - JG Brock - - - - - AH King 54,113 - - 16,014 70,127 MR Poepjes - 190,341 - - 190,341 M Recklies - - - 1,467 1,467 JW Russell 38,649 186,934 - (225,583) - FJ Van Maanen 517,500 344,927 - 8,614 871,041
Total 78,549,592 2,231,928 - (63,623,835) 17,157,685
^ Represents acquisitions and disposals of shares on market and shares issued under the dividend reinvestment plan, as well as departures and appointments.

27 |
REMUNERATION REPORT (AUDITED) (CONTINUED)
7. ADDITIONAL STATUTORY DISCLOSURES (CONTINUED) Table 6: Performance right and option holdings of key management personnel (including nominees)
30 June 2017 Options balance at beginning of
period 1 July 2016
Performance rights balance at
beginning of period
1 July 2016
Performance rights vested
Options granted as
remuneration
Options balance at end
of period 30 June 2017
Performance rights balance
at end of period
30 June 2017
Options not vested and
not exercisable
Options vested and exercisable
Directors PJ Newton - - - - - - - - PG Cook - 709,092 (709,092) - - - - - WS Hallam - 507,867 (507,867) 2,000,000 2,000,000 - 2,000,000 - PM Cmrlec - - - - - - - - SD Heggen - - - - - - - - M Jerkovic - - - - - - - - X Penggen - - - - - - - - SD Robinson - - - - - - - - Y Zhang - - - - - - - -
Executives PD Hucker - 292,767 (292,767) - - - - - JG Brock - - - - - - - - AH King - - - 1,200,000 1,200,000 - 1,200,000 - MR Poepjes - 190,341 (190,341) 600,000 600,000 - 600,000 - M Recklies - - - - - - - - JW Russell - 186,934 (186,934) - - - - - FJ Van Maanen - 344,927 (344,927) 1,200,000 1,200,000 - 1,200,000 -
Total - 2,231,928 (2,231,928) 5,000,000 5,000,000 - 5,000,000 -
End of Audited Remuneration Report.

| 28
DIRECTORS’ MEETINGS The number of meetings of Directors’ (including meetings of committees of Directors) held during the year and the number of meetings attended by each Director was as follows:
Directors Meetings
Audit Committee
Remuneration & Nomination Committee
No of meetings held: 12 2 1
No of meetings attended: PG Cook 9 - - PM Cmrlec 3 1 - WS Hallam 12 - - SD Heggen 12 2 1 M Jerkovic - 1 - PJ Newton 12 2 1 X Penggen - - - SD Robinson 5 - 1 Y Zhang 12 - -
All Directors were eligible to attend all meetings held except:
• PG Cook – resigned 2 February 2017 • PM Cmrlec – resigned 5 October 2016; • M Jerkovic – appointed 1 May 2017; • X Penggen – resigned 9 January 2017; and • SD Robinson – appointed 25 November 2016.
Committee Membership As at the date of this report, the Company had an Audit Committee and a Remuneration and Nomination Committee of the Board of Directors.
Members acting on the committees of the Board during the year were:
Audit Committee Remuneration and Nomination Committee SD Heggen * PJ Newton * PJ Newton SD Heggen
M Jerkovic M Jerkovic Notes: * Designates the Chairman of the Committee.
CORPORATE GOVERNANCE In recognising the need for the highest standards of corporate behaviour and accountability, the Directors of the Company support and have adhered to the principles of Corporate Governance. The Company’s corporate governance statement is available at the Company’s website at http://metalsx.com.au/about us/corporate governance/.

29 |
AUDITOR’S INDEPENDENCE AND NON-AUDIT SERVICES
AUDITOR INDEPENDENCE
The Directors’ received the Independence Declaration, as set out on page 30, from Ernst & Young.
NON-AUDIT SERVICES The following non-audit services were provided by the entity’s auditor, Ernst & Young. The directors are satisfied that the provision of non-audit is compatible with the general standard of independence for auditors imposed by the Corporations Act 2001. The nature and scope of each type of non-audit service provided means that auditor independence was not compromised.
Ernst & Young received or are due to receive the following amounts for the provision of non-audit services (refer to note 34):
$ Tax and stamp duty compliance services 428,158
Signed in accordance with a resolution of the Directors.
WS Hallam Managing Director Perth, 31 August 2017

| 30
AUDITOR’S INDEPENDENCE DECLARATION

31 |
CONSOLIDATED STATEMENT OF COMPREHENSIVE INCOME FOR THE YEAR ENDED 30 JUNE 2017
Notes 2017 2016 Continuing operations Revenue 5 266,315,113 71,962,785 Cost of sales 7(a) (257,159,645) (62,496,576) Gross profit 9,155,468 9,466,209
Other income 6 3,015,539 127,863 Other expenses 7(b) (17,602,822) (8,787,581) Finance costs 7(d) (686,933) (130,019) Fair value change in financial assets 7(c) 12,371,917 364,853 Impairment loss on available-for-sale financial assets 17 (416,758) (105,000) Impairment loss on mine properties and development 19 (72,250,650) - Exploration and evaluation expenditure written off 20 (1,243,736) (1,984,216) Loss before income tax from continuing operations (67,657,975) (1,047,891)
Income tax (expense)/benefit 8 (36,094,768) 4,285,058 (Loss)/profit for the period from continuing operations (103,752,743) 3,237,167
Discontinued operations Profit/(loss) from discontinued operations 41 237,764,988 (26,861,360) Profit/(loss) for the period 134,012,245 (23,624,193)
Other comprehensive income Items that may be reclassified subsequently to profit or loss
Reclassification of cumulative fair value changes in available-for-sale financial assets previously recognised in equity to the profit and loss on gaining control of the investee, net of tax (8,660,342) - Changes in the fair value of available-for-sale financial assets, net of tax (546,195) 9,745,369 Other comprehensive profit for the period, net of tax 30 (9,206,537) 9,745,369 Total comprehensive profit/(loss) for the period 124,805,708 (13,878,824)
Profit/(loss) attributable to: Members of the parent 134,012,245 (23,624,193)
134,012,245 (23,624,193)
Total comprehensive profit/(loss) attributable to: Members of the parent 24,805,708 (13,878,824)
124,805,708 (13,878,824)
Profit/(loss) per share for the profit/(loss) attributable to the ordinary equity holders of the parent (cents per share) Basic profit/(loss) per share Continuing operations 9 (17.43) 0.71 Discontinued operations 9 39.94 (5.92) Total operations 22.51 (5.21)
Diluted profit/(loss) per share Continuing operations 9 (17.43) 0.71 Discontinued operations 9 39.94 (5.92) Total operations 22.51 (5.21)

| 32
CONSOLIDATED STATEMENT OF FINANCIAL POSITION AS AT 30 JUNE 2017
Notes 2017 2016
CURRENT ASSETS Cash and cash equivalents 11 50,125,170 39,184,787 Trade and other receivables 12 45,046,603 15,799,458 Inventories 13 43,638,521 52,173,412 Prepayments 14 1,250,872 528,564 Other financial assets 15 10,858,049 5,802,625 Total current assets 150,919,215 113,488,846
NON-CURRENT ASSETS Derivative financial instruments 16 99,000 - Available-for-sale financial assets 17 9,300,778 43,238,834 Property, plant and equipment 18 40,466,982 79,343,202 Mine properties and development costs 19 77,370,210 197,832,376 Exploration and evaluation expenditure 20 4,892,164 165,083,986 Total non-current assets 132,129,134 485,498,398 TOTAL ASSETS 283,048,349 598,987,244
CURRENT LIABILITIES Trade and other payables 21 29,306,601 68,289,529 Provisions 22 5,723,077 5,347,668 Interest bearing loans and borrowings 24 3,187,557 5,201,279 Unearned income 26 - 22,493,125 Total current liabilities 38,217,235 101,331,601
NON-CURRENT LIABILITIES Provisions 23 40,776,282 86,692,744 Interest bearing loans and borrowings 25 5,308,678 10,242,066 Unearned income 27 - 5,812,500 Total non-current liabilities 46,084,960 102,747,310 TOTAL LIABILITIES 84,302,195 204,078,911 NET ASSETS 198,746,154 394,908,333
EQUITY Issued capital 28 252,511,413 407,029,190 Accumulated losses 29 (82,858,477) (45,666,070) Share based payments reserve 30 25,331,051 20,576,509 Fair value reserve 30 3,762,167 12,968,704 TOTAL EQUITY 198,746,154 394,908,333

33 |
CONSOLIDATED STATEMENT OF CASH FLOWS FOR THE YEAR ENDED 30 JUNE 2017
Notes 2017 2016
OPERATING ACTIVITIES Receipts from customers 384,989,576 333,778,610 Interest received 1,796,414 1,368,321 Other income 4,817,730 1,918,640 Payments to suppliers and employees (364,084,914) (274,723,364) Interest paid (682,151) (302,045) Net cash flows from operating activities 11 26,836,655 62,040,162
INVESTING ACTIVITIES Payments for property, plant and equipment (18,561,268) (15,688,911) Payments for mine properties and development (31,698,923) (86,476,897) Payments for exploration and evaluation (14,098,029) (26,405,423) Proceeds from sale of property, plant and equipment 270,862 409,903 Payments for available-for-sale financial assets (804,999) (2,574,234) Proceeds from sales of available-for-sale financial assets - 299,400 Advances in relation to interest bearing receivables (500,000) (1,591,484) Net cash inflow on acquisition of subsidiary 40 39,078,178 - Net cash outflow on disposal of subsidiary 41 (96,323,551) - Net cash flows used in investing activities (122,637,730) (132,027,646)
FINANCING ACTIVITIES Payment of finance lease liabilities (3,706,810) (2,890,872) Payments for dividends (1,588) (10,057,734) Proceeds from share issue 115,639,413 - Payments for share issue costs (5,256,827) (116,968) Proceeds from gold prepayment - 23,250,000 Payments for performance bond facility 67,270 (50,000) Net cash flows from financing activities 106,741,458 10,134,426
Net increase/(decrease) in cash and cash equivalents 10,940,383 (59,853,058) Cash and cash equivalents at the beginning of the financial period 39,184,787 99,037,845 Cash and cash equivalents at the end of the period 11 50,125,170 39,184,787

| 34
CONSOLIDATED STATEMENT OF CHANGES IN EQUITY FOR THE YEAR ENDED 30 JUNE 2017
Issued capital
Accumulated losses
Share based payments
reserve Fair value reserves
Total Equity
2016 At 1 July 2015 332,851,798 (9,769,564) 19,961,005 3,223,335 346,266,574
Profit for the year - (23,624,193) - - (23,624,193) Other comprehensive income, net of tax - - - 9,745,369 9,745,369 Total comprehensive (loss)/profit for the year net of tax - (23,624,193) - 9,745,369 (13,878,824) Transactions with owners in their capacity as owners Dividends paid - (12,272,313) - - (12,272,313) Share based payments - - 615,504 - 615,504 Issue of share capital 74,294,360 - - - 74,294,360 Share issue costs (116,968) - - - (116,968) At 30 June 2016 407,029,190 (45,666,070) 20,576,509 12,968,704 394,908,333
2017 At 1 July 2016 407,029,190 (45,666,070) 20,576,509 12,968,704 394,908,333
Loss for the year - 134,012,245 - - 134,012,245 Other comprehensive income, net of tax - - - (9,206,537) (9,206,537) Total comprehensive (loss)/profit for the year net of tax - 134,012,245 - (9,206,537) 124,805,708 Transactions with owners in their capacity as owners Dividend on demerger of Westgold (refer to note 41) - (171,204,652) - - (171,204,652) Share based payments - - 4,754,542 - 4,754,542 Issue of share capital (149,260,950) - - - (149,260,950) Share issue costs (5,256,827) - - - (5,256,827) At 30 June 2017 252,511,413 (82,858,477) 25,331,051 3,762,167 198,746,154

35 |
NOTES TO THE CONSOLIDATED FINANCIAL STATEMENTS FOR THE YEAR ENDED 30 JUNE 2017
1. CORPORATE INFORMATIONThe financial report of Metals X Limited for the year ended 30 June 2017 was authorised for issue in accordance witha resolution of the Directors on 24 August 2017.
Metals X Limited (the Company or the Parent) is a for profit company limited by shares incorporated in Australiawhose shares are publicly traded on the Australian Securities Exchange.
The nature of the operations and principal activities of the Consolidated Entity are described in the Directors’ Report.
The address of the registered office is Level 5, 197 St Georges Terrace, Perth WA 6000.
2. SUMMARY OF SIGNIFICANT ACCOUNTING POLICIES(a) Basis of Preparation
The financial report is a general purpose financial report, which has been prepared in accordance with therequirements of the Corporations Act 2001 and Australian Accounting Standards and other authoritivepronouncements of the Australian Accounting Standards Board.
The financial report has been prepared on a historical cost basis, except for available-for-sale investments,derivatives and copper trade receivables, which have been measured at fair value.
The financial report is presented in Australian dollars.
(b) Statement of Compliance
The financial report complies with Australian Accounting Standards as issued by the Australian Accounting Standards Board which include International Financial Reporting Standards (IFRS) as issued by the International AccountingStandards Board.
Adoption of new accounting standards
In the current year, the Consolidated Entity has adopted all of the new and revised Standards and Interpretationsissued by the Australian Accounting Standards Board (the AASB) that are relevant to its operations and effective forannual reporting periods beginning on 1 July 2016.
Adoption of these Standards and Interpretations, which included the following new and amended standards, did nothave any effect on the financial position or the performance of the Consolidated Entity.
Reference Title Application date of standard*
Application date for the Consolidated Entity*
AASB 2014-3 Amendments to Australian Accounting Standards – Accounting for Acquisitions of Interests in Joint Operations
1 January 2016 1 July 2016
AASB 2014-4 Amendments to Australian Accounting Standards – Clarification of Acceptable Methods of Depreciation and Amortisation
1 January 2016 1 July 2016
AASB 2014-9 Amendments to Australian Accounting Standards – Equity Method in Separate Financial Statements
1 January 2016 1 July 2016
AASB 2015-1 Amendments to Australian Accounting Standards – Annual Improvements to Australian Accounting Standards 2012–2014 Cycle
1 January 2016 1 July 2016
AASB 2015-2 Amendments to Australian Accounting Standards – Disclosure Initiative: Amendments to AASB 101
1 January 2016 1 July 2016
* Designates the beginning of the applicable annual reporting period unless otherwise stated.

| 36
2. SUMMARY OF SIGNIFICANT ACCOUNTING POLICIES (Continued) Adoption of new accounting standards (Continued)
Certain new accounting standards and interpretations have been published that are not mandatory for 30 June 2017 reporting periods. These standards and interpretations have not been early adopted.
Reference Title Summary Impact on Metals X
Application date of standard*
Application date for
Consolidated Entity*
AASB 9, and relevant amending standards
Financial Instruments AASB 9 replaces AASB 139 Financial Instruments: Recognition and Measurement.
Except for certain trade receivables, an entity initially measures a financial asset at its fair value plus, in the case of a financial asset not at fair value through profit or loss, transaction costs.
Debt instruments are subsequently measured at fair value through profit or loss (FVTPL), amortised cost, or fair value through other comprehensive income (FVOCI), on the basis of their contractual cash flows and the business model under which the debt instruments are held.
There is a fair value option (FVO) that allows financial assets on initial recognition to be designated as FVTPL if that eliminates or significantly reduces an accounting mismatch.
Equity instruments are generally measured at FVTPL. However, entities have an irrevocable option on an instrument-by-instrument basis to present changes in the fair value of non-trading instruments in other comprehensive income (OCI) without subsequent reclassification to profit or loss.
For financial liabilities designated as FVTPL using the FVO, the amount of change in the fair value of such financial liabilities that is attributable to changes in credit risk must be presented in OCI. The remainder of the change in fair value is presented in profit or loss, unless presentation in OCI of the fair value change in respect of the liability’s credit risk would create or enlarge an accounting mismatch in profit or loss.
All other AASB 139 classification and measurement requirements for financial liabilities have been carried forward into AASB 9, including the embedded derivative separation rules and the criteria for using the FVO.
The incurred credit loss model in AASB 139 has been replaced with an expected credit loss model in AASB 9.
The requirements for hedge accounting have been amended to more closely align hedge accounting with risk management, establish a more principle-based approach to hedge accounting and address inconsistencies in the hedge accounting model in AASB 139.
The Company has determined that AASB 9 will have no material impact on the way the Consolidated Entity accounts for its financial instruments as it does not apply hedge accounting and does not believe that the credit risk associated with its receivables is material. The Company is still assessing whether there will be any material impact on classification.
1 January 2018 1 July 2018

NOTES TO THE CONSOLIDATED FINANCIAL STATEMENTS FOR THE YEAR ENDED 30 JUNE 2017 (CONTINUED)
37 |
Reference Title Summary Impact on Metals X
Application date of standard*
Application date for
Consolidated Entity*
AASB 15, and relevant amending standards
Revenue from Contracts with Customers
AASB 15 replaces all existing revenue requirements in Australian Accounting Standards (AASB 111 Construction Contracts, AASB 118 Revenue, AASB Interpretation 13 Customer Loyalty Programmes, AASB Interpretation 15 Agreements for the Construction of Real Estate, AASB Interpretation 18 Transfers of Assets from Customers and AASB Interpretation 131 Revenue – Barter Transactions Involving Advertising Services) and applies to all revenue arising from contracts with customers, unless the contracts are in the scope of other standards, such as AASB 117 (or AASB 16 Leases, once applied).
The core principle of AASB 15 is that an entity recognises revenue to depict the transfer of promised goods or services to customers in an amount that reflects the consideration to which an entity expects to be entitled in exchange for those goods or services. An entity recognises revenue in accordance with the core principle by applying the following steps: ► Step 1: Identify the contract(s)
with a customer ► Step 2: Identify the performance
obligations in the contract ► Step 3: Determine the transaction
price ► Step 4: Allocate the transaction
price to the performance obligations in the contract
► Step 5: Recognise revenue when (or as) the entity satisfies a performance obligation.
The Company is currently evaluating all revenue streams to determine the potential impact related to the adoption of AASB 15, as well as potential disclosures required by the standard. Based on our analysis within the adoption plan completed to date, the Company preliminarily does not believe there will be significant change in the amount of revenue recognised under the new standard. In this respect, particular focus has been place on the point of revenue recognition as well as the classification of quotational pricing adjustments within the profit and loss.
1 January 2018 1 July 2018
AASB 16 Leases AASB 16 requires lessees to account for all leases under a single on- balance sheet model in a similar way to finance leases under AASB 117 Leases. The standard includes two recognition exemptions for lessees – leases of ’low-value’ assets (e.g., personal computers) and short-term leases (i.e., leases with a lease term of 12 months or less). At the commencement date of a lease, a lessee will recognise a liability to make lease payments (i.e., the lease liability) and an asset representing the right to use the underlying asset during the lease term (i.e., the right-of-use asset).
Lessees will be required to separately recognise the interest expense on the lease liability and the depreciation expense on the right-of-use asset.
Lessees will be required to remeasure the lease liability upon the occurrence of certain events (e.g., a change in the lease term, a change in future lease payments resulting from a change in an index or rate used to determine those payments). The lessee will generally recognise the amount of the remeasurement of the lease liability as an adjustment to the right-of-use asset.
Lessor accounting is substantially unchanged from today’s accounting under AASB 117. Lessors will continue to classify all leases using the same classification principle as in AASB 117 and distinguish between two types of leases: operating and finance leases.
As at 30 June 2017, the Company has non-cancellable operating leases in relation to office rentals. Management is continuing to determine the extent that these operating leases will be recognised as assets and liabilities on the Company’s statement of financial position, the impact on profit and classification of the related cash flows.
1 January 2019 1 July 2019

| 38
2. SUMMARY OF SIGNIFICANT ACCOUNTING POLICIES (CONTINUED) (c) Changes in Accounting Policy
The accounting policies used in the preparation of these financial statements are consistent with those used in previous years, except as stated in note 2(b).
(d) Basis of Consolidation
The consolidated financial statements comprise the financial statements of the parent entity and its subsidiaries ('the Consolidated Entity') as at 30 June each year. Control is achieved when the Consolidated Entity is exposed, or has rights, to variable returns from its involvement with the investee and has the ability to affect those returns through its power over the investee. Specifically, the Consolidated Entity controls an investee if and only if the Consolidated Entity has: • Power over the investee (i.e. existing rights that give it the current ability to direct the relevant activities of the
investee) • Exposure, or rights, to variable returns from its involvement with the investee, and • The ability to use its power over the investee to affect its returns
When the Consolidated Entity has less than a majority of the voting or similar rights of an investee, the Consolidated Entity considers all relevant facts and circumstances in assessing whether it has power over an investee, including: • The contractual arrangement with the other vote holders of the investee • Rights arising from other contractual arrangements • The Consolidated Entity’s voting rights and potential voting rights
The Consolidated Entity re-assesses whether or not it controls an investee if facts and circumstances indicate that there are changes to one or more of the three elements of control. Consolidation of a subsidiary begins when the Consolidated Entity obtains control over the subsidiary and ceases when the Consolidated Entity loses control of the subsidiary. Assets, liabilities, income and expenses of a subsidiary acquired or disposed of during the year are included in the statement of comprehensive income from the date the Consolidated Entity gains control until the date the Consolidated Entity ceases to control the subsidiary.
Profit or loss and each component of other comprehensive income are attributed to the equity holders of the parent of the Consolidated Entity and to the non-controlling interests, even if this results in the non-controlling interests having a deficit balance. When necessary, adjustments are made to the financial statements of subsidiaries to bring their accounting policies into line with the Consolidated Entity’s accounting policies. All intra-Consolidated Entity assets and liabilities, equity, income, expenses and cash flows relating to transactions between members of the Consolidated Entity are eliminated in full on consolidation.
(e) Foreign Currency Translation
(i) Functional and presentation currency
Both the functional and presentation currency of the Company and its Australian subsidiaries is Australian dollars (A$).
(ii) Transactions and balances
Transactions in foreign currencies are initially recorded in the functional currency by applying the exchange rates ruling at the date of the transaction. Monetary assets and liabilities denominated in foreign currencies are translated at the rate of exchange at the reporting date.
All exchange differences in the consolidated financial report are taken to the profit or loss.
(f) Operating Segments
An operating segment is a component of an entity that engages in business activities from which it may earn revenues and incur expenses (including revenues and expenses relating to transactions with other components of the same entity), whose operating results are regularly reviewed by the entity’s chief operating decision maker to make decisions about resources to be allocated to the segment and assess its performance and for which discrete financial information is available. This includes start up operations which are yet to earn revenues. Management will also consider other factors in determining operating segments such as the existence of a line manager and the level of segment information presented to the board of directors.
Operating segments have been identified based on the information provided to the chief operating decision makers – being the executive management team. The Consolidated Entity aggregates two or more operating segments when they have similar economic characteristics.
Operating segments that meet the quantitative criteria as prescribed by AASB 8 are reported separately. However, an operating segment that does not meet the quantitative criteria is still reported separately where information about the segment would be useful to users of the financial statements.
Information about other business activities and operating segments that are below the quantitative criteria are combined and disclosed in a separate category for “all other segments”.

NOTES TO THE CONSOLIDATED FINANCIAL STATEMENTS FOR THE YEAR ENDED 30 JUNE 2017 (CONTINUED)
39 |
2. SUMMARY OF SIGNIFICANT ACCOUNTING POLICIES (CONTINUED) (g) Cash and Cash Equivalents
Cash and cash equivalents in the statement of financial position comprise cash at bank and in hand and short-term deposits that are readily convertible to known amounts of cash and which are subject to an insignificant risk of changes in value.
For the purposes of the Statement of cash flows, cash and cash equivalents consist of cash and cash equivalents as defined above, net of outstanding bank overdrafts. Bank overdrafts are included within interest bearing loans and borrowings in the current liabilities on the statement of financial position.
(h) Trade and Other Receivables On initial recognition copper trade receivables are designated at fair value through profit and loss (refer to note 2(y)), accordingly these trade receivables are measured at fair value as at reporting date. Credit balances are reclassified to trade and other payables. The majority of copper sales revenue is invoiced and received in US dollars. In the case of copper concentrate, on presentation of documents the customer settles 90% of the provisional invoice value within 3-5 days of receipt of consignment and the remaining 10% is settled within 3-5 days of presentation of the final invoice at the end of the quotational period. Tin trade receivables and other receivables are recognised initially at fair value and subsequently measured at amortised cost using the effective interest rate method, less an allowance for impairment.
Collectability of tin trade receivable and other receivables is reviewed on an ongoing basis. Individual debts that are known to be uncollectible are written off when identified. An impairment allowance is recognised when there is objective evidence that the Consolidated Entity will not be able to collect the receivable. Financial difficulties of the debtor, default payments or debts more than 60 days overdue are considered objective evidence of impairment. The amount of the impairment loss is the receivable carrying amount compared to the present value of estimated future cash flows, discounted at the original effective interest rate.
(i) Inventories Inventories are valued at the lower of cost and net realisable value.
Cost includes expenditure incurred in acquiring and bringing the inventories to their existing condition and location and is determined using the weighted average cost method.
(j) Derivative Financial Instruments and Hedging The Consolidated Entity uses derivative financial instruments to manage commodity price exposures. Such derivative financial instruments are initially recorded at fair value on the date on which the derivative contract is entered into and are subsequently remeasured to fair value.
Certain derivative instruments are also held for trading for the purpose of making short term gains. None of the derivatives qualify for hedge accounting and changes in fair value are recognised immediately in profit or loss in other revenue and expenses.
Derivatives are carried as assets when their fair value is positive and as liabilities when their fair value is negative.
(k) Joint Arrangements Joint arrangements are arrangements over which two or more parties have joint control. Joint Control is the contractual agreed sharing of control of the arrangement which exists only when decisions about the relevant activities require unanimous consent of the parties sharing control. Joint arrangements are classified as ether a joint operation or a joint venture, based on the rights and obligations arising from the contractual obligations between the parties to the arrangement.
To the extent the joint arrangement provides the Consolidated Entity with rights to the individual assets and obligations arising from the joint arrangement, the arrangement is classified as a joint operation and as such, the Consolidated Entity recognises its: • Assets, including its share of any assets held jointly • Liabilities, including its share of liabilities incurred jointly; • Revenue from the sale of its share of the output arising from the joint operation; • Share of revenue from the sale of the output by the joint operation; and • Expenses, including its share of any expenses incurred jointly
To the extent the joint arrangement provides the Consolidated Entity with rights to the net assets of the arrangement, the investment is classified as a joint venture and accounted for using the equity method. Under the equity method, the cost of the investment is adjusted by the post-acquisition changes in the Consolidated Entity’s share of the net assets of the joint venture.

| 40
2. SUMMARY OF SIGNIFICANT ACCOUNTING POLICIES (CONTINUED) (l) Borrowing Costs
Borrowing costs directly attributable to the acquisition, construction or production of a qualifying asset (i.e. an asset that necessarily takes a substantial period of time to get ready for its intended use or sale) are capitalised as part of the cost of that asset. All other borrowing costs are expensed in the period they occur. Borrowing costs consist of interest and other costs that an entity incurs in connection with the borrowing of funds.
(m) Rehabilitation Costs The Consolidated Entity is required to decommission and rehabilitate mines and processing sites at the end of their producing lives to a condition acceptable to the relevant authorities.
The expected cost of any approved decommissioning or rehabilitation programme, discounted to its net present value, is provided when the related environmental disturbance occurs. The cost is capitalised when it gives rise to future benefits, whether the rehabilitation activity is expected to occur over the life of the operation or at the time of closure. The capitalised cost is amortised over the life of the operation and the increase in the net present value of the provision for the expected cost is included in financing expenses. Expected decommissioning and rehabilitation costs are based on the discounted value of the estimated future cost of detailed plans prepared for each site. Where there is a change in the expected decommissioning and restoration costs, the value of the provision and any related asset are adjusted and the effect is recognised in profit or loss on a prospective basis over the remaining life of the operation.
The estimated costs of rehabilitation are reviewed annually and adjusted as appropriate for changes in legislation, technology or other circumstances. Cost estimates are not reduced by potential proceeds from the sale of assets or from plant clean up at closure.
(n) Available-for-Sale Investments All available-for-sale investments are initially recognised at fair value plus directly attributable transaction costs.
Available-for-sale investments are those non-derivative financial assets, principally equity securities that are designated as available-for-sale. Investments are designated as available-for-sale if they do not have fixed maturities and fixed and determinable payments and management intends to hold them for the medium to long term.
After initial recognition, available-for-sale investments are measured at fair value. Gains or losses are recognised in other comprehensive income and presented as a separate component of equity until the investment is sold, collected or otherwise disposed of, or until the investment is determined to be impaired, at which time the cumulative gain or loss previously reported in equity is included in profit or loss.
The fair value of investments that are actively traded in organised markets is determined by reference to quoted market bid prices at the close of business on the reporting date.
For investments with no active market, fair value is determined using valuation techniques. Such valuation techniques include using recent arm’s length transactions; reference to the current market value of another instrument that is substantially the same; discounted cash flow analysis and option pricing models. Where fair value cannot be reliably measured for certain unquoted investments, these investments are measured at cost.
(o) Business Combinations Business combinations are accounted for using the acquisition method. The consideration transferred in a business combination shall be measured at fair value, which shall be calculated as the sum of the acquisition-date fair values of the assets transferred by the acquirer, the liabilities incurred by the acquirer to former owners of the acquiree and the equity issued by the acquirer, and the amount of any non-controlling interest in the acquiree. For each business combination, the acquirer measures the non-controlling interest in the acquiree either at fair value or at the appropriate share of the acquiree’s identifiable net assets. Acquisition-related costs are expensed as incurred.
When the Consolidated Entity acquires a business, it assesses the financial assets and liabilities assumed for appropriate classification and designation in accordance with the contractual terms, economic conditions, the Consolidated Entity’s operating or accounting policies and other pertinent conditions as at the acquisition date. This includes the separation of embedded derivatives in the host contracts by the acquiree.
If the business combination is achieved in stages, the acquisition date fair value of the acquirer’s previously held equity interest in the acquiree is remeasured at fair value as at the acquisition date through profit or loss.
Any contingent consideration to be transferred by the acquirer will be recognised at fair value at the acquisition date. Subsequent changes to the fair value of the contingent consideration which is deemed to be an asset or liability will be recognised in accordance with AASB 139 either in profit or loss or in other comprehensive income. If the contingent consideration is classified as equity, it shall not be remeasured and subsequent settlement is accounted for within equity. In instances, where the contingent consideration does not fall within the scope of AASB 139, it is measured in accordance with the appropriate AASB.
Goodwill is initially measured at cost, being the excess of the aggregate of the consideration transferred and the amount recognised for non-controlling interest over the fair value of the identifiable net assets acquired and liabilities assumed. If this consideration is lower than the fair value of the identifiable net assets of the subsidiary acquired, the difference is recognised in profit or loss.

NOTES TO THE CONSOLIDATED FINANCIAL STATEMENTS FOR THE YEAR ENDED 30 JUNE 2017 (CONTINUED)
41 |
2. SUMMARY OF SIGNIFICANT ACCOUNTING POLICIES (CONTINUED) (o) Business Combinations (CONTINUED)
After initial recognition, goodwill is measured at cost less any accumulated impairment losses. For the purpose of impairment testing, goodwill acquired in a business combination is, from the acquisition date, allocated to each of the Consolidated Entity’s cash-generating units that are expected to benefit from the combination, irrespective of whether other assets or liabilities of the acquiree are assigned to those units.
Where goodwill forms part of a cash-generating unit and part of the operation within that unit is disposed of, the goodwill associated with the operation disposed of is included in the carrying amount of the operation when determining the gain or loss on disposal of the operation. Goodwill disposed of in this circumstance is measured based on the relative value of the operation disposed of and the portion of the cash-generating unit retained.
(p) Property, Plant and Equipment Plant and equipment is stated at historical cost less accumulated depreciation and any impairment in value.
Capital work-in-progress is stated at cost and comprises all costs directly attributable to bringing the assets under construction ready to their intended use. Capital work-in-progress is transferred to property, plant and equipment at cost on completion.
Depreciation is calculated on a straight-line basis over the estimated useful life of the asset, or where appropriate, over the estimated life of the mine.
Major depreciation periods are: • Mine specific plant and equipment is depreciated using – the shorter of life of mine and useful life. Useful life
ranges from 2 to 10 years. • Buildings – the shorter of life of mine and useful life. Useful life ranges from 5 to 40 years. • Office Plant and equipment is depreciated at 33% per annum for computers and office machines and 20% per
annum for other office equipment and furniture.
Impairment The carrying values of plant and equipment are reviewed for impairment when events or changes in circumstances indicate the carrying value may not be recoverable.
For an asset that does not generate largely independent cash inflows, the recoverable amount is determined for the cash-generating unit to which the asset belongs.
If any such indication exists and where the carrying values exceed the estimated recoverable amount, the assets or cash-generating units are written down to their recoverable amount. Refer to note 2(t) for further discussion on impairment testing performed by the Consolidated Entity.
Derecognition An item of property, plant and equipment is derecognised upon disposal or when no future economic benefits are expected to arise from the continued use of the asset.
Any gain or loss arising on derecognition of the asset (calculated as the difference between the net disposal proceeds and the carrying amount of the item) is included in the profit and loss in the period the item is derecognised.
(q) Exploration and Evaluation Expenditure Expenditure on acquisition, exploration and evaluation relating to an area of interest is carried forward at cost where rights to tenure of the area of interest are current and;
i) it is expected that expenditure will be recouped through successful development and exploitation of the area of interest or alternatively by its sale and/or;
ii) exploration and evaluation activities are continuing in an area of interest but at reporting date have not yet reached a stage which permits a reasonable assessment of the existence or otherwise of economically recoverable reserves.
A regular review is undertaken of each area of interest to determine the appropriateness of continuing to carry forward costs in relation to that area of interest. Where uncertainty exists as to the future viability of certain areas, the value of the area of interest is written off to the profit and loss or provided against.
Impairment The carrying value of capitalised exploration and evaluation expenditure is assessed for impairment regularly and if after expenditure is capitalised, information becomes available suggesting that the recovery of expenditure is unlikely or that the Consolidated Entity no longer holds tenure, the relevant capitalised amount is written off to profit or loss in the period when the new information becomes available.

| 42
2. SUMMARY OF SIGNIFICANT ACCOUNTING POLICIES (CONTINUED) (r) Mine Properties and Development
Expenditure on the acquisition and development of mine properties within an area of interest are carried forward at cost separately for each area of interest. Accumulated expenditure is amortised over the life of the area of interest to which such costs relate on a production output basis.
A regular review is undertaken of each area of interest to determine the appropriateness of continuing to carry forward costs in relation to that area of interest.
Impairment The carrying value of capitalised mine properties and development expenditure is assessed for impairment whenever facts and circumstances suggest that the carrying amount of the asset may exceed its recoverable amount.
Recoverable amount is determined for an individual asset, unless the asset does not generate cash inflows that are largely independent of those from other assets or groups of assets. When the carrying amount of an asset or CGU exceeds its recoverable amount, the asset is considered impaired and is written down to its recoverable amount. Refer to note 2(t) for further discussion on impairment testing performed by the Consolidated Entity.
(s) Non-Current Assets and Disposal Groups Held for Sale and Discontinued Operations Non-current assets and disposal groups are classified as held for sale and measured at the lower of their carrying amount and fair value less costs to sell if their carrying amount will be recovered principally through a sale transaction. They are not depreciated or amortised. For an asset or disposal group to be classified as held for sale it must be available for immediate sale in its present condition and its sale must be highly probable.
An impairment loss is recognised for any initial or subsequent write-down of the asset (or disposal group) to fair value less costs to sell. A gain is recognised for any subsequent increases in fair value less costs to sell of an asset (or disposal group), but is not in excess of any cumulative impairment loss previously recognised. A gain or loss not previously recognised by the date of the sale of the non-current asset (or disposal group) is recognised as the date of derecognition.
A discontinued operation is a component of the entity that has been disposed of or is classified as held for sale and that represents a separate major line of business or geographical area of operations, is part of a single coordinated plan to dispose of such a line of business or area of operations, or is a subsidiary acquired exclusively with a view to resale. The results of discontinued operations are presented separately on the face of the statement of comprehensive income and the assets and liabilities are presented separately on the face of the statement of financial position.
(t) Impairment of Non-Financial Assets The Consolidated Entity assesses, at each reporting date, whether there is an indication that an asset may be impaired. If any indication exists, or when annual impairment testing for an asset is required, the Consolidated Entity estimates the asset’s recoverable amount. An asset’s recoverable amount is the higher of an asset’s or cash-generating unit’s (CGU) fair value less costs of disposal and its value in use. Recoverable amount is determined for an individual asset, unless the asset does not generate cash inflows that are largely independent of those from other assets or groups of assets. When the carrying amount of an asset or CGU exceeds its recoverable amount, the asset is considered impaired and is written down to its recoverable amount.
In assessing value in use, the estimated future cash flows are discounted to their present value using a pre-tax discount rate that reflects current market assessments of the time value of money and the risks specific to the asset or CGU. In determining fair value less costs of disposal, recent market transactions are taken into account. If no such transactions can be identified, an appropriate valuation model is used. These calculations are corroborated by valuation multiples or other available fair value indicators.
The Consolidated Entity bases its impairment calculation on detailed budgets and forecasts, which are prepared separately for each of the Consolidated Entity’s CGUs to which the individual assets are allocated, based on the life-of-mine plans. The estimated cash flows are based on expected future production, metal selling prices, operating costs and forecast capital expenditure based on life-of-mine plans.
Value in use does not reflect future cash flows associated with improving or enhancing an asset’s performance, whereas anticipated enhancements to assets are included in fair value less costs of disposal calculations.
Impairment losses of continuing operations, including impairment on inventories, are recognised in the profit and loss. For such properties, the impairment is recognised in other comprehensive income up to the amount of any previous revaluation.
For assets, an assessment is made at each reporting date to determine whether there is an indication that previously recognised impairment losses no longer exist or have decreased. If such indication exists, the Consolidated Entity estimates the asset’s or CGU’s recoverable amount. A previously recognised impairment loss is reversed only if there has been a change in the assumptions used to determine the asset’s recoverable amount since the last impairment loss was recognised. The reversal is limited so that the carrying amount of the asset does not exceed its recoverable amount, nor exceed the carrying amount that would have been determined, net of depreciation, had no impairment loss been recognised for the asset in prior years. Such reversal is recognised in profit or loss unless the asset is carried at a revalued amount, in which case, the reversal is treated as a revaluation increase.

NOTES TO THE CONSOLIDATED FINANCIAL STATEMENTS FOR THE YEAR ENDED 30 JUNE 2017 (CONTINUED)
43 |
2. SUMMARY OF SIGNIFICANT ACCOUNTING POLICIES (CONTINUED) (u) Trade and Other Payables
Trade payables and other payables are carried at amortised cost and due to their short-term nature they are not discounted. They represent liabilities for goods and services provided to the Consolidated Entity prior to the end of the financial year that are unpaid and arise when the Consolidated Entity becomes obliged to make future payments in respect of the purchase of these goods and services. The amounts are unsecured and usually paid within 30 days of recognition.
(v) Interest-Bearing Loans and Borrowings All loans and borrowings are initially recognised at the fair value of the consideration received less directly attributable transaction costs.
After initial recognition, interest-bearing loans and borrowings are subsequently measured at amortised cost using the effective interest rate method.
Borrowings are classified as current liabilities unless the Consolidated Entity has the unconditional right to defer settlement of the liability for at least 12 months after the reporting date.
(w) Provisions Provisions are recognised when the Consolidated Entity has a present obligation (legal or constructive) as a result of a past event, it is probable that an outflow of resources embodying economic benefits will be required to settle the obligation and a reliable estimate can be made of the amount of the obligation. Provisions are measured at the present value of management’s best estimate of the expenditure required to settle the present obligation at the reporting date. The discount rate used to determine the present value reflects current market assessments of the time value of money and the risks specific to the liability. The increase in the provision resulting from the passage of time is recognised in finance costs.
(x) Leases Leases are classified at their inception as either operating or finance leases based on the economic substance of the agreement so as to reflect the risks and benefits incidental to ownership. (i) Operating Leases
The minimum lease payments of operating leases, where the lessor effectively retains substantially all of the risks and benefits of ownership of the leased item, are recognised as an expense in profit and loss on a straight-line basis over the lease term. Contingent rentals are recognised as an expense in the financial year in which they are incurred.
(ii) Finance Leases Leases which effectively transfer substantially all the risks and benefits incidental to ownership of the leased item to the Consolidated Entity are capitalised at the inception of the lease at the fair value of the leased property or, if lower, at the present value of the minimum lease payments. Lease payments are apportioned between the finance charges and reduction of the lease liability so as to achieve a constant rate of interest on the remaining balance of the liability. Finance charges are charged directly to profit and loss. Capitalised leased assets are depreciated over the estimated useful life of the asset or where appropriate, over the estimated life of the mine. The cost of improvements to or on leasehold property is capitalised, disclosed as leasehold improvements, and amortised over the unexpired period of the lease or the estimated useful lives of the improvements, whichever is the shorter.
(y) Revenue Revenue is measured at the fair value of the consideration received or receivable to the extent it is probable that the economic benefits will flow to the Consolidated Entity and the revenue can be reliably measured. The following specific recognition criteria must also be met before revenue is recognised: Copper sales Revenue from copper production is recognised when the significant risks and rewards of ownership have passed to the buyer. Sales revenue is subject to adjustment based on final assay results. In addition, the terms of the sales contracts for copper concentrate contain provisional pricing arrangements. Adjustments to the sales price are based on movements in metal prices up to the date of final pricing. Final settlement is between 2 and 4 months after the date of delivery (the “quotational period”) with pricing based on the average LME copper price for the month of settlement. The revenue adjustment mechanism embedded within the sales contract has the characteristics of a commodity derivative which significantly modifies the cash flows under the contract. The Consolidated Entity has decided to designate the trade receivables arising on initial recognition of these sales transaction as a financial asset at fair value through profit and loss and not separately account for the embedded derivative. Accordingly, the fair value of the receivable is re-estimated continuously and changes in fair value recognised as an adjustment to revenue in the consolidated statement of comprehensive income.

| 44
2. SUMMARY OF SIGNIFICANT ACCOUNTING POLICIES (CONTINUED) (y) Revenue (CONTINUED)
Tin and Gold sales Revenue from tin and gold production is recognised when the significant risks and rewards of ownership have passed to the buyer. Interest income Revenue is recognised as interest accrues using the effective interest method. This is a method of calculating the amortised cost of a financial asset and allocating the interest income over the relevant period using the effective interest rate, which is the rate that exactly discounts estimated future cash receipts through the expected life of the financial asset to the net carrying amount of the financial asset.
(z) Earnings Per Share Basic earnings per share is calculated as net profit attributable to members of the parent, adjusted to exclude any costs of servicing equity (other than dividends) and preference share dividends, divided by the weighted average number of ordinary shares, adjusted for any bonus element. Diluted earnings per share is calculated as net profit attributable to members of the parent adjusted for: • cost of servicing equity (other than dividends) and preference share dividends; • the after tax effect of dividends and interest associated with dilutive potential ordinary shares that have been
recognised; and • other non-discriminatory changes in revenues or expenses during the period that would result from the dilution
of potential ordinary shares; divided by the weighted average number of ordinary shares and dilutive potential ordinary shares, adjusted for any bonus element.
(aa) Issued Capital Issued and paid up capital is recognised at the fair value of the consideration received by the Consolidated Entity. Any transaction costs arising on the issue of ordinary shares are recognised directly in equity as a reduction in the proceeds received.
(ab) Share-Based Payment Transactions The Consolidated Entity provides benefits to employees (including Directors) in the form of share-based payment transactions, whereby employees render services in exchange for shares or rights over shares (equity-settled transactions). The Consolidated Entity has one plan in place that provides these benefits. It is the Long Term Incentive Plan (LTIP) which provides benefits to all employees including Directors.
In valuing equity-settled transactions, no account is taken of any vesting conditions (such as service conditions), other than conditions linked to the price of the shares of Metals X Limited (market conditions) if applicable.
The cost of these equity-settled transactions with employees is measured by reference to the fair value at the date at which they are granted. The fair value is determined by using a Black & Scholes model. Further details of which are given in note 31.
The cost of equity-settled transactions is recognised, together with a corresponding increase in equity, over the period in which the performance and/or service conditions are fulfilled (the vesting period), ending on the date on which the relevant employees become fully entitled to the award (the vesting date).
At each subsequent reporting date until vesting, the cumulative charge to the statement of comprehensive income is the product of (i) the grant date fair value of the award; (ii) the current best estimate of the number of awards that will vest, taking into account such factors as the likelihood of employee turnover during the vesting period and the likelihood of non-market performance conditions being met; and (iii) the expired portion of the vesting period. The charge to profit and loss for the period is the cumulative amount as calculated above less the amounts already charged in previous periods. There is a corresponding credit to equity. Until an award has vested, any amounts recorded are contingent and will be adjusted if more or fewer awards vest than were originally anticipated to do so. Any award subject to a market condition is considered to vest irrespective of whether or not the market condition is fulfilled, provided that all other conditions are satisfied. If a non-vesting condition is within the control of the Consolidated Entity, Company or the employee, the failure to satisfy the condition is treated as a cancellation. If a non-vesting condition within the control of neither the Consolidated Entity, Company nor employee is not satisfied during the vesting period, any expense for the award not previously recognised is recognised over the remaining vesting period, unless the award is forfeited. If the terms of an equity-settled award are modified, as a minimum an expense is recognised as if the terms had not been modified. An additional expense is recognised for any modification that increases the total fair value of the share-based payment arrangement, or is otherwise beneficial to the employee, as measured at the date of modification. If an equity-settled award is cancelled, it is treated as if it had vested on the date of cancellation, and any expense not yet recognised for the award is recognised immediately. However, if a new award is substituted for the cancelled award, and designated as a replacement award on the date that it is granted, the cancelled and new award are treated as if they were a modification of the original award, as described in the previous paragraph. The dilutive effect, if any, of outstanding options is reflected as additional share dilution in the computation of dilutive earnings per share.

NOTES TO THE CONSOLIDATED FINANCIAL STATEMENTS FOR THE YEAR ENDED 30 JUNE 2017 (CONTINUED)
45 |
2. SUMMARY OF SIGNIFICANT ACCOUNTING POLICIES (CONTINUED) (ac) Employee Benefits
(i) Wages, salaries, sick leave and other short-term benefits Liabilities for wages and salaries, including non-monetary benefits, accumulating sick leave and other short term benefits expected to be settled wholly within 12 months of the reporting date are recognised in respect of employees' services up to the reporting date. They are measured at the amounts expected to be paid when the liabilities are settled. (ii) Long service leave The liability for long service leave is recognised and measured as the present value of expected future payments to be made in respect of services provided by employees up to the reporting date using the projected unit credit method. Consideration is given to expected future wage and salary levels, experience of employee departures, and periods of service. Expected future payments are discounted using market yields at the reporting date on corporate bonds with terms to maturity and currencies that match, as closely as possible, the estimated future cash outflows. (iii) Superannuation Contributions made by the Consolidated Entity to employee superannuation funds, which are defined contribution plans, are charged as an expense when incurred.
(ad) Onerous Operating Lease Provision A provision for an onerous operating lease is recognised when the expected benefits to be derived from the lease are lower than the unavoidable cost of meeting the obligations under the lease. The provision is measured at the lesser of the present value of the expected net cost of continuing with the lease and any amount agreed between the lessor and the lessee to terminate the lease.
(ae) Other Taxes Revenues, expenses and assets are recognised net of the amount of GST except: • when the GST incurred on a purchase of goods and services is not recoverable from the taxation authority, in
which case the GST is recognised as part of the cost of acquisition of the asset or as part of the expense item as applicable; and
• receivables and payables, which are stated with the amount of GST included. The net amount of GST recoverable from, or payable to, the taxation authority is included as part of receivables or payables in the statement of financial position. Cash flows are included in the statement of cash flows on a gross basis and the GST component of cash flows arising from investing and financing activities, which is recoverable from, or payable to, the taxation authority are classified as operating cash flows. Commitments and contingencies are disclosed net of amounts of GST recoverable from, or payable to, the taxation authority.
(af) Income Tax The Consolidated Entity entered into a tax Consolidated Entity as of 1 July 2004. Current tax assets and liabilities are measured at the amount expected to be recovered from or paid to the taxation authorities. The tax rates and tax laws used to compute the amount are those that are enacted or substantively enacted at the reporting date in the countries where the Group operates and generates taxable income. Deferred income tax is provided on all temporary differences at the reporting date between the tax bases of assets and liabilities and their carrying amounts for financial reporting purposes. Deferred income tax liabilities are recognised for all taxable temporary differences except: • when the deferred income tax liability arises from the initial recognition of goodwill or of an asset or liability in
a transaction that is not a business combination and, at the time of the transaction, affects neither the accounting profit nor taxable profit or loss; and
• in respect of taxable temporary differences associated with investments in subsidiaries, associates and interests in joint ventures, when the timing of the reversal of the temporary differences can be controlled and it is probable that the temporary differences will not reverse in the foreseeable future.
Deferred income tax assets are recognised for all deductible temporary differences, carry-forward of unused tax assets and unused tax losses, to the extent that it is probable that taxable profit will be available against which the deductible temporary differences, and the carry-forward of unused tax assets and unused tax losses can be utilised except: • when the deferred income tax asset relating to the deductible temporary difference arises from the initial
recognition of an asset or liability in a transaction that is not a business combination and, at the time of the transaction, affects neither the accounting profit nor taxable profit or loss; and
• in respect of the deductible temporary differences associated with investments in subsidiaries, associates and interests in joint ventures, deferred tax assets are only recognised to the extent that it is probable that the temporary differences will reverse in the foreseeable future and taxable profit will be available against which the temporary differences can be utilised.

| 46
2. SUMMARY OF SIGNIFICANT ACCOUNTING POLICIES (CONTINUED)
(af) Income Tax (CONTINUED) The carrying amount of deferred income tax assets is reviewed at each reporting date and reduced to the extent that it is no longer probable that sufficient taxable profit will be available to allow all or part of the deferred income tax asset to be utilised. Unrecognised income taxes are reassessed at each reporting date and are recognised to the extent that it has become probable that future taxable profit will allow the deferred tax asset to be recovered. Deferred income tax assets and liabilities are measured at the tax rates that are expected to apply to the year when the asset is realised or the liability is settled, based on tax rates (and tax laws) that have been enacted or substantively enacted at the reporting date. Income taxes relating to items recognised directly in equity are recognised in equity and not in the profit and loss. Deferred tax assets and deferred tax liabilities are offset only if a legally enforceable right exists to set off current tax assets against current tax liabilities and the deferred tax assets and liabilities relate to the same taxable entity and the same taxation authority.
Tax consolidation legislation Metals X Limited and its wholly-owned Australian controlled entities have implemented the tax consolidation legislation as of 1 July 2004. The head entity, Metals X Limited and the controlled entities in the tax consolidated group continue to account for their own current and deferred tax amounts. The Consolidated Entity has applied the group allocation approach in determining the appropriate amount of current taxes and deferred taxes to allocate to members of the tax consolidated group.
3. SIGNIFICANT ACCOUNTING JUDGEMENTS, ESTIMATES AND ASSUMPTIONS The preparation of the financial statements requires management to make judgements, estimates and assumptions that affect the reported amounts in the financial statements. Management continually evaluates its judgements and estimates in relation to assets, liabilities, contingent liabilities, revenue and expenses. Management bases its judgements and estimates on historical experience and on other various factors it believes to be reasonable under the circumstances, the result of which form the basis of the carrying values of assets and liabilities that are not readily apparent from other sources. Management has identified the following critical accounting policies for which significant judgements have been made as well as the following key estimates and assumptions that have the most significant impact on the financial statements. Actual results may differ from these estimates under different assumptions and conditions and may materially affect financial results or the financial position reported in future periods.
Further details of the nature of these assumptions and conditions may be found in the relevant notes to the financial statements.
(i) Significant judgments made in applying accounting policies
• Impairment of available-for-sale-investments In determining the amount of impairment of financial assets, the Consolidated Entity has made judgments in identifying financial assets whose decline in fair value below cost is considered “significant” or “prolonged”. A significant decline is assessed based on the historical volatility of the share price. The higher the historical volatility, the greater the decline in fair value required before it is likely to be regarded as significant. A prolonged decline is based on the length of time over which the share price has been depressed below cost. A sudden decline followed by immediate recovery is less likely to be considered prolonged compared to a sustained fall of the same magnitude over a longer period. The Consolidated Entity considers a less than a 10% decline in fair value is unlikely to be considered significant for investments actively traded in a liquid market, whereas a decline in fair value of greater than 20% will often be considered significant. For less liquid investments that have historically been volatile (standard deviation greater than 25%), a decline of greater than 30% is usually considered significant. Generally, the Consolidated Entity does not consider a decline over a period of less than three months to be prolonged. However, where the decline in fair value is greater than six months for liquid investments and 12 months for illiquid investments, it is usually considered prolonged.
(ii) Significant accounting estimates and assumptions
• Determination of mineral resources and ore reserves The determination of reserves impacts the accounting for asset carrying values, depreciation and amortisation rates and provisions for mine rehabilitation. The Consolidated Entity estimates its mineral resource and reserves in accordance with the Australian code for Reporting of Exploration Results, Mineral Resources and Ore Reserves 2012 (the JORC code). The information on mineral resources and ore reserves were prepared by or under the supervision of Competent Persons as defined in the JORC code. The amounts presented are based on the mineral resources and ore reserves determined under the JORC code.

NOTES TO THE CONSOLIDATED FINANCIAL STATEMENTS FOR THE YEAR ENDED 30 JUNE 2017 (CONTINUED)
47 |
3. SIGNIFICANT ACCOUNTING JUDGEMENTS, ESTIMATES AND ASSUMPTIONS (CONTINUED) (ii) Significant accounting estimates and assumptions (continued)
There are numerous uncertainties inherent in estimating mineral resources and ore reserves and assumptions that are valid at the time of estimation may change significantly when new information becomes available. Changes in the forecast prices of commodities, exchange rates, production costs or recovery rates may change the economic status of reserves and may, ultimately, result in the reserves being restated.
• Mine rehabilitation provision The Consolidated Entity assesses its mine rehabilitation provision on an annual basis in accordance with the accounting policy stated in note 2(m). In determining an appropriate level of provision, consideration is given to the expected future costs to be incurred, the timing of those future costs (largely dependent on the life of mine) and the estimated level of inflation. The ultimate rehabilitation costs are uncertain, and cost estimates can vary in response to many factors, including estimates of the extent and costs of rehabilitation activities, technological changes, regulatory changes, cost increases as compared to the inflation rates, and changes in discount rates. The expected timing of expenditure can also change, for example in response to changes in reserves or to production rates. These uncertainties may result in future actual expenditure differing from the amounts currently provided. Therefore, significant estimates and assumptions are made in determining the provision for mine rehabilitation. As a result, there could be significant adjustments to the provisions established which would affect future financial result. The provision at reporting date represents management’s best estimate of the present value of the future rehabilitation costs required.
• Impairment of capitalised exploration and evaluation expenditure The future recoverability of capitalised exploration and evaluation expenditure is dependent on a number of factors, including whether the Consolidated Entity decides to exploit the related area interest itself or, if not, whether it successfully recovers the related exploration and evaluation asset through sale. Factors that could impact the future recoverability include the level of reserves and resources, future technological changes, which could impact the cost of mining, future legal changes (including changes to environmental restoration obligations) and changes to commodity prices. To the extent that capitalised exploration and evaluation expenditure is determined not to be recoverable in the future, profits and net assets will be reduced in the period in which this determination is made. In addition, exploration and evaluation expenditure is capitalised if activities in the area of interest have not yet reached a stage that permits a reasonable assessment of the existence or otherwise of economically recoverable reserves. To the extent it is determined in the future that this capitalised expenditure should be written off, profits and net assets will be reduced in the period in which this determination is made.
• Impairment of capitalised mine development expenditure The future recoverability of capitalised mine development expenditure is dependent on a number of factors, including the level of proved, probable and inferred mineral resources, future technological changes, which could impact the cost, future legal changes (including changes to environmental restoration obligations) and changes to commodity prices. The Consolidated Entity regularly reviews the carrying values of its mine development assets in the context of internal and external consensus forecasts for commodity prices and foreign exchange rates, with the application of appropriate discount rates for the assets concerned. To the extent that capitalised mine development expenditure is determined not to be recoverable in the future, this will reduce profit in the period in which this determination is made. Capitalised mine development expenditure is assessed for recoverability in a manner consistent with property, plant and equipment as described below. Refer to note 2(r) for further discussion on the impairment assessment process undertaken by the Consolidated Entity.
• Impairment of property, plant and equipment Property, plant and equipment is reviewed for impairment if there is any indication that the carrying amount may not be recoverable. Where a review for impairment is conducted, the recoverable amount is assessed by reference to the higher of “value in use” (being net present value of expected future cash flows of the relevant cash generating unit) and “fair value less costs to sell”. In determining the value in use, future cash flows for each cash generating unit (CGU) (i.e. each mine site) are prepared utilising managements latest estimates of; the quantities of ore reserves and mineral resources for which there is a high degree of confidence of
economic extraction; royalties and taxation; future production levels; future commodity prices; future cash costs of production; and other relevant cash inflows and outflows.
| 48
3. SIGNIFICANT ACCOUNTING JUDGEMENTS, ESTIMATES AND ASSUMPTIONS (CONTINUED) (ii) Significant accounting estimates and assumptions (continued)
Cash flow scenarios for a range of commodity prices and foreign exchange rates are assessed using internal and external market forecasts, and the present value of the forecast cash flows. The Consolidated Entity’s cash flows are most sensitive to movements in commodity price, expected quantities of ore reserves and mineral resources and key operating costs. In particular, the Renison Tin Project’s forecasted cash flows are most sensitive to variations in the commodity prices and the Higginsville and Central Murchison Gold Operations are most sensitive to expected quantities of ore reserves and mineral resources to be extracted and therefore the estimated future cash inflows resulting from the sale of product produced is dependent on these assumptions. Variations to the expected cash flows, and the timing thereof, could result in significant changes to any impairment losses recognised, if any, which in turn could impact future financial results. Refer to Note 2(t) for further discussion on the impairment assessment process undertaken by the Consolidated Entity.
• Life of mine method of amortisation and depreciation The Consolidated Entity applies the life of mine method of amortisation and depreciation to its mine specific plant and to mine properties and development based on ore tonnes mined. These calculations require the use of estimates and assumptions. Significant judgement is required in assessing the available reserves and the production capacity of the plants to be depreciated under this method. Factors that are considered in determining reserves and production capacity are the Consolidated Entity’s history of converting resources to reserves and the relevant time frames, the complexity of metallurgy, markets and future developments. When these factors change or become known in the future, such differences will impact pre tax profit and carrying values of assets. Refer to note 19 for discussion on change in estimates in current year.
4. FINANCIAL RISK MANAGEMENT OBJECTIVES AND POLICIES The Consolidated Entity’s principal financial instruments comprise receivables, payables, finance lease and hire purchase contracts, cash and short-term deposits, and available-for-sale investments. Risk exposures and responses The Consolidated Entity manages its exposure to key financial risks in accordance with the Consolidated Entity’s financial risk management policy. The objective of the policy is to support the delivery of the Consolidated Entity’s financial targets while protecting future financial security. The Consolidated Entity enters into derivative transactions, principally zero cost collar put and call options. The purpose is to manage the commodity price risks arising from the Consolidated Entity’s operations. These derivatives provide economic hedges, but do not qualify for hedge accounting and are based on limits set by the board. The main risks arising from the Consolidated Entity’s financial instruments are interest rate risk, foreign currency risk, commodity risk, credit risk, equity price risk and liquidity risk. The Consolidated Entity uses different methods to measure and manage different types of risks to which it is exposed. These include monitoring levels of exposure to interest rate, foreign exchange risk and assessments of market forecasts for interest rate, foreign exchange and commodity prices. Ageing analysis of and monitoring of receivables are undertaken to manage credit risk, liquidity risk is monitored through the development of future rolling cash flow forecasts. The board reviews and agrees policies for managing each of these risks as summarised below. Primary responsibility for identification and control of financial risks rests with the Board. The Board reviews and agrees policies for managing each of the risks identified below, including for interest rate risk, credit allowances and cash flow forecast projections. Details of the significant accounting policies and methods adopted, including the criteria for recognition, the basis of measurement and the basis on which income and expenses are recognised, in respect of each class of financial asset, financial liability and equity instrument are disclosed in note 2 to the financial statements. The accounting classification of each category of financial instruments as defined in note 2, and their carrying amounts, are set out below:
(a) Interest Rate Risk The Consolidated Entity’s exposure to risks of changes in market interest rates relate primarily to the Consolidated Entity’s interest bearing liabilities and cash balances. The level of debt is disclosed in notes 24 and 25. The Consolidated Entity’s policy is to manage its interest cost using fixed rate debt. Therefore, the Consolidated Entity does not have any variable interest rate risk on its debt. The Consolidated Entity constantly analyses its interest rate exposure. Within this analysis consideration is given to potential renewals of existing positions, alternative financing positions and the mix of fixed and variable interest rates. The following sensitivity analysis is based on the interest rate risk exposures in existence at the reporting date. The sensitivity analysis is for variable rate cash balances.

NOTES TO THE CONSOLIDATED FINANCIAL STATEMENTS FOR THE YEAR ENDED 30 JUNE 2017 (CONTINUED)
49 |
4. FINANCIAL RISK MANAGEMENT OBJECTIVES AND POLICIES (CONTINUED) At 30 June 2017, if interest rates had moved by a reasonably possible 0.25%, as illustrated in the table below, with all other variables held constant, post tax profits and equity would have been affected as follows:
Post tax profit Other Comprehensive
Income higher/(lower) higher/(lower) 2017 2016 2017 2016
Judgements of reasonably possible movements: + 0.25% (25 basis points) 46,883 67,992 - - - 0.25% (25 basis points) (46,883) (67,992) - - A sensitivity of +%0.25 or -0.25% has been selected as this is considered reasonable given the current level of short-term and long-term Australian dollar interest rates. The movements in profit are due to possible higher or lower interest income from variable rate cash balances. The sensitivity is higher in 2017 than 2016 due to an increase in the balance of cash and cash equivalents held in variable interest rate accounts in 2017. At the reporting date the Consolidated Entity’s exposure to interest rate risk for classes of financial assets and financial liabilities is set out below.
2017 Floating
interest rate Fixed
interest Non-Interest
bearing Total carrying
amount Financial Assets
Cash and cash equivalents 26,790,352 65,000 - 26,855,352 Trade and other receivables - - 45,046,603 45,046,603 Other financial assets - 10,858,049 - 10,858,049
26,790,352 10,923,049 45,046,603 82,760,004
Financial Liabilities Trade and other payables - - (29,306,601) (29,306,601) Interest bearing liabilities - (8,496,235) - (8,496,235)
- (8,496,235) (29,306,601) (37,802,836) Net financial assets/(liabilities) 44,957,168
2016 Floating
interest rate Fixed
interest Non-Interest
bearing Total carrying
amount Financial Assets
Cash and cash equivalents 38,852,221 332,566 - 39,184,787 Trade and other receivables - - 15,799,458 15,799,458 Other financial assets - 5,802,625 - 5,802,625
38,852,221 6,135,191 15,799,458 60,786,870
Financial Liabilities Trade and other payables - - (68,289,529) (68,289,529) Interest bearing liabilities - (15,443,345) - (15,443,345)
- (15,443,345) (68,289,529) (83,732,874) Net financial assets/(liabilities) (22,946,004)
(b) Credit Risk Credit risk arises from the financial assets of the Consolidated Entity, which comprises cash and cash equivalents, trade and other receivables, other financial assets held as security and loans. Cash and cash equivalents are held with National Australia Bank which is an Australian Bank with an AA- credit rating (Standard & Poor’s). The Consolidated Entity’s exposure to credit risk arises from potential default of the counter party, with the maximum exposure equal to the carrying amount of the financial assets (as outlined in each applicable note) as well as $10,858,049 (2016: $3,305,319) in relation to other financial assets (refer to note 15). The Consolidated Entity does not hold any credit derivatives to offset its credit exposure. The Consolidated Entity trades only with recognised, creditworthy third parties and as such collateral is not requested nor is it the Consolidated Entity’s policy to securitise its trade and other loans and receivables. Receivable balances are monitored on an ongoing basis with the result that the Consolidated Entity does not have a significant exposure to bad debts. Significant concentrations of credit risk are in relation to cash and cash equivalents with Australian banks.

| 50
4. FINANCIAL RISK MANAGEMENT OBJECTIVES AND POLICIES (CONTINUED)
(c) Price Risk
Equity Security Price Risk
The Consolidated Entity’s revenues are exposed to equity security price fluctuations arising from investments in equity securities.
At 30 June 2017, if equity security prices had moved by a reasonably possible 20%, as illustrated in the table below, with all other variables held constant, post tax profits and equity would have been affected as follows:
Post tax profit Other Comprehensive
Income higher/(lower) higher/(lower) 2017 2016 2017 2016
Judgements of reasonably possible movements: Price + 20% - - 1,302,109 6,053,437 Price - 20% * (1,302,109) - - (6,053,437)
* Provided the decline is below cost and is significant or prolonged. A sensitivity of +20% or -20% has been selected as this is considered reasonable given recent fluctuations in equity prices and management’s expectations of future movements. The movements in other comprehensive income are due to possible higher or lower equity security prices from investments in equity securities that are classified as available-for-sale financial assets (refer to note 2(n)). The overall sensitivity for post-tax profits and equity in 2017 is higher due to increases in the market value of the underlying securities during the financial year (refer to note 17).
(d) Foreign Currency Risk
As a result of tin and copper sales receipts being denominated in US dollars, the Consolidated Entity’s cash flows can be affected by movements in the US dollar/Australian dollar exchange rate.
At the balance date the Consolidated Entity had the following exposure to US dollar foreign currency:
2017 2016
Cash and cash equivalents 23,269,818 870 Trade and other receivables 31,096,630 -
54,366,448 870
At 30 June 2017, if foreign currency rates had moved by a reasonably possible 10%, as illustrated in the table below, with all other variables held constant, post tax profits and equity would have been affected as follows:
Post tax profit Other Comprehensive
Income higher/(lower) higher/(lower) 2017 2016 2017 2016
Judgements of reasonably possible movements: A$/US$ Price +10% 5,436,645 87 - - A$/US$ Price -10% (5,436,645) (87) - -
A sensitivity of +10% or -10% has been selected as this is considered reasonable given recent fluctuations in foreign currency rates and management’s expectations of future movements. The overall sensitivity for post-tax profits in 2017 is higher due to acquisition of the Nifty (refer to Review of Operations).
(e) Commodity Price Risk
The Consolidated Entity’s revenues are exposed to commodity price fluctuations. Periodically the Consolidated Entity enters into contracts to manage commodity price risk. At the end of the financial period the Consolidated Entity did not have any contracts outstanding. In the previous period the Consolidated Entity had sales contracts for 187,750 ounces at an average price of $1,652.13 per ounce ending in September 2018, which the Consolidated Entity will deliver physical gold to settle. These contracts were transferred to Westgold as a part of the demerger.

NOTES TO THE CONSOLIDATED FINANCIAL STATEMENTS FOR THE YEAR ENDED 30 JUNE 2017 (CONTINUED)
51 |
4. FINANCIAL RISK MANAGEMENT OBJECTIVES AND POLICIES (CONTINUED)
(e) Commodity Price Risk (CONTINUED) 2017 2016
Gross value of open copper concentrate positions (a) 58,584,329 -
58,584,329 -
(a) This relates to the provisional amount of copper tonnes remaining open to price adjustments (gross sales).
Refer to note 12 for the open quantity.
At 30 June 2017, if commodity prices had moved by a reasonably possible 10%, as illustrated in the table below, with all other variables held constant, post tax profits and equity would have been affected as follows:
Post tax profit Other Comprehensive
Income higher/(lower) higher/(lower) 2017 2016 2017 2016
Judgements of reasonably possible movements: Copper prices +10% 5,858,433 - - - Copper prices -10% (5,858,433) - - -
A sensitivity of +10% or -10% has been selected as this is considered reasonable given recent fluctuations in commodity prices and management’s expectations of future movements. The overall sensitivity for post-tax profits in 2017 is higher due to acquisition of the Nifty (refer to Review of Operations).
(f) Liquidity Risk
Liquidity risk arises from the financial liabilities of the Consolidated Entity and the subsequent ability to meet the obligations to repay the financial liabilities as and when they fall due.
The Consolidated Entity’s objective is to maintain a balance between continuity of funding and flexibility through the use of finance and hire purchase leases.
The table below reflects all contractually fixed payables and receivables for settlement, repayment and interest resulting from recognised financial assets and liabilities, including derivative financial instruments as of 30 June 2017. For derivative financial instruments the market value is presented, whereas for the other obligations the respective undiscounted cash flows for the respective upcoming fiscal years are presented. Cash flows for financial assets and liabilities without fixed amount or timing are based on the conditions existing as 30 June.
The remaining contractual maturities of the Consolidated Entity’s financial liabilities are:
2017 2016
6 months or less (30,958,079) (70,779,811) 6 - 12 months (1,660,898) (2,910,280) 1 - 5 years (5,516,557) (10,634,483) Over 5 years - -
(38,135,534) (84,324,574)
Maturity analysis of financial assets and liabilities based on management’s expectation.
The risk implied from the values shown in the table below, reflects a balanced view of cash inflows and outflows. Leasing obligations, trade payables and other financial liabilities mainly originate from the financing of assets used in our ongoing operations such as property, plant, equipment and investments of working capital e.g. inventories and trade receivables. To monitor existing financial assets and liabilities as well as to enable effective controlling of future risks, management monitors its Consolidated Entity’s expected settlement of financial assets and liabilities on an ongoing basis.

| 52
(f) Liquidity Risk (CONTINUED)
2017 <6 months 6-12 months 1-5 years >5 years Total
Financial assets Cash and equivalents 51,087,338 - - - 51,087,338 Trade and other receivables 45,046,603 - - - 45,046,603 Other financial assets 11,066,473 - - - 11,066,473
107,200,414 - - - 107,200,414
Financial liabilities Trade and other payables (29,306,601) - - - (29,306,601) Interest bearing loans (1,651,478) (1,660,898) (5,516,557) - (8,828,933)
(30,958,079) (1,660,898) (5,516,557) - (38,135,534) Net inflow/(outflow) 76,242,335 (1,660,898) (5,516,557) - 69,064,880
2016 <6 months 6-12 months 1-5 years >5 years Total
Financial assets Cash and equivalents 40,344,106 - - - 40,344,106 Trade and other receivables 15,799,458 - - - 15,799,458 Other financial assets 6,147,331 - - - 6,147,331
62,290,895 - - - 62,290,895
Financial liabilities Trade and other payables (68,289,529) - - - (68,289,529) Interest bearing loans (2,490,282) (2,910,280) (10,634,483) - (16,035,045)
(70,779,811) (2,910,280) (10,634,483) - (84,324,574) Net inflow/(outflow) (8,488,916) (2,910,280) (10,634,483) - (22,033,679)
(g) Fair Values
For all financial assets and liabilities recognised in the statement of financial position, carrying amount approximates fair value unless otherwise stated in the applicable notes.
The methods for estimating fair value are outlined in the relevant notes to the financial statements.
The Consolidated Entity uses various methods in estimating the fair value of a financial instrument. The methods comprise:
Level 1 – the fair value is calculated using quoted prices in active markets. Level 2 – the fair value is estimated using inputs other than quoted prices included in level 1 that are
observable for the asset or liability, either directly (as prices) or indirectly (derived from price). Level 3 – the fair value is estimated using inputs for the asset or liability that are not based on observable market
data.
The fair value of the financial instruments as well as the methods used to estimate the fair value are summarised in the table below.
2017 Quoted market price (Level 1)
Valuation technique market observable inputs
(Level 2)
Valuation technique non
market observable inputs (Level 3) Total
Financial Assets Available-for-sale financial assets
Listed investments 1 9,300,778 - - 9,300,778 Derivatives
Unlisted investments 2 - 99,000 - 99,000 Copper trade receivables 3 - 31,096,630 - 31,096,630
9,300,778 31,195,630 - 40,496,408

NOTES TO THE CONSOLIDATED FINANCIAL STATEMENTS FOR THE YEAR ENDED 30 JUNE 2017 (CONTINUED)
53 |
4. FINANCIAL RISK MANAGEMENT OBJECTIVES AND POLICIES (CONTINUED) (g) Fair Values (CONTINUED)
2016 Quoted market price
(Level 1)
Valuation technique
market observable
inputs (Level 2)
Valuation technique non
market observable inputs (Level 3) Total
Financial Assets Available-for-sale financial assets
Listed investments 1 43,238,834 - - 43,238,834 Derivatives
Unlisted investments 2 - - - - Copper trade receivables 3 - - - -
43,238,834 - - 43,238,834
1. Quoted market price represents the fair value determined based on quoted prices on active markets as at the reporting date without any deduction for transaction costs. The fair value of the listed equity investments are based on quoted market prices.
2. The unlisted investments relate to 1,500,000 unlisted options in Brainchip Holdings Limited (Brainchip) acquired for nil cost as part of a capital raising. The fair value is determined using a Black & Scholes model, which takes account of factors including the option exercise price, the volatility of the underlying share price, the risk free rate, the market price of the underlying share at grant date and the expected life of the option (refer to note 16). Below are the inputs used to value the derivative:
2017 Expected Volatility (%) 80% Risk-free interest rate (%) 1.90% Expected life of options (yrs) 2.92 Options exercise price ($) $0.23 Share price at grant date ($) $0.155
3. The fair value of trade receivables relates to copper provisionally sold at the reporting date. The fair value is based on the applicable LME prices.
Transfer between categories
There were no transfers between Level 1 and Level 2, and no transfers into and out of Level 3 fair value measurement.

| 54
5. REVENUE 2017 2016
Tin sales 84,126,857 69,394,562 Copper sales (a) 180,335,000 1,287,617 Interest received 1,853,256 1,280,606
Total revenue 266,315,113 71,962,785
(a) Total copper sales for the period was 24,828 tonnes (2016: Nil), out of which 7,868 tonnes (2016: Nil) of
copper, provisionally sold at the reporting date, has been revalued at a weighted average price of US$5,908 (2016: Nil). The net movement in trade receivables due to fair value adjustments is an increase of $9,356,648 (2016: Nil) which has been included in revenue from the sale of copper.
6. OTHER INCOME
Net loss on sale of available-for-sale investment - (16,637) Other income 3,015,539 144,500
Total other income 3,015,539 127,863
7. EXPENSES
(a) Cost of Sales
Salaries, wages expense and other employee benefits 40,750,875 8,536,624 Superannuation expense 3,871,333 810,980 Other production costs 161,375,302 44,667,319
Write-down/(reversal of write-down) in value of inventories to estimated net realisable value 1,130,360 (1,577,052)
Royalty expense 12,017,091 1,855,714
Depreciation and amortisation expense
Depreciation of non-current assets
Property, plant and equipment 12,315,552 1,475,362 Buildings 502,271 284,049 Amortisation of non-current assets
Mine, properties and development costs 25,196,861 6,443,580
Total cost of sales 257,159,645 62,496,576
(b) Other Expenses
Administration expenses
Employee benefits expense
Salaries and wages expense 1,199,865 3,018,754 Directors' fees and other benefits 262,905 330,000 Superannuation expense 153,551 318,132 Other employee benefits 200,411 66,986 Share-based payments 4,754,542 615,504 6,571,274 4,349,376 Other administration expenses
Consulting expenses 3,530,555 1,865,639 Travel and accommodation expenses 319,721 122,967 Operating lease costs 918,168 947,145 Stamp duty compliance costs 3,403,642 2,901,661 Administration costs 1,155,028 613,465 9,327,114 6,450,877 Depreciation expense
Depreciation of non-current assets
Property plant and equipment 102,011 141,457 Total Administration expenses 16,000,399 10,941,710

NOTES TO THE CONSOLIDATED FINANCIAL STATEMENTS FOR THE YEAR ENDED 30 JUNE 2017 (CONTINUED)
55 |
7. EXPENSES (CONTINUED) 2017 2016 Other expenses
Net (profit) on sale of assets (9,985) (25,487)
Loss/(gain) on derivatives 1,612,408 (2,128,642)
Other expenses 1,602,423 (2,154,129)
Total other expenses 17,602,822 8,787,581 (c) Fair Value Change in Financial Instruments
Fair value change in derivatives gain (refer to note 17(c)) (12,371,917) (364,853)
Total fair value change in financial instruments (12,371,917) (364,853)
(d) Finance Costs
Interest 423,375 114,944 Unwinding of rehabilitation provision discount 263,558 15,075
Total finance costs 686,933 130,019
8. INCOME TAX 2017 2016 (a) Major Components of Income Tax Expense:
Income Statement Current income tax expense Current income tax (benefit)/expense 6,424,248 (18,384,388)
Adjustments in respect of current income tax of previous years (5,951,964) (4,064,917)
Deferred income tax
Relating to origination and reversal of temporary differences in current year (22,821,036) 10,188,700
Derecognition of carry forward losses and other temporary differences 49,714,897 3,835,795 Adjustments in respect of current income tax of previous years 8,728,624 4,139,752 Income tax reported in the income statement 36,094,769 (4,285,058)
(b) Amounts Charged or Credited Directly to Equity
Deferred income tax related to items charged or credited directly to equity Unrealised gain on available-for-sale investments (3,945,658) 4,285,058
Income tax reported in equity (3,945,658) 4,285,058
(c) A reconciliation of income tax benefit and the product of accounting loss before income tax multiplied by the consolidated entity's applicable income tax rate is as follows:
Accounting loss before tax from continuing operations (67,657,975) (1,047,891) Profit/(loss) before tax from a discontinued operation 237,764,988 (26,861,360) Total accounting profit/(loss) before income tax 170,107,013 (27,909,251)
At statutory income tax rate of 30% (2016: 30%) 51,032,104 (8,372,775)
Non-assessable items Gain on acquisition of subsidiary (3,711,575) - Gain on disposal of subsidiary (68,551,175) - Non-deductible items Acquisition costs 1,455,967 167,762 Share-based payments 1,426,363 184,652 Sundry items 28,456 12,541 Other non-deductible items 2,055,416 - Deductible items (455,718) (187,868) Prior year tax benefits 2,776,660 74,835 Derecognition of deferred tax balances on disposal of subsidiary 323,374 - Derecognition of tax losses 49,714,897 3,835,795
Income tax expense/(benefit) reported in income the statement of comprehensive income 36,094,769 (4,285,058)

| 56
8. INCOME TAX (CONTINUED) (d) Deferred Income Tax at 30 June relates to the following: Current Period Movement
Closing Balance
30 June 2017 Income
Statement Equity Transferred Out Transferred In Opening Balance
30 June 2016
Deferred tax liabilities Exploration (1,200,793) 12,016,357 - (39,387,801) 715,251 (27,856,984) Deferred mining (21,771,175) (2,669,400) - (18,387,250) 11,234,012 (31,593,813) Mine properties & development (1,300,527) (6,843,839) - (4,185,666) - (12,330,032) Derivative held for trading - - - - - - Available-for-sale financial assets 1,039,176 (125,028) (3,945,658) - - (3,031,510) Consumables (8,976,426) 510,684 - (2,763,205) 7,714,849 (3,514,098) Prepayment - 6,414 - - (6,537) (123) Diesel rebate (100,275) (203,104) - - 41,981 (261,398) Gross deferred tax liabilities (32,310,020) (78,587,958)
Deferred tax assets Accelerated depreciation for tax purposes 13,886,165 (15,275,580) - 16,080,885 (11,414,850) 3,276,620 Available-for-sale financial assets - - - - - - Inventories 3,195,725 (3,419,386) - 1,300,623 - 1,076,962 Legal costs 131,760 (114,931) - - - 16,829 Equity raising costs - - - - - - Accrued expenses 64,530 (3,693) - - - 60,837 Provision for employee entitlements 2,515,579 2,263,463 - 1,912,307 (4,455,432) 2,235,917 Provision for fringe benefits tax (50,063) 74,832 - - (20,523) 4,246 Provision for rehabilitation 11,694,202 (309,201) - 24,580,612 (10,773,451) 25,192,161 Recognised tax losses 872,122 - - - - 46,724,386 Gross deferred tax assets 32,310,020 - - - - 78,587,958
Net deferred tax liabilities - -
Movement in deferred taxes (14,092,412) (3,945,658) (20,849,495) (6,964,701)

NOTES TO THE CONSOLIDATED FINANCIAL STATEMENTS FOR THE YEAR ENDED 30 JUNE 2017 (CONTINUED)
57 |
8. INCOME TAX (CONTINUED)
(e) Tax Consolidation and the Tax Sharing Arrangement The Company and its 100% owned subsidiaries are a tax consolidated group with effect from 1 July 2004. Metals X Limited is the head entity of the tax consolidated group. Members of the group have entered into a tax sharing agreement that provides for the allocation of income tax liabilities between the entities should the head entity default on its tax payments obligations. No amounts have been recognised in the financial statements in respect of this agreement on the basis that the possibility of default is remote.
(f) Tax Effect Accounting by Members of the Tax Consolidated Group
Members of the tax consolidated group have entered into a tax funding agreement. The tax funding agreement provides for the allocation of current taxes to members of the tax consolidated group. Deferred taxes are allocated to members of the tax consolidated group in accordance with a group allocation approach which is consistent with the principles of AASB 112 ‘Income Taxes’.
The allocation of taxes under the tax funding agreement is recognised as an increase/decrease in the controlled entities intercompany accounts with the tax consolidated group head company, Metals X Limited. The nature of the tax funding agreement is such that no tax consolidation contributions by or distributions to equity participants are required.
(g) Unrecognised Losses
At 30 June 2017, there are unrecognised losses of $200,166,034 for the Consolidated Entity which are subject to a restricted rate of utilisation (2016: $154,786,053).
9. EARNINGS PER SHARE
The following reflects the data used in the basic and diluted earnings per share computations.
2017 2016 (a) Earnings Used in Calculating Earnings per Share For basic earnings per share: (Loss)/profit attributable to continuing operations (103,752,743) 3,237,167
Profit/(loss) attributable to discontinued operations 237,764,988 (26,861,360)
Profit/(loss) attributable to ordinary equity holders of the parent 134,012,245 (23,624,193)
Basic earnings/(loss) per share (cents) 22.51 (5.21)
For diluted earnings per share: (Loss)/profit attributable to continuing operations (103,752,743) 3,237,167
Profit/(loss) attributable to discontinued operations 237,764,988 (26,861,360)
Profit/(loss) attributable to ordinary equity holders of the parent 134,012,245 (23,624,193)
Fully diluted earnings/(loss) per share (cents) 22.51 (5.21)
(b) Weighted Average Number of Shares
Weighted average number of ordinary shares for basic earnings per share 595,353,059 453,392,560
Effect of Dilution: Share Options - -
Weighted average number of ordinary shares adjusted for the effect of dilution 595,353,059 453,392,560
Basic EPS is calculated by dividing the profit for the year attributable to ordinary equity holders of the parent by the weighted average number of ordinary shares outstanding during the year. Diluted EPS is calculated by dividing the profit attributable to ordinary equity holders of the parent (after adjusting for interest on the convertible preference shares) by the weighted average number of ordinary shares outstanding during the year plus the weighted average number of ordinary shares that would be issued on conversion of all the dilutive potential ordinary shares into ordinary shares.
The Company had 7,250,000 (2016: nil) share options on issue that are excluded from the calculation of diluted earnings per share for the current financial period because they are considered non-dilutive.
There have been no other transactions involving ordinary shares or potential ordinary shares between the reporting date and the date of authorisation of these financial statements.

| 58
10. DIVIDENDS PAID AND PROPOSED 2017 2016
Dividends declared and paid during the financial year
Nil dividends for 2017 (2016: $0.0295 partially franked (26%) at 30 per cent) - 12,272,313
Dividends on Demerger of Westgold (refer to note 41) (171,204,652) - Total dividends (171,204,652) 12,272,313
Dividends proposed but not recognised as a liability Final dividend for 2017 $0.01 unfranked (2016: Nil) 6,093,409 -
The amount of franking credits available for the subsequent financial year are:
Franking account balance as at the end of the financial year at 30% (2016: 30%) 1,842 1,842
Franking credits that will arise from the payment of income tax payable as at the end of the financial year - -
Franking debits that will arise from the payment of dividends during the financial year - -
The amount of franking credits available for future reporting years 1,842 1,842
The Company operates a dividend reinvestment plan which allows eligible shareholders to elect to invest dividends in ordinary shares. All holders of Metals X ordinary shares with addresses in Australia or New Zealand are eligible to participate in the plan. The allocation price for shares is based on the average of the daily volume weighted average price of Metals X ordinary shares sold on the Australian Securities Exchange less a discount, calculated with reference to a period of not less than five consecutive trading days as determined by the directors. An issue of shares under the dividend reinvestment plan results in an increase in issued capital unless the Company elects to purchase the required number of shares on-market.
11. CASH AND CASH EQUIVALENTS 2017 2016
Cash at bank and in hand - denominated in AUD 26,790,352 38,851,351 Cash at bank and in hand - denominated in USD 23,269,818 870
Short-term deposits 65,000 332,566 Total 50,125,170 39,184,787
CASH FLOW RECONCILIATION
For the purposes of the statement of cash flows, cash and cash equivalents comprise the following at 30 June:
Cash at bank and in hand 26,790,352 38,852,221 Short-term deposits 65,000 332,566 26,855,352 39,184,787
Reconciliation of net profit after income tax to net cash flows from operating activities Profit after income tax 134,012,245 (23,624,193)
Amortisation and depreciation 75,138,830 64,093,026 Gold prepayment physical deliveries (8,930,625) (22,493,125) Gain on demerger (228,503,915) - Impairment loss on available-for-sale financial assets 416,758 - Impairment loss on mine properties and development 72,250,650 - Income tax expense 36,094,768 (4,285,058) Share based payments 4,754,542 615,504 Unwinding of rehabilitation provision discount 420,475 740,569 Fair value change in financial instruments (12,371,917) (259,853) Exploration and evaluation expenditure written off 1,243,736 26,816,554 Profit on disposal of available-for-sale financial assets - 16,637 Loss on disposal of property, plant and equipment 10,491 215,101 74,536,038 41,835,162 Changes in assets and liabilities Decrease in inventories (12,298,152) (15,651,830) (Increase)/decrease in trade and other receivables and prepayments (19,272,577) 600,215 (Decrease)/increase in trade and other creditors (16,327,636) 33,910,109 Increase in provisions 198,982 1,346,506 Net cash flows from operating activities 26,836,655 62,040,162
NOTES TO THE CONSOLIDATED FINANCIAL STATEMENTS FOR THE YEAR ENDED 30 JUNE 2017 (CONTINUED)
59 |
12. TRADE AND OTHER RECEIVABLES (CURRENT) 2017 2016 Trade receivables at fair value (a) 31,096,630 -
Trade receivables at amortised cost (b) 4,033,382 2,901,113 Other debtors (c) 9,916,591 12,898,345 Provision for doubtful debt (d) - - 45,046,603 15,799,458
(a) As at 30 June 2017 copper sales of 7,868 tonnes (2016: nil) remained open to price adjustments. (b) Trade receivables at amortised cost are non-interest bearing and are generally on 30 - 90 day terms.
(C) Other debtors primarily relate to cash calls advanced to the Bluestone Mines Tasmania Joint Venture Pty Ltd.
Other debtors are non-interest bearing and are generally on 30 - 90 day terms.
(d) Collectibility of trade and other receivables is reviewed on an ongoing basis at an operating unit level. Individual debts that are known to be uncollectible are written off when identified. An impairment allowance is recognised when there is objective evidence that the Consolidated Entity will not be able to collect the receivable. Financial difficulties of the debtor, default payments or debts more than 60 days overdue are considered objective evidence of impairment. The amount of the impairment loss is the receivable carrying amount compared to the present value of estimated future cash flows, discounted at the original effective interest rate. The carrying amounts disclosed above approximate the fair value. Refer to note 4(b) on credit risk of trade receivables to understand how the Consolidated Entity manages and measures credit quality of trade receivables that are neither past due or impaired.
13. INVENTORIES (CURRENT) Ore stocks at net realisable value 1,228,402 11,881,422
Gold in circuit at cost - 13,504,552 Gold metal at cost - - Tin in circuit at cost 85,480 42,684 Tin concentrate at cost 17,613,704 13,994,929 Copper concentrate at cost 5,441,932 3,843,256 Stores and spares at cost 29,921,421 11,713,659 Provision for obsolete stores and spares (10,652,418) (2,807,090) Total inventories at lower of cost and net realisable value 43,638,521 52,173,412
During the year there were write-downs of $1,130,360 (2016: reversal of write-downs $1,577,052) for the Consolidated Entity. This is included in cost of sales refer to note 7(a).
14. PREPAYMENTS (current) Prepayments 1,250,872 528,564
15. OTHER FINANCIAL ASSETS (CURRENT) Cash on deposit - performance bond facility (a) 10,858,049 3,305,319
Loan to Southern Gold Limited (b) - 2,104,548 Loan to Nelson Resources Limited (c) - 392,758 Total other financial assets 10,858,049 5,802,625
(a) The cash on deposit is interest bearing and is used as security for government performance bonds.
(b) The loan to Southern Gold Limited was secured, interest bearing at 8% per annum and matured upon the
demerger of Westgold.
(c) The loan to Nelson Resources Limited was converted into equity (refer to note 17(a)) (2016: was secured and interest bearing at 20% per annum and repayable on demand).

| 60
16. DERIVATIVE FINANCIAL INSTRUMENTS (non-current) 2017 2016 Derivatives held for trading 99,000 -
The Consolidated Entity holds 1,500,000 unlisted options in Brainchip Holdings Limited (Brainchip). The options were acquired for nil cost as part of a capital raising. The fair value of the options at 30 June 2017 have been valued using a Black & Scholes model, which takes account of factors including the option exercise price, the volatility of the underlying share price, the risk free rate, the market price of the underlying share at grant date and the expected life of the option.
17. AVAILABLE-FOR-SALE FINANCIAL ASSETS (NON-CURRENT) Shares - Australian listed 9,300,778 43,238,834
Available-for-sale investments consist of investments in ordinary shares.
Listed shares The fair value of listed available-for-sale investments has been determined directly by reference to published price quotations in an active market.
(a) The Company has a 21.77% (2016: 14.76%) interest in Nelson Resources Limited (Nelson) (formerly Mongolian Resource Corporation Limited), which is involved in the exploration of base metals in Australia. Nelson was delisted from the Australian Securities Exchange in June 2016. During the period the Company converted a loan of $392,758 into issued capital in Nelson. At 30 June 2017 Nelson had not recommenced trading and the Company recognised an impairment of $392,758 (2016: nil). The Company does not have significant influence over Nelson as it does not have any board representation or the ability to influence the decision making of Nelson.
(b) The Company has a 6.69% (2016: 7.10%) interest in Brainchip, which is involved in the development of artificial intelligence. Brainchip is listed on the Australian Securities Exchange. At the end of the period the fair value of the Company’s investment was $9,129,778 (2016: $7,292,444) which is based on Brainchip's quoted share price.
(c) At 30 June 2016 the Company had a 32.60% interest in Aditya Birla which is involved in the mining and exploration of base metals in Australia. Aditya Birla was listed on the Australian Securities Exchange. The fair value of the Company’s investment was $35,751,390 which was based on Aditya Birla's quoted share price. During the period the Company acquired 100% of the issued capital in Aditya Birla via an off-market takeover (refer to note 40) and recognised a gain on the remeasurement of the Company's investment in Aditya Birla prior to obtaining control of $12,386,916.
(d) The Company has a 0.85% (2016: 1.22%) interest in Auris Minerals Limited (Auris) (formerly RNI NL), which is involved in the mining and exploration of base metals in Australia. Auris is listed on the Australian Securities Exchange. At the end of the period the fair value of the Company’s investment was $171,000 (2016: $195,000) which is based on Auris' quoted share price. At the end of the period the market value of the investment was lower than the cost, the Company recognised an impairment of $24,000 (2016: $105,000).

NOTES TO THE CONSOLIDATED FINANCIAL STATEMENTS FOR THE YEAR ENDED 30 JUNE 2017 (CONTINUED)
61 |
18. PROPERTY, PLANT & EQUIPMENT (NON-CURRENT) 2017 2016 Plant and equipment
At cost 54,650,126 134,531,738 Accumulated depreciation (26,749,146) (77,803,384)
Net carrying amount 27,900,980 56,728,354
Land and buildings At cost 10,787,059 33,664,192 Accumulated depreciation (2,508,328) (17,631,026)
Net carrying amount 8,278,731 16,033,166
Capital work in progress at cost 4,287,271 6,581,682
Total property, plant and equipment 40,466,982 79,343,202
Movement in property, plant and equipment Plant and equipment At 1 July net of accumulated depreciation 56,728,354 48,413,657 Transfer from capital in progress 8,369,170 18,478,774 Disposals (281,353) (625,005) Disposal of subsidiary (refer to note 41) (40,167,538) - Acquisition of subsidiary (refer to note 40) 19,208,791 - Depreciation charge for the year (15,956,444) (9,539,072) At 30 June net of accumulated depreciation 27,900,980 56,728,354
Land and buildings At 1 July net of accumulated depreciation 16,033,166 11,412,015 Transfer from capital in progress 66,462 5,527,531 Disposals - - Disposal of subsidiary (refer to note 41) (11,632,352) - Acquisition of subsidiary (refer to note 40) 4,604,471 - Depreciation charge for the year (793,016) (906,380) At 30 June net of accumulated depreciation 8,278,731 16,033,166
Capital work in progress At 1 July net of accumulated depreciation 6,581,682 4,291,515 Additions 21,991,311 29,932,645 Disposal of subsidiary (refer to note 41) (14,158,562) - Acquisition of subsidiary (refer to note 40) 661,677 - Transfer to mine properties & development (2,353,208) (3,636,168) Transfer to plant and equipment (8,369,167) (18,478,779) Transfer to land and buildings (66,462) (5,527,531) At 30 June 4,287,271 6,581,682
The carrying value of plant and equipment held under finance leases and hire purchase contracts at 30 June 2017 is $7,877,498 (2016: $12,931,643). Value of plant and equipment leased under finance leases and acquired through hire purchase contracts during the 30 June 2016 financial year is $3,430,039 (2016: $16,554,150).
Leased assets and assets under hire purchase contracts are pledged as security for the related finance lease and hire purchase lease liabilities (refer to notes 24 and 25).

| 62
19. MINE PROPERTY AND DEVELOPMENT (non-current) 2017 2016 Development areas at cost
Mine site establishment 73,996,925 72,639,349 Impairment (73,981,925) - Net carrying amount 15,000 72,639,349 Mine properties Mine site establishment 29,642,684 48,025,820 Accumulated amortisation (25,205,215) (28,583,186) Net carrying amount 4,437,469 19,442,634 Mine capital development 145,903,058 296,765,046 Accumulated amortisation (72,985,317) (191,014,653) Net carrying amount 72,917,741 105,750,393 Total mine properties and development 77,370,210 197,832,376
Movement in mine properties and development Development areas at cost At 1 July 72,639,349 75,453,011
Additions 1,357,575 13,537,355 Disposal of subsidiary (refer to note 41) (1,731,274) - Impairment (72,250,650) - Transfer to mine site establishment - (16,351,017) At 30 June 15,000 72,639,349
Mine site establishment At 1 July net of accumulated amortisation 19,442,634 3,254,944
Additions - - Disposal of subsidiary (refer to note 41) (14,973,486) - Transfer from capital work in progress (refer to note 18) 2,353,208 2,402,864 Transfer from development areas - 16,351,017 (Decrease)/increase in rehabilitation provision 14,600 60,004 Amortisation charge for the year (2,399,487) (2,626,195) At 30 June net of accumulated amortisation 4,437,469 19,442,634
Mine capital development At 1 July net of accumulated amortisation 105,750,393 82,598,928
Additions 30,341,348 72,939,540 Disposal of subsidiary (refer to note 41) (61,290,833) - Acquisition of subsidiary (refer to note 40) 53,509,721 - Transfer from capital work in progress (refer to note 18) - 1,233,304 Adjustment to rehabilitation liability (refer to note 23) 596,996 - Amortisation charge for the year (55,989,884) (51,021,379) At 30 June net of accumulated amortisation 72,917,741 105,750,393
During the period the Company completed a recoverable amounts assessment of the CMNP. The value of the CMNP was written down to nil and an impairment loss of $72,250,650 was recognised in profit or loss (refer to note 42).
In the previous period, the Consolidated Entity re-estimated key assumptions supporting amortisation calculations, to ensure that the expense profile reflected the pattern in which the assets’ future economic benefits are expected to be consumed. This resulted in the amortisation rate of mine development assets increasing. The impact of the increase in amortisation was approximately $7,300,000 in the previous period amortisation expense. Future periods profit or loss are expected to be impacted by increased amortisation.

NOTES TO THE CONSOLIDATED FINANCIAL STATEMENTS FOR THE YEAR ENDED 30 JUNE 2017 (CONTINUED)
63 |
20. EXPLORATION EXPENDITURE (NON-CURRENT) 2017 2016
Exploration and evaluation costs carried forward in respect of mining areas of interest
Pre-production areas At Cost 4,892,164 165,083,986
Accumulated impairment - - Net carrying amount 4,892,164 165,083,986
Movement in deferred exploration and evaluation expenditure At 1 July net of accumulated impairment 165,083,986 100,042,283
Additions 14,098,029 87,103,241 Acquisition of subsidiary 3,137,060 - Disposal of subsidiary (refer to note 41) (176,183,175) - Adjustment to rehabilitation liability (refer to note 23) - 4,755,016 Expenditure written off (1,243,736) (26,816,554) At 30 June net of accumulated impairment 4,892,164 165,083,986
The ultimate recoupment of costs carried forward for exploration and evaluation phases is dependent on the successful development and commercial exploitation or sale of the respective mining areas. Amortisation of the costs carried forward for the development phase is not recognised pending the commencement of production.
During the year a review was undertaken for each area of interest to determine the appropriateness of continuing to carry forward costs in relation to that area of interest. In assessing the carrying value of all of the Consolidated Entity’s projects certain expenditure on exploration and evaluation of mineral resources has not led to the discovery of commercially viable quantities of mineral resources. As a result exploration and evaluation expenditure of $1,243,736 (2016: $26,816,554) was written off to the profit and loss. In the current period the amount predominantly relates to tenements within the nickel division which were impaired to nil (refer to note 42). In the previous period the amount relates to tenements in the gold division which were written down to nil as the expenditure did not result in the discovery of commercially viable quantities of mineral resources and as a result there is no future benefits expected.
21. TRADE AND OTHER PAYABLES (current) Trade creditors (a) 16,319,500 35,431,298
Sundry creditors and accruals (b) 12,987,101 32,858,231 29,306,601 68,289,529
(a) Trade creditors are non-interest bearing and generally on 30 day terms. (b) Sundry creditors and accruals are non-interest bearing and generally on 30 day terms.
Due to the short term nature of these payables, their carrying value approximates their fair value.
22. PROVISIONS (CURRENT) Provision for annual leave (a) 3,991,142 3,993,898
Provision for sick leave (a) 113,193 - Provision for long service leave (a) 1,618,742 860,122 Provision for fringe benefits tax payable (a) - 14,152 Provision for onerous lease (b) - 479,496 5,723,077 5,347,668
(a) The nature of the provisions are described in note 2(w) and 2(ac). (b) The nature of the provisions are described below in note 23. 23. PROVISIONS (non-current) Provision for long service leave (a) 1,795,608 2,598,999
Provision for onerous operating lease (b) - 119,874 Provision for rehabilitation (c) 38,980,674 83,973,871 40,776,282 86,692,744
(a) Provision for long service leave The nature of the provisions are described in note 2(w) and 2(ac).

| 64
23 PROVISIONS (NON-CURRENT) (CONTINUED)
(b) Provision for onerous lease
On the acquisition of Alacer in 2014, a provision was recognised for the fact that the lease rentals or payments on the operating lease were significantly higher than the market rate at acquisition. The provision has been calculated based on the difference between the market rate and the rate paid. The operating lease was transferred to Westgold at the demerger date. The operating lease had a life of four years.
(c) Provision for rehabilitation
Environmental obligations associated with the retirement or disposal of mining properties and/or of exploration activities are recognised when the disturbance occurs and are based on the extent of the damage incurred. The provision is measured as the present value of the future expenditure. The rehabilitation liability is remeasured at each reporting period in line with the change in the time value of money (recognised as an interest expense in the statement of comprehensive income and an increase in the provision), and additional disturbances/change in the rehabilitation cost are recognised as additions/changes to the corresponding asset and rehabilitation liability.
(d) Current and non-current movements in provisions
Onerous operating lease Rehabilitation Total
At 1 July 2015 1,078,865 66,821,746 67,900,611 Arising during the year - 11,719,911 11,719,911 Utilised (581,381) - (581,381) Adjustment due to revised conditions - 4,755,016 4,755,016 Rehabilitation expenditure - (63,371) (63,371) Unwind of discount 101,886 740,569 842,455 At 30 June 2016 599,370 83,973,871 84,573,241
At 1 July 2016 599,370 83,973,871 84,573,241
Arising during the year - - - Utilised (242,242) - (242,242) Acquisition of subsidiary (refer to note 40) - 35,911,504 35,911,504 Disposal of subsidiary (refer to note 41) (399,580) (81,935,372) (82,334,952) Adjustment due to revised conditions - 611,596 611,596 Rehabilitation expenditure - (1,400) (1,400) Unwind of discount 42,452 420,475 462,927 At 30 June 2017 - 38,980,674 38,980,674
24. INTEREST BEARING LOANS AND BORROWINGS (CURRENT) 2017 2016
Lease liability 3,187,557 5,201,279
Represents current portion of finance leases which have repayment terms of 36 months.
25. INTEREST BEARING LOANS AND BORROWINGS (NON-CURRENT) Lease liability 5,308,678 10,242,066
Represents non-current portion of finance leases which have repayment terms of 36 months from inception.
The carrying amount of the Consolidated Entity's non-current loans and borrowings approximate their fair value. The weighted average interest rate is 3.92% per annum.
Financing facilities available At reporting date, the following financing facilities were available: Total facilities - finance lease facility 8,496,235 15,443,345
- cash advance facility - 25,000,000 8,496,235 40,443,345
Facilities used at reporting date - finance lease facility 8,496,235 15,443,345
Cash Advance Facility
In 2016 the Consolidated Entity had an undrawn cash advance facility of $25,000,000 with Citibank N.A. which was drawn down and repaid in full during the current period.

NOTES TO THE CONSOLIDATED FINANCIAL STATEMENTS FOR THE YEAR ENDED 30 JUNE 2017 (CONTINUED)
65 |
25. INTEREST BEARING LOANS AND BORROWINGS (NON-CURRENT) (CONTINUED) Assets pledged as security: The carrying amounts of assets pledged as security for current and non-current interest bearing liabilities are: Non-current Finance lease 2017 2016 Plant and equipment 7,877,498 12,931,643
Total non-current assets pledged as security 7,877,498 12,931,643
Plant and equipment assets are pledged against lease liabilities for the term of the lease period.
26. UNEARNED INCOME (CURRENT)
Gold prepayment (refer to note 27) - 22,493,125 - 22,493,125
27. UNEARNED INCOME (NON-CURRENT)
Gold prepayment - 5,812,500 - 5,812,500
In 2014 Metals X established a gold prepayment facility with Citibank N.A (Citi). The loan is repayable in gold ounces in equal instalments of 1,250 ounces per month between October 2014 and September 2017 inclusive. During the period 6,250 ounces were delivered to Citi. The facility was transferred to Westgold upon the demerger on 1 December 2016.
The loan was classified as unearned revenue on the Statement of Financial Position as Citi prepaid Metals X for a fixed quantity of gold ounces. Metals X had a legal obligation to deliver gold ounces, and subsequently recognised revenue as and when it made the repayment in gold ounces. Metals X measured revenue based on the allocation of the nominal amounts of the advance payments corresponding to the goods delivered.
28. ISSUED CAPITAL (a) Ordinary Shares
Issued and fully paid
252,511,413
407,029,190
Number $
(b) Movements in ordinary shares on issue At 1 July 2015 416,010,939 332,851,798
Issue share capital 61,504,262 71,817,861 Issue share capital under dividend reinvestment plan 2,170,099 2,476,499 Share issue costs - (116,968) At 30 June 2016 479,685,300 407,029,190
Capital reduction via demerger (refer to note 41) - (341,913,378) Issue share capital 129,655,603 192,652,428 Share issue costs - (5,256,827) At 30 June 2017 609,340,903 252,511,413
Dividend Reinvestment Plan The Company operates a dividend reinvestment plan (DRP) which allows eligible shareholders to elect to invest dividends in ordinary shares.
2016 The Company paid a partially (26%) franked dividend of 2.95 cents per share with a record date of 2 September 2015 and paid on 25 September 2015. The Company offered a DRP at a 5% discount to the 5 day VWAP. Under the offer 2,170,099 shares were issued at $1.14095 per share on 25 January 2015. 2017 There were no shares issued under the DRP in 2017.

| 66
28. ISSUED CAPITAL (CONTINUED)
(c) Terms and Conditions of Contributed Equity
Holders of ordinary shares are entitled to receive dividends as declared from time to time and are entitled to one vote per share at shareholder meetings. In the event of winding up the Company the holders are entitled to participate in the proceeds from the sale of all surplus assets in proportion to the number of and amounts paid up on shares held. Effective 1 July 1998, the Corporations legislation in place abolished the concepts of authorised capital and par share values. Accordingly, the Parent does not have authorised capital nor par value in respect of its issued shares.
(d) Escrow Restrictions
There are no current escrow restrictions on the issued capital of the Company.
(e) Options on Issue
There were 7,250,000 shares of the Company under option as the date of this report (2016: Nil).
(f) Option Conversions
There were no option conversions during the financial year (2016: Nil).
(g) Performance Rights Conversions
There were 3,388,155 performance rights that were converted to shares during the financial year (2016: Nil).
29. ACCUMULATED LOSSES 2017 2016
At 1 July (45,666,070) (9,769,564) Net profit in current period attributable to members of the parent entity 134,012,245 (23,624,193) Dividends paid - (12,272,313) Dividends on Demerger of Westgold (refer to note 41) (171,204,652) - At 30 June (82,858,477) (45,666,070)
30. RESERVES
Share based payments reserve
Fair value reserve Total
$ $ $
At 30 June 2015 19,961,005 3,223,335 23,184,340 Share based payments 615,504 - 615,504 Fair value change in available-for-sale financial assets - 9,745,369 9,745,369 At 30 June 2016 20,576,509 12,968,704 33,545,213 Share based payments 4,754,542 - 4,754,542 Fair value change in available-for-sale financial assets - (9,206,537) (9,206,537) At 30 June 2017 25,331,051 3,762,167 29,093,218
Nature and purpose of reserves Fair value reserve This reserve records the movements in the fair value of available-for-sale investments.
Share based payments reserve
This reserve is used to recognise the fair value of rights and options issued to employees in relation to equity-settled share based payments.
31. SHARE-BASED PAYMENTS 2017 2016
(a) Recognised share-based payment expense
The expense recognised for services received during the year is shown in the table below:
Expense arising from equity-settled share-based payments 4,754,542 615,504
The share-based payment plan is described below. There have been no cancellations or modifications to the plan during 2017 and 2016.

NOTES TO THE CONSOLIDATED FINANCIAL STATEMENTS FOR THE YEAR ENDED 30 JUNE 2017 (CONTINUED)
67 |
31. SHARE-BASED PAYMENTS (CONTINUED) (b) Long Term Incentive Plan
Under the Long Term Incentive Plan (LTIP), grants are made to senior executives and other staff members who have made an impact on the Consolidated Entity’s performance. LTIP grants are delivered in the form of share options or performance rights which vest over a period of three years subject to meeting performance measures, with no opportunity to retest.
(i) Performance Rights
Performance rights are issued for nil consideration. Performance rights vest over a period of three years subject to meeting performance measures. The Company uses absolute total shareholder return and relative shareholder return as the performance measures for the performance rights. Any performance rights that do not vest on the third anniversary of their grant date will lapse. Upon vesting, these performance rights will be settled in ordinary fully paid shares of the Company.
Pursuant to the demerger of Westgold the Board determined that the 3,388,155 performance rights on issue would vest and be exercisable prior to the Demerger. The performance rights vested and were converted into shares in the Company on 25 November 2016.
The Metals X share price on the date of vesting was $1.51 per share. The cost of accelerating the vesting of the Performance Rights of $3,744,376 was recognised in the consolidated statement of comprehensive income.
Summary of performance rights granted under the Long Term Incentive Plan The following table illustrates the number and movements in, performance rights issued under the LTIP.
2017 Number 2016 Number Outstanding at the beginning of the year 3,388,155 1,637,020 Granted during the year - 1,751,135 Vested during the year (3,388,155) - Lapsed/cancelled during the year - - Outstanding at the year end - 3,388,155
Exercise price of performance rights
Performance rights on issue as part of LTIP have a nil exercise price.
Performance conditions
The performance rights have the following performance hurdles which will be measured over the vesting period of three years from grant date:
• The Absolute Total Shareholder Return (TSR) performance rights (50% of total performance rights) will vest subject to the compound annual growth rate of the Company’s TSR being not less than 15% over the three year service period.
• The Relative TSR performance rights (50% of total performance rights) are measured against a defined peer group of companies which the Board considers compete with the Company for the same investment capital, both in Australia and overseas, and which by the nature of their business are influenced by commodity prices and other external factors similar to those that impact on the TSR performance of the Company.
Weighted average fair value of performance rights
The weighted average fair value of performance rights granted during the year was nil (2016: $0.673).
Performance rights valuation
The fair value of the performance rights granted are estimated using a Hoadley employee share option pricing model (Monte Carlo Simulation), taking into account the terms and conditions upon which the performance rights were granted.

| 68
31. SHARE-BASED PAYMENTS (CONTINUED)
Performance rights Absolute TSR Performance
Rights
Relative TSR Performance
Rights
Absolute TSR Performance
Rights
Relative TSR Performance
Rights Details 2017 2016
Grant date - - 23 Nov 2015 23 Nov 2015 Share price at grant date ($) - - $1.260 $1.260 Performance right exercise price ($) - - Nil Nil Share price barrier ($) - - $2.170 -
Vesting conditions - - 1.153 times 20
day VWAP - Measurement date - - 1 Jul 2017 1 Jul 2017 Expected life of performance rights (yrs) - - 3 years 3 years Expected volatility (%) - - 60% 60% Risk-free interest rate (%) - - 2.17% 2.17% Stock dividend yield per annum (%) - - 2.34% 2.34% Fair value at grant date ($) - - $0.554 $0.79
(ii) Share options Share options are issued for nil consideration. The exercise price of the share options is equal to 125% of the weighted average closing sale price of the Company’s fully paid ordinary shares on ASX over the 20 trading days immediately preceding the day on which the options are awarded. Any options that are not exercised by the third anniversary of their grant date will lapse. Upon exercise, these options will be settled in ordinary fully paid shares of the Company. The options will vest when the senior executive or other staff member continues to be employed by the Consolidated Entity on the first anniversary of the grant date or as determined by the Board of Directors.
Summary of options granted under the Long Term Incentive Plan
The following table illustrates the number and weighted average exercise price (WAEP) of, and movements in, share options issued under the LTIP.
2017 Number 2017 WAEP 2016 Number 2016 WAEP Outstanding at the beginning of the year - - - - Granted during the year 7,250,000 0.76 - - Exercised during the year - - - - Lapsed/cancelled during the year - - - - Outstanding at the year end 7,250,000 0.76 - -
Exercisable at the year end 7,250,000 0.76 - -
The outstanding balance as at 30 June 2017 is represented by the following table:
Grant Date Vesting
date Expiry date
Exercise Price
Options granted
Options lapsed /
cancelled Options
exercised Number of options
at end of period
On issue Vested 24 Nov 16 20 Jan 18 20 Jan 20 $0.76 2,000,000 - - 2,000,000 - 20 Jan 17 20 Jan 18 20 Jan 20 $0.76 5,250,000 - - 5,250,000 -
Total 7,250,000 7,250,000 -

NOTES TO THE CONSOLIDATED FINANCIAL STATEMENTS FOR THE YEAR ENDED 30 JUNE 2017 (CONTINUED)
69 |
31. SHARE-BASED PAYMENTS (CONTINUED)
Weighted average remaining contractual life of share options
The weighted average remaining contractual life for the share options outstanding as at 30 June 2017 is 2.56 (2016: nil).
Range of exercise price of share options
The exercise price for options outstanding at the end of the year is $0.76 (2016: nil).
Weighted average fair value of share options
The weighted average fair value of options granted during the year was $0.19 (2016: nil).
Share option valuation
The fair value of the equity-settled share options granted under the LTIP is estimated at the date of grant using a Black & Scholes model, which takes into account factors including the options exercise price, the volatility of the underlying share price, the risk-free interest rate, the market price of the underlying share at grant date, historical and expected dividends and the expected life of the option.
The following table gives the assumptions made in determining the fair value of the options granted:
Grant date 24 Nov 16 20 Jan 17 Expected volatility (%) 60% 60% Risk-free interest rate (%) 2.00% 2.00% Expected life of options (yrs) 2.5 2.5 Options exercise price ($) $0.76 $0.76 Share price at grant date ($) $0.61 $0.61 Fair value at grant date ($) $0.19 $0.19
The effects of early exercise have been incorporated into the calculations by using an expected life for the option that is shorter than the contractual life based on historical exercise behaviour, which is not necessarily indicative of exercise patterns that may occur in the future. The expected volatility was determined using a historical sample of the Company’s share price over a 12 month period. The resulting expected volatility therefore reflects the assumptions that the historical volatility is indicative of future trends, which may also not necessarily be the actual outcome.
32. CONTINGENT ASSETS AND LIABILITIES Bank guarantees
The Consolidated Entity has a number of bank guarantees in favour of various government authorities and service providers. The bank guarantees primarily relate to environmental and rehabilitation bonds at the various projects. The total amount of these guarantees at the reporting date is $10,858,049 (2016: $3,305,319). These bank guarantees are fully secured by performance bonds (refer to note 15).
The Renison Tin Operation mining tenement has expired and is in the process of being renewed. As a part of the renewal process an updated mine closure plan is required to be prepared, which may result in a potential increase in the rehabilitation liability at the Renison Tin Operation. The Company is currently in discussions with the Tasmanian Government authorities regarding the mine closure plan and potential increase in rehabilitation liability.

| 70
33. COMMITMENTS (a) Capital commitments Commitments relating to joint arrangements
At 30 June 2017 the Consolidated Entity has capital commitments that relate principally to the purchase and maintenance of plant and equipment for its mining operations.
Capital expenditure commitments
Estimated capital expenditure contracted for at reporting date, but not recognised as liabilities for the Consolidated Entity:
2017 2016
- Within one year 1,537,473 2,688,982
(b) Operating lease commitments - Company as lessee
The Company has entered into commercial property leases on office rental and remote area residential accommodation. The Company has entered into commercial leases on office equipment. These operating leases have an average life of between one month and four years with renewal options included in the contracts. The Company also has commercial leases over the tenements in which the mining operations are located. These tenement leases have a life of up to twenty one years. In order to maintain current rights to explore and mine the tenements the Consolidated Entity is required to perform minimum exploration work to meet the expenditure requirements specified by the relevant state governing body. There are no restrictions placed on the lessee by entering into these contracts. The operating lease commitments include Joint Operation commitments as disclosed in note 35.
Future minimum rentals payable under non-cancellable operating leases as at 30 June are as follows:
(i) Property leases as lessee: - Within one year 203,612 1,518,782
- After one year but not more than five years 453,608 383,592 657,220 1,902,374
(ii) Equipment leases: - Within one year 37,053 46,680
- After one year but not more than five years 51,022 23,789 88,075 70,469
(iii) Mineral tenement leases: - Within one year 405,652 5,763,238
- After one year but not more than five years 671,957 21,405,977 - After more than five years 1,119,505 62,054,198 2,197,114 89,223,413

NOTES TO THE CONSOLIDATED FINANCIAL STATEMENTS FOR THE YEAR ENDED 30 JUNE 2017 (CONTINUED)
71 |
33. COMMITMENTS (CONTINUED)
(c) Operating Lease Commitments - Company as Lessor The Company has entered into a commercial sub-lease on the above mentioned office space.
Future minimum rentals receivable under non-cancellable operating leases as at 30 June are as follows: (i) Property Leases as Lessor: 2017 2016
- Within one year - 5,838 - After one year but not more than five years - - - 5,838
(d) Finance Lease and Hire Purchase Commitments
The Company has finance leases and hire purchase contracts for various items of plant and machinery. The leases do have terms of renewal but no escalation clauses. Renewals are at the option of the specific entity that holds the lease. The finance and hire purchase contracts have an average term of 36 months with the right to purchase the asset at the completion of the lease term for a pre-agreed amount.
Future minimum lease payments under finance leases and hire purchase contracts together with the present value of the minimum lease payments are as follows:
2017
Minimum lease
payments
Present value of lease
payments
Within one year 3,495,056 3,187,557 After one year but not more than five years 5,550,511 5,308,678 Total minimum lease payments 9,045,567 8,496,235 Less amounts representing finance charges (549,332) - Present value of minimum lease payments 8,496,235 8,496,235
2016
Minimum lease
payments
Present value of lease
payments Within one year 5,757,588 5,201,279
After one year but not more than five years 10,716,217 10,242,066 Total minimum lease payments 16,473,805 15,443,345 Less amounts representing finance charges (1,030,460) - Present value of minimum lease payments 15,443,345 15,443,345
2017 2016 Included in the financial statements as:
Current interest-bearing loans and borrowings (note 24) 3,187,557 5,201,279
Non-current interest-bearing loans and borrowings (note 25) 5,308,678 10,242,066 Total included in interest-bearing loans and borrowings 8,496,235 15,443,345
The weighted average interest rate of leases for the Company is 3.92% (2016: 3.83%). (e) Other Commitments
The Consolidated Entity has obligations for various expenditures such as state government royalties, production based payments and exploration expenditure. Such expenditures are predominantly related to the earning of revenue in the ordinary course of business.

| 72
34. AUDITOR'S REMUNERATION 2017 2016
Amounts received or due and receivable by Ernst & Young (Australia) for:
An audit or review of financial reports of the entity and any other entity within the Consolidated Entity 335,097 398,055
Other services in relation to the entity and any other entity in the Consolidated Entity:
- tax compliance 300,918 125,890 - stamp duty compliance 26,300 17,100 - investigating accountant's report Westgold demerger 100,940 - Total auditor remuneration 763,255 541,045
35. INTERESTS IN JOINT OPERATIONS
The Consolidated Entity's interest in the assets and liabilities of joint operations are included in the consolidated statement of financial position.
RENISON TIN PROJECT
Subsidiary Bluestone Mines Tasmania Pty Ltd has a 50% interest and participating share in the Renison Tin Project which is operated and managed by its joint operator Bluestone Mines Tasmania Joint Venture Pty Ltd. The Consolidated Entity is entitled to 50% of the production. The Renison Tin Project is located in Tasmania.
Commitments relating to the joint operation: 2016 2015
Share of capital commitments (refer to note 33(a)) 666,774 1,081,377
Share of operating lease commitments (refer to note 33(b)) Future minimum rentals payable under non-cancellable operating leases as at 30 June are as follows: (i) Property leases as lessee: - Within one year 932 932
932 932
(ii) Equipment leases: - Within one year 3,477 13,085
- After one year but not more than five years 2,202 1,275 5,679 14,360
(iii) Mineral tenement leases: - Within one year 57,417 56,658
- After one year but not more than five years - - - After more than five years - - 57,417 56,658
Impairment
During the year reversal of write-downs of inventory of $3,358 (2016: $1,591,216) were recognised in the joint operation.
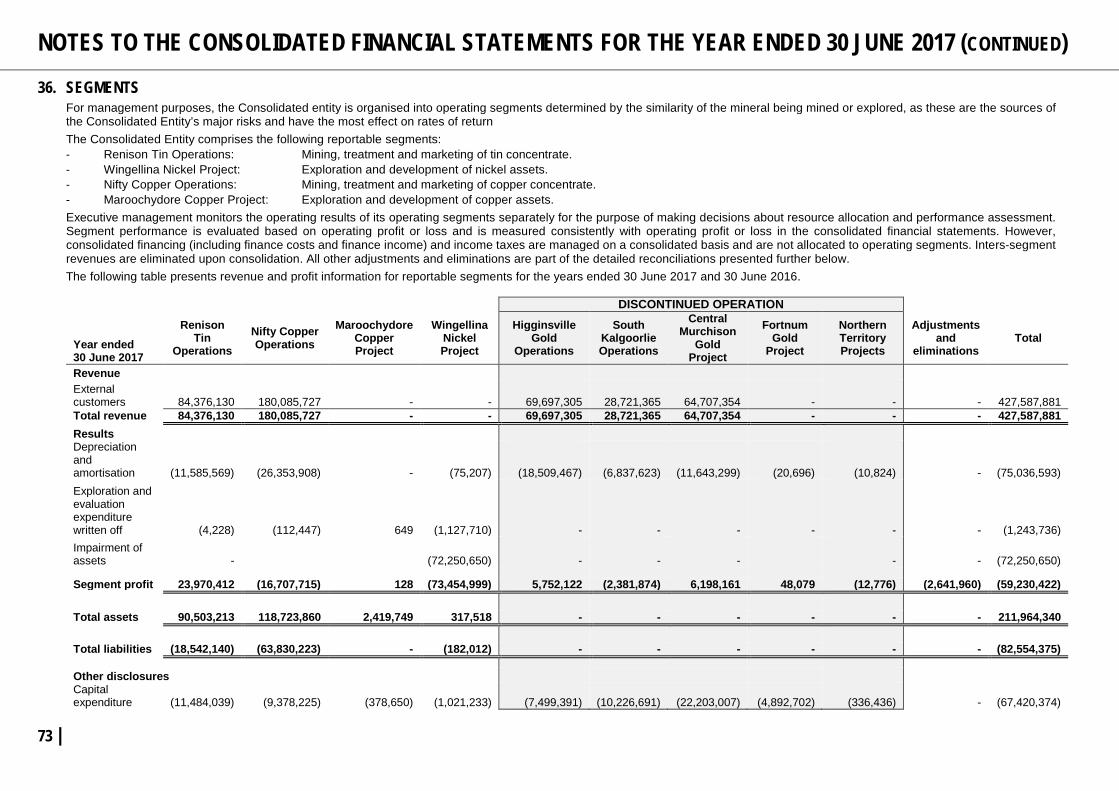
NOTES TO THE CONSOLIDATED FINANCIAL STATEMENTS FOR THE YEAR ENDED 30 JUNE 2017 (CONTINUED)
73 |
36. SEGMENTS For management purposes, the Consolidated entity is organised into operating segments determined by the similarity of the mineral being mined or explored, as these are the sources of the Consolidated Entity’s major risks and have the most effect on rates of return The Consolidated Entity comprises the following reportable segments: - Renison Tin Operations: Mining, treatment and marketing of tin concentrate. - Wingellina Nickel Project: Exploration and development of nickel assets. - Nifty Copper Operations: Mining, treatment and marketing of copper concentrate. - Maroochydore Copper Project: Exploration and development of copper assets. Executive management monitors the operating results of its operating segments separately for the purpose of making decisions about resource allocation and performance assessment. Segment performance is evaluated based on operating profit or loss and is measured consistently with operating profit or loss in the consolidated financial statements. However, consolidated financing (including finance costs and finance income) and income taxes are managed on a consolidated basis and are not allocated to operating segments. Inters-segment revenues are eliminated upon consolidation. All other adjustments and eliminations are part of the detailed reconciliations presented further below. The following table presents revenue and profit information for reportable segments for the years ended 30 June 2017 and 30 June 2016.
DISCONTINUED OPERATION
Year ended 30 June 2017
Renison Tin
Operations Nifty Copper Operations
Maroochydore Copper Project
Wingellina Nickel Project
Higginsville Gold
Operations
South Kalgoorlie Operations
Central Murchison
Gold Project
Fortnum Gold
Project
Northern Territory Projects
Adjustments and
eliminations Total
Revenue External customers 84,376,130 180,085,727 - - 69,697,305 28,721,365 64,707,354 - - - 427,587,881 Total revenue 84,376,130 180,085,727 - - 69,697,305 28,721,365 64,707,354 - - - 427,587,881 Results Depreciation and amortisation (11,585,569) (26,353,908) - (75,207) (18,509,467) (6,837,623) (11,643,299) (20,696) (10,824) - (75,036,593) Exploration and evaluation expenditure written off (4,228) (112,447) 649 (1,127,710) - - - - - - (1,243,736) Impairment of assets - (72,250,650) - - - - - (72,250,650)
Segment profit 23,970,412 (16,707,715) 128 (73,454,999) 5,752,122 (2,381,874) 6,198,161 48,079 (12,776) (2,641,960) (59,230,422)
Total assets 90,503,213 118,723,860 2,419,749 317,518 - - - - - - 211,964,340
Total liabilities (18,542,140) (63,830,223) - (182,012) - - - - - - (82,554,375)
Other disclosures Capital expenditure (11,484,039) (9,378,225) (378,650) (1,021,233) (7,499,391) (10,226,691) (22,203,007) (4,892,702) (336,436) - (67,420,374)

| 74
36. SEGMENTS (CONTINUED)
DISCONTINUED OPERATION
Year ended 30 June 2016
Renison Tin
Operations Nifty Copper Operations
Maroochydore Copper Project
Wingellina Nickel Project
Higginsville Gold
Operations
South Kalgoorlie Operations
Central Murchison
Gold Project
Fortnum Gold
Project
Northern Territory Projects
Adjustments and
eliminations Total
Revenue External customers 70,682,179 - - - 151,350,329 72,484,117 56,482,885 - - - 350,999,510 Total revenue 70,682,179 - - - 151,350,329 72,484,117 56,482,885 - - - 350,999,510 Results Depreciation and amortisation (8,129,119) - - (73,872) (34,029,491) (13,896,094) (7,700,893) (21,758) (34,497) - (63,885,724) Exploration and evaluation expenditure written off (4,468) - - (1,979,741) (1,798,344) (3,807,396) (10,060,284) (439,383) (8,726,938) - (26,816,554) Impairment of assets - - - - - - - - - -
Segment profit 8,255,007 - - (2,053,620) (9,847,207) 214,611 (7,400,382) (1,059,608) (8,769,650) 1,999,499 (18,661,350)
Total assets 82,733,985 - - 72,682,323 75,473,457 48,966,587 176,474,827 36,584,238 17,424,394 - 510,339,811
Total liabilities (16,259,471) - - (174,209) (45,883,925) (39,060,748) (58,685,165) (11,873,268) (1,428) - (171,938,214)
Other disclosures Capital expenditure (17,861,736) - - (1,781,439) (45,622,735) (29,169,224) (75,104,400) (36,874,869) (1,538,964) - (207,953,367)
Adjustments and eliminations
Finance income and costs, fair value gains and losses on financial assets are not allocated to individual segments as the underlying instruments are managed on a Consolidated Entity basis.
Current taxes, deferred taxes, cash and certain financial assets and liabilities are not allocated to those segments as they are also managed on a Consolidated Entity basis.
Capital expenditure consists of additions of property, plant and equipment, mine properties and development and exploration and evaluation expenditure including assets from the acquisition of subsidiaries.
Corporate charges comprise non-segmental expenses such as head office expenses and interest. Corporate charges are not allocated to operating segments.

NOTES TO THE CONSOLIDATED FINANCIAL STATEMENTS FOR THE YEAR ENDED 30 JUNE 2017 (CONTINUED)
75 |
36. SEGMENTS (CONTINUED) (a) Reconciliation of Profit/(Loss) 2017 2016 Segment profit (59,230,422) (18,661,350) Corporate administration expenses (16,000,399) (10,941,710) Corporate interest income 1,853,256 1,280,606 Corporate other income 3,015,539 144,500 Fair value change in financial instruments 11,955,159 259,853 Net gains on disposal of available-for-sale investments - (16,637) Net loss on disposal of assets 9,985 25,487 Profit/(loss) from discontinued operations (9,261,093) 26,861,360
Total consolidated profit before income tax from continuing operations (67,657,975) (1,047,891)
(b) Reconciliation of Assets Segment operating assets 211,964,340 510,339,811 Unallocated corporate assets Cash and cash equivalents 60,725,031 41,985,917 Trade and other receivables 306,839 2,736,458 Prepayments 102,093 112,779 Other financial assets 99,000 - Available-for-sale financial assets 9,300,778 43,238,833 Property, plant and equipment 550,267 573,446 Total consolidated assets 283,048,348 598,987,244
(c) Reconciliation of Liabilities Segment operating liabilities 82,554,375 171,938,214 Unallocated corporate liabilities Trade and other payables 614,990 23,893,871 Provision for employee benefits 1,118,618 1,810,935 Interest bearing loans and borrowings 14,212 6,435,891 Total consolidated liabilities 84,302,195 204,078,911
(d) Segment Revenue from External Customers Segment revenue 427,587,881 350,999,510 Total revenue 427,587,881 350,999,510
Revenue from external customers by geographical locations is detailed below. Revenue is attributable to geographical location based on the location of the customers. The Company does not have external revenues from external customers that are attributable to any foreign country other than as shown.
Australia 163,126,024 280,317,331 South East Asia 264,461,857 70,682,179 Total revenue 427,587,881 350,999,510
The Consolidated Entity has five customers to which it provides tin, copper and gold. The Consolidated Entity sends its tin and copper concentrates to three South East Asian customers that accounts for 38% of total external revenue (2016: 20%). The Renison Tin Operations, Customer 1 and Customer 2 provided 6% and 14% respectively of total external revenue (2016: 6% and 14%). The Nifty Copper Operations, Customer 1 provided 42% of total external revenue (2016: nil). The Consolidated Entity sold its gold to two Australian customers that accounts for 62% of total external revenue (2016: 80%). The Gold Operations, Customer 1 and Customer 2 provided 21% and 17% respectively of total external revenue (2016: 54% and 26%).
(e) Segment Non-Current Assets, Excluding Financial Assets, are all Located in Australia.

| 76
37. KEY MANAGEMENT PERSONNEL (a) Details of Key Management Personnel Appointed Resigned (i) Non-Executive Directors (NEDs) PJ Newton Non-Executive Chairman 14 Dec 2012 - PM Cmrlec Non-Executive Director 23 Jul 2013 5 Oct 2016 SD Heggen Non-Executive Director 25 Oct 2012 - M Jerkovic Non-Executive Director 1 May 2017 - X Penggen Non-Executive Director 9 Feb 2012 9 Jan 2017 Y Zhang Non-Executive Director 9 Jan 2017 - (ii) Executive Directors WS Hallam Managing Director 1 Mar 2005 - PG Cook Executive Director 23 Jul 2004 2 Feb 2017 SD Robinson Executive Director 25 Nov 2016 - (iii) Other Executives (KMPs) AH King Chief Operating Officer 24 Feb 2014 - JG Brock Chief Operating Officer - CMGP 21 Mar 2016 1 Dec 2016 PD Hucker Chief Operating Officer - SKO & HGO 17 Oct 2012 1 Dec 2016 MR Poepjes General Manager - NCP 8 Aug 2011 - M Recklies General Manager - Renison 24 Mar 2017 - JW Russell Chief Geologist 17 Oct 2012 1 Dec 2016 FJ Van Maanen CFO & Company Secretary 1 Jul 2005 - (b) Compensation of Key Management Personnel 2017 2016 Short-term employee benefits 2,514,540 2,770,701 Post employment benefits 188,580 207,133 Other long-term benefits 206,900 90,741 Share-based payment 3,075,201 391,136 5,985,221 3,459,711
The amounts disclosed in the table are the amounts recognised as an expense during the period related to key management personnel.
(c) Loans to Key Management Personnel There were no loans to key management personnel during the current or previous financial year.
(d) Interest held by Key Management Personnel under the Long Term Incentive Plan Performance rights held by key management personnel under the LTIP: Grant date Test Date Exercise price $ 2017 2016 26 Nov 2014 1 Jul 2017 Nil - 1,230,770 23 Nov 2015 1 Jul 2018 Nil - 1,001,158 Total - 2,231,928
Share options held by key management personnel under the LTIP to purchase ordinary shares: Grant date Expiry date Exercise price $ 2017 2016 20 Jan 2017 20 Jan 2020 0.76 5,000,000 - Total 5,000,000 -

NOTES TO THE CONSOLIDATED FINANCIAL STATEMENTS FOR THE YEAR ENDED 30 JUNE 2017 (CONTINUED)
77 |
38. RELATED PARTY DISCLOSURES (a) Subsidiaries
The consolidated financial statements of the Consolidated Entity include Metals X Limited and the subsidiaries listed in the following table:
Country of Ownership interest
Name incorporation 2017 2016 Bluestone Australia Pty Ltd Australia 100% 100%
Metals Exploration Pty Ltd Australia 100% 100% Cupric Pty Ltd * Australia 100% 0% Westgold Resources Limited ** Australia 0% 100%
Subsidiary companies of Bluestone Australia Pty Ltd Bluestone Mines Tasmania Pty Ltd Australia 100% 100%
Subsidiary companies of Metals Exploration Pty Ltd Austral Nickel Pty Ltd Australia 100% 100%
Hinckley Range Pty Ltd Australia 100% 100% Metex Nickel Pty Ltd Australia 100% 100%
Subsidiary companies of Cupric Pty Ltd Nifty Copper Pty Ltd * Australia 100% 0%
Maroochydore Copper Pty Ltd * Australia 100% 0%
Subsidiary companies of Westgold Resources Limited Castile Resources Pty Ltd ** Australia 0% 100%
Aragon Resources Pty Ltd ** Australia 0% 100% Big Bell Gold Operations Pty Ltd ** Australia 0% 100% Hill 51 Pty Ltd ** Australia 0% 100% Avoca Resources Pty Ltd ** Australia 0% 100% Avoca Mining Pty Ltd ** Australia 0% 100% HBJ Minerals Pty Ltd ** Australia 0% 100% Dioro Exploration NL ** Australia 0% 100% Hampton Gold Mining Areas Limited ** United Kingdom 0% 100%
* Entities acquired in the Aditya Birla Minerals Limited takeover (refer to note 40). ** Entities disposed in the Westgold Resources Limited demerger (refer to note 41).
(b) Ultimate parent Metals X Limited is the ultimate parent entity. (c) Key management personnel Details relating to key management personnel, including remuneration paid, are included in note 37.
(d) Transactions with related parties 2017 2016
(i) Jointly controlled operations
Amounts charged by Bluestone Australia Pty Ltd to the joint operation of Bluestone Mines Tasmania Joint Venture Pty Ltd for services provided * 339,513 139,880
(ii) Related parties
Amounts charged by Bluestone Australia Pty Ltd to Pantoro for services provided ** 95,287 289,927
* Subsidiary Bluestone Mines Tasmania Pty Ltd has a 50% interest in the Renison Tin Project accounted for as
a joint operation. ** PG Cook and PM Cmrlec were directors of Pantoro during the financial period.

| 78
39. INFORMATION RELATING TO METALS X LIMITED (THE PARENT ENTITY)
2017 2016
Current assets 59,657,737 40,304,185 Total assets 158,126,546 273,922,057 Current Liabilities 438,525 656,206 Total Liabilities 438,525 656,206 Issued capital 261,791,412 416,309,191 Accumulated losses (133,196,610) (176,588,553) Option premium reserve 25,331,051 20,576,509 Other reserves 3,762,167 12,968,704
Total Equity 157,688,020 273,265,851
Profit of the parent entity 214,596,595 2,308,844
Total comprehensive profit of the parent entity 205,390,059 12,054,213 Guarantees entered into by the parent entity in relation to the debts of its subsidiaries.
Pursuant to ASIC Instrument 2016/785, Metals X and its wholly owned subsidiaries (refer to note 38(a) entered into a deed of cross guarantee on 11 November 2013. The effect of the deed is that Metals X has guaranteed to pay any deficiency in the event of winding up of any controlled entity or if they do not meet their obligations under the terms of any debt subject to the guarantee. The controlled entities have given a similar guarantee in the event that Metals X is wound up or if it does not meet its obligations under the terms of any debt subject to the guarantee.
The statement of financial position and statement of comprehensive income for the closed group is not different to the Consolidated Entity's statement of financial position and statement of comprehensive income.
Contingent liabilities of the parent entity. Nil
Contractual commitments by the parent entity for the acquisition of property, plant or equipment.
Nil

NOTES TO THE CONSOLIDATED FINANCIAL STATEMENTS FOR THE YEAR ENDED 30 JUNE 2017 (CONTINUED)
79 |
40. BUSINESS COMBINATION Acquisition of Aditya Birla Minerals Limited
On 15 October 2015 the Company announced an off-market takeover offer to acquire 100% of the ordinary shares in Aditya Birla Minerals Limited (Aditya Birla), a publicly listed Australian company which owns copper projects in Western Australia. The original offer of 1 Metals X shares for every 5 Aditya Birla share was increased on 7 December 2015 to 1 Metals X shares for every 4.75 Aditya Birla share. At 30 June 2016 the Company held 32.6% of Aditya Birla that was valued at $35,751,390. Metals X acquired Aditya Birla to significantly enlarge the base metals division of the Company.
On 18 July 2016 the unconditional offer was increased to 1 Metals X share for every 4.5 Aditya Birla share, plus $0.08 in cash for every Aditya Birla share. On 20 July 2016 the Company gained control of Aditya Birla. On 22 July 2016 the Company obtained over 90% acceptances under the offer and proceeded to compulsory acquire the remaining interests in Aditya Birla. The Company completed the 100% acquisition on 28 August 2016. There were additional costs of $8,171,746 and 1,194,757 Metals X shares with a fair value of $1,911,611 paid to the Aditya Birla shareholders who accepted the offer prior to the increase in consideration on 22 July 2016 that has been expensed in the profit and loss along with a gain of $22,455,274 relating to the 32.6% previously held interest in Aditya Birla. The acquisition has been accounted for using the acquisition method.
Assets acquired and liabilities assumed
In accordance with the Accounting Standard AASB 3 ‘Business Combinations’, the Company is able to provisionally determine the initial accounting for the acquisition. At the date of this report, the fair value of assets and liabilities have been provisionally determined based on the directors’ best estimate of their likely fair value. These amounts may be amended when further information to support these values such as the final tax position is obtained. The provisional fair values of the identifiable assets and liabilities as at the date of acquisition are:
Assets
Provisional fair value recognised
on acquisition Cash and cash equivalents 64,147,982
Trade and other receivables 12,481,931 Other assets 1,444,469 Other financial assets 7,620,000 Inventories 28,338,961 Property, plant and equipment 24,474,940 Mine properties and development costs 53,509,723 Exploration and evaluation expenditure 3,137,063 195,155,069 Liabilities
Trade and other payables 17,576,870 Provisions 41,655,605 59,232,475 Total identifiable net assets as fair value 135,922,594
Fair value of previously held investment in Aditya Birla at date of control of 32.6% * 43,923,135 Fair value of Metals X shares (46,938,925 ordinary shares) ** 75,101,401 Cash paid 16,898,058 Purchase consideration transferred 135,922,594
Analysis of cash flows on acquisition: Cash paid (16,898,058)
Cash acquired with the subsidiary 64,147,982 Net cash flow 47,249,924
From the date of acquisition, Aditya Birla contributed $180,382,325 of revenue and $16,619,145 to the loss before tax from continuing operations for the Consolidated Entity. If the combination had occurred on 1 July 2016, revenue from continuing operations would have been $210,826,518 and loss before tax from continuing operations for the Consolidated Entity would have been $18,071,510. The fair value of the trade receivables amounts to $12,481,931 which is the gross amount of trade receivables. None of the receivables have been impaired and it is expected that the full contractual amount can be collected. Transaction costs relating to external legal fees, consultant’s fees, technical fees and due diligence costs of $4,151,562 have been expensed and are included in the profit and loss. * Fair value was based on Aditya Birla share price on the date control was gained. ** Fair value was based on Metals X share price on the date control was gained.

| 80
41. DISCONTINUED OPERATION
On 1 December 2016, Westgold was demerged from the Metals X Consolidated Group, following approval by Metals X Shareholders at an Extraordinary General Meeting held on 24 November 2016. Existing Metals X shareholders received shares in Westgold on a 1 Westgold share for every 2 Metals X shares held (in specie distribution).
The fair value of Westgold at demerger was $513,118,030, which was determined by multiplying the number of Westgold shares on issue (304,671,487) by the VWAP ($1.684) over the first five days of trading on the ASX.
The results of the discontinued operation included in the statement of profit or loss and other comprehensive income are set out below.
30 June 2017 30 June 2016
Results of the discontinued operations: Revenue 163,126,231 280,318,569
Expenses (155,480,427) (277,230,121)
Gross profit/(loss) 7,645,804 3,088,448 Other income 2,257,169 3,313,662 Other expenses (7,467,354) Finance costs (481,057) (963,778)
Exploration and evaluation expenditure written off - (24,832,338) Gain on distribution of controlled entities 228,503,915 -
Profit/(loss) before tax 237,765,008 (26,861,360) Income tax (20) -
Profit/(loss) for the period from discontinued operations 237,764,988 (26,861,360) Cash flow information from discontinued operations: Operating activities 6,984,139 49,627,766
Investing activities (44,370,328) (119,056,979) Financing activities 133,231,424 64,056,379
Net cash inflow/(outflow) 95,845,235 (5,372,834)
Carrying value of net assets of discontinued operations: Assets Cash and cash equivalents 96,323,551 Trade and other receivables 5,228,674 Inventories 49,172,005 Prepayments 605,398 Property, plant and equipment 65,958,451 Mine properties and development costs 77,995,594 Exploration and evaluation expenditure 176,183,175 471,466,848 Liabilities Trade and other payables (8,789,270) Unearned income (19,375,000) Interest bearing liabilities (7,269,709) Provisions (119,269,645) Deferred tax asset (32,149,109) (186,852,733) Net assets and liabilities disposed of 284,614,115 Reduction in share capital (341,913,378) Demerger dividend (171,204,652) Gain on distribution of controlled entities (228,503,915)
Entities disposed were: Westgold Resources Limited, Aragon Resources Pty Ltd, Big Bell Gold Operations Pty Ltd, Castile Resources Pty Ltd, Hill 51 Pty Ltd, Avoca Resources Pty Ltd, Avoca Mining Pty Ltd, Dioro Exploration Pty Ltd, HBJ Minerals Pty Ltd and Hampton Gold Mining Areas Limited.

NOTES TO THE CONSOLIDATED FINANCIAL STATEMENTS FOR THE YEAR ENDED 30 JUNE 2017 (CONTINUED)
81 |
42. IMPAIRMENT In accordance with the Consolidated Entity’s accounting policies and processes, non‐financial assets are reviewed each reporting period to determine whether there is an indication of impairment. Where an indicator of impairment exists, a formal estimate of the recoverable amount is made. In assessing whether an impairment is required for the carrying value of an asset, its carrying value is compared to its recoverable amount. The recoverable amount is the higher of the asset’s fair value less costs of disposal and value in use.
Methodology The future recoverability of assets is dependent on a number of key factors including; commodity price, discount rates used in determining the estimated discounted cash flow, foreign exchange rates, the level of proved and probable reserves and measured, indicated and inferred mineral resources, future technological changes which could impact the cost of mining, and future legal changes (including changes to environmental restoration obligations). Impairment is recognised when the carrying amount of the assets exceeds its recoverable amount. When fair value less cost of disposal (FVLCD) is used, fair value is estimated based on discounted cash flows using market based commodity price and exchange assumptions, estimated quantities of recoverable minerals, production levels, operating costs and capital requirements. Consideration is also given to analysts’ valuations, and the market value of the Company’s securities. The fair value methodology adopted is categorised as Level 3 in the fair value hierarchy. 30 June 2017 Assessment As a result of the Consolidated Entity’s 30 June 2017 impairment indicator review, an assessment of the recoverable amount for all of its cash generating units (CGUs) with impairment indicators was performed. An indicator for the Central Musgraves Nickel Project (CMNP or Wingellina) CGU was identified, with factors considered including a lower USD nickel price, increase in market interest rates and other changes to nickel market conditions, which have impacted the return expected by a market participant. This has resulted in impairment charge for the CMNP based on FVLCD. Due to the early development stage and the capital investment required to develop this project, the Consolidated Entity determined that the value in use method was not appropriate to determine the recoverable amount and therefore utilised the fair value less cost of disposal method. The Consolidated Entity utilised a discounted cash flow (DCF) model to determine the fair value of CMNP due to the absence of market prices and recent transactions for an asset of a similar nature. The Consolidated Entity developed a DCF model based upon the existing CMNP feasibility study. The DCF was updated to incorporate current commodity prices, exchange rates, interest rates, debt to equity ratio assumptions and discount rates based upon the weighted average cost of capital for CMNP. The DCF model indicated a negative cash flow over the life of the project. An impairment loss of $73,378,360 was therefore recognised to reduce the carrying amount of the CMNP to nil. Key Assumptions underpinning the CMNP Impairment Assessment The table below summarises the key assumptions used in the carrying value assessment, no reasonably possible changes in key assumptions would change this outcome:
Details 30 June 2017
Nickel price (US$ per tonne) $16,233 Cobalt price (US$ per tonne) $30,000 Exchange rate (AUD/USD) $0.76 Discount rate % (pre tax) 19.5%
Commodity prices and exchange rates Commodity price and foreign exchange rates are estimated with reference to external market forecasts, and updated at least twice annually. The rates applied to the valuation have regard to observable market data.
Discount rate In determining the fair value of assets, the future cash flows were discounted using rates based on the Consolidated Entity’s estimated real weighted average cost of capital, with an additional premium applied having regard to the project’s stage of development. Statement of Financial Position The impairment charges have been allocated to the Consolidated Entity’s non-current assets as below:
Central Musgraves Nickel Project Carrying Value Impairment loss Recoverable amount
Mine properties and development $72,250,650 $72,250,650 -
Exploration and evaluation expenditure $1,127,710 $1,127,710 - Total $73,378,360 $73,378,360 -
43. EVENTS AFTER THE BALANCE SHEET DATE On 26 July 2017 the Company entered into hedges for 1,500 tonnes of copper per month for ten months from October 2017 to July 2018. The Company has granted calls up to A$8,255 per tonne of LME copper and brought puts as low as A$7,600 per tonne of LME copper. Refer to ASX Announcement dated 27 July 2017.

| 82
DIRECTORS’ DECLARATION
In accordance with a resolution of the Directors of Metals X Limited, I state that:
In the opinion of the Directors:
(a) the financial statements and notes of the Company and of the Consolidated Entity are in accordance with the Corporations Act 2001, including:
(i) giving a true and fair view of the Company's and the Consolidated Entity's financial position as at 30 June 2017 and of their performance for the year ended on that date; and
(ii) complying with the Australian Accounting Standards (including the Australian Accounting Interpretations) and Corporations Regulations 2001; and
(b) the financial statements and notes also comply with International Financial Reporting Standards as disclosed in note 2(b) and;
(c) there are reasonable grounds to believe that the Company will be able to pay its debts as and when they become due and payable; and
(d) this declaration has been made after receiving the declarations required to be made to the Directors in accordance with section 295A of the Corporations Act 2001 for the financial year ended 30 June 2017.
As at the date of this declaration, there are reasonable grounds to believe that the members of the Closed Group identified in note 38 will be able to meet any obligations or liabilities to which they are or may become subject, by virtue of the Deed of Cross Guarantee.
On behalf of the Board.
WS Hallam Managing Director Perth, 31 August 2017

| 83
INDEPENDENT AUDIT REPORT

| 84

85 |
INDEPENDENT AUDIT REPORT (CONTINUED)

| 86

87 |
INDEPENDENT AUDIT REPORT (CONTINUED)

| 88
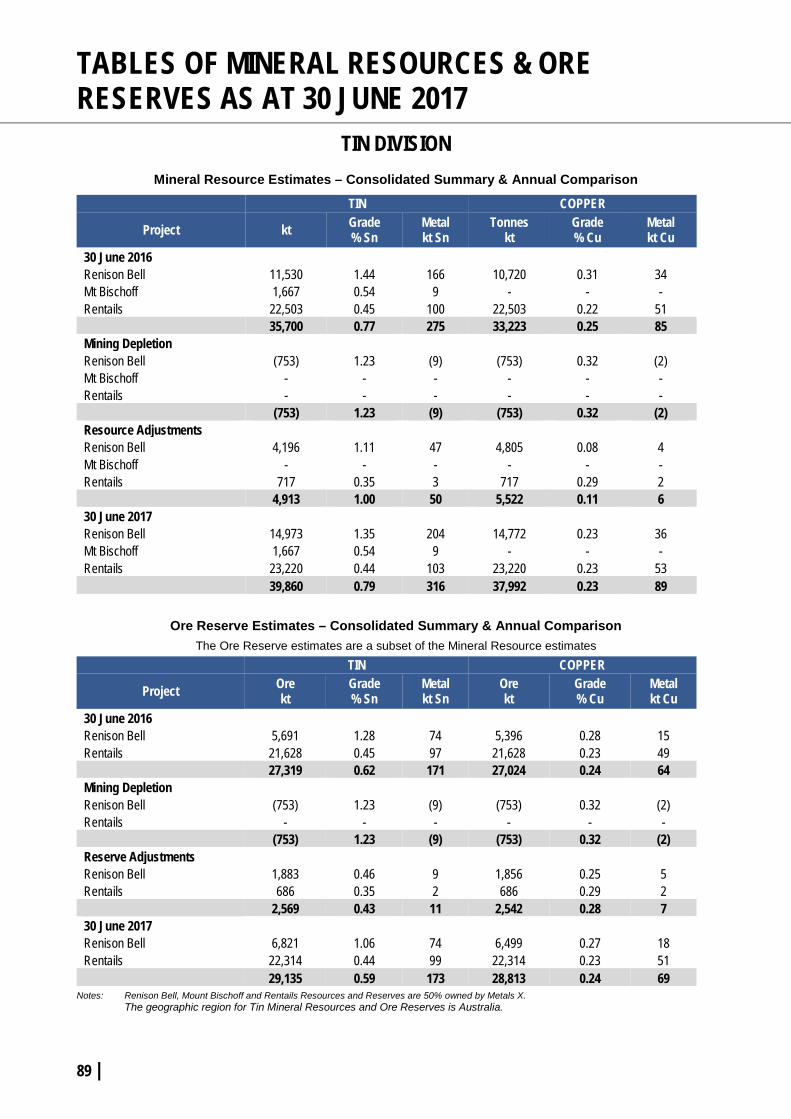
89 |
TABLES OF MINERAL RESOURCES & ORE RESERVES AS AT 30 JUNE 2017
TIN DIVISION Mineral Resource Estimates – Consolidated Summary & Annual Comparison
TIN COPPER
Project kt Grade % Sn
Metal kt Sn
Tonnes kt
Grade % Cu
Metal kt Cu
30 June 2016 Renison Bell 11,530 1.44 166 10,720 0.31 34 Mt Bischoff 1,667 0.54 9 - - - Rentails 22,503 0.45 100 22,503 0.22 51 35,700 0.77 275 33,223 0.25 85 Mining Depletion Renison Bell (753) 1.23 (9) (753) 0.32 (2) Mt Bischoff - - - - - - Rentails - - - - - - (753) 1.23 (9) (753) 0.32 (2) Resource Adjustments Renison Bell 4,196 1.11 47 4,805 0.08 4 Mt Bischoff - - - - - - Rentails 717 0.35 3 717 0.29 2 4,913 1.00 50 5,522 0.11 6 30 June 2017 Renison Bell 14,973 1.35 204 14,772 0.23 36 Mt Bischoff 1,667 0.54 9 - - - Rentails 23,220 0.44 103 23,220 0.23 53 39,860 0.79 316 37,992 0.23 89
Ore Reserve Estimates – Consolidated Summary & Annual Comparison The Ore Reserve estimates are a subset of the Mineral Resource estimates
TIN COPPER
Project Ore kt
Grade % Sn
Metal kt Sn
Ore kt
Grade % Cu
Metal kt Cu
30 June 2016 Renison Bell 5,691 1.28 74 5,396 0.28 15 Rentails 21,628 0.45 97 21,628 0.23 49 27,319 0.62 171 27,024 0.24 64 Mining Depletion Renison Bell (753) 1.23 (9) (753) 0.32 (2) Rentails - - - - - - (753) 1.23 (9) (753) 0.32 (2) Reserve Adjustments Renison Bell 1,883 0.46 9 1,856 0.25 5 Rentails 686 0.35 2 686 0.29 2 2,569 0.43 11 2,542 0.28 7 30 June 2017 Renison Bell 6,821 1.06 74 6,499 0.27 18 Rentails 22,314 0.44 99 22,314 0.23 51 29,135 0.59 173 28,813 0.24 69
Notes: Renison Bell, Mount Bischoff and Rentails Resources and Reserves are 50% owned by Metals X. The geographic region for Tin Mineral Resources and Ore Reserves is Australia.

| 90
COPPER DIVISION
Mineral Resource Estimates – Consolidated Summary & Annual Comparison
Project COPPER
kt Grade % Cu
Metal Kt Cu
30 June 2016 Nifty Sulphide * 23,460 2.03 478 Nifty Oxide 4,330 0.86 37 Nifty Heap Leach 3,310 0.74 23 31,100 1.73 538 Mining Depletion Nifty Sulphide (1,576) 1.84 (29) Nifty Oxide - - - Nifty Heap Leach - - - (1,576) 1.84 (29) Resource Adjustments Nifty Sulphide ** 24,800 0.95 235 Nifty Sulphide *** 516 5.60 29 Nifty Oxide - - - Nifty Heap Leach - - - 25,316 - 264 30 June 2017 Nifty Sulphide 47,200 1.51 713 Nifty Oxide 4,330 0.86 37 Nifty Heap Leach 3,310 0.74 23 54,840 1.41 773
Notes: The 2016 Mineral Resource estimate was released by Aditya Birla Minerals Limited with a cut-off grade of 1.2% Cu*. The 2016 Mineral Resource estimate, as released by Aditya Birla Minerals Limited, adjusted to the Metals X cut-off grade of 0.75% Cu**. Adjustments from 2016 to 2017 at a 0.75% cut-off grade***.
Maroochydore Project COPPER COBALT
kt Grade % Cu
Metal kt Cu kt Grade
ppm Co Metal kt Co
30 June 2016 Maroochydore Oxide 43,200 0.91 394 43,200 391 16.9 Maroochydore Sulphide 5,430 1.66 90 5,430 292 1.6 48,630 1.00 486 48,630 380 18.5 Mining Depletion Maroochydore Oxide - - - - - - Maroochydore Sulphide - - - - - - - - - - - - Resource Adjustments Maroochydore Oxide - - - - - - Maroochydore Sulphide - - - - - - - - - - - - 30 June 2017 Maroochydore Oxide 43,200 0.91 394 43,200 391 16.9 Maroochydore Sulphide 5,430 1.66 90 5,430 292 1.6 48,630 1.00 486 48,630 380 18.5
Notes: The 2016 Mineral Resource estimate is as released by Aditya Birla Minerals Limited.

91 |
TABLES OF MINERAL RESOURCES & ORE RESERVES AS AT 30 JUNE 2017 (CONTINUED)
COPPER DIVISION (CONTINUED) Ore Reserve Estimates – Consolidated Summary & Annual Comparison
The Ore Reserve estimates are a subset of the Mineral Resource estimates
Project COPPER
Ore kt
Grade % Cu
Metal kt Cu
30 June 2016 Nifty Sulphide 5,240 1.85 97 Mining Depletion Nifty Sulphide (1,576) 1.84 (29) Resource Adjustments Nifty Sulphide 6,086 1.40 85 30 June 2017 Nifty Sulphide 9,750 1.58 153
Notes: The geographic region for Copper Mineral Resources and Ore Reserves is Australia.

| 92
NICKEL DIVISION
Mineral Resource Estimates – Consolidated Summary & Annual Comparison
Project NICKEL COBALT Fe2O3
Kt Grade % Ni
Metal kt Ni kt Grade
% Co Metal kt Co kt Grade
% Fe2O3 Metal
kt 30 June 2016 Wingellina 182,560 0.92 1,684 182,560 0.07 132 182,560 45.30 82,701 Claude Hills 33,277 0.81 269 33,277 0.07 22 33,277 38.73 12,889 215,837 0.91 1,953 215,837 0.07 154 215,837 44.29 95,590 Mining Depletion Wingellina - - - - - - - - - Claude Hills - - - - - - - - - - - - - - - - - - Resource Adjustments
Wingellina - - - - - - - - - Claude Hills - - - - - - - - - (637) 17.9 (114) (637) 1.06 (7) (637) 519.23 (3,306) 30 June 2017 Wingellina 182,560 0.92 1,684 182,560 0.07 132 182,560 45.30 82,701 Claude Hills 33,277 0.81 269 33,277 0.07 22 33,277 38.73 12,889 215,837 0.91 1,953 215,837 0.07 154 215,837 44.29 95,590
Ore Reserve Estimates – Consolidated Summary & Annual Comparison
The Ore Reserve estimates are a subset of the Mineral Resource estimates
Project NICKEL COBALT Fe2O3
Ore kt
Grade % Ni
Metal kt Ni
Ore kt
Grade % Co
Metal kt Co
Ore kt
Grade % Fe2O3
Metal kt
30 June 2016 Wingellina 168,422 0.93 1,561 168,422 0.07 123 168,422 45.64 76,870 Claude Hills - - - - - - - - - 168,422 0.93 1,561 168,422 0.07 123 168,422 45.64 76,870 Mining Depletion Wingellina - - - - - - - - - Claude Hills - - - - - - - - - - - - - - - - - - Resource Adjustments Wingellina - - - - - - - - - Claude Hills - - - - - - - - - - - - - - - - - - 30 June 2017 Wingellina 168,422 0.93 1,561 168,422 0.07 123 168,422 45.64 76,870 Claude Hills - - - - - - - - - 168,422 0.93 1,561 168,422 0.07 123 168,422 45.64 76,870
Notes: The geographic region for Nickel Mineral Resources and Ore Reserves is Australia.

93 |
TABLES OF MINERAL RESOURCES & ORE RESERVES AS AT 30 JUNE 2017 (CONTINUED)
COMPETENT PERSONS STATEMENT The information in this report that relates to nickel Mineral Resources was compiled by Metals X technical employees under the supervision of Mr. Jake Russell B.Sc. (Hons), who is a member of the Australian Institute of Geoscientists. Mr Russell, at the date of the Mineral Resource estimate, was a full-time employee of the Company, and has sufficient experience which is relevant to the styles of mineralisation and types of deposit under consideration and to the activities which he is undertaking to qualify as a Competent Person as defined in the 2012 Edition of the “Australasian Code for Reporting of Exploration Results, Mineral Resources and Ore Reserves”. Mr Russell consents to the inclusion in this report of the matters based on his information in the form and context in which it appears.
The information in this report that relates to tin Mineral Resources was compiled by Metals X technical employees under the supervision of Mr. Colin Carter B.Sc., who is a member of the Australian Institute of Geoscientists. Mr. Carter is a full-time employee of the Company, and has sufficient experience which is relevant to the styles of mineralisation and types of deposit under consideration and to the activities which he is undertaking to qualify as a Competent Person as defined in the 2012 Edition of the “Australasian Code for Reporting of Exploration Results, Mineral Resources and Ore Reserves”. Mr. Carter consents to the inclusion in this report of the matters based on his information in the form and context in which it appears. Mr. Carter is eligible to participate in short and long term incentive plans.
The information in this report that relates to copper Mineral Resources compiled by Metals X technical employees under the supervision of Mr. Kim Kremer B.Sc., who is a member of the Australian Institute of Geoscientists. Mr Kremer is a full-time employee of the Company, and has sufficient experience which is relevant to the styles of mineralisation and types of deposit under consideration and to the activities which he is undertaking to qualify as a Competent Person as defined in the 2012 Edition of the “Australasian Code for Reporting of Exploration Results, Mineral Resources and Ore Reserves”. Mr Kremer consents to the inclusion in this report of the matters based on his information in the form and context in which it appears. Mr Kremer is eligible to participate in short and long term incentive plans.
The information in this report that relate to copper and nickel Ore Reserves has been compiled by Metals X technical employees under the supervision of Mr Michael Poepjes BEng (Mining Engineering), MSc (Min. Econ) MAusIMM. Mr Poepjes is a full-time employee of the Company. Mr Poepjes has sufficient experience which is relevant to the styles of mineralisation and types of deposit under consideration and to the activities which he is undertaking to qualify as a Competent Person as defined in the 2012 Edition of the “Australasian Code for Reporting of Exploration Results, Mineral Resources and Ore Reserves”. Mr Poepjes consents to the inclusion in this report of the matters based on his information in the form and context in which it appears. Mr Poepjes is eligible to participate in short and long term incentive plans and holds options over shares in the Company.
The information in this report that relate to tin Ore Reserves has been compiled by Metals X technical employees under the supervision of Mr. Allan King B App Sc. (Mining Engineering) MAusIMM. Mr. King is a full-time employee of the Company. Mr King has sufficient experience which is relevant to the styles of mineralisation and types of deposit under consideration and to the activities which he is undertaking to qualify as a Competent Person as defined in the 2012 Edition of the “Australasian Code for Reporting of Exploration Results, Mineral Resources and Ore Reserves”. Mr. King consents to the inclusion in this report of the matters based on his information in the form and context in which it appears. Mr. King is eligible to participate in short and long term incentive plans and holds options over shares in the Company.
STATEMENT OF GOVERNANCE ARRANGEMENTS AND INTERNAL CONTROLS Governance of Metals X’s Mineral Resources and Ore Reserves development and management activities is a key responsibility of the Executive Management of the Company.
Senior geological and mining engineering staff of the Company oversee reviews and technical evaluations of the estimates and evaluate these with reference to actual physical and cost and performance measures. The evaluation process also draws upon internal skill sets in operational and project management, ore processing and commercial/financial areas of the business.
The Chief Operating Officer (in consultation with senior staff) is responsible for monitoring the planning, prioritization and progress of exploratory and resource definition drilling programs across the Company and the estimation and reporting of resources and reserves. These definition activities are conducted within a framework of quality assurance and quality control protocols covering aspects including drill hole siting, sample collection, sample preparation and analysis as well as sample and data security.
A four-level compliance process guides the control and assurance activities:
1. Provision of internal policies, standards, procedures and guidelines; 2. Mineral Resources and Ore Reserves reporting based on well-founded assumptions and compliance with external standards
such as the Australasian Joint Ore Reserves Committee (JORC) Codes; 3. Internal review of process conformance and compliance; and 4. Internal assessment of compliance and data veracity.
The objectives of the estimation process are to promote the maximum conversion of identified mineralisation into JORC 2012 compliant Mineral Resources and Ore Reserves.
Metals X reports its Mineral Resources and Ore Reserves on an annual basis, in accordance with ASX Listing Rule 5.21 and clause 14 of Appendix 5A (the Australasian Code for Reporting of Exploration Results, Mineral Resources and Ore Reserves (the JORC code) 2012 Edition). There have been no material changes to the Mineral Resources and Ore Reserves estimates since the last annual updates.
Mineral Resources are quoted inclusive of Ore Reserves. Competent Persons named by Metals X are members of the Australasian Institute of Mining and Metallurgy and/or the Australian Institute of Geoscientists, and qualify as Competent Persons as defined in the JORC Code.

| 94
SECURITY HOLDER INFORMATION AS AT 28 AUGUST 2017
(a) Top 20 quoted Shareholders
Shareholder % Number of Shares
HSBC CUSTODY NOM AUST LTD 28.77% 175,302,751 J P MORGAN NOM AUST LTD 10.30% 62,771,557 SUN HUNG KAI INV SVCS LTD 9.18% 55,907,571 NATIONAL NOM LTD 8.81% 53,679,885 CITICORP NOM PL 7.64% 46,576,836 JINCHUAN GRP LTD 7.22% 44,000,000 ALL-STATES FINANCE PL 2.28% 13,883,311 AJAVA HLDGS PL 1.53% 9,325,453 CS THIRD NOM PL 1.11% 6,734,637 BNP PARIBAS NOMS PL 1.09% 6,642,071 COOK PETER GERARD 0.88% 5,387,500 CITICORP NOM PL 0.84% 5,144,550 BOND STREET CUSTS LTD 0.77% 4,721,475 BNP PARIBAS NOM PL 0.74% 4,534,405 NATIONAL NOM LTD 0.67% 4,071,644 DEBORTOLI WINES PL 0.38% 2,317,262 UBS NOM PL 0.36% 2,198,318 MERRILL LYNCH AUST NOM PL 0.35% 2,150,907 HSBC CUSTODY NOM AUST LTD 0.32% 1,961,590 AMP LIFE LTD 0.31% 1,899,361
Total 83.55% 509,211,084
(b) Distribution of quoted ordinary shares
Size of Parcel Number of Shareholders
Number of Shares
1 - 1,000 983 495,892 1,001 - 5,000 2,428 6,393,822 5,001 - 10,000 1,023 7,541,532 10,001 - 100,000 1,458 41,404,189 Over 100,000 148 553,505,468
Total 6,040 609,340,903
(c) Number of holders with less than a marketable parcel of ordinary shares
Number of Shareholders Number of Shares
1 – 100,000 576 159,557
(d) Substantial Shareholders Shareholder % Number of shares
Blackrock Group 11.73 71,515,258 Apac Resources Limited 9.18 55,907,571 Jinchuan Group Limited 7.22 44,000,000 Ausbil Investment Management Limited 5.30 32,318,571

95 |
SECURITY HOLDER INFORMATION AS AT 28 AUGUST 2017 (CONTINUED)
(e) Voting Rights The voting rights for each class of security on issue are:
Ordinary fully paid shares Each ordinary shareholder is entitled to one vote for each share held.
Options The holders of options have no rights to vote at a general meeting of the company.
(f) Unquoted Equity Securities
Number of Options Exercise Price Expiry Date Number holders
7,250,000 $0.76 20/01/2020 11


www.metalsx.com.au