annual report 2007 - shimadzu · shimadzu annual report 2007 3 shimadzu annual report 2007 4 to our...
TRANSCRIPT
ANNUAL REPORT 2007ANNUAL REPORT 2007
P012-E407

Shimadzu Annual Report 20071
Shimadzu Annual Report 20072
Contents Consolidated Financial Highlights Year ended March 31Cautionary Statement Regarding Forward-Looking Information
Projections of future business performance contained in this report are made by the Company management based on information available at the time of its publication and do not preclude potential risks and uncertainties. Actual results may differ materially from those described in this report due to various factors.
Unit: million yen
2004 20052003 2006 2007
Net sales
Domestic sales
Overseas sales
Operating income
Net income
Earnings per share (yen)
Dividend per share (yen)
Capital expenditures
Depreciation
Cash flows from operating activities
Cash flows from investing activities
Cash flows from financing activities
Cash and cash equivalents as of the end of fiscal year
Total assets
Net assets
Equity capital ratio (%)
Return on equity (%)
Return on assets (%)
Net assets per share (yen)
Number of group employees (people)
160,238
73,321
20,587
233,559
163,509
79,129
21,076
242,638
167,983
94,449
25,281
262,432
62,186
10,944
204,283
142,097
64,600
16,898
11,902 11,316 13,3793,518 5,912
43.87 39.32 45.3012.78 21.64
7.00 7.00 8.005.00 5.00
6,350 7,059 11,0503,947 11,525
4,678 4,866 5,1564,416 4,420
18,139 12,941 13,99123,955 14,793
(11,896) (6,342) (9,797)(3,754) (4,068)
(7,520) (5,330) (9,728)(4,223) (11,208)
29,860 31,927 26,90732,762 31,180
262,846 277,052 295,084244,014 256,399
96,387 129,659 *142,20480,528 85,676
36.7 46.8 48.033.0 33.4
13.1 10.0 9.94.4 7.1
6.7 6.8 8.13.4 4.7
360.81 438.15 479.60301.46 320.72
8,246 8,512 8,9547,879 7,930
217,940
153,340
Net income
¥ ¥
Earnings per share Net assets per share
* Equity for the year ended March 31, 2007 includes minority interests due to introduction of a new accounting standard.
0
10
20
30
40
50
02003 2004 20062005 2007 2003 2004 20062005 2007 2003 2004 20062005 2007 2003 2004 20062005 2007
¥millions
Net sales
0
100
200
300
400
500
0
50,000
100,000
150,000
200,000
250,000¥millions
5,000
10,000
15,000
20,000
25,000
3,518
5,912
11,90211,316
13,379
12.78
21.64
43.8745.30
39.32
301.46320.72
360.81
438.15
479.60
204,283217,940
233,559
242,638262,432
· · · · · · · · · · · · · · · · · · · · · · · · · · · · · · · · ·
· · · · · · · · · · · · · · · · · · · · · · · · · · · · · · · · · · · · · · · ·
· · · · · · · · · · · · · · · · · · · · · · · · · · · · · · · · ·
· · · · · · · · · · · · · · · · · · · · · · · · · · · · · · · · ·
· · · · · · · · · · · · · · · · · · · · · · · · · · · · · · · · · · · · · ·
· · · · · · · · · · · · · · · · · · · · · · · · · · · ·
· · · · · · · · · · · · · · · · · · · · · · · · · · · ·
· · · · · · · · · · · · · · · · · · · · · · · · · · · · · · ·
· · · · · · · · · · · · · · · · · · · · · · · · · · · · · · · · · · · · ·
· · · · · · · · · · · · · · · · · · ·
· · · · · · · · · · · · · · · · · · ·
· · · · · · · · · · · · · · · · · · ·
· · · ·
· · · · · · · · · · · · · · · · · · · · · · · · · · · · · · · · · · · · · ·
· · · · · · · · · · · · · · · · · · · · · · · · · · · · · · · · · · · · · · ·
· · · · · · · · · · · · · · · · · · · · · · · · · · · · · ·
· · · · · · · · · · · · · · · · · · · · · · · · · · · · · · ·
· · · · · · · · · · · · · · · · · · · · · · · · · · · · · · ·
· · · · · · · · · · · · · · · · · · · · · · · · · · ·
· · · · · · · · · · · · · · · · · ·
Share Price ( Tokyo Stock Exchange )
4 6 8 10 12 2 4 6 8 10 12 22006 2007
Month800
1,200
2,000
1,600
YenTOPIXTOPIXShimadzu
400
700
1,300
1,000
Unit: yen
Share price range
High
Low
Fiscal year-end
Number of shares outstanding (as of fiscal year-end; unit: million shares)
Market capitalization (as of fiscal year-end; unit: million yen)
Earnings per share
Earnings per share (diluted)
Dividend
870
622
741
295
218,911
39.32
37.53
7.00
FY2005
1,107
720
1,021
296
302,287
45.30
-
8.00
FY2006
Share Price Information
Consolidated Financial Highlights
To Our Shareholders
Business Segment Information
Environmental Preservation Activities
Board of Directors
Financial Section
1
2
4
9
13
14
16
Shimadzu Annual Report 20073
Shimadzu Annual Report 20074
To Our Shareholders
Business Overview
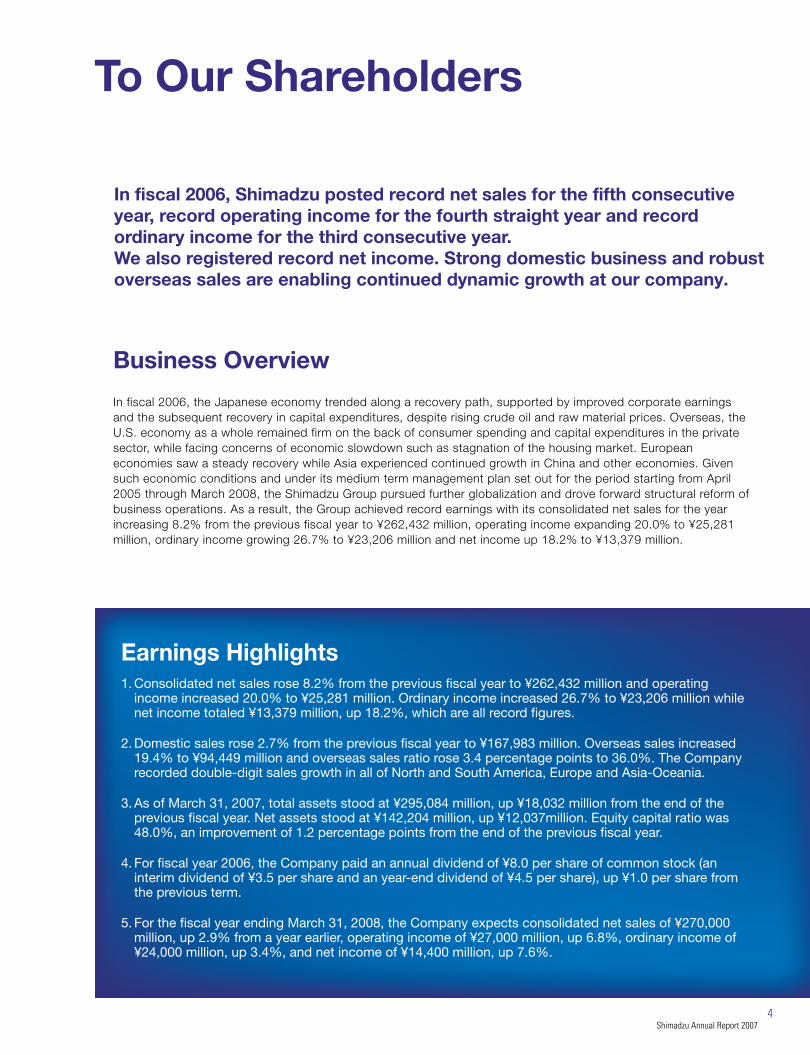
In fiscal 2006, the Japanese economy trended along a recovery path, supported by improved corporate earnings and the subsequent recovery in capital expenditures, despite rising crude oil and raw material prices. Overseas, the U.S. economy as a whole remained firm on the back of consumer spending and capital expenditures in the private sector, while facing concerns of economic slowdown such as stagnation of the housing market. European economies saw a steady recovery while Asia experienced continued growth in China and other economies. Given such economic conditions and under its medium term management plan set out for the period starting from April 2005 through March 2008, the Shimadzu Group pursued further globalization and drove forward structural reform of business operations. As a result, the Group achieved record earnings with its consolidated net sales for the year increasing 8.2% from the previous fiscal year to ¥262,432 million, operating income expanding 20.0% to ¥25,281 million, ordinary income growing 26.7% to ¥23,206 million and net income up 18.2% to ¥13,379 million.
Earnings Highlights1. Consolidated net sales rose 8.2% from the previous fiscal year to ¥262,432 million and operating
income increased 20.0% to ¥25,281 million. Ordinary income increased 26.7% to ¥23,206 million while net income totaled ¥13,379 million, up 18.2%, which are all record figures.
2. Domestic sales rose 2.7% from the previous fiscal year to ¥167,983 million. Overseas sales increased 19.4% to ¥94,449 million and overseas sales ratio rose 3.4 percentage points to 36.0%. The Company recorded double-digit sales growth in all of North and South America, Europe and Asia-Oceania.
3. As of March 31, 2007, total assets stood at ¥295,084 million, up ¥18,032 million from the end of the previous fiscal year. Net assets stood at ¥142,204 million, up ¥12,037million. Equity capital ratio was 48.0%, an improvement of 1.2 percentage points from the end of the previous fiscal year.
4. For fiscal year 2006, the Company paid an annual dividend of ¥8.0 per share of common stock (an interim dividend of ¥3.5 per share and an year-end dividend of ¥4.5 per share), up ¥1.0 per share from the previous term.
5. For the fiscal year ending March 31, 2008, the Company expects consolidated net sales of ¥270,000 million, up 2.9% from a year earlier, operating income of ¥27,000 million, up 6.8%, ordinary income of ¥24,000 million, up 3.4%, and net income of ¥14,400 million, up 7.6%.
In fiscal 2006, Shimadzu posted record net sales for the fifth consecutive year, record operating income for the fourth straight year and record ordinary income for the third consecutive year. We also registered record net income. Strong domestic business and robust overseas sales are enabling continued dynamic growth at our company.
President and Chief Executive Officer
Shigehiko Hattori
Shimadzu Annual Report 20073
Shimadzu Annual Report 20074
To Our Shareholders
Business Overview
In fiscal 2006, the Japanese economy trended along a recovery path, supported by improved corporate earnings and the subsequent recovery in capital expenditures, despite rising crude oil and raw material prices. Overseas, the U.S. economy as a whole remained firm on the back of consumer spending and capital expenditures in the private sector, while facing concerns of economic slowdown such as stagnation of the housing market. European economies saw a steady recovery while Asia experienced continued growth in China and other economies. Given such economic conditions and under its medium term management plan set out for the period starting from April 2005 through March 2008, the Shimadzu Group pursued further globalization and drove forward structural reform of business operations. As a result, the Group achieved record earnings with its consolidated net sales for the year increasing 8.2% from the previous fiscal year to ¥262,432 million, operating income expanding 20.0% to ¥25,281 million, ordinary income growing 26.7% to ¥23,206 million and net income up 18.2% to ¥13,379 million.
Earnings Highlights1. Consolidated net sales rose 8.2% from the previous fiscal year to ¥262,432 million and operating
income increased 20.0% to ¥25,281 million. Ordinary income increased 26.7% to ¥23,206 million while net income totaled ¥13,379 million, up 18.2%, which are all record figures.
2. Domestic sales rose 2.7% from the previous fiscal year to ¥167,983 million. Overseas sales increased 19.4% to ¥94,449 million and overseas sales ratio rose 3.4 percentage points to 36.0%. The Company recorded double-digit sales growth in all of North and South America, Europe and Asia-Oceania.
3. As of March 31, 2007, total assets stood at ¥295,084 million, up ¥18,032 million from the end of the previous fiscal year. Net assets stood at ¥142,204 million, up ¥12,037million. Equity capital ratio was 48.0%, an improvement of 1.2 percentage points from the end of the previous fiscal year.
4. For fiscal year 2006, the Company paid an annual dividend of ¥8.0 per share of common stock (an interim dividend of ¥3.5 per share and an year-end dividend of ¥4.5 per share), up ¥1.0 per share from the previous term.
5. For the fiscal year ending March 31, 2008, the Company expects consolidated net sales of ¥270,000 million, up 2.9% from a year earlier, operating income of ¥27,000 million, up 6.8%, ordinary income of ¥24,000 million, up 3.4%, and net income of ¥14,400 million, up 7.6%.
In fiscal 2006, Shimadzu posted record net sales for the fifth consecutive year, record operating income for the fourth straight year and record ordinary income for the third consecutive year. We also registered record net income. Strong domestic business and robust overseas sales are enabling continued dynamic growth at our company.
President and Chief Executive Officer
Shigehiko Hattori
Shimadzu Annual Report 20075
Shimadzu Annual Report 20076
Business Segment Overview
Analytical and Measuring Instruments
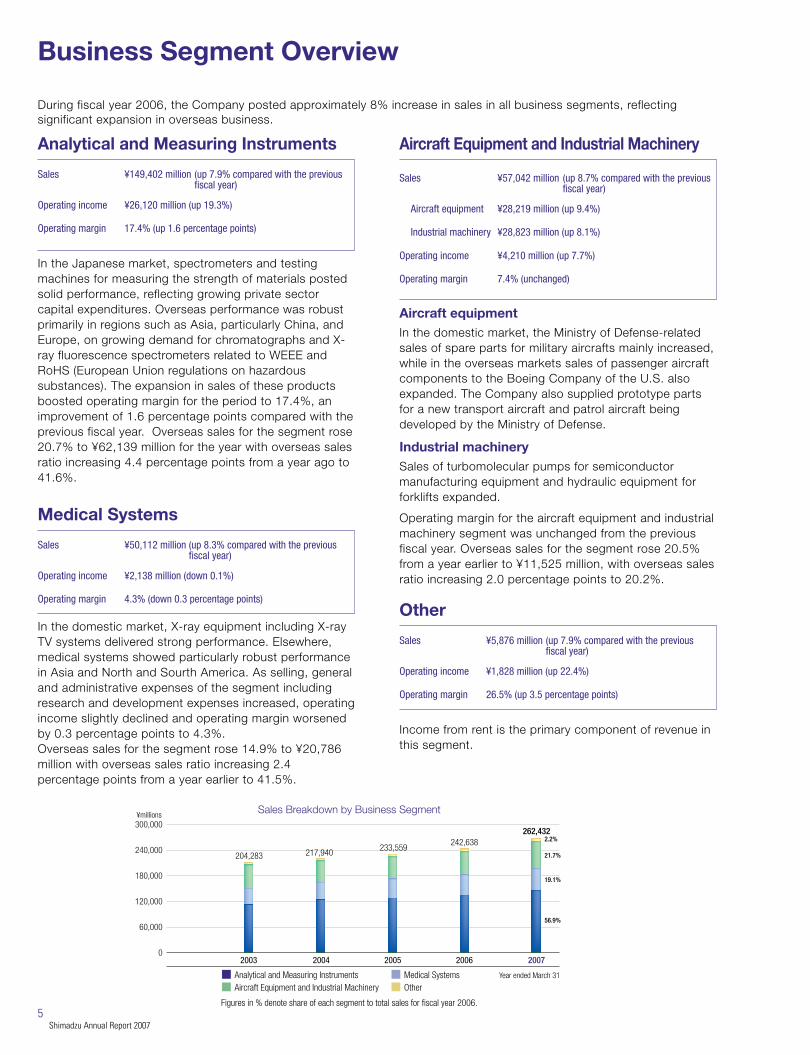
During fiscal year 2006, the Company posted approximately 8% increase in sales in all business segments, reflecting significant expansion in overseas business.
In the Japanese market, spectrometers and testing machines for measuring the strength of materials posted solid performance, reflecting growing private sector capital expenditures. Overseas performance was robust primarily in regions such as Asia, particularly China, and Europe, on growing demand for chromatographs and X-ray fluorescence spectrometers related to WEEE and RoHS (European Union regulations on hazardous substances). The expansion in sales of these products boosted operating margin for the period to 17.4%, an improvement of 1.6 percentage points compared with the previous fiscal year. Overseas sales for the segment rose 20.7% to ¥62,139 million for the year with overseas sales ratio increasing 4.4 percentage points from a year ago to 41.6%.
¥149,402 million (up 7.9% compared with the previous fiscal year)
Sales
¥26,120 million (up 19.3%)Operating income
17.4% (up 1.6 percentage points)Operating margin
Aircraft Equipment and Industrial Machinery
Aircraft equipmentIn the domestic market, the Ministry of Defense-related sales of spare parts for military aircrafts mainly increased, while in the overseas markets sales of passenger aircraft components to the Boeing Company of the U.S. also expanded. The Company also supplied prototype parts for a new transport aircraft and patrol aircraft being developed by the Ministry of Defense.
Industrial machinerySales of turbomolecular pumps for semiconductor manufacturing equipment and hydraulic equipment for forklifts expanded.
Operating margin for the aircraft equipment and industrial machinery segment was unchanged from the previous fiscal year. Overseas sales for the segment rose 20.5% from a year earlier to ¥11,525 million, with overseas sales ratio increasing 2.0 percentage points to 20.2%.
¥57,042 million (up 8.7% compared with the previous fiscal year)
Sales
¥28,219 million (up 9.4%)Aircraft equipment
¥28,823 million (up 8.1%)Industrial machinery
¥4,210 million (up 7.7%)Operating income
7.4% (unchanged)Operating margin
Overseas Sales
North and South America
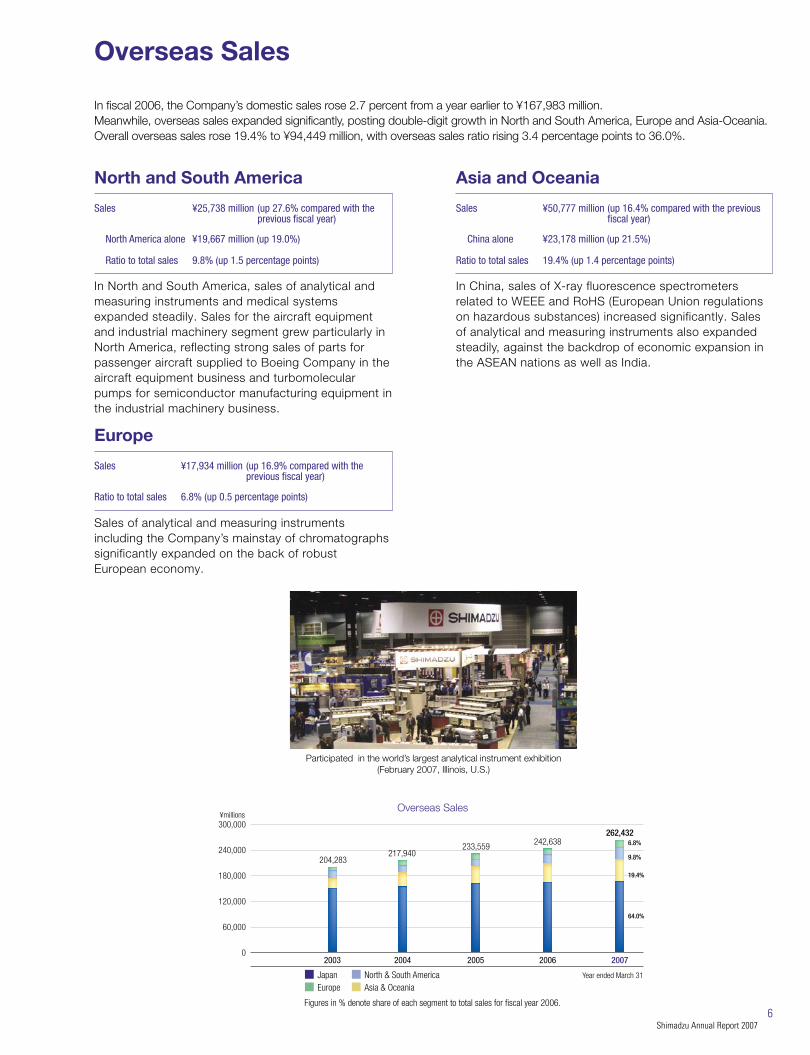
In fiscal 2006, the Company’s domestic sales rose 2.7 percent from a year earlier to ¥167,983 million.Meanwhile, overseas sales expanded significantly, posting double-digit growth in North and South America, Europe and Asia-Oceania. Overall overseas sales rose 19.4% to ¥94,449 million, with overseas sales ratio rising 3.4 percentage points to 36.0%.
In North and South America, sales of analytical and measuring instruments and medical systems expanded steadily. Sales for the aircraft equipment and industrial machinery segment grew particularly in North America, reflecting strong sales of parts for passenger aircraft supplied to Boeing Company in the aircraft equipment business and turbomolecular pumps for semiconductor manufacturing equipment in the industrial machinery business.
¥25,738 million (up 27.6% compared with the previous fiscal year)
Sales
¥19,667 million (up 19.0%)North America alone
9.8% (up 1.5 percentage points)Ratio to total sales
Asia and Oceania
In China, sales of X-ray fluorescence spectrometers related to WEEE and RoHS (European Union regulations on hazardous substances) increased significantly. Sales of analytical and measuring instruments also expanded steadily, against the backdrop of economic expansion in the ASEAN nations as well as India.
¥50,777 million (up 16.4% compared with the previous fiscal year)
Sales
¥23,178 million (up 21.5%)China alone
19.4% (up 1.4 percentage points)Ratio to total sales
Europe
Sales of analytical and measuring instruments including the Company’s mainstay of chromatographs significantly expanded on the back of robust European economy.
¥17,934 million (up 16.9% compared with the previous fiscal year)
Sales
6.8% (up 0.5 percentage points)Ratio to total sales
Medical Systems
In the domestic market, X-ray equipment including X-ray TV systems delivered strong performance. Elsewhere, medical systems showed particularly robust performance in Asia and North and Sourth America. As selling, general and administrative expenses of the segment including research and development expenses increased, operating income slightly declined and operating margin worsened by 0.3 percentage points to 4.3%.Overseas sales for the segment rose 14.9% to ¥20,786 million with overseas sales ratio increasing 2.4 percentage points from a year earlier to 41.5%.
¥50,112 million Sales (up 8.3% compared with the previous fiscal year)
¥2,138 million (down 0.1%)Operating income
4.3% (down 0.3 percentage points)Operating margin Other
Income from rent is the primary component of revenue in this segment.
¥5,876 million Sales (up 7.9% compared with the previous fiscal year)
¥1,828 million (up 22.4%)Operating income
26.5% (up 3.5 percentage points)Operating margin
Sales Breakdown by Business Segment
Figures in % denote share of each segment to total sales for fiscal year 2006.
Analytical and Measuring Instruments Medical Systems
0
60,000
120,000
180,000
240,000
¥millions300,000
2003 2004 2005 2006 2007
204,283 217,940233,559
242,638262,432
21.7%
19.1%
56.9%
2.2%
9.8%
19.4%
64.0%
6.8%
Aircraft Equipment and Industrial Machinery Other
Figures in % denote share of each segment to total sales for fiscal year 2006.
Japan North & South AmericaEurope Asia & Oceania
¥millions
0
60,000
120,000
180,000
300,000
240,000
2003 2004 2005 2006 2007
204,283217,940
233,559 242,638262,432
Participated in the world’s largest analytical instrument exhibition(February 2007, Illinois, U.S.)
Overseas Sales
Year ended March 31 Year ended March 31
Shimadzu Annual Report 20075
Shimadzu Annual Report 20076
Business Segment Overview
Analytical and Measuring Instruments
During fiscal year 2006, the Company posted approximately 8% increase in sales in all business segments, reflecting significant expansion in overseas business.
In the Japanese market, spectrometers and testing machines for measuring the strength of materials posted solid performance, reflecting growing private sector capital expenditures. Overseas performance was robust primarily in regions such as Asia, particularly China, and Europe, on growing demand for chromatographs and X-ray fluorescence spectrometers related to WEEE and RoHS (European Union regulations on hazardous substances). The expansion in sales of these products boosted operating margin for the period to 17.4%, an improvement of 1.6 percentage points compared with the previous fiscal year. Overseas sales for the segment rose 20.7% to ¥62,139 million for the year with overseas sales ratio increasing 4.4 percentage points from a year ago to 41.6%.
¥149,402 million (up 7.9% compared with the previous fiscal year)
Sales
¥26,120 million (up 19.3%)Operating income
17.4% (up 1.6 percentage points)Operating margin
Aircraft Equipment and Industrial Machinery
Aircraft equipmentIn the domestic market, the Ministry of Defense-related sales of spare parts for military aircrafts mainly increased, while in the overseas markets sales of passenger aircraft components to the Boeing Company of the U.S. also expanded. The Company also supplied prototype parts for a new transport aircraft and patrol aircraft being developed by the Ministry of Defense.
Industrial machinerySales of turbomolecular pumps for semiconductor manufacturing equipment and hydraulic equipment for forklifts expanded.
Operating margin for the aircraft equipment and industrial machinery segment was unchanged from the previous fiscal year. Overseas sales for the segment rose 20.5% from a year earlier to ¥11,525 million, with overseas sales ratio increasing 2.0 percentage points to 20.2%.
¥57,042 million (up 8.7% compared with the previous fiscal year)
Sales
¥28,219 million (up 9.4%)Aircraft equipment
¥28,823 million (up 8.1%)Industrial machinery
¥4,210 million (up 7.7%)Operating income
7.4% (unchanged)Operating margin
Overseas Sales
North and South America
In fiscal 2006, the Company’s domestic sales rose 2.7 percent from a year earlier to ¥167,983 million.Meanwhile, overseas sales expanded significantly, posting double-digit growth in North and South America, Europe and Asia-Oceania. Overall overseas sales rose 19.4% to ¥94,449 million, with overseas sales ratio rising 3.4 percentage points to 36.0%.
In North and South America, sales of analytical and measuring instruments and medical systems expanded steadily. Sales for the aircraft equipment and industrial machinery segment grew particularly in North America, reflecting strong sales of parts for passenger aircraft supplied to Boeing Company in the aircraft equipment business and turbomolecular pumps for semiconductor manufacturing equipment in the industrial machinery business.
¥25,738 million (up 27.6% compared with the previous fiscal year)
Sales
¥19,667 million (up 19.0%)North America alone
9.8% (up 1.5 percentage points)Ratio to total sales
Asia and Oceania
In China, sales of X-ray fluorescence spectrometers related to WEEE and RoHS (European Union regulations on hazardous substances) increased significantly. Sales of analytical and measuring instruments also expanded steadily, against the backdrop of economic expansion in the ASEAN nations as well as India.
¥50,777 million (up 16.4% compared with the previous fiscal year)
Sales
¥23,178 million (up 21.5%)China alone
19.4% (up 1.4 percentage points)Ratio to total sales
Europe
Sales of analytical and measuring instruments including the Company’s mainstay of chromatographs significantly expanded on the back of robust European economy.
¥17,934 million (up 16.9% compared with the previous fiscal year)
Sales
6.8% (up 0.5 percentage points)Ratio to total sales
Medical Systems
In the domestic market, X-ray equipment including X-ray TV systems delivered strong performance. Elsewhere, medical systems showed particularly robust performance in Asia and North and Sourth America. As selling, general and administrative expenses of the segment including research and development expenses increased, operating income slightly declined and operating margin worsened by 0.3 percentage points to 4.3%.Overseas sales for the segment rose 14.9% to ¥20,786 million with overseas sales ratio increasing 2.4 percentage points from a year earlier to 41.5%.
¥50,112 million Sales (up 8.3% compared with the previous fiscal year)
¥2,138 million (down 0.1%)Operating income
4.3% (down 0.3 percentage points)Operating margin Other
Income from rent is the primary component of revenue in this segment.
¥5,876 million Sales (up 7.9% compared with the previous fiscal year)
¥1,828 million (up 22.4%)Operating income
26.5% (up 3.5 percentage points)Operating margin
Sales Breakdown by Business Segment
Figures in % denote share of each segment to total sales for fiscal year 2006.
Analytical and Measuring Instruments Medical Systems
0
60,000
120,000
180,000
240,000
¥millions300,000
2003 2004 2005 2006 2007
204,283 217,940233,559
242,638262,432
21.7%
19.1%
56.9%
2.2%
9.8%
19.4%
64.0%
6.8%
Aircraft Equipment and Industrial Machinery Other
Figures in % denote share of each segment to total sales for fiscal year 2006.
Japan North & South AmericaEurope Asia & Oceania
¥millions
0
60,000
120,000
180,000
300,000
240,000
2003 2004 2005 2006 2007
204,283217,940
233,559 242,638262,432
Participated in the world’s largest analytical instrument exhibition(February 2007, Illinois, U.S.)
Overseas Sales
Year ended March 31 Year ended March 31
Shimadzu Annual Report 20077
Shimadzu Annual Report 20077
Shimadzu Annual Report 20078
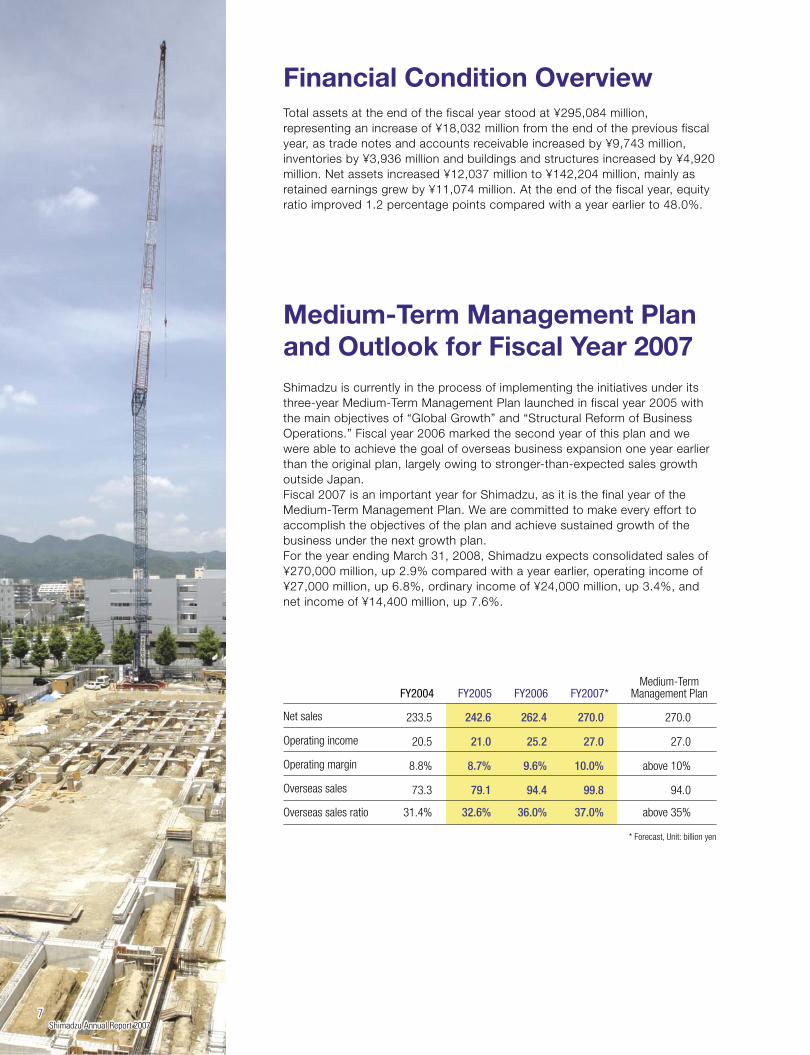
Financial Condition Overview Dividend PolicyTotal assets at the end of the fiscal year stood at ¥295,084 million, representing an increase of ¥18,032 million from the end of the previous fiscal year, as trade notes and accounts receivable increased by ¥9,743 million, inventories by ¥3,936 million and buildings and structures increased by ¥4,920 million. Net assets increased ¥12,037 million to ¥142,204 million, mainly as retained earnings grew by ¥11,074 million. At the end of the fiscal year, equity ratio improved 1.2 percentage points compared with a year earlier to 48.0%.
Medium-Term Management Plan and Outlook for Fiscal Year 2007Shimadzu is currently in the process of implementing the initiatives under its three-year Medium-Term Management Plan launched in fiscal year 2005 with the main objectives of “Global Growth” and “Structural Reform of Business Operations.” Fiscal year 2006 marked the second year of this plan and we were able to achieve the goal of overseas business expansion one year earlier than the original plan, largely owing to stronger-than-expected sales growth outside Japan. Fiscal 2007 is an important year for Shimadzu, as it is the final year of the Medium-Term Management Plan. We are committed to make every effort to accomplish the objectives of the plan and achieve sustained growth of the business under the next growth plan. For the year ending March 31, 2008, Shimadzu expects consolidated sales of ¥270,000 million, up 2.9% compared with a year earlier, operating income of ¥27,000 million, up 6.8%, ordinary income of ¥24,000 million, up 3.4%, and net income of ¥14,400 million, up 7.6%.
Global GrowthUnder the Global Growth objective, we have established new sales subsidiaries in the U.K., France, Netherlands and India. In China, we newly established a company to offer contract-based analytical service in Guangzhou (Guandong) and expanded capacity of our analytical and measuring instrument plant in Suzhou (Jiangsu) to accelerate globalization of our operation.
Shimadzu believes that its profit distribution policy is a matter of vital importance to the Company and our policy is to make stable and continued dividend payments reflecting our earnings performance. We are fully committed to improving business performance to reinforce our profitability and financial standings and boost return on equity. We plan to invest retained earnings effectively in new facilities as well as research and development to ensure future growth and business expansion.We have set the annual dividend for fiscal year 2006 at ¥8.0 per share of common stock (interim dividend of ¥3.5 per share and year-end dividend of ¥4.5 per share). For fiscal year 2007, we expect to offer an annual dividend of ¥8.0 per share of common stock (interim dividend of ¥4.0 per share and year-end dividend of ¥4.0 per share). We would like to thank our shareholders and look forward to their continued support.
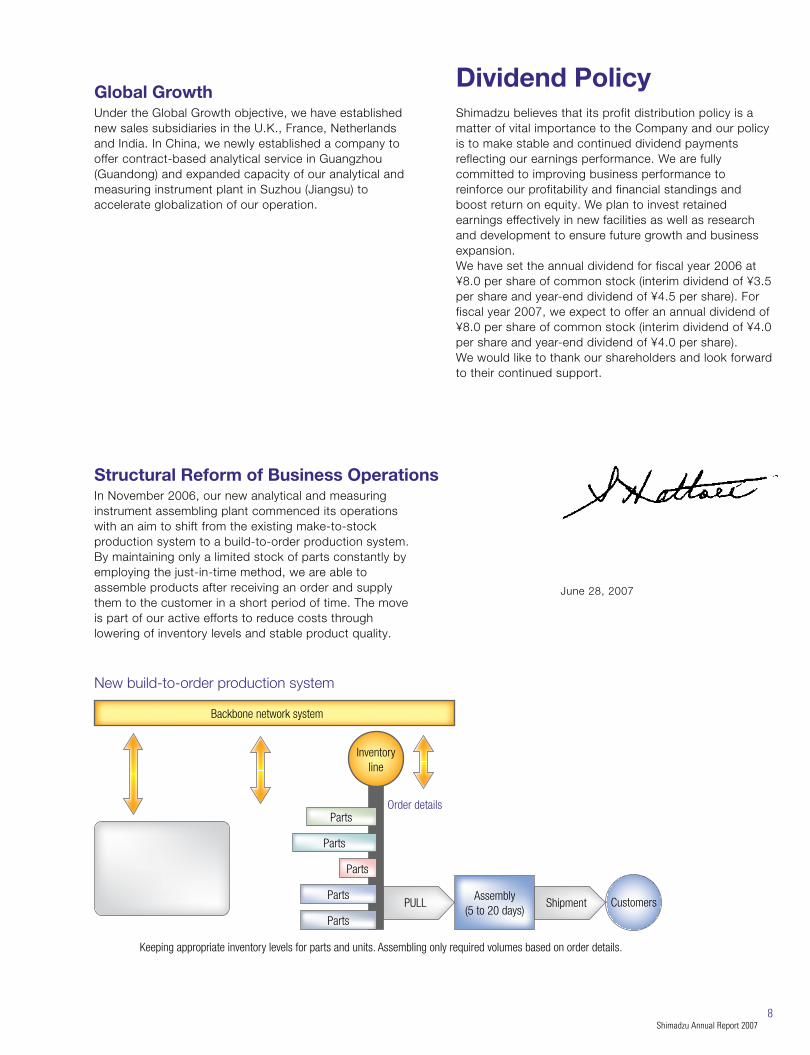
Structural Reform of Business OperationsIn November 2006, our new analytical and measuring instrument assembling plant commenced its operations with an aim to shift from the existing make-to-stock production system to a build-to-order production system. By maintaining only a limited stock of parts constantly by employing the just-in-time method, we are able to assemble products after receiving an order and supply them to the customer in a short period of time. The move is part of our active efforts to reduce costs through lowering of inventory levels and stable product quality.
June 28, 2007
* Forecast, Unit: billion yen
FY2004 FY2005 FY2006 FY2007*
Net sales
Operating income
Operating margin
Overseas sales
Overseas sales ratio
242.6 262.4 270.0233.5
21.0 25.2 27.020.5
8.7% 9.6% 10.0%8.8%
79.1 94.4 99.873.3
32.6% 36.0%
Medium-TermManagement Plan
270.0
27.0
above 10%
94.0
above 35%37.0%31.4%
New build-to-order production system
Backbone network system
Parts
Inventoryline
Customers
Parts
Parts
Parts
Parts
PULL ShipmentAssembly
(5 to 20 days)
Order details
Keeping appropriate inventory levels for parts and units. Assembling only required volumes based on order details.
Shimadzu (Guangzhou) Analysis & Technology Service co., Ltd
Construction of new plant for integrated production of turbomolecular pumps (June 2007, Kyoto)
Procurement of parts and materials Procurement of processed parts from suppliers
President and Chief Executive Officer
Shigehiko Hattori
Shimadzu Annual Report 20077
Shimadzu Annual Report 20077
Shimadzu Annual Report 20078
Financial Condition Overview Dividend PolicyTotal assets at the end of the fiscal year stood at ¥295,084 million, representing an increase of ¥18,032 million from the end of the previous fiscal year, as trade notes and accounts receivable increased by ¥9,743 million, inventories by ¥3,936 million and buildings and structures increased by ¥4,920 million. Net assets increased ¥12,037 million to ¥142,204 million, mainly as retained earnings grew by ¥11,074 million. At the end of the fiscal year, equity ratio improved 1.2 percentage points compared with a year earlier to 48.0%.
Medium-Term Management Plan and Outlook for Fiscal Year 2007Shimadzu is currently in the process of implementing the initiatives under its three-year Medium-Term Management Plan launched in fiscal year 2005 with the main objectives of “Global Growth” and “Structural Reform of Business Operations.” Fiscal year 2006 marked the second year of this plan and we were able to achieve the goal of overseas business expansion one year earlier than the original plan, largely owing to stronger-than-expected sales growth outside Japan. Fiscal 2007 is an important year for Shimadzu, as it is the final year of the Medium-Term Management Plan. We are committed to make every effort to accomplish the objectives of the plan and achieve sustained growth of the business under the next growth plan. For the year ending March 31, 2008, Shimadzu expects consolidated sales of ¥270,000 million, up 2.9% compared with a year earlier, operating income of ¥27,000 million, up 6.8%, ordinary income of ¥24,000 million, up 3.4%, and net income of ¥14,400 million, up 7.6%.
Global GrowthUnder the Global Growth objective, we have established new sales subsidiaries in the U.K., France, Netherlands and India. In China, we newly established a company to offer contract-based analytical service in Guangzhou (Guandong) and expanded capacity of our analytical and measuring instrument plant in Suzhou (Jiangsu) to accelerate globalization of our operation.
Shimadzu believes that its profit distribution policy is a matter of vital importance to the Company and our policy is to make stable and continued dividend payments reflecting our earnings performance. We are fully committed to improving business performance to reinforce our profitability and financial standings and boost return on equity. We plan to invest retained earnings effectively in new facilities as well as research and development to ensure future growth and business expansion.We have set the annual dividend for fiscal year 2006 at ¥8.0 per share of common stock (interim dividend of ¥3.5 per share and year-end dividend of ¥4.5 per share). For fiscal year 2007, we expect to offer an annual dividend of ¥8.0 per share of common stock (interim dividend of ¥4.0 per share and year-end dividend of ¥4.0 per share). We would like to thank our shareholders and look forward to their continued support.
Structural Reform of Business OperationsIn November 2006, our new analytical and measuring instrument assembling plant commenced its operations with an aim to shift from the existing make-to-stock production system to a build-to-order production system. By maintaining only a limited stock of parts constantly by employing the just-in-time method, we are able to assemble products after receiving an order and supply them to the customer in a short period of time. The move is part of our active efforts to reduce costs through lowering of inventory levels and stable product quality.
June 28, 2007
* Forecast, Unit: billion yen
FY2004 FY2005 FY2006 FY2007*
Net sales
Operating income
Operating margin
Overseas sales
Overseas sales ratio
242.6 262.4 270.0233.5
21.0 25.2 27.020.5
8.7% 9.6% 10.0%8.8%
79.1 94.4 99.873.3
32.6% 36.0%
Medium-TermManagement Plan
270.0
27.0
above 10%
94.0
above 35%37.0%31.4%
New build-to-order production system
Backbone network system
Parts
Inventoryline
Customers
Parts
Parts
Parts
Parts
PULL ShipmentAssembly
(5 to 20 days)
Order details
Keeping appropriate inventory levels for parts and units. Assembling only required volumes based on order details.
Shimadzu (Guangzhou) Analysis & Technology Service co., Ltd
Construction of new plant for integrated production of turbomolecular pumps (June 2007, Kyoto)
Procurement of parts and materials Procurement of processed parts from suppliers
President and Chief Executive Officer
Shigehiko Hattori
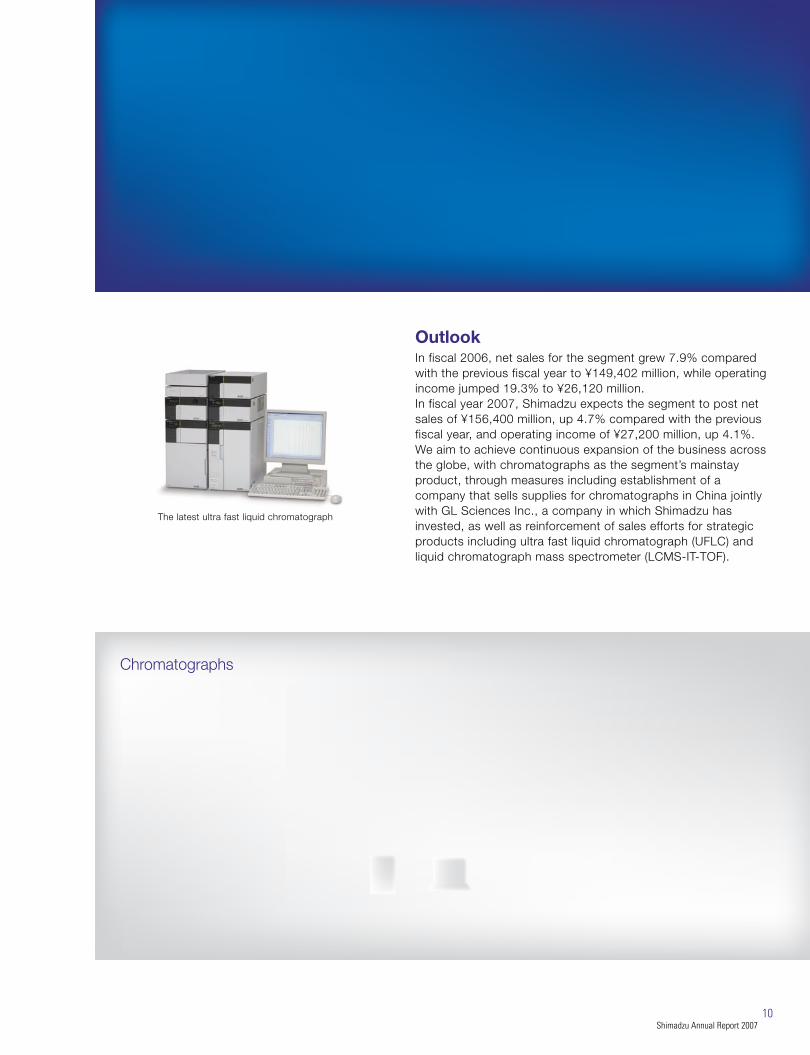
The latest ultra fast liquid chromatograph
Shimadzu Annual Report 20079
Shimadzu Annual Report 200710
Analytical and Measuring InstrumentsIn this segment, Shimadzu offers a number of highly competitive products both in Japan and abroad, including chromatographs, mass spectrometers, X-ray/surface analysis instruments, material testing machines, nondestructive inspection machines and environment-related measuring instruments. These instruments are used in research and development and quality control by businesses and universities in wide-ranging fields such as pharmaceuticals, chemicals, food, iron and steel, and semiconductors. In recent years, these products are also being used in environmental monitoring.Currently, in addition to the products’ high market share in Japan, we are accelerating our efforts to expand globally, especially in the biggest markets such as the U.S. and Europe as well as in fast-growing China and India.Furthermore, we are committed to expanding the business in the life science field and have been focusing on the development of instruments for DNA and protein analysis as well as related laboratory reagents. We are also involved in the joint development with a number of research institutes of next generation diagnosis technologies such as analysis of SNPs and disease biomarkers.
OutlookIn fiscal 2006, net sales for the segment grew 7.9% compared with the previous fiscal year to ¥149,402 million, while operating income jumped 19.3% to ¥26,120 million.In fiscal year 2007, Shimadzu expects the segment to post net sales of ¥156,400 million, up 4.7% compared with the previous fiscal year, and operating income of ¥27,200 million, up 4.1%. We aim to achieve continuous expansion of the business across the globe, with chromatographs as the segment’s mainstay product, through measures including establishment of a company that sells supplies for chromatographs in China jointly with GL Sciences Inc., a company in which Shimadzu has invested, as well as reinforcement of sales efforts for strategic products including ultra fast liquid chromatograph (UFLC) and liquid chromatograph mass spectrometer (LCMS-IT-TOF).
Business Segment Information
We are committed to offering strong support to our customers in their businesses and research and development activities by supplying a wide range of products and services based on our cutting-edge technologies for a multitude of industrial and academic applications. Currently, our core businesses are Analytical and Measuring Instruments such as chromatographs widely used in research and development in the pharmaceutical and chemical industries, Medical Systems such as X-ray imaging systems, Aircraft Equipment such as flight control systems and air-conditioning equipment and Industrial Machinery including turbomolecular pumps for semiconductor manufacturing equipment and hydraulic equipment for forklifts.
Chromatographs
Carrier gas Detector Data system
Column
Column ovenInjection of sample
Basic mechanism of chromatograph
A chromatograph is an instrument that isolates chemical components of a sample in a column and analyzes those components and their quantity. There are two types of chromatographs: gas chromatographs and liquid chromatographs. Gas chromatographs heat samples and separate and analyze them in gas form while liquid chromatographs separate the components of samples and analyze them in liquid form at room temperature. They are commonly used for research and development and quality control in a wide range of industries such as pharmaceuticals, petrochemicals, food, and environmental analysis. Shimadzu enjoys the biggest market share for both gas and liquid chromatographs in Japan and is currently striving to expand sales globally in the U.S., Europe, China and India. In fiscal 2006, sales of chromatographs rose 7% from a year earlier to ¥57,300 million, of which domestic sales declined 3% to ¥26,100 million while overseas sales increased 16% to ¥31,100 million.
Sales by Geographical Segment (FY2006)
Europe 10.0%
North & South America 8.8%
Asia-Oceania 22.7%
Japan 58.4%
112,198
122,918131,643
138,453
14,40819,634 22,705 21,891
149,402
26,120
Sales and Operating Income
¥millions Net sales Operating income
0
30,000
Year ended March31
60,000
90,000
120,000
150,000
2003 2004 2005 2006 2007
for gas chromatograph
for liquid chromatograph
Shimadzu’s liquid chromatograph mass spectrometer plays an important role in research and development at a major Japanese beverage manufacturer
Column
Shimadzu Annual Report 200711
Shimadzu Annual Report 200712
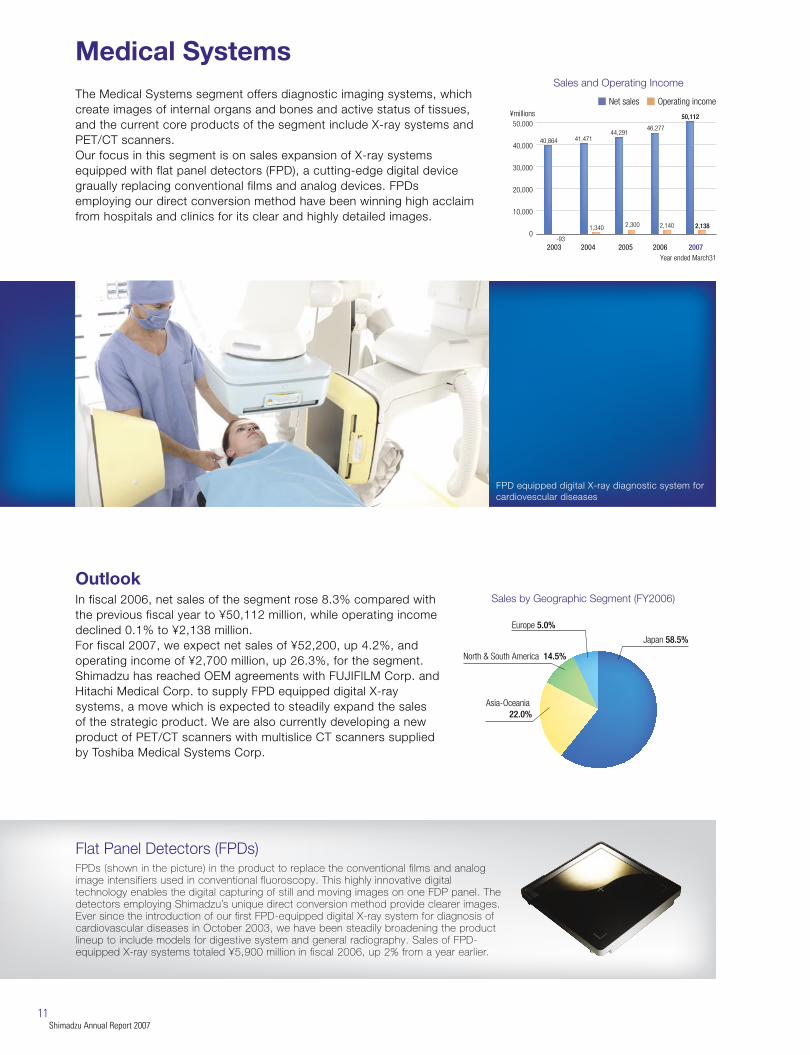
The Medical Systems segment offers diagnostic imaging systems, which create images of internal organs and bones and active status of tissues, and the current core products of the segment include X-ray systems and PET/CT scanners. Our focus in this segment is on sales expansion of X-ray systems equipped with flat panel detectors (FPD), a cutting-edge digital device graually replacing conventional films and analog devices. FPDs employing our direct conversion method have been winning high acclaim from hospitals and clinics for its clear and highly detailed images.
Net Sales and Operating Income
¥millions
Aircraft Equipment Sales by Geographic Segment (FY2006)
Industrial Machinery Sales by Geographic Segment (FY2006)
0
10,000
20,000
30,000
40,000
50,000
60,000
47,804 49,25152,306 52,460
29,41629,41627,67327,673
24,72924,729 25,78625,786
18,388
27,577 26,674
18,38821,57821,578
27,577 26,674
18,388
27,577 26,674
2,340 3,056 2,846 3,909
57,042
28,21928,219
28,82328,823
4,210
2003 2004 2005 2006
Other 0.7%
North & South America 7.7%Japan 91.6%
North & South America 10.8%
Europe 1.2%
Japan 68.2%
Asia-Oceania 19.7%
Flat Panel Detectors (FPDs)FPDs (shown in the picture) in the product to replace the conventional films and analog image intensifiers used in conventional fluoroscopy. This highly innovative digital technology enables the digital capturing of still and moving images on one FDP panel. The detectors employing Shimadzu’s unique direct conversion method provide clearer images. Ever since the introduction of our first FPD-equipped digital X-ray system for diagnosis of cardiovascular diseases in October 2003, we have been steadily broadening the product lineup to include models for digestive system and general radiography. Sales of FPD-equipped X-ray systems totaled ¥5,900 million in fiscal 2006, up 2% from a year earlier.
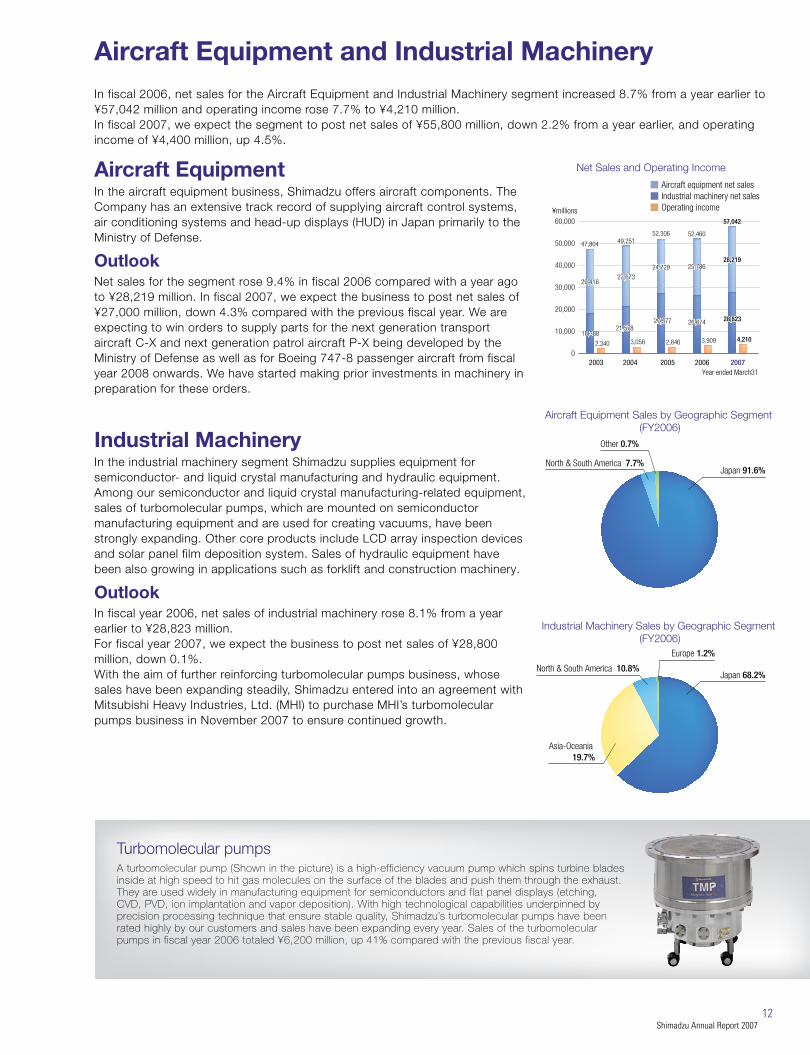
Turbomolecular pumpsA turbomolecular pump (Shown in the picture) is a high-efficiency vacuum pump which spins turbine blades inside at high speed to hit gas molecules on the surface of the blades and push them through the exhaust. They are used widely in manufacturing equipment for semiconductors and flat panel displays (etching, CVD, PVD, ion implantation and vapor deposition). With high technological capabilities underpinned by precision processing technique that ensure stable quality, Shimadzu’s turbomolecular pumps have been rated highly by our customers and sales have been expanding every year. Sales of the turbomolecular pumps in fiscal year 2006 totaled ¥6,200 million, up 41% compared with the previous fiscal year.
2007
¥millions
40,864 41,47144,291
46,277
-93
1,340 2,300 2,140
50,112
2,1380
10,000
20,000
30,000
40,000
50,000
2003 2004 2005 2006 2007
Sales and Operating IncomeIn fiscal 2006, net sales for the Aircraft Equipment and Industrial Machinery segment increased 8.7% from a year earlier to ¥57,042 million and operating income rose 7.7% to ¥4,210 million.In fiscal 2007, we expect the segment to post net sales of ¥55,800 million, down 2.2% from a year earlier, and operating income of ¥4,400 million, up 4.5%.
Aircraft EquipmentIn the aircraft equipment business, Shimadzu offers aircraft components. The Company has an extensive track record of supplying aircraft control systems, air conditioning systems and head-up displays (HUD) in Japan primarily to the Ministry of Defense.
OutlookNet sales for the segment rose 9.4% in fiscal 2006 compared with a year ago to ¥28,219 million. In fiscal 2007, we expect the business to post net sales of ¥27,000 million, down 4.3% compared with the previous fiscal year. We are expecting to win orders to supply parts for the next generation transport aircraft C-X and next generation patrol aircraft P-X being developed by the Ministry of Defense as well as for Boeing 747-8 passenger aircraft from fiscal year 2008 onwards. We have started making prior investments in machinery in preparation for these orders.
Industrial MachineryIn the industrial machinery segment Shimadzu supplies equipment for semiconductor- and liquid crystal manufacturing and hydraulic equipment. Among our semiconductor and liquid crystal manufacturing-related equipment, sales of turbomolecular pumps, which are mounted on semiconductor manufacturing equipment and are used for creating vacuums, have been strongly expanding. Other core products include LCD array inspection devices and solar panel film deposition system. Sales of hydraulic equipment have been also growing in applications such as forklift and construction machinery.
In fiscal year 2006, net sales of industrial machinery rose 8.1% from a year earlier to ¥28,823 million. For fiscal year 2007, we expect the business to post net sales of ¥28,800 million, down 0.1%.With the aim of further reinforcing turbomolecular pumps business, whose sales have been expanding steadily, Shimadzu entered into an agreement with Mitsubishi Heavy Industries, Ltd. (MHI) to purchase MHI’s turbomolecular pumps business in November 2007 to ensure continued growth.
Outlook
Europe 5.0%
Sales by Geographic Segment (FY2006)
North & South America 14.5%
Asia-Oceania 22.0%
Japan 58.5%
FPD equipped digital X-ray diagnostic system for cardiovescular diseases
Net sales Operating income
Aircraft equipment net salesIndustrial machinery net salesOperating income
OutlookIn fiscal 2006, net sales of the segment rose 8.3% compared with the previous fiscal year to ¥50,112 million, while operating income declined 0.1% to ¥2,138 million.For fiscal 2007, we expect net sales of ¥52,200, up 4.2%, and operating income of ¥2,700 million, up 26.3%, for the segment. Shimadzu has reached OEM agreements with FUJIFILM Corp. and Hitachi Medical Corp. to supply FPD equipped digital X-ray systems, a move which is expected to steadily expand the sales of the strategic product. We are also currently developing a new product of PET/CT scanners with multislice CT scanners supplied by Toshiba Medical Systems Corp.
Year ended March31
Year ended March31
Medical Systems Aircraft Equipment and Industrial Machinery
Shimadzu Annual Report 200711
Shimadzu Annual Report 200712
The Medical Systems segment offers diagnostic imaging systems, which create images of internal organs and bones and active status of tissues, and the current core products of the segment include X-ray systems and PET/CT scanners. Our focus in this segment is on sales expansion of X-ray systems equipped with flat panel detectors (FPD), a cutting-edge digital device graually replacing conventional films and analog devices. FPDs employing our direct conversion method have been winning high acclaim from hospitals and clinics for its clear and highly detailed images.
Net Sales and Operating Income
¥millions
Aircraft Equipment Sales by Geographic Segment (FY2006)
Industrial Machinery Sales by Geographic Segment (FY2006)
0
10,000
20,000
30,000
40,000
50,000
60,000
47,804 49,25152,306 52,460
29,41629,41627,67327,673
24,72924,729 25,78625,786
18,388
27,577 26,674
18,38821,57821,578
27,577 26,674
18,388
27,577 26,674
2,340 3,056 2,846 3,909
57,042
28,21928,219
28,82328,823
4,210
2003 2004 2005 2006
Other 0.7%
North & South America 7.7%Japan 91.6%
North & South America 10.8%
Europe 1.2%
Japan 68.2%
Asia-Oceania 19.7%
Flat Panel Detectors (FPDs)FPDs (shown in the picture) in the product to replace the conventional films and analog image intensifiers used in conventional fluoroscopy. This highly innovative digital technology enables the digital capturing of still and moving images on one FDP panel. The detectors employing Shimadzu’s unique direct conversion method provide clearer images. Ever since the introduction of our first FPD-equipped digital X-ray system for diagnosis of cardiovascular diseases in October 2003, we have been steadily broadening the product lineup to include models for digestive system and general radiography. Sales of FPD-equipped X-ray systems totaled ¥5,900 million in fiscal 2006, up 2% from a year earlier.
Turbomolecular pumpsA turbomolecular pump (Shown in the picture) is a high-efficiency vacuum pump which spins turbine blades inside at high speed to hit gas molecules on the surface of the blades and push them through the exhaust. They are used widely in manufacturing equipment for semiconductors and flat panel displays (etching, CVD, PVD, ion implantation and vapor deposition). With high technological capabilities underpinned by precision processing technique that ensure stable quality, Shimadzu’s turbomolecular pumps have been rated highly by our customers and sales have been expanding every year. Sales of the turbomolecular pumps in fiscal year 2006 totaled ¥6,200 million, up 41% compared with the previous fiscal year.
2007
¥millions
40,864 41,47144,291
46,277
-93
1,340 2,300 2,140
50,112
2,1380
10,000
20,000
30,000
40,000
50,000
2003 2004 2005 2006 2007
Sales and Operating IncomeIn fiscal 2006, net sales for the Aircraft Equipment and Industrial Machinery segment increased 8.7% from a year earlier to ¥57,042 million and operating income rose 7.7% to ¥4,210 million.In fiscal 2007, we expect the segment to post net sales of ¥55,800 million, down 2.2% from a year earlier, and operating income of ¥4,400 million, up 4.5%.
Aircraft EquipmentIn the aircraft equipment business, Shimadzu offers aircraft components. The Company has an extensive track record of supplying aircraft control systems, air conditioning systems and head-up displays (HUD) in Japan primarily to the Ministry of Defense.
OutlookNet sales for the segment rose 9.4% in fiscal 2006 compared with a year ago to ¥28,219 million. In fiscal 2007, we expect the business to post net sales of ¥27,000 million, down 4.3% compared with the previous fiscal year. We are expecting to win orders to supply parts for the next generation transport aircraft C-X and next generation patrol aircraft P-X being developed by the Ministry of Defense as well as for Boeing 747-8 passenger aircraft from fiscal year 2008 onwards. We have started making prior investments in machinery in preparation for these orders.
Industrial MachineryIn the industrial machinery segment Shimadzu supplies equipment for semiconductor- and liquid crystal manufacturing and hydraulic equipment. Among our semiconductor and liquid crystal manufacturing-related equipment, sales of turbomolecular pumps, which are mounted on semiconductor manufacturing equipment and are used for creating vacuums, have been strongly expanding. Other core products include LCD array inspection devices and solar panel film deposition system. Sales of hydraulic equipment have been also growing in applications such as forklift and construction machinery.
In fiscal year 2006, net sales of industrial machinery rose 8.1% from a year earlier to ¥28,823 million. For fiscal year 2007, we expect the business to post net sales of ¥28,800 million, down 0.1%.With the aim of further reinforcing turbomolecular pumps business, whose sales have been expanding steadily, Shimadzu entered into an agreement with Mitsubishi Heavy Industries, Ltd. (MHI) to purchase MHI’s turbomolecular pumps business in November 2007 to ensure continued growth.
Outlook
Europe 5.0%
Sales by Geographic Segment (FY2006)
North & South America 14.5%
Asia-Oceania 22.0%
Japan 58.5%
FPD equipped digital X-ray diagnostic system for cardiovescular diseases
Net sales Operating income
Aircraft equipment net salesIndustrial machinery net salesOperating income
OutlookIn fiscal 2006, net sales of the segment rose 8.3% compared with the previous fiscal year to ¥50,112 million, while operating income declined 0.1% to ¥2,138 million.For fiscal 2007, we expect net sales of ¥52,200, up 4.2%, and operating income of ¥2,700 million, up 26.3%, for the segment. Shimadzu has reached OEM agreements with FUJIFILM Corp. and Hitachi Medical Corp. to supply FPD equipped digital X-ray systems, a move which is expected to steadily expand the sales of the strategic product. We are also currently developing a new product of PET/CT scanners with multislice CT scanners supplied by Toshiba Medical Systems Corp.
Year ended March31
Year ended March31
Medical Systems Aircraft Equipment and Industrial Machinery

Shimadzu Annual Report 200713
Shimadzu Annual Report 200714
Environmental Conservation Activities
Board of Directors
Shimadzu has been actively implementing environmental conservation initiatives across its business operations and providing support for academic projects. In keeping with our management principle of “Realizing the Well-being of Mankind and the Earth,” the Shimadzu Group is committed to making steady efforts to tackle these important
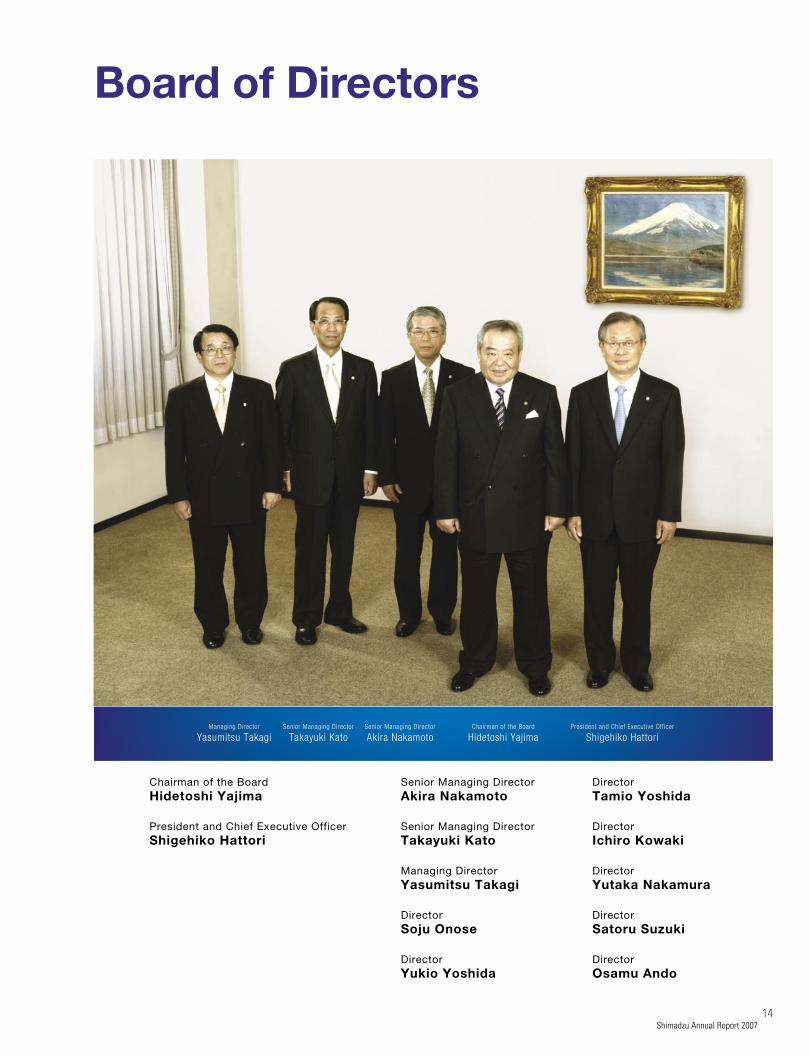
Senior Managing DirectorAkira Nakamoto
Chairman of the Board Hidetoshi Yajima
President and Chief Executive OfficerShigehiko Hattori
Senior Managing DirectorTakayuki Kato
Managing DirectorYasumitsu Takagi
DirectorSoju Onose
DirectorYukio Yoshida
DirectorIchiro Kowaki
DirectorYutaka Nakamura
DirectorSatoru Suzuki
DirectorOsamu Ando
Managing Director
Yasumitsu TakagiSenior Managing Director
Takayuki KatoSenior Managing Director
Akira NakamotoChairman of the Board
Hidetoshi YajimaPresident and Chief Executive Officer
Shigehiko Hattori
DirectorTamio Yoshida
Environmental Management SystemsMajority of Shimadzu’s domestic plants are ISO-14001 certified and implementing an integrated environmental management system. Shimadzu also works hard to reduce environmental burden in operating activities on segment levels, such as reducing energy consumption and CO2 emissions, reducing and recycling waste, eliminating the use of substances that damage the ozone layer and decreasing the amount of packaging used.
Support for Academic ProjectsSince 1996, Shimadzu has been continuously supporting the environmental management project at the United Nations University. The project is aimed at monitoring environmental pollution and accumulating environmental data in Asia with 11 Asian countries participating in the fourth phase of the project, “Environmental Monitoring and Governance in the East Asian Hydrosphere – Monitoring of Persistent Organic Compounds in Asia,” which started in 2005. We have been supporting the project in various forms including provision of funds, lending of analysis equipment, provision of analysis method training. We are committed in our support to ensure the success of the projects.
Promotion of GreeningWith the aim of creating a plant surrounded by green spaces, Shimadzu has been actively increasing planted areas at Sanjo Works in Kyoto, which plays the central role in our production. The new plant building for analytical and measuring instruments, which started operation in 2006, is equipped with a solar power system that supplies part of the electric power consumed at the plant. These initiatives are part of the plant construction and relocation plan being implemented at the Sanjo Works and we will promote environment-friendly, clean plant operation in consideration of the global environment. We are fully committed to further promoting activities that would help prevent global warming, the acceleration of which is of great concern.
Shimadzu Annual Report 200713
Shimadzu Annual Report 200714
Environmental Conservation Activities
Board of Directors
Shimadzu has been actively implementing environmental conservation initiatives across its business operations and providing support for academic projects. In keeping with our management principle of “Realizing the Well-being of Mankind and the Earth,” the Shimadzu Group is committed to making steady efforts to tackle these important
Senior Managing DirectorAkira Nakamoto
Chairman of the Board Hidetoshi Yajima
President and Chief Executive OfficerShigehiko Hattori
Senior Managing DirectorTakayuki Kato
Managing DirectorYasumitsu Takagi
DirectorSoju Onose
DirectorYukio Yoshida
DirectorIchiro Kowaki
DirectorYutaka Nakamura
DirectorSatoru Suzuki
DirectorOsamu Ando
Managing Director
Yasumitsu TakagiSenior Managing Director
Takayuki KatoSenior Managing Director
Akira NakamotoChairman of the Board
Hidetoshi YajimaPresident and Chief Executive Officer
Shigehiko Hattori
DirectorTamio Yoshida
Environmental Management SystemsMajority of Shimadzu’s domestic plants are ISO-14001 certified and implementing an integrated environmental management system. Shimadzu also works hard to reduce environmental burden in operating activities on segment levels, such as reducing energy consumption and CO2 emissions, reducing and recycling waste, eliminating the use of substances that damage the ozone layer and decreasing the amount of packaging used.
Support for Academic ProjectsSince 1996, Shimadzu has been continuously supporting the environmental management project at the United Nations University. The project is aimed at monitoring environmental pollution and accumulating environmental data in Asia with 11 Asian countries participating in the fourth phase of the project, “Environmental Monitoring and Governance in the East Asian Hydrosphere – Monitoring of Persistent Organic Compounds in Asia,” which started in 2005. We have been supporting the project in various forms including provision of funds, lending of analysis equipment, provision of analysis method training. We are committed in our support to ensure the success of the projects.
Promotion of GreeningWith the aim of creating a plant surrounded by green spaces, Shimadzu has been actively increasing planted areas at Sanjo Works in Kyoto, which plays the central role in our production. The new plant building for analytical and measuring instruments, which started operation in 2006, is equipped with a solar power system that supplies part of the electric power consumed at the plant. These initiatives are part of the plant construction and relocation plan being implemented at the Sanjo Works and we will promote environment-friendly, clean plant operation in consideration of the global environment. We are fully committed to further promoting activities that would help prevent global warming, the acceleration of which is of great concern.


16
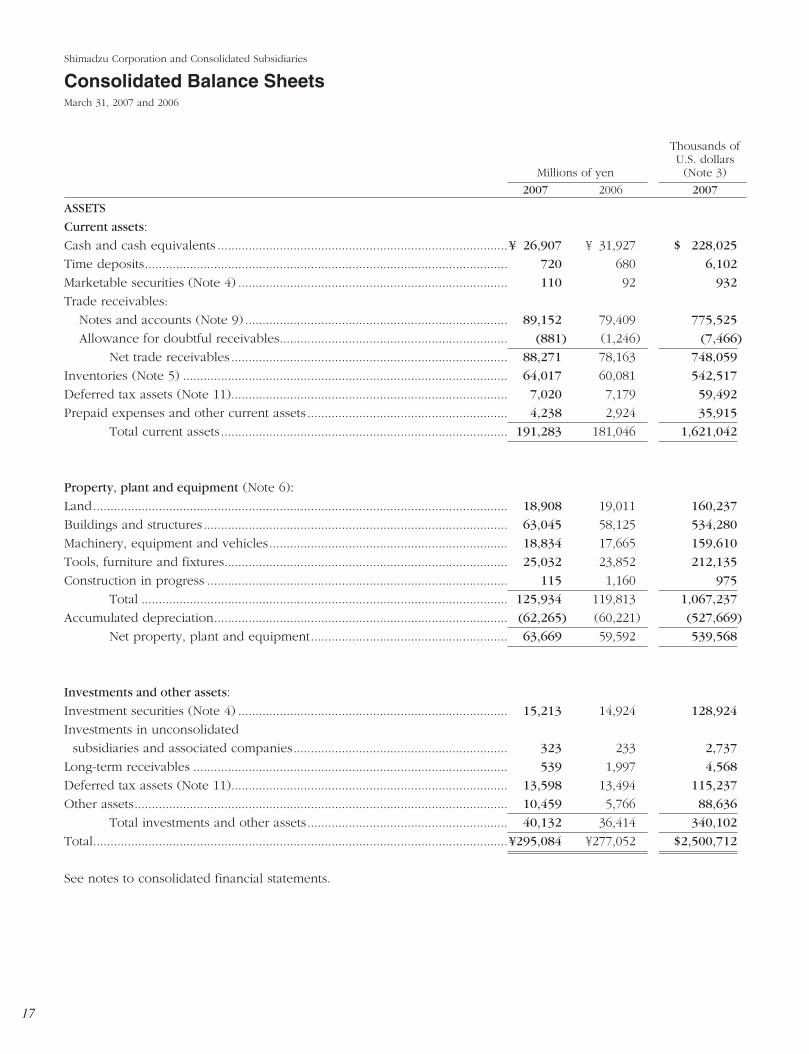
Consolidated Balance Sheets ......................................17
Consolidated Statements of Income...........................19
Consolidated Statements of Changes in Equity ..........20
Consolidated Statements of Cash Flows.....................22
Notes to Consolidated Financial Statements ..............24
Independent Auditor's Report....................................37
Financial Section
17
Thousands ofU.S. dollars
Millions of yen (Note 3)
2007 2006 2007
ASSETS
Current assets:
Cash and cash equivalents ....................................................................................¥ 26,907 ¥ 31,927 $ 228,025
Time deposits......................................................................................................... 720 680 6,102
Marketable securities (Note 4) .............................................................................. 110 92 932
Trade receivables:
Notes and accounts (Note 9) ............................................................................ 89,152 79,409 775,525
Allowance for doubtful receivables.................................................................. (881) (1,246) (7,466)
Net trade receivables ................................................................................ 88,271 78,163 748,059
Inventories (Note 5) .............................................................................................. 64,017 60,081 542,517
Deferred tax assets (Note 11)................................................................................ 7,020 7,179 59,492
Prepaid expenses and other current assets .......................................................... 4,238 2,924 35,915
Total current assets................................................................................... 191,283 181,046 1,621,042
Property, plant and equipment (Note 6):
Land........................................................................................................................ 18,908 19,011 160,237
Buildings and structures ........................................................................................ 63,045 58,125 534,280
Machinery, equipment and vehicles..................................................................... 18,834 17,665 159,610
Tools, furniture and fixtures.................................................................................. 25,032 23,852 212,135
Construction in progress ....................................................................................... 115 1,160 975
Total .......................................................................................................... 125,934 119,813 1,067,237
Accumulated depreciation..................................................................................... (62,265) (60,221) (527,669)
Net property, plant and equipment......................................................... 63,669 59,592 539,568
Investments and other assets:
Investment securities (Note 4) .............................................................................. 15,213 14,924 128,924
Investments in unconsolidated
subsidiaries and associated companies.............................................................. 323 233 2,737
Long-term receivables ........................................................................................... 539 1,997 4,568
Deferred tax assets (Note 11)................................................................................ 13,598 13,494 115,237
Other assets............................................................................................................ 10,459 5,766 88,636
Total investments and other assets.......................................................... 40,132 36,414 340,102
Total........................................................................................................................¥295,084 ¥277,052 $2,500,712
See notes to consolidated financial statements.
Shimadzu Corporation and Consolidated Subsidiaries
Consolidated Balance SheetsMarch 31, 2007 and 2006
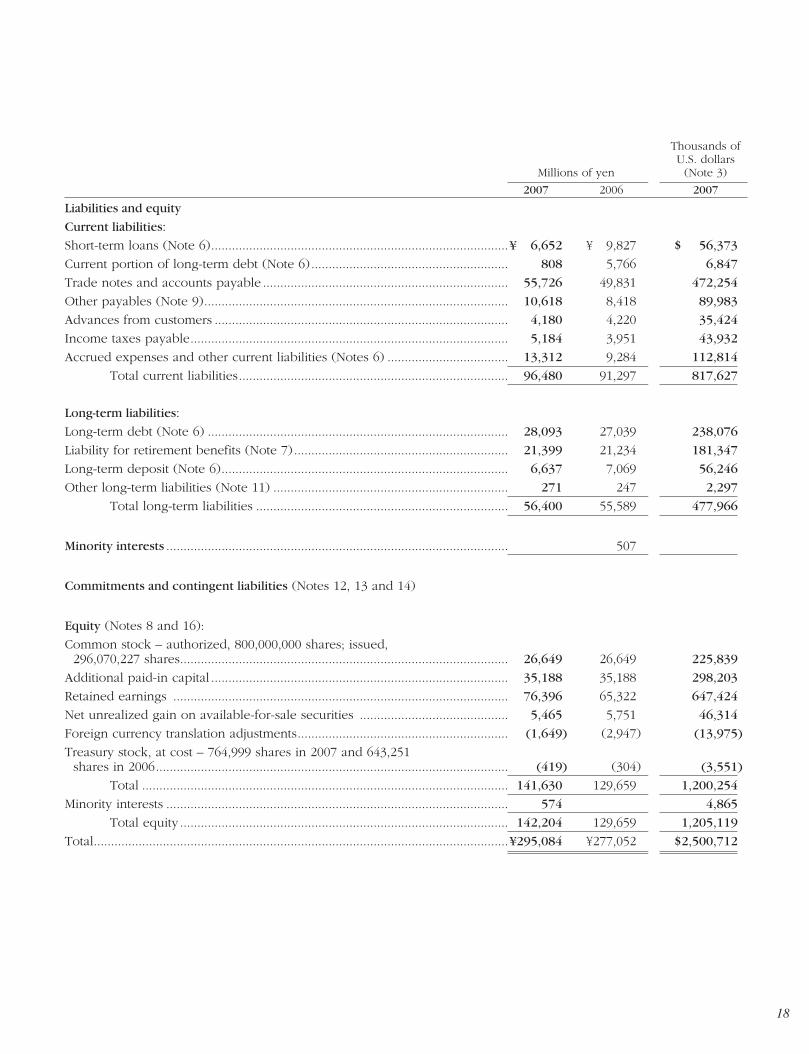
18
Thousands ofU.S. dollars
Millions of yen (Note 3)
2007 2006 2007
Liabilities and equity
Current liabilities:
Short-term loans (Note 6)......................................................................................¥ 6,652 ¥ 9,827 $ 56,373
Current portion of long-term debt (Note 6) ......................................................... 808 5,766 6,847
Trade notes and accounts payable ....................................................................... 55,726 49,831 472,254
Other payables (Note 9)........................................................................................ 10,618 8,418 89,983
Advances from customers ..................................................................................... 4,180 4,220 35,424
Income taxes payable............................................................................................ 5,184 3,951 43,932
Accrued expenses and other current liabilities (Notes 6) ................................... 13,312 9,284 112,814
Total current liabilities.............................................................................. 96,480 91,297 817,627
Long-term liabilities:
Long-term debt (Note 6) ....................................................................................... 28,093 27,039 238,076
Liability for retirement benefits (Note 7) .............................................................. 21,399 21,234 181,347
Long-term deposit (Note 6)................................................................................... 6,637 7,069 56,246
Other long-term liabilities (Note 11) .................................................................... 271 247 2,297
Total long-term liabilities ......................................................................... 56,400 55,589 477,966
Minority interests ................................................................................................... 507
Commitments and contingent liabilities (Notes 12, 13 and 14)
Equity (Notes 8 and 16):
Common stock – authorized, 800,000,000 shares; issued, 296,070,227 shares............................................................................................... 26,649 26,649 225,839
Additional paid-in capital ...................................................................................... 35,188 35,188 298,203
Retained earnings ................................................................................................. 76,396 65,322 647,424
Net unrealized gain on available-for-sale securities ........................................... 5,465 5,751 46,314
Foreign currency translation adjustments............................................................. (1,649) (2,947) (13,975)
Treasury stock, at cost – 764,999 shares in 2007 and 643,251shares in 2006...................................................................................................... (419) (304) (3,551)
Total .......................................................................................................... 141,630 129,659 1,200,254
Minority interests ................................................................................................... 574 4,865
Total equity ............................................................................................... 142,204 129,659 1,205,119
Total........................................................................................................................¥295,084 ¥277,052 $2,500,712
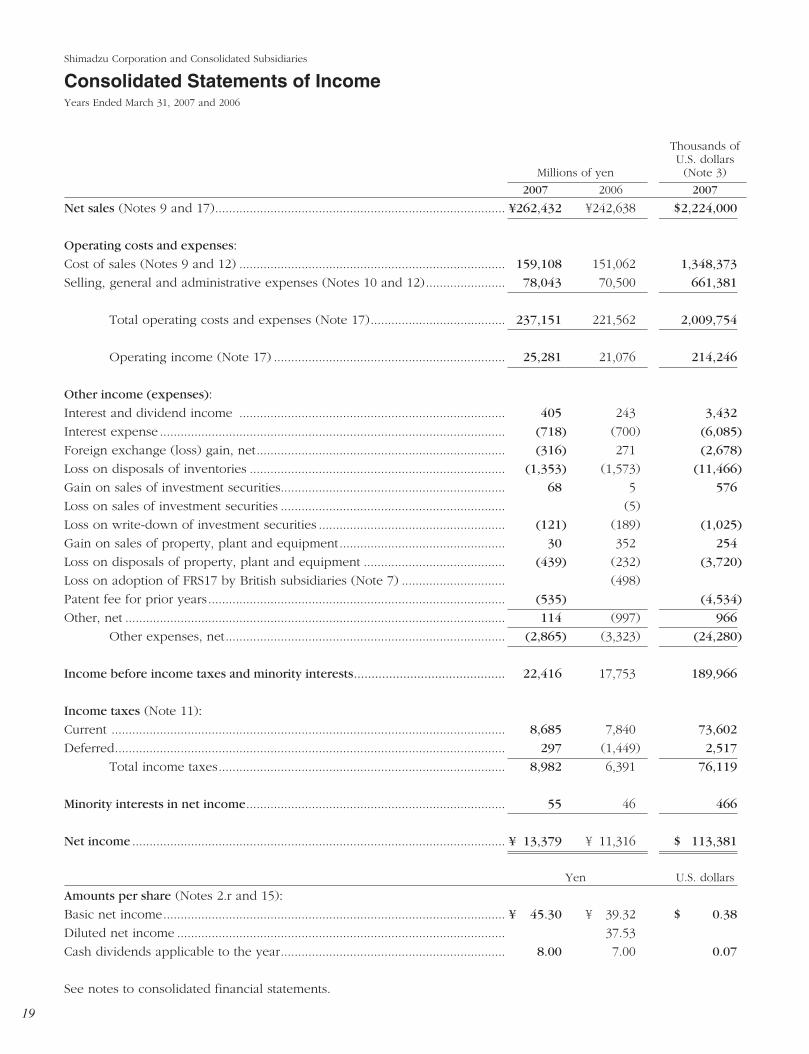
19
Thousands ofU.S. dollars
Millions of yen (Note 3)
2007 2006 2007
Net sales (Notes 9 and 17).................................................................................... ¥262,432 ¥242,638 $2,224,000
Operating costs and expenses:
Cost of sales (Notes 9 and 12) ............................................................................. 159,108 151,062 1,348,373
Selling, general and administrative expenses (Notes 10 and 12)....................... 78,043 70,500 661,381
Total operating costs and expenses (Note 17)....................................... 237,151 221,562 2,009,754
Operating income (Note 17) ................................................................... 25,281 21,076 214,246
Other income (expenses):
Interest and dividend income ............................................................................. 405 243 3,432
Interest expense .................................................................................................... (718) (700) (6,085)
Foreign exchange (loss) gain, net........................................................................ (316) 271 (2,678)
Loss on disposals of inventories .......................................................................... (1,353) (1,573) (11,466)
Gain on sales of investment securities................................................................. 68 5 576
Loss on sales of investment securities ................................................................. (5)
Loss on write-down of investment securities ...................................................... (121) (189) (1,025)
Gain on sales of property, plant and equipment................................................ 30 352 254
Loss on disposals of property, plant and equipment ......................................... (439) (232) (3,720)
Loss on adoption of FRS17 by British subsidiaries (Note 7) .............................. (498)
Patent fee for prior years...................................................................................... (535) (4,534)
Other, net .............................................................................................................. 114 (997) 966
Other expenses, net................................................................................. (2,865) (3,323) (24,280)
Income before income taxes and minority interests........................................... 22,416 17,753 189,966
Income taxes (Note 11):
Current .................................................................................................................. 8,685 7,840 73,602
Deferred................................................................................................................. 297 (1,449) 2,517
Total income taxes................................................................................... 8,982 6,391 76,119
Minority interests in net income........................................................................... 55 46 466
Net income ............................................................................................................ ¥ 13,379 ¥ 11,316 $ 113,381
Yen U.S. dollars
Amounts per share (Notes 2.r and 15):
Basic net income................................................................................................... ¥ 45.30 ¥ 39.32 $ 0.38
Diluted net income ............................................................................................... 37.53
Cash dividends applicable to the year................................................................. 8.00 7.00 0.07
See notes to consolidated financial statements.
Shimadzu Corporation and Consolidated Subsidiaries
Consolidated Statements of IncomeYears Ended March 31, 2007 and 2006
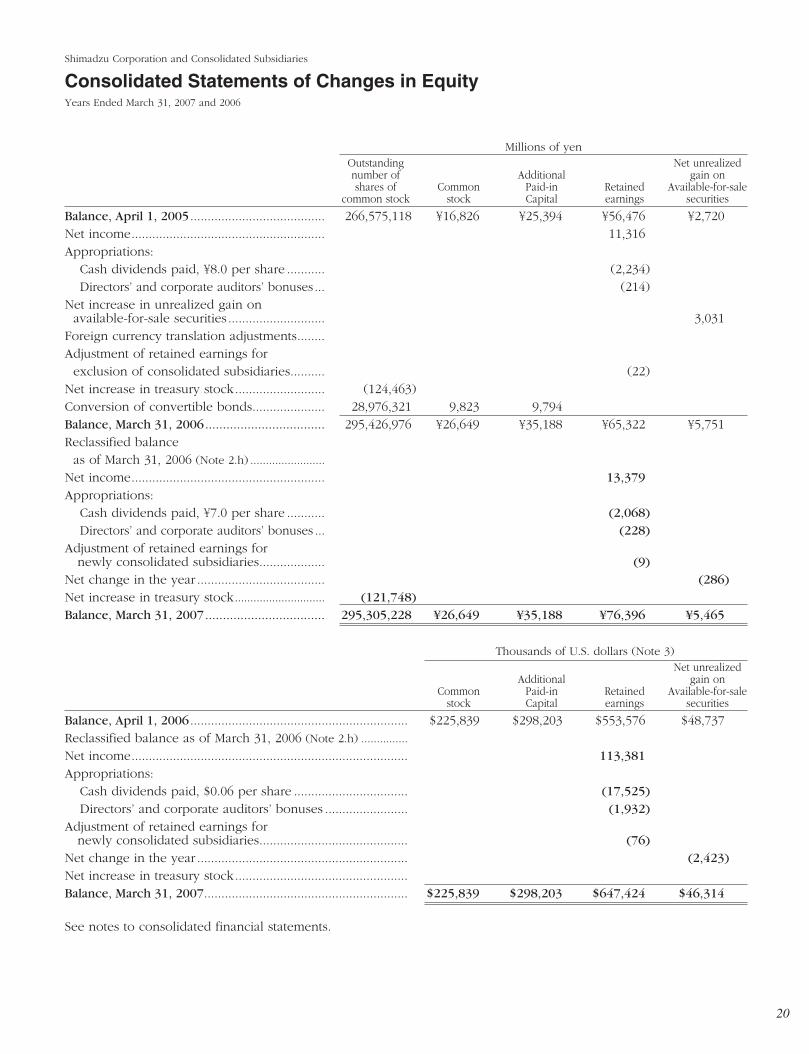
20
Millions of yenOutstanding Net unrealizednumber of Additional gain onshares of Common Paid-in Retained Available-for-sale
common stock stock Capital earnings securities
Balance, April 1, 2005 ....................................... 266,575,118 ¥16,826 ¥25,394 ¥56,476 ¥2,720Net income........................................................ 11,316Appropriations:
Cash dividends paid, ¥8.0 per share ........... (2,234)Directors’ and corporate auditors’ bonuses... (214)
Net increase in unrealized gain on available-for-sale securities ............................ 3,031
Foreign currency translation adjustments........Adjustment of retained earnings for exclusion of consolidated subsidiaries.......... (22)
Net increase in treasury stock.......................... (124,463)Conversion of convertible bonds..................... 28,976,321 9,823 9,794Balance, March 31, 2006.................................. 295,426,976 ¥26,649 ¥35,188 ¥65,322 ¥5,751Reclassified balance as of March 31, 2006 (Note 2.h) ........................
Net income........................................................ 13,379Appropriations:
Cash dividends paid, ¥7.0 per share ........... (2,068)Directors’ and corporate auditors’ bonuses ... (228)
Adjustment of retained earnings fornewly consolidated subsidiaries................... (9)
Net change in the year ..................................... (286)Net increase in treasury stock............................. (121,748)Balance, March 31, 2007.................................. 295,305,228 ¥26,649 ¥35,188 ¥76,396 ¥5,465
Thousands of U.S. dollars (Note 3)Net unrealized
Additional gain onCommon Paid-in Retained Available-for-sale
stock Capital earnings securities
Balance, April 1, 2006 ............................................................... $225,839 $298,203 $553,576 $48,737Reclassified balance as of March 31, 2006 (Note 2.h) ...............
Net income................................................................................ 113,381Appropriations:
Cash dividends paid, $0.06 per share ................................. (17,525)Directors’ and corporate auditors’ bonuses ........................ (1,932)
Adjustment of retained earnings fornewly consolidated subsidiaries........................................... (76)
Net change in the year ............................................................. (2,423)Net increase in treasury stock..................................................Balance, March 31, 2007........................................................... $225,839 $298,203 $647,424 $46,314
See notes to consolidated financial statements.
Shimadzu Corporation and Consolidated Subsidiaries
Consolidated Statements of Changes in EquityYears Ended March 31, 2007 and 2006
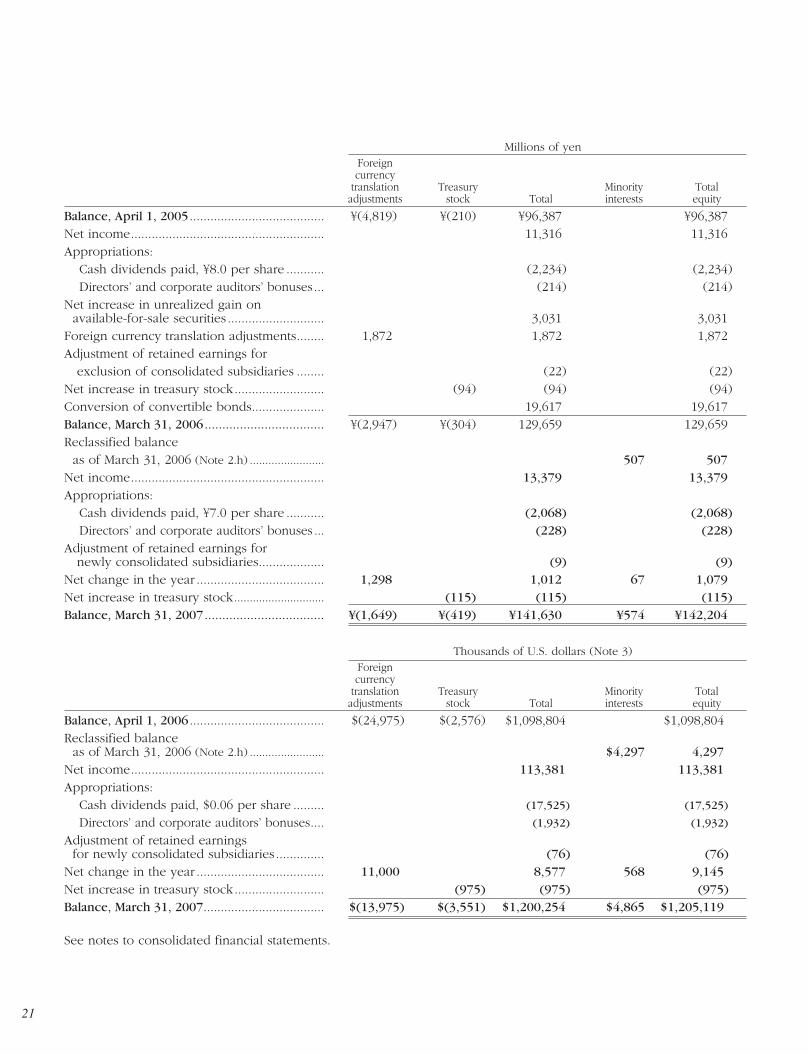
21
Millions of yenForeigncurrency
translation Treasury Minority Totaladjustments stock Total interests equity
Balance, April 1, 2005 ....................................... ¥(4,819) ¥(210) ¥96,387 ¥96,387Net income........................................................ 11,316 11,316Appropriations:
Cash dividends paid, ¥8.0 per share ........... (2,234) (2,234)Directors’ and corporate auditors’ bonuses... (214) (214)
Net increase in unrealized gain on available-for-sale securities ............................ 3,031 3,031
Foreign currency translation adjustments........ 1,872 1,872 1,872Adjustment of retained earnings for
exclusion of consolidated subsidiaries ........ (22) (22)Net increase in treasury stock.......................... (94) (94) (94)Conversion of convertible bonds..................... 19,617 19,617Balance, March 31, 2006.................................. ¥(2,947) ¥(304) 129,659 129,659Reclassified balance as of March 31, 2006 (Note 2.h) ........................ 507 507
Net income........................................................ 13,379 13,379Appropriations:
Cash dividends paid, ¥7.0 per share ........... (2,068) (2,068)Directors’ and corporate auditors’ bonuses ... (228) (228)
Adjustment of retained earnings fornewly consolidated subsidiaries................... (9) (9)
Net change in the year ..................................... 1,298 1,012 67 1,079Net increase in treasury stock............................. (115) (115) (115)Balance, March 31, 2007.................................. ¥(1,649) ¥(419) ¥141,630 ¥574 ¥142,204
Thousands of U.S. dollars (Note 3)Foreigncurrency
translation Treasury Minority Totaladjustments stock Total interests equity
Balance, April 1, 2006 ....................................... $(24,975) $(2,576) $1,098,804 $1,098,804Reclassified balanceas of March 31, 2006 (Note 2.h) ........................ $4,297 4,297
Net income........................................................ 113,381 113,381Appropriations:
Cash dividends paid, $0.06 per share ......... (17,525) (17,525)
Directors’ and corporate auditors’ bonuses.... (1,932) (1,932)
Adjustment of retained earnings for newly consolidated subsidiaries .............. (76) (76)
Net change in the year ..................................... 11,000 8,577 568 9,145Net increase in treasury stock.......................... (975) (975) (975)Balance, March 31, 2007................................... $(13,975) $(3,551) $1,200,254 $4,865 $1,205,119
See notes to consolidated financial statements.
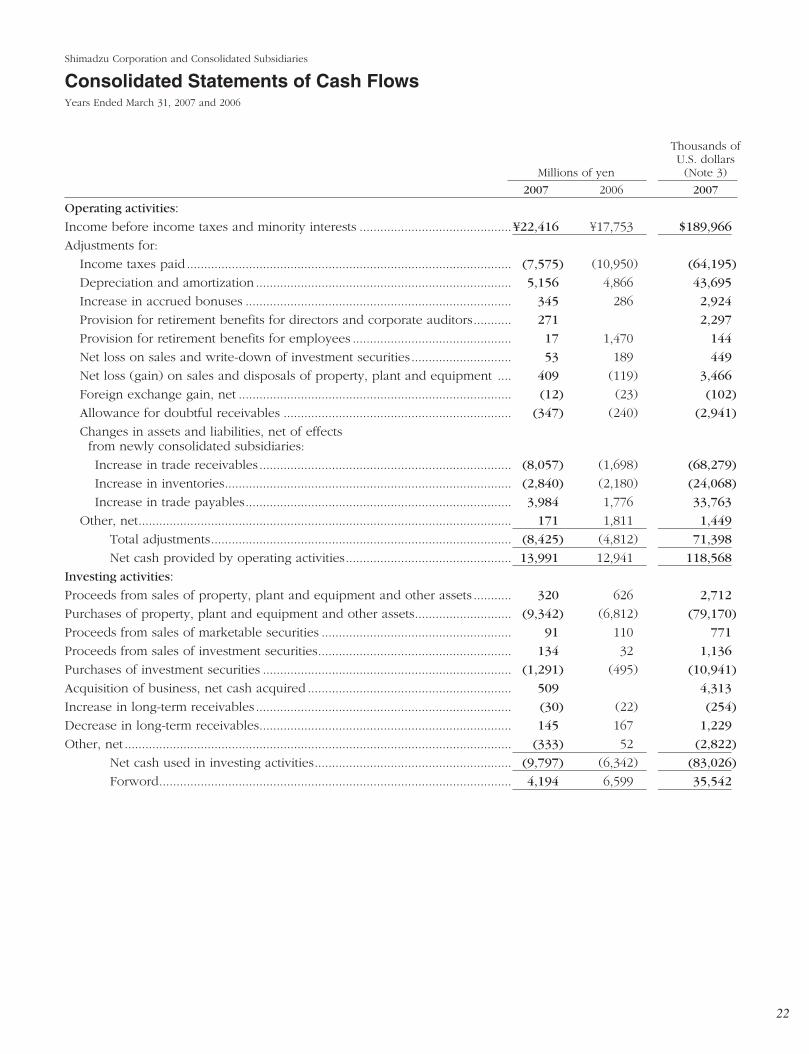
22
Thousands ofU.S. dollars
Millions of yen (Note 3)
2007 2006 2007
Operating activities:
Income before income taxes and minority interests ............................................¥22,416 ¥17,753 $189,966
Adjustments for:
Income taxes paid .............................................................................................. (7,575) (10,950) (64,195)
Depreciation and amortization .......................................................................... 5,156 4,866 43,695
Increase in accrued bonuses ............................................................................. 345 286 2,924
Provision for retirement benefits for directors and corporate auditors........... 271 2,297
Provision for retirement benefits for employees .............................................. 17 1,470 144
Net loss on sales and write-down of investment securities............................. 53 189 449
Net loss (gain) on sales and disposals of property, plant and equipment .... 409 (119) 3,466
Foreign exchange gain, net ............................................................................... (12) (23) (102)
Allowance for doubtful receivables .................................................................. (347) (240) (2,941)
Changes in assets and liabilities, net of effects from newly consolidated subsidiaries:
Increase in trade receivables ......................................................................... (8,057) (1,698) (68,279)
Increase in inventories................................................................................... (2,840) (2,180) (24,068)
Increase in trade payables............................................................................. 3,984 1,776 33,763
Other, net............................................................................................................ 171 1,811 1,449
Total adjustments....................................................................................... (8,425) (4,812) 71,398
Net cash provided by operating activities................................................ 13,991 12,941 118,568
Investing activities:
Proceeds from sales of property, plant and equipment and other assets ........... 320 626 2,712
Purchases of property, plant and equipment and other assets............................ (9,342) (6,812) (79,170)
Proceeds from sales of marketable securities ....................................................... 91 110 771
Proceeds from sales of investment securities........................................................ 134 32 1,136
Purchases of investment securities ........................................................................ (1,291) (495) (10,941)
Acquisition of business, net cash acquired ........................................................... 509 4,313
Increase in long-term receivables .......................................................................... (30) (22) (254)
Decrease in long-term receivables......................................................................... 145 167 1,229
Other, net ................................................................................................................ (333) 52 (2,822)
Net cash used in investing activities......................................................... (9,797) (6,342) (83,026)
Forword...................................................................................................... 4,194 6,599 35,542
Shimadzu Corporation and Consolidated Subsidiaries
Consolidated Statements of Cash FlowsYears Ended March 31, 2007 and 2006
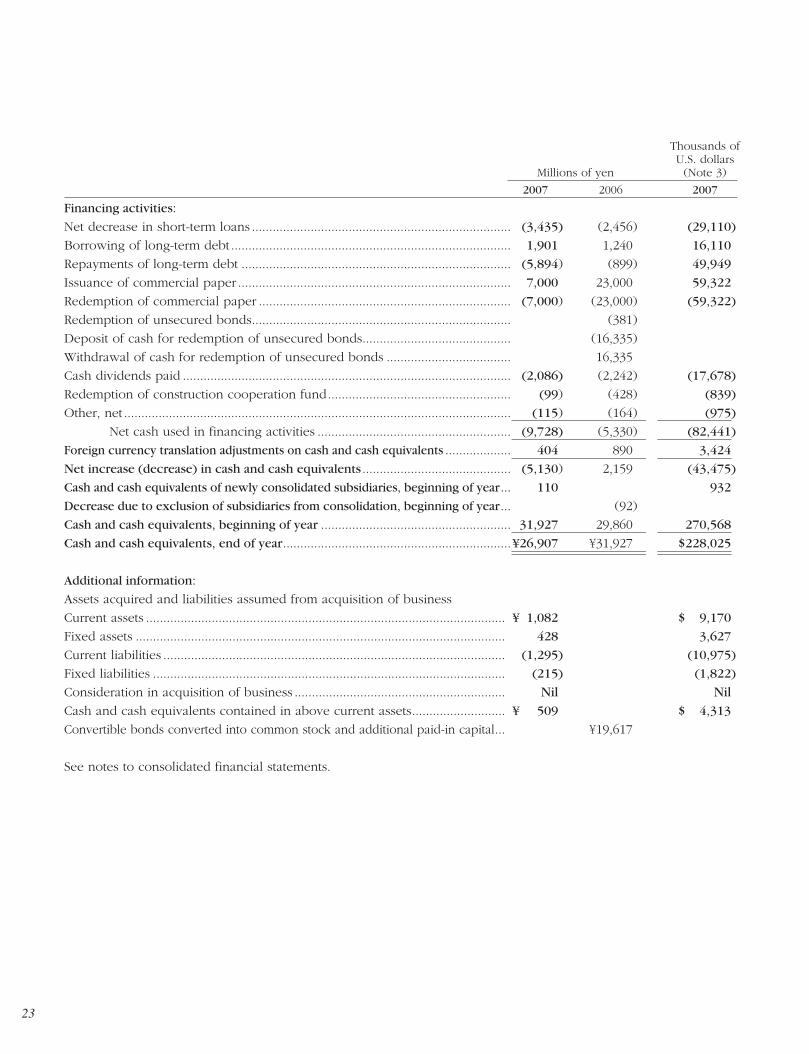
23
Thousands ofU.S. dollars
Millions of yen (Note 3)
2007 2006 2007
Financing activities:
Net decrease in short-term loans ........................................................................... (3,435) (2,456) (29,110)
Borrowing of long-term debt ................................................................................. 1,901 1,240 16,110
Repayments of long-term debt .............................................................................. (5,894) (899) 49,949
Issuance of commercial paper ............................................................................... 7,000 23,000 59,322
Redemption of commercial paper ......................................................................... (7,000) (23,000) (59,322)
Redemption of unsecured bonds........................................................................... (381)
Deposit of cash for redemption of unsecured bonds........................................... (16,335)
Withdrawal of cash for redemption of unsecured bonds .................................... 16,335
Cash dividends paid ............................................................................................... (2,086) (2,242) (17,678)
Redemption of construction cooperation fund..................................................... (99) (428) (839)
Other, net ................................................................................................................ (115) (164) (975)
Net cash used in financing activities ........................................................ (9,728) (5,330) (82,441)
Foreign currency translation adjustments on cash and cash equivalents ................... 404 890 3,424
Net increase (decrease) in cash and cash equivalents ........................................... (5,130) 2,159 (43,475)
Cash and cash equivalents of newly consolidated subsidiaries, beginning of year... 110 932
Decrease due to exclusion of subsidiaries from consolidation, beginning of year... (92)
Cash and cash equivalents, beginning of year ....................................................... 31,927 29,860 270,568
Cash and cash equivalents, end of year..................................................................¥26,907 ¥31,927 $228,025
Additional information:
Assets acquired and liabilities assumed from acquisition of business
Current assets ........................................................................................................ ¥ 1,082 $ 9,170
Fixed assets ........................................................................................................... 428 3,627
Current liabilities ................................................................................................... (1,295) (10,975)
Fixed liabilities ...................................................................................................... (215) (1,822)
Consideration in acquisition of business ............................................................. Nil NilCash and cash equivalents contained in above current assets........................... ¥ 509 $ 4,313
Convertible bonds converted into common stock and additional paid-in capital... ¥19,617
See notes to consolidated financial statements.
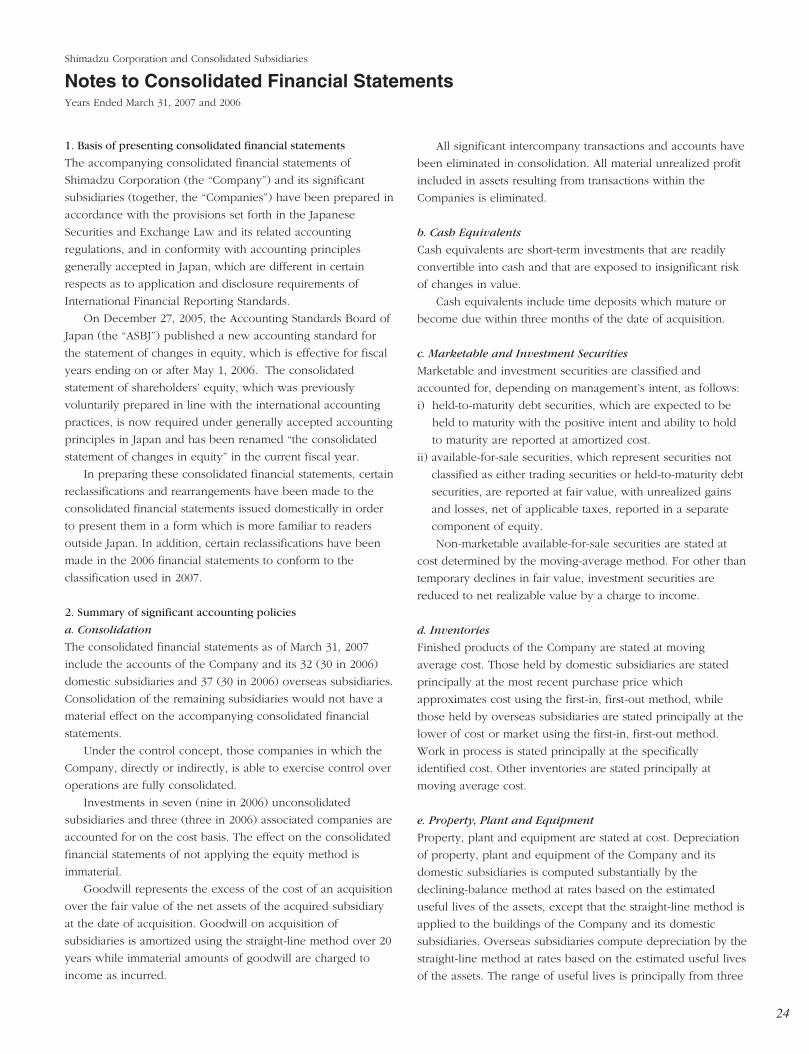
24
1. Basis of presenting consolidated financial statements
The accompanying consolidated financial statements of
Shimadzu Corporation (the “Company”) and its significant
subsidiaries (together, the “Companies”) have been prepared in
accordance with the provisions set forth in the Japanese
Securities and Exchange Law and its related accounting
regulations, and in conformity with accounting principles
generally accepted in Japan, which are different in certain
respects as to application and disclosure requirements of
International Financial Reporting Standards.
On December 27, 2005, the Accounting Standards Board of
Japan (the “ASBJ”) published a new accounting standard for
the statement of changes in equity, which is effective for fiscal
years ending on or after May 1, 2006. The consolidated
statement of shareholders’ equity, which was previously
voluntarily prepared in line with the international accounting
practices, is now required under generally accepted accounting
principles in Japan and has been renamed “the consolidated
statement of changes in equity” in the current fiscal year.
In preparing these consolidated financial statements, certain
reclassifications and rearrangements have been made to the
consolidated financial statements issued domestically in order
to present them in a form which is more familiar to readers
outside Japan. In addition, certain reclassifications have been
made in the 2006 financial statements to conform to the
classification used in 2007.
2. Summary of significant accounting policies
a. Consolidation
The consolidated financial statements as of March 31, 2007
include the accounts of the Company and its 32 (30 in 2006)
domestic subsidiaries and 37 (30 in 2006) overseas subsidiaries.
Consolidation of the remaining subsidiaries would not have a
material effect on the accompanying consolidated financial
statements.
Under the control concept, those companies in which the
Company, directly or indirectly, is able to exercise control over
operations are fully consolidated.
Investments in seven (nine in 2006) unconsolidated
subsidiaries and three (three in 2006) associated companies are
accounted for on the cost basis. The effect on the consolidated
financial statements of not applying the equity method is
immaterial.
Goodwill represents the excess of the cost of an acquisition
over the fair value of the net assets of the acquired subsidiary
at the date of acquisition. Goodwill on acquisition of
subsidiaries is amortized using the straight-line method over 20
years while immaterial amounts of goodwill are charged to
income as incurred.
All significant intercompany transactions and accounts have
been eliminated in consolidation. All material unrealized profit
included in assets resulting from transactions within the
Companies is eliminated.
b. Cash Equivalents
Cash equivalents are short-term investments that are readily
convertible into cash and that are exposed to insignificant risk
of changes in value.
Cash equivalents include time deposits which mature or
become due within three months of the date of acquisition.
c. Marketable and Investment Securities
Marketable and investment securities are classified and
accounted for, depending on management’s intent, as follows:
i) held-to-maturity debt securities, which are expected to be
held to maturity with the positive intent and ability to hold
to maturity are reported at amortized cost.
ii) available-for-sale securities, which represent securities not
classified as either trading securities or held-to-maturity debt
securities, are reported at fair value, with unrealized gains
and losses, net of applicable taxes, reported in a separate
component of equity.
Non-marketable available-for-sale securities are stated at
cost determined by the moving-average method. For other than
temporary declines in fair value, investment securities are
reduced to net realizable value by a charge to income.
d. Inventories
Finished products of the Company are stated at moving
average cost. Those held by domestic subsidiaries are stated
principally at the most recent purchase price which
approximates cost using the first-in, first-out method, while
those held by overseas subsidiaries are stated principally at the
lower of cost or market using the first-in, first-out method.
Work in process is stated principally at the specifically
identified cost. Other inventories are stated principally at
moving average cost.
e. Property, Plant and Equipment
Property, plant and equipment are stated at cost. Depreciation
of property, plant and equipment of the Company and its
domestic subsidiaries is computed substantially by the
declining-balance method at rates based on the estimated
useful lives of the assets, except that the straight-line method is
applied to the buildings of the Company and its domestic
subsidiaries. Overseas subsidiaries compute depreciation by the
straight-line method at rates based on the estimated useful lives
of the assets. The range of useful lives is principally from three
Shimadzu Corporation and Consolidated Subsidiaries
Notes to Consolidated Financial StatementsYears Ended March 31, 2007 and 2006
25
to 75 years for buildings and structures, from four to 17 years
for machinery, equipment and vehicles and from two to 15
years for tools, furniture and fixtures.
f. Long-Lived Assets
In August 2002, the Business Accounting Council (BAC) issued
a Statement of Opinion, “Accounting for Impairment of Fixed
Assets,” and in October 2003 the ASBJ issued ASBJ Guidance
No. 6, “Guidance for Accounting Standard for Impairment of
Fixed Assets.” These new pronouncements were effective for
fiscal years beginning on or after April 1, 2005 with early
adoption permitted for fiscal years ending on or after March 31,
2004. The Companies adopted the new accounting standard for
impairment of fixed assets as of April 1, 2004.
The Company and the domestic subsidiaries review their
long-lived assets for impairment whenever events or changes
in circumstances indicate that the carrying amount of an asset
or asset group may not be recoverable. An impairment loss
would be recognized if the carrying amount of an asset or asset
group exceeds the sum of the undiscounted future cash flows
expected to result from the continued use and eventual
disposition of the asset or asset group. The impairment loss
would be measured as the amount by which the carrying
amount of the asset exceeds its recoverable amount, which is
the higher of the discounted cash flows from the continued use
and eventual disposition of the asset or the net selling price at
disposition.
g. Retirement and Pension Plans
Employees whose service with the Company is terminated are,
under most circumstances, entitled to lump-sum indemnities
determined by reference to the basic rate of pay at the time of
termination, length of service and conditions under which the
termination occurs. If the termination is involuntary, caused by
retirement at the mandatory retirement age, or certain other
conditions, the employee is entitled to greater payments than
in the case of voluntary termination.
In addition, the Company, certain domestic subsidiaries and
British subsidiaries have non-contributory funded pension
plans covering most employees. The Company, certain
domestic subsidiaries and British subsidiaries accounted for the
liabilities for retirement benefits based on projected benefit
obligations and plan assets at the balance sheet date.
Effective January 1, 2005, the British subsidiaries adopted
FRS17, a new accounting standard for employees’ retirement
benefits and accounted for the liability for retirement benefits
based on projected benefit obligations and plan assets at the
balance sheet date.
Effective April 1, 2007, the Company amended the above
plans, introducing the cash balance pension plan, severance
lump-sum payment plan and option plan, consisting of a
defined contribution pension plan and a prepaid retirement
benefit plan, among which employees can adopt whichever
they consider more preferable.
The Company has an employees’ retirement benefit trust
for payments of retirement benefits. The securities which were
previously contributed to and are held in this trust are qualified
as plan assets.
Directors and corporate auditors are not covered by these
plans. However, the Company and 12 (eight in 2006) domestic
subsidiaries provide for the liability at the amount which would
be required, if all directors and corporate auditors terminated
their offices at the end of each financial period. The accrued
provisions are not funded and any amounts payable to
directors and corporate auditors upon retirement are subject to
the approval of the shareholders.
h. Presentation of Equity
On December 9, 2005, the ASBJ published a new accounting
standard for presentation of equity. Under this accounting
standard, certain items which were previously presented as
liabilities are now presented as components of equity. Such
items include stock acquisition rights, minority interests, and
any deferred gain or loss on derivatives accounted for under
hedge accounting. This standard is effective for fiscal years
ending on or after May 1, 2006. The consolidated balance sheet
as of March 31, 2007 is presented in line with this new
accounting standard.
i. Research and Development Costs
Research and development costs are charged to income as
incurred.
j. Allowance for Doubtful Receivables
The allowance for doubtful receivables is stated in amounts
considered to be appropriate based on the Companies’ past
credit loss experience and an evaluation of potential losses in
the receivables outstanding.
k. Leases
Leases are principally accounted for as operating leases. Under
Japanese accounting standards for leases, finance leases that
deem to transfer ownership of the leased property to the lessee
are to be capitalized, while other finance leases are permitted
to be accounted for as operating lease transactions if certain
“as if capitalized” information is disclosed in the notes to the
lessee’s consolidated financial statements.
26
l. Bonuses to directors and corporate auditors
Prior to the fiscal year ended March 31, 2005, bonuses to
directors and corporate auditors were accounted for as a
reduction of retained earnings in the fiscal year following
approval at the general shareholders meeting. The ASBJ issued
ASBJ Practical Issues Task Force (PITF) No.13, “Accounting
Treatment for Bonuses to Directors and Corporate Auditors,”
which encouraged companies to record bonuses to directors
and corporate auditors on the accrual basis with a related
charge to income, but still permitted the direct reduction of
such bonuses from retained earnings after approval of the
appropriation of retained earnings.
The ASBJ replaced the above accounting pronouncement by
issuing a new accounting standard for bonuses to directors and
corporate auditors on November 29, 2005. Under the new
accounting standard, bonuses to directors and corporate
auditors must be expensed and are no longer allowed to be
directly charged to retained earnings. This accounting standard
is effective for fiscal years ending on or after May 1, 2006. The
companies must accrue bonuses to directors and corporate
auditors at the year end to which such bonuses are
attributable.
The Companies adopted the new accounting standard for
bonuses to directors and corporate auditors from the year
ended March 31, 2007. The effect of adoption of this
accounting standard was to decrease income before income
taxes and minority interests for the year ended March 31, 2007
by ¥271 million ($2,297 thousand).
m. Income Taxes
The provision for income taxes is computed based on the
pretax income included in the consolidated statements of
income. The asset and liability approach is used to recognize
deferred tax assets and liabilities for the expected future tax
consequences of temporary differences between the carrying
amounts and the tax bases of assets and liabilities. Deferred
taxes are measured by applying currently enacted tax laws to
the temporary differences.
The Companies file a tax return under the consolidated
corporate-tax system which allows companies to base tax
payments on the combined profits or losses of the parent
company and its wholly owned domestic subsidiaries.
n. Appropriations of Retained Earnings
Appropriations of retained earnings are reflected in the
consolidated financial statements for the following year upon
shareholders’ approval.
o. Foreign Currency Transactions
All short-term and long-term monetary receivables and
payables denominated in foreign currencies are translated into
Japanese yen at the exchange rates at the balance sheet date.
Foreign exchange gains and losses are recognized in the
fiscal periods in which they occur.
p. Foreign Currency Financial Statements
The balance sheet accounts of the consolidated overseas
subsidiaries are translated into Japanese yen at the current
exchange rate as of the balance sheet date except for equity,
which is translated at the historical exchange rate. Differences
arising from such translation are shown as “Foreign currency
translation adjustments” in a separate component of equity.
Revenue and expense accounts of the consolidated
overseas subsidiaries are translated into yen at the average
exchange rate.
q. Derivative Financial Instruments
The Companies use derivative financial instruments to manage
their exposures to fluctuations in foreign exchange and interest
rates. Foreign currency exchange forward contracts and interest
rate options (caps) are utilized by the Companies to reduce
foreign currency exchange and interest rate risks. The
Companies do not enter into derivatives for trading or
speculative purposes.
The foreign currency forward contracts and interest rate
options (caps) are measured at the fair value at the balance
sheet date and the unrealized gains / losses are recognized in
income.
r. Amounts per Share
Basic net income per share is computed by dividing net
income available to common shareholders by the weighted-
average number of common shares outstanding for the period.
Diluted net income per share reflects the potential dilution
that could occur if securities were exercised or converted into
common stock. Diluted net income per share of common stock
assumes full conversion of the outstanding convertible bonds
at the beginning of the year with an applicable adjustment for
related interest expense, net of tax.
Cash dividends per share presented in the accompanying
consolidated statements of income are the dividends applicable
to the respective years, including dividends to be paid after the
end of the year.
27
s. New Accounting Pronouncement
Measurement of Inventories
Under generally accepted accounting principles in Japan
(“Japanese GAAP”), inventories are currently measured either
by the cost method, or at the lower of cost or market. On July
5, 2006, the ASBJ issued ASBJ Statement No.9, “Accounting
Standard for Measurement of Inventories,” which is effective
for fiscal years beginning on or after April 1, 2008 with early
adoption permitted. This standard requires that inventories
held for sale in the ordinary course of business be measured at
the lower of cost or net selling value, which is defined as the
selling price less additional estimated manufacturing costs and
estimated direct selling expenses. The replacement cost may be
used in place of the net selling value, if appropriate. The
standard also requires that inventories held for trading
purposes be measured at the market price.
Lease Accounting
On March 30, 2007, the ASBJ issued ASBJ Statement No.13,
“Accounting Standard for Lease Transactions”, which revised
the existing accounting standard for lease transactions issued
on June 17, 1993.
Under the existing accounting standard, finance leases that
deem to transfer ownership of the leased property to the lessee
are to be capitalized, however, other finance leases are
permitted to be accounted for as operating lease transactions if
certain “as if capitalized” information is disclosed in the note to
the lessee’s financial statements.
The revised accounting standard requires that all finance
lease transactions should be capitalized. The revised
accounting standard for lease transactions is effective for fiscal
years beginning on or after April 1, 2008 with early adoption
permitted for fiscal years beginning on or after April 1, 2007.
Unification of Accounting Policies Applied to Foreign
Subsidiaries for the Consolidated Financial Statements
Under Japanese GAAP, a company currently can use the
financial statements of foreign subsidiaries which are prepared
in accordance with generally accepted accounting principles in
their respective jurisdictions for its consolidation process unless
they are clearly unreasonable. On May 17, 2006, the ASBJ
issued ASBJ Practical Issues Task Force (PITF) No.18, “Practical
Solution on Unification of Accounting Policies Applied to
Foreign Subsidiaries for the Consolidated Financial Statements.”
The new task force prescribes: 1) the accounting policies and
procedures applied to a parent company and its subsidiaries
for similar transactions and events under similar circumstances
should in principle be unified for the preparation of the
consolidated financial statements, 2) financial statements
prepared by foreign subsidiaries in accordance with either
International Financial Reporting Standards or the generally
accepted accounting principles in the United States tentatively
may be used for the consolidation process, 3) however, the
following items should be adjusted in the consolidation process
so that net income is accounted for in accordance with
Japanese GAAP unless they are not material;
(1) Amortization of goodwill
(2) Actuarial gains and losses of defined benefit plans
recognized outside profit or loss
(3) Capitalization of intangible assets arising from development
phases
(4) Fair value measurement of investment properties, and the
revaluation model for property, plant and equipment, and
intangible assets
(5) Retrospective application when accounting policies are
changed
(6) Accounting for net income attributable to a minority interest
The new task force is effective for fiscal years beginning on or
after April 1, 2008 with early adoption permitted.
3. U.S. dollar amounts
The consolidated financial statements are stated in Japanese
yen, the currency of the country in which the Company is
incorporated and operates. The translations of Japanese yen
amounts into U.S. dollar amounts are included solely for the
convenience of readers outside Japan and have been made at
the rate of ¥118 to $1, the approximate rate of exchange at
March 31, 2007. Such translations should not be construed as
representations that the Japanese yen amounts could be
converted into U.S. dollars at that or any other rate.
28
4. Marketable and investment securities
Marketable and investment securities as of March 31, 2007 and
2006 consisted of the following:
Thousands ofMillions of yen U.S. dollars
2007 2006 2007
Current –
Government bonds and other.....¥ 110 ¥ 92 $ 932
Non-current:
Equity securities ...........................¥15,153 ¥14,754 $128,415
Government bonds and other..... 60 170 509
Total ..........................................¥15,213 ¥14,924 $128,924
The carrying amounts and aggregate fair values of marketable
and investment securities at March 31, 2007 and 2006 were as
follows:Millions of yen
Unrealized Unrealized FairMarch 31, 2007 Cost gains losses value
Securities classified as:
Available-for-sale –
Equity securities.............. ¥5,577 ¥9,318 ¥177 ¥14,778
Held-to-maturity ................. 170 3 167Millions of yen
Unrealized Unrealized FairMarch 31, 2006 Cost gains losses value
Securities classified as:
Available-for-sale –
Equity securities.............. ¥4,605 ¥9,717 ¥34 ¥14,288
Held-to-maturity ................. 262 6 256Thousands of U.S. dollars
Unrealized Unrealized FairMarch 31, 2007 Cost gains losses value
Securities classified as:
Available-for-sale –
Equity securities..............$47,263 $78,966 $992 $125,237
Held-to-maturity ................. 1,441 26 1,415
Available-for-sale securities whose fair value is not readily
determinable as of March 31, 2007 and 2006 were as follows:Carrying amount
Thousands ofMillions of yen U.S. dollars
2007 2006 2007
Available-for-sale –
Equity securities.............................. ¥375 ¥466 $3,178
Proceeds from sales of available-for-sale securities for the year
ended March 31, 2007 and 2006 were ¥134 million ($1,136
thousand) and ¥32 million, respectively. Gross realized gains
on these sales, computed on the moving average cost basis,
were ¥68 million ($576 thousand) and ¥5 million for the years
ended March 31, 2007 and 2006, respectively. Gross realized
losses on these sales, computed on the moving average cost
basis, were ¥Nil and ¥5 million for the years ended March 31,
2007 and 2006, respectively.
The carrying values of debt securities by contractual
maturities for securities classified as held-to-maturity at March
31, 2007 are as follows:
Carrying amountMillions of Thousands of
yen U.S. dollars2007 2007
Due within one year or less .......................... ¥110 $ 932
Due after one year through five years.......... 60 509
Total ............................................................ ¥170 $1,441
5. Inventories
Inventories at March 31, 2007 and 2006 consisted of the
following:
Thousands ofMillions of yen U.S. dollars
2007 2006 2007
Finished products .......................... ¥22,952 ¥20,008 $194,508
Semi-finished products.................... 7,591 6,955 64,331
Work in process............................... 12,729 21,717 107,873
Raw materials and supplies ............ 20,745 11,401 175,805
Total .................................................¥64,017 ¥60,081 $542,517
6. Short-term loans and long-term debt
Short-term loans primarily consisted of bank overdrafts and
financing agreements with banks which are renewable on an
annual basis and bear interest at annual rates ranging from
0.42% to 6.80% and from 0.36% to 6.75% at March 31, 2007 and
2006, respectively.
Long-term debt at March 31, 2007 and 2006 consisted of the
following:Thousands of
Millions of yen U.S. dollars2007 2006 2007
1.36% unsecured bonds, due April 2008.............................. ¥15,000 ¥15,000 $127,119
0.88% unsecured bonds, due April 2009.............................. 10,000 10,000 84,746
Loans, principally from banks, due serially to 2013 with interestrates ranging from 0.60% to 6.04% (0.60% to 6.04%, due serially to 2011 at March 31, 2006) ............. 3,901 7,805 33,058
Total ......................................... 28,901 32,805 244,923
Less portion due within one year........................................ (808) (5,766) (6,847)
Long-term debt, lesscurrent portion............................¥28,093 ¥27,039 $238,076
The aggregate annual maturities of long-term debt outstanding
at March 31, 2007 were as follows:
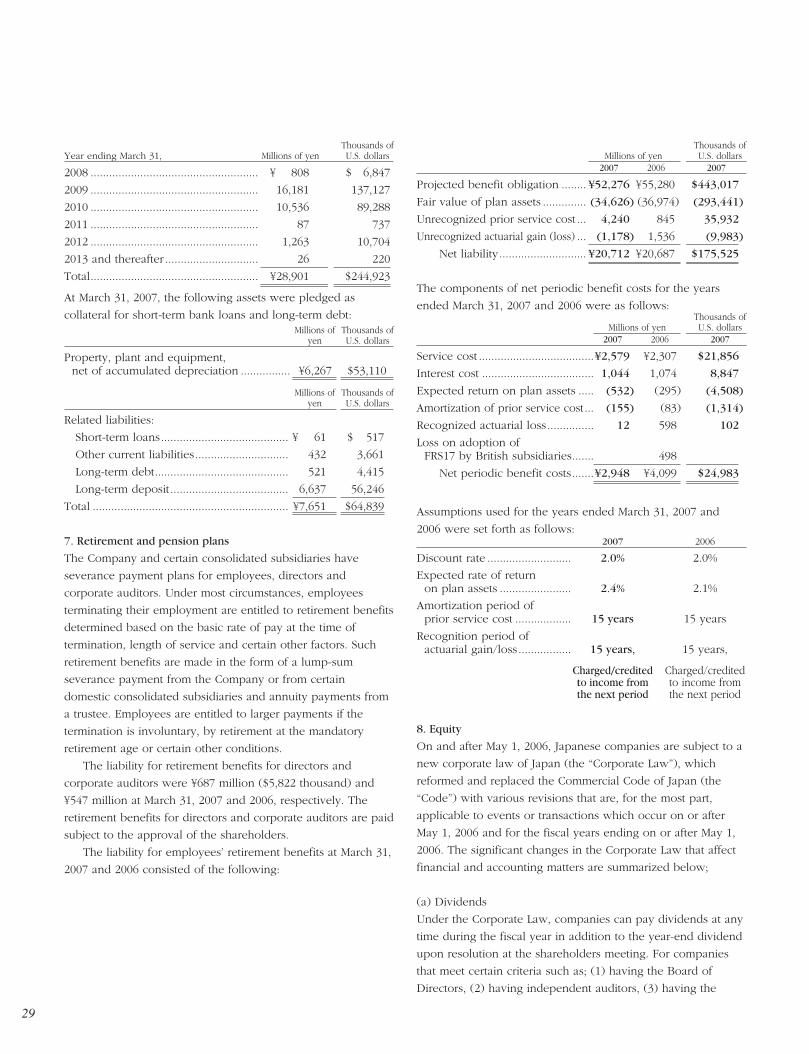
29
Thousands ofYear ending March 31, Millions of yen U.S. dollars
2008 ...................................................... ¥ 808 $ 6,847
2009 ...................................................... 16,181 137,127
2010 ...................................................... 10,536 89,288
2011 ...................................................... 87 737
2012 ...................................................... 1,263 10,704
2013 and thereafter .............................. 26 220
Total...................................................... ¥28,901 $244,923
At March 31, 2007, the following assets were pledged as
collateral for short-term bank loans and long-term debt:Millions of Thousands of
yen U.S. dollars
Property, plant and equipment,net of accumulated depreciation ................ ¥6,267 $53,110
Millions of Thousands ofyen U.S. dollars
Related liabilities:
Short-term loans......................................... ¥ 61 $ 517
Other current liabilities.............................. 432 3,661
Long-term debt........................................... 521 4,415
Long-term deposit...................................... 6,637 56,246
Total ............................................................... ¥7,651 $64,839
7. Retirement and pension plans
The Company and certain consolidated subsidiaries have
severance payment plans for employees, directors and
corporate auditors. Under most circumstances, employees
terminating their employment are entitled to retirement benefits
determined based on the basic rate of pay at the time of
termination, length of service and certain other factors. Such
retirement benefits are made in the form of a lump-sum
severance payment from the Company or from certain
domestic consolidated subsidiaries and annuity payments from
a trustee. Employees are entitled to larger payments if the
termination is involuntary, by retirement at the mandatory
retirement age or certain other conditions.
The liability for retirement benefits for directors and
corporate auditors were ¥687 million ($5,822 thousand) and
¥547 million at March 31, 2007 and 2006, respectively. The
retirement benefits for directors and corporate auditors are paid
subject to the approval of the shareholders.
The liability for employees’ retirement benefits at March 31,
2007 and 2006 consisted of the following:
Thousands ofMillions of yen U.S. dollars
2007 2006 2007
Projected benefit obligation ........ ¥52,276 ¥55,280 $443,017
Fair value of plan assets .............. (34,626) (36,974) (293,441)
Unrecognized prior service cost ... 4,240 845 35,932
Unrecognized actuarial gain (loss) ... (1,178) 1,536 (9,983)
Net liability............................ ¥20,712 ¥20,687 $175,525
The components of net periodic benefit costs for the years
ended March 31, 2007 and 2006 were as follows:Thousands of
Millions of yen U.S. dollars2007 2006 2007
Service cost .....................................¥2,579 ¥2,307 $21,856
Interest cost .................................... 1,044 1,074 8,847
Expected return on plan assets ..... (532) (295) (4,508)
Amortization of prior service cost... (155) (83) (1,314)
Recognized actuarial loss............... 12 598 102
Loss on adoption of FRS17 by British subsidiaries....... 498
Net periodic benefit costs.......¥2,948 ¥4,099 $24,983
Assumptions used for the years ended March 31, 2007 and
2006 were set forth as follows:2007 2006
Discount rate ........................... 2.0% 2.0%
Expected rate of return on plan assets ....................... 2.4% 2.1%
Amortization period ofprior service cost .................. 15 years 15 years
Recognition period of actuarial gain/loss................. 15 years, 15 years,
Charged/credited Charged/creditedto income from to income fromthe next period the next period
8. Equity
On and after May 1, 2006, Japanese companies are subject to a
new corporate law of Japan (the “Corporate Law”), which
reformed and replaced the Commercial Code of Japan (the
“Code”) with various revisions that are, for the most part,
applicable to events or transactions which occur on or after
May 1, 2006 and for the fiscal years ending on or after May 1,
2006. The significant changes in the Corporate Law that affect
financial and accounting matters are summarized below;
(a) Dividends
Under the Corporate Law, companies can pay dividends at any
time during the fiscal year in addition to the year-end dividend
upon resolution at the shareholders meeting. For companies
that meet certain criteria such as; (1) having the Board of
Directors, (2) having independent auditors, (3) having the
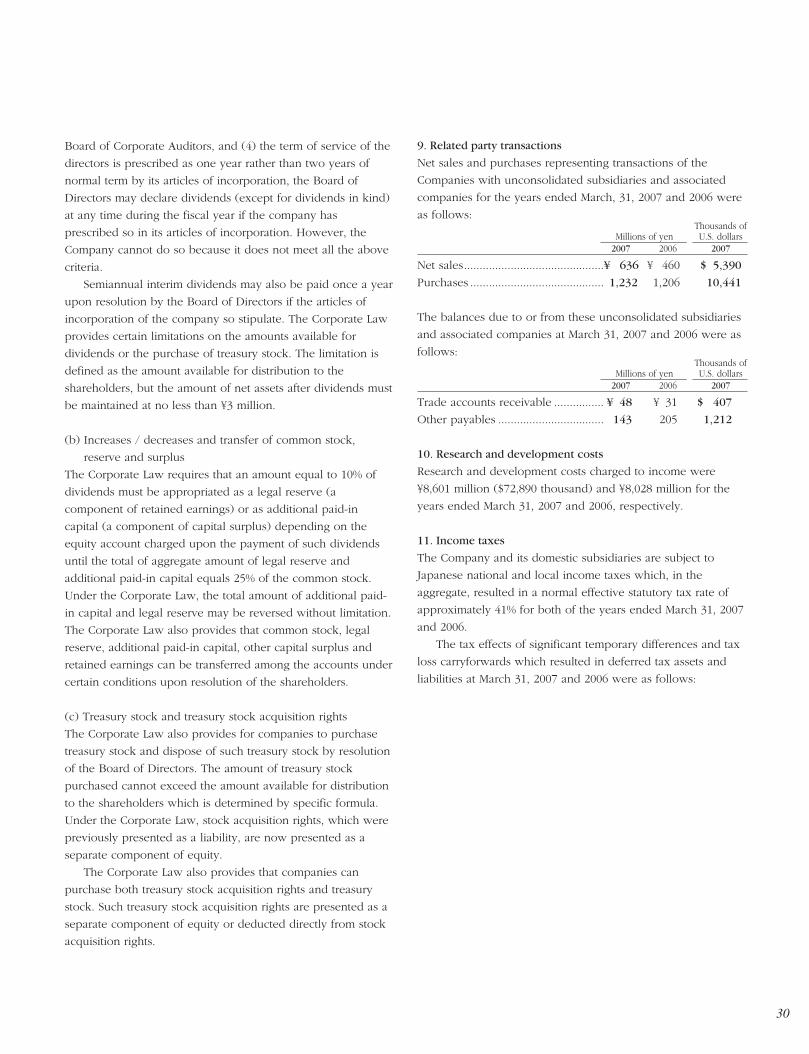
30
Board of Corporate Auditors, and (4) the term of service of the
directors is prescribed as one year rather than two years of
normal term by its articles of incorporation, the Board of
Directors may declare dividends (except for dividends in kind)
at any time during the fiscal year if the company has
prescribed so in its articles of incorporation. However, the
Company cannot do so because it does not meet all the above
criteria.
Semiannual interim dividends may also be paid once a year
upon resolution by the Board of Directors if the articles of
incorporation of the company so stipulate. The Corporate Law
provides certain limitations on the amounts available for
dividends or the purchase of treasury stock. The limitation is
defined as the amount available for distribution to the
shareholders, but the amount of net assets after dividends must
be maintained at no less than ¥3 million.
(b) Increases / decreases and transfer of common stock,
reserve and surplus
The Corporate Law requires that an amount equal to 10% of
dividends must be appropriated as a legal reserve (a
component of retained earnings) or as additional paid-in
capital (a component of capital surplus) depending on the
equity account charged upon the payment of such dividends
until the total of aggregate amount of legal reserve and
additional paid-in capital equals 25% of the common stock.
Under the Corporate Law, the total amount of additional paid-
in capital and legal reserve may be reversed without limitation.
The Corporate Law also provides that common stock, legal
reserve, additional paid-in capital, other capital surplus and
retained earnings can be transferred among the accounts under
certain conditions upon resolution of the shareholders.
(c) Treasury stock and treasury stock acquisition rights
The Corporate Law also provides for companies to purchase
treasury stock and dispose of such treasury stock by resolution
of the Board of Directors. The amount of treasury stock
purchased cannot exceed the amount available for distribution
to the shareholders which is determined by specific formula.
Under the Corporate Law, stock acquisition rights, which were
previously presented as a liability, are now presented as a
separate component of equity.
The Corporate Law also provides that companies can
purchase both treasury stock acquisition rights and treasury
stock. Such treasury stock acquisition rights are presented as a
separate component of equity or deducted directly from stock
acquisition rights.
9. Related party transactions
Net sales and purchases representing transactions of the
Companies with unconsolidated subsidiaries and associated
companies for the years ended March, 31, 2007 and 2006 were
as follows:Thousands of
Millions of yen U.S. dollars2007 2006 2007
Net sales.............................................¥ 636 ¥ 460 $ 5,390
Purchases ........................................... 1,232 1,206 10,441
The balances due to or from these unconsolidated subsidiaries
and associated companies at March 31, 2007 and 2006 were as
follows:Thousands of
Millions of yen U.S. dollars2007 2006 2007
Trade accounts receivable ................ ¥ 48 ¥ 31 $ 407
Other payables .................................. 143 205 1,212
10. Research and development costs
Research and development costs charged to income were
¥8,601 million ($72,890 thousand) and ¥8,028 million for the
years ended March 31, 2007 and 2006, respectively.
11. Income taxes
The Company and its domestic subsidiaries are subject to
Japanese national and local income taxes which, in the
aggregate, resulted in a normal effective statutory tax rate of
approximately 41% for both of the years ended March 31, 2007
and 2006.
The tax effects of significant temporary differences and tax
loss carryforwards which resulted in deferred tax assets and
liabilities at March 31, 2007 and 2006 were as follows:
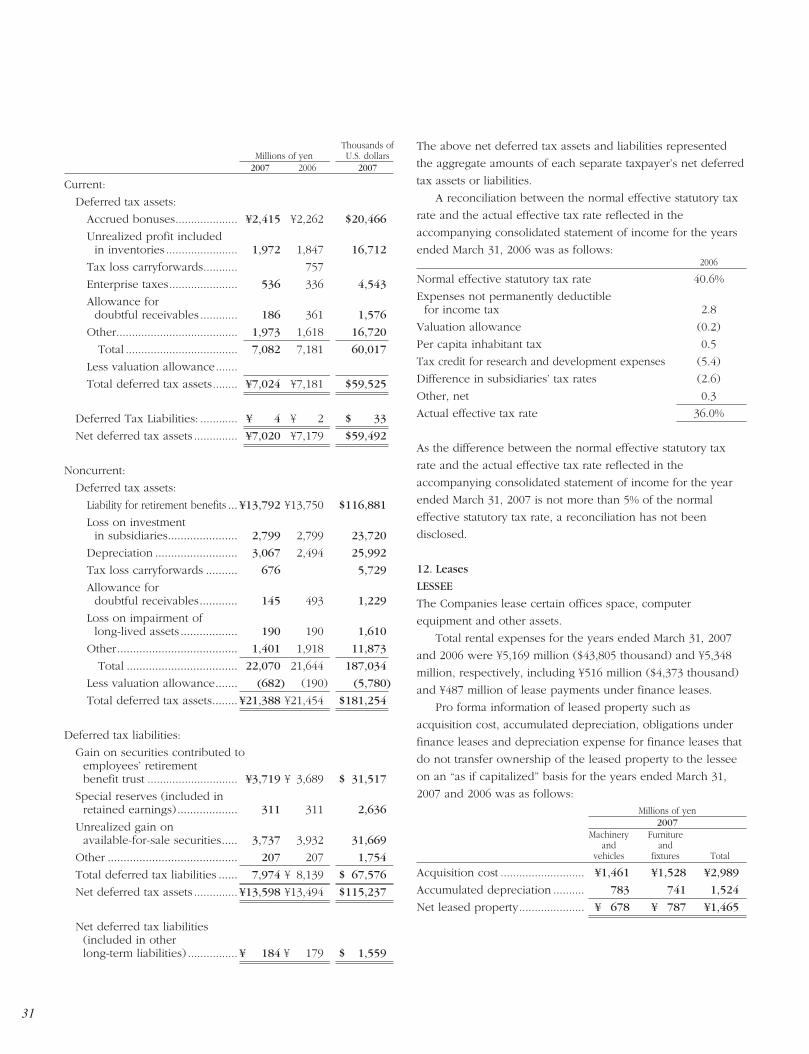
31
Thousands ofMillions of yen U.S. dollars
2007 2006 2007
Current:
Deferred tax assets:
Accrued bonuses.................... ¥2,415 ¥2,262 $20,466
Unrealized profit included in inventories ....................... 1,972 1,847 16,712
Tax loss carryforwards........... 757
Enterprise taxes...................... 536 336 4,543
Allowance fordoubtful receivables ............ 186 361 1,576
Other....................................... 1,973 1,618 16,720
Total .................................... 7,082 7,181 60,017
Less valuation allowance.......
Total deferred tax assets........ ¥7,024 ¥7,181 $59,525
Deferred Tax Liabilities: ............ ¥ 4 ¥ 2 $ 33
Net deferred tax assets .............. ¥7,020 ¥7,179 $59,492
Noncurrent:
Deferred tax assets:
Liability for retirement benefits ... ¥13,792 ¥13,750 $116,881
Loss on investment in subsidiaries...................... 2,799 2,799 23,720
Depreciation .......................... 3,067 2,494 25,992
Tax loss carryforwards .......... 676 5,729
Allowance for doubtful receivables............ 145 493 1,229
Loss on impairment of long-lived assets .................. 190 190 1,610
Other...................................... 1,401 1,918 11,873
Total ................................... 22,070 21,644 187,034
Less valuation allowance....... (682) (190) (5,780)
Total deferred tax assets........ ¥21,388 ¥21,454 $181,254
Deferred tax liabilities:
Gain on securities contributed to employees’ retirement benefit trust ............................. ¥3,719 ¥ 3,689 $ 31,517
Special reserves (included in retained earnings) ................... 311 311 2,636
Unrealized gain on available-for-sale securities..... 3,737 3,932 31,669
Other ......................................... 207 207 1,754
Total deferred tax liabilities ...... 7,974 ¥ 8,139 $ 67,576
Net deferred tax assets .............. ¥13,598 ¥13,494 $115,237
Net deferred tax liabilities (included in other long-term liabilities) ................¥ 184 ¥ 179 $ 1,559
The above net deferred tax assets and liabilities represented
the aggregate amounts of each separate taxpayer’s net deferred
tax assets or liabilities.
A reconciliation between the normal effective statutory tax
rate and the actual effective tax rate reflected in the
accompanying consolidated statement of income for the years
ended March 31, 2006 was as follows:2006
Normal effective statutory tax rate 40.6%
Expenses not permanently deductible for income tax 2.8
Valuation allowance (0.2)
Per capita inhabitant tax 0.5
Tax credit for research and development expenses (5.4)
Difference in subsidiaries’ tax rates (2.6)
Other, net 0.3
Actual effective tax rate 36.0%
As the difference between the normal effective statutory tax
rate and the actual effective tax rate reflected in the
accompanying consolidated statement of income for the year
ended March 31, 2007 is not more than 5% of the normal
effective statutory tax rate, a reconciliation has not been
disclosed.
12. Leases
LESSEE
The Companies lease certain offices space, computer
equipment and other assets.
Total rental expenses for the years ended March 31, 2007
and 2006 were ¥5,169 million ($43,805 thousand) and ¥5,348
million, respectively, including ¥516 million ($4,373 thousand)
and ¥487 million of lease payments under finance leases.
Pro forma information of leased property such as
acquisition cost, accumulated depreciation, obligations under
finance leases and depreciation expense for finance leases that
do not transfer ownership of the leased property to the lessee
on an “as if capitalized” basis for the years ended March 31,
2007 and 2006 was as follows:
Millions of yen2007
Machinery Furnitureand and
vehicles fixtures Total
Acquisition cost ........................... ¥1,461 ¥1,528 ¥2,989
Accumulated depreciation .......... 783 741 1,524
Net leased property..................... ¥ 678 ¥ 787 ¥1,465
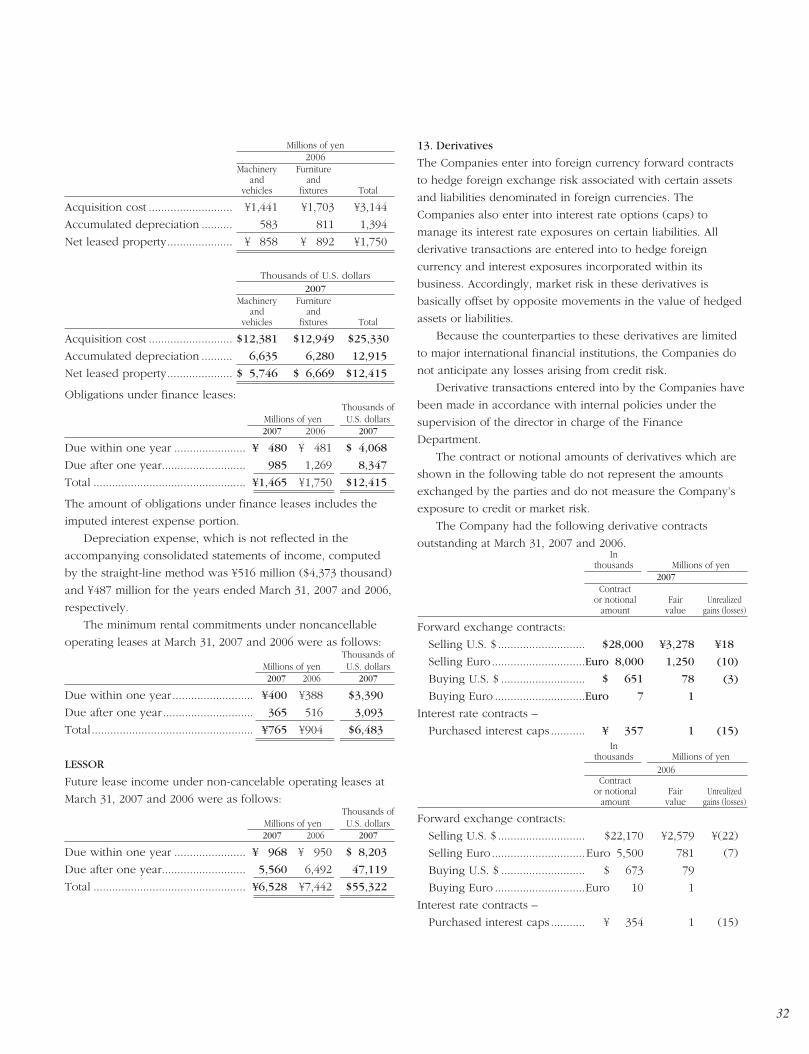
32
Millions of yen2006
Machinery Furnitureand and
vehicles fixtures Total
Acquisition cost ........................... ¥1,441 ¥1,703 ¥3,144
Accumulated depreciation .......... 583 811 1,394
Net leased property..................... ¥ 858 ¥ 892 ¥1,750
Thousands of U.S. dollars2007
Machinery Furnitureand and
vehicles fixtures Total
Acquisition cost ........................... $12,381 $12,949 $25,330
Accumulated depreciation .......... 6,635 6,280 12,915
Net leased property..................... $ 5,746 $ 6,669 $12,415
Obligations under finance leases:Thousands of
Millions of yen U.S. dollars2007 2006 2007
Due within one year ....................... ¥ 480 ¥ 481 $ 4,068
Due after one year........................... 985 1,269 8,347
Total ................................................. ¥1,465 ¥1,750 $12,415
The amount of obligations under finance leases includes the
imputed interest expense portion.
Depreciation expense, which is not reflected in the
accompanying consolidated statements of income, computed
by the straight-line method was ¥516 million ($4,373 thousand)
and ¥487 million for the years ended March 31, 2007 and 2006,
respectively.
The minimum rental commitments under noncancellable
operating leases at March 31, 2007 and 2006 were as follows:Thousands of
Millions of yen U.S. dollars2007 2006 2007
Due within one year.......................... ¥400 ¥388 $3,390
Due after one year ............................. 365 516 3,093
Total.................................................... ¥765 ¥904 $6,483
LESSOR
Future lease income under non-cancelable operating leases at
March 31, 2007 and 2006 were as follows:Thousands of
Millions of yen U.S. dollars2007 2006 2007
Due within one year ....................... ¥ 968 ¥ 950 $ 8,203
Due after one year........................... 5,560 6,492 47,119
Total ................................................. ¥6,528 ¥7,442 $55,322
13. Derivatives
The Companies enter into foreign currency forward contracts
to hedge foreign exchange risk associated with certain assets
and liabilities denominated in foreign currencies. The
Companies also enter into interest rate options (caps) to
manage its interest rate exposures on certain liabilities. All
derivative transactions are entered into to hedge foreign
currency and interest exposures incorporated within its
business. Accordingly, market risk in these derivatives is
basically offset by opposite movements in the value of hedged
assets or liabilities.
Because the counterparties to these derivatives are limited
to major international financial institutions, the Companies do
not anticipate any losses arising from credit risk.
Derivative transactions entered into by the Companies have
been made in accordance with internal policies under the
supervision of the director in charge of the Finance
Department.
The contract or notional amounts of derivatives which are
shown in the following table do not represent the amounts
exchanged by the parties and do not measure the Company’s
exposure to credit or market risk.
The Company had the following derivative contracts
outstanding at March 31, 2007 and 2006.In
thousands Millions of yen2007
Contractor notional Fair Unrealized
amount value gains (losses)
Forward exchange contracts:
Selling U.S. $ ............................ $28,000 ¥3,278 ¥18
Selling Euro..............................Euro 8,000 1,250 (10)
Buying U.S. $ ........................... $ 651 78 (3)
Buying Euro .............................Euro 7 1
Interest rate contracts –
Purchased interest caps ........... ¥ 357 1 (15)In
thousands Millions of yen2006
Contractor notional Fair Unrealized
amount value gains (losses)
Forward exchange contracts:
Selling U.S. $ ............................ $22,170 ¥2,579 ¥(22)
Selling Euro..............................Euro 5,500 781 (7)
Buying U.S. $ ........................... $ 673 79
Buying Euro .............................Euro 10 1
Interest rate contracts –
Purchased interest caps ........... ¥ 354 1 (15)
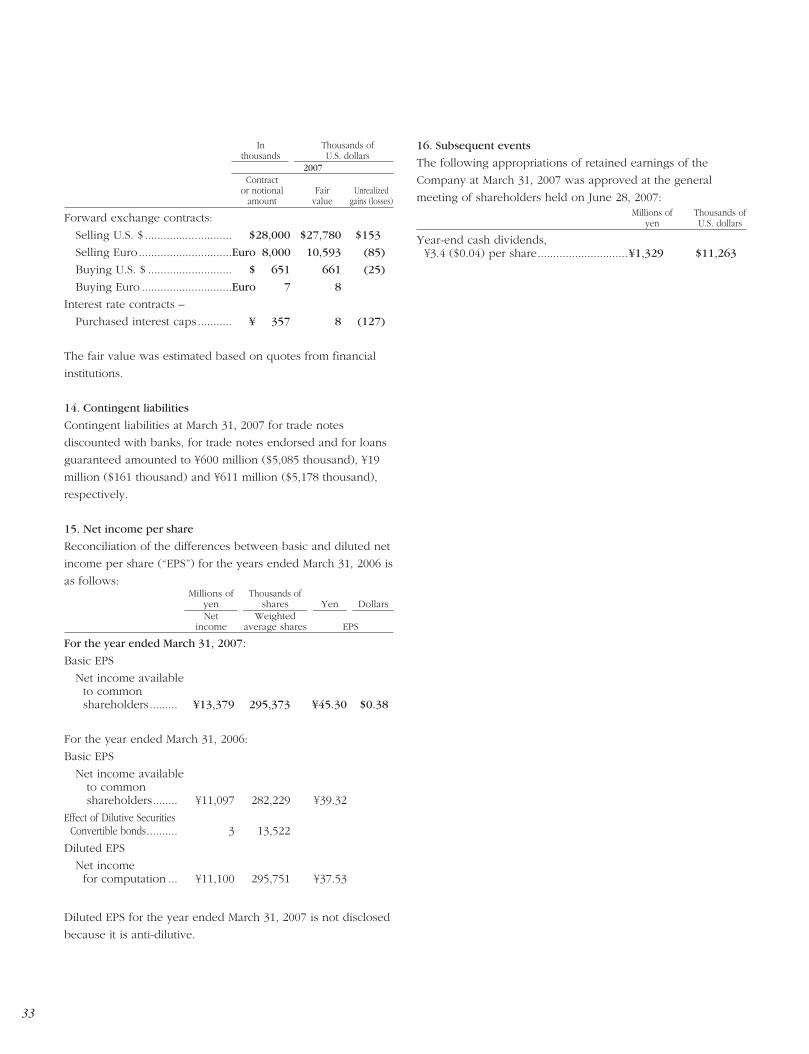
33
In Thousands ofthousands U.S. dollars
2007Contract
or notional Fair Unrealizedamount value gains (losses)
Forward exchange contracts:
Selling U.S. $ ............................ $28,000 $27,780 $153
Selling Euro..............................Euro 8,000 10,593 (85)
Buying U.S. $ ........................... $ 651 661 (25)
Buying Euro .............................Euro 7 8
Interest rate contracts –
Purchased interest caps ........... ¥ 357 8 (127)
The fair value was estimated based on quotes from financial
institutions.
14. Contingent liabilities
Contingent liabilities at March 31, 2007 for trade notes
discounted with banks, for trade notes endorsed and for loans
guaranteed amounted to ¥600 million ($5,085 thousand), ¥19
million ($161 thousand) and ¥611 million ($5,178 thousand),
respectively.
15. Net income per share
Reconciliation of the differences between basic and diluted net
income per share (“EPS”) for the years ended March 31, 2006 is
as follows:Millions of Thousands of
yen shares Yen DollarsNet Weighted
income average shares EPS
For the year ended March 31, 2007:
Basic EPS
Net income available to commonshareholders......... ¥13,379 295,373 ¥45.30 $0.38
For the year ended March 31, 2006:
Basic EPS
Net income available to commonshareholders........ ¥11,097 282,229 ¥39.32
Effect of Dilutive Securities Convertible bonds.......... 3 13,522
Diluted EPS
Net income for computation ... ¥11,100 295,751 ¥37.53
Diluted EPS for the year ended March 31, 2007 is not disclosed
because it is anti-dilutive.
16. Subsequent events
The following appropriations of retained earnings of the
Company at March 31, 2007 was approved at the general
meeting of shareholders held on June 28, 2007:Millions of Thousands of
yen U.S. dollars
Year-end cash dividends, ¥3.4 ($0.04) per share.............................¥1,329 $11,263
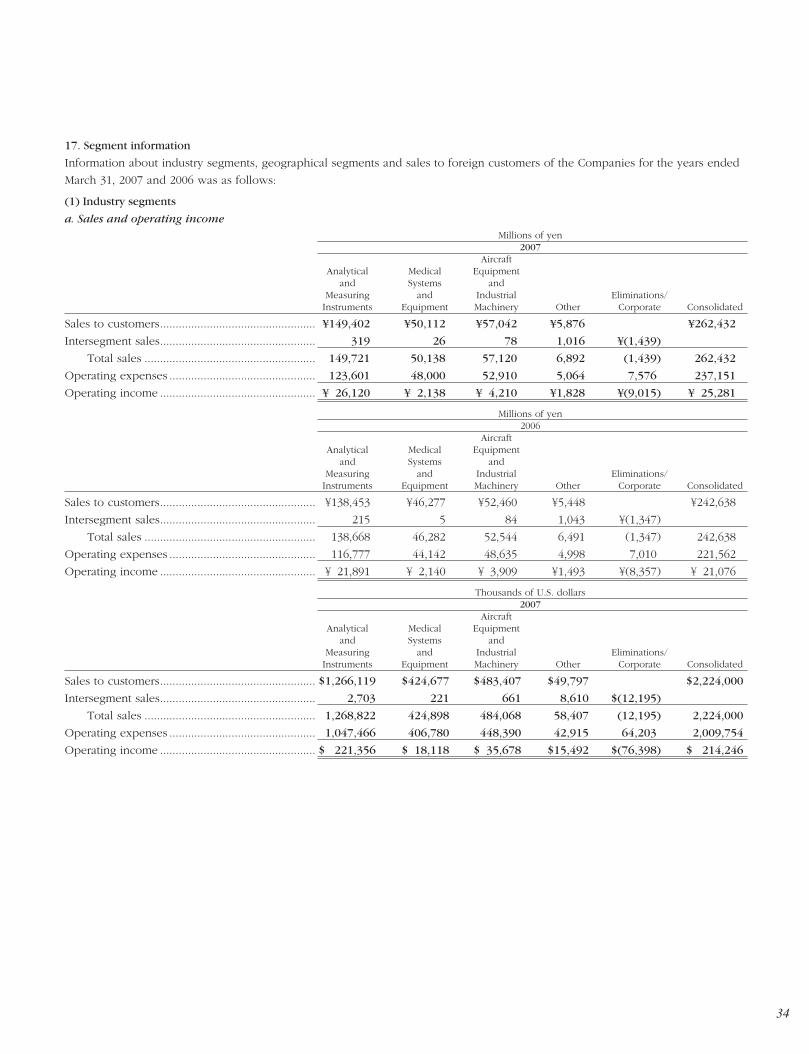
34
17. Segment information
Information about industry segments, geographical segments and sales to foreign customers of the Companies for the years ended
March 31, 2007 and 2006 was as follows:
(1) Industry segments
a. Sales and operating incomeMillions of yen
2007Aircraft
Analytical Medical Equipmentand Systems and
Measuring and Industrial Eliminations/Instruments Equipment Machinery Other Corporate Consolidated
Sales to customers.................................................. ¥149,402 ¥50,112 ¥57,042 ¥5,876 ¥262,432
Intersegment sales.................................................. 319 26 78 1,016 ¥(1,439)
Total sales ....................................................... 149,721 50,138 57,120 6,892 (1,439) 262,432
Operating expenses ............................................... 123,601 48,000 52,910 5,064 7,576 237,151
Operating income .................................................. ¥ 26,120 ¥ 2,138 ¥ 4,210 ¥1,828 ¥(9,015) ¥ 25,281
Millions of yen2006
AircraftAnalytical Medical Equipment
and Systems andMeasuring and Industrial Eliminations/Instruments Equipment Machinery Other Corporate Consolidated
Sales to customers.................................................. ¥138,453 ¥46,277 ¥52,460 ¥5,448 ¥242,638
Intersegment sales.................................................. 215 5 84 1,043 ¥(1,347)
Total sales ....................................................... 138,668 46,282 52,544 6,491 (1,347) 242,638
Operating expenses ............................................... 116,777 44,142 48,635 4,998 7,010 221,562
Operating income .................................................. ¥ 21,891 ¥ 2,140 ¥ 3,909 ¥1,493 ¥(8,357) ¥ 21,076
Thousands of U.S. dollars2007
AircraftAnalytical Medical Equipment
and Systems andMeasuring and Industrial Eliminations/Instruments Equipment Machinery Other Corporate Consolidated
Sales to customers.................................................. $1,266,119 $424,677 $483,407 $49,797 $2,224,000
Intersegment sales.................................................. 2,703 221 661 8,610 $(12,195)
Total sales ....................................................... 1,268,822 424,898 484,068 58,407 (12,195) 2,224,000
Operating expenses ............................................... 1,047,466 406,780 448,390 42,915 64,203 2,009,754
Operating income .................................................. $ 221,356 $ 18,118 $ 35,678 $15,492 $(76,398) $ 214,246
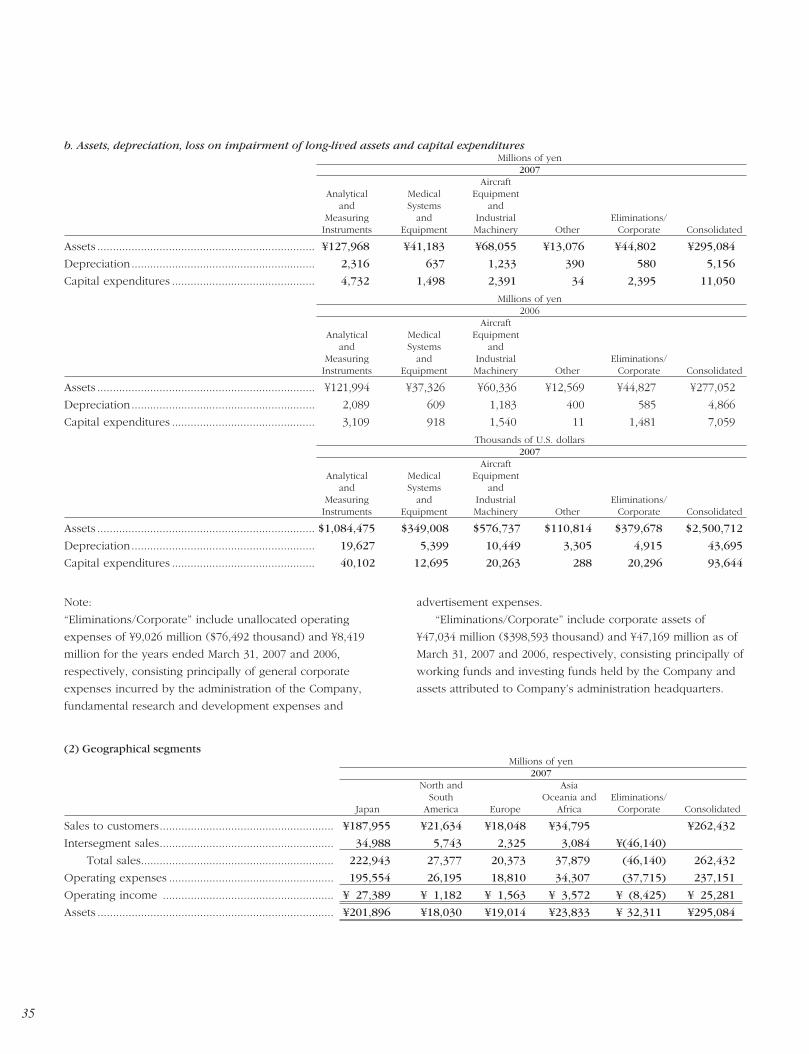
35
(2) Geographical segmentsMillions of yen
2007North and Asia
South Oceania and Eliminations/Japan America Europe Africa Corporate Consolidated
Sales to customers........................................................ ¥187,955 ¥21,634 ¥18,048 ¥34,795 ¥262,432
Intersegment sales........................................................ 34,988 5,743 2,325 3,084 ¥(46,140)
Total sales.............................................................. 222,943 27,377 20,373 37,879 (46,140) 262,432
Operating expenses ..................................................... 195,554 26,195 18,810 34,307 (37,715) 237,151
Operating income ....................................................... ¥ 27,389 ¥ 1,182 ¥ 1,563 ¥ 3,572 ¥ (8,425) ¥ 25,281
Assets ............................................................................ ¥201,896 ¥18,030 ¥19,014 ¥23,833 ¥ 32,311 ¥295,084
b. Assets, depreciation, loss on impairment of long-lived assets and capital expendituresMillions of yen
2007Aircraft
Analytical Medical Equipmentand Systems and
Measuring and Industrial Eliminations/Instruments Equipment Machinery Other Corporate Consolidated
Assets ...................................................................... ¥127,968 ¥41,183 ¥68,055 ¥13,076 ¥44,802 ¥295,084
Depreciation........................................................... 2,316 637 1,233 390 580 5,156
Capital expenditures .............................................. 4,732 1,498 2,391 34 2,395 11,050
Millions of yen2006
AircraftAnalytical Medical Equipment
and Systems andMeasuring and Industrial Eliminations/Instruments Equipment Machinery Other Corporate Consolidated
Assets ...................................................................... ¥121,994 ¥37,326 ¥60,336 ¥12,569 ¥44,827 ¥277,052
Depreciation........................................................... 2,089 609 1,183 400 585 4,866
Capital expenditures .............................................. 3,109 918 1,540 11 1,481 7,059
Thousands of U.S. dollars2007
AircraftAnalytical Medical Equipment
and Systems andMeasuring and Industrial Eliminations/Instruments Equipment Machinery Other Corporate Consolidated
Assets ...................................................................... $1,084,475 $349,008 $576,737 $110,814 $379,678 $2,500,712
Depreciation........................................................... 19,627 5,399 10,449 3,305 4,915 43,695
Capital expenditures .............................................. 40,102 12,695 20,263 288 20,296 93,644
Note:
“Eliminations/Corporate” include unallocated operating
expenses of ¥9,026 million ($76,492 thousand) and ¥8,419
million for the years ended March 31, 2007 and 2006,
respectively, consisting principally of general corporate
expenses incurred by the administration of the Company,
fundamental research and development expenses and
advertisement expenses.
“Eliminations/Corporate” include corporate assets of
¥47,034 million ($398,593 thousand) and ¥47,169 million as of
March 31, 2007 and 2006, respectively, consisting principally of
working funds and investing funds held by the Company and
assets attributed to Company’s administration headquarters.
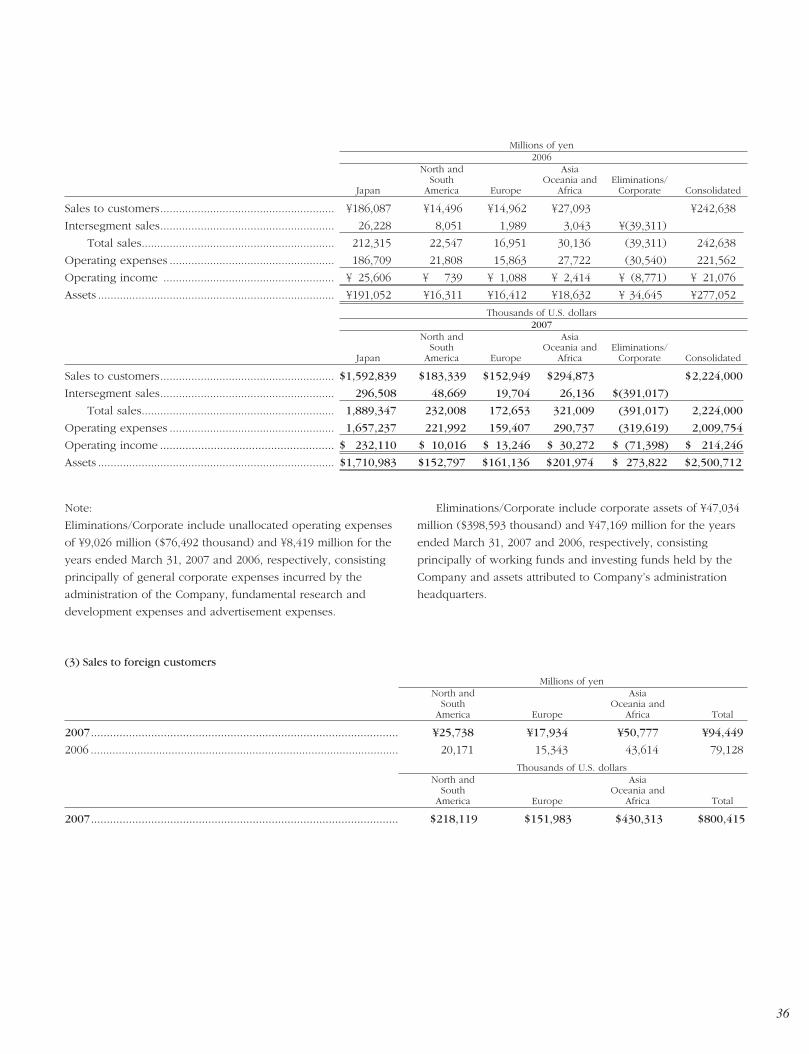
36
Millions of yen2006
North and AsiaSouth Oceania and Eliminations/
Japan America Europe Africa Corporate Consolidated
Sales to customers........................................................ ¥186,087 ¥14,496 ¥14,962 ¥27,093 ¥242,638
Intersegment sales........................................................ 26,228 8,051 1,989 3,043 ¥(39,311)
Total sales.............................................................. 212,315 22,547 16,951 30,136 (39,311) 242,638
Operating expenses ..................................................... 186,709 21,808 15,863 27,722 (30,540) 221,562
Operating income ....................................................... ¥ 25,606 ¥ 739 ¥ 1,088 ¥ 2,414 ¥ (8,771) ¥ 21,076
Assets ............................................................................ ¥191,052 ¥16,311 ¥16,412 ¥18,632 ¥ 34,645 ¥277,052
Thousands of U.S. dollars2007
North and AsiaSouth Oceania and Eliminations/
Japan America Europe Africa Corporate Consolidated
Sales to customers........................................................ $1,592,839 $183,339 $152,949 $294,873 $2,224,000
Intersegment sales........................................................ 296,508 48,669 19,704 26,136 $(391,017)
Total sales.............................................................. 1,889,347 232,008 172,653 321,009 (391,017) 2,224,000
Operating expenses ..................................................... 1,657,237 221,992 159,407 290,737 (319,619) 2,009,754
Operating income ....................................................... $ 232,110 $ 10,016 $ 13,246 $ 30,272 $ (71,398) $ 214,246
Assets ............................................................................ $1,710,983 $152,797 $161,136 $201,974 $ 273,822 $2,500,712
(3) Sales to foreign customers
Millions of yenNorth and Asia
South Oceania andAmerica Europe Africa Total
2007................................................................................................. ¥25,738 ¥17,934 ¥50,777 ¥94,449
2006 ................................................................................................... 20,171 15,343 43,614 79,128
Thousands of U.S. dollarsNorth and Asia
South Oceania andAmerica Europe Africa Total
2007................................................................................................. $218,119 $151,983 $430,313 $800,415
Note:
Eliminations/Corporate include unallocated operating expenses
of ¥9,026 million ($76,492 thousand) and ¥8,419 million for the
years ended March 31, 2007 and 2006, respectively, consisting
principally of general corporate expenses incurred by the
administration of the Company, fundamental research and
development expenses and advertisement expenses.
Eliminations/Corporate include corporate assets of ¥47,034
million ($398,593 thousand) and ¥47,169 million for the years
ended March 31, 2007 and 2006, respectively, consisting
principally of working funds and investing funds held by the
Company and assets attributed to Company’s administration
headquarters.
37
INDEPENDENT AUDITORS’ REPORT
To the Board of Directors and Shareholders of
Shimadzu Corporation:
We have audited the accompanying consolidated balance sheets of Shimadzu Corporation and
consolidated subsidiaries as of March 31, 2007 and 2006, and the related consolidated statements of
income, changes in equity, and cash flows for the years then ended, all expressed in Japanese yen.
These consolidated financial statements are the responsibility of the Company’s management. Our
responsibility is to express an opinion on these consolidated financial statements based on our audits.
We conducted our audits in accordance with auditing standards generally accepted in Japan. Those
standards require that we plan and perform the audit to obtain reasonable assurance about whether the
financial statements are free of material misstatement. An audit includes examining, on a test basis,
evidence supporting the amounts and disclosures in the financial statements. An audit also includes
assessing the accounting principles used and significant estimates made by management, as well as
evaluating the overall financial statement presentation. We believe that our audits provide a reasonable
basis for our opinion.
In our opinion, the consolidated financial statements referred to above present fairly, in all material
respects, the consolidated financial position of Shimadzu Corporation and consolidated subsidiaries as of
March 31, 2007 and 2006, and the consolidated results of their operations and their cash flows for the
years then ended in conformity with accounting principles generally accepted in Japan.
Our audits also comprehended the translation of Japanese yen amounts into U.S. dollar amounts and, in
our opinion, such translation has been made in conformity with the basis stated in Note 3. Such U.S.
dollar amounts are presented solely for the convenience of readers outside Japan.
June 28, 2007
Deloitte Touche TohmatsuSumitomoseimei Kyoto Building62, Tsukihoko-choShinmachi-higashiiru, Shijo-doriShimogyo-ku, Kyoto 600-8492Japan
Tel: +81 (75) 222 0181Fax: +81 (75) 231 2703www.deloitte.com/jp

www.shimadzu.com
Kyoto, Japan
0156-07702-20A-NS