annual report 2010 - f-secure
TRANSCRIPT

F-Secure– Protecting the irreplaceableAnnual Report 2010
f-secure.com
2 annual rePort
F-Secure in brief 3Information for Shareholders 4Summary of Stock exchange releases 4Facts and figures 5Ceo letter 2010 6Board of Directors’ report 2010 8
Financial Statements 14F-Secure Consolidated 15 Statement of comprehensive income 16 Statement of financial position 17 Statement of cash flows 18 Statement of changes shareholders’ equity 19 notes to the financial statements 19F-Secure Corporation 39 Income statement 40 Balance sheet 40 Cash flow statement 41 notes to the financial statements 42
auditors’ report 51Corporate Governance Statement 2010 52Board of Directors 56executive team 57Contact Information 58
TAble of conTenTs

annual rePort 3
f-secURe In bRIef
f-secure’s promise, ‘Protecting the irreplaceable’ captures the essence of what we do. We want to protect our customers’ valuable digital content across devices and access – now and in the future – as our customers’ needs and technologies evolve. so while you concentrate on what is important to you, we make sure you are protected and safe online whether you are using a computer or a smartphone. We also backup and enable you to share your important files.
by protecting and preventing the loss of valuable content, f-secure’s trusted services provide peace of mind for millions of consumers and businesses in all their online activities. our online software services are easy to use and delivered with dependable support.
Working with operators is a key element of our business strategy. f-secure has partnerships with more than 200 operators around the world. We have been a pioneer of the ‘software as a service’ business model in the industry.
by delivering software as a service, f-secure enables companies to focus on their business priorities, without having to maintain the expertise and technology to cope with the constantly evolving threat landscape. software as a service also brings new business opportunities for both business and consumer-focused operators. backed up by our world-class technology and support, software as a service is easy to deploy.
founded in 1988, f-secure is listed on nAsDAQ oMX Helsinki ltd.
F-Secure key FigureS 2010
eur million 2010 2009
Revenues 130.1 125.1operating profit 19.8 24.0% of revenues 15% 19%Profit before taxes 19.9 25.2earnings per share (eUR) 0.10 0.12
At the end of period:Deferred revenue 37.2 35.6equity ratio, % 69% 70%Debt-to-equity ratio, % -63% -68%Personnel, Dec. 31 812 826
WHIle yoU concenTRATe on WHAT Is IMPoRTAnT To yoU, We MAke sURe yoU ARe PRoTecTeD AnD sAfe onlIne WHeTHeR yoU ARe UsIng A coMPUTeR oR A sMARTPHone.

4 annual rePort
The main goal of f-secure’s investor communications is to make available correct, up-to-date information of f-secure’s operations impartially and simultaneously to all interest groups. All investor information is published in english and in finnish. All investor information is also available on the group’s web pages. Annual reports, interim reports, as well as stock exchange and press releases are available on the group’s website www.f-secure.com under f-securecorporation.com, Investor Relations web pages. subscriptions for the emailing list for stock exchange releases can be made by sending your contact details to [email protected].
f-secure arranges press conferences for media and analysts at the time of publishing the quarterly reports. f-secure observes a three-week silent period before the publishing of each quarterly report. During this time, f-secure does neither arrange meetings nor phone conferences with investors or analysts.
InfoRMATIon foR sHAReHolDeRs
Dec. 8, 2010 subscription of f-secure shares with f-secure 2005 warrants
nov. 8, 2010 employee negotiations related to reorganization of operations of f-secure concluded
oct. 27, 2010 f-secure corporation – Interim Report, January 1 – september 30, 2010
oct. 4, 2010 f-secure plans to reorganize its operations to drive growth and starts employee negotiations
sep. 14, 2010 Announcement pursuant to securities Act chapter 2, section 10
sep. 7, 2010 Announcement pursuant to securities Act chapter 2, section 10
Jul. 29, 2010 f-secure corporation – Interim Report, January 1 – June 30, 2010
June 6, 2010 Announcement pursuant to securities Act chapter 2, section 10
May 31, 2010 f-secure to start repurchase program
May 26, 2010 subscription of f-secure shares with f-secure 2005 warrants
Apr. 28, 2010 f-secure corporation – Interim Report, January 1 – March 31, 2010
sUMMARy of sTock eXcHAnge ReleAses In 2010
Annual general MeetingThe Annual general Meeting of f-secure corporation will be held on Wednesday, March 30, 2011 at 4.00 p.m. (finnish time) at f-secure corporation, Tammasaarenkatu 7, 00180 Helsinki. More information on how to attend as well as the documents for the meeting are available on the group’s webpage www.f-secure.com under f-securecorporation.com, Investor Relations, general Meetings.
Financial calendar for 2011financial statements bulletin february 2Annual Report Week 10 in the beginning of MarchQ1 Interim Report April 27Q2 Interim Report July 27Q3 Interim Report october 26
F-Secure share factslisting since 1999 nAsDAQ oMX Helsinki ltd.Trading symbol fsc1Vnumber of shares 157,539,243
Apr. 16, 2010 Announcement pursuant to securities Act chapter 2, section 10
Mar. 24, 2010 Resolutions of the Annual general Meeting of f-secure corporation
Mar.2 , 2010 f-secure's Annual Report 2009 published
Mar 1, 2010 f-secure corporation: notice to the Annual general Meeting
feb. 16, 2010 2005 b- and c-warrants of f-secure corporation listed on March 1, 2010
feb. 18, 2010 f-secure corporation's financial statements 2009 and the board of Directors' proposals to the Annual general Meeting
feb. 3, 2010 f-secure oyj – financial statement Release f-secure corporation – Interim Report, January 1 – December 31, 2009
The stock exchange releases are fully available on the company website www.f-securecorporation.com under investor relations.
some of the information in the releases may be outdated.

annual rePort 5
fAcTs AnD fIgURes
Rest of Europe46%
Nordic Countries33%
North America9%
Rest of the world12%
0
200
400
600
800
1000
20102009200820072006
Research and development
Administration
Sales and marketing
0
30
60
90
120
150
0%
10%
20%
30%
40%
50%
20102009200820072006
Revenues
Operating profit
Revenue growth %
0
5
10
15
20
25
0.0
0.5
1.0
1.5
2.0
3.0
2.5
12/1011/10
10/1009/10
08/1007/10
06/1005/10
04/1003/10
02/1001/10
Turnover EUR
Average Price
Millions EURkEUR
0
4 000
8 000
12 000
16 000
20 000
Q1/10Q1/09
Q1/08Q1/07
Q1/06Q1/05
Q1/04Q1/03
Q1/02Q1/01
ISP revenues
Revenues
Operating profit
0
5
10
15
20
25
30
35
40
Q410Q310Q210Q110
Personnel
Revenues and operating profit by quarter 2010 (m€) Revenues and operating profit 2006–2010 (m€)
Revenues by the operator business (m€)
Regional revenue split 2010
share trading volume and average price per month

6 annual rePort
2010 – Building a foundation for future growthIt’s usually winter when I sit down to write the ceo letter and reflect on the past year. This winter has been exciting; it started early, and we haven’t seen so much snow in 50 years. Despite these challenges, the city of Helsinki has adapted quickly to the situation to ensure that life and business continue as usual. similarly, f-secure saw a changing ecosystem and had to adapt in a sustainable way to a new business environment in 2010.
for me, our 22nd year of operations has also been an exciting one. We took leaps forward in building great services and developing global scale via our partner network. Very importantly, we continued to expand our operator partnerships both in the areas of security and storage related services. by the end of 2010, we had an addressable market of over 100 million broadband customers through our operator partners. While our financial performance remained reasonably good, we clearly experienced a year of lower growth than what we aspired to. As a result, a number of restructuring initiatives were taken to strengthen the company for the years to come.
on a global scale, year 2010 was a very dynamic one, with the global economy witnessing a quick recovery. At the end of last year 200 million more people were accessing the Internet than the year before and 15 million tablet Pcs were sold globally. Driven by the combination of increased global purchasing power and the hunger to search out and share information, society is well on its way to being always connected – truly independent of time and location. social media has really transformed global patterns of Internet utilization for everyone, from kids to grandparents. These trends also serve as important components for the steps we are taking to benefit from new opportunities.
F-Secure in 2010Today people are more exposed in the Internet than ever before. As our lives become more and more digitalized, security services continue to play a vital role in society by providing safety for Internet citizens globally. Interestingly, the market for security has continued to grow for over twenty years in a row. The storage related services market, such as share/synch/back-up, is at an early stage of development compared to the security market. The expansion of combined security and storage services is expected to keep growing for the years to come with f-secure’s service offering continuing to be highly competitive in every market we operate in.
ceo leTTeR 2010
During the past year we continued on our path of being the “best value added services partner for operators globally”. our financial performance continued at a solid level, with record revenues of 130 million and healthy profitability of 20 million. All in all, the financial results were well within our projections, as we had anticipated that a number of investments and restructuring programs would be required to drive our long-term competitiveness and growth. In 2010 a high level of attention was directed towards the integration of the acquired steek sA (in 2009) and the overall restructuring of the company, aiming at a simplified organization and faster decision making.
During the past year, the number of our operator partners continued to expand convincingly. A number of important agreements were announced, including AT&T (United states), fastweb (Italy), starhub (singapore), celcom (Malaysia), and frontier communications (United states). After our tenth year of software as a service with operators, our partner network is clearly the strongest ever!
Receiving the Product of the year award from AV-comparatives, one of the major independent testing organizations in the industry, was a great way to end the year. It confirmed to our customers, partners and ourselves that we have a world class product and exceptional expertise in this company. With consistently excellent test results throughout 2010, we can be justifiably proud of our achievements over the past year.
Security landscape in 2010security news during the last months of 2010 was dominated by Wikileaks and the politically motivated online attacks carried out
by THe enD of 2010, We HAD An ADDRessAble MARkeT of oVeR 100 MIllIon bRoADbAnD cUsToMeRs THRoUgH oUR oPeRAToR PARTneRs.

annual rePort 7
by its opponents and supporters. clearly the most significant malware development of the year – and perhaps of the whole decade – was the highly sophisticated stuxnet worm targeting factory systems and altering automation processes. Unfortunately, it is likely that we will see stuxnet copycats in the future.
The Windows 7 operating system has been lauded as a safer operating system than its predecessor Window Vista. Despite overtaking Vista in terms of market share this year, Windows 7 is still far behind Windows XP, which remains by far the most popular operating system and the biggest target for malware writers.
on the mobile security side, the number of mobile malware has not increased dramatically in 2010, although we saw developments that may give pointers to future trends. for example, infected versions of mobile games were uploaded to freeware download sites, infecting phones and making secret calls to expensive premium rate numbers. over the next year, we foresee more mobile malware targeting the Android platform and jailbroken iPhones.
our prediction remains that security services will become, over time, equally important for smartphones and tablets as they have been for the traditional Pcs.
Foundation for a promising future based on a number of attractive reflection points in the market and the operator community, we are optimistic about the years to come. We can also rely on our healthy corporate business and our growing Direct consumer business, which is crucial to introducing and piloting new features promptly.
The Product of the year award has shown our passion to serve our customers’ needs. With the new ways of working which we have implemented, we will continue further on this path of excellence. The Internet is full of information and entertainment as well as opportunities that we must seize boldly. We’ll make sure that users around the world get the most out of every Internet experience without worry or fear. f-secure’s mission is to safeguard digitally connected lives by conveniently securing all devices and backing up users’ irreplaceable content.
our technical and solution portfolio combines security and storage services that meet the evolving demands of online lives and social networks. We also expect our unified services and extensive attention to user experience to take a quantum leap forward. naturally we are committed to developing and delivering world class protection services for the years to come.
In conjunction with our service portfolio, our 200+ operator partner network is the foundation for building long-lasting commercial relationships on a global scale. given the momentum in the magnitude of partnerships recently formed, we can also expect attractive developments in the number of mobile and broadband Internet users we will be servicing.
our commitment to increase value for our partners, customers, employees and shareholders inspires us to fulfill our mission with the innovation and reliability that have become f-secure’s trademark. looking forward to Protecting the irreplaceable for the years to come!
kimmo AlkioPresident & ceo
oUR coMMITMenT To IncReAse VAlUe foR oUR PARTneRs, cUsToMeRs, eMPloyees AnD sHAReHolDeRs InsPIRes Us To fUlfIll oUR MIssIon WITH THe InnoVATIon AnD RelIAbIlITy THAT HAVe becoMe f-secURe’s TRADeMARk.

8 annual rePort
Financial performance and key figures f-secure’s overall performance was good while the operator business was very strong during the year; security as a service sales delivered accelerating growth, storage related deliveries with major operator partners progressed well and company completed major operator wins during the year. year 2010 was another year providing profitable growth and the recent development will provide an excellent base for future.
company’s total revenue for 2010 was eUR 130.1 million (2009: 125.1m), representing a growth of 4%. solid revenue growth continued in the operator channel, up by 12% and 67.1m in total. business through the traditional channels was as expected, slightly down by 3% and 63m in total, representing 48% (52%) of company’s total revenues. earnings before interest and taxes (ebIT) was 19.8 million (24m), representing 15% of revenues, 18% lower than in 2009. ebIT excluding restructuring costs was 21.8m, representing 17% of revenues; 9% lower than in 2009. earnings per share (ePs) were eUR 0.10 (eUR 0.12). In 2010, the ebIT% was at 15% (19%).
cash flow from operations was 23.2 million positive (16.4m positive). Deferred revenue increased to 37.2m at the end of year (35.6m at the end of December 2009) mainly because of healthy renewal sales in the traditional license sales.
Total costs were 103.2 million (92.3m), representing 12% growth. The costs increased during the year mainly because of investments and running costs of the storage and digital content business unit, in R&D and in sales and marketing. In addition, there were one-time costs of approximately 2 million due to reorganization of the operations that was completed in november 2010. f-secure capitalized some of its R&D expenses according to accounting rules, totaling 2.3 million (1.7m) during 2010. In addition to one-time restructuring costs, the targeted cost increases in the storage business continued and were mainly non-permanent in nature (e.g. subcontracting) and related to the unit's transformation program and successful customer deliveries.
The company gave quarterly financial guidance for company revenue and cost levels as well as the annual market growth expectation. The financial performance for each quarter of 2010 met the targets set in the guidance.
In the end of 2010 the geographical breakdown of the revenues split as follows: finland and scandinavia 33% (35%), Rest of europe 46% (46%), north America 9% (8%) and Rest of the World 12% (11%). further information on the key financial data is presented in note 29 to the financial statements.
Operator channel in 2010f-secure’s portfolio in the software as a service business includes Pc and mobile security and a broad range of storage based services. f-secure’s business through the operator channel (including IsP’s, mobile operators and cable operators) continued to perform well. The annual revenues were 67.1m (60.2m), representing 52% of the total revenues (48%) and a growth of 12% from 2009. The impact of contractual changes with some operators at the beginning of 2010 had approximately 6% negative impact on the yoy growth.
boARD of DIRecToRs’ RePoRT 2010
f-secure’s position in the operator channel is strong in the traditional Internet security business. The competitiveness of security as a services business continues to gain market share to the benefit of both operators and end customers. During the quarter the number of internet security subscribers in the operator business has continued to grow. This growth was mainly driven by the increase in subscriber take-up rates within the existing operator base both in western and emerging markets. f-secure has also been successful in its activities with mobile broadband operators to support the operator business growth in the future.
The storage and Digital content (sDc) market entry has strengthened f-secure’s attractiveness as a long term strategic partner, as already experienced with several major operators globally. The sDc business extends f-secure’s value added service portfolio and strengthens the security as a service business. Integration of the sDc operations to the high f-secure quality standards has continued throughout 2010. During Q4 predictability of both project deliveries and service quality made progress. currently the storage business requires investments both for the transformation and increasing number of customer projects. However, the transformation related costs are temporary in nature and return on the investments is seen gradually during 2011.
During the year, f-secure completed several commercial negotiations and signed several operator agreements. At the end of 2010, f-secure strengthened its market position in north America as a result of recent agreements with AT&T (one of the biggest operators in the world), for storage services.
The total number of f-secure’s operator partners is significantly larger than that of any other security service vendor. During the year company signed several major operator partnerships, such as biglobe (Japan), Vodafone companies (Romania, Portugal and spain), 3 (Italy and sweden), AT&T (UsA), frontier (UsA), fastweb (Italy) and celcom (Malaysia). The company currently has more than 200 partners in over 40 countries with an addressable market of over 100 million broadband consumer customers. geographic distribution of the addressable market is as follows; approximately 67m in europe, approximately 13m in north America (excl. AT&T), close to 5m in latin America and in the APAc region with more than 14m potential addressable subscribers (source: estimates by f-secure).
Business through other channelsThe annual revenues for 2010 were 63m (64.9m), representing 48% of the total revenues (52%) and a decline of 3% compared to 2009.
The sales in traditional channels continued well as expected. customer satisfaction to security services are at high level that is visible as healthy license renewal rates.
Mobile securitycooperation with major handset manufacturers, including nokia, and operators such as Vodafone group, Teliasonera group, T-Mobile International, swisscom and elisa continued well during

annual rePort 9
the year. currently, f-secure has mobile operator partnerships with more than 20 operators worldwide.
As the number of internet connected devices increase in the world, the company continued to develop several security services for mobile devices. f-secure’s Anti-Theft offering has been available for downloads in nokia’s ovi store. During the year, f-secure also announced that its Mobile security and Anti-Theft for Mobile solutions for mobile devices on the symbian3 platform. f-secure Anti-Theft for mobile was selected by nokia as a pre-installed 3rd party app for its new symbian3 models, such as the nokia n8. During the year, mobile security services were made available for the tablet market on Android operating system in addition to Android smart phones.
The revenues from the Mobile security business have remained at same level as before and are included in the above mentioned channels.
Products and servicesf-secure has been a pioneer in both software as a service and cloud computing. nearly ten years ago, f-secure innovated and launched to the market a new business model by offering security as a subscription service via operators (saas). cloud computing has been in the center of the company’s technology strategy and choices for the past few years. An example of cloud computing at f-secure is the real-time protection network which provides reputations of files, sites and URls to f-secure’s solutions. It is implemented as an in-the-cloud reputation service, capable of supporting several types of solutions now and in the future.
The real-time protection network moves the Pc processing and memory intensive functions to the cloud making the client software one of the fastest in the industry. furthermore, by harnessing the collective intelligence of client systems, the real-time protection network is able to detect and react to new emerging threats a magnitude faster. This is important in today’s dramatically changed threat situation where the Internet is facing a deluge of new malware and variants that make traditional heuristics or signature-based solutions inefficient and slow. This technology has been utilized for example in anti-virus, browsing protection and parental control features in f-secure Internet security and f-secure client security solutions.
Another dimension of cloud computing is the online storage area where f-secure has made a significant investment into carrier-grade storage infrastructure. This flexible and scalable cloud storage platform enables f-secure to tackle even the most complex requirements of the largest operators in the world while at the same time making small deployments feasible to enable new solutions to be trialed in a fast and incremental manner. In practice this means that new, experimental solutions such as various types of synchronization and sharing services will seamlessly utilize the same storage back-end systems as the mass-market online backup services.
furthermore, the extraction of the cloud security concepts from the Pc context and combination of these two cloud-based technologies will in the future allow f-secure to create new and
innovative solutions in the social media sphere. The first of such services such as safe links for protecting site owners against inadvertent distribution of malicious links are currently being trialed in public beta.
f-secure has continued to invest in user experience design when developing solutions and service offerings. UX designers, marketers, and developers have engaged in consumer research, focus groups, and usability tests, to explore consumer needs, and validate new product and service prototypes with consumers to ensure that they are appealing and usable when introduced to the public. User experience and design topics, in addition to technical performance, are crucial for commercial success of solutions and services.
In January 2011, f-secure received the “Product of the year” award issued by AV-comparatives, one of the major independent testing organizations in the industry. The testing organization described Internet security 2011 a well-designed product with a clear and easy-to-use interface.
During 2010 the key product announcements were the following:
In november, a new version of f-secure Protection service for business was introduced. This is a turnkey solution for small and medium-sized companies.
In october, a new version of f-secure Messaging security gateway was introduced. This application offers powerful email encryption in addition to industry-leading spam filtering and anti-virus capabilities for corporate environment.
In october, f-secure announced that its Mobile security and Anti-Theft for Mobile solutions are now available for mobile devices on the symbian3 platform. f-secure Anti-Theft for mobile has been selected by nokia as a pre-installed 3rd party app for its new symbian3 models, such as the nokia n8. f-secure Anti-Theft for Mobile is available as a free stand-alone product, and as part of f-secure Mobile security 6, which offers a complete security package.
In september, f-secure announced a new version of its flagship internet security service, f-secure Internet security™ 2011. f-secure Internet security™ 2011 offers extraordinary ease-of-use, with multi-layered protection and fast performance for computers. The main features of the f-secure Internet security™ 2011 include protection against viruses and spyware, firewall to prevent hacker attacks, browsing protection that identifies unsafe web sites, protection against identity theft, blocking of spam and phishing e-mails as well as parental control to protect children online. The intensive research into computer users’ needs has produced security software that is easy to use and sophisticated in its technological capabilities to fight malware. The service is cloud-based and has minimal system impact.
In August, f-secure published a new version of the f-secure online backup. With f-secure online backup your backed-up files can be easily accessed over the Internet. In addition to the sharing

10 annual rePort
feature, the new version of f-secure online backup includes modified default settings to enable faster backup, as well as an enhanced web interface for ease of use.
In June, f-secure offered enhanced mobile protection for Android platforms. f-secure Mobile security 6 is available for consumers and businesses for mobile phones on the Android, symbian and Windows platforms.
In May, f-secure introduced f-secure share available for operators globally. f-secure share is a fully hosted and secure service solution available to Internet operators. It provides an easy to use online storage and sharing solution for the operators’ end customers, ideal for sharing for example personal photos, videos and office documents. f-secure share works as a virtual drive for all the end user’s digital content, which can be easily accessed from the web interface of their home Pc, office computer or mobile.
In february, f-secure launched f-secure Mobile security 6, a new version of its leading smartphone security solution, introducing Premium Anti-theft with locator features and browsing Protection, the company’s first in-the-cloud service for mobile devices, which make smartphone Internet use and financial transactions safer than ever. f-secure Mobile security 6 provides smartphone security, safeguarding personal and confidential data in the event the phone is lost, stolen, infected by mobile malware or even spied on.
In January 2010, f-secure launched the availability of its new smartphone solution, f-secure Anti-Theft for Mobile. The solution provides three useful security features to protect your phone: remote lock, remote wipe and theft control and is available for symbian and Windows Phone platforms.
research and developmentIn 2010, the group’s research and development expenses totaled 34.5m (28.0m). The group also capitalized some of its R&D expenses according to accounting rules, totaling 2.3m (1.7m) for 2010.
Market situationThere were no significant changes in the competitive landscape or in the pricing levels in the security space during the quarter. consolidation in the storage and digital content market continued, with many of f-secure’s traditional competitors entering the space. Usual signs of price competition are evident in some countries in the security area, while the storage and digital content space at large is beginning to shift towards more sustainable business models through consolidation. f-secure's competitive position in the operator channel has remained strong. At the same time the broadband market is experiencing a shift from fixed to mobile broadband access. The combined broadband business is anticipated to continue as a healthy growth driver for security as a service in the operator channel.
reorganization of operations to drive growth f-secure's first priority is to drive growth and market expansion. The core growth driver has been software as a service (saas) sales
through the operators. However, to drive faster growth f-secure reorganized its operations to further emphasize and increase activities in the operator channel to take advantage of the market opportunity for value added services. f-secure streamlined its organization to a functional structure and eliminated overlapping roles. The objective is to drive growth, speed and innovation. These structural changes and related efficiency gains are intended to also fund future growth investments for the software as a service business globally.
In october, f-secure initiated employee negotiations with the employee representatives in finland to plan the organizational changes. The management estimated that the employee negotiations may lead to reduction of 80 employees out of which up to 50 in finland. The scope of the employee negotiations covered all employee groups and functions in f-secure. The negotiations were concluded in november and as a result of the negotiations, the company’s personnel were reduced by a maximum of 59 employees, of which 34 in finland. The restructuring program was completed in Q4 as planned. The new organization structure was effective in January 2011.
Personnel and organizationf-secure's personnel totaled 812 at the end of December (end of Dec. 2009: 826). f-secure’s number of personnel has continued to increase slightly during the year especially in the storage business, support, and sales functions.
As of January the current executive Team consists of the following persons: kimmo Alkio (President and ceo), Ari Alakiuttu (Vice President, Human Resources), Tuomas Hyyryläinen (Vice President, strategy and M&A), samu konttinen (Vice President, sales and Marketing), Maria nordgren (Vice President, channels), Pirkka Palomäki (chief Technology officer), kari Penttilä (Vice President, R&D), Patrik sallner (Vice President, Professional services ), Antti Reijonen (Vice President, solution and Portfolio Management) and Taneli Virtanen (chief financial officer).
Financing and capital structuref-secure's financial position continued strong. f-secure's equity ratio at the end of December was 69% (70%) and gearing ratio was 63% negative (68% negative).
cash flow from the operations for 2010 was 23.2 million positive (16.4m positive). Total cash flow including investments, share buy-backs and dividend payment was 1.5 million negative (27.4m negative including acquisition cost, dividends and share buy-back). The net financial income for 2010 was approximately nil impacted by low interest income and changes of exchange rates losses (1.2m).
The company’s cash position has developed according to the longer term efficient capital management objectives. The market value of the liquid assets of f-secure on December 31, 2010 was 32.8 million (33.6m).
changes in exchange rates, eUR against UsD, JPy, gbP, sek and MyR, have slightly increased revenues and costs during 2010.

annual rePort 11
capital expenditureThe company's investments in tangible and intangible assets in 2010 were 10.4 million (37.2m), consisting mainly of IT hardware and software as well as capitalization of some research and development expenses.
Shares, shareholders’ equity, and option programsIn December, a total of 50,000 f-secure shares were subscribed for with the c warrants attached to the f-secure 2005 Warrant Plan. The issue of the 2005 Warrant Plan was approved by the Annual general Meeting on March 23, 2005. In aggregate the number of shares was increased by 50,000. The corresponding increase in the share capital was registered in the finnish Trade Register on Dec 8, 2010. f-secure received as subscription price a total amount of eUR 77,000.00, which was recorded in the fund for company's distributable equity. As a result of the registering the total number of shares is 157,539,243. The trading with the new shares commenced on Dec 9, 2010. The subscription period for the 2005 c warrants began on March 1, 2010.
In May, a total of 20,000 f-secure shares were subscribed for with the 2005c warrants attached to the f-secure 2005 Warrant Plan. The issue of the 2005 Warrant Plan was approved by the Annual general Meeting on March 23, 2005. In aggregate the number of shares was increased by 20,000. The corresponding increase in the share capital was registered in the finnish Trade Register on May 26, 2010. f-secure received as subscription price a total amount of eUR 30,800.00, which were recorded in the fund for company's distributable equity. The subscription period for the 2005 c warrants began on March 1, 2010.
In March, the trading of 2005 b- and c-warrants of f-secure corporation commenced on the nasdaq oMX Helsinki ltd. each 2005 b-warrant entitles holders to subscribe for one f-secure share at a price of eUR 2.72. each 2005 c-warrant entitles holders to subscribe for one f-secure share at a price of eUR 1.54. The subscription price of the stock options shall, as per the dividend record date, be reduced by the amount of dividend per share. The subscription time for 2005 b-warrants began on March 2, 2009 and ended on november 30, 2010. The subscription time for 2005 c-warrants began on March 1, 2010 and ended on november 30, 2011. The terms of the option program were published in a stock exchange release on february 26, 2010.
The total number of company’s shares is currently 157,539,243. The corresponding number of shares diluted would be 160,990,852 including all stock option programs. The company’s registered shareholders’ equity is eUR 1.551.311,18. More information on the stock option programs is available on the company’s Investors website.
f-secure has one class of shares, and each share entitles one vote. further information on the group’s option programs and shares can be found in notes 18 and 19 to the financial statements.
capital management, dividend policy and repurchase of own sharesThe objective of f-secure’s capital management is to aim at an
efficient capital structure that ensures the functioning of business operations and promotes the increase of shareholder value.
During 2010, f-secure has continued its share buyback program based on the authorization by the Annual general Meeting 2010. During 2010, f-secure has bought in total 1,757,867 own shares. Including all shares bought, the total number of own shares held at the end of December 2010 was 3,307,313 shares, corresponding to approximately 2.1% of the company’s shares and voting rights. The shares were purchased through public trading on the nAsDAQ oMX Helsinki ltd. in accordance with its rules and at market price.
The own shares are purchased to be used to improve the company's financial structure, to be used as part of the incentive compensation plan, for making acquisitions or implementing other arrangements related to the company's business or for the purpose of otherwise assigning or cancelling the shares. further information on the group’s share repurchases can be found in note 18 to the financial statements. The dividend policy of f-secure is to pay approximately half of its annual profits as dividend. subject to circumstances, the company may deviate from this policy.
risks and uncertainties f-secure has not seen material changes in the risks and uncertainties during the reporting period. The slower growth in sales of fixed broadband connections by operators may also have an impact on security service sales. As the uncertainty in the economic environment especially in europe has continued, f-secure continues to monitor closely the development in the economic and financial markets.
f-secure's risks and uncertainties are related to, among other things, the competitiveness of f-secure's product portfolio, competitive dynamics in the industry, pricing models (e.g. free services), impact of changes in technology, timely and successful commercialization of complex technologies as new products and solutions, the ability to protect own intellectual property (IPR) in f-secure's solutions as well as the use of third party technologies on reasonable commercial terms, subcontracting relationships, regional development in new growth markets, sustainability of partner relationships, compromising stored personal data and service quality related penalties.
Due to the longevity and complexity of project deliveries in the storage and digital content business, the project completion timelines and related revenues are more unpredictable, by nature, than in the traditional security services business. This may cause risks for delivery delay penalties and may cause more variability in revenue forecasts.
Disputes and litigationsf-secure corporation is a party to a dispute in brazil regarding a distributor relationship and will defend itself accordingly, including through an arbitration process in finland. The group does not expect any material impact on its financials from this lawsuit.
In 2010, f-secure Inc. the U.s. subsidiary of f-secure corporation was dismissed from a patent infringement lawsuit filed in a state court in the U.s in December 2008.

12 annual rePort
corporate governancef-secure complies with the corporate governance recommendations for public listed companies published in June 2010 by the securities Market Association, a body established by the confederation of finnish Industries ek, the central chamber of commerce, and nAsDAQ oMX Helsinki ltd., as explained on f-secure’s web pages. f-secure has published a corporate governance statement for 2010 in this annual report and on the company website in March. The remuneration statement was published on the company website corporate governance pages as of october, 2010. More information on corporate governance in f-secure can be found on the company webpages.
Shares and shareholdersAccording to the shareholder register held by euroclear finland ltd., f-secure’s largest shareholders at the end of 2010 were finnish private households (60.6%), finnish public sector institutions (12.4%), finnish financial and insurance institutions (20.9%), foreign investors (0.2%), finnish corporations (4.5%) and finnish non-profit organizations (1.4%). The shareholders that have more than 5% of the shares and votes in f-secure are Risto siilasmaa (40.0% of shares and 40.9% of voting rights) and the Ilmarinen mutual pension insurance company (6.33% of shares and 6.5% of voting rights).
At the end of the year, f-secure’s share price was eUR 2.00 (2.74), the lowest price during the year being eUR 1.97 and the highest being eUR 2.93. At the end of December, the market capitalization of f-secure corporation shares totaled eUR 315 million (431). During the year, the trading volume in 2010 was around 66 million shares (55) or eUR 150 million (134) on the nAsDAQ oMX Helsinki ltd. The company’s P/e ratio was 20.3 (22.8).
further information on shares, the largest shareholders and the share ownership of the board of Directors and the executive team can be found on note 28 to the financial statements. Up-to-date information on major shareholders is available on the company web site.
events after the period-endno material changes regarding the group’s business or financial position have materialized after the end of December 2010.
Annual general Meeting 2010The Annual general Meeting of f-secure corporation was held on March 24, 2010. The Meeting confirmed the financial statements for the financial year 2009. The members of the board and the President and ceo were granted a discharge from liability. The Annual general Meeting decided to distribute a dividend of eUR 0.06 per share, which was paid to those shareholders that on the record date of March 29, 2010 were registered in the Register of shareholders held by euroclear finland ltd. The dividend was paid on April 8, 2010. further, the board of Directors was authorized to grant during year 2010 no more than eUR 100 000 to support activities of universities and colleges.
It was decided that the annual compensation remain on a previous year’s level; for the chairman is eUR 55,000, for the chairmen of executive and Audit committee eUR 40,000 and for members eUR 30,000. Approximately 40% of the annual remuneration will be paid as company shares.
It was decided that the number of board members would be six. The following members were re-elected: sari baldauf, Pertti ervi, Juho Malmberg and Risto siilasmaa. Anu nissinen and Jussi Arovaara were elected as new members of the board. The board elected in the first meeting Mr. siilasmaa as the chairman of the board. The board nominated Ms. baldauf as the chairman of the executive committee and Mr. siilasmaa the member of the executive committee. Mr. ervi was nominated as the chairman of the Audit committee and Mr. Arovaara, Mr. Malmberg ja Ms. nissinen were nominated as members of the Audit committee.
The auditor’s fee will be paid against approved invoice. ernst & young oy was elected the group’s auditors. APA, Mr. erkka Talvinko is acting as responsible partner. It was decided that the board of Directors may pass a resolution to purchase a maximum of 13.000.000 shares of the company. The amount represents approximately 8.3% of all the shares issued by the company. The authorization is valid for one year. The authorization covers the purchase of shares through public trading on the nAsDAQ oMX Helsinki ltd. in accordance with its rules or through a public tender offer made to the shareholders of the company. The own shares will be purchased to be used for making acquisitions or implementing other arrangements related to the company's business, to improve the company's financial structure, to be used as part of the incentive compensation plan or for the purpose of otherwise assigning or cancelling the shares. The board of Directors shall have the right to decide on other matters related to the purchase of the company’s own shares.
The Annual general Meeting authorized the board of Directors to decide on a transfer of a maximum of 15.500.000 own shares of the company either against consideration or without payment. The authorization is valid for one year. The shares may be transferred as a consideration to finance acquisitions or in other arrangements and used as part of the equity-based incentive plans of the company as decided by the board of Directors. The board of Directors shall also have the right to sell the shares through public trading on the nAsDAQ oMX Helsinki ltd. The board of Directors shall have the right to decide on other matters related to a transfer of own shares.
The Annual general Meeting also authorized the board of Directors to decide on the issuance of shares. The amount of shares to be issued based on this authorization shall not exceed 40.000.000 shares. board of Directors decides on all the conditions of the issuance of shares. The authorization is valid for 18 months. The authorizations are available in full on the company Investor web pages under general Meetings.
Long-term objectivesThe long term market opportunities are attractive for f-secure. The demand for Value Added services, like Internet security, storage services, is driven by the expansion of Internet users and Internet connected devices.
The growth of Internet users grew by 200m close to 2b in one year (sept 09 – sept 10). The global Internet penetration is still globally below 30%; in Asia it is slightly over 20%, in europe close 60%, and in north America close to 80% (source: Internet World stats, U.s. census bureau, estimated in June 2010). The growing number of smart phones and other Internet connected devices is expected to accelerate tens of billions during next 10 years (source; gigaom/ ericson)

annual rePort 13
The security software market as a total is attractive globally. The global security software revenue worldwide estimate for 2010 is $16.5bn, reflecting a 10% annual growth rate for 2010. consumer security software growth is expected to show cAgR of 6.5% 2007-2014 (source: source: gartner Jul. 2010).
The volume of user generated digital content is expected to continue to increase rapidly during coming years driven by digital photos and music. The Use of social media is increasing and people look for services to share, store and control of their personal data. IDc forecasts this storage as a service market to pass $3bn by 2012, with a compound annual growth rate of more than 29% from 2007 to 2012.
The security as a service (saas) business has been a strong growth driver for f-secure since the year 2000. based on the company’s strong technology assets in security, cloud computing and in storage area and based on its pioneering role in offering software as a service, f-secure continues to create new innovative offerings to augment traditional security services.
based on experience of the software as a service business model, f-secure anticipates that both the customer benefits (e.g. lower total cost of ownership) and attractive partner business benefits (e.g. lifetime revenue share) will accelerate the adoption of the software as a service business model compared to traditional software acquisition as a product.
f-secure’s first priority is to drive growth and market expansion. The company sells its Value Added services to consumers through its large operator network of over 200 operator partners in over 40 countries with an addressable market of over 100 million broadband customers.
f-secure focuses on increasing the penetration within the current operator base with security and storage related services and continues to selectively seek partner expansion globally; especially in emerging markets. The penetration rates vary by operator; overall penetration levels are relatively low and leave substantial opportunity for growth. The combination of security and storage services attract a larger customer base and has proven to drive penetration rates.
f-secure’s close co-operation with major mobile phone vendors and mobile phone operators provides good opportunities to benefit from the growth of the mobile Internet. over time, f-secure anticipates synergies across the Value Added services being developed and offered both for Pc’s and smart phones.
f-secure’s target is to be the best partner for operators in providing value added services to consumers. f-secure pursues investments in new value added services for both Pc and mobile users to augment the existing security and storage services.
f-secure aims to exceed the average market growth rates in revenues and seeks to improve its profitability sustainably towards an ebIT level of 25% over time. f-secure’s longer term profitability level continues to be driven extensively by revenue growth and scalable operations. f-secure targets its investments in strategic growth businesses, specifically the operator channel.
Short-term outlookcombination of latest operator wins together with competitive service portfolio have further improved the company’s growth projections. operator revenues are expected to deliver accelerating growth driven by security sales, storage related project deliveries and storage service sales. The traditional security license business related revenues are not estimated to contribute to revenue growth.
The management estimates annual revenue growth to accelerate to around 10%. The company continues to prioritize growth over short term profitability and plans to invest majority of the improved earnings back to growth opportunities in its core business. Annual profitability is expected to improve from 2010 level at a comparable pace to revenue growth (compared to 2010 ebIT excl. re-structuring).
Revenue growth is expected to accelerate and profitability to improve after the first quarter. for the first quarter storage project delivery related revenue contribution is limited, while total cost base remains consistent with the Q4 level. The majority of operational cost increases are targeted to drive product portfolio competitiveness, build scalability of the storage services business and geographical expansion. The revenue estimate is based on the sales pipeline at the time of publishing, existing subscriptions and support contracts as well as current exchange rates.
Proposal for dividend distributionThe board of Directors is proposing to the Annual general Meeting 2011, to be held on Wednesday March 30, 2011, that a dividend of eUR 0.06 per share is to be paid from the distributable shareholders’ equity. The suggested dividend record date is April 4, 2011 and the payment date April 12, 2011. The dividend payout ratio is 61%.
on December 31, 2010, the parent company distributable equity totaled 51.1 million.
no material changes have taken place in the company’s financial position after the balance sheet date and the proposed dividend does not compromise the company’s financial standing.
Helsinki, february 16, 2011
F-Secure corporation
Board of DirectorsRisto siilasmaaJussi Arovaarasari baldaufPertti erviJuho MalmbergAnu nissinen
President and ceOkimmo Alkio

FInanCIal StatementS
14 F-SeCure ConSolIDateD
equity ratio, % shareholders’ equity + minority interest
balance total - received advance payments
rOi, % Result before taxes + financial expenses
balance total - non-interest bearing liabilities (average)
rOe, % Result before taxes - taxes
shareholders’ equity + minority items (average)
gearing, % Interest bearing liabilities - cash and bank accounts, liquid financial assets
shareholders’ equity + minority items
earnings per share, euro Result before taxes - taxes +/- minority interest
Adjusted number of shares (average)
Shareholders’ equity per share, euro shareholders’ equity
Adjusted number of shares, Dec 31
P/e ratio share price closing, Dec 31
earnings per share
Dividend per earnings, % Dividend per share
earnings per share
effective dividends, % Dividend per share
share price closing, Dec 31
conTenTs
financial statements 14
f-secure consolidated 15
statement of comprehensive income 16
statement of financial position 17
statement of cash flows 18
statement of changes shareholders’ equity 19
notes to the financial statements 19
f-secure corporation 39
Income statement 40
balance sheet 40
cash flow statement 41
notes to the financial statements 42
Auditors’ report 51
cAlcUlATIon of key RATIos

FInanCIal StatementS
F-SeCure ConSolIDateD 15 F-SeCure ConSolIDateD 15
FInanCIal StatementS
f-secURe consolIDATeD
FInanCIal StatementS
16 F-SeCure ConSolIDateD
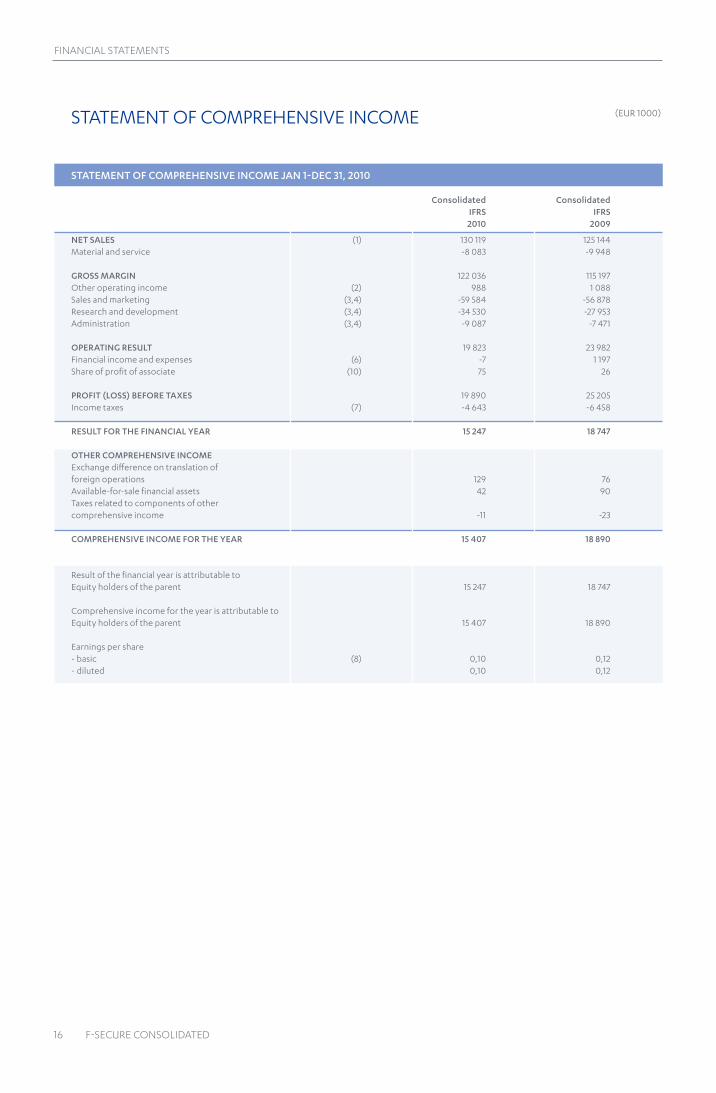
sTATeMenT of coMPReHensIVe IncoMe (eUR 1000)
STATeMeNT OF cOMPreHeNSiVe iNcOMe JAN 1-Dec 31, 2010
consolidated consolidated iFrS iFrS 2010 2009
NeT SALeS (1) 130 119 125 144Material and service -8 083 -9 948
grOSS MArgiN 122 036 115 197other operating income (2) 988 1 088sales and marketing (3,4) -59 584 -56 878Research and development (3,4) -34 530 -27 953Administration (3,4) -9 087 -7 471
OPerATiNg reSuLT 19 823 23 982financial income and expenses (6) -7 1 197share of profit of associate (10) 75 26
PrOFiT (LOSS) BeFOre TAXeS 19 890 25 205Income taxes (7) -4 643 -6 458
reSuLT FOr THe FiNANciAL yeAr 15 247 18 747
OTHer cOMPreHeNSiVe iNcOMe exchange difference on translation of foreign operations 129 76Available-for-sale financial assets 42 90Taxes related to components of other comprehensive income -11 -23
cOMPreHeNSiVe iNcOMe FOr THe yeAr 15 407 18 890
Result of the financial year is attributable to equity holders of the parent 15 247 18 747
comprehensive income for the year is attributable to equity holders of the parent 15 407 18 890
earnings per share - basic (8) 0,10 0,12- diluted 0,10 0,12
FInanCIal StatementS
F-SeCure ConSolIDateD 17
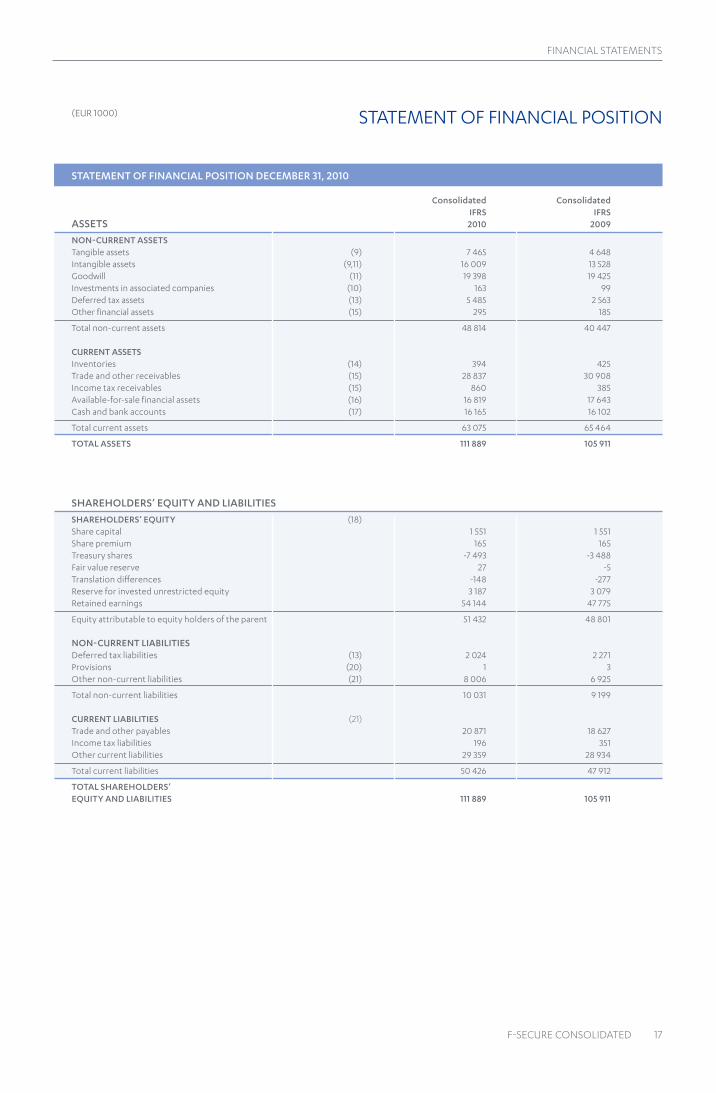
sTATeMenT of fInAncIAl PosITIon(eUR 1000)
STATeMeNT OF FiNANciAL POSiTiON DeceMBer 31, 2010
consolidated consolidated iFrS iFrSASSeTS 2010 2009
NON-curreNT ASSeTSTangible assets (9) 7 465 4 648Intangible assets (9,11) 16 009 13 528goodwill (11) 19 398 19 425Investments in associated companies (10) 163 99Deferred tax assets (13) 5 485 2 563other financial assets (15) 295 185
Total non-current assets 48 814 40 447
curreNT ASSeTS Inventories (14) 394 425Trade and other receivables (15) 28 837 30 908Income tax receivables (15) 860 385Available-for-sale financial assets (16) 16 819 17 643cash and bank accounts (17) 16 165 16 102
Total current assets 63 075 65 464
TOTAL ASSeTS 111 889 105 911
SHAreHOLDerS’ equiTy AND LiABiLiTieS
SHAreHOLDerS’ equiTy (18) share capital 1 551 1 551share premium 165 165Treasury shares -7 493 -3 488fair value reserve 27 -5Translation differences -148 -277Reserve for invested unrestricted equity 3 187 3 079Retained earnings 54 144 47 775
equity attributable to equity holders of the parent 51 432 48 801
NON-curreNT LiABiLiTieS Deferred tax liabilities (13) 2 024 2 271Provisions (20) 1 3other non-current liabilities (21) 8 006 6 925
Total non-current liabilities 10 031 9 199 curreNT LiABiLiTieS (21) Trade and other payables 20 871 18 627Income tax liabilities 196 351other current liabilities 29 359 28 934
Total current liabilities 50 426 47 912
TOTAL SHAreHOLDerS’equiTy AND LiABiLiTieS 111 889 105 911

FInanCIal StatementS
18 F-SeCure ConSolIDateD
sTATeMenT of cAsH floWs (eUR 1000)
STATeMeNT OF cASH FLOWS DeceMBer 31, 2010
consolidated consolidated iFrS iFrS 2010 2009
cASH FLOW FrOM OPerATiONS Result for the financial year 15 247 18 501Adjustments (24) 11 287 8 571cash flow from operations before change in working capital 26 534 27 072 cHANge iN NeT WOrkiNg cAPiTALcurrent receivables, increase (-), decrease (+) 3 003 -3 980Inventories, increase (-), decrease (+) 31 -296non-interest bearing debt, increase (+), decrease (-) 2 491 341Provisions, increase (+), decrease (-)
cash flow from operations before financial items and taxes 32 059 23 137 Interest expenses paid -8 -13Interest income received 17 145other financial income and expenses -437 1 220Income taxes paid -8 441 -8 089
cash flow from operations 23 189 16 400
cASH FLOW FrOM iNVeSTMeNTSInvestments in intangible and tangible assets -10 403 -5 000Investments in subsidiary shares, net of cash acquired (11) -1 055 -26 840other investments 4 -11Proceeds from sale of intangible and tangible assets 2 14
cash flow from investments -11 453 -31 837 cASH FLOW FrOM FiNANciNg AcTiViTieS Increase in share capital 108 950Treasury shares -4 004 -2 055Dividends paid -9 310 -10 904
cash flow from financing activities -13 207 -12 008
change in cash -1 471 -27 445
Translation difference 668 -95cash and bank at the beginning of the period 33 591 61 041
cash and bank at period end 32 788 33 501
change in net fair value of current available-for-sale assets 42 90
cash and bank at period end 32 831 33 591

FInanCIal StatementS
F-SeCure ConSolIDateD 19
sTATeMenT of cHAnges In eQUITy(eUR 1000)
STATeMeNT OF cHANgeS iN equiTy DeceMBer 31, 2010
Share Share Share Treasury Available Transl. unrestricted retained Total capital issue premium shares for diff. equity earnings equityiFrS fund sale reserve
equity Dec 31, 2008 1 551 661 169 -1 453 -71 -353 1 465 39 142 41 111
Available-for-sale financial assets, net 67 67Translation difference 76 76Result of the financial year 18 747 18 747
Total comprehensive income for the year 67 76 18 747 18 890
Dividends -10 904 -10 904Acquisition of treasury shares -2 035 -2 035Registration of share issue -661 -661exercise of options 1 611 1 611cost of share based payments 788 788other changes 3 3
equity Dec 31, 2009 1 551 169 -3 488 -5 -277 3 078 47 773 48 801 Available-for-sale financial assets, net 31 31Translation difference 129 129Result of the financial year 15 247 15 247
Total comprehensive income for the year 31 129 15 247 15 407
Dividends -9 310 -9 310Acquisition of treasury shares -4 004 -4 004exercise of options 108 108cost of share based payments 533 533other changes -103 -103
equity Dec 31, 2010 1 551 169 -7 493 27 -148 3 186 54 141 51 432
noTes To THe fInAncIAl sTATeMenTs
corporate informationf-secure produces software protection and internet security services for consumers and businesses against computer viruses and other threats coming through the Internet or mobile networks, as well as online backup services preventing loss of valuable content and enabling sharing of important files.
The parent company of the group is f-secure corporation incorporated in finland and domiciled in Helsinki. company’s registrant address is Tammasaarenkatu 7, 00180 Helsinki. A copy of consolidated financial statement can be received on the Internet address www.f-secure.com or from the parent company’s registrant address.
In their meeting on 16 february 2011 the board of Directors of f-secure corporation have agreed to permit the publication of the consolidated financial statements of f-secure corporation for the year 2010. According to the finnish companies Act, the Annual general Meeting can confirm or reject the consolidated financial statement after publication. The general Annual Meeting can also decide to change the financial statement.
AccoUnTIng PRIncIPles
basis for presentationThe consolidated financial statements of f-secure corporation of 2010 have been prepared in accordance with International financial Reporting standards (IfRs) as adopted by the eU. The disclosures also conform to finnish Accounting legislation.
The group has adopted the following new or amended standards and Interpretations during the year.
IfRIc 16 Hedges and net Investment in a foreign operation. The interpretation provides guidance on the accounting for a hedge of a net investment. As the company has no such hedges and net investments mentioned in the interpretation, the interpretation had no impact on the group’s financial statements.
IfRs 3 business combinations - revised. The revised standard recognises and measures the goodwill acquired in the business combination or a gain from a bargain purchase. The adoption of revised standard had no impact on the group’s financial statements.
IAs 27 Amendment: consolidated and separate financial statements. The revised standard requires that changes in a parent’s ownership interest in a subsidiary that do not result in the loss of control are accounted for within equity. The adoption of the revised standard had no effect on the group’s financial statements.
IAs 39 Amendment: eligible Hedged Items. The changes provides guidance for hedging of one-sided risks and inflation risks. The adoption of the revised standard had no impact on the group’s financial statements.
IfRIc 17 Distribution of non-cash Assets to owners. The interpretation applies to the distribution of non-cash assets or distributions that gives owners a choice of receiving either non-cash assets or a cash alternative.
FInanCIal StatementS
20 F-SeCure ConSolIDateD
The interpretation had no impact on the disclosures of group’s financial statements.
IfRIc 18 Transfer or Assets from customers. This interpretation applies to the accounting for transfers of items of property that the entity must use to connect the customer to a network or to provide the customer with ongoing access to a supply of goods or services. The interpretation had no impact on the group’s financial statements.
Improvements to IfRss (April 2009). There are separate transitional provisions for 12 standards, but the adoption of the improvements had no significant impact on the group’s financial statements.
IfRs 2 Amendment: group cash-settled share-based Payment Transactions. An entity shall apply this IfRs in accounting for all share-based payment transactions, whether or not the entity can identify specially some or all of the goods or services received. The adoption of the revised standard had no impact on the group’s financial statements.
Management judgment and use of estimatesThe preparation of financial statements in accordance with IfRs requires the use of estimates and assumptions as well as use of judgment when applying accounting principles that affect the reported amount of assets and liabilities, the disclosure of contingent assets and liabilities at the date of the financial statements, and the reported amounts of revenues and expenses during reporting periods. Although these estimates are based on the management’s best knowledge, actual results may differ from those estimates. Possible changes in estimates and assumptions are recognized in the period when they occur.
The key judgments and assumptions concerning the future and other key sources of estimation, that have a significant risk of causing an adjustment to the carrying amounts of assets and liabilities, are following:
- The group has entered into commercial agreement related to storage services. The group has determined, based on terms and conditions of the agreement that project revenue should be recognize using the percentage-of-completion method. Value of the multi-year agreement is not disclosed, while significant to f-secure.
- impairment of assets: The key assumption used to determine the recoverable amount for goodwill, including sensitivity analysis, are further explained in note 12;
- deferred tax assets: The group has recognized tax losses as deferred tax assets. further details are disclosed in note 13;
- development expenditures carried forward: initial capitalization of cost is based on management’s judgment on technological and economical feasibility. further details are disclosed in note 9.
- used arguments when recognizing share-based payment transactions: the assumptions and models used for estimating fair value for share-based payment transactions are disclosed in note 19.
Principles of consolidationsubsidiaries in which f-secure corporation’s holding exceeds 50 percent are consolidated in the financial statements. subsidiaries are consolidated from the date on which control is transferred to the group and cease to be consolidated from the date on which control is transferred out of the group. The company’s holding in the associated companies is also consolidated. The group’s investment in its associate is accounted for under the equity method of accounting. The income statement reflects the share of the results of operations of the associate. equity accounting is discontinued when the carrying amount of the investment in an associated company reaches zero, unless the group has incurred or guaranteed obligations in respect of the associated company.
All intra-group transactions and balances, including unrealized profits arising from intra-group transactions, have been eliminated on consolidation. Where necessary, the accounting policies of subsidiaries have been adjusted to ensure consistency with the policies adopted by the group.
foreign currency translationThe presentation currency of f-secure group is the euro, which is the measurement currency of the parent. for purposes of inclusion in the consolidated financial statements, the balance sheet of each foreign entity is translated into euros at the exchange rates prevailing at the balance sheet date. The income statement of each foreign entity is translated at the average exchange rates for the financial year. The resulting net translation difference is recorded in the shareholders’ equity.
The consolidated statement of cash flows has been prepared by translating each subsidiary’s individual cash flow statements at the average exchange rates for the financial year.
foreign currencies are translated into the local currency using fixed monthly exchange rates. At the balance sheet date, assets and liabilities denominated in foreign currencies are translated at the rates of exchange prevailing at that date. exchange rate gains and losses of financial transactions are recognized in the income statement under financial items.
Intangible assetsgoodwillMutual ownership of shares has been accounted using the acquisition method. The cost of an acquisition is measured at the fair value of the assets given up, shares issued or liabilities undertaken at the date of acquisition plus costs directly attributable to the acquisition. The excess cost of acquisition over the fair value of the net assets of the subsidiary acquired is recorded as goodwill. goodwill represents the excess of purchase cost over the fair value of separately identifiable assets less liabilities of acquired companies. following initial recognition, goodwill is measured at cost less any accumulated impairment losses. goodwill is reviewed for impairment, annually or more frequently if events or changes in circumstances indicate that the carrying value may be impaired.
Technology and customersIntangible assets recognized separately from goodwill in acquisitions consist of technology-based intangible assets and customer-based intangible assets. The fair value was measured by using Multi-Period excess earnings model. Depreciation is recorded on a straight-line basis over the estimated useful life of an asset. The estimated useful life of these assets is 8 years.
Tangible and other intangible assetsother tangible assets include renovation costs of rented office space. Intangible assets include software licenses. Tangible and other intangible assets are recorded at historical cost less accumulated depreciation. Depreciation is recorded on a straight-line basis over the estimated useful life of an asset. The estimated useful lives of tangible and intangible assets are as follows: Machinery and equipment 3–8 years other tangible assets 5–10 years capitalized development costs 3 years other intangible assets 5–10 years
ordinary repairs and maintenance costs are charged to the income statement during the financial period in which they are incurred. The cost of major renovations is included in the assets’ carrying amount when it is probable that the group will derive future economic benefits in excess of the originally assessed standard or performance of the existing asset. Any gain or loss arising on de-recognition of the asset (calculated as the difference between the net disposal proceeds and the carrying amount of the asset) is included in the income statement in the year the asset is derecognized.
government grantsgovernment grants are recognized at their fair value where there is reasonable assurance that the grant will be received and all attaching conditions will be complied with. When the grant relates to an expense item, it is recognized as income over the period necessary to match the

FInanCIal StatementS
F-SeCure ConSolIDateD 21
grant on a systematic basis to the costs that it is intended to compensate. These grants are recognized as other operating income in the income statement. government grants related to an asset are deducted from the acquisition cost of the asset and recognized as income by reducing the depreciation charge of the asset they relate to.
Research and development costsResearch costs are expensed as incurred. Development expenditures incurred on individual projects of totally new products or product versions with significant new features are carried forward when they are technically feasible and their future recoverability can reasonably be regarded as assured.
InventoriesInventories are valued at the lower of cost and net realizable value with cost being determined by first-in first-out method. net realizable value is the estimated selling price in the ordinary course of business, less estimated costs of completion and the estimated costs necessary to make the sale.
leasesleases where the lessor retains substantially all the risks and benefits of ownership of the asset are classified as operating leases. The group has only operating leases. operating lease payments are recognized as an expense in the income statement on a straight-line basis over the lease term. leases of unused office space are recognized as other operating income in the income statement on straight-line basis over the lease term.
Impairment of assetsAt each reporting date, the group assesses whether there is any indication that an asset may be impaired. Where an indicator of impairment exists, the group makes a formal estimate of recoverable amount. Where the carrying amount of an asset exceeds its recoverable amount the asset is considered impaired and written down to its recoverable amount. Recoverable amount is the higher of an asset’s or cash-generating unit’s fair value less costs to sell and its value in use and is determined for an individual asset, unless the asset does not generate cash inflows that are largely independent of those from other assets or groups of assets. A previously recognized impairment loss is reversed only if there has been a change in the estimates used to determine the asset’s recoverable amount since the last impairment loss was recognized. The increased amount cannot exceed the carrying amount that would have been determined, net of depreciation, had no impairment loss been recognized for the asset in prior years. Impairment losses relating to goodwill cannot be reversed in future periods.
PensionsAll of f-secure group’s pension arrangements are in accordance with local statutory arrangements and defined contribution plans. contributions to defined contribution plans are recognized in the income statement in the period to which the contributions relate. The group recognizes disability commitment of finnish Tyel pension plan when disability appears.
share-based payment transactionsIn the company’s industry it is common practice internationally that incentives are provided to employees in the form of equity-settled share-based instruments. company has three kinds of incentive programs; warrant-based program, synthetic warrant-based program and a share-based program.
The company’s warrant programs cover key personnel. The warrant program reward is settled as equity-settled payment and synthetic warrant-based program as cash-settled payment. The cost of equity-settled transactions with employees is measured by reference to the fair value at the date on which they are granted. The cost of cash-settled transactions with employees is measured by reference to the fair value at the date of balance sheet. The fair value is determined by using the binomial model. The cost of transactions is recognized, together with a corresponding entry in equity and liability, over the period in which the performance conditions are fulfilled, ending on the date on which the relevant employees become
fully entitled to the award (vesting date). If the holder of the warrant leaves company before vesting the warrant is forfeited. The cumulative expense recognized for transactions at each reporting date until the vesting date reflects the extent to which the vesting period has expired and the number of awards that, in the opinion of the directors of the group at that date, based on the best available estimate of the number of equity instruments that will ultimately vest.
The share-based incentive program has been established as part of the key employee incentive and retention system inside f secure group. Reward will be settled in two phases so that one part is settled as equity-settled payment and one part as cash-settled payment. cost of equity-settled transactions is measured by reference to the fair value by using market price of f-secure corporation share at the date on which they are granted and cost of cash-settled by using market price of f-secure corporation on the date of balance sheet. The cost is recognized over the period in which the performance conditions are fulfilled, ending on the date on which the relevant employees become fully entitled to the reward (end of lock-up period). The cost of equity-settle corresponding entry is recognized in equity and cost of cash-settle in liabilities. If relevant employee leaves company before fully entitled to the reward, the reward is forfeited. The cumulative expense recognized for share-based incentive program transactions at each reporting date is based on the best available estimate of the number of equity instruments that will ultimately fulfill.
ProvisionsProvisions are recognized when the group has a present obligation (legal or constructive) as a result of a past event, it is probable that an outflow of resources embodying economic benefits will be required to settle the obligation and a reliable estimate can be made of the amount of the obligation.
As the market price of the company’s share rises, the value of the warrant program rises accordingly. This will generate taxable income to the personnel when the warrants are realized. In certain countries the employer must pay social charges based on the taxable income triggered by the realization of the warrants. The provision has been matched against the realized social costs. The provision is measured based on the fair value of the options, and the amount of provision is adjusted to reflect the change in the share price. The market price of the company’s share as of December 31, 2010 was 2.00 euro.
Income taxesDirect current taxes are calculated on the results of all group companies in accordance with the local tax and accounting rules in each country. Deferred taxes, resulting from temporary differences between the financial statement and the income tax basis of assets and liabilities, use the enacted tax rates in effect in the years in which the differences are expected to reverse. Deferred tax assets are recognized to the extent that it is probable that future taxable profit will be available.
Revenue recognitionRevenue is primarily derived from monthly software as a service sale, software license agreement sales and operator’s system integration and maintenance sales. license agreements consist of initial license agreements and periodic maintenance agreements covering product updates and customer support. The revenue recognition policy of f-secure group recognizes the service revenue at the time of delivery, the license agreement’s license fee revenues as the product is delivered, the license agreement’s maintenance revenues are recognized over the maintenance period, and service based project deliveries are recognized with the percentage of completion method, when the outcome can be reliably estimated. The degree of completion is determined by relation of project costs incurred for work performed to date bear the estimated total project costs. If total project costs will exceed total project revenue, the expected loss is recognized as an expense immediately. Indirect taxes, discounts granted and exchange rate differences are excluded from net sales.

FInanCIal StatementS
22 F-SeCure ConSolIDateD
other operating income other operating income includes profits from the sales of fixed assets, rental revenue, and government grants received for research and development projects.
Presentation of expensesclassification of the functionally presented expenses has been made as follows: various types of expenses in different geographical locations have been allocated to the various functions by allocating to directly allocable expenses to the respective function, and other operating expenses have been allocated to functions on the basis of average headcount in each location.
Treasury sharesParent company has acquired treasury shares. The cost of acquisition is recognized as a deduction in the shareholders’ equity.
financial assetsAccording to IAs 39 standard, financial assets have been classified into financial assets at fair value through profit or loss, held-to-maturity, loans and receivables originated by the enterprise and available-for-sale financial assets. The classification is dependent on the purpose for which the assets were acquired. Purchases and sales of financial assets are recognized on the trade date i.e. the date that the group commits to purchase the asset. The cost of purchase includes transaction costs. financial assets are currently classified as loans and receivables and available-for-sale financial asset.
loans and receivables originated by the enterprise are measured at amortized cost. Trade receivables are carried at the original invoice amount to customers less an estimate made for doubtful receivables. outstanding receivables are reviewed periodically and bad debts are written off when identified.
Available-for-sale financial assets consist of interest-bearing debt securities and shares in mutual funds invested in similar instruments. for assets that are actively traded in organized financial markets, fair value is determined by reference to stock exchange quoted market bid prices at the close of business on the balance sheet date. Assets, the fair value of which cannot be measured reliably, are recognized at cost less impairment. The fair value changes of available-for-sale financial assets are recognized in shareholders’ equity under fair value reserve. When financial assets recognized as available-for-sale is sold, the accumulated fair value changes are released from equity and recognized in the income statement.
cash and cash equivalents in the consolidated statement of financial position comprise cash at bank and in hand and other highly liquid short-term investments.
for the purpose of the consolidated statement of cash flows, cash and cash equivalents consist of cash and cash equivalents as defined above.
Derivative financial instruments and hedgingThe group uses derivative financial instruments such as forward currency contracts to hedge its risks associated with foreign currency fluctuations.
such derivative financial instruments are initially recognized at fair value on the date on which a derivative contract is entered into and are subsequently recognized at fair value. Any gains and losses arising from changes in fair value on derivatives that do not qualify for hedge accounting are taken directly to net profit or loss for the year. The fair value of forward currency contracts is calculated by reference to current forward exchange rates for contracts with similar maturity profiles.
Adoption of new and revised standardsThe group has not applied the following new or revised standards and Interpretations that have been issued, but are not yet effective.
Improvements to IfRss (May 2010). There are separate transitional provisions for several standards, but the group expects that adoption of the improvements will have no significant impact on the group’s financial statements in the period of initial application. Improvements become effective mainly for financial years beginning on or after 1 July 2010 and are not adopted by the eU.
IAs 32 Amendment: classification of Rights Issues. The group expects that adoption of the revised standard will have no impact on the group’s financial statements in the period of initial application. Amended standard becomes effective for financial years beginning on or after 1 february 2010 and is adopted by the eU.
IAs 24 Revised: Related party Disclosures. The group expects that adoption of the revised standard will have impact on the group’s financial statements in the period of initial application. Amended standard becomes effective for financial years beginning on or after 1 January 2011 and is adopted by the eU.
IfRs 9 financial Instruments. The group expects that adoption of the revised standard will have impact on the disclosures of group’s financial statements in the period of initial application. Amended standard becomes effective for financial years beginning on or after 1 January 2013 and is not adopted by the eU.
IfRIc 14 Amendment: Prepayments of a Minimum funding Requirement. The group expects that interpretation will have no impact on the group’s financial statements in the period of initial application. Interpretation becomes effective for financial years beginning on or after 1 January 2011 and is adopted by the eU.
IfRIc 19 extinguishing financial liabilities with equity Instruments. The group expects that interpretation will have no impact on the group’s financial statements in the period of initial application. Interpretation becomes effective for financial years beginning on or after 1 July 2010 and is adopted by the eU.

FInanCIal StatementS
F-SeCure ConSolIDateD 23
1. SegMeNT iNFOrMATiON
The group has one business segment; data security. The revenus of different geographical areas are presented by the location of the customers and the long-term assets by the location of the assets.
Sales channels Operator Other consolidated Dec 31, 2010 channel channels group
Revenue from external customers 67 109 63 010 130 119
consolidated Dec 31, 2009
Revenue from external customers 60 178 64 966 125 144
geographical information Finland and rest of North rest of consolidated Dec 31, 2010 Scandinavia europe America the world group
Revenue from external customers 43 110 59 320 12 058 15 631 130 119segment long-term assets 12 658 29 231 101 1 340 43 329
consolidated Dec 31, 2009
Revenue from external customers 44 187 57 301 10 561 13 095 125 144segment long-term assets 7 258 29 254 80 1 293 37 884
(eUR 1000) noTes To THe fInAncIAl sTATeMenTs
2. OTHer OPerATiNg iNcOMe
consolidated consolidated 2010 2009
Rental revenue 131 195goverment grants 835 858other 22 35
Total 988 1 088
3. DePreciATiON AND reDucTiON iN VALue
Depreciations from non-current assets
other capitalized expenditure -2 362 -1 316capitalized development -306 -439
Intangible assets -2 668 -1 755
Machinery and equipment -2 127 -1 557other tangible assets -470 -460
Tangible assets -2 597 -2 017
Total depreciation -5 265 -3 772
Depreciations by function
sales and marketing -2 006 -2 326Research and development -3 158 -1 353Administration -101 -93
Total depreciation -5 265 -3 772

FInanCIal StatementS
24 F-SeCure ConSolIDateD
4. PerSONNeL eXPeNSeS
consolidated consolidated
Personnel expenses 2010 2009
Wages and salaries -45 923 -39 748Pension expenses - defined contribution plan -6 184 -5 599share-based payments -785 -1 352other social expenses -4 237 -2 849
Total -57 128 -49 548
employee benefits of Management are stated in disclosure 27. Related party transactions. share-based payments are stated in disclosure 19. share-based payment transactions.
Average number of personnel 835 770
Personnel by function Dec 31
sales and marketing 368 351Research and development 339 376Administration 105 99
Total 812 826
5. AuDiT FeeS
group auditor Audit fees -94 -96Tax consulting -21 -15other consulting -12 -125
Total -127 -236
others Audit fees -16 -13Tax consulting -21 -17
Total -38 -31
6. FiNANciAL iNcOMe AND eXPeNSeS
Interest income 17 136Interest expense -14 -17other financial income 300 1 440exchange gains and losses -160 -203other financial expenses -150 -159
Total financial income and expenses -7 1 197
Financial income and expenses from loans and receivables
Interest income 17 131Interest expense -14 -17exchange gains and losses -19 -172
Total -16 -58
Financial income and expenses from Available-for-sale financial assets
Interest income 4other financial income 252 1 313
Total 252 1 317
components of other comprehensive income
Available-for-sale financial assetsgains/(losses) arising during the year 121 378Reclassification adjustements included in the income statement -79 -288
Total 42 90
noTes To THe fInAncIAl sTATeMenTs (eUR 1000)

FInanCIal StatementS
F-SeCure ConSolIDateD 25
7. iNcOMe TAXeS
consolidated consolidated 2010 2009
Income taxes of the business activity -7 715 -7 144Income taxes from previous years -105 -58Deferred tax 3 177 744
Total -4 643 -6 458
components of other comprehensive income Available-for-sale financial assests -11 -23
A reconciliation of income tax expense applicable to accounting profit before income tax at the statutory income tax rate to income tax expense at the groups' effective income tax rate for the years ended 31 December 2010 and 2009 is as follows:
Result before taxes 19 890 25 205
Income taxes at statutory rate of 26% -5 171 -6 553Taxes on foreign subsidiaries' net income inexcess of income taxes at statutory rates 643 108non-deductible expenses -339 -99Unrecognised tax losses 316Income taxes from previous years -105 -58other 329 -172
Total taxes -4 643 -6 458
8. eArNiNgS Per SHAre
basic earnings per share amounts are calculated by dividing net profit for the year attributable on ordinary equity holders of the parent by the weighted average number of ordinary shares outstanding during the year. Diluted earnings per share amounts are calculated by dividing the net profit attributable to ordinary shareholders by the weighted average number of ordinary shares outstanding during the year adjusted for the effects of dilutive options.
net profit attributable to equity holders from continuing operations 15 247 18 747
Weighted average number of ordinary shares (1 000) 154 968 155 770effect of dilution: share options 1 260 3 350
Adjusted weighted average number of ordinary shares 156 228 159 120for diluted earning per share
basic earnings per share (eUR/share) 0,10 0,12Diluted earnings per share (eUR/share) 0,10 0,12
The weighted average number of shares take into account the effect of change in treasury shares.
(eUR 1000) noTes To THe fInAncIAl sTATeMenTs
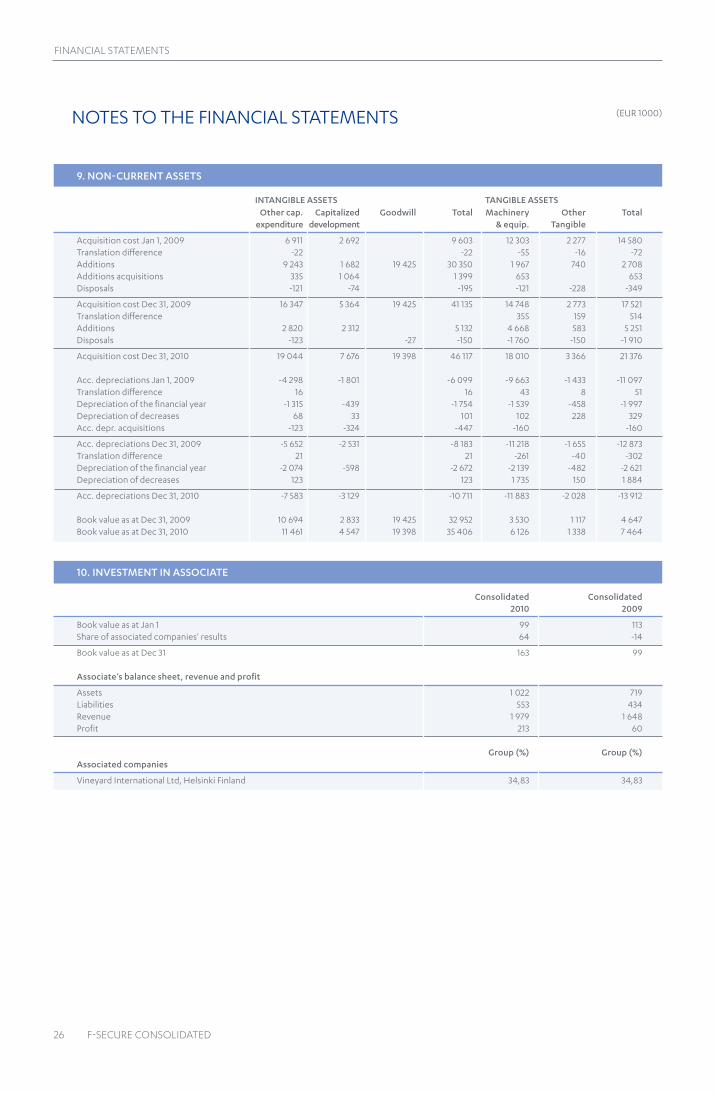
FInanCIal StatementS
26 F-SeCure ConSolIDateD
9. NON-curreNT ASSeTS
Other cap. capitalized goodwill Total Machinery Other Total expenditure development & equip. Tangible
Acquisition cost Jan 1, 2009 6 911 2 692 9 603 12 303 2 277 14 580Translation difference -22 -22 -55 -16 -72Additions 9 243 1 682 19 425 30 350 1 967 740 2 708Additions acquisitions 335 1 064 1 399 653 653Disposals -121 -74 -195 -121 -228 -349
Acquisition cost Dec 31, 2009 16 347 5 364 19 425 41 135 14 748 2 773 17 521Translation difference 355 159 514Additions 2 820 2 312 5 132 4 668 583 5 251Disposals -123 -27 -150 -1 760 -150 -1 910
Acquisition cost Dec 31, 2010 19 044 7 676 19 398 46 117 18 010 3 366 21 376
Acc. depreciations Jan 1, 2009 -4 298 -1 801 -6 099 -9 663 -1 433 -11 097Translation difference 16 16 43 8 51Depreciation of the financial year -1 315 -439 -1 754 -1 539 -458 -1 997Depreciation of decreases 68 33 101 102 228 329Acc. depr. acquisitions -123 -324 -447 -160 -160
Acc. depreciations Dec 31, 2009 -5 652 -2 531 -8 183 -11 218 -1 655 -12 873Translation difference 21 21 -261 -40 -302Depreciation of the financial year -2 074 -598 -2 672 -2 139 -482 -2 621Depreciation of decreases 123 123 1 735 150 1 884
Acc. depreciations Dec 31, 2010 -7 583 -3 129 -10 711 -11 883 -2 028 -13 912
book value as at Dec 31, 2009 10 694 2 833 19 425 32 952 3 530 1 117 4 647book value as at Dec 31, 2010 11 461 4 547 19 398 35 406 6 126 1 338 7 464
iNTANgiBLe ASSeTS TANgiBLe ASSeTS
10. iNVeSTMeNT iN ASSOciATe
consolidated consolidated 2010 2009
book value as at Jan 1 99 113share of associated companies' results 64 -14
book value as at Dec 31 163 99
Associate’s balance sheet, revenue and profit
Assets 1 022 719liabilities 553 434Revenue 1 979 1 648Profit 213 60
group (%) group (%)Associated companies
Vineyard International ltd, Helsinki finland 34,83 34,83
noTes To THe fInAncIAl sTATeMenTs (eUR 1000)

FInanCIal StatementS
F-SeCure ConSolIDateD 27
12. iMPAirMeNT TeSTiNg OF gOODWiLL
In impairment testing the group's assets are tested against the group's total generated cash flow.
The cash flow estimates have been reviewed byt the management and cover the next five years. The estimates are based on 2011 planning and after that revenue growth of 5% during 2012-2015, and after that terminal growth of 1%. The cAgR of 5% growth is based on gartner's estimation of revenues for the consumer and enterprise antivirus business globally during 2007-2014 (source: gartner, 2010). The profitability is based on past years' profitability level, 2011 planning and longer term communicated profitability target level. The used discount rate is 14,3% before taxes. The impairment test, based on these assumptions, show no need to impair assets and/or goodwill.
Sensitivity to changes in assumptionsThe main parameters in the calculations are profitability, growth rate and discount rate. If the revenue growth was as calculated and the profitability would decline below 8%, or if the profitability level reamined the same, and the revenue would decline by 10% compared to previous year (year after year) in 2010-2015, the discounted amount would meet the book value. Test is not practically sensitive to discount rate.
13. DeFerreD TAX
consolidated consolidated 2010 2009Deferred tax assets
other temporary differences 1 313 1 055losses carried forward 4 172 1 506Tax charged to shareholders' equity change in fair value, available-for-sale 2
Total 5 485 2 563 Deferred tax liability
other temporary differencies 22 fair value adjustments on acquisition 1 992 2 271Tax charged to shareholders' equity change in fair value, available-for-sale 9
Total 2 024 2 271 At December 31, 2010 the group had 12,3 million euro losses carried forward. Deferred tax assets have been recognized of these losses as they may be used to offset future taxable profits in the group.
14. iNVeNTOrieS
other inventories 394 425
no impairment was recognized from inventories in years 2010 and 2009.
11. BuSiNeSS cOMBiNATiONS
on 10 July 2009, the group acquired 100% of the voting shares of steek sA, an unlisted company based in france specializing in providing online storage and data management solutions. The final working capital regarding the acquisition of f-secure sDc sAs (former steek s.A.) was defined and the amount 1.1 million euros was paid during the period.
(eUR 1000) noTes To THe fInAncIAl sTATeMenTs
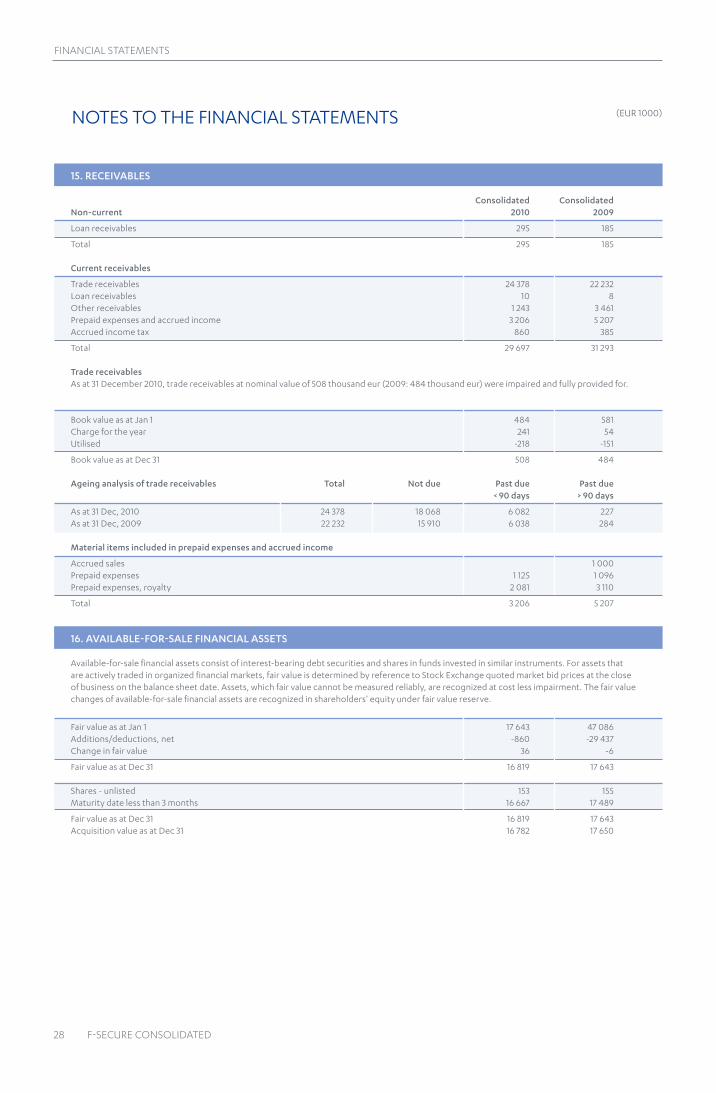
FInanCIal StatementS
28 F-SeCure ConSolIDateD
15. receiVABLeS
consolidated consolidatedNon-current 2010 2009
loan receivables 295 185
Total 295 185
current receivables
Trade receivables 24 378 22 232loan receivables 10 8other receivables 1 243 3 461Prepaid expenses and accrued income 3 206 5 207Accrued income tax 860 385
Total 29 697 31 293
Trade receivables As at 31 December 2010, trade receivables at nominal value of 508 thousand eur (2009: 484 thousand eur) were impaired and fully provided for.
book value as at Jan 1 484 581charge for the year 241 54Utilised -218 -151
book value as at Dec 31 508 484
Ageing analysis of trade receivables Total Not due Past due Past due < 90 days > 90 days
As at 31 Dec, 2010 24 378 18 068 6 082 227As at 31 Dec, 2009 22 232 15 910 6 038 284
Material items included in prepaid expenses and accrued income
Accrued sales 1 000Prepaid expenses 1 125 1 096Prepaid expenses, royalty 2 081 3 110
Total 3 206 5 207
16. AVAiLABLe-FOr-SALe FiNANciAL ASSeTS
Available-for-sale financial assets consist of interest-bearing debt securities and shares in funds invested in similar instruments. for assets that are actively traded in organized financial markets, fair value is determined by reference to stock exchange quoted market bid prices at the close of business on the balance sheet date. Assets, which fair value cannot be measured reliably, are recognized at cost less impairment. The fair value changes of available-for-sale financial assets are recognized in shareholders’ equity under fair value reserve.
fair value as at Jan 1 17 643 47 086Additions/deductions, net -860 -29 437change in fair value 36 -6
fair value as at Dec 31 16 819 17 643
shares - unlisted 153 155Maturity date less than 3 months 16 667 17 489
fair value as at Dec 31 16 819 17 643Acquisition value as at Dec 31 16 782 17 650
noTes To THe fInAncIAl sTATeMenTs (eUR 1000)

FInanCIal StatementS
F-SeCure ConSolIDateD 29
17. cASH AND SHOrT-TerM DePOSiTS
consolidated consolidated 2010 2009
cash at bank and in hand 16 165 16 102
Available-for-sale financial assets are recognized as liquid short-term investments and are held as part of the group's ongoing cash management activities. see note 23. financial risk management objectives and policies.
for the purposes of the consolidated statement of cash flows, cash and cash equivalents comprise the following at December 31:
cash at bank and in hand 16 165 16 102Available-for-sale 16 667 17 489
Total 32 831 33 591
18. SHAreHOLDerS’ equiTy
During the year, ordinary shares were subscibed with warrants attached to f-secure option programs and converted as follows. Issued and fully paid Number of Share Share unrestricted Treasury shares capital premium fund equity reserve shares Total
31.12.2008 155 360 161 1 551 166 1 465 1 453 4 635Registration of share issue 693 246 exercise of options 698 836 1 611 1 611Acquisition of treasury shares -841 514 2 055 2 055Treasury shares used 9 068 3 -20 -17
31.12.2009 155 919 797 1 551 166 3 079 3 488 8 284exercise of options 70 000 108 108Acquisition of treasury shares -1 757 867 4 004 4 004
31.12.2010 154 231 930 1 551 166 3 187 7 492 12 396
The share capital amounted to 1,551,311 euro and the number of shares was 157,539,243 (including own shares 3,307,313) at the end of the year 2010. A share has no nomibal value. Accountable par value is eUR 0,01.
Share premium fundProceeds from exercised warrants were recognized under the share capital and share premium fund until March 26, 2008.
unrestricted equity reserveon March 20, 2007, the shareholders' meeting decided to decrease the share premium fund. The decreased amount of 33,582 thousand euro was transferred to unrestricted equity reserve. on March 26, 2008, the shareholders' meeting decided that the total amount of the subscription prices paid for new shares issued after the date of the meeting, based on stock options under the f-secure stock option Plan 2005, be recorded in companys' unrestricted equity reserve. on october 28, 2008, the extraordinary shareholders' meeting decided that assets from the invested unrestricted equity will be distributed to shareholders eUR 0.23 per share. The amount of the distribution was in total 35,719 thousand euro for all outstanding shares, altogether 155,301,612 shares.
Translation differencesThe translation difference is used to record exchange difference arising from the translation of the financial statements of foreign subsidiaries.
Dividends proposed and paidProposed for approval at AgM for year 2010 0,06 euro per sharefinal dividend for year 2009 0,06 euro per share, paid during the year 2010: 9,310,086 eurofinal dividend for year 2008 0,07 euro per share, paid during the year 2009: 10,903,928 euro
(eUR 1000) noTes To THe fInAncIAl sTATeMenTs

FInanCIal StatementS
30 F-SeCure ConSolIDateD
Before tax Tax After tax Total
equity Dec 31, 2008 -97 25 -72 -72Available-for-sale, net -6 2 -5 -5fair value gains/losses to Pl 97 -25 72 72
equity Dec 31, 2009 -6 1 -5 -5Available-for-sale, net 36 -9 26 26fair value gains/losses to Pl 7 -2 5 5
equity Dec 31, 2010 36 -10 26 26
FAir VALue, AVAiLABLe-FOr-SALe
Treasury sharesThe cost of acquistion is recognised as a deduction in the shareholders' equity. The shares were acquired through public trading on nAsDAQ oMX Helsinki in accordance with its rules and at market price.
based on authorization of the shareholders' meeting on March 24, 2010 parent company has acquired treasury shares during the period as follows.
Number of Acquisition Average range of shares cost acquisition acquisition Time price € price €
January 2010 63 665 181 2.83 2.81 - 2.87february 2010 178 964 438 2.43 2.38 - 2.49March 2010 509 066 1 275 2.49 2.39 - 2.54June 2010 200 700 427 2.11 2.05 - 2.17July 2010 48 947 102 2.08 2.05 - 2.18August 2010 234 569 505 2.14 2.07 - 2.20september 2010 25 341 55 2.18 2.15 - 2.20october 2010 25 000 54 2.16 2.15 - 2.18november 2010 282 192 583 2.06 1.97- 2.17December 2010 189 423 384 2.03 1.99- 2.09
1 757 867 4 004
on March 2009 total of 9,068 shares were given as remuneration to board members
The total number of acquired treasury shares was 3,307,313 at the end of the year 2010. This represent 2.1 percent of the company's voting power on December 31, 2010. Fair value reserve The reserve is used to record increments and decrements in the fair value of available-for-sale financial assets.
noTes To THe fInAncIAl sTATeMenTs (eUR 1000)

FInanCIal StatementS
F-SeCure ConSolIDateD 31
19. SHAre-BASeD PAyMeNT TrANSAcTiONS
During the period the group have had three different incentive plans which cover the key personnel.
Warrant programsThe company has had warrant programs since April 1998. During the period the group had two warrant programs. The company's warrant programs cover the key personnel. If the holder of the warrant leaves the company before vesting, the warrant is forfeited.
The group has applied IfRs 2 to equity-settled awards granted after november 7, 2002 that had not vested on or before January 1, 2005.
Option scheme 2005on March 23, 2005, the shareholders’ meeting decided to issue a total of 4,500,000 warrants. each warrant entitles the holder to subscribe for one share. The subscription in full would increase the capital stock by 45,000 euro, which represents 2.9 percent of the company's share capital and voting power on December 31, 2010. The subscription price of a share in each series shall be the trade volume weighted average price of the company's share quoted on the oMX The nordic exchange, Helsinki as follows: 2005A on March 2005; 2005b on March 2006; 2005c on March 2007 and 2005D on March 2008, rounded off to the nearest cent. The subscription price of the stock options shall, as per the dividend recorded date, be reduced by the amount of dividend per share. However, only such dividends whose distribution has been agreed upon after of the period for determination of the share subscription price and which have been distributed prior to the share subscription are deducted from the subscription price. Pursuant to the companies Act, the share subscription price shall, nevertheless, always be at least the accounting equivalent value per share. The subscription period of 2005A expired on november 30, 2009. The subscription period of 2005b exprided on november 30, 2010.
Plan issued category Start end exercise price
2005A 1.3.2008 30.11.2009 1.43 2005b 1.3.2009 30.11.2010 2.72 2005c 1.3.2010 30.11.2011 1.54 2005D 1.3.2011 30.11.2012 2.09
2005 4 500 000
The shares subscribed for on the basis of the warrants shall entitle the holder to dividend for the financial period in which the subscription takes place. other shareholder rights shall commence upon the entry into the Trade Register of increase of the share capital.
The maximum dilution effect of the issuance of the warrants is 3,451,609 shares on aggregate or 2.1 percent of the company’s share capital after dilution. 2.7 million warrants have been issued from current warrant program (22.0 million totally) as of December 31, 2010. 2.1 million warrants are held by the subsidiary company Df-Data oy.
options outstanding and weighted average exercise price
Outstanding Jan 01 1 993 760 1.85 2 903 391 1.82granted 100 000 2.09 50 000 2.15forfeited 20 000 1.54 260 000 2.09exercised 70 000 1.54 698 836 1.43expired 278 760 2.72 795 1.43Outstanding Dec 31 1 725 000 1.67 1 993 760 1.85exercisable Dec 31 1 315 000 1.54 278 760 2.78
for options exercised during the period the weighted average share price was 2.06 euro (2.75 euro in year 2009). options were execised on a regular basis throughout the period. The group received 108 thousand euro for exercised option, which was recorded to unrestricted equity reserve (1,611 thousand euro to unrestricted equity reserve in year 2009).
The options outstanding by range of exercise prices
exercise price € Number of Weighted Weighted exercise price € Number of Weighted Weighted options average remaining average options average remaining average contractual life exercise price € contractual life exercise price € in years in years
1.43 - 1.60 1 315 000 0.92 1.54 1.43 - 1.60 1 405 000 1.92 1.60 2.09 - 2.78 410 000 1.92 2.09 1.60 - 2.78 588 760 1.97 2.45
1 725 000 1 993 760
Jan 01 - Dec 31, 2010 Jan 01 - Dec 31, 2009 Number of options Weighted average
exercise price €Number of options Weighted average
exercise price €
December 31, 2010 December 31, 2009
(eUR 1000) noTes To THe fInAncIAl sTATeMenTs

FInanCIal StatementS
32 F-SeCure ConSolIDateD
expense arising from share-based payment transactions during the period was 76 thousand euro (347 thousand euro in year 2009). The weighted fair value of options granted at the date of grant date was 0.22 euro (0.67 euro in year 2009).
Synthetic option-based incentive programThe synthetic option-based incentive program has been established on february 2009 as part of the key employee incentive and retention system within f-secure group. The program offers for the participants a possibility to receive synthetic options of f-secure corporation as a long-term incentive compensation . no reward can be given to any participating employee, whose employment has terminated before the end of the vesting period. The synthetic option-based incentive program will last five years. It comprises three granting periods and subsequent vesting period of two years after each granting year. The program ends on December 31, 2013. Within the framework of the program, the aggregate number of options to be given as reward cannot exceed 5 million. The actual compensation is the difference of subscription price and the vesting price, and will be paid to the participating employees as a cash-settled payment. The subscription price of the synthetic option is the weighted average share price in the period of october to December prior to the granting year. The vesting price is the weighted average share price in period of september to november prior to the payment month. The subscription price for the granting period of 2009 is 2.17 euro. The subscirtion price for the granting period of 2010 is 2.27 by board decision on november 30, 2010.
Options outstanding
Jan 01 - Dec 31, 2010 Jan 01 - Dec 31, 2009Outstanding Jan 01 600 000 Outstanding Jan 01granted 950 000 granted 600 000forfeited 15 000 forfeitedOutstanding Dec 31 1 535 000 Outstanding Dec 31 600 000
expense arising from share-based payment transactions during the period was 36 thousand euro (22 thousand euro in year 2009).The carrying amount of liability at December 31, 2010 was 59 thousand euro.
The fair value of options granted during the period was determined by using the binomial model.Used arguments: Option scheme 2005 Synthetic option programme 2010 2009 2010 2009
Weighted average share price € 2.00 2.22 2.00 2.74Weighted average exercise price € 2.06 2.75 - -expected volatility 20.37% 36.84% 20.37% 31.01%option life in years 2.0 3.8 2.0 2.0Risk-free interest rate 1.55% 2.52% 1.55% 0.96%expected dividends - - - -
expected volatility reflects the assumption that the historical volatility is indicative of future trends, which may also not necessarily be the actual outcome. based on previous years, the company has estimated that 2-3% of granted options will be forfeited.
Share-based incentive programThe share-based incentive program has been established as part of the key employee incentive and retention system within f-secure group. The program will offer for the participants a possibility to receive shares of f-secure corporation as an incentive reward if the company’s financial targets set for the earning period have been achieved. no reward can be given to any participating employee, whose employment has terminated before the end of the lock-up period. The share-based incentive program will last six years. It comprises three earning and lock-up periods. The participating employee may not sell or transfer the shares received before the end of the lock-up period on each earnings period. The program ends on December 31, 2013. The rewards will be settled in two phases so that one part is settled as equity-settled payment and one part as cash-settled payment. Within the framework of the program, the aggregate number of shares to be given as reward cannot exceed 5 million shares.
The participating employee shall be entitled to the shareholder rights of to the reward shares from the moment the shares have been entered into the participating employee's book-entry account.
expense arising from the share-based payment transactions during the period was 672 thousand euro (982 thousand euro in year 2009). The costs of the equity-settled transactions are measured by reference to the fair value of the f-secure corporation share at the date on which they are granted. The costs of cash-settled transactions are measured by reference to the fair value of the f-secure corporation share on the date of balance sheet.
20. PrOViSiONS
A provision is recognized for the employer's liability for social security contributions on share option gains, which will arise on exercise of the relevant share options, by employees. The provision is calculated based on the number of options outstanding at the balance sheet date outside finland that are expected to be exercised, and using the market price of the share at the balance sheet date as the best estimate of market price at the date of exercise. It is expected that the costs will be incurred during the exercise period of 1 January 2011 to 30 november 2012.
consolidated consolidated 2010 2009
book value as at Jan 1 3 Arising during the year 3Utilised -3
book value as at Dec 31 3social costs 3
noTes To THe fInAncIAl sTATeMenTs (eUR 1000)

FInanCIal StatementS
F-SeCure ConSolIDateD 33
21. LiABiLiTieS consolidated consolidated 2010 2009Non-current liabilities
Deferred revenues 7 806 6 725other liabilities 200 200
Total 8 006 6 925
current liabilities
Deferred revenues 29 359 28 917Trade payables 4 600 3 951other liabilities 2 023 3 430Accrued expenses 14 249 11 263Income tax liabilities 196 351
Total 50 426 47 911
Material amounts shown under accruals and deferred income
Accrued personnel expenses 10 361 7 745Deferred royalty 903 1 315Accrued expenses 2 984 2 203
Total 14 249 11 263
22. FiNANciAL ASSeTS AND LiABiLiTieS
loans and other receivables 305 193Trade receivables 24 378 22 232Available-for-sale financial assets 16 819 17 643cash and bank accounts 16 165 16 102Trade payables -4 800 -4 151
Total 52 867 52 019
The carrying amounts of the group's financial instruments are equivalent to fair values.
Fair value hierarchy The group uses the following hierarchy for determining and disclosing the fair value of financial intruments by valuation technique
level 1: Quouted prices in active markets for indentical assets or liabilitieslevel 2: other techniques for which all inputs which have a significant effect on the recorded fair value are observable, either directly or indirectlylevel 3: Techinques which use inputs which have a significant effect on the recorded fair value that are not based on observable market data
Assets measured at fair value Total Level 1 Level 2 Level 3
Available-for-sale financial assets 31 Dec 2010 16 819 16 667 - 153Available-for-sale financial assets 31 Dec 2009 17 643 17 489 - 155
During the reporting period ending 31 December 2010, there were no transfers between levels.
(eUR 1000) noTes To THe fInAncIAl sTATeMenTs

FInanCIal StatementS
34 F-SeCure ConSolIDateD
23. FiNANciAL riSk MANAgeMeNT OBJecTiVeS AND POLicieS
generalThe goal of risk management is to identify risks that may hinder the group from achieving its business objectives. The responsibility for the company's risk management lies with ceo, the management and finally with the board of Directors. The risks related to the group's financial instruments are mainly related to credit risks and foreign currency fluctuations. The group's available-for-sale assets are also exposed to interest rate fluctuations.
credit risk The group trades only with recognized, creditworthy third parties. Receivable balances are monitored and collected on an ongoing basis with the result that the group's exposure to bad debts is not significant. There are no significant concentrations of credit risk within the group. see note 15. Receivables
Foreign currency risk The group invoices mainly in euros. However, there are some transactional currency exposures that arise from sales or purchasing in other currencies. The other main measurement currencies are UsD, JPy, sek and gbP. In order to minimize the impact of the fluctuation of the exchange rates, the goal is to use forward currency contracts to eliminate the currency exposure of the estimated cash flow of these currencies for a period of six months.
consolidated consolidated 2010 2009Derivativescurrency instruments – currency forward contract eur eur
nominal value 1 691 4 374fair value 26 -143
f-secure corporation has hedged receivables denominated in UsD, JPy, sek and gbP with a forward rate contract. The forward rate contracts expires on January 26, 2011. The company does not have other derivatives.
f-secure corporation does not hedge investements made in its subsidiaries because the impact of changes of exchange rates would not be relevant in the group's balance sheet.
Sales in different currencies % %
eUR 68 74sek, gbP 11 8UsD, JPy 17 14other currencies 4 4
100 100
The risk involved in the sales in foreign currency is notabaly diminished by the operational expenses in subsidiaries that use the same currency.
Financial assets and liablilities in different currencies % %
eUR 70 77sek, gbP 7 5UsD, JPy 20 15other currencies 4 3
100 100
The table below demonstrates how sensitive the group's profit before taxes is to reasonably possible changes in the UsD, JPy, sek and gbP exchange rate, assuming that all other variables are held constant. The analysis is based +/- 10% exchange rate change, on trade receivables and includes forward currency contracts.
UsD, JPy +338/-338 +27/-27
gbP, sek +225/-225 +82/-82
noTes To THe fInAncIAl sTATeMenTs (eUR 1000)

FInanCIal StatementS
F-SeCure ConSolIDateD 35
interest rate riskThe group does not have any interest bearing liabilities. based on the group's conservative investment policy, it invests its cash mainly in short term and low risk funds. Investments are made in creditworthy funds. These available-for-sale investments are exposed to market risk for changes in interest risks.
The group's objective is to maintain a balance between continuity of funding and flexibility through the use of cash and available-for-sale financial assets. see note 16.
capital managementThe objective of the group’s capital management is to maintain an efficient capital structure that ensures the functioning of business operations and promotes the increase of shareholder value. Reviewing the capital structure of the group is part of the process for monitoring financial performance. The objective of the group is to improve its current capital structure.
AgM 2007 made a decision to decrease the share premium to distributable equity. This enabled the group to employ various actions to improve the efficiency of the equity; and/or to return the equity to shareholders. egM 2008 made a decision that assets from the distributable equity will be distributed to shareholders eUR 0.23 per share totalling 35,719 thousand euro.
According to the dividend policy of f-secure corporation, approximately half of its annual profit is paid as dividend. subject to circumstances, the company may deviate from this policy.
24. NOTeS TO cASH FLOW STATeMeNT
consolidated consolidated 2010 2009Adjustments
Deferred income 430 -1 635Depreciation and amortization 5 265 3 772Profit / loss on sale of fixed assets 22 85other adjustments 920 842financial income and expenses 7 -1 197Income taxes 4 642 6 704
Total 11 287 8 571
25. OPerATiNg LeASe cOMMiTMeNTS The group has entered into commercial leases on office space and on motor vechicles. Motor vechicle leases have an average life of three years and office space between two and five years with renewal terms included in the contracts.
future minimum rentals payable under non-cancellable operating leases as at 31 December are as follows
As lessee
Within one year 5 266 4 437After one year but not more than five years 11 920 14 881
Total 17 186 19 317
26. cONTiNgeNT LiABiLiTieS
Other liabilities
others 375 70
Legal claimsf-secure Inc. the U.s. subsidiary of f-secure corporation has been dismissed from a patent infringement lawsuit filed in a state court in the U.s in December 2008.
f-secure corporation is a party to a dispute in brazil regarding a distributor relationship and will defend itself accordingly, including through an arbitration process in finland. The group does not expect any material impact on its financials from this lawsuit.
(eUR 1000) noTes To THe fInAncIAl sTATeMenTs

FInanCIal StatementS
36 F-SeCure ConSolIDateD
27. reLATeD PArTy DiScLOSureS
compensation of key management personnel of the group
Wages and other short-term employee benefits -2 457 -1 605share-based payments -376 -573other compensations -36
Total -2 833 -2 214
Wages and other short-term employee benefits
Managing directors -572 -501Members of the boards of directors -225 -225
Board of directors 2010 and managing director Wages Fees incentive Other reward compensations
kimmo Alkio, managing director 372 - 115 -Risto siilasmaa, chairman of the board - 55 - -Marko Ahtisaari - 8 - -Jussi Arovaara - 23 - -sari baldauf - 40 - -Pertti ervi - 40 - -Juho Malmberg - 30 - -Anu nissinen - 23 - -Alex sozonoff - 8 - -
Total 372 225 115
Incentive reward granted to managing director is measured to the fair value at the date which it was granted and the cost is recognized over the period in which the performance conditions are fullfilled 01.12.2010 - 31.12.2013. The ceo's retirement age and the determination of his pension conform to the standard rules specified by finland's employee Pension Act (Tyel). The period of notice for the ceo is twelve (12) months both ways and there are no separate compensations for dismissal.
The consolidated financial statements include the financial statements of corporations listed in the following table.
Name country of incorporation group (%)
Parent f-secure corporation, Helsinki finland Df-Data oy, Helsinki finland 100f-secure Inc., san Jose United states 100steek Inc., Delaware United states 100f-secure (Uk) ltd, london great-britain 100f-secure kk, Tokyo Japan 100f-secure gmbH, München germany 100f-secure estore gmbH, München germany 100f-secure sARl, Maisons-laffitte france 100f-secure sDc sAs, bordeaux france 100f-secure france sARl, Maisons-laffitte france 100f-secure bVbA, Heverlee-leuven belgium 100f-secure Ab, stockholm sweden 100f-secure srl, Milano Italy 100f-secure sP z.o.o., Warsaw Poland 100f-secure corporation (M) sdn bhd, kuala lumpur Malaysia 100f-secure Pvt ltd, Hyderabad India 100f-secure Pte ltd, singapore singapore 100f-secure b.V., Utrecht The netherlands 100f-secure limited, Hongkong Hongkong 100f-secure Pty limited, sydney Australia 100f-secure Iberia sl, barcelona spain 100
28. SHAreS AND SHAreHOLDerS
Shares and share ownership distribution, December 31, 2010
Shares Number of Percentage of Total shares Percentage shareholders shareholders of shares
1-100 3 058 13.14 % 202 044 0.13 %101-1 000 15 207 65.36 % 5 594 312 3.55 %1 001-10 000 4 630 19.90 % 13 489 335 8.56 %10 001-50 000 290 1.25 % 5 807 179 3.69 %50 001-100 000 27 0.12 % 1 956 203 1.24 %100 001- 55 0.24 % 130 490 170 82.83 %
Total 23 267 100.00 % 157 539 243 100.00 %
noTes To THe fInAncIAl sTATeMenTs (eUR 1000)

FInanCIal StatementS
F-SeCure ConSolIDateD 37
PercentageShareholder category, December 31, 2010 Total shares of shares
corporations 7 135 269 4.53 %financial and insurance institutions 32 909 028 20.89 %general goverment 19 482 320 12.37 %non-profit organizations 2 184 320 1.39 %Households 95 492 160 60.61 %other countries and international organizations 336 146 0.21 %
Total 157 539 243 100.00 %
Largest shareholders and administrative register Owner Shares % shares % votes
Risto siilasmaa 63 076 552 40.04 % 40.90 %keskinäinen henkivakuutusyhtiö Ilmarinen 9 977 338 6.33 % 6.47 %Valtion eläkerahasto 5 000 000 3.17 % 3.24 %Ismo bergroth 4 502 752 2.86 % 2.92 %Ari Hyppönen 3 843 332 2.44 % 2.49 %kuntien eläkevakuutus 2 797 626 1.78 % 1.81 %Alfred berg finland sijoitusrahasto 2 548 025 1.62 % 1.65 %oP-Delta sijoitusrahasto 2 400 000 1.52 % 1.56 %Mandatum henkivakuutusosakeyhtiö 2 107 441 1.34 % 1.37 %oP-suomi pienyhtiöt 1 929 281 1.22 % 1.25 %
Administrative register
nordea Pankki suomi oyj 6 535 884 4.15 % 4.24 %skandinaviska enskilda banken 4 618 525 2.93 % 2.99 %svenska Handelsbanken Ab 1 181 739 0.75 % 0.77 %other registers 1 347 963 0.86 % 0.87 %
other shareholders 42 365 472 26.89 % 27.47 %
Total 154 231 930 100.00 %
own shares f-secure corporation 3 307 313 2.10 %
Total 157 539 243 100.00 %
Ownership of managementBoard of Directors Shares % shares Warrants % shares
risto Siilasmaa 63 076 552 40.04 % Jussi arovaara 4 327 Sari Baldauf 92 610 0.06 % Pertti ervi 28 610 0.02 % 11 600 0.01 %Juho malmberg 23 958 0.02 % anu nissinen 4 327
total 63 230 384 40.14 % 11 600 0.01 %
executive team Shares % shares Warrants % shares
kimmo Alkio 24 051 0.02 % 650 000 0.41 %Ari Alakiuttu 40 000 0.03 %Tuomas Hyyryläinen samu konttinen 20 000 0,01 %Maria nordgren Pirkka Palomäki 1 964 48 219 0.03 %kari Penttilä 50 Antti Reijonen 45 000 0.03 %Patrik sallner Taneli Virtanen 25 000 0.02 % 60 000 0.04 %
Total 51 065 0.03 % 863 219 0.55 %
Ownership of managementThe board of Directors and ceo owned a total of 63,254,435 shares on December 31, 2010. This represents 40.1 percent of the company's shares and 41.0 percent of votes. In addition, the warrants of the management accounted for 0.06 percent of the total amount of f-secure shares. With these stock options 874,819 new shares can be issued.
(eUR 1000) noTes To THe fInAncIAl sTATeMenTs

FInanCIal StatementS
38 F-SeCure ConSolIDateD
29. key rATiOS iFrS iFrS iFrS iFrS iFrSeconomic indicators 2010 2009 2008 2007 2006
net sales (MeUR) 130.1 125.1 113.0 96.8 80.7net sales growth % 4 % 11 % 17 % 20 % 31 %operating result (MeUR) 19.8 24.0 24.3 19.5 8.9% of net sales 15.2 % 19.2 % 21.5 % 20.1 % 11.0 %Result before taxes 19.9 25.2 26.4 21.4 10.4% of net sales 15.3 % 20.1 % 23.4 % 22.1 % 12.8 %Roe (%) 30.3 % 32.2 % 36.0 % 25.4 % 13.1 %RoI (%) 42.5 % 45.0 % 51.5 % 36.3 % 19.3 %equity ratio (%) 69.1 % 69.8 % 71.3 % 81.6 % 80.2 %Investments (MeUR) 10.4 37.2 3.1 2.2 3.7% of net sales 8.0 % 29.7 % 2.7 % 2.3 % 4.6 %R&D costs (MeUR) 34.5 28.0 25.5 21.2 17.7% of net sales 26.5 % 22.4 % 22.6 % 21.9 % 21.9 %capitalized development (MeUR) 2.3 1.7 0.5 0.1 0.9gearing % -63.2 % -68.5 % -148.5 % -124.6 % -123.2 %Wages and salaries (MeUR) 45.9 39.7 35.8 29.9 25.6Personnel on average 835 770 652 528 439Personnel on Dec 31 812 826 718 566 479
key ratios
earnings / share (eur) 0.10 0.12 0.13 0.10 0.05earnings / share diluted 0.10 0.12 0.12 0.10 0.05Shareholders' equity per share 0.31 0.31 0.26 0.44 0.35Dividend per share *) 0.06 0.06 0.07 0.07 0.02Dividend per earnings (%) 60.0 % 50.0 % 53.8 % 70.0 % 40.0 %effective dividends (%) 3.0 % 2.2 % 3.7 % 2.9 % 0.9 %P/e ratio 20.3 22.8 14.9 24.6 47.6Share price. lowest (eur) 1.97 1.86 1.73 1.83 2.05Share price. highest (eur) 2.93 3.14 3.05 2.79 3.48mean share price (eur) 2.27 2.43 2.39 2.32 2.54Share price Dec 31 2.00 2.74 1.88 2.45 2.25market capitalization (meur) 315.1 431.5 293.4 379.9 348.6trading volume (millions) 65.9 55.5 64.5 80.3 93.8trading volume (%) 42.5 % 35.6 % 41.5 % 51.8 % 60.6 %
Adjusted number of shares
average during the period 154 967 615 155 770 113 155 301 688 155 040 771 154 859 859average during the period, diluted 156 227 725 159 120 328 161 464 443 161 464 443 161 464 443Dec 31 157 539 243 157 469 243 156 077 161 155 056 338 154 936 468Dec 31, diluted 160 990 852 161 269 612 161 270 407 161 464 443 161 464 443
0
5
10
15
20
25
0.0
0.5
1.0
1.5
2.0
3.0
2.5
12/1011/10
10/1009/10
08/1007/10
06/1005/10
04/1003/10
02/1001/10
Turnover EUR
Average Price
Millions EUR
Turnover and average share price per month*) board proposal
capital repayment from unrestricted equity was made in year 2008 eUR 0.23 per share.
noTes To THe fInAncIAl sTATeMenTs (eUR 1000)

FInanCIal StatementSFInanCIal StatementS
f-secURe coRPoRATIon
F-SeCure CorPoratIon 39

FInanCIal StatementS
40 F-SeCure CorPoratIon
iNcOMe STATeMeNT JAN 1-Dec 31, 2010 FAS FAS 2010 2009
NeT SALeS (1) 117 891 111 912Material and service -8 765 -9 603gRoss MARgIn 109 126 102 308
other operating income (2) 2 171 1 899sales and marketing (3,4) -46 209 -45 867Research and development (3,4) -28 828 -26 936Administration (3,4) -8 214 -6 841
OPerATiNg reSuLT 28 046 24 563
financial income and expenses (6) 101 1 361
PrOFiT (LOSS) BeFOre TAXeS 28 147 25 925Income taxes (7) -7 564 -6 957
reSuLT FOr THe FiNANciAL yeAr 20 582 18 967
bAlAnce sHeeT
BALANce SHeeT DeceMBer 31, 2010
ASSeTS FAS FAS 2010 2009
NON-curreNT ASSeTSIntangible assets (8) 8 648 4 994tangible assets (8) 3 789 2 103Investments in associated companies (9) 42 42Investments in group companies (9) 34 244 34 241
total non-current assets 46 723 41 380
curreNT ASSeTSInventories (11) 394 423long-term receivables (12) 715 625Short-term receivables (12) 35 664 28 968Deferred tax assets (10) 2Short-term investments (13) 16 817 17 550Cash and bank accounts (14) 7 630 8 019
total current assets 61 220 55 586
TOTAL ASSeTS 107 943 96 966
SHAreHOLDerS’ equiTy AND LiABiLiTieS
SHAreHOLDerS’ equiTy (15,16)share capital 1 551 1 551share premium 165 165Treasury shares -7 493 -3 488fair value reserve 27 -5Reserve for invested unrestricted equity 3 187 3 079Retained earnings 34 828 25 271Profit for the financial year 20 582 18 967Total shareholders' equity 52 847 45 540
LiABiLiTieSDeferred tax liabilities (18) 9 long-term liabilities (18) 6 592 5 697short-term liabilities (18) 48 494 45 729
Total liabilities 55 096 51 426
TOTAL SHAreHOLDerS’ 107 943 96 966equiTy AND LiABiLiTieS
IncoMe sTATeMenT (eUR 1000)
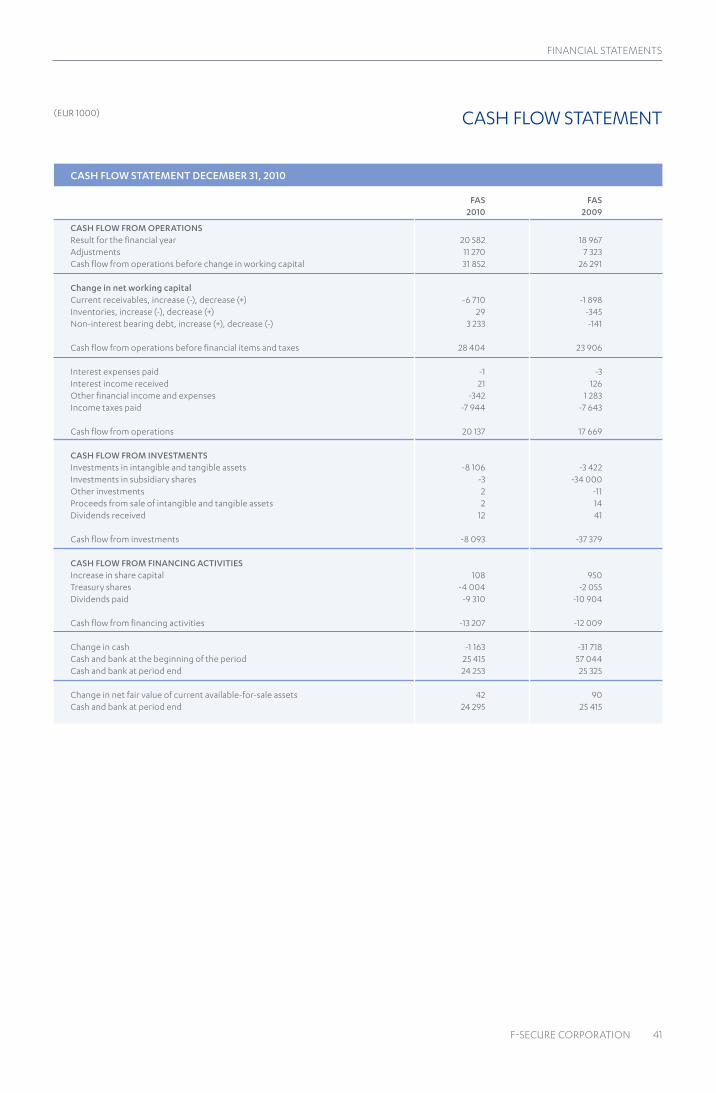
FInanCIal StatementS
F-SeCure CorPoratIon 41
cASH FLOW STATeMeNT DeceMBer 31, 2010 FAS FAS 2010 2009
cASH FLOW FrOM OPerATiONSResult for the financial year 20 582 18 967Adjustments 11 270 7 323cash flow from operations before change in working capital 31 852 26 291
change in net working capitalcurrent receivables, increase (-), decrease (+) -6 710 -1 898Inventories, increase (-), decrease (+) 29 -345non-interest bearing debt, increase (+), decrease (-) 3 233 -141 cash flow from operations before financial items and taxes 28 404 23 906 Interest expenses paid -1 -3Interest income received 21 126other financial income and expenses -342 1 283Income taxes paid -7 944 -7 643 cash flow from operations 20 137 17 669
cASH FLOW FrOM iNVeSTMeNTSInvestments in intangible and tangible assets -8 106 -3 422Investments in subsidiary shares -3 -34 000other investments 2 -11Proceeds from sale of intangible and tangible assets 2 14Dividends received 12 41
cash flow from investments -8 093 -37 379 cASH FLOW FrOM FiNANciNg AcTiViTieS Increase in share capital 108 950Treasury shares -4 004 -2 055Dividends paid -9 310 -10 904
cash flow from financing activities -13 207 -12 009 change in cash -1 163 -31 718cash and bank at the beginning of the period 25 415 57 044cash and bank at period end 24 253 25 325
change in net fair value of current available-for-sale assets 42 90cash and bank at period end 24 295 25 415
cAsH floW sTATeMenT (eUR 1000)

FInanCIal StatementS
42 F-SeCure CorPoratIon
corporate informationf-secure produces services and software protection to individuals and businesses against computer viruses and other threats coming through the Internet or mobile networks.
The parent company of the group is f-secure corporation incorporated in finland and domiciled in Helsinki. company’s registrant address is Tammasaarenkatu 7, 00180 Helsinki. copy of consolidated financial statement can be received from Internet address www.f-secure.com or the parent company’s registrant address.
AccoUnTIng PRIncIPlesThe financial statement of f-secure corporation has been prepared in accordance with finnish Accounting standards (fAs).
foreign currency translationforeign currencies are translated into the local currency using fixed monthly exchange rates. At the balance sheet date, assets and liabilities denominated in foreign currencies are translated at the rates of exchange prevailing at that date. exchange rate gains and losses of financial transactions are recognized in the income statement under financial items. forward rate contracts for hedging purposes are recorded using the exchange rate prevailing at the balance sheet date.
Tangible and intangible assetsIntangible assets include software licenses. Intangible assets recognized on merger consist of technology-based intangible assets. Tangible and intangible assets are recorded at historical cost less accumulated depreciation. Depreciation is recorded on a straight-line basis over the estimated useful life of an asset. The estimated useful lives of tangible and intangible assets are as follows: Machinery and equipment 3–8 years capitalized development costs 3 years Intangible assets 5–10 years
ordinary repairs and maintenance costs are charged to the income statement during the financial period in which they are incurred. The cost of major renovations is included in the assets’ carrying amount when it is probable that the company will derive future economic benefits in excess of the originally assessed standard or performance of the existing asset. Any gain or loss arising on derecognition of the asset (calculated as the difference between the net disposal proceeds and the carrying amount of the asset) is included in the income statement in the year the asset is derecognized.
Research and development costsResearch costs are expensed as incurred. Development expenditures incurred on individual projects of totally new products or product versions with significant new features are carried forward when they are technically feasible and their future recoverability can reasonably be regarded as assured.
InventoriesInventories are valued at the lower of cost and net realizable value with cost being determined by method first-in first-out method. net realizable value is the estimated selling price in the ordinary course of business, less estimated costs of completion and the estimated costs necessary to make the sale.
leasesleases where the lessor retains substantially all the risks and benefits of ownership of the asset are classified as operating leases. The company has only operating leases. operating lease payments are recognized as an expense in the income statement on a straight-line basis over the lease term. leases of unused office space are recognized as other operating income in the income statement on a straight-line basis over the lease term.
PensionsPension arrangement is of local statutory arrangement and defined contribution plans. contributions to defined contribution plans are recognized in income statement in the period to which the contributions relate. The company recognizes the disability commitment of Tyel pension plan when disability appears.
share-based payment transactionsIn the company’s industry it is common practice internationally that incentives are provided to employees in the form of equity-settled share-based instruments. company has three kinds of incentive programs; warrant-based program, synthetic warrant-based program and a share-based program.
The company’s warrant programs cover key personnel. The synthetic warrant-based program is settled as cash-settled payment. The cost of cash-settled transactions with employees is measured by reference to the fair value at the date of balance sheet. The fair value is determined by using the binomial model. The cost of transactions is recognized, together with a corresponding entry in liability, over the period in which the performance conditions are fulfilled, ending on the date on which the relevant employees become fully entitled to the award (vesting date). If the holder of the warrant leaves company before vesting the warrant is forfeited. The cumulative expense recognized for transactions at each reporting date until the vesting date reflects the extent to which the vesting period has expired and the number of awards that, in the opinion of the directors of the group at that date, based on the best available estimate of the number of equity instruments that will ultimately vest.
The share-based incentive program has been established as part of the key employee incentive and retention system inside f secure. Reward will be settled in two phases so that one part is settled as equity-settled payment and one part as cash-settled payment. cost of cash-settled transactions is measured by reference to the fair value by using market price of f secure corporation share on the date of balance sheet. The cost is recognized over the period in which the performance conditions are fulfilled, ending on the date on which the relevant employees become fully entitled to the reward (end of lock-up period). The cost of cash-settle corresponding entry is recognized in liabilities. If relevant employee leaves company before fully entitled to the reward, the reward is forfeited. The cumulative expense recognized for share-based incentive program transactions at each reporting date is based on the best available estimate of the number of equity instruments that will ultimately fulfill.
Income taxesDirect current taxes are calculated in accordance with the local tax and accounting rules. Deferred taxes, resulting from temporary differences between the financial statement and the income tax basis of assets and liabilities, use the enacted tax rates in effect in the years in which the differences are expected to reverse. Deferred tax assets are recognized to the extent that it is probable that future taxable profit will be available.
Revenue recognitionRevenue is primarily derived from monthly software as a service sale, software license agreement sales and operator’s system integration and maintenance sales. license agreements consist of initial license agreements and periodic maintenance agreements covering product updates and customer support. The revenue recognition policy of f-secure group recognizes the service revenue at the time of delivery, the license agreement’s license fee revenues as the product is delivered, the license agreement’s maintenance revenues are recognized over the maintenance period, and service based project deliveries are recognized with the percentage of completion method, when the outcome can be reliably estimated. The degree of completion is determined by relation of project costs incurred for work performed to date bear the estimated total project costs. If total project costs will exceed total project
noTes To THe fInAncIAl sTATeMenTs

FInanCIal StatementS
F-SeCure CorPoratIon 43
revenue, the expected loss is recognized as an expense immediately. Indirect taxes, discounts granted and exchange rate differences are excluded from net sales.
other operating income other operating income includes profits from the sales of fixed assets, rental revenue, and government grants received for research and development projects.
Presentation of expensesclassification of the functionally presented expenses has been made as follows: various types of expenses in different geographical locations have been allocated to the various functions by allocating directly to allocable expenses to the respective function, and other operating expenses have been allocated to functions on the basis of average headcount in each location.
Treasury sharescompany has acquired treasury shares. The cost of acquisition is recognized as a deduction in the shareholders’ equity.
financial assetsshort-term investments are measured at fair value. short-term investments consist of interest-bearing debt securities and shares in mutual funds invested in similar instruments. for assets that are actively traded in organized financial markets, fair value is determined by reference to stock exchange quoted market bid prices at the close of business on the balance sheet date. Assets, the fair value of which cannot be measured reliably, are recognized at cost less impairment. The fair value changes of short-term investments are recognized in shareholders’ equity under fair value reserve. When financial assets recognized as available-for-sale are sold, the accumulated fair value changes are released from equity and recognized in the income statement.
cash and cash equivalents in the balance sheet comprise cash at bank and in hand and other highly liquid short-term investments.

FInanCIal StatementS
44 F-SeCure CorPoratIon
1. NeT SALeS
FAS FASgeographical information 2010 2009
finland and scandinavia 41 283 41 962Rest of europe 57 897 55 858north America 7 258 5 005Rest of the world 11 453 9 087
Total 117 891 111 912
2. OTHer OPerATiNg iNcOMe
Rental revenue 46 195goverment grants 835 456other 1 290 1 249
Total 2 171 1 899
3. DePreciATiON AND reDucTiON iN VALue
Depreciations from non-current assets
other cap.expenditure -1 094 -882capitalized development -209 -300
Intangible assets -1 303 -1 182 Machinery and equipment -1 376 -1 042
Tangible assets -1 376 -1 042
Total depreciation -2 679 -2 224
Depreciations by function
sales and marketing -1 148 -774Research and development -1 430 -1 356Administration -101 -94
Total depreciation -2 679 -2 224
4. PerSONNeL eXPeNSeS
Personnel expenses
Wages and salaries -26 445 -24 901Pension expenses -4 707 -4 392other social expenses -1 492 -1 319
Total -32 643 -30 613
compensation of key management personnel
Wages and other short-term employee benefits -2 008 -1 307
Wages and other short-term employee benefits
Managing director -372 -307Members of the boards of directors -225 -225
Wages and other short-term employee benefits of the board of directors and managing director see group disclosure 27. Related party disclosure
The ceo's retirement age and the determination of his pension conform to the standard rules specified by finland's employee Pension Act (Tyel). The period of notice for the ceo is twelve (12) months both ways and there are no separate compensations for dismissal.
noTes To THe fInAncIAl sTATeMenTs (eUR 1000)
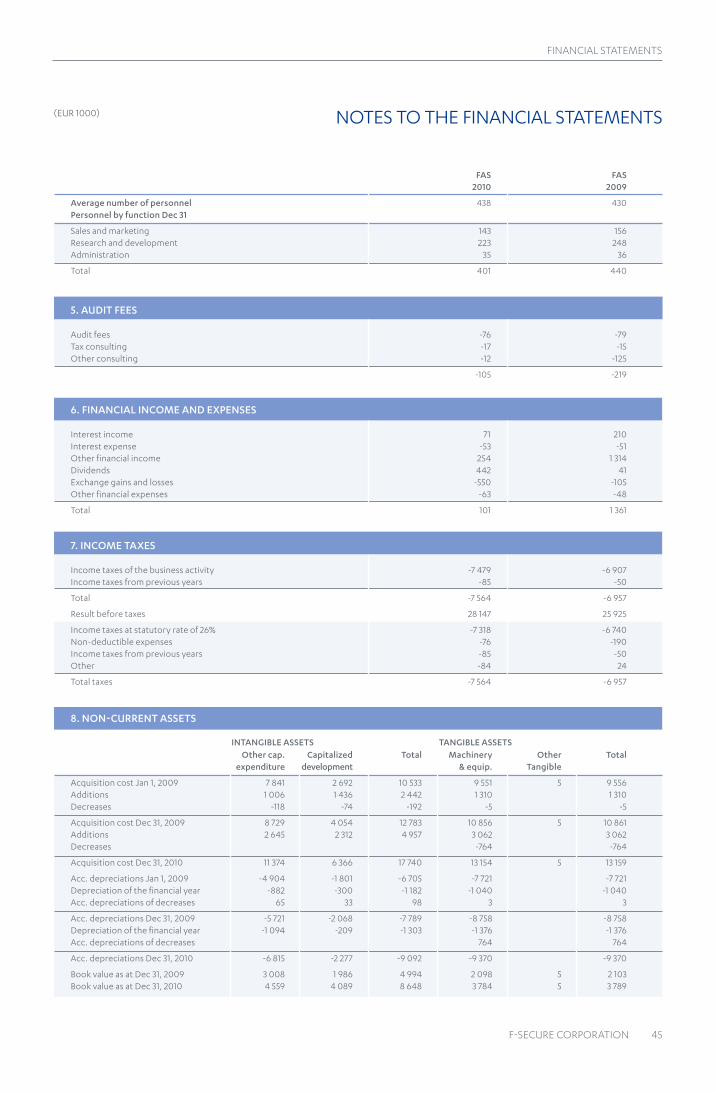
FInanCIal StatementS
F-SeCure CorPoratIon 45
FAS FAS 2010 2009
Average number of personnel 438 430Personnel by function Dec 31
sales and marketing 143 156Research and development 223 248Administration 35 36
Total 401 440
5. AuDiT FeeS
Audit fees -76 -79Tax consulting -17 -15other consulting -12 -125
-105 -219
6. FiNANciAL iNcOMe AND eXPeNSeS
Interest income 71 210Interest expense -53 -51other financial income 254 1 314Dividends 442 41exchange gains and losses -550 -105other financial expenses -63 -48
Total 101 1 361
7. iNcOMe TAXeS
Income taxes of the business activity -7 479 -6 907Income taxes from previous years -85 -50
Total -7 564 -6 957
Result before taxes 28 147 25 925
Income taxes at statutory rate of 26% -7 318 -6 740non-deductible expenses -76 -190Income taxes from previous years -85 -50other -84 24
Total taxes -7 564 -6 957
8. NON-curreNT ASSeTS
Other cap. capitalized Total Machinery Other Total expenditure development & equip. Tangible
Acquisition cost Jan 1, 2009 7 841 2 692 10 533 9 551 5 9 556Additions 1 006 1 436 2 442 1 310 1 310Decreases -118 -74 -192 -5 -5
Acquisition cost Dec 31, 2009 8 729 4 054 12 783 10 856 5 10 861Additions 2 645 2 312 4 957 3 062 3 062Decreases -764 -764
Acquisition cost Dec 31, 2010 11 374 6 366 17 740 13 154 5 13 159
Acc. depreciations Jan 1, 2009 -4 904 -1 801 -6 705 -7 721 -7 721Depreciation of the financial year -882 -300 -1 182 -1 040 -1 040Acc. depreciations of decreases 65 33 98 3 3
Acc. depreciations Dec 31, 2009 -5 721 -2 068 -7 789 -8 758 -8 758Depreciation of the financial year -1 094 -209 -1 303 -1 376 -1 376Acc. depreciations of decreases 764 764
Acc. depreciations Dec 31, 2010 -6 815 -2 277 -9 092 -9 370 -9 370
book value as at Dec 31, 2009 3 008 1 986 4 994 2 098 5 2 103book value as at Dec 31, 2010 4 559 4 089 8 648 3 784 5 3 789
iNTANgiBLe ASSeTS TANgiBLe ASSeTS
(eUR 1000) noTes To THe fInAncIAl sTATeMenTs

FInanCIal StatementS
46 F-SeCure CorPoratIon
9. iNVeSTMeNTS group comp. Associated Total shares comp. shares
book value as at Jan 1 34 241 42 34 283Additions 3 3
book value as at Dec 31 34 244 42 34 286
Name country of incorporation Share of ownership (%)
Parent F-Secure Corporation, Helsinki Finland DF-Data oy, Helsinki Finland 100F-Secure Inc., San Jose united States 100F-Secure (uK) ltd, london Great-Britain 100F-Secure KK, tokyo Japan 100F-Secure GmbH, münchen Germany 100F-Secure eStore GmbH, münchen Germany 100F-Secure Sarl, maisons-laffitte France 98F-Secure France Sarl, maisons-laffitte France 100F-Secure BVBa, Heverlee-leuven Belgium 100F-Secure aB, Stockholm Sweden 100F-Secure Srl, milano Italy 100F-Secure SP z.o.o., Warsaw Poland 100F-Secure Corporation (m) Sdn Bhd, Kuala lumpur malaysia 100F-Secure Pvt ltd, Hyderabad India 100F-Secure Pte ltd, Singapore Singapore 100F-Secure B.V., utrecht the netherlands 100F-Secure limited, Hong Kong Hong Kong 100F-Secure Pty limited, Sydney australia 100F-Secure Iberia Sl, Barcelona Spain 100
Associated companies Share of ownership (%)
Vineyard International ltd, Helsinki finland 34,8
10. DeFerreD TAX
FAS FAS 2010 2009
Deferred tax assets
Tax charged to shareholders’ equity change in fair value, available-for-sale 2
Total 2
Deferred tax liability
other temporary differences change in fair value, available-for-sale 9
Total 9
11. iNVeNTOrieS
other inventories 394 423
noTes To THe fInAncIAl sTATeMenTs (eUR 1000)
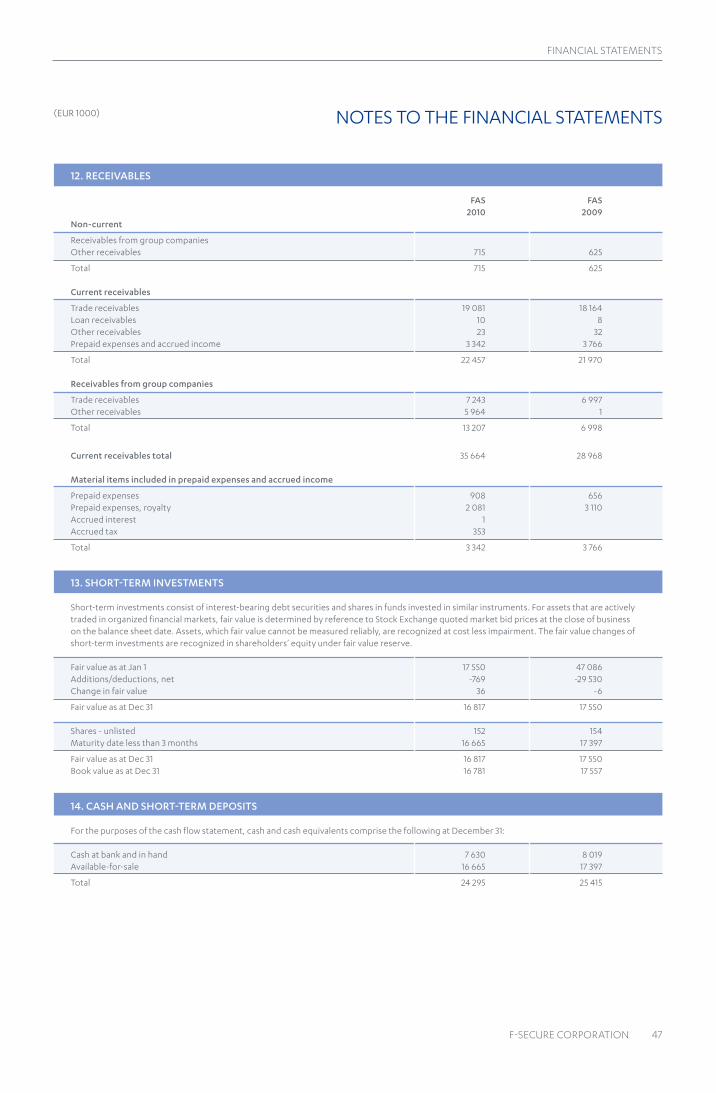
FInanCIal StatementS
F-SeCure CorPoratIon 47
12. receiVABLeS
FAS FAS 2010 2009Non-current
Receivables from group companiesother receivables 715 625
Total 715 625
current receivables
Trade receivables 19 081 18 164loan receivables 10 8other receivables 23 32Prepaid expenses and accrued income 3 342 3 766
Total 22 457 21 970
receivables from group companies
Trade receivables 7 243 6 997other receivables 5 964 1
Total 13 207 6 998
current receivables total 35 664 28 968
Material items included in prepaid expenses and accrued income
Prepaid expenses 908 656Prepaid expenses, royalty 2 081 3 110Accrued interest 1 Accrued tax 353
Total 3 342 3 766
13. SHOrT-TerM iNVeSTMeNTS
short-term investments consist of interest-bearing debt securities and shares in funds invested in similar instruments. for assets that are actively traded in organized financial markets, fair value is determined by reference to stock exchange quoted market bid prices at the close of business on the balance sheet date. Assets, which fair value cannot be measured reliably, are recognized at cost less impairment. The fair value changes of short-term investments are recognized in shareholders’ equity under fair value reserve.
fair value as at Jan 1 17 550 47 086Additions/deductions, net -769 -29 530change in fair value 36 -6
fair value as at Dec 31 16 817 17 550
shares - unlisted 152 154Maturity date less than 3 months 16 665 17 397
fair value as at Dec 31 16 817 17 550book value as at Dec 31 16 781 17 557
14. cASH AND SHOrT-TerM DePOSiTS
for the purposes of the cash flow statement, cash and cash equivalents comprise the following at December 31:
cash at bank and in hand 7 630 8 019Available-for-sale 16 665 17 397
Total 24 295 25 415
(eUR 1000) noTes To THe fInAncIAl sTATeMenTs

FInanCIal StatementS
48 F-SeCure CorPoratIon
15. STATeMeNT OF cHANgeS iN SHAreHOLDerS’ equiTy
Parent company Share Share Share Treasury Fair unrestricted retained Total capital issue premium shares value equity earnings equityFAS fund reserve reserve
equity Dec 31, 2008 1 551 661 165 -1 453 -71 1 465 36 176 38 493Available-for-sale financial assets, net 67 67Result of the financial year 18 967 18 967Dividend -10 904 -10 904Acquisition of treasury shares -2 035 -2 035Registration of share issue -661 -661exercise of options 1 611 1 611other change 3 3
equity Dec 31, 2009 1 551 165 -3 488 -4 3 079 44 239 45 540Available-for-sale financial assets, net 31 31Result of the financial year 20 582 20 582Dividend -9 310 -9 310Acquisition of treasury shares -4 004 -4 004exercise of options 108 108other change -100 -100
equity Dec 31, 2010 1 551 165 -7 493 27 3 187 55 411 52 847
16. SHAreHOLDerS’ equiTy
During the year, 70,000 ordinary shares were subscibed with warrants attached to f-secure option programs.
The company's share capital amounted to 1,551,311 euro and the number of shares was 157,539,243 at the end of the year 2010. see group disclosure 18. shareholders' equity.
Treasury sharessee group disclosure 18. shareholders' equity.
Distributable shareholders' equity on December 31, 2010
Unrestricted equity reserve 3 187Retained earnings 27 336Result of the financial year 20 582
Distributable shareholders' equity on December 31, 2010 51 105
17. SHAre-BASeD PAyMeNT TrANSAcTiONS
see group disclosure 19. share-based payment transactions.
noTes To THe fInAncIAl sTATeMenTs (eUR 1000)

FInanCIal StatementS
F-SeCure CorPoratIon 49
18. LiABiLiTieS
FAS FAS 2010 2009Non-current liabilities
Deferred revenues 6 592 5 697Deferred tax liabilites 9
Total 6 601 5 697
current liabilities
Deferred revenues 23 549 23 555Trade payables 3 268 2 901other liabilities 1 002 1 181Accrued expenses 10 026 8 975
Total 37 845 36 613
Liabilities to the group companies
Advance payments 3 543 3 187Trade payables 4 491 3 534other liabilities 2 616 2 395
Total 10 650 9 116
Total current liabilities 48 494 45 729
Material amounts shown under accruals and deferred income
Accrued personnel expenses 7 501 6 121Deferred royalty 903 1 315Accrued expenses 1 621 1 512Accrued tax 27
Total 10 026 8 975
19. FiNANciAL riSk MANAgeMeNT OBJecTiVeS AND POLicieS
see group disclosure 23. financial risk management objectives and policies.
(eUR 1000) noTes To THe fInAncIAl sTATeMenTs

FInanCIal StatementS
50 F-SeCure CorPoratIon
20. NOTeS TO cASH FLOW STATeMeNT FAS FAS 2010 2009Adjustments
Deferred income 839 -1 060Depreciation and amortization 2 679 2 224Profit / loss on sale of fixed asset -2 83other adjustments 290 481financial income and expenses -101 -1 361Income taxes 7 564 6 957
Total 11 270 7 323
21. OPerATiNg LeASe cOMMiTMeNTS
The group has entered into commercial leases on office space and on motor vehicles. Motor vehicle leases have an average life of three years and office space between two and five years with renewal terms included in the contracts.
future minimum rentals payable under non-cancellable operating leases as at 31 December are as follows
As lessee
Within one year 2 839 2 845After one year but not more than five years 10 916 13 243
Total 13 754 16 087
22. cONTiNgeNT LiABiLiTieS
guarantees for other group companies 12 11
other liabilitiesothers 371 70
Derivatives see group disclosure 23. financial risk management objectives and policies
23. SHAreS AND SHAreHOLDerS
see group disclosure 28. shares and shareholders.
24. key rATiOS
see group disclosure 29. key ratios.
noTes To THe fInAncIAl sTATeMenTs (eUR 1000)
annual rePort 51
To the Annual general Meeting of F-Secure corporation We have audited the accounting records, the financial statements, the report of the board of Directors, and the administration of f-secure corporation for the financial period 1.1.–31.12.2010. The financial statements comprise the consolidated statement of financial position, statement of comprehensive income, statement of changes in equity and statement of cash flows, and notes to the consolidated financial statements, as well as the parent company’s balance sheet, income statement, cash flow statement and notes to the financial statements.
responsibility of the Board of Directors and the Managing DirectorThe board of Directors and the Managing Director are responsible for the preparation of consolidated financial statements that give a true and fair view in accordance with International financial Reporting standards (IfRs) as adopted by the eU, as well as for the preparation of financial statements and the report of the board of Directors that give a true and fair view in accordance with the laws and regulations governing the preparation of the financial statements and the report of the board of Directors in finland. The board of Directors is responsible for the appropriate arrangement of the control of the company’s accounts and finances, and the Managing Director shall see to it that the accounts of the company are in compliance with the law and that its financial affairs have been arranged in a reliable manner.
Auditor’s responsibilityour responsibility is to express an opinion on the financial statements, on the consolidated financial statements and on the report of the board of Directors based on our audit. The Auditing Act requires that we comply with the requirements of professional ethics. We conducted our audit in accordance with good auditing practice in finland. good auditing practice requires that we plan and perform the audit to obtain reasonable assurance about whether the financial statements and the report of the board of Directors are free from material misstatement, and whether the members of the board of Directors of the parent company and the Managing Director are guilty of an act or negligence which may result in liability in damages towards the company or violated the limited liability companies Act or the articles of association of the company.
An audit involves performing procedures to obtain audit evidence about the amounts and disclosures in the financial statements and
the report of the board of Directors. The procedures selected depend on the auditor’s judgment, including the assessment of the risks of material misstatement, whether due to fraud or error. In making those risk assessments, the auditor considers internal control relevant to the entity’s preparation of financial statements and report of the board of Directors that give a true and fair view in order to design audit procedures that are appropriate in the circumstances, but not for the purpose of expressing an opinion on the effectiveness of the company’s internal control. An audit also includes evaluating the appropriateness of accounting policies used and the reasonableness of accounting estimates made by management, as well as evaluating the overall presentation of the financial statements and the report of the board of Directors.
We believe that the audit evidence we have obtained is sufficient and appropriate to provide a basis for our audit opinion.
Opinion on the consolidated financial statementsIn our opinion, the consolidated financial statements give a true and fair view of the financial position, financial performance, and cash flows of the group in accordance with International financial Reporting standards (IfRs) as adopted by the eU.
Opinion on the company’s financial statements and the report of the Board of Directors In our opinion, the financial statements and the report of the board of Directors give a true and fair view of both the consolidated and the parent company’s financial performance and financial position in accordance with the laws and regulations governing the preparation of the financial statements and the report of the board of Directors in finland. The information in the report of the board of Directors is consistent with the information in the financial statements.
Helsinki, february 16, 2011
ernst & young OyAuthorized Public Accountant firm
erkka Talvinko Authorized Public Accountant
AUDIToR’s RePoRT

52 annual rePort
general principlesf-secure corporation applies principles of corporate governance and follows high ethical standards, complying with the finnish companies Act, securities Market Act, the rules and regulation of nAsDAQ oMX Helsinki ltd, and other regulations on the administration of public companies issued by the authorities.
The company complies with the corporate governance code for listed companies, in force as of october 1, 2010, as explained below and on the web pages of f-secure corporation. The code has been published by the securities Market Association, a body established by the confederation of finnish Industries ek, the central chamber of commerce, and nAsDAQ oMX Helsinki ltd. The code is publicly available at www.cgfinland.com.
The key elements of the corporate governance practices of f-secure corporation are described briefly below. More information on the governance practices of the company is available on the f-secure corporation website.
Tasks and responsibilities of governing bodiesThe main duties of the company’s governing bodies are mostly defined by the finnish companies Act and other applicable regulation.
Annual general Meeting of Shareholders (AgM)The highest governing body of the corporation is the general Meeting of shareholders. The AgM's tasks are defined in detail by the finnish companies Act, Articles of Association of f-secure corporation and other regulations. The AgM shall decide on the number of members of the board of Directors, confirm remunerations to the board members and auditors, appoint board members, approve financial statements, determines dividends and select auditor and other duties defined by the Articles of Association and the finnish companies Act. The AgM shall be held after the end of the financial year within a period determined by the board of Directors and as defined by the companies Act.
f-secure corporation has only one class of shares and thus all shares have equal voting power at the general Meetings of shareholders. More detailed information on the process of the Annual general Meetings can be found in the f-secure Articles of Association, which is available on the company’s Investor web pages under corporate governance. All documents related to the company's AgM can also be found at www.f-secure.com under f-securecorporation.com, Investor Relations.
In 2010, the Annual general Meeting was held in Helsinki, HTc Ruoholahti on March 24, 2010. The decisions made in the AgM 2010 are presented in the board of Directors’ report for 2010.
Board of Directors
The main tasks of the Board of DirectorsThe objective of the board of Directors is to direct the company with the aim of achieving the best possible return on invested capital for shareholders in the long term. The board of Directors represents all shareholders. The board of Directors shall always work to the best advantage of the company and all of its shareholders.
coRPoRATe goVeRnAnce sTATeMenT 2010
The board of Directors is responsible for making sure that supervision of the company’s accounting and financial management is duly organized. The meetings of the board shall regularly discuss reports presented by the ceo of the company on the financial status and operations of the company.
furthermore, it is the duty of the board to prepare matters to be handled by the shareholders’ meeting, to decide on the convening of the shareholders’ meeting and to make sure that the decisions made at the shareholders’ meeting are executed. Any matters that are significant or far-reaching from the company’s point of view shall be dealt with by the board. These include strategic outlines, approval of budgets and operating plans and supervision of how these are put into effect, acquisitions and corporate structure, any major investments with regard to the operation of the company, organization of the supervision of accounting and financial management, internal monitoring systems and risk management as well as personnel policies and reward systems.
The duties and responsibilities of the board are more thoroughly defined in the Articles of Association of the company, the finnish companies Act and other applicable laws and regulations. The Articles of Association and the charter of the board, including a more complete list of its main duties and tasks and its committees, are presented in detail on the company’s Investor web pages.
The tasks of the board of Directors are governed by the finnish companies Act, the Articles of Association of the company, decisions of the general Meetings of shareholders, legislation regarding accounting rules and IfRs as well as the securities Market, and the rules of the nAsDAQ oMX Helsinki ltd., and other regulations.
According to the Articles of Association, the board shall have a minimum of three and maximum of seven ordinary members, whose term ends at the end of the next AgM following the election of members. The Annual general Meeting of shareholders shall decide the number of board members and elect the board members. The board shall elect the chairman of the board from among its members. The board shall also elect a secretary, who may be a non-member of the board. The term of each board member is one year. The majority of the board members shall be independent of the company. More detailed information about e.g. other terms of board membership can be found in the Articles of Association.
The board of Directors shall convene at least five times during its term. The board shall conduct an annual self-assessment of its operations.
Board of Directors in 2010
According to the decision of the Annual general Meeting 2010, the board has six (6) members. The members of the board are risto Siilasmaa (chairman), Jussi Arovaara, Sari Baldauf, Pertti ervi, Juho Malmberg and Anu Nissinen. The board members until March 24, 2010 were Risto siilasmaa, Marko Ahtisaari, sari baldauf, Pertti ervi, Juho Malmberg and Alexis sozonoff.

annual rePort 53
The majority of f-secure corporation’s board of Directors, Pertti ervi, sari baldauf, Juho Malmberg, Anu nissinen and Jussi Arovaara, have no dependence neither on the company nor the significant shareholders. The chairman of the board, Mr. siilasmaa, is a major shareholder of the company.
The Annual general Meeting decides on the remuneration to be paid to the members of the board. According to its decision, the annual compensation for the chairman is eUR 55,000, for the chairmen of executive and Audit committee eUR 40,000 and for members eUR 30,000. Approximately 40% of the annual remuneration will be paid as company shares. In principle these shares are bought on the nAsDAQ oMX Helsinki ltd. Information on the number of shares, paid as remuneration, to each board member is available on the company’ s website under Investors, shareholders, Insiders.
In 2010, the board focused especially on strategy topics, follow-up of acquired business, restructuring of the operations and the company’s financial results on continuous basis. During 2010, the board held 9 meetings and the attendance was close to 100%. The members of the board of Directors are presented later in this report. The detailed tables on remuneration and share ownership are presented in note 27 to the financial statements.
Board committees
Audit committeeThe board has two committees; Audit committee and executive committee (nomination and remuneration issues). The chairman of the Audit committee is Pertti ervi and the members are Jussi Arovaara, Juho Malmberg and Anu Nissinen.
The Audit committee prepares, instructs and evaluates the corporation’s risk management, internal supervision systems, IT strategy and practices, financial reporting, external auditing of the accounts and internal control. During 2010, the Audit committee held 5 meetings and the attendance was close to 100%.
In 2010, the Audit committee focused, in addition to its regulatory tasks, especially on IT strategy and risk management process and practices.
executive committeeThe chairman of the executive committee is Sari Baldauf and the member is risto Siilasmaa.
The executive committee prepares material and provides instructions on issues related to the composition and compensation of the board of Directors and remuneration of the other members of the executive management. The executive committee held 5 meetings in 2010 and the attendance was 100%. In 2010, the executive committee focused especially on talent management and competence development.
The charters of both committees can be found on the f-secure corporation web pages under corporate governance.
President and ceOThe board of Directors shall appoint the ceo and decide upon his/her remuneration and other benefits. The President and ceo is in charge of the day-to-day management of the company.
The President and ceo of the company is kimmo Alkio. The ceo’s duties include managing the business according to the instructions issued by the board of Directors, presenting the matters to be dealt with in the board of Directors’ meeting, implementing the matters resolved by the board of Directors and other issues determined in the companies Act.
The ceo’s retirement age and the determination of his/her pension conform to the standard rules, which are specified by finland’s employee Pension Act. The period of notice for the ceo is twelve (12) months and there is no separate compensation for dismissal. During 2010, the President and ceo’s annual compensation was in total eUR 372 291. The ceo also belongs to the company’s incentive reward program. More details on the remuneration and option programs are available in note 27 to the financial statements as well as in the Remuneration statement published on the company’s Investor web pages under corporate governance. The President and ceo as well as the executive team members are presented later in this report.
executive Teamf-secure corporation’s executive Team is chaired by the President and ceo, and it assists the ceo in the management and development of the company. The executive Team currently consists of the following persons: The current executive Team consists of the following persons: kimmo Alkio (President and ceo), Ari Alakiuttu (Vice President, Human Resources), Tuomas Hyyryläinen (Vice President, strategy and M&A), Samu konttinen (Vice President, sales and geographical operations), Maria Nordgren (Vice President, channels), Pirkka Palomäki (chief Technology officer), kari Penttilä (Vice President, R&D), Patrik Sallner (Vice President, Professional services), Antti reijonen (Vice President, solution and Portfolio Management) and Taneli Virtanen (chief financial officer).
The ceo appoints the executive Team members and decides upon the terms and conditions of their employment. The board of Directors approves the compensation for the executive teams.
THe boARD HAs TWo coMMITTees; AUDIT coMMITTee AnD eXecUTIVe coMMITTee (noMInATIon AnD ReMUneRATIon IssUes).
54 annual rePort
The bonuses and granting of stock options are based on the performance of the group and the individual. The executive Team assembles regularly once a month and separately as needed.
The remuneration paid to the board of Directors, President & ceo and the executive team are described in note 27 to the financial statements as well as in the remuneration statement for 2010.
AuditorsThe auditor is elected by the Annual general Meeting for one year’s term of service. The auditor is responsible for auditing the consolidated and parent company’s financial statements and accounting. The auditor will report to the board of Directors at least once a year.
for 2010, f-secure corporation’s auditor is ernst & young oy, an auditing firm of Authorized Public Accountant authorized by the central chamber of commerce. APA erkka Talvinko acts as responsible partner for the direction and coordination of the audit work. During 2010, the group paid a total of eUR 94 281 for auditing services (2009: eUR 96 320) and eUR 32 927 (2009: eUR 139 710) for other services. ernst & young has been f-secure corporation’s auditor since 1999.
Description of the main features of internal control and risk management pertaining to the financial reporting process
internal controlThe executive Team of f-secure, financial Management and Risk Management are responsible for internal control and risk management. Regular audits will be performed in the business units as well as in the subsidiaries. The purpose is to ensure compliance with consistent administration, accounting practices and information security in the company.
Internal control covers all the guidelines, policies, processes and organizational structure that help to ensure that the business conduct is in compliance with all applicable regulations, and that all financial reporting is correct. The guidelines and instructions are made to ensure that accounting and financial information is a true and accurate reflection of the activities and financial situation of the company.
Actual performance against sales and cost targets and comparison period is constantly followed up by operative reporting systems on a daily, weekly or monthly basis.
The company constantly follows up its cost efficiency and profitability as well as incoming and outgoing payment transactions. If any inconsistencies appear, the issues are handled without delay. The company’s controlling function works in close cooperation with the cfo and business units, providing relevant data for business planning purposes and sales estimates.
During 2010 the financial management focused especially on redefining project revenue recognition principles. Project revenue recognition is based on ‘percentage of completion’ method and is used for large delivery projects.
internal audit The principles of internal audit are embedded in written guidelines and policies concerning accounting, risk management and controlling, and operations at all units in f-secure are coordinated by the company's finance department. The company guidelines cover accounting, reporting, documentation, authorization as well as other relevant issues.
f-secure has no separate internal audit function, and therefore this has been taken into account when defining the scope of external audit. The financial management team meets with the auditors several times a year.
risk ManagementThe goal of risk management is to identify risks that may hinder the company from achieving its business objectives. A risk can be defined as any uncertainty that affects f-secure’s business objectives and ability to reach its results.
The risks can be defined into strategic, operative and financial risks. strategic risks comprise e.g. risks related to changes in industry, markets or competition, intellectual capital, operator or subcontracting agreements, or acquisitions. operative risks include risks related to production, processes and quality. financial risks include all risks concerning financial activities, such as currency risks.
The responsibility for the company’s risk management lies with the ceo and the executive Team coordinated by the risk management team. The board of Directors is responsible for defining the company’s overall level of risk tolerance. The board of Directors and its committees approve and follow up the reporting procedures, and monitor the adequacy, appropriateness and effectiveness of the company’s business and administrative processes.
Weekly and monthly financial reporting that covers the entire company is used to monitor how well financial targets are being met. The reports include actual figures, plans and up-to-date forecasts. The company has sought to manage the risks relating to its business operations by developing its operating processes and control systems.
The company’s risk management team leads the operational risk management processes. f-secure’s risk management team
THe goAl of RIsk MAnAgeMenT Is To IDenTIfy RIsks THAT MAy HInDeR THe coMPAny fRoM AcHIeVIng ITs bUsIness obJecTIVes.

annual rePort 55
is regularly monitoring and coordinating activities to mitigate threats. The board has set certain appropriate authorization limits to the management, and if these limits are exceeded, the decisions shall be handled by the board of Directors.
f-secure corporation does not provide financing outside the industry standard payment terms, and invoicing is mainly done in euros. However, some currencies contain an exchange rate risk. In order to minimize the impact of the fluctuation of the exchange rates, the goal is to hedge the estimated cash flow of these currencies.
The investment policy of the company for cash reserves is conservative. cash is mainly invested in short-term funds and other low-risk investments. The company’s critical IT systems are reviewed externally to ensure their security. The company monitors these systems internally as well.
During 2010 the controlling systems of storage business and forecasting were further developed.
Other issues
Management of insider issuesThe company follows the insider regulations of the nAsDAQ oMX Helsinki ltd. Insiders are divided into three categories: (1) permanent public insiders including the members of the board, the auditors, and the group’s executive team, (2) permanent company-specific non-public insiders including persons who by virtue of their position or tasks learn inside information on
a regular basis, and (3) project-based insiders. The trading of f-secure shares and options of permanent public insiders is public.
Permanent public insiders and permanent company-specific insiders are not entitled to trade shares, options or other securities 21 days prior to publication of interim financial statements or company accounts.
Up-to-date information on the holdings of f-secure’s permanent insiders with a duty to declare can be found on the company’s website.
Silent PeriodThe company observes a silent period of 21 days before each quarterly report announcement. During the silent period, the company will arrange neither meetings nor conference calls with the investor community.
communicationsThe aim of the company’s communications is to support the correct valuation of the company by providing the markets with sufficient information on f-secure’s financial position, strategy and objectives. The board of Directors has approved the disclosure policy that defines the guidelines in communications to financial markets and investors and other parties. The f-secure web site contains all information made public according to the disclosure requirements for listed companies.
The members of the board of Directors and the executive Team are presented on pages 56-57.

56 annual rePort
risto Siilasmaa chairman of the board of Directors since 2006, in the board since 1988b. 1966, M.sc (engineering) • Main employment history: Founder of the F-Secure
corporation. Worked as a President and ceo of the company until november 2006 and since then held the position of chairman of the board.
• Main Board Memberships and public duties currentlyundertaken: chairman of the board of Directors of elisa corporation and fruugo ltd. Member of the board of Directors of nokia corporation, blyk ltd, ekahau Inc., efecte corporation, Mendor oy and federation of finnish Technology Industries. Member of the Investment council of finnish Industry Investment ltd.
• Holdings:Numberofshares63.078.862,holding%40,9%
Jussi Arovaara board member since 2010b. 1966 • Mainemploymenthistory:CurrentlyworksasaVicePresident,
global sales operations in corel corporation (Uk) and has served in several international sales, marketing and business development positions in corel corporation in the Uk, canada and finland since 1996. In his earlier career before 1996 worked in several sales and marketing positions in computer wholesale.
• Holdings:Numberofshares5.587
Sari Baldauf board member since 2005, chairman of the executive committee b. 1955, M.sc. (bus. Adm.), D.sc. (Tech.) h.c., D.sc. (econ. & bus.Adm.) h.c. • Mainemploymenthistory:Workedformorethantwentyyears
at nokia corporation. During the years served as executive Vice President and general Manager of nokia networks 1998-2005 and a member of the group executive board 1994-2005. Prior to 1998 served as executive Vice President of nokia APAc and President of nokia Telecommunications, cellular systems.
• Main Board Memberships and public duties currentlyundertaken: Deputy chairman of the board of Directors of fortum corporation, Member of the board of Directors of capMan oyj and Hewlett-Packard company. Member of supervisory board of Daimler Ag and a chairman of the board of Directors of savonlinna opera festival ltd. serves also on boards of finnish business and Policy forum eVA , International youth foundation And John nurminen foundation
• Holdings:Numberofshares94.290
Pertti ervi board member since 2003, chairman of The Audit committeeb. 1957, b.sc. (electronics)• Mainemploymenthistory:Currentlyworksasanindependent
management consultant. co-founder of the computer 2000 finland oy in which served as an MD until 1995. After that worked until 2000 as a co-President for computer 2000 Ag international headquarters in germany. Has worked with international management level with major IT vendors such as cisco, IbM, Intel, HP and Microsoft.
• Main Board Memberships and public duties currentlyundertaken: chairman of the board of Directors of Inventure oy, nevtor oy and efecte corporation. Vice chairman of the board of Directors of Ixonos Plc and a Member of the board of Directors of Aldata solutions oyj, forte net services oy, forte groupservices oy, opus capita oy and Teleste corporation.
• Holdings:Numberofshares30.290,2005Coption14.600
Juho Malmberg board member since 2008b. 1962, M.sc. (cs)• Mainemploymenthistory:MemberofExecutiveBoardofKone
corporation since 2006. • Currently, since November 2010, serves as an Executive Vice
President, customer experience and prior to his current position worked as an executive Vice President for global Development. Prior to kone corporation worked in Accenture as Managing Director of Accenture finland 2002-2005, Director of nordic outsourcing business in 2005, Deputy Managing Director 1999-2002 and Technology Director 1992-1999.
• Holdings:Numberofshares25.218
Anu Nissinen board member since 2010b. 1963, M.sc. (economics)• Main employment history: Currently serves as a President of
sanoma entertainment oy. Prior 2008 worked as President of sW Television oy / Welho, Marketing Director of Helsinki Televisio oy and Marketing Manager of oy sinebrychoff Ab.
• Main Board Memberships and public duties currentlyundertaken: Member of the board of Directors of DnA ltd and Vice chairman of the federation of the finnish Media Industry
• Holdings:Numberofshares5.587
boARD of DIRecToRs
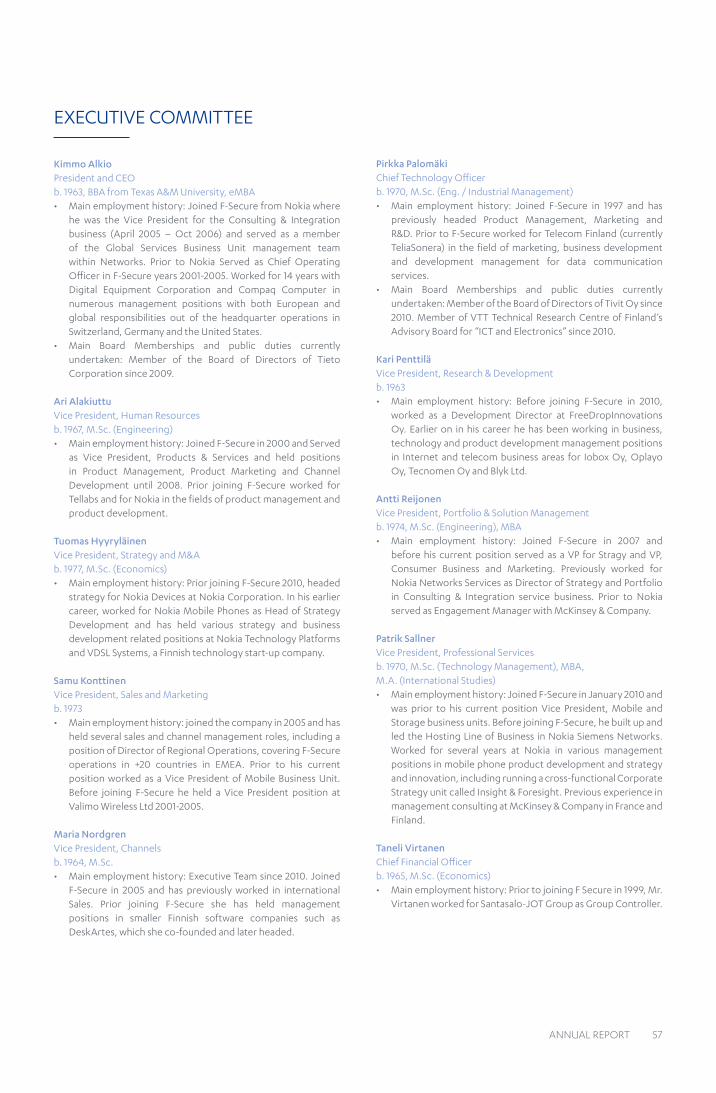
annual rePort 57
kimmo Alkio President and ceob. 1963, bbA from Texas A&M University, eMbA• Mainemploymenthistory:JoinedF-SecurefromNokiawhere
he was the Vice President for the consulting & Integration business (April 2005 – oct 2006) and served as a member of the global services business Unit management team within networks. Prior to nokia served as chief operating officer in f-secure years 2001-2005. Worked for 14 years with Digital equipment corporation and compaq computer in numerous management positions with both european and global responsibilities out of the headquarter operations in switzerland, germany and the United states.
• Main Board Memberships and public duties currentlyundertaken: Member of the board of Directors of Tieto corporation since 2009.
Ari AlakiuttuVice President, Human Resources b. 1967, M.sc. (engineering) • Mainemploymenthistory:JoinedF-Securein2000andServed
as Vice President, Products & services and held positions in Product Management, Product Marketing and channel Development until 2008. Prior joining f-secure worked for Tellabs and for nokia in the fields of product management and product development.
Tuomas Hyyryläinen Vice President, strategy and M&Ab. 1977, M.sc. (economics) • Mainemploymenthistory:PriorjoiningF-Secure2010,headed
strategy for nokia Devices at nokia corporation. In his earlier career, worked for nokia Mobile Phones as Head of strategy Development and has held various strategy and business development related positions at nokia Technology Platforms and VDsl systems, a finnish technology start-up company.
Samu konttinenVice President, sales and Marketing b. 1973 • Mainemploymenthistory:joinedthecompanyin2005andhas
held several sales and channel management roles, including a position of Director of Regional operations, covering f-secure operations in +20 countries in eMeA. Prior to his current position worked as a Vice President of Mobile business Unit. before joining f-secure he held a Vice President position at Valimo Wireless ltd 2001-2005.
Maria Nordgren Vice President, channels b. 1964, M.sc.• Mainemploymenthistory:ExecutiveTeamsince2010.Joined
f-secure in 2005 and has previously worked in international sales. Prior joining f-secure she has held management positions in smaller finnish software companies such as DeskArtes, which she co-founded and later headed.
Pirkka Palomäki chief Technology officerb. 1970, M.sc. (eng. / Industrial Management)• Main employment history: Joined F-Secure in 1997 and has
previously headed Product Management, Marketing and R&D. Prior to f-secure worked for Telecom finland (currently Teliasonera) in the field of marketing, business development and development management for data communication services.
• Main Board Memberships and public duties currentlyundertaken: Member of the board of Directors of Tivit oy since 2010. Member of VTT Technical Research centre of finland’s Advisory board for “IcT and electronics” since 2010.
kari PenttiläVice President, Research & Development b. 1963• Main employment history: Before joining F-Secure in 2010,
worked as a Development Director at freeDropInnovations oy. earlier on in his career he has been working in business, technology and product development management positions in Internet and telecom business areas for Iobox oy, oplayo oy, Tecnomen oy and blyk ltd.
Antti reijonenVice President, Portfolio & solution Managementb. 1974, M.sc. (engineering), MbA • Main employment history: Joined F-Secure in 2007 and
before his current position served as a VP for stragy and VP, consumer business and Marketing. Previously worked for nokia networks services as Director of strategy and Portfolio in consulting & Integration service business. Prior to nokia served as engagement Manager with Mckinsey & company.
Patrik SallnerVice President, Professional services b. 1970, M.sc. (Technology Management), MbA, M.A. (International studies)• Mainemploymenthistory:JoinedF-SecureinJanuary2010and
was prior to his current position Vice President, Mobile and storage business units. before joining f-secure, he built up and led the Hosting line of business in nokia siemens networks. Worked for several years at nokia in various management positions in mobile phone product development and strategy and innovation, including running a cross-functional corporate strategy unit called Insight & foresight. Previous experience in management consulting at Mckinsey & company in france and finland.
Taneli Virtanen chief financial officerb. 1965, M.sc. (economics) • Mainemploymenthistory:PriortojoiningFSecurein1999,Mr.
Virtanen worked for santasalo-JoT group as group controller.
eXecUTIVe coMMITTee

58 annual rePort
conTAcT InfoRMATIon
eurOPe
cOrPOrATe HeADquArTerS & FiNLANDF-Secure Corporationtammasaarenkatu 7Pl 2400181 HelsinkiFinlandtel. +358 9 2520 0700Fax +358 9 2520 5001e-mail: [email protected] www.f-secure.comwww.f-secure.fi
F-Secure Corporationelektroniikkatie 390570 ouluFinlandtel. +358 9 2520 0700Fax +358 8 551 3701
BeLgiuMF-Secure BVBaInterleuvenlaan 62, Zone 2, Bus 563001 Heverlee - leuvenBelgiumtel. +32 16 39 47 35Fax +32 16 39 47 37www.f-secure.be
DeNMArkF-Secure CorporationInternational HouseCenter Boulevard 5DK-2300 København Stel. +45 32 47 33 47mobile +45 26 29 88 47www.f-secure.com
FrANceF-Secure Sarl38/44 rue Jean mermoz78600 maisons laffitteFrancetel. +33 820 000 759Fax +33 820 025 508email: [email protected] www.f-secure.fr
F-Secure SDC SaS9 rue raymond manaud33520 Bruges-BordeauxFrance gerMANyF-Secure GmbHF-Secure eStore GmbHZielstattstraße 4481379 münchenGermanytel. +49 89 787 467 0Fax +49 89 787467 99email: [email protected]
iTALyF-Secure SrlVia Giorgio Stephenson, 43/a20157 milanoItalytel. +39 2 3900 0094Fax +39 2 3900 7212e-mail: [email protected]
THe NeTHerLANDSF-Secure B.V.einsteinbaan 143439 nJ nieuwegeinnederlandwww.f-secure.nltel. +31 30 602 01 10Fax +31 30 602 01 [email protected]
NOrWAyF-Secure Corporationnydalsveien 330484 oslonorwaytel. +47 21 52 00 62Fax +47 21 52 00 10www.f-secure.com
POLANDF-Secure Sp.z.o.o.ul. Hrubieszowska 6a01-209 WarszawaPolandtel. +48 22 431 82 21Fax +48 22 431 82 20www.f-secure.pl
SPAiNF-Secure Iberia Slc/o aFFIrma Business Centeravda de europa 14, room 628108 alcobendasSpain
SWeDeNF-Secure aBBox 717 (postal adress)16927 Solna, SwedenGårdsvägen 18 (visiting address)16970 SolnaSwedentel. +46 8 507 440 00Fax +46 8 507 440 01e-mail: [email protected]
uNiTeD kiNgDOMF-Secure uK ltdmercury ParkWycombe laneWooburn GreenBuckinghamshireHP10 0HHunited Kingdomtel. +44 845 890 3300Fax +44 845 890 3301e-mail: [email protected]
NOrTH AMericA
uSAF-Secure Inc.100 Century Center CourtSan Jose, Ca 95112, uSatel. +1 888 432 8233Fax +1 408 350 2339e-mail: [email protected]
ASiA
MALAySiAF-Secure malaysia (m) Sdn BhdBlock 3a, Horizon, Bangsar South,no.8, Jalan Kerinchi,59200 Kuala lumpurmalaysiatel. +603 2264 0200Fax +603 2264 0299www.f-secure.com
AuSTrALiAF-Secure Pty ltd Suite 09 level 8 100 Walker Street north Sydney nSW 2060 australia tel. +61 28404 4192 Fax +61 28404 4170 e-mail: [email protected]
HONg kONgF-Secure ltdFlat F, 30/F, legend tower,7 Shing Yip StreetKwun tongKowloontel. +852 2363 3160Fax +852 2363 2162e-mail: [email protected]
iNDiA: HyDerABAD (MAiN OFFice)F-Secure Pvt ltd office no. 117, 6-3-1192/1/1Block 3, 1st Floor, White HouseKundanbagh, BegumpeHyderabad 500016 India tel. +91 40 4013 3503 /4/5Fax +91 40 4013 3506 Support: +91 18 0010 25987 www.f-secure.co.in
iNDiA: MuMBAiF-Secure Pvt ltdroom no 314, Bhavya Plaza 5th road, off F S.V road Khar (west),mumbai 400052,Indiatel. +91 22 2674 4137tel. +91 22 2674 414Fax +91 22 2674 4347www.f-secure.co.in
JAPANF-Secure KKatt new tower 6th Floor2-11-7 akasaka, minato-kutokyo Japan, 107-0052tel. +81 3 5545 8940Fax +81 3 5545 8945e-mail: [email protected]
SiNgAPOreF-Secure Pte ltd21 Science Park road#02-01 the aquariusSingapore 117628tel. +65 8118 4552Fax +603 2264 0299e-mail: [email protected]


60 annual rePort
While you concentrate on what is important to you, we make sure you are protected and safe online whether you are using a computer or a smartphone. We also backup and enable you to share your important files. our services are available through more than 200 operators around the world and are trusted in millions of homes and businesses. founded in 1988, f-secure is listed on nAsDAQ oMX Helsinki ltd.
F-Secure corporationTammasaarenkatu 7, Pl 2400181 Helsinkifinland
+358 9 2520 0700 Telephone
[email protected] the irreplaceable
F-Secure Corporation