annual report 2011 fugro n.v. 50 years fugro
TRANSCRIPT

GEOTECHNIEK
MILIEU ONDERZOEK
MARINER
AN
NU
AL
RE
PO
RT
20
11
FU
GR
O N
.V.
Annua l Repo r t 2011FU G RO N . V.
50 yEARs FUGROF r o m s m a l l D u t c h
e n g i n e e r i n g c o m p a ny
t o g l o b a l p l a y e r !

Fugro N.V.
Veurse Achterweg 10
2264 SG Leidschendam
P.O. Box 41
2260 AA Leidschendam
The Netherlands
T +31 (0)70 3111422
F +31 (0)70 3202703
www.fugro.com
Commercial Register The Hague
Trade Registry no 27120091
VAT no 00 56 21 409 B01
C o l o p h o n
Fugro N.V.
Veurse Achterweg 10
2264 SG Leidschendam
The Netherlands
T +31 (0)70 3111422
F +31 (0)70 3202703
Realisation:
C&F Report Amsterdam B.V.
Photography and images:
Fugro N.V.
Fugro has endeavoured to fulfil all legal requirements
related to copyright. Anyone who, despite this, is of
the opinion that other copyright regulations could
be applicable should contact Fugro.
A Dutch translation of this annual report is
available. In matters of any misinterpretation
the official English annual report will prevail.
This annual report is also available on www.fugro.com.
Cautionary statement regarding forward-looking statements
This annual report may contain forward-looking statements. Forward-looking statements are statements that are not historical facts, including
(but not limited to) statements expressing or implying Fugro’s beliefs, expectations, intentions, forecasts, estimates or predictions (and the
assumptions underlying them). Forward-looking statements necessarily involve risks and uncertainties. The actual future results and situations
may therefore differ materially from those expressed or implied in any forward-looking statements. Such differences may be caused by various
factors (including, but not limited to, developments in the oil and gas industry and related markets, currency risks and unexpected operational
setbacks). Any forward-looking statements contained in this annual report are based on information currently available to Fugro’s management.
Fugro assumes no obligation to make a public announcement in each case where there are changes in information related to, or if there are
otherwise changes or developments in respect of, the forward-looking statements in this annual report.

C o n t e n t s
A n n u a l R e p o r t 2 0 1 1
■ Preface 2
■ Fugro at a glance 3Major developments in 2011 3
Key figures 4
Mission and profile 6
Fugro’s activities 7
Financial targets and strategy 8
Information for shareholders 10
■ Report of the Supervisory Board 15
■ Report of the Board of Management 23General 23
Acquisitions 24
Employees 25
Capacity planning 25
Financial 26
Dividend proposal 32
Market developments and trends 32
Backlog 34
Post balance sheet date events 34
Outlook 35
Important and interesting contracts 37
Geotechnical division 40
Survey division 42
Geoscience division 44
■ Theme: 50 years Fugro 46
■ Corporate Social Responsibility 60
■ Risk Management 73
■ Corporate Governance 79
■ Financial statements 2011 891 Consolidated statement of comprehensive
income 90
2 Consolidated statement of financial position 92
3 Consolidated statement of changes in equity 93
4 Consolidated statement of cash f lows 96
5 Notes to the consolidated financial statements 98
6 Subsidiaries and investments of Fugro N.V.
accounted for using the equity method 170
7 Company balance sheet 173
8 Company income statement 174
9 Notes to the company financial statements 175
10 Other information 180
Report of Stichting Administratiekantoor Fugro
(‘Trust Office’) 184
Historic review 186
Glossary 188

2
■ P r e f a c e
D e a r s h a r e h o l d e r s a n d o t h e r s t a ke h o l d e r s ,
The aftermath of the global financial crisis that started
in 2008 has also affected the course of business of Fugro.
This was particularly noticeable in Europe and in the
United States, where even still now, large government
deficits are slowing down economic recovery. On the
other hand, growth continues in emerging countries like
China, Brazil and India.
In the past year our strategy, which aims to provide a
wide range of services based on a large geographic
spread, has proven useful. The result is that, despite
challenging circumstances, the year 2011 can be
concluded with new highlights: a net profit of
EUR 288 million and revenue of EUR 2.6 billion.
Prior to the financial crisis, Fugro had several years with
strong growth in revenue and net profit. In 2009 the
impact of the crisis was limited to a profit decrease of
7% and 5% lower revenue. In the following years, the
upward trend was quickly resumed and thanks to our
strong financial position we were able to keep investing
in future growth. Last year this was specifically reflected
in an active acquisition policy.
It is a privilege to have the opportunity to write my last
preface on the basis that we completed last year
successfully and that Fugro’s outlook is positive.
I would like to take this opportunity to thank all
stakeholders and interested people for the confidence
they placed in me. The pleasure and enjoyment I have
experienced leading thousands of employees with dozens
of nationalities is particularly due to their tireless efforts
that form the basis of Fugro’s success.
K.S. Wester
President and CEO of the Board of Management
until 31 December 2011
I am pleased to have received the confidence to shape the
next phase of Fugro’s development as Chairman of the
Board of Management. I look forward to accomplishing
this, working with colleagues and employees.
Effectively 1 January 2012, Fugro is managed by a Board
of Management supported by a group of managers with
a regional or service oriented responsibility. This will
strengthen mutual cooperation and customer focus in
the regions and create more consistency in the services
Fugro provides. It will also allow us to be even more
decisive and further improve our competitive position.
As a result of the increasing demand for oil and gas as
well as the depletion rate in existing oil fields, we expect
our workload from the oil and gas market to strengthen
towards the second half of 2012. The recovery of the
marine seismic data acquisition market is progressing
with further price recovery. Considering the strong
position that Fugro has in the markets it operates in,
the current improving backlog and a strong
management team, we enter 2012 with confidence,
despite the current uncertainties.
On behalf of the Board of Management, the management
team and employees I would like to thank Klaas Wester
for his significant contribution to the development of
Fugro during his term as President and CEO. His astute
ability to analyse opportunities, pragmatic view on
things and ‘down to earth’ mentality has brought Fugro
to where it is today. We will do whatever is necessary to
continue the success of Fugro in the years to come.
A. Steenbakker
Chairman of the Board of Management
as of 1 January 2012

3Fugro at a glance
■ F u g r o a t a g l a n c e
■M A J O R D E V E L O P M E N T S I N 2 0 1 1
• Itisproposedtomaintainthedividendfor2011
at EUR 1.50 per (certificate of a) share (2010:
EUR 1.50), to be paid at the option of the
shareholder in cash or in (certificates of) shares.
In case no choice is made, the dividend will be paid
in (certificates of) shares.
• Investmentsforcapacityexpansioncontinued
according to plan and amounted to EUR 208.9
million in 2011.
• Annualrevenueofthecompaniesacquiredin
2011 amounts to EUR 215 million.
• Backlogatthebeginningof2012amountedto
EUR 1,692.6 million. This is 9.0% higher than at
the beginning of 2011 (EUR 1,553.2 million).
• Inthesecondhalfof2011Fugrowasrefinanced.
Fugro reached agreement with 27 US and UK based
investors with respect to so called US Private
Placement loans (USPP) with a value expressed in
US dollars of 909 million.
Fugro also reached agreement with a number
of individual banks for committed facilities up
to a total value of EUR 775 million for 5 years.
These facilities were made available by eight
internationally operating banks.
• In2011Fugro’srevenueincreasedby13.0%to
EUR 2,577.8 million (2010: EUR 2,280.4 million).
Revenue increased organically by 7.6% and by
8.8% as a result of acquisitions. The foreign
currency effect was 3.2% negative. The effect of
disposals was 0.2% negative.
• Netresultwentupwith5.7%toEUR287.6million
(2010: EUR 272.2 million).
• Netprofitmarginwas11.2%(2010:11.9%).
• Earningsbeforeinterest,tax,depreciation
and amortisation (EBITDA) increased by 3.5%
to EUR 581.0 million (2010: EUR 561.1 million).
• Resultsfromoperatingactivities(EBIT)were0.6%
lower at EUR 349.3 million (2010: EUR 351.5
million).
• InparticulartheSurveyandGeosciencedivisions
showed growth in revenue and all three divisions
were profitable.
• Earningspershareincreasedby4.6%toEUR3.63
(2010: EUR 3.47). Cash f low per share was 6.4%
higher at EUR 6.65 (2010: 6.25).
The term ‘shares’ as used in this Annual Report should, with respect to ordinary shares issued by Fugro N.V., be construed to include certificates of shares (also referred
to as ‘share certificates’ or ‘depositary receipts’ for shares) issued by Stichting Administratiekantoor Fugro (also referred to as ‘Fugro Trust Office’ or ‘Trust Office’),
unless the context otherwise requires or unless it is clear from the context that this is not the case. For further information please refer to page 83.
In this Annual Report, Fugro N.V. is also referred to as ‘the Company’ or ‘Fugro’. Fugro N.V. and its subsidiary companies are together referred to as
‘the Group’.
4
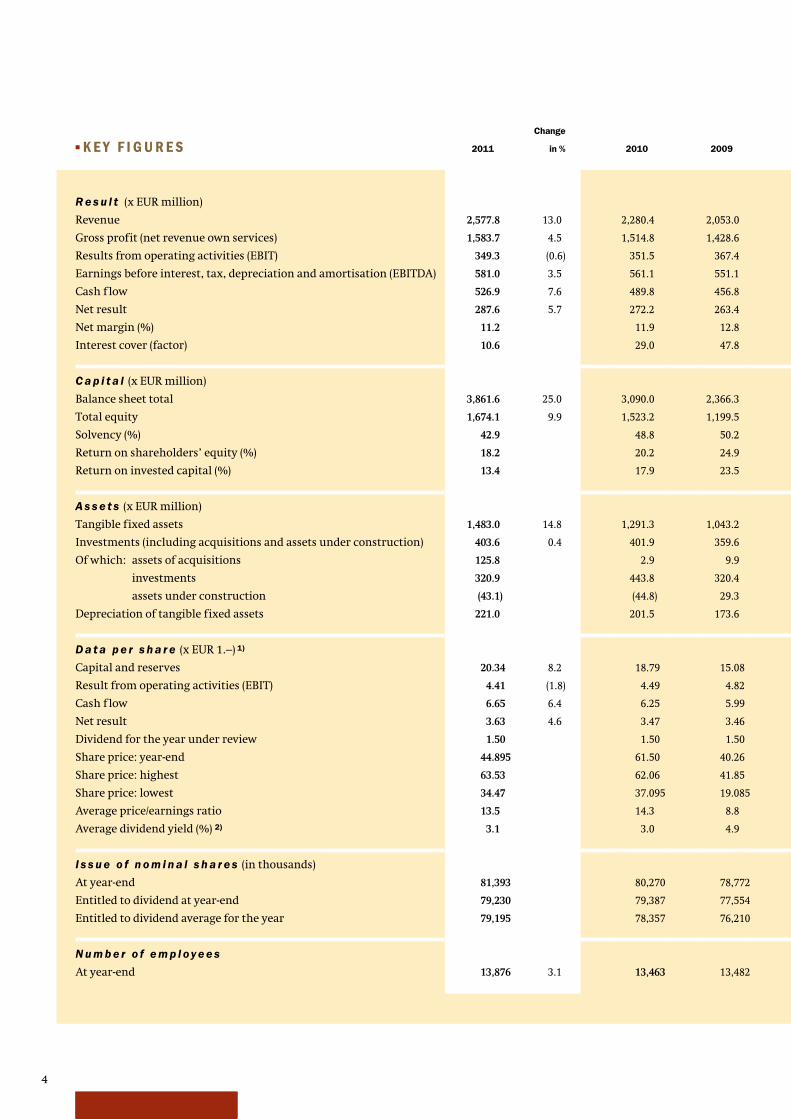
■ K E Y F I G U R E S 2011
Change
in % 2010 2009 2008 2007
R e s u l t (x EUR million)
Revenue 2,577.8 13.0 2,280.4 2,053.0 2,154.5 1,802.7
Gross profit (net revenue own services) 1,583.7 4.5 1,514.8 1,428.6 1,432.2 1,197.9
Results from operating activities (EBIT) 349.3 (0.6) 351.5 367.4 385.7 324.8
Earnings before interest, tax, depreciation and amortisation (EBITDA) 581.0 3.5 561.1 551.1 535.2 439.6
Cash f low 526.9 7.6 489.8 456.8 438.9 337.1
Net result 287.6 5.7 272.2 263.4 283.4 216.2
Net margin (%) 11.2 11.9 12.8 13.2 12.0
Interest cover (factor) 10.6 29.0 47.8 14.1 13.1
C a p i t a l (x EUR million)
Balance sheet total 3,861.6 25.0 3,090.0 2,366.3 2,123.3 1,700.1
Total equity 1,674.1 9.9 1,523.2 1,199.5 935.8 707.0
Solvency (%) 42.9 48.8 50.2 43.7 41.2
Return on shareholders’ equity (%) 18.2 20.2 24.9 35.9 35.4
Return on invested capital (%) 13.4 17.9 23.5 29.7 30.0
A s s e t s (x EUR million)
Tangible fixed assets 1,483.0 14.8 1,291.3 1,043.2 859.1 599.3
Investments (including acquisitions and assets under construction) 403.6 0.4 401.9 359.6 394.4 341.1
Of which: assets of acquisitions 125.8 2.9 9.9 14.4 8.7
investments 320.9 443.8 320.4 323.0 291.0
assets under construction (43.1) (44.8) 29.3 57.0 41.4
Depreciation of tangible fixed assets 221.0 201.5 173.6 140.4 107.7
D a t a p e r s h a r e (x EUR 1.–) 1)
Capital and reserves 20.34 8.2 18.79 15.08 12.12 9.94
Result from operating activities (EBIT) 4.41 (1.8) 4.49 4.82 5.29 4.67
Cash f low 6.65 6.4 6.25 5.99 6.01 4.84
Net result 3.63 4.6 3.47 3.46 3.88 3.11
Dividend for the year under review 1.50 1.50 1.50 1.50 1.25
Share price: year-end 44.895 61.50 40.26 20.485 52.80
Share price: highest 63.53 62.06 41.85 59.95 62.00
Share price: lowest 34.47 37.095 19.085 19.32 34.91
Average price/earnings ratio 13.5 14.3 8.8 10.2 15.6
Average dividend yield (%) 2) 3.1 3.0 4.9 3.8 2.6
I s s u e o f n o m i n a l s h a r e s (in thousands)
At year-end 81,393 80,270 78,772 76,608 70,421
Entitled to dividend at year-end 79,230 79,387 77,554 75,138 69,879
Entitled to dividend average for the year 79,195 78,357 76,210 73,048 69,614
N u m b e r o f e m p l oy e e s
At year-end 13,876 3.1 13,463 13,482 13,627 11,472

5Fugro at a glance
0
550
1,100
1,650
2,200
2,750
20112010200920082007
R e ve n u e
(x EUR 1 mln.)
0
350
700
1,050
1,400
1,750
20112010200920082007
Gross p ro f i t (net revenue
own ser v ices ) (x EUR 1 mln.)
0
120
240
360
480
600
20112010200920082007
C a s h f l ow
(x EUR 1 mln.)
0
0.9
1.8
2.7
3.6
4.5
20112010200920082007
N e t r e s u l t p e r s h a r e
(x EUR 1.–)
0
120
240
360
480
600
20112010200920082007
Earnings before interest, taxes, depreciation and amor tisation (EBITDA) (x EUR 1 mln.)
■ K E Y F I G U R E S 2011
Change
in % 2010 2009 2008 2007
R e s u l t (x EUR million)
Revenue 2,577.8 13.0 2,280.4 2,053.0 2,154.5 1,802.7
Gross profit (net revenue own services) 1,583.7 4.5 1,514.8 1,428.6 1,432.2 1,197.9
Results from operating activities (EBIT) 349.3 (0.6) 351.5 367.4 385.7 324.8
Earnings before interest, tax, depreciation and amortisation (EBITDA) 581.0 3.5 561.1 551.1 535.2 439.6
Cash f low 526.9 7.6 489.8 456.8 438.9 337.1
Net result 287.6 5.7 272.2 263.4 283.4 216.2
Net margin (%) 11.2 11.9 12.8 13.2 12.0
Interest cover (factor) 10.6 29.0 47.8 14.1 13.1
C a p i t a l (x EUR million)
Balance sheet total 3,861.6 25.0 3,090.0 2,366.3 2,123.3 1,700.1
Total equity 1,674.1 9.9 1,523.2 1,199.5 935.8 707.0
Solvency (%) 42.9 48.8 50.2 43.7 41.2
Return on shareholders’ equity (%) 18.2 20.2 24.9 35.9 35.4
Return on invested capital (%) 13.4 17.9 23.5 29.7 30.0
A s s e t s (x EUR million)
Tangible fixed assets 1,483.0 14.8 1,291.3 1,043.2 859.1 599.3
Investments (including acquisitions and assets under construction) 403.6 0.4 401.9 359.6 394.4 341.1
Of which: assets of acquisitions 125.8 2.9 9.9 14.4 8.7
investments 320.9 443.8 320.4 323.0 291.0
assets under construction (43.1) (44.8) 29.3 57.0 41.4
Depreciation of tangible fixed assets 221.0 201.5 173.6 140.4 107.7
D a t a p e r s h a r e (x EUR 1.–) 1)
Capital and reserves 20.34 8.2 18.79 15.08 12.12 9.94
Result from operating activities (EBIT) 4.41 (1.8) 4.49 4.82 5.29 4.67
Cash f low 6.65 6.4 6.25 5.99 6.01 4.84
Net result 3.63 4.6 3.47 3.46 3.88 3.11
Dividend for the year under review 1.50 1.50 1.50 1.50 1.25
Share price: year-end 44.895 61.50 40.26 20.485 52.80
Share price: highest 63.53 62.06 41.85 59.95 62.00
Share price: lowest 34.47 37.095 19.085 19.32 34.91
Average price/earnings ratio 13.5 14.3 8.8 10.2 15.6
Average dividend yield (%) 2) 3.1 3.0 4.9 3.8 2.6
I s s u e o f n o m i n a l s h a r e s (in thousands)
At year-end 81,393 80,270 78,772 76,608 70,421
Entitled to dividend at year-end 79,230 79,387 77,554 75,138 69,879
Entitled to dividend average for the year 79,195 78,357 76,210 73,048 69,614
N u m b e r o f e m p l oy e e s
At year-end 13,876 3.1 13,463 13,482 13,627 11,472
1) More data regarding the basic earnings per share can be found in note 5.45 to the financial statements (page 143).
2) Dividend for the year, to be paid the following year, divided by the average of the highest and lowest share price
during the year.
0
60
120
180
240
300
20112010200920082007
N e t r e s u l t
(x EUR 1 mln.)
6
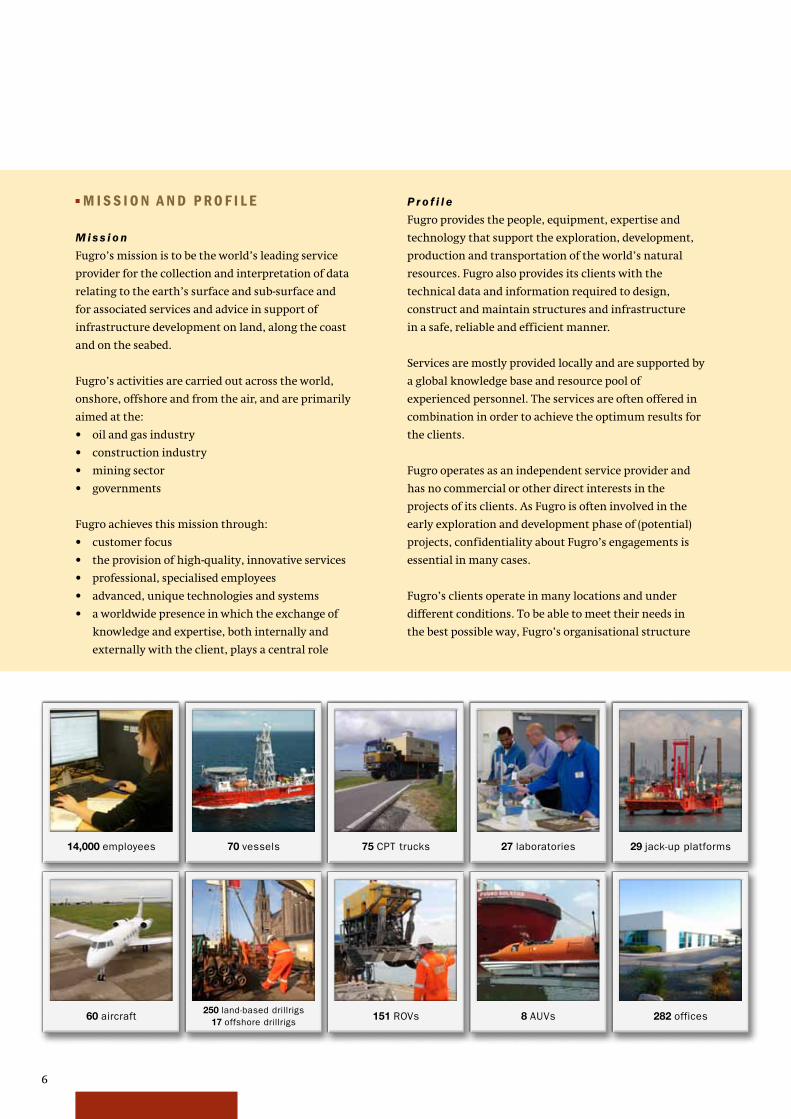
14,000 employees 70 vessels 75 CPT trucks 27 laboratories 29 jack-up platforms
60 aircraft250 land-based drillrigs
17 offshore drillrigs 151 ROVs 8 AUVs 282 offices
■M I S S I O N A N D P RO F I L E
M i s s i o n
Fugro’s mission is to be the world’s leading service
provider for the collection and interpretation of data
relating to the earth’s surface and sub-surface and
for associated services and advice in support of
infrastructure development on land, along the coast
and on the seabed.
Fugro’s activities are carried out across the world,
onshore, offshore and from the air, and are primarily
aimed at the:
• oilandgasindustry
• constructionindustry
• miningsector
• governments
Fugro achieves this mission through:
• customerfocus
• theprovisionofhigh-quality,innovativeservices
• professional,specialisedemployees
• advanced,uniquetechnologiesandsystems
• aworldwidepresenceinwhichtheexchangeof
knowledge and expertise, both internally and
externally with the client, plays a central role
P r o f i l e
Fugro provides the people, equipment, expertise and
technology that support the exploration, development,
production and transportation of the world’s natural
resources. Fugro also provides its clients with the
technical data and information required to design,
construct and maintain structures and infrastructure
in a safe, reliable and efficient manner.
Services are mostly provided locally and are supported by
a global knowledge base and resource pool of
experienced personnel. The services are often offered in
combination in order to achieve the optimum results for
the clients.
Fugro operates as an independent service provider and
has no commercial or other direct interests in the
projects of its clients. As Fugro is often involved in the
early exploration and development phase of (potential)
projects, confidentiality about Fugro’s engagements is
essential in many cases.
Fugro’s clients operate in many locations and under
different conditions. To be able to meet their needs in
the best possible way, Fugro’s organisational structure

7Fugro at a glance
is decentralised and client-oriented, delivering a wide
range of services in a variety of operating environments
and conditions. Fugro delivers these services from
a global network of offices and facilities.
Fugro strives to achieve strong market positions based on
(in-house developed) technologies, high-value services
and a strong international or regional presence.
Fugro was founded in the Netherlands in 1962 and
is listed on the Amsterdam stock exchange of NYSE
Euronext since 1992. Fugro was included in the
AEX-index as of September 2008.
Fugro grows organically and through acquisitions, and
by the end of 2011 employed some 14,000 staff in more
than 60 countries.
■F U G RO ’ S A C T I V I T I E S
Fugro provides a unique range of services and activities
worldwide. These are organised in three divisions:
Geotechnical, Survey and Geoscience.
G e o t e c h n i c a l
The Geotechnical division investigates the engineering
properties and geological characteristics of near-surface
soils and rocks using (in-house developed) proprietary
technologies, advises on foundation design, provides
construction materials testing, pavement assessment
and installation support services. These services support
clients’ projects worldwide in the onshore, near shore
and offshore environments, including deep water.
Typical projects include support of infrastructure
development and maintenance, large construction
projects, f lood protection and support of the design
and installation of oil and gas facilities and windfarms.
S u r vey
The Survey division provides a range of services in
support of the oil and gas industry, renewables and
commercial and civil industries, as well as governments
and other organisations. It encompasses numerous
offshore, subsea and geospatial activities as well as global
positioning systems that support these and other Group
activities. Offshore services include geophysical
investigations for geohazards, pipeline and cable routes,
inspection and construction support services,
hydrographic charting and meteorological and
oceanographic studies. Subsea services revolve around
the use of remotely operated vehicles (ROV) in support of
drilling as well as inspection, repair and maintenance
(IRM) services of subsea assets. These services are
expanded to well intervention in support of oil and gas
extraction. Geospatial services concentrate on land
survey and aerial and satellite mapping services for a
wide range of clients. Fugro’s global positioning system
(GPS) which augments GPS and Glonass signals to provide
globally precise positioning are used for the foregoing
services but also are provided on a subscription basis to
clients in the oil and gas industry as well as agriculture.
G e o s c i e n c e
The Geoscience division provides services and products
associated with collecting, processing, interpreting,
managing and storing geophysical and geological data.
These data sets are used for evaluating the presence of
natural resources, including oil, gas, water and minerals,
and for optimising the exploration, appraisal,
development and production of those resources. A broad
range of geophysical data sets are collected including
marine seismic, gravity, magnetics and electromagnetics.
The data sets are collected at sea, from the air and on
land using vessels, low flying airplanes and helicopters.
Clients are oil and gas companies, mining companies and
governmental organisations.

8
■F I N A N C I A L TA R G E T S A N D S T R AT E G Y
F i n a n c i a l t a r ge t s
Fugro’s target is to achieve, under comparable economic
circumstances, a structural increase in earnings per
share for its shareholders. Fugro’s long-term policy is
aimed at generating a steady growth in net result based
on increasing revenue.
Important financial targets are:
• growthinearningspershareaveraging10%per
annum
• strongcashf lowwithanaverageannualgrowthper
share of 10%
• maintainingahealthybalancesheetandsolvency
(> 331/3 %)
• interestcover(EBIT/Interest)ofmorethan5
Fugro’s financial strategy is aimed at the utilisation
and/or optimisation of:
• theratiobetweenriskandreturnofthevarious
business activities
• theratiobetweenshareholders’equityandshort-
term/long-term borrowings
• theuseofbothpublicandprivatecapitalmarkets
• thedurationandphasingofthedifferentfinancing
components
S t r a t e g y
Fugro aims at achieving equilibrium between its various
activities in order to be able to meet its targets. Fugro
strives for a balance between services related to
exploration, development and production activities for
the oil and gas industry, and those related to other
markets, such as mining and construction. This also
results in a combination of offshore and onshore
activities. Moreover, Fugro strives for a balanced
geographical spread. This, and the diverse range of
related activities, reduces Fugro’s sensitivity to market
f luctuations in a particular sector. As an independent
service provider, Fugro provides a broad spread of
services to its clients. The elements of geographical
diversity, range of services and wide client base
contribute to our ability to control our business risks.
Fugro strives for growth, both organically and through
acquisitions. To achieve organic growth Fugro invests in
equipment and human capital. Organic growth is also
achieved by actively developing new technologies and
services.
In the most important market sector – oil and gas –
the spread of Fugro’s services across the exploration,
development and production phases is a key factor.
This means Fugro provides services in many phases of
the (20 – 30 year) life-cycle of an oil or gas field. Avoiding
dependence on one phase of this market or single group
of clients is an essential component of Fugro’s strategy.
The result is a business that is less cyclical.
Profit margins vary per service and activity depending on
the specific market circumstances. For the more risky or
capital intensive activities a higher profit margin is
aimed for than the overall company average.
The long-term aim is to achieve robust but controlled
profit growth through:
• abroadbutcohesiveservicesportfolio
• themannerinwhichFugroisfinanced
• themarket-orientedinternationalorganisational
structure
• continuousdevelopmentandtrainingofemployees
• specificinvestmentsinequipmentandtechnology
• managementfocusonincreasingnetresult
Fugro strives to improve profitability with a focus on
core activities and niche markets by:
• increasingoperationalscale
• buildingstrongmarketpositions
• continuingresearchanddevelopment
• cooperationanddevelopmentforandwithclients
• beingselectiveabouttheprojectsthataretakenon
• acquiringcompanieswithahighadded-value
• leveragingandoptimisingcapabilitiesandresources
Over the period 2005 – 2008 revenues doubled and the
net profit margin increased from 8.6% to 13.2%. As from
late 2008 the market conditions have been negatively
influenced by the global economic downturn, resulting
in a slight decrease in both revenue and net profit in
2009. In the course of the second half of 2010 revenue
growth was resumed and continued in 2011. Price
pressure remained in some segments, resulting in
moderate profit increases in 2010 and 2011. The oil
and gas industry is expected to increase investments in
2012 and some improvement in market conditions is
anticipated in this sector. The timing of recovery of the
world economy is still difficult, which may affect other
sectors in which Fugro operates.

9Fugro at a glance
M a r ke t p o s i t i o n s
Fugro’s strategy is based primarily on securing and,
where possible, expanding strong market positions.
Complementing and broadening its package of closely
related services provides a competitive advantage.
Growth in adjacent sectors, by responding actively and
f lexibly to market developments and client needs, is also
an important component of the strategy.
On land, Fugro’s major clients are governments, industry
and construction companies in local and regional
markets. In these markets Fugro holds strong regional
positions.
At sea, the major clients are oil and gas companies, and
offshore contractors that operate in a global market.
Fugro has a leading position in offshore survey and
offshore geotechnical activities. In other market
segments, like mining and precise positioning, Fugro
holds leading market positions in niche markets with a
large variety of clients.
A c q u i s i t i o n s
To broaden its base and ensure continued sustainable
growth, Fugro usually completes a number of
acquisitions each year. Generally these serve to
strengthen or improve current market positions or to
obtain special technologies. Because acquisitions always
involve an element of risk, a thorough and extensive due
diligence is carried out before the decision to acquire a
company is taken. This limits the risks considerably.
Acquisition evaluation is based not only on financial
criteria but also on:
• added-valueforFugro
• cohesionwithFugro’sactivitiesandservices
• matchwithFugro’sculture
• growthpotential
• astrongpositioninanichemarketorregion
• technicalandmanagementqualities
• riskprofile
R e s e a r c h a n d d e ve l o p m e n t
Research and development is of strategic importance to
Fugro. The search for ways to expand and improve
services to clients is unceasing and cooperation with
clients plays a major role in this. Many new ideas are
generated through joint development projects and often
developments take place in close cooperation with a
client because the client is interested in solving a specific
problem. Research relating to special measuring
equipment and analytical methods also plays an
important role in enhancing Fugro’s services. Its global
market position is, to a great extent, dependent on high-
value equipment, technologies and software.
Measurements are becoming increasingly detailed and
even the most complex data needs to be interpreted.
To this end, increasingly knowledge is exchanged or
combined within the company in order to arrive at
solutions or new developments. Part of this research and
development expense is incurred as costs for the
execution of projects.
C o o p e r a t i o n a n d s c a l e a d va n t a ge s
Effective cooperation between Fugro’s business units is
promoted at various levels. Critical mass is also a key
factor for the successful execution of large assignments.
Capacity utilisation and cooperation are optimised
through the exchange of equipment, employees and
expertise between the various activities and by extensive
employee training. Fugro promotes technological
advancement by clustering the knowledge available
within and outside the Group. The integration of
information systems and the utilisation of scale
advantages enhance the service provided to clients.
Conetesting and drilling in Madingley, United Kingdom 1979

10
D a t a p e r s h a r e
(x EUR 1.–) 2011 2010 2009 2008 2007
Cash f low 6.65 6.25 5.99 6.01 4.84
Net result 3.63 3.47 3.46 3.88 3.11
Dividend paid out in the year under review 1.50 1.50 1.50 1.25 0.83
Proposed dividend over the year under review 1.50 1.50 1.50 1.50 1.25
Pay-out ratio of the net result (%) 41.3 43.7 44.2 39.8 40.4
■I N F O R M AT I O N F O R S H A R E H O L D E R S
L i s t i n g o n t h e s t o c k e x c h a n ge
Fugro is listed on the Amsterdam stock exchange of
NYSE Euronext (Euronext Amsterdam) since 1992.
The share is included in the AEX-index as of September
2008 (symbol: FUR/ISIN code: NL0000352565). Trading in
options on Fugro shares is also possible via Euronext
Amsterdam.
On 29 February 2012 Fugro’s market capitalisation
amounted to EUR 4.5 billion.
As far as is known, approximately 70% of the
outstanding shares are held by foreign investors.
Information on the shares can be found on pages 4
and 5 (key figures) and on pages 81, 142 and 143.
D i v i d e n d p o l i c y
Fugro strives for a pay-out ratio between 35 and 55% of
the net result. The shareholder (or certificate holder)
may choose between a dividend entirely in cash or
entirely in shares. In case no choice is made, the dividend
will be paid in shares.
F i n a n c i a l a ge n d a
9 March 2012 Publication of 2011 annual figures (before trading hours), press conference and
analysts’ meeting with webcast
10 April 2012 Notice for Annual General Meeting of Shareholders on 22 May 2012
24 April 2012 Record date for registration to attend the Annual General Meeting of Shareholders
18 May 2012 Trading update business developments first quarter 2012 (after trading hours)
22 May 2012 Annual General Meeting of Shareholders in Hilton The Hague at 14.00 hours, dual
language webcast (Dutch and English)
24 May 2012 Quotation ex-dividend
28 May 2012 Record date dividend entitlement (after trading hours)
29 May – 11 June 2012 Dividend option period (cash or shares)
14 June 2012 Determination and publication (after trading hours) of the amount of the dividend
in shares based upon the volume weighted average price of the traded shares Fugro
at Euronext Amsterdam on 12, 13 and 14 June 2012
18 June 2012 Payment of the dividend related to the financial year 2011
10 August 2012 Publication of half-yearly figures 2012 and announcement of the profit forecast for
2012 (before trading hours), press conference and analysts’ meeting with webcast
16 November 2012 Trading update business developments third quarter 2012 (after trading hours)
8 March 2013 Publication of 2012 annual figures (before trading hours), press conference and
analysts’ meeting with webcast
8 May 2013 Annual General Meeting of Shareholders

11Fugro at a glance
C h a n ge i n o u t s t a n d i n g
s h a r e s 2011 2010
Outstanding at 1/1 80,269,684 78,772,478
Stock dividend 1,123,297 1,497,206
Outstanding at 31/12 81,392,981 80,269,684
Balance purchased for
option scheme (31/12) 2,162,746 882,796
Entitled to dividend
as of 31/12 79,230,235 79,386,888
Certificates and shares (excluding
Fugro Trust Office)
Shares held by Fugro
Trust Office*
% of the issued
capital**
EGM 2011 57.0 41.9 98.9
AGM 2011 56.8 42.5 99.3
AGM 2010 35.7 63.5 99.2
EGM 2009 36.3 62.8 99.1
AGM 2009 35.2 64.0 99.2
* Stichting Administratiekantoor Fugro (‘Fugro Trust Office’) votes on the shares for which certificates have been issued and on which shares the certificate holders do not vote themselves as representative of the Fugro Trust Office.
** Excluding own shares held by Fugro.
In 2011 about 52% of the shareholders chose to receive
the dividend for 2010 in shares (2010: 52%). In 2011,
1,123,297 new shares were issued for this purpose.
Material changes to the policy on additions to reserves
and on dividends shall be submitted to the General
Meeting of Shareholders.
D i v i d e n d fo r 2 0 1 1
It is proposed that the dividend for 2011 be maintained
at EUR 1.50 per share (2010: EUR 1.50), to be paid at the
option of the shareholder:
• incash,or
• inshares.
In case no choice is made, the dividend will be paid in
shares.
The proposed dividend equates to a pay-out ratio of
41.3% of the net result.
Shareholders (and holders of certificates of shares) have
until Monday 11 June 2012 to make their dividend
preference known. The determination of the number
of shares that entitles the holder to one new share will
take place on Thursday 14 June 2012 (after trading hours)
based upon the volume weighted average price of the
traded shares Fugro at Euronext Amsterdam on
12, 13 and 14 June 2012. To arrive at a whole number
a deviation of a maximum of 5% of the calculated value
may be applied. The dividend will be made payable on
18 June 2012. No trading will take place on Euronext
Amsterdam in dividend rights.
The percentage of (certificates of) shares that was
represented in person or by proxy in the shareholders’
meetings over the past three years was as follows:
A ge n d a o f t h e ge n e r a l m e e t i n g
o f s h a r e h o l d e r s a n d r e c o r d d a t e
The agenda, including explanatory notes, of the General
Meeting of Shareholders is posted on Fugro’s website
(www.fugro.com) at least 42 days prior to the meeting.
The agenda shows which items are for discussion and
which items are to be voted upon. The record date for
registration to attend the general meeting is 28 days
before the day of the meeting.
R e m o t e e l e c t r o n i c v o t i n g
Currently Fugro offers the possibility to grant proxies,
whether or not with voting instructions, by electronic
means. Fugro also offers the holders of certificates of
shares the possibility to issue voting instructions by
using an internet e-voting system: https://evoting.rbs.
com/evoting/go. As the technology matures and becomes
more trustworthy, Fugro will evaluate whether to
facilitate the use of electronic means to cast votes during
the meeting without being present in person or by proxy.
S h a r e h o l d i n g s o f 5 % o r m o r e
Under the Dutch Financial Supervision Act,
shareholdings of 5% or more in any Dutch listed
company must be disclosed to the Netherlands Authority
for the Financial Markets (AFM). According to the public
register of the AFM the following shareholders disclosed
that they owned an interest, directly and indirectly, of
between 5 and 10% in Fugro’s share capital on
1 March 2012:
ING Groep N.V. 9.64%
Mr. G-J. Kramer (directly and indirectly) 5.52%
WAM Acquisitions GP, Inc. 5.26%
Capital Group International Inc. 5.09%

12
Options are granted annually on 31 December and
the option exercise price is equal to the price of the
certificates of shares at the closing of Euronext
Amsterdam on the last trading day of the year. The
vesting period for the granted options is three years
starting at the first of January of the year following the
grant date. The option period is six years. The options
granted are unconditional and are not subject to any
further conditions of exercise, except that the option
holder is still employed by Fugro or one of its operating
companies. Standard exceptions apply to the latter rule
in connection with retirement, long-term disability and
death. In the event that a public offer is considered
hostile and such offer is declared unconditionally, all
options become immediately exercisable.
Options are granted in such a way that at any moment
the maximum number of outstanding options to acquire
shares in Fugro will not exceed 7.5% of the issued
ordinary share capital, taking into account the number
of shares repurchased for the option plan. In order to
mitigate dilution, it is Fugro’s policy to purchase own
(certificates of) shares to cover the options granted with
the result that no new shares are issued when options are
exercised.
In 2011 Fugro purchased 2,250,000 shares at an average
price of EUR 48.92 per share. On 31 December 2011 a
total of 2,162,746 own shares was held. These shares are
not entitled to dividend and there are no voting rights
attached to these shares. The exercise of all outstanding
options as of 31 December 2011, including the options
granted on this date, could – after having used the
purchased shares – lead to an increase of the issued share
capital by a maximum of 5.2%. As stated above it is
Fugro’s policy to purchase own shares to cover the
options granted with the result that no new shares are
issued when options are exercised. Since the 1st of
January 2012 a total of 33,500 options were exercised.
I n ve s t o r r e l a t i o n s
Fugro offers comprehensive information regarding the
company on its website and through meetings with
analysts, presentations to analysts, presentations to
(institutional) investors and press and by means of press
releases. Shareholders and certificate holders are able to
follow most of these meetings and presentations in real
time, for example by means of webcasting or telephone.
After the meetings, the presentations are posted on the
website. The presentations are given particularly during
the periods March/April and August/September. During
these presentations Fugro’s strategy and activities are
As stated on page 83, only certificates of shares of Fugro
are listed on Euronext Amsterdam. These certificates are
issued by the Fugro Trust Office, which carries out the
administration of the underlying shares (for which it has
issued the certificates). On 1 March 2012 the Fugro Trust
Office administered 92.94% of the issued (underlying)
shares.
Pa r t i c i p a t i o n s a n d e m p l oy e e o p t i o n s
As far as is known, on 31 December 2011 around one
percent of Fugro’s share capital was held by members
of the Board of Management and other employees within
the Group. Of the total number of employee options
granted during the past years, 5,268,300 options
(excluding the option grants as per 31 December 2011)
were still outstanding on 31 December 2011.
A total number of 1,161,100 new options, with an
exercise price of EUR 44.895 were granted to a total of
684 employees on 31 December 2011. Of these options,
29.7% was granted to the six members of the Board of
Management (see also pages 165 and 166).
Options on Fugro shares are granted to a broad group of
employees. The granting of options is dependent on the
achievement of the targets of the Group as a whole and
of the individual operating companies as well as on the
contribution of the relevant employee to the long term
development of the company. Option grants to members
of the Board of Management are based upon the
remuneration policy and the option scheme that were
adopted and approved respectively by the Annual
General Meeting of Shareholders on 14 May 2008.
M o ve m e n t i n n u m b e r o f s h a r e s p u r c h a s e d
t o c o ve r t h e o p t i o n s g r a n t e d
2011 2010
Balance on 1/1 882,796 1,218,776
Purchased 2,250,000 800,000
Sold in connection with
option exercise (970,050) (1,135,980)
Balance on 31/12 2,162,746 882,796
Granted, not exercised
options as of 31/12 6,429,400 6,280,100

13Fugro at a glance
D i s t r i b u t i o n o f s h a r e h o l d e r s
(x 1,000 shares)
Nederland
Overig
Zwitserland
Duitsland
Frankrijk
België
Luxemburg
Verenigde Staten
Verenigd Koninkrijk
0
16,500
33,000
49,500
66,000
82,500
End 2011End 2010 End 2009End 2008End 2007End 2006
United Kingdom
United States
Luxembourg
Germany
Switzerland
Belgium
France
Other
The Netherlands
further explained in detail by members of the Board of
Management. Roadshows are held in amongst others the
United States, United Kingdom, The Netherlands and
Germany. Individual and collective personal contact with
investors and analysts is also maintained annually via
around three hundred ‘one-on-one’-meetings,
presentations and telephone conferences. Fugro has
formulated a policy on bilateral contacts with
shareholders. This policy is posted on the website.
P r e ve n t i o n o f t h e m i s u s e o f i n s i d e
i n fo r m a t i o n
Fugro considers prevention of the misuse of inside
information when trading in securities to be essential for
its relationship with the outside world. Fugro has issued
internal guidelines (last updated in August 2011) on the
holding of and effecting transactions in Fugro securities
which apply to the members of the Supervisory Board,
the Board of Management and other designated persons.
A record is kept of all so-called ‘insiders’. Fugro has
appointed a Compliance Officer. Dealings in securities
by the members of the Supervisory Board, the Board of
Management and a few managers (who are considered
insiders as meant in section 5:60 of the Financial
Supervision Act) are notified to the Authority for the
Financial Markets (AFM). The public database of the AFM
can be consulted on the website of the AFM: www.afm.nl.
F u r t h e r i n fo r m a t i o n
Further information about Fugro is available on the
website www.fugro.com. Fugro can be contacted by
telephone (+31(0)70 3111422) or by e-mail
0
15
30
45
60
75
0
6,000
12,000
18,000
24,000
30,000
2010 201120092008200720062005
S h a r e p r i c e a n d n u m b e r o f s h a r e s t r a d e d
(January 2005 – December 2011)
0
15
30
45
60
75
0
200
400
600
800
1,000
2010 201120092008200720062005
Closing price (scale left).
Trading volume in million Euro per month (scale right).
Source: NYSE Euronext
Closing price (scale left).
Number of shares traded per month (x 1,000) (scale right).
Source: NYSE Euronext
S h a r e p r i c e a n d t r a d i n g v o l u m e i n E u r o
(January 2005 – December 2011)

14
From left to right: Mr. Th. Smith, Mr. F.J.G.M. Cremers, Mrs. M. Helmes, Mr. J.A. Colligan, Mr. G-J. Kramer and Mr. F.H. Schreve.
name Mr. F.H. Schreve (1942)
function Chairman
committee member remuneration and nomination committee
nationality Dutch
(first) appointed* 1983 until 10 May 2011 and 14 December 2011
current term until AGM 2013
expertise management strategy and risks inherent to the
company’s business; management selection,
nomination and selection; compliance; shareholder
and employee relations
other functions Supervisory Board member HVC N.V. Chairman of the
Board Foundation preference shares H.E.S. Beheer N.V.,
Foundation Trust Office TKH N.V. and Foundation
Waarborgfonds Sport. Supervisory Board Chairman
Sint Lucas Andreas Ziekenhuis and Foundation
National Park De Hoge Veluwe
* Mr. Schreve retired on 10 May 2011 when Mr. H.C. Scheffer took over
the chairmanship. When Mr. Scheffer passed away in September 2011,
Mr. Schreve was asked to return as chairman. Mr. Schreve was (re)appointed
on 14 December 2011 for a term of one year and a half.
name Mr. J.A. Colligan (1942)
committee member audit committee
nationality British
first appointed 2003
current term until AGM 2015
expertise management strategy and risks inherent to the
company’s business; management selection,
nomination and selection, oil and gas sector,
innovation and technology development
other functions Director Society of Petroleum Engineers Foundation
name Mr. G-J. Kramer (1942)
committee Chairman remuneration and nomination committee
nationality Dutch
first appointed 2006
current term until AGM 2014
expertise management selection, nomination and selection;
management strategy and the company’s risk profile;
compliance; oil and gas sector
other functions Chairman Supervisory Board ASM International N.V.
and Scheuten Solar Holding B.V. Vice-chairman
Supervisory Board Damen Shipyards Group.
Supervisory Board member N.V. Bronwater leiding
Doorn and Energie Beheer Nederland B.V. Chairman
Supervisory Board Delft Technical University. Chairman
Service Organisation Protestant Churches in the
Netherlands. Chairman Board Amsterdam Sinfonietta
and Chairman Board Residentie Orkest. Board member
Leiden Pieterskerk Foundation, Foundation Beelden
aan Zee Museum and The Concertgebouw Fund
Foundation. Member Advisory Board De Nieuwe Kerk
and Frans Hals Museum
name Mr. F.J.G.M. Cremers (1952)
function Vice-chairman
committee chairman audit committee
nationality Dutch
first appointed 2005
current term until AGM 2013
expertise financial administration, financing; internal risk
management and control systems; compliance; oil
and gas sector; shareholder and employee relations
other functions Supervisory Board member N.V. Nederlandse
Spoorwegen (vice-chairman), SBM Offshore N.V., Vopak
N.V., Unibail-Rodamco S.E., Luchthaven Schiphol N.V.
and Parcom Capital B.V. Board member Foundation
preference shares Philips and Foundation preference
shares Heijmans. Member of the Capital Market
Committee of the Netherlands Authority for the
Financial Markets (AFM)
name Mrs. M. Helmes (1965)
committee member audit committee
nationality German
first appointed 2009
current term until AGM 2013
expertise financial administration and accounting; internal risk
management and control systems; financing and
general financial management
other functions Chief Financial Officer Celesio AG, Stuttgart, Germany
name Mr. Th. Smith (1942)
committee member remuneration and nomination committee
nationality American
first appointed 2002
current term until AGM 2014
expertise management strategy and the company’s risk profile;
management selection, nomination and selection;
innovation and technology development; the oil and
gas sector
other functions Chairman of the Board Smith Global Services, Inc.,
Board member Houston Advanced Research Center,
Director of WWW United, Inc. and Director of
Satterfield & Pontikes, Inc.
Secretary to the Supervisory Board
W.G.M. Mulders (1955)
■ S U P E R V I S O R Y BO A R D

15Report of the Supervisory Board
In many respects the year 2011 was good for Fugro,
despite the continuing tough unpredictable and volatile
economic environment. The expected global economic
recovery in early 2011 did not materialise. We take into
account that 2012 will continue to present expected and
unexpected uncertainties like the world’s f lagging
economy, an unstable financial sector and complications
regarding the refinancing of government debt. Fugro
will continue to consistently implement its targeted
strategy; it is well positioned for the years to come.
In 2011 the Supervisory Board was confronted with the
untimely death of its new chairman, Herman Scheffer,
on 20 September. Herman Scheffer joined the
Supervisory Board in May 2010 and was appointed
chairman in May 2011. We would like to take this
opportunity to say a posthumous thank you for Herman
Scheffer’s contributions and his advice during the short
period of his board membership. We will miss his
expertise, dedication and great engagement.
F i n a n c i a l s t a t e m e n t s 2 0 1 1 a n d d i v i d e n d
This Annual Report includes the Financial Statements
2011, which are accompanied by an unqualified
independent auditor’s report of the external auditor,
KPMG Accountants N.V. (KPMG). These Financial
Statements were prepared in accordance with
International Financial Reporting Standards (IFRS) as
adopted by the European Union and section 9 of Book 2
Dutch Civil Code.
We have discussed the Annual Report, including the
Financial Statements with the Board of Management
in the presence of KPMG. Furthermore we reviewed
the auditor’s report and the quality of internal risk
management and control systems. We are of the opinion
that the Financial Statements and the report by the
Board of Management provide a true and fair view of
the state of affairs of Fugro including the management
policies pursued.
We propose that the shareholders adopt the Financial
Statements 2011 and discharge the members of
the Board of Management for its management of the
Company during 2011 and the Supervisory Board for
its supervision over said management. We endorse the
proposal of the Board of Management to maintain the
dividend for 2011 at EUR 1.50 per share, to be paid at the
choice of the shareholder in cash or in shares. The
amount of the dividend in shares will be determined and
published on Thursday 14 June 2012 after trading hours.
If no choice is made, the dividend will be paid in shares.
The proposed dividend equates to a pay-out ratio of
41.3% of the net result.
C o m p o s i t i o n a n d p r o f i l e
o f t h e S u p e r v i s o r y B o a r d
The Supervisory Board currently consists of six members
being of American, British, Dutch or German nationality.
Information about each member of the Supervisory
Board is included on page 14 . The Supervisory Board has
prepared a profile defining its size and composition,
taking into account the nature of the Company and its
activities. The desired experience and background is
present in the Supervisory Board members. When a
proposal is made for the (re)appointment of a
supervisory director, the Supervisory Board primarily
looks at the desired complementary expertise and
experience, as well as the independence of the candidate.
The Supervisory Board aims for a diverse composition in
terms of such factors as gender, years of experience
and nationality.
All Supervisory Board members are independent under
the terms of the Dutch Corporate Governance Code
(‘Code’). Supervisory Board members do not carry out
any other functions that could jeopardise their
independence. With the exception of Mr. G-J. Kramer
who, as former CEO of Fugro, holds a 5.52% interest in
Fugro (see page 12), none of the other Supervisory Board
members hold any (options on) shares in Fugro. Both the
composition of the Supervisory Board and the expertise
and experience of its individual members comply with
all corporate governance rules and requirements. Only
Mr. F.H. Schreve holds a tenure on the Supervisory Board
that exceeds the 12 years of the Code. The division of
duties within the Supervisory Board and the procedure
of the Supervisory Board are laid down in terms of
reference. The terms of reference of the Supervisory
Board (including its profile, the terms of reference of
the Audit Committee and of the Remuneration and
Nomination Committee) are posted on Fugro’s website.
■ R e p o r t o f t h e S u p e r v i s o r y B o a r d

16
Management’s opinion regarding the set-up and
functioning of the internal risk management and control
system; and Fugro’s corporate governance structure.
The meeting reports of the Audit Committee and of the
Remuneration and Nomination Committee were also
discussed.
Next to the regular agenda items, the following items
were discussed:
In January the financing structure of the Company was
discussed. The Supervisory Board considered it of
importance that the long term finance was secured as
soon as possible in view of the financial crisis. This
(re)financing process was completed in the period June –
August. Gender diversity was also discussed.
The Supervisory Board is very much in favour of
improving female representation in senior positions and
on both the Board of Management and the Supervisory
Board, but it is also realised that this is not an easy task
to accomplish in view of the business in which Fugro
operates. However gender diversity is and will continue
to be a point of attention.
In March vessel strategy and management was a topic
and the progress of the (re)financing process was
discussed again. The dividend proposal was approved (as
a large shareholder Mr. Kramer did not participate in the
discussions and decision). The updated terms of
reference of the Supervisory Board were approved and
posted on the website.
In May the Supervisory Board decided on changes in
Fugro’s management structure and on the succession of
the retiring Mr. K.S. Wester as President of the Board of
Management. Mr. Scheffer was appointed chairman of
the Supervisory Board as successor of Mr. Schreve. The
(re)financing was discussed once more and also the
rotation of the lead audit engagement partner of KPMG
at the end of the year.
In August the Supervisory Board was updated on Fugro’s
policy and measures with respect to corruption and
bribery, particularly in view of the UK bribery Act that
came into force in July. At the end of September the
M e e t i n g s i n 2 0 1 1
In 2011 the Supervisory Board met five times in regularly
scheduled two day-meetings. The Board of Management
attended all those meetings. Several investments and
special issues were discussed in conference calls. A few
meetings were held without members of the Board of
Management being present. In two instances, one of the
Supervisory Directors was absent and excused. The
overall attendance percentage was 93%. In between
meetings the Chairman was in regular contact with the
President of the Board of Management and with the
other members of the Board of Management when
necessary or useful.
In November a meeting was combined with visits to
operating companies in Wallingford and Aberdeen in
the United Kingdom, whereby presentations on business
activities and environment and discussion with senior
management took place. These company visits take place
annually and also form part of the ongoing training and
education of Supervisory Directors. In the January
meeting the Supervisory Board was updated on corporate
governance. Subjects that were discussed were amongst
others the one-tier versus the two-tier board, new and
expected legislation, the functioning of a supervisory
board and the dynamics of the decision process.
In August the Supervisory Board was updated on
developments in the oil and gas industry by an external
industry expert.
In the meetings with the Board of Management the
recurring items on the agenda were amongst others the
operational and financial targets; the general strategy
designed to achieve the targets as well as the strategies
for the various business lines; market developments;
the annual budget; the financial results; share price
development; potential acquisitions and divestments;
post acquisition analysis; corporate social responsibility;
health, safety and environment; important investments;
management development and the filling of various
senior management positions; human resources
management; information and communication
technology (ICT); the main risks inherent to the
company’s activities as well as the Board of
Fugro’s first vessel with drilling rig 1969

17Report of the Supervisory Board
The outcome of the self-assessment was positive,
with suggestions for further improvement.
Au d i t C o m m i t t e e
In 2011 the members of the Audit Committee were
Messrs. F.J.G.M. Cremers (chairman) and J.A. Colligan
and Mrs. M. Helmes. The composition of the Audit
Committee is in accordance with the requirements of the
Code. Collectively the members possess the required
experience and financial expertise. Mr. Cremers and
Mrs. Helmes were acting as financial expert within the
meaning of the Code. The Audit Committee met three
times. The external auditor (KPMG) attended all three
meetings. The annual accounts and half-yearly results
were discussed during the relevant meetings. Topics
such as taxation, claims and disputes, compliance and
the financial crisis were discussed in depth. Risk areas,
such as hedging, f luctuations in currency exchange
rates, impairment and insurance were also discussed as
was the functioning of the internal risk management
and control system and the 2012 audit plan of the
internal audit function. A lot of attention was paid to
the financing structure of Fugro and the (re)financing
process. The Audit Committee was informed of
important findings from the internal audit visits.
KPMG was given the opportunity to discuss issues with
members of the Audit Committee in the absence of
Fugro’s Board of Management and staff.
At least once every four years the Audit Committee and
the entire Supervisory Board conduct a thorough
assessment of the functioning of the external auditor in
accordance with best practice provision V.2.3 of the Code.
The previous assessment took place in 2010 when KPMG
was reappointed as the external auditor. In 2011 the
functioning of the external auditor was reviewed by
the Board of Management and discussed in the Audit
Committee. The outcome was positive. Rotation of the
lead audit engagement partner of KPMG took place at the
end of 2011.
R e m u n e r a t i o n a n d N o m i n a t i o n C o m m i t t e e
In 2011 the members of the Remuneration and
Nomination Committee were Messrs. G-J. Kramer
(chairman), H.C. Scheffer (who passed away on
20 September) F.H. Schreve and Th. Smith.
The Committee met formally three times, mostly in the
presence of the President of the Board of Management,
Mr. Wester, but also met informally on a number of
occasions to discuss, amongst others, the succession of
Mr. Wester and the succession of Mr. Scheffer.
The recurring topics that were discussed included,
Supervisory Board discussed in a closed meeting the
succession of Mr. Scheffer who passed away on
20 September and initiated the search process for a new
chairman. Following the advice of the Remuneration and
Nomination Committee it was decided that it would be
desirable that Mr. Schreve returns as Supervisory
Director and chairman and to propose the appointment
of Mr. Schreve to an extraordinary meeting of
shareholders held in December for a term of one year
and a half. The Supervisory Board discussed the
preliminary proposal with the Board of the Fugro Trust
Office. After careful consideration the Board of the Fugro
Trust Office decided that it would vote in favour of the
appointment of Mr. Schreve as the best solution
available.
In November the progress of the search process for the
future chairman of the Supervisory Board was discussed,
considering new Dutch legislation that would restrict
the number of supervisory board seats a person can have
at Dutch large companies and foundations.
Mr. Steenbakker, the new chairman of the Board of
Management as of 1 January 2012 gave a presentation
to the Supervisory Board on the management structure
in 2012.
F u n c t i o n i n g o f t h e B o a r d o f M a n a ge m e n t
a n d o f t h e S u p e r v i s o r y B o a r d
The Supervisory Board evaluated the performance and
the remuneration of the Board of Management and its
individual members. This evaluation was prepared by
the Remuneration and Nomination Committee by
conducting interviews with each member of the Board
of Management and also based on the reports of the
various business lines. The results were discussed in a
closed plenary meeting of the Supervisory Board.
The Supervisory Board also reviewed its own
performance and its individual members. The self-
assessment of the Supervisory Board focused in
particular on the team effectiveness, the independence
of the Supervisory Directors, their professionalism and
experience mix, potential conflicts of interest, the
Supervisory Board committees and their functioning, the
quality of the information received and the frequency of
meetings and contacts with the Board of Management
and other senior executives of the Company, training
and knowledge, effectiveness and board responsibility.
This internal self-evaluation was based on individual
discussions with the chairman and on questionnaires,
which were completed by each Supervisory Board
member and plenary discussed in a closed meeting.

18
among which the development of the long term
strategy, on the basis of measurable targets such as
the (growth) targets in the strategic plan and in the
annual budget. This part of the income of members
of the Board of Management (and other senior
management) also depends on the Fugro share price
and is therefore linked to the value of Fugro;
• pensionprovisionsandfringebenefits.Pensionis
based upon a customary pension scheme and on an
available premium system. The fringe benefits are
commensurate with the position held.
The actual (financial and non-financial) targets are not
disclosed because they qualify as competition-sensitive
and hence commercially confidential and potentially
price sensitive information.
Before determining the remuneration of individual
members of the Board of Management, the Supervisory
Board analyses the possible outcomes of the variable
remuneration components and how they may affect the
remuneration. The remuneration policy within the
Fugro Group is also taken into account. In an
unfortunate situation, the Supervisory Board may
recover from the members of the Board of Management
any variable remuneration awarded on the basis of
incorrect financial or other data. Payment of variable
remuneration to the members of the Board of
Management is subject to the correctness of the relevant
(financial) data for the relevant year. Under
circumstances, for instance if the predetermined targets/
performance criteria would produce an unfair result due
to extraordinary circumstances, the Supervisory Board
has the discretionary authority to make adjustments
(upward or downward) to the amount of the annual
bonus. If the Supervisory Board would during the year
decide on the payment of severance pay or other special
remuneration to one or more members of the Board of
Management, an account and an explanation of this
remuneration shall be included in the remuneration
report. Until now, the amount of an annual bonus has
never been adjusted nor has a special remuneration
been paid.
R e m u n e r a t i o n i n 2 0 1 1
B o a r d o f M a n a ge m e n t
Fixed salary 2011
After two consecutive years of no changes, the fixed
salaries of the members of the Board of Management
were raised by 3% as per 1 January 2011.
amongst others, the remuneration policy, the
remuneration of the members of the Board of
Management (including the granting of bonuses), the
granting of stock options, the remuneration of the
members of the Supervisory Board and the composition
and performance evaluation of both the members of
Board of Management and the Supervisory Board.
The Remuneration and Nomination Report for the year
2011 was prepared in accordance with best practice
provision II.2.12 of the Code and approved by the
Supervisory Board. This Report contains an account of
the manner in which the remuneration and nomination
policy has been implemented in 2011. The Remuneration
and Nomination Report 2011 is posted on Fugro’s
website. A summary is provided hereunder.
Summary Remuneration and Nomination Report 2011
The objective of the remuneration policy is to provide a
remuneration system such that performance that is
pursuant to the results and strategy of Fugro is rewarded
and also that qualified and experienced management can
be recruited, motivated and retained.
The key elements of the remuneration policy are as
follows:
• afixedsalary,setinthemiddleofapeergroupof
comparable companies;
• anannualbonus(short-termincentive),dependingon
targets determined in advance with a maximum of
twelve months (100%) of annual fixed salary. The
bonus is related to quantified financial targets and
accounts for 2/3 of the annual bonus and the other
part of the bonus is related to non-financial / personal
targets and will account for 1/3 of the annual bonus.
The financial targets and the weighing given to the
individual financial elements are as follows: earnings
per share 60%, net profit margin 20% and return on
capital employed 20%. The non-financial targets are
based on Fugro’s strategic agenda. These are
qualitative individual targets and/or collective targets
that are the responsibility of one or more directors
and that can be influenced by them. These targets
could include, among other things, health safety and
environment (HSE), corporate social responsibility
(CSR), personal development, etc.;
• stockoptions(long-termincentive).Thestockoptions
for the Board of Management form part of a broad
option scheme that is in existence already many years
and that is applicable to more than 600 managers
worldwide. Options are granted on the basis of the
contribution to the long term development of Fugro,

19Report of the Supervisory Board
N o m i n a t i o n
The main topics discussed were the composition of the
Supervisory Board and of the Board of Management.
Senior management succession, talent identification and
the issue of diversity were also reviewed.
The Committee spent significant time on the situation
which arose when Mr. Scheffer passed away in
September. The search for a new chairman for the
Supervisory Board was again initiated. However, a
change of the chairmanship of the Supervisory Board
could not coincide with the succession of Mr. Wester
by Mr. Steenbakker as chairman of the Board of
Management. Against this background it was proposed
to the Supervisory Board that it would be desirable that
Mr. Schreve with his long experience of Fugro would
return as chairman. Mr. Schreve consented to this
request of the Supervisory Board for a period up till mid
2013. He was almost unanimously appointed by the
Extraordinary Meeting of Shareholders in December
2011 for a term of a year and a half maximum.
In the absence of Mr. Scheffer and before the return of
Mr. Schreve as chairman, Mr. Cremers acted as chairman
of the Supervisory Board.
C o m p o s i t i o n B o a r d o f M a n a ge m e n t
a n d S u p e r v i s o r y B o a r d
Board of Management
In various closed meetings the Supervisory Board
discussed the composition of the Board of Management.
This led to the appointment of Mr. W.S. Rainey to the
Board of Management by the AGM held on 10 May 2011.
At the same time the Supervisory Board announced that
the President (chairman) of the Board of Management,
Mr. Wester, would retire in June 2012. On 1 January 2012
Mr. Wester handed over his responsibilities to
Mr. Steenbakker who has been appointed as chairman
of the Board of Management.
Mr. Wester was appointed to the Board of Management in
1996 and appointed President in 2005. His leadership was
instrumental for Fugro’s success and continued
development. We would like to thank Klaas Wester for
his constructive management and to express our
appreciation for his contribution to Fugro. The solid
position Fugro has acquired in the past period is to a
large degree attributable to him.
Mr. Steenbakker was appointed chairman of the Board of
Management as of 1 January 2012 as he has taken over
the management responsibility together with his
colleagues in the Board of Management. Mr. Wester will
Annual bonus 2010
At the beginning of 2011 the Remuneration and
Nomination Committee evaluated the predetermined
2010 annual bonus targets. Based on the results for the
non-financial and financial targets, the Supervisory
Board has established the extent to which the targets for
2010 were achieved. Both the financial targets (weighing:
earnings per share, net profit margin and return on
capital employed) relating to the Group’s financial
performance as well as the non-financial targets were
met and even exceeded. As a result, the Supervisory
Board has decided to award to each of the members of
the Board of Management an annual bonus of 10 months
annual fixed salary for the year 2010 (paid in 2011).
The actual targets are not disclosed because they qualify
as competition-sensitive and hence commercially
confidential and potentially price sensitive information.
Stock options 2011
As per 31 December 2011 a total number of 345,000 stock
options was granted to the members of the Board of
Management (based upon the option scheme as approved
by the Annual General Meeting of Shareholders (AGM)
on 14 May 2008). The exercise price of these options is
EUR 44.895 (the closing price of the shares at Euronext
Amsterdam on 30 December 2011). The option period is
six years and the options can only be exercised after
1 January 2015 (vesting period is three years).
Further details of Fugro’s remuneration policy and of the
remuneration of the individual members of the Board of
Management, broken down into its various components,
are presented in the financial statements on page 164
and in the Remuneration and Nomination Report 2011.
S u p e r v i s o r y B o a r d
The shareholders’ meeting determines the remuneration
package for the Supervisory Board. Remuneration was
reviewed in the first quarter of 2011, taking into account
a benchmark analysis of remuneration of supervisory
directors at companies that are part of the Amsterdam
AEX index. In view of the outcome of this analysis and
the increased tasks of supervisory directors, the AGM
approved in May 2011 an appropriate increase in the
remuneration of the Supervisory Directors as of
1 January 2011. For further details reference is made to
the Remuneration and Nomination Report 2011 and to
page 167 of the financial statements.

20
preside over the finalisation of the financial statements
for 2011, introduce and help his successor in his new
responsibilities and organise the 50-year jubilee of Fugro
in May. The selection process was prepared by the
Remuneration and Nomination Committee. The starting
point was the selection of a number of capable internal
candidates and the involvement of an independent
executive search firm. This process led to the final
conclusion that Mr. Steenbakker was the right person to
succeed Mr. Wester.
We wish Arnold Steenbakker and the members of the
Board of Management success in 2012.
As of 1 January 2012 the Board of Management
consists of:
Mr. Arnold Steenbakker (1957) – Chairman
Mr. Paul van Riel (1956) – Vice-chairman, Director
Geoscience division
Mr. Scott Rainey (1954) – Director Geotechnical division
Mr. Jakob Rüegg (1944) – Director Survey division
Mr. André Jonkman (1954) – Financial Director (CFO)
Mr. Klaas Wester (1946) – President until 31 December
2011; retirement June 2012
Messrs. J. Rüegg and A. Jonkman need to be reappointed
as their term expires at the AGM to be held on 22 May
2012. Mr. Rüegg was appointed in September 2009. It will
be proposed to the AGM to reappoint Mr. Rüegg for an
additional one year to be in charge of the Survey
Division, after which he will take retirement.
Mr. Jonkman was reappointed in May 2008 and it will be
proposed to reappoint him for a term of four years.
Supervisory Board
The Supervisory Board has nominated Mr. Harrie L.J. Noy
(1951) for appointment as member of the Supervisory
Board. The nomination will be put on the agenda of the
AGM on 22 May 2012.
Mr. Noy has the Dutch nationality and is since 2000 CEO
and Chairman of the Executive Board of Arcadis N.V. in
Amsterdam. He will step down from this position in the
upcoming AGM of Arcadis N.V. on 16 May 2012.
In addition, Mr. Noy is member of the Supervisory Board
of NV Nederlandse Gasunie; Board member of VNO –
NCW (the Confederation of Netherlands Industry and
Employers); member of the Exchange Council NYSE
Euronext Amsterdam; Board member of VEUO (The
Dutch Association of Listed Companies); and Chairman
of the Supervisory Board of the College of Arnhem –
Nijmegen (HAN).
Mr. Noy is nominated because of his experience as CEO of
a listed company and as supervisory director, his
technical background and his experience growing the
international presence of Arcadis.
If Mr. Noy is appointed on 22 May 2012, the Supervisory
Board intends to appoint him as Chairman of the
Supervisory Board in May 2013.
I n c o n c l u s i o n
We would like to thank all shareholders for their trust in
Fugro and management and all employees for their hard
work and efforts. We are aware of the challenges 2012
will bring us, but we feel confident that Fugro can cope
with these challenges.
Leidschendam, 8 March 2012
F.H. Schreve, Chairman
F.J.G.M. Cremers, Vice-chairman
J.A. Colligan
M. Helmes
G-J. Kramer
Th. Smith

21
50 yeARS FuGRO
0
1 .0
0 . 5
1 . 5
2 . 0
2 . 5
3 . 0
2000 20111990198019701962
R e ve n u e
d e ve l o p m e n t
1 9 6 2 - 2 0 1 1
(In EUR billion)

22
From left to right: A. Jonkman, K.S. Wester, A. Steenbakker, J. Rüegg, W.S. Rainey and P. van Riel.
■BO A R D O F M A N A G E M E N T
Fugro is the holding company of a large number of operating
companies located throughout the world and with a range of
activities. To promote client-orientation and efficiency, the
Group’s organisational structure is highly decentralised, but
cohesive, and built around three divisions, Geotechnical, Survey
and Geoscience.
The Board of Management manages Fugro’s strategic, financial
and organisational matters and appoints senior managers.
The approval of the Supervisory Board is required for important
management board resolutions.
Managing directors are (re)appointed by the General
Meeting of Shareholders for a maximum term of four
years. The members of the Board of Management are
collectively responsible for the management of the
company. Notwithstanding their collective responsibility
within the Board of Management, specific tasks and
responsibilities have been assigned to the individual
members of the Board of Management.
As of 1 January 2012, Mr. Steenbakker took over the
chairmanship of the Board of Management from
Mr. Wester, who will retire in June 2012. Mr. Van Riel
was appointed vice-chairman.
B o a r d o f M a n a ge m e n t
name A. Steenbakker (1957)
function Chairman of the Board of Management
as of 1 January 2012
nationality Dutch
employed by Fugro since 2005
appointed to Board of Management 2006
(reappointed 2010)
current term until AGM 2014
name P. van Riel (1956)
function Vice-chairman of the Board of Management /
Director Geoscience division
nationality Dutch
employed by Fugro since 2001
appointed to Board of Management 2006
(reappointed 2010)
current term until AGM 2014
name W.S. Rainey (1954)
function Director Geotechnical division
nationality American
employed by Fugro since 1981
appointed to Board of Management 2011
current term until AGM 2015
name J. Rüegg (1944)
function Director Survey division
nationality Swiss
employed by Fugro since 1994
appointed to Board of Management 2009
current term until AGM 2012
name A. Jonkman (1954)
function Chief Financial Officer
nationality Dutch
employed by Fugro since 1988
appointed to Board of Management 2004
(reappointed 2008)
current term until AGM 2012
other functions member Supervisory Board Dietsmann N.V.
name K.S. Wester (1946)
function President and CEO of the Board of Management
until 31 December 2011
nationality Dutch
employed by Fugro since 1981
appointed to Board of Management 1996
(President and CEO 2005)
current term retirement June 2012
other functions member Supervisory Board Iv-Groep B.V.
member Supervisory Board Royal BAM Group N.V.
member Supervisory Board Aarding Management B.V.
Company Secretary
W.G.M. Mulders (1955)

23Report of the Board of Management
■ R e p o r t o f t h e B o a r d o f M a n a g e m e n t
■ G E N E R A L
The global economic recovery expected in early 2011
failed to materialise. The continuing growth in a number
of countries, particularly in the Far East, was largely
offset by stagnation in Europe and the Middle East.
Europe and the USA are still suffering the aftermath of
the financial crisis that started in 2008, while the
political changes in the Arab world and North Africa are
slowing down economic developments in those regions.
The demand for energy remained stable, as also reflected
in oil prices of around USD 100 per barrel (WTI). As a
result, and in order to meet the expected increase in
future demand, the oil and gas industry has increased its
spending on global exploration and production. Oil and
gas will remain important in the coming years. Although
use of energy from renewable sources such as offshore
wind farms is growing rapidly, it still only makes a small
contribution globally. The disaster that struck the
Japanese nuclear power plant following the earthquake
and tsunami caused many countries to reconsider the
use of nuclear energy.
Many of Fugro’s activities are related to energy, and the
above global developments have resulted in an
increasing demand for our services in various activities,
but fell short of earlier expectations. This applies
specifically to marine seismic surveys and support
services for offshore installations, where prices remained
under pressure throughout the year. The fact that
marine seismic activities in the Gulf of Mexico failed to
recover after the 2010 Macondo incident meant that
there was still overcapacity of seismic vessels in 2011.
Demand for offshore construction-related services
picked up slightly during the year.
The picture in other sectors in which Fugro operates
showed regional variations. Demand for services for
large infrastructure projects in Europe and the United
States, for example, was weak. Although activities that
largely depend on government funding, such as
infrastructure, aerial mapping and construction, were
generally under pressure in the ‘old economies’, this was
offset by growing demand in emerging regions such as
Brazil, China (Hong Kong) and Western Australia.
Mining-related work is recovering strongly after a few
difficult years, thanks in part to the broader range of
services which we can now also offer in onshore oil and
gas exploration.
The growth in revenue that occurred in the first half of
2011 continued during the rest of the year, with second-
half revenue increasing by more than 13% compared to
the corresponding period in 2010. As a result, Fugro
achieved record revenue for the year of EUR 2,577.8
million. The increase was mainly attributable to the
Survey and Geoscience divisions, while the Geotechnical
division’s revenue was at the same level as in the
previous year.
Continuing price pressure in a number of sectors and
costs needed to integrate acquisitions completed in 2011
resulted in a slightly lower net profit margin of 11.2%
(2010: 11.9%). In absolute terms, however, net profit for
the year of EUR 287.6 million exceeded that of any
previous year. The afore mentioned matters also
impacted the EBIT.
Fugro’s financial position is solid and was further
secured in 2011 by the decision to expand our long-term
borrowing facilities. This helped us to continue an active
acquisition strategy designed to reinforce market
positions, broaden our range of services and to support
further growth in the future. Our program for investing
in new vessels, specialised equipment and ROVs will also
support continued organic growth.
Fugro’s broad range of services enables the company to
offer one-stop-shopping solutions to clients for complex
projects. This applies both for new oil and gas
developments, as well as large infrastructure projects
such as harbour extensions and offshore wind farms.
Fugro also has extensive capacity in equipment and
expertise for the exploration of valuable mineral
resources.
Fugro won contracts for several attractive projects
during the year. Some examples of these are discussed
on pages 37, 38 and 39.

24
provider of subsea installation services, IRM
(inspection, repair and maintenance) and light well
intervention. The company operates ROV (Remotely
Operated Vehicle) and diving services, has four high
specification chartered vessels in its f leet and is
primarily active in the Asia-Pacific region, where
it will enhance Fugro’s existing presence.
• Fugroacquiredtheremaining50%ofthesharesin
MR Subsea KS and MR Subsea AS, Norway. MR Subsea
is active in the field of ROV services and is the owner
of the vessel Atlantis Dweller.
A c q u i s i t i o n s w i t h i n t h e G e o s c i e n c e
d i v i s i o n
• JDRCableSystemsHoldingsNetherlandsBV,renamed
De Regt Marine Cables B.V. (De Regt), the Netherlands,
designs and produces special marine cables for the oil
and gas industry, for geophysical clients and for
defence.
• KelmanTechnologies’seismicdataprocessing
business, Canada, has expertise in land data
processing. Kelman complements Fugro’s existing
seismic data processing capabilities.
• OceanBottomNodes(OBN)businessofSeaBird
Exploration PLC, Norway. The OBN method is for
seabed acquisition of 3-D and 4-D (time lapse reservoir
monitoring) multi-component seismic data. OBN is
the only available method for acquiring seabed
seismic data in deep water and around obstructed
areas. The nodes used in the OBN approach are
deployed using ROVs.
Reasons for acquisitions include obtaining new or
additional technology and increasing market share.
The annual revenue of the companies acquired in 2011
amounts to EUR 215 million.
The total cost of the acquisitions completed in 2011 was
EUR 219 million.
For more detailed information on acquisitions that took
place in 2011, reference is made to the Financial
statements on pages 120, 121 and 122.
In financial terms, the year 2011 can be summarised as
follows:
• Fugro’srevenueincreasedby13.0%toEUR2,577.8
million (2010: EUR 2,280.4 million). Revenue
increased organically by 7.6% and by 8.8% as a result
of acquisitions. The foreign currency effect was
negative 3.2%; the effect of disposals was 0.2%
negative;
• Earningsbeforeinterest,taxes,depreciationand
amortisation (EBITDA) increased by 3.5% to
EUR 581.0 million (2010: EUR 561.1 million);
• Resultsfromoperatingactivities(EBIT)werelowerat
0.6% to EUR 349.3 million (2010: EUR 351.5 million);
• Netresultwentupwith5.7%toEUR287.6million
(2010: EUR 272.2 million);
• Earningspershareincreasedby4.6%toEUR3.63
(2010: EUR 3.47).
It is proposed to maintain the dividend for 2011 at
EUR 1.50 per share (2010: EUR 1.50).
■ A C QU I S I T I O N S
In 2011 Fugro completed nine acquisitions:
A c q u i s i t i o n s w i t h i n t h e G e o t e c h n i c a l
d i v i s i o n
• BluestoneOffshorePteLtd,Singapore,provides
offshore geotechnical services.
• AOAGeophysicsInc.,USA,offersgeoscience
consultancy to the offshore oil and gas industry.
• SialGeoscienceConsultingandEngineeringS, ti,
Turkey, is a leading Turkish geotechnical consultant
providing expertise to large infrastructure
construction companies and government.
• Geo-logGmbH,Germany,isanonshoregeotechnical
company with expertise in the field of site
investigation and characterisation.
A c q u i s i t i o n s w i t h i n t h e S u r vey d i v i s i o n
• TSmarineGroupHoldingsPtyLtd.(TSM)andits
subsidiaries, Australia. The group is a specialist
Soil investigation in Singapore 1974

25Report of the Board of Management
knowledge and experience through on-the-job training
and by working together with experienced employees in
small teams on projects. Fugro also actively invests in
ensuring a healthy and safe work environment.
■ C A PA C I T Y P L A N N I N G
A large part of Fugro’s revenue is generated by offering
niche services in related markets by combining state-of-
the-art technology and knowledge on a global scale.
Over the years Fugro has achieved a leading position in
several niche markets, and in order to be able to
maintain such positions it requires continuous
development, upgrading and advancement of the
technologies used. To optimise efficiency, Fugro uses a
lot of equipment that is developed in-house, based on the
company’s operational experience. Maintaining the
ownership of such equipment is part of Fugro’s strategy.
This is underpinned by an ongoing long term investment
program in key assets such as purpose-build vessels and
operational equipment. In order to maintain f lexibility,
part of the vessel f leet capacity is based on long and short
term charters, in particular for those activities that can
be performed from more standardised vessels.
The charter term of a number of vessels will expire in the
course of 2012. Extensions of charters will be considered
taking into account the backlog and prospects for future
work. Fugro also uses vessels that are chartered on a
project-by-project basis.
■ E M P L OY E E S
N u m b e r o f e m p l oy e e s
At the end of 2011 the number of employees was 13,876
(2010: 13,463). In a number of business units reductions
in staff were implemented during the year. The net effect
of these reductions and new hires in business units
where market conditions were favourable, was a
reduction of 57 employees. This, together with the
addition of 470 staff through acquisitions, resulted in
an increase of 413 employees overall. The average
number of employees for the financial year was 13,749
(2010: 13,444), an increase of 2.3%. Fugro also works
with a large group of experienced and long serving
freelance workers who are regularly deployed on a
project basis. The use of freelance workers provides
Fugro with the f lexibility to respond to variations in
manpower requirements. As a result of increasing
demand some more freelancers were hired in 2011.
Fugro mainly employs local employees and deploys a
small number of expatriates.
Despite the global shortage of specialists, Fugro has been
successful when it comes to recruiting experienced and
professional employees. Increasingly, this is coordinated
on a global basis. Fugro’s recruitment success is helped
by the global spread of its activities and the opportunities
that Fugro can offer to innovative and entrepreneurial
staff.
Fugro continues to invest in training and education in
order to guarantee a high standard of services. Once
again, as in 2010, recruiting young talent was deemed
critical in 2011. New employees also get access to
Pe r s o n n e l d a t a 2011 2010 2009 2008 2007
Average number of employees during the year 13,749 13,444 13,587 12,977 10,824
Revenue per employee (x EUR 1,000) 187.5 169.6 151.1 166.0 166.5
Net revenue own services per employee (x EUR 1,000) 115.2 112.7 105.1 110.4 110.7
Geographical distribution at year-end
The Netherlands 1,034 943 947 978 935
Europe other/Africa 4,604 4,461 4,369 4,311 3,595
Middle East/Asia/Australia 4,349 4,270 4,411 4,319 3,624
North and South America 3,889 3,789 3,755 4,019 3,318
Total at year-end 13,876 13,463 13,482 13,627 11,472

26
three small size survey vessels for shallow water work
have been ordered.
The financing of the vessels is covered by existing
facilities and expected future operating cash f lows.
■ F I N A N C I A L
R e ve n u e a n d c o s t d e ve l o p m e n t
In 2011 revenue reached EUR 2,577.8 million, an increase
of 13.0% compared to the EUR 2,280.4 million in 2010.
Revenue increased 7.6% due to organic growth and by
8.8% as a result of acquisitions. Revenue decreased by
0.2% as a result of divestments and the foreign currency
effect was 3.2% negative. Organic growth of 7.6% was
achieved despite the fact that Fugro continued to face
price pressure in a number of market segments where
there is more capacity in the market than demand can
absorb. The marine seismic activities (division
Geoscience) and the subsea activities (division Survey)
suffered the most from this. In addition issues like the
‘Arab Spring’ and the continuing weakness of the world
wide economy, nourished by financial problems in a
number of countries, played a role.
The analysis of the change in revenue is shown in the
table on page 27. The average revenue growth over a ten
year period is about two-thirds organic growth, and
one-third from acquisitions. The average foreign
currency effect over the same period is 2.5% negative.
Also in 2011, Fugro spent much attention to optimising
business efficiency and reducing costs as much as
possible. Related decision points are that of continuation
or termination of charter agreements of vessels and
the clustering of operating companies in a number
of regions.
Third party costs amounted to EUR 994.0 million in 2011
(2010: EUR 765.6 million). This represents an increase of
EUR 228.4 million. Third party costs as a percentage of
revenue were 38.6% (2010: 33.6%) and include EUR 78.9
million expenses associated with seismic and geologic
data libraries (2010: EUR 88.8 million). The third party
costs as a percentage of revenue is higher in 2011 than in
previous years. One of the main reasons is that the
recently acquired companies, Fugro RUE and Fugro TSM
operate almost solely with chartered vessel capacity.
Moreover in 2011 there was delay in the start of some
projects in Brazil as a result of late delivery of vessel
capacity by third parties and the last minute cancellation
In the course of 2011 the following changes took place in
the vessel f leet:
G e o t e c h n i c a l d i v i s i o n
The acquisition of Bluestone added temporarily the
Greatship Maya drilling vessel to our f leet. The charter of
this vessel was terminated and the drilling equipment,
owned by Fugro, was demobilised. A number of vessels
were chartered for short periods for activities such as
wind-farm operations.
S u r vey d i v i s i o n
A new-build survey vessel, the Fugro Galaxy, commenced
service in the first quarter of the year. The acquisition of
TSmarine added four medium-term chartered vessels to
the f leet. These vessels are equipped for ROV and diving
work and for special installation work. The new-build
ROV support vessel, the Fugro Symphony, was delivered
in the second quarter, while an order for a new vessel
equipped with ROV and diving facilities for work in
Brazil was placed with a Brazilian yard in the fourth
quarter. The medium term charter of one ROV support
vessel in the Far East was not extended on the expiry
date.
G e o s c i e n c e d i v i s i o n
The charter of the 2-D seismic vessel Geo Arctic was
terminated halfway through the year, while in late 2011
Fugro informed the owners of the medium-sized seismic
vessels Geo Natuna and Seisquest that it did not intend to
continue the charters expiring in early 2012 on the current
conditions. The acquisition of Seabird’s Ocean Bottom
Nodes (OBN) activities at the year-end added the Seabird
Hugin vessel to the f leet (charter). Furthermore a charter
agreement for a 2-D seismic vessel was entered into.
S c h e d u l e d f l e e t e x p a n s i o n
Fugro has placed orders for six new build vessels to
become operational in the period 2012 through 2014 as
shown below. All vessels will be owned and are designed
to Fugro’s specifications. In addition to the listed vessels
F l e e t r e n e wa l / e x p a n s i o n
Name of the vessel Type of vesselexpected
delivery
Fugro Equator Survey Q1-2012
Fugro Brasilis Survey Q2-2012
Fugro Australis Survey Q4-2012
Fugro Voyager Geotechnical Q1-2013
Fugro Scout Geotechnical Q1-2013
New vessel Brazil ROV support Q1-2014
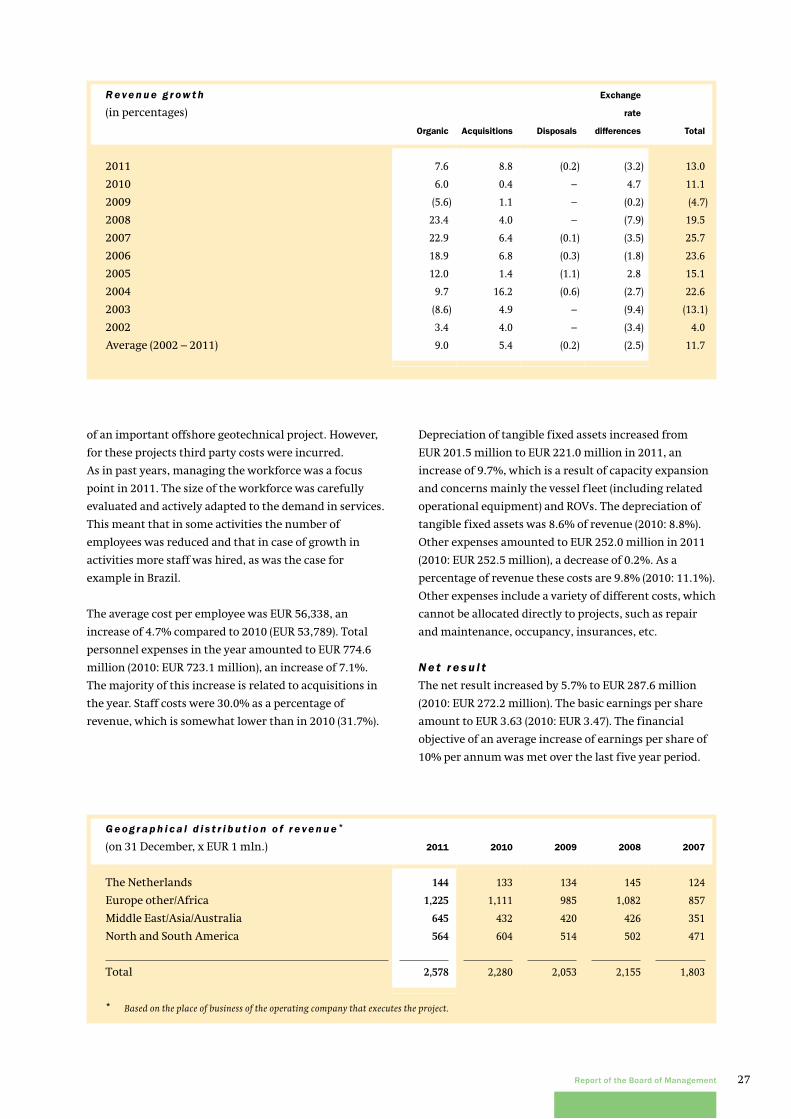
27Report of the Board of Management
Depreciation of tangible fixed assets increased from
EUR 201.5 million to EUR 221.0 million in 2011, an
increase of 9.7%, which is a result of capacity expansion
and concerns mainly the vessel f leet (including related
operational equipment) and ROVs. The depreciation of
tangible fixed assets was 8.6% of revenue (2010: 8.8%).
Other expenses amounted to EUR 252.0 million in 2011
(2010: EUR 252.5 million), a decrease of 0.2%. As a
percentage of revenue these costs are 9.8% (2010: 11.1%).
Other expenses include a variety of different costs, which
cannot be allocated directly to projects, such as repair
and maintenance, occupancy, insurances, etc.
N e t r e s u l t
The net result increased by 5.7% to EUR 287.6 million
(2010: EUR 272.2 million). The basic earnings per share
amount to EUR 3.63 (2010: EUR 3.47). The financial
objective of an average increase of earnings per share of
10% per annum was met over the last five year period.
of an important offshore geotechnical project. However,
for these projects third party costs were incurred.
As in past years, managing the workforce was a focus
point in 2011. The size of the workforce was carefully
evaluated and actively adapted to the demand in services.
This meant that in some activities the number of
employees was reduced and that in case of growth in
activities more staff was hired, as was the case for
example in Brazil.
The average cost per employee was EUR 56,338, an
increase of 4.7% compared to 2010 (EUR 53,789). Total
personnel expenses in the year amounted to EUR 774.6
million (2010: EUR 723.1 million), an increase of 7.1%.
The majority of this increase is related to acquisitions in
the year. Staff costs were 30.0% as a percentage of
revenue, which is somewhat lower than in 2010 (31.7%).
R e ve n u e g r ow t h
(in percentages)
Organic Acquisitions Disposals
exchange
rate
differences Total
2011 7.6 8.8 (0.2) (3.2) 13.0
2010 6.0 0.4 – 4.7 11.1
2009 (5.6) 1.1 – (0.2) (4.7)
2008 23.4 4.0 – (7.9) 19.5
2007 22.9 6.4 (0.1) (3.5) 25.7
2006 18.9 6.8 (0.3) (1.8) 23.6
2005 12.0 1.4 (1.1) 2.8 15.1
2004 9.7 16.2 (0.6) (2.7) 22.6
2003 (8.6) 4.9 – (9.4) (13.1)
2002 3.4 4.0 – (3.4) 4.0
Average (2002 – 2011) 9.0 5.4 (0.2) (2.5) 11.7
G e og r a p h i c a l d i s t r i b u t i o n o f r e ve n u e *
(on 31 December, x EUR 1 mln.) 2011 2010 2009 2008 2007
The Netherlands 144 133 134 145 124
Europe other/Africa 1,225 1,111 985 1,082 857
Middle East/Asia/Australia 645 432 420 426 351
North and South America 564 604 514 502 471
Total 2,578 2,280 2,053 2,155 1,803
* Based on the place of business of the operating company that executes the project.

28
The net result includes a change in the value of Electro
Magnetic GeoServices ASA (EMGS) of EUR 6 million
positive after tax which is caused by the increase of the
share price of EMGS. The net effect after tax in 2010 was
some EUR 16 million positive.
E B I T
The result from operating activities (EBIT) amounted to
EUR 349.3 million (2010: EUR 351.5 million), a decrease
of 0.6%. As in previous years the EBIT as a percentage of
revenue improved in the second half of 2011 compared
to the first half 2011. The EBIT 2011 was negatively
affected by the last minute cancellation of an important
offshore geotechnical project, the delay in the start of
some projects in Brazil as a result of late delivery of
vessel capacity by third parties, extended dry docking
and the costs of integrating the 2011 acquisitions.
E B I T DA
The earnings before interest, tax, depreciation and
amortisation amounted to EUR 581.0 million
(2010: EUR 561.1 million), an increase of 3.5%.
Fo r e i g n c u r r e n c y
In 2011, the average US dollar exchange rate decreased to
EUR 0.71 (2010: EUR 0.76), the average exchange rate of
the British pound decreased to EUR 1.15 (2010: EUR 1.17)
and the average exchange rate of the Norwegian kroner
increased to EUR 0.129 (2010: EUR 0.125). As a result of
f luctuations during the year, the net foreign exchange
effect in the profit and loss account in 2011 was positive
EUR 16.8 million (2010: negative EUR 5.1 million).
Exchange differences were caused by the variance in
exchange rates between the entry date of trade
receivables and the moment of receipt, the revaluation of
balance sheet positions and the realised exchange
differences on foreign currency transactions.
The foreign exchange effect was EUR 2.7 million positive
on the equity per 31 December 2011 (2010: positive
EUR 108.0 million). Amongst others as a result of further
optimising net investment hedges, the effect on equity
was limited. See also page 75 of the report under risk
management and page 159 of the financial statements
under currency risk.
C a s h f l ow
In 2011, the cash f low amounted to EUR 526.9 million
(2010: EUR 489.8 million), an increase of 7.6%. Cash f low
is defined as the profit for the period plus depreciation
and amortisation. The expected future cash f low will
enable the company to remain within the current
financing covenants and to finance the committed
investments. The cash f low per share equates to
EUR 6.65 (2010: EUR 6.25), an increase of 6.4%.
The financial growth target for the cash f low of, on
average, 10% per annum was achieved measured over
the last five years.
I n ve s t m e n t s
As indicated before, Fugro will continue to invest in its
vessel f leet and equipment in the coming years to
support future growth. This will predominantly be done
in the Geotechnical and Survey divisions. Here, older
vessels will be replaced and capacity will be added if
R e ve n u e d i s t r i b u t i o n p e r d i v i s i o n
(on 31 December, x EUR 1 mln.) 2011 2010 2009 2008 2007
Geotechnical 670 664 536 541 443
Survey 1,191 1,009 956 960 852
Geoscience 717 607 561 654 508
Total 2,578 2,280 2,053 2,155 1,803
E x c h a n ge r a t e s
(in EUR)2011
year-end2011
Average2010
year-end2010
Average2009
year-end2009
Average
US dollar 0.77 0.71 0.75 0.76 0.69 0.72
British pound 1.20 1.15 1.16 1.17 1.13 1.13
Norwegian kroner 0.129 0.129 0.128 0.125 0.121 0.115

29Report of the Board of Management
market conditions allow. In particular deep water market
opportunities will be considered in this decision-making.
The 2011 investments can be specified as follows
(x EUR million):
Maintenance capex 112.0
Capacity expansion 208.9
Total investments 320.9
Movement in assets under construction
(mainly vessels and ROVs) (43.1)
Subtotal 277.8
Assets from acquisitions 125.8
Total 403.6
Each year, Fugro is investing in order to maintain the
existing capacity. In 2011, the maintenance capex
amounted to EUR 112.0 million (2010: EUR 81.2 million).
Replacement investments in 2011 were limited to those
which were unavoidable. The increase in maintenance
capex is among others caused by higher dry docking
costs in 2011.
In the table on page 30, an overview of the annual
investments for the period 2010-2014 is given, including
an estimate for the years 2012-2014. The major part of
the capacity expansion in 2011 concerns ROVs and the
vessels Fugro Symphony and Fugro Galaxy.
The investments in 2012 include the vessels Fugro
Australis, Fugro Equator and Fugro Brasilis. Investments
in 2013 and 2014 are, as yet, not identified apart from
the delivery of the Fugro Voyager, Fugro Scout and the
recently ordered ROV vessel in Brazil.
N e t f i n a n c e c o s t s
The net finance costs amounted to EUR 13.4 million in
2011 (2010: gain EUR 6.2 million). The analysis is as
follows (x EUR million):
2011 2010
Change in fair value financial
assets (3.9) (22.3)
Net interest charge 33.0 12.1
Foreign currency effects (16.8) 5.1
Other 1.1 (1.1)
Total costs (gain) 13.4 (6.2)
The change in fair value of financial assets mainly relates
to our shareholding in Electro Magnetic GeoServices ASA
(EMGS).
The net interest charge increased in 2011 mainly because
of a higher use of bank facilities as well as the higher
interest. The interest cover (EBIT/net interest charge) is
11 (2010: 29). This is a high coverage, substantially above
the financial objective of more than 5.
0
90
180
270
360
450
20112010200920082007
R e s u l t s f r o m o p e r a t i n g a c -
t i v i t i e s ( E B I T ) (x EUR 1 mln.)
0
60
120
180
240
300
20112010200920082007
N e t r e s u l t
(x EUR 1 mln.)
The Pelatuk, one of the Fugro-Cesco vessels on anchor in the Far East1976

30
1.7 (2010: 1.3). Gearing amounted to 73% (2010: 54%).
The higher gearing is largely caused by higher financing,
required for the investment to build up the seismic data
library and the acquisitions completed in 2011. It is
expected that the gearing will decrease in the course of
2012. The financial ratios underline Fugro’s healthy
balance sheet.
Working capital amounted to EUR 624.0 million at the
end of 2011 (2010: EUR 253.2 million). The change can be
analysed as follows:
(x EUR 1 mln)31 December
201131 December
2010 Change
Inventories 364.9 219.0 145.9
Trade receivables 494.1 444.1 50.0
Trade and other
payables (512.7) (474.2) (38.5)
Net cash and cash
equivalents 2.6 (218.9) 221.5
Other 275.1 283.2 (8.1)
624.0 253.2 370.8
The higher ‘inventories’ value is mainly caused by
building up the 3-D multi client seismic library.
Fugro annually invests in new seismic and geological
data at its own risk and expense (multi client), which is
recognised on the balance sheet under ‘inventories’.
Such a data library is normal for companies that carry
out this type of service. The data library contains
valuable information that is offered and sold to multiple
interested parties and which can retain its sales and
profit potential for several years.
Following increasing interest for multi client 3-D seismic
projects, Fugro started late 2009 to use part of the newly
available vessel capacity to build up a marine 3-D library
in addition to the 2-D library.
Ta xe s
In 2011, income tax expense amounted to EUR 45.3
million (2010: EUR 78.5 million). The effective tax rate in
2011 amounted to 13.3% (2010: 21.9%). The change in
geographical spread of taxable profits in 2011 compared
to 2010 resulted in a reduction of the average domestic
tax rate applicable. Furthermore, in a number of tax
jurisdictions previously unrecognised tax losses were
recognised and also some previously unrecognised tax
losses were utilised in 2011. In 2011 a lot of emphasis was
put on reducing tax expenses, for example by using the
recently introduced innovation box opportunity in the
Netherlands.
In the UK Fugro obtained the status of ‘low risk’ from
the tax authorities based on high transparency.
In the Netherlands Fugro is in discussion with the tax
authorities regarding entering into the ‘Horizontal
monitoring’ covenant.
It is expected that the future tax charge will be around
20%.
I n t a n g i b l e a s s e t s ( go o d w i l l )
In 2011, the addition to goodwill resulting from acquisi-
tions amounted to EUR 171.6 million (2010: EUR 44.1
million). The addition is mainly a result of nine
acquisitions in 2011. There was a positive foreign
exchange effect in 2011 of EUR 7.4 million (2010: positive
EUR 22.8 million) on the balance sheet for the goodwill.
Goodwill is not amortised, but is tested at least once a
year for impairment. In 2011, as in 2010, this did not
result in adjustments.
B a l a n c e s h e e t r a t i o s
Solvency at the end of 2011 was 42.9% (ultimo 2010:
48.8%). The solvency ratio objective is to be at least
331/3%. At the end of 2011 the current ratio was
( E x p e c t e d ) i n ve s t m e n t s , e x c l u d i n g a s s e t s
f r o m a c q u i s i t i o n s (x EUR 1 mln) 2010 2011 2012* 2013* 2014*
Maintenance capex 81.2 112.0 110.0 120.0 120.0
Capacity expansion 362.6 208.9 175.0 150.0 100.0
Total investments 443.8 320.9 285.0 270.0 220.0
Movement in assets under construction (44.8) (43.2) (50.0) (40.0) –
Net cash 399.0 277.8 235.0 230.0 220.0
* Estimate.
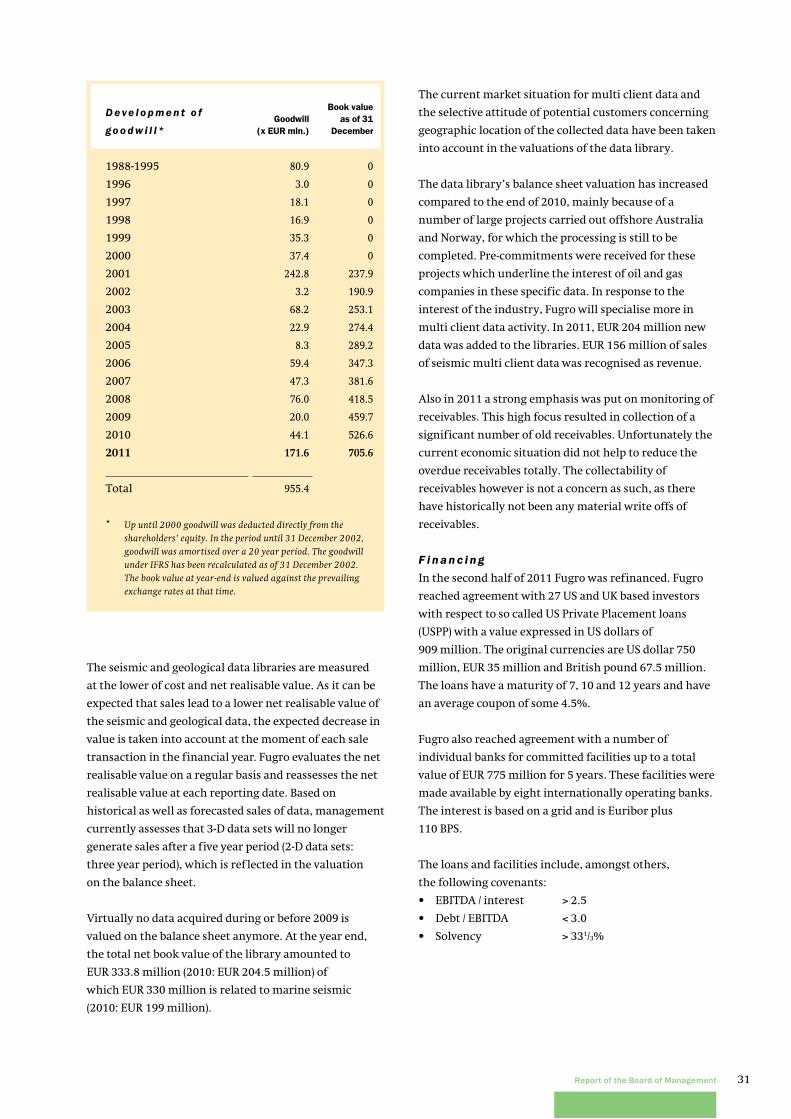
31Report of the Board of Management
The current market situation for multi client data and
the selective attitude of potential customers concerning
geographic location of the collected data have been taken
into account in the valuations of the data library.
The data library’s balance sheet valuation has increased
compared to the end of 2010, mainly because of a
number of large projects carried out offshore Australia
and Norway, for which the processing is still to be
completed. Pre-commitments were received for these
projects which underline the interest of oil and gas
companies in these specific data. In response to the
interest of the industry, Fugro will specialise more in
multi client data activity. In 2011, EUR 204 million new
data was added to the libraries. EUR 156 million of sales
of seismic multi client data was recognised as revenue.
Also in 2011 a strong emphasis was put on monitoring of
receivables. This high focus resulted in collection of a
significant number of old receivables. Unfortunately the
current economic situation did not help to reduce the
overdue receivables totally. The collectability of
receivables however is not a concern as such, as there
have historically not been any material write offs of
receivables.
F i n a n c i n g
In the second half of 2011 Fugro was refinanced. Fugro
reached agreement with 27 US and UK based investors
with respect to so called US Private Placement loans
(USPP) with a value expressed in US dollars of
909 million. The original currencies are US dollar 750
million, EUR 35 million and British pound 67.5 million.
The loans have a maturity of 7, 10 and 12 years and have
an average coupon of some 4.5%.
Fugro also reached agreement with a number of
individual banks for committed facilities up to a total
value of EUR 775 million for 5 years. These facilities were
made available by eight internationally operating banks.
The interest is based on a grid and is Euribor plus
110 BPS.
The loans and facilities include, amongst others,
the following covenants:
• EBITDA/interest >2.5
• Debt/EBITDA <3.0
• Solvency >331/3%
The seismic and geological data libraries are measured
at the lower of cost and net realisable value. As it can be
expected that sales lead to a lower net realisable value of
the seismic and geological data, the expected decrease in
value is taken into account at the moment of each sale
transaction in the financial year. Fugro evaluates the net
realisable value on a regular basis and reassesses the net
realisable value at each reporting date. Based on
historical as well as forecasted sales of data, management
currently assesses that 3-D data sets will no longer
generate sales after a five year period (2-D data sets:
three year period), which is reflected in the valuation
on the balance sheet.
Virtually no data acquired during or before 2009 is
valued on the balance sheet anymore. At the year end,
the total net book value of the library amounted to
EUR 333.8 million (2010: EUR 204.5 million) of
which EUR 330 million is related to marine seismic
(2010: EUR 199 million).
D e ve l o p m e n t o f
go o d w i l l *Goodwill
(x euR mln.)
Book value as of 31
December
1988-1995 80.9 0
1996 3.0 0
1997 18.1 0
1998 16.9 0
1999 35.3 0
2000 37.4 0
2001 242.8 237.9
2002 3.2 190.9
2003 68.2 253.1
2004 22.9 274.4
2005 8.3 289.2
2006 59.4 347.3
2007 47.3 381.6
2008 76.0 418.5
2009 20.0 459.7
2010 44.1 526.6
2011 171.6 705.6
Total 955.4
* Up until 2000 goodwill was deducted directly from the shareholders’ equity. In the period until 31 December 2002, goodwill was amortised over a 20 year period. The goodwill under IFRS has been recalculated as of 31 December 2002. The book value at year-end is valued against the prevailing exchange rates at that time.

32
T h e o i l a n d ga s m a r ke t
The fundamentals for the oil and gas market are healthy
with the price of a barrel of oil averaging around USD 100
(WTI) during 2011 and planned investments of USD 600
billion in 2012. Most of the increase in investments
outside North America will take place in Latin America,
Africa, Europe, Russia and the Middle East (12 to 24%
increase compared to 2011). More than 30% will be spent
by the eight largest international and national oil
companies. Fugro has long term customer relationships
and regional presence where investments are planned.
According to these external reports and industry leading
oil companies, global investments in oil and gas supply
infrastructure of USD 20 trillion are required over the
next 20-25 years, which will provide a good basis for the
future for Fugro in this segment.
Fugro is involved throughout the life cycle of oil and
gas fields. This cycle lasts for several decades starting
with the search for new fields and continuing with
investigations and surveys related to the design and
construction of the facilities required to bring new fields
into production. During the further life of the field
inspection, repair and maintenance of subsea facilities
and improving production are activities that are required
on a regular basis, with decommissioning as the final
activity. Fugro is well positioned to benefit from
increases in investments by oil and gas companies
during the course of the field life cycle.
Many of the offshore exploration and development
activities, especially those related to deepwater projects,
take place in the Gulf of Mexico, West Africa and Brazil.
This activity will increase as most of the so called ‘easy
oil’ has been found. Frontier areas that are developing
are in the Arctic and East Africa. Other regions that
continue to be active are the Middle East, the northern
part of the North Sea and many parts of Asia.
■ D I V I D E N D P RO P O S A L
It is proposed that the dividend for 2011 be maintained
at EUR 1.50 per share (2010: EUR 1.50), to be paid at the
option of the shareholder:
• incash,or
• inshares
In case no choice is made, the dividend will be paid in
shares. The proposed dividend equates to a pay-out
percentage of 41.3% of the net result.
■ M A R K E T D E V E L O P M E N T S A N D T R E N D S
Tr e n d s
In 2011 the world was affected by natural catastrophes,
like the Fukushima accident in Japan, political unrest in
North Africa and the Middle East, the economic
uncertainties in Europe and the USA, pressure on the
European Union and the Euro, and an ongoing slow
recovery of the activity in the Gulf of Mexico after the
Macondo incident. Although some of these issues
are easing entering into 2012, other issues are developing
such as continued unrest in Syria, the potential Iranian
response to international pressure on their nuclear
program and a lingering European crisis leading to
continued uncertainty in the market. The year 2012 will
continue to be a year with uncertainty with regard to the
recovery of the world economy, the strength of the
financial sector and possibly the refinancing of
government debt. In 2011 the effects on Fugro were
limited thanks to the strong financial position and our
strategy to focus on providing a broad range of services
across the value chain of our customers, and creating
client-, regional-, and market diversity, all healthy
differentiators for Fugro.
CPT truck at the Golden Gate Bridge, San Francisco1998

33Report of the Board of Management
With a focus on the larger infrastructure projects and
by early positioning with the key players in the
development of these projects, Fugro has been able to
mitigate the impact of the slowdown in activity. In some
countries, like the USA, stimulus programs are still
generating projects in which Fugro is participating,
like areal surveys and road maintenance projects.
M i n i n g
In 2011 the mining market was driven by an increase in
demand for mineral commodities linked to
infrastructure and economic development. Overall this
caused an increased need for Fugro’s services that
support the exploration and development of mineral
resources. With lower demand from the West, demand
in Asia is driving exploration. Copper and iron ore are in
demand as a result of construction and infrastructure
expansion. Fugro also expects that exploration for
precious metals like gold will continue to be buoyant.
Junior exploration companies are still under pressure as
potential sources of funding from the equity markets are
limited. Given the current situation in the financial
market, this trend will likely not reverse in 2012.
Mining related activities accounted for 3% of Fugro’s
revenue in 2011.
O t h e r m a r ke t s e g m e n t s
Fugro not only supplies services to the aforementioned
markets but also to a number of other niche markets.
These services include the sale of positioning signals,
route surveys for offshore telecommunication cables,
and airborne mapping using laser and radar technology
for governmental authorities and other public bodies.
Approximately 3% of annual revenue is generated by
these segments. In general, these activities are more
region-specific and related to specific economic activity.
The Macondo oil spill in the Gulf of Mexico delayed also
in 2011 developments in that area. With the recently
issued permits and the upcoming June lease round for
the central Gulf of Mexico it looks like activity will
improve.
The US shale gas market is stabilising, with drilling
activity contracting, as a result of the current depressed
gas prices (USD 2.5 per TCF). Exploration and production
of unconventional gas fields in Europe, Far East and
Australia is developing, but the impact on Fugro’s
business will not be too significant in 2012.
The increasing demand for gas, large scale expansion of
LNG facilities in the Middle East, Australia and Nigeria
will require investments in large infrastructure projects,
like pipelines, terminals, jetties, liquefaction facilities
and liquid gas storage. These projects require
bathymetric and terrestrial survey, near shore, on- and
offshore geotechnical soil investigation, geohazard
analysis and foundation design as well as techniques for
planning the optimum pipeline route, across land or on
the sea bed; all core services that Fugro can supply.
External publications indicate that oil companies base
their economic viability calculations for most of their
larger projects on a price of oil well below the current
price level of around USD 100 per barrel (WTI).
Considering the long duration from start to finish of
these kinds of projects and the current trend in the oil
price, Fugro anticipates that its services will continue to
be in demand in 2012 and the years beyond. About 75%
of Fugro’s activities is related to the oil and gas industry.
T h e m a r ke t fo r i n f r a s t r u c t u r e p r o j e c t s
Infrastructure and construction related activities
accounted for approximately 19% of Fugro’s revenues
in 2011. Fugro undertakes large contracts associated
with land reclamation, (LNG) harbour expansions, levees,
tunnels, bridges, roads, pipelines and major building and
construction works in for instance Hong Kong, Panama,
Turkey, California and Western Australia. The company
has strengthened its market position by supplying
solutions, that integrate data collection and earthscience
consulting, to our clients. This fulfils the customer’s
preference for contracting these services to a single,
independent global service provider.

34
■ B A C K L O G
At the beginning of 2012 the backlog of work to be
carried out during the year amounted to EUR 1,692.6
million (beginning of 2011: EUR 1,553.2 million).
The proportion of definite orders is 55% (beginning
2011: 58%). The backlog calculation is based on year-end
exchange rates in EUR and is 9.0% higher than at the
beginning of 2011. Of the increase in backlog, 1.6% is
related to foreign currency effects. The backlog has
increased as a result of somewhat improving market
circumstances and through acquisitions. Delays of new
projects, last minute awards and lower prices still have
an effect on the volume of the backlog. This is, amongst
others, caused by improved availability of service
capacity since the start of the economic downturn.
In the past years the order backlog of work to be carried
out typically equalled about eight months revenue.
■ P O S T B A L A N C E S H E E T DAT E E V E N T S
On 1 January 2012, Mr. A. Steenbakker took over the
chairmanship of the Board of Management from
Mr. K.S. Wester, who will retire in June 2012. Mr. Wester
was the President and CEO of Fugro as of October 2005.
This transition of the chairmanship was earlier
announced in May 2011. See for further information on
the composition of the Board of Management page 22.
On 8 March 2012 Fugro has entered into an option
agreement with the independent foundation Stichting
Beschermingspreferente aandelen Fugro (‘Foundation
protective preference shares Fugro’), pursuant to which
the Foundation was granted the right to acquire
cumulative preference protective shares in Fugro’s share
capital. By entering into the option agreement, the
Foundation is in a position to achieve its object – i.e.
safeguarding Fugro and its businesses – autonomously,
independently and effectively should the occasion occur.
See for further information page 83.
B a c k l og a t s t a r t o f t h e y e a r
( f o r t h e n e x t t we l ve m o n t h s )
(x EUR 1 mln.) 2012 2011 2010 2009 2008
Geotechnical
Onshore Geotechnical 257.3 230.4 191.9 168.7 152.7
Offshore Geotechnical 218.5 205.7 199.3 174.6 142.6
475.8 436.1 391.2 343.3 295.3
Survey
Offshore Survey 439.6 431.2 388.3 436.0 354.7
Subsea Services 294.1 255.9 244.5 273.0 207.5
Geospatial Services 74.7 96.2 83.6 95.8 85.9
808.4 783.3 716.4 804.8 648.1
Geoscience
Seismic Services 303.3 222.8 164.1 356.8 399.6
Geophysical and Geological Services
including Information Services 105.1 111.0 92.3 95.5 115.5
408.4 333.8 256.4 452.3 515.1
Total 1,692.6 1,553.2 1,364.0 1,600.4 1,458.5
Backlog comprises revenue for work to be carried out in the coming twelve months and includes uncompleted
parts of on-going projects and contracts awarded but not yet started (approximately 55% of the total) and projects
that have been identified and are highly likely to be awarded (approximately 45% of the total).

35Report of the Board of Management
■ O U T L O O K
The year 2012 is developing positively for Fugro, despite
the current uncertainties. A significant part of the
revenue is generated from the oil and gas industry. With
an estimated 2012 investment of close to USD 600 billion,
an increase of some 10% from the 2011 investments, the
oil and gas industry is planning for the highest level of
investment in history, according to external reports.
The stable oil price of around USD 100 per barrel (WTI) is
above the threshold that drives investments in the
exploration and development in more frontier areas,
including deeper water. With a well balanced portfolio of
services across the life cycle of oil and gas fields, Fugro
will benefit from the investment the industry is
projecting in the coming years.
Fugro’s activities in the infrastructure and construction,
water management and renewable energy markets are,
amongst others, dependent on the world wide economic
situation and how the government deficits will impact
public and private investment. Europe’s efforts to
continue to invest in offshore wind farms, an important
market for Fugro, will continue with many EU member
states adopting policies to change the energy mix over
the next 20-30 years to lessen dependence on fossil fuels.
Asia and the United States seem to be following this
trend. Fugro’s international footprint, the efforts to
focus on the larger, more complex projects, bundling of
services and maintaining leadership in data acquisition
and consulting have created a robust competitive
position in these markets for Fugro.
The recovery of the marine seismic data acquisition
market is progressing with improved pricing. Vessel
activity should further increase in the Gulf of Mexico
with the recently issued permits and the upcoming June
lease round for the central part of the Gulf of Mexico.
With increasing activity in areas like the North Sea,
Barents Sea, Angola, the Arctic and Australia, a
re-balancing of the global seismic f leet capacity is
expected. This will lead to higher utilisation and create
room for further price recovery in this market sector.
Fugro will continue to balance the size and f lexibility
(owned versus charter) of its seismic f leet with market
circumstances and will continue to enhance its multi
client library following the increasing interest from
clients for multi client data.
The International Energy Agency indicates that in the
next decennia the world crude oil demand will remain
steady at about 80 million barrels per day (mb/d).
The supply of crude oil is impacted by the increasing
depletion rates of existing oil fields. In 2020, current
production capacity will have declined by an estimated
25% due to depletion. Meeting the growing demand for
energy in the world will mostly come from an increased
supply of natural gas with an estimated compound
annual growth of 1.7%. These developments will require
the industry to focus on maximising production from
existing oil and gas fields and the exploration and
development of new fields. The portfolio of services
across the Geoscience division, including the recent
acquisition of Ocean Bottom Nodes business, provides
unique solutions to support clients with these challenges.
The investments the oil and gas industry is making in
subsea infrastructure, offshore production facilities and
pipelines, will lead to a growing demand for subsea
services, like inspection, repair and maintenance (IRM) of
oil and gas installations. Fugro’s survey and subsea
business lines provide a global foot print that offers
vessels, equipment like ROVs and AUVs and highly
experienced staff to all regions in which our clients
operate. With an investment boom in the fabrication of
offshore facilities starting in 2010, the demand for
offshore installation support services will increase
during 2012 and onwards.
Enhancing oil- and gas production will require
investments in large oil and gas infrastructure projects,
like on- and offshore pipelines, terminals, jetties and
storage and processing facilities. These projects require
services like bathymetric and terrestrial survey, near-,
on- and offshore geotechnical soil investigation,
geohazard analyses and foundation design as well as
Skandi Carla commenced services2000

36
B o a r d o f M a n a ge m e n t d e c l a r a t i o n p u r s u a n t
t o s e c t i o n 5 : 2 5 c o f t h e F i n a n c i a l M a r ke t s
S u p e r v i s i o n A c t i n t h e N e t h e r l a n d s
To the best of the Board of Management’s knowledge the
financial statements (pages 90 to 179) give a true and fair
view of the assets, liabilities, financial position and profit
or loss of Fugro N.V. and the companies included jointly
in the consolidation, and the annual report gives a true
and fair view of the situation on the balance sheet date
and the business development during the financial year
of Fugro N.V. and the Group companies for which the
financial information is recognised in its financial
statements. The principal risks and uncertainties with
which Fugro N.V. is confronted, are described in this
annual report.
Leidschendam, 8 March 2012
K.S. Wester, President and CEO until 31 December 2011
A. Steenbakker, Chairman Board of Management
as of 1 January 2012
P. van Riel, Vice-chairman / Director Geoscience division
A. Jonkman, Chief Financial Officer
W.S. Rainey, Director Geotechnical division
J. Rüegg, Director Survey division
techniques for planning the optimum pipeline routes,
across land or on the sea bottom. The geographic spread
of the Survey and Geotechnical divisions supports the
client at the front end of the development, up to
involvement in the detailed design, working with the
engineering and construction contractors locally.
This provides the client with the ability to contract all
earth related services to one company, a competitive
advantage for Fugro.
Mineral exploration and development activity is linked
to economic growth and is relatively sensitive to supply
or demand swings in any given commodity. In spite of
the economic challenges in the Western world, mineral
prices in general were at historically high levels over the
past year thanks to Far East demand and it is expected
that this will continue to drive exploration. Fugro’s
techniques are used in the exploration of all of these
minerals. The ongoing demand in mineral exploration
will benefit the land and airborne geophysical businesses
which are major suppliers of these services to the world’s
mining companies.
In the oil and gas market we see a trend of a reducing
talent pool as a result of retirement of experienced
engineers and a decrease in new graduates entering the
market. As a result of the increased requirements by the
national oil companies to maximise local content and the
scarcity of experienced local staff, attracting, training
and retaining local staff is becoming more and more
important. Fugro’s corporate social responsibility focus
on the health and safety, education and development of
our employees and maximising local content in growth
areas like Brazil and Angola will contribute to retaining
key talent.
Fugro is expecting a strengthening of activity in most
market sectors in which it operates, mainly towards the
second half of 2012. This is supported by current tender
activity and an improving backlog. Fugro has been able
to prolong its strong financial position in 2011 as a result
of the secured long term financing through a USPP (USD
equivalent 909 million) and committed bank facilities of
EUR 775 million. This provides sufficient financial
resources for future investment opportunities to
continue the expansion and broadening of activities both
organically and through acquisitions.
As in previous years, we will first publish a quantitative
outlook for 2012 in August, at the time of the publication
of the 2012 half-yearly report.

37Report of the Board of Management
• Africa,Asia–Fugroundertookseverallarge3-Dcontractseismicacquisitionprojects,eachinexcessofUSD20
million, around the world, among others in Tanzania, Kenya, Mozambique, Nigeria, Brunei, India, Sierra Leone,
Togo and Indonesia. These projects were undertaken for national oil companies, international majors, large
independents and an industrial client.
• Australia–FugrowasawardedtwomajorcontractsaspartofWoodside’sBrowseLNGprojectnearJames
Price Point, north of Broome in Western Australia. Fugro’s work scope included the onshore geotechnical
investigation for the proposed LNG facility and performing the nearshore investigation for the port and loading
facilities for the proposed development. The total value of the contracts was in excess of AUD 50 million.
• Australia,Norway,RepublicofSeychelles–FugrocompletedtheEendracht3-Dmulticlientsurveyin
Australia. The project totals 8,639km². The data was acquired and processed by Fugro.
Fugro also completed a 5,300km² 3-D in the Barents Sea just west of the recent Skrugard and Havis discoveries
made by Statoil. The survey was designed based on Fugro’s extensive 2-D database acquired from 2006 to 2011.
Together with others, these projects are part of Fugro’s quickly developing 3-D multi client library.
In addition to the expansion into the 3-D market, Fugro continued to acquire 2-D data in new areas and
completed a 17,000 linear km 2-D survey near the Seychelles.
• Brazil–FugroInSituwasawardedthefirstnearshoresiteinvestigationcontractusingajack-upbargeinBrazil
by Petrobras. The contract is a soil investigation campaign for a key LNG project in the Northeastern Region of
Brazil in ‘Todos os Santos’ Bay, Salvador. The contract has a value for Fugro of some USD 4 million.
• Canada–FugroGeoSurveysandFugroPelagossecuredathree-yearcontracttoprovideairbornelidar
bathymetry survey services to Canadian Hydrographic Service (CHS) in support of their annual charting and
mapping effort in the Canadian Arctic region. CHS plan to utilise the reconnaissance survey data provided by
Fugro to plan for more efficient and cost effective surveys, thereby improving the throughput of the Arctic
Charting and Mapping effort in an area with a very limited operational window.
• Congo–FugroGeotechniqueSA,FugroSouthAfrica,FugroNigeriaandFugroFrancewerejointlyawarded
a contract by Australian mining company, Elemental Minerals Limited, to provide a bathymetric survey,
nearshore geophysical preliminary studies, onshore soil investigations, laboratory testing and a geological
report for the design of a plant (facilities and mining buildings), rail corridor, yard and port facilities near Pointe
Noire, Congo.
• Egypt–FugroSubseaServicesLtdwasawardedacontracttoprovidevessel,ROVandsubseaintervention
services, by Technip on their Burullus West Delta Deep Phase VIIIa Project. The project was carried out from
the vessel Fugro Saltire and had a value of approximately USD 14 million.
• India–FugroconductedanairbornegeophysicalsurveyfortheAtomicMineralsDirectorateforExploration
and Research of the Department of Atomic Energy, Government of India, to support their objectives of
geological mapping and exploration. This project comprised 77,000 line-km of airborne surveying using
Fugro’s helicopter-borne electromagnetic system in the Indian States of Karnataka, Madhya Pradesh, and
Rajasthan. The project had a value of USD 11 million.
■ I M P O R TA N T A N D I N T E R E S T I N G C O N T R A C T S

38
• Malaysia–Fugro-TSMwascontractedtoprovidetheirDP2constructionsupportvessel,theHavilaHarmonyto
support drilling operations at Shell Sarawak’s Gumust Project. The Harmony’s primary task was the
installation 14 subsea trees in up to 1,200m of water. The success of the Shell campaign during 2011 led to
additional work with Murphy Oil in Malaysia, where two subsea trees have been installed in 1,300m of water
using the same field proven technique. The total contract value was approximately USD 40 million.
• MediterraneanSea–InDecember2010FugrowasawardedacontractwithIGIPoseidontoconductadetailed
marine survey for a deepwater gas transmission pipeline. The pipeline linking Greece and Italy will form part
of a larger proposed pipeline bringing gas from the Caspian region to Europe. Fieldwork for the contract was
worth approximately EUR 10 million.
• Mexico–Fugrowasawardedtwomajorcontractsfortheexecutionofoffshoregeophysicalandgeotechnical
investigations for the development of new fields in the North and Southwest Offshore Regions of the Gulf
of Mexico for PEMEX. Fugro’s scope of work included offshore geophysical surveys and geotechnical
investigations for 37 proposed platform sites, more than 260km of pipelines and 6 jack-up placement locations,
an AUV survey and reinterpretation of 3-D seismic data. The value of the contracts was in excess of USD 40
million.
• MiddleEast&India–FugrohasextendeditslongtermframeworkagreementwithMcDermottforthe
provision of positioning, survey, ROV and geotechnical services for another three years until the end of 2014.
This contract extension continues a long and successful relationship which dates back more than 30 years and
has an approximate value of USD 20-25 million per year.
• Nigeria–FugroSubseaServicescontinuestodevelopitsLifeofFieldSupportoperationsoffshoreNigeria,
working for Mobil Producing Nigeria Unlimited, Shell Nigeria Exploration and Production, and the Shell
Petroleum Development Company. This includes a comprehensive range of ROV, air-diving, inspection and
intervention.
• NorthSea–FugroGeoConsultingLtdenteredintoafive-yearframeworkagreementwithSMartWindand
Mainstream Renewable to carry out detailed geotechnical investigations at three offshore wind projects in
Europe. The agreement is estimated to be worth approximately EUR 70 million.
• PapuaNewGuinea–FugroTSMsuccessfullycompletedaseabeddrillingprogramforNautilusMineralson
Solwara one in the Bismarck Sea. The program, which had a value of USD 30 million, included seafloor based
drilling. Operations were completed in water depths exceeding 2,000 metres utilising remote operated vehicles.
• Russia–FugrowasawardedtwomajorcontractsaspartofPhaseIoftheintegrateddevelopmentofthe
Shtokman gas-condensate field in the central part of the Russian sector of the Barents Sea. Fugro’s work scope
included the offshore geotechnical investigation of the field subsea structures, export pipeline and cable route
and performing the nearshore survey in Opasova Bay for the pipeline landfall area. The value of the contracts
to Fugro was approximately EUR 22 million.
• UnitedStates–FugroRoadwarehasrecentlybeenawardedanextensiontocontinuesurveyingCaliforniaroads
for a total contract value exceeding USD 20 million.
• UnitedStates–FugrolaunchedRoqSCAN,aportablewellsitesystemjointlydevelopedbyFugroandCarlZeiss,
that analyses wellbore cuttings to provide highly quantitative mineralogical datasets within one hour.
In 2011 this tool went into testing in the Wolfcamp shale play in the Permian Basin in Texas.

39Report of the Board of Management
■ R E C E N T LY A w A R D E D I M P O R TA N T A N D I N T E R E S T I N G C O N T R A C T S
• Angola–Fugrohasbeenawardedathree-yearsurveyandpositioningcontractfromOceaneeringtosupport
Oceaneering’s BP Angola Field Support Vessels Services project in Angola. Fugro will perform all surface and
subsea positioning tasks, including inspection surveys.
• Australia–FugroTSMhasbeenawardedtheGreaterWesternFlank(GWF)Phase1ProjectSubseaInstallation
Contract from Woodside Energy Limited. Contract value is in excess of AUD 100 million.
• Australia–Fugrohasbeenawardedalarge3-DseismicsurveyoffshoreNorthwestAustralia.Theseismicdata
are being acquired by the vessel Geo Atlantic.
• India–FugroSingaporehasbeenawardedamajoroffshoregeotechnicalinvestigationcontractbyReliance
Industries Ltd on the East Coast of India. Fugro will perform geotechnical investigations, laboratory testing and
foundation design studies to allow detailed design of subsea infrastructure for the Dhirubhai Satellite Fields
located in water depths of up to 1,850 meter. Fugro will be deploying one of their deepwater geotechnical
vessels. The value of the contract is approximately USD 8 million. This project is the first phase of the project
that was cancelled early in 2011.
• Qatar–FugroGEOShasbeenawardedafive-yearcontractwhichprovidesQatarShellwithsupportforaseabed
water temperature monitoring system. The contract will ensure round-the-clock support and maintenance of
the metocean monitoring system, which is part of the Pearl GTL (gas-to-liquids) project in Ras Laffan, Qatar.
• EastAfrica,NorthSea–FugroGeoteamhasrecentlysignedlettersofawardwith4majorinternationaloil
companies for 3-D and 4-D seismic surveys in East Africa and the North Sea for a total amount of close to
USD 120 million. The surveys will be undertaken during the summer months using Fugro Geoteam’s industry
leading C-Class seismic vessels.
FLI-MAP embankment survey, Kinderdijk, the Netherlands2002

40
Key f i g u r e s G e o t e c h n i c a l (amounts x EUR 1 mln.) 2011 2010 2009 2008 2007
Revenue 670 664 536 541 443
Results from operating activities (EBIT) 98 104 94 95 78
Average invested capital (incl. acquisitions) 519 447 358 254 173
Depreciation of tangible fixed assets 40 35 29 24 19
Results from operating activities (eBIT)
as a % of revenue 15 16 18 18 18
■ G E OT E C H N I C A L D I V I S I O N
The Geotechnical division’s revenues marginally
increased to EUR 670 million (2010: EUR 664 million).
The offshore business line generated EUR 313 million
(2010: EUR 308 million) and the onshore activities
contributed EUR 357 million (2010: 356 million). Results
from operating activities (EBIT) were EUR 98 million
(2010: EUR 104 million) corresponding to an EBIT margin
of 15% (2010: 16%).
The start to the year was slow due to a number of one-off
issues like the cancellation of a large offshore contract in
India, accelerated dry-docking of several vessels in the
first quarter, reduced government funding in the USA
and Europe and the political unrest in North Africa and
the Middle East. The revenue voids created by the project
cancellation and vessel delays due to drydocking were
overcome; however, the costs associated with rearranging
the respective work schedules contributed to a lower
EBIT.
The offshore geotechnical revenues were consistent with
last year in the global deepwater activities and increased
in the specialised geoconsulting services. Further growth
of windfarm and renewables projects were achieved.
The larger deepwater projects in West Africa, Brazil, Gulf
of Mexico and Indonesia, have been driven by the need
for the international oil companies to locate and develop
new, larger reserves. The stable price of oil provided a
comfort zone for continued investments by oil and gas
clients. Only the shallow water Gulf of Mexico and the
South East Asia regions were weak, related to the low gas
price in the USA, the fallout from Macondo and the lower
volume of offshore oil and gas activity in the Asia Pacific
region. The overcapacity in the Southeast Asia market
provided an opportunity to acquire Bluestone Offshore
Pte Ltd (Singapore), a specialist geotechnical company in
South East Asia and Australia, who operated a deepwater
geotechnical vessel in the region. Since the acquisition
the vessel has been demobilised and returned to the
owner.
The renewable (windfarm) activity for 2011 continued to
increase in Europe, in countries like Germany, UK and
the Netherlands with further geographical expansion in
France and surrounding areas. The political commitment
by the European Commission and associated subsidies
will continue to drive this market. The large volume of
windfarm work and the location of the projects in
shallow water have enticed competitors that would not
typically expand into the deeper water offshore market.
The increase in the number of competitors has resulted
in some pricing pressure on this sector. The long term
and phased developments have resulted in multi-year
contracts for the site surveys and engineering services
in a number of these projects.
The onshore geotechnical revenues showed a positive
development over the year in the face of the poor
economic situation in many European countries and the
United States and the effects of political unrest and
related uncertainty for building and construction
activities in some parts of the Middle East. Conversely,
there was a strong performance in the Asia Pacific region
and in Central and South America which were not so
much affected by the global economic situation. In
Africa, the operation in Nigeria benefited from a further
political stabilisation in the Niger Delta and a stable oil
price. In an effort to further support the onshore
activities in Europe, Sial Geoscience Consulting and
Engineering S, ti, was acquired to provide a strong
entrance into the Turkish market and this region in
general. Sial, a leading Turkish geotechnical consultant,
is recognised for their expertise in large infrastructure
projects for the construction industry, governments and
industrial clients.

41Report of the Board of Management
Pavement services provide data collection along
roadways with proprietary equipment to characterise
the quality of the existing roadways and to support local,
state and federal government’s highway maintenance
programs. Over the course of the year approximately
275,000 kilometres of highways were surveyed and
reported to the various government agencies. Also
services are provided for railway track surveys to provide
rail operators the information necessary to support their
long-term track bed maintenance or renewal programs.
The nearshore geotechnical and construction support
activities have continued to grow and expand, amongst
others, for the foundation installation projects which
require drilling expertise. Expansion of these services
has been significant in Latin and South America, the
Mediterranean and Australia related to large projects
such as the Panama Canal and the large LNG projects in
Australia. The services offered include site surveys, large
diameter drilling and specialised foundation
investigations in water depths typically less than
25 meters. These particular services and the extended
duration of the projects have resulted in a repositioning
of equipment into these regions to support projects
currently underway.
The number of very large global oil and gas related
construction projects increased last year. Most of these
developments involve onshore, nearshore and offshore
geoscience and geotechnical consulting services which in
totality cannot be offered by a single entity other than
Fugro. In support of increasing technology resources and
expertise AOA Geophysics Inc., based in Houston, Texas,
was acquired to enhance the level of expertise in our
geoscience consultancy services in the offshore oil and
gas sectors with particular expertise in marine oil
seepage.
Two deepwater geotechnical drilling vessels are under
construction in India and will be delivered in the first
part of 2013. Both vessels are specially designed and built
for servicing the deepwater geotechnical market in
Southeast Asia and the Americas, capable of operating in
water depths up to 2,500 meters. The vessels are
equipped with Fugro’s proprietary deepwater drilling
and seabed equipment.
The emerging markets are growing at a faster pace and
have not been as susceptible to the fallout from the
current budget and economic conditions experienced
in the USA and Europe.
Soil investigation offshore Doha, Qatar2005

42
■ S U R V E Y D I V I S I O N
In the year under review the Survey division achieved
revenues of EUR 1,191 million (2010: EUR 1,009 million).
The offshore survey business line generated
EUR 632 million of revenue (2010: EUR 612 million).
The subsea services business line added EUR 440 million
(2010: EUR 275 million) and the geospatial activities
contributed EUR 119 million (2010: EUR 122 million).
The result from operating activities (EBIT) increased
by 2% to EUR 233 million (2010: EUR 228 million)
equating to an EBIT margin of 20% (2010: 23%).
The Survey division activities are largely dominated
by the oil and gas industry. The oil price and the
prevailing investment climate remain key factors in the
business. Most of the division’s activities are related to
work offshore and include survey and positioning
services together with geophysics and geology as well as
subsea services and intervention in support of the
development of natural resources. Meteorological and
oceanographic services form an integral part of these
activities. Subsea Services are providing a wide range of
underwater services using a comprehensive f leet of
ROVs and specialist ROV support vessels. The oil and gas
activities focus mainly on inspection, repair and
maintenance of subsea structures, support of
construction activities and support of drilling operations
for hydrocarbons. The Geospatial Services business line
concentrates primarily on land and airborne surveys
principally driven by government and infrastructure
developments but also include an oil and gas related
component.
A firm basis for activities in offshore survey is the Fugro
network of Global Positioning System (GPS) reference
stations operated globally, forming the nucleus of all
survey activities at sea as well as on land and in the air.
Safe and successful offshore construction operations for
field developments as well as pure exploration rely
on precise and reliable data concerning surface and
seabed locations. Using the expertise gained in the oil
and gas business Offshore Survey is using its knowledge
in a variety of other applications that require sound
knowledge of the marine environment, like offshore
windfarms.
Following a slow start into the year the traditional
offshore survey business caught-up in the second half of
the year based on a balanced portfolio of activities
around the globe. The most unpredictable business
environment for the offshore survey activities was the
Gulf of Mexico. While on the one hand Fugro benefits
from new legislation introduced for work in the Gulf of
Mexico, we experienced a slow return of exploration and
production activities which is only now showing some
return to normal. The European operations benefited
from a strong renewables market and together with oil
and gas activities had good order books during the report
period. Trading conditions overall continue to be
competitive, particularly in the offshore construction
support market where many contractors were hungry
for work and thus forced to operate often at cut-throat
rates. This trend is felt by the subcontracting industry as
well. In March we took delivery of the second dedicated
survey vessel, the Fugro Galaxy, for the European
markets. At year-end three survey vessels were under
construction. To continue our policy of vessel
replacement with younger tonnage and to upgrade our
capabilities for future markets, also an order for three
small survey vessels was placed. Offshore Survey enjoyed
a successful year in a competitive environment.
The Subsea Services business performance varied in
response to both regional and global conditions in its
various market sectors although the overall performance
did not meet all expectations due to increased
competitive pressure on margins and lower activity in
the first half year. Strongest performance came from
subsea inspection, repair and maintenance (IRM)
Key f i g u r e s S u r vey (amounts x EUR 1 mln.) 2011 2010 2009 2008 2007
Revenue 1,191 1,009 956 960 852
Results from operating activities (EBIT) 233 228 246 235 205
Average invested capital (incl. acquisitions) 952 710 578 497 423
Depreciation of tangible fixed assets 50 51 49 43 37
Results from operating activities (eBIT)
as a % of revenue 20 23 26 24 24

43Report of the Board of Management
activities in general and in North West Europe in
particular where the regulatory regime tends to take
precedence. In the latter part of the year, construction
activity picked up in Europe and Middle East although
it still lagged behind in Asia-Pacific. The combined
strong IRM and increasing installation activities resulted
in improved utilisation of resources through the year
and for vessels in particular. Drill support activities held
up well.
In West Africa, the activity was at high level. Work in
Brazil was dominated by projects for Petrobras with long
term contracts resulting in a high level of backlog.
The operations in the Middle East and Asia-Pacific had
a challenging year.
The acquisition of TSmarine late in the first quarter
enabled us to restructure the operations in Perth and
Singapore and puts Fugro into a better position in the
market place for specialist higher value contracts.
Overall ROV utilisation improved as the year progressed.
The ROV fleet increased to over 150 units partly through
the acquisition of TSmarine and partly via our internal
build programme. The delivery of new build Fugro
Symphony in May got off to a very productive start.
In December Fugro committed to a new build subsea
support vessel to be built in Brazil to meet Petrobras
requirements and to qualify for local content
regulations.
Geospatial Services provides terrestrial (ground based)
survey services and a range of airborne mapping
solutions. The portfolio of services also includes satellite
based remote sensing capabilities, using data from third
party sources.
In 2011, the Geospatial business line managed to raise
margins despite challenging market conditions. The
business line benefited from continuing strong demand
from the natural resource sector in Australia (oil and gas,
mining) as well as the rail sector in the USA. Revenues
from services associated with shale oil and gas
development projects in the USA continued to grow.
However, in other sectors and regions, the picture was
more mixed. Demand for certain types of aerial mapping
services deteriorated globally in 2011, due to the
economic uncertainty and spending cutbacks,
particularly in the public sector. In general, the
terrestrial survey component of the Geospatial business
line performed better than aerial mapping.
In the course of 2011, measures were taken to rationalise
the Geospatial organisation in response to market
circumstances. In addition to staff reductions, (in the
USA, UK, Netherlands, South Africa and the Middle East)
steps were taken to reorganise the aerial mapping
business globally, to improve efficiency and resource
utilisation. These measures are expected to result in an
improved performance in 2012.
Surveyor with satellite positioning system, Rocky Mountains, Canada2002

44
Key f i g u r e s G e o s c i e n c e (amounts x EUR 1 mln.) 2011 2010 2009 2008 2007
Revenue 717 607 561 654 508
Results from operating activities (EBIT) 112 101 106 154 115
Average invested capital (incl. acquisitions) 1,207 902 703 583 456
Depreciation of tangible fixed assets 39 38 32 28 23
Results from operating activities (eBIT)
as a % of revenue 16 17 19 24 23
■ G E O S C I E N C E D I V I S I O N
In 2011 the Geoscience division saw revenue increase by
18% to EUR 717 million (2010: EUR 607 million).
The seismic business line generated EUR 507 million
(2010: EUR 403 million). In 2011 the information
business line and general geophysical business line were
combined and contributed EUR 210 million to the
revenue (2010: EUR 204 million). Results from operating
activities (EBIT) amounted to EUR 112 million
(2010: EUR 101 million). This equates to an EBIT margin
of 16% (2010: 17%).
The Geoscience division is a leading provider of
proprietary and multi client data, technical and
consulting services, and software and technical products
associated with oil, gas and minerals exploration,
development and production. The division’s integrated
services include geophysical and geological data
acquisition, processing, analysis and interpretation.
Fugro is the fourth largest marine seismic contractor in
the industry and operates one of the newest and most
modern high capacity 3-D seismic f leets in the world.
Fugro’s f leet was active around the globe. The marine
seismic data acquisition segment, which accounts for the
majority of the revenue, continued to be under pressure
during 2011.
Marine seismic acquisition, predominantly applied to
support oil and gas exploration, experienced another
difficult year in 2011 due to a continued competitive
contract market. Results were negatively impacted by a
worldwide oversupply of seismic vessels. The seismic
processing activities continued to quickly grow and
contributed well. The capabilities of the seismic
processing group were significantly enhanced by the
acquisition of Kelman Technologies’ seismic processing
business. This has strengthened our offerings in land
seismic data processing, in particular for seismic data
acquired over shale oil and gas plays.
As in 2010, the reduced contribution from the marine
seismic contract market has been largely offset by
positive results from multi client seismic data sales
which were strong across most of the portfolio. In 2011
large 3-D multi client programs were completed and
delivered to underwriting clients. This included the
Eendracht 3-D multi client survey in Australia which,
with a total 8,639 km2, is one of the largest 3-D marine
seismic multi client surveys in the world to date. Also a
5,300km2 3-D in the Barents Sea was completed in
Norway, just west of Statoil’s recent Skrugard and Havis
discoveries. Fast track data was delivered to clients just
3 weeks after completing the survey. New 3-D multi
client programs were also started up in other regions,
including a large survey in the Netherlands. This
continues the trend where increasing focus is being put
on developing the 3-D multi client library in line with
the shift in the seismic f leet, which now predominantly
consists of high end 3-D vessels. Smaller programs on the
2-D side complement the 3-D programs. In 2011 a
17,000 km 2-D multi client survey was completed near
the Seychelles. This multi client survey was enhanced by
an integrated geological / geophysical interpretation by
Fugro’s geologist staff.
During the year two other acquisitions were completed.
The first was De Regt Marine Cables, which is a specialist
marine cable manufacturer of, among others, seismic
lead-ins and gun umbilicals and umbilicals used in
offshore geotechnics and ROVs. The second acquisition
was the Ocean Bottom Node (OBN) business from Seabird
Exploration. With this acquisition Fugro has entered the
quickly developing market for the acquisition of seismic
data on the seabed. The OBN method is particularly
useful for obtaining full azimuth, long offset high
quality data in areas with complex geologic structure
and in areas where obstructions at the surface do not
allow for streamer based acquisition.
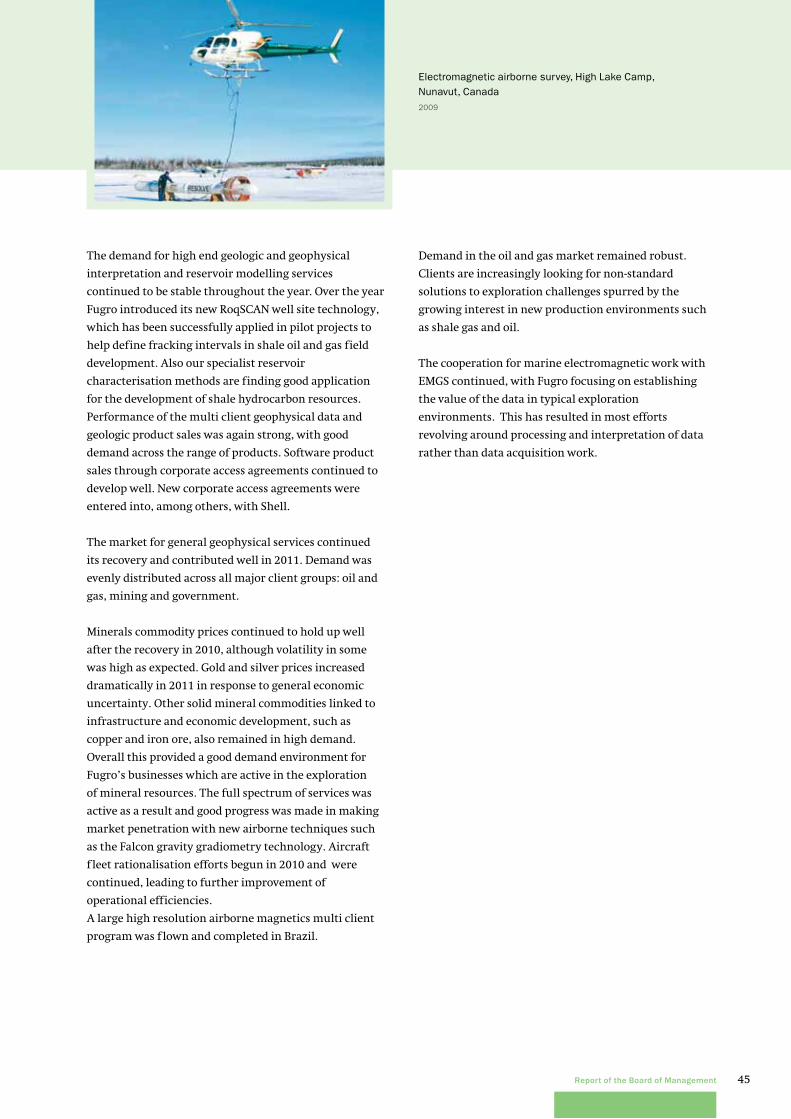
45Report of the Board of Management
The demand for high end geologic and geophysical
interpretation and reservoir modelling services
continued to be stable throughout the year. Over the year
Fugro introduced its new RoqSCAN well site technology,
which has been successfully applied in pilot projects to
help define fracking intervals in shale oil and gas field
development. Also our specialist reservoir
characterisation methods are finding good application
for the development of shale hydrocarbon resources.
Performance of the multi client geophysical data and
geologic product sales was again strong, with good
demand across the range of products. Software product
sales through corporate access agreements continued to
develop well. New corporate access agreements were
entered into, among others, with Shell.
The market for general geophysical services continued
its recovery and contributed well in 2011. Demand was
evenly distributed across all major client groups: oil and
gas, mining and government.
Minerals commodity prices continued to hold up well
after the recovery in 2010, although volatility in some
was high as expected. Gold and silver prices increased
dramatically in 2011 in response to general economic
uncertainty. Other solid mineral commodities linked to
infrastructure and economic development, such as
copper and iron ore, also remained in high demand.
Overall this provided a good demand environment for
Fugro’s businesses which are active in the exploration
of mineral resources. The full spectrum of services was
active as a result and good progress was made in making
market penetration with new airborne techniques such
as the Falcon gravity gradiometry technology. Aircraft
f leet rationalisation efforts begun in 2010 and were
continued, leading to further improvement of
operational efficiencies.
A large high resolution airborne magnetics multi client
program was f lown and completed in Brazil.
Demand in the oil and gas market remained robust.
Clients are increasingly looking for non-standard
solutions to exploration challenges spurred by the
growing interest in new production environments such
as shale gas and oil.
The cooperation for marine electromagnetic work with
EMGS continued, with Fugro focusing on establishing
the value of the data in typical exploration
environments. This has resulted in most efforts
revolving around processing and interpretation of data
rather than data acquisition work.
Electromagnetic airborne survey, High Lake Camp, Nunavut, Canada2009

50 years Fugro
From small Dutch engineering company to global player!
President and Chief Executive Officer G-J. Kramer 1983 - 2005
President and Chief Executive Officer K. Joustra 1962 - 1983
President and Chief Executive Officer K.S. Wester 2005 - 2011
Brazil office
Leidschendam office
Leidschendam office 1962
10-ton CPT equipment
Geotechnical vessel Bucentaur
Seismic vessel Geo Coral
Wallingford office
Houston office
50 years Fugro
To mark our 50th anniversary we are pleased to present a brief summary of how Fugro has grown over the years and consistently been able to anticipate developments in the market. It has been an exciting time, with many successes, but from time to time also some fluctuations. Technical ingenuity and a belief in our own abilities at all levels of the group, together with perseverance, have been the decisive factors in achieving this success.
Over the past 50 years, Fugro has expanded its services from solving foundation problems in the Netherlands to being involved in global developments in energy, transport, water management and the exploration of natural resources.
We are privileged to have been able to play our part in so many fascinating developments all over the world, such as oil and gas production at depths of 3,000 metres; Burj Dubai, the tallest building in the world; mapping inaccessible areas in Papua New Guinea and exploring for valuable resources such as diamonds.
Every day our employees, from dozens of different countries, many of whom having worked for Fugro for years, do their utmost and enjoy sharing in our success.
You can find more details of Fugro’s origins and growth over the years in Down to Earth and Up to Date, which we published on the occasion of Fugro’s 40th anniversary, and in Moving on, which marked 45 years of Fugro. In May this year we will be celebrating Fugro’s 50th anniversary.

50 years Fugro
From small Dutch engineering company to global player!
President and Chief Executive Officer G-J. Kramer 1983 - 2005
President and Chief Executive Officer K. Joustra 1962 - 1983
President and Chief Executive Officer K.S. Wester 2005 - 2011
Brazil office
Leidschendam office
Leidschendam office 1962
10-ton CPT equipment
Geotechnical vessel Bucentaur
Seismic vessel Geo Coral
Wallingford office
Houston office
50 years Fugro
To mark our 50th anniversary we are pleased to present a brief summary of how Fugro has grown over the years and consistently been able to anticipate developments in the market. It has been an exciting time, with many successes, but from time to time also some fluctuations. Technical ingenuity and a belief in our own abilities at all levels of the group, together with perseverance, have been the decisive factors in achieving this success.
Over the past 50 years, Fugro has expanded its services from solving foundation problems in the Netherlands to being involved in global developments in energy, transport, water management and the exploration of natural resources.
We are privileged to have been able to play our part in so many fascinating developments all over the world, such as oil and gas production at depths of 3,000 metres; Burj Dubai, the tallest building in the world; mapping inaccessible areas in Papua New Guinea and exploring for valuable resources such as diamonds.
Every day our employees, from dozens of different countries, many of whom having worked for Fugro for years, do their utmost and enjoy sharing in our success.
You can find more details of Fugro’s origins and growth over the years in Down to Earth and Up to Date, which we published on the occasion of Fugro’s 40th anniversary, and in Moving on, which marked 45 years of Fugro. In May this year we will be celebrating Fugro’s 50th anniversary.

Fugro 1962-1970
Fugro 1962-1970
Taking a soil sample
Installing ground anchors for CPT test
One of the first CPT trucks
How it all began
The 1960s saw a building boom in the Netherlands. As most Dutch soils are soft and weak, buildings need pile foundations. Traditionally, piles were made of wood: fir trunks that were nice and straight, but which had limited load-bearing capacity. That is why concrete piles increasingly started being used for larger buildings; as well as an increased range of pile sizes and lengths, these also increased the potential load-bearing capacities. Whereas sawing a metre off a wooden pile is a simple process, shortening concrete piles is much more difficult and, therefore, more expensive. And this demands a more detailed picture of the subsurface. The load-bearing capacity of both wooden and concrete piles used to be determined on the job, simply by counting the number of blows the pile driver needed to sink the last ten centimetres. But as load-bearing capacities increased and foundations became more expensive, the need for a better picture beforehand increased. And this meant information was needed on two subjects: the soil type and how the soil behaves when loaded. In short: soil investigation and soil mechanics.
Soil investigations used to be carried out by drilling companies, while soil mechanics was the domain of universities and a few municipal public works departments, and it often took a long time to reach any conclusions. There was, therefore, an opportunity in the market, and that led in 1962 to the formation of Fugro (Ingenieursbureau voor Funderingstechnieken en Grondmechanica). Its strategy: performing soil investigations itself and coming up with foundation recommendations on the basis of these investigations. And its Cone Penetration Testing (CPT) technology meant Fugro delivered rapid results. This decisive approach caught on, and soon the first orders came in. These also included export orders from Belgium and Cura ao, for instance. Improved mobility of CPT equipment and Fugro’s development of the electric cone for measuring penetration resistance enabled faster and better measurements. Soon Fugro started hiring out its own surveyors for planning the many CPT and drilling operations, and by the late 1960s these activities had evolved into the Geodesy Department. Annual revenue in the first few years was around € 400,000.
By then, oil and gas had been discovered in the North Sea and Fugro was asked to perform offshore soil investigations. Elsewhere in the world, soil investigations were being carried out by drilling boreholes and taking soil samples. Fugro’s newly developed electric CPT technology, however, produced much faster results and was highly suited for investigating the North Sea seabed. And so Fugro soon made a name for itself in this field.
Working in Curacao
Voorburgseweg 39 Leidschendam
Surveyors in the field
Demonstration 2-ton CPT
First offshore CPT at the Leman Bank
Voorburgseweg Laboratory
Leidschendam
Pile-driving monitoring in The Hague
Graph of friction ratios in different soil types obtained from measurements with a Fugro electric friction cone penetrometer
Compression test

Fugro 1962-1970
Fugro 1962-1970
Taking a soil sample
Installing ground anchors for CPT test
One of the first CPT trucks
How it all began
The 1960s saw a building boom in the Netherlands. As most Dutch soils are soft and weak, buildings need pile foundations. Traditionally, piles were made of wood: fir trunks that were nice and straight, but which had limited load-bearing capacity. That is why concrete piles increasingly started being used for larger buildings; as well as an increased range of pile sizes and lengths, these also increased the potential load-bearing capacities. Whereas sawing a metre off a wooden pile is a simple process, shortening concrete piles is much more difficult and, therefore, more expensive. And this demands a more detailed picture of the subsurface. The load-bearing capacity of both wooden and concrete piles used to be determined on the job, simply by counting the number of blows the pile driver needed to sink the last ten centimetres. But as load-bearing capacities increased and foundations became more expensive, the need for a better picture beforehand increased. And this meant information was needed on two subjects: the soil type and how the soil behaves when loaded. In short: soil investigation and soil mechanics.
Soil investigations used to be carried out by drilling companies, while soil mechanics was the domain of universities and a few municipal public works departments, and it often took a long time to reach any conclusions. There was, therefore, an opportunity in the market, and that led in 1962 to the formation of Fugro (Ingenieursbureau voor Funderingstechnieken en Grondmechanica). Its strategy: performing soil investigations itself and coming up with foundation recommendations on the basis of these investigations. And its Cone Penetration Testing (CPT) technology meant Fugro delivered rapid results. This decisive approach caught on, and soon the first orders came in. These also included export orders from Belgium and Cura ao, for instance. Improved mobility of CPT equipment and Fugro’s development of the electric cone for measuring penetration resistance enabled faster and better measurements. Soon Fugro started hiring out its own surveyors for planning the many CPT and drilling operations, and by the late 1960s these activities had evolved into the Geodesy Department. Annual revenue in the first few years was around € 400,000.
By then, oil and gas had been discovered in the North Sea and Fugro was asked to perform offshore soil investigations. Elsewhere in the world, soil investigations were being carried out by drilling boreholes and taking soil samples. Fugro’s newly developed electric CPT technology, however, produced much faster results and was highly suited for investigating the North Sea seabed. And so Fugro soon made a name for itself in this field.
Working in Curacao
Voorburgseweg 39 Leidschendam
Surveyors in the field
Demonstration 2-ton CPT
First offshore CPT at the Leman Bank
Voorburgseweg Laboratory
Leidschendam
Pile-driving monitoring in The Hague
Graph of friction ratios in different soil types obtained from measurements with a Fugro electric friction cone penetrometer
Compression test

Fugro 1971-1980
Going offshore
In the early 1970s Fugro’s revenue soared from around € 3 million a year to almost € 30 million in 1974. Collaboration and the subsequent merger with Cesco added hydrographical survey services for making nautical maps to its original range of onshore geodetic survey services. Internationalisation also proceeded rapidly, with US offices being opened in Long Beach and Houston. Fugro’s reputation in CPT technology became widely known, also among such authorities in soil mechanics as Professor Schmertmann in the US and Professor Sanglerat in France, who become great supporters.
North Sea oil and gas production took off fast, and CPT equipment that could be positioned on the sea floor (Sea Calf) or lowered to and fixed at the bottom of a drill pipe (WISON) was developed to make offshore soil investigations less dependent on vessel movements caused by the swell. This technological innovation established Fugro’s reputation once and for all. The electric penetration cone developed by Fugro became the world standard. Onshore activities were also expanding, with offices being opened in Hong Kong and Dubai.
An office was also opened in the United Kingdom to capitalise on the North Sea operations that were being coordinated from the UK. Offshore activities were growing fast and, by the mid-1970s, Fugro had eight vessels in use for offshore surveys. The second half of the 1970s was a difficult period, with considerable losses in Saudi Arabia and problems looming in the USA. Cesco’s marine survey activities were divested. After growing rapidly to € 30 million a year by 1974, revenue then remained stable, until 1977 when the company made its first ever loss. But business subsequently picked up.
Mariner on the North Sea
Hanomag taking soil samples
1971 Head Office
Investigating asphalt layers
Aerial photograph mapping
Fugro stand at a trade exhibition
Analysing soil samples in the laboratory
Seacalf for CPT tests
Fugro van for visual inspection of sewers and mains
Works council meeting
Fugro 1971-1980

Fugro 1971-1980
Going offshore
In the early 1970s Fugro’s revenue soared from around € 3 million a year to almost € 30 million in 1974. Collaboration and the subsequent merger with Cesco added hydrographical survey services for making nautical maps to its original range of onshore geodetic survey services. Internationalisation also proceeded rapidly, with US offices being opened in Long Beach and Houston. Fugro’s reputation in CPT technology became widely known, also among such authorities in soil mechanics as Professor Schmertmann in the US and Professor Sanglerat in France, who become great supporters.
North Sea oil and gas production took off fast, and CPT equipment that could be positioned on the sea floor (Sea Calf) or lowered to and fixed at the bottom of a drill pipe (WISON) was developed to make offshore soil investigations less dependent on vessel movements caused by the swell. This technological innovation established Fugro’s reputation once and for all. The electric penetration cone developed by Fugro became the world standard. Onshore activities were also expanding, with offices being opened in Hong Kong and Dubai.
An office was also opened in the United Kingdom to capitalise on the North Sea operations that were being coordinated from the UK. Offshore activities were growing fast and, by the mid-1970s, Fugro had eight vessels in use for offshore surveys. The second half of the 1970s was a difficult period, with considerable losses in Saudi Arabia and problems looming in the USA. Cesco’s marine survey activities were divested. After growing rapidly to € 30 million a year by 1974, revenue then remained stable, until 1977 when the company made its first ever loss. But business subsequently picked up.
Mariner on the North Sea
Hanomag taking soil samples
1971 Head Office
Investigating asphalt layers
Aerial photograph mapping
Fugro stand at a trade exhibition
Analysing soil samples in the laboratory
Seacalf for CPT tests
Fugro van for visual inspection of sewers and mains
Works council meeting
Fugro 1971-1980

Fugro 1981-1990
Fugro 1981-1990
Hard times
The record-breaking year of 1980 was followed by a few years of stagnation and major losses. This resulted in a reorganisation and a management reshuffle. Most of the US activities were spun off in a management buy-out. The offshore market was under pressure, both in the North Sea and the Gulf of Mexico. The number of staff in the USA fell to fourteen. Several measures, however, helped the group to rebound, e.g. a speculative, but successful geochemical and geotechnical multi client survey campaign offshore Alaska. The data that Fugro collected at its own expense were avidly snapped up by various oil companies. The decision to split the onshore and offshore activities so as to achieve a better focus on the different markets proved successful!
All went well until the oil price collapsed in 1986, which heralded the start of the third oil crisis. Offshore work came to a standstill, and McClelland, Fugro’s main competitor, especially in the Gulf of Mexico, was hit equally hard. This resulted in the two giants in offshore geotechnics deciding to join forces. Although revenue fell from € 50 million in 1984 to € 35 million in 1986, it bounced back, partly as a result of the merger, to over € 100 million by 1990, while profits also recovered strongly.The group started an active acquisition policy in the late 1980s and strengthened its position in onshore geotechnical surveying, both in the Netherlands and elsewhere. This was primarily driven by a wish, after three oil crises, to become less dependent on the oil and gas industry.
The geodetic and hydrographical activities were divested in 1988 so that the group could focus solely on the Fugro and McClelland strengths: geotechnics. By the late 1980s, oil fields were being developed in water depths of around 1,000 metres and the industry asked Fugro to design measuring tools that would enable geotechnical investigations in water depths of up to 3,000 metres.
Until then, marine surveys were conducted onboard vessels owned by third parties. In 1990, however, Fugro purchased three vessels in order to become less dependent on vessel owners, and also to be able to adapt these vessels for increased efficiency.
A geotechnical vessel in the ice off Alaska
CPT truck in Baghdad, Iraq
CPT testing for the Yamuna bridge in Bangladesh
Geotechnical vessel Fugro I
Mounting measuring equipment for monitoring driven pile
Geohydrological investigation in Abu Dhabi
Drillrig in Malaysian jungle
German REO 26
Electro-technician at work
Mounting measuring tools on an offshore pile
Managers’ meeting dinner in Duivenvoorde Castle, Voorschoten, Netherlands
CPT truck in the Middle East
Result of deep-water geological survey

Fugro 1981-1990
Fugro 1981-1990
Hard times
The record-breaking year of 1980 was followed by a few years of stagnation and major losses. This resulted in a reorganisation and a management reshuffle. Most of the US activities were spun off in a management buy-out. The offshore market was under pressure, both in the North Sea and the Gulf of Mexico. The number of staff in the USA fell to fourteen. Several measures, however, helped the group to rebound, e.g. a speculative, but successful geochemical and geotechnical multi client survey campaign offshore Alaska. The data that Fugro collected at its own expense were avidly snapped up by various oil companies. The decision to split the onshore and offshore activities so as to achieve a better focus on the different markets proved successful!
All went well until the oil price collapsed in 1986, which heralded the start of the third oil crisis. Offshore work came to a standstill, and McClelland, Fugro’s main competitor, especially in the Gulf of Mexico, was hit equally hard. This resulted in the two giants in offshore geotechnics deciding to join forces. Although revenue fell from € 50 million in 1984 to € 35 million in 1986, it bounced back, partly as a result of the merger, to over € 100 million by 1990, while profits also recovered strongly.The group started an active acquisition policy in the late 1980s and strengthened its position in onshore geotechnical surveying, both in the Netherlands and elsewhere. This was primarily driven by a wish, after three oil crises, to become less dependent on the oil and gas industry.
The geodetic and hydrographical activities were divested in 1988 so that the group could focus solely on the Fugro and McClelland strengths: geotechnics. By the late 1980s, oil fields were being developed in water depths of around 1,000 metres and the industry asked Fugro to design measuring tools that would enable geotechnical investigations in water depths of up to 3,000 metres.
Until then, marine surveys were conducted onboard vessels owned by third parties. In 1990, however, Fugro purchased three vessels in order to become less dependent on vessel owners, and also to be able to adapt these vessels for increased efficiency.
A geotechnical vessel in the ice off Alaska
CPT truck in Baghdad, Iraq
CPT testing for the Yamuna bridge in Bangladesh
Geotechnical vessel Fugro I
Mounting measuring equipment for monitoring driven pile
Geohydrological investigation in Abu Dhabi
Drillrig in Malaysian jungle
German REO 26
Electro-technician at work
Mounting measuring tools on an offshore pile
Managers’ meeting dinner in Duivenvoorde Castle, Voorschoten, Netherlands
CPT truck in the Middle East
Result of deep-water geological survey

Fugro 1991-2000
Fugro 1991-2000
Stock exchange flotation
The acquisition of a number of companies meant a new start of surveying activities. The takeover of John E. Chance Associates of Louisiana in 1991 added 400 employees to the workforce in one go and, most importantly, state-of-the-art expertise in accurate offshore satellite positioning.
Onshore geotechnical activities were also expanded by, for example, adding environmental services for investigating soil pollution and laboratory analyses for determining the strength of building materials. The strong growth in the group’s activities and the need for more financial headroom to fund further growth led to the decision in 1992 to list Fugro McClelland on the Amsterdam Stock Exchange. At the time of the flotation, revenue was around € 150 million and rapidly increased to over € 700 million by 2000 through a combination of organic growth and several, mainly small, acquisitions.
Fugro became increasingly involved in major projects, such as soil investigations and quality assurance of all the building materials for the new Hong Kong airport, Chek Lap Kok. As well as increasing its strong position in offshore geotechnical work in the 1990s, Fugro also built up a leading position in a wide range of marine survey services, in particular in increasingly accurate satellite positing systems.
The acquisition of the Norwegian company Geoteam marked Fugro’s first steps in marine seismic operations. In response to increasing competition, Fugro divested most of its environmental activities in 1997. Acquisitions in 1999 gave the group a strong position in aerial geophysical surveys of mining locations.
Despite some fluctuations, Fugro’s share price tripled in the first seven years after flotation.
Structural monitoring of Hong Kong’s Tsing Ma bridge
Geotechnical survey for extension of San Francisco airport
Drilling in the desert
3-tons installation for Euripides pile tests
Helicopter with FLI-MAP system
Seismic vessel Seisquest
Surveyor in Canada in winter
Launching “Searobin” for inspecting cable routes
Structural monitoring in Botlek tunnel, Netherlands
Lowering an ROV
The Bavenit in Monaco harbour
Taking soil samples near a railway in California
Hauling in a “deep-tow” system that maps the sea floor

Fugro 1991-2000
Fugro 1991-2000
Stock exchange flotation
The acquisition of a number of companies meant a new start of surveying activities. The takeover of John E. Chance Associates of Louisiana in 1991 added 400 employees to the workforce in one go and, most importantly, state-of-the-art expertise in accurate offshore satellite positioning.
Onshore geotechnical activities were also expanded by, for example, adding environmental services for investigating soil pollution and laboratory analyses for determining the strength of building materials. The strong growth in the group’s activities and the need for more financial headroom to fund further growth led to the decision in 1992 to list Fugro McClelland on the Amsterdam Stock Exchange. At the time of the flotation, revenue was around € 150 million and rapidly increased to over € 700 million by 2000 through a combination of organic growth and several, mainly small, acquisitions.
Fugro became increasingly involved in major projects, such as soil investigations and quality assurance of all the building materials for the new Hong Kong airport, Chek Lap Kok. As well as increasing its strong position in offshore geotechnical work in the 1990s, Fugro also built up a leading position in a wide range of marine survey services, in particular in increasingly accurate satellite positing systems.
The acquisition of the Norwegian company Geoteam marked Fugro’s first steps in marine seismic operations. In response to increasing competition, Fugro divested most of its environmental activities in 1997. Acquisitions in 1999 gave the group a strong position in aerial geophysical surveys of mining locations.
Despite some fluctuations, Fugro’s share price tripled in the first seven years after flotation.
Structural monitoring of Hong Kong’s Tsing Ma bridge
Geotechnical survey for extension of San Francisco airport
Drilling in the desert
3-tons installation for Euripides pile tests
Helicopter with FLI-MAP system
Seismic vessel Seisquest
Surveyor in Canada in winter
Launching “Searobin” for inspecting cable routes
Structural monitoring in Botlek tunnel, Netherlands
Lowering an ROV
The Bavenit in Monaco harbour
Taking soil samples near a railway in California
Hauling in a “deep-tow” system that maps the sea floor

Fugro 2001-2011
Fugro 2001-2011
Recovering an ROV
Seismic survey carried out by the Geo Caribbean
Airborne survey in Brazil Mobile jack-up rig at
work in Istanbul
Wind turbines
in the Irish Sea
Seismic survey by the Geo Celtic
Technician testing Fugro Dighem system
Installation of anchoring pile in the Caspian Sea
Geotem survey in Canada
Installation monitoring system in Singapore
Rolling out streamers for a seismic survey in Western
Australia
Launching an AUV
Interior of CPT truck
Highest CPT in the world on Mount Everest (8,850m)
Further growth
After a few years of rapid growth, revenue fell in 2003 by some 13% to € 822 million as a result of economic stagnation and losses attributable to fluctuations in the US dollar exchange rate. Towards the end of the year, Fugro completed by far its largest ever acquisition by taking over Thales Geosolutions, with some 1,200 employees. Provisions made to fund the cost of integrating these activities resulted in a further reduction in the year end result that year. However, many years of strong growth followed, with revenue tripling over the next eight years to over € 2.5 billion in 2011. The net result increased even more strongly, as reflected in the rising share price.
The increased revenue was once again attributable to a combination of rapid organic growth and acquisitions. In 2005 we anticipated on an increase of the marine seismic market and invested in building new state-of-the-art seismic survey vessels to acquire 3-D data, in addition to the existing 2-D fleet.
New technology means oil and gas can now be produced profitably in ever deeper water. As a result, the industry is becoming interested in new regions such as Brazil and West Africa. Regulations on employing local staff and resources are also increasing. Fugro easily fullfills these regulations as its decentralised structure has traditionally depended primarily on local organisations. Fugro’s operations in Brazil currently, for example, employ over 1,200 people.
Offshore, more and more installations are being placed on the sea floor in ever deeper water. This requires new investigation methods and positioning systems. Some surveys are now carried out by self-propelled Autonomous Underwater Vehicles (AUVs). Inspection and installation jobs in water depths of up to 3,000 metres require larger vessels and new equipment such as Remotely Operated Vehicles (ROVs). Every day, Fugro has some 70 vessels operating in activities such as geotechnical surveys, inspection work and seismic surveys.
Onshore activities are also showing steady growth. New investigation techniques for large-scale highway maintenance, measuring methods for inspecting the load-bearing capacity of heavily loaded pile foundations and studies into vulnerability to earthquakes and flooding were added to our range of services. Accurate airborne mapping techniques are increasingly replacing traditional mapping by surveyors. Airborne geophysical surveys are now also being used in oil and gas exploration by applying measuring techniques originally developed for mineral exploration and mining.
In addition to many contracts in the oil and gas sector, Fugro is becoming increasingly involved in other sources of energy such as offshore wind farms, nuclear power plants and the production of shale gas and oil.

Fugro 2001-2011
Fugro 2001-2011
Recovering an ROV
Seismic survey carried out by the Geo Caribbean
Airborne survey in Brazil Mobile jack-up rig at
work in Istanbul
Wind turbines
in the Irish Sea
Seismic survey by the Geo Celtic
Technician testing Fugro Dighem system
Installation of anchoring pile in the Caspian Sea
Geotem survey in Canada
Installation monitoring system in Singapore
Rolling out streamers for a seismic survey in Western
Australia
Launching an AUV
Interior of CPT truck
Highest CPT in the world on Mount Everest (8,850m)
Further growth
After a few years of rapid growth, revenue fell in 2003 by some 13% to € 822 million as a result of economic stagnation and losses attributable to fluctuations in the US dollar exchange rate. Towards the end of the year, Fugro completed by far its largest ever acquisition by taking over Thales Geosolutions, with some 1,200 employees. Provisions made to fund the cost of integrating these activities resulted in a further reduction in the year end result that year. However, many years of strong growth followed, with revenue tripling over the next eight years to over € 2.5 billion in 2011. The net result increased even more strongly, as reflected in the rising share price.
The increased revenue was once again attributable to a combination of rapid organic growth and acquisitions. In 2005 we anticipated on an increase of the marine seismic market and invested in building new state-of-the-art seismic survey vessels to acquire 3-D data, in addition to the existing 2-D fleet.
New technology means oil and gas can now be produced profitably in ever deeper water. As a result, the industry is becoming interested in new regions such as Brazil and West Africa. Regulations on employing local staff and resources are also increasing. Fugro easily fullfills these regulations as its decentralised structure has traditionally depended primarily on local organisations. Fugro’s operations in Brazil currently, for example, employ over 1,200 people.
Offshore, more and more installations are being placed on the sea floor in ever deeper water. This requires new investigation methods and positioning systems. Some surveys are now carried out by self-propelled Autonomous Underwater Vehicles (AUVs). Inspection and installation jobs in water depths of up to 3,000 metres require larger vessels and new equipment such as Remotely Operated Vehicles (ROVs). Every day, Fugro has some 70 vessels operating in activities such as geotechnical surveys, inspection work and seismic surveys.
Onshore activities are also showing steady growth. New investigation techniques for large-scale highway maintenance, measuring methods for inspecting the load-bearing capacity of heavily loaded pile foundations and studies into vulnerability to earthquakes and flooding were added to our range of services. Accurate airborne mapping techniques are increasingly replacing traditional mapping by surveyors. Airborne geophysical surveys are now also being used in oil and gas exploration by applying measuring techniques originally developed for mineral exploration and mining.
In addition to many contracts in the oil and gas sector, Fugro is becoming increasingly involved in other sources of energy such as offshore wind farms, nuclear power plants and the production of shale gas and oil.
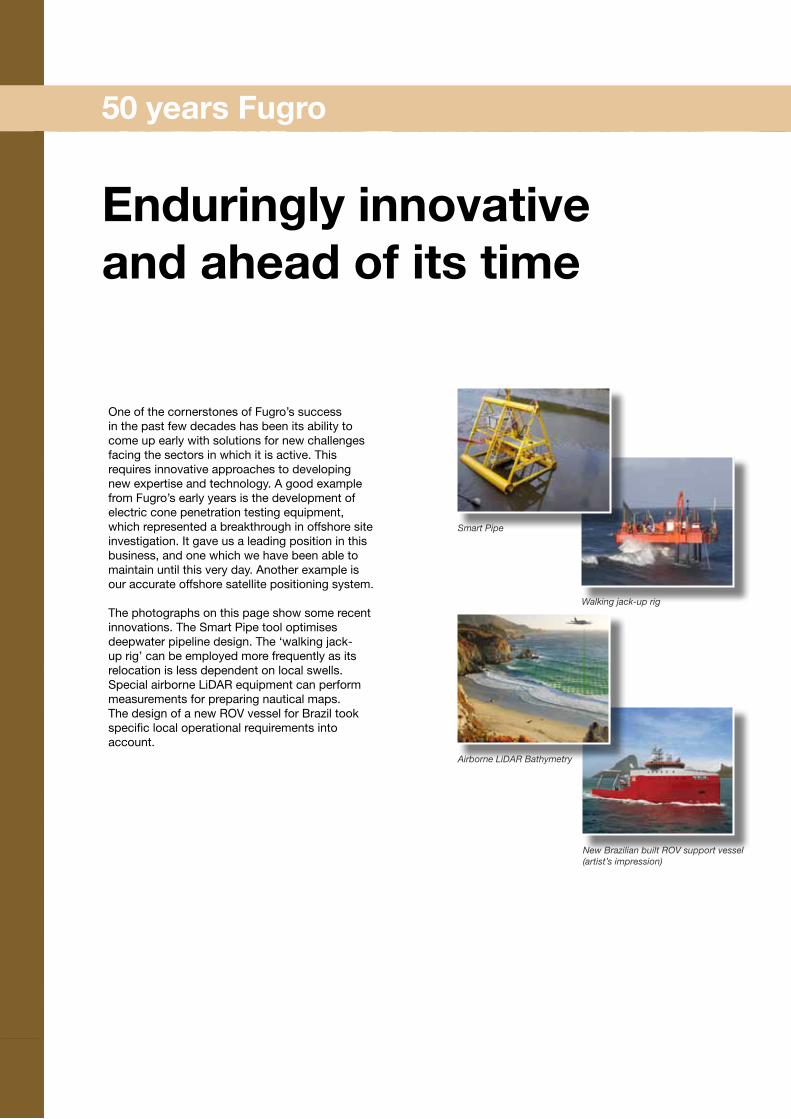
50 years Fugro
One of the cornerstones of Fugro’s success in the past few decades has been its ability to come up early with solutions for new challenges facing the sectors in which it is active. This requires innovative approaches to developing new expertise and technology. A good example from Fugro’s early years is the development of electric cone penetration testing equipment, which represented a breakthrough in offshore site investigation. It gave us a leading position in this business, and one which we have been able to maintain until this very day. Another example is our accurate offshore satellite positioning system.
The photographs on this page show some recent innovations. The Smart Pipe tool optimises deepwater pipeline design. The ‘walking jack-up rig’ can be employed more frequently as its relocation is less dependent on local swells. Special airborne LiDAR equipment can perform measurements for preparing nautical maps. The design of a new ROV vessel for Brazil took specific local operational requirements into account.
Our annual reports cover a range of topics. In addition to the compulsory financial reporting, it provides information on matters such as governance, strategy, market developments and our investments. However, Fugro also sees its annual report as an excellent opportunity to inform a wide audience of stakeholders, such as shareholders, clients and employees, about its activities. These include new developments and day-to-day operations on many fronts all over the world, as well as Fugro’s involvement in social projects. This approach and our focus on innovation are obviously appreciated, as shown by the number of prizes we have been awarded in recent years.
• The King Willem I Award is granted every two years to recognise courage, vigor, sustainability and perseverance and to stimulate creative and innovative entrepreneurship.
• The Henri Sijthoff Price is an annual award of Het Financieele Dagblad for companies that favourably distinguish themselves with respect to public information and financial reporting.
• The Prix de Mazars is the award for the best annual report of listed companies in the Netherlands and is awarded annually.
• The Erasmus Innovation Price is awarded annually by the Erasmus University of Rotterdam to award Dutch organisations for the contribution of management and organisations for sustainable innovations.
Enduringly innovative and ahead of its time
Walking jack-up rig
New Brazilian built ROV support vessel(artist’s impression)
King Willem I prize - 2008
Henri Sijthoff prize - 2005 and 2008
Dubai Office, Middle East
Mumbai Office, India
Ciudad del Carmen Office, Mexico
Willemstad Office, Curacao
Ontario Office, Canada
Prix de Mazars - 2009 and 2011
Erasmus Innovation Award - 2010-2011
Airborne LiDAR Bathymetry
Smart Pipe
50 years Fugro

50 years Fugro
One of the cornerstones of Fugro’s success in the past few decades has been its ability to come up early with solutions for new challenges facing the sectors in which it is active. This requires innovative approaches to developing new expertise and technology. A good example from Fugro’s early years is the development of electric cone penetration testing equipment, which represented a breakthrough in offshore site investigation. It gave us a leading position in this business, and one which we have been able to maintain until this very day. Another example is our accurate offshore satellite positioning system.
The photographs on this page show some recent innovations. The Smart Pipe tool optimises deepwater pipeline design. The ‘walking jack-up rig’ can be employed more frequently as its relocation is less dependent on local swells. Special airborne LiDAR equipment can perform measurements for preparing nautical maps. The design of a new ROV vessel for Brazil took specific local operational requirements into account.
Our annual reports cover a range of topics. In addition to the compulsory financial reporting, it provides information on matters such as governance, strategy, market developments and our investments. However, Fugro also sees its annual report as an excellent opportunity to inform a wide audience of stakeholders, such as shareholders, clients and employees, about its activities. These include new developments and day-to-day operations on many fronts all over the world, as well as Fugro’s involvement in social projects. This approach and our focus on innovation are obviously appreciated, as shown by the number of prizes we have been awarded in recent years.
• The King Willem I Award is granted every two years to recognise courage, vigor, sustainability and perseverance and to stimulate creative and innovative entrepreneurship.
• The Henri Sijthoff Price is an annual award of Het Financieele Dagblad for companies that favourably distinguish themselves with respect to public information and financial reporting.
• The Prix de Mazars is the award for the best annual report of listed companies in the Netherlands and is awarded annually.
• The Erasmus Innovation Price is awarded annually by the Erasmus University of Rotterdam to award Dutch organisations for the contribution of management and organisations for sustainable innovations.
Enduringly innovative and ahead of its time
Walking jack-up rig
New Brazilian built ROV support vessel(artist’s impression)
King Willem I prize - 2008
Henri Sijthoff prize - 2005 and 2008
Dubai Office, Middle East
Mumbai Office, India
Ciudad del Carmen Office, Mexico
Willemstad Office, Curacao
Ontario Office, Canada
Prix de Mazars - 2009 and 2011
Erasmus Innovation Award - 2010-2011
Airborne LiDAR Bathymetry
Smart Pipe
50 years Fugro

60
■ C o r p o r a t e S o c i a l R e s p o n s i b i l i t y
V i s i o n a n d a m b i t i o n
Fugro strives for strong but controlled growth in revenue
and net result. The organisation aims for an optimised
and balanced synergy between its various activities in
order to realise its goals while maintaining a broad
activity portfolio on a geographic and product basis.
Fugro aims to deliver improved added value to its clients
by a combination of specialised staff and technologies,
and associated high-quality services. In addition to
growth in revenue and net result, the organisation’s
policies on human resources, health, safety and the
environment are also of great importance. Sustainability,
transparency and reliability are the key themes of
Fugro’s policy.
It is realised that the impacts of Fugro’s specific local
activities and the international nature of its services
place great demands on its staff. The organisation is
aware of its role in society, particularly in an
international and multicultural environment, and
understands the importance of paying constant and
increased attention to corporate social responsibility
(CSR). Fugro strives to meet the expectations of all the
stakeholders in the company by balancing regard for the
environment, social awareness and financial results.
Resulting from a continuously developing CSR policy,
Fugro operating companies and employees put the
principles of CSR into daily practice in a wide range of
areas. Fugro’s CSR policy is inextricably linked with the
course of business and should, therefore, be considered
to be an integral part of other corporate aspects.
Fugro strives towards growth, both organically and
through acquisition. Geographical expansion is a
component of Fugro’s ability to continue to capitalise
on the world’s rising prosperity. Growth also means
attracting more local staff, and it enables the
organisation to offer opportunities for training and
education to its employees. The presence of local
operating companies and a focus on maximising local
content is an important spearhead for the integration
of Fugro’s services within communities in general.
The growing demand for energy is increasingly met by
the use of alternative energy sources such as solar, wind,
bio fuels, tidal and nuclear energy. This presents Fugro
with good opportunities. When managing its
investments, Fugro considers the balance between
improving the quality of its equipment and the issues of
fuel use, emissions and cost management.
Fugro aims to strengthen the coherence of its CSR policy
by providing a framework, based on the ISO 26000
guidance standard on corporate social responsibility, to
its subsidiaries on how to implement the various aspects
of CSR.

61Corporate Social Responsibility
Fugro’s Corporate Social Responsibility reporting follows
the framework of the Global Reporting Initiative (GRI).
In the longer term Fugro will endeavor to increase the
consistent and accurate measurement around key
performance indicators at company level, provided these
measurements will add value to our stakeholders.
The implementation is phased and based on a number
of coherent key focus areas. This will allow the
organisation to collectively direct their CSR effort to
these focus areas and accelerate the impact. Once certain
focus areas are becoming an integral part of our
company values, new key focus areas will be selected.
Fugro collects data using equipment, technology and
expertise, but its value is embedded in how we interpret
this data and provide the client with information to
make good business decisions. People, being the enabler
to create this value, are in the center of this process be it
as an operator of the equipment, a developer of new
technologies and/or applying their experience built
through a long employment history with the company.
This recognition has been guiding in the selection of the
2012-2013 key CSR focus areas, which can be
summarised as follows:
• Providing a safe, secure and healthy work environment
has a direct impact on the wellbeing of our
employees, their families and communities. Fugro
considers this a differentiator for the recruitment and
retention of experienced staff.
• Maximising local content is critical to maintain
and/or reinforce our position in relation to the
competition. Focus on this area will also create
sustainable development, through the direct
interface with local communities, educational
institutes and suppliers.
• Continuous development of our staff through the
human resource initiative, Partnership for Growth
program and the focused training through the Fugro
Academy provides a personal growth environment
during all stages of an employee’s career.
CSR works from within the operating company. In line
with Fugro’s decentralised structure, the Board of
Management is responsible to set the key focus areas,
with the operating companies taking responsibility for
the implementation, taking local practice and standards
into account.
Loyalty of employees is an important pillar to deliver
on Fugro’s organic growth strategy in a decentralised
structure. The key focus areas above are in direct support
to continue to build a loyal workforce that provides a
sustainable basis for continued growth of the company.
O r ga n i s a t i o n a l s t r u c t u r e
The organisation is divided into three divisions:
Geotechnical, Survey and Geoscience. These divisions
work together worldwide in focusing on the right
solutions for the relevant market. The Board of
Management is responsible for Group policies, including
corporate social responsibility, strategy, acquisitions,
investments, risk management, finance and internal
coordination. This includes matters that are best handled
centrally, for reasons such as efficiency, advanced
specialisation or financing.
Fugro’s philosophy is that the operating companies in
the divisions should be able to operate autonomously as
much as possible within the framework of the Group’s
policy, business principles and internal risk management
systems. This enhances the quality of the operating
companies’ management and the development
opportunities available for employees. Delegation is
closely entwined in the corporate culture. The increasing
cooperation between or within the different divisions
creates synergy, especially for complex and integrated
projects, which increases earning capacity. Thus
creativity and involvement within the whole
organisation are increased while employees’
opportunities for professional challenges and career
development are considerably enhanced.
M a n a ge m e n t a p p r o a c h
Market presence
The Fugro decentralised organisational structure
facilitates a strong regional market presence, which
leads to the use of local staff and suppliers. The operating

62
environment
By increasing the awareness of the use of energy and
sustainable materials, the impact on the environment
can be minimised. Fugro considers this when purchasing
or ordering new equipment, and when expanding its
f leet of vessels and airplanes.
Fugro’s services are aimed at efficiently deploying
personnel and equipment for the collection and
interpretation of data. The organisation also acts as an
advisory body. Fugro does not own or operate large-scale
production facilities that might have an impact on the
environment. Its main focus is on environmental aspects
associated with the deployment of the equipment and
offices from which Fugro operates.
Community
Fugro aims to be a good neighbour, as demonstrated by
the way the operating companies contribute, directly
and indirectly, to the general wellbeing of the
communities in which they work. Managers and
employees are encouraged, where appropriate, to
become involved with local communities and to support
charitable projects, cultural events, and organisations
and educational institutions that aim to improve the
effectiveness of the industries in which Fugro operates.
Fugro’s General Business Principles
Fugro works on the principle that every employee shares
responsibility for the company’s reputation. For all staff,
this means that it is not enough to just do things right;
employees must also do the right thing. Fugro’s
employees support the social values of reliability,
integrity, openness, and respect for fellow employees
and the environment. These common values form the
foundation of Fugro’s general business principles
(Business Principles).
The Business Principles govern how each of the Fugro
companies, which make up the Fugro Group, conducts
its affairs. It provides fundamental guidelines upon
which business decisions and actions throughout the
world, at all employment levels, are to be based and
apply to all corporate actions as well as the conduct of all
Fugro employees and others, like agents, subcontractors
etc., who act on Fugro’s behalf. Since the Business
Principles are not intended to be all encompassing, but to
provide the minimum standards for behaviour required,
the management of each Fugro company has the
discretion to specify additional local rules of business
conduct within the framework of the Business
Principles.
companies are responsible for local staff policies, which
take into account local customs and regulations, within
the guidelines set out by Fugro in areas such as salaries,
pensions, safety and health and the general business
principles. Most of the employees in Fugro’s worldwide
network of offices are nationals, including the
managerial staff.
Transfer of knowledge
Fugro’s range of high-quality services provides a strong
foundation for further growth, and supports long-term
development of higher standards of service. Fugro’s
global presence and innovative capabilities are utilised
to further these goals. A suitable internal personal
development and career policy is important in order to
retain and benefit from competent employees and those
with specific expertise relevant to the organisation.
The education policy is aimed at: employees who
demonstrate management potential; the development of
in-house experts; and at employees who can be deployed
f lexibly on a project-by-project basis.
Flexibility through exchangeability of staff is an
important aspect of Fugro’s education policy. To
facilitate this, the same technical systems are used
throughout the Group whenever possible, and both
short- and long-term employee exchange programmes
have been developed enabling people to gain experience
through overseas postings. To foster the recruitment of
new, young talent, Fugro has built-up good contacts
with universities and the organisation supports both
management and professional development through the
Fugro Academy.
Prosperity is largely dependent on the extent to which
knowledge and innovation processes thrive within
business and the economy. This necessitates investment
in classroom and e-learning training and education.
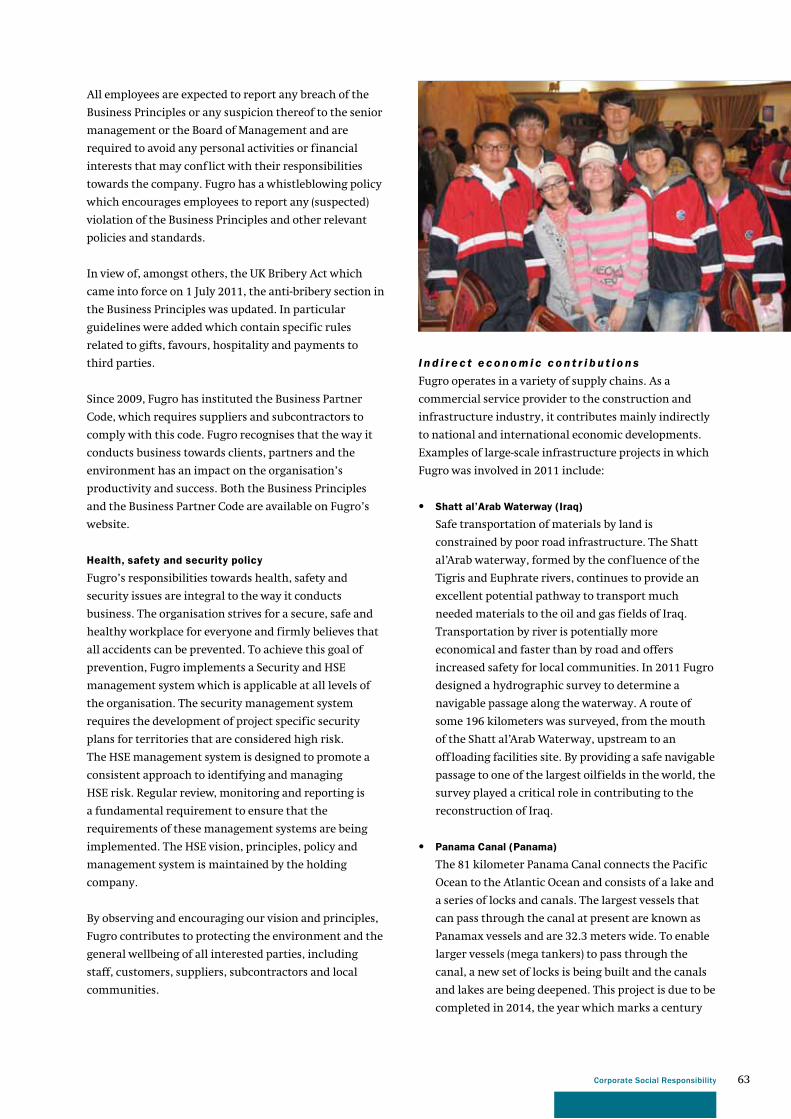
63Corporate Social Responsibility
I n d i r e c t e c o n o m i c c o n t r i b u t i o n s
Fugro operates in a variety of supply chains. As a
commercial service provider to the construction and
infrastructure industry, it contributes mainly indirectly
to national and international economic developments.
Examples of large-scale infrastructure projects in which
Fugro was involved in 2011 include:
• Shatt al’Arab Waterway (Iraq)
Safe transportation of materials by land is
constrained by poor road infrastructure. The Shatt
al’Arab waterway, formed by the confluence of the
Tigris and Euphrate rivers, continues to provide an
excellent potential pathway to transport much
needed materials to the oil and gas fields of Iraq.
Transportation by river is potentially more
economical and faster than by road and offers
increased safety for local communities. In 2011 Fugro
designed a hydrographic survey to determine a
navigable passage along the waterway. A route of
some 196 kilometers was surveyed, from the mouth
of the Shatt al’Arab Waterway, upstream to an
off loading facilities site. By providing a safe navigable
passage to one of the largest oilfields in the world, the
survey played a critical role in contributing to the
reconstruction of Iraq.
• Panama Canal (Panama)
The 81 kilometer Panama Canal connects the Pacific
Ocean to the Atlantic Ocean and consists of a lake and
a series of locks and canals. The largest vessels that
can pass through the canal at present are known as
Panamax vessels and are 32.3 meters wide. To enable
larger vessels (mega tankers) to pass through the
canal, a new set of locks is being built and the canals
and lakes are being deepened. This project is due to be
completed in 2014, the year which marks a century
All employees are expected to report any breach of the
Business Principles or any suspicion thereof to the senior
management or the Board of Management and are
required to avoid any personal activities or financial
interests that may conflict with their responsibilities
towards the company. Fugro has a whistleblowing policy
which encourages employees to report any (suspected)
violation of the Business Principles and other relevant
policies and standards.
In view of, amongst others, the UK Bribery Act which
came into force on 1 July 2011, the anti-bribery section in
the Business Principles was updated. In particular
guidelines were added which contain specific rules
related to gifts, favours, hospitality and payments to
third parties.
Since 2009, Fugro has instituted the Business Partner
Code, which requires suppliers and subcontractors to
comply with this code. Fugro recognises that the way it
conducts business towards clients, partners and the
environment has an impact on the organisation’s
productivity and success. Both the Business Principles
and the Business Partner Code are available on Fugro’s
website.
Health, safety and security policy
Fugro’s responsibilities towards health, safety and
security issues are integral to the way it conducts
business. The organisation strives for a secure, safe and
healthy workplace for everyone and firmly believes that
all accidents can be prevented. To achieve this goal of
prevention, Fugro implements a Security and HSE
management system which is applicable at all levels of
the organisation. The security management system
requires the development of project specific security
plans for territories that are considered high risk.
The HSE management system is designed to promote a
consistent approach to identifying and managing
HSE risk. Regular review, monitoring and reporting is
a fundamental requirement to ensure that the
requirements of these management systems are being
implemented. The HSE vision, principles, policy and
management system is maintained by the holding
company.
By observing and encouraging our vision and principles,
Fugro contributes to protecting the environment and the
general wellbeing of all interested parties, including
staff, customers, suppliers, subcontractors and local
communities.

64
imaging and automated technology, mounted on
Fugro’s ARAN (Automatic Road Analyzer) collection
vehicles, to capture downward pavement images for
crack detection and right-of-way images. Future
pavement conditions can be predicted using
pavement performance models which also enables
the VDOT to calculate the benefits of alternative
treatment strategies. In 2011, Fugro was involved in
similar projects among others in New York,
California, Louisiana, Oklahoma, Utah and Iowa.
Fugro is also involved in several international projects in
the area of protection against f looding:
• New South Wales (Australia)
Fugro’s airborne LiDAR bathymetry is widely
accepted as an accurate and efficient technology for
commercial surveys, supporting the oil and gas
industry and numerous marine projects around the
world. Following successful projects in other parts of
Australia, June 2011 saw the first deployment of
Fugro’s light weight Airborne LiDAR Bathymetry
(LADS Mk 3) system on its east coast. In a coastal zone
management project for the New South West
Government the information collected is used for
environmental management, climate change
adaptation and modelling the effects of storm surges
and tsunamis.
• White Volta (Ghana)
The White Volta, also known as the Nakambe River, is
the headstream of the Volta River in West Africa. It
originates in Burkina Faso and it f lows into Lake Volta
in Ghana. In the last four years, severe f looding
occurred every wet season in this part of the drainage
system. As partner of a consortium, Fugro was
awarded a contract for the World Bank funded f lood
hazard assessment project for the Upper White Volta
in Ghana. The project included survey activities,
hydrological, hydraulic and overland f low modelling,
cause analysis of the f loods, assessment of
effectiveness of f lood mitigation measures and the
implementation of a f lood early warning system.
For this project a total length of 880 river kilometres
was surveyed and modelled.
• International Levee Handbook
The International Levee Handbook, which is due for
completion in 2013, will define best practices and
guidance on all aspects related to the design,
construction and maintenance of levees. Levee
experts from Fugro in the Netherlands, UK, France
since completion of the original canal. To complete a
definitive design for the locks, an accurate model of
the area was needed but the density of the
surrounding rainforest ruled out a terrestrial survey.
The solution was provided by Fugro, using light based
airborne LiDAR system (FLI-MAP) which achieved
good penetration through the canopy. On basis of the
recorded laser data, contours were generated and a
3-D topographic model of the area was created.
With regards to infrastructure developments, Fugro
is globally recognised for gathering, analysing and
reporting information to measure the attributes,
conditions and safety of road networks.
• Virginia State (uSA)
The Virginia Department of Transportation (VDOT)
utilised data collected by Fugro to issue its April 2011
State of the Pavement Report. It outlined the
pavement condition and ride quality of Virginia’s
roads classified by pavement type, highway system,
maintenance district and country. The VDOT report
incorporated data collected using continuous digital

65Corporate Social Responsibility
and the USA are actively involved in the creation of
this handbook. In an international framework of
experts they work together with governments,
institutes and other engineering consultants.
In 2011, Fugro carried out projects relating to
geohazards, including:
• Seismic microzonation study Hong Kong
In recent years, and in particular following the major
earthquake of 2008 in western China’s Sichuan
province, there has been a growing interest in seismic
design and mitigation of earthquake risk in Hong
Kong. For this reason, the Hong Kong Government
decided to carry out a seismic microzonation study
covering their North West Territories. The objective
of the study was to generate a hazard map,
subdividing the study region into zones with
relatively similar responses to earthquake-related
effects and defining their seismic behaviour for
future design and planning purposes.
Fugro has been awarded contracts, both to seismically
classify and to determine the most suited geophysical
technique for the solid and soft, superficial substrata
of Hong Kong’s North West Territories.
I n d i r e c t e n v i r o n m e n t a l c o n t r i b u t i o n s
Sustainable energy
Demand for sustainable energy has been the driver for
the significant expansion of wind farm developments in
Western Europe. Also in the years to come it is expected
that many more wind farms will be built. Fugro provides
a variety of services required to determine the best
location, both on and offshore. Examples include:
• SMart Wind and Mainstream Renewable Power
(Europe), for which Fugro has carried out detailed
geotechnical studies at two offshore wind projects in
Europe.
• EON Arkona Becken Wind Farm (Baltic Sea,
Germany), a 400 MW offshore wind farm,
for which Fugro performed the geotechnical
investigation using a vessel and two jack-up
platforms.
• Centrica Lincs Offshore Wind Farm (North Sea, UK),
a 270 MW offshore wind farm, which lies within one
of the UK’s most environmentally sensitive coastal
regions, for which Fugro provided assistance with the
installation of the electrical substation.
Biodiversity
• Coral mapping (Southeast uS)
Lophelia Pertusa is the dominant deep-sea reef-
forming coral off the South East United States (SEUS),
found from North Carolina through the Gulf of
Mexico at depths exceeding 200 meter. On the SEUS
continental slope, deep-sea coral habitats typically
occur at depths between 370 and 870 meter and are
known to be oases of marine life offering both food
and shelter for a diverse and unique fauna of fish
and invertebrates. In 2011 Fugro was contracted to
perform a geophysical cable route survey and
associated environmental habitat mapping using
seabed photography along the proposed route of a
submarine cable along the South Eastern American
continental shelf, stretching from Florida down to
Mexico. Seabed video data was reviewed, and broad-
scale habitat changes recorded according to the
SEADESC and DNV habitat classification. Habitats
where hard coral reefs were found to occur were
further assessed for coral quality, and areas where
reefs occurred were delineated.
• Habitat mapping (North Sea, europe)
Within the North Sea various environmentally
sensitive habitats have been identified, including

66
shallow sand banks, stony reefs, submarine
structures made by leaking gases and tube worm
(Sabellaria) reefs. Fugro has been involved in
identifying, delineating and mapping such areas in
the North Sea. Through the combined experience of
Fugro geophysicists and environmental scientists,
geophysical data is used to identify areas of potential
sensitivity which are subsequently groundtruthed
through high resolution seabed photography. Seabed
photography and habitat mapping has also been
performed from one of our AUVs during deep sea
surveys performed offshore West of Shetlands. Charts
and accompanying descriptive reports are then
produced showing the nature and extent of the
habitat.
This allows correct management decisions to be made
regarding the likely impact of the development
activity on the surrounding environment.
environment
• Campos Basin oil spill sensitivity mapping project
(Brazil)
The Brazilian environmental ministry (MMA) has
a multi-year plan to map the Brazilian coastline,
identifying potential impact for the fauna and f lora,
and social economy of oil spills generated by oil and
gas industry activities. Fugro has been involved on
several mapping projects to the MMA for the past six
years. This mapping normally starts with a desk top
study gathering satellite images, followed by field
visits along the Brazilian coast, going from location to
location in order to characterise the geo-morphology
and coastal hydrodynamics off the coast line. The
social economic activities are mapped detailing what
each location is able to produce, e.g. fishing,
aquaculture and port and harbors, etc. All this
information is integrated into a GIS system, and
compiled into an atlas including various charts,
presented both in digital and hard copies. This is the
basic tool that has been used by the Brazilian National
Contingency Plan to mitigate any oil spill event.
S o c i a l c o n t r i b u t i o n s
Project participation
Integral to Fugro’s value system is its support for social
initiatives.
Fugro Seastar AS has been supporting a project in
Ethiopia called Helping Hands for two years. The prime
goal is to develop skills in the local community on
farming and help raising chickens. So far they have been
able to build a chicken house, a bridge and improved
water supply.
Sponsorships
Fugro seeks to help preserve and promote accessibility to
valuable cultural heritage and the organisation supports
a large number of initiatives worldwide, notably in the
fields of the arts, culture and sport. As sponsor of the
Concertgebouw Amsterdam Fugro contributes to their
mission to offer as many people as possible the
opportunity to experience high quality classical music.
Fugro’s support to Stichting Hermitage, national park
‘De Hoge Veluwe’, the sea tugboat ‘Holland’ and MS150
(Houston-Austin cycling tour by US Multiple Sclerosis
Society) is ongoing. Worldwide, operating companies
regularly assist in local environmental projects such as
cleaning up beaches, with some extending this to
‘adoption’ of part of the beach. Fugro GEOS Inc.
continues to be Beach Guardians (Texas General Land
Office, Adopt a Beach programme) for a local beach in
Galveston, Texas.
Fugro-Lafayette sponsors the ‘Family Performance Series’
through the Acadiana Center for the Arts to provide a
venue for quality live performance for young audiences.
This up-close and informal setting is the perfect
atmosphere to introduce children to a wide variety of
performing arts experiences. Performances include
music, poetry, puppet shows, international storytelling
and folktales, and theatre. It is also sponsor of the
Performing Arts Society of Acadiana (PASA).
Fugro continued to support the Barratt Due Institute of
Music. The Barratt Due Institute of Music was founded in
1927 and it has played a central role in music education
in Norway for more than 80 years. Children, young
people and adult students are taught under the same
roof, inspired by the founders’ motto: From music
kindergarten to the concert podium. In 2012 Fugro
Norway also plans to participate in supporting the

67Corporate Social Responsibility
production of an album featuring the best young talents
of Norway.
Several Fugro operating companies are involved in sports
and charity events to raise money for (international)
cancer organisations: Fugro Pelagos in California for the
American Cancer Society and Fugro Survey for the
‘Friends of Anchor’ which is a local charity that raises
money on behalf of the local hospital Cancer Center in
Aberdeen. Employees of Fugro participated to the
Making Strides against Breast Cancer Walk near
downtown Houston. Fugro Survey also donated to the
British Heart foundation. A group of employees of Fugro
Pelagos participated in the Ronald McDonald House
Dinner Service: they prepared and served dinner for over
160 people staying there.
For over twenty years, Fugro has been assisting the Texas
Gulf Coast Regional Blood Center by conducting blood
drives 3 times a year at its Hillcroft headquarters.
On 28 October every year Fugro House turns PINK.
Employees show their support for the Breast Cancer
Campaign by raising money through various pink
initiatives: pink baking, pink clothing and even pink hair
adorns the offices of Fugro House.
Fugro, in conjunction with the Dutch Consulate in Rio de
Janeiro, supported the Municipality of Rio de Janeiro to
gather thousands of local participants in celebrating the
‘International Car-Free Day’ event that was held at the
famous ‘Aterro do Flamengo’ park. This opportunity was
used to promote cycling in Rio de Janeiro as part of a
healthy life style. The ‘Orange Squad’ distributed orange
bicycles and commemoratives tee-shirts sponsored by
Fugro. The 11km route, normally busy with hundreds of
cars driving towards downtown Rio, was used exclusively
for cycling and the participants were able to enjoy a calm
and peaceful environment amidst the spectacular
scenery on offer in the city of Rio de Janeiro. The crowd
was a mixture of addicted cyclists, amateurs, entire
families, and whoever was caught by the purpose of the
day.
Fugro’s companies in Hong Kong and China have been
sponsoring a scholarship programme for a secondary
school in Urad Qianqi, a city in Inner Mongolia, since
2010. Sixty poor students of the school receive financial
support from Fugro and with that support are able to
continue their studies without struggling for school fees.
Fugro provides support to universities and local school
by donating software and hardware, for instance in
Mexico.
In South Africa, Fugro continues to contribute to The
Homestead, a project to support street children. In 2011
the first Fugro Survey Africa ‘Santa Shoebox Project’ was
initiated. The money collected from staff and the
company was utilised to give 55 boys a bag with practical
necessities as well as some sweets, loads of games and
even some bulk food products for the Homestead itself
at Christmas.
Fugro Caspian cooperated with ‘Save the Children’ in
Azerbaijan: a small group of teenagers from a local
orphanage spent time at Fugro assisting with clerical
work. The boys were, for the first time, given the
opportunity to gain valuable work experience in a
professional environment.
As part of the Dutch ‘Fietsen4Fietsen’ (Cycling for
Bicycles) initiative, Fugro sponsored the purchase of
eight delivery tricycles for Africa.
Fugro also sponsors various sport events: the Abu Dhabi
Squash Rackets Association, the Abu Dhabi International
Triathlon and the Abu Dhabi Striders Half Marathon.
The Rugby football festival in the United Arab Emirates

68
was also sponsored by Fugro. Fugro Survey and Fugro
Marine Services support the team of rowing boat De Rijp
which participates amongst other in the annual
Harlingen-Terschelling rowing boat race. The team
consists of students from the Maritiem Instituut Willem
Barentz. Three Fugro teams (altogether twenty men)
entered into the Institute of Civil Engineering (ICE)
5-a-side football tournament.
These are just some examples of Fugro’s contribution to
local communities, which vary from large projects to
small contributions.
Participation in industry-related organisations
and research institutes
In addition to research activities, which is part of its core
business, Fugro is actively involved with several related
matters and social initiatives. The company takes an
active role in a wide variety of committees, boards of
management and institutes such as, the Houston
Weather Museum, the Alliance for Coastal Technology,
the Gulf of Mexico Coastal Ocean Observing System
Regional association and the Society for Underwater
Technology Houston Branch. In Australia, Fugro is on
the Advisory board of the Curtin University and the
National Board of the Australian Society of
Hydrographers (AHS). In the Netherlands Fugro has a
seat on the board of NIOZ (Netherlands Institute for Sea
Research).
Fugro is currently holding the chairmanship of the
International Association of Geophysical Contractors
(IAGC), an industry body in which the geophysical
contractors work togheter on topics such as technical
and contract standards, the environmental impact of
geophysical operations and advocating the multi client
model.
Worldwide, Fugro has established long-term
relationships with major universities and supports
higher education through scholarships, financial
support of PhD students, financing research and
supports an active involvement of Fugro employees on
the committees and boards of educational
establishments such as the University of Newcastle, the
Technical University of Catalonia, Memorial University
in Canada, the University of New Hampshire, Curtin
University in Australia, Georgia Tech., Delft Technical
University, Heriot Watt University in the UK and Wuhan
University in China.
Fugro has formed a close alliance with the Earth Sciences
Department of Royal Holloway, University of London to
accredit its geoscience training programmes. In 2011 the
alliance delivered its first postgraduate diploma in
Applied Petroleum Geosciences to a number of personnel
from a conglomerate of Libyan oil companies. Despite
the unrest in their home country Fugro could support
the participants such that 85% of the attendees reached
the required standards, some even achieving distinction
grades for their postgraduate qualification. Especially
the Fugro Geoscience division has a long history of
supporting universities. The first was the Technical
University in Delft in the early 90’s and today they have
over 15 active agreements with universities around the
globe supporting research consortia and often donating
software that is used in classroom, thesis projects and
research consortiums. The most recent agreement was
with the Department of Geology at the University of
Malaya, the oldest geology department in Malaysia.
In the United States Fugro organised a number of
industry workshops including the IMarEST (Marine
Engineering, Science and Technology) / SUT Metocean
Awareness Course in Houston.
Fugro is actively helping to develop industry guidelines
and standards and supported the industry committee

69Corporate Social Responsibility
that has produced guidelines and technical notes under
the auspices of the International Oil and Gas Producers
Association (OGP) for the conduct of offshore drilling
hazard surveys. Fugro further played a leading role in
the OGP/IMCA (International Marine Contractors
Association) workgroup that was set up to revise and
upgrade a guideline for the use of offshore positioning
systems, which is important as positioning services can
have an effect on safety at sea and are instrumental in
the quality of the work that is delivered. The effort
resulted in the publication of the new ‘Guidelines for
GNSS positioning in the oil & gas industry’ by OGP/IMCA,
a guiding document that is now widely adopted by the
offshore industry.
Fugro has a leading role in both the Society for
Underwater Technology Offshore Site Investigation and
Geotechnics Committee (SUT OSIG) and the Offshore Site
Investigation Forum (OSIF). This is a forum of world
experts in the geotechnical and geophysical aspects
of offshore site investigation. The committee is an
acknowledged source of the highest level of technical
advice to the industry and government bodies. Current
initiatives in which Fugro are participating include
membership in the SUT OSIG Working Group on
Developing Guidance Notes on Site Investigations for
Offshore Renewable Energy Projects and Fugro provides
the chairman of an OSIF Working Group on the
Development of Guidance on Well Top Hole Prognosis
Fugro is active in several technical subcommittees of
the International Standards Organisation (ISO) and has
contributed to the development of new standards for
marine soils investigations, marine geophysical
investigations and is currently working on a standard
that relates to offshore jack-up rigs. In addition, Fugro is
an ISO national committee member for offshore related
matters and also provides the chairman of the NNI
(Dutch Standards) sub-committee for geotechnical
investigation techniques. Fugro is the secretary of the
International Society for Soil Mechanics and
Geotechnical Engineering (ISSMGE) committee for
offshore geotechnics and is a member of the ISSMGE
committee on in-situ testing.
S u s t a i n a b l e d e ve l o p m e n t / e n v i r o n m e n t
One aspect of the general business principles (GBP) is
Fugro’s continuing commitment to sustainable
development. This requires the organisation to make
a balanced consideration of its short and long-term
business interests and the integration of social, economic
and environmental considerations during the
commercial decision making process. Because of its
global presence and decentralised structure, Fugro
endeavours to keep in balance the limited or lack of
local regulation and legislation in some countries and
the high standards the organisation wishes to pursue.
Fugro’s services are aimed at efficiently deploying
personnel and equipment for the collection and
interpretation of data and providing installation support
services. The organisation also acts as an advisory body.
Fugro does not own or operate large-scale production
facilities that might have an impact on the environment.
Its main focus is on environmental aspects associated
with the deployment of the equipment and offices from
which Fugro operates.
Fugro had made it its goal that by the end of 2011 all
large, operational subsidiaries would have a certified
environmental management system according to
ISO 14001 or equivalent. By the end of 2011, almost
85% of these subsidiaries were certified or close to
certification.
Wo r k i n g e n v i r o n m e n t
Partnership for Growth
The global human resources initiative Partnership for
Growth was first introduced to the organisation in
December 2010. Fugro’s diverse business activities and
global presence create good potential for development
of its employees. Partnership for Growth is designed to
achieve personal growth and for the organisation to
harmonise this with its overall business goals.
Built as a series of interlinked modules, the Partnership
for Growth is a set of tools and processes which assist the
daily management of our people resources, aligning
personal career ambitions with the overall goals and
objectives of the company. Fundamentally underpinning
all these activities is a regular, structured, open
communication between manager and employee,
ensuring clarity surrounding job role, performance,
and career direction.

70
The Induction module was successfully launched in June
2011, and has been well received and effective. The
Performance and Personal Development (PPD) process
was also introduced in 2011. The full PPD process takes
the form of an annual cycle, starting with target setting,
and ending with performance appraisal with at least one
interim review. An online survey conducted in June 2011
showed that 70% of OpCos had adopted the new tools,
with the remainder able to make slight modifications to
their existing processes. Approximately 55% reported
that appraisals had already taken place, despite being
part way through the year.
With these initiatives Fugro continues to build the
framework it needs to develop a global workforce that is
able to meet its clients’ needs now and in the future.
Fugro Academy
The Fugro Academy has been operating for five years.
In that time, the range of courses has grown, but the core
essence of developing technical and business skills in our
staff has remained the same. The vision that everyone
will have access to the Fugro Academy remains a strong
focus and has driven the expansion of Fugro Academy
use into all of the Fugro operating companies. This has
facilitated the global access to and sharing of Fugro
knowledge that was one of the objectives in the original
concept.
Technical training in Fugro systems and processes
remains a core capability for Fugro Academy. By
developing a global training team to deliver training at
OpCo locations, Fugro Academy is able to support
Fugro’s needs to standardise service delivery to clients.
One of the benefits of a global organisation is high
standards service quality and Fugro Academy assists in
that objective.
Offshore survey training is an example of how Fugro
Academy has developed courses for the many operating
companies working in this sector. Over the five years of
its existence, almost 50 offshore survey courses have
been developed by internal trainers and senior field staff
who now pass on their knowledge and experience
to newer staff members. By the end of 2011, over
900 courses had been delivered in over 21 countries to
6,800 staff resulting in 32,000 days of training.
E-learning continues to be developed as a means of
delivering training and development opportunities to an
international pool of staff. As well as a rich selection of
commercially available courses, over 250 Fugro courses
have been developed to support staff development.
The e-learning software used by Fugro Academy is also
available to Fugro operating companies to allow them
to develop courses locally, or adapt corporate courses to
local needs. A good example of how this takes place is
Brazil, where various courses have been translated into
Portuguese by a local e-learning expert to support the
local staff.
Fugro Academy started to introduce the concept of
mobile learning during 2011 through several pilot
projects. Due to the nature of the Fugro business, many
staff have difficulties accessing e-learning due to limited
internet access, for example at sea. To support these staff
during their working day and beyond, Fugro Academy
has introduced a mobile learning platform that allows
staff to download courses and take them on any
computer.
Diversity & opportunities
In Fugro’s business structure, local operating companies
operate autonomously within the framework of the
group’s policy, business principles and internal risk
management systems. As a global organisation,
operating in more than 60 countries, diversity is
inextricably part of Fugro’s business. Whenever possible,
staff is recruited locally, and is offered local training and
development opportunities. In this way, a balanced
reflection of the countries in which Fugro operates is
realised which contributes to successful operations
because Fugro benefits from the local expertise in
understanding business practices, laws and customs.
At the same time, being a global employer, Fugro offers
career opportunities worldwide which naturally results
in diversity because of the many different ethnicities
within the workplace. Though working with people from
various cultural backgrounds is at times challenging,
it adds value in that it provides a learning environment

71Corporate Social Responsibility
where people have an open mind and appreciate and
respect each others qualities. In this way constructive
cooperation between professionals leads to innovation
and global quality solutions for Fugro’s clients.
With an ongoing focus on demonstrating our
commitment to our stakeholders for sustainable global
growth, diversity will always be a natural business
outcome for Fugro.
employment benefits
Fugro promotes commitment and rewards effort and
results; for this reason f lexible reward systems and an
option plan have been in place for many years.
Employee pension schemes and other such benefits are
maintained on behalf of the company’s staff, taking into
account local customs and regulations.
Health and safety
Fugro is committed to working to eliminating hazards
and preventing all incidents. Therefore it is important
that a longer term strategic view of HSE is taken which
aims to further develop our culture and ensure good and
continually improving health, safety and environmental
performance. Fugro will continue to strengthen its HSE
culture through leadership, stakeholder engagement
and effective policy implementation. In 2011, a four year
strategy (2012-2015) has been developed to promote the
HSE principles and to build on the success of improving
global standards and implementing a consistent
approach to HSE throughout the organisation.
The Fugro organisation is diverse with many HSE risks
which need to be managed locally; each division has a
HSE strategy which addresses their own operations
within the corporate framework. Management and
employees at all levels within the organisation are key to
delivering the strategy and are expected to be actively
involved in ensuring good health, safety and protection
of the environment. This system ties in with Fugro’s
business principles, which state that the operating
companies will carry out their activities independently
in accordance with instructions and supervision from
Fugro. The operating companies are supported by a
dedicated team of HSE advisors.
The incident performance indicators for 2011 show that
Fugro’s safety program continues to result in
improvements. The recordable incidence and lost time
injury frequency in 2011 reduced 11% and 14%
respectively (per 1 million manhours worked) compared
to 2010.
Fugro strives to achieve incident ratios which are in line
with the benchmarks that are appropriate for the
industries in which Fugro works, such as to achieve an
LTIF (Lost Time Injury Frequency) of less than 0.5 per
1 million work hours (benchmark set by the
International Association of Oil and Gas Producers).
The part of Fugro’s services that relates to this segment
showed a LTIF below 0.5 in 2011.
In 2011 the Golden SAM (Safety Always Matters) was
awarded to Fugro Subsea Services Ltd. in Aberdeen and
Fugro Airborne Surveys (Pty) Ltd. in Johannesburg for
best overall and consistent HSE performance.
In 2010 Fugro engaged a team of safety experts from a
leading industrial company to assist with the execution
of an employee safety perception survey. A total of
1,600 randomly selected employees participated. From
the survey it can be concluded that:
• Safetyisconsideredavaluebytheorganisation,
• EmployeesconsidertheFugroHSEManagement
System of high quality,
• Safetyrulesareobeyed,
• Individualsfeelempoweredtotakeaction.
Further involvement and engagement of the workforce,
particularly in incident investigation and development
of (local) procedures, training and recognition of safety
achievements were indicated as areas for improvement.
The outcome of this employee safety perception survey
has been valuable input for goal setting and defining the
priorities for Fugro’s HSE strategy for the next four
years.

72
Health campaign
Fugro believes that health awareness contributes to the
well being of the employees and the company launched
a ‘Fit for the Job’ wellness campaign in 2010. This
campaign, built on the character of SAM (Safety Always
Matters) aims to encourage employees to start or
continue personal wellness activities while on the job.
In 2011 the operating companies were encouraged to
support and promote the initiative. Examples include;
• Fugro Companies in the uSA have actively participated
in the ‘Fit for the Job’ initiative, recognising the
importance of having a healthy workforce. In 2011
a voluntary biometric screening of all staff was
undertaken to determine the key areas of focus for the
US health initiative. In addition, two newsletters were
issued with articles on specific aspects of health and
wellness, success stories and the two competitive
programs that were completed during the year. The first
program was called ‘Walk around the world’, in which
different regions competed against each other to see who
could amass the greatest number of hours exercised over
a three month period. Equating it to miles walked, over
the three month period of the program participants
logged 125,000 miles equivalent of exercise. The second
was the ‘Biggest Loser’ Campaign that pitched
individuals against each other in a weight loss
competition. Participants lost more than 600lbs of
weight in total.
• Fugro Netherlands, For many years, Fugro staff in the
Netherlands participate in international running events
such as the Zevenheuvelenloop (Nijmegen) and the City-
Pier-City (The Hague). But they also show up in other
major international sport events in rowing, football and
cycling.
In August 2011 the first Dutch edition of the
‘Fit for the job’ newsletter was issued, in which the
availability of free company fruit was announced and
employees were invited to follow introductory lessons in
the local fitness-centre. At the end of the year a special
sports exhibition was held to make all the Leidschendam
employees aware of the coming ‘Fit for the Job’ activities.

73Risk Management
G e n e r a l
Fugro’s risk management policy is aimed at the long-
term sustainable management of its business activities
and the limiting or, where meaningful, hedging of the
associated risks. Due to the wide diversity of markets,
clients and regions and its broad portfolio of activities,
quantifying all the existing risks relevant to the Group as
a whole is virtually impossible. Risks are, however,
quantified wherever possible and useful. This applies
amongst others to the influence of the exchange rate of
the US dollar, the Norwegian kroner and the British
pound. See page 28.
Strengths
• Consistentexecutionofstrategyasanindependent
service provider
• Goodmarketpositioninmanynichemarkets
worldwide
• Professionalemployeeswhoreceivecontinuous
additional training
• High-qualitytechnologyandservicesprovision
• Wellfunctioningfinancialandriskmanagement
systems
• Cooperationbetweenbusinessunits
• Healthyfinancialposition
Weaknesses
• Sensitivitytorapid,sharpf luctuationsin,amongst
others, the exchange rate of the US dollar, the
Norwegian kroner and the British pound
• Muchoftherevenuedependsoninvestmentbythe
oil and gas industry
Opportunities
• Increasedinvestmentbytheoilandgasindustry,
amongst others related to depletion of existing fields
• Increasingdemandforoilandgaswithagrowing
world population
• Optimisationofexistingoilandgasfields
• Moreandlargerinfrastructureprojects,including
coastline protection and pipelines
• Developmentsinunconventionaloilandgasfields
• UpcomingmarketssuchasBrazil,IndiaandChina
• Increasingdemandfornon-fossilenergysources
Threats
• Economicandfinancialinstabilityasaresultofthe
euro crisis
• Politicalinstabilityincountriesand/orregions
important to Fugro
• Paymentriskofclientswithlowfinancialstrength
• Pressureonpricesbyclientsasaresultoflower
demand and/or overcapacity in certain market
segments
• Strongdecreaseoftheoilpricecomparedtothe
present level of USD 100 per barrel (WTI), leading to
lower investments by the oil and gas industry
• Offshoreoperationsinanumberofregionsaround
the globe are vulnerable to acts of piracy
• Cutsingovernmentspending
O p e r a t i o n a l
Activity portfolio
Although the core activities show a high degree of
cohesion, they also target highly diverse markets, clients
and regions. A high proportion of the activities is related
■ R i s k M a n a g e m e n t
F u g r o ’s l o n g - t e r m r i s k s a r e l i m i t e d d u e t o :
• Thediversityofactivitiesinmorethanone
international market segment
• Noclientswithcontractsaccountingformore
than around 4% of Fugro’s total annual
revenue
• Useofownmoderntechnologiesand
professional employees
• Theabilitytoadjustquicklytoexchangerate
and price changes as most contracts are of
short duration
• Geographicalspreadoftheactivities
• Abalancedandf lexiblevesself leet
composition (owned and chartered)
• Currentliabilities(EUR856million)amountto
22% of the balance sheet total
• Limitedriskrelatedtopensionobligations
• Goodinternalriskmanagementandcontrol
systems
• Partofthe(manpower)capacitybeinghired-in
on a f lexible basis, among which free lance
staff
• Strongfinancialpositiontosupportfuture
growth

74
B r e a k d ow n r e ve n u e p e r
c u r r e n c y (for the year 2011)
B r e a k d ow n r e ve n u e p e r
s e c t o r (for the year 2011)
Overig
Mijnbouw
Bouw en infra
Olie en gas
Oil and gas
Infrastructure
Mining
Other
3%
75%
3%
19%
Others
EUR
GBP
USD
50%
13%
27%
10%
Others
USD
GBP
EUR
to the oil and gas industry. Fugro’s dependence on the
more cyclic investment in oil and gas exploration and
development is balanced by its involvement in the more
stable investments in oil and gas production. The other
activities are dependent on developments in markets
that include infrastructure, construction and mining.
The influence of positive and negative economic effects
is further moderated by:
• Cohesionbetweenabroadrangeofservicesprovided
to different markets
• Goodgeographicalspread
• Beinganindependentserviceprovidertoadiverse
base of clients
• Strongmarketpositions
• SizeoftheGroup
Contract flow and price changes
Some of Fugro’s contracts are awarded on the basis of
long-term preferred supplier agreements. In the course
of a year Fugro often carries out several projects for the
same client. The projects carried out for any single client
do not, however, account for more than around 4% of the
total annual revenue. Having a large number of clients
supports Fugro’s independence and improves its stability.
To carry out its projects Fugro has at its disposal highly
trained employees and many technically advanced and
therefore expensive equipment. Much of Fugro’s work
involves short-term contracts. Fugro is, to a degree,
sensitive to price changes and sudden changes in
exchange rates, although it can adapt relatively quick
due to the general short term duration of projects.
Fugro’s budgets are, to a great extent, based on the
expected investments by the oil and gas industry. Unless
there is a structural drop in the oil price to less than
around USD 80 per barrel (WTI), it is not anticipated that
substantial (up or down) f luctuations in oil prices will
lead to a rapid change in these investments.
Capacity management
Fugro is constantly alert for signals that indicate changes
in market conditions so it can react quickly and
appropriately. Sudden and unexpected changes in
market conditions are, however, always possible. Some
of Fugro’s survey activities can precede investment by
clients and generally take place at the start of project
or investment cycles of clients. This means Fugro’s
activities can be the first to be affected by changes in
market conditions. Postponement and interruption to
the f low of orders can lead to temporary shortfalls in
revenue due to under-utilisation of capacity.
The weather and the availability of vessels are key factors
for offshore activities in particular. Weather influences
are calculated into the budgets and tend to average out
over the year and the regions in which Fugro is active.
As far as vessels are concerned, Fugro’s objective is to
operate a balanced f leet in which around 50% of the
vessels are owned and around 30% are on mid-term or
long-term charter basis. Approximately 20% of the f leet
is chartered on short term or a project basis.
The fact that Fugro is deploying heavy and specialist
Streamer deployment onboard the seismic vessel ‘Geo Atlantic’2007

75Risk Management
equipment does mean that the risk of capacity under-
utilisation will increase. At the same time, the exchange
of manpower and equipment between the various
business units can improve capacity utilisation.
The deployment of expensive (marine) equipment also
leads to risks with regard to loss of revenue due to
equipment break downs. Part of the staff is appointed on
a temporary basis or works on a freelance basis,
providing Fugro a certain f lexibility to respond to
variations in manpower needs.
F i n a n c i a l
Balance sheet
Fugro follows an active policy to optimise its balance
sheet ratios in order to limit financial risks and maintain
its long-term solvency. Being quoted on the stock
exchange provides a worthwhile contribution towards
achieving the (financial) targets and it enables Fugro
to make a well considered selection of the optimal
financing mix when considering larger investments
and acquisitions.
Future interest rate risks are limited to bank loans.
Fugro’s objective is to limit the effect of interest rate
changes on the results.
Research costs are charged directly to the results. Fugro
has evaluated the book value of its assets, including
goodwill, within the framework of its normal balance
sheet evaluation. This has shown that no impairment
of any tangible or intangible asset is necessary.
Currency exchange rate conversion
Fugro limits its susceptibility to changes in foreign
currency variances, but is not immune to exchange rate
variances caused by rapid changes to the rates versus the
Euro (which is the reporting currency). Besides that,
changes in exchange rates will result in translation
differences. As most of Fugro’s revenue in local
currencies is used for local payments, the effect of
negative or positive currency movements on operational
activities at a local level is minimal. Fugro’s international
monetary streams are limited and mainly in US dollars,
US dollar related currencies the Euro, the Norwegian
kroner and the British pound. Where possible and
desirable, forward exchange contracts are executed.
Fugro strives to match assets and liabilities in foreign
currencies. Rapid and radical changes in exchange rates
can also influence the balance sheet and profit and loss
account, partly due to the length of time between
tenders being submitted and orders being awarded or
delayed, during which period forward exchange hedging
contracts would not be appropriate. This creates an
additional foreign currency risk that cannot be
quantified in advance. At the Group’s current structure
and size, a rate difference of 10% on the USD would
affect profit by EUR 2 million and revenue by
approximately EUR 107 million. A rate difference of 10%
on the GBP would affect profit by EUR 3.5 million and
revenue by approximately EUR 42 million. For a 10%
rate difference of the NOK the effect on profit is
EUR 5 million and on revenue by approximately
EUR 15 million.
Pension provisions
Fugro maintains pension schemes for its employees in
accordance with regulations and customs which prevail
in each of the countries in which Fugro operates.
Since 1 January 2005 Fugro operates an average salary
based pension scheme in the Netherlands. This is
classified as a ‘defined benefit’ scheme. The pension
E x c h a n ge r a t e s
(in EUR)
uSD end of period
uSD average
GBP end of period
GBP average
NOK end of
period NOK
average
31 December 2011 0.77 0.71 1.20 1.15 0.129 0.129
30 June 2011 0.69 0.70 1.11 1.14 0.129 0.128
31 December 2010 0.75 0.76 1.16 1.17 0.128 0.125
30 June 2010 0.81 0.76 1.22 1.16 0.126 0.125
31 December 2009 0.69 0.72 1.13 1.13 0.121 0.115
30 June 2009 0.71 0.75 1.17 1.12 0.111 0.112
31 December 2008 0.71 0.68 1.05 1.25 0.102 0.125
30 June 2008 0.63 0.65 1.26 1.28 0.125 0.121

76
However, at a global level, the connection between every
operating company’s LAN and that of any other Fugro
company or the ‘outside world’ is monitored and
controlled by a dedicated team of ICT security specialists,
using state-of-the-art ‘firewall’ systems and other ICT
security related systems.
Fugro maintains a dedicated ICT security team consisting
of a global ICT security officer and eight regional ICT
security personnel. This team is responsible for
maintaining and monitoring the security aspects of
Fugro’s ICT infrastructure, such as access to the internet,
e-mail and intranet applications. The ICT security team is
independent from the ICT support staff in the operating
companies.
As a group, Fugro works to mitigate ICT related risks
through a variety of measures, which are constantly
under review:
• Theadoptionofnewthirdpartysoftwareand
software upgrades (such as that used in the office
environment) is generally delayed until sufficient
time has passed to prove that the software is stable
and does not pose a security risk. Once adopted for
use, critical ‘patches’ to fix software bugs are applied
as they become available.
• Proprietarysoftwareissubjecttocomprehensive
testing procedures before operational use.
• Accesstoclientdataandotherconfidential
information is restricted to specific people in the
operating company concerned, who have a legitimate
reason for such access.
• Fugro’scentralwebhostingfacilitiesareprotected
by high-end web application firewalls specifically
designed to protect the applications from known
attack vectors.
• DatacommunicationswithinFugro’sglobalwidearea
network (WAN) are channelled over an encrypted
virtual private network (VPN), the security of which is
monitored around the clock.
• Fugro’sICTsystemsareconstantlymonitoredfor
evidence of contamination by viruses or
‘malware’using a variety of independent means.
• AccessfromFugro’sWANto‘socialnetwork’sitesis
restricted for security reasons.
During the first quarter of 2011, Fugro brought in-house
the responsibility for the operation of a substantial
number of firewall devices previously outsourced to a
third party ICT security service provider. This transition
went smoothly according to plan and has resulted in
a number of practical and operational benefits to the
commitments in the Netherlands are fully re-insured on
the basis of a guarantee contract. The accrued benefits
are fully financed.
The employees of De Regt participate in the Metalektro
sector collective arrangement. There are no risks for
Fugro following this arrangement.
In the United States Fugro has a 401K system for its
employees. Fugro contributes towards the deposits of its
employees in accordance with agreed rules and taking
the regulations of the Internal Revenue Service (IRS),
the American federal tax authority, into account.
This system is free of risk for Fugro.
In the United Kingdom Fugro operates a number of
pension schemes. All the schemes available to new
employees are defined contribution schemes. There is
one defined benefit scheme open for long-serving
employees and there are other defined benefit schemes
which have been closed but which have on-going
obligations to their members. Measures have been taken
to ensure these obligations can be paid when required.
In the other countries where Fugro has organised
retirement provisions for its employees, obligations
arising from these provisions are covered by items
recognised in the balance sheet of the relevant operating
company.
Information and communication technology (ICT)
Fugro relies on a range of ICT systems (including
hardware, software, computer networks and
communication links) to manage its business, support
operations and to deliver many of the advanced
technological solutions which help to differentiate the
company in the marketplace. While much of the office
based hardware and software used by Fugro are proven
off-the-shelf products, Fugro actively develops
proprietary hardware and software to facilitate its range
of specialist services and to strengthen its market
position.
Fugro’s global ICT infrastructure is designed to support
the needs of a decentralised global organisation in an
efficient, reliable and secure manner. The ICT needs of
individual Fugro companies vary according to the size
and operational activities of each company. Typically,
company managers have local responsibility for their
Local Area Network (LAN) infrastructure including its
support. At a local or regional level, operating companies
are encouraged to share ICT knowhow and support
services in order to generate efficiencies of scale.

77Risk Management
General Business Principles (code of conduct)
The Fugro General Business Principles govern how each
of the Fugro companies, which make up the Fugro
Group, conducts its affairs. See for further information
page 62. The General Business Principles were last
updated in November 2011. In particular the anti-bribery
section was updated and guidelines were added which
contain specific rules related to gifts, favours, hospitality
and payments to third parties. The General Business
Principles are posted on the website.
Corporate handbook
Fugro’s corporate handbook contains mandatory
instructions regarding many business aspects, including
risk management. This handbook is for the senior
management members responsible for further
application within the operating companies.
The corporate handbook is updated regularly.
Financial handbook
This handbook contains detailed guidelines for the
financial reporting. The financial handbook is for the
senior management and the controllers of all operating
companies. The latest update was issued in December
2011.
Insurance manual
The insurance manual contains detailed guidelines with
respect to risks to be insured. The insurance manual is
distributed to managers of all operating companies and
their employees who are responsible for insurances.
The latest update was issued in December 2011.
Information and communication technology (ICT)
Fugro endeavours to mitigate the risks associated with
ICT systems through a variety of measures. These are
described on page 76.
Project Management handbook
This handbook provides procedures in preparation to
and for the execution of projects. This handbook is used
by project managers. The latest update was issued in
October 2011.
organisation, not to mention cost savings. In the light
of these changes. Fugro commissioned an independent
audit by a third party of its ICT security systems and
procedures. The results from this audit, confirmed that
Fugro’s perimeter firewall configuration and related
systems are indeed robust and fit for purpose.
The audit also highlighted areas where further
enhancements could be made and form the basis for
a number of initiatives to be undertaken in 2012.
Insurance and legal risks
Fugro is insured against a number of risks. Risks related
to professional indemnity and general liability are
covered at a Group level. Equipment is insured locally
and local cover is arranged for risks associated with
normal business operations, such as insurance for the
vehicle f leet, the buildings and for employees.
Some operating companies are involved in claims, either
as the claimant or the defendant, within the context of
normal business operations. Where necessary proper
provisions have been accounted for in the financial
statements. Based on developments thus far, it is not
anticipated that Fugro’s financial position will be
noticeably affected by any of these proceedings.
With regard to items included in the annual report
adjustments to estimates are possible.
I n t e r n a l s y s t e m s
Due to the generally short-term nature of its
assignments, constant monitoring of its markets and its
operating and financial results is intrinsic to Fugro’s
modus operandi.
Clarity and transparency are an absolute must for
assessing and evaluating risks. These are fundamental
characteristics of the Fugro culture. Due to the wide
variety of markets, clients and regions and Fugro’s
extensive activity portfolio, the management of the
operating companies is responsible for the application
and monitoring of and compliance with the internal
control systems. The monitoring systems consist of the
internal control framework described below.
Survey vessel during iceberg profiling project, Notre Dame Bay, Newfoundland, Canada2009

78
external audit
The financial statements of Fugro and most of its
subsidiaries are audited annually by external auditors.
These audits take place on the basis of generally accepted
auditing standards. The performance of the external
auditor is evaluated annually. The current external
auditor, KPMG Accountants N.V., was appointed as Group
auditor by the Annual General Meeting of Shareholders
in 2010. In principle, the (re)appointment of the external
auditor will be on the agenda of the Annual General
Meeting of Shareholders in 2014.
Advisory roles
If necessary, professional external advice is sought of
third parties. The external auditor does not act in an
advisory capacity, except for occasionally due diligence
as part of mergers and acquisitions and activities relating
to the financial statements.
Safety
Key operational subsidiaries are externally certified in
accordance with OHSAS 18001 or equivalent. Compliance
audits are done by internal specialists and by external
agencies when re-certification has to take place. The last
update was issued in December 2011.
Quality
Where required Fugro operating companies work in
accordance with the relevant certificates such as
ISO 9001 or equivalent. Compliance audits are carried
out internally, by clients and by external agencies.
environment
Fugro has set a goal that all key operational subsidiaries
will have a certified environmental management system
according to ISO 14001 or equivalent. By the end of 2011,
almost 85% of these subsidiaries were certified or close
to certification. As with quality certification, compliance
audits are carried out, both internally and by external
agencies.
Whistleblowers arrangements
Employees have the possibility of reporting alleged
irregularities of a general, operational or financial
nature in any Fugro operating company, worldwide,
without jeopardising their legal position.
A whistleblower policy is posted on Fugro’s website.
D e c l a r a t i o n r e ga r d i n g r i s k m a n a ge m e n t
Taking the above into account, to the best knowledge of
and in the opinion of the Board of Management, Fugro’s
internal risk management and control systems as
described in this annual report provide a reasonable
assurance that the financial reporting does not contain
any errors of material importance and these systems
worked properly in the year under review.
Planning
The business plans of every Fugro unit are translated
into budgets. Adherence to the budgets is checked on a
monthly basis. Any unforeseen circumstances that arise,
or any substantial deviation from the budgets, must
be reported immediately by the management of the
operating company to the responsible division director.
The monthly reports submitted by the operational
management to Fugro include an analysis of the
achievements versus the approved plans and a forecast
for the coming period.
Authorisation level
Managers are bound by clear authorisation restrictions
regarding representation. Projects and contracts with
a value or risk that exceeds a specified amount must
be approved in accordance with the applicable
authorisation matrix which is updated from time
to time by the Board of Management.
Letter of representation
Every six months all managers and controllers of
operating companies and the responsible division
director sign a detailed statement regarding the financial
reporting and internal control.
Internal Audit
Regular and frequent internal audits of the various
operating companies are carried out. The findings are
reported directly to the responsible division director.
The findings are also shared with the Audit Committee.
Peer reviews
‘Peer reviews’ are also carried out on a regular basis.
A peer review involves a review of an operating company
by a team from other operating companies. The results
are reported directly to the responsible division director.
Audit Committee
The Audit Committee comprises three members of the
Supervisory Board and it ensures an independent
monitoring of the risk management process from the
perspective of its supervisory role. The Audit Committee
focuses on the quality of the internal and external
reporting, the effectiveness of the internal audits and the
functioning of the external auditor. Further information
on the Audit Committee is available on pages 17 and in
the terms of reference of the Audit Committee. These
terms of reference (included in the terms of reference of
the Supervisory Board) are posted on Fugro’s website.

79Corporate Governance
■ C o r p o r a t e G o v e r n a n c e
G e n e r a l
Fugro subscribes to the Dutch Corporate Governance
Code, which is based on the principle accepted in the
Netherlands that a company is a long-term alliance
between the various parties involved in the company.
The stakeholders are the groups and individuals who,
directly or indirectly, influence – or are influenced by –
the attainment of the company’s objects: e.g. employees,
shareholders and other lenders, suppliers, clients, the
public sector and civil society. The Board of Management
and the Supervisory Board have overall responsibility for
weighing up these interests, generally with a view to
ensuring the continuity of the enterprise, while the
company endeavours to create long-term shareholder
value.
It is very important for Fugro to achieve a balance
between the interests of its various stakeholders. Good
entrepreneurship, integrity, openness and transparent
management as well as good supervision of the
management are the starting points for Fugro’s
corporate governance structure.
D u t c h C o r p o r a t e G o ve r n a n c e C o d e
The Dutch Corporate Governance Code (Code) was
initially set up by the Tabaksblat Committee in
December 2003. Fugro’s corporate governance structure
was approved by the Annual General Meeting of
Shareholders (AGM) in May 2004. The Code was revised
in December 2008. On 10 December 2009 the Dutch
legislator designated the revised Code by decree as the
new corporate governance code as defined by section
2:391 Dutch Civil Code. For Fugro the Code became
effective retrospectively as per 1 January 2009 and
had hardly any consequences for Fugro’s corporate
governance structure. The full text of the Code is
available at www.commissiecorporategovernance.nl.
In accordance with the recommendations of the
Corporate Governance Code Monitoring Committee the
broad outline of Fugro’s corporate governance structure
and compliance with the principles and best practices
of the Code – including explanation of a few deviations –
was discussed in the AGM held on 6 May 2010. Since that
date no substantial changes have been made to the
corporate governance structure.
Each substantial change in the corporate governance
structure of Fugro and in the compliance of the Code
shall be submitted to the General Meeting of
Shareholders for discussion under a separate agenda
item.
B r o a d o u t l i n e C o r p o r a t e G o ve r n a n c e
s t r u c t u r e a n d c o m p l i a n c e w i t h t h e C o d e
The broad outline of Fugro’s corporate governance
structure is explained in this chapter and also on Fugro’s
website. All underlying documentation is posted on the
website.
Fugro’s corporate governance structure, its supervision
and the way it is reported are in line with the Code.
The Code contains principles and best practice provisions
that regulate relations between the Board of
Management, the Supervisory Board and the General
Meeting of Shareholders. The principles may be regarded
as reflecting the general views on good corporate
governance, which enjoy wide support. They have
been elaborated in the form of specific best practice
provisions. Companies may depart from the best practice
provisions. Departures may be justified in certain
circumstances. Each year Fugro indicates expressly in
the annual report to what extent it has applied the best
practice provisions in the Code and, if it did not do so,
why and to what extent it did not apply them.
Fugro takes the view that shareholders, the media,
corporate governance ‘rating agencies’ and proxy
advisors should carefully assess the reason for each and
every departure from the Code’s provisions and they
should avoid a ‘tick-a-box’ mentality. A shareholder
should vote as he sees fit. A shareholder who makes use
of the voting advice of a third party is expected to form
his own judgment on the voting policy of this adviser and
the voting advice provided by him.
Compliance with the Code in 2011
A full overview (‘Comply or Explain’-report) of Fugro’s
compliance with the Code in 2011 is posted on the
website. Fugro’s corporate governance structure is fully
in line with the recommendations in the Code except for
the points below. All deviations were approved earlier by
the General Meeting of Shareholders.

80
Principle IV.2
Maintaining its operational independence is crucial
for Fugro (see page 83 for a further explanation).
One of the ways to safeguard this independence is share
certification. Although the Code provides that the
certification structure is not meant as a protective
measure, Fugro has chosen, in the interest of its clients,
to also view the certification structure as part of its
protective measures. During the performance of its
assignments Fugro often receives extremely confidential
information. Fugro can only perform its assignments if it
can secure the confidential nature of such information
towards its clients.
The second reason for the certification structure is the
prevention of possible harmful effects as a result of
absenteeism in the shareholders’ meetings of Fugro.
Fugro considers it not to be in the interest of its
stakeholders in general that through absenteeism an
accidental majority can, based only on its own interest,
force through its opinion. To prevent this, ties in with
this Principle IV.2.
Best practice provision IV.2.1
In accordance with this provision the Board of the Fugro
Trust Office (or ‘Trust Office’) enjoys the confidence of
the holders of certificates and operates independently
of Fugro. One deviation from this provision is that the
terms of administration of the Trust Office do not
stipulate the instances in which and the conditions
under which holders of certificates may ask the Trust
Office to convene a meeting, except with respect of the
right to nominate a candidate for appointment to the
Board of the Trust Office (see further the explanation
on best practice provision IV.2.2).
Best practice provision IV.2.2
According to this provision the meeting of holders of
certificates may make recommendations to the Board of
the Trust Office for the appointment of a member to the
Board. The Board has decided that holders of certificates
representing at least 15% of the issued share capital in
the form of certificates of shares may request that a
meeting of holders of certificates is convened in order
to make recommendations for the appointment of a
member to the Board.
Best practice provision IV.2.5
According to this provision the Trust Office, in exercising
its voting rights, should be guided ‘primarily by the
interests of the holders of certificates, taking the
interests of the company and its affiliated enterprise into
account’. The articles of association and the terms of
administration of the Trust Office provide that if the
Best practice provisions II.1.1 and II.2.8
The term of appointment (1996) of one of the six
members of the Board of Management, Mr. K.S. Wester
(65), deviates from the first provision as he was not
appointed for a maximum term of four years. Also the
employment agreement (1981) with Mr. Wester does not
provide for a specific severance pay on termination of
employment. Fugro honours agreements that were
entered into long before the introduction of the Code in
2004. Mr. Wester will retire in June 2012.
Best practice provision III.3.5
The term of the appointment of the Chairman of the
Supervisory Board, Mr. F.H. Schreve, deviates from this
provision because he has already served as a member of
Fugro’s Supervisory Board for longer than twelve years.
Mr. Schreve was Chairman of the Supervisory Board
from 1983 until the AGM in May 2011 when he retired
and was succeeded by Mr. H.C. Scheffer. When
Mr. Scheffer passed away in September 2011. The
Supervisory Board asked Mr. Schreve to return as
chairman. Mr. Schreve was almost unanimously
(re)appointed as member of the Supervisory Board for a
term of one and a half years at an Extraordinary Meeting
of Shareholders (EGM) that was held on 14 December
2011. With this appointment, the EGM agreed with the
deviation from this best practice provision. See for
further details page 19.
Principle III.5 and best practice provision III.5.11
The Supervisory Board does not have a separate
remuneration committee and nomination committee.
In May 2005 the at that time separate remuneration
committee and nomination committee were, with the
approval of the AGM, amalgamated into one committee
that carries out the tasks in both areas. The reason for
the amalgamation was that a separate remuneration
committee and nomination committee (with separate
meetings) had proven impractical due to the fact that
the Supervisory Board is small and three of its members
are not resident in the Netherlands. The chairman of
the Remuneration and Nomination Committee is
Mr. G-J. Kramer who was a member of Fugro’s Board of
Management until the end of 2005. This is not fully in
compliance with the provision that the chairmanship of
the remuneration committee (but there is no separate
remuneration committee) is not filled by a former
member of the Board of Management.

81Corporate Governance
■ C O R P O R AT E I N F O R M AT I O N
C a p i t a l s t r u c t u r e
The authorised capital of Fugro amounts to
EUR 16,000,000 and is divided into:
(i) 96,000,000 ordinary shares, with a nominal value of
EUR 0.05 each;
(ii) 160,000,000 cumulative protective preference
shares, with a nominal value of EUR 0.05 each;
(iii) 32,000,000 cumulative financing preference shares,
with a nominal value of EUR 0.05 each, which can be
sub-divided into two series of 16,000,000 cumulative
financing preference shares; and
(iv) 32,000,000 cumulative convertible financing
preference shares, with a nominal value of EUR 0.05
each, which can be sub-divided into two series of
16,000,000 cumulative convertible financing
preference shares.
On 31 December 2011 the issued capital amounted to
EUR 4,069,649.05, divided into 81,392,981 ordinary
shares. No preference shares have been issued.
R e s t r i c t i o n s t o t h e t r a n s f e r o f s h a r e s
The Board of Management’s approval is required for each
transfer of protective preference shares, financing
preference shares and convertible financing preference
shares. The approval has to be requested in writing
stating the name of the intended acquirer of the shares
in question.
Ordinary shares may be transferred only to natural
persons. Notwithstanding the provisions of the
preceding sentence, the transfer of ordinary shares shall
not be possible if and insofar as the acquirer, either alone
or under a mutual collaboration scheme jointly with one
or more others, natural persons and/or legal entities,
either directly or – otherwise than as a holder of
certificates of shares issued with the cooperation of
Fugro – indirectly:
(i) is the holder of ordinary shares to a nominal amount
of one percent or more of the total capital of Fugro
issued in the form of ordinary shares
Trust Office exercises the voting rights, it will do this
in such manner that the interest of Fugro and its
enterprise, as well as the interests of all stakeholders,
will be safeguarded as best as possible (article 2 of the
articles of association and article 4 of the terms of
administration). The interests of some stakeholders need
not necessarily at all times run parallel with that of other
stakeholders. For example, some will have a short term
focus whilst others have a long term focus. It is up to the
Board of the Trust Office to, after balancing the interests,
come to a well considered decision on the exercise of the
voting rights. In addition, when considering the exercise
of voting rights the Board in any case takes into
consideration the (Dutch) law as well as the articles of
association and the terms of administration of the Trust
Office. The Board can (also) opt, for reasons of its own, to
not exercise the voting rights on the shares held by the
Trust Office.
Best practice provision IV.2.8
Based on the provisions of section 2:118a Dutch Civil
Code and article 18.2 of the terms of administration,
the Trust Office will provide a power of attorney to any
holder of certificates of shares who so requests, to
exercise the voting rights on the (underlying) shares
corresponding to the certificates held by the holder in a
shareholders’ meeting of Fugro. Holders of certificates of
shares can (also) choose to have themselves represented
in the shareholders’ meeting by a written power of
attorney. In specific situations the Trust Office can opt
not to provide a requested power of attorney, limit the
power of attorney or withdraw a power of attorney.
This applies for example in case a public offer for the
(certificates of) shares in the share capital of Fugro is
announced or is already made, but it applies also in
(other) circumstances in which granting a power of
attorney in the view of the Trust Office substantially
conflicts with the interest of Fugro and its enterprise
(article 18.3 terms of administration and section 2:118a
Dutch Civil Code). Therefore the deviation of this
provision of the Code is that proxies to vote are not
issued without any limitation and in all circumstances.
This deviation is of course the consequence of the fact
that the structure of share certification is also meant as
a protective measure.
Southern Ocean in transit to installation project2011

82
irrevocable resolution wholly or partially lifted the
restrictions limiting the transfer of ordinary shares,
to which lifting of restrictions conditions may be
attached.
If article 17 of the articles of association of Fugro is not
applicable, then article 11, sub 1 of the terms of
administration of the Trust Office is applicable. In
accordance with article 11, sub 1, a holder of certificates
of shares who as a result of conversion acquires ordinary
shares in the capital of Fugro may only transfer these
ordinary shares to a third party if he or she has first
offered these shares to the Trust Office. Also applies that
the holder of certificates who as a result of conversion
acquires ordinary shares in the capital of Fugro, during
the period that article 11, sub 1 is applicable shall:
(i) not encumber the acquired shares with a right of lien
or a right of usufruct, whereby the voting right on
these shares shall be granted to the holder of the right
of lien or the usufructuary; and
(ii) not grant a proxy to vote on the acquired shares nor
accept any voting instructions from third parties
regarding the manner in which he exercises the
voting rights on these shares.
S u b s t a n t i a l i n t e r e s t s i n F u g r o
As far as Fugro is aware of, the shareholders with an
interest in Fugro’s share capital of more than 5% are
reported on page 12.
P r o t e c t i ve m e a s u r e s ( e x t r a o r d i n a r y c o n t r o l
r i g h t s ; l i m i t a t i o n o f v o t i n g r i g h t s )
When carrying out assignments Fugro can have access to
clients’ extremely confidential information. For this
reason Fugro can only carry out its activities if it can
safeguard its independence in relation to its clients.
The main point of Fugro’s protection against a hostile
takeover depends on the one hand on certification of
the ordinary shares and, on the other hand, on the
possibility of Fugro to issue cumulative protective
preference shares. In addition to this, protective
preference shares may also be issued by the Fugro
subsidiaries Fugro Consultants International N.V.
and Fugro Financial International N.V. to Stichting
Continuïteit Fugro (see pages 84). The primary
aim of the protective measures is to safeguard Fugro’s
independence in relation to its clients.
(as of 31 December 2011 one percent equalled
813,929 shares); or
(ii) through such transfer would acquire more than one
percent of the total capital of Fugro issued in the form
of ordinary shares.
The restrictions to the transfer of ordinary shares stated
above are not applicable to:
(a) the transfer of ordinary shares to Fugro itself or to
a subsidiary of Fugro;
(b) the transfer or issue of ordinary shares to, or the
exercise of a right to subscribe for ordinary shares by,
a trust office or to another legal person, if in respect
of such a trust office or other legal person the Board
of Management with the approval of the Supervisory
Board has by an irrevocable resolution wholly or
partially lifted the restrictions limiting the transfer
or issue of ordinary shares, to which lifting of
restrictions conditions may be attached; in respect
of another legal person as referred to above, such
restrictions may be lifted only to the extent that such
may be required to permit that legal person to avail
itself of the facility of the participation exemption,
as at present provided for in section 13 of the
Corporation Tax Act 1969;
(c) the transfer of ordinary shares acquired by Fugro
itself or the issue by Fugro of ordinary shares, if such
a transfer or issue takes place within the framework
of either a collaborative arrangement with or the
acquisition of another enterprise, or a legal merger,
or the acquisition of a participating interest or the
expansion thereof, in respect of which the Board of
Management with the approval of the Supervisory
Board by an irrevocable resolution has wholly or
partially lifted the restrictions limiting the transfer
or issue of ordinary shares, to which lifting of
restrictions conditions may be attached;
(d) the transfer or transmission of ordinary shares to
shareholders who on 31 March 1992 were recorded as
shareholders in the shareholders’ register of Fugro,
if in respect of such a transfer or transmission the
Board of Management, with the approval of the
Supervisory Board, by an irrevocable resolution
wholly or partially lifted the restrictions limiting the
transfer of ordinary shares, to which lifting of
restrictions conditions may be attached;
(e) the transfer or transmission of ordinary shares to
group companies of legal person-shareholders who on
31 March 1992 were recorded as shareholders in the
shareholders’ register of Fugro, if in respect of such
a transfer or transmission the Board of Management,
with the approval of the Supervisory Board, by an

83Corporate Governance
independence and/or continuity and/or identity of Fugro
and the relevant businesses, as well as all activities which
are incidental to or which may be conducive to any of the
foregoing. The Foundation aims to achieve its objects
independent from Fugro, by acquiring protective
preference shares and by exercising the rights attached
to such shares.
Fugro – in observance of the authority granted to the
Board of Management by the AGM of 2011 – on 8 March
2012 has entered into an option agreement with the
Foundation pursuant to which the Foundation was
granted the right to acquire cumulative preference
protective shares in Fugro’s share capital, each share
with a nominal value of EUR 0.05, up to an amount to
be determined by the Foundation up to a maximum
equal to 100% minus 1 share of the aggregate nominal
value of ordinary shares and preference financing shares
in Fugro that are held by third parties at the time the
right to acquire preference protective shares is exercised
by the Foundation. By entering into the option
agreement, the Foundation is in a position to achieve
its objects – i.e. safeguarding the company and its
businesses – autonomously, independently and
effectively should the occasion occur. The (Board of)
Foundation Protective Preference Shares operates
completely independent of Fugro. For the composition
of the Board of the Foundation see page 182.
S t i c h t i n g C o n t i n u ï t e i t F u g r o ( ‘ Fo u n d a t i o n
C o n t i n u i t y ’ )
The (call) option on protective preference shares granted
by Fugro Consultants International N.V. and Fugro
Financial International N.V. (both registered in Curaçao)
to Foundation Continuity has been approved by the AGM
in 1999. The objective of Foundation Continuity
corresponds to that of Foundation Protective Preference
Shares. The protective measures described above shall be
put up, especially in a takeover situation, when this is in
the interest of Fugro to protect its independence and also
in defining Fugro’s position in relation to that of the
raider and the raider’s plans and it creates the possibility,
when necessary, to look for alternatives. The protective
measures will not be put up to protect the Board of
Management’s own position. Due to the uncertainty
regarding the situations with which Fugro could be
confronted, the use of protective measures in
circumstances other than those described above cannot
be discounted. For the composition of the Board of
Foundation Continuity see page 181.
F u g r o Tr u s t O f f i c e ( ‘ Tr u s t O f f i c e ’ )
Only (non-voting) certificates of shares are listed and
traded on Euronext Amsterdam. These exchangeable
certificates are issued by the Trust Office and the Board
of the Trust Office exercises the voting rights on the
underlying shares in such manner that the interests of
Fugro and its enterprise, as well as the interests of all
stakeholders, are safeguarded as best possible. For the
composition of the Board of the Trust Office see page
181. The (Board of the) Trust Office operates completely
independent of Fugro.
Holders of certificates (and their authorised proxies):
• may,aftertimelywrittennotification,attendand
speak at shareholders’ meetings;
• areentitledtorequestfromtheTrustOfficeaproxy
to exercise the voting rights on the (underlying)
shares corresponding to their certificates. The Trust
Office may solely limit, exclude or revoke this proxy
if:
a) a public offer has been announced or made on the
(certificates of) shares of Fugro or if a justifiable
expectation prevails that such an offer shall be
made, without agreement thereon having
necessarily been reached with Fugro;
b) a holder of certificates or a number of holders of
certificates, in accordance with an agreement
between and among them to co-operate, together
or not, with subsidiaries, acquire at least 25% of
the issued capital of Fugro; or
c) in the opinion of the Trust Office, the exercise of
voting rights by a holder of certificates constitutes
a real conflict of interests with those of Fugro;
• may,providedtheyarenaturalpersonsandtheyhave
not entered into an agreement between and among
them to co-operate, exchange their certificates for
ordinary shares entitled to vote up to a maximum
of 1% of the issued share capital of Fugro per
shareholder.
S t i c h t i n g B e s c h e r m i n g s p r e f e r e n t e
a a n d e l e n F u g r o ( ‘ Fo u n d a t i o n P r o t e c t i ve
P r e f e r e n c e S h a r e s ’ )
The objects of Foundation Protective Preference Shares
are to attend to Fugro’s interests and of Fugro’s
businesses as well as the businesses of the entities that
form part of the Group, in such way that Fugro’s
interests and the interests of the relevant businesses as
well as the interests of all parties involved, are
safeguarded to the extent possible, and that Fugro and
the relevant businesses are defended to the extent
possible against factors that could negatively affect the

84
of Management and of the Supervisory Board; approval
of the profit appropriation; authorisation to acquire own
shares, to issue shares (or to grant rights to subscribe for
shares) and to restrict or exclude pre-emptive rights in
respect of shares; and approval of decisions to amend the
articles of association or to dissolve Fugro. In addition,
the following is discussed in the (Annual) General
Meeting of Shareholders: the annual report, changes to
the profile of the Supervisory Board, the dividend policy
and substantial changes in the corporate governance
structure of Fugro and in the compliance with the Code.
At least one (Annual) General Meeting of Shareholders is
convened each year. Extraordinary General Meetings are
convened as often as the Supervisory Board or the Board
of Management deems this necessary. The shareholders’
meeting is chaired by the Chairman of the Supervisory
Board. The Supervisory Board and the Board of
Management provide the shareholders’ meeting with all
the information requested, unless there is a very good
reason why providing the information would not be in
the interests of Fugro.
A p p o i n t m e n t a n d d i s m i s s a l o f m e m b e r s o f
t h e B o a r d o f M a n a ge m e n t a n d S u p e r v i s o r y
B o a r d
The members of both the Board of Management and the
Supervisory Board are appointed by the General Meeting
of Shareholders for a maximum period of four years on a
binding nomination of the Supervisory Board.
The binding nature of such a nomination may, however,
be overruled by a resolution adopted by an absolute
majority of the votes cast by the General Meeting of
Shareholders, provided such majority represents more
than one-third of the issued share capital. If this
proportion of the capital is not represented at the
meeting, but an absolute majority of the votes cast is in
favour of a resolution to cancel the binding nature of the
nomination, a new meeting may be convened at which
the resolution may be passed by an absolute majority
of votes, regardless of the proportion of the capital
represented at the meeting. If a binding nomination
has not been made or has not been made in due time,
O p t i o n s c h e m e
Fugro has a stock option scheme that was approved by
the AGM on 14 May 2008. Details of the option scheme
are described on page 12 of this Annual Report.
Employee options on ordinary shares are granted to the
members of the Board of Management and other
employees in such way that at any moment the
maximum number of outstanding options to acquire
ordinary shares in Fugro will not exceed 7.5% of the
issued ordinary share capital. In order to mitigate
dilution, it is Fugro’s policy to purchase own shares to
cover the option scheme with the result that no new
shares are issued when options are exercised. The total
number of options to be granted is subject to the
approval of the Supervisory Board as is the grant of
options to members of the Board of Management itself.
A g r e e m e n t s w i t h a s h a r e h o l d e r t h a t c o u l d
p r o v i d e a r e a s o n fo r l i m i t a t i o n o f t h e
t r a n s f e r o f ( c e r t i f i c a t e s o f ) s h a r e s
If article 11, sub 1 of the terms of administration of the
Trust Office is applicable (see also above), exchange of
certificates into ordinary shares is only possible if the
holder of certificates who acquires ordinary shares in the
capital of Fugro as a result of the exchange, shall accept
the stipulations pursuant to section 11, sub 1 of the
terms of administration.
F u n c t i o n i n g o f t h e G e n e r a l M e e t i n g
o f S h a r e h o l d e r s
The powers of the (Annual) General Meeting of
Shareholders are stipulated in legislation and in the
articles of association of Fugro and can be stated
concisely as follows: approval of decisions that would
cause a major change to the identity or character of
Fugro or its business; appointment and dismissal of
members of the Board of Management and of the
Supervisory Board; adoption of the remuneration policy
for the members of the Board of Management; approval
of the stock option scheme for the members of the Board
of Management; determination of the remuneration of
members of the Supervisory Board; adoption of the
financial statements; discharge of members of the Board
Fugro Saltire near a platform2009

85Corporate Governance
Au t h o r i s a t i o n o f t h e B o a r d o f M a n a ge m e n t
w i t h r e ga r d t o t h e a c q u i s i t i o n ( p u r c h a s e )
o f ow n s h a r e s a n d t h e i s s u e o f s h a r e s
Fugro regularly proposes to its shareholders to authorise
the Board of Management to acquire and to issue shares.
On 10 May 2011 the AGM authorised the Board of
Management for a period of 18 months as from 10 May
2011 until 10 November 2012, to, subject to the approval
of the Supervisory Board, cause Fugro to purchase its
own (certificates of) shares, within the limits set by the
articles of association, either through purchase on a
stock exchange or otherwise, at a price, excluding
expenses, not lower than the nominal value of the shares
and not higher than 10% above the average of the closing
price of the certificates of the shares on Euronext
Amsterdam for the five business days before the day on
which the purchase is made.
Also on 10 May 2011 the AGM designated the Board of
Management as the corporate body which is authorised
for a period of 18 months as of 10 May 2011 until
10 November 2012, to, subject to the approval of the
Supervisory Board,
(a) resolve on the issue of – and/or on the granting of
rights to subscribe for – all preference shares –
including both the cumulative protective preference
shares and the different kinds of financing preference
shares – and ordinary shares in which the authorised
capital is divided at the date of the relevant
resolution;
(b) restrict and/or to exclude pre-emption rights that
accrue to shareholders upon issue of (grant of rights
to subscribe for) ordinary shares and/or financing
preference shares.
the General Meeting of Shareholders may appoint a
Managing Director at its discretion.
Unless the resolution is proposed by the Supervisory
Board, the General Meeting of Shareholders may only
pass a resolution to suspend or dismiss a member of the
Board of Management or Supervisory Board with a
majority of two-thirds of the votes cast, which majority
represents more than one-half of the issued capital.
With regard to the overruling of the binding nature of a
nomination by the Supervisory Board and the decision
to suspend or dismiss a member of the Board of
Management or Supervisory Board, convening a second
General Meeting of Shareholders pursuant to section
2:120, subsection 3, Dutch Civil Code shall not be
permitted.
A m e n d m e n t o f t h e a r t i c l e s o f a s s o c i a t i o n
A resolution to amend the articles of association of Fugro
may be passed only on a proposal thereto of the Board of
Management with the prior approval of the Supervisory
Board and by a majority of at least two-thirds of the votes
cast at a General Meeting of Shareholders at which at
least one-half of the issued capital is represented. If at a
meeting at which the proposal to amend the articles of
association is to be considered, the required part of the
capital is not represented, then a second meeting may be
convened at which second meeting the resolution
to amend the articles of association may be passed,
irrespective of the part of the capital represented at
such meeting, provided such resolution is adopted by
a majority of at least two-thirds of the votes cast.
Insofar as a resolution to amend the articles of
association brings about a change in the rights vested in
the holders of protective preference shares or the
holders of financing preference shares or the holders of
convertible financing preference shares, such a
resolution shall require the approval of the meeting of
holders of protective preference shares or the meeting of
holders of financing preference shares or the meeting of
the holders of convertible financing preference shares,
as the case may be.
Fugro’s articles of association were last amended on
28 June 2010 and are posted on the website.

86
utilised. The facility may be cancelled in the event
of a ‘change of ownership’ of Fugro whereupon all or
part of the loans may become immediately due and
payable.
Credit facility with BNP Paribas S.A. of
EUR 100 million for five years. This agreement was
implemented in 2011 and EUR 55 million of the
facility has been utilised. The facility may be
cancelled in the event of a ‘change of ownership’
of Fugro whereupon all or part of the loans may
become immediately due and payable.
Credit facility with Barclays Bank Plc. of
EUR 75 million for five years. This agreement was
implemented in 2011 and EUR 41 million of the
facility has been utilised. The facility may be
cancelled in the event of a ‘change of ownership’ of
Fugro whereupon all or part of the loans may become
immediately due and payable.
Credit facility with ABNAMRO Bank N.V. of
EUR 50 million for five years. This agreement was
implemented in 2011 and EUR 27 million of the
facility has been utilised. The facility may be
cancelled in the event of a ‘change of ownership’
of Fugro whereupon all or part of the loans may
become immediately due and payable.
Credit facility with Credit Suisse A.G. of
EUR 50 million for five years. This agreement was
implemented in 2011 and EUR 27 million of the
facility has been utilised. The facility may be
cancelled in the event of a ‘change of ownership’
of Fugro whereupon all or part of the loans may
become immediately due and payable.
Credit facility with Rabobank of EUR 100 million for
five years. This agreement was implemented in 2008
and the facility has been fully utilised. The facility is
being repaid in quarterly instalments. The facility
may be cancelled in the event of a ‘change of
ownership’ of Fugro whereupon all or part of the
loans may become immediately due and payable.
The authorisation of the Board of Management with
respect to the issue of ordinary shares and /or to grant
rights to subscribe for ordinary shares was limited to
10% of the issued share capital of Fugro at the time of
the issue plus an additional 10% of the issued capital of
Fugro at the time of the issue in connection with or
on the occasion of mergers and acquisitions.
The Board of Management may resolve, with the
approval of the Supervisory Board, to dispose of shares
acquired by Fugro in its own capital.
C o n s e q u e n c e s o f p u b l i c b i d fo r m a j o r
a g r e e m e n t s
Fugro differentiates three categories of agreements as
referred to in the Decree on Section 10 EU Takeover
Directive:
a) Credit facility with Rabobank of EUR 150 million for
five years. This agreement was implemented in 2011
and EUR 82 million of the facility has been utilised.
The facility may be cancelled in the event of a ‘change
of ownership’ of Fugro whereupon all or part of the
loans may become immediately due and payable.
Credit facility with ING Bank N.V. of EUR 150 million
for five years. This agreement was implemented in
2011 and EUR 82 million of the facility has been
utilised. The facility may be cancelled in the event of
a ‘change of ownership’ of Fugro whereupon all or
part of the loans may become immediately due and
payable.
Credit facility with The Royal Bank of Scotland N.V.
of EUR 100 million for five years. This agreement was
implemented in 2011 and EUR 55 million of the
facility has been utilised. The facility may be
cancelled in the event of a ‘change of ownership’
of Fugro whereupon all or part of the loans may
become immediately due and payable.
Credit facility with HSBC Bank Plc. of EUR 100 million
for five years. This agreement was implemented in
2011 and EUR 55 million of the facility has been
Fugro Searcher surveying in the North Sea2010

87Corporate Governance
Pa y m e n t t o m e m b e r s o f t h e B o a r d o f
M a n a ge m e n t o n t e r m i n a t i o n o f e m p l oy m e n t
r e s u l t i n g f r o m a p u b l i c b i d
Fugro has not entered into any agreements with
members of the Board of Management or employees that
provide for a specific severance pay on termination of
employment as a result of a public bid within the
meaning of section 5:70 or 5:74 of the Dutch Act on
Financial Supervision. The employment agreements with
Messrs. Jonkman, Rainey, Van Riel, Rüegg and
Steenbakker do – in accordance with the Code – provide
for a general severance pay amounting to a maximum of
one year’s base salary which in principle is applicable in
the event of termination or annulment of the
employment agreement. These severance payments are
also applicable in the event that said persons in
reasonableness cannot continue to perform their
function any longer as result of a change in
circumstances such that continuing to fulfil their
function can no longer be asked of them. This could be
the case if Fugro is wound-up, merged or taken over, or
undergoes a far-reaching restructuring or a fundamental
change of policy. The employment agreement (1981)
with Mr. Wester (65) does not provide for a specific
severance pay on termination of employment or change
of circumstances. This means that general Dutch labour
law provisions are applicable. Fugro honours agreements
that were entered into long before the introduction of
the Code in 2004. Mr. Wester will retire in June 2012.
C o r p o r a t e G o ve r n a n c e s t a t e m e n t
This is a statement concerning corporate governance as
referred to in section 2a of the decree on additional
requirements for annual reports (Vaststellingsbesluit
nadere voorschriften inhoud jaarverslag) effective as of
1 January 2010 (the ‘Decree’). The information required
to be included in this corporate governance statement as
described in sections 3, 3a and 3b of the Decree can be
found in the following chapters, sections and pages of
this Annual Report 2011 and are deemed to be included
and repeated in this statement:
• theinformationconcerningcompliancewiththe
Dutch Corporate Governance Code, as required by
section 3 of the Decree, can be found in the chapter
on ‘Corporate Governance’;
• theinformationconcerningFugro’smainfeatures
of the internal risk management and control systems
relating to the financial reporting process, as
required by section 3a sub a of the Decree, can be
found in the chapter on ‘Risk Management’;
b) Private Placement USD loans. As described in
paragraph 5.46.2 of the Financial statements, Fugro
has concluded long term loans with American and
British institutional investors in 2002. The terms and
conditions of these loans provide that Fugro may
consolidate or merge with any other person or legal
entity if either a) Fugro shall be the surviving or
continuing person, or b) the surviving, continuing or
resulting person or legal entity that purchases,
acquires or otherwise acquires all or substantially all
of the assets of the company i) is a solvent entity
organised under the laws of any approved jurisdiction
(any of the following jurisdictions: the Netherlands,
The United States, Canada and any country which is a
member of the EU (other than Greece) at the time of
the date of the agreement, ii) is engaged in any similar
line of business as Fugro and iii) expressly assumes
the obligations of Fugro under this agreement in a
writing which is in form and substance reasonably
satisfactory to the holders of at least 51% of the
outstanding principal amount of the notes.
Fugro has also concluded long term loans with
American and British institutional investors in 2011.
In case of a ‘Change of Control’ Fugro shall give
written notice of such fact to all holders of the loan
notes. The notice shall contain an offer by Fugro to
prepay the entire unpaid principal amount of loan
notes held by each holder at 100% of the principal
amount of such loan notes at par (and without any
make-whole, premium, penalty or make-whole
amount whatsoever or howsoever described),
together with interest accrued thereon to the
prepayment date selected by Fugro.
c) Employee option agreements. The employee option
agreements stipulate that in the event of a
restructuring of the share capital of Fugro or a
merger of Fugro with any other legal entity, the
option holder is entitled for every option to such
securities, cash or other property as to which a
shareholder of Fugro is entitled per share
immediately prior to the restructuring or merger,
unless the option period is shortened by Fugro. In the
event of a restructuring of its share capital or merger
with another company, Fugro may shorten the option
period so as to terminate immediately prior to the
time at which the restructuring or merger is
effectuated. In the event that a public offer is
considered hostile and such offer is declared
unconditional, all options become immediately
exercisable.

88
• theinformationregardingthefunctioningofFugro’s
General Meeting of Shareholders, and the authority
and rights of Fugro’s shareholders and holders of
certificates of shares, as required by section 3a sub b
of the Decree, can be found in the chapter on
‘Corporate Governance’;
• theinformationregardingthecompositionand
functioning of Fugro’s Board of Management, the
Supervisory Board and its Committees, as required
by section 3a sub c of the Decree, can be found in
the relevant sections of the chapter on ‘Corporate
Governance’, the Report of the Supervisory Board
and on pages 14 and 22; and
• theinformationconcerningthedisclosureofthe
information required by the Decree on Section 10 EU
Takeover Directive, as required by section 3b of the
Decree, may be found in the chapter on ‘Corporate
Governance’.
This corporate governance statement is also available on
Fugro’s website.
Conducting seabed CPT operations from the back deck of the MV Meridian2011

1 Consolidated statement of comprehensive income 90
2 Consolidated statement of financial position 92
3 Consolidated statement of changes in equity 93
4 Consolidated statement of cash f lows 96
5 Notes to the consolidated financial statements 98
6 Subsidiaries and investments of Fugro N.V.
accounted for using the equity method 170
7 Company balance sheet 173
8 Company income statement 174
9 Notes to the company financial statements 175
10 Other information 180
10.1 Independent Auditor’s report 180
10.2 Subsequent events 182
10.3 Foundation Boards 182
10.4 Statutory provisions regarding the appropriation
of profit 182
10.5 Proposal regarding the appropriation of profit 183
Report of Stichting Administratiekantoor Fugro
(‘Trust Office’) 184
Historic review 186
Glossary 188
F U G R O N . V.
F i n a n c i a l s t a t e m e n t s 2 0 1 1

90
(EUR x 1,000) 2011 2010
(5.25) Revenue 2,577,765 2,280,391
(5.28) Third party costs (994,037) (765,587)
Net revenue own services (revenue less third party costs) 1,583,728 1,514,804
(5.29) Other income 23,860 21,902
(5.30) Personnel expenses (774,592) (723,141)
(5.35) Depreciation (220,984) (201,493)
(5.36) Amortisation of intangible assets (10,674) (8,111)
(5.31) Other expenses (252,008) (252,482)
Results from operating activities (EBIT) 349,330 351,479
Finance income 29,099 28,239
Finance expenses (42,548) (22,065)
(5.32) Net finance income/(costs) (13,449) 6,174
(5.38) Share of profit of equity-accounted investees (net of income tax) 4,721 1,018
Profit before income tax 340,602 358,671
(5.33) Income tax expense (45,332) (78,518)
Profit for the period 295,270 280,153
Attributable to:
Owners of the Company 287,595 272,219
Non-controlling interests 7,675 7,934
Profit for the period 295,270 280,153
(5.45) Basic earnings per share (EUR) 3.63 3.47
(5.45) Diluted earnings per share (EUR) 3.58 3.42
1 C o n s o l i d a t e d s t a t e m e n t o f c o m p r e h e n s i v e i n c o m eFor the year ended 31 December
The notes on pages 98 to 179 are an integral part of these consolidated financial statements.

91Fugro Financial statements 2011
(EUR x 1,000) 2011 2010
Profit for the period 295,270 280,153
Other comprehensive income
(5.32) Foreign currency translation differences of foreign operations 55,850 108,638
(5.32) Foreign currency translation differences of equity-accounted investees 24 121
(5.32) Net change in fair value of hedge of net investment in foreign
operations (53,218) 864
(5.33) Defined benefit plan actuarial gains (losses) (14,919) 735
(5.32) Net change in fair value of cash f low hedges transferred to profit or loss 1,034 1,034
(5.32) Net change in fair value of available-for-sale financial assets (1,899) (438)
Total other comprehensive income for the period (net of tax) (13,128) 110,954
Total comprehensive income for the period 282,142 391,107
Attributable to:
Owners of the Company 273,810 382,289
Non-controlling interests 8,332 8,818
Total comprehensive income for the period 282,142 391,107
1 C o n s o l i d a t e d s t a t e m e n t o f c o m p r e h e n s i v e i n c o m e ( c o n t i n u e d )For the year ended 31 December
The notes on pages 98 to 179 are an integral part of these consolidated financial statements.

92
2 C o n s o l i d a t e d s t a t e m e n t o f f i n a n c i a l p o s i t i o nAs at 31 December
(EUR x 1,000) 2011 2010
A s s e t s
(5.35) Property, plant and equipment 1,482,981 1,291,314
(5.36) Intangible assets 782,386 576,433
(5.38) Investments in equity-accounted investees 1,632 7,836
(5.39) Other investments 59,247 62,533
(5.40) Deferred tax assets 55,262 18,891
Total non-current assets 2,381,508 1,957,007
(5.41) Inventories 364,875 219,028
(5.42) Trade and other receivables 884,550 803,241
(5.34) Current tax assets 60,278 29,352
(5.43) Cash and cash equivalents 170,384 81,363
Total current assets 1,480,087 1,132,984
Total assets 3,861,595 3,089,991
E q u i t y
Share capital 4,070 4,014
Share premium 431,385 431,441
Reserves 932,735 800,644
Unappropriated result 287,595 272,219
Total equity attributable to owners of the Company 1,655,785 1,508,318
Non-controlling interests 18,349 14,929
(5.44) Total equity 1,674,134 1,523,247
L i a b i l i t i e s
(5.46) Loans and borrowings 1,215,173 590,862
(5.47) Employee benefits 98,320 76,100
(5.48) Provisions 4,215 5,204
(5.40) Deferred tax liabilities 13,683 14,780
Total non-current liabilities 1,331,391 686,946
(5.43) Bank overdraft 167,810 300,301
(5.46) Loans and borrowings 79,776 23,658
(5.49) Trade and other payables 512,692 474,208
Other taxes and social security charges 46,279 45,222
(5.34) Current tax liabilities 49,513 36,409
Total current liabilities 856,070 879,798
Total liabilities 2,187,461 1,566,744
Total equity and liabilities 3,861,595 3,089,991
The notes on pages 98 to 179 are an integral part of these consolidated financial statements.

93Fugro Financial statements 2011
The notes on pages 98 to 179 are an integral part of these consolidated financial statements.
3 C o n s o l i d a t e d s t a t e m e n t o f c h a n g e s i n e q u i t y
(EUR x 1,000) 2011
Share capital
Share premium
Trans -lation
reserveHedging reserve
Other reserves
Reserve for own shares
Unappro-priated result Total
Non-con-trolling
interestTotal
equity
Balance at 1 January 2011 4,014 431,441 (7,082) (3,511) 934,317 (123,080) 272,219 1,508,318 14,929 1,523,247
Total comprehensive income
for the period:
Profit or (loss) 287,595 287,595 7,675 295,270
Other comprehensive income
(5.32) Foreign currency translation
differences of foreign operations 55,193 55,193 657 55,850
(5.32) Foreign currency translation
differences of equity-accounted
investees 24 24 24
(5.32) Net change in fair value of hedge
of net investment in foreign
operations (53,218) (53,218) (53,218)
(5.33) Defined benefit plan actuarial
gains (losses) (14,919) (14,919) (14,919)
(5.32) Net change in fair value of cash
f low hedges transferred to profit
or loss 1,034 1,034 1,034
(5.32) Net change in fair value of
available-for-sale financial assets (1,899) (1,899) (1,899)
Total other comprehensive
income (net of tax) – – 1,999 1,034 (16,818) – – (13,785) 657 (13,128)
Total comprehensive income
for the period – – 1,999 1,034 (16,818) – 287,595 273,810 8,332 282,142
Transactions with owners
recognised directly in equity
Contributions by and
distributions to owners
(5.30) Share-based payments 13,201 13,201 13,201
Share options exercised 29,899 29,899 29,899
Addition to reserves 212,844 (212,844) – –
(5.44) Own shares acquired
and stock dividend 56 (56) (110,068) (110,068) (110,068)
(5.44) Dividends to shareholders (59,375) (59,375) (4,912) (64,287)
Total contributions by and
distribution to owners 56 (56) – – 226,045 (80,169) (272,219) (126,343) (4,912) (131,255)
Balance at 31 December 2011 4,070 431,385 (5,083) (2,477) 1,143,544 (203,249) 287,595 1,655,785 18,349 1,674,134

94
3 C o n s o l i d a t e d s t a t e m e n t o f c h a n g e s i n e q u i t y ( c o n t i n u e d )
(EUR x 1,000) 2010
Share capital
Share premium
Trans-lation
reserveHedging reserve
Other reserves
Reserve for own shares
Unappro-priated result Total
Non-con-trolling
interestTotal
equity
Balance at 1 January 2010 3,939 431,441 (115,821) (4,545) 721,907 (112,600) 263,410 1,187,731 11,779 1,199,510
Total comprehensive income
for the period:
Profit or (loss) 272,219 272,219 7,934 280,153
Other comprehensive income
(5.32) Foreign currency translation
differences of foreign operations 107,754 107,754 884 108,638
(5.32) Foreign currency translation
differences of equity-accounted
investees 121 121 121
(5.32) Net change in fair value of hedge
of net investment in foreign
operations 864 864 864
(5.33) Defined benefit plan actuarial gains
(losses) 735 735 735
(5.32) Net change in fair value of cash
f low hedges transferred to profit
or loss 1,034 1,034 1,034
(5.32) Net change in fair value of
available-for-sale financial assets (438) (438) (438)
Total other comprehensive
income (net of tax) – – 108,739 1,034 297 – – 110,070 884 110,954
The notes on pages 98 to 179 are an integral part of these consolidated financial statements.

95Fugro Financial statements 2011
3 C o n s o l i d a t e d s t a t e m e n t o f c h a n g e s i n e q u i t y ( c o n t i n u e d )
(EUR x 1,000) 2010
Share capital
Share premium
Trans-lation
reserveHedging reserve
Other reserves
Reserve for own shares
Unappro-priated result Total
Non-con-trolling
interestTotal
equity
Total comprehensive income
for the period – – 108,739 1,034 297 – 272,219 382,289 8,818 391,107
Transactions with owners
recognised directly in equity
Contributions by and distributions
to owners
(5.30) Share-based payments 12,654 12,654 12,654
Share options exercised 25,280 25,280 25,280
Addition to reserves 206,129 (206,129) – –
(5.44) Own shares acquired
and stock dividend 75 (35,760) (35,685) (35,685)
(5.44) Dividends to shareholders (57,281) (57,281) (4,499) (61,780)
Total contributions by and
distribution to owners 75 – – – 218,783 (10,480) (263,410) (55,032) (4,499) (59,531)
Changes in ownership interests
in subsidiaries
Acquisition of non-controlling
interests without a change
in control (6,670) (6,670) (1,169) (7,839)
Total transactions with owners
of the Company 75 – – – 212,113 (10,480) (263,410) (61,702) (5,668) (67,370)
Balance at 31 December 2010 4,014 431,441 (7,082) (3,511) 934,317 (123,080) 272,219 1,508,318 14,929 1,523,247
The notes on pages 98 to 179 are an integral part of these consolidated financial statements.

96
4 C o n s o l i d a t e d s t a t e m e n t o f c a s h f l o w sFor the year ended 31 December
(EUR x 1,000) 2011 2010
C a s h f l ow s f r o m o p e r a t i n g a c t i v i t i e s
Profit for the period 295,270 280,153
Adjustments for:
(5.35) Depreciation 220,984 201,493
(5.36) Amortisation of intangible assets 10,674 8,111
Amortisation of transaction costs related to loans and borrowings 1,258 838
(5.26) Net gain from bargain purchases (4,542) –
(5.41) Expensed inventories 103,820 108,602
(5.51) Change in allowance for impairment on trade receivables (17,163) 393
(5.32) Net finance costs (excluding net foreign exchange variance and net
change in fair value of financial assets at fair value through profit
or loss) 32,760 11,058
(5.38) Share of profit of equity-accounted investees (4,721) (1,018)
(5.32) Net change in fair value of financial assets at fair value through profit
or loss (3,941) (22,337)
(5.26) Loss on disposal of assets and liabilities 1,300 –
Gain on sale of property, plant and equipment (2,556) (3,050)
(5.30) Equity-settled share-based payments 13,201 12,654
(5.33) Income tax expense 45,332 78,518
Operating cash flows before changes in working capital and provisions 691,676 675,415
Change in inventories (240,732) (233,066)
Change in trade and other receivables 30,110 (178,308)
Change in trade and other payables (75,806) 77,286
Change in provisions and employee benefits (18) 1,107
405,230 342,434
Interest paid (24,639) (17,330)
Income tax paid (71,833) (97,987)
Net cash from operating activities 308,758 227,117
C a s h f l ow s f r o m i n ve s t i n g a c t i v i t i e s
Proceeds from sale of property, plant and equipment 16,794 25,945
Proceeds from sale of other investments 15,286 436
(5.32) Interest received 6,131 4,853
(5.32) Dividends received 203 1,049
(5.26) Disposal of assets and liabilities (1,131) –
(5.26) Acquisition of subsidiaries, net of cash acquired (203,463) (53,634)
(5.26) Acquisition of non-controlling interest – (7,839)
(5.35) Acquisition of property, plant and equipment (320,914) (443,824)
(5.35) Change in assets under construction 43,164 44,803
(5.36) Acquisition of intangible assets (8,617) (13,742)
(5.36) Internally developed intangible assets (16,504) (8,486)
Investment in equity-accounted investees (109) (69)
(5.39) Acquisition of other investments (9,529) (14,091)
Net cash from investing activities (478,689) (464,599)* Restated for comparison purposes.
The notes on pages 98 to 179 are an integral part of these consolidated financial statements.
*
*
*
*

97Fugro Financial statements 2011
4 C o n s o l i d a t e d s t a t e m e n t o f c a s h f l o w s ( c o n t i n u e d )For the year ended 31 December
(EUR x 1,000) 2011 2010
C a s h f l ow s f r o m f i n a n c i n g a c t i v i t i e s
Proceeds from issue of long-term loans 1,268,615 172,000
Repurchase of own shares (110,068) (35,760)
Paid consideration for the exercise of share options (17,652) (22,271)
Proceeds from the sale of own shares 47,551 47,551
Repayment of borrowings (724,459) (27,099)
Payment of transaction costs related to loans and borrowings (6,119) (350)
Dividends paid (64,287) (61,705)
Net cash from financing activities 393,581 72,366
Net increase/(decrease) in cash and cash equivalents 223,650 (165,116)
Cash and cash equivalents at 1 January (218,938) (59,761)
Effect of exchange rate f luctuations on cash held (2,138) 5,939
Cash and cash equivalents at 31 December 2,574 (218,938)
Presentation in the statement of financial position
(5.43) Cash and cash equivalents 170,384 81,363
(5.43) Bank overdraft (167,810) (300,301)
2,574 (218,938)
The notes on pages 98 to 179 are an integral part of these consolidated financial statements.

98
5.1 G e n e r a l
Fugro N.V., hereinafter to be referred to as ‘Fugro’ or ‘the Company’, has its corporate seat in The Netherlands.
The address of the company’s principal office is Veurse Achterweg 10, 2264 SG, Leidschendam, The Netherlands.
The consolidated financial statements of Fugro as at and for the year ended 31 December 2011 include Fugro
and its subsidiaries (together referred to as the ‘Group’) and the Group’s interests in equity-accounted investees.
A summary of the main subsidiaries is included in chapter 6. Fugro is a global service provider with regard to
the collection and interpretation of data relating to the earth’s surface and sub-surface and for associated
services and advice in support of infrastructure development on land, along the coast and on the seabed.
5.2 S t a t e m e n t o f c o m p l i a n c e
The consolidated financial statements have been prepared in accordance with International Financial
Reporting Standards (IFRS) as adopted by the European Union (EU-IFRS) and with Part 9 of Book 2 of the
Netherlands Civil Code.
The financial statements have been prepared by the Board of Management and have been authorised for
publication by the Supervisory Board on 8 March 2012. Publication will take place on 9 March 2012.
The financial statements will be submitted for adoption to the Annual General Meeting of Shareholders
on 22 May 2012. The official language for the financial statements is the English language as approved by the
Annual General Meeting of Shareholders on 10 May 2011. With reference to the Company income statement
of Fugro N.V., use has been made of the exemption pursuant to section 2:402 of the Netherlands Civil Code.
5.3 B a s i s o f p r e p a r a t i o n
5.3.1 Functional and presentation currency
The financial statements are presented in EUR x 1,000, unless mentioned otherwise. The Euro is the functional
and presentation currency of the Company.
5.3.2 Basis of measurement
The financial statements have been prepared on the basis of historical cost, except that the following assets
and liabilities are stated at their fair value: derivative financial instruments, financial instruments at fair value
through profit or loss, available-for-sale financial assets and plan assets associated with defined benefit plans.
5.3.3 Use of estimates and judgements
The preparation of the consolidated financial statements requires management to make judgements,
estimates and assumptions that affect the application of accounting policies and the reported amounts of
assets, liabilities, income and expenses. Actual results may differ materially from these estimates.
The estimates and associated assumptions are based on historical experience and various other factors that
are believed to be reasonable under the circumstances, the result of which form the basis of making the
judgements about the carrying values of the assets and liabilities that are not readily apparent from other
sources. The estimates and the underlying assumptions are reviewed on an ongoing basis. Revisions to
accounting estimates are recognised in the period in which the estimates are revised, if the revision affects
only that period, or in the period of the revision and future periods if the revision affects both current and
future periods.
Key sources of estimation uncertainty and references to the notes which include information about
assumptions and estimation uncertainties that have a significant risk of resulting in a material adjustment
within the next financial year are included in note 5.60.
5 N o t e s t o t h e c o n s o l i d a t e d f i n a n c i a l s t a t e m e n t s

99Fugro Financial statements 2011
5.3.4 Changes in accounting policies
No significant changes in accounting policies were applicable during the year ended 31 December 2011.
5.3.5 New standards and interpretations not yet adopted
A number of new standards, amendments to standards and interpretations are effective for annual periods
beginning after 1 January 2011, and have not been applied in preparing these consolidated financial
statements. None of these is expected to have a significant effect on the consolidated financial statements of
Fugro, except for IFRS 9 Financial Instruments, which becomes mandatory for the 2013 consolidated financial
statements and could change the classification and measurement of financial assets and potentially the
amended IAS 19 Employee benefits, effective as from 1 January 2013, which could impact pension expense
(in profit or loss) as well as actuarial gains and losses (in other comprehensive income). Fugro does not plan to
adopt these standards early and the extent of the impact has not been determined.
5.4 S i g n i f i c a n t a c c o u n t i n g p o l i c i e s
The accounting policies set out below have been applied consistently by all subsidiaries and equity-accounted
investees to all periods presented in these consolidated financial statements. Certain comparative information
is restated for comparison purposes.
5.4.1 Basis of consolidation
5.4.1.1 Accounting for business combinations
From 1 January 2010 the Group has applied IFRS 3 Business Combinations (2008) in accounting for business
combinations. The change in accounting policy has been applied prospectively and has had no material impact
on earnings per share.
Business combinations are accounted for using the acquisition method as at the acquisition date, which is the
date on which control is transferred to the Group. Control is the power to govern the financial and operating
policies of an entity so as to obtain benefits from its activities. In assessing control, the Group takes into
consideration potential voting rights that currently are exercisable.
Acquisitions on or after 1 January 2010
For acquisitions on or after 1 January 2010, the Group measures goodwill at the acquisition date as:
– the fair value of the consideration transferred; plus
– the recognised amount of any non-controlling interests in the acquiree; plus
the fair value of the existing equity interest in the acquiree, if the business combination is in stages; less
– the net recognised amount (generally fair value) of the identifiable assets acquired and liabilities assumed.
When the excess is negative, a bargain purchase gain is recognised immediately in profit or loss. The
consideration transferred does not include amounts related to the settlement of pre-existing relationships.
Such amounts are generally recognised in profit or loss.
Costs related to the acquisition, other than those associated with the issue of debt or equity securities, that the
Group incurs in connection with a business combination are expensed as incurred.
Any contingent consideration payable is recognised at fair value at the acquisition date. If the contingent
consideration is classified as equity, it is not re-measured and settlement is accounted for within equity.
Otherwise, subsequent changes to the fair value of the contingent consideration are recognised in profit or loss.

100
When share-based payment awards (replacement awards) are required to be exchanged for awards held by the
acquiree’s employees (acquiree’s awards) and relate to past services, then all or a portion of the amount of the
acquirer’s replacement awards is included in measuring the consideration transferred in the business
combination. This determination is based on the market-based value of the replacement awards compared
with the market-based value of the acquiree’s awards and the extent to which the replacement awards relate to
past and/or future service.
Acquisitions between 1 January 2003 and 1 January 2010
For acquisitions between 1 January 2003 and 1 January 2010, goodwill represents the excess of the cost of the
acquisition over the Group’s interest in the recognised amount (generally fair value) of the identifiable assets,
liabilities and contingent liabilities of the acquiree. When the excess was negative, a bargain purchase gain was
recognised immediately in profit or loss.
Transaction costs, other than those associated with the issue of debt or equity securities, that the Group
incurred in connection with business combinations were capitalised as part of the cost of the acquisition.
5.4.1.2 Subsidiaries
Subsidiaries are those entities controlled by the Group, taking into account the impact of potential voting
rights that are presently exercisable. Control exists when the Group has the power, directly or indirectly, to
govern the financial and operating policies of an entity so as to obtain benefits from its activities. The financial
statements of subsidiaries are included in the consolidated financial statements from the date that control
commences until the date that control ceases.
On the loss of control, the Group derecognises the assets and liabilities of the subsidiary, any non-controlling
interest and the other components of equity related to the subsidiary. Any surplus or deficit arising on the
loss of control is recognised in profit or loss. If the Group retains any interest in the previous subsidiary, it is
accounted for as an equity-accounted investee or as an available for sale financial asset depending on the level
of influence retained.
5.4.2 Equity-accounted investees
Equity-accounted investees are those entities in which the Group has significant influence, but not control,
over the financial and operating policies. Significant influence is presumed to exist when the Group holds
between 20% and 50% of the voting power of another entity. Refer to note 5.10 for the accounting policy for
equity-accounted investees.
5.4.3 Other investments
Other investments are those entities in whose activities the Group holds a non-controlling interest and has
no control or significant influence. Refer to note 5.11 for the accounting policy for other investments.
5.4.4 Transactions eliminated on consolidation
Intra-group balances and transactions, and any unrealised income and expenses arising from intra-group
transactions, are eliminated in preparing the consolidated financial statements. Unrealised gains arising
from transactions with equity-accounted investees are eliminated against the investment to the extent of
the Group’s interest in the investee. Unrealised losses are eliminated in the same way as unrealised gains,
but only to the extent that there is no evidence of impairment.

101Fugro Financial statements 2011
5.5 Fo r e i g n c u r r e n c y
5.5.1 Foreign currency transactions and translation
Transactions in foreign currencies are translated to the respective functional currencies of Group entities at
exchange rates at the dates of the transactions.
Monetary assets and liabilities denominated in foreign currencies at the reporting date are retranslated to the
respective functional currency at the foreign exchange rate at that date. The foreign currency gain or loss on
monetary items is the difference between amortised cost in the functional currency at the beginning of the
year, adjusted for effective interest and payments during the year, and the amortised cost in foreign currency
translated at the exchange rate at the end of the year.
Non-monetary assets and liabilities that are measured in terms of historical cost in a foreign currency are
translated using the exchange rate at the date of the transaction. Non-monetary assets and liabilities
denominated in foreign currencies that are measured at fair value are retranslated to the functional currency
at foreign exchange rates effective at the date the fair value was determined. Foreign currency differences
arising on retranslation are recognised in profit or loss, except for differences arising on the retranslation
of available-for-sale financial assets and equity-accounted investees, a financial liability designated as a hedge
of the net investment in a foreign operation that is effective, or qualifying cash f low hedges, which are
recognised in other comprehensive income.
A summary of the main currency exchange rates applied in the year under review and the preceding years
reads as follows:
USD at year-end
USD average
GBP at year-end
GBP average
NOK at year-end
NOK average
2011 0.77 0.71 1.20 1.15 0.129 0.129
2010 0.75 0.76 1.16 1.17 0.128 0.125
2009 0.69 0.72 1.13 1.13 0.121 0.115
2008 0.71 0.68 1.05 1.25 0.102 0.121
2007 0.68 0.73 1.36 1.46 0.126 0.125

102
5.5.2 Foreign operations
The assets and liabilities of foreign operations, including goodwill and fair value adjustments arising on
acquisition, are translated to EUR at foreign exchange rates effective at the reporting date. The income and
expenses of foreign operations are translated to EUR at exchange rates effective at the dates of the transactions.
Foreign currency differences are recognised in other comprehensive income, and presented in the foreign
currency translation reserve for foreign operations (Translation reserve) in equity. However, if the operation is
a non-wholly-owned subsidiary, then the relevant proportionate share of the translation difference is allocated
to the non-controlling interests. When a foreign operation is disposed of, such that control, significant
influence or joint control is lost, the cumulative amount in the translation reserve related to that foreign
operation is reclassified to profit or loss as part of the gain or loss on disposal. When the Group disposes of
only part of its interest in a subsidiary that includes a foreign operation while retaining control, the relevant
proportion of the cumulative amount is reattributed to non-controlling interests. If the Group disposes of
only part of its investment in an equity-accounted investee that includes a foreign operation while retaining
significant influence or joint control, the relevant proportion of the cumulative amount is reclassified to
profit or loss.
If the settlement of a monetary item, receivable from or payable to a foreign operation, is neither planned nor
likely in the foreseeable future, foreign exchange gains and losses arising from such a monetary item are
considered to form part of a net investment in a foreign operation and are recognised in other comprehensive
income, and presented in the Translation reserve in equity.
5.5.3 Hedge of a net investment in foreign operations
The Group applies hedge accounting to foreign currency differences arising between the functional currency
of the foreign operation and the functional currency of Fugro (EUR), regardless of whether the net investment
is held directly or through an intermediate parent.
Foreign currency differences arising on the (re-)translation of a financial liability designated as a hedge of a net
investment in a foreign operation are recognised in other comprehensive income to the extent that the hedge
is effective, and are presented within equity in the Translation reserve. To the extent that the hedge is
ineffective, such differences are recognised in profit or loss. When the hedged net investment is disposed of,
the relevant amount in the Translation reserve is transferred to profit or loss as part of the profit or loss on
disposal.
5.6 D e t e r m i n a t i o n o f f a i r va l u e s
A number of the Group’s accounting policies and disclosures require the determination of fair value, for both
financial and non-financial assets and liabilities. Fair values have been determined for measurement and/or
disclosure purposes based on the following methods. When applicable, additional information on the
determination of fair values is disclosed in the notes of the specific asset or liability.
5.6.1 Property, plant and equipment
The fair value of property, plant and equipment recognised as a result of a business combination is the
estimated amount for which a property could be exchanged on the date of acquisition between a willing buyer
and a willing seller in an arm’s length transaction after proper marketing wherein the parties had each acted
knowledgeably. The fair value of items of plant, equipment, fixtures and fittings is based on the market
approach and cost approaches using quoted market prices for similar items when available and depreciated
replacement cost when appropriate. Depreciated replacement cost estimates reflect adjustments for physical
deterioration as well as functional and economic obsolescence.

103Fugro Financial statements 2011
5.6.2 Intangible assets
The fair value of patents and trademarks acquired in a business combination is based on the discounted
estimated royalty payments that have been avoided as a result of the patent or trademark being owned.
The fair value of customer relationships acquired in a business combination is determined using the multi-
period excess earnings method, whereby the subject asset is valued after deducting a fair return on all other
assets that are part of creating the related cash f lows. The fair value of other intangible assets is based on
the discounted cash f lows expected to be derived from the use and eventual sale of the assets.
5.6.3 Inventories
The fair value of inventories (including seismic and geological libraries) acquired in a business combination
is determined based on the estimated selling price in the ordinary course of business less the estimated costs
of completion and sale, and a reasonable profit margin based on the effort required to complete and sell the
inventories.
5.6.4 Equity and debt securities
The fair value of equity and debt securities is determined by reference to their quoted closing bid price at
the reporting date, or if unquoted, determined using a valuation technique. Valuation techniques employed
include market multiples and discounted cash f low analysis using expected future cash f lows and a market-
related discount rate. The fair value of held-to-maturity investments is determined for disclosure purposes
only.
5.6.5 Trade and other receivables
The fair value of trade and other receivables, is estimated at the present value of future cash f lows, discounted
at the market rate of interest at the reporting date. This fair value is determined for disclosure purposes or
when such assets are acquired in a business combination.
5.6.6 Forward exchange contracts and interest rate swaps
The fair value of forward exchange contracts is based on their quoted price, if available. If a quoted price is
not available, then fair value is estimated by discounting the difference between the contractual forward price
and the current forward price for the residual maturity of the contract using a risk-free interest rate (based on
government bonds).
The fair value of interest rate swaps is based on broker quotes. Those quotes are tested for reasonableness by
discounting estimated future cash f lows based on the terms and maturity of each contract and using market
interest rates for a similar instrument at the measurement date. Fair values reflect the credit risk of the
instrument and include adjustments to take account of the credit risk of the Group entity and counterparty
when appropriate.
5.6.7 Other non-derivative financial liabilities
Fair value, which is determined for disclosure purposes, is calculated based on the present value of future
principal and interest cash f lows, discounted at the market rate of interest at the reporting date. For financial
leases the market rate of interest is determined by reference to similar lease agreements.

104
5.6.8 Share-based payment transactions
The fair value of the employee share options are measured using a binomial model. Measurement inputs
include the share price on the measurement date (year-end date of the year of granting), the exercise price of
the instrument, expected volatility (based on an evaluation of the historic volatility of Fugro’s (certificates of)
shares, particularly over the historic period commensurate with the expected term), expected term of the
instruments (based on historical experience and general option holder behaviour), expected dividends and the
risk-free interest rate (based on government bonds). Service and non-market performance conditions attached
to the transactions are not taken into account in determining fair value.
5.7 F i n a n c i a l i n s t r u m e n t s
5.7.1 Non-derivative financial assets
The Group initially recognises loans and receivables and deposits on the date that they are originated. All other
financial assets (including assets designated at fair value through profit or loss) are recognised initially on the
trade date, which is the date that the Group becomes a party to the contractual provisions of the instrument.
The Group derecognises a financial asset when the contractual rights to the cash f lows from the asset expire,
or it transfers the rights to receive the contractual cash f lows on the financial asset in a transaction in which
substantially all the risks and rewards of ownership of the financial asset are transferred. Any interest in
transferred financial assets that is created or retained by the Group is recognised as a separate asset or liability.
Financial assets and liabilities are offset and the net amount presented in the statement of financial position
when, and only when, the Group has a legal right to offset the amounts and intends either to settle on a net
basis or to realise the asset and settle the liability simultaneously.
The Group classifies non-derivative financial assets into the following categories: financial assets at fair value
through profit or loss, held-to-maturity financial assets, loans and receivables and available-for-sale financial
assets. Reference is made to note 5.11.
Loans and receivables comprise cash and cash equivalents and trade and other receivables. Cash and cash
equivalents comprise cash balances and call deposits with original maturities of three months or less.
5.7.2 Non-derivative financial liabilities
The Group initially recognises debt securities issued and subordinated liabilities on the date that they are
originated. All other financial liabilities (including liabilities designated at fair value through profit or loss)
are recognised initially on the trade date, which is the date that the Group becomes a party to the contractual
provisions of the instrument.
The Group derecognises a financial liability when its contractual obligations are discharged, cancelled or
expire.
Financial liabilities and assets are offset and the net amount presented in the statement of financial position
when, and only when, the Group has a legal right to offset the amounts and intends either to settle on a net
basis or to realise the asset and settle the liability simultaneously.
Other financial liabilities are recognised initially at fair value plus any directly attributable transaction costs.
Subsequent to initial recognition, these financial liabilities are measured at amortised cost using the effective
interest method.
Other financial liabilities comprise loans and borrowings, bank overdrafts, and trade and other payables.
Reference is made to note 5.14 cash and cash equivalents and note 5.20 Trade and other payables.

105Fugro Financial statements 2011
5.7.3 Derivative financial instruments, including hedge accounting
The Group holds derivative financial instruments to hedge its exposure to foreign exchange risks arising from
operational and financing activities. In accordance with its treasury policy, the Group does not hold or issue
derivative financial instruments for trading purposes. Derivatives that do not qualify for hedge accounting are
accounted for as trading instruments.
Embedded derivatives are separated from the host contract and accounted for separately if the economic
characteristics and risks of the host contract and the embedded derivative are not closely related, a separate
instrument with the same terms as the embedded derivative would meet the definition of a derivative, and
the combined instrument is not measured at fair value through profit or loss.
On initial designation of the derivative as the hedging instrument, the Group formally documents the
relationship between the hedging instrument and hedged item, including the risk management objectives
and strategy in undertaking the hedge transaction and the hedged risk, together with the methods that will be
used to assess the effectiveness of the hedging relationship. The Group makes an assessment, both at the
inception of the hedge relationship as well as on an ongoing basis, of whether the hedging instruments are
expected to be ‘highly effective’ in offsetting the changes in the fair value or cash f lows of the respective
hedged items attributable to the hedged risk, and whether the actual results of each hedge are within a range
of 80-125%. For a cash f low hedge of a forecast transaction, the transaction should be highly probable to occur
and should present an exposure to variations in cash f lows that could ultimately affect reported profit or loss.
Derivatives are recognised initially at fair value; attributable transaction costs are recognised in profit or loss
as incurred. Subsequent to initial recognition, derivatives are measured at fair value, and changes therein are
accounted for as described below.
5.7.3.1 Cash flow hedges
When a derivative is designated as the hedging instrument in a hedge of the variability in cash f lows
attributable to a particular risk associated with a recognised asset or liability or a highly probable forecast
transaction that could affect profit or loss, the effective portion of changes in the fair value of the derivative
is recognised in other comprehensive income and presented in the Hedging reserve in equity.
The amount recognised in the Hedging reserve is removed and included in profit or loss in the same period as
the hedged cash f lows affect profit or loss under the same line item in the statement of comprehensive income
as the hedged item. Any ineffective portion of changes in the fair value of the derivative is recognised
immediately in profit or loss.
If the hedging instrument no longer meets the criteria for hedge accounting, expires or is sold, terminated or
exercised, or the designation is revoked, then hedge accounting is discontinued prospectively. The cumulative
gain or loss previously recognised in other comprehensive income and presented in the Hedging reserve in
equity remains there until the forecast transaction affects profit or loss. When the hedged item is a
non-financial asset, the amount accumulated in equity is included in the carrying amount of the asset when
the asset is recognised. If the forecast transaction is no longer expected to occur, then the balance in equity is
reclassified in profit or loss.
106
5.7.3.2 Other non-trading derivatives
When a derivative financial instrument is not designated in a hedge relationship that qualifies for hedge
accounting, all changes in its fair value are recognised immediately in profit or loss.
5.8 P r o p e r t y , p l a n t a n d e q u i p m e n t
5.8.1 Owned assets
Items of property, plant and equipment are measured at cost less accumulated depreciation and accumulated
impairment losses (refer accounting policy 5.15). The cost of property, plant and equipment includes
expenditure that is directly attributable to the acquisition of the asset. The cost of self-constructed assets
includes the costs of materials and direct labour, any other costs directly attributable to bringing the assets to
a working condition for their intended use, the costs of dismantling and removing the items and restoring
the site on which they are located and capitalised borrowing costs. Cost also may include transfers from equity
of any gain or loss on qualifying cash f low hedges of foreign currency purchases of property, plant and
equipment. Purchased software that is integral to the functionality of the related equipment is capitalised as
part of that equipment.
Property, plant and equipment that is being constructed or developed for future use is classified as property,
plant and equipment under construction and stated at cost until construction or development is complete,
at which time it is reclassified as land and buildings, plant and equipment, vessels or other property, plant
and equipment.
When parts of an item of property, plant and equipment have different useful lives, they are accounted for
as separate items (major components) of property, plant and equipment.
The gain or loss on disposal of an item of property, plant and equipment is determined by comparing the
proceeds from disposal with the carrying amount of the property, plant and equipment, and is recognised
net within ‘other income’ or ‘other expenses’ in profit or loss.
5.8.2 Leased assets
Leases in terms of which the Group assumes substantially all the risks and rewards of ownership are classified
as finance leases. Upon initial recognition the leased asset is measured at an amount equal to the lower of
its fair value and the present value of the minimum lease payments.
Subsequent to initial recognition, the asset is accounted for in accordance with the accounting policy
applicable to that asset. Other leases are operating leases and are not recognised in the Group’s statement
of financial position. Lease payments are accounted for as described in accounting policy 5.22.2.
5.8.3 Subsequent cost
Subsequent expenditure is capitalised only when it is probable that the future economic benefits associated
with the expenditure will f low to the Group, and its cost can be measured reliably. Ongoing repairs and
maintenance is expensed as incurred.

107Fugro Financial statements 2011
5.8.4 Depreciation
Depreciation is based on the cost of an asset less its residual value. Significant components of individual assets
are assessed and if a component has a useful life that is different from the remainder of that asset, that
component is depreciated separately. Depreciation is recognised in profit or loss on a straight-line basis over
the estimated useful lives of each component of an item of property, plant and equipment. Leased assets are
depreciated over the shorter of the lease term and their useful lives unless it is reasonably certain that the
Group will obtain ownership by the end of the lease term. Depreciation methods, useful lives and residual
values are reviewed at each reporting date and adjusted if appropriate. The estimated useful lives for the
current and comparative period of significant items of property, plant and equipment are as follows:
Category Years
Land and buildings
Land Infinite
Buildings 20 – 40
Fixtures and fittings 5 – 10
Vessels
Vessels and jack-ups 2 – 25
Plant and equipment
Plant and equipment 4 – 10
Survey equipment 3 – 5
Aircraft 5 – 10
AUVs and ROVs 6 – 7
Computers and office equipment 3 – 4
Transport equipment 4
Other
Maintenance 3 – 5
Used plant and machinery 1 – 2
5.9 I n t a n g i b l e a s s e t s
5.9.1 Goodwill
Goodwill that arises upon the acquisition of subsidiaries is presented with intangible assets. For the
measurement of goodwill at initial recognition, refer to note 5.4.1.1, Accounting for business combinations.
Goodwill is measured at cost less accumulated impairment losses. Goodwill is allocated to cash generating
units and is not amortised but is tested for impairment annually or when there is an indication for impairment
(refer accounting policy 5.15). In respect of equity-accounted investees, the carrying amount of goodwill is
included in the carrying amount of the investment, and any impairment loss is allocated to the carrying
amount of the equity-accounted investee as a whole.

108
5.9.2 Research and development
Expenditure on research activities, undertaken with the prospect of gaining new scientific or technical
knowledge and understanding, is recognised in profit or loss as incurred.
Development activities involve a plan or design for the production of new or substantially improved products
and processes. Development expenditure is capitalised only if development costs can be measured reliably,
the product or process is technically and commercially feasible, future economic benefits are probable, and
the Group intends to and has sufficient resources to complete development and to use or sell the asset.
The capitalised expenditure includes the cost of materials, direct labour, overhead costs that are directly
attributable to preparing the asset for its intended use, and capitalised borrowing costs. Other development
expenditure is recognised in profit or loss as incurred. Capitalised development expenditure is measured at
cost less accumulated amortisation and accumulated impairment losses (refer accounting policy 5.15).
5.9.3 Software and other intangible assets
Software and other intangible assets acquired or developed by the Group and that have finite useful lives are
measured at cost less accumulated amortisation and accumulated impairment losses (refer accounting policy
5.15).
5.9.4 Subsequent expenditure
Subsequent expenditure on capitalised intangible assets is capitalised only when it increases the future
economic benefits embodied in the specific asset to which it relates. All other expenditure, including
expenditure on internally generated goodwill and brands, is recognised in profit or loss as incurred.
5.9.5 Amortisation
Amortisation is based on the cost of an asset less its residual value. Amortisation is recognised in profit or loss
on a straight-line basis over the estimated useful lives of intangible assets unless such lives are indefinite.
Goodwill and intangibles assets with an indefinite life are systematically tested for impairment annually
or when there is an indication for impairment (refer accounting policy 5.15). Other intangible assets and
software are amortised from the date they are available for use. The estimated useful life of software and other
capitalised development costs is, in general, five years. Amortisation methods, useful lives and residual values
are reviewed at each reporting date and adjusted if appropriate.
5.10 I n ve s t m e n t s i n e q u i t y - a c c o u n t e d i n ve s t e e s
Investments in equity-accounted investees are accounted for using the equity method and are recognised
initially at cost. The Group’s investment includes goodwill identified on acquisition, net of any accumulated
impairment losses (refer accounting policy 5.15). The consolidated financial statements include the Group’s
share of the income and expenses and equity movements of equity-accounted investees, after adjustments to
align the accounting policies with those of the Group, from the date that significant influence commences
until the date that significant influence ceases. When the Group’s share of losses exceeds the carrying amount
of the equity-accounted investee, the carrying amount is reduced to nil and recognition of further losses is
discontinued except to the extent that the Group has incurred legal or constructive obligations or has made
payments on behalf of the investee.
5.11 O t h e r i n ve s t m e n t s
5.11.1 Other investments in equity instruments
Other investments in equity instruments do not have a quoted market price in an active market. As the fair
value cannot be reliably measured the equity instruments are stated at cost. Dividends received are accounted
for in profit or loss when these become due.

109Fugro Financial statements 2011
5.11.2 Financial assets at fair value through profit or loss
A financial asset is classified at fair value through profit or loss if it is classified as held for trading or is
designated as such upon initial recognition. Financial assets are designated at fair value through profit or loss
if the Group manages such investments and makes purchase and sale decisions based on their fair value in
accordance with the Group’s documented risk management or investment strategy. Attributable transaction
costs are recognised in profit or loss as incurred. Financial assets at fair value through profit or loss are
measured at fair value, and changes therein are recognised in profit or loss.
Financial assets designated at fair value through profit or loss comprise equity securities that otherwise would
have been classified as available for sale.
5.11.3 Long-term loans and other long-term receivables
Long-term loans and other long-term receivables are financial assets with fixed or determinable payments
that are not quoted in an active market. Such assets are recognised initially at fair value plus any directly
attributable transaction costs. Subsequent to initial recognition, loans and receivables are measured at
amortised cost using the effective interest method; less any impairment losses (refer to accounting policy 5.15).
5.11.4 Available-for-sale financial assets
Available for sale financial assets are non-derivative financial assets that are designated as available for sale or
are not classified in any of the above categories of financial assets. Subsequent to initial recognition, they are
measured at fair value and changes therein, other than impairment losses (refer to note 5.15) and foreign
currency differences on available-for-sale debt instruments (refer to note 5.5.1), are recognised in other
comprehensive income and presented in the other reserves in equity. When an investment is derecognised,
the cumulative gain or loss accumulated in equity is reclassified to profit or loss.
Available-for-sale financial assets comprise equity securities and debt securities.
5.12 I n ve n t o r i e s
5.12.1 Seismic and geological data libraries
The seismic and geological data libraries consist of completed and in progress collection of seismic and
geological data that can be sold non-exclusively to one or more clients. These seismic and geological data
libraries are measured at the lower of cost and net realisable value. Net realisable value is the estimated sales
value price in the ordinary course of business, less the estimated costs of completion and selling expenses.
Costs include direct costs and an attributable portion of direct overheads, but exclude a profit element.
As it is expected that sales lead to a lower net realisable value of the seismic and geological data, these expected
decreases in value are taken into account at the moment of sale throughout the financial year. The Group
evaluates the net realisable value on a regular basis and reassesses the net realisable value at each reporting
date.
5.12.2 Other inventories
Other inventories are measured at the lower of cost and net realisable value. The cost of other inventories
is based on the first-in first-out principle, and includes expenditure incurred in acquiring the inventories,
production or conversion costs and other costs incurred in bringing them to their existing location and
condition. Net realisable value is the estimated selling price in the ordinary course of business, less the
estimated costs of completion and selling expenses.

110
5.13 Tr a d e a n d o t h e r r e c e i va b l e s
Services rendered on contract work completed but not yet billed to customers are included in trade and other
receivables as unbilled revenues on completed contracts.
Trade and other receivables are recognised initially at fair value plus any directly attributable transaction
costs. Subsequent to initial recognition they are measured at amortised cost using the effective interest
method less, any impairment losses (refer accounting policy 5.15).
5.14 C a s h a n d c a s h e q u i va l e n t s
Cash and cash equivalents, comprising cash balances and call deposits, are recognised initially at fair value
plus any directly attributable transaction costs. Subsequent to initial recognition they are measured at
amortised cost using the effective interest method less, any impairment losses (refer accounting policy 5.15).
Bank overdrafts that are repayable on demand and form an integral part of the Group’s cash management are
included as a component of cash and cash equivalents for the purpose of the consolidated statement of cash
f lows.
5.15 I m p a i r m e n t
5.15.1 Non-derivative financial assets
A financial asset not carried at fair value through profit or loss is assessed at each reporting date to determine
whether there is objective evidence that it is impaired. A financial asset is impaired if objective evidence
indicates that a loss event has occurred after the initial recognition of the asset, and that the loss event had
a negative effect on the estimated future cash f lows of that asset that can be estimated reliably.
The Group considers evidence of impairment for receivables at both a specific asset and collective level.
All individually significant receivables are assessed for specific impairment. All individually significant
receivables found not to be specifically impaired are then collectively assessed for any impairment that has
been incurred but not yet identified. Receivables that are not individually significant are collectively assessed
for impairment by grouping together receivables with similar risk characteristics. In assessing collective
impairment the Group uses historical trends of the probability of default, the timing of recoveries and the
amount of loss incurred, adjusted for management’s judgement as to whether current economic and credit
conditions are such that the actual losses are likely to be greater or less than suggested by historical trends.
An impairment loss in respect of a financial asset measured at amortised cost is calculated as the difference
between its carrying amount and the present value of the estimated future cash f lows discounted at the asset’s
original effective interest rate. Losses are recognised in profit or loss and reflected in an allowance account
against receivables. Interest on the impaired asset continues to be recognised through the unwinding of the
discount. When a subsequent event causes the amount of impairment loss to decrease, the decrease in
impairment loss is reversed through profit or loss.
Impairment losses on available-for-sale financial assets are recognised by reclassifying the losses accumulated
in other comprehensive income, and presented in equity, to profit or loss. The cumulative loss that is
reclassified from other comprehensive income to profit or loss is the difference between the acquisition cost,
net of any principal repayment and amortisation, and the current fair value, less any impairment loss
recognised previously in profit or loss. Changes in impairment provisions attributable to application of the
effective interest method are reflected as a component of interest income. If, in a subsequent period, the fair
value of an impaired available-for-sale debt security increases and the increase can be related objectively to
an event occurring after the impairment loss was recognised in profit or loss, then the impairment loss is
reversed, with the amount of the reversal recognised in profit or loss. Any subsequent recovery in the fair
value of an impaired available-for-sale equity security is recognised in other comprehensive income.

111Fugro Financial statements 2011
5.15.2 Non-financial assets
The carrying amounts of the Group’s non-financial assets other than inventories, assets arising from employee
benefits and deferred tax assets (refer accounting policy 5.23), are reviewed at each reporting date to determine
whether there is any indication of impairment. If any such indication exists, then the asset’s recoverable
amount is estimated. For goodwill, and intangible assets that have indefinite useful lives or that are not yet
available for use, the recoverable amount is estimated each year at the same time. An impairment loss is
recognised if the carrying amount of an asset or its related cash-generating unit exceeds its estimated
recoverable amount. Impairment losses are recognised in profit or loss. Impairment losses recognised in
respect of cash-generating units are allocated first to reduce the carrying amount of any goodwill allocated to
the cash-generating unit (group of cash-generating units) and then to reduce the carrying amount of the other
assets in the cash-generating unit (or group of cash-generating units) on a pro rata basis.
The recoverable amount of an asset or cash-generating unit (CGU) is the greater of its value in use and its fair
value less costs to sell. In assessing value in use, the estimated future cash f lows are discounted to their present
value using a pre-tax discount rate that reflects current market assessments of the time value of money and
the risks specific to the asset or cash-generating unit. For the purpose of impairment testing, assets that cannot
be tested individually are grouped together into the smallest group of assets that generates cash inflows from
continuing use that are largely independent of the cash inflows of other assets or cash-generating unit. Subject
to an operating segment ceiling test, for the purposes of goodwill impairment testing, CGUs to which goodwill
has been allocated, are aggregated so that the level at which impairment testing is performed reflects the
lowest level at which goodwill is monitored for internal reporting purposes. Goodwill acquired in a business
combination is allocated to groups of cash generating units that are expected to benefit from the synergies of
the combination.
The Group’s corporate assets do not generate separate cash inflows and are utilised by more than one cash-
generating unit. Corporate assets are allocated to cash-generating units on a reasonable and consistent basis
and tested for impairment as part of the testing of the cash generating units to which the corporate asset is
allocated.
An impairment loss in respect of goodwill is not reversed. In respect of other assets, impairment losses
recognised in prior periods are reviewed at each reporting date for any indications that the loss has decreased
or no longer exists. An impairment loss is reversed if there has been a change in the estimates used to
determine the recoverable amount. An impairment loss is reversed only to the extent that the asset’s carrying
amount does not exceed the carrying amount that would have been determined, net of depreciation or
amortisation, if no impairment loss had been recognised.
5.16 S h a r e c a p i t a l
5.16.1 Share capital
Share capital is classified as equity. The term ‘shares’ as used in the financial statements should, with respect
to ordinary shares issued by Fugro, be construed to include certificates of shares (‘share certificates’ or
‘depositary receipts’ for shares) issued by ‘Stichting Administratiekantoor Fugro’ (also referred to as ‘Fugro
Trust Office’ or ‘Trust Office’), unless the context otherwise requires or unless it is clear from the context that
this is not the case. Incremental costs directly attributable to the issue of ordinary shares and share options are
recognised as a deduction from equity, net of any tax effects.
5.16.2 Repurchase and sale of shares
When shares are repurchased or sold, the amount of the consideration paid or received, including direct
attributable costs, net of any tax effects, is recognised as a change in equity. Repurchased shares and related
results are reported as reserve for own shares and presented separately as a component of total equity.

112
5.16.3 Dividends
Dividends are recognised as a liability in the period in which they are declared.
5.17 L o a n s a n d b o r r ow i n g s
Loans and borrowings are recognised initially at fair value, less attributable transaction costs. Subsequent
to initial recognition, borrowings are measured at amortised cost using the effective interest rate method.
5.18 E m p l oy e e b e n e f i t s
5.18.1 Defined contribution plans
A defined contribution plan is a post-employment benefit plan under which an entity pays fixed contributions
into a separate entity and will have no legal or constructive obligation to pay further amounts. Obligations for
contributions to defined contribution pension plans are recognised as an employee benefit expense in profit or
loss in the periods during which services are rendered by employees. Prepaid contributions are recognised as
an asset to the extent that a cash refund or a reduction in future payments is available. Contributions to a
defined contribution plan that are due more than 12 months after the end of the period in which the
employees render the service are discounted to their present value.
5.18.2 Defined benefit plans
A defined benefit plan is a post-employment benefit plan other than a defined contribution plan. The Group’s
net obligation in respect of defined benefit pension plans is calculated separately for each plan by estimating
the amount of future benefit that employees have earned in return for their service in the current and prior
periods; that benefit is discounted to determine the present value. Any unrecognised past service costs and the
fair value of plan assets are deducted. The discount rate is the yield at the reporting date on AA credit-rated
corporate bonds that have maturity dates approximating the terms of the Group’s obligations and that are
denominated in the same currency in which the benefits are expected to be paid. The calculation is performed
by qualified actuaries using the projected unit credit method. When the calculation results in a benefit to the
Group, the recognised asset is limited to the total of any unrecognised past service costs and the present value
of economic benefits available in the form of any future refunds from the plan or reductions in future
contributions to the plan. In order to calculate the present value of economic benefits, consideration is given
to any minimum funding requirements that apply to any plan in the Group. An economic benefit is available
to the Group if it is realisable during the life of the plan, or on settlement of the plan liabilities.
When the benefits of a plan are improved, the portion of the increased benefit related to past service by
employees is recognised in profit or loss on a straight-line basis over the average period until the benefits
become vested. To the extent that the benefits vest immediately, the expense is recognised immediately in
profit or loss.
The Group recognises all actuarial gains and losses arising from defined benefit plans in other comprehensive
income and all expenses related to defined benefit plans in personnel expenses in profit or loss.
The Group recognises gains and losses on the curtailment or settlement of a defined benefit plan when the
curtailment or settlement occurs. The gain or loss on curtailment comprises any resulting change in the fair
value of plan assets, change in the present value of defined benefit obligation and any related actuarial gains
and losses and past service cost that had not previously been recognised.
5.18.3 Other long-term employee benefits
The Group’s net obligation in respect of long-term employee benefits, other than pension plans, is the amount
of future benefit that employees have earned in return for their service in the current and prior periods; that
benefit is discounted to determine its present value, and the fair value of any assets is deducted. The discount
rate is the yield at the reporting date on AA credit-rated corporate bonds that have maturity dates
approximating the terms of the Group’s obligations and that are denominated in the same currency in which
the benefits are expected to be paid. The calculation is performed using the projected unit credit method. Any
actuarial gains or losses are recognised in profit or loss in the period in which they arise.

113Fugro Financial statements 2011
5.18.4 Share-based payments
The share option scheme allows some assigned Group employees to acquire shares in Fugro. The fair value of
granted options is recognised as an employee expense, with a corresponding increase in equity. The fair value
is determined on the date of granting and is spread over the period during which the employees become
unconditionally entitled to the options. The amount recognised as an expense is adjusted to reflect the number
of options for which the related service vesting conditions are expected to be met, such that the amount
ultimately recognised as an expense is based on the number of options that meet the related service conditions
at the vesting date.
5.19 P r o v i s i o n s
A provision is recognised if, as a result of a past event, the Group has a present legal or constructive obligation
that can be estimated reliably, and it is probable that an outflow of economic benefits will be required to settle
the obligation. Provisions are determined by discounting the expected future cash f lows at a pre-tax rate that
reflects current market assessments of the time value of money and, where appropriate, the risks specific to
the liability. The unwinding of the discount is recognised as finance cost.
5.19.1 Restructuring
A provision for restructuring is recognised when the Group has approved a detailed and formal restructuring
plan, and the restructuring either has commenced or has been announced publicly. Future operating losses are
not provided for.
5.19.2 Onerous contracts
A provision for onerous contracts is recognised when the expected benefits to be derived by the Group from
a contract are lower than the unavoidable cost of meeting its obligations under the contract. The provision
is measured at the present value of the lower of the expected cost of terminating the contract and the expected
net cost of continuing with the contract. Before a provision is established, the Group recognises any
impairment loss on the assets associated with that contract.
5.20 Tr a d e a n d o t h e r p a ya b l e s
Trade and other payables are recognised initially at fair value plus any directly attributable transaction costs.
Subsequent to initial recognition they are measured at amortised cost using the effective interest method.
5.21 R e ve n u e
Revenue comprises the fair value of the consideration received or receivable for the sale of goods and services
rendered in the ordinary course of the Group’s activities. Revenue is shown net of value-added tax, rebates and
discounts and after eliminating sales within the Group.
The Group recognises revenue when persuasive evidence exists, usually in the form of an executed sales
agreement, the amount of revenue can be measured reliably, it is probable that future economic benefits
will f low to the entity and when specific criteria have been met for each of the Group’s activities as described
below. The Group bases its estimates on historical results, taking into consideration the type of customer,
the type of transaction and the specifics of each arrangement.
Revenue from Sales of goods, seismic and geological data, and software licences and subscription income do
not qualify as a significant category of revenue as referred to in IAS 18.35 (b); however for completeness sake
the relating revenue recognition policies are set out in 5.21.2, 5.21.3 and 5.21.4.

114
5.21.1 Services rendered
Revenue from services rendered to third parties relate to fixed price contracts and ‘cost plus’ contracts (mainly
daily rates or rates per (square) kilometre). This revenue is recognised in profit or loss in proportion to the stage
of completion of the transaction at the reporting date. The stage of completion is assessed using the proportion
of contract cost incurred for work performed to the reporting date, compared to total contract cost (as this
method is most appropriate for the majority of the services provided by the Group), which are mainly based
on daily rates for staff and equipment or rates per (square) kilometre for vessels and airplanes.
5.21.2 Sales of goods
Revenue from the sale of goods is recognised when the significant risks and rewards of ownership have been
transferred to the buyer, recovery of the consideration is probable, the associated costs of goods can be
estimated reliably, and there is no continuing management involvement with the goods.
No revenue is recognised if there are significant uncertainties regarding recovery of the consideration due
or associated costs. An expected loss on a contract is recognised immediately in profit or loss.
5.21.3 Seismic and geological data
Revenue from the sale of non-exclusive seismic and geological data libraries is recognised in the period when
the data has been collected, processing has been completed and data has (substantially) been delivered to the
client. Pre-commitments on seismic and geological data library sales are recorded as advance instalments.
When data collection has commenced, revenue is recognised based on the stage of completion. Separate
(service) components/deliverables, such as annual maintenance fees or training fees, are accounted for over
the period in which these services have been delivered to the customer, using a straight line basis over the term
of the contract.
5.21.4 Software licences and subscription income
Software licences and subscription income are recognised in the period during which the underlying services
have been provided, using a straight line basis over the term of the contract.
5.21.5 Net revenue own service (revenue less third party costs)
Net revenue own service comprise all revenue minus costs incurred with third parties related to the
employment of resources (in addition to the resources deployed by the Group) and other third party cost such
as charter-lease costs and other cost required for the execution of various projects.
5.21.6 Other income
Other income concerns income not related to the key business activities of the Group, such as income from
the sale of non-monetary assets and/or liabilities, exceptional and/or non-recurring income.
5.21.7 Government grants
Government grants are recognised initially as deferred income at fair value when there is reasonable assurance
that they will be received and the Group will comply with the conditions associated with the grant. Grants that
compensate the Group (partly) for expenses incurred are recognised in profit or loss on a systematic basis in
the same periods in which the expenses are recognised. Grants that (partly) compensate the Group for the cost
of an asset are recognised in profit or loss on a systematic basis over the useful life of the asset.

115Fugro Financial statements 2011
5.22 E x p e n s e s
5.22.1 Third party costs
Third party costs are matched with related revenues on contracts and accounted for on a historical cost basis.
5.22.2 Lease payments
Payments made under operating leases are recognised in profit or loss on a straight-line basis over the term of
the lease. Lease incentives received are recognised as an integral part of the total lease expense, over the term
of the lease.
Minimum lease payments made under finance leases are apportioned between the finance expense and the
reduction of the outstanding liability. The finance expense is allocated to each period during the lease term
so as to produce a constant periodic rate of interest on the remaining balance of the liability.
At inception of an arrangement, the Group determines whether such an arrangement is or contains a lease.
A specific asset is the subject of a lease if fulfilment of the arrangement is dependent on the use of that
specified asset. An arrangement conveys the right to use the asset if the arrangement conveys to the Group
the right to control the use of the underlying asset.
At inception or upon reassessment of the arrangement, the Group separates payments and other consideration
required by such an arrangement into those for the lease and those for other elements on the basis of their
relative fair values. If the Group concludes for a finance lease that it is impracticable to separate the payments
reliably, then an asset and a liability are recognised at an amount equal to the fair value of the underlying
asset. Subsequently the liability is reduced as payments are made and an imputed finance charge on the
liability is recognised using the Group’s incremental borrowing rate.
5.22.3 Net finance costs
Net finance costs consist of finance costs, finance income and foreign currency gains and losses.
Finance costs comprise interest expense on borrowings, unwinding of the discount on provisions, losses on
disposal of available-for-sale financial assets, fair value losses on financial assets at fair value through profit
or loss, impairment losses recognised on financial assets (other than trade receivables), and losses on hedging
instruments that are recognised in profit or loss.
Finance income comprises interest income on funds invested (including available-for-sale financial assets),
dividend income, gains on the disposal of available-for-sale financial assets, fair value gains on financial assets
at fair value through profit or loss, gains on the re-measurement to fair value of any pre-existing interest in an
acquiree, and gains on hedging instruments that are recognised in profit or loss. Interest income is recognised
in profit or loss as it accrues, using the effective interest method. Dividend income is recognised in profit or
loss on the date the Group’s right to receive payment is established, which in the case of quoted shares is
normally the ex-dividend date.
Borrowing costs that are not directly attributable to the acquisition, construction or production of a qualifying
asset are recognised in profit or loss using the effective interest method.
Foreign currency gains and losses are reported on a net basis as either finance income or finance cost
depending on whether foreign currency movements are in a net gain or net loss position.

116
5.23 I n c o m e t a x
Income tax expense comprises current and deferred tax. Current tax and deferred tax is recognised in profit or
loss except to the extent that it relates to a business combination, or items recognised directly in equity or in
other comprehensive income.
Current tax is the expected tax payable or receivable on the taxable income or loss for the year, using tax rates
enacted or substantively enacted at the reporting date, and any adjustment to tax payable in respect of
previous years. Current tax payable also includes any tax liability arising from the declaration of dividends.
Deferred tax is recognised in respect of temporary differences between the carrying amounts of assets and
liabilities for financial reporting purposes and the amounts used for taxation purposes. Deferred tax is not
recognised for: taxable temporary differences arising on the initial recognition of goodwill; temporary
differences on the initial recognition of assets or liabilities in a transaction that is not a business combination
and that affects neither accounting nor taxable profit or loss; and temporary differences related to investments
in subsidiaries and jointly controlled entities to the extent that it is probable that they will not reverse in the
foreseeable future. Deferred tax is measured at the tax rates that are expected to be applied to temporary
differences when they reverse, based on the laws that have been enacted or substantively enacted by the
reporting date. Deferred tax assets and liabilities are offset if there is a legally enforceable right to offset
current tax liabilities and assets, and they relate to income taxes levied by the same tax authority on the same
taxable entity, or on different tax entities, but they intend to settle current tax liabilities and assets on a net
basis or their tax assets and liabilities will be realised simultaneously.
A deferred tax asset is recognised for unused tax losses, tax credits and deductible temporary differences, to
the extent that it is probable that future taxable profits will be available against which the asset can be utilised.
Deferred tax assets are reviewed at each reporting date and are reduced to the extent that it is no longer
probable that the related tax benefit will be realised.
Additional income taxes that arise from the distribution of dividends are recognised at the same time as the
liability to pay the related dividend.
In determining the amount of current and deferred tax the Group takes into account the impact of uncertain
tax positions and whether additional taxes and interest may be due. The Group believes that its accruals for tax
liabilities are adequate for all open tax years based on its assessment of many factors, including interpretations
of tax law and prior experience. This assessment relies on estimates and assumptions and may involve a series
of judgements about future events. New information may become available that causes the Group to change its
judgement regarding the adequacy of existing tax liabilities; such changes to tax liabilities will impact tax
expense in the period that such a determination is made.
5.24 S t a t e m e n t o f c a s h f l ow s
The consolidated statement of cash f lows is prepared using the indirect method. The cash f low statement
distinguishes between operating, investing and financing activities. Cash f lows in foreign currencies are
converted at the exchange rate at the dates of the transactions. Currency exchange differences on cash held are
separately shown. Payments and receipts of corporate taxes are included as cash f low from operating activities
and interest paid is shown as cash f low from operating activities. Cash f lows as a result from acquisition/
divestment of financial interest in subsidiaries and equity accounted investees are included as cash f low from
investing activities, taking into account the available cash in these interests. Dividends paid are part of the cash
f low from financing activities.
5.25 S e g m e n t r e p o r t i n g
An operating segment is a component of the Group that engages in business activities from which it may earn
revenues and incur expenses, including revenues and expenses that relate to transactions with any of the
Group’s other components. All operating segments’ operating results are reviewed regularly by the Group’s
Executive Committee to make decisions about resources to be allocated to the segment and to assess its
performance, and for which discrete financial information is available.

117Fugro Financial statements 2011
Inter-segment pricing is determined on an arm’s length basis. Segment results, assets and liabilities include
items directly attributable to a segment as well as those that can be allocated on a reasonable basis.
Unallocated items comprise mainly income tax assets and liabilities, loans and borrowings and corporate
assets and head office expenses. Segment capital expenditure is the total cost incurred during the year to
acquire property, plant and equipment, and intangible assets other than goodwill.
5.25.1 Operating segments
As an engineering firm with operations throughout the world, the Group delivers its services to clients located
all over the globe and collects and interprets data related to the earth’s surface and the soil and rock beneath.
On the basis of this data the Group provides advice, generally for purposes related to the oil and gas industry,
the mining industry and the construction industry. The Group has three reportable segments, which are the
Group’s divisions. The divisions offer different products and services, and are managed separately because they
require different technology and marketing strategies. For each of the divisions, the Executive Committee
reviews internal management reports on a monthly basis. The following summary describes the operations
in each of the Group’s reportable segments:
Geotechnical
The Geotechnical division investigates the engineering properties and geological characteristics of near-surface
soils and rocks using (in-house developed) proprietary technologies, advises on foundation design, provides
construction materials testing, pavement assessment and installation support services. These services support
clients’ projects worldwide in the onshore, near shore and offshore environments, including deep water.
Typical projects include support of infrastructure development and maintenance, large construction projects,
f lood protection and support of the design and installation of oil and gas facilities and windfarms.
Survey
The Survey division provides a range of services in support of the oil and gas industry, renewables and
commercial and civil industries, as well as governments and other organisations. It encompasses numerous
offshore, subsea and geospatial activities as well as global positioning systems that support these and other
Group activities. Offshore services include geophysical investigations for geohazards, pipeline and cable
routes, inspection and construction support services, hydrographic charting and meteorological and
oceanographic studies. Subsea services revolve around the use of remotely operated vehicles (ROV) in support
of drilling as well as inspection, repair and maintenance (IRM) services of subsea assets. These services are
expanded to well intervention in support of oil and gas extraction. Geospatial services concentrate on land
survey and aerial/satellite mapping services for a wide range of clients. Fugro’s global positioning system (GPS)
which augments GPS and Glonass signals to provide globally precise positioning are used for the foregoing
services but also are provided on a subscription basis to a wide range of clients in industry as well as
agriculture.
Geoscience
The Geoscience division provides services and products associated with collecting, processing, interpreting,
managing and storing geophysical and geological data. These data sets are used for evaluating the presence
of natural resources, including oil, gas, water and minerals, and for optimising the exploration, appraisal,
development and production of those resources. A broad range of geophysical data sets are collected including
marine seismic, gravity, magnetics and electromagnetics. The data sets are collected at sea, from the air and on
land using vessels, low flying airplanes and helicopters. Clients are oil and gas companies, mining companies
and governmental organisations.

118
The segments are managed on a worldwide basis, and operate in four principal geographical areas, The
Netherlands, Europe other/Africa, Middle East/Asia/Australia and the Americas. In presenting information on
the basis of geographical segments, segment revenue is based on the geographical location of operating
companies. The allocation of segment assets is based on the geographical location of the operating company
using the assets.
Information regarding the results of each reportable segment is included below. Performance is measured
based on segment profit before income tax, as included in the internal management reports that are reviewed
by the Group’s Executive Committee. Segment profit is used to measure performance as management believes
that such information is the most relevant in evaluating the results of certain segments relative to other
entities that operate within these industries.
Operating segments
(EUR x 1,000) Geotechnical Survey Geoscience Total
2011 2010 2011 2010 2011 2010 2011 2010
Revenue 731,817 724,878 1,252,365 1,060,746 745,101 626,726 2,729,283 2,412,350
Of which inter-segment revenue 61,616 60,352 61,670 52,112 28,232 19,495 151,518 131,959
Segment result 138,335 138,962 284,644 278,831 159,684 145,733 582,663 563,526
Finance income 957 939 3,933 3,012 8,797 25,596 13,687 29,547
Finance expense (12,973) (13,309) (15,837) (5,458) (20,218) (24,974) (49,028) (43,741)
Share of profit of equity-accounted investees – 914 4,642 – 79 104 4,721 1,018
Depreciation (40,025) (34,597) (50,046) (50,530) (39,232) (38,305) (129,303) (123,432)
Amortisation intangible assets (679) (658) (1,625) (676) (8,189) (6,654) (10,493) (7,988)
Reportable segment profit (or loss)
before income tax 85,615 92,251 225,711 225,179 100,921 101,500 412,247 418,930
Reportable segment assets 688,585 608,239 1,400,819 1,051,920 1,548,427 1,312,309 3,637,831 2,972,468
Reportable segment liabilities 385,136 163,055 563,016 294,409 869,737 761,599 1,817,889 1,219,063
Capital expenditure, property, plant and equipment 45,691 54,413 221,573 96,775 40,393 288,809 307,657 439,997
Capital expenditure intangible assets 31,766 6,042 68,849 40,745 107,781 19,184 208,396 65,971
Additions to other investments (4) (1) 7,372 – (10,434) 39,113 (3,066) 39,112
Geographical segments
(EUR x 1,000) Netherlands Europe other/AfricaMiddle East/
Asia/Australia Americas Consolidated
2011 2010 2011 2010 2011 2010 2011 2010 2011 2010
Revenue from external
customers 143,588 133,233 1,224,878 1,110,685 645,067 432,105 564,232 604,368 2,577,765 2,280,391
Non-current assets 249,773 199,585 997,314 817,599 856,976 714,183 277,445 225,640 2,381,508 1,957,007

119Fugro Financial statements 2011
Reconciliation of reportable segment revenues, profit or loss, assets and liabilities and other material items
(EUR x 1,000) 2011 2010
Revenues
Total revenue for reportable segments 2,729,283 2,412,350
Elimination of inter-segment revenue (151,518) (131,959)
Consolidated revenue 2,577,765 2,280,391
Profit or loss
Total profit (or loss) for reportable segments before income tax 412,247 418,930
Unallocated amounts:
– Other corporate expenses (93,537) (80,627)
– Net finance income 21,892 20,368
Consolidated profit before income tax 340,602 358,671
Assets
Total assets for reportable segments 3,637,831 2,972,468
Other unallocated amounts 223,764 117,523
Consolidated assets 3,861,595 3,089,991
Liabilities
Total liabilities for reportable segments 1,817,889 1,219,063
Other unallocated amounts 369,572 347,681
Consolidated liabilities 2,187,461 1,566,744
Unallocated assets are assets that are used by more than one reporting segment, and principally comprise
in both 2011 and 2010 property, plant and equipment, equity-accounted investees and other investments,
deferred tax assets, current tax assets, derivative financial instrument assets and cash and cash equivalents
which are used as part of the Group’s financing offset arrangements. Unallocated liabilities are liabilities that
relate to more than one reporting segment, and comprise both in 2011 as in 2010 borrowings, derivative
financial instruments liabilities; current and non-current tax liabilities, employee benefit obligations and
centrally held accruals and provisions.
Other corporate expenses 2011 and 2010 include general (corporate) expenses, depreciation on corporate assets
and on certain items of property, plant and equipment that are used by operating segments but are managed
as a central pool.

120
Other material items 2011 in respect of elements of profit or loss
(EUR x 1,000)
Report-able
segment totals
Adjust-ments and
other unallo-cated
amounts
Consoli-dated totals
Finance income 13,687 15,412 29,099
Finance expense (49,028) 6,480 (42,548)
Depreciation (129,303) (91,681) (220,984)
Amortisation intangible assets (10,493) (181) (10,674)
Other material items 2010 in respect of elements of profit or loss
(EUR x 1,000)
Report-able
segment totals
Adjust-ments and
other unallo-cated
amounts
Consoli-dated totals
Finance income 29,547 (1,308) 28,239
Finance expense (43,741) 21,676 (22,065)
Depreciation (123,432) (78,061) (201,493)
Amortisation intangible assets (7,988) (123) (8,111)
5.26 A c q u i s i t i o n s a n d d i ve s t m e n t s o f s u b s i d i a r i e s
5.26.1 Acquisitions 2011
The Group acquired a 100% interest in the following companies, assets and activities:
(EUR x million) Price Goodwill Country DivisionAnnual revenue
Number of em ployees
Acquisition date
TSmarine Group Holdings
Pty Ltd. 90.5 67.9 Australia Survey 90.0 170 3 March
Bluestone Offshore Pte Ltd. 9.5 23.4 Singapore Geotechnical 15.4 40 4 April
JDR Cable Systems Holdings
Netherlands B.V. 35.1 37.1 Netherlands Geoscience 25.0 110 29 April
Kelman Technologies (Seismic
Processing business and assets) 7.3 4.1 Canada Geoscience 9.1 40 13 May
AOA Geophysics, Inc. 0.6 2.3 USA Geotechnical 1.9 14 30 June
Sial Geosciences Consulting
and Engineering S ti 4.6 4.1 Turkey Geotechnical 1.5 21 6 July
MR Subsea KS and AS 6.6 (4.5) Norway Survey 4.6 1 September
Geo-log GmbH 1.2 1.2 Germany Geotechnical 2.0 20 1 October
Seabird (Ocean Bottom Nodes
business and assets) 60.8 31.7 Norway Geoscience 65.0 55 8 December
Adjustment prior years – (0.2)
Total 216.2 167.1 214.5 470

121Fugro Financial statements 2011
5.26.1.1 TSmarine Group Holdings Pty Ltd.
Early March, Fugro has acquired 100% of the shares in TSmarine Group Holdings Pty Ltd. (TSM) and its
subsidiaries. Revenue in 2010 was EUR 90.0 million and the company employs 170 staff. The goodwill amounts
to EUR 67.9 million.
5.26.1.2 Bluestone Offshore Pte Ltd.
In April, Fugro has acquired 100% of the shares in Bluestone Offshore Pte Ltd. Revenue in 2010 was
EUR 15.4 million and the company employs 40 staff. The goodwill amounts to EUR 23.4 million.
5.26.1.3 JDR Cable Systems Holdings Netherlands B.V.
In April, Fugro has acquired 100% of the shares in JDR Cable Systems Holdings Netherlands B.V. renamed
to De Regt Marine Cables B.V. Revenue in 2010 was EUR 25.0 million and the company employs 110 staff.
The goodwill amounts to EUR 37.1 million.
5.26.1.4 Kelman Technologies (Seismic Processing business and assets)
In May, Fugro has acquired the seismic processing business from Kelman Technologies in Canada. Revenue
in 2010 was about EUR 9.1 million and Fugro has taken over 40 employees. The goodwill amounts to
EUR 4.1 million.
5.26.1.5 AOA Geophysics, Inc.
At the end of June, Fugro has reached agreement with AOA Geophysics to acquire 100% of the shares in the
company. AOA Geophysics is based in Houston and provides geoscience consultancy and contracting services
to the offshore oil and gas sectors, with particular expertise in marine oil seep exploration and the
interpretation of geophysical data in complex ground conditions, including gas hydrates. The company
employs 14 staff with annual revenue of EUR 1.9 million. The goodwill on the acquisition amounts to
EUR 2.3 million.
5.26.1.6 Sial Geosciences Consulting and Engineering S ti (Sial)
In July, Fugro has acquired 100% of the shares in Sial. Sial is a leading Turkish geotechnical consultant
providing expertise to large infrastructure construction companies and government. The annual revenues
amounted to EUR 1.5 million. The goodwill on the acquisition amounts to EUR 4.1 million. The company has
21 employees.
5.26.1.7 MR Subsea KS and AS
On 1 September Fugro acquired the remaining 50% of the shares in MR Subsea KS and MR Subsea AS from
Simon Møkster Shipping. MR Subsea is active in the field of ROV services and is the owner of the sub sea vessel
Atlantis Dweller. The annual revenue amounted to EUR 4.6 million. The fair value of the assets recognised in
the business combination was higher than the purchase price. As a result, Fugro has recognised a gain in profit
and loss of EUR 4.5 million as a result of this bargain purchase. In addition, a gain was recognised in share of
profit of equity-accounted investees (net of income tax) as a result of remeasuring the equity interest, held by
Fugro before the business combination, to fair value of EUR 3.7 million.
5.26.1.8 Geo-log GmbH
Early October, Fugro acquired 100% of the shares in Geo-log GmbH in Germany. Geo-log is an onshore
geotechnical company with expertise in the field of site investigation and characterisation.
The annual revenue amounted to EUR 2.0 million. The company employs 20 employees. The goodwill amounts
to EUR 1.2 million.

122
5.26.1.9 Seabird (Ocean Bottom Nodes business and assets)
In December, Fugro has acquired the Ocean Bottom Nodes business from Seabird Exploration Plc. in Norway.
Revenue in 2010 was about EUR 65.0 million and Fugro has taken over 55 employees. The goodwill amounts to
EUR 31.7 million.
5.26.2 Divestments
In March, Fugro divested its geotechnical business in the South of France. This transaction involved taking
over staff (70 employees), equipment and the order book of the branches in Aix, Montpellier, Toulouse and
Bordeaux.
5.26.3 Effect of acquisitions and divestments
The TSM acquisition had the following effect on the Group’s assets and liabilities:
(EUR x 1,000) 2011
Property, plant and equipment 18,231
Intangible assets 1,005
Inventories 1,159
Trade and other receivables 60,000
Current tax assets 2,102
Cash and cash equivalents (835)
Deferred tax assets 5,065
Trade and other payables (64,152)
Total net identifiable assets and liabilities 22,575
Goodwill on acquisition 67,900
Consideration payable (7,700)
Consideration paid, in cash 82,775
Cash acquired 835
Net cash outflow 83,610

123Fugro Financial statements 2011
The Ocean Bottom Nodes acquisition had the following effect on the Group’s assets and liabilities:
(EUR x 1,000) 2011
Property, plant and equipment 40,919
Intangible assets 8,324
Other fixed assets 23
Trade and other receivables 5,309
Deferred tax assets 10,631
Cash and cash equivalents 133
Loans and borrowings (35,572)
Trade and other payables (780)
Total net identifiable assets and liabilities 28,987
Goodwill on acquisition 31,691
Consideration paid, in cash 60,678
Cash acquired (133)
Net cash outflow 60,545
The other acquisitions had the following effect on the Group’s assets and liabilities:
(EUR x 1,000) 2011
Property, plant and equipment 66,652
Intangible assets 2,477
Investments in equity-accounted investees (11,055)
Deferred tax assets 739
Inventories 1,379
Trade and other receivables 11,152
Current tax assets 160
Cash and cash equivalents 3,587
Loans and borrowings (52,289)
Trade and other payables (25,215)
Total net identifiable assets and liabilities (2,413)
Goodwill on acquisitions 67,458
Considerations payable (2,150)
Consideration paid, in cash 62,895
Cash (acquired)/disposed of (3,587)
Net cash outflow 59,308
The other acquisitions have been combined in the table above as none of them individually is considered to be
material. Furthermore, the acquisitions in 2011 include an amount of EUR 0.3 million relating to prior period
adjustments due to the finalisation of the purchase price allocation procedures (2010: EUR 4.4 million).

124
The acquisitions in 2011 contributed EUR 161 million to the revenues of the Group. If all acquisitions in 2011
had been effected at the beginning of 2011, the revenue of the Group would have been around EUR 268 million
higher.
The acquisitions in 2011 contributed EUR 0.1 million negative to the profit of the Group. On a full year basis
this would approximately amount to EUR 7.5 million positive. In determining these amounts, management
has assumed that the fair value adjustments, determined provisionally, that arose on the date of acquisition
would have been the same if the acquisition had occurred on 1 January 2011.
The goodwill from the acquisitions is attributable mainly to market share, the skills and technical talent
of the acquired business’ work force, and the synergies expected to be achieved from integrating the
companies into the Group’s existing business. None of the goodwill recognised is expected to be deductible
for income tax purposes.
The fair value of acquired assets and (contingent) liabilities related to the acquisitions has been determined
provisionally pending completion of final valuations.
The group incurred acquisition-related costs of EUR 2,612 thousand (2010: EUR 481 thousand) related to
external legal fees and due diligence costs. The legal fees and due diligence costs have been included in the
other expenses in profit or loss.
The divestments had the following effect on the Group’s assets and liabilities:
(EUR x 1,000) 2011
Property, plant and equipment (153)
Trade and other receivables (1,238)
Current tax assets 621
Trade and other payables 601
Total net identifiable assets and liabilities (169)
Sale price 1,300
Consideration paid, in cash 1,131
Cash disposed of –
Net cash outflow 1,131
5.27 G o ve r n m e n t g r a n t s
The Company has not been awarded any significant government grants in 2011.
5.28 T h i r d p a r t y c o s t s
(EUR x 1,000) 2011 2010
Cost of suppliers 601,221 408,651
Operational lease expense 141,781 99,566
Other rentals 113,093 95,441
Seismic and geological data libraries 78,917 88,758
Other costs 59,025 73,171
994,037 765,587
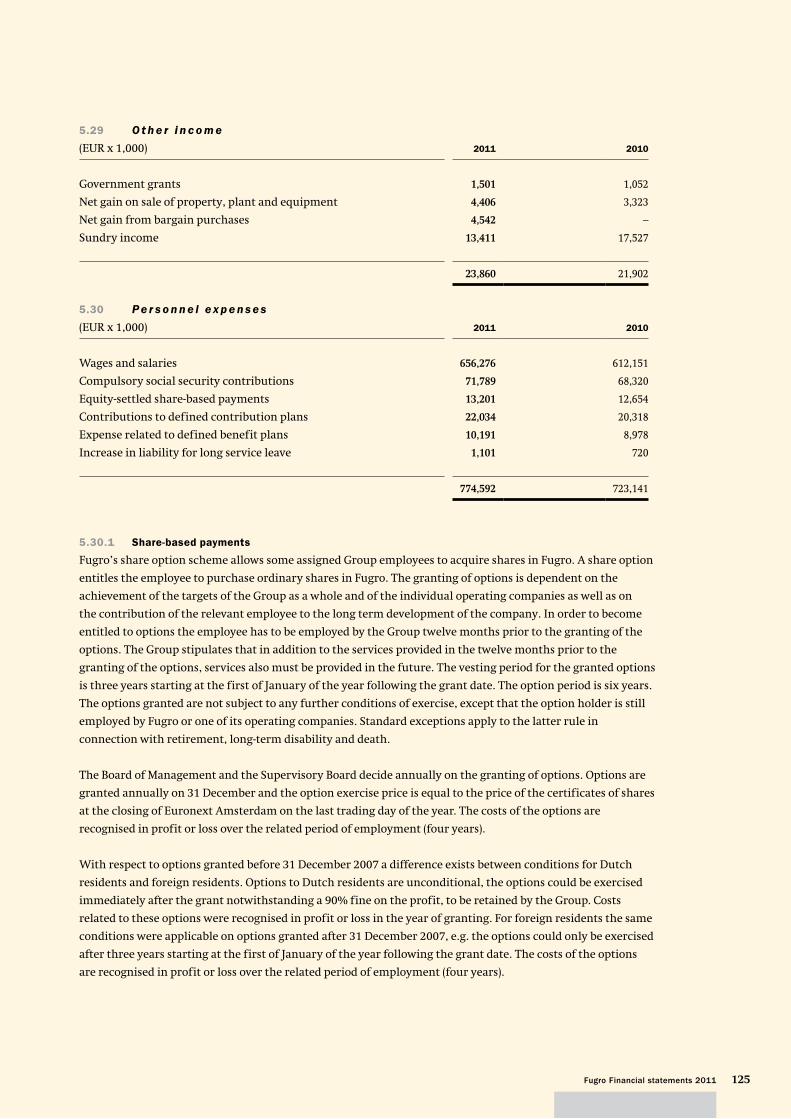
125Fugro Financial statements 2011
5.29 O t h e r i n c o m e
(EUR x 1,000) 2011 2010
Government grants 1,501 1,052
Net gain on sale of property, plant and equipment 4,406 3,323
Net gain from bargain purchases 4,542 –
Sundry income 13,411 17,527
23,860 21,902
5.30 Pe r s o n n e l e x p e n s e s
(EUR x 1,000) 2011 2010
Wages and salaries 656,276 612,151
Compulsory social security contributions 71,789 68,320
Equity-settled share-based payments 13,201 12,654
Contributions to defined contribution plans 22,034 20,318
Expense related to defined benefit plans 10,191 8,978
Increase in liability for long service leave 1,101 720
774,592 723,141
5.30.1 Share-based payments
Fugro’s share option scheme allows some assigned Group employees to acquire shares in Fugro. A share option
entitles the employee to purchase ordinary shares in Fugro. The granting of options is dependent on the
achievement of the targets of the Group as a whole and of the individual operating companies as well as on
the contribution of the relevant employee to the long term development of the company. In order to become
entitled to options the employee has to be employed by the Group twelve months prior to the granting of the
options. The Group stipulates that in addition to the services provided in the twelve months prior to the
granting of the options, services also must be provided in the future. The vesting period for the granted options
is three years starting at the first of January of the year following the grant date. The option period is six years.
The options granted are not subject to any further conditions of exercise, except that the option holder is still
employed by Fugro or one of its operating companies. Standard exceptions apply to the latter rule in
connection with retirement, long-term disability and death.
The Board of Management and the Supervisory Board decide annually on the granting of options. Options are
granted annually on 31 December and the option exercise price is equal to the price of the certificates of shares
at the closing of Euronext Amsterdam on the last trading day of the year. The costs of the options are
recognised in profit or loss over the related period of employment (four years).
With respect to options granted before 31 December 2007 a difference exists between conditions for Dutch
residents and foreign residents. Options to Dutch residents are unconditional, the options could be exercised
immediately after the grant notwithstanding a 90% fine on the profit, to be retained by the Group. Costs
related to these options were recognised in profit or loss in the year of granting. For foreign residents the same
conditions were applicable on options granted after 31 December 2007, e.g. the options could only be exercised
after three years starting at the first of January of the year following the grant date. The costs of the options
are recognised in profit or loss over the related period of employment (four years).

126
The average stock price on Euronext Amsterdam during 2011 was EUR 50.41 (2010: EUR 47.03).
As at 31 December 2011, Fugro N.V. granted 1,161,100 options to 684 employees. These options have an
exercise price of EUR 44.895 (2010: 1,107,350 options were granted to 663 employees with an exercise price
of EUR 61.50).
In 2011 Fugro sold 970,050 certificates of shares in relation to options that were exercised. Fugro issued no new
(certificates of) shares in relation to the exercise of options in 2011 (2010: nil). The (certificates of) shares that
were sold had an average purchase price of EUR 44,16 per certificate. The options were exercised throughout
the year, with the exception of determined closed periods.
As at 31 December the following options were outstanding:
Year of issue Duration
Number of partici-
pants Granted
Out-standing at 01-01-
2011Forfeited in 2011
Exercised in 2011
Out-standing at 31-12-
2011
Exercis-able at 31-12-2011
Exercise price
(EUR)
2005 6 years 521 1,155,000 795,750 6,500 789,250 – – 27.13
2006 6 years 547 1,140,500 963,550 4,000 127,800 831,750 831,750 36.20
2007 6 years 565 1,140,500 1,120,950 8,350 53,000 1,059,600 1,059,600 52.80
2008 6 years 620 1,141,900 1,130,750 12,250 – 1,118,500 1,118,500 20.485
2009 6 years 639 1,166,550 1,161,750 7,850 – 1,153,900 – 40.26
2010 6 years 663 1,107,350 1,107,350 2,800 – 1,104,550 – 61.50
2011 6 years 684 1,161,100 – – – 1,161,100 – 44.895
8,012,900 6,280,100 41,750 970,050 6,429,400 3,009,850
The outstanding options as at 31 December 2011 have an exercise price ranging from EUR 20.485 to EUR 61.50.
The average remaining term of the options is four years (2010: four years). The movement during the year of
options and the average exercise price is as follows:
2011 2010
Weighted average exercise
price (EUR)
Number of options
Weighted average exercise
price (EUR)
Number of options
Options outstanding at 1 January 40.40 6,280,100 33.17 6,334,430
Forfeited during the period 35.96 (41,750) 34.79 (25,700)
Options granted during the period 44.895 1,161,100 61.50 1,107,350
Options exercised during the period 29.73 (970,050) 20.77 (1,135,980)
Options outstanding at 31 December 42.85 6,429,400 40.40 6,280,100
Exercisable at 31 December 3,009,850 2,880,250

127Fugro Financial statements 2011
The valuation of the share options is determined by using a binomial model.
Concerning early departure, different percentages for different categories of staff are used: Board of
Management 0%, other Executive Committee members 0%, managers of operating companies 7%.
The expected behaviour for exercising the options by the Board of Management is estimated till the end of the
vesting period and for the other two groups with a multiple of three. Expected volatility is estimated by
considering historic average share price volatility.
The inputs used in the measurement of the fair values at grant date of the share options are the following:
2011 2010
Average share price during the year in EUR 50.41 47.03
Average fair value of the granted options during the year in EUR 12.76 16.71
Exercise price (fair value at grant date) in EUR 44.895 61.50
Expected volatility (weighted average volatility) 41% 39%
Option term (expected weighted average term) 4 years 4 years
Expected dividends 3.28% 3.38%
Risk-free interest rate (based on government bonds) 1.91% 2.74%
Costs of granted options at the end of 2007 in EUR – 3,291,433
Costs of granted options at the end of 2008 in EUR 1,715,401 1,582,401
Costs of granted options at the end of 2009 in EUR 3,153,277 3,153,277
Costs of granted options at the end of 2010 in EUR 4,627,100 4,627,100
Costs of granted options at the end of 2011 in EUR 3,704,740 –
Total 13,200,518 12,654,211
5.30.2 Number of employees as at 31 December 2011 2010
Nether-
lands Foreign Total Nether-
lands Foreign Total
Technical staff 703 9,861 10,564 607 9,545 10,152
Management and administrative staff 163 2,591 2,754 154 2,643 2,797
Temporary and contract staff 168 390 558 182 332 514
1,034 12,842 13,876 943 12,520 13,463
Average number of employees during the year 1,053 12,696 13,749 944 12,500 13,444

128
5.31 O t h e r e x p e n s e s
(EUR x 1,000) 2011 2010
Maintenance and operational supplies 62,723 60,779
Indirect operating expenses 71,188 62,429
Occupancy costs 44,805 43,176
Communication and office equipment 37,247 34,181
Restructuring costs 257 544
Research cost 682 3,278
Loss on disposal of property, plant and equipment 1,850 273
Other 33,256 47,822
252,008 252,482
Audit fees, presented under other expenses, as charged by KPMG are disclosed in note 9.13.
5.32 N e t f i n a n c e ( i n c o m e ) c o s t s
(EUR x 1,000) 2011 2010
Interest income on loans and receivables (6,131) (4,853)
Dividend income on available-for-sale financial assets (203) (1,049)
Net change in fair value of financial assets at fair value
through profit or loss (6,008) (22,337)
Net foreign exchange variance (16,757) –
Finance income (29,099) (28,239)
Interest expense on financial liabilities measured at amortised cost 39,094 16,960
Net change in fair value of derivatives 1,387 –
Net change in fair value of financial assets at fair value
through profit or loss 2,067 –
Net foreign exchange variance – 5,105
Finance expense 42,548 22,065
Net finance (income)/costs recognised in profit or loss 13,449 (6,174)

129Fugro Financial statements 2011
(EUR x 1,000) 2011 2010
Recognised in other comprehensive income
Net gain (loss) on hedge of net investment in foreign operations (53,218) 864
Foreign currency translation differences of foreign operations 55,850 108,638
Foreign currency translation differences of equity-accounted investees 24 121
2,656 109,623
Net change in fair value of cash f low hedges transferred to profit or loss 1,034 1,034
Net change in fair value of available-for-sale financial assets (1,899) (438)
Total 1,791 110,219
Recognised in:
Hedging reserve 1,034 1,034
Translation reserve 1,999 108,739
Other reserves (1,899) (438)
Non-controlling interests 657 884
Total 1,791 110,219
5.33 I n c o m e t a x e x p e n s e
Recognised in profit or loss
(EUR x 1,000) 2011 2010
Current tax expense
Current year 59,703 67,298
Adjustment for prior years (612) (3,356)
59,091 63,942
Deferred tax expense
Origination and reversal of temporary differences (3,172) 14,210
Reduction in tax rate 924 333
Utilisation of tax losses recognised (5,363) 188
Recognition of previously unrecognised tax losses (5,462) (495)
Effect of write-down deferred tax assets – 1
Adjustments for prior years (686) 339
(13,759) 14,576
Total income tax expense 45,332 78,518

130
Reconciliation of effective tax rate
(EUR x 1,000)2011
%2011 2010
%2010
Profit for the period 295,270 280,153
Income tax expense 45,332 78,518
Profit before income tax 340,602 358,671
Income tax using the weighted domestic average tax rates 16.7 57,025 23.0 82,522
Reduction in tax rate 0.3 924 0.1 333
Recognition of previously unrecognised tax losses (1.6) (5,462) (0.2) (495)
Effect of write-down deferred tax assets – – 0.0 1
Non-deductible expenses 0.8 2,748 0.9 3,246
Tax exempt income (1.5) (5,278) (0.9) (3,250)
Effect of utilisation previously unrecognised tax losses (1.0) (3,327) (0.2) (822)
Adjustments for prior years (deferred) (0.2) (686) 0.1 339
Adjustments for prior years (current) (0.2) (612) (0.9) (3,356)
13.3 45,332 21.9 78,518
The geographical spread of taxable profits in 2011 compared to 2010 resulted in a reduction of the average
domestic tax rate applicable from 23.0% to 16.7%. Furthermore, in a number of tax jurisdictions previously
unrecognised tax losses were recognised (2011: EUR 5.5 million; 2010: EUR 0.5 million) and in addition
previously unrecognised tax losses were utilised in 2011 (2011: EUR 3.3 million; 2010: EUR 0.8 million). In 2011
a lot of emphasis was put on reducing tax expenses, for example by using the recently introduced innovation
box opportunity in the Netherlands.
Adjustments for prior years relate to settlement of outstanding tax returns of several years and various fiscal
tax entities as well as the recognition of tax liabilities for fiscal positions taken that are currently being
challenged or probably will be challenged by tax authorities.

131Fugro Financial statements 2011
Income tax recognised in other comprehensive income and in equity
(EUR x 1,000) 2011 2010
Before tax
Tax (ex-pense)/benefit Net of tax Before tax
Tax (ex-pense)/ benefit Net of tax
Defined benefit plan actuarial gains (losses) (19,655) 4,736 (14,919) 1,274 (539) 735
Net change in fair value of cash f low hedges
transferred to profit or loss 1,388 (354) 1,034 1,388 (354) 1,034
Net change in fair value of hedge of net investment
in foreign operations (53,218) – (53,218) 2,700 (1,836) 864
Share-based payment transactions 29,021 878 29,899 22,728 2,552 25,280
Net change in fair value of available-for-sale
financial assets (1,899) – (1,899) (438) – (438)
Foreign currency translation differences of foreign
operations and equity-accounted investees 55,028 846 55,874 108,493 266 108,759
10,665 6,106 16,771 136,145 89 136,234
Reference is also made to note 5.40.
5.34 C u r r e n t t a x a s s e t s a n d l i a b i l i t i e s
The net current tax asset of EUR 10,765 thousand (2010: EUR 7,057 thousand net current tax liability)
represents the balance of current tax assets and liabilities in respect of current and prior periods less advance
tax payments.

132
5.35 P r o p e r t y , p l a n t a n d e q u i p m e n t
(EUR x 1,000) 2011
Land and buildings
Plant and equip-ment Vessels
Fixed assets
under con-struction Other Total
Cost
Balance at 1 January 2011 171,395 1,144,045 676,246 134,313 214,291 2,340,290
Acquisitions through business combinations 3,723 67,434 42,565 3,738 8,342 125,802
Investments in assets under construction – – – 134,387 – 134,387
Other additions 16,195 73,482 30,284 – 23,402 143,363
Capitalised fixed assets under construction – 59,112 118,439 (177,551) – –
Disposals (3,308) (42,169) (3,529) – (14,297) (63,303)
Effects of movement in foreign exchange rates 3,481 12,728 24,646 (2,356) 4,358 42,857
Balance at 31 December 2011 191,486 1,314,632 888,651 92,531 236,096 2,723,396
Depreciation and impairment losses
Balance at 1 January 2011 50,383 666,652 146,104 – 185,837 1,048,976
Depreciation 7,344 148,623 44,225 – 20,792 220,984
Disposals (750) (33,454) (3,207) – (11,501) (48,912)
Effects of movement in foreign exchange rates 1,092 9,829 4,509 – 3,937 19,367
Balance at 31 December 2011 58,069 791,650 191,631 – 199,065 1,240,415
Carrying amount
At 1 January 2011 121,012 477,393 530,142 134,313 28,454 1,291,314
At 31 December 2011 133,417 522,982 697,020 92,531 37,031 1,482,981

133Fugro Financial statements 2011
(EUR x 1,000) 2010
Land and buildings
Plant and equip-ment Vessels
Fixed assets
under con-struction Other Total
Cost
Balance at 1 January 2010 155,595 922,775 450,189 164,319 190,266 1,883,144
Acquisitions through business combinations 2,112 (1,317) – – 2,136 2,931
Investments in assets under construction – – – 226,285 – 226,285
Other additions 5,793 147,339 3,309 – 16,295 172,736
Capitalised fixed assets under construction – 61,860 209,228 (271,088) – –
Disposals (3,505) (64,384) (6,967) – (10,512) (85,368)
Effects of movement in foreign exchange rates 11,400 77,772 20,487 14,797 16,106 140,562
Balance at 31 December 2010 171,395 1,144,045 676,246 134,313 214,291 2,340,290
Depreciation and impairment losses
Balance at 1 January 2010 44,100 527,383 110,778 – 157,656 839,917
Depreciation 6,292 136,553 35,823 – 22,825 201,493
Disposals (2,161) (45,219) (6,956) – (8,137) (62,473)
Effects of movement in foreign exchange rates 2,152 47,935 6,459 – 13,493 70,039
Balance at 31 December 2010 50,383 666,652 146,104 – 185,837 1,048,976
Carrying amount
At 1 January 2010 111,495 395,392 339,411 164,319 32,610 1,043,227
At 31 December 2010 121,012 477,393 530,142 134,313 28,454 1,291,314
5.35.1 Impairment loss and subsequent reversal
The Group has not incurred nor reversed any impairment losses.
5.35.2 Fixed assets under construction
This involves mainly vessels under construction and ROVs. These will become operational in 2012 and 2013.
At 31 December 2011 capitalised borrowing costs related to the construction of vessels amounted to
EUR 10.0 million (2010: EUR 13.6 million), with an interest rate of 4.5% (2010: 4.5%).
5.35.3 Leased fixed assets
The Group has no leased fixed assets that have to be included in property, plant and equipment.
5.35.4 Security
Land and buildings includes EUR 5 million (2010: EUR 6 million) in the Netherlands, that serves as security
for mortgage loans (refer to note 5.46).

134
5.36 I n t a n g i b l e a s s e t s
(EUR x 1,000) 2011
Goodwill Software Other Total
Cost
Balance at 1 January 2011 526,623 120,029 17,534 664,186
Acquisitions through business combinations 171,832 2,852 8,954 183,638
Adjustments prior period (241) – – (241)
Purchase of intangible assets – 1,568 7,049 8,617
Internally developed intangible assets – 16,504 – 16,504
Effect of movements in foreign exchange rates 7,364 1,704 388 9,456
Balance at 31 December 2011 705,578 142,657 33,925 882,160
Amortisation and impairment losses
Balance at 1 January 2011 – 78,928 8,825 87,753
Amortisation of intangible assets – 7,953 2,721 10,674
Effect of movements in foreign exchange rates – 958 389 1,347
Balance at 31 December 2011 87,839 11,935 99,774
Carrying amount
At 1 January 2011 526,623 41,101 8,709 576,433
At 31 December 2011 705,578 54,818 21,990 782,386

135Fugro Financial statements 2011
(EUR x 1,000) 2010
Goodwill Software Other Total
Cost
Balance at 1 January 2010 459,745 92,163 15,273 567,181
Acquisitions through business combinations 39,735 29 – 39,764
Adjustments prior period 4,356 – – 4,356
Purchase of intangible assets – 13,740 2 13,742
Internally developed intangible assets – 8,486 – 8,486
Effect of movements in foreign exchange rates 22,787 5,611 2,259 30,657
Balance at 31 December 2010 526,623 120,029 17,534 664,186
Amortisation and impairment losses
Balance at 1 January 2010 – 68,339 6,152 74,491
Amortisation of intangible assets – 6,228 1,883 8,111
Effect of movements in foreign exchange rates – 4,361 790 5,151
Balance at 31 December 2010 – 78,928 8,825 87,753
Carrying amount
At 1 January 2010 459,745 23,824 9,121 492,690
At 31 December 2010 526,623 41,101 8,709 576,433
5.36.1 Impairment loss and subsequent reversal
The Company has not incurred nor reversed any impairment losses.
5.37 I m p a i r m e n t t e s t i n g fo r c a s h - ge n e r a t i n g u n i t s c o n t a i n i n g go o d w i l l
For the purpose of impairment testing, goodwill is allocated to cash-generating units which represent the
lowest level within the Group at which the goodwill is monitored for internal management purposes and
which is not higher than the Group’s operating segments as reported in note 5.25. The aggregate carrying
amounts of goodwill are allocated to the following groups of cash-generating units:
(EUR x 1,000) 2011 2010
Geotechnical 109,727 76,830
Survey 322,543 252,663
Geoscience 273,308 197,130
Total 705,578 526,623

136
The recoverable amounts of the cash-generating units that carry goodwill are determined based on
calculations of value in use. Value in use was determined by discounting the expected future cash f lows from
the continuing use of the units. Unless indicated otherwise, value in use in 2011 was determined similarly as in
2010. The calculation of the value in use was based on the following key assumptions:
– The period for the discounted cash f low calculations is in principle indefinite. However the Group has set
the period at fifty years, subject to periodic evaluation, for the following reasons. About 75% of the Group’s
activities relate to the oil and gas industry. The services are in principle of such a nature that our clients use
us to help them to explore and extract hydrocarbon and mineral resources. Experts are without doubt that
these resources will continue to be available to mankind for many decades and their reports indicate
periods between fifty and hundred years. The Group recognises that harnessing alternative means of
energy, like wind, nuclear and hydro electric energy will continue. These sources however have limited
output and will be difficult to transport.
– Cash f lows in the first year of the forecast are based on the approved profit plan. The anticipated annual
revenue growth for following years has been based on average growth levels ranging from 0 to 3.5%.
– The pre-tax discount rate used to discount the pre-tax cash f lows used for impairment testing purposes is
determined through an iterative calculation method using the projected post-tax cash f lows, expected tax
rate for the respective cash generating unit and post-tax discount rate for the Group. The weighted average
pre-tax discount rate for the Group is 10.5% (2010: 10.6%).
The key assumptions and the approach to determine their value are the growth rates that are based on analysis
of the long-term market price trends in the oil and gas industry adjusted for actual experience.
The carrying amounts of the units remain below the recoverable amounts and as such no impairment losses
are accounted for. Considering the significant headroom (recoverable amounts exceeding carrying amounts),
no sensitivity analysis has been prepared. Future adverse changes in the assumptions could however reduce
the recoverable amounts below the carrying amount. As at 31 December 2011 no cumulative impairment
losses have been recognised (2010: none).
5.38 I n ve s t m e n t s i n e q u i t y - a c c o u n t e d i n ve s t e e s
The carrying amount of the equity-accounted investees of the Group can be summarised as follows:
(EUR x 1,000) 2011 2010
Equity-accounted investees 1,632 7,836
The Group’s share in realised profit in the above mentioned equity-accounted investees amounted
to EUR 4,721 thousand positive in 2011 (2010: EUR 1,018 thousand positive).
In 2011 and 2010 the Group did not receive dividends from any of its investments in equity-accounted
investees or other investments.
None of the group’s equity-accounted investees are publicly listed entities and consequently they do not have
published price quotations.
Not adjusted for the percentage ownership held by the Group, the equity-accounted investees have assets
of EUR 3 million (2010: EUR 46 million), liabilities of EUR 1 million (2010: EUR 30 million), revenues of
EUR 10 million (2010: EUR 20 million) and profit of EUR 2 million (2010: EUR 4 million). The decrease
compared to 2010 is mainly a result of the acquisition of the remaining 50% shares in MR Subsea KS and
MR Subsea AS.

137Fugro Financial statements 2011
5.39 O t h e r i n ve s t m e n t s
The Group holds the following other investments:
(EUR x 1,000) 2011 2010
Other investments in equity instruments 1,095 1,095
Long-term loans 5,246 31,623
Financial assets at fair value through profit or loss 47,658 25,636
Available-for-sale financial assets 1,021 2,812
Other long-term receivables 4,227 1,367
59,247 62,533
5.39.1 Other investments in equity instruments
The Group has the following other investments in equity instruments accounted for at cost:
Name of the company
(EUR x 1,000) Country Ownership Assets Liabilities Equity RevenueProfit/
loss
La Coste & Romberg-Scintrex USA 11% 12,713 9,643 3,070 13,856 1,612
The Group’s other investments in equity instruments are not listed. A reliable fair value estimate cannot
be made.
5.39.2 Long-term loans
In July 2010, Fugro granted a loan to Electro Magnetic GeoServices ASA (EMGS) of US dollar 20 million.
The loan had a maturity of 3.5 years, carried an interest rate of Libor plus 8% and was secured by the income
of the Pemex contract which EMGS is carrying out. The loan was repaid in July 2011.
In December Fugro granted a loan facility for five years of USD 25 million to Expro AX-S Technology. At the end
of December about one third of the facility has been drawn. The loan bears interest of 10%, after an interest
free period of 10 months. The loan is scheduled to be repaid as follows: 20% in year 3, 20% in year 4 and 60% in
year 5. The facility agreement includes a warrant and a call option. The warrant (expiring 31 December 2013)
gives Fugro the right to obtain 25% of the shares of Expro AX-S for an amount of USD 250,000, the option
(expiring 30 April 2012) gives Fugro the right to convert the loan facility into another 25% of the shares.
5.39.3 Financial assets at fair value through profit or loss
In 2009 the Group provided a long-term convertible loan of NOK 150 million at 7% per annum to Electro
Magnetic GeoServices ASA (EMGS). The conversion feature has been accounted for as financial asset at fair
value through profit or loss. The loan could at any time be converted into common shares in EMGS at the
conversion price of NOK 5.40 per share until the maturity date on 2 January 2012. In April 2011 the EMGS
convertible loan was converted into 27.8 million shares in EMGS (14.81% of the outstanding shares of EMGS,
valued at year-end share price of NOK 13.30).
5.39.4 Available-for-sale financial assets
The fair value of the available for sale financial assets is based on quoted prices of these companies on the
Australian Securities Exchange (ASX).

138
5.40 D e f e r r e d t a x a s s e t s a n d l i a b i l i t i e s
5.40.1 Recognised deferred tax assets and liabilities
Deferred tax assets and liabilities are attributable to the following items:
(EUR x 1,000) Assets Liabilities Net
2011 2010 2011 2010 2011 2010
Property, plant and equipment 10,958 8,568 (7,148) (5,466) 3,810 3,102
Intangible assets 833 490 (12,133) (8,319) (11,300) (7,829)
Other investments 124 2,246 – (1,132) 124 1,114
Financial assets at fair value through profit or loss – – – (6,253) – (6,253)
Loans and borrowings – 186 – – – 186
Employee benefits 25,126 20,018 – – 25,126 20,018
Provisions 1,408 3,302 (236) (1,473) 1,172 1,829
Tax loss carry-forwards 26,948 1,040 – – 26,948 1,040
Exchange rate differences 213 206 (64) (62) 149 144
Other items 8,027 2,752 (12,477) (11,992) (4,450) (9,240)
Deferred tax assets/(liabilities) 73,637 38,808 (32,058) (34,697) 41,579 4,111
Set off of tax components (18,375) (19,917) 18,375 19,917 – –
Net deferred tax asset/(liability) 55,262 18,891 (13,683) (14,780) 41,579 4,111
The recognised deferred tax assets are dependent on future taxable profits in excess of profits arising from the
reversal of existing taxable temporary differences.
Movement in temporary differences during the year
(EUR x 1,000) 2011
Balance 01-01-11
Acquired in busi-
ness combina-
tions
Recog- nised in profit or
loss
Recog- nised in
other compre-hensive income
Balance 31-12-11
Property, plant and equipment 3,102 (1,576) 2,284 – 3,810
Intangible assets (7,829) – (3,471) – (11,300)
Other investments 1,114 (366) (624) – 124
Financial assets at fair value through profit or loss (6,253) – 6,253 – –
Loans and borrowings 186 548 (734) – –
Employee benefits 20,018 290 82 4,736 25,126
Provisions 1,829 892 (1,549) – 1,172
Tax loss carry-forward 1,040 14,571 11,337 – 26,948
Exchange differences 144 2 (2,374) 2,377 149
Other items (9,240) 2,074 2,555 161 (4,450)
4,111 16,435 13,759 7,274 41,579

139Fugro Financial statements 2011
(EUR x 1,000) 2010
Balance 01-01-10
Acquired in busi-
ness combina-
tions
Recog- nised in profit or
loss
Recog- nised in
other compre-hensive income
Balance 31-12-10
Property, plant and equipment 3,016 (350) 436 – 3,102
Intangible assets (6,982) – (847) – (7,829)
Other investments 5,132 (982) (3,036) – 1,114
Financial assets at fair value through profit or loss – – (6,253) – (6,253)
Loans and borrowings (1,650) – – 1,836 186
Employee benefits 20,006 – 551 (539) 20,018
Provisions 2,592 – (763) – 1,829
Tax loss carry-forward 701 – 339 – 1,040
Exchange differences 425 – (547) 266 144
Other items (4,687) (97) (4,456) – (9,240)
18,553 (1,429) (14,576) 1,563 4,111
5.40.2 Unrecognised deferred tax assets and liabilities
Deferred tax has not been recognised in respect of the following items:
Unrecognised deferred tax assets
(EUR x 1,000) 2011 2010
Deductible temporary differences 318 3,073
Tax losses 19,586 21,352
Capital allowances 3,084 3,199
Total 22,988 27,624
Unrecognised deferred tax assets relate to tax units previously suffering losses for which it is currently not
probable that future taxable profit will be available to offset these losses, taking into account fiscal restrictions
on the utilisation of loss compensation.

140
Unrecognised tax assets changed over the period as follows:
Unrecognised deferred tax assets
(EUR x 1,000) 2011 2010
As of 1 January 27,624 21,711
Movements during the period:
Additional losses 2,162 4,789
Utilisation (3,327) (822)
Recognition of previously unrecognised tax losses (5,462) (495)
Effect of change in tax rates (599) (105)
Exchange rate differences (45) 1,583
Change from reassessment (728) 963
Resulting from acquisitions 3,363 –
As of 31 December 22,988 27,624
Reassessment of tax compensation opportunities under applicable tax regulations has resulted in a decrease of
unrecognised deferred tax assets of EUR 0.7 million (2010: EUR 1.0 million increase).
Of the total recognised and unrecognised deferred tax assets in respect of tax losses carried forward an amount
of EUR 3,326 thousand expires in periods varying from two to five years. An amount of EUR 2,216 thousand
expires between five and ten years and an amount of EUR 40,992 thousand can be offset indefinitely.
The deductible temporary differences and capital allowances do not expire under current tax legislation.
Deferred tax assets have not been recognised in respect of these items, because it is not probable that future
taxable profit will be available against which the Group can utilise these benefits.
Based on forecasted results per tax jurisdiction, management considered it probable that sufficient future
taxable profit will be generated to utilise deferred tax assets depending on taxable profits in excess of the
profits arising from the reversal of existing temporary differences.
Unrecognised deferred tax liabilities
At 31 December 2011 no deferred tax liabilities relating to investments in subsidiaries have been recognised
(2010: nil), because Fugro controls whether the liability will be incurred and it is satisfied that it will not
be incurred in the foreseeable future.
In some of the countries where the Group operates, local tax laws provide that gains on disposal of certain
assets are tax exempt, provided that the gains are not distributed. The company does not intend to distribute
such gains; therefore no tax liabilities are recognised in this respect.
5.41 I n ve n t o r i e s
(EUR x 1,000) 2011 2010
Seismic and geological data libraries 333,806 204,485
Other inventories 31,069 14,543
364,875 219,028

141Fugro Financial statements 2011
Seismic and geological data libraries
Seismic and geological data libraries are stated at the lower of cost and net realisable value. During 2011
EUR 78.9 million (2010: EUR 88.8 million) of seismic and geological data libraries were recorded in third
party costs.
Virtually no data acquired during or before 2009 is valued on the balance sheet. EUR 156 million of sales of
seismic multi client data was recognised in revenue.
Other inventories
During 2011 EUR 24,609 thousand (2010: EUR 19,340 thousand) of other inventories were recognised as an
expense and EUR 294 thousand (2010: EUR 504 thousand) was written down. The write down is included in
third party costs.
5.42 Tr a d e a n d o t h e r r e c e i va b l e s
(EUR x 1,000) 2011 2010
Unbilled revenue on completed projects 221,550 224,038
Trade receivables 494,058 444,097
Non-trade receivables 168,942 135,106
884,550 803,241
Unbilled revenue on completed projects includes aggregated costs and recognised profits, net of recognised
losses for all contracts in progress for which this amount exceeds progress billings.
At 31 December 2011 trade receivables include retentions of EUR 8.6 million (2010: EUR 7.2 million) relating
to completed projects.
Trade receivables are shown net of impairment losses amounting to EUR 30.2 million (2010: EUR 47.3 million)
arising from identified doubtful receivables from customers. Trade receivables were impaired taking into
account the financial position of the debtors, the days outstanding and expected outcome of negotiations
and legal proceedings against debtors. Unbilled revenue on completed projects does not include impairment
losses (2010: nil). Non-trade receivables include among others pre-payments and VAT receivables.
Reference is made to note 5.51 and 5.53 for detailed information on the credit and currency risks,
and impairment losses related to trade receivables.
5.43 C a s h a n d c a s h e q u i va l e n t s
(EUR x 1,000) 2011 2010
Cash and cash equivalents 170,384 81,363
Bank overdraft (167,810) (300,301)
Cash and cash equivalents in the consolidated statement of cash f lows 2,574 (218,938)
At 31 December 2011 and 31 December 2010 all cash and cash equivalents are freely available to the Group.

142
5.44 To t a l e q u i t y
5.44.1 Share capital
(In thousands of shares) Ordinary shares
2011 2010
On issue and fully paid at 1 January 80,270 78,773
Stock dividend 2010 respectively 2009 1,123 1,497
Repurchased for option programme at year-end (2,163) (883)
On issue and fully paid at 31 December – entitled to dividend 79,230 79,387
On 31 December 2011 the authorised share capital amounts to EUR 16 million (2010: EUR 16 million) divided
into 96 million ordinary shares, each of EUR 0.05 nominal value (2010: 96 million) and 224 million various
types of preference shares, each of EUR 0.05 nominal value (2010: 224 million). On 31 December 2011
the issued share capital amounted to EUR 4,069,649.05. As of this date, 84.8% of the ordinary shares
(81,392,981 shares) were issued. No preference shares have been issued. In 2011 a total number of
1,123,297 certificates of shares were issued by the Fugro Trust Office (2010: 1,497,206). The holders of ordinary
shares are entitled to dividends as approved by the Annual General Meeting of Shareholders from time to time.
Furthermore they are entitled to one vote per share in Fugro’s shareholders meeting. The holders of
certificates of shares are entitled to the same dividend but they are not entitled to voting rights. Under certain
conditions the holder of certificates can exchange his certificates into ordinary shares and vice versa. For more
details reference is made to page 82.
The Board of Management proposes a dividend for 2011 of EUR 1.50 (2010: EUR 1.50) per (certificate of) share,
to be paid at the option of the holder in cash or in (certificates of) shares. This dividend proposal is currently
part of unappropriated result.
5.44.2 Share premium
The share premium can be considered as paid in capital.
5.44.3 Translation reserve
The Translation reserve comprises all foreign currency differences arising from the translation of the financial
statements of foreign operations, as well as from the translation of liabilities that hedge the Company’s net
investment in a foreign subsidiary.
5.44.4 Hedging reserve
The Hedging reserve comprises the effective portion of the cumulative net change in the fair value of cash f low
hedging instruments related to hedged transactions that have not yet occurred.
5.44.5 Reserve for own shares
Fugro purchases certificates of own shares to cover its option scheme. Fugro purchased 2,250,000 certificates
of shares during the year under review at an average price of EUR 48.92 (2010: 800,000 certificates at an
average price of EUR 44.70). 970,050 (certificates of) shares were sold at an average price of EUR 44.16 with
respect to exercise of options (2010: 1,135,980 at an average price of EUR 49.11). As per 31 December 2011
Fugro holds 2,162,746 own certificates of shares (2010: 882,796) with respect to the option scheme. This was
2.7% of the issued capital (2010: 1.1%).

143Fugro Financial statements 2011
5.44.6 Unappropriated result
After the reporting date the following dividends were proposed by the Board of Management. There are no
corporate income tax consequences related to this proposal.
(EUR x 1,000) 2011 2010
EUR 1.50 per qualifying (certificate of a) share (2010: EUR 1.50) 118,845 119,081
118,845 119,081
5.45 E a r n i n g s p e r s h a r e
The basic earnings per share for 2011 amount to EUR 3.63 (2010: EUR 3.47); the diluted earnings per share
amount to EUR 3.58 (2010: EUR 3.42).
The calculation of basic earnings per share at 31 December 2011 is based on the profit attributable to owners
of the Company of EUR 287,595 thousand (2010: EUR 272,219 thousand) and a weighted average number of
shares outstanding during the year ended 31 December 2011 of 79,195 thousand (2010: 78,357 thousand),
calculated as follows:
5.45.1 Basic earnings per share
Profit attributable to owners of the Company
(EUR x 1,000) 2011 2010
Profit for the period 295,270 280,153
Non-controlling interest (7,675) (7,934)
Profit attributable to owners of the Company 287,595 272,219
Weighted average number of ordinary shares
(In thousands of shares) 2011 2010
On issue and fully paid at 1 January 79,387 77,554
Effect of own shares held (1,213) (493)
Effect of shares issued due to exercised options 384 410
Effect of shares issued due to optional dividend 637 886
Weighted average number of ordinary shares at 31 December 79,195 78,357

144
5.45.2 Diluted earnings per share
The calculation of diluted earnings per share at 31 December 2011 was based on profit attributable to owners
of the Company of EUR 287,595 thousand (2010: EUR 272,219 thousand), and a weighted average number of
ordinary shares outstanding after adjustment for the effects of all dilutive potential ordinary shares of
80,260 thousand (2010: 79,554 thousand), calculated as follows:
Net profit attributable to owners of the Company (diluted)
(EUR x 1,000) 2011 2010
Profit attributable to owners of the Company 287,595 272,219
Profit attributable to owners of the Company (diluted) 287,595 272,219
Weighted average number of ordinary shares (diluted)
(In thousands of shares) 2011 2010
Weighted average number of ordinary shares at 31 December 79,195 78,357
Effect of share options on issue 1,065 1,197
Weighted average number of ordinary shares (diluted) at 31 December 80,260 79,554
5.46 L o a n s a n d b o r r ow i n g s
This note provides information about the contractual terms of the Group’s interest-bearing loans and
borrowings, which are measured at amortised cost. For more information about the Group’s exposure
to currency risk, interest rate risk, and liquidity risk, refer to note 5.52, 5.53 and 5.54.
Loans and borrowings
(EUR x 1,000) 2011 2010
Bank loans 450,687 491,820
Private Placement loans 2011 in USD 575,430 –
Private Placement loans 2011 in EUR 34,860 –
Private Placement loans 2011 in GBP 80,693 –
Private Placement loans 2002 in USD 92,091 89,634
Private Placement loans 2002 in EUR 20,000 20,000
Mortgage loans 5,082 5,808
Other loans and long-term borrowings 36,106 7,258
Subtotal 1,294,949 614,520
Less: current portion of loans and borrowings 79,776 23,658
1,215,173 590,862

145Fugro Financial statements 2011
Terms and debt repayment schedule
Terms and conditions of outstanding loans were as follows:
(EUR x 1,000) 2011 2010
Currency
Nominal interest
rateYear of
maturityFace value
Carrying value
Face value
Carrying value
Bank loans EUR
EURI BOR
+110 bps 2013-2016 454,000 450,687 500,000 491,820
Private Placement loans:
320 million USD bonds 2011 USD 4.05% 2018 246,400 245,526 – –
330 million USD bonds 2011 USD 4.78% 2021 254,100 253,184 – –
100 million USD bonds 2011 USD 4.88% 2023 77,000 76,720 – –
27.5 million GBP bonds 2011 GBP 4.06% 2018 33,000 32,876 – –
40 million GBP bonds 2011 GBP 4.82% 2021 48,000 47,817 – –
35 million EUR bonds 2011 EUR 4.81% 2021 35,000 34,860 – –
44 million USD bonds 2002 USD 6.85% 2012 33,880 33,777 33,000 32,878
39 million USD bonds 2002 USD 6.95% 2014 30,030 29,927 29,250 29,128
37 million USD bonds 2002 USD 7.10% 2017 28,490 28,387 27,750 27,628
20 million Eurobonds 2002 EUR 6.45% 2012 20,000 20,000 20,000 20,000
Mortgage and other loans
and long-term borrowings Variable 3.10% 2012-2013 41,188 41,188 13,066 13,066
1,301,088 1,294,949 623,066 614,520
The mortgage loans are secured over land and buildings with a carrying amount of EUR 5 million
(2010: EUR 6 million).
5.46.1 Bank loans
In November 2011 Fugro signed agreements with eight banks for committed multicurrency revolving facilities
with a maturity of five years. The total amount of these bilateral agreements with the banks is EUR 775
million. Rabobank and ING Bank N.V. provided EUR 150 million each, The Royal Bank of Scotland N.V.,
BNP Paribas S.A. and HSBC Bank Plc. provided each EUR 100 million, Barclays Bank Plc. provided
EUR 75 million, ABN AMRO Bank N.V. and Credit Suisse AG provided EUR 50 million each.
In 2008 agreement was reached with Rabobank for a revolving facility of EUR 100 million, maturing in 2013.
The Rabobank facility is repaid in quarterly instalments of EUR 5 million.
In November 2011, Fugro repaid the bank loans relating to revolving credit facilities, with a maturing date in
April 2012, with the Royal Bank of Scotland N.V. (EUR 100 million), Rabobank (EUR 100 million), ABN AMRO
Bank N.V. (EUR 100 million), ING Groep N.V. (EUR 75 million) and BNP Paribas S.A. (EUR 50 million), totalling
EUR 425 million.
The interest of the bank loans under the new multicurrency revolving facilities is LIBOR, or in relation to any
EUR loan EURIBOR, plus a margin based on Debt/ EBITDA margin at each completed half year. The average
interest rate of the facilities is currently EURIBOR plus 110 base points. At 31 December 2011 a total amount
of EUR 424 million of the new facilities was in use (55%), the loans were all drawn in euro.

146
5.46.2 Private Placement loans
In August 2011 long-term loans were concluded with twenty-five American and two British institutional
investors for a total amount equivalent to USD 909 million, with maturities of 7, 10 and 12 years and fixed
interest rates.
In May 2002 long-term loans were concluded with twenty American and two British institutional investors.
As per 8 May 2007 the Group terminated a Cross Currency Swap (foreign exchange contract related to the
US Dollar exposure of the loans). The cumulative exchange differences as per termination date have been
added to equity (Hedging reserve) and are being charged to profit or loss during the remaining term of the
loan. This resulted during 2011 in a cost of EUR 1,388 thousand (2010: EUR 1,388 thousand).
At reporting date all the Private Placement loans are valued at the closing rate. The currency exchange
difference on the loans between the initial exchange rate and the exchange rate at the reporting date is
accounted for in the Translation reserve. For the year under review the currency exchange differences on
loans in US dollars amount to EUR 58,950 thousand negative (2010: EUR 7,200 thousand negative).
5.46.3 Covenant requirements
Both the newly committed multicurrency revolving facilities as well as the Private Placement loans contain
covenant requirements which can be summarised as follows:
– Equity > EUR 200 million (only applicable to Private Placement loans 2002)
– Consolidated EBITDA plus Operating Lease Expense/Consolidated Interest Expense plus Operating Lease
Expense > 2.5
– Consolidated Net Financial Indebtedness/Consolidated EBITDA < 3.0
– Solvency: Consolidated Net Worth/Balance sheet total > 1.0:3.0
– Consolidated Financial Indebtedness of the Subsidiaries < 15%, for the Private Placement loans and < 20%
for the bank loans, of the consolidated balance sheet total
– Fugro declared dividend < 60% of the profits of the Group for such financial year (only applicable to Private
Placement loans 2011). As can be concluded from the table below, at the twelve month rolling forward
measurement dates in 2011 and 2010, the Company complied with the above conditions.
(EUR x 1,000) 2011 2010
EBITDA 580,988 561,083
(5.28) Operating lease expense 141,781 99,566
(5.32) Net interest expense 32,963 12,107
Margin > 2.5 4.1 5.9
(2) Net financial indebtedness (loans and borrowings less net cash) 1,292,375 833,458
Bank guarantees 37,278 23,744
Total 1,329,653 857,202
EBITDA coverage < 3.0 2.29 1.53
(2) Net worth 1,655,785 1,508,318
(2) Balance sheet total 3,861,595 3,089,991
Solvency > 33.33% 42.9% 48.8%
Margin Indebtedness subsidiaries < 15% 2.4% 4.4%
Dividend < 60% of the profit 41.3% 43.7%
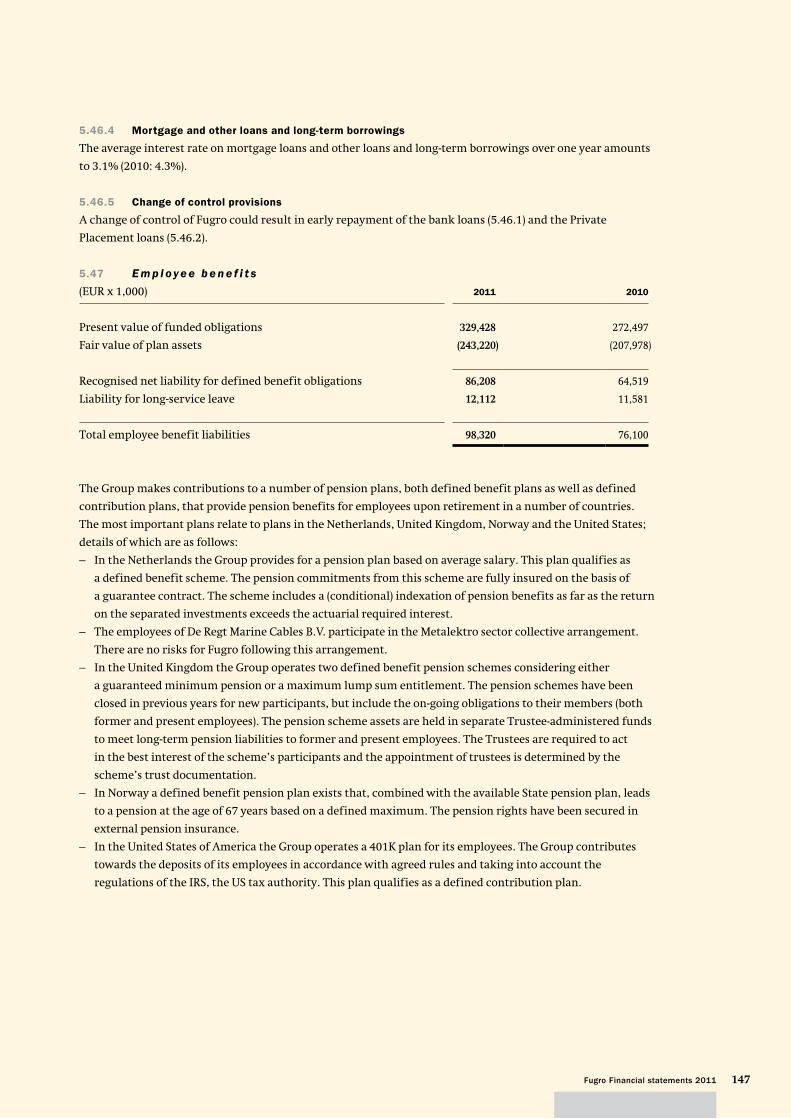
147Fugro Financial statements 2011
5.46.4 Mortgage and other loans and long-term borrowings
The average interest rate on mortgage loans and other loans and long-term borrowings over one year amounts
to 3.1% (2010: 4.3%).
5.46.5 Change of control provisions
A change of control of Fugro could result in early repayment of the bank loans (5.46.1) and the Private
Placement loans (5.46.2).
5.47 E m p l oy e e b e n e f i t s
(EUR x 1,000) 2011 2010
Present value of funded obligations 329,428 272,497
Fair value of plan assets (243,220) (207,978)
Recognised net liability for defined benefit obligations 86,208 64,519
Liability for long-service leave 12,112 11,581
Total employee benefit liabilities 98,320 76,100
The Group makes contributions to a number of pension plans, both defined benefit plans as well as defined
contribution plans, that provide pension benefits for employees upon retirement in a number of countries.
The most important plans relate to plans in the Netherlands, United Kingdom, Norway and the United States;
details of which are as follows:
– In the Netherlands the Group provides for a pension plan based on average salary. This plan qualifies as
a defined benefit scheme. The pension commitments from this scheme are fully insured on the basis of
a guarantee contract. The scheme includes a (conditional) indexation of pension benefits as far as the return
on the separated investments exceeds the actuarial required interest.
– The employees of De Regt Marine Cables B.V. participate in the Metalektro sector collective arrangement.
There are no risks for Fugro following this arrangement.
– In the United Kingdom the Group operates two defined benefit pension schemes considering either
a guaranteed minimum pension or a maximum lump sum entitlement. The pension schemes have been
closed in previous years for new participants, but include the on-going obligations to their members (both
former and present employees). The pension scheme assets are held in separate Trustee-administered funds
to meet long-term pension liabilities to former and present employees. The Trustees are required to act
in the best interest of the scheme’s participants and the appointment of trustees is determined by the
scheme’s trust documentation.
– In Norway a defined benefit pension plan exists that, combined with the available State pension plan, leads
to a pension at the age of 67 years based on a defined maximum. The pension rights have been secured in
external pension insurance.
– In the United States of America the Group operates a 401K plan for its employees. The Group contributes
towards the deposits of its employees in accordance with agreed rules and taking into account the
regulations of the IRS, the US tax authority. This plan qualifies as a defined contribution plan.

148
Liability for defined benefit obligations
Plan assets consist of the following:
(EUR x 1,000) 2011 2010
Equity securities 78,491 69,063
Government bonds 136,234 99,759
Corporate bonds 18,271 16,269
Real estate 3,582 14,578
Cash 6,642 8,309
243,220 207,978
Movements in the present value of the funded defined benefit obligations
(EUR x 1,000) 2011 2010
Defined benefit obligations at 1 January 272,497 244,362
Acquisitions 1,918 –
Benefits paid by the plan (4,499) (4,268)
Contributions paid by plan participants 2,069 2,198
Current service costs and interest (see below) 21,906 19,717
Actuarial gains and losses recognised in other comprehensive income
(see below) 30,495 5,792
Effect of movement in exchange rates 5,042 4,696
Defined benefit obligations at 31 December 329,428 272,497
Movement in the fair value of plan assets
(EUR x 1,000) 2011 2010
Fair value of plan assets at 1 January 207,978 179,643
Acquisitions 1,229 –
Contributions paid by the employer 10,306 9,717
Contributions paid by plan participants 2,069 2,198
Benefits paid by the plan (4,499) (4,268)
Expected return on plan assets 11,715 10,739
Actuarial gains and losses recognised in other comprehensive income
(see below) 10,840 7,066
Effect of movement in exchange rates 3,582 2,883
Fair value of plan assets at 31 December 243,220 207,978

149Fugro Financial statements 2011
Expenses recognised in profit or loss
(EUR x 1,000) 2011 2010
Current service costs 7,540 6,201
Interest on obligation 14,366 13,516
21,906 19,717
Expected return on plan assets (11,715) (10,739)
10,191 8,978
The expenses are recognised in the following line items in the statement of comprehensive income:
(EUR x 1,000) 2011 2010
Personnel expenses 10,191 8,978
Actual return on plan assets
(EUR x 1,000) 2011 2010
Actual return on plan assets 22,555 17,805
Actuarial gains and losses recognised directly in other comprehensive income
(EUR x 1,000) 2011 2010
Cumulative amount at 1 January (32,909) (33,914)
Recognised during the year (19,655) 1,274
Effect of movement in exchange rates (556) (269)
Cumulative amount at 31 December (53,120) (32,909)
Actuarial assumptions
Principal actuarial assumptions at the reporting date (expressed as a range of weighted averages):
2011 2010
Discount rate at 31 December 2.6 – 4.75% 4.0 – 5.4%
Expected return on plan assets 4.1 – 6.3% 5.0 – 6.9%
Future salary increases 2.0 – 2.25% 2.0 – 4.0%
Medical cost trend rate n/a n/a
Future pension increases 2.0 – 3.25% 2.0 – 3.75%
The financial effects of differences between the actuarial assumptions and actuals for the pension liability
and plan assets are included in the actuarial gains and losses.

150
Assumptions regarding future mortality are based on published statistics and mortality tables:
Netherlands: Generation table 2010-2060 For men and women, an age correction of (– 1: – 1) is applied.
United Kingdom: PxA (00) rated + 2, by year of birth with long coherent improvements.
Norway: K2005
The calculation of the defined benefit obligation is sensitive to the mortality assumptions. As the actuarial
estimates of mortality continue to be refined, an increase of one year in the lives is considered reasonably
possible in the next financial year. The effect of this change would be an increase in the employee benefit
liability by EUR 9.7 million.
The overall expected long-term rate of return on assets is 5.4%. The expected long-term rate of return is based
on the portfolio as a whole and not on the sum of the returns on individual asset categories. The return is based
exclusively on historical returns, without adjustments.
Historical information
(EUR x 1,000) 2011 2010 2009 2008 2007
Present value of the defined obligation 329,428 272,497 244,362 190,269 209,738
Fair value of plan assets 243,220 207,978 179,643 143,757 185,917
Deficit in the plan (86,208) (64,519) (64,719) (46,512) (23,821)
Experience adjustments arising on plan liabilities 10,910 1,418 1,269 (1,982) (14,204)
Experience adjustments arising on plan assets 10,840 7,066 14,603 (35,150) (4,358)
The estimated planned contributions 2012 amount to EUR 10.5 million (estimate 2011: EUR 10.0 million).
5.48 P r o v i s i o n s
(EUR x 1,000) 2011 2010
Restruc-
turingProce- dures Total
Restruc-turing
Proce- dures Total
Balance at 1 January – 5,204 5,204 36 6,204 6,240
Provisions made during the year – 765 765 – – –
Provisions used during the year – – – (36) – (36)
Provisions reversed during the year – (1,837) (1,837) – (1,045) (1,045)
Unwinding of discount – 83 83 – 45 45
Balance at 31 December – 4,215 4,215 – 5,204 5,204
Non-current – 4,215 4,215 – 5,204 5,204

151Fugro Financial statements 2011
Procedures
The Group is involved in several legal proceedings in various jurisdictions (including the USA) as a result of its
normal business activities, either as plaintiff or as defendant. The Board of Management ensures that these
cases are vigorously defended. Fugro has set up adequate provisions for those claims where management
believes it is probable that a liability has been incurred and the amount is reasonably estimable. These
provisions are reviewed periodically and adjusted if necessary. Considering the expected duration of the (legal)
proceedings, management does not expect the legal actions, for which a provision has been set-up, to be
completed within the next year. The expected outflows of economic benefits have been discounted at a rate of
4.5%, and are based on management’s best estimate. Final settlements can differ from this estimate, and could
require revisions to the estimated provisions. In 2011, Fugro settled a number of claims without incurring
costs. Consequently part of the provision for procedures has been reversed.
5.49 Tr a d e a n d o t h e r p a ya b l e s
(EUR x 1,000) 2011 2010
Trade payables 155,485 147,709
Advance instalments to work in progress 43,726 49,285
Fair value derivatives 438 –
Non-trade payables 313,043 277,214
Balance at 31 December 512,692 474,208
Non-trade payables include accrued expenses of invoices to be received, employee related accruals, interest
payable and considerations payable regarding acquisitions.
5.50 F i n a n c i a l r i s k m a n a ge m e n t
5.50.1 Overview
The Company’s risk management policy includes the long-term sustainable management of its business
activities and where possible, the mitigation of the associated business risks. Based on the nature and relative
significance of the risks related to the Group’s wide diversity of markets, clients and regions and its broad
portfolio of activities the risks have been quantified to the extent possible.
The Group has exposure to the following risks from its use of financial instruments:
– credit risk
– liquidity risk
– market risk
This note presents information about the Group’s exposure to each of the above risks, the Group’s objectives,
policies and processes for measuring and managing risk, and the Group’s management of capital.
The Board of Management has overall responsibility for the establishment and oversight of the Group’s risk
management framework.
The Group’s risk management policies are established to identify and analyse the risks faced by the Group,
to set appropriate risk limits and controls, and to monitor risks and adherence to limits. Risk management
policies and systems are reviewed regularly to reflect changes in market conditions and the Group’s activities.
The Group, through its training and management standards and procedures, aims to develop a disciplined and
constructive control environment in which all employees understand their role and obligations.
152
The Audit Committee oversees how management monitors compliance with the Group’s risk management
policies and procedures and reviews the adequacy of the risk management framework in relation to the risks
faced by the Group. The Audit Committee is assisted in its oversight role by internal audit. Both regular and ad
hoc reviews of risk management controls and procedures are performed, the results of which are reported
directly to the Board of Management and Executive Committee. A summary of important observations is
reported to the Audit Committee.
5.50.2 Credit risk
Credit risk is the risk of financial loss to the Group if a customer or counterparty to a financial instrument fails
to meet its contractual obligations, and arises principally from the Group’s receivables from customers.
Trade and other receivables
The Group’s exposure to credit risk is influenced mainly by the individual characteristics of each client.
However, management also considers the composition of the Group’s client base, including the default risk of
the industry and country in which clients operate, as these factors may have an influence on credit risk. As the
Group operates to a large extent in the oil and gas industry a significant portion of trade and other receivables
relates to clients from this industry.
Some of the Group’s orders are awarded on the basis of long-term preferred supplier agreements. In the course
of a year Fugro often carries out multiple projects for the same client. The projects carried out for any single
client do not, however, account for more than 4% on an annual basis of the total revenue. Having a large
number of clients and short project time spans mitigates Fugro’s credit risk as the individual amounts
receivable with the same client are limited.
New customers are analysed individually for creditworthiness before payment and delivery terms and
conditions are offered. The Group’s review may include external ratings, where available, and in some cases
bank references. Customers that fail to meet the Group’s benchmark creditworthiness may transact with the
Group only on a prepayment basis or have to provide a bank guarantee.
The majority of the Group’s clients has done business with the Group for many years and significant losses
have only occurred incidentally in prior years. However, as a result of the expected negative effects of the
current worldwide economic crisis the credit risk has increased significantly. Clients that are known to have
negative credit characteristics are individually monitored by the group controllers. Findings are reported
on a bi-weekly basis to the Board of Management. If clients fail to pay timely the Group re-assesses the
creditworthiness and stronger debt collection is started if deemed necessary. The Group publishes an internal
list of clients that need extra attention before a contract is closed.
The Board of Management reviews frequently the outstanding trade receivables. Local management is
requested to take additional precaution in working with affected clients.
The Group establishes an allowance for impairment that represents its estimate of incurred losses in respect of
trade and other receivables. The main components of this allowance are a specific loss component that relates
to individually significant exposures, and a collective loss component established for groups of similar assets
in respect of losses that have been incurred but not yet identified. The collective loss allowance is determined
based on historical data of payment statistics for similar financial assets.
The Group held cash and cash equivalents of EUR 170.4 million at 31 December 2011 (2010: EUR 81.4 million),
which represents its maximum credit exposure on these assets. The cash and cash equivalents are held with
bank and financial institution counterparties, which have ‘investment grade’ credit ratings.

153Fugro Financial statements 2011
Guarantees
In principle Fugro does not provide parent company guarantees to its subsidiaries, unless significant
commercial reasons exist. Fugro has filed declarations of joint and several liability for a number of subsidiaries
at the Chambers of Commerce. Fugro has filed a list with the Chamber of Commerce which includes all
financial interests of Fugro as well as a reference to each subsidiary for which such a declaration of liability has
been deposited. At 31 December 2011 and at 31 December 2010 no significant guarantees were outstanding.
5.50.3 Liquidity risk
Liquidity risk is the risk that the Group will encounter difficulty in meeting the obligations associated with
its financial liabilities that are settled by delivering cash or another financial asset. The Group’s approach to
managing liquidity is to ensure, as far as possible, that it will always have sufficient liquidity to meet its
liabilities when due, under both normal and stressed conditions, without incurring unacceptable losses or
risking damage to the Group’s reputation.
The Group monitors cash f low on a regular basis. Consolidated cash f low information including a six months
projection is reported on a monthly basis to the Executive Committee, ensuring that the Group has sufficient
cash on demand (or available lines of credit) to meet expected operational expenditures for the next half-year,
including the servicing of financial obligations from lease commitments not included in the statement of
financial position and investment programs in vessels. Cash f lows exclude the potential impact of extreme
circumstances that cannot reasonably be predicted, such as natural disasters. The Group maintains the
following lines of credit:
– A total amount of bilateral revolving facility agreements with eight banks totalling EUR 775 million.
Rabobank and ING Bank N.V. provided EUR 150 million each, The Royal Bank of Scotland N.V., BNP Paribas
S.A. and HSBC Bank Plc. provided each EUR 100 million, Barclays Bank Plc. provided EUR 75 million,
ABN AMRO Bank N.V. and Credit Suisse provided EUR 50 million each. At 31 December 2011 an amount
of EUR 424 million was drawn (55%).
– Revolving line of credit with Rabobank of EUR 100 million, maturing in May 2013. The Rabobank facility is
fully drawn at 31 December 2011. The facility is being repaid in equal quarterly instalments. The balance at
31 December 2011 is EUR 30 million.
– A variety of unsecured overdraft facilities in various currencies totalling around EUR 580 million of which
EUR 122 million has been drawn at 31 December 2011 (2010: around EUR 525 million with EUR 270 million
drawn).
– US Private Placement loans totalling EUR 806 million. The facility needs to be repaid, in fixed instalments
denominated in the several currencies, as follows: In 2012 EUR 53 million, in 2014 EUR 30 million, in 2017
EUR 29 million, in 2018 EUR 280 million, in 2021 EUR 337 million and in 2023 EUR 77 million.
5.50.4 Market risk
Market risk includes changes in market prices, such as foreign exchange rates, interest rates and equity prices
will affect the Group’s income or the value of its holdings of financial instruments. The objective of market
risk management is to manage and control market risk exposures within acceptable parameters, while
optimising the return.
Currency risk
The global nature of the business of the Group exposes the operations and reported financial results and cash
f lows to the risks arising from fluctuations in exchange rates. The Group’s business is exposed to currency risk
whenever it has revenues in a currency that is different from the currency in which it incurs the costs of
generating those revenues. In the case that the revenues can be offset against the costs incurred in the same
currency, the balance may be affected if the value of the currency in which the revenues and costs are
generated varies relative to the Euro. This risk exposure primarily affects those operations of the Group that
generate a portion of their revenue in foreign currencies and incur their costs primarily in Euros.

154
Cash inflows and outflows of the operating segments are offset if they are denominated in the same currency.
This means that revenue generated in a particular currency balance out costs in the same currency, even if the
revenues arise from a different transaction than that in which the costs are incurred. As a result, only the
unmatched amounts are subject to currency risk.
To mitigate the impact of currency exchange rate f luctuations, the Group continually assesses the exposure to
currency risks and if deemed necessary a portion of those risks is hedged by using derivative financial
instruments. The principal derivative financial instruments used to cover foreign currency exposure are
forward foreign currency exchange contracts. Given the current investment program in vessels and the fact
that the majority of the investments are denominated in US dollar, the Group is currently not using derivative
financial instruments as positive cash f low in US dollar from operations is offset to a large extent by these
investments.
Interest on borrowings is denominated in the currency of the borrowing. Generally, borrowings are
denominated in currencies that match the cash f lows generated by the underlying operations of the Group,
primarily Euro and US dollar. This provides an economic hedge without derivatives being entered into and
therefore hedge accounting is not applied in these circumstances.
The Group’s investment in its subsidiaries with US dollar as functional currency is partly hedged by means
of the US dollar Private Placement loans, which mitigates the currency risk arising from the subsidiary’s net
assets. The Group’s investment in its subsidiaries in the United Kingdom is partly hedged by means of the
GB pound Private Placement loans. The Group’s investments in other subsidiaries are not hedged.
The hedge on the investment is fully effective. Consequently all exchange differences relating to this hedge
have been accounted for in other comprehensive income. The Group is sensitive to translation differences
resulting from translation of its operations in non-Euro currencies to Euros.
Interest rate risk
The Group’s liabilities bear both fixed and variable interests. The Group’s objective is to limit the effect
of interest rate changes on the results by matching long term investment with long term (fixed interest)
financing as much as possible. The Group continuously considers interest rate swaps to limit significant
(short term) interest exposures.
5.50.5 Capital Management
The Board of Management’s policy is to maintain a strong capital base in order to maintain investor, creditor
and market confidence and to sustain future development of the business. Capital consists of share capital,
retained earnings and non-controlling interests of the Group. The Board of Management monitors the
geographic spread of shareholders, the return on capital as well as the level of dividends to ordinary share
holders. The Board strives:
– for a dividend pay-out ratio of 35 to 55% of the net result.
– to maintain a healthy financial position with a targeted solvency of > 33.33%.
– to maintain a balance between the higher returns that might be possible with higher levels of borrowings
and the advantages and security afforded by a sound capital position.
The Group’s objective is to achieve a healthy return on shareholders’ equity. The return in 2011 was 18.2%
(2010: 20.2%). In comparison the weighted average interest expense on interest-bearing borrowings was 4.1%
(2010: 4.0%).
From time to time Fugro purchases its own certificates of shares. These certificates are used to cover the
options granted by Fugro. Purchase and sale decisions are made on a specific transaction basis by the Board
of Management. Fugro does not have a defined share buy-back plan.

155Fugro Financial statements 2011
There were no changes to the Group’s approach to capital management during the year.
The Group is subject to the externally imposed capital requirements related to covenant requirements as set
out in note 5.46.3. As per 31 December 2011 and 31 December 2010 the Group complied with all imposed
external capital requirements
5.51 C r e d i t r i s k
Exposure to credit risk
(EUR x 1,000) Carrying amount
2011 2010
Other investments in equity instruments 1,095 1,095
Available-for-sale financial assets 1,021 2,812
Long-term loans 5,246 31,623
Financial assets at fair value through profit or loss 47,658 25,636
Other long-term receivables 4,227 1,367
Unbilled revenue on completed projects 221,550 224,038
Trade receivables 494,058 444,097
Non-trade receivables 168,942 135,106
Cash and cash equivalents 170,384 81,363
1,114,181 947,137
The maximum exposure to credit risk at the reporting date is the carrying amount of each class of financial
assets mentioned above. The Group holds no collateral as security on the long-term loans.
The maximum exposure for trade receivables and unbilled revenue on completed contracts at the reporting
date by geographic region was:
(EUR x 1,000) Carrying amount
2011 2010
Netherlands 45,201 43,047
Europe other 275,977 267,517
Africa 43,810 21,905
Middle East 56,904 74,414
Asia 115,198 69,641
Australia 60,585 68,424
Americas 117,933 120,504
715,608 665,452

156
The maximum exposure to credit risk for trade receivables and unbilled revenue on completed contracts at the
reporting date by type of customer was:
(EUR x 1,000) Carrying amount
2011 2010
Oil and gas 537,780 503,941
Infrastructure 131,083 118,915
Mining 23,627 18,886
Other 23,118 23,710
715,608 665,452
Impairment losses
The ageing of trade receivables and unbilled revenue on completed contracts at the reporting date was:
– As of 31 December 2011, trade receivables and unbilled revenue on completed projects of
EUR 715,608 thousand (2010: EUR 665,452 thousand) were fully performing.
– As of 31 December 2011, trade receivables of EUR 202,288 thousand (2010: EUR 152,562 thousand)
were past due but not impaired. These relate to a number of independent customers for whom there
is no recent history of default. The average credit term for these trade receivables is 30 days.
– As of 31 December 2011, trade receivables and unbilled revenue on completed projects of
EUR 30,151 thousand (2010: EUR 47,314 thousand) were impaired and provided for.
The individually impaired receivables mainly relate to customers, which are in unexpectedly difficult
economic situations. It was assessed that a portion of the receivables is expected to be recovered. The ageing of
trade receivables and unbilled revenue on completed projects is as follows:
(EUR x 1,000) 2011 2010
GrossImpair-
ment GrossImpair-
ment
From 0 to 30 days 513,320 – 512,890 –
From 31 to 60 days 89,850 – 80,620 –
From 61 to 90 days 44,583 6,074 34,303 9,490
Over 90 days 88,458 22,396 76,294 35,198
Retentions and special items 9,548 1,681 8,659 2,626
745,759 30,151 712,766 47,314

157Fugro Financial statements 2011
The movement in the allowance for impairment in respect of trade receivables and unbilled revenue
on completed contracts during the year was as follows:
(EUR x 1,000) 2011 2010
Balance at 1 January 47,314 46,921
Impairment loss recognised 909 5,513
Impairment loss reversed (15,783) (3,657)
Trade receivables written off (2,640) (2,525)
Acquired through business combinations 132 –
Effect of movement in exchange rates 219 1,062
Balance at 31 December 30,151 47,314
The allowance accounts in respect of trade receivables and unbilled revenue on completed contracts are used
to record impairment losses unless the Group is satisfied that no recovery of the amount owing is possible;
at that point the amount considered irrecoverable is written off directly against the allowance.
In 2011 a strong emphasis was put on monitoring of receivables. This high focus resulted in collection of
significant number of old receivables and a reversal of the allowance for impairment by EUR 15.8 million.
No impairments related to other financial assets than trade receivables and unbilled revenue on completed
contracts are recognised. In general, the Group considers credit risk on other receivables and cash and cash
equivalents to be limited. Cash and cash equivalents are held with large well known banks with adequate
credit ratings only. Refer to 5.50.2.

158
5.52 L i q u i d i t y r i s k
The following are the contractual maturities of financial liabilities, including interest payments:
(EUR x 1,000) 2011
Carrying amount
Contrac-tual cash
flows6 months
or less6 – 12
months1 – 2 years
2 – 5 years
More than 5 years
Bank loans 450,687 468,214 14,507 14,407 18,613 420,687 –
Private Placement loans:
320 million USD bonds 245,526 315,381 4,990 4,990 9,979 29,938 265,484
330 million USD bonds 253,184 374,644 6,073 6,073 12,146 36,438 313,914
100 million USD bonds 76,720 121,812 1,879 1,879 3,758 11,273 103,023
27.5 million GBP bonds 32,876 42,255 670 670 1,340 4,019 35,556
40 million GBP bonds 47,817 70,954 1,157 1,157 2,314 6,941 59,385
35 million EUR bonds 34,860 51,697 842 842 1,684 5,051 43,278
44 million USD bonds 33,777 33,777 33,777 – – – –
39 million USD bonds 29,927 34,087 1,040 1,040 2,080 29,927 –
37 million USD bonds 28,387 38,467 1,008 1,008 2,016 2,016 32,419
20 million Eurobonds 20,000 20,323 20,323 – – – –
Mortgage and other loans
and long-term borrowings 41,188 42,279 1,555 5,720 35,004 – –
Trade and other payables 512,692 512,692 512,692 – – – –
Bank overdraft 167,810 167,810 167,810 – – – –
1,975,451 2,294,392 768,323 37,786 88,934 546,290 853,059
The interest included in the above table is based on the current amounts borrowed with current interest rates
against the current exchange rate (if applicable). No assumptions are included for possible future changes in
borrowings or interest payments.
It is not expected that the cash f lows included in the maturity analysis could occur significantly earlier, or at
significantly different amounts.

159Fugro Financial statements 2011
(EUR x 1,000) 2010*
Carrying amount
Contrac-tual cash
flows6 months
or less6 – 12
months1 – 2 years
2 – 5 years
More than 5 years
Bank loans 491,820 510,100 15,000 14,900 470,000 10,200 –
Private Placement loans:
44 million USD bonds 32,878 36,390 1,130 1,130 34,130 – –
39 million USD bonds 29,128 37,378 1,016 1,016 2,032 33,314 –
37 million USD bonds 27,628 41,540 985 985 1,970 5,910 31,690
20 million Eurobonds 20,000 21,935 645 645 20,645 – –
Mortgage and other loans
and long-term borrowings 13,066 13,634 284 3,942 9,408 – –
Trade and other payables 474,208 474,208 474,208 – – – –
Bank overdraft 300,301 300,301 300,301 – – – –
1,389,029 1,435,486 793,569 22,618 538,185 49,424 31,690
* Restated for comparison purposes.
5.53 C u r r e n c y r i s k
The following significant exchange rates applied during the year:
(In EUR)Average
rate
Reporting date mid-spot rate
USD 0.71 0.77
GBP 1.15 1.20
NOK 0.129 0.129
Sensitivity analysis
A 10 percent strengthening of the Euro against the above currencies at 31 December would have increased
(decreased) equity and profit or loss by the amounts shown below. This analysis is based on foreign currency
exchange rate variances that the Group considered to be reasonably possible at the reporting date. This
analysis assumes that all other variables, in particular interest rates, remain constant and ignores any impact
of forecasted sales and purchases. The analysis is performed on the same basis as for 2010.
Effect in EUR thousands EquityProfit or
(loss)
31 December 2011
USD (34,077) (1,974)
GBP (11,395) (3,514)
NOK (15,729) (5,191)
31 December 2010
USD (42,368) (5,066)
GBP (16,399) (1,467)
NOK (14,799) (5,385)
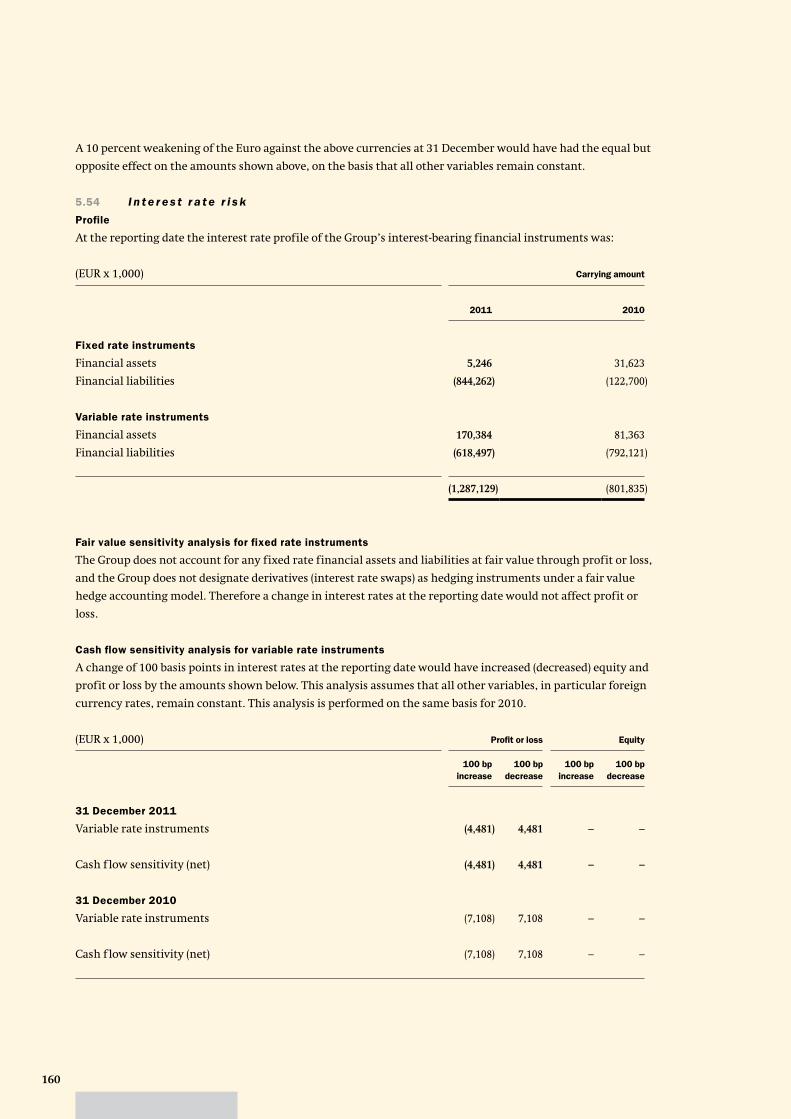
160
A 10 percent weakening of the Euro against the above currencies at 31 December would have had the equal but
opposite effect on the amounts shown above, on the basis that all other variables remain constant.
5.54 I n t e r e s t r a t e r i s k
Profile
At the reporting date the interest rate profile of the Group’s interest-bearing financial instruments was:
(EUR x 1,000) Carrying amount
2011 2010
Fixed rate instruments
Financial assets 5,246 31,623
Financial liabilities (844,262) (122,700)
Variable rate instruments
Financial assets 170,384 81,363
Financial liabilities (618,497) (792,121)
(1,287,129) (801,835)
Fair value sensitivity analysis for fixed rate instruments
The Group does not account for any fixed rate financial assets and liabilities at fair value through profit or loss,
and the Group does not designate derivatives (interest rate swaps) as hedging instruments under a fair value
hedge accounting model. Therefore a change in interest rates at the reporting date would not affect profit or
loss.
Cash flow sensitivity analysis for variable rate instruments
A change of 100 basis points in interest rates at the reporting date would have increased (decreased) equity and
profit or loss by the amounts shown below. This analysis assumes that all other variables, in particular foreign
currency rates, remain constant. This analysis is performed on the same basis for 2010.
(EUR x 1,000) Profit or loss Equity
100 bp
increase100 bp
decrease100 bp
increase100 bp
decrease
31 December 2011
Variable rate instruments (4,481) 4,481 – –
Cash f low sensitivity (net) (4,481) 4,481 – –
31 December 2010
Variable rate instruments (7,108) 7,108 – –
Cash f low sensitivity (net) (7,108) 7,108 – –

161Fugro Financial statements 2011
At 31 December 2011 it is estimated that a general increase of 100 basis points in interest rates would
decrease the Group’s profit before income tax by approximately EUR 4.5 million (2010: negative impact
of EUR 7.1 million).
5.55 Fa i r va l u e s
The fair values of financial assets and liabilities, together with the carrying amounts shown in the statement
of financial position, are as follows:
(EUR x 1,000) 2011 2010
Carrying amount Fair value
Carrying amount Fair value
Financial assets at fair value through profit or loss
Financial assets at fair value through profit or loss 47,658 47,658 25,636 25,636
Loans and receivables
Trade receivables, unbilled revenue on completed projects 884,550 884,550 803,241 803,241
Cash and cash equivalents 170,384 170,384 81,363 81,363
Long-term loans 5,246 5,246 31,623 31,623
Other long-term receivables 4,227 4,227 1,367 1,367
Available-for-sale financial assets
Other investments in equity instruments* 1,095 1,095 1,095 1,095
Available-for-sale financial assets 1,021 1,021 2,812 2,812
Financial liabilities measured at amortised cost
Bank loans (450,687) (450,687) (491,820) (491,820)
Mortgage and other loans and long-term borrowings (41,188) (41,188) (13,066) (13,066)
Private Placement loans in USD (667,521) (718,452) (89,634) (89,514)
Private Placement loans in GBP (80,693) (86,811) – –
Private Placement loans in EUR (54,860) (58,954) (20,000) (19,874)
Bank overdraft (167,810) (167,810) (300,301) (300,301)
Trade and other payables (512,692) (512,692) (474,208) (474,208)
Total (861,270) (922,413) (441,892) (441,646)
Unrecognised gains/(losses) (61,143) 246
* The other investments in equity instruments do not have a quoted market price in an active market. The fair value cannot be reliably
measured by the Group.
Interest rates used for determining fair value
The Group uses the government yield curve as per the reporting date plus an adequate constant credit spread
to discount financial instruments. The interest rates used are as follows:
Derivatives 2011 2010
Loans and borrowings 2.0 – 7.1% 2.0 – 7.1%
Leases n/a n/a
Receivables n/a n/a

162
Fair value hierarchy
The table below analyses financial instruments carried at fair value, by valuation method. The different levels
have been defined as follows:
– Level 1: quoted prices (unadjusted) in active markets for identical assets or liabilities.
– Level 2: inputs other than quoted prices included within Level 1 that are observable for the asset or liability,
either directly (i.e. as prices) or indirectly (i.e. derived from prices).
– Level 3: inputs for the asset or liability that are not based on observable market data (unobservable inputs).
31 December 2011
Level 1 EUR
1,000
Level 2 EUR
1,000
Level 3 EUR
1,000
Total EUR
1,000
(5.39) Available-for-sale financial assets 1,021 – – 1,021
(5.39) Financial assets at fair value through profit or loss 47,658 – – 47,658
(5.49) Fair value derivatives (438) – – (438)
Total 48,241 – – 48,241
31 December 2010
Level 1 EUR
1,000
Level 2 EUR
1,000
Level 3 EUR
1,000
Total EUR
1,000
(5.39) Available-for-sale financial assets 2,812 – – 2,812
(5.39) Financial assets at fair value through profit or loss – 25,636 – 25,636
Total 2,812 25,636 – 28,448
In April 2011 the EMGS convertible loan was converted into 27.8 million shares in EMGS (14.81% of the
outstanding shares of EMGS). As a result, Fugro shareholding in EMGS transfers from Level 2 to Level 1
in 2011 (2010: no transfers in either direction).
5.56 C o m m i t m e n t s n o t i n c l u d e d i n t h e s t a t e m e n t o f f i n a n c i a l p o s i t i o n
5.56.1 Operating leases as lessee
Non-cancellable operating lease rentals are payable as follows:
(EUR x 1,000) 2011 2010
Less than one year 175,264 126,248
Between one and five years 257,634 233,097
More than five years 36,254 49,135
469,152 408,480
The Group leases a number of offices and warehouse/laboratory facilities and vessels under operating leases.
The leases typically run for an initial period of between three and ten years, with in most cases an option to
renew the lease after that date. Lease payments are adjusted annually to reflect market rentals. None of the
leases include contingent rentals.

163Fugro Financial statements 2011
During the year an amount of EUR 255 million was recognised as an expense in profit or loss in respect
of operating leases and other rentals (2010: EUR 195 million).
The Group does, in principle, not act as a lessor.
5.56.2 Capital commitments
At 31 December 2011 the Group has contractual obligations to purchase property, plant and equipment
for EUR 277.7 million (2010: EUR 235.9 million).
5.56.3 Contingencies
Some Group companies are, as a result of their normal business activities, involved either as plaintiffs or
defendants in claims. Based on information presently available and management’s best estimate the financial
position of the Group is not likely to be significantly influenced by any of these matters. Should the actual
outcome differ from the assumptions and estimates, the financial position of the Group would be impacted.
Fugro N.V. and its Dutch operating companies form a fiscal unit for corporate tax. Each of the operating
companies is severally liable for corporate tax to be paid by the fiscal unit.
5.57 S u b s e q u e n t e ve n t s
On 1 January 2012, Mr. A. Steenbakker took over the chairmanship of the Board of Management from
Mr. K.S. Wester, who will retire in June 2012. Mr. Wester was the President and CEO of Fugro as of October
2005. This transition of the chairmanship was earlier announced in May 2011. See for further information on
the composition of the Board of Management page 22.
On 8 March 2012 Fugro has entered into an option agreement with the independent foundation Stichting
Beschermingspreferente aandelen Fugro (‘Foundation protective preference shares Fugro’), pursuant to which
the Foundation was granted the right to acquire cumulative preference protective shares in Fugro’s share
capital, each share with a nominal value of EUR 0.05, up to an amount to be determined by the Foundation up
to a maximum equal to 100% minus 1 share of the aggregate nominal value of ordinary shares and preference
financing shares in Fugro that are held by third parties at the time the right to acquire shares is exercised by
the Foundation. By entering into the option agreement, the Foundation is in a position to achieve its object –
i.e. safeguarding Fugro and its businesses – autonomously, independently and effectively should the occasion
occur. See for further information page 83.

164
5.58 R e l a t e d p a r t i e s
5.58.1 Identity of related parties
The Group has a related party relationship with its subsidiaries, its equity-accounted investees and other
investments, its Directors, Executive Committee, and its Supervisory Board.
5.58.2 Transactions with the Board of Management
Members of the Board of Management of Fugro hold 0.5% of the outstanding voting shares and certificates of
shares in Fugro. Members of the Board of Management also participate in Fugro’s share option scheme
(refer note 5.30.1).
The remuneration of the Board of Management for 2011 and 2010 is as follows:
(in EUR) K.S. Wester A. Jonkman P. van Riel
2011 2010 2011 2010 2011 2010
Fixed salary 580,590 563,680 321,360 312,000 321,360 312,000
Bonus with respect to the previous year 469,733 469,733 260,000 260,000 260,000 260,000
Pension costs (including disability insurance) 350,000 350,000 265,800 265,303 265,800 265,303
1,400,323 1,383,413 847,160 837,303 847,160 837,303
Value of options granted 1,155,200 1,491,132 765,320 993,462 765,320 993,462
Total 2,555,523 2,874,545 1,612,480 1,830,765 1,612,480 1,830,765
(in EUR) A. Steenbakker J. Rüegg W.S. Rainey*
2011 2010 2011 2010 2011 2010
Fixed salary 321,360 312,000 321,360 312,000 191,597 –
Bonus with respect to the previous year 260,000 260,000 260,000 203,792 – –
Pension costs (including disability insurance) 265,800 265,303 18,000 18,001 169,900 –
847,160 837,303 599,360 533,793 361,497 –
Value of options granted 765,320 993,462 765,320 993,462 765,320 –
Total 1,612,480 1,830,765 1,364,680 1,527,255 1,126,817 –
* W.S. Rainey was appointed to the Board of Management as per 10 May 2011. The remuneration is disclosed as of this date.
The fringe benefits for the Board of Management are commensurate with the position held.
There are no guarantees or obligations towards or on behalf of the Board of Management.
The determination of the annual bonus is based upon the remuneration policy as adopted by the Annual
General Meeting of Shareholders on 14 May 2008. This remuneration policy is available on Fugro’s website:
www.fugro.com.

165Fugro Financial statements 2011
The Supervisory Board determines the remuneration of the individual members of the Board of Management,
on a proposal by the Remuneration and Nomination Committee, within the scope of the remuneration policy.
Annual bonus
Each member of the Board of Management will be eligible for an annual bonus, with a maximum of twelve
months (100%) of annual fixed salary. On-target performance will result in a bonus of eight months of annual
fixed salary. The bonus is related to quantified financial targets and accounts for 2/3 of the annual bonus and
the other part of the bonus is related to non-financial / personal targets and will account for 1/3 of the annual
bonus. At the beginning of each year the Supervisory Board sets the financial and the non-financial targets
for the relevant year. The Supervisory Board ensures that targets are challenging, realistic and consistent with
Fugro’s strategy. The performance measures and the weighing given to the individual measures are set by
the Supervisory Board. Achievement of the targets will be measured shortly after the end of the relevant year.
The weighting given to the individual financial elements is as follows: earnings per share (EPS) 60%, net profit
margin 20% and return on capital employed (ROCE) 20%. These financial elements are based upon Fugro’s
annual budget. The maximum bonus related to the financial targets will be granted if the targets are exceeded
by 30%, and if the performance is only 70% of target, the bonus will be 50% of on-target performance.
If performance is less than 70% of target, the part of the bonus that is related to financial targets will be zero.
The non-financial targets are derived from Fugro’s strategic agenda. These are qualitative individual targets
and/or collective targets that are the responsibility of one or more directors and can be influenced by them.
These targets could include, among other things, health safety and environment (HSE), corporate social
responsibility (CSR), personal development, etc.
Based on the results for the non-financial and financial targets, the Supervisory Board has established the
extent to which the targets for 2011 were achieved. The Supervisory Board concluded that the personal
(non-financial) targets were all met. The financial performance compared to the financial targets comes at
approximately 5 months. As a result the Supervisory Board has decided to award to each of the members of the
Board of Management an annual bonus of nine month’s annual fixed salary for the year 2011.
The actual targets are not disclosed because they qualify as competition-sensitive and hence commercially
confidential and potentially price sensitive information.

166
The following table gives details of the options granted to members of the Board of Management:
Board of Management Number of options In EUR Number of months
YearNumber at 01-01-11
Granted in 2011
Exercised in 2011
Forfeited in 2011
Number at 31-12-11
Exercise price
Share price at
exercise day
Expiring date Bonus1)
K.S. Wester 2005 113,000 113,000 – 27.13 41.96 31-12-2011 7
2006 125,000 125,000 36.20 31-12-2012 8
2007 125,000 125,000 52.80 31-12-2013 8
2008 107,500 107,500 20.485 31-12-2014 11
2009 90,000 90,000 40.26 31-12-2015 10
2010 79,400 79,400 61.50 31-12-2016 10
2011 80,000 80,000 44.895 31-12-2017 9
Total 639,900 80,000 113,000 – 606,900
A. Jonkman 2005 85,000 85,000 – 27.13 42.27 31-12-2011 7
2006 85,000 85,000 36.20 31-12-2012 8
2007 85,000 85,000 52.80 31-12-2013 8
2008 72,500 72,500 20.485 31-12-2014 11
2009 60,000 60,000 40.26 31-12-2015 10
2010 52,900 52,900 61.50 31-12-2016 10
2011 53,000 53,000 44.895 31-12-2017 9
Total 440,400 53,000 85,000 – 408,400
P. van Riel 2005 50,400 50,400 – 27.13 42.41 31-12-2011 –
2006 75,000 75,000 36.20 31-12-2012 8
2007 75,000 75,000 52.80 31-12-2013 8
2008 67,500 67,500 20.485 31-12-2014 11
2009 60,000 60,000 40.26 31-12-2015 10
2010 52,900 52,900 61.50 31-12-2016 10
2011 53,000 53,000 44.895 31-12-2017 9
Total 380,800 53,000 50,400 – 383,400
A. Steenbakker 2005 33,400 33,400 – 27.13 40.06 31-12-2011 –
2006 75,000 75,000 36.20 31-12-2012 8
2007 75,000 75,000 52.80 31-12-2013 8
2008 67,500 67,500 20.485 31-12-2014 11
2009 60,000 60,000 40.26 31-12-2015 10
2010 52,900 52,900 61.50 31-12-2016 10
2011 53,000 53,000 44.895 31-12-2017 9
Total 363,800 53,000 33,400 – 383,400
J. Rüegg 2005-2008 150,200 25,200 125,000 34.942) 39.91 31-12-2014 –
2009 52,500 52,500 40.26 31-12-2015 10
2010 52,900 52,900 61.50 31-12-2016 10
2011 53,000 53,000 44.895 31-12-2017 9
Total 255,600 53,000 25,200 – 283,400

167Fugro Financial statements 2011
Board of Management Number of options In EUR Number of months
YearNumber at 01-01-11
Granted in 2011
Exercised in 2011
Forfeited in 2011
Number at 31-12-11
Exercise price
Share price at
exercise day
Expiring date Bonus1)
W.S. Rainey 2005-2010 164,200 27,500 136,700 42.142) 52.67 31-12-2016 –
2011 53,000 53,000 44.895 31-12-2017 9
Total 164,200 53,000 27,500 – 189,700
Total 2,244,700 345,000 334,500 – 2,255,200
1) Bonus in the book year; paid in the next year.
2) Weighted average.
5.58.3 Executive Committee
The Group considers the Executive Committee, including the Board of Management, as ‘key management’.
In addition to their salaries, the Group also provides non-cash benefits to the Executive Committee and
contributes to their post-retirement plan. The members of the Executive Committee also participate in Fugro’s
share option scheme. The Executive Committee’s compensation comprises:
2011 2010
Fixed salary 3,041,402 2,886,950
Bonus with respect to the previous year 2,399,570 2,349,584
Pension costs (including disability insurance) 1,804,298 1,650,473
Value of options granted 6,830,120 8,265,675
14,075,390 15,152,682
5.58.4 Supervisory Board
The remuneration of the Supervisory Board is as follows:
2011 2010
F.H. Schreve, Chairman* 36,115 66,000
F.J.G.M. Cremers, Vice-Chairman 65,000 48,000
J.A. Colligan 58,000 46,000
M. Helmes 58,000 46,000
G-J. Kramer 60,000 48,000
H.C. Scheffer** 43,359 29,932
Th. Smith 83,000 61,000
403,474 344,932
* Mr. Schreve retired as Supervisory Director and Chairman in May 2011. Following the passing away of Mr. Scheffer, he has been
(re)appointed to the Board of Supervisory Directors as Chairman by the extraordinary general meeting of shareholders on 14 December
2011.
** Mr. Scheffer was appointed to the Board of Supervisory Directors on 6 May 2010. Mr. Scheffer passed away in September 2011.

168
There are no options granted and no company assets available to the members of the Supervisory Board.
There are no loans outstanding to the members of the Supervisory Board and no guarantees given on behalf
of members of the Supervisory Board.
Below is a summary of the number of options to acquire ordinary shares in Fugro that are held by
Mr. G-J. Kramer. These share options were granted to Mr. Kramer when he was a member (CEO) of the Board
of Management of Fugro.
Number of options In EUR
YearNumber at 01-01-11
Exercised in 2011
Forfeited in 2011
Number at 31-12-11
Exercise price
Share price at
exercise day
Expiring date
G-J. Kramer 2005 129,600 129,600 – – 27.13 62.94 31-12-2011
Total 129,600 129,600 – –
Per 31 December 2011 Mr. Kramer owned (directly and indirectly) 4,494,978 (certificates of) ordinary shares in
Fugro.
5.58.5 Other related party transactions
5.58.5.1 Joint ventures
The Group has not entered into any joint ventures.
5.59 S u b s i d i a r i e s
5.59.1 Significant subsidiaries
For an overview of (significant) subsidiaries we refer to chapter 6.
5.60 E s t i m a t e s a n d m a n a ge m e n t j u d ge m e n t s
Management discussed with the Audit Committee the development in and choice of critical accounting
principles and estimates and the application of such principles and estimates.
Key sources of estimation uncertainty
The preparation of financial statements in conformity with EU-IFRS requires management to make
judgements, estimates and assumptions that affect the application of accounting policies and the reported
amounts of assets, liabilities, income and expenses. Actual results may differ from these estimates. Estimates
and underlying assumptions are reviewed on an ongoing basis. Revisions to accounting estimates are
recognised in the period in which the estimates are revised if the revision affects only that period, or in the
period of the revision and future periods if the revision affects both current and future periods. Information
about critical judgements in applying accounting policies that have the most significant effect on the amounts
recognised in the consolidated financial statements is included in the following notes:
– Deferred tax: The assumptions used in recognition and measurement of deferred taxes are disclosed in
note 5.40.
– Impairments: Impairment analyses of goodwill are performed annually and whenever a triggering event
has occurred to determine whether the carrying value exceeds the recoverable amount. These analyses are
based on estimates of future cash f lows. The accounting policies regarding impairments are included in
note 5.15. Note 5.37 contains information about the key assumptions used to determine the recoverable
amount of the various cash generating units. Note 5.41 contains information about the impairment of
seismic and geological data. Specific information on credit risk is disclosed in notes 5.50.2 and 5.51.

169Fugro Financial statements 2011
These notes contain information about the assumptions used relating to impairment of trade receivables,
unbilled revenue on completed projects and other receivables.
– Assets and liabilities from employee benefits: Actuarial assumptions are established to anticipate future
events and are used in calculating pension and other post retirement benefit expenses and liabilities. These
factors include assumptions with respect to interest rates, expected investment returns on plan assets, rates
of future compensation increases, turnover rates and life expectancy. Note 5.47 contains information about
the (actuarial) assumptions related to employee benefits. Actuarial gains and losses related to defined
benefit plans are accounted for in other comprehensive income.
– Other provisions, tax and other contingencies: Information on the assumptions used in estimating the
effect of legal proceedings is included in note 5.23 and 5.48.

170
6 S u b s i d i a r i e s a n d i n v e s t m e n t s o f F u g r o N . V. a c c o u n t e d f o r u s i n g t h e e q u i t y m e t h o d(including statutory seat and percentage of interest)
Unless stated otherwise, the direct or indirect interest of Fugro in the subsidiaries listed below is 100%.
Insignificant, but consolidated, subsidiaries in terms of third party recompense for goods and services supplied
and balance sheet totals have not been included.
The subsidiaries listed below have been fully incorporated into the consolidated financial statements of Fugro,
unless indicated otherwise. Companies in which Fugro participates but that are not included in Fugro’s
consolidated financial statements are indicated by a #.
The information as required by sections 2:379 and 2:414 of the Dutch Civil Code has been filed at the trade
registry of the Chamber of Commerce in The Hague.
Fugro Survey Pty Ltd. Balcatta, Australia
Fugro Subsea Services Australia Pty Ltd. Canning Vale, Australia
Fugro LADS Corporation Pty Ltd. Kidman Park, Australia
Fugro Airborne Surveys Pty Ltd. Perth, Australia
Fugro Geoteam Pty Ltd. Perth, Australia
Fugro Holdings Australia Pty Ltd. Perth, Australia
Fugro-Jason Australia Pty Ltd. Perth, Australia
Fugro Multi Client Services Pty Ltd. Perth, Australia
Fugro Seismic Imaging Pty Ltd. Perth, Australia
Fugro Spatial Solutions Pty Ltd. Perth, Australia
Fugro TSM Pty Ltd. Perth, Australia
Fugro Satellite Positioning Pty Ltd. Perth, Australia
Fugro PMS Pty Ltd. Sydney, Australia
Fugro Austria GmbH Bruck an der Mur, Austria
Azeri-Fugro # 40% Baku, Azerbaijan
Fugro Survey GmbH (Caspian branch office) Baku, Azerbaijan
Fugro Belgique/België S.A./N.V Brussels, Belgium
Fugro In Situ Geotecnia Ltda. Portao, Brazil
Fugro Brasil Ltda. Rio das Ostras, Brazil
Fugro Geosolutions Brasil Serviços Ltda. Rio de Janeiro, Brazil
Geomag S/A Prospeccoes Aerogeofisicas 20% Rio de Janeiro, Brazil
LASA Engenhariae Prospeccoes S.A. 20% Rio de Janeiro, Brazil
Fugro Sdn Bhd. (Brunei) Bandar Seri Begawan, Brunei Darussalam
Fugro Survey (Brunei) Sdn Bhd. Kuala Belait, Brunei Darussalam
Fugro GeoServices Ltd. Calgary, Canada
Fugro Data Solutions Canada, Inc. Calgary, Canada
Fugro Airborne Surveys, Corp. Missisauga, Canada
Fugro Roadware, Inc. Missisauga, Canada
Fugro (Canada), Inc. New Brunswick, Canada
Fugro Airborne Surveys, Corp. Ottawa, Canada
Fugro GeoSurveys, Inc. St. John’s, Canada
Fugro Interra S.A. Santiago, Chile
Fugro Geoscience (Beijing) Ltd. Beijing, China
Fugro Technical Services (Guangzhou) Ltd. Guangzhou, China
Fugro Pacifica Qinhuangdao Co. Ltd. Qinhuangdao, China
Fugro Geotechnique Co. Ltd. 60% Shanghai, China
China Offshore Fugro GeoSolutions
(Shenzhen) Co. Ltd. 50% Shekou, Shenzhen, China
Fugro Comprehensive Geotechnical
Investigation (Zhejiang) Co. Ltd. Zhejiang, China
Fugro Airborne Surveys N.V. Willemstad, Curaçao
Fugro Consultants International N.V. Willemstad, Curaçao
Fugro GeoSurveys N.V. Willemstad, Curaçao
Fugro Robertson Americas N.V. Willemstad, Curaçao
Fugro Satellite Services N.V. Willemstad, Curaçao
Fugro Survey Caribbean N.V. Willemstad, Curaçao
Fugro Aerial Mapping A/S Taastrup, Denmark
Fugro S.A.E. Cairo, Egypt
Fugro Geoid S.A.S. Jacou, France
Fugro France S.A.S. Nanterre, France
Fugro Geotechnique S.A. Nanterre, France
Fugro Topnav S.A.S. Paris (Massy), France
Fugro Consult GmbH Berlin, Germany
Fugro-OSAE GmbH Bremen, Germany
Fugro Weinhold Engineering GmbH Erkelenz-Holzweiler, Germany
Fugro-MAPS GmbH Munich, Germany
Fugro Certification Services Ltd. Fo Tan, Hong Kong
Fugro Technical Services Ltd. Fo Tan, Hong Kong
Geotechnical Instruments (Hong Kong) Ltd. Fo Tan, Hong Kong
Fugro Geotechnical Services Ltd. Fo Tan, Hong Kong
Fugro Shanghai (Hong Kong) Ltd. 60% Wanchai, Hong Kong
Fugro (Hong Kong) Ltd. Wanchai, Hong Kong
Fugro Geosciences International Ltd. Wanchai, Hong Kong
Fugro Holdings (Hong Kong) Ltd. Wanchai, Hong Kong
Fugro Geospatial Services (Hong Kong) Ltd. Wanchai, Hong Kong
Fugro Marine Survey International Ltd. Wanchai, Hong Kong
Fugro SEA Ltd. Wanchai, Hong Kong
Fugro Subsea Services Ltd. Wanchai, Hong Kong
Fugro Survey International Ltd. Wanchai, Hong Kong
Fugro Survey Ltd. Wanchai, Hong Kong
Fugro Survey Management Ltd. Wanchai, Hong Kong
Company % Office, Country Company % Office, Country

171Fugro Financial statements 2011
MateriaLab Consultants Ltd. Tuen Mun, Hong Kong
Fugro Consult Kft. Budapest, Hungary
Fugro NexTerra Geophysics Pvt Ltd. Kolkata, India
Fugro Geoscience India Pvt. Ltd. Navi Mumbai, India
Fugro Geotech (Pvt) Ltd. Navi Mumbai, India
Fugro Survey (India) Pvt Ltd. 90% Navi Mumbai, India
P.T. Fugro Indonesia Jakarta Selatan, Indonesia
Fugro Oceansismica S.p.A. Rome, Italy
Fugro Japan Co., Ltd. Tokyo, Japan
Fugro Kazakhstan LLC Atyrau, Kazakhstan Republic
Fugro KazProject LLP Atyrau, Kazakhstan Republic
Fugro-MAPS S.a.r.l. Beirut, Lebanon
Fugro Rovtech Limited Libya (Libyan Branch Office) Tripoli, Libya
UAB ‘Fugro Baltic’ Vilnius, Lithuania
Fugro Eco Consult S.a.r.l. Munsbach, Luxembourg
Fugro Technical Services (Macau) Ltd. Macau, Macau
Fugro Geodetic (Malaysia) Sdn Bhd. 30% Kuala Lumpur, Malaysia
Fugro Geosciences (Malaysia) Sdn Bhd. 30% Kuala Lumpur, Malaysia
Fugro-Jason (M) Sdn. Bhd. 40% Kuala Lumpur, Malaysia
Fugro Malta Ltd. Safi, Malta
Fugro Airborne Surveys Ltd. Quatre-Bornes, Mauritius
Fugro Seastar Mauritius Ltd. Quatre-Bornes, Mauritius
Fugro Survey Mauritius Ltd. Quatre-Bornes, Mauritius
Fugro-Chance de Mexico S.A. de C.V. Ciudad Del Carmen, Campeche, Mexico
Fugro Survey Mexico S.A. de C.V. Ciudad Del Carmen, Campeche, Mexico
Geomundo S.A. de C.V. Ciudad Del Carmen, Campeche, Mexico
De Regt Marine Cables B.V. Krimpen aan de Lek, The Netherlands
Fugro C.I.S. B.V. Leidschendam, The Netherlands
Fugro Data Solutions B.V. Leidschendam, The Netherlands
Fugro Ecoplan B.V. Leidschendam, The Netherlands
Fugro-Elbocon B.V. Leidschendam, The Netherlands
Fugro Engineers B.V. Leidschendam, The Netherlands
Fugro GeoServices B.V. Leidschendam, The Netherlands
Fugro Intersite B.V. Leidschendam, The Netherlands
Fugro-Jason Netherlands B.V. Leidschendam, The Netherlands
Fugro Marine Services B.V. Leidschendam, The Netherlands
Fugro Nederland B.V. Leidschendam, The Netherlands
Fugro Robertson B.V. Leidschendam, The Netherlands
Fugro South America B.V. Leidschendam, The Netherlands
Fugro Survey B.V. Leidschendam, The Netherlands
Fugro Vastgoed B.V. Leidschendam, The Netherlands
Fugro Aerial Mapping B.V. Leidschendam, The Netherlands
Inpark Detacheringen B.V. Leidschendam, The Netherlands
Fugro Satellite Positioning B.V. Leidschendam, The Netherlands
Fugro BTW Ltd. New Plymouth, New Zealand
Fugro Survey (Nigeria) Ltd. Port Harcourt, Nigeria
Fugro Nigeria Ltd. Port Harcourt, Nigeria
Fugro Survey A/S Bergen, Norway
ProFocus Systems A/S Fyllingsdalen, Norway
Fugro RUE A/S Haugesund, Norway
Fugro Geotechnics A/S Oslo, Norway
Fugro Multi Client Services A/S Oslo, Norway
Fugro Norway A/S Oslo, Norway
Fugro Seastar A/S Oslo, Norway
Fugro Seismic Imaging A/S Oslo, Norway
Fugro-Geoteam A/S Oslo, Norway
Fugro Interaction A/S Stavanger, Norway
Fugro OBN Technologies A/S Trondheim, Norway
Fugro Oceanor A/S Trondheim, Norway
Fugro Geolab Nor A/S Trondheim, Norway
Fugro Middle East & Partners LLC Muscat, Oman
Fugro Geodetic Ltd. Karachi, Pakistan
Fugro Panama SA Panama City, Panama
Fugro TerraLaser S.A. Lima, Peru
Fugro Peninsular Geotechnical Services Doha, Qatar
Fugro Engineering LLP Moscow, Russia
Fugro Geosciences GmbH branch Moscow, Russia
Electro Magnetic Marine Exploration
Technologies (EMMET) ZAO Moscow, Russia
Geo Inzh Services LLP Moscow, Russia
Fugro-Geostatika Co Ltd. St. Petersburg, Russia
Fugro-Suhaimi Ltd. 50% Dammam, Saudi Arabia
Decca Survey Saudi Arabia Ltd. 48% Dammam, Saudi Arabia
Fugro Saudi Arabia Ltd. Riyadh, Saudi Arabia
Fugro Loadtest Asia Pte Ltd. Singapore, Singapore
Fugro Satellite Positioning Pte Ltd. Singapore, Singapore
Fugro Singapore Pte Ltd. Singapore, Singapore
Fugro Survey Pte Ltd. Singapore, Singapore
Fugro TSM Pte Ltd. Singapore, Singapore
Fugro Subsea Technologies Pte Ltd. Singapore, Singapore
Fugro-GEOS Pte Ltd. Singapore, Singapore
Fugro Survey Africa (Pty) Ltd. Cape Town, South Africa
Fugro Satellite Positioning (Pty) Ltd. Cape Town, South Africa
Fugro Maps South Africa (Pty) Ltd. Cape Town, South Africa
Fugro Airborne Surveys (Pty) Ltd. Gauteng, South Africa
Fugro Data Services AG Zug, Switzerland
Fugro Finance AG Zug, Switzerland
Fugro Geodetic AG Zug, Switzerland
Fugro Geosciences GmbH Zug, Switzerland
Fugro International Holding A.G. Zug, Switzerland
Fugro South America GmbH Zug, Switzerland
Fugro Survey GmbH Zug, Switzerland
Fugro Survey Caribbean Inc. Chaguaramas, Trinidad and Tobago
Fugro Sial Ltd. Ankara, Turkey
Company % Office, Country Company % Office, Country

172
Fugro Geoscience Middle East Abu Dhabi, United Arab Emirates
Fugro Survey (Middle East) Ltd. Abu Dhabi, United Arab Emirates
Fugro Middle East B.V. Dubai, United Arab Emirates
Fugro-MAPS (UAE) Sharjah, United Arab Emirates
Fugro Survey Ltd. Aberdeen, United Kingdom
Fugro-ImpROV Ltd. Aberdeen, United Kingdom
Fugro Salt Subsea Ltd. Aberdeen, United Kingdom
Fugro Aperio Ltd. Cambridge, United Kingdom
Fugro BKS Ltd. Coleraine, United Kingdom
Fugro Data Solutions Ltd. Conwy, United Kingdom
Fugro NPA Ltd. Edenbridge, United Kingdom
Fugro ERT (Scotland) Ltd. Edinburgh, United Kingdom
Fugro Seacore Ltd. Falmouth, United Kingdom
Fugro Alluvial Offshore Ltd. Great Yarmouth, United Kingdom
Fugro-Robertson Ltd. Llandudno, United Kingdom
Fugro Loadtest Ltd. Middlesex, United Kingdom
Fugro General Robotics Ltd. Milton Keynes, United Kingdom
Fugro Seismic Imaging Ltd. Swanley, United Kingdom
Fugro Multi Client Services (UK) Ltd. Wallingford, United Kingdom
Fugro GeoConsulting Ltd. Wallingford, United Kingdom
Fugro Airborne Surveys Ltd. Wallingford, United Kingdom
Fugro Engineering Services Ltd. Wallingford, United Kingdom
Fugro-GEOS Ltd. Wallingford, United Kingdom
Fugro Holdings (UK) Ltd. Wallingford, United Kingdom
Fugro-Jason (UK) Ltd. Wallingford, United Kingdom
Company % Office, Country Company % Office, Country
Fugro EarthData, Inc. Frederick, United States
Fugro (USA), Inc. Houston, United States
Fugro Data Solutions, Inc. Houston, United States
Fugro Geoteam, Inc. Houston, United States
Fugro GeoServices, Inc. Houston, United States
Fugro Multi Client Services, Inc. Houston, United States
Fugro GeoConsulting, Inc. Houston, United States
Fugro Consultants, Inc. Houston, United States
Fugro, Inc. Houston, United States
Fugro-GEOS, Inc. Houston, United States
Fugro-ImpROV, Inc. Houston, United States
Fugro-Jason, Inc. Houston, United States
Fugro-McClelland Marine Geosciences, Inc. Houston, United States
Fugro Gravity & Magnetic Services, Inc. Houston, United States
Fugro Seismic Imaging, Inc. Houston, United States
Fugro Drilling & Well Services, Inc. Houston, United States
Fugro Satellite Positioning Inc. Houston, United States
John Chance Land Surveys, Inc. Lafayette, United States
Fugro Chance, Inc. Lafayette, United States
Fugro Horizons, Inc. Rapid City, United States
Fugro Roadware, Inc. Richmond, United States
Fugro Pelagos, Inc. San Diego, United States
Fugro Geotechnics Vietnam LLC Ho Chi Minh City, Vietnam

173Fugro Financial statements 2011
7 C o m p a ny b a l a n c e s h e e tAs at 31 December, before profit appropriation
(EUR x 1,000) 2011 2010
A s s e t s
(9.1) Intangible assets 70,538 70,538
(9.2) Tangible fixed assets 33 84
(9.3) Financial fixed assets 2,560,633 1,845,522
Deferred tax assets – 434
Total non-current assets 2,631,204 1,916,578
(9.4) Trade and other receivables 21,023 27,901
Current tax assets 6,081 –
Cash and cash equivalents 24,566 –
Total current assets 51,670 27,901
Total assets 2,682,874 1,944,479
E q u i t y
Share capital 4,071 4,014
Share premium 431,384 431,441
Translation reserve (5,083) (7,082)
Hedging reserve (2,477) (3,511)
Other reserves 940,295 811,237
Unappropriated result 287,595 272,219
(9.5) Total equity 1,655,785 1,508,318
P r o v i s i o n s
(9.6) Provisions 3,246 5,000
Deferred tax liabilities 1,310 –
L i a b i l i t i e s
(9.7) Loans and borrowings 797,357 216,579
Total non-current liabilities 801,913 221,579
Bank overdraft 150,131 190,671
Loans and borrowings 53,777 –
(9.8) Trade and other payables 18,815 18,700
Other taxes and social security charges 2,453 1,574
Current tax liabilities – 3,637
Total current liabilities 225,176 214,582
Total liabilities 1,027,089 436,161
Total equity and liabilities 2,682,874 1,944,479
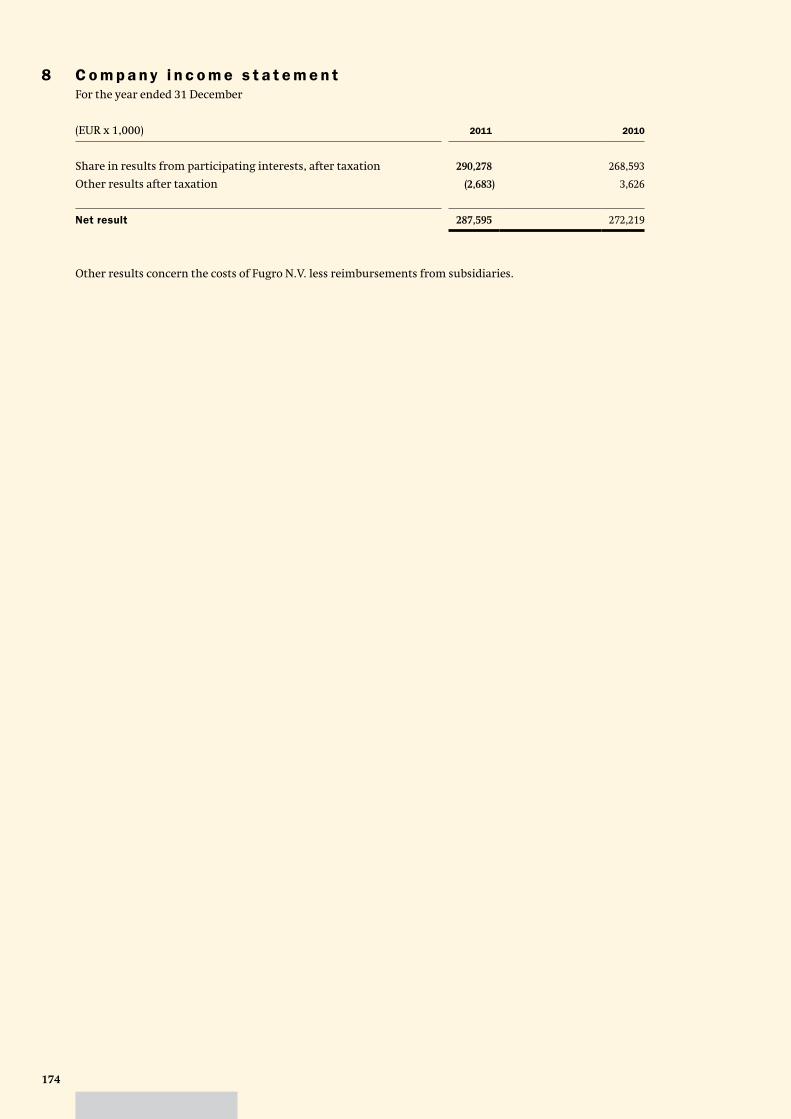
174
8 C o m p a ny i n c o m e s t a t e m e n tFor the year ended 31 December
(EUR x 1,000) 2011 2010
Share in results from participating interests, after taxation 290,278 268,593
Other results after taxation (2,683) 3,626
Net result 287,595 272,219
Other results concern the costs of Fugro N.V. less reimbursements from subsidiaries.

175Fugro Financial statements 2011
9 N o t e s t o t h e c o m p a ny f i n a n c i a l s t a t e m e n t s
G e n e r a l
The company financial statements form part of the 2011 consolidated financial statements of Fugro. As the
financial data of Fugro N.V. are included in the consolidated financial statements, the statement of income
of Fugro N.V. is condensed in conformity with section 402 of Book 2 of the Netherlands Civil Code.
A c c o u n t i n g p o l i c i e s
For setting the principles for the recognition and measurement of assets and liabilities and determination of
the result for its company financial statements, Fugro makes use of the option provided in Section 2:362 Clause
8 of the Netherlands Civil Code. This means that the principles for the recognition and measurement of assets
and liabilities and determination of the result (hereinafter referred to as principles for recognition and
measurement) of the company financial statements of Fugro N.V. are the same as those applied for the
consolidated EU-IFRS financial statements. Participating interests, over which significant influence is
exercised, are stated on the basis of the net equity value. These consolidated financial statements have been
prepared in accordance with International Financial Reporting Standards (IFRS) as adopted by the European
Union (EU-IFRS) and with Part 9 of Book 2 of the Netherlands Civil Code. Reference is made to pages 98 to 117
for a description of these principles.
The share in the result of participating interests consists of the share of Fugro in the result of these
participating interests. Results on transactions, where the transfer of assets and liabilities between Fugro and
its participating interests, and mutually between participating interests themselves, are not incorporated as
far as they can be deemed to be unrealised.
9.1 I n t a n g i b l e a s s e t s
(EUR x 1,000) 2011 2010
Cost
Balance at 1 January 70,538 70,538
Balance at 31 December 70,538 70,538
Carrying amount
At 1 January 70,538 70,538
At 31 December 70,538 70,538
The capitalised goodwill is not systematically amortised. Goodwill is tested for impairment annually, or when
there is an indication for impairment. Goodwill represents amounts arising on acquisition of subsidiaries.
No impairment has been recognised.
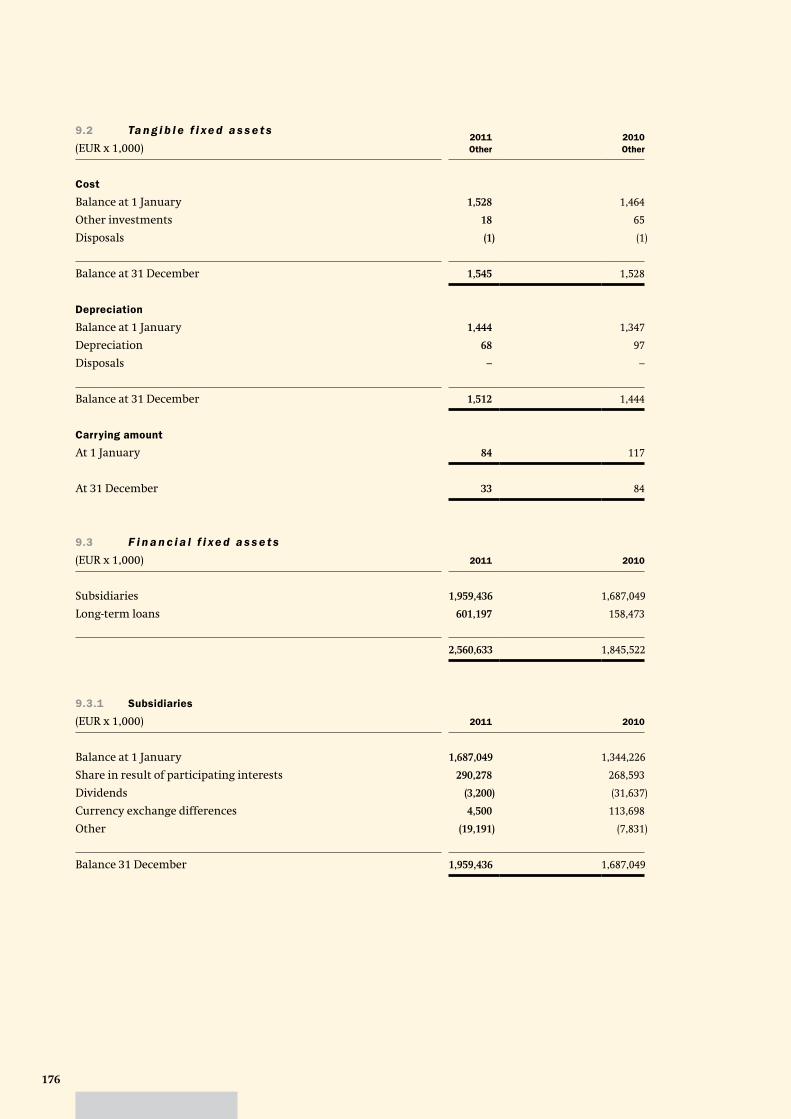
176
9.2 Ta n g i b l e f i xe d a s s e t s
(EUR x 1,000)2011 Other
2010 Other
Cost
Balance at 1 January 1,528 1,464
Other investments 18 65
Disposals (1) (1)
Balance at 31 December 1,545 1,528
Depreciation
Balance at 1 January 1,444 1,347
Depreciation 68 97
Disposals – –
Balance at 31 December 1,512 1,444
Carrying amount
At 1 January 84 117
At 31 December 33 84
9.3 F i n a n c i a l f i xe d a s s e t s
(EUR x 1,000) 2011 2010
Subsidiaries 1,959,436 1,687,049
Long-term loans 601,197 158,473
2,560,633 1,845,522
9.3.1 Subsidiaries
(EUR x 1,000) 2011 2010
Balance at 1 January 1,687,049 1,344,226
Share in result of participating interests 290,278 268,593
Dividends (3,200) (31,637)
Currency exchange differences 4,500 113,698
Other (19,191) (7,831)
Balance 31 December 1,959,436 1,687,049

177Fugro Financial statements 2011
9.3.2 Long-term loans
(EUR x 1,000) 2011 2010
Balance at 1 January 158,473 64,296
Loans provided 837,266 247,723
Redemptions (391,306) (147,877)
Currency exchange differences (3,236) (5,669)
Balance 31 December 601,197 158,473
This concerns loans to subsidiaries at 4.5% (2010: 2.0%) interest.
9.4 Tr a d e a n d o t h e r r e c e i va b l e s
(EUR x 1,000) 2011 2010
Receivables from Group companies 19,246 26,926
Other taxes and social security charges 1,188 –
Other receivables 589 975
Balance 31 December 21,023 27,901
9.5 E q u i t y
The equity movement schedule is included in chapter 3 of the consolidated financial statements. For the notes
to the equity reference is made to note 5.44 of the consolidated financial statements. The Translation reserve
and Hedging reserve qualify as a legal reserve (‘wettelijke reserve’) in accordance with Part 9 of Book 2 of the
Netherlands Civil Code.
9.6 P r o v i s i o n s
For the notes on provisions reference is made to note 5.48 of the consolidated financial statements.
9.7 L o a n s a n d b o r r ow i n g s
(EUR x 1,000) 2011 2010
Private Placement loans 750,975 109,634
Long-term loans 46,382 106,945
Balance at 31 December 797,357 216,579
For the notes on Private Placement loans reference is made to note 5.46.2 and 5.46.3 of the consolidated
financial statements. The long-term loans are from subsidiaries. In principle, these loans will be repaid within
two years. The average interest on loans and borrowings amounts to 4.5% per annum (2010: 3.5%).

178
9.8 Tr a d e a n d o t h e r p a ya b l e s
(EUR x 1,000) 2011 2010
Trade payables 857 2,198
Interest Private Placement loans 12,892 1,117
Non-trade payables and accrued expenses 5,066 15,385
Balance 31 December 18,815 18,700
9.9 C o m m i t m e n t s n o t i n c l u d e d i n t h e b a l a n c e s h e e t
Tax unit
Fugro N.V. and the Dutch operating companies form a fiscal unit for corporate tax. Each of the operating
companies is severally liable for corporate tax to be paid by the fiscal unit.
9.10 G u a r a n t e e s
In principle Fugro does not provide parent company guarantees to its subsidiaries, unless significant
commercial reasons exist. Fugro has filed declarations of joint and several liability for a number of subsidiaries
at the Chambers of Commerce. Fugro has filed a list with the Chamber of Commerce, which includes all
financial interests of the Group in subsidiaries as well as a reference to each subsidiary for which such a
declaration of liability has been deposited. At 31 December 2011 and at 31 December 2010 no significant
guarantees were outstanding.
9.11 C o n t i n ge n c i e s
For the notes to contingencies reference is made to note 5.56.3 of the consolidated financial statements.
9.12 R e l a t e d p a r t i e s
For the notes to related parties, reference is made to note 5.58 of the consolidated financial statements.
In note 5.58 the remuneration of the Board of Management, Executive Committee and Supervisory Board is
disclosed.
9.13 Au d i t f e e s
With reference to Section 2:382a of the Netherlands Civil Code, the following fees for the financial year have
been charged by KPMG to the Company and its subsidiaries:
(EUR x 1,000) 2011 2010
KPMG Acoun-
tants N.V.
Other KPMG
networkTotal
KPMG
KPMG Acoun-
tants N.V.
Other KPMG
networkTotal
KPMG
Statutory audit of financial statements 691 1,452 2,143 691 1,355 2,046
Other assurance services 105 34 139 65 41 106
Tax advisory services – 6 6 – 9 9
Other non-audit services – 11 11 5 – 5
Total 796 1,503 2,299 761 1,405 2,166

179Fugro Financial statements 2011
In 2011 the audit fees under the category ‘statutory audit of financial statements’, include an amount of
EUR 195 thousand for the audit of the 2010 statutory financial statements of subsidiaries.
Audit and (non-)audit related fees for the respective years are charged to the income statement on an accrual
basis.
The most important task of the external auditor is the audit of the (consolidated) financial statements of Fugro.
Furthermore, the auditor assists with due diligence processes and financial statements related audit work
within the Group. Tax advice is in principle given by specialist firms or specialised departments of local audit
firms, which hardly ever are involved in the audit of the financial statements of the relevant subsidiary. Other
than these advisory services, Fugro makes only limited use of external advisors. In the case that such services
are required, specialists are engaged that are not associated with the external auditor.
The fees paid for the above mentioned services, which are included in profit or loss of the consolidated
financial statements in the line other expenses, are evaluated on a regular basis and in line with the market.
The members of the Supervisory Board have signed the financial statements pursuant to their statutory
obligations under Section 2:101 sub 2 Netherlands Civil Code.
The members of the Board of Management have signed the financial statements pursuant to their statutory
obligations under Section 2:101 sub 2 Netherlands Civil Code and Section 5:25c sub 2 (c) Financial Markets
Supervison Act.
Leidschendam, 8 March 2012
Board of Management Supervisory Board
K.S. Wester, President and CEO until 31 December 2011 F.H. Schreve, Chairman
A. Steenbakker , Chairman Board of Management as of 1 January 2012 F.J.G.M. Cremers, Vice-chairman
P. van Riel , Vice-chairman/Director Geoscience division J.A. Colligan
A. Jonkman, Chief Financial Officer M. Helmes
W.S. Rainey, Director Geotechnical division G-J. Kramer
J. Rüegg, Director Survey division Th. Smith

180
1 0 O t h e r i n f o r m a t i o n
10.1 I n d e p e n d e n t Au d i t o r ’s r e p o r t
To: the Supervisory Board and Shareholders of Fugro N.V.
Report on the financial statements
We have audited the accompanying financial statements
2011 of Fugro N.V., Leidschendam, as set out on pages 90
to 179. The financial statements include the consolidated
financial statements and the company financial
statements. The consolidated financial statements
comprise the consolidated statement of financial
position as at 31 December 2011, the consolidated
statement of comprehensive income, of changes in
equity, and of cash f lows for the year then ended, and
notes, comprising a summary of the significant
accounting policies and other explanatory information.
The company financial statements comprise the
company balance sheet as at 31 December 2011,
the company income statement for the year then ended
and the notes, comprising a summary of the accounting
policies and other explanatory information.
Management’s responsibility
Management is responsible for the preparation and fair
presentation of the financial statements in accordance
with International Financial Reporting Standards as
adopted by the European Union and with Part 9 of Book 2
of the Netherlands Civil Code, and for the preparation
of the report of the board of management in accordance
with Part 9 of Book 2 of the Netherlands Civil Code.
Furthermore, management is responsible for such
internal control as it determines is necessary to enable
the preparation of the financial statements that are free
from material misstatement, whether due to fraud or
error.
Auditor’s responsibility
Our responsibility is to express an opinion on these
financial statements based on our audit. We conducted
our audit in accordance with Dutch law, including the
Dutch Standards on Auditing. This requires that we
comply with ethical requirements and plan and perform
the audit to obtain reasonable assurance about whether
the financial statements are free from material
misstatement.
An audit involves performing procedures to obtain audit
evidence about the amounts and disclosures in the
financial statements. The procedures selected depend
on the auditor’s judgment, including the assessment
of the risks of material misstatement of the financial
statements, whether due to fraud or error.
In making those risk assessments, the auditor considers
internal control relevant to the entity’s preparation and
fair presentation of the financial statements in order
to design audit procedures that are appropriate in the
circumstances, but not for the purpose of expressing
an opinion on the effectiveness of the entity’s internal
control. An audit also includes evaluating the
appropriateness of accounting policies used and the
reasonableness of accounting estimates made by
management, as well as evaluating the overall
presentation of the financial statements.
We believe that the audit evidence we have obtained
is sufficient and appropriate to provide a basis for our
audit opinion.
Opinion with respect to the consolidated financial
statements
In our opinion, the consolidated financial statements
give a true and fair view of the financial position of
Fugro N.V. as at 31 December 2011 and of its result and
its cash f lows for the year then ended in accordance with
International Financial Reporting Standards as adopted
by the European Union and with Part 9 of Book 2 of the
Netherlands Civil Code.
Opinion with respect to the company financial
statements
In our opinion, the company financial statements give a
true and fair view of the financial position of Fugro N.V.
as at 31 December 2011 and of its result for the year
then ended in accordance with Part 9 of Book 2 of the
Netherlands Civil Code.

181Fugro Financial statements 2011
Report on other legal and regulatory requirements
Pursuant to the legal requirements under Section 2:393
sub 5 at e and f of the Netherlands Civil Code, we have no
deficiencies to report as a result of our examination
whether the report of the board of management, to the
extent we can assess, has been prepared in accordance
with Part 9 of Book 2 of this Code, and if the information
as required under Section 2:392 sub 1 at b - h has been
annexed. Further, we report that the report of the board
of management, to the extent we can assess, is consistent
with the financial statements as required by Section
2:391 sub 4 of the Netherlands Civil Code.
Amstelveen, 8 March 2012
KPMG ACCOUNTANTS N.V.
R.P. Kreukniet RA

182
10.2 S u b s e q u e n t e ve n t s
Reference is made to note 5.57.
10.3 Fo u n d a t i o n B o a r d s
Stichting Administratiekantoor Fugro
(‘Fugro Trust Office’)
The Board of the Fugro Trust Office, Leidschendam,
The Netherlands, is composed as follows:
name function term
R. van der Vlist, Chairman Board member 2012
L.P.E.M. van den Boom Board member 2013
J.F. van Duyne Board member 2015
J.A.W.M. van Rooijen Board member 2014
All Board members are independent of Fugro.
Stichting Beschermingspreferente aandelen Fugro
(‘Foundation Protective Preference Shares’)
The Board of Foundation Protective Preference Shares,
Leidschendam, The Netherlands, is composed as follows:
name function term
M.W. den Boogert, Chairman Board member B 2014
M.A.M. Boersma Board member B 2014
J.V.M. Commandeur Board member B 2012
J.C. de Mos Board member B 2013
F.H. Schreve Board member A 2015
All Board members, with the exception of
Mr. F.H. Schreve, are independent of Fugro. Mr. Schreve
is the Chairman of the Supervisory Board of Fugro.
Stichting Continuïteit Fugro (‘Foundation Continuity’)
The Board of Foundation Continuity, Curaçao, is
composed as follows:
name function term
G.E. Elias, Chairman Board member B 2012
A.C.M. Goede Board member B 2013
R. de Paus Board member B 2015
M. van der Plank Board member B 2014
F.H. Schreve Board member A indefinite *
* In capacity as a member of the Supervisory Board of Fugro.
All Board members, with the exception of
Mr. F.H. Schreve, are independent of Fugro. Mr. Schreve
is the Chairman of the Supervisory Board of Fugro.
10.4 S t a t u t o r y p r o v i s i o n s r e ga r d i n g
t h e a p p r o p r i a t i o n o f p r o f i t
The provisions regarding the appropriation of profit are
contained in article 36 of the Articles of Association of
Fugro and, as far as relevant, read as follows:
36.2 a. The profit shall, if sufficient, be applied first
in payment to the holders of protective
preference shares of a percentage as specified
below of the compulsory amount paid on
these shares as at the commencement of the
financial year for which the distribution is
made.
b. The percentage referred to above in
subparagraph a. shall be equal to the average
of the Euribor interest charged for loans with
a term of one year – weighted by the number
of days for which this interest was applicable –
during the financial year for which the
distribution is made, increased by at most four
percentage points; this increase shall each time
be fixed by the Board of Management for a
period of five years, after approval by the
Supervisory Board.
36.3 a. Next, if possible, a dividend shall be paid on the
financing preference shares of each series and
on the convertible financing preference shares
of each series, equal to a percentage calculated
on the amount effectively paid on the
financing preference shares of the respective
series and the convertible financing preference
shares of the respective series, including a
share premium, if any, upon the first issue of
the series in question, and which percentage
shall be related to the average effective return
on ‘state loans general with a term of
7 – 8 years’, calculated and determined in the
manner as described hereinafter.
b. The percentage of the dividend for the
financing preference shares of each or for the
convertible financing preference shares of each
series, as the case may be, shall be calculated
by taking the arithmetic mean of the average
effective return on the aforesaid loans, as
published by Bloomberg, or if Bloomberg
does not publish this information, by Reuters,
for the last five stock market trading days
preceding the day of the first issue of financing
preference shares of the respective series or the
convertible financing preference shares of the
respective series, as the case may be, or

183Fugro Financial statements 2011
preceding the day on which the dividend
percentage is adjusted, increased or decreased,
if applicable, by a mark-up or mark-down set
by the Board of Management upon issue and
approved by the Supervisory Board of at most
two percentage points, depending on the
market conditions then obtaining, which
mark-up or mark-down may differ for each
series, or, if Reuters does not publish this
information or if such state loan and
information source that is or are most
comparable thereto as to be determined by
the board of Management and approved by
the Supervisory Board.
36.4 If in any financial year the profit is insufficient
to make the distributions referred to above in
paragraph 3 of this article, then in subsequent
financial years the provisions of paragraph 3
shall not apply until the deficit has been made
good and until the provisions of paragraph 3
have been applied or until the Board of
Management, with the approval of the
Supervisory Board, resolves to charge an
amount equal to the deficit to the freely
distributable reserves, with the exception
of the reserves which have been set aside as
share premium upon the issue of financing
preference shares or convertible financing
preference shares.
36.5 If the first issue of financing preference shares
or convertible financing preference shares
of a series takes place during the course of a
financial year, the dividend for that financial
year on the respective series of financing
preference shares or convertible financing
preference shares shall be decreased
proportionately up to the first day of such
issue.
36.6 After application of paragraphs 2 to 5 no
further distribution of shall be made on the
protective preference shares, the financing
preference shares or the convertible financing
preference shares.
36.7 Of any profit remaining after application
of the paragraphs 2 to 5 such amount shall
be allocated to the reserves by the Board of
Management with the approval of the
Supervisory Board as the Board of Management
shall deem necessary. Insofar as the profit is
not allocated to the reserves pursuant to the
provisions of the preceding sentence, it shall
be at the disposal of the General Meeting of
Shareholders either for allocation in whole or
in part to the reserves or for distribution in
whole or in part to the holders of ordinary
shares pro rata to the aggregate amount of
their ordinary shares.
10.5 P r o p o s a l r e ga r d i n g t h e
a p p r o p r i a t i o n o f p r o f i t
In accordance with article 36 of the Articles of
Association, it shall be proposed to the Annual General
Meeting of Shareholders on 22 May 2012 that the net
result of EUR 287.6 million be appropriated as follows:
EUR 118.8 million (EUR 1.50 per share) as dividend to
holders of (certificates of) ordinary shares, to be paid
either in cash or in (certificates of) ordinary shares, and
the remaining EUR 168.8 million to be allocated to the
reserves. The dividend proposal is stated on page 15 of
the Report of the Supervisory Board and also on page 32.

184
R e p o r t o f S t i c h t i n g A d m i n i s t r a t i e k a n t o o r
F u g r o ( ‘ Tr u s t O f f i c e ’ )
In accordance with article 19 of the conditions of
administration for registered shares in the share capital
of Fugro N.V. (‘Fugro’) and best practice provision IV.2.6
of the Corporate Governance Code, the undersigned
issues the following report to the holders of certificates
of ordinary shares Fugro.
During the 2011 reporting year all the Trust Office’s
activities were related to the administration of ordinary
shares against which certificates have been issued.
During 2011 the Board met twice. The meeting of 6 April
2011 was dedicated, among other things, to the
preparation for the annual general meeting of Fugro on
10 May 2011. The meeting of 15 September 2011, after
the publication of Fugro’s half-yearly results, was
dedicated, among other things, to the composition of
the Board and to general business developments. It was
discussed also if it would be necessary or useful to
convene a meeting of holders of certificates. It was
decided that at the moment this was not the case. Prior
to both meetings the Board discussed with the Board of
Management and the Supervisory Board of Fugro the
activities and performance of Fugro on the basis of the
Annual Report 2010 and the Half-yearly report 2011
respectively. Corporate Governance within Fugro and
the Trust Office was also discussed in both meetings.
With great sorrow the Board took note that the chairman
of the Supervisory Board of Fugro, Mr. H.C. Scheffer,
untimely passed away on 20 September 2011.
At the end of September 2011 the Board was informed
that the Supervisory Board had requested the former
chairman, Mr. F.H. Schreve, to stand as candidate for the
position of chairman of the Supervisory Board till May
2013 and that the Supervisory Board intended to propose
the appointment of Mr. Schreve at an extraordinary
shareholders’ meeting that would be held on 14
December 2011. After careful consideration the Board
decided that it in principle would vote in favour of the
appointment of Mr. Schreve.
All the Trust Office’s Board members are independent of
Fugro. The Board may offer holders of certificates the
opportunity to recommend candidates for appointment
to the Board. The voting policy of the Trust Office has
been laid down in a document that can be found on the
website: www.fugro.com/corporate/admkantoor.asp.
The Trust Office is authorised to accept voting
instructions from holders of certificates and to cast
these votes during a general meeting of Fugro.
The Board attended the annual general meeting of Fugro
held on 10 May 2011 as well as the extraordinary general
meeting of shareholders held on 14 December 2011. In
the annual general meeting the Trust Office represented
42.5% of the votes cast and in the extraordinary general
meeting the Trust Office represented 41.9% of the votes
cast. The Trust Office voted in favour of all the proposals
submitted to both meetings. In accordance with the
terms of administration, holders of certificates were
offered the opportunity to vote, in accordance with their
own opinion, as authorised representatives of the Trust
Office. This opportunity was taken by 180 holders of
certificates, holding 38,068,411 certificates at the annual
general meeting and by 83 holders of certificates holding
39,883,942 certificates at the extraordinary general
meeting.
In accordance with the roster, on 30 June 2011
Mr. J.F. van Duyne stepped down as a member of the
Trust Office’s Board. The previous report of the Trust
Office stated that the Board intended reappointing
Mr. Van Duyne as a Board member for a period of four
years. In accordance with article 4.3 of the articles of
association, the Board offered holders of certificates
who represent at least 15% of the issued certificates the
opportunity to request, until 4 April 2011, that the Board
convenes a meeting of holders of certificates in order
to recommend a candidate to the Trust Office’s Board.
As no request for a meeting of holders of certificates was
submitted, in its meeting of 6 April 2011 the Board, in
accordance with its announced intention, reappointed
Mr. Van Duyne as a member of the Board for a period
of four years.

185Fugro Financial statements 2011
The activities related to the administration of the shares
are carried out by the administrator of the Trust Office:
Administratiekantoor van het Algemeen Administratie-
en Trustkantoor B.V. in Amsterdam, The Netherlands.
The Trust Office’s address is: Veurse Achterweg 10,
2264 SG Leidschendam, The Netherlands.
Leidschendam, 22 February 2012
The Board
In accordance with the roster, on 30 June 2012
Mr. R. van der Vlist will step down as a member
of the Trust Office’s Board. The Trust Office intends
reappointing Mr. Van der Vlist as a Board member for
a period of four years. In accordance with article 4.3 of
the articles of association, the Board offers holders of
certificates who represent at least 15% of the issued
certificates the opportunity to request, until 6 April
2012, that the Board convenes a meeting of holders
of certificates in order to recommend a candidate to
the Trust Office’s Board. The request should be
submitted in writing and should state the name and
address of the recommended candidate.
At present the Board of the Trust Office comprises:
1. R. van der Vlist, Chairman
2. L.P.E.M. van den Boom
3. J.F. van Duyne
4. J.A.W.M. van Rooijen
Mr. Van der Vlist was Company Secretary of N.V.
Koninklijke Nederlandsche Petroleum Maatschappij.
Mr. Van den Boom was a member of the Board of
Management of NIB Capital Bank N.V. and he is a
Senior Partner of PARK Corporate Finance.
Mr. Van Duyne was Chairman of the Board of
Management of Koninklijke Hoogovens N.V. and
afterwards joint Chief Executive Officer of Corus
Group PLC.
Mr. Van Rooijen was, amongst others, Chairman of
KPMG Corporate finance N.V. and member (CFO) of the
Board of Management of KPMG Holding N.V.
In 2011 the total remuneration of the members of
the Board amounted to EUR 31,000 and the total costs
of the Trust Office amounted to EUR 124,923.
On 31 December 2011, 75.544.435 ordinary shares
with a nominal value of EUR 0.05 were in administration
against which 75.544.435 certificates of ordinary shares
had been issued. During the financial year 195,936
certificates were exchanged into ordinary shares and
1,762,990 ordinary shares were exchanged into
certificates. A total number of 987,283 certificates
of ordinary shares were issued as a result of the stock
dividend.

186
H i s t o r i c r e v i e w
IFRS 2011
IFRS 2010
IFRS 2009
IFRS 2008
IFRS 2007
IFRS 2006
IFRS 2005
IFRS 2004
IFRS 2003
Dutch GAAP 2002
Dutch GAAP 2001
Dutch GAAP 2000
Dutch GAAP 1999
Dutch GAAP 1998
Dutch GAAP 1997
Dutch GAAP 1996
I n c o m e a n d e x p e n s e s (x EUR 1,000)
Revenue 2,577,765 2,280,391 2,052,988 2,154,474 1,802,730 1,434,319 1,160,615 1,008,008 822,372 945,899 909,817 712,934 546,760 578,207 482,096 375,276
Third party costs 994,037 765,587 624,413 722,321 604,855 503,096 405,701 364,644 273,372 328,401 331,685 250,132 176,067 197,258 172,346 123,337
Net revenue own services
(revenue less third party costs) 1,583,728 1,514,804 1,428,575 1,432,153 1,197,875 931,223 754,914 643,364 549,000 617,498 578,132 462,765 370,648 380,948 309,750 251,939
Results from operating activities (EBIT) 2) 349,330 351,479 367,422 385,732 324,813 211,567 144,070 104,236 63,272 111,873 98,470 73,697 61,805 61,669 46,195 25,911
EBITDA 580,988 561,083 551,130 535,178 439,590 295,948 218,833 177,453 124,056 158,814 142,039 113,269 98,334 97,926 75,781 49,371
Cash f low 526,928 489,757 456,773 438,902 337,106 226,130 176,093 125,802 80,480 119,161 105,301 85,596 77,233 74,057 60,670 39,479
Net result 2) 287,595 272,219 263,410 283,412 216,213 141,011 99,412 49,317 18,872 72,220 61,732 46,024 40,704 37,800 31,084 16,018
of which non-recurring items – – – – – – – – – – – – – – 3,630 –
B a l a n c e s h e e t (x EUR 1,000)
Property, plant and equipment 1,482,981 1,291,314 1,043,227 859,088 599,298 412,232 262,759 232,956 268,801 192,293 163,298 120,526 114,035 108,181 93,479 68,521
Investments 446,716 446,755 330,244 337,469 299,699 203,944 90,414 71,028 123,983 100,036 89,352 49,008 37,301 61,487 58,220 27,000
of which in acquisitions 125,802 2,931 9,882 14,423 8,666 21,041 10,057 2,296 70,888 24,852 11,196 3,686 9,257 6,081 5,763 1,724
Depreciation of property, plant and equipment 220,984 201,493 173,593 140,429 107,684 78,169 69,445 66,139 54,004 46,941 43,569 39,572 36,529 36,257 29,586 23,460
Net current assets 1) 624,017 253,186 140,301 56,060 171,347 150,733 222,485 (95,348) 114,852 129,071 (50,514) 92,269 15,066 7,170 6,308 11,571
Total assets 3,861,595 3,089,991 2,366,317 2,123,306 1,700,130 1,405,698 1,138,660 983,350 1,056,003 793,245 814,772 474,741 380,495 338,021 289,512 216,272
Provisions 4,215 5,204 6,240 13,155 16,278 13,888 398 1,075 584 12,706 8,056 6,746 10,573 8,894 7,805 4,447
Loans and borrowings 1,215,173 590,862 441,339 395,384 449,957 341,997 300,753 184,268 431,895 273,520 121,450 120,713 23,234 24,368 17,153 18,741
Equity attributable to owners of the company 1) 1,655,785 1,508,318 1,187,731 928,329 699,989 562,417 465,460 223,913 211,196 271,698 244,660 101,453 107,909 90,575 77,370 61,260
Key r a t i o s (in %) 2)
Results from operating activities (EBIT)/revenue 13.6 15.4 17.9 17.9 18.0 14.8 12.9 10.3 9.2 11.8 10.8 10.3 11.3 10.7 9.6 6.9
Profit/revenue 11.2 11.9 12.8 13.2 12.0 9.8 8.6 4.9 2.3 7.6 6.8 6.5 7.4 6.5 6.4 4.3
Profit/net revenue own services 18.2 18.0 18.4 19.8 18.0 15.1 13.2 7.7 8.3 11.7 10.7 9.9 11.0 9.9 10.0 6.4
Profit/capital and reserves 1) 22.3 22.3 24.9 34.8 34.3 27.4 28.8 22.7 17.6 27.4 35.7 45.4 41.0 45.0 44.8 28.5
Total equity/total assets 1) 43.4 49.3 50.7 44.1 41.6 40.2 41.3 23.2 20.2 34.6 30.4 22.1 29.3 27.9 27.7 28.9
Interest cover 10.6 29.0 47.8 13.9 13.1 10.9 7.2 3.7 2.2 6.1 7.8 8.1 13.1 12.1 10.4 –
D a t a p e r s h a r e (x EUR 1.–) 2) 4)
Equity attributable to owners of the Company 1) 20.34 18.79 15.08 12.12 9.94 8.08 6.76 3.60 3.48 4.57 4.17 2.10 2.29 1.91 1.65 1.36
Results from operating activities (EBIT) 3) 4.41 4.49 4.82 5.29 4.67 3.08 2.18 1.76 1.09 1.95 1.86 1.48 1.27 1.30 0.98 0.58
Cash f low 3) 6.65 6.25 5.99 6.01 4.84 3.29 2.67 2.12 1.39 2.08 1.98 1.72 1.59 1.56 1.29 0.88
Net result 3) 3.63 3.47 3.46 3.88 3.11 2.05 1.51 0.83 0.33 1.26 1.16 0.92 0.84 0.80 0.66 0.36
Dividend paid in year under review 1.50 1.50 1.50 1.25 0.83 0.60 0.48 0.48 0.46 0.46 0.40 0.34 0.31 0.28 0.25 0.17
S h a r e p r i c e (x EUR 1.–) 4)
Year-end share price 44.895 61.50 40.26 20.485 52.80 36.20 27.13 15.35 10.20 10.78 12.53 17.19 9.23 4.99 7.01 3.48
Highest share price 63.53 62.06 41.85 59.95 62.00 36.64 27.40 16.41 12.86 16.50 18.91 17.81 9.98 10.99 8.28 3.71
Lowest share price 34.47 37.095 19.085 19.32 34.91 27.13 15.14 10.05 6.13 9.88 10.75 9.31 4.10 4.06 3.44 1.93
N u m b e r o f e m p l oy e e s
At year-end 13,876 13,463 13,482 13,627 11,472 9,837 8,534 7,615 8,472 6,923 6,953 5,756 5,114 5,136 4,429 4,222
S h a r e s i n i s s u e (x 1,000) 4)
Of nominal EUR 0.05 at year-end 81,393 80,270 78,772 76,608 70,421 69,582 68,825 62,192 60,664 59,449 58,679 51,048 50,449 48,682 47,673 46,053
1) As of 2002 no accrued dividend has been incorporated.
2) For 2002 and earlier years, before amortisation of goodwill.

187Fugro Financial statements 2011
IFRS 2011
IFRS 2010
IFRS 2009
IFRS 2008
IFRS 2007
IFRS 2006
IFRS 2005
IFRS 2004
IFRS 2003
Dutch GAAP 2002
Dutch GAAP 2001
Dutch GAAP 2000
Dutch GAAP 1999
Dutch GAAP 1998
Dutch GAAP 1997
Dutch GAAP 1996
I n c o m e a n d e x p e n s e s (x EUR 1,000)
Revenue 2,577,765 2,280,391 2,052,988 2,154,474 1,802,730 1,434,319 1,160,615 1,008,008 822,372 945,899 909,817 712,934 546,760 578,207 482,096 375,276
Third party costs 994,037 765,587 624,413 722,321 604,855 503,096 405,701 364,644 273,372 328,401 331,685 250,132 176,067 197,258 172,346 123,337
Net revenue own services
(revenue less third party costs) 1,583,728 1,514,804 1,428,575 1,432,153 1,197,875 931,223 754,914 643,364 549,000 617,498 578,132 462,765 370,648 380,948 309,750 251,939
Results from operating activities (EBIT) 2) 349,330 351,479 367,422 385,732 324,813 211,567 144,070 104,236 63,272 111,873 98,470 73,697 61,805 61,669 46,195 25,911
EBITDA 580,988 561,083 551,130 535,178 439,590 295,948 218,833 177,453 124,056 158,814 142,039 113,269 98,334 97,926 75,781 49,371
Cash f low 526,928 489,757 456,773 438,902 337,106 226,130 176,093 125,802 80,480 119,161 105,301 85,596 77,233 74,057 60,670 39,479
Net result 2) 287,595 272,219 263,410 283,412 216,213 141,011 99,412 49,317 18,872 72,220 61,732 46,024 40,704 37,800 31,084 16,018
of which non-recurring items – – – – – – – – – – – – – – 3,630 –
B a l a n c e s h e e t (x EUR 1,000)
Property, plant and equipment 1,482,981 1,291,314 1,043,227 859,088 599,298 412,232 262,759 232,956 268,801 192,293 163,298 120,526 114,035 108,181 93,479 68,521
Investments 446,716 446,755 330,244 337,469 299,699 203,944 90,414 71,028 123,983 100,036 89,352 49,008 37,301 61,487 58,220 27,000
of which in acquisitions 125,802 2,931 9,882 14,423 8,666 21,041 10,057 2,296 70,888 24,852 11,196 3,686 9,257 6,081 5,763 1,724
Depreciation of property, plant and equipment 220,984 201,493 173,593 140,429 107,684 78,169 69,445 66,139 54,004 46,941 43,569 39,572 36,529 36,257 29,586 23,460
Net current assets 1) 624,017 253,186 140,301 56,060 171,347 150,733 222,485 (95,348) 114,852 129,071 (50,514) 92,269 15,066 7,170 6,308 11,571
Total assets 3,861,595 3,089,991 2,366,317 2,123,306 1,700,130 1,405,698 1,138,660 983,350 1,056,003 793,245 814,772 474,741 380,495 338,021 289,512 216,272
Provisions 4,215 5,204 6,240 13,155 16,278 13,888 398 1,075 584 12,706 8,056 6,746 10,573 8,894 7,805 4,447
Loans and borrowings 1,215,173 590,862 441,339 395,384 449,957 341,997 300,753 184,268 431,895 273,520 121,450 120,713 23,234 24,368 17,153 18,741
Equity attributable to owners of the company 1) 1,655,785 1,508,318 1,187,731 928,329 699,989 562,417 465,460 223,913 211,196 271,698 244,660 101,453 107,909 90,575 77,370 61,260
Key r a t i o s (in %) 2)
Results from operating activities (EBIT)/revenue 13.6 15.4 17.9 17.9 18.0 14.8 12.9 10.3 9.2 11.8 10.8 10.3 11.3 10.7 9.6 6.9
Profit/revenue 11.2 11.9 12.8 13.2 12.0 9.8 8.6 4.9 2.3 7.6 6.8 6.5 7.4 6.5 6.4 4.3
Profit/net revenue own services 18.2 18.0 18.4 19.8 18.0 15.1 13.2 7.7 8.3 11.7 10.7 9.9 11.0 9.9 10.0 6.4
Profit/capital and reserves 1) 22.3 22.3 24.9 34.8 34.3 27.4 28.8 22.7 17.6 27.4 35.7 45.4 41.0 45.0 44.8 28.5
Total equity/total assets 1) 43.4 49.3 50.7 44.1 41.6 40.2 41.3 23.2 20.2 34.6 30.4 22.1 29.3 27.9 27.7 28.9
Interest cover 10.6 29.0 47.8 13.9 13.1 10.9 7.2 3.7 2.2 6.1 7.8 8.1 13.1 12.1 10.4 –
D a t a p e r s h a r e (x EUR 1.–) 2) 4)
Equity attributable to owners of the Company 1) 20.34 18.79 15.08 12.12 9.94 8.08 6.76 3.60 3.48 4.57 4.17 2.10 2.29 1.91 1.65 1.36
Results from operating activities (EBIT) 3) 4.41 4.49 4.82 5.29 4.67 3.08 2.18 1.76 1.09 1.95 1.86 1.48 1.27 1.30 0.98 0.58
Cash f low 3) 6.65 6.25 5.99 6.01 4.84 3.29 2.67 2.12 1.39 2.08 1.98 1.72 1.59 1.56 1.29 0.88
Net result 3) 3.63 3.47 3.46 3.88 3.11 2.05 1.51 0.83 0.33 1.26 1.16 0.92 0.84 0.80 0.66 0.36
Dividend paid in year under review 1.50 1.50 1.50 1.25 0.83 0.60 0.48 0.48 0.46 0.46 0.40 0.34 0.31 0.28 0.25 0.17
S h a r e p r i c e (x EUR 1.–) 4)
Year-end share price 44.895 61.50 40.26 20.485 52.80 36.20 27.13 15.35 10.20 10.78 12.53 17.19 9.23 4.99 7.01 3.48
Highest share price 63.53 62.06 41.85 59.95 62.00 36.64 27.40 16.41 12.86 16.50 18.91 17.81 9.98 10.99 8.28 3.71
Lowest share price 34.47 37.095 19.085 19.32 34.91 27.13 15.14 10.05 6.13 9.88 10.75 9.31 4.10 4.06 3.44 1.93
N u m b e r o f e m p l oy e e s
At year-end 13,876 13,463 13,482 13,627 11,472 9,837 8,534 7,615 8,472 6,923 6,953 5,756 5,114 5,136 4,429 4,222
S h a r e s i n i s s u e (x 1,000) 4)
Of nominal EUR 0.05 at year-end 81,393 80,270 78,772 76,608 70,421 69,582 68,825 62,192 60,664 59,449 58,679 51,048 50,449 48,682 47,673 46,053
1) As of 2002 no accrued dividend has been incorporated.
2) For 2002 and earlier years, before amortisation of goodwill.
3) Unlike preceding years the figures as from the year 1999 have been calculated based upon the weighted average number of outstanding shares.
4) As a result of the share split (4:1) in 2005, the historical figures have been restated.

188
G l o s s a r y
Te c h n i c a l t e r m s
2-D Seismic: Acoustic measuring technology which uses single vessel-towed
hydrophone streamers. This technique generates a 2-D cross-Article of the deep seabed
and is used primarily when initially reconnoitring for the presence of oil or gas
reservoirs.
3-D Seismic: Acoustic measuring technology which uses multiple vessel-towed long
hydrophone stre amers. This technique generates a 3-D model of the deep seabed and is
used to locate and analyse oil and gas reservoirs.
AUV (Autonomous Underwater Vehicle): An unmanned submersible launched
from a ‘mother-vessel’ but not connected to it via a cable. Propulsion and control are
autonomous and use pre-defi ned mission protocols.
Construction Support: Offshore services related to the installation and construction
of structures such as pipelines, drilling platforms and other oil and gas related
infrastructure, usually involving the use of ROVs.
DGPS (Differential Global Positioning System): A GPS based positioning system
using territorial reference points to enhance accuracy.
EM: Electromagnetic.
Gas hydrates: mixture of semi-solid methane gas and water molecules that are created
by water pressure and cold temperatures found deep in the ocean.
Geophysics: The mapping of subterranean soil characteristics using non-invasive
techniques such as sound.
Geoscience: A range of scientifi c disciplines (geology, geophysics, petroleum
engineering, bio stratifi cation, geochemistry, etc.) related to the study of rocks, fossils
and fl uids.
Geotechnics: The determination of subterranean soil characteristics using invasive
techniques such as probing, drilling and sampling.
Glonass: Global Navigation Satellite System.
GPS: Global Positioning System.
Gravity: Precision gravity measurements to detect geological and other anomalies.
LiDAR: a measuring system based on laser technology that can make extremely
accurate recordings from an aircraft.
LNG: Liquifi ed Natural Gas
Multi client data: Data collected at own risk and expense and sold to several clients.
RoqSCAN: RoqSCAN is a fully portable, automated, quantitative rock properties/
mineralogical analyser which has been developed exclusively by Fugro and Carl Zeiss for
use at the oil and gas well site.
ROV (Remotely Operated Vehicle): Unmanned submersible launched from a vessel
and equipped with measuring and manipulation equipment. A cable to the mother-
vessel provides power, video and data communication.
Seismic: Acoustic measurement of seabed characteristics and stratifi cation with the
objective of detecting oil and gas. These measurements are conducted using specialised
vessels equipped with powerful acoustic energy sources and long receiving streamers
(hydrophones) to measure (sub) seabed acoustic echoes.
Starfi x: DGPS positioning system, specifi cally for use offshore. This system is intended
for the professional user and, in addition to a high degree of accuracy, is equipped with
a wide range of data analysis and quality control possibilities.
WTI: West Texas Intermediate is a crude oil benchmark.
F i n a n c i a l t e r m s
Cash fl ow: The profi t for the period attributable to equity holders of the company plus
depreciation, amortisation of intangible fi xed assets and minority interest.
Dividend yield: Dividend as a percentage of the (average) share price.
EBIT: Result from operating activities.
EBITDA: Result from operating activities before depreciation and amortisation.
Gearing: Loans and borrowings plus bank overdraft minus cash and cash equivalents,
divided by shareholders equity.
Interest cover: Result from operating activities (EBIT) compared with the net interest
charges.
Invested capital: The capital made available to the Company, i.e. Group equity plus
the available loans and the balance of current account deposits/withdrawals.
Net profi t margin: profi t as a percentage of Revenue.
Pay-out ratio of the net result: The pay-out ratio of the net result is defi ned as
proposed dividend, multiplied by the number of shares entitled to dividend, divided by
one thousand, divided by the net result.
Private Placement: Long-term fi nancing (7 – 15 years), entered into in May 2002
and in August 2011 via private placements with American and British institutional
investors.
Return on invested capital: EBIT divided by the average of the current and previous
year of total assets less current liabilities.
Solvency: Shareholders’ equity as a percentage of the balance sheet total.

Fugro N.V.
Veurse Achterweg 10
2264 SG Leidschendam
P.O. Box 41
2260 AA Leidschendam
The Netherlands
T +31 (0)70 3111422
F +31 (0)70 3202703
www.fugro.com
Commercial Register The Hague
Trade Registry no 27120091
VAT no 00 56 21 409 B01
C o l o p h o n
Fugro N.V.
Veurse Achterweg 10
2264 SG Leidschendam
The Netherlands
T +31 (0)70 3111422
F +31 (0)70 3202703
Realisation:
C&F Report Amsterdam B.V.
Photography and images:
Fugro N.V.
Fugro has endeavoured to fulfil all legal requirements
related to copyright. Anyone who, despite this, is of
the opinion that other copyright regulations could
be applicable should contact Fugro.
A Dutch translation of this annual report is
available. In matters of any misinterpretation
the official English annual report will prevail.
This annual report is also available on www.fugro.com.
Cautionary statement regarding forward-looking statements
This annual report may contain forward-looking statements. Forward-looking statements are statements that are not historical facts, including
(but not limited to) statements expressing or implying Fugro’s beliefs, expectations, intentions, forecasts, estimates or predictions (and the
assumptions underlying them). Forward-looking statements necessarily involve risks and uncertainties. The actual future results and situations
may therefore differ materially from those expressed or implied in any forward-looking statements. Such differences may be caused by various
factors (including, but not limited to, developments in the oil and gas industry and related markets, currency risks and unexpected operational
setbacks). Any forward-looking statements contained in this annual report are based on information currently available to Fugro’s management.
Fugro assumes no obligation to make a public announcement in each case where there are changes in information related to, or if there are
otherwise changes or developments in respect of, the forward-looking statements in this annual report.

GEOTECHNIEK
MILIEU ONDERZOEK
MARINER
AN
NU
AL
RE
PO
RT
20
11
FU
GR
O N
.V.
Annua l Re p o r t 2011FUGRO N .V.
50 yEARs FUGROF r o m s m a l l D u t c h
e n g i n e e r i n g c o m p a ny
t o g l o b a l p l a y e r !