annual report 2012 - hba.gr
TRANSCRIPT

201220122012201220122012201220122012201220122012
EURO
PEAN
CEN
TRAL
BAN
K AN
NUAL
REP
ORT
EN
ANNUAL REPORT2012
2012

annual report2012
In 2013 all ECB publications
feature a motif taken from
the €5 banknote.

© European Central Bank, 2013
AddressKaiserstrasse 2960311 Frankfurt am MainGermany
Postal addressPostfach 16 03 1960066 Frankfurt am MainGermany
Telephone +49 69 1344 0
Websitehttp://www.ecb.europa.eu
Fax +49 69 1344 6000
All rights reserved. Reproduction for educational and non-commercial purposes is permitted provided that the source is acknowledged.
Photographs:Andreas BöttcherRobert Metsch
The cut-off date for the data included in this report was 1 March 2013.
ISSN 1561-4573 (print)ISSN 1725-2865 (epub)ISSN 1725-2865 (online)EU catalogue number QB-AA-13-001-EN-C (print)EU catalogue number QB-AA-13-001-EN-E (epub)EU catalogue number QB-AA-13-001-EN-N (online)

3ECB
Annual Report2012
ContentSForeword 7
Chapter 1eConomiC developmentS and monetary poliCy 13
i monetary poliCy deCiSionS 13
2 monetary, FinanCial and eConomiC developmentS 16
2.1 The global macroeconomic environment 16 Box 1 Why the recent slowdown in global trade? 182.2 Monetaryandfinancialdevelopments 26 Box 2 The impact of non-standard measures decided upon on 8 December 2011 32 Box 3 Trendsineuroarealong-terminflationexpectations 392.3 Price and cost developments 48 Box 4 TheimpactofindirecttaxesonHICPinflationin 2012 502.4 Output, demand and labour market developments 55 Box 5 The rebalancing process within the euro area 582.5 Fiscal developments 63
3 eConomiC and monetary developmentS in non-euro area eu member StateS 69
Chapter 2Central banK operationS and aCtivitieS 79
1 monetary poliCy operationS, ForeiGn eXChanGe operationS and inveStment aCtivitieS 79
1.1 Monetary policy operations 791.2 Foreign exchange operations and operations with other central banks 871.3 Investment activities 88
2 payment and SeCuritieS Settlement SyStemS 90
2.1 The TARGET2 system 902.2 TARGET2-Securities 922.3 Settlement procedures for cross-border collateral 93
3 banKnoteS and CoinS 94
3.1 The circulation of banknotes and coins 943.2 Banknote counterfeiting and counterfeit deterrence 963.3 Banknote production and issuance 97
4 StatiStiCS 99
4.1 New and enhanced euro area statistics 994.2 Other statistical developments 99
5 eConomiC reSearCh 101
5.1 Research priorities and achievements 1015.2 Dissemination of research: publications and conferences 102

4ECB Annual Report2012
6 other taSKS and aCtivitieS 103
6.1 Compliancewiththeprohibitionofmonetaryfinancingandprivilegedaccess 1036.2 Advisory functions 1036.3 Administration of borrowing and lending operations 1086.4 Eurosystem reserve management services 109
Chapter 3FinanCial Stability, taSKS related to the eSrb, and FinanCial inteGration 111
1 FinanCial Stability 111
1.1 Financial stability monitoring 1111.2 Financial stability arrangements 113
2 taSKS ConCerninG the FunCtioninG oF the european SyStemiC riSK board 116
2.1 Institutional framework 1162.2 Analytical, statistical, logistical and organisational support to the ESRB 116
3 FinanCial reGulation and SuperviSion 119
3.1 Banking 1193.2 Securities 1203.3 Accounting 121
4 FinanCial inteGration 122
5 overSiGht oF payment SyStemS and marKet inFraStruCtureS 126
5.1 Large-value payment systems and infrastructure service providers 1275.2 Retail payment systems and payment instruments 1295.3 Securities and derivatives clearing and settlement 130
Chapter 4european iSSueS 133
1 poliCy and inStitutional iSSueS 133
2 developmentS in and relationS with eu aCCedinG and Candidate CountrieS 137
Chapter 5international iSSueS 141
1 Key developmentS in the international monetary and FinanCial SyStem 141
2 Cooperation with CountrieS outSide the eu 143
Chapter 6eXternal CommuniCation and aCCountability 147
1 aCCountability and CommuniCation poliCy 147

5ECB
Annual Report2012
2 aCCountability to the european parliament 148
3 CommuniCation aCtivitieS 149
Chapter 7inStitutional FrameworK and orGaniSation 155
1 deCiSion-maKinG bodieS and Corporate GovernanCe oF the eCb 155
1.1 The Eurosystem and the European System of Central Banks 1551.2 The Governing Council 1561.3 The Executive Board 1581.4 The General Council 1591.5 Eurosystem/ESCB committees, the Budget Committee, the Human Resources
Conference and the Eurosystem IT Steering Committee 1611.6 Corporate governance 162
2 orGaniSational developmentS 167
2.1 Human resources management 1672.2 Staff relations and social dialogue 1682.3 ESCB Social Dialogue 1692.4 TheEurosystemProcurementCoordinationOffice 1692.5 New ECB premises 1702.6 Environmental issues 1712.7 Information technology service management 171
annual aCCountS
Management report for the year ending 31 December 2012 173Balance Sheet as at 31 December 2012 180ProfitandLossAccountfortheyearending31December2012 182Accounting policies 183Notes on the Balance Sheet 189NotesontheProfitandLossAccount 205Auditor’s report 209Noteonprofitdistribution/allocationoflosses 210Consolidated Balance Sheet of the Eurosystem as at 31 December 2012 212
anneXeS
1 leGal inStrumentS adopted by the eCb 2152 ChronoloGy oF monetary poliCy meaSureS oF the euroSyStem 2243 overview oF the eCb’S CommuniCation related to the proviSion oF liquidity 2264 publiCationS produCed by the eCb 2285 GloSSary 229

6ECB Annual Report2012
CountrieS otherS
BE Belgium BIS Bank for International Settlements BG Bulgaria CPI Consumer Price Index CZ Czech Republic EBA European Banking Authority DK Denmark ECB European Central Bank DE Germany EEA European Economic Area EE Estonia EIOPA European Insurance and Occupational IE Ireland Pensions Authority GR Greece EMU Economic and Monetary Union ES Spain ESA 95 European System of Accounts 1995 FR France ESCB European System of Central Banks IT Italy ESMA European Securities and Markets CY Cyprus Authority LV Latvia EU European Union LT Lithuania EUR euro LU Luxembourg GDP gross domestic product HU Hungary HICP Harmonised Index of Consumer Prices MT Malta ILO International Labour Organization NL Netherlands IMF International Monetary Fund AT Austria MFI monetaryfinancialinstitutionPL Poland NCB national central bankPT Portugal OECD Organisation for Economic RO Romania Co-operation and Development SI Slovenia PPI Producer Price Index SK Slovakia FI Finland In accordance with EU practice, the EU Member SE Sweden States are listed in this report using the UK United Kingdom alphabetical order of the country names in the JP Japan national languages. US United States
Unless stated otherwise, all references in this report to Treaty article numbers reflect the numbering in effect since the Treaty of Lisbon entered into force on 1 December 2009.
abbreviationS

7ECB
Annual Report2012
In an environment of contracting economic activityandvolatilefinancialconditionsbroughtabout by the financial and sovereign debtcrisis, 2012 was another challenging year for the conduct of monetary policy. Nevertheless, the credibility of the ECB’s monetary policy remained high, as reflected by the continuedfirm anchoring of medium to longer-terminflationexpectationsinlinewiththeGoverningCouncil’saimofkeepinginflationratesbelow,but close to, 2% over the medium term.
Real economic activity in the euro area declined in 2012, mainly on account of weak investment and private consumption. This development reflected weak economic confidence,heightened uncertainty and the ongoing process of balance sheet adjustment in the financialand non-financial sectors, combinedwith highunemployment, a tighter fiscal stance andsubdued foreign demand. Annual inflationremained at elevated levels in 2012 despite the unfavourable macroeconomic environment, although it declined in the course of the year.
The level of inflation largely reflected strong rises in energy prices and increases in indirecttaxes and administered prices in a number of euro area countries. On average, inflation stoodat 2.5% in 2012, after 2.7% in 2011. The underlying pace of monetary expansion was subdued throughout 2012.Given the easing of inflationary pressures over the policy-relevant horizononaccount of the materialisation of some downside risks to economic growth, the Governing Council decided in July 2012 to lower the key ECB interest rates by 25 basis points.
Financial market tensions were at elevated levels at the beginning of the year. The funding stress in interbank money markets subsequently subsided somewhat, not least in the context of the strong participation of banks in two three-year longer-term refinancing operations launchedinDecember2011andFebruary2012.Theseoperations, likeall refinancingoperations in2012,were conducted with full allotment, helping to forestall a curtailment of credit to the real economy. In addition, the Eurosystem took further measures to preserve and increase collateral availability for counterparties, such as accepting certain additional credit claims as collateral and broadening the eligibility criteria for some types of asset-backed security. In combination, these measures have improved the availability of collateral in the euro area.
Thereintensificationoftheeuroareasovereigndebtcrisisinthefirsthalfof2012revealedaclearneedforcountriestobetterandmorecloselycoordinatetheireconomic,fiscalandfinancialpoliciesto avoid unsustainable developments in individual countries jeopardising the smooth functioning of EMU. A number of important initiatives were taken in 2012 with a view to strengthening EMU.
The Treaty on Stability, Coordination and Governance in the Economic and Monetary Union (alsoknownas thefiscalcompact),whichwassigned inMarch2012,wassubsequently ratifiedin 12 euro area countries and entered into force on 1 January 2013. This Treaty aims to strengthen
Foreword

8ECB Annual Report2012
theexistingfiscalframework,notablythroughtheanchoringinnationallegislationofastructuralbalanced budget rule. Deviations from the rule and, most importantly, the cumulated impact on government debt will be corrected automatically. If effectively implemented and enforced, the new rulewillhelptoputpublicfinancesbackonasustainablepath.
In May 2012 the euro area Heads of State or Government invited the Presidents of the European Council, the European Commission, the Eurogroup and the ECB to develop proposals on how to further strengthen Economic Union to make it fully commensurate with the requirements of Monetary Union. Important decisions were taken during the remainder of 2012 on the basis of these proposals, with the decision to establish a single supervisory mechanism (SSM) centred at the ECB beingoneofthemostsignificant.Importantinitiatives–whichwillrequirefurtherworkin2013–were launched, including the establishment of a single resolution mechanism for banks and new contractual arrangements for competitiveness and growth to promote structural reforms, intra-euro area competitiveness and thereby the resilience of the euro area.
Conditions in financialmarkets worsened again towards themiddle of 2012, in part indicatingunwarranted fears on the part of some investors about the reversibility of the euro. To safeguard the monetary policy transmission mechanism and the singleness of the monetary policy, the Governing Council in August announced its readiness to undertake Outright Monetary Transactions, with further details provided in September. The adherence of governments to their commitments and thefulfilmentbytheEuropeanFinancialStabilityFacility/EuropeanStabilityMechanismoftheirrole are necessary conditions for such transactions to be conducted and to be effective. If such conditions are fulfilled, the Eurosystem could consider purchasing sovereign debt securities insecondary markets, provided that it assesses monetary policy transmission to be severely disrupted. While no such purchases have been made so far, following this announcement and government actionstoaddressfiscalimbalancesandcurrentaccountdeficits,financialmarkettensionsgraduallysubsided.Agradualreductioninthefragmentationoffinancialmarketscontributedtoasomewhatmore homogeneous transmission of monetary policy to the real economy, although fragmentation remains a policy challenge.
Turningtofinancialstabilitydevelopments,theriskstothestabilityoftheeuroareafinancialsystemincreasedconsiderably in thefirst half of2012.After a relatively calmfirst quarterof theyear,a resurgence of sovereign bond market tensions in some euro area countries led to renewed stress ontheeuroareafinancialsystem.Suchstresseasedtangiblyafterthesummerinthecontextofthegeneraleasingoffinancialmarkettensions.Inthesecondhalfoftheyeartherewerefewersignsoffinancialstress,buttheeuroareafinancialstabilityenvironmentcontinuedtobefragile.Thekeyelement of fragility remained the potential renewed worsening of negative feedback loops among systemicriskfactorsstemmingfromimbalancesandvulnerabilitiesinthefiscal,macroeconomicandfinancialdomains.
The agreement on establishing an SSM reached by the ECOFIN Council in December 2012 constituted amilestoneinEuropeanfinancialintegrationbyelevatingtheresponsibilityforbankingsupervisionto the European level. The Council regulation proposed by the European Commission at the year-end established that the ECB would be the supervisor for all banks in countries participating in the SSM, with direct supervisory powers over large, systemically important banks. At the same time, the ECB and the national supervisors will act as a single system, in line with the conviction that a single banking supervision system is a key element of Monetary Union.

9ECB
Annual Report2012
Along with the strengthened regulatory framework for the banking sector, the envisaged banking union comprises, in addition to bank supervision, a single resolution mechanism with a common backstopshouldtemporaryfiscalsupportbeneeded.Theassemblyofthesebuildingblockswillbeinstrumental inaddressingspecificrisks tofinancialsystemstability,notablystemmingfromthelink between banking sector and sovereign sector fragilities, as well as in reversing the process of financialmarketfragmentation.
2012 was the second year of existence of the European Systemic Risk Board (ESRB), the EU bodyresponsibleforthemacro-prudentialoversightoftheEUfinancialsystem.TheECBensuresthe Secretariat of the ESRB and provides the ESRB with analytical, statistical, logistical and administrative support. In its second year, the ESRB continued to have regular exchanges of views onsystemic risks to theEUfinancial systemandbegan topublish its“riskdashboard”,a setofquantitative andqualitative indicators to identify andmeasure systemic risk in theEUfinancialsystem. In 2012 the ESRB also adopted two recommendations, one on ways to mitigate risks encountered by banks in their funding activities and the other on strengthening the regulatory framework for money market funds in the EU. The ESRB also worked on the implementation of therecommendationsissuedinthepreviousyear,onthebasisofthe“actorexplain”mechanism. AsanindependentEUbody,theESRBcontinuedtofulfilitsaccountabilityobligationsvis-à-vistheEuropean Parliament through its Annual Report, regular hearings of the Chair of the ESRB before theCommitteeonEconomicandMonetaryAffairsof theEuropeanParliament andconfidentialoral discussions between the ESRB Chair and the Chair and Vice-Chairs of the above-mentioned committee.
Intheareaofpaymentsystemsandfinancialmarketinfrastructures,theECBcontinuedtocontributeto the key policy and regulatory initiatives aimed at enhancing the stability of market infrastructures, including legislative initiatives at the EU level. The ECB also contributed to the work of the Committee on Payment and Settlement Systems and the International Organization of Securities Commissions, in particular with respect to the Principles for Financial Market Infrastructures and the resolution and recovery of such infrastructures, aswell as towork in the field of over-the-counter derivativesmarket infrastructure. Furthermore, in thefield of retail payments oversight,theEurosystemdefinedoversightexpectationsforlinksbetweenretailpaymentsystems,andtheForum on the Security of Retail Payments developed security requirements for payments over the internet.
The ECB also continued to facilitate the creation of an integrated European retail payments market. The “End-dateRegulation” of 14March 2012 constitutes amajor step in this regard, setting adeadline of 1 February 2014 for completing the migration to the Single Euro Payments Area. In the fieldofcentralbankservices,theEurosystemoperatesthelarge-valuepaymentsystemTARGET2.The single platform of TARGET2 facilitates the real-time gross settlement of transactions in euro andenables24EUcentralbanksandtheirrespectiveusercommunitiestobenefitfromthesamecomprehensive and advanced services.
An important milestone in the TARGET2-Securities (T2S) project was reached in 2012, as 22 European central securities depositories (CSDs) signed the Framework Agreement and Danmarks Nationalbank signed the Currency Participation Agreement. The CSDs that have signed T2S legal agreements account for almost 100% of current euro settlement volumes. This demonstrates the reinforced commitment of the T2S community to the completion of the project. Substantial progress was achieved in completing the development of the core functions of the T2S application, and T2S

10ECB Annual Report2012
continued to play a pivotal role in fostering harmonisation in the post-trade area. In May 2012 the ECOFINCouncilconfirmeditssupportforT2Sasanimportantcontributortotheestablishmentofa single market for securities services.
Turning to organisational issues, the ECB had 1,450.5 full-time equivalent permanent positions at the end of 2012, compared with 1,440.5 positions at the end of 2011. The increase was mainly drivenbytheincreasedbusinessrequirementsresultingfromthefinancialcrisis.Themembersofstaff of the ECB come from all 27 EU Member States and are recruited by means of open selection campaignstofillvacanciespublishedontheECB’swebsite.InaccordancewiththeECB’smobilitypolicy, 225 members of staff moved internally to other positions in 2012, while 14 members of staff were seconded to other organisations for external work experience and 41 were granted unpaid leave to study or take up employment with another organisation, or for personal reasons. The ECB’s human resources framework continued to focus on the ongoing acquisition and development of skills and competencies by all members of staff. The main developments in the area of human resources policies included the introduction of a pilot mentoring programme and the setting-up of a career transition support pilot programme.
Construction work on the new ECB premises progressed in 2012 and included the mounting of the facadepanelsonthedoubleofficetower,therenovationoftheGrossmarkthallefacades,andthestartoftheinstallationofthetechnicalinfrastructureandthefit-outworks.On20September2012theECB held the topping out ceremony for its new premises. Completion of the new premises is expected in 2014.
Regarding its financial accounts, the ECB earned a surplus of €2.16 billion in 2012, comparedwith a surplus of €1.89 billion in 2011. The Governing Council decided to transfer, as at 31 December 2012, an amount of €1.17 billion to the provision for foreign exchange rate, interest rate, credit and gold price risks, thereby increasing it to its ceiling of €7.53 billion, which was the value of the ECB’s capital paid up by the euro area NCBs as at that date. The size of this provision is reviewed annually. The ECB’s net profit for 2012, following the transfer to the provision, was €998 million. This amount was distributed to the euro area NCBs in proportion to their paid-up shares in the ECB’s capital.
Frankfurt am Main, March 2013
Mario Draghi


The restoration of the Grossmarkthalle (Frankfurt’s former wholesale market hall) is one of the remarkable elements of the construction works for the ECB’s new premises. The former splendour of the facades and concrete shell roof structure is slowly being restored, evoking again the vision of its architect, Martin Elsaesser.
Much progress has been made on the restoration of the Grossmarkthalle’s facades. By the end of 2012 the brickwork of the wingbuildingshadbeencleanedandrepointed,new,considerablymoreenergy-efficientwindowshadbeenfittedandthemarkethall’sconcretegridfacadehadbeenrestored.Aseachfloorofthewingbuildingswasfittedwiththenewwindows,work began on the installation of the technical infrastructure.

13ECB
Annual Report2012
Chapter 1
eConomiC developmentS and monetary poliCy
i monetary poliCy deCiSionSa very ChallenGinG environment For monetary poliCyIn 2012 the Eurosystem once again conducted its monetary policy in a very challenging environment. The lingering sovereign debt crisis in several euro area countries and a perceived lack of determination on the part of governments to address the root causes of this crisis continued to have anadverse impactoneconomicconfidence,financialmarketsentimentandfinancingconditions.The level of stress in financialmarkets varied over the course of 2012,with some governmentbond markets being particularly affected by high risk premia which became excessive towards the middleoftheyear,reflecting,amongotherfactors,unfoundedfearsofthereversibilityoftheeuro.These tensions added to the funding stress already being experienced in the banking sector, with somebankshavingnoaccess to interbankandotherfinancialmarkets.Thisexertedpressureonbanks to tighten their credit standards and to further deleverage, thereby risking a curtailment of the provisionofcredittotherealeconomy.Overall,financialmarketscontinuedtobehighlysegmentedalongnationalbordersandfinancialconditionsdisplayedsignificantheterogeneityacrosseuroareacountries.
Weak economic confidence, rising commodity prices and the ongoing process of balance sheetadjustmentinthefinancialandnon-financialsectorscombinedwithhighunemployment,atighterfiscalstanceandsubduedforeigndemanddampenedeconomicactivity in theeuroareain2012. As a result, GDP declined by 0.5% for the year as a whole, following two years of moderate positive growth.Reflecting particularly negative developments in domestic demand, euro area realGDPcontractedfromthesecondquarterof2012onwards,followingstagnationinthefirstquarter.
HICP inflation stood at elevated levels above 2% throughout 2012, declining from 2.7% at thebeginning of the year to 2.2% in November and December. The average rate for the year as a whole was 2.5%, which was only slightly lower than the rate of 2.7% registered in 2011. Persistently elevatedinflationin2012mainlyreflectedhighenergypricesandincreasesinindirecttaxesowingtotheongoingneedforfiscalconsolidation.Mediumandlong-terminflationexpectationsremainedfirmlyanchoredat levelsconsistentwith theGoverningCouncil’saimofkeeping inflation ratesbelow, but close to, 2% in the medium term.
M3 growth overall strengthened moderately in the course of 2012, reaching an annual average rate of 3.1%, as compared with the low growth rate of 1.5% recorded in 2011. By contrast, the annual growth rate of loans to the private sector turned negative over the course of 2012, in particular onthebackofnetredemptionsofloanstonon-financialcorporations.Toalargeextent,subduedloandynamicsreflectedtheweakeconomicsituationandoutlook,heightenedriskaversionandtheongoing adjustment in the balance sheets of households and enterprises, all of which weighed on credit demand. Furthermore, in a number of euro area countries, capital constraints, risk perception andthesegmentationoffinancialmarketsrestrictedcreditsupply.
Against the background of the monetary policy measures adopted, the Governing Council considered throughout the year that price developments remained in line with price stability over the policy-relevant horizon in an environment of weak economic growth, well-anchored medium-terminflationexpectationsandsubduedmonetarydynamics.Riskstotheoutlookforpricestability were seen as broadly balanced.

14ECBAnnual Report2012
diminiShed domeStiC inFlationary preSSureS related to weaK aCtivity led to a Further Cut in Key eCb intereSt rateSTo mitigate the adverse impact of financialmarket tensions on economic and monetary developments, the Governing Council cut the key ECB interest rates by 25 basis points in July. This decision took account of the fact that inflationarypressureshadbeenfurtherdampenedas some of the previously identified downsiderisks to economic activity materialised. Policy rates were kept at their historically low level of0.75%forthemainrefinancingrate,0.00%forthe rate on the deposit facility and 1.50% for the rate on the marginal lending facility throughout the second half of 2012 (see Chart 1).
impaired monetary poliCy tranSmiSSion hampered the eFFeCtive paSS-throuGh oF Key eCb intereSt rate CutSThe lowering of the key ECB interest rates in July 2012, which followed two 25 basis point cuts in late 2011, led to a further decline in money market interest rates. While bank lending rates forhouseholdsandnon-financialcorporationsgenerallydecreasedattheeuroarealevelin2012,reflectingthepass-throughofthecutsinkeyECBinterestratessinceNovember2011,thisprocessdid not take place in a homogeneous fashion across euro area countries as had been the case in the past.Inparticular,thefragmentationoffinancialmarketsalongnationalbordershinderedasmoothtransmission of monetary policy in the euro area. As a result, the cuts in policy rates were to a large extent passed on in some countries, but the interest rates charged on bank loans to the real economy remained unchanged or even increased in other countries.
euroSyStem adopted Further non-Standard monetary poliCy meaSureS in 2012In order to contribute to a more effective transmission of the ECB’s accommodative monetary policystancetotherealeconomy,tosupportthefinancingoftherealeconomyandtherebytoensurethe maintenance of price stability over the medium term, the Governing Council adopted further non-standardmonetarypolicymeasuresoverthecourseof2012.Measuresrelatedtorefinancingoperations were taken to support bank lending and market liquidity, while other measures addressed themalfunctioning in certain financialmarket segments and aimed in particular to prevent riskpremia from becoming excessive and leading to destructive scenarios.
non-Standard meaSureS related to reFinanCinG operationSTo alleviate the funding constraints experienced by banks and to help to avoid the disorderly shedding of bank assets, the ECB continued to provide funding support using longer-term refinancingoperationswithexceptionalmaturities,conductingall refinancingoperationsasfixedrate tender procedures with full allotment, and took measures to increase collateral availability. In particular, the two three-year longer-term refinancing operations that had been announcedon8December2011hada significant impact in2012.1Thefirstof theseoperations, conducted1 For a detailed description of themeasures taken in December 2011, see the box entitled “Additional non-standardmonetary policy
measuresdecidedbytheGoverningCouncilon8December2011”,Monthly Bulletin, ECB, December 2011.
Chart 1 eCb interest rates and the overnight interest rate
(percentages per annum; daily data)
0.0
0.5
1.0
1.5
2.0
2.5
3.0
3.5
4.0
4.5
5.0
5.5
6.0
0.0
0.5
1.0
1.5
2.0
2.5
3.0
3.5
4.0
4.5
5.0
5.5
6.0
2007 2008 2009 2010 2011 2012
overnight interest rate (EONIA) interest rate on the deposit facility interest rate on the marginal lending facility interest rate on the main refinancing operations
Sources: ECB and Thomson Reuters.

15ECB
Annual Report2012
on 21 December 2011, provided €489.2 billion to banks, while the second one, conducted on29February2012,provided€529.5billion.Takingother refinancingoperations intoaccount,the two three-year longer-term refinancing operations led to a net liquidity injection of around€500 billion. Together with the reform efforts made in several euro area countries and progress towards a stronger euro area economic governance framework, these operations contributed to an improvementinthefinancialenvironmentinthefirstfewmonthsof2012andaneasingofmoneymarket strains throughout the year (see also Box 2).
The Governing Council also announced that the Eurosystem would continue to provide liquidity to banksthroughfixedratetenderprocedureswithfullallotmentuntilatleastmid-2013.Furthermore,the Governing Council decided on a number of changes to the collateral eligibility requirements and risk control measures in February, June and September 2012, with the aim of broadening the range of collateral eligible to be used in Eurosystem credit operations. Finally, in December 2012 the ECB announced the extension of the existing foreign currency swap arrangements with other central banks until 1 February 2014.
tarGeted meaSureS to addreSS malFunCtioninG in Government bond marKetSFollowing some calmness in the first few months of 2012, conditions in sovereign debtmarketsworsened again towards themiddle of 2012. Thismainly reflected a perceived lack ofdetermination on the part of governments to take the necessary steps to resolve the crisis and to implement agreements made at the European level. Markets particularly focused on the potential repercussions of uncertainties in Greece, and on developments in Spain and Italy, amid fears about the sustainability of government debt and constrained access to the funding market. These fears led to exceptionally high risk premia, related in particular to unfounded concerns on the part of investors about the reversibility of the euro. Differences widened particularly in the pricing of sovereign debt up to July 2012 (see Chart 2).
Chart 2 two and ten-year government bond yields for selected euro area countries
(percentages per annum)
NetherlandsSpainItaly
GermanyFranceBelgium
Two-year government bond yields Ten-year government bond yields
-1
0
1
2
3
4
5
6
7
8
9
-1
0
1
2
3
4
5
6
7
8
9
2010 2011 2012-1
0
1
2
3
4
5
6
7
8
9
-1
0
1
2
3
4
5
6
7
8
9
2010 2011 2012
Source: Thomson Reuters.

16ECBAnnual Report2012
In order to address severe distortions in the pricing of sovereign debt in some euro area countries, the Governing Council announced its readiness to undertake Outright Monetary Transactions (OMTs) in secondarymarketswith regard to sovereignbonds in theeuroarea.Thesewerefirstannounced in August 2012, with further details on the modalities being provided in September.2 At the same time, the ECB announced that it would terminate the Securities Markets Programme which had been introduced in May 2010.
OMTs have not yet been activated but the Eurosystem is ready to undertake them under certain conditions (as outlined in further detail in Section 1.1 of Chapter 2). The Governing Council will independently consider conducting OMTs to the extent that they are warranted from a monetary policy perspective in the event of market fragmentation. OMTs are aimed at supporting the transmission mechanism in all euro area countries and the singleness of the monetary policy. They provide a fully effective backstop to avoid destructive scenarios with potentially severe challenges for price stability in the euro area.
The announcements about OMTs helped to alleviate tensions in financial markets and reducedtail risks and uncertainty in the second half of 2012. They contributed to an overall improvement infinancingconditions,whichwasevidenced,forexample,byadeclineinthegovernmentbondyields of countries under stress (see Chart 2) and the issuance of new bonds by banks, companies and sovereigns which for some time had not had access to markets.
However, the situation remains fragile as long as the root causes of the current crisis are not fully addressed. This can only be done by governments, which need to ensure sustainable public debt, make their economies more competitive, strengthen the resilience of their banks, and continue to improve the institutional setting of EMU.
2 monetary, FinanCial and eConomiC developmentS
2.1 the Global maCroeConomiC environment
Global Growth momentum Slowed in 2012Inearly2012surveyindicatorssignalledthatthefirmingofmomentuminglobaleconomicgrowthover thefinalquarterof2011wascontinuing into thefirstquarterof2012,with thePurchasingManagers’ Index (PMI) for global all-industry output reaching 54.5 in February, compared with an average of 52.1 in the final quarter of 2011. However, this improvement in sentiment was short-lived and confidencebegan todeteriorateoncemore, in apattern similar todevelopmentsseenin2011.Activityslowedinadvancedeconomiesasfinancialmarketstressandthesovereigndebt crisis affecting some euro area countries intensified, and uncertainty remained persistentlyhigh. The ongoing repair of public and private balance sheets, as well as weak labour and housing markets, continued to dampen growth. Growth also slowed in a number of emerging economies but remained robust in comparison with developments in advanced economies. This slowdown was partly driven by higher levels of uncertainty and partly due to past policy tightening in a number of
2 ForadetaileddescriptionofthemeasuresdecidedoninSeptember2012,seetheboxentitled“MonetarypolicymeasuresdecidedbytheGoverningCouncilon6September2012”,Monthly Bulletin, ECB, September 2012.

17ECB
Annual Report2012
countries. Social unrest and geopolitical tensions in a number of Middle Eastern and North African countriesalsostifledgrowth.
By the middle of the year European leaders’ decisions, including the endorsement of common supervisory oversight of the banking sector, had helped to reduce the uncertainty in some areas and global sentiment began to show signs of stabilisation, albeit at very low levels. However, higher energy prices driven by oil supply disruptions, ongoing concerns about the resolution of sovereign debtandgovernanceissuesintheeuroareaanduncertaintysurroundingfiscaltighteningandthedebt ceiling extension in the United States held activity back in the second half of the year. Overall, the underlying growth momentum of the global economy remained weak and the recovery slow. By the end of the year data releases and survey indicators were both showing very tentative signs of improvement.
Theslowdowninworldtradethatbeganin2010intensifiedoverthecourseof2012and,accordingto data from the CPB Netherlands Bureau of Economic Policy Analysis, total trade volume growth slowed to just 2.2% in 2012, from 5.8% in 2011. Over the course of 2012 world import growth slowedmuchmoresharplythanoverallactivity.Highuncertainty–particularlyinEurope–andsubduedconfidenceappear tohavedampeneddemand fordurableand investmentgoods,whichaffectedglobal tradeflows. Inaddition,global tradeflowsmayhavebeenadverselyaffectedbysome structural factors (see also Box 1). This might suggest that there is a risk of the weakness in trade growth being long-lasting. Towards the end of 2012 short-term survey indicators continued to point towards a weak trade environment, with the global PMI for new manufacturing export orders havingremainedbelowtheexpansion-contractionthresholdforthefinalninemonthsoftheyear.
Chart 3 main developments in selected economies
ChinaUnited Kingdom
JapanUnited Stateseuro area
Output growth 1)
(annual percentage changes; quarterly data)Inflation rates 2)
(annual percentage changes; monthly data)
-10
-5
0
5
10
15
-10
-5
0
5
10
15
2007 2008 2009 2010 2011 2012-4
-2
0
2
4
6
8
10
-4
-2
0
2
4
6
8
10
2007 2008 2009 2010 2011 2012
Sources: National data, BIS, Eurostat and ECB calculations.1) Eurostat data are used for the euro area and for the United Kingdom; national data are used for the United States, China and Japan. GDP figureshavebeenseasonallyadjusted.2) HICP for the euro area and for the United Kingdom; CPI for the United States, China and Japan.

18ECBAnnual Report2012
Unemployment rates remained high in the OECD area over the course of 2012. The headline numbers masked a divergence in developments in the major advanced economies, with unemployment rates declining in the United States, Canada and Japan but continuing to rise in the euro area.
Regarding price developments, consumer price inflation in advanced economies graduallydecreased over the course of 2012, with the exception of a slight increase between August and October, largely driven by energy prices (see Chart 3). Overall, abundant spare capacity and the sluggishrecoveryinadvancedeconomiesensuredthatunderlyinginflationarypressuresremainedcontained.InOECDcountries,averageheadlineconsumerpriceinflationstoodat2.2%in2012,downfrom2.9%in2011.Averageconsumerprice inflationexcluding foodandenergystoodat1.8%, comparedwith 1.6% in 2011.Annual inflation rates declined sharply inChina andmoremoderately in other emerging economies over the course of 2012, as the weak global environment dampenedinflationarypressures.
box 1
why the reCent Slowdown in Global trade?
Over the last two years there has been a widespread deceleration in world trade growth amid a numberofshockstotheglobaleconomy:decliningconsumerandbusinessconfidencestemmingfrom the euro area sovereign debt crisis, balance sheet deleveraging and, at a regional level, disruptionscausedby theearthquake inJapanand the“ArabSpring”.Aslowdown inannualimport growth has been observed across both advanced and emerging market economies (see Chart A). Growth in world trade has not only declined in absolute terms but has also weakened relative to global economic activity. Between 1982 and 2007 the ratio of global import growth to GDP growth was, on average, 1.8, whereas this ratio declined to 1.0 inthesecondhalfof2011andthefirsthalfof2012 (see the table below).
Why has the recent slowdown been stronger than that suggested by the long-run relationship between trade and GDP growth? First, the decline in trade growth relative to GDP growth has been particularly pronounced in advanced economies,beingcausedtoasignificantextentby developments in the euro area. Second, in some regions, the decline in GDP was driven by demand components with a relatively high import content, namely fixed investment andinventories. Finally, there is some evidence thatsmallertradefinanceflowsmayalsohavehad a dampening effect on global trade.
Chart a world merchandise imports
(year-on-year percentage changes; seasonally and working day-adjusted)
-30
-20
-10
0
10
20
30
-30
-20
-10
0
10
20
30
2008 2009 2010 2011 2012
advanced economiesemerging economiesworld
Source: CPB Netherlands Bureau for Economic Policy Analysis.Notes: Data shown are calculated as three-month moving averages. The latest observation is for December 2012.

19ECB
Annual Report2012
Regional trade developments
The trade slowdown, although widespread, has shown considerable divergence across regions. TheratioofglobalimportgrowthtoglobalGDPgrowthfellfrom1.7inthefirsthalfof2011to1.0 in the following 12 months. The decline in relative trade growth was stronger in advanced countries than in emerging market economies (see Chart A). An important reason for this is thesignificantdecreaseineuroareaimportgrowthsincemid-2011aswellasitslargeshareofabout 50% of advanced country imports. Since the second half of 2011 euro area GDP growth has declined less than import growth and the share of the euro area in advanced country GDP has decreased to around 30%. Excluding the euro area and Japan (the latter’s GDP and trade being affected by the natural disaster in 2011), the decline in relative trade growth in advanced economies is much less pronounced. In many emerging economies, particularly in central and easternEurope,importgrowthhasalsoweakenedsignificantlyrelativetooutputgrowth.
The role of weak investment
One explanation for the fall in the ratio of import growth to GDP growth in 2012 is the decline in the growth contribution of demand components with a relatively high import content, namelyinventories,fixedinvestmentanddurablegoodsconsumption.1 According to estimates by Bussière et al., the average import content of investment in the OECD economies in 2005 was 32% and that of exports 28%, followed by private consumption at 25% and government spending at 10%. The import content of exports is particularly high in small open economies and in countries, like many in East Asia, which are closely integrated with vertical production networks.
Sincethesecondhalfof2011fixedinvestmentandinventorieshavecontributednegativelytooutputgrowthintheeuroarea,whichhelpstoexplainthesignificantdeclineobservedintheratioof import growth to GDP growth. While inventory restocking added almost half a percentage pointtogrowthinthefirsthalfof2011,inventoriesdecreasedinthesecondhalfof2011andinthefirstsixmonthsof2012,withfixedinvestmentalsodecliningoverthesameperiod(seeChartB). The consumption of durable goods, which have a higher import content compared with non-durable goods, declined along with investment, albeit at a lower rate.
1 SeeAlessandria,G.,Kaboski,J.andMidrigan,V.,“Thegreattradecollapseof2008-09:Aninventoryadjustment?”,IMF Economic Review, Vol. 58, No 2, pp. 254-294, 2010; Alessandria, G., Kaboski, J. andMidrigan, V., “US trade and inventory dynamics”,American Economic Review,Vol.101,Issue3,pp.303-307,2011;Anderton,R.andTewolde,T.,“Theglobalfinancialcrisis:tryingtounderstandtheglobaltradedownturnandrecovery”,Working Paper Series, No 1370, ECB, August 2011; and Bussière, M., Callegari, G.,Ghironi,F.,Sestieri,G.andYamano,N.,“Estimatingtradeelasticities:Demandcompositionandthetradecollapseof2008-09”,NBER Working Paper Series, No 17712, National Bureau of Economic Research, 2011.
ratio of import growth to Gdp growth
1982-2007 H1 2011 H2 2011 H1 2012
World 1.8 1.7 1.0 1.0Advanced economies 2.9 4.9 1.2 1.1Advanced economies excluding the euro area and Japan 1.9 2.1 1.7 1.6Emerging economies 1.5 1.5 1.0 1.1
Sources: Haver Analytics, IMF and ECB calculations.

20ECBAnnual Report2012
In emerging market economies, some inventory destocking was observed in the second half of2011,followedbyaslightrecoveryinthefirsthalfof2012(seeChartC).Thesedevelopmentsroughly coincided with the decline in the ratio of import growth to GDP growth. In the EU Member States of central and eastern Europe, the negative growth contribution of inventories was somewhat more pronounced than in the rest of the emerging markets and continued into the firsthalfof2012.TheweakerratiooftradegrowthrelativetoGDPgrowthinemergingmarketscan also be explained in part by lower exports to advanced economies, such as the euro area, as exports are also a relatively import-intensive demand component.
Mixed evidence on the impact of trade finance and trade protectionism
Two additional factors are frequently cited as possible explanations of the recent decline in globaltradegrowth.Thefirstoftheseistheavailabilityoftradefinance.Accordingtoestimatesby the Institute of International Finance,2thevalueoftradefinanceflowshasfallensignificantlysince the end of 2011, with the decline concentrated among euro area banks. While the decrease intradefinanceflowscoincideswithlowerglobaltradegrowth,therelativelylargercontractionin trade finance among euro area banksmay reflect in part euro area bank deleveraging andretrenching from areas of cross-border lending.
Theevidenceonhowmuchthedeclineintradefinanceisduetolowerdemandorlowersupplyis mixed. The forward-looking ICC-IMF Market Snapshot (January 2012) concluded that
2 Capital Markets Monitor, Institute of International Finance, September 2012.
Chart b Contributions to Gdp growth in the euro area
(six-month percentage changes; percentage points)
-1.5
-1.0
-0.5
0.0
0.5
1.0
1.5
2.0
-1.5
-1.0
-0.5
0.0
0.5
1.0
1.5
2.0
H1 2012H1 2011 H2 2011
GDPconsumption of durable goodsconsumption of semi- and non-durable goodsgovernment spendinggross fixed capital formationinventoriesimportsexports
Source: Eurostat.Note: ECB calculations based on data for Germany, Spain, France, Italy, the Netherlands and Finland.
Chart C Growth contribution of fixed investment and inventories in selected emerging economies(six-month percentage changes; percentage points)
-1.5
-0.5
0.5
1.5
2.5
3.5
4.5
-1.5
-0.5
0.5
1.5
2.5
3.5
4.5
H1 2012H1 2011 H2 2011
GDPgross fixed capital formationinventories
Source: Haver Analytics.Note: ECB calculations based on data for Argentina, Brazil, the Czech Republic, Hong Kong SAR, Hungary, India, Indonesia, Malaysia, Mexico, Poland, Romania, Russia, Singapore, South Korea, Taiwan, Thailand and Turkey.

21ECB
Annual Report2012
united StateSThe US economy continued on a path to recovery in 2012, growing at a faster pace than in the previous year. Real GDP growth stood at 2.2%, compared with 1.8% in 2011. Economic growth in thefirsthalfof2012wassluggish,weigheddownbyconcernsaboutglobaleconomicprospects,by the contraction in government expenditure and by the slowdown in most of the other domestic demand components. In the second half of the year GDP growth gained some momentum on the back of resilient growth in personal consumption expenditure, which was supported primarily by wealth effects coming from continued increases in equity prices and improvements in the housing market andbystronglevelsofconsumerconfidence.Astrongexpansioninprivateresidentialinvestment,reflecting a sustained increase in the housing market, also contributed to the acceleration in GDPgrowth.Despitetheprevailingpoliticalgridlocksurroundingthefiscaltighteningscheduledto take effect in early 2013, private non-residential investment and inventory accumulation contributed positively to growth. By contrast, government spending was a drag on growth in 2012, led especially by a sharp contraction in defence spending in the fourth quarter. Net trade was neutral togrowth.Thecurrentaccountdeficitstoodat3.1%ofGDPinthefirstthreequartersof2012,thesame level as in 2011. As for the labour market, the pace of employment growth was slightly more dynamic than that of the previous year, allowing the unemployment rate to fall from 8.9% in 2011 to 8.1% in 2012.
Afteraverageannualinflationof3.2%in2011,CPIinflationdeceleratedto2.1%in2012.Inthefirsthalfof2012inflationeasedsignificantly,reflectinglowerenergyandfoodprices.InAugust2012,however, energy prices reversed their previous downward trend, leading to an increase in CPI inflation until October, before resuming their decline until the end of the year. Excludingfoodandenergy,CPIinflationaveraged2.1%,upfrom1.7%inthepreviousyear,onthebackofsustained increases in the cost of shelter, medical care and apparel.
The Federal Open Market Committee (FOMC) of the Federal Reserve System kept its target for the federal funds rate unchanged within a range of 0% to 0.25% throughout 2012, in an environment of moderate economic growth and employment growth, high unemployment and a subdued
both supply and demandwere expected to have a negative impact on trade finance in 2012.Asignificantnumberofrespondentsindicatedthatlesscreditorliquidityavailableattheirownbank(73%)oratcounterpartybanks(89%)wasexpectedtoaffecttheirtradefinanceactivitiesat least to some extent. 78% of respondents also thought that a fall in the demand for trade financewouldcontributetothedeclineintradefinance.Intermsofregions,thesurveyfoundthatlesscreditwasavailablefortradefinanceinsub-SaharanAfrica,centralandeasternEuropeand Latin America.
On the other hand, protectionism, which tends to increase during global economic downturns, isunlikelytohavehadasignificantimpactonglobaltradeoverthepasttwoyears.Accordingto ECB staff calculations,3 the crisis saw an increase in trade protectionism but, since 2009, almost all governments have slowed down the pace of adoption of protectionist measures. The ratio of newly implemented trade-restrictive to trade-liberalising measures declined from overeightat thebeginningof2009toaroundtwointhefirstquarterof2012.ECBstaffalsoestimate that, following a spike in 2008-09, the overall number of temporary trade barriers implemented by G20 economies reverted in 2010-11 to its long-term trend.4
3 Based on data from Global Trade Alert, corrected for reporting lags.4 Based on data from the World Bank’s Temporary Trade Barriers Database.

22ECBAnnual Report2012
outlook for inflation over themedium term. In June 2012 theFOMCdecided to continue to theend of 2012 (instead of the end of June 2012) its programme to extend the average maturity of its holdings of securities (frequently referred to as “Operation Twist”) and its existing policyof reinvesting principal payments from its holdings of agency debt and agency mortgage-backed securities. In September 2012 the FOMC decided to launch a third round of quantitative easing measures–referredtoas“QE3”–tostimulatefurthertheeconomy.TheFOMCplannedtopurchaseadditional agency mortgage-backed securities at a rate of USD 40 billion per month. With these actions, the FOMC expected to exert downward pressure on longer-term interest rates, to support mortgagemarketsandtohelpmakebroaderfinancialconditionsmoreaccommodative.TheFOMCalso anticipated that exceptionally low levels for the federal funds rate were likely to be warranted “atleastuntilmid-2015”,havingpreviously,inJanuary2012,referredto“atleastthroughlate2014”.In December 2012 the FOMC decided to continue purchasing longer-term Treasury securities at a rateofUSD45billionpermonthafterits“OperationTwist”programmehadconcludedattheendof the year, thus increasing the balance sheet of the Federal Reserve. It also announced a shift from calendar-based policy rate guidance to outcome-based guidance, anticipating that exceptionally low levels for the federal funds rate would be appropriate at least as long as the unemployment rate remainedabove6.5%, inflationbetweenoneand twoyearsaheadwasnotprojected tobeabove2.5%andlonger-terminflationexpectationscontinuedtobewellanchored.
Asregardsfiscalpolicy, thefederalbudgetdeficitdeclinedto7.0%ofGDPin2012,from8.7%in the previous year. This led to a further increase in the level of federal debt held by the public, to 73% of GDP at the end of 2012, compared with 68% at the end of 2011. Over the course of 2012alackofconsensusonavoidingtheprojectedfiscaltighteninginearly2013–referredtoasthe “fiscal cliff”– comprising taxhikes and automatic spending cuts, contributed to anunusualdegree of uncertainty. In early January 2013 a political agreement on tax and spending reforms was reached by the approval in Congress of the American Taxpayer Relief Act, partly avoiding considerable fiscal tightening in the economy.The deal, however, focused on the revenue side,postponing by two months the spending reform decisions. In this context, the issue of tackling long-term fiscal imbalanceswas left unaddressed, leaving the near-term outlook surrounded byconsiderable uncertainty.
JapanEconomic growth in Japan was highly volatile in 2012 owing to the considerable uncertainty surroundingglobaldevelopmentsandnationalpolicies.Growthinthefirstquarterwasfirm,drivenmainly by strong domestic demand. Public demand due to the reconstruction work following the earthquake and tsunami in 2011, as well as private consumption demand partly boosted by the subsidised purchase of eco-friendly cars, contributed positively to growth. Starting from the second quarter the economy contracted amid weakening global demand. Owing partly to the strong yen, the currentaccountbalanceturnednegativeforthefirsttimesincetheseriesbeganin1985.Togetherwith subdued domestic demand, the slowdown in external demand led to a sizeable contraction in growth in the third quarter. At the end of the year the economy remained weak, although private consumptionpickeduponceagainagainstthebackgroundofaweakeryen.Annualinflationwaspositiveinthefirsthalfoftheyearbutturnednegativeinthesecondhalf.Coreinflation(excludingfood, beverages and energy) was negative throughout 2012.
On account of weak economic developments and deflation, the Bank of Japan maintainedits target for the uncollateralised overnight call rate between 0.0% and 0.1%. Over the year the central bank announced increases in its Asset Purchase Program totalling about JPY 46 trillion, and extended its duration until the end of 2013. In addition, it amended its

23ECB
Annual Report2012
Growth-Supporting Funding Facility with the Stimulating Bank Lending Facility. The latter is unlimited in size and grants loans to banks equal in size to their increase in net lending. In January 2013 the Bank of Japan also announced the introduction of a price stability target of 2%, replacing theinflationgoalof1%establishedinFebruary2012.Furthermore,thecentralbankintroducedthe“open-endedassetpurchasingmethod”undertheAssetPurchaseProgram,tocomeintoeffectinJanuary 2014. Despite the approval of a gradual VAT increase (from 5% to 10%) starting in 2014, fiscalconsolidationinJapanwassmall.Deadlockoveradebtfinancingbillbetweenthelowerandupper houses of the Japanese Diet was resolved by new elections in December, which brought about a change in government and the approval of the bill.
emerGinG aSiaEconomic growth in emerging Asia decelerated further in 2012, with annual GDP growth slowing toaround5.9%,somewaybelowitslong-termaverage.Exportgrowthdeclinedsignificantlyastheslowdown in Europe and other advanced economies contributed to a widespread reduction in trade. Although monetary and credit policy tightening during 2011 and in early 2012 dampened domestic demand somewhat, expenditure remained generally resilient amid strong credit growth and rising residentialpropertypricesinanumberofcountries.InflationinemergingAsiamoderatedin2012.Decliningglobalfoodpriceshelpedtobringheadlineinflationrateslower,whileweakeractivityalsomoderatedinflationarypressures.In thelightof thedeteriorationinactivityandtrade,andeasinginflation,somecentralbankshaltedorevenreversedthemonetarytighteningcyclethathadbeguninthe second half of 2010, contributing to renewed growth momentum towards the end of the year.
In China, real GDP growth declined to 7.8% in 2012 from 9.3% in 2011. Growth had been weak at the start of the year but rebounded strongly in the second half, driven by domestic demand. Consumption and investment contributed in almost equal measure, while the contribution of net exports was slightly negative. Domestic demand was supported by government infrastructure investmentandaccommodativefinancingconditions.Constructionactivitypickeduptowardstheendoftheyearasthehousingmarketrecoveredfromamilddownturninthefirsthalfoftheyear.Inflationeasedduringtheyearonthebackofdecliningfoodprices,reaching2.6%for2012asawhole, against 5.4% in 2011. Owing to the weak outlook earlier in the year, the authorities cut the reserve requirement ratio for banks by half a percentage point in both February and May. Similarly, the benchmark one-year lending and deposit rates were reduced in June and July by a cumulative 56and50basispointsrespectively.Aspartoftheongoingfinancialsectorreformprocess,bankswere given more scope to set lending and borrowing interest rates. In the second half of 2012, as net capitalflowsturnednegativeandforeignreservesstabilised,thePeople’sBankofChinastartedtorely to a much greater extent on open market operations to steer liquidity conditions. Owing to the weak global environment, growth in exports, mainly to the euro area but also to Japan, decelerated for most of 2012. As import growth declined faster than export growth, the trade surplus rose to USD 232.8 billion, from USD 157.9 billion in 2011. The renminbi appreciated by 1.7% in nominal effective terms and by 2.2% in real effective terms between the end of 2011 and the end of 2012, despite a temporary depreciation over the summer. By the end of 2012 China’s foreign reserves had reached USD 3.3 trillion, up from USD 3.2 trillion in December 2011.
latin ameriCaEconomic activity in Latin America slowed overall during 2012, on the back of lower external demand and some signs of weakness in domestic demand in a number of countries. In addition, weaker global prospects led to a decline in commodity prices and terms-of-trade losses for commodity exporters, which account for roughly three-quarters of the output in the region. For the region as a

24ECBAnnual Report2012
whole,theyear-on-yearrealGDPgrowthratestoodat3.1%inthefirsthalfof2012,comparedwithaverage growth of 4.5% in 2011. Private consumption continued to be the main engine of growth, despite recording some deceleration. To a lesser extent, government consumption also contributed positively to growth. By contrast, net exports weighed on growth owing to the slowdown in the world economy,andinvestmentalsocontributednegatively,reflectingpastmonetarypolicytightening.In particular, Brazil, the largest Latin American economy, slowed substantially as a result of a stronger than expected deterioration in external demand and a weaker pick-up in domestic demand. Year-on-year realGDPgrowth inBrazil stoodat0.6% in thefirst halfof2012, comparedwithaveragegrowthof2.7%in2011.Asforinflation,themoderationineconomicgrowthcoupledwithlowerenergyandfoodpricesledtosomeeasingininflationarypressuresin2012.Averageannualconsumerpriceinflationdeceleratedfrom6.9%in2011to6.2%in2012.
Inthelastmonthsof2012theLatinAmericaneconomygainedsomemomentum,reflectingagradualimprovement in the global outlook and the impact of policy-easing measures in some countries. In Brazil, a deteriorating external environment coupledwith lower inflation prompted the centralbanktocutinterestratessignificantlybetweenSeptember2011andOctober2012,reversingpreviousrounds of tightening. In 2012 the Banco Central do Brasil cut interest rates by 375 basis points. Having heldupfairlywellinthefirsthalfof2012,thelabourmarketimprovedfurtherinthesecondhalfofthe year, with moderate job creation and a relatively low level of unemployment. Financial markets in the region were generally resilient and the banking sectors in the economies with the most developed financialsectors(Brazil,MexicoandChile)remainedrobust,profitableandliquid.
volatile Commodity priCeS in 2012 The price of Brent crude oil was overall stable in the course of 2012, albeit masking high levels of volatility. Prices were down nearly USD 40 per barrel from peak to trough between mid-March and late June 2012, before they rose again and stabilised at around USD 110 per barrel towards the end of the year (see Chart 4). Moreover, 2012 was the second consecutive year that the average annual Brent oil price stood above USD 110 per barrel.
As in 2011, a combination of supply concerns and demand-side factors explained the sharp movements in oil prices. On the supply side, the escalation of tensions with Iran, culminating with the announcement of a US and European embargo on oil imports from the country, pushed prices sharply higher in the first quarter of 2012, well ahead of the actuallaunching of the embargo on 1 July 2012. Prices remained elevated even as the market became increasingly well supplied by OPEC-led output rises, particularly owing to a faster than expected recovery in Libyan output. Eventually, however, the rising oil supplies coupled with an accumulation of signals pointing to slowing global demand, further amplified by renewedtensions in some euro area sovereign debt markets, led to a reversal in oil prices in the second quarter of the year. In the second half of
Chart 4 main developments in commodity prices
(daily frequency)
6065707580859095100105110115120125130135
30405060708090
100110120130140150160170180
2007 2008 2009 2010 2011 2012
Brent crude oil (USD/barrel; left-hand scale)non-energy commodities (USD; index: 2010 = 100; right-hand scale)
Sources: Bloomberg and Hamburg Institute of International Economics.

25ECB
Annual Report2012
theyear–despitetheweaknessinoildemand–unplannedoutagesinnon-OPECsupply,coupledwith geopolitical tensions, supported a recovery in oil prices.
The prices of non-energy commodities, on aggregate, increased slightly during 2012 (see Chart 4) amid some volatility, but remained throughout the year well below their daily peaks reached during 2008 and 2011. Metal price movements were primarily affected by uncertainty regarding global growth, whereas the prices of some food commodities, particularly soybeans and cereals, were strongly affected by weather-related supply disruptions. In aggregate terms, non-energy commodity prices (denominated in US dollars) were 1.2% higher at the end of 2012 than at the beginning of the year.
the eFFeCtive eXChanGe rate oF the euro waS broadly unChanGed over the yearEuro exchange rate developments in 2012 largely reflected evolvingmarket perceptions of theeuro area’s economic outlook and of changing risk premia related to the euro area sovereign debt crisis. In the period up to April 2012 the euro appreciated slightly in nominal effective terms and bilaterally against the US dollar. After April renewed tensions related to the resolution of theeuroareasovereigndebtcrisisledtoadeclineinthevalueoftheeuro.Specifically,betweenApril and July 2012, the euro depreciated by around 5% in nominal effective terms and by 8% againsttheUSdollar.ThistrendwashaltedandreversedafterlateJuly,whentheECBreaffirmedthe irreversibility of the euro and announced the Eurosystem’s Outright Monetary Transactions (OMTs). Between the end of July and the end of September, the euro appreciated markedly, largely recovering earlier losses, amid substantially declining volatility. Euro exchange rate movements in the later part of 2012 were characterised by an environment of stability, with volatility indicators in foreignexchangeratemarketsnearlevelsseenbeforethefinancialcrisis(seeChart5).
Chart 5 patterns in exchange rates and implied volatilities
(daily data)
Exchange rates Implied exchange rate volatilities (three-month)
85
95
105
115
125
135
145
155
165
175
0.6
0.7
0.8
0.9
1.0
1.1
1.2
1.3
1.4
1.5
1.6
1.7
2007 2008 2009 2010 2011 2012
USD/EUR (left-hand scale)GBP/EUR (left-hand scale)CHF/EUR (left-hand scale)JPY/EUR (right-hand scale)
0
5
10
15
20
25
30
35
0
5
10
15
20
25
30
35
2007 2008 2009 2010 2011 2012
USD/EURGBP/EURCHF/EURJPY/EUR
Sources: Bloomberg and ECB.Note: The latest observation is for 1 March 2013.

26ECBAnnual Report2012
The nominal effective exchange rate of the euro, as measured against the currencies of 20 of the euro area’s most important trading partners, was broadly unchanged over the year (see Chart 6). By the end of 2012, in nominal effective terms, the euro stood 0.4% below its level at the end of 2011 and 1% below its average level since 1999. Against the US dollar, on 31 December 2012 the euro traded at USD 1.32, which was around 2% higher than at the end of 2011 and 5% below its average for 2011.
Regarding other major currencies, the euro appreciated substantially against the Japanese yen, particularly in the second half of 2012, as uncertainties in Japan negatively affected the value of the Japanese currency. On 31 December 2012 the euro stood at JPY 114, 13% higher than at the start of the year and 2% above its 2011 average. By contrast, the euro depreciated slightly against the pound sterling, trading at GBP 0.82 at the end of 2012, which was around 2% below its level at the beginning of the year and 6% lower than its average level in 2011.
The euro was unchanged during 2012 against the Australian dollar but depreciated against the Canadian dollar (by 1%), the Norwegian krone (by 5%) and the Korean won (by 6%). By contrast, it appreciated against the Asian currencies that are linked to the US dollar, including the Chinese renminbi (by 1%) and the Hong Kong dollar (by 2%).
Against the Swiss franc, the euro continued to trade close to the minimum exchange rate of CHF 1.20 which was unilaterally announced by the Swiss National Bank in September 2011 and defended through interventions by the central bank in the foreign exchange market over the course of 2012. On 30 December 2012 the euro stood at CHF 1.21, broadly unchanged from its level at the beginning of the year.
The real effective exchange rates of the euro based on different cost and price measures decreased duringthefirstthreequartersof2012.Bytheendof2012theystoodatlevelsbelowthoseprevailingat the end of 2011 (see Chart 6).
2.2 monetary and FinanCial developmentS
monetary Growth StrenGthened moderatelyM3 growth started to recover over the course of 2012, but stayed at moderate levels. The annual growth rate of M3, which had stood at 1.5% in December 2011, increased to around 3.6% in July 2012, before moderating again until September. In December 2012, however, the annual rate of growth of M3 stood at 3.4%. The considerable volatility in the monthly developments in the euro
Chart 6 euro nominal and real effective exchange rates (eer-20)1)
(quarterly data; index: Q1 1999 = 100)
80
90
100
110
120
80
90
100
110
120
2007 2008 2009 2010 2011 2012
nominalreal, CPI-deflatedreal, ULCT-deflatedreal, GDP-deflated
Source: ECB.1) An upward movement of the EER-20 indices represents an appreciation of the euro. The latest observations are for the fourth quarter of 2012 for “nominal” and “real, CPI-deflated”and the second quarter of 2012 for “real, GDP-deflated” and“real,ULCT-deflated”.ULCTstandsforunitlabourcostsofthetotal economy.

27ECB
Annual Report2012
areamainlyreflectsthemoney-holdingsector’spreference for liquidity in an environment of low interest rates and, in particular until August, heightened uncertainty. From this perspective, thedevelopmentsinmoneycontinuedtoreflectthe influence of the government debt crisis,triggering portfolio shifts in and out of monetary assets, particularly by institutional investors.
By contrast, the annual rate of growth of loans to the private sector (adjusted for the impact of loan sales and securitisation activity) declined steadily, standing at -0.2% in December 2012, compared with 1.2% in December 2011. As a consequence, the divergence observed since early 2012 in the annual growth rates of money and credit to the private sector continued to widen in the course of 2012 (see Chart 7). At the same time, the impact of the non-standard measures adopted by the Governing Council of the ECB, in particular the three-year longer-term refinancing operations (LTROs) carriedout in December 2011 and February 2012 –albeitonlymaterialisingwithacertainlag–andtheannouncementonOMTs,alleviatedsomeofthe funding pressures faced by MFIs. The increase in the volatility of monthly data for money and credit was also fostered by developments observed in interbank transactions conducted via central counterparties (CCPs), which were traditionally part of the money-holding sector. This led the ECB to amend its statistical measurement of broad money and credit to the private sector to adjust for repurchase agreement transactions with CCPs with effect from the end-August monetary data.3 In addition, changes in the regulatory environment and uncertainty regarding further changes to the regulatoryframeworkimpactedonthefinancialsystemasawhole,notonlyaffectinglendingbyMFIs but also stimulating efforts on the part of the banking system to strengthen its deposit base. Overall, looking beyond short-term volatility, developments in broad money and credit indicate that the pace of underlying monetary expansion strengthened moderately in 2012 but remained subdued.
portFolio ConSiderationS were the Key driver oF developmentS in ComponentS oF m3As regards the developments in the main components of M3, the heightened uncertainties prevailing in financial markets and the accompanying preference for highly liquid deposits – against thebackgroundofverylowpolicyandmoneymarketrates–manifestedthemselvesmainlyinastrongincrease in the annual growth rate of M1, which stood at 6.3% in December 2012 (see Chart 8). These portfolio reallocations away from riskier assets were also accompanied by a decline in the remuneration of more or less all assets contained in M3, with a resultant decline in the opportunity costs of holding highly liquid instruments (see Chart 9). This preference for liquid deposits in the presence of very low policy and market rates points to the establishment of cash buffers by the money-holding sector, possibly as an intermediate step in the portfolio reallocation process.
3 Seetheboxentitled“Theadjustmentofmonetarystatisticsforrepurchaseagreementtransactionswithcentralcounterparties”,Monthly Bulletin, ECB, September 2012.
Chart 7 m3 and loans to the private sector
(annual percentage changes; adjusted for seasonal and calendar effects)
-4
-2
0
2
4
6
8
10
12
14
-4
-2
0
2
4
6
8
10
12
14
2007 2008 2009 2010 2011 2012
M3 (annual growth rate)M3 (annualised three-month growth rate)loans to the private sector (annual growth rate)loans to the private sector (annualised three-month growth rate)
Source: ECB.

28ECBAnnual Report2012
The annual growth rate of marketable instruments declined over the course of 2012 and stood at -7.5% in December 2012, down from -1.2% in December 2011, owing to sizeable reductions in the money-holding sector’s holdings of repurchase agreements (which in the past seem to have been used by investors to temporarily park liquidity). At the same time, the annual growth rate of debt securities with an original maturity of up to two years remained at double-digit levels, before decliningsignificantlyinNovemberandevenmoresoinDecember2012.Inpart,thisstronggrowthuntilautumnmightreflectashiftinMFIissuancefromlong-termtoshort-termdebtsecurities,asinvestorconfidenceintheeuroareabankingsector’sabilitytoredeembondswithamaturityoflessthantwoyearsmayhaveincreasedsufficientlytorekindletheshort-termmarketfollowingthetwothree-yearLTROs.Inaddition,theECB’snewandstricterdefinitionofmoneymarketfunds,whichwas implemented in August 2011, resulted in an increasing number of money market funds being reclassifiedasinvestmentfundsorshiftingtheirinvestmentstrategytowardsinvestmentfunds.Asinvestment funds, unlike money market funds, belong to the money-holding sector, the change in thedefinitionofmoneymarketfundsresultedinthedemandforshort-termdebtissuedbyMFIs,onthepartofentitiespreviouslyclassifiedasmoneymarketfunds,nowbeingrecordedunderMFIdebt securities held by the money-holding sector.
Money market fund shares/units displayed rather volatile behaviour over the course of 2012. In the lightofverylowshort-terminterestrates,moneymarketfundshaveincreasinglyfounditdifficulttogeneratesignificantpositivereturnsforinvestors,andwerethereforeunabletobenefitfromflowsintoshorter-termfinancialassets.
By contrast, an increased demand for repurchase agreements in the first half of 2012 largelyreflected an increased reliance on secured interbank transactions conducted via CCPs, which,for banks, have the advantage of greatly reducing counterparty risk. Given the volatility inherent in interbank transactions, the fact that such secured interbank transactions have increased in the
Chart 8 main components of m3
(annual percentage changes; adjusted for seasonal and calendar effects)
-15
-10
-5
0
5
10
15
20
25
-15
-10
-5
0
5
10
15
20
25
2007 2008 2009 2010 2011 2012
M1other short-term deposits (M2-M1)marketable instruments (M3-M2)
Source: ECB.
Chart 9 mFi interest rates on short-term deposits and the three-month euribor
(percentages per annum)
0
1
2
3
4
5
6
0
1
2
3
4
5
6
2007 2008 2009 2010 2011 2012
three-month EURIBORdeposits redeemable at notice of up to three monthsdeposits with an agreed maturity of up to two yearsovernight deposits
Source: ECB.

29ECB
Annual Report2012
courseofthefinancialcrisis–especiallysincethecollapseofLehmanBrothers–hasinevitablytranslated into higher levels of volatility in the related monetary series. Therefore, in order to ensure consistency between the policy analysis and the statistical framework, the ECB decided to adjust the measurement of M3 and its counterparts for repurchase agreements/reverse repurchase agreements withCCPswitheffectfromthereleaseoftheend-Augustmonetaryfigures.
volatility in headline m3 larGely reFleCted the depoSit holdinGS oF oFisThe annual growth rate of M3 deposits – which comprise short-term deposits and repurchaseagreements and represent the broadest monetary aggregate for which reliable information is available atthesectorallevel–increasedfrom1.2%inDecember2011to4.4%inDecember2012.
Developments in M3 deposits also reflected the contribution made by non-monetary financialintermediariesotherthaninsurancecorporationsandpensionfunds(referredtoas“otherfinancialintermediaries”orOFIs).TheannualgrowthrateofM3depositsheldbyOFIsincreasedfrom1.4%in December 2011 to 3.9% in October 2012, before decreasing again to 0.9% in December 2012, albeitwithconsiderablefluctuations.Fromaneconomicperspective,themoneydemandbehaviourofOFIsisstronglyinfluencedbyconditionsinfinancialmarketsandmovementsinrelativeyieldsacrossabroadspectrumoffinancialassets.Giventheinherentvolatilityofthesedeterminants,OFImoney holdings can at times display quite erratic behaviour, so their short-term dynamics should not be over-interpreted. At the same time, the agility of these investors endows their money holdings with early signalling properties for incipient trends in portfolio allocation, which will only emerge with a lag in the money holdings of other, more inert sectors, such as households. Deposits placed by general government other than the central government also showed dynamic behaviour, increasing from 4.8% in December 2011 to 9.0% in December 2012.
The annual growth rate of M3 deposits held by households continued to increase in 2012, rising from 1.4% in December 2011 to 4.4% in December2012,partly reflecting theeffortsofbanks to increase deposit funding, not least for regulatory reasons. Households’ holdings make up the bulk of M3 deposits. There was a similar rise in the annual growth rate of M3 deposits held by non-financial corporations, whichincreased to 4.7% in December 2012 from -0.9% inDecember2011.Thismayreflectabuild-upof liquid buffers in order to prepare for future internal funding needs.
weaKeninG Growth oF Credit to the private SeCtor As regards the counterparts of M3, the annual growth rate of MFI credit to euro area residents declined to 0.5% in December 2012 from 0.9% in December 2011 (see Chart 10). This development concealed two opposite movements, namely an increase in the
Chart 10 Counterparts of m3
(annualflows;EURbillions;adjustedforseasonalandcalendareffects)
-600
-400
-200
0
200
400
600
800
1,000
1,200
1,400
1,600
-800
-600
-400
-200
0
200
400
600
800
1,000
1,200
1,400
1,600
-8002007 2008 2009 2010 2011 2012
M3 other counterparts (including capital and reserves) (5)
longer-term financial liabilities (excluding capital and reserves) (4)
net external assets (3)credit to general government (2)credit to the private sector (1)
Source: ECB.Notes: M3 is shown for reference only (M3 = 1+2+3-4+5). Longer-termfinancialliabilities(excludingcapitalandreserves)are shown with an inverted sign, since they are liabilities of the MFI sector.

30ECBAnnual Report2012
annual growth rate of credit to general government and a decrease in the annual growth rate of credit to the private sector. The increase in the annual growth rate of credit to general government, which stoodat5.8%inDecember2012,reflectedbothanincreaseintheannualgrowthrateofloanstogeneral government in the second half of 2012 and strong demand for government debt securities, particularlyinthefirsthalfof2012,resultingindouble-digitannualgrowthratesduringtheperiodfromJanuarytoNovember2012.Strongdemandinthefirstmonthsof2012canbeassociatedwiththe ample liquidity provision in the three-year LTROs, while since the late summer MFI holdings ofgovernmentdebt securities havebenefited from the stabilisationof euro area sovereignbondmarkets which followed the announcement of OMTs.
The growth profile of credit to the private sector generallymirrors that of loans,which are themain component of this aggregate. In line with developments in loans, credit to the private sector moved into negative territory, with growth of -0.8% in December 2012. The annual growth rate of MFI loans to the private sector (adjusted for sales and securitisation) also declined over the course of 2012, and stood at -0.2% at the end of December 2012, down from 1.2% in December 2011. Thisprofileisconsistentwitheconomicactivityandfinancialmarketdevelopmentsinthecourseof 2012. Developments in loans to the private sector reflected those of its main components. Theannualgrowthratesofloanstonon-financialcorporationsandofloanstohouseholds(adjustedfor sales and securitisation) both declined for most of 2012. Loans to OFIs also declined, albeit showing considerable volatility.
Asregardsloanstothenon-financialprivatesector,theannualgrowthrateofloanstohouseholds(adjusted for sales and securitisation), which stood at 2.0% in December 2011, continued to decline gradually, ending at 0.7% in December 2012 in line with the observed weakening in economic activity, heightened uncertainty and risk aversion, a fall in consumer confidence, deterioratingprospects for the housing market and the need to deleverage following past excesses. (For more details on lending to households, see the section on household borrowing later in this chapter.) Bycontrast, theannualgrowthrateofloanstonon-financialcorporations(adjustedforsalesandsecuritisation) stood at -1.3% in December 2012, primarily driven by the weakening of the economic environment, the deterioration in business expectations, increased risk perceptions of banks and firms and deleveraging needs.More broadly, from a time-series perspective, the growth rate ofloanstonon-financialcorporationsseemstobefollowingatypicalpro-cyclicalandlaggingpattern.In sum, at the end of 2012 annual growth in loans to households remained moderately positive, whereasloanstonon-financialcorporationsrecordednegativeannualgrowth.
At the same time, developments in corporate borrowing seem to have been driven by the interplay of additional factors on both the supply and the demand side, although with some cross-country heterogeneity. On the demand side, in a number of countries, internal and alternative non-bank externalfundingsourcesofferratherfavourablefinancingopportunities,thusdampeningthedemandforMFIloans,whereasinothercountriestheindebtednessoffirmscreatesaneedfordeleveraging.
On the supply side, in various euro area countries, capital and market-based funding constraints, albeit declining towards the end of the year, continued to limit the supply of MFI credit to the economy. The segmentation of financial markets further exacerbated developments in creditgrowth, although there were signs of receding segmentation from September onwards. Indeed, the non-standard monetary policy measures taken by the Governing Council of the ECB, in particular the three-year LTROs and the announcement on OMTs in August and of their technical features in September, are likely to have contributed to averting a disorderly deleveraging of the banking sector by alleviating the funding pressures on euro area credit institutions.

31ECB
Annual Report2012
Regarding the other counterparts ofM3, the annual growth rate ofMFI longer-termfinancialliabilities (excluding capital and reserves) held by the money-holding sector declined over the course of 2012, standing at -5.1% in December 2012, compared with 1.4% in December 2011, thereby supporting the increase in M3. This development was driven by sizeable declines in the growth of longer-term deposits and in the issuance of longer-term debt securities, the latter being influenced by buyback programmes ofMFIs, aimed at improving their capital position,and, in the case of other MFIs, by the replacement of market-based funding with the three-year LTROs.Theoutflowsfromlonger-termdepositslargelyreflectedareversalofpastsecuritisationactivities.
Finally,thenetexternalassetpositionofeuroareaMFIs–whichcapturesthecapitalflowsofthemoney-holding sector when routed via MFIs and the transfer of assets issued by the money-holding sector–increasedby€101billionoverthe12monthstoDecember2012.Whileearly2012mainlysawnetoutflows,netinflowswereregisteredinthesecondhalf.
money marKet ConditionS Continued to be aFFeCted by the SovereiGn debt CriSiS Conditions in euro area money markets continued to be affected by the sovereign debt crisis in 2012. The ECB policy decisions which had the most notable impact on euro area money markets were the allotment of the two three-year LTROs (on 21 December 2011 and 29 February 2012) and the lowering of the deposit facility rate to zero in July 2012 (see also Box 2).
Strongdemand fromcounterparties in the two three-yearLTROs led to a significant build-upof excess liquidity, which peaked at €773.9 billion on average during the sixth maintenance period of 2012. Partly as a consequence of the increase in excess liquidity, trading activity in euro area money markets declined further (see Chart 11 below, showing the decline in EONIA volumes over the year). However, the underlying reason for the continued decline in trading activity was the continued strong market segmentation caused by the sovereign debt crisis. The announcement on OMTs in August 2012 led to an overall improvement in financialmarket conditions and a reduction in excess liquidity, which stood at €622.7 billion on average during the last maintenance period of 2012. Owing to the high level of excess liquidity prevailing throughout 2012, short-term money market rates remained close to the rate on the deposit facility, exhibiting only mild volatility.
Chart 12 shows the development of three-month unsecured interest rates (the three-month EURIBOR) and three-month secured interest rates (the three-month EUREPO and the three-month overnight index swap rate). All of these money market interest rates decreased over the course of 2012. The EURIBOR and overnight index swap rates were particularly affected by the increase in excess liquidity and the increase in the expected duration of excess liquidity following the two three-year LTROs. Both
Chart 11 eonia volumes
(EUR billions; daily data)
0
5
10
15
20
25
30
35
40
45
0
5
10
15
20
25
30
35
40
45
20132012Jan. Apr. July Oct. Jan.
Sources: ECB and Thomson Reuters.

32ECBAnnual Report2012
of these interest rates decreased sharply in the first half of the year. During the second halfof 2012 the overnight index swap rate remained broadly stable, while the three-month EURIBOR continued to decline.
In July 2012 the Governing Council of the ECB reduced the key ECB interest rates by 25 basis points. The lowering of the rate on the deposit facility to zero was associated with short-term money market rates in the vicinity of zero, with some trades, especially in the secured segment, taking place at negative rates. The EONIA continued to stand at interest rates above zero. Recourse to the deposit facility declined as a result of the lowering of its remuneration rate to zero, as many counterparties decided to keep funds in excess of their reserve requirements in their current accounts. During the last maintenance period of 2012, for example, average recourse to the deposit facility stood at €239.1 billion, while average current account holdings in excess of reserve requirements stood at €383.6 billion.
Chart 12 three-month eurepo, euribor and overnight index swap rates
(percentages per annum; spread in basis points; daily data)
-20
0
20
40
60
80
100
120
140
160
180
200
-0.5
0.0
0.5
1.0
1.5
2.0
2.5
3.0
3.5
4.0
4.5
5.0
5.5
2007 2008 2009 2010 2011 2012 2013
spread between the three-month EURIBOR and the three-month EUREPO (right-hand scale)
three-month overnight index swap rate (left-hand scale) three-month EURIBOR (left-hand scale) three-month EUREPO (left-hand scale)
Sources: ECB and Thomson Reuters.
box 2
the impaCt oF non-Standard meaSureS deCided upon on 8 deCember 2011
On 8 December 2011 the Governing Council of the ECB decided on additional non-standard monetary policy measures,1 i.e.:
toconduct twolonger-termrefinancingoperations(LTROs)withamaturityof threeyears –and the option of early repayment after one year;
to discontinue for the time being, as of the maintenance period starting on 14 December 2011, –thefine-tuningoperationscarriedoutonthelastdayofeachmaintenanceperiod;
to reduce the ratio for minimum reserve requirements from 2% to 1% as of the maintenance –period starting on 18 January 2012;
to increase collateral availability by (i) reducing the rating threshold for certain asset-backed –securities (ABSs) and (ii) allowing NCBs, as a temporary solution, to accept as collateral additionalperformingcreditclaims(i.e.bankloans)thatsatisfyspecificeligibilitycriteria.
1 See theECB’spress releaseof8December2011, entitled “ECBannouncesmeasures to supportbank lendingandmoneymarketactivity”.

33ECB
Annual Report2012
This box reviews developments in the Eurosystem balance sheet following the introduction of these additional non-standard measures, as well as developments in money market rates. It also touches upon issues related to the Eurosystem’s risk exposure and discusses whether these measures imply risks to price stability in the euro area.
Developments in the Eurosystem balance sheet
The balance sheet of a central bank provides detailed information about how it uses its monetary policy instruments. It is therefore useful for understanding how monetary policy is implemented in both normal and crisis times. The Eurosystem has significantly expandedits balance sheet in response to the breakdown of various financial market segments(see Charts A and B). From 16 December 2011 to end-December 2012, the Eurosystem balance sheet increased by around 25% and reached a level slightly below €2,500 billion. Thisincreaseismainlyattributabletoincreasedprovisionofcentralbankrefinancingatlonger-termmaturities (the assets side of the simplified Eurosystem balance sheet2). Indeed, in the two three-year LTROs conducted on 21 December 2011 and 29 February 2012, a total amount of €1,018.7 billion was allotted. However, taking into account operations which matured in mid-December2011aswellas shifts indemandbetween refinancingoperationsaheadof thetwo three-year operations, the net increase in liquidity provision through the two three-year LTROs amounted to around €500 billion. In this connection, the provision of central bank refinancing through the weekly main refinancing operations (with a one-week maturity)decreased substantially, from €170 billion in mid-December 2011 to around €90 billion at the end of December 2012. Regarding the asset purchase programmes used for monetary policy, thefirst and secondcoveredbondpurchaseprogrammes (July2009 to June2010and
2 Seealsotheboxentitled“Simplifiedbalancesheets:methodology”inthearticleentitled“RecentdevelopmentsinthebalancesheetsoftheEurosystem,theFederalReserveSystemandtheBankofJapan”,Monthly Bulletin, ECB, October 2009.
Chart a Simplified eurosystem balance sheet: assets
(EUR billions)
500
1,000
1,500
2,000
2,500
3,000
500
1,000
1,500
2,000
2,500
3,000
002007 2008 2009 2010 2011 2012 2013
Securities Markets Programmemarginal lending facility and fine-tuning operationsLTROsdomestic assets
first covered bond purchase programmeUSD repos and swapsmain refinancing operationssecond covered bond purchase programmenet foreign assets
Source: ECB.

34ECBAnnual Report2012
November 2011 to October 2012) and the Securities Markets Programme together resulted in gross liquidity that averaged €279.8 billion in the review period (i.e. from mid-December 2011 to end-December 2012). Finally, the Eurosystem continued to hold, in net terms, sizeable amounts of foreign assets (i.e. foreign currency-denominated assets held outright for foreign exchange intervention or investment purposes) and domestic assets, which are held outright by NCBs and are not relevant for monetary policy implementation.
On the liabilities sideof the simplifiedEurosystembalance sheet, the two three-yearLTROsprompted a large increase in recourse to the deposit facility, which reached an all-time high of €827.5 billion on 5 March 2012. However, since July 2012 banks have instead held sizeable amounts of liquidity on their current accounts with their central banks. This stems mainly from the reduction of the deposit facility rate to zero in July 2012, which made banks indifferent as regards transferring theirexcess liquidity(definedas the liquidity inexcessof thebankingsector’s liquidity needs given by autonomous factors and reserve requirements) overnight to the deposit facility or leaving it unremunerated on their current accounts as excess reserves. In the period under review the Eurosystem continued to sterilise the liquidity impact stemming from the Securities Markets Programme. Banknotes in circulation remained broadly stable, while government deposits (i.e. treasury departments’ current account holdings with NCBs) almost tripled.One reason for this development is the difficulty encountered by treasuries inplacingfundswiththebankingsystem,owingforinstancetospecificrequirementsonthepartoftheformer(e.g.aspecificsetofassetsrequiredascollateralforthesetransactions).Finally,autonomousfactorsotherthanbanknotesandgovernmentdepositsincreasedsignificantly.
Chart b Simplified eurosystem balance sheet: liabilities
(EUR billions)
0
500
1,000
1,500
2,000
2,500
3,000
0
500
1,000
1,500
2,000
2,500
3,000
2007 2008 2009 2010 2011 2012 2013
liquidity-absorbing fine-tuning operations Federal Reserve System claims current accounts government deposits
Swiss National Bank claims deposit facility other autonomous factors banknotes
Source: ECB.

35ECB
Annual Report2012
Developments in money markets
After the two three-year LTROs, excess liquidity amounted to around €810 billion. At the end of December 2012 it hovered at €615 billion. As a result of such ample liquidity conditions, the EONIA remained at levels very close to the deposit facility rate; at the end of December 2012 it wasaround62basispointsbelowtherateonthemainrefinancingoperations.Thediscontinuationoftheend-of-maintenance-periodfine-tuningoperationsinJanuary2012removedthespikesinthe EONIA which traditionally occurred on the last day of the maintenance period and helped to depress volatility further.
Impact on the Eurosystem’s risk exposure
As a consequence of the expansion in monetary policy operations, the Eurosystem’s exposure to risksalsoincreasedduring2012.Centralbanksalwaystakeonsomefinancialriskwhenconductingthe market operations that are necessary for the implementation of monetary policy decisions. However, they put in place mechanisms to ensure that the risks are effectively mitigated.
As mentioned above, the decision announced on 8 December 2011 to conduct two LTROs with a three-year maturity was accompanied by a measure to increase collateral availability by (i) reducing the rating threshold for certain ABSs and (ii) allowing NCBs, as a temporary solution, to accept as collateral additional performing credit claims (i.e. bank loans) that satisfy specificeligibilitycriteria.Thisexpansionoftherangeofcollateralacceptedwasnecessarytoaddressthepotentialimpactoncollateral–viadiminishedeligibilityandincreasedhaircuts–ofrating downgrades.
Central banks’ risk-taking must be assessed against the expected benefits – in terms ofcontributions to the fulfilment of institutional objectives – of the associated measures. TheEurosystem’s carefully designed risk management framework enables the central banks of the euro area to support the economy effectively by optimising the relationship between policy efficiency and risk-taking. Risks are constantly monitored and assessed against availablefinancialbuffersattheEurosystemlevel.Theefficiencyoftheriskmanagementframeworkisalso evaluated on an ongoing basis.
ThefirstlineofdefencetoensureadequateprotectionoftheEurosystem’sbalancesheetconsistsin accepting only counterparties considered financially sound. Additionally, the Eurosystemrequires that its counterparties provide adequate collateral. This collateral is revalued on a daily basis using observed market prices, or appropriate theoretical pricing methods where reliable daily market prices are not available. Moreover, haircuts are applied in order to protect the Eurosystem from financial losses in the event of sharp declines in the price of an assetafter a counterparty’s default (with an additional haircut in the case of theoretical valuation). This framework ensures a high recovery value in the event of a counterparty defaulting. In this waytheEurosystemmanagesitsexposureandrisk-takingsoastoensurethefulfilmentofitsprimary mandate, the maintenance of price stability.
Eight frameworks 3 for additional credit claims have so far been approved by the Governing Council of the ECB. The haircuts applicable have been calibrated to keep the risks at an acceptable
3 Frameworks proposed by the Central Bank of Ireland, the Bank of Greece, the Banco de España, the Banque de France, the Banca d’Italia, the Central Bank of Cyprus, the Oesterreichische Nationalbank and the Banco de Portugal.

36ECBAnnual Report2012
level, complying with Article 18.1 of the Statute of the ESCB (which states that Eurosystem creditoperationsmustbebasedon“adequatecollateral”).Theadditionalcreditclaimsintroducemore underlying obligors, belonging to different sectors of the economy, to the collateral pools andhenceimprovethediversificationofthecollateralportfolios.Allinall,theincrementalrisksassociated with the lower eligibility thresholds applied to the additional credit claims, measured astheexpectedshortfallata99%confidenceleveloveraone-yearhorizon,arecoveredbytheappliedhaircuts,notleastinviewofthediversificationeffectsexplainedabove.
Implications for price stability
As discussed above, the expansion of the balance sheet of the Eurosystem between December 2011 and December 2012 was largely driven by banks’ high demand in the twothree-yearrefinancingoperations.Thislevelofdemandledtoanincreaseinexcessliquidity.Banks place excess liquidity in current accounts, the deposit facility or weekly liquidity-absorbing operations with the Eurosystem.
The question may arise as to whether holding such large amounts of excess liquidity poses risks to price stability. This is currently not the case. The high demand on the part of euro areabanksforcentralbankrefinancingisaconsequenceof themalfunctioningof interbankmarkets. The building-up of large excess liquidity positions by euro area banks is the outcome of central bank policy action to counter funding constraints in interbank money markets and thereby forestall a disorderly deleveraging process that could have curtailed the supply of credittotherealeconomy.Suchacurtailmentcouldhavecreatedsignificantdownwardrisksto price stability.
Overthemediumtolongterm,inflationriskisassociatedwithhighgrowthofmonetaryliquidity,as measured, in particular, by M3 growth. However, such monetary growth is essentially unrelated to the amount of excess liquidity held by the euro area banking sector. There is not necessarily a stable relationship between bank reserves and, in particular, excess liquidity held by euro area banks on the one hand and monetary liquidity on the other, as evidenced by the subdued pace of money and credit growth observed since late 2010. The reason for the absence of such a relationship is related to the nature of central bank reserves, as their ultimate and main value lies intheirnatureasthesolemediumofexchangebywhichreserverequirementscanbefulfilledandautonomousfactorsrefinanced.4 It follows that the amount of central bank reserves held by abankisnot thedeterminingfactor in itsability togeneratenewloans.Factors influencingabank’s loan supply are, among other things, its capital position, its monitoring technology and its cost structure.
A possible tangible effect of the large amount of excess liquidity held by the banking sector mightbeitsimpactonassetpricesandmoneymarketrates,affectingbanks’refinancingcosts,the relative prices of alternative investment opportunities and, via these channels, the supply of bank loans. As described above in more detail, the direct impact on short-term money market ratesoftheadditionalcentralbankrefinancingofbanksthroughthetwothree-yearLTROswasrelatively muted, while longer-term money market rates tended to decrease more, mainly as a consequence of the extended maturity of the operations.
4 Foramoredetailedanalysis,seetheboxentitled“Therelationshipbetweenbasemoney,broadmoneyandriskstopricestability”,Monthly Bulletin, ECB, May 2012.

37ECB
Annual Report2012
tenSionS in euro area Government bond marKetS eaSed marKedly in the SeCond halF oF 2012AAA-rated long-term government bond yields in the euro area fell from around 2.6% at the beginning of January 2012 to 1.7% at the end of December (see Chart 13). In the United States, yields on long-term government bonds declined only slightly over the same period, from around 1.9% to around 1.8%.
The most pronounced difference in bond market developments in the two main economic areas couldbeobservedinthefirstquarterof2012.WhereasAAA-ratedten-yeargovernmentbondyieldsin the euro area remained broadly unchanged, ten-year government bond yields in the United States increased by more than 30 basis points. In the second quarter of 2012 yields in the euro area and the United States followed a broadly similar downward trend, although yields on ten-year US government bonds were generally around 30 basis points below those of their euro area counterparts. In the remainder of the year yields in the two areas tended to converge.
The development of government bond yields in 2012 can be broken down into three distinct phases. In the first phase, which lasted fromJanuary to mid-March, sovereign bond market sentiment was rather positive on both sides of the Atlantic. In the euro area, this manifested itself in a decline of the spreads between government bond yields in countries under financial stress,on the one hand, and those of AAA-rated issuers on the other. Several positive steps towards the resolution of the euro area sovereign debt crisis played a role in this regard. First, banks in the euro area received an extraordinary monetary policy stimulus, primarily in the form of three-year LTROs; second, a “fiscal compact”was established among euro area countries;4 and, third, the Greek private sector involvement resulted in a successful debt swap, which improved the prospects for avoiding a disorderly
4 Thefiscalcompacthasbeenimplementedasanintergovernmentaltreatyconcludedby25ofthe27EUMemberStates.
From the perspective of the monetary pillar of the ECB’s monetary policy strategy, therefore, the additional monetary stimulus resulting from higher asset prices and lower money market rates has not translated into a pick-up in growth of monetary aggregates and is therefore not associated with risks to price stability over the medium to longer term.
Finally, it should be stressed that large quantities of excess liquidity do not prevent the ECB from raising interest rates should its comprehensive analysis of risks to price stability point to a need to tighten the stance of monetary policy.
Chart 13 long-term government bond yields
(percentages per annum; daily data)
1.0
1.5
2.0
2.5
3.0
3.5
4.0
4.5
5.0
5.5
1.0
1.5
2.0
2.5
3.0
3.5
4.0
4.5
5.0
5.5
2007 2008 2009 2010 2011 2012
euro areaUnited States
Sources: Bloomberg, EuroMTS and ECB.Notes: The euro area ten-year bond yield is represented by the ten-year par yield derived from the yield curve of AAA-rated euro area government bonds, as estimated by the ECB. For the United States, yields on ten-year government bonds are shown.

38ECBAnnual Report2012
restructuringofsovereigndebtinGreece.Mixedeconomicandfinancialnews,includingdowngradesof thecreditratingsofseveraleuroareasovereigns,didnotweighsignificantlyoneuroareabondmarket sentiment. In the United States, the positive market sentiment was driven mainly by better than expected macroeconomic data releases, supporting the increase in US ten-year government bond yields.
The second phase lasted from mid-March to the end of July. During this period AAA-rated long-term government bond yields in the euro area and US long-term government bond yields declinedsignificantly.Thereasonforthistrendreversalwastwofold.First,adeclineincoincidentand forward-looking indicators of activity in the main economic areas, as well as a fall in householdandbusinessconfidenceandweaklabourmarketdata,promptedasignificantdownward reassessmentoftheoutlookforglobalgrowth.Second,concernsaboutthepoliticalandfinancialstability of the euro area re-emerged and triggered renewed flight-to-safety flows andwideningspreads for some euro area government bonds. These concerns were mainly fuelled by the outcome of the Greek elections in May, by a number of downgrades of Spanish and Italian banks and by Moody’s downgrade of the Spanish sovereign rating in June.
The thirdphasestarted in late July,when theECBreaffirmed the irreversibilityof theeuroandstressed that risk premia related to fears of the reversibility of the euro would be addressed. This statement was confirmed by the announcement of OMTs and their modalities inearly August and September respectively. As a result, bond market sentiment in the euro area improved significantly. In particular, there was no further decline in yields on AAA-rated government bonds, which subsequently remained relatively stable between early August and the end of 2012. Moreover, investors’ uncertainty about near-term bond market developments intheeuroarea,asmeasuredbyoption-impliedvolatility,droppedsignificantlyfromthesummerpeak of around 9.5% to around 5.6% at the end of the year. In addition, the yields on government bonds of euro area countries under financial stress decreased significantly over the period. The positive market momentum was supported further by advances in both the design of the single supervisory mechanism (SSM) and the restructuring of the Spanish banking system, as well as by the success of the Greek debt buyback operation in December, with the subsequent approval of the disbursementofaidforGreece.Allthesefactorssignificantlyimprovedfinancialmarketconfidenceandreducedthefragmentationoffinancialmarketsintheeuroareaattheendof2012.However,it remains the responsibility of governments to use the more resilient market conditions to take swift actions to tackle the fundamental causes of the crisis. In the United States, concerns about the loomingfiscalcliffintensifiedaftertheUSpresidentialelectionsinNovember.Asaresult,yieldson ten-year government bonds in the United States rose from the historical lows of around 1.4% observed at the end of July to around 1.8% at the end of 2012.
A key feature of the euro area government bond markets in 2012 was that yields tended to converge across most euro area countries, as a consequence of the aforementioned steps towards a positive resolution of the euro area sovereign debt crisis. The converging trend was most pronounced at thebeginningof2012andinthelastfivemonthsof2012,whileyieldsofsomecountries,notablySpain and Italy, deviated from this trend from mid-March to late July. Overall, from January to December 2012 ten-year government bond spreads vis-à-vis the German Bund declined acrossall main euro area countries except Spain, where the spread increased by around 70 basis points (seeChart14).Countriesunderfinancialassistanceprogrammesbenefitedmostfromthepositivemarket sentiment with respect to the euro area. Greek spreads vis-à-vis the German Bund fellby more than 2,000 basis points, while the corresponding Portuguese and Irish spreads declined by around 600 and 350 basis points respectively. Italy and Belgium also saw a significant

39ECB
Annual Report2012
narrowing of spreads, namely decreases of around 190 and 160 basis points respectively.
These developments were accompanied by a significantdeclineincreditdefaultswap(CDS)premia for sovereigns of all euro area countries. Nevertheless, the tensions were far from over at the end of 2012. In particular, the spreads and CDS premia of euro area sovereigns under financialstressattheendof2012remainedwellabove the levels observed before the onset of the sovereign debt crisis.
In the light of the worsening economic outlook, real yields on AAA-rated government bonds in the euro area tended to decline further in 2012, despite the already low levels of around 0.0% and 0.7% recorded for five-year and ten-yearbonds respectively at the beginning of 2012. In particular, the prospect of continued weak economic activity dragged the real yields on AAA-rated government bonds with five-yearmaturities into negative territory in early 2012, where they stayed for the rest of the year. Real yields on AAA-rated government bonds with ten-year maturities also turned negative in 2012, but onlyinthemiddleoftheyear.AttheendofDecember2012therealfive-yearandten-yearspotyields stood at around -0.8% and -0.2% respectively. Overall, the decline in real yields over the yeartookplaceinacontextofbroadlystableinflationexpectations(seeBox3).Attheendof2012thefive-yearforwardbreak-eveninflationratefiveyearsaheadstoodataround2.5%,alevelsimilarto that observed at the beginning of the year,while the inflation swap ratewith the same timehorizon stood close to 2.2%, around 20 basis points lower than a year earlier.
Chart 14 Government bond spreads of selected euro area countries
(basis points; daily data)
0
1,000
2,000
3,000
4,000
5,000
0
300
600
900
1,200
1,500
2007 2008 2009 2010 2011 2012
Belgium SpainFrance IrelandItaly PortugalGreece (right-hand scale)
Source: Thomson Reuters.Note: Spread between the yield on ten-year government bonds and that on corresponding German government bonds.
box 3
trendS in euro area lonG-term inFlation eXpeCtationS
The ECB’s monetary policy is focused on delivering price stability in the euro area over the mediumterm.Tothatend, theclosemonitoringof long-terminflationexpectationsremainsapriority.Thisboxreviewsdevelopmentsinavailableindicatorsoflong-terminflationexpectationsintheeuroareaduring2012,andshowsthatbothsurvey-basedandfinancialindicatorspointtofirmlyanchoredinflationexpectationsatlevelsconsistentwithpricestability.1
Survey-based indicators of inflation expectations
During2012survey-basedlong-terminflationexpectationsremainedclosetotheirhistoricalaverage(seeChartA).Long-terminflationexpectationsfromtheECBSurveyofProfessionalForecasters ticked up from an average of 1.98% in 2011 to 1.99% in 2012. Expectations from
1 Seealsothearticleentitled“Assessingtheanchoringoflong-terminflationexpectations”,Monthly Bulletin, ECB, July 2012.

40ECBAnnual Report2012
the Euro Zone Barometer stood at 2.10% on average in 2012, up from 2.03% in 2011, while those from Consensus Economics decreased to 2.00% in 2012, down from 2.05% in 2011.
Financial indicators of inflation expectations
Financial indicators of inflation expectationstend to exhibit higher volatility than their survey-based counterparts (see Charts B and C). Since break-even inflation rates (BEIRs) –calculated as the yield spread between nominal andinflation-linkedbonds–andotherfinancialindicators comprise not only the level of expected inflation, but also the compensation(risk premia) for the risks surrounding that future level, their higher volatility is often related to changes in risk premia. In this regard, since the autumn of 2008 the higher volatility of financial asset prices in general and bondyields in particular has also pushed up the (temporary)volatilityoffinancialindicatorsofinflationexpectations.2
Five-year forward BEIRs five years ahead – a benchmark indicator of long-term inflationexpectations(andrelatedpremia)–stoodataround2.4%onaveragein2012,closetothelevelobserved in 2011 and only marginally higher than their historical average of 2.3% since 2004. However, long-term forward BEIRs were somewhat more volatile than usual during 2012, fluctuatingwithinarangeof2.1%to2.7%.
Fluctuations of long-term forward BEIRs during 2012 appear more strongly related to temporarymarket phenomena than to changes in inflation expectations (and related premia). Notably, episodes of upward and downward trends in long-term forward BEIRs may result from flight-to-safety flows, which tend to have a different effect on AAA-rated nominaland inflation-linked bond yields. Specifically, following flight-to-safety flows the yield on AAA-ratednominalbonds tends todecreasefurther than theyieldson inflation-linkedbonds,therebyreducingthecalculatedBEIRs.Conversely,whentheseflowsarereversed,thecalculatedBEIRsincrease,withoutanychangeinunderlyinginflationexpectations.
Inthiscontext,BEIRstendedtobebelowtheiryear-longaverageinthefirsthalfoftheyear,whenre-emergingmarkettensionstriggeredflight-to-safetyflowsintoAAA-ratedbonds.Inthesecond half of the year, however, with the easing of market tensions following the announcement
2 In late 2011 the ECB changed its method for estimating break-even inflation rates for the euro area to reduce distortions stemming fromwidening spreadsbetweenGermanandFrenchbondyields; seealso theboxentitled“Estimating realyields andbreak-eveninflationratesfollowingtherecentintensificationofthesovereigndebtcrisis”,Monthly Bulletin, ECB, December 2011.
Chart a long-term inflation expectations from surveys
(quarterly data; annual percentage changes)
1.6
1.8
2.0
2.2
2.4
1.6
1.8
2.0
2.2
2.4
2004 2005 2006 2007 2008 2009 2010 2011 2012
Consensus EconomicsEuro Zone BarometerECB Survey of Professional Forecasters
Sources: ECB, Euro Zone Barometer and Consensus Economics.Notes:Long-term inflation expectations are surveyedquarterlyin the ECB Survey of Professional Forecasters (SPF) and the Euro Zone Barometer and biannually by Consensus Economics. Theforecasthorizondiffersacrosssurveys:fiveyearsaheadinthe SPF, four years ahead in the Euro Zone Barometer and six to ten years ahead in Consensus Economics forecasts.

41ECB
Annual Report2012
of additional non-standard monetary policy measures, there was a gradual unwinding of previous flight-to-safety flows, resulting in awidening of the calculatedBEIRs. This is, for example,corroborated by lower liquidity premia in German and French government-sponsored agency bonds relative to their sovereign counterparts. In addition, following the downgrading of ItaliansovereigndebtbyMoody’sfromA3toBaa2inJuly,Italianinflation-linkedbondswereremoved from some key inflation-linked bond indices, triggering some portfolio reallocationflowsintoAAA-ratedinflation-linkedbondsandloweringtheiryields.Thecombinationoftheunwindingofflight-to-safetyflowsinthenominalbondmarketandportfolioreallocationflowsintoAAA-ratedinflation-linkedbondsexertedsomeupwardpressureonBEIRsin thesecondhalf of the year.
TwofurtherobservationsconfirmthesignificanceofmarketphenomenainexplainingtherecentvolatilityinBEIRs.First,long-termforwardindicatorsbasedoninflation-linkedswaps,whichshouldbelessaffectedbyflight-to-safetyflows,remainedmorestablethanbondmarket-basedBEIRs,fluctuatingaroundaloweraveragelevelof2.3%andwithinarangeof2.1%to2.6%.
Second,adecompositionofthelong-termforwardBEIRsintoinflationexpectations,inflationriskpremia and measurement errors (which can be related to market liquidity distortions) using term structuremodels,aspresentedinChartD,showsthattheidentifiedmarketdistortionsaffectingthecalculationoflong-termforwardBEIRshaveincreasedsignificantlysincethebeginningofthefinancialcrisis,wideningthegapbetweentheobservedandthemodel-basedlong-termforwardBEIRs.At thesame time, theestimated levelsof long-term inflationexpectations infinancialmarkets, at slightly below 2% in 2012, remained consistent with price stability and survey data. Inaddition,theinflationriskpremiaremainedquitecontainedatrelativelylowlevelsbyhistoricalstandards,possiblyreflectingthemacroeconomicconditionsintheeuroarea.Needlesstosay,
Chart C long-term forward break-even inflation rates and inflation-linked swap rates in the euro area(daily data; percentages per annum)
1.75
2.00
2.25
2.50
2.75
3.00
1.75
2.00
2.25
2.50
2.75
3.00
2010 2011 2012
five-year forward inflation-linked swap ratefive years ahead
five-year forward BEIR five years ahead
Sources: Thomson Reuters, ICAP and ECB calculations.Note:Zerocouponbreak-eveninflationrates,seasonallyadjusted,estimatedfromAAA-ratedinflation-linkedbondsindexedtoeuroareainflation.
Chart b long-term break-even inflation rates in the euro area
(daily data; percentages per annum)
1.0
1.4
1.8
2.2
2.6
3.0
1.0
1.4
1.8
2.2
2.6
3.0
2010 2011 2012
five-year forward BEIR five years aheadspot ten-year BEIRspot five-year BEIR
Sources: Thomson Reuters and ECB calculations.Note: Zero coupon break-even inflation rates, seasonallyadjusted, estimated from AAA-rated inflation-linked bondsindexedtoeuroareainflation.

42ECBAnnual Report2012
euro area equity priCeS inCreaSed Sharply in 2012Equity prices in the euro area and the United States rose by around 16% and 13% respectively in 2012 (see Chart 15). This compares with an increase of around 23% in Japan. The broad equity indices in the euro area and in the United States moved broadly in tandem throughout the year. Despite the sound overall performance of equity markets in the euro area, the increase in the broad equity index was not distributed evenly across the euro area as therewere significant differences fromcountry to country.
Inthefirstquarterof2012equitymarketsralliedstrongly in both the euro area and the United States, with the Dow Jones EURO STOXX and the S&P 500 indices increasing by around 14% and 12% respectively between the beginning of January and mid-March. In addition, stock market
econometric models covering the crisis period should be interpreted very cautiously. Several pieces of research confirm that distortionsin nominal and real yields identified in theterm structure model are indeed related to flight-to-safety flows and asset-specificliquidity premium measures respectively.3
Despite the evidence in support of the anchoring of long-term inflation expectations, at thecurrent juncture there is also evidence pointing to significant uncertainty surrounding theinflation outlook. Uncertainty measures fromsurvey data remained at relatively high levels in recent years and relatively extreme (high and low)inflationoutcomescontinuetobehedgedagainstthroughinflationcapsandfloors.Closemonitoring of those additional indicators of inflation expectations is also warranted. Nevertheless, on balance, available evidence from both survey data and financial marketindicators suggests that euro area long-term inflation expectations remainfirmly anchoredat levels consistent with price stability. 3 SeeGarcia,J.A.andWerner,T.,“Inflationcompensationandinflationriskpremiaintheeuroareatermstructureofinterestrates”,
in Chadha, J., Durré, A. and Joyce, M. (eds), Modern Macroeconomic Policy Making, Cambridge University Press, Cambridge, 2013.
Chart d decomposition of euro area long-term forward break-even inflation rates
(monthly data; percentages per annum)
0.0
0.5
1.0
1.5
2.0
2.5
3.0
-0.5
0.0
0.5
1.0
1.5
2.0
2.5
2004 2005 2006 2007 2008 2009 2010 2011 2012
Consensus Economics long-term inflation expectations (six to ten years)
model-based inflation expectations (five to ten years) model-based five-year forward BEIR five years ahead observed five-year forward BEIR five years ahead inflation risk premia (left-hand scale)
Sources: Thomson Reuters and ECB calculations.Note: For a detailed model description, see Garcia, J.A. and Werner,T.,“Inflationrisksandinflationriskpremia”,Working Paper Series, No 1162, ECB, Frankfurt am Main, March 2010.
Chart 15 major stock market indices
(indices rebased to 100 on 1 January 2012; daily data)
40
60
80
100
120
140
160
180
200
220
240
40
60
80
100
120
140
160
180
200
220
240
2007 2008 2009 2010 2011 2012
JapanUnited Stateseuro area
Source: Thomson Reuters.Note: The indices used are the Dow Jones EURO STOXX broad index for the euro area, the Standard & Poor’s 500 index for the United States and the Nikkei 225 index for Japan.

43ECB
Annual Report2012
uncertainty, as measured by implied volatility, decreased markedly on both sides of the Atlantic. Marketgainsinbotheconomicareaswereledbythefinancialsector,withcorrespondingequityprices in the euro area and the United States rising by around 17% and 18% respectively. Financial stocks in the euro area grew mainly on the back of the monetary stimulus provided in the form of the three-yearLTROs,whichsignificantlyalleviatedbanks’ fundingpressures. Inaddition,financialequities in the euro area benefited from prospects of more limited negative spillovers fromsovereignstothefinancialsectorasaconsequenceofthepolicymeasuresagreedatthemeetingofeuro area Heads of State or Government at the end of January. By contrast, downgrades of the credit ratingsofsomeeuroareabanksandgenerallyweakearningsreportsdidnotweighsignificantlyonmarket sentiment.
The positive trend in equity prices reversed in the second half of March 2012, with subsequent declines that were more pronounced in the euro area than in the United States. Whereas stock prices in the euro area, as measured by the Dow Jones EURO STOXX index, fell by almost 15% between mid-March and mid-June, those in the United States, as measured by the S&P 500 index, declined by around 4% over the same period. Moreover, stock market uncertainty, as measured by implied volatility, rose markedly in the euro area (by 14 percentage points), while it increased only moderately in the United States (by 5 percentage points). The sharp decline in euro area equities wasprimarilyduetolossesinthefinancialsector,giventhattherelatedsub-indexdeclinedbymorethan 20%. Moreover, there appeared to have been a new surge in market participants’ risk aversion on the back of a number of downgrades of Italian and Spanish banks and political uncertainty in Greece. The general moderation of economic activity and the increase in default risk for European corporations also weighed on euro area stock prices in general.
Stockmarketsentimentimprovedsignificantlyinthethirdquarter,whichstoodinsharpcontrastto the negative developments in the second quarter. In particular, stock markets in the euro area ralliedonthebackofastrongrecoveryinfinancialequityprices,asmarketconcernsaboutfinancialstability receded following statements from policy-makers regarding their commitment to take the necessarystepstoresolvethecrisis.TheECBreaffirmedtheirreversibilityoftheeuroinlateJulyand subsequently announced OMTs and their modalities in early August and September respectively to address risk premia that were related to fears that national currencies might be reintroduced. Further supportwas provided by political initiatives to strengthenfinancial stability in the euroarea via a banking union (starting with the creation of the SSM) and by the German constitutional court’s ruling on the European Stability Mechanism. Finally, further monetary stimulus in the United States also bolstered equity markets. As a result, the Dow Jones EURO STOXX index rose by 12% between mid-June and the end of September, while the S&P 500 index increased by around 7%over the sameperiod. In addition, both economic areas experienced a significant decline instock market uncertainty, as measured by implied volatility.
Stock prices in the euro area continued to rise in the last quarter of the year, albeit at a slower pace than in the third quarter. Further concrete decisions on the design of the SSM also contributed to the positive stock market sentiment, while the worsening economic outlook weighed negatively thereon. Overall, stock prices in the euro area, as measured by the Dow Jones EURO STOXX index, gained around 7% in the final quarter. Equity prices in the financial sector continued tooutperformthoseinthenon-financialsector,withtheformerincreasingby10%andthelatterby6%. In the United States, the S&P 500 index remained broadly unchanged over the same period, as signs of improvement in the US housing and labour markets were offset by concerns about the loomingfiscalcliff.

44ECBAnnual Report2012
houSehold borrowinG deClined Further In 2012 the annual growth rate of total loans to households continued to decline, standing at 0.5% inDecember2012,downfrom1.6%inDecember2011.This reflectsasimilardevelopment forMFI loans to households when adjusted for loan sales and securitisation. This similarity can be explained by the fact that MFIs remain the main provider of loans to households. In addition, non-MFI provision of loans to households largely mirrors the loan sales and securitisation activities of MFIs, which, depending on national accounting practices, result in household loans being shifted from the MFI sector to the OFI sector.
Lending for house purchase remained the main driver of growth in MFI loans to households. The annual growth rate of loans for house purchase, which stood at 2.3% at the end of 2011, continued to decline, standing at 0.7% in September before rebounding to 1.3% in December 2012. Theeuroareagrowthratesmasksignificantcross-countryheterogeneity,whichin2012continuedto be caused by differing degrees of indebtedness, resulting in varying deleveraging needs, as well as bydifferencesinbanks’abilityandwillingnesstolend.Furthermore,thegrowthprofileoflendingtohouseholdsforhousepurchaseislikelytohavereflectedtheweakeningineconomicactivityandthedeterioration inhousingmarketprospectsandconsumerconfidence.These factorswerealsoidentified in theeuroareabank lendingsurveyas themaindriversof thedecline innetdemandforhousingloans in thefirsthalfof2012.Fromasupply-sideperspective, in thesecondhalfof2012 the net tightening of credit standards was rather limited, as the ECB’s non-standard policy measures (especially the two three-year LTROs conducted in late 2011 and early 2012) helped to ease constraints on banks’ lending to households by allowing banks to access medium-term funding at low costs. In line with the decrease in market rates, banks’ lending rates for loans for house purchase declined over the course of 2012 for the euro area as a whole.
After some stabilisation in the first quarter of2012, the annual growth rate of consumer credit resumed its decline and remained negative, standing at -2.8% in December 2012, down from -1.8% in December 2011. The weak developments observed in consumer credit were due largely to demand factors (affecting this type of lending in particular) and were, at the same time, in line with the results of consumer surveys. Subdued growth in households’ real disposable income and the fact that household indebtedness remained at very high levels in a number of euro area countries continued to dampen demand for consumer credit. In line with this, the bank lending survey reported both declining demand and a slight tightening of credit standards for this type of loan. Banks’ lending rates for consumer credit declined in the second half of the year (see Chart 16). This notwithstanding, there was considerable heterogeneity in MFI lending rates across the euro area.
Chart 16 interest rates for lending to households and non-financial corporations
(percentages per annum; excluding charges; rates on new business)
2
3
4
5
6
7
8
9
10
2
3
4
5
6
7
8
9
10
2007 2008 2009 2010 2011 2012
short-term rates for lending to non-financial corporationslong-term rates for lending to non-financial corporationsrates for loans to households for house purchaserates for loans to households for consumer credit
Source: ECB.

45ECB
Annual Report2012
houSehold indebtedneSS waS broadly unChanGed, but remained hiGh 2012 saw a slight increase in the ratio of household debt to nominal gross disposable income, to a level close to that seen in mid-2010. This moderate increase reflected growth intotal household debt combined with stagnating disposable income (see Chart 17). The interest payments by households as a percentage of gross disposable income remained broadly unchanged over the course of 2012, mainly owing to a slight decrease in interest rates on lending for house purchase. By contrast, the household debt-to-GDP ratio is estimated to have declined slightly and stood at 66.0% in the fourth quarter of 2012.
deCline in the CoSt oF eXternal FinanCinG For non-FinanCial CorporationSTheoverall costof externalfinancing fornon-financial corporations declined by around80 basis points from the end of 2011 to the end of 2012. The decline was shared across the sources ofexternalfinancing (seeChart18).However,although the average funding costs decreased for non-financialcorporationsintheeuroareaasawhole,significantregionaldispersionpersisted.
The pass-through of the cuts in monetary policy rates, implemented in late 2011, together with the improved market sentiment following the three-year LTROs conducted in December 2011 and February 2012 contributed to the decline in thecostofexternalfinancingfornon-financialcorporations in the first part of the year. Thedecline came to a halt around the middle of the year when market tensions increased. However, with the further cut in monetary policy rates implemented in July 2012 and the announcement oftheOMTs,theexternalcostoffinancingfellagain, at a quicker pace.
Regarding the cost of bank-based financing,short-term nominal MFI lending rates decreased from 3.7% at the end of 2011 to 2.9% at the end of 2012. Over the same period short-term market rates declined to a greater extent, by around 120 basis points for the three-month EURIBOR. The spread between short-term MFI
Chart 17 household debt and interest payments
(percentages)
1.0
1.5
2.0
2.5
3.0
3.5
4.0
4.5
40
50
60
70
80
90
100
110
2007 2008 2009 2010 2011 2012
interest payments as a percentage of gross disposable income (right-hand scale)ratio of household debt to gross disposable income(left-hand scale)ratio of household debt to GDP (left-hand scale)
Sources: ECB and Eurostat.Notes: Household debt comprises total loans to households from all institutional sectors, including the rest of the world. Interest payments do not include the full financing costs paidby households, as they exclude the fees for financial services.Data for the last quarter shown have been partly estimated.
Chart 18 overall cost of the external financing of non-financial corporations and components(percentages per annum)
20126
8
10
12
2
4
6
8
2007 2008 2009 2010 2011
long-term MFI lending ratescost of market-based debtcost of quoted equity (right-hand scale)short-term MFI lending ratesoverall cost of financing
Sources: ECB, Thomson Reuters and Merrill Lynch.Notes:Theoverallcostoftheexternalfinancingofnon-financialcorporations is calculated as a weighted average of the cost of bank lending, the cost of debt securities and the cost of equity, based on their respective amounts outstanding (see the box entitled“Ameasureoftherealcostoftheexternalfinancingofeuro area non-financial corporations”,Monthly Bulletin, ECB, March 2005).

46ECBAnnual Report2012
lending rates and the three-month money market rate hence increased throughout 2012. Long-term nominal MFI lending rates declined less than short-term nominal lending rates, by around 60 basis points. The spread between the long-term nominal MFI lending rate and the ten-year overnight index swap rate also widened.
Whilethecutsinmonetarypolicyratesimplementedinlate2011maylargelybereflectedinlendingrates by the end of 2012, the pass-through of the cut in the monetary policy rate implemented in July 2012 may still be incomplete, therefore explaining part of the increase in bank lending spreads. Moreover, in 2012 MFI lending rates remained widely dispersed across euro area countries. Indeed, several factors may have contributed to higher lending rate spreads, particularly in some euro area countries, some of them suggesting impairments to the monetary transmission mechanism. On the one hand, the deteriorating creditworthiness of corporations in some jurisdictions due to a prolonged period of weak economic activity and strong uncertainty regarding the growth outlook caused banks to charge higher risk compensation and therefore higher lending rates. On the other hand, theincreaseinbanklendingspreadsmayhavereflectedthespillovereffectsofsovereignmarkettensions on bank funding conditions, as well as some possible impact from banks’ deleveraging strategies in a context of adjustment towards higher regulatory capital requirements.
The cost ofmarket-based debt financing declined by around 180 basis points between the endof 2011 and the end of 2012, reaching a historical low at the end of the year. The decline took place over two periods. At the beginning of the year it was partly driven by the cuts in monetary policy rates in late 2011 as well as the favourable spillovers resulting from the ECB’s non-standard measures, in particular the two three-year LTROs. The decline came to a halt around the middle oftheyearwhenmarkettensionsreintensified,butresumedfollowingthepolicyactions–thecutinmonetarypolicyratesinJuly2012andtheannouncementoftheOMTs–whenconfidencewasrestored and market sentiment strongly improved.
The cost of issuing quoted equity also declined over 2012 and stood in December 2012 around 60 basis points lower than 12 months before. More noticeably than the cost of market debt, the cost of equity was affected by the renewal of market tensions before the middle of 2012. However, theincreaserecordedinthesecondquarterof2012wasquicklyreversedasconfidenceimprovedfollowing the policy actions implemented or announced in the second half of 2012.
muted reCourSe to eXternal FinanCinGThe increase in the net external financing of euro area non-financial corporationswasmuted in2012 and reached a historically low amount of less than €100 billion cumulated over the year. In terms of components, the decline in newMFI loans to non-financial corporationswas partlycounterbalanced by an increasing issuance of market-based debt, while the issuance of quoted shares remained subdued.
Looking in more detail, after the small increase recorded in 2011, loans to non-financialcorporationsdeclinedin2012,byaround€50billionintotal.Turningtomarket-basedfinancing,the annual growth rate of debt securities issuance increased, from 5% at the end of 2011 to 12% at the end of 2012, but remained below the previous peak of 16% recorded at the beginning of 2010 (see Chart 19). At the same time, growth in the issuance of quoted shares remained subdued.

47ECB
Annual Report2012
The slowdown in the demand for external financing is partly related to deterioratingeconomic conditions and weak investment dynamics. Indeed, according to the euro area bank lending survey, the demand for corporate loans in the euro area contracted in net terms for thewholeyear,onthebackoflowerfinancingneeds for investments and inventories. The availability of internal funds may also explain the moderate dynamics of external financing,in particular for large firms, as shown byfinancial statements from listed non-financialcorporations.Asregardssmallfirms,thesurveyon theaccess tofinanceofsmallandmedium-sized enterprises (SMEs) in the euro area portrayed a bleaker picture.
Turning to the supply of credit, the euro area bank lending survey showed that euro area banks credit standards for loans to enterprises remained tight in 2012, with the net percentage changes in credit standards revealing some additional tightening over the year. As the year progressed, risk perceptions appeared to have a moresignificanteffectoncreditsupplyconditions,while,conversely, following theECB’snon-standard policy measures (especially the two three-year LTROs), banks’ balance sheet or funding constraints exerted less pressure on the tightening of credit standards.
Themovementsinexternalfinancingflowsrecordedin2012suggestthatsomefirmswereabletodiversifytheirsourcesoffinancinginresponsetotighterbanklendingstandards.Suchsubstitutionawayfrombankfinancingremainedlimitedtolargercompanies,whicharepredominantlydomiciledin countries with more developed corporate bond markets. At the same time, those corporations thataremostdependentonbankfunding,includingSMEs,andfirmslocatedinstressedcountriesremained vulnerable to tight credit supply. More specifically, the two waves of the survey onSMEs’accesstofinanceconductedin2012emphasisedthatfinancingconditionsforSMEswerediverseacrosseuroareacountries,withclearfinancingobstacles forSMEs incountries thataremore strongly affected by the crisis.
Stable Corporate indebtedneSS Theweakeconomicactivity recorded in2012weighedon theeuroareanon-financial corporatesector’searningscapacity,withcorporateprofitabilityremainingatrelativelylowlevelsthroughoutthe year. With a reduced capacity to accumulate earnings, the corporate sector’s efforts to deleverage have been hampered.
Acrossfirms’ size,however,developments inprofitabilityvariedmarkedly in2012.On theonehand,signsofamoderateimprovementinfirms’profitabilityhaveappearedforlisted(andgenerallylarger)companies.Bycontrast, thesurveyonSMEs’accesstofinanceshowsthatSMEs’profitshave continued to deteriorate since the end of 2011.
Chart 19 external financing of euro area non-financial corporations broken down by instrument(annual percentage changes)
-5
0
5
10
15
20
-5
0
5
10
15
20
2007 2008 2009 2010 2011 2012
total external financing MFI loans debt securities quoted shares
Source: ECB.Note: Quoted shares are euro-denominated.

48ECBAnnual Report2012
The euro area non-financial corporate sector’sindebtedness remained broadly unchanged in 2012 and, taking a longer-term perspective, has done so since 2008 (see Chart 20). It remained high, especially at this point of the economic cycle and particularly in some sectors, such as construction. Although the ability of firms toservice their debt continued to be supported by the low interest rate environment and low corporate bond yields, the income of non-financialcorporationsisstillrelativelyweakso that, in relation to it, net interest payments remained at an elevated level.
2.3 priCe and CoSt developmentS
In 2012 headline HICP inflation in the euroarea was 2.5%, on average, after standing at 2.7% in 2011 and 1.6% in 2010. Since the end of 2010 annual inflation has been somewhatelevated, owing mainly to the strong annual rates of growth in energy prices, as well as to pronounced increases in indirect taxes and administered prices in some euro area countries. Afterdeclininginthesecondquarterof2012,overallHICPinflationedgedupduringthesummermonths,beforedecreasingagainfromOctober,reflectingmainlydevelopmentsinenergyprices.
As evidenced by developments in producer prices and survey data, pipeline pressures in the supplychain receded further in thefirsthalfof2012,drivenmainlybyamoderation inoil andcommodity prices. After dipping to a temporary low in July 2012, the producer price index for industry(excludingconstruction)rose,althoughitstartedtodeclineagaininOctober.Theprofilewasshapedbyoilpricefluctuationsandthespikeininternationalfoodpricesoverthesummer.
Throughout 2012 domestic cost pressures stemming from labour costs remained subdued. Wage data, including compensation per employee, showed signs of moderation compared with 2011, amid a weakening in economic activity and a rise in slack in the labour market. Annual labour productivity grew at a very low, but positive, rate in 2012. Growth in compensation per employee decelerated compared with the previous year. This moderation partly absorbed the upward impact oflowerproductivitygrowthonunitlabourcostgrowth,whichhoveredataround1.5%inthefirstthree quarters of the year.
Consumerinflationperceptionsandshort-terminflationexpectationsremainedmoreorlessstablein2012.Long-term inflation expectations, asmeasuredby surveys,werevery stable, remainingfirmlyanchoredinlinewiththeGoverningCouncil’saimofkeepinginflationbelow,butcloseto,2% over the medium term.
Chart 20 euro area non-financial corporations’ debt and repayment costs
(percentages)
0
4
8
12
50
60
70
80
20122007 2008 2009 2010 2011
ratio of debt to GDP (left-hand scale)
ratio of net interest payments to gross operating surplus (right-hand scale)
Source: ECB.Notes: Debt is reported on the basis of the quarterly European sector accounts. It includes loans, debt securities issued and pension fund reserves. Information up to the third quarter of 2012 is included.

49ECB
Annual Report2012
hiCp inFlation Stood at elevated levelS in 2012 Changesinindirecttaxationwereanimportantdeterminantofinflationlevelsatboththenationaland euro area levels. Increases in the value added tax rate and excise duties introduced during 2011and2012hadagreaterimpactoneuroareaHICPinflationin2012thanthoseintroducedinprevious years and occurred in a larger number of countries. Box 4 investigates in more detail the impactofindirecttaxesonHICPinflationinboththeeuroareaasawholeandindividualeuroareacountries.AnotherfactorthatinfluencedthedevelopmentofheadlineHICPinflationin2012was,asinpreviousyears,fluctuationsinenergyandcommodityprices(seeTable1andChart21).
The annual rate of change in the energy component, which has a weight of 11.0% in the overall HICP, remained in single digits throughout 2012, recording a 12-month average of 7.6%, compared with 11.9% in 2011. This was mainly the result of base effects. The greatest impact was visible in the price developments of items directly related to oil prices, such as liquid fuels, fuels and lubricants for personal transport equipment, although the prices of electricity, gas and heating fuel were also affected.
Reflectingdevelopmentsininternationalfoodcommodityprices,aswellaslocalsupplyconditions,the annual rate of change in food prices remained at a high level, of around 3%, throughout 2012. However, there was no concrete evidence that the sharp increases in commodity prices over the summerhadamoreprotractedimpact.Thefactthatinflationinthefoodcomponenthoveredaroundthe same level masked divergent developments in the two sub-components. Unprocessed food priceinflationfollowedanupwardtrendin2012,withanaverageannualrateofchangeof3.0%. This was markedly higher than that in 2011 (1.8%) and 2010 (1.3%). By contrast, processed food price inflation declined steadily to 3.1%on average in 2012, comparedwith 3.3% in 2011 and 0.9% in 2010.
AverageHICP inflation excluding food and energywas higher in 2012 than in 2011 and 2010, inspiteofweakerdemandandlowerwagegrowth.Thismeasureofunderlyinginflationconsistsoftwo main components, namely non-energy industrial goods and services. Over the last one and a half years the annual rates of change in these sub-components were driven upwards by hikes in the value
table 1 price developments
(annual percentage changes, unless otherwise indicated)
2010 2011 2012 2011Q4
2012Q1
2012 Q2
2012Q3
2012Q4
2012Nov.
2012Dec.
HICP and its componentsOverall index 1.6 2.7 2.5 2.9 2.7 2.5 2.5 2.3 2.2 2.2
Energy 7.4 11.9 7.6 11.5 9.1 7.2 8.0 6.3 5.7 5.2Unprocessed food 1.3 1.8 3.0 1.8 2.0 2.3 3.4 4.3 4.1 4.4Processed food 0.9 3.3 3.1 4.2 4.0 3.5 2.7 2.4 2.4 2.4Non-energy industrial goods 0.5 0.8 1.2 1.2 1.1 1.3 1.3 1.1 1.1 1.0Services 1.4 1.8 1.8 1.9 1.8 1.8 1.8 1.7 1.6 1.8
Other price and cost indicatorsIndustrial producer prices 2.9 5.9 2.6 5.1 3.7 2.2 2.4 2.3 2.1 2.1Oil prices (EUR per barrel) 60.7 79.7 86.6 80.7 90.1 84.6 87.3 84.4 84.8 82.8Non-energy commodity prices 44.6 12.2 0.5 -2.5 -5.8 -1.1 5.3 4.4 5.2 2.5
Sources: Eurostat, ECB and ECB calculations based on Thomson Reuters data.

50ECBAnnual Report2012
added tax rate in several euro area countries. The annual rate of change in non-energy industrial goods prices continued its rising trend that had started in the second quarter of 2010, compounding upward base effects and a series of month-on-month increases. The latter reflected some pass-throughofpreviousexchangeratedepreciation,commoditypriceincreasesandtaxhikes.Inthefirsthalfof2012theannualrateofinflationinservicespricesfellgraduallyfromthelevelofaround2%observed in late 2011. It then remained relatively stable at a level of around 1.7% for the rest of the year, with upward bouts as a result of hikes in indirect taxes in a number of countries, against the background of a general slowdown in demand and, to a lesser extent, labour costs.
Chart 21 breakdown of hiCp inflation: main components
(annual percentage changes; monthly data)
2012-3
-2
-1
0
1
2
3
4
5
-10
-15
-5
0
5
10
15
20
25
2007 2008 2009 2010 2011
total HICP (left-hand scale)unprocessed food (left-hand scale)energy (right-hand scale)
2012-1
0
1
2
3
4
-2
0
2
4
6
8
2007 2008 2009 2010 2011
total HICP excluding energy and unprocessed food (left-hand scale)processed food (right-hand scale)non-energy industrial goods (left-hand scale)services (left-hand scale)
Source: Eurostat.
box 4
the impaCt oF indireCt taXeS on hiCp inFlation in 2012
Changes in indirect taxation have become an increasingly prominent feature of inflationdynamics, at both the national and the euro area level. Increases in value added tax (VAT) rates and excise duties introduced during 2011 and 2012 had a greater impact on euro area HICP inflation in2012 than those introduced inpreviousyears andoccurred in a larger numberofcountries.Thepositivenetcontributionfromindirecttaxestoinflationoverthepastdecadeisrelated to a general trend towards imposing higher tax rates on consumption and reducing taxes on labour income.1 The main reason for this shift is the fact that indirect taxes are generally considered to be easier to collect,more difficult to evade andmore supportive of economicgrowth. The number of increases in indirect tax rates has risen in recent years as a result of
1 See Taxation trends in the European Union – data for the EU Member States, Iceland and Norway, Eurostat Statistical Books, European Commission, 2012.

51ECB
Annual Report2012
fiscalconsolidationefforts inmanyeuroareacountries thathaveattempted toboost revenueswithout adversely affecting their competitiveness. This box reviews the impact of indirect taxes on inflation and examines how inflation has developed in both the euro area as awhole andindividual euro area countries when abstracting from these temporary effects.
Impact of changes in indirect taxation on inflation in the euro area and individual euro area countries2
The“mechanical”impactofchangesinindirecttaxratesontheeuroareaHICPcanbederivedfrom the HICP at constant tax rates (HICP-CT), which is published by Eurostat. Such an impact is mechanical in the sense that it assumes that tax changes are passed on to consumer prices fully and immediately. It can therefore be viewed as the likely upper bound for the actual direct impact, which is typically lower and spread over time, depending on a number of factors related to thecyclicalsituationandcompetitiveenvironmentof theprice-settingfirms.3 The fact that consumer demand remains very weak in many of the countries that have introduced increases in indirect taxes suggests that the pass-through may have been less than full.
On the basis of the HICP-CT, the mechanical upward impact of increases in indirect taxes at the euro area level was, on average, 0.4 percentage point in 2012, after 0.3 percentage point in 2011 and 0.1 percentage point in 2010 (see Chart A). This compares with an average impact of 0.2 percentage point since 2004. Despite the temporary nature of individual taxchanges,which–assuminganimmediatepass-through–dropoutoftheannualinflationrate after 12 months, the impact at the euro area level has, to some extent, been smoothed by the large number of measures taken by different countries at different times.
In 2012 ten euro area countries saw a change in indirect tax rates that had an upward impact of ¼ percentage point or more on their HICP inflation rate (see Chart B). This was morecountries than in any year since the HICP-CT wasfirst compiled in2004.Nevertheless, thesize of the impact in 2012 varied considerably across countries. The largest impact by far was recorded in Portugal (1.9 percentage points), followed by Greece and Finland (0.9 percentage point). In the case of Greece,
2 The HICP at constant tax rates is not published for Ireland. This country is therefore not included in the data presented in this box. In Ireland, the standard VAT rate went up by 2 percentage points in 2012, which had a significant impact on the country’s inflation.
3 Econometric evidence of the pass-through of tax changes is mixed. For example, a study by the Deutsche Bundesbank on the VAT increase in Germany in 2007 concluded that, although it was some months before the tax change had any impact on consumer prices, overall the pass-through was complete. Another study, by the Banco de España, concluded that the pass-through of the VAT increase in Spain in mid-2010 was only around 40% to 60% of the full impact. For further information, see Monthly Report, Deutsche Bundesbank, April 2008; and Economic Bulletin, Banco de España, October 2010.
Chart a mechanical impact of changes in indirect tax rates on euro area hiCp inflation(annual percentage changes; percentage points)
-1.0
-0.5
0.0
0.5
1.0
1.5
2.0
2.5
3.0
3.5
-1.0
-0.5
0.0
0.5
1.0
1.5
2.0
2.5
3.0
3.5
2009 2010 2011 2012
HICP at constant tax rates overall HICP inflation impact of changes in indirect tax rates
Source: Eurostat.

52ECBAnnual Report2012
the impact in 2012 was considerably lower than in 2011 and 2010, when it stood at 2.0 percentage points and 3.3 percentage points respectively. In the case of those countries that introduced a tax change later in the year, the average annual impact masked much larger impacts: for example, the VAT increase in Spain in September 2012 had a mechanical impact of 2.1 percentage points in the last four months of the year, but only 0.7 percentage point over the year as a whole. This taxchangewillcontinuetohaveanupwardeffectoninflationinthefirsteightmonthsof2013,resulting in a mechanical impact of 1.4 percentage points over the year as a whole.
Chart b impact of changes in indirect tax rates on inflation rates in 2011 and 2012
(percentage points)
-0.5
0.0
0.5
1.0
1.5
2.0
-0.5
0.0
0.5
1.0
1.5
2.0
20112012
BE DE EE GR ES FR IT CY LU MT NL AT PT SI SK FI euroarea
Sources: Eurostat and ECB calculations.
Chart C inflation in the euro area as a whole and individual euro area countries in 2012
(annual percentage changes)
BE DE EE GR ES FR IT CY LU MT NL AT PT SI SK FI euro area
HICP excluding energy and food at constant tax rates overall HICP inflation
5.0
4.0
3.0
2.0
1.0
0.0
-1.0
-2.0
5.0
4.0
3.0
2.0
1.0
0.0
-1.0
-2.0
Sources: Eurostat and ECB calculations.

53ECB
Annual Report2012
produCer priCeS Continued to deCline in 2012Havingincreasedinlate2010andthefirsthalfof2011,theannualrateofchangeinproducerpricesdecreasedin2012,owingmainlytodecliningcommodityprices.Inthefirsthalfoftheyearpipelinepressures in the supply chain receded further. On the back of a hike in energy prices associated with rising oil prices, producer prices increased temporarily in the summer, before falling again in the fourth quarter. The lagged effects of the spike in international food commodity prices, which occurred during the summer months and was largely reversed in the autumn, continued to feed through the food production chain.
On average, producer prices for industrial goods (excluding construction) in the euro area rose by 2.6% in 2012, compared with 5.9% in 2011 and 2.9% in 2010. The annual rate of growth in industrial producer prices excluding construction and energy was also lower in 2012 than in previous years (1.3% compared with 3.8% in 2011 and 1.6% in 2010). The easing of price pressures was more visible at the earlier stages of the pricing chain (producer prices for intermediate goods) than at the later stages (producer prices for consumer goods excluding food; see Chart 22).
Underlying inflation
Changes in indirect tax rates tend to have one-off effects on the price level similar to those sometimes associated with commodity price shocks. In the absence of second-round effects, the impactonannual inflationrates is temporary.Therefore, inorder togauge theunderlyingmovementsininflation,itisusefultoexcludenotonlythevolatileenergyandfoodcomponentsof the HICP, but also the impact from changes in indirect taxation 4 (see Chart C). Using this exclusion measure, in 2012 underlying inflation was negative in Greece and Portugalandbelow1% inSpain,CyprusandSlovenia. In Italy,headline inflationwasabove3%,butunderlyinginflationwas1.7%.Fortheeuroareaasawhole,underlyinginflationstoodat1.2%in2012,whileheadlineinflationwas2.5%.
Conclusion
ChangesinindirecttaxationhadasignificantupwardimpactoneuroareaHICPinflationin2012.Theyalsocontributedtoalowerdispersionofinflationratesacrosseuroareacountriesthanwouldotherwise have been the case, given that theywere particularly significant in those countriesthathadweakerunderlyinginflationdynamicsowingtomacroeconomicadjustmentprocesses. Theimpactofindirecttaxeswillalsoplayasignificantroleindetermininginflationin2013,assome measures still have to run their full course and additional measures are planned in a number of countries. Although the upward impact is only temporary for each individual measure, it is important that recurrent upward impacts do not give rise to second-round effects in the form of higher inflation expectations and higherwage claims. Indeed, given that theECBaims tomaintaineuroareaHICPinflationbelow,butcloseto,2%overthemediumterm,suchrecurrentupwardimpactslimitthescopeforpriceincreasesrelatedtowageandprofitdevelopmentsthatcan be sustained if this price stability objective is to be achieved.5
4 The data shown are calculated on the basis of Eurostat’s HICP at constant tax rates, broken down by main components, thereby avoiding a double counting of the impact of taxes on energy and food.
5 Seetheboxentitled“Factorslimitingthescopeavailableforincreasesindomesticprices”,Monthly Bulletin, ECB, January 2012.

54ECBAnnual Report2012
domeStiC priCe preSSureS remained Subdued in 2012In 2012 wage data, including compensation per employee, showed some signs of moderation compared with 2011, amid a weakening in economic activity and a rise in slack in the labour market. This development should be seen against the background of the high level of wage pressures observed in thefirst half of 2011, ata time of improving labour market conditions following the latest cyclical upswing.
The annual rate of growth in compensation per employee was 1.8% in the third quarter of 2012, which was markedly lower than the average of 2.2% in 2011 (see Table 2). Other wage indicators, such as hourly labour cost growth, decreased slightly in 2012, in contrast to what was witnessed in 2011, when growth in hourly wages increased significantly. Overall, non-wage costs continued to grow at a faster rate than the wages and salaries component of euro area hourly labour costs.
Euro area negotiated wages grew slightly faster in 2012 than in 2011, reaching an annual average of 2.1% in 2012, compared with 2.0% in 2011. The fact that actual wages, measured by compensation per employee, rose more moderately than negotiated wages suggests that some adjustment of wage costs at the euro area level is taking place via a negative wage drift.
Owing to a slowdown in GDP growth since the second quarter of 2011, annual labour productivity growth per employee slowed to around 0.3%, on average, in the first three quarters of 2012,compared with 1.2% in 2011. As labour productivity growth per employee in the euro area was significantly lower than the increase in compensation per employee, unit labour costs grew ata significantly higher rate than in previous years. In the third quarter of 2012 unit labour costsincreased by 1.7% year on year, compared with 1.0% in 2011.
table 2 labour cost indicators
(annual percentage changes, unless otherwise indicated)
2010 2011 2012 2011 Q4
2012 Q1
2012 Q2
2012Q3
2012 Q4
Negotiated wages 1.7 2.0 2.1 2.0 2.0 2.2 2.2 2.2Hourly labour cost index 1.5 2.2 . 2.2 1.6 1.9 2.0 .Compensation per employee 1.7 2.2 . 2.2 2.0 1.6 1.8 .Memo items:
Labour productivity 2.5 1.2 . 0.7 0.4 0.3 0.1 .Unit labour costs -0.9 1.0 . 1.6 1.6 1.3 1.7 .
Sources: Eurostat, national data and ECB calculations.
Chart 22 breakdown of industrial producer prices
(annual percentage changes; monthly data)
2012-25
-20
-15
-10
-5
0
5
10
15
20
25
-10
-8
-6
-4
-2
0
2
4
6
8
10
2007 2008 2009 2010 2011
consumer goods (right-hand scale)capital goods (right-hand scale)intermediate goods (right-hand scale)total industry excluding construction (right-hand scale)energy (left-hand scale)
Sources: Eurostat and ECB calculations.

55ECB
Annual Report2012
Reflectingthisincreaseinunitlabourcostsandthe adverse economic conditions, unit profitgrowth declined in the first three quarters of2012 and even turned negative in the third quarter. Following the rebound from mid-2009 onwards, the level of profits remained broadlyunchanged in 2011 and 2012. At the same time, the increase in unit taxes strengthened slightly in 2012 compared with 2011. Overall annual growth in the GDP deflator has remainedbroadly stable at around 1.2% over the past two years.
reSidential property priCeS deClined Euro area residential property prices, which are not included in the HICP, fell by 2.6% year on year in the third quarter of 2012 (see Chart 23). Against the background of tensions in several euro areafinancialmarkets, the annual growthrate of this indicator decreased gradually from the end of 2010, when it stood at around 2%, andenterednegativeterritoryinthelastquarterof2011.Asignificantdispersionofannualhouseprice growth among euro area countries could also be observed in 2012. While annual house price growth was negative and continued to decline in many euro area countries, it remained positive in Belgium, Germany, Austria, Luxembourg, Estonia and Finland.
developmentS in inFlation eXpeCtationSData from Consensus Economics, the Euro Zone Barometer and the ECB Survey of Professional Forecastersshowthatsurvey-basedlong-terminflationexpectations(fiveyearsahead)werecloseto2.0%in2012.Market-basedindicators,suchasbreak-eveninflationratesderivedfrominflation-linkedbondsandcomparableratesextractedfrominflation-linkedswaps,werealsofullyconsistentwiththeGoverningCouncil’sdefinitionofpricestability(seealsoBox3).
2.4 output, demand and labour marKet developmentS
Growth turned neGative in 2012 Following the sharp contraction in output in 2009, euro area real GDP recorded positive growth for two consecutive years. In 2012, however, growth lost momentum and GDP is estimated to have declined by 0.5% (see Table 3). As in the downturn in 2009, both domestic demand and changes in inventories made negative contributions to GDP growth in 2012. The pattern of GDPgrowthwaslargelyinfluencedbyweakinvestmentandprivateconsumption,which,inturn,wereadverselyaffectedbylowbusinessandconsumerconfidence,highoilprices,tightbankcreditsupply conditions and tensions in sovereign debt markets mainly caused by worries about the sustainabilityofpublicfinancesinanumberofeuroareacountries.Incontrastto2009,nettrademade a positive contribution to growth in 2012 despite weak export growth, owing to a decline in imports. These developments are consistent with the view that the weakness in euro area economic activity in 2012 primarily originated in domestic markets rather than being a global phenomenon, which was the case in 2009.
Chart 23 residential property price developments in the euro area
(annual percentage changes; quarterly data)
-5-4-3-2-10123456789
10
-5-4-3-2-1012345678910
1992 1996 2000 2004 2008 2012
residential property prices in nominal terms
Source: ECB calculations, based on non-harmonised national data.Note: Data for 2012 include data up to the third quarter of 2012.

56ECBAnnual Report2012
In terms of quarter-on-quarter developments, following a decline of 0.3% in the last quarter of 2011,which reflected an intensification of the financial crisis in combinationwith a temporaryweakening inforeigndemand,euroarearealGDPwasstable in thefirstquarterof2012. In thesecond and third quarters the level of output declined by 0.2% and 0.1% respectively, as domestic demand and inventories continued to slow in an environment characterised by low confidenceand high uncertainty. Eurostat’s first estimate for the fourth quarter puts the quarter-on-quarterchange in real GDP at -0.6%. No breakdown is available as yet for the fourth quarter, but the latest information points towards a continued negative contribution from domestic demand alongside a fall in exports.
domeStiC demand ContraCted For the FirSt time SinCe 2009In 2012 private consumption was lower than in 2011, when it increased by just 0.1%. The decline in 2012 appears to reflect lower growth in consumer spending on retail goods aswell as fewercar purchases. Consumption of services appeared to increase, albeit marginally. Developments in consumptionwere in linewith the reduction in real income caused by elevated inflation andfalling employment. At the same time, in order to mitigate the effect of lower disposable income on current consumption standards, households drew on their savings. As a result, in 2012 their saving ratiofelltothelowestlevelrecordedformanyyears.Theindicatorofconsumerconfidence,whichprovides a reasonably good indication of trends in consumption, improved slightly, albeit remaining negative, during thefirst half of2012, following theperiodofdecline that started inmid-2011. Inthelatterhalfof2012,however,confidencedeclinedsharplytostandatalevelwellbelowitslong-term average (see Chart 24).
table 3 Composition of real Gdp growth
(percentage changes; seasonally adjusted, unless otherwise indicated)
Annual rates 1) Quarterly rates 2)
2010 2011 2012 2011Q4
2012Q1
2012Q2
2012Q3
2012Q4
2011Q4
2012Q1
2012Q2
2012Q3
2012Q4
Real gross domestic product of which:
2.0 1.4 -0.5 0.6 -0.1 -0.5 -0.6 -0.9 -0.3 0.0 -0.2 -0.1 -0.6
Domestic demand 3) 1.3 0.5 . -0.7 -1.6 -2.3 -2.3 . -0.9 -0.4 -0.6 -0.3 .Private consumption 0.9 0.1 . -0.8 -1.1 -1.1 -1.4 . -0.5 -0.3 -0.5 -0.1 .Government consumption 0.7 -0.1 . -0.4 -0.1 -0.2 -0.1 . 0.0 0.1 -0.1 -0.1 .Grossfixedcapitalformation -0.1 1.5 . 0.8 -2.5 -3.9 -4.2 . -0.5 -1.4 -1.7 -0.6 .Changes in inventories 3), 4) 0.6 0.2 . -0.3 -0.5 -0.8 -0.6 . -0.5 0.0 0.0 -0.1 .
Net exports 3) 0.7 0.9 . 1.3 1.5 1.8 1.6 . 0.6 0.3 0.5 0.3 .Exports 5) 11.2 6.3 . 3.6 2.4 3.5 3.0 . 0.0 0.5 1.6 0.9 .Imports 5) 9.6 4.2 . 0.5 -1.1 -0.6 -0.7 . -1.4 -0.3 0.6 0.3 .
Real gross value added of which:
2.1 1.6 . 0.9 0.0 -0.3 -0.5 . -0.3 0.0 -0.1 -0.1 .
Industry excluding construction 9.1 3.4 . 0.1 -1.1 -1.4 -1.7 . -1.6 0.1 -0.1 -0.2 .Construction -5.4 -0.8 . 0.7 -2.8 -2.6 -2.7 . -0.1 -1.0 -0.9 -0.8 .Services 1.2 1.3 . 1.1 0.6 0.2 0.0 . 0.1 0.0 0.0 0.0 .Memo item:Purely market-related services 6) 1.2 1.5 . 1.1 0.5 0.0 -0.1 . 0.0 0.0 -0.2 0.1 .
Sources: Eurostat and ECB calculations.Notes: Annual data are calculated using non-seasonally adjusted data. Eurostat’s second release of national accounts for the fourth quarter of 2012 (which includes the expenditure breakdown) took place after the cut-off date for data for this report.1) Percentage change compared with the same period a year earlier.2) Percentage change compared with the previous quarter. 3) As a contribution to real GDP growth; in percentage points.4) Including acquisitions less disposals of valuables.5) Imports and exports cover goods and services and include internal cross-border trade in the euro area. Since intra-euro area trade is not cancelledoutinimportandexportfiguresusedinnationalaccounts,thesedataarenotfullycomparablewithbalanceofpaymentsdata.6)Includestradeandrepairs,hotelsandrestaurants,transportandcommunications,financialintermediation,realestate,rentingandbusinessactivities.

57ECB
Annual Report2012
Growth in total fixed investment, which hadturned positive in 2011 after contracting for three consecutive years, turned negative again in 2012. This contraction was broadly based across both construction and non-construction investment. The negative developments in the course of 2012 were chiefly attributable to ahigh degree of uncertainty and a deterioration in sentiment, as well as to tight bank credit supply conditions in some countries and in the euro area as a whole. Ongoing balance sheet restructuring andadversefinancialconditionsalsodampenedthe growth momentum throughout the year. Further considerable adjustments in the housing markets in some countries exerted downward pressure on residential investment.
Annual growth in government consumption was, in all likelihood, close to zero or marginally negative in 2012, broadly continuing the slight decline seen in 2011. This was the result of further fiscal consolidation efforts in a number of euroarea countries. Such efforts focused in particular on curbing the compensation of government employees, which accounts for about half of total government consumption in the euro area. Intermediate consumption expenditure was also cut, while social transfers in kind continued to rise broadly in line with the trend in previous years.
In a context of falling output, a deterioration in theeconomicoutlookandsignificanttighteningoffinancingconditionsinsomecountries,growthwas also dampened by destocking. As a result, inventories made a negative contribution to growth in 2012, at around -0.6 percentage point ofGDP(basedondataforthefirstthreequartersof 2012), after making positive contributions of 0.2 percentage point and 0.6 percentage point in 2011 and 2010 respectively.
net trade held up, larGely owinG to weaK importSExternal trade was the only component to make a positive net contribution to euro area real GDP growth in 2012. While exports registered modestgrowth, importscontracted for thefirsttime since 2009. Accordingly, the contribution of net trade to euro area real GDP growth in
Chart 24 Confidence indicators
(percentage balances; seasonally adjusted)
-40-35-30-25-20-15-10-505
10152025
-40-35-30-25-20-15-10-50510152025
20122007 2008 2009 2010 2011
construction confidenceservices confidenceindustrial confidenceconsumer confidence
Sources: European Commission Business and Consumer Surveys.Notes: Data shown are calculated as deviations from the averageover the period since January 1985 for consumer, industrial andconstruction confidence, and since April 1995 for servicesconfidence.
Chart 25 euro area export volumes to selected trading partners
(indices: Q1 2006 = 100; seasonally adjusted; three-month moving averages)
60
80
100
120
140
160
60
80
100
120
140
160
20122006 2007 2008 2009 2010 2011
Latin AmericaOPECUnited StatesAsianon-euro area EU Member Statesextra-euro area1)
Source: ECB.Note: The latest observation is for December 2012, except for the extra-euro area and the non-euro area EU Member States, for which the latest observation is for November 2012.1) Extra-euro area refers to developments in the euro area as a wholevis-à-vistherestoftheworld.

58ECBAnnual Report2012
2012 was one of the highest on record. The decline in imports was mainly driven by the weakness in economic activity in the euro area, which led to reduced demand for imported consumption, investment and intermediate goods. At the same time, export growth was dampened by the decline in foreign demand, amid the global economic slowdown, and therefore remained well below the rates seen in 2010 and 2011. Nevertheless, improvements in price competitiveness in the wake of the ongoing rebalancing process supported export growth in some euro area countries (see Box 5). Looking at the geographical breakdown of euro area exports of goods, exports to the United States remained fairly robust, despite decelerating somewhat (see Chart 25). By contrast, intra-euro area trade slowed markedly, as did exports to non-euro area EU Member States and Asia.
box 5
the rebalanCinG proCeSS within the euro area1
Before the recent crisis, some euro area countries experienced wage growth and inflationrates persistently above the euro area average. These developments, together with favourable financingconditions,contributedtoalossofcompetitivenessandthebuild-upofexternalandinternal macroeconomic imbalances. This box reviews the process of rebalancing among euro area countries which started with the onset of the crisis.
The build-up of macroeconomic imbalances prior to 2008
Low real financing costs and overly optimistic assumptions on the part of households, firmsand the public sector about future economic developments were some of the key factors contributingtotheimbalances.Inparticular,theyledtoasignificantcumulativedeteriorationincompetitiveness,withwagegrowthpersistentlyaboveproductivitygrowthandinflationratesabovethe euro area average.2Anumberofcountriessawunsustainablecredit-financeddomesticdemandgrowth and housing bubbles. Owing to deteriorating competitiveness and strong import growth on thebackofrobustdomesticdemand,currentaccountdeficitsincreasedsignificantlyinsomeeuroareacountries.Giventhatthestrongdemandlargelyreflecteddevelopmentsinprivateandpublicconsumption and investment in the non-tradable sector (in particular in the construction sector, leading to a housing bubble in some countries), there was no corresponding increase in the capacity toservicethegrowingexternaldebtburden.Onthefiscalside,strongrevenuegrowth,buoyedbythe unsustainable boom in domestic demand, gave rise to structural increases in public expenditure, even in those countries where public budget deficits and debt were already relatively high. Thesubsequentcrisis-relatedweaknessindomesticdemandexposedtheresultingsignificantfiscalvulnerabilities,withpublicdeficitsanddebtlevelsincreasingstrongly.
1 This box examines the rebalancing process in the 12 EU Member States that had joined the euro area by 2001, i.e. Belgium, Germany, Ireland, Greece, Spain, France, Italy, Luxembourg, the Netherlands, Austria, Portugal and Finland. Those countries that joined the euro area after 2001 are excluded, given that issues of real and nominal convergence play a more important role in explaining inflation differentials in those countries.
2 In the early years of EMU, substantially increasing relative costs and prices could be partly attributed to the normal process of real and nominalconvergence.However,empiricalworkhasbeenunabletofindunambiguousevidenceofcatching-upeffects(intheformofBalassa-Samuelson effects) at play after the start of Stage Three of EMU. Earlier studies of Balassa-Samuelson effects in the euro area (e.g.Hofmann,B.andRemsperger,H.,“InflationDifferentialsamongtheEuroAreaCountries:PotentialCausesandConsequences”,conferencepaperpresentedatthe2005annualmeetingoftheAlliedSocialScienceAssociations,andKatsimi,M.,“Inflationdivergenceintheeuroarea:theBalassa-Samuelsoneffect”,Applied Economics Letters,Vol.11,Issue5,pp.329-332)didnotfindanysignificantcontributionofcross-countrypriceconvergencetonationalinflationratesinStageThreeofEMU.SomeBalassa-Samuelsoneffectsinagroupofeuroareacountriesbetween1992and2001weresetoutinWagner,M.,“TheBalassa-SamuelsonEffectin‘EastandWest’:DifferencesandSimilarities”,Economics Series, No 180, Institute for Advanced Studies, Vienna.

59ECB
Annual Report2012
The process of rebalancing since the start of the crisis
The rebalancing process, which began in 2008, involves adjustment in relative competitiveness positions and internal and external macroeconomic imbalances. Average unit labour cost growth has declined in most euro area countries with adjustment needs since 2008, helping to restore competitiveness (see Chart A). Labour shedding on a large scale led to an improvement in cost competitiveness through higher measured productivity. At the same time, although wage adjustments were initially rather limited, they have recently been stronger, driven in some cases by reductionsinpublicsectorpayinthecontextoffiscalconsolidationefforts.Theimplementationof structural reforms to address the deep-rooted structural rigidities in some countries has started to gain momentum, including in countries that are subject to an EU-IMF adjustment programme. Inparticular,reformstoincreaselabourmarketflexibilitymayhavestartedtocontributetogainsin relative competitiveness.
For price competitiveness to improve, reductions in relative labour costs need to translate into corresponding adjustments in relative prices. However, relative prices did not adjust in line with relative labour cost improvements (see Chart B). This can partly be attributed to countries’ fiscal consolidation efforts,which involved increasing indirect taxes and administeredprices,thereby exerting upward pressure on prices. In addition, the limited price adjustment could also reflect a simultaneous increase in profitmargins,whichmay have been caused by a numberof factors. Itmay reflect the normal cyclical recovery of profitmargins, following the initialcompression experienced in previous years on the back of still resilient wage dynamics. Moreover,thestrongeraggregateprofitmarginscouldbepartlydrivenbycompositionaleffects,asunprofitablefirmsclosedown, forexample.However, increasingprofitmarginscouldalsoreflectalackofcompetitionincertainsectorsoftheeconomy,allowingfirmstoapplyahighmarkup as they are not forced through competition to pass on the improvements in labour costs tofinalprices.Againstthisbackground,giventhatreformsinproductmarketshavesofarbeen
Chart a average annual change in unit labour costs relative to the euro area average in the periods 1999-2007 and 1999-2012(percentage points)
-2.0
-1.5
-1.0
-0.5
0.0
0.5
1.0
1.5
2.0
-2.0
-1.5
-1.0
-0.5
0.0
0.5
1.0
1.5
2.0
IE ES PT GR IT LU NL FR BE FI AT DE
1999-2012 1999-2007
Sources: European Commission and ECB calculations.Notes: The data refer to the 12 EU Member States that had joined the euro area by 2001. Countries are shown in descending order for the period 1999-2007. The data for Greece only cover the periods 2001-07 and 2001-12.

60ECBAnnual Report2012
generally limited, efforts to strengthen competition are essential to ensure that prices can adjust in line with labour costs.
The compression of domestic demand since 2008 and, in turn, the substantially lower growth of non-energy imports have been the main drivers of the improvement in current account balances observed in theeuroareacountrieswhich recordedcurrentaccountdeficitsprior to thecrisis
Chart b average annual hiCp inflation differentials relative to the euro area average in the periods 1999-2007 and 1999-2012(percentage points)
-1.0
-0.5
0.0
0.5
1.0
1.5
-1.0
-0.5
0.0
0.5
1.0
1.5
GR IE ES PT LU NL IT BE FR AT DE FI
1999-2012 1999-2007
Sources: Eurostat and ECB calculations.Notes: The data refer to the 12 EU Member States that had joined the euro area by 2001. Countries are shown in descending order for the period 1999-2007. The data for Greece only cover the periods 2001-07 and 2001-12.
Chart C Current account balances
(as a percentage of GDP)
-20
-15
-10
-5
0
5
10
-20
-15
-10
-5
0
5
10
GR PT ES IE IT FR EA BE FI NL AT LU DE
20122008
Sources: European Commission and ECB calculations.Notes: The data refer to the 12 EU Member States that had joined the euro area by 2001. Countries are shown in ascending order according to the current account balance in 2008.

61ECB
Annual Report2012
(see Chart C). Part of the current improvement in external balances may be reversed as economic activity in these countries recovers. However, demand is not expected to return to the excessive levels reached prior to the crisis, and the production potential of the affected economies has declined as a result of the crisis. In addition, in some countries the current account balance should increasingly reflect thegains in relative cost andprice competitiveness, aswell as, incertain cases, the increase in the number of exporting firms. Increasing import substitution (i.e. replacing imports with domestic production) and gains in export market shares should support the external adjustment.3 Notwithstanding this improvement in current account balances, a significant challenge in terms of stocks remains, as the persistent deficits experienced overthe past decade have led to an accumulation of net liabilities vis-à-vis other countries. Netinternational investment positions have continued to deteriorate in recent years in most countries whichexperiencedcurrentaccountdeficitsprior to thecrisis,despite thenotable reduction incurrentaccountdeficits.Countrieswillneedtoruncurrentaccountsurplusesforsometimeinordertoachieveareductioninexternalindebtednessandregaininvestorconfidence.
Further efforts to continue the process of rebalancing remain necessary
Despite the adjustment observed so far, substantial further rebalancing appears necessary in order to restore competitiveness positions and unwind remaining imbalances, as indicated by theremainingdifferentialsincostsandpersistingcurrentaccountdeficits(seeChartsAandC).To continue this process, countries will need to take further ambitious measures to enhance both price and non-price competitiveness. The set of measures that need to be taken and the urgency ofthosemeasuresvaryacrosscountries.Asignificantgenuinereductioninunitlabourcostsandprofitmargins(wherealackofcompetitionisapparent)isparticularlyurgentincountrieswherehigh unemployment rates risk becoming structural and where competition is weak.
A number of policy areas are particularly important in supporting the continuing rebalancing process.Theyrelatetoreformsincreasingtheflexibilityoflabourmarketsandcompetitioninproduct markets to facilitate the necessary adjustment of price competitiveness. With respect to thelabourmarket,flexibilityinthewagedeterminationprocessmustbestrengthenedinseveraleuro area countries, for example by relaxing employment protection legislation, abolishing wage indexationschemes,loweringminimumwagesandpermittingwagebargainingatthefirmlevel.In addition, a permanent increase in productivity facilitates competitiveness adjustment as it both lowers unit labour costs and increases potential output. However, raising productivity (by way of process and product innovation, labour force skills or business environment factors) typically requires structural reforms which can take considerable time to have visible effects (such as the liberalisation of closed professions and labour immigration, the reorientation of spending towards education and R&D, and reforms of key framework conditions, such as the amendment of judicial and regulatory frameworks to enhance their business-friendliness). Moreover, high profit margins are particularly prevalent in domestically-oriented sectors (predominantly theservices sectors). Therefore, structural reform measures can address this situation by removing obstacles to (international) competition, particularly in sheltered professions, for example by lowering entry barriers for new firms and, generally, by abolishing excessive bureaucracy.This, in turn, will help to reduce the prevailing downward rigidities in prices and enable countries toreapthebenefitsoftheadjustment.
3 However, in the medium term import substitution could have a potentially negative effect on productivity and hence on export growth owing to the limited use of better, more diverse and cheaper inputs.

62ECBAnnual Report2012
the eConomiC Slowdown waS broadly baSed aCroSS SeCtorSThe economic slowdown in 2012 was broadly based from a sectoral perspective. Value added in industry (excluding construction) declined on an annual basis, falling by 1.4% on average during thefirst threequartersoftheyear.Thiscompareswithanincreaseof3.4%in2011.Thegrowthdynamics weakened throughout the year, in line with the slowdown in GDP growth. This trend was confirmed by developments in industrial production (excluding construction), which inDecember 2012 stood 2.3% below its level one year earlier. Among the components of industrial production (excluding construction), intermediate goods recorded the most pronounced decline in 2012 (see Chart 26).
Construction production contracted further in 2012, continuing a prolonged period of weakness. After a decline of 0.8% in 2011, value added in construction shrank on average by 3.5% year on yearinthefirstthreequartersof2012(basedonnon-seasonally adjusted data). Value added in services recorded modest average annual growth of 0.2% during the same period, which is weaker than in 2011, when it rose by 1.3%.
labour marKetS Continued to deteriorateHeadcount employment, which had started to decline in the second half of 2011, fell further in the course of 2012 (see Chart 27). As a result, in the third quarter of 2012 euro area employment stood about 0.7% below its level one year earlier. Survey data point to further job losses in the fourth quarter of 2012. Overall in 2012 employment is likely to have fallen by around 0.7%, which compares with a rise of 0.3% in 2011. From a sectoral perspective, this decline in the number of jobs was broadly based across the main sectors. Total hours worked recorded
Withregardtofiscalpolicies,issuesrelatedtopublicsectorimbalancesandfiscalsustainabilityneedtobeaddressed.Restoringthesustainabilityofpublicfinancesbyputtingthedebtratioonadownward path is a priority. To this end, precise and credible medium-term consolidation plans arecrucialtoregainfinancialmarketconfidenceandlowerdebtservicecosts.
Rebalancing price and cost competitiveness across euro area countries implies that wage and price growth in countries that have previously seen excesses in this respect needs to be significantlylowerthantheeuroareaaverageduringatransitionphase.Atthesametime,severalof the euro area economies that increased their competitiveness prior to the crisis are likely to grow faster and temporarily experience wage and price increases above the euro area average. However, excessive wage increments and a strong surge in prices need to be avoided in the more competitivecountries–alsoduringthistransitionphase–astheywouldharmrealgrowthandlead to higher unemployment.
Chart 26 industrial production growth and contributions
(growth rate and percentage point contributions; monthly data; seasonally adjusted)
-11-10-9-8-7-6-5-4-3-2-101234
-11-10-9-8-7-6-5-4-3-2-101234
20122007 2008 2009 2010 2011
total excluding constructionenergyintermediate goodsconsumer goodscapital goods
Sources: Eurostat and ECB calculations.Note: Data shown are calculated as three-month moving averages against the corresponding average three months earlier.

63ECB
Annual Report2012
a more pronounced decline than headcount employment in 2012. In the light of the renewed weakening of growth, many firms chose toreduce their labour input by cutting hours worked rather than the number of employees, in order to avoid the adjustment costs associated with dismissing workers.
As labour market developments tend to lag behind overall cyclical developments, employment growth declined less than output growth. This implies that annual productivity growth per person declined from 0.7% in the last quarter of 2011 to 0.1% in the third quarter of 2012. The average annual growth rate over the first three quarters of the year was 0.3%,which compares with an increase of 1.2% in the previous year. The decline in productivity growth was broadly based across sectors, although the sharpest decline was observed in the industrial sector (excluding construction). As a result of the sharper decline in hours worked than in jobs, annual growth in overall productivity measured by hours worked stood slightly above 1%on average during the first three quarters of 2012,whichwas onlymarginally lowerthan in 2011.
After bottoming out in the first half of 2011, the unemployment rate continued to increasein 2012, reaching levels not seen since the start of the euro area series in 1995 (see Chart 27). In December 2012 the unemployment rate stood at 11.8%, an increase of almost 2 percentage points from its trough in April 2011. The annual change in the unemployment rate has, however, started to ease since mid-2012. In 2012 as a whole the unemployment rate stood on average at 11.4%, which compares with an average rate of 10.2% in 2011.
2.5 FiSCal developmentS
Thegeneralgovernmentdeficit for theeuroarea isexpected tohavedeclinedsignificantly forasecondconsecutiveyear in2012, reflectingsizeableconsolidationefforts inmostcountries.Thecrisisexperiencedinrecentyearsconfirmsthatensuringsoundpublicfinancesordesigningcredibleconsolidation strategies to restore debt sustainability when it is endangered is a prerequisite for overallmacroeconomicandfinancialstability,aswellasforthesmoothfunctioningofMonetaryUnion. The euro area countries, including the most affected, have responded forcefully to the ongoing sovereign debt crisis and negative spillover effects, implementing fiscal consolidationand structural reform measures and strengthening their domestic budgetary frameworks. The EU fiscalgovernanceframeworkhasbeenfurtherstrengthenedbytheadoptionofthefiscalcompact(see Section 1 of Chapter 4).
Chart 27 labour market developments
(quarter-on-quarter growth rate; percentages of the labour force; seasonally adjusted)
-1.0
-0.8
-0.6
-0.4
-0.2
0.0
0.2
0.4
0.6
0.8
1.0
7.0
7.5
8.0
8.5
9.0
9.5
10.0
10.5
11.0
11.5
12.0
20122007 2008 2009 2010 2011
unemployment (right-hand scale)employment (left-hand scale)
Source: Eurostat.

64ECBAnnual Report2012
FiSCal ConSolidation in 2012Despite economic headwinds, the aggregate general government deficit for the euro area fell to3.5% of GDP in 2012, from 4.2% of GDP in 2011, according to the European Commission’s winter 2013economic forecast (seeTable4).The reduction in thebudgetdeficitwasdrivenbyhighergovernmentrevenuesasapercentageofGDP,reflectinghighertaxesonincomeandwealthand,to a lesser extent, increased indirect taxes, while the expenditure ratio increased somewhat. Total government revenue increased from 45.4% of GDP in 2011 to 46.3% of GDP in 2012, while the total government expenditure-to-GDP ratio increased from 49.5% in 2011 to 49.8% in 2012.
According to the European Commission’s winter 2013 forecast, the euro area average gross general government debt-to-GDP ratio increased further in 2012, to 93.1% from 88.1% in 2011, as a result of a large“snowball”effectof2.5%ofGDP(whichcapturestheimpactofinterestexpenditure,realGDPgrowthandinflationonthedebtratio)andastock-flowadjustmentof2.2%ofGDP,whiletheprimarybudget balance of -0.4% of GDP contributed to the debt deterioration only marginally. The debt ratio was above the reference value of 60% of GDP at the end of 2012 in 12 out of 17 euro area countries.
As can be seen in Table 4, the European Commission’s winter 2013 forecast showed, for most countries, higher 2012 deficit and debt figures than the estimates presented in the April 2012stabilityprogrammes,therevisedexcessivedeficittargets(SpainandPortugal)orthereviewofthesecondadjustmentprogrammetarget(Greece).Forsomecountries,thedeficitsweresignificantlyhigher than expected. This was the case in particular for Spain, Italy, Cyprus and Slovenia. The targets are projected to have been missed by a smaller margin in Belgium, France, Malta, Slovakia andFinland.RegardingthecountriescoveredbyanEU-IMFfinancialassistanceprogramme,thefiscaldeficits inIrelandandGreeceimprovednoticeablycomparedwith2011,while inPortugal
table 4 Fiscal positions in the euro area and euro area countries
(as a percentage of GDP)
General government surplus (+)/defi cit (-) General government gross debtEuropean Commission
forecastStability
programmeEuropean Commission
forecastStability
programme2010 2011 2012 2012 2010 2011 2012 2012
Belgium -3.8 -3.7 -3.0 -2.8 95.5 97.8 99.8 99.4Germany -4.1 -0.8 0.1 -1.0 82.5 80.5 81.6 82.0Estonia 0.2 1.1 -0.5 -2.6 6.7 6.1 10.5 8.8Ireland -30.9 -13.4 -7.7 -8.3 92.2 106.4 117.2 117.5Greece 1) -10.7 -9.4 -6.6 -6.6 148.3 170.6 161.6 -Spain 1) -9.7 -9.4 -10.2 -6.3 61.5 69.3 88.4 -France -7.1 -5.2 -4.6 -4.4 82.3 86.0 90.3 89.0Italy -4.5 -3.9 -2.9 -1.7 119.2 120.7 127.1 123.4Cyprus -5.3 -6.3 -5.5 -2.6 61.3 71.1 86.5 -Luxembourg -0.8 -0.3 -1.5 -1.5 19.2 18.3 20.5 20.9Malta -3.6 -2.7 -2.6 -2.2 67.4 70.4 73.1 70.3Netherlands -5.1 -4.5 -4.1 -4.2 63.1 65.5 70.8 70.2Austria -4.5 -2.5 -3.0 -3.0 72.0 72.4 74.3 74.7Portugal 1) -9.8 -4.4 -5.0 -5.0 93.5 108.0 120.6 -Slovenia -5.7 -6.4 -4.4 -3.5 38.6 46.9 53.7 51.9Slovakia -7.7 -4.9 -4.8 -4.6 41.0 43.3 52.4 50.2Finland -2.5 -0.8 -1.7 -1.1 48.6 49.0 53.4 50.7Euro area -6.2 -4.2 -3.5 -3.2 85.6 88.1 93.1 -
Sources: European Commission’s winter 2013 economic forecast, April 2012 update of the stability programmes and ECB calculations.Notes:DataarebasedonESA95definitions.1)ForGreece,SpainandPortugal,figuresrefernottothestabilityprogrammetargetsbuttothereviewofthesecondadjustmentprogramme(forGreece)andrevisedexcessivedeficitproceduretargets(forSpainandPortugal).

65ECB
Annual Report2012
the deficit deteriorated slightly, partly reflecting the unwinding of a temporary transaction. The following brief review of recent budgetary developments is limited to the countries covered by anEU-IMFfinancialassistanceprogramme.
developmentS in the eu-imF proGramme CountrieS
GreeCeIn Greece, a remarkable fiscal consolidation has been achieved since the inception of the firsteconomic adjustment programme in May 2010. However, more still needs to be done to put public debtfirmlyonasustainablepath.
In view of deteriorating government debt sustainability prospects, it became necessary to modify the original programme design, and the authorities committed in March 2012 to a second adjustment programme. This involved a contribution from the private sector through a voluntary bond exchange, which led to substantial relief in the Greek debt burden. Later in the year, however, policy implementation in many areas was subject to substantial delays and macroeconomic conditions worsened considerably, reflecting the heightened political uncertainty in the contextof two elections. Significant doubts emerged as to the capacity and willingness of the Greekgovernmenttoimplementthefiscalandstructuralreformsneededtorestoredebtsustainabilityandcompetitiveness. Following the second election, held in June 2012, the new Greek government committed itself to bringing the programme back on track.
The fiscal consolidation path under the second programmewas reviewed inDecember 2012 totake worse than expected macroeconomic conditions into account. As a result, the 2012 primary balance target was revised from -1.0% of GDP to -1.5% of GDP and the target of achieving a primary surplus of 4.5% of GDP was put back from 2014 to 2016. The deadline for correcting the excessivedeficitwas also extended from2014 to2016. Inorder to close the consolidationgap,which was estimated at about €13.5 billion (7.3% of GDP) for the period 2013-14, the authorities defined,aspartofthe2013-16Medium-TermFiscalStrategy,apredominantlyexpenditure-basedconsolidation package.
As regards the debt-to-GDP ratio, the achievement of 120% by 2020, targeted at the time of the approval of the second programme, was no longer within reach. In order to bring the debt down and easeprogrammefinancing,theEurogroupagreedon26and27November2012onaseriesofdebt-reducing measures, including the possibility of debt buybacks. Taking into consideration the impact of debt-reducing measures, including the successful completion of the debt buyback in December 2012, and assuming a rigorous implementation of the programme, the debt ratio is expected to reach 124% of GDP in 2020 and fall substantially below 110% of GDP by 2022.
irelandInIreland,whereallpreviousdeficit targetshavebeenmet, theEU-IMFadjustmentprogrammecontinuedtobeimplementedsuccessfullyin2012.The2012generalgovernmentdeficitisexpectedto be below both the stability programme and the adjustment programme target.
The updated Medium-Term Fiscal Statement for 2013-15 was published in November 2012. In this statementthegovernmentpledgedtocontinuefiscalconsolidationbeyondprogrammecompletionso as tomeet the 2015 deadline for correcting the excessive deficit. The statement foresees anunchanged composition of adjustment, with one-third of the remaining correction taking place on

66ECBAnnual Report2012
the revenue side, and the remainder on the expenditure side. The revenue measures include the introduction of a value-based real estate tax and base broadening for personal income taxes and social security contributions. Important expenditure savings will be made in social welfare and the public pay and pensions bill.
Looking ahead, the Irish government remains committed to the reform path agreed under the adjustment programme and is ready to implement additional measures if needed. Revisions to the composition of the structural adjustment effort should be minimised in order to limit uncertainty. Continued compliancewith the fiscal targetswould send a strong signal tomarkets andwouldreinforce the chances of Ireland regaining full access to market funding in 2013, following the successful initial market access in summer 2012.
portuGalIn Portugal, the adjustment programme remained broadly on track in 2012. While spending (except for unemployment benefits) performed better than budgeted, revenues lagged behind the initialbudget plans, mainly on account of weaker than expected macroeconomic conditions.
The fiscal consolidation path under the programme was adjusted to accommodate the internalrebalancing of the economy, while safeguarding the reduction of the debt-to-GDP ratio over the mediumterm.For2012thedeficittargetwasrevisedupwardsfrom4.5%ofGDPto5%.
Significant additional consolidation efforts are required to further improve the fiscal situation.For 2013 consolidation measures amounting to 3% of GDP have been incorporated in the budget. Thebulkoftheconsolidationcomesfromtherevenueside,withasignificantincreaseinpersonalincome tax rates. On the expenditure side, broadly based new consolidation measures are almost fully offset by the reinstatement of annual additional pension/salary payments for pensioners and public employees as a consequence of a Constitutional Court decision.
Looking ahead, continued political commitment to programme implementation and the achievement of agreed fiscal targets will be crucial tomaintain the reformmomentum and regain access tofinancialmarketsin2013asplanned.
CyCliCally adJuSted indiCatorS As shown inTable 5, all three fiscal indicatorswhich correct for the cyclical conditions of theeconomy (i.e. the cyclically adjusted balance, the cyclically adjusted primary balance and the structuralbalance)confirmaremarkableconsolidationeffortfortheeuroareaaggregatein2012.The cyclically adjusted balance and the cyclically adjusted primary balance, which excludes the effects of interest payments, improved by respectively 1.2 and 1.3 percentage points of GDP. The euro area structural balance (which excludes one-off and temporary measures) improved by 1.4 percentage points of GDP. These numbers should be interpreted with caution because real-time estimates of the cyclical impact on budget balances are characterised by a degree of uncertainty, particularlyineconomiesundergoingsignificantrebalancing.
eXCeSSive deFiCit proCedureSAll euro area countries except Germany, Estonia, Italy, Luxembourg, Malta and Finland are expected to have recorded a deficit above or equal to the 3%ofGDP reference value in 2012,according to the European Commission’s winter 2013 economic forecast. By the end of 2012 12euroareacountriesweresubjecttoanexcessivedeficitprocedure,withdeadlinesforreducingdeficitratiostobelowthereferencevaluerangingfrom2012forBelgium,ItalyandCyprusto2016

67ECB
Annual Report2012
forGreece(seeTable6).TheEUCouncilabrogatedtheexcessivedeficitprocedureforGermanyinJune2012andforMaltainDecember2012,asfinaldatashowedthatthedeficitshadnotexceededthe3%ofGDPreferencevaluein2011andtheCommission’sforecastprojecteddeficitsbelow3%of GDP for both countries in 2012.
Further FiSCal ConSolidation eXpeCted in 2013 In2013furtherimprovementintheeuroareafiscalsituationisexpected.AccordingtotheEuropeanCommission’swinter 2013 economic forecast, the general government deficit ratio for the euroarea will decline by 0.7 percentage point to 2.8% of GDP (see Chart 28). The euro area revenue
table 5 Changes in the cyclically adjusted balance, the cyclically adjusted primary balance and the structural balance in the euro area and euro area countries (in percentage points of GDP)
Change in cyclically adjusted budget balance
Change in cyclically adjusted primary budget balance
Change in structural budget balance
2010 2011 2012 2010 2011 2012 2010 2011 2012
Belgium 1.2 -0.4 1.3 0.9 -0.4 1.4 0.5 -0.2 0.7Germany -2.8 2.4 1.4 -2.9 2.4 1.3 -1.5 1.3 1.4Estonia 1.1 -0.9 -1.8 1.1 -0.9 -1.8 -0.1 0.5 0.8Ireland -16.8 16.7 5.0 -15.6 16.9 5.5 0.7 1.4 0.3Greece 6.7 3.4 4.2 7.3 4.7 2.2 6.7 3.3 4.2Spain 1.8 -0.1 -0.5 1.9 0.4 0.0 1.1 0.1 1.5France 0.1 1.6 1.2 0.1 1.8 1.1 0.3 1.3 1.2Italy 0.0 0.4 1.7 -0.1 0.8 2.3 0.4 0.0 2.3Cyprus 0.8 -1.0 1.5 0.5 -0.8 2.8 0.8 -0.7 0.5Luxembourg -1.1 0.3 -0.9 -1.1 0.4 -0.8 -1.1 0.2 -0.8Malta -0.1 0.8 0.3 -0.2 0.9 0.4 -0.5 1.2 0.0Netherlands 0.0 0.5 1.1 -0.2 0.5 1.1 0.1 0.4 1.1Austria -1.0 1.2 -0.3 -1.1 1.1 -0.2 -0.6 1.0 -0.1Portugal -0.5 5.9 0.2 -0.5 7.0 0.4 -0.1 2.2 2.2Slovenia -0.2 -1.1 2.4 0.0 -0.9 2.9 -0.3 -0.1 1.4Slovakia -0.4 2.5 0.3 -0.5 2.8 0.4 0.0 2.0 0.5Finland -1.4 0.7 -0.5 -1.5 0.7 -0.5 -1.4 0.7 -0.6Euro area -0.6 1.6 1.2 -0.6 1.8 1.3 0.1 0.9 1.4
Source: European Commission’s winter 2013 economic forecast.Notes: Positive numbers correspond to fiscal improvements and negative numbers to fiscal deteriorations. Changes in the cyclicallyadjustedandcyclicallyadjustedprimarybalancesincludeone-offandtemporarymeasures,includingfinancialsectorsupportmeasures.
table 6 excessive deficit procedures in the euro area countries
(as a percentage of GDP)
Budget balance 2012 Start Deadline Recommended average
structural adjustment p.a.
Belgium -3.0 2010 2012 ¾Ireland -7.7 2010 2015 2Greece -6.6 2010 2016 -Spain -10.2 2010 2014 2½France -4.6 2010 2013 1Italy -2.9 2010 2012 ½Cyprus -5.5 2010 2012 1½Netherlands -4.1 2011 2013 ¾Austria -3.0 2011 2013 ¾Portugal -5.0 2010 2014 1¾Slovenia -4.4 2010 2013 ¾Slovakia -4.8 2010 2013 1
Source: European Commission’s winter 2013 economic forecast.
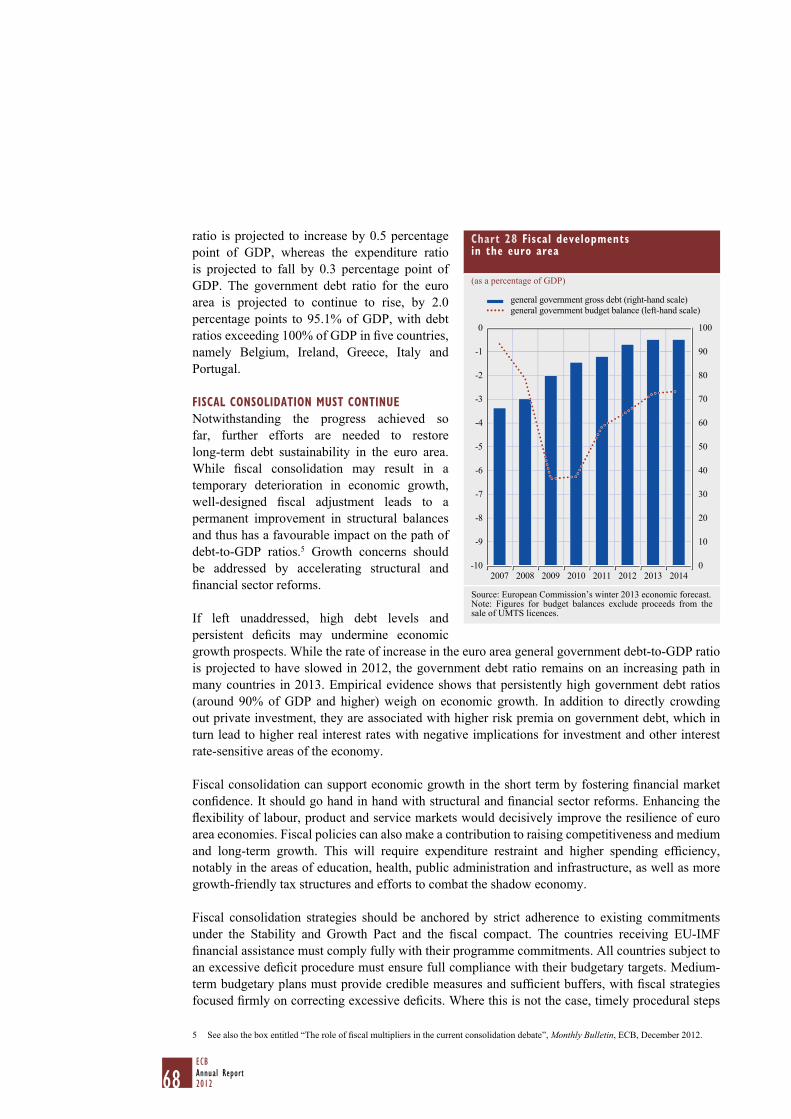
68ECBAnnual Report2012
ratio is projected to increase by 0.5 percentage point of GDP, whereas the expenditure ratio is projected to fall by 0.3 percentage point of GDP. The government debt ratio for the euro area is projected to continue to rise, by 2.0 percentage points to 95.1% of GDP, with debt ratiosexceeding100%ofGDPinfivecountries,namely Belgium, Ireland, Greece, Italy and Portugal.
FiSCal ConSolidation muSt Continue Notwithstanding the progress achieved so far, further efforts are needed to restore long-term debt sustainability in the euro area. While fiscal consolidation may result in atemporary deterioration in economic growth, well-designed fiscal adjustment leads to apermanent improvement in structural balances and thus has a favourable impact on the path of debt-to-GDP ratios.5 Growth concerns should be addressed by accelerating structural and financialsectorreforms.
If left unaddressed, high debt levels and persistent deficits may undermine economicgrowth prospects. While the rate of increase in the euro area general government debt-to-GDP ratio is projected to have slowed in 2012, the government debt ratio remains on an increasing path in many countries in 2013. Empirical evidence shows that persistently high government debt ratios (around 90% of GDP and higher) weigh on economic growth. In addition to directly crowding out private investment, they are associated with higher risk premia on government debt, which in turn lead to higher real interest rates with negative implications for investment and other interest rate-sensitive areas of the economy.
Fiscalconsolidationcansupporteconomicgrowthintheshorttermbyfosteringfinancialmarketconfidence.Itshouldgohandinhandwithstructuralandfinancialsectorreforms.Enhancingtheflexibilityoflabour,productandservicemarketswoulddecisivelyimprovetheresilienceofeuroarea economies. Fiscal policies can also make a contribution to raising competitiveness and medium and long-term growth. This will require expenditure restraint and higher spending efficiency,notably in the areas of education, health, public administration and infrastructure, as well as more growth-friendly tax structures and efforts to combat the shadow economy.
Fiscal consolidation strategies should be anchored by strict adherence to existing commitments under the Stability and Growth Pact and the fiscal compact. The countries receiving EU-IMFfinancialassistancemustcomplyfullywiththeirprogrammecommitments.Allcountriessubjecttoanexcessivedeficitproceduremustensurefullcompliancewiththeirbudgetarytargets.Medium-termbudgetaryplansmustprovidecrediblemeasuresandsufficientbuffers,withfiscalstrategiesfocusedfirmlyoncorrectingexcessivedeficits.Wherethisisnotthecase,timelyproceduralsteps
5 Seealsotheboxentitled“Theroleoffiscalmultipliersinthecurrentconsolidationdebate”,Monthly Bulletin, ECB, December 2012.
Chart 28 Fiscal developments in the euro area
(as a percentage of GDP)
0
10
20
30
40
50
60
70
80
90
100
-10
-9
-8
-7
-6
-5
-4
-3
-2
-1
0
2007 2008 2009 2010 2011 2012 2013 2014
general government budget balance (left-hand scale) general government gross debt (right-hand scale)
Source: European Commission’s winter 2013 economic forecast.Note: Figures for budget balances exclude proceeds from the sale of UMTS licences.

69ECB
Annual Report2012
shouldbetakenundertheexcessivedeficitproceduretopreventconsolidationeffortsfrombeingundulydelayedand thenewlystrengthenedfiscalgovernance framework from losingcredibilityfrom the outset.
3 eConomiC and monetary developmentS in non-euro area eu member StateS
eConomiC aCtivityDespiteimprovingfinancialconditions,economicactivityremainedweakinmostofthetennon-euro area EU Member States (hereafter also referred to as the EU10 countries) in 2012, especially towards the end of the year. GDP growth was considerably lower in 2012 than in 2011. The economic recovery was mainly curtailed by the continued deleveraging needs in a number of countries and economic weakness in the euro area, which affected above all those economies where growth had been driven primarily by external demand in 2011. Domestic demand (excluding inventories) continued to be an important driver of GDP growth, with largely positive contributions in those countries that saw economic growth. Investment increased in a number of countries including Bulgaria, Denmark, Romania and the United Kingdom. Weak or still negative credit growth continued to restrain economic growth in a number of countries as a result of both tight supply-side conditionsandlowdemand,reflectingmoderateeconomicactivityanddebtdeleveraging.Althoughunemployment declined in a few countries, continued low growth meant that its level remained high in the majority of EU10 countries, especially Bulgaria, Latvia, Lithuania and Hungary.
Inweightedaverageterms,EU10annualGDPgrowthdeclinedover thecourseof thefirst threequarters of 2012 in comparison with 2011. Cross-country differences, however, were substantial, but smaller than at the peak of the crisis in 2009 (see Table 7). Although slower than in 2011, GDP growth remained robust in Latvia and Lithuania, while growth remained well above the EU average
table 7 real Gdp growth in the non-euro area eu member States and the euro area
(annual percentage changes)
2009 2010 2011 2012 1) 2012Q1
2012Q2
2012Q3
2012Q4
Bulgaria -5.5 0.4 1.7 . 0.5 0.5 0.5 .Czech Republic -4.5 2.5 1.9 . -0.5 -1.0 -1.3 .Denmark -5.7 1.6 1.1 -0.6 0.2 -1.4 0.0 -1.0Latvia -17.7 -0.9 5.5 . 5.6 4.8 5.2 .Lithuania -14.8 1.5 5.9 3.6 4.3 3.1 3.4 3.0Hungary -6.8 1.3 1.6 . -1.3 -1.4 -1.6 .Poland 1.6 3.9 4.3 . 3.5 2.3 1.8 .Romania -6.6 -1.7 2.5 0.2 0.8 1.3 -0.3 0.1Sweden -5.0 6.6 3.7 . 1.2 1.4 0.6 .United Kingdom -4.0 1.8 0.9 0.2 0.3 -0.2 0.2 0.3
EU7 2) -3.1 2.1 3.2 . 1.7 1.1 0.6 .EU10 3) -4.0 2.4 1.8 . 0.8 0.3 0.3 .Euro area -4.4 2.0 1.4 -0.5 -0.1 -0.5 -0.6 -0.9
Source: Eurostat.Notes: Annual data are calculated using non-seasonally adjusted data. Quarterly data are seasonally and working day-adjusted for all countries except Romania, for which the data are only seasonally adjusted.1)Figuresfor2012areflashestimates,i.e.preliminarydata.2) The EU7 aggregate comprises the seven non-euro area EU Member States that joined the EU in 2004 or 2007.3) The EU10 aggregate comprises the ten non-euro area EU Member States as at 31 December 2012.

70ECBAnnual Report2012
in Poland. In Latvia, there was a broad-based recovery in output growth, which stood at 5.2%, the strongestinthewholeEUforthefirstthreequartersof2012.InLithuania,heighteneduncertaintyweighed on domestic spending and, although weaker external demand dampened exports, the positive contribution of net exports to GDP growth remained substantial. In Poland, real GDP growth deceleratednotablyin2012fromrelativelyhighlevels,mostlyreflectingabroad-basedslowdownindomesticandexternaldemand.GDPcontractedinthefirstthreequartersof2012intheCzechRepublic and Hungary. The main factor behind the economic slowdown in the Czech Republic was domestic demand owing to falling household consumption and lower government expenditure. Hungary experienced a steep cumulative decline in economic activity as domestic demand fell amid deleveraging byhouseholdsandcompanies,fiscalconsolidation,andweakconsumerandbusinessconfidence. The United Kingdom experienced a decline in output during the first half of 2012. Real GDPincreased markedly in the third quarter, boosted by positive calendar effects as well as the London Olympics, but declined again in the fourth quarter. The recovery in economic activity in Bulgaria and Romania remained moderate in 2012. In Denmark, real GDP growth remained low on the backofsubdueddomesticdemand,reflectingtheneedforbalancesheetrepairfollowingtherapidleveraging in the run-up to the crisis. Economic growth in Sweden in 2012 moderated somewhat compared with 2011, but remained noticeably above the EU average.
priCe developmentSTheweightedaverageannualHICPinflationintheEU10economieswas3.0%in2012,after4.0%in2011.Nevertheless,cross-countryvariationininflationdynamicsremainedsignificant(seeTable8).Thehighestannual inflation in2012wasexperiencedbyHungary(5.7%),whereas inSweden theinflation ratedeclined to0.9%, the lowest among theEU10countries. Inmost countries, subdueddomesticdemandandlargesparecapacitieshadalimitingeffectoninflationarypressures.Asregardsother factorsaffecting inflation rates,baseeffects from internationalcommodityprice increases inthefirsthalfof2011ledtoamoderationininflationarypressuresinmostEU10countries.However,an uptick in certain commodity prices in the third quarter exerted upward pressure on inflation,especiallyinBulgariaandRomaniaasthesetwocountriesaremoreexposedtofluctuationsinfoodprices.Changesinadministeredpricesandindirecttaxeshadaheterogeneouseffectoninflationinthe EU10 countries. In Latvia and the United Kingdom, the fading effects of previous indirect tax
table 8 hiCp inflation in the non-euro area eu member States and the euro area
(annual percentage changes)
2009 2010 2011 2012 2012Q1
2012Q2
2012Q3
2012Q4
Bulgaria 2.5 3.0 3.4 2.4 1.9 1.8 3.0 2.8Czech Republic 0.6 1.2 2.1 3.5 4.0 3.8 3.4 2.9Denmark 1.1 2.2 2.7 2.4 2.8 2.2 2.4 2.1Latvia 3.3 -1.2 4.2 2.3 3.3 2.4 1.9 1.6Lithuania 4.2 1.2 4.1 3.2 3.6 2.8 3.2 3.0Hungary 4.0 4.7 3.9 5.7 5.6 5.5 6.0 5.5Poland 4.0 2.7 3.9 3.7 4.2 4.0 3.9 2.8Romania 5.6 6.1 5.8 3.4 2.7 2.1 4.2 4.7Sweden 1.9 1.9 1.4 0.9 0.9 0.9 0.9 1.0United Kingdom 2.2 3.3 4.5 2.8 3.5 2.7 2.4 2.7
EU7 1) 3.7 3.2 3.9 3.7 3.9 3.6 4.0 3.4EU10 2) 2.7 3.2 4.0 3.0 3.4 2.9 2.9 2.8Euro area 0.3 1.6 2.7 2.5 2.7 2.5 2.5 2.3
Source: Eurostat.1) The EU7 aggregate comprises the seven non-euro area EU Member States that joined the EU in 2004 or 2007.2) The EU10 aggregate comprises the ten non-euro area EU Member States as at 31 December 2012.

71ECB
Annual Report2012
increaseshelpedtodampeninflation(alongsideareductioninthestandardVATrateby1percentagepointto21%inLatviaasofJuly2012).Asaresult,inflationdeclinedfrom4.2%in2011to2.3%in 2012 in Latvia and from 4.5% in 2011 to 2.8% in 2012 in the United Kingdom. Conversely, in theCzechRepublicandHungary,recentfiscalconsolidationmeasureshavehadtheoppositeeffect.Thus,inflationintheCzechRepublicincreasedfrom2.1%in2011to3.5%in2012,whileinHungaryinflation increased from3.9%in2011 to5.7%in2012.AverageHICP inflationexcludingenergyand unprocessed food declined in the EU10 countries in 2012 to 2.5%, compared with 3.1% in 2011. Overall,thestronginfluenceofidiosyncraticfactorsresultedinconsiderableintra-yearpricevariationsacrosscountries,butEU10inflationwasonaveragelowerin2012thanin2011.
FiSCal poliCieSThe budget balance-to-GDP ratio improved in most non-euro area EU countries; only the Czech Republic,Denmark,HungaryandSwedenrecordedaworseningfiscalbalancein2012.InHungary,however, excluding the one-off revenues linked to the nationalisation of the obligatory private pensionpillarin2011,theunderlyingfiscalsituationimprovedin2012,afteradeteriorationinthetwo preceding years. Five of the ten non-euro area EU Member States are estimated to have posted budgetdeficitsabovethe3%ofGDPreferencevaluein2012(seeTable9).Despiteasignificantconsolidationeffort,theUnitedKingdomcontinuedtorecordaverylargedeficit,estimatedat6.3%of GDP, owing to a less favourable macroeconomic environment than previously expected. In Denmark,thedeficitstronglywidenedto4.0%ofGDPasaconsequenceoflowerGDPgrowth,higher public investment and a one-off payout of voluntary early retirement pension contributions. Deficits in2012areestimated tohaveexceeded the referencevaluealso in theCzechRepublic,Lithuania and Poland, with the latter two countries posting large improvements. Overall, except for theCzechRepublicandPoland,thefiscaloutcomesfor2012werebroadlyinlinewiththetargets
table 9 General government finances
(as a percentage of GDP)
Budget balance Gross debtEuropean Commission April 2012
stability/convergence programme updates
European Commission April 2012 stability/convergence programme updates
2009 2010 2011 2012 2012 2009 2010 2011 2012 2012
Bulgaria -4.3 -3.1 -2.0 -1.0 -1.6 14.6 16.2 16.3 18.9 19.8Czech Republic -5.8 -4.8 -3.3 -5.2 -3.0 34.2 37.8 40.8 45.5 44.0Denmark -2.7 -2.5 -1.8 -4.0 -4.0 40.7 42.7 46.4 45.6 40.5Latvia -9.8 -8.1 -3.4 -1.5 -2.1 36.7 44.5 42.2 41.9 44.5Lithuania -9.4 -7.2 -5.5 -3.2 -3.0 29.3 37.9 38.5 41.1 40.2Hungary -4.6 -4.4 4.3 -2.4 -2.5 79.8 81.8 81.4 78.6 78.4Poland -7.4 -7.9 -5.0 -3.5 -2.9 50.9 54.8 56.4 55.8 53.7Romania -9.0 -6.8 -5.7 -2.9 -2.8 23.6 30.5 34.7 38.0 34.2Sweden -0.7 0.3 0.3 -0.2 -0.1 42.6 39.5 38.4 37.7 37.7United Kingdom -11.5 -10.2 -7.8 -6.3 -5.9 67.8 79.4 85.2 89.8 89.0EU7 1) -7.0 -6.5 -3.6 -3.4 -2.8 44.1 48.6 50.3 51.2 49.5EU10 2) -8.5 -7.5 -5.3 -4.7 -4.3 56.8 64.1 67.5 70.7 69.5Euro area 3) -6.3 -6.2 -4.2 -3.5 -3.2 80.0 85.6 88.1 93.1 -
Sources: European Commission’s winter 2013 economic forecast, April 2012 updated stability/convergence programmes and ECB calculations.Notes:DataarebasedonESA95definitions.The2012figuresintheApril2012stability/convergenceprogrammeupdateswereestablishedbynationalgovernmentsandhencecoulddifferfromthefinaloutcomes.1) The EU7 aggregate comprises the seven non-euro area EU Member States that joined the EU in 2004 or 2007.2) The EU10 aggregate comprises the ten non-euro area EU Member States as at 31 December 2012.3) The euro area budget balance aggregate is based on EU/IMF and/or EDP targets for Ireland, Greece, Spain and Portugal and April 2012 stability programme updates for the other euro area countries. The euro area gross debt aggregate is not reported owing to missing information for some countries.

72ECBAnnual Report2012
contained in the April 2012 convergence programmes. The improvements in budget balances in2012weremainlyduetostructuralfiscalconsolidationinmostcountries.
At the end of 2012 all non-euro area EU Member States apart from Bulgaria and Sweden were subjecttoanEUCouncildecisionontheexistenceofanexcessivedeficit.InBulgaria,theexcessivedeficitprocedure(EDP)wasabrogatedby theEUCouncil inJune2012andfiscalconsolidationcontinuedin2012.Deadlinestocorrecttheexcessivedeficitsituationweresetat2012forLatvia,Lithuania, Hungary, Poland and Romania, at 2013 for the Czech Republic and Denmark, and at the financialyear2014/15fortheUnitedKingdom.
Thegrossgeneralgovernmentdebt-to-GDPratiosareestimatedtohaveincreasedin2012infivenon-euro area EU Member States (Bulgaria, the Czech Republic, Lithuania, Romania and the United Kingdom). The debt-to-GDP ratio remained above the 60% reference value in Hungary and the United Kingdom, decreasing in the former but further increasing in the latter. The decline in the governmentdebtratioinHungaryreflected,interalia,theappreciationoftheforintandtherebytherevaluation of the foreign currency-denominated part of the public debt.
balanCe oF paymentS developmentSIn 2012 the combined current and capital account balances of the EU10 countries (as a percentage of GDP) continued to improve in most countries except for Bulgaria, Denmark and the United Kingdom (see Table 10). Surpluses were registered in Denmark, Latvia, Hungary and Sweden, whereasBulgariaandLithuaniarecordedsmalldeficits.IntheCzechRepublic,PolandandRomania,thecombinedcurrentandcapitalaccountdeficitsnarrowedsignificantly,withPolandandRomaniarecordingthesmallestdeficitssincetheyjoinedtheEU.ExternaladjustmentintheCzechRepublicand Poland was largely brought about by an improvement in the goods balance backed by robust exportgrowthinthefirsthalfoftheyear,whereasinRomaniaitreflectedamorefavourableincomebalance and capital account balance. In Hungary and Sweden, the combined current and capital account surpluses did not move significantly. Latvia and Lithuania, which recorded the largestcurrentaccountdeficitspriortotheglobalfinancialcrisisandsawsharpimprovementsafterwards,
table 10 balance of payments of the non-euro area eu member States and the euro area
(as a percentage of GDP)
Current and capital account balance
Net direct investment fl ows
Net other investment fl ows
2009 2010 2011 2012 1) 2009 2010 2011 2012 1) 2009 2010 2011 2012 1)
Bulgaria -7.6 -0.7 1.6 -0.5 7.2 2.7 4.1 5.9 -2.0 -2.7 -5.1 -0.4Czech Republic -1.0 -3.0 -2.5 -1.2 1.0 2.5 2.0 4.1 -1.4 -1.8 0.3 -4.2Denmark 3.4 5.9 5.9 5.3 -0.8 -3.7 -0.2 -1.8 3.8 4.2 -3.0 4.1Latvia 11.1 4.9 0.0 0.4 0.6 1.5 4.9 2.9 -9.8 -0.8 -7.2 -5.7Lithuania 7.1 2.7 -1.3 -0.4 -0.6 2.2 3.2 1.7 -10.3 -9.2 -1.5 -5.0Hungary 0.9 2.8 3.3 3.6 0.1 0.8 0.3 2.1 9.1 0.7 -3.8 -10.6Poland -2.2 -3.3 -2.9 -1.5 1.9 1.4 2.3 1.1 3.1 2.1 0.5 -0.7Romania -3.6 -4.2 -3.9 -2.7 3.0 1.8 1.3 1.8 2.3 4.7 1.6 -0.3Sweden 6.6 6.5 6.3 6.6 -3.9 -4.2 -2.3 -4.5 -10.0 -8.8 -9.7 -5.6United Kingdom -1.5 -3.1 -1.2 -2.9 1.2 0.9 -2.3 -1.2 -3.0 0.0 5.9 12.3EU7 2) -1.4 -2.1 -1.9 -0.9 1.8 1.7 2.0 2.2 1.8 0.9 -0.4 -2.7EU10 3) -0.2 -1.1 0.0 -0.7 0.7 0.2 -1.0 -0.8 -1.9 -0.4 1.7 5.9Euro area -0.1 0.1 0.3 1.1 -0.8 -1.0 -1.6 -0.9 -2.1 -0.3 -1.6 0.3
Source: ECB.1) Figures for 2012 refer to the four-quarter average up to the third quarter of 2012. 2) The EU7 aggregate comprises the seven non-euro area EU Member States that joined the EU in 2004 or 2007. 3) The EU10 aggregate comprises the ten non-euro area EU Member States as at 31 December 2012.

73ECB
Annual Report2012
slightly improved their combined current and capital account and kept it close to balance.
On the financing side, net foreign directinvestment outflows from the EU10 countrieswere on aggregate close to 1% of GDP. While Denmark, Sweden and the United Kingdom were net exporters of direct investment, non-euro area EU countries in central and eastern Europe posted net inflows. Denmark and the United Kingdomrecordedlargeportfolioinvestmentoutflows,whileconsiderableinflowswereobservedforLithuaniaand Sweden. Regarding other investment, all EU10 countries except for Denmark and the UnitedKingdomexperiencednetoutflowsin2012,which was probably related to the ongoing process of deleveraging.
eXChanGe rate developmentSExchange rate developments in EU10 currencies reflected the different exchange rate regimesthat were in place in individual countries. The currencies of Denmark, Latvia and Lithuania participated in the exchange rate mechanism II (ERM II). The Latvian lats and the Lithuanian litas weresubjecttoastandardfluctuationbandof±15%around their central rates against the euro, and the Danish krone was subject to a narrower band of ±2.25%(seeChart29).ERMIIparticipationwas,in the case of Latvia and Lithuania, accompanied by unilateral commitments to maintain narrower fluctuation bands or currency board regimes.These unilateral commitments place no additional obligations on the ECB. The Lithuanian litas joined ERM II with its existing currency board arrangement in place, and the Latvian authorities decided to maintain the exchange rate of the lats at itscentralrateagainsttheeurowithafluctuationband of ±1%. During 2012 the Lithuanian litasremained at its central rate, while the Latvian lats fluctuatedwithintheunilaterallysetbandof±1%vis-à-vistheeuro.
Turning to the currencies of EU10 countries that did not participate in ERM II in 2012, three distinct phases of exchange rate developments canbeidentified(seeChart30).Duringthefirstquarter of the year the currencies of central and eastern European countries mostly appreciated
Chart 29 developments in erm ii eu currencies
(daily data; deviation from the central parity in percentage points)
-0.5
0.0
0.5
1.0
1.5
-0.5
0.0
0.5
1.0
1.5
Jan. Apr. July Oct. Jan.20132012
LTL LVL DKK
Source: ECB.Notes: A positive (negative) deviation from the central rate against the euro implies that the currency is on the strong (weak) side of the band. For the Danish krone, a fluctuation band of ±2.25% applies. For the other currencies, thestandard fluctuation band of ±15% applies. The latestobservation is for 1 March 2013.
Chart 30 developments in non-erm ii eu currencies vis-à-vis the euro
(daily data; index: 2 January 2012 = 100)
90
95
100
105
110
115
90
95
100
105
110
115
2012 2013Jan. Apr. July Oct. Jan.
PLNGBPHUF
SEKCZKRONBGN
Source: ECB.Notes: An increase (decrease) indicates an appreciation (depreciation) of the currency. The latest observation is for 1 March 2013.

74ECBAnnual Report2012
against the euro against the background of a stabilising economic outlook for the region and declining risk aversion among international investors. During the second quarter and the summer of 2012, increased uncertainty about the economic outlook and the evolution of the euro area sovereign debt crisis resulted in higher volatility in central and eastern European foreign exchange markets and an appreciation of the pound sterling and the Swedish krona. This trend was reversed after the summer as global financialmarket sentiment improved and risk aversion declined.Asa result, the pound sterling and the Swedish krona lost some of their earlier gains and in early January 2013 traded about 2½% and 4%, respectively, above their levels a year earlier. At the same time, the exchange rates of central and eastern European currencies stabilised mostly above the levels prevailing in early 2012. In early January 2013 the Hungarian forint and the Polish zloty traded about 7% and 9% higher than in January 2012, while the Czech koruna stood about 1% above its level at the beginning of 2012 and the Romanian leu traded 2½% lower than a year earlier. The exchange rate of the Bulgarian lev remained unchanged against the euro throughout the period under review given its euro-based currency board arrangement.
FinanCial developmentSFinancial market conditions generally improved in the non-euro area EU Member States in the course of 2012. Long-term interest rates, as measured by ten-year government bond yields, declined for all countries, and for many countries they fell to historically low levels. The declines partly resulted from a decrease in perceived tail risks and expectations of low growth. Long-term interest rates inDenmark,Swedenand theUnitedKingdomdeclinedalsoasaconsequenceofflight-to-safetyflows,mostlyconcentratedinthefirsthalfof2012.Higher-yieldingbondsissuedbyotherEU10 countries benefited from the global search for yield,whichwas particularly strong in thesecond half of 2012. Credit risk premia, as measured by credit default swaps, decreased sharply in thesecondhalfof2012asaresultofthegeneralimprovementinfinancialmarkets.Thiswastoasignificantextentduetoareductionintailrisksstemmingfromtheeuroareawhichfollowedtheannouncement, in August-September, of Outright Monetary Transactions. With regard to money markets, interest rates declined in all EU10 countries except Romania, where the upward trend inmoneymarketratesreflectedanumberoffactorsincludingtherevisionofbanks’expectationsregarding the outlook for the policy rate and liquidity situation as well as the tightening of liquidity provisionbyBancaNaţionalăaRomânieisinceAugust2012.StockmarketsinEU10countriesroseon average by 11% in 2012, slightly less than the 16% increase observed for the euro area. Equity prices increased the most in Denmark and Poland (up by 28% and 25% respectively), increased slightly in Bulgaria and were broadly unchanged in Romania.
monetary poliCyThe primary objective of monetary policy in all EU10 countries is price stability. Monetary policy strategies, however, continued to differ considerably from country to country in 2012 (see Table 11).
The lowering of the key ECB interest rates by 25 basis points in both December 2011 and July 2012 set the environment for the measures taken by several EU10 central banks. Interest rate reductions took place in a number of central and eastern European countries and Denmark. Following a series of rate reductions byDanmarksNationalbank ending in July, the interest rate on certificates ofdeposit stood at -0.20% (down from +0.30% in December 2011), the lending rate at 0.20% (down from 0.70%) and the current account and discount rates at 0.00% (down from 0.25% and 0.75% respectively). Latvijas Banka lowered its refinancingratebya totalof100basispoints to2.5%.In thefirstquarterof2012BancaNaţionalăaRomâniei continued to lower the monetary policy rate, reducing it in three 25 basis point steps to 5.25%. The policy rate was subsequently left

75ECB
Annual Report2012
unchanged. Similarly, Sveriges Riksbank cut its repo rate by 75 basis points in total to 1.00% owing todampenedeconomicandinflationprospects.TheMagyarNemzetiBanklooseneditsmonetarypolicy by reducing its base rate by 175 basis points cumulatively between August 2012 and February 2013 to 5.25%. Narodowy Bank Polski raised its repo rate by 25 basis points in May before cutting it in November, December, January and February (each time by 25 basis points), thus reducing the repo rate to 3.75% at the end of February 2013. The key policy rates were also reduced byČeskánárodníbanka,withthereporatestandingat0.05%attheendof2012.
With regard to other monetary policy measures, along with the changes in policy rates mentioned above, Danmarks Nationalbank intervened in the foreign exchange market in the first half of 2012 to stem appreciating pressure on the Danish krone. The overall objective ofthesemeasureswas tokeep the exchange ratevis-à-vis the euro stable and, at the same time, tonarrow the spread between the lending rate and the rate on certificates of deposit in order toreduce the possibility of fluctuations in short-term money market rates. Česká národní bankasignalled its readiness to use the Czech koruna exchange rate as a policy tool for more aggressive monetary easing. Meanwhile, the Bank of England increased the size of its asset purchase programme by GBP 50 billion in February and by a further GBP 50 billion in July. As a result, the total assets purchased with central bank reserves increased from GBP 275 billion in 2011 to GBP 375 billion at the end of 2012. In addition, the Bank of England and HM Treasury introduced
table 11 official monetary policy strategies of the non-euro area eu member States
Monetary policy strategy Currency Features
Bulgaria Exchange rate target Bulgarian lev Exchangeratetarget:fixedtotheeuroatBGN1.95583pereuro within the framework of a currency board arrangement.
Czech Republic Inflationtarget Czech koruna Inflationtarget:2%±1percentagepoint.Managedfloatingexchange rate.
Denmark Exchange rate target Danish krone ParticipatesinERMIIwitha±2.25%fluctuationbandaround a central rate of DKK 7.46038 per euro.
Latvia Exchange rate target Latvian lats ParticipatesinERMIIwitha±15%fluctuationbandarounda central rate of LVL 0.702804 per euro. Latvia continues withafluctuationbandof±1%asaunilateralcommitment.
Lithuania Exchange rate target Lithuanian litas ParticipatesinERMIIwitha±15%fluctuationbandaround a central rate of LTL 3.45280 per euro. Lithuania continues with its currency board arrangement as a unilateral commitment.
Hungary Inflationtarget Hungarian forint Inflationtarget:3%medium-termtargetsince2007with±1percentagepointtoassesstargetachievement(expost).Free-floatingexchangerate.
Poland Inflationtarget Polish zloty Inflationtarget:2.5%±1percentagepoint(12-monthincreaseintheCPI).Free-floatingexchangerate.
Romania Inflationtarget Romanian leu Inflationtarget:3.0%±1percentagepointforend-2011andend-2012,and2.5%±1percentagepointfortheyear-endfrom2013.Managedfloatingexchangerate.
Sweden Inflationtarget Swedish krona Inflationtarget:annualchangeintheCPIof2%.Free-floatingexchange rate.
United Kingdom Inflationtarget Pound sterling Inflationtarget:2%asmeasuredbythe12-monthincreaseinthe CPI. In the event of a deviation of more than 1 percentage point, the Governor of the Bank of England is expected to write an open letter on behalf of the Monetary Policy Committee to the Chancellor of the Exchequer. Free-floatingexchangerate.
Source: ESCB.Note: For the United Kingdom the CPI is identical to the HICP.

76ECBAnnual Report2012
the Funding for Lending Scheme, which gives banks access to cheap funding along with incentives to expand lending. The Magyar Nemzeti Bank also introduced a new long-term liquidity-providing instrument and stands ready to launch a mortgage bond purchase programme as soon as the universal mortgage bond issuance model is introduced. The purpose of the liquidity-providing instrument was to support the liquidity buffer of the banking system and to help the sector in reducing its asset-liability mismatches. Latvijas Banka lowered its minimum reserve ratio by 1 percentage point in viewofthedownwardtrendininflationandtheresultingabilitytoincreasetheavailabilityofthefinancialsector’sresources to theeconomy.Meanwhile,Lietuvosbankas introducedlimitedopenmarket operations to help banks manage their liquidity in a more optimal way.
RatecutdecisionsintheEU10countriesweregenerallyduetoperceiveddisinflationarypressuresover the medium term, but also aimed to further support the domestic post-crisis rebound and credit growth (in Latvia) and later to combat a weakening economic outlook. The monetary policy stance, on average, remained accommodative in the EU10 countries. There were some large downward movements in real money market interest rates in ex ante terms (in Bulgaria, the Czech Republic, Hungary and the United Kingdom). Measures of real short-term interest rates in ex post terms declined in most countries and stayed negative on average. Overall, the accommodative monetary policystancereflectedthesubduedinflationoutlook,aswellasuncertaintiesrelatedtotheeconomicrecovery in most EU10 countries.


In 2012 the new ECB premises started to take shape as a new visible element of Frankfurt’s city skyline. The high-rise grewslightlymorequicklythananticipated,atarateofapproximatelyoneflooreverysixdays.

79ECB
Annual Report2012
Chapter 2
Central banK operationS and aCtivitieS
1 monetary poliCy operationS, ForeiGn eXChanGe operationS and inveStment aCtivitieS
1.1 monetary poliCy operationS
The monetary policy instruments used by the Eurosystem in 2012 comprised open market operations, such as main refinancing operations (MROs), longer-term refinancing operations (LTROs)and fine-tuning operations, as well as standing facilities and minimum reserve requirements.In September 2012 the ECB announced the operational features of a new non-standard measure, the Outright Monetary Transactions (OMTs). This measure is aimed at safeguarding an appropriate monetary policy transmission and the singleness of the monetary policy in the euro area. The second covered bond purchase programme ended as scheduled on 31 October 2012 and the Securities Markets Programme was also terminated following the decision on OMTs.
During 2012 the Governing Council changed the key ECB interest rates on one occasion (see Chart 31). On 11 July 2012 the interest rates on the MROs, the marginal lending facility and the deposit facility were reduced by 25 basis points to 0.75%, 1.50% and 0.00% respectively. The width of the interest rate corridor was thus kept at 150 basis points (75 basis points on either sideofthefixedrateontheMROs).
The implementation of monetary policy during 2012 was driven by the Eurosystem’s efforts to address the tensions in some segments of the financial markets and the impairment ofthe monetary policy transmission mechanism. Full allotment and fixed rate tender procedurescontinued to apply in all liquidity-providing refinancing operations.1 As a consequence, the outstanding volume of refinancing operationscontinued to be driven by the demand from counterparties,therebyreflectingtheirunderlyingliquidity preferences. The banking system’s demand for liquidity from the Eurosystem increased sharply as a consequence of the two three-year LTROs, in which a combined amount of more than €1,000 billion was allotted to as many as 800 different counterparties. As a result, the banking system’s overall demand for liquidity reached a level of over €1,200 billion during the firsthalfof2012,butstabilisedinthesecondhalf
1 Theratesinthethree-monthLTROswerefixedattheaveragerateoftheMROsoverthelifetimeoftheLTROs.
Chart 31 eCb interest rates and the overnight interest rate
(percentages)
0.0
0.2
0.4
0.6
0.8
1.0
1.2
1.4
1.6
1.8
2.0
0.0
0.2
0.4
0.6
0.8
1.0
1.2
1.4
1.6
1.8
2.0
Jan. Mar. May July2012
Sep. Nov.
overnight interest rate (EONIA) interest rate on the deposit facility
interest rate on the main refinancing operations interest rate on the marginal lending facility
Source: ECB.

80ECBAnnual Report2012
anddeclinedmarginallytowardstheendoftheyearwhenfinancialmarkettensionspartiallyabated(see Chart 32).
During the 12 maintenance periods of 2012 (from 18 January 2012 to 15 January 2013), the averagedailyliquidityneedsoftheeuroareabankingsystem–definedasthesumofautonomousfactors 2andreserverequirements–amountedto€487.6billion,whichwas4%higherthanduringthe 12 maintenance periods of 2011. The slight increase in liquidity needs was the combined result of an increase in autonomous factors, by 47%, to €381.6 billion on average (see Chart 33) and a considerable decrease in reserve requirements, reflecting theGoverningCouncil’s decision inDecember 2011 to reduce the reserve ratio from 2% to 1%, as of the reserve maintenance period starting on 18 January 2012. The main contributor to the increase in autonomous factors was government deposits, which rose considerably in 2012. Minimum reserve requirements decreased to €106 billion on average during the 12 maintenance periods of 2012, compared with €208 billion during the 12 maintenance periods of 2011.
The average monthly amount of excess reserves (current account holdings in excess of reserve requirements) in 2012 stood at €208.7 billion, averaging €4.61 billion during the first sixmaintenance periods of 2012 (from 18 January 2012 to 10 July 2012) and €412.74 billion during the last six maintenance periods of 2012 (from 11 July 2012 to 15 January 2013), which was higher than in previous years (€2.53 billion during the 12 maintenance periods of 2011 and €1.26 billion during the 12 maintenance periods of 2010).
2 Autonomous factors are those items on the Eurosystem’s balance sheet, such as banknotes in circulation and government deposits, which have an impact on credit institutions’ current account holdings, but are not under the direct control of the ECB’s liquidity management function.
Chart 32 outstanding volume of monetary policy operations
(EUR billions)
-1,200-1,000-800-600-400-20002004006008001,0001,2001,4001,600
-1,200-1,000
-800-600-400-200
0200400600800
1,0001,2001,4001,600
Jan. Feb. Mar. Apr. May June July2012 2013
Aug. Sep. Oct. Nov. Dec. Jan.
liquidity needs
liquidity-absorbing fine-tuning operationsCBPP, CBPP2 and SMP
six-month LTROs
one-maintenance-period LTROs
net recourse to deposit facility
three-year LTROs
one-year LTROs
three-month LTROs
MROs and one-day fine-tuning operations
Source: ECB.

81ECB
Annual Report2012
Excess reserves increased in the second half of 2012 because of the reduction of the deposit facility rate to zero in July 2012, which, in principle, made banks indifferent as to whether they use the deposit facility overnight or leave excess reserves on their current accounts (see Chart 33). The average daily amount of excess reserves amounted to €29.7 billion during the first sixmaintenance periods of 2012 and €419.9 billion during the last six maintenance periods of the year. The average daily use of the deposit facility stood at around €701.9 billion during the first sixmaintenance periods and decreased to €282.8 billion during the last six maintenance periods.
open marKet operationS In 2012 the Eurosystem used MROs, regular three-month LTROs, special-term refinancingoperationswithamaturityofonemaintenanceperiod,three-yearLTROsandfine-tuningoperationsto manage the liquidity situation in the money market. All liquidity-providing operations have to be fully collateralised.
MROs are regular operations with a weekly frequency and normally have a maturity of one week. They are the traditional, main instrument for signalling the ECB’s monetary policy stance. However, given the abundant excess liquidity, the relative importance of MROs temporarily declined after the three-yearLTROallotments.In2012all52MROswereconductedasfixedratetenderproceduresinwhichallbidsweresatisfied.Thenumberofcounterpartieswhichhavetakenthenecessarystepsto become eligible for open market operations decreased to 2,298 in 2012, from 2,319 in 2011, while the number of euro area MFIs decreased from 7,533 at the end of 2011 to 7,059 at the end of 2012. On average, 95 counterparties participated in the MROs in 2012. The average volume allotted in the MROs in 2012 was €98 billion (compared with €159 billion in 2011), whereby the averageallotmentinthefirsthalfoftheyearwasabout20%lowerthanthatduringthesecondhalf.In 2012 the lowest number of counterparties (65) to participate in an MRO as well as the lowest MRO volume allotted (€17.5 billion) were recorded in the operation that was settled on 7 March.
Chart 33 liquidity factors in the euro area in 2012
(EUR billions)
-1,600
-1,000-800-600-400-200
0200400600800
1,0001,2001,4001,600
-1,600-1,400-1,200-1,000-800-600-400-20002004006008001,0001,2001,4001,600
Jan. Mar.Feb. MayApr. June July Aug. Oct.Sep. Nov. Dec.2012
Liquidityprovision
Liquidityabsorption
-1,200-1,400
reserve requirements fine-tuning operations (net) autonomous factors current accounts
net recourse to deposit facility CBPP, CBPP2 and SMP MROs LTROs
Source: ECB.

82ECBAnnual Report2012
The highest number of participants (169) was observed on 22 February, while the highest allotment amount (€180.4 billion) was recorded on 27 June.
In 2012 the daily average outstanding volume of liquidity allotted in the regular three-month LTROs, special-term refinancing operations and supplementaryLTROswas €1,022 billion. Participationin the regular three-month LTROs averaged €14.4 billion and remained volatile throughout 2012, ranging from a minimum of €6.2 billion allotted in October to a maximum of €26.3 billion allotted in June. The average volume allotted in the one-month special-term refinancing operationswas€17.8 billion and the average number of participating counterparties was 26. Finally, in the three-year LTRO 3 which was settled on 1 March, 800 counterparties participated for a total amount of €529.5 billion, while in the three-year LTRO settled on 22 December 2011, 523 counterparties participated for a total amount of €489.2 billion.
In addition to the open market operations used for the implementation of monetary policy, the ECB can also provide eligible counterparties with liquidity in other currencies (see Section 1.2 of this chapter).
SeCuritieS marKetS proGramme The Governing Council decided in May 2010 to establish the Securities Markets Programme (SMP). The objective of this temporary programme was to address the malfunctioning of certain euro area debt securities market segments and to restore an appropriate monetary policy transmission mechanism. The programme was implemented by Eurosystem portfolio managers carrying out purchases of certain euro area sovereign debt securities in secondary market interventions. The purchases were made between May 2010 and March 2011 and between August 2011 and February 2012. With the announcement of the technical features of the OMTs on 6 September 2012, the SMP was terminated. The liquidity injected through the SMP will continue to be absorbed as in the past, and the existing securities bought under the SMP will be held to maturity. At the programme’s peak, the Eurosystem held SMP securities for a total settlement amount of €219.5 billion, compared with €208.7 billion at the end of 2012.4
the SeCond Covered bond purChaSe proGramme In October 2011 the Governing Council announced a second covered bond purchase programme, the CBPP2. This programme was launched with the purpose of easing funding conditions for banks and companies and encouraging banks to maintain or expand lending to their customers. It allowed the Eurosystem to purchase eligible euro-denominated covered bonds issued in the euro area for an intended nominal amount of €40 billion. The purchases were conducted in both the primary and secondary markets from November 2011 until the end of October 2012, with the purchases totalling a nominal amount of €16.418 billion. The programme was not fully utilised owing to the lack of primary market covered bond issuance, along with the positive effects of the three-year LTROs. It is intended that the purchased bonds will be held until maturity.
TheGoverningCouncildecidedtomaketheportfoliosofthefirstandsecondcoveredbondpurchaseprogrammes available for securities lending. Lending is voluntary and conducted through securities lending facilities offered by central securities depositories, or via matched repurchase transactions with eligible counterparties. While this lending activity has remained limited in terms of amounts, it is considered useful for a proper market functioning that the securities held under the programmes are in principle available for lending.3 TherateofthisLTROisfixedattheaveragerateoftheMROsoveritslifetime.Asof27February2013counterpartieshavethepossibility
to redeem on a weekly basis (i.e. on the day that the weekly MRO is settled) the funds (or a part thereof) borrowed in this second three-year LTRO.
4 More information on the SMP can be found in the ECB’s press release of 10 May 2010, in the ECB’s Decision of 14 May 2010 establishing asecuritiesmarketsprogramme,andintheweeklyfinancialstatementsoftheEurosystem.

83ECB
Annual Report2012
outriGht monetary tranSaCtionS In August 2012 the Governing Council announced the setting-up of the OMTs, the technical features of which were further specified in September5. These OMTs aim to safeguard an appropriate monetary policy transmission and the singleness of the monetary policy in the euro area.
A necessary condition for OMTs is strict and effective conditionality attached to an appropriate European Financial Stability Facility/European Stability Mechanism (EFSF/ESM) programme. This conditionality aims to ensure that governments will make the necessary reforms and maintain fiscaldiscipline.TheGoverningCouncilwillconsiderOMTstotheextentthattheyarewarrantedfrom a monetary policy perspective as long as programme conditionality is fully respected, and terminate them once their objectives have been achieved or when there is non-compliance with the macroeconomic adjustment or precautionary programme. OMTs will be considered for future cases of EFSF/ESM macroeconomic adjustment programmes or precautionary programmes (such as an enhanced conditions credit line). They may also be considered for Member States already under a macroeconomic adjustment programme as they regain bond market access. OMTs would not take place while a given programme is under review and would resume after the review period once programme compliance has been assured.
Transactions would be focused on the shorter part of the yield curve, and in particular on sovereign bonds with a maturity of between one and three years. No ex ante quantitative limits are set on the size of OMTs. The Eurosystem intends to accept the same (pari passu) treatment as private or other creditors with respect to bonds issued by euro area countries and purchased by the Eurosystem through OMTs. The liquidity created through the OMTs would be fully sterilised, as continues to be the case for the SMP, while the transparency of the OMT portfolio would be greater than that of the SMP portfolio. The OMTs had not been activated by the end of 2012.
aGent For the european FinanCial Stability FaCility/european Stability meChaniSm In December 2011 the Governing Council gave approval for the ECB to act as an agent on behalf of the EFSF/ESM in secondary bond market interventions for the EFSF. In June 2012 it was announced that all the necessary preparatory work had been undertaken, but no actual transactions had been carried out under this agency function by the end of 2012.
Fine-tuninG operationS In order to absorb the liquidity injected through the SMP, the ECB conducted weekly liquidity-absorbing fine-tuning operations to collect one-week fixed-term deposits for a weekly amountcorrespondingtothesizeoftheSMPoperationssettleduptothepreviousFriday.Thesefine-tuningoperations were carried out as variable rate tender procedures with a maximum bid rate equal to the prevailing MRO rate. Upon termination of the SMP, the ECB announced that the liquidity injected through the SMP would continue to be absorbed as in the past. In addition, it announced that any liquidity created through OMTs would also be sterilised. Fine-tuning operations to counter the liquidity imbalance on the last day of the maintenance periods were suspended from 14 December 2011.
StandinG FaCilitieS Counterparties can use the two standing facilities on their own initiative to obtain overnight liquidity against eligible collateral or to place overnight deposits with the Eurosystem. At the end of 2012 2,321 counterparties had access to the marginal lending facility and 2,910 counterparties had access to the deposit facility. The use of the deposit facility remained at high levels during thefirst half of2012,with apeakof€827.5billionon5March.Owing to the reductionof the5 See the press release of 6 September 2012, which is available on the ECB’s website.

84ECBAnnual Report2012
deposit facility rate to zero in July 2012, the average recourse to the deposit facility decreased from €701.9billionduringthefirstsixmaintenanceperiodsof2012to€282.8billionduringthelastsixmaintenance periods of 2012, as banks left larger amounts on their current accounts instead, as explained earlier in this section. The average daily use of the deposit facility over the 12 maintenance periods of 2012 was €484.3 billion (compared with €120 billion for the 12 maintenance periods of 2011 and €145.9 billion for the 12 maintenance periods of 2010). In 2012 the use of the deposit facility followed a broadly similar pattern during each reserve maintenance period: the deposit facility amounts were lower at the beginning of each period, but increased subsequently as more counterparties fulfilled their reserve requirements. The average daily recourse to the marginallending facility was €1.76 billion (compared with €2.1 billion in 2011 and €0.62 billion in 2010).
minimum reServe SyStem Credit institutions in the euro area are required to hold minimum reserves on current accounts with the Eurosystem. From 1999 to 2011 the minimum reserve requirements were equal to 2% of credit institutions’ reserve base. On 8 December 2011 the Governing Council decided, as an additional enhanced credit support measure, to reduce the reserve ratio from 2% to 1%, as from the reserve maintenance period starting on 18 January 2012. The minimum reserve requirements amounted to €106 billion on average during the 12 maintenance periods of 2012, which was half of the amount held during the 12 maintenance periods of 2011. As the Eurosystem remunerates reserve holdings at a rate corresponding to the MRO rate, the minimum reserve system does not impose a tax on the banking sector.
eliGible aSSetS For Credit operationS As stipulated in Article 18.1 of the Statute of the ESCB, all credit operations of the Eurosystem are based on adequate collateral. This is standard central bank practice worldwide. Collateral adequacy implies that the Eurosystem is to a large extent protected from losses in its credit operations (see below for more details on risk management issues). Furthermore, the Eurosystem ensures that sufficientcollateralisavailabletoawidesetofcounterparties,sothattheEurosystemcanprovidethe amount of liquidity it deems necessary in its monetary policy operations.
The Eurosystem accepts a broad range of assets as collateral in all its credit operations. This feature of the Eurosystem’s collateral framework, together with the fact that access to Eurosystem open market operations is granted to a large pool of counterparties, has been key in supportingtheimplementationofmonetarypolicyintimesofstress.Theinbuiltflexibilityofitsoperational framework has allowed the Eurosystem to provide the necessary liquidity to address the impaired functioningof themoneymarketduring thefinancial crisis,without counterpartiesencountering widespread collateral constraints.
In 2012 the Eurosystem took a number of measures to preserve and increase collateral availability for counterparties. Since 9 February 2012 euro area NCBs have been allowed, as a temporary solution and following explicit approval by the Governing Council, to accept as collateral for Eurosystem credit operations additional performing credit claims that satisfy specific eligibility criteria. The responsibility entailed by the acceptance of such credit claims is borne by the NCB authorising their use. In addition, on 29 June 2012 the eligibility criteria for certain types of asset-backed security (ABS) were broadened. Furthermore, on 9 November 2012 marketable debt instruments denominated in currencies other than the euro, namely the US dollar, the pound sterling and the Japanese yen, and issued and held in the euro area, became eligible until further notice.

85ECB
Annual Report2012
In 2012 the average amount of marketable assets eligible as collateral was €13.7 trillion, an 8% increase compared with 2011 (see Chart 34). This development was related in particular to an increase in the eligibility of uncovered bank bonds. Central government securities, which amounted to €6.1 trillion, accounted for 44% of total eligible collateral, followed by uncovered bank bonds (€2.4 trillion, or 18%) and covered bank bonds (€1.6 trillion, or 12%). As well as marketable collateral, eligible collateral includes non-marketable assets, mostly in the form of credit claims (also referred to as bank loans). In contrast to the situation for marketable assets, the volume of potentially eligible non-marketable assets cannot easily be measured. The deposited amount of non-marketable assets reached €0.6 trillion in 2012.
The average amount of collateral put forward by counterparties increased to €2,448 billion in 2012, from €1,824 billion in 2011 (see Chart 35). At the same time, the average amount of outstanding credit increased from €538 billion in 2011 to €1,131 billion in 2012, as a result of the two three-year LTROs settled in December 2011 and March 2012. Consequently, the share of deposited collateral not used to cover credit from monetary policy operations decreased during 2012, whereas the absolute amount increased slightly. The level of over-collateralisation shows that, at the aggregate level, the Eurosystem’s counterparties experienced no shortage of collateral.
As regards the composition of collateral put forward (see Chart 36), non-marketable assets (mostly credit claims andfixed-termdeposits)were the largest component in 2012, accounting for 26%of the total (compared with 23% in 2011). The share of covered bank bonds increased, while the
Chart 34 eligible marketable assets
(EUR billions)
0
2,000
4,000
6,000
8,000
10,000
12,000
14,000
0
2,000
4,000
6,000
8,000
10,000
12,000
14,000
2007 2008 2009 20112010 2012
other marketable assets asset-backed securities corporate bonds covered bank bonds uncovered bank bonds regional government securities central government securities
Source: ECB.Notes: Nominal amounts; averages of end-of-month data. The data shown in this chart are published on a quarterly basis on the ECB’s website.
Chart 35 Collateral put forward in eurosystem credit operations and outstanding credit in monetary policy operations(EUR billions)
0
500
1,000
1,500
2,000
2,500
0
500
1,000
1,500
2,000
2,500
2007 2008 2009 2010 2011 2012
peak outstanding creditaverage outstanding credit total collateral put forward
Source: ECB.Notes: “Collateral put forward” refers to assets deposited ascollateral in countries operating a pooling system and assets used as collateral in countries operating an earmarking system. Collateral value after valuation and haircuts; averages of end-of-month data. The data shown in this chart are published on a quarterly basis on the ECB’s website.

86ECBAnnual Report2012
share of ABSs declined. The average share of central government bonds increased slightly from 14% in 2011 to 15% in 2012.
On 17 September 2012 the Governing Council approved the launch of the Common Eurosystem Pricing Hub (CEPH), which has replaced the two existing valuation hubs operated by the Banque de France and the Deutsche Bundesbank. The CEPH provides the Eurosystem with an integrated platform delivering single prices that are used by all Eurosystem central banks to value collateral submitted in Eurosystem credit operations.Thefirst releaseof theCEPHwentlive on 21 September 2012.
riSK manaGement iSSueS related to Credit operationS In the implementation of monetary policy operations, the Eurosystem is exposed to the risk of counterparty default. This risk is mitigated by requiring counterparties to submit adequate collateral. However, in the event of a counterparty default, the Eurosystem would also be exposed to credit, market and liquidity risks associated with the resolution of collateral assets. In addition, liquidity-providing operations in foreign currencies against euro-denominated collateral, as well as euro-denominated liquidity-providing operations against foreign collateral, entail currency risk. In order to reduce all these risks to acceptable levels, the Eurosystem maintains high credit standards for assets accepted as collateral, valuates collateral on a daily basis and applies appropriate risk control measures.
As a matter of prudence, the Eurosystem has established a buffer against potential shortfalls resulting from the eventual resolution of collateral received from defaulted counterparties. The level of the buffer is reviewed annually, pending the eventual disposal of the received collateral and in line with the prospect of recovery.
Moregenerally,financialrisksincreditoperationsarecontinuouslymonitoredandquantifiedattheEurosystem level and regularly reported to the ECB’s decision-making bodies.
In 2012 the Governing Council decided to adopt a number of adjustments to its collateral eligibility criteria and risk control framework.
With regard to the Eurosystem credit assessment framework (ECAF), the Governing Council took several decisions in 2012. On 4 April the Governing Council approved the rating tool of Creditreform Rating AG for use within the ECAF. In view of their non-compliance with the Basel II definition of default, the Governing Council excluded on 5 July three rating tools from use asECAF sources for the time being, namely those of ICAP, Coface Serviços Portugal and Cerved. In order to improve the ECAF performance monitoring process, the Governing Council decided
Chart 36 breakdown of assets (including credit claims) put forward as collateral by asset type(percentages)
0
10
20
30
40
50
60
70
80
90
100
0
10
20
30
40
50
60
70
80
90
100
2007 2008 2009 2010 2011 2012
non-marketable assets other marketable assets asset-backed securities corporate bonds covered bank bonds uncovered bank bonds regional government securities central government securities
Source: ECB.Notes: Collateral value after valuation and haircuts; averages of end-of-month data. The data shown in this chart are published on a quarterly basis on the ECB’s website.

87ECB
Annual Report2012
on 28 November that the providers of credit assessment systems accepted within the ECAF will berequiredtosubmitperformancemonitoringdataonadisaggregatedbasis.Asignedcertificateconfirmingtheaccuracyandvalidityoftheperformancemonitoringinformationwillalsoneedtobeprovided. Finally, on 19 December the Governing Council approved the in-house credit assessment system of Banka Slovenije for use within the ECAF.
With regard to the establishment of higher transparency standards for ABSs, the Governing Council decided on 5 July 2012 to implement loan-level data reporting as a collateral eligibility requirement for ABSs in the Eurosystem collateral framework. The Governing Council also announced the dates from which such reporting requirements would apply for the different asset classes, beginning with a phasing-in period. Furthermore, the Governing Council announced that in order to monitor compliance with the loan-level template requirements and to check the timeliness, consistency and completeness of loan-level data, a single loan-level data repository would automatically check ABSs forwhichloan-leveldataaresubmittedandassignthemascore.ThisscorewillstrictlyreflectthespecificrequirementssetoutintheprovisionsgoverningtheEurosystem’scollateralframework.
The Eurosystem also designed adequate risk control measures to accompany the decisions to preserve collateral availability for counterparties taken by the Governing Council in 2012. First, with regard to the temporary acceptance of additional performing credit claims described above, the Eurosystem adopted common guidelines aiming to ensure the adequacy of eligibility criteria and risk control measures, which would be subject to the prior approval of the Governing Council. Second, when deciding to reduce the rating threshold and to amend the eligibility requirements for certain ABSs effective as of 29 June 2012, the Governing Council also adopted a revised risk control framework for these ABSs ensuring adequate protection of the Eurosystem.
1.2 ForeiGn eXChanGe operationS and operationS with other Central banKS
In 2012 the Eurosystem did not intervene in the foreign exchange markets. Furthermore, the ECB did not undertake any foreign exchange operations in the currencies that participate in ERM II. The standing agreement between the ECB and the IMF to facilitate the initiation of special drawing right (SDR) transactions by the IMF on behalf of the ECB with other SDR holders was not activated in2012,whereasithadbeenactivatedonfiveoccasionsin2011.
The temporary liquidity swap line which the ECB established with the Federal Reserve System in 2007, which was reactivated in May 2010 to counter strains in the European US dollar funding markets, was extended on 13 December 2012 until 1 February 2014. In close cooperation with other central banks, the Eurosystem provided US dollar funding to counterparties against eligible collateralinoperationswhichtooktheformofrepurchaseagreementsandwerecarriedoutasfixedrate tender procedures with full allotment. In addition to these regular weekly seven-day operations, the ECB, in coordination with the Federal Reserve, the Bank of England, the Bank of Japan and the Swiss National Bank, continued to conduct every four weeks US dollar liquidity-providing operations with a maturity of 84 days. In 2012 the Eurosystem conducted 50 operations with a seven-day maturity, as well as one 14-day operation at the year-end and 13 84-day operations. The temporary reciprocal swap lines established in 2011 between the ECB, the Bank of England, the Bank of Japan and the Swiss National Bank to enhance their capacity to provide liquidity supporttotheglobalfinancialsystemandtoeasestrainsinfinancialmarketswerenotusedin2012.Theyare seen, however, as effective in easingfinancial strainsby serving asbackstop facilitiesthat support money market liquidity by reducing funding risk. These swap lines were extended

88ECBAnnual Report2012
on 13 December 2012 until 1 February 2014. The Governing Council also decided that the ECB would, until further notice, continue to conduct regular US dollar liquidity-providing operations with maturities of approximately one week and three months.
On 12 September 2012 the Governing Council decided, in agreement with the Bank of England, to extend the liquidity swap arrangement with the Bank of England up to 30 September 2013. The swap facility agreement of 17 December 2010 had been authorised until 28 September 2012. Under this facility, the Bank of England can provide, if necessary, up to GBP 10 billion to the ECB in exchange for euro. The agreement allows pounds sterling to be made available to the Central Bank of Ireland as a precautionary measure, for the purpose of meeting any temporary liquidity needs of the banking system in that currency.
1.3 inveStment aCtivitieS
The ECB invests the funds related to its foreign reserve portfolio as well as its own funds. These investment activities, which are separate from monetary policy programmes such as the OMTs, the SMP and the CBPP2, are organised in such a way as to ensure that no inside information about central bank policy actions may be used when making investment decisions.
ForeiGn reServe manaGement The ECB’s foreign reserve portfolio was originally set up through transfers of foreign reserve assetsfromtheeuroareaNCBs.Overtime,thecompositionoftheportfolioreflectschangesinthemarket value of the invested assets, as well as foreign exchange and gold operations of the ECB. The main purpose of the ECB’s foreign reserves is to ensure that, whenever needed, the Eurosystem has a sufficient amount of liquid resources for its foreign exchange policy operations involving non-EU currencies. The objectives for the management of the ECB’s foreign reserves are, in order of importance, liquidity, security and return.
The ECB’s foreign reserve portfolio consists of US dollars, Japanese yen, gold and SDRs. The US dollar and Japanese yen reserves are actively managed by the ECB and those euro area NCBsthatwishtotakepartinthisactivityasagentsfortheECB.SinceJanuary2006a“currencyspecialisationmodel” has been in operation to increase the efficiency of the ECB’s investmentoperations. Under this scheme, each NCB which wishes to be involved in ECB foreign reserve management, or group of NCBs acting jointly for this purpose, is as a rule allocated a share in the US dollar or the Japanese yen portfolio.6
The value of the ECB’s net foreign reserve assets 7 at current exchange rates and market prices decreased from €65.6 billion at end-2011 to €64.8 billion at end-2012, of which €43.8 billion was in foreign currencies and €21 billion was in gold and SDRs. The decrease in the value oftheforeignreserveportfolioreflecteda13%depreciationoftheJapaneseyenagainsttheeuro.Positive contributions from capital gains and interest income generated by portfolio management activities offset some of these losses. Applying end-2012 exchange rates, US dollar-denominated assets represented 79% of the foreign currency reserves, while those assets denominated in Japanese yen accounted for 21%. The value of gold and SDR holdings increased slightly, driven by the appreciation of gold by around 4% in 2012 (as measured in euro terms).
6 Formoredetails,seethearticleentitled“PortfoliomanagementattheECB”,Monthly Bulletin, ECB, April 2006. 7 Netforeignreserveassetsarecalculatedasofficialreserveassetsexcludingthenet,marked-to-marketvalueofforeigncurrencyswaps,
plus deposits in foreign currency with residents, minus future predetermined net drains on foreign currency holdings owing to repurchase and forward transactions. For detailed information on the data sources, see the ECB’s website.

89ECB
Annual Report2012
own FundS manaGement The ECB’s own funds portfolio consists of the invested counterpart of the ECB’s paid-up capital, as well as amounts held in its general reserve fund and its provision against foreign exchange rate, interest rate, credit and gold price risks. The purpose of this portfolio is to provide the ECB with income to help cover its operating expenses. The objective of its management is to maximise expected returns, subject to a no-loss constraint at a certain confidence level. The portfolio isinvestedineuro-denominatedfixedincomeassets.
The value of the portfolio at current market prices grew from €15.9 billion at end-2011 to €18.9 billion at end-2012. The increase in market value was due to an increase in the ECB’s paid-up capital effective on 27 December 2012, an increase in the provision against foreign exchange rate, interest rate, credit and gold price risks and, to a lesser extent, investment returns.
Given that the same business area is responsible for both the implementation of the CBPP2 and the SMP (and potentially also the OMTs) and the management of the own funds portfolio, it was decided in 2012 to apply a largely passive management style to the ECB’s own funds portfolio. This decision was taken to ensure that no inside information about central bank policy actions can have an impact on investment decisions.
riSK manaGement iSSueS related to inveStment aCtivitieS and monetary poliCy portFolioS ThefinancialriskstowhichtheECBisexposedinitsinvestmentactivitiesandmonetarypolicyportfolios (SMP, CBPP and CBPP2) are closely monitored and measured. For this purpose, a detailed limit structure is in place. The monitoring of limit compliance is performed daily. Furthermore, regular reports ensure that all stakeholders are adequately informed of the level of such risks. As is alreadythecasefortheexistingmonetarypolicyportfolios,thefinancialrisksoftheOMTswouldalso be closely monitored and measured. The OMTs also incorporate two important risk-mitigating features, namely the element of conditionality entailing that purchases would only be conducted during limited time periods, subject to a successful implementation of economic policies, and the focus of the purchases on instruments with a residual maturity of between one and three years.
In 2012 the ECB continued to enhance the information technology infrastructure supporting the risk management framework for its investment operations and monetary policy portfolios.
One of the measures used to quantify market risk is Value-at-Risk (VaR). Calculating this measure fortheECB’sinvestmentportfolioon31December2012,usingasparametersa95%confidencelevel, a time horizon of one year, and a sample of one year for asset price volatility, VaR would amount to €8.98 billion, compared with €13.08 billion on 30 December 2011.8 Computing the same measurewith afive-year insteadof aone-year samplewould result in aVaRof€12.30billion,compared with €12.16 billion on 30 December 2011. The largest part of the market risk is due to movements in currency and gold prices. The low levels of interest rate risk in the ECB’s investment portfolios reflect the fact that themodified duration of these portfolios remained relatively lowin 2012.
8 The market risk for the CBPP, CBPP2 and SMP portfolios is not included in these estimates since the portfolios will be held until maturity following the valuation principle of amortised cost subject to impairment.

90ECBAnnual Report2012
2 payment and SeCuritieS Settlement SyStemSThe Eurosystem has the statutory task of promoting the smooth operation of payment systems. Payment systems and securities clearing and settlement systems are fundamental infrastructures that arenecessaryfortheproperfunctioningofmarketeconomies.Theyareindispensablefortheefficientflowofpaymentsforgoods,servicesandfinancialassets,andtheirsmoothfunctioningiscrucialfortheimplementationofacentralbank’smonetarypolicyandformaintainingthestabilityofandconfidenceinthecurrency,thefinancialsystemandtheeconomyingeneral.Fortheperformanceofthistask,theEurosystem applies three approaches: it takes on an operational role, conducts oversight activities and acts as a catalyst (for further details on the second and third of these, see Sections 4 and 5 of Chapter 3). In terms of its operational role, the Eurosystem may, in accordance with the Statute of the ESCB,providefacilitiestoensureefficientandsoundclearingandpaymentsystems.
2.1 the tarGet2 SyStem
The Eurosystem operates the TARGET2 system for large-value and urgent payments in euro. TARGET2 plays an important role in the smooth implementation of the single monetary policy and the functioning of the euro money market. It offers a real-time settlement service in central bank money and broad market coverage. It processes large-value and urgent transactions without any upper or lower limit on the value of payments and has also attracted a variety of other payments. The system is based on a single technical infrastructure, the Single Shared Platform (SSP). Three Eurosystemcentralbanks–theDeutscheBundesbank,theBanquedeFranceandtheBancad’Italia–jointly provide the SSP and operate it on behalf of the Eurosystem.
By December 2012 TARGET2 had 985 direct participants. The overall number of banks (including branches and subsidiaries) that can be addressed worldwide through TARGET2 reached 55,000. In addition, TARGET2 settled the cash positions of 82 ancillary systems.
tarGet2 operationS The TARGET2 system functioned smoothly in 2012 and settled a large number of euro payments. The system’s market share remained stable, with 92% of the total value of payments in euro large-value payment systems being executed via TARGET2. In 2012 the system processed a total of 90,671,378 transactions, with a daily average of 354,185 transactions. The total value of TARGET2 traffic in 2012was €634,132 billion,with an average daily value of €2,477 billion.Table12providesanoverviewofpaymenttrafficintheTARGET2systemin2012,comparingitwithtrafficinthepreviousyear.
table 12 payment traffic in tarGet2
Value (EUR billions) Volume (number of transactions)2011 2012 Change (%) 2011 2012 Change (%)
TARGET2 overallTotal 612,936 634,132 3.4 89,565,697 90,671,378 1.2Daily average 2,385 2,477 3.8 348,505 354,185 1.6
Source: ECB.Note: There were 257 operating days in 2011 and 256 in 2012.

91ECB
Annual Report2012
In 2012 the overall availability 9 of the SSP of TARGET2 reached 100%.
Overthecourseoftheyear99.98%ofthepaymentsintheSSPwereprocessedwithinfiveminutesand the system’s positive performance met with the satisfaction of participants.
Cooperation with tarGet2 uSerS The Eurosystem maintains close relations with TARGET2 users. Regular meetings were held between the NCBs and national TARGET2 user groups in 2012. In addition, joint meetings of the Eurosystem’s Working Group on TARGET2 and the TARGET Working Group of the European credit sector associations took place on a semi-annual basis to discuss TARGET2 business issues at the pan-European level. An ad hoc group created in 2011 and composed of representatives from these two groups continued its work, addressing major changes affecting TARGET2, such as the connection of TARGET2-Securities (T2S). Further strategic issues were addressed in the Contact Group on Euro Payments Strategy, a forum composed of senior representatives from commercial and central banks.
manaGement oF new SyStem releaSeSThe Eurosystem attaches the greatest importance to the development of TARGET2 in order to further increase the level of service offered and to meet the needs of its participants.
In view of the considerable effort involved in preparing for T2S, the Eurosystem decided in 2011 that there would not be an annual release of TARGET2 in 2012. The Eurosystem nonetheless continued to work on the TARGET2 system in 2012, preparing for the adaptations that will be necessary inorder toconnect toT2S.AfinaldecisionwastakenontheservicesthatTARGET2willofferto its participants to support their cash activities in T2S. These services will be made available to participants when T2S goes live. The Eurosystem also launched a review of the strategy for migrating TARGET2 to the new industry standards (ISO 20022). It was decided that all current messaging standards should move to their equivalents in ISO 20022 in a “big bang” scenarioscheduled for November 2017.
CountrieS partiCipatinG in tarGet2 All euro area countries participate in TARGET2, as its use is mandatory for the settlement of all payment orders related to the Eurosystem’s monetary policy operations. Non-euro area EU central banks may connect to the TARGET2 system on a voluntary basis in order to facilitate the settlement of euro-denominated transactions in these countries. From a legal and business point of view, each central bank is responsible for managing its system component and for maintaining relationships with its participants. In addition, some financial institutions located in other EEA countriesparticipate in TARGET2 via remote access.
24 central banks of the EU and their respective user communities are currently connected to TARGET2: the 17 euro area NCBs, the ECB and six central banks of non-euro area countries.10
9 The level of availability is the extent to which participants were able to use the TARGET2 system during their business hours without incident.
10 Bulgaria, Denmark, Latvia, Lithuania, Poland and Romania.

92ECBAnnual Report2012
2.2 tarGet2-SeCuritieS
TARGET2-Securities (T2S) is the future Eurosystem service for securities settlement in central bank money in Europe. The project is currently in the development phase and is due to go live in June2015.Virtuallyall tradedsecurities inEuropewillbesettled inT2S, leading tosignificanteconomies of scale and a reduction of settlement costs. By removing the distinction between cross-border and domestic settlement, T2S will constitute a major breakthrough in the creation of an integrated capitalmarket forEurope, providing a solidbasis for increasing efficiency andcompetition in the entire post-trading sector. T2S will enable significant savings in terms ofcollateral and liquidity, a particularly valuable feature at a time when the demand for high-quality collateralisever-increasingasaresultofthefinancialturmoilandnewregulatorydevelopments.Itwillharmonisemarketprocessesandthusfacilitatebackofficestreamlining.
By the end of June 2012 a total of 22 central securities depositories (CSDs) had signed the T2S Framework Agreement 11,i.e.almostalloftheCSDsbasedintheeuroareaandfiveCSDsbasedoutside the euro area. These CSDs account for almost 100% of settlement volumes in euro, and the T2S entry fee will be waived for them in view of their decision for early participation in the system. Furthermore, in June Danmarks Nationalbank signed the Currency Participation Agreement 12 and agreed to make the Danish krone available in T2S as of 2018. The signing of these agreements marks the end of more than two years of contractual negotiations, but T2S remains open to new participants; non-euro area central banks and CSDs may still sign the Currency Participation Agreement or the Framework Agreement at a later stage. However, CSDs will henceforth have to pay an entry fee.
11 The T2S Framework Agreement is the contract stipulating the rights and obligations of the Eurosystem and of CSDs outsourcing their settlement function to the Eurosystem.
12 The T2S Currency Participation Agreement is the contract governing the relationship between the Eurosystem and non-euro area NCBs that wish to make their currency available in T2S.
Chart 37 Central securities depositories participating in t2S
BankofGreeceSecuritiesSettlementSystem–BOGS(Greece)•Centrálnydepozitárcennýchpapierov(Slovakia)•Clearstream Banking (Germany)•Depozitarul Central (Romania)•Eesti Väärtpaberikeskus (Estonia)•Euroclear Belgium•Euroclear Finland•Euroclear France•Euroclear Nederland•Iberclear–BMEGroup(Spain)•Interbolsa–SociedadeGestoradeSistemasdeLiquidaçãoe•deSistemasCentralizadosdeValoresMobiliários(Portugal)KDD–CentralnaKlirinškoDepotnaDružba(Slovenia)•KözpontiElszámolóházésÉrtéktár–KELER(Hungary)•Lietuvoscentrinisvertybiniųpopieriųdepozitoriumas(Lithuania)•LuxCSD (Luxembourg)•Malta Stock Exchange•Monte Titoli (Italy)•NationalBankofBelgiumSecuritiesSettlementSystem–•NBB-SSS (Belgium)Oesterreichische Kontrollbank (Austria)•SIX SIS (Switzerland)•VP LUX (Luxembourg)•VP Securities (Denmark)•

93ECB
Annual Report2012
With these two contractual agreements entering into force, a new governance structure was put in place as of 1 July 2012. The new governance structure, which remains based on the principles of wide market involvement and transparency, assigns greater influence to the contractualcounterparties of the Eurosystem and will also apply after T2S begins live operations. It is divided intosteering,advisoryandworkinglevels.ThefirstcomprisestheT2SBoard,responsiblefortheday-to-day management of the project and live operations, and the CSD Steering Group, which representsthe“singlevoice”oftheCSDsvis-à-vistheEurosystem.Attheadvisorylevel,theT2SAdvisory Group brings together all stakeholder categories, i.e. central banks, CSDs and the banking community as well as regulators, overseers and the industry. The National User Groups represent the formal link between national markets and the Advisory Group. At the working level, the ECB’s T2SProgrammeOfficeandtheTechnicalGroupssupportthesteering-levelbodies.
Significanttechnicalprogresswasachievedin2012.Amongotherthings,theEurosystempublishedthe T2S User Handbook as well as amended versions of the User Requirements Document, the User DetailedFunctionalSpecificationsand theBusinessProcessDescription.The fourcentralbanksresponsible for developing and operating the T2S platform (the Deutsche Bundesbank, the Banco deEspaña,theBanquedeFranceandtheBancad’Italia)expecttofinishdevelopingthenecessarysoftware(corefunctions)inthefirstquarterof2013andhavemadegoodprogressintheirinternaltesting of the software. CSDs and NCBs completed their feasibility assessments in June 2012, resulting in more than 30 change requests. At the end of 2012 the CSDs and the Eurosystem agreed on the timing and composition of three migration waves, planned to take place between June 2015 and November 2016. In early 2013 they continued to discuss the possibility of alternative migration solutions in order to better balance the operational efforts involved in migration.
Progress was also made on connectivity to T2S, i.e. the choice of networks through which market participants and CSDs will be able to send instructions to and receive messages from T2S. Licences were awarded to two value-added network service providers following a tender procedure launched in 2011. The Eurosystem also largely completed its legal framework for the dedicated link service that will be made available in parallel to the two value-added network solutions, if there is demand for such a service from the market.
Market participants stressed the need for T2S to become more involved in post-trade harmonisation in orderforthefullbenefitsofT2Stobereaped.TheT2SHarmonisationSteeringGroupsupportstheT2SAdvisory Group in pursuing several harmonisation activities and prepared the third T2S harmonisation progress report in the course of 2012, for publication in early 2013. For further details on T2S harmonisationactivitiesandtheirimpactonEuropeanfinancialintegration,seeSection4ofChapter3.
2.3 Settlement proCedureS For CroSS-border Collateral
Eligible assets may be used to collateralise all types of Eurosystem credit operation, not only at the domestic level but also across national borders. The cross-border mobilisation of collateral in the euro area is conducted mainly via the correspondent central banking model (CCBM) and through eligible linksbetweeneuroareasecuritiessettlementsystems(SSSs).Whereasthefirstsolutionisprovidedby the Eurosystem, the latter is a market-led initiative. In addition, cross-border collateral can be mobilised on the accounts of NCBs with a non-domestic (international) CSD on an exceptional basis.
At the end of 2012 the amount of cross-border collateral (including both marketable and non-marketable assets) held by the Eurosystem stood at €643 billion, down from €731 billion at

94ECBAnnual Report2012
the end of 2011. Overall, at the end of 2012 cross-border collateral represented 22.8% of the total collateral provided to the Eurosystem (compared with 29.9% in 2011).
Collateral manaGement ServiCeSThe CCBM remained the main channel for transferring cross-border collateral in Eurosystem monetary policy and intraday credit operations in 2012. Assets held in custody through the CCBM decreased from €434 billion at the end of 2011 to €354 billion at the end of 2012. Cross-border collateral held on accounts of NCBs with a non-domestic (international) CSD on an exceptional basis amounted to €134 billion at the end of 2012.
The CCBM was initially set up in 1999 as an interim solution and, since it builds upon the principle of minimum harmonisation, market participants have called for some improvements. In particular, they have requested that it no longer be necessary to repatriate (marketable) assets from investor CSDs to issuer CSDs before they are mobilised as collateral through the CCBM, and that tri-party collateral management services which are currently only used domestically may also be used on a cross-border basis. The Eurosystem supports the inclusion of these enhancements to the CCBM and is currently working on their incorporation into the framework in 2014.
Issues related to euro securities settlement and collateral mobilisation in Eurosystem credit operations were discussed in the Contact Group on Euro Securities Infrastructures, which is a forum for representatives of market infrastructures, market participants and central banks.
eliGible linKS between national SeCuritieS Settlement SyStemSCross-border collateral can also be mobilised by using links between national SSSs. However, such links are only eligible for Eurosystem credit operations if they meet the Eurosystem’s user standards. Once the securities have been transferred to another SSS via eligible links, they can be used through local procedures in the same way as any domestic collateral. The amount of collateral mobilised through direct and relayed links decreased from €175 billion at the end of 2011 to €156 billion at the end of 2012.
In 2012 one new direct link was added to the list of eligible links and three direct links were removed. In total, there were 52 direct and 8 relayed links available to counterparties at the end of 2012, of which only a limited number are actively used.
3 banKnoteS and CoinS In accordance with Article 128 of the Treaty, the Governing Council of the ECB has the exclusive right to authorise the issuance of euro banknotes within the EU. The ECB and the NCBs may issue these banknotes.
3.1 the CirCulation oF banKnoteS and CoinS
demand For euro banKnoteS and CoinSAt the end of 2012 there were 15.7 billion euro banknotes in circulation, with a total value of €912.6 billion. This compares with 14.9 billion banknotes, with a total value of €888.6 billion, at the end of 2011 (see Chart 38). In terms of value, the €50 and the €500 banknotes accounted for the largest shares of the banknotes in circulation, standing at 35% and 32% respectively at the end of the

95ECB
Annual Report2012
year. The €50 banknote was the most-used denomination in terms of volume, accounting for 41% of all euro banknotes in circulation (see Chart 39). In 2012 the annual growth rate of banknotes in circulation was 2.7% in value terms and 4.9% in volume terms. The €50 banknotes showed by far the highest annual growth rate, at 6.5%, followed by the €20 and €10 banknotes at 4.7% and the €5 banknotes at 4.4%. The growth rate of the €500 banknote, which had been considerable in the past, turned negative (-2.0%).
Itisestimatedthat,intermsofvalue,20-25%oftheeurobanknotesincirculation(withthefigurelikely to lie towards the upper end of that range) are held outside the euro area, predominantly in countries neighbouring the euro area. In 2012 net shipments of euro banknotes by financialinstitutions to regions outside the euro area increased by 19%, or €2.1 billion, as compared with 2011. Euro banknotes, mainly high-value denominations, are held outside the euro area as a store of value and for settling transactions on international markets.
In 2012 the total number of euro coins in circulation (i.e. net circulation excluding stocks held by the euro area NCBs) increased by 4.4% to stand at 102.0 billion. The low-value coins of 1, 2 and 5 cent accounted for 62% of the total number of coins in circulation. At the end of 2012 the value of coins in circulation stood at €23.7 billion, 2.5% higher than at the end of 2011.
banKnote handlinG by the euroSyStemIn 2012 the euro area NCBs issued 33.1 billion banknotes worth €1.0 trillion, while 32.2 billion banknotesworth€1.0trillionwerereturnedtothem.Thesefiguresweresimilartothoserecordedin 2011. 34.6 billion banknotes were processed using fully automated banknote processing machines,
Chart 38 number and value of euro banknotes in circulation
0
2
4
6
8
10
12
14
16
18
0
100
200
300
400
500
600
700
800
900
1,000
2007 2008 2009 2010 2011 2012
number (in billions; right-hand scale)value (in EUR billions; left-hand scale)
Source: ECB.
Chart 39 number of euro banknotes in circulation by denomination
(billions)
0
1
2
3
4
5
6
7
0
1
2
3
4
5
6
7
2007 2008 2009 2010 2011 2012
€5€10€20
€50€100€200€500
Source: ECB.

96ECBAnnual Report2012
whichcheckedthebanknotesforbothauthenticityandfitnessforcirculationinordertomaintainthe quality and integrity of the banknotes in circulation according to the common minimum sorting standardsestablishedbytheEurosystem.Inthatprocess,some5.6billionbanknoteswereidentifiedasbeingunfitforcirculationanddestroyed.Thereplacementrate 13 of the banknotes in circulation (i.e.theshareofbanknotesthatneededtobereplacedbecausetheybecameunfit)was44%forthedenominations up to and including €50 and 9% for the high-denomination banknotes.
The average return frequency 14 of banknotes in circulation was 2.16 at end-2012, meaning that, on average, a banknote returned to a euro area NCB around every six months. The return frequencies were 0.34 for €500 banknotes, 0.46 for €200 banknotes and 0.70 for €100 banknotes, while the return frequencies of the denominations which are typically used for transactions were higher (1.56 for €50 banknotes, 3.38 for €20 banknotes, 4.11 for €10 banknotes and 2.27 for €5 banknotes).
3.2 banKnote CounterFeitinG and CounterFeit deterrenCe
CounterFeit euro banKnoteS In 2012 the National Analysis Centres 15 received some 531,000 counterfeit euro banknotes. When compared with the number of genuine euro banknotes in circulation, the proportion of counterfeits remains at a very low level. Long-term developments in the quantity of counterfeits removed from circulation are shown in Chart 40. Counterfeiters tend to target the €20 and €50 banknotes, which in 2012 accounted for 42.5% and 40.0% of total counterfeits respectively. Further details of the denominational breakdown are shown in Chart 41.
13 Definedasthenumberofbanknotesidentifiedasbeingunfitinayeardividedbytheaveragenumberofbanknotesincirculationduringthat year.
14 DefinedasthetotalnumberofbanknotesreturnedtoeuroareaNCBsinayeardividedbytheaveragenumberofbanknotesincirculationduring that year.
15 Centres established in each EU Member State for the initial analysis of counterfeit euro banknotes at the national level.
Chart 40 number of counterfeit euro banknotes recovered from circulation
(thousands)
0
50
100
150
200
250
300
350
400
450
500
0
50
100
150
200
250
300
350
400
450
500
2007 2008 2009 2010 2011 2012
Source: ECB.
Chart 41 breakdown of counterfeit euro banknotes by denomination in 2012
€100
€200
€500
€5
€10
€20
€50
13%
2%
0.5%
0.5%
1.5%
42.5%
40%
Source: ECB.

97ECB
Annual Report2012
Althoughconfidenceinthesecurityoftheeuroisfullyjustifiedbytheongoinganti-counterfeitingmeasures of European and international authorities, this should not give rise to complacency. The ECB continues to advise the public to remain alert to the possibility of fraud, to remember the “feel-look-tilt”test,16 and never to rely on just one security feature. In addition, training is offered to professional cash handlers on a continuous basis, both in Europe and beyond, and up-to-date informationmaterialismadeavailabletosupporttheEurosystem’sfightagainstcounterfeiting.TheECB’s well-established cooperation with Europol and the European Commission also serves this goal.
CounterFeit deterrenCe at the Global level Cooperation on counterfeit deterrence goes beyond the European level. The Eurosystem participates actively in the work of the Central Bank Counterfeit Deterrence Group 17. The ECB hosts the International Counterfeit Deterrence Centre (ICDC), which acts as the technical centre for this group. The ICDC maintains a website 18 which provides information and guidance concerning the reproductionofbanknoteimages,aswellaslinkstocountry-specificwebsites.
3.3 banKnote produCtion and iSSuanCe
produCtion arranGementS In 2012 NCBs were responsible for the production of 8.5 billion euro banknotes, with the new €5 banknote, which is to be introduced in May 2013 (see below), accounting for 2.9 billion of that total (around34%ofthebanknotesproduced).The€5banknoteofthefirstseriesceasedtobeproduced.The allocation of euro banknote production continued to be based on decentralised production with pooling, an arrangement initially established in 2002. Under this arrangement, each euro area NCB is responsible for the procurement of an allocated share of the total requirement for certain denominations (see Table 13).
roadmap For Greater ConverGenCe oF nCb CaSh ServiCeSIn 2007 the Governing Council adopted a roadmap for procedural steps contributing, in the medium term, to increased convergence of NCB cash services. On 1 October 2012 electronic messaging between NCBs and national and international professional clients for cash transactions – one of the remaining itemsfrom the roadmap – was put in place by theNCBs of Belgium, Germany, Ireland, Cyprus, Luxembourg, Malta, the Netherlands, Austria and Finland. The principles governing this facility are laid down in the ECB Guideline on the Data Exchange for Cash Services.19 An interface hosted by the ECB ensures that messages can be exchanged between NCBs using different data formats. This allows professional clients that wish to transact cash with a non-domestic NCB to send the order forwithdrawal, or notification of deposit, via
16 Seethe“Securityfeatures”sectionoftheECB’swebsiteunder“The€uro”,then“Banknotes”.17 A group comprising 32 central banks and banknote printing authorities that work together under the auspices of the G10.18 See http://www.rulesforuse.org19 Guideline ECB/2012/16 of 20 July 2012 (OJ L 245, 11.9.2012, p. 3).
table 13 allocation of euro banknote production in 2012
Quantity (millions of banknotes)
NCB commissioning production
€5 2,915.30 BE, ES, FR, IT, AT€10 1,959.04 DE, GR, FR, IE, PT€20 1,703.95 CY, EE, FR, IT, MT, LU, NL,
SI, SK, FI€50 1,530.43 BE, DE, ES, IT€100 298.13 DE€200 50.00 DE€500 0.00 -
Total 8,456.87
Source: ECB.

98ECBAnnual Report2012
their domestic NCB. The remaining euro area NCBs will connect to the interface in the course of 2013 and 2014.
The electronic exchange of messages facilitates the organisation of cash transportation across national borders and thus complements Regulation (EU) No 1214/2011 of the European Parliament and of the Council of 16 November 2011 on the professional cross-border transport of euro cash by road between euro area Member States 20, which entered into force on 30 November 2012. This interface also makes possible bulk transfers between NCBs, which will be useful with regard to the introduction of the second series of euro banknotes.
reCirCulation oF banKnoteS When putting euro banknotes back into circulation, cash handlers (credit institutions, cash in transit companies and other economic agents, such as retailers and casinos) must adhere to the rules laid downinDecisionECB/2010/14ontheauthenticityandfitnesscheckingandrecirculationofeurobanknotes 21. This Decision aims in particular to ensure that all banknotes distributed to the public viacashdispensershavebeencheckedforbothauthenticityandfitness.Accordingtodatareportedby cash handlers to the euro area NCBs, around one-third of the total number of euro banknotes that were put back into circulation in 2012 after machine processing were recirculated by cash handlers using banknote handling machines.
In preparation for the issuance of the second series of euro banknotes, the scope of Decision ECB/2010/14 has been amended by Decision ECB/2012/19 22, which entered into force on 20 September 2012. The amended Decision ensures that the checking procedures to be followed by cash handlers when recirculating euro banknotes are also applicable to the new banknotes.
the eXtended CuStodial inventory proGramme Following the decision by the Governing Council in 2011 that the Extended Custodial Inventory (ECI) programme for euro banknotes would be extended from Asia to North America and the Middle East, an open tender was conducted in 2012. The successful bidders will be selected in the course of 2013. The programme follows on from the pilot ECI programme which was originally planned to end in January 2012, but was extended until the end of January 2013. The ECI programme aims to ensure the smooth circulation of euro banknotes in geographically remote regions and to provide detailed statistical data on the international use of euro banknotes.
the SeCond SerieS oF euro banKnoteSThe Eurosystem continued work on a new series of euro banknotes in 2012, focusing on the large-scaleproductionofthenew€5banknote,whichwillbethefirstdenominationofthenewseriestobe launched. The Eurosystem also helped the relevant stakeholders to prepare for the introduction of the new banknotes and continued developing the subsequent denominations of the new series. ThenewseriesiscalledtheEuropaseriesandfeaturesaportraitofEuropa,afigurefromGreekmythology, in the watermark and hologram. The Europa series will have the same denominations asthefirstseriesofbanknotes–€5,€10,€20,€50,€100,€200and€500–andmostofthesamedesign elements.23
20 OJ L 316, 29.11.2011, p. 1.21 OJ L 267, 9.10.2010, p. 1.22 OJ L 253, 20.9.2012, p. 19.23 For more details, see http://www.newfaceoftheeuro.eu

99ECB
Annual Report2012
The Governing Council decided on 9 March 2012 that the new €5 banknote would be introduced on 2 May 2013. The exact timing of the issuance of the other denominations of the Europa series will be determined at a later stage. It is anticipated that the new banknotes will be introduced gradually over several years in ascending order. The Eurosystem will inform the public, cash handlers and banknote equipment manufacturers well in advance about the modalities of the introduction of thenewbanknotes.Thebanknotesofthefirstserieswillremainlegaltenderforarelativelylongperiod and their withdrawal from circulation will be gradual and communicated to the public well inadvance.Evenafterthebanknotesofthefirstserieshavebeenwithdrawn,itwillbepossibletoexchange them at the euro area NCBs for an unlimited period of time.
4 StatiStiCSThe ECB, assisted by the NCBs, develops, collects, compiles and disseminates a wide range of statistics which support the monetary policy of the euro area, various other tasks of the ESCB and the tasks of the European Systemic Risk Board (ESRB). These statistics are also used by public authorities (for example, in the European Commission’s scoreboard for monitoring macroeconomic imbalances),financialmarketparticipants,themediaandthegeneralpublic.In2012regulareuroarea statistics continued to be provided in a smooth and timely manner. In addition, work focused on strengthening the informationbasis for the fulfilmentof themandatesgiven to theECBandthe ESRB, although this represented a considerable challenge in view of the limited resources available.Inaccordancewiththeannuallyreviewedstatisticalworkprogramme,significanteffortsweredevotedtomeetingnewdatarequirements,particularlyinthefieldsofmonetarypolicyandfinancialstabilityanalysis.
The challenges associated with the growing data demands were discussed in April 2012 at the ECB’ssixthbiennialconferenceonstatistics,whichwasdevoted to the themeof“Centralbankstatisticsasaservantoftwoseparatemandates–pricestabilityandmitigationofsystemicrisk”.
4.1 new and enhanCed euro area StatiStiCS
Complying with its duty to provide statistical support to the ESRB, the ECB was heavily involved in2012inthepreparationoftheESRBriskdashboard,whichwasreleasedforthefirsttimeafterthe ESRB General Board meeting on 20 September 2012. In order to improve the dashboard’s ability to capture systemic risks, the initial set of 45 indicators will be regularly updated and revised (see also Section 2.2 of Chapter 3).
InSeptember2012theECBalsopublishedforthefirsttimeanadjustedstatisticalmeasureofthebroad monetary aggregate M3 and credit to the private sector in the euro area, which excludes repurchase agreement transactions conducted through central counterparties.
4.2 other StatiStiCal developmentS
The ESCB continued its work on enhancing the availability and quality of statistics on the basis of micro-databases,astheseprovidemoreflexibilityinmeetinguserneedsandhelptominimisetheburden for reporting agents.

100ECBAnnual Report2012
In this context, the Governing Council in September 2012 adopted the enhanced data quality management framework for the Centralised Securities Database, which is composed of Guideline ECB/2012/21 and Recommendation ECB/2012/22. In addition, in October 2012 the ECB adopted Regulation ECB/2012/24 concerning statistics on holdings of securities. The Regulation lays down reportingrequirementsforeuroareafinancialinvestors,custodiansandeuroareaparentinstitutionsof certain banking groups. These requirements apply to security-by-security data on holdings of securitiesbyeuroarea(financialandnon-financial)investors,aswellasonholdingsbynon-euroarea investors of securities issued by euro area residents which are kept in custody in the euro area. The data collection will start in March 2014 with reference to data for December 2013.
ThefirstwaveoftheEurosystem’ssurveyonhouseholdfinanceandconsumptionwasconductedby the NCBs of 15 euro area countries (in a few cases in collaboration with national statistical institutes). The survey, the results of which are expected to be published in early 2013, provides micro-level data on households’ real and financial assets, liabilities, consumption and saving,income and employment, future pension entitlements, intergenerational transfers and gifts, and attitudes to risk.
TheESCBcontinueditsworkondevelopingaregisterofallfinancialinstitutionsintheEU,includinglarge banking and insurance groups. As well as providing comprehensive lists of all financialinstitutions and facilitating their classification as counterparts for statistical reporting purposes, theenhancedRegisterofInstitutionsandAffiliatesDatabase(RIAD)willsupportfinancialstabilityanalysis and facilitate the assessment of collateral in market operations. To increase its usefulness, theRIADwillbeinteroperablewiththeEuroGroupsRegisterof(mainly)non-financialenterprisesin Europe, which is being developed and run in parallel by Eurostat.
In addition, a number of other datasets are under development. The ESCB is developing enhanced statistics for the insurance sector, which would to the extent possible reuse data to be collected using Solvency II quantitative reporting templates, as designed by the European Insurance and Occupational Pensions Authority. Work is also under way to harmonise a core set of data attributes and design a pilot area for data from credit registers or other similar loan-level datasets with a view to reusing information to meet various statistical and analytical needs. Payments statistics are being improved to cover recent developments resulting from the Single Euro Payments Area, notably Regulation (EU) 260/2012 on credit transfers and direct debits (see Section 2 of Chapter 3), and statistics on payment cards are being developed on the basis of individual datasets collected from international card schemes.
As regards general economic statistics, the ECB is conducting work with a view to publishing a monthly estimate of industrial new orders for the euro area in 2013, given that Eurostat no longer produces such statistics. In addition, the ECB held a conference in May 2012 in the context of its work towards the publication in 2013 of commercial property price indicators.
The ECB continued its close working relationship with Eurostat and with other international organisations. The legislative process to align the European System of Accounts (ESA 95) with theSystemofNationalAccounts2008andthesixtheditionof theIMF’s“BalanceofPaymentsandInternationalInvestmentPositionManual”isclosetobeingfinalised.Inparallel,workisbeingconductedtofinalisetherevisionofallrelatedECBandEUlegalactsinordertoensurethatthenew standards are implemented in 2014.

101ECB
Annual Report2012
TheECBalsocontributestotheimprovementoffinancialstatisticsatthegloballevel,notablyviaits participation in the Inter-Agency Group on Economic and Financial Statistics (IAG), together with the BIS, Eurostat, the IMF, the OECD, the United Nations and the World Bank. The IAG is coordinatingandmonitoringthestatisticalinitiativessupportedbythefinanceministersandcentralbank governors of the G20 to close global information gaps. The ECB also helped to enhance the PrincipalGlobalIndicatorswebsite,whichinMarch2012publishedforthefirsttimeanaggregatedfigureforthequarterlyGDPgrowthoftheG20economies.In2012theG20endorsedaninitiativetolaunchaglobal“LegalEntityIdentifier”systeminMarch2013,whichtheECBfullysupports.Together with the BIS and the IMF, the ECB published the third part of a handbook on securities statistics, which covers equity securities (issues and holdings).
Inorder tomaintainthepublic’sconfidenceinthestatisticsproducedbytheESCB,uponwhichpolicy decisions are based, it is important for the ESCB to demonstrate that it adheres to the highest quality standards. For this reason, in February 2012 the Governing Council approved an amended versionofthe“PubliccommitmentonEuropeanstatisticsbytheESCB”withaviewtoenhancingits convergence with the European Statistics Code of Practice developed by the European Statistical System Committee.
The ESCB is committed to providing its statistics as a public good. The ESCB therefore announced in September 2012 a common policy of free access to and reuse of its publicly available statistics, irrespective of any subsequent commercial or non-commercial use.
5 eConomiC reSearChConsistent with the approach adopted throughout the Eurosystem, the purpose of research activities at the ECB is: (i) to provide research results relevant for monetary policy and other Eurosystem tasks, (ii) to maintain and use econometric models in order to construct economic forecasts and projections and compare the impact of alternative policy choices, and (iii) to communicate with the academic and research community, for example through the publication of research results inpeer-reviewed scientific journals andbyparticipating in andorganising researchconferences. The following two sections analyse the main research areas and activities in 2012.
5.1 reSearCh prioritieS and aChievementS
Economic research at the ECB is performed in a decentralised manner by several business areas according to their needs and expertise. The Directorate General Research is charged with producing high-quality economic research, as well as coordinating the research work conducted across the ECB. Its Director General chairs the Research Coordination Committee (RCC), which aligns research activities at the ECB with the requirements of the institution and the needs of its policy processes. Each year, the RCC establishes a set of priority areas and provides a forum to help the various business areas collaborate in their research activities in these priority areas. The high-level researchpriorities identified for2012were:financial stability,macro-prudential supervision andregulation; money markets and the operational framework in the post-crisis environment; monetary policy,fiscalpolicyandsovereigndebt;countrysurveillanceandinflationdynamics;andhouseholdfinanceandconsumption.Considerableprogresswasmadeinalloftheseareas.

102ECBAnnual Report2012
In thecontextof thefirstpriorityarea, theESCBMacro-prudentialResearchNetworkprovidedsignificantanalyticalsupporttotherelevantECBpolicyareas,aswellastotheEuropeanSystemicRiskBoard(seeSection2ofChapter3).Substantialprogresswasmadeinlinkingfinancialstabilityand economic developments, and devising new early warning indicators. Part of this research was presented at the Network’s second conference, which was held in Frankfurt in October 2012.
In the area of money markets and the operational framework, the focus of research activities had toshiftfrompreparingfor“normal”timestoreflectingsubstantialchangesinmarketfunctioning, as well as new instruments and a changed regulatory environment.
Intheareaofmonetarypolicy,fiscalpolicyandsovereigndebt,researchworkwascompletedondriversofsovereigndebtpremia,theinteractionbetweenmonetaryandfiscalpolicies,andspillovereffectsfromfiscaltofinancialvariables.
Research in the area of country surveillance and inflation dynamics included work on: (i) adjustment issues and imbalances, (ii) cross-country spillovers and linkages, and (iii) the conceptual underpinning of competitiveness determinants. Work in the latter area was also supported by a new research network on competitiveness (CompNet).
Finally, the Household Finance and Consumption Network collected critical micro-information towards the end of 2012. This information will need to be analysed in more detail, but the initial results indicate that the data obtained will provide the Eurosystem with a greater understanding of the investment, saving, borrowing and consumption behaviour of euro area households.
5.2 diSSemination oF reSearCh: publiCationS and ConFerenCeS
As in previous years, ECB staff research was published in the ECB’s Working Paper Series and Occasional Paper Series. 91 Working Papers and 7 Occasional Papers were published in 2012. A total of 75 Working Papers were written or co-written by ECB staff, a large number together with other Eurosystem economists, with the remainder being written by external visitors attending conferences and workshops, participating in research networks or spending a prolonged period at the ECB for the completion of a research project.24 As is now the established norm, most of the papers are eventually expected to be published in leading peer-reviewed academic journals. In 2012 ECB staff published almost 100 articles in academic journals.
Another regular ECB publication is the Research Bulletin,25 which is used to disseminate research work of general interest to a wide audience. In 2012 three issues of the Research Bulletin were published.Articles examinedavarietyof issues, suchas “The impactof theSecuritiesMarketsProgramme”,“Doesregulationathomeaffectbankrisk-takingabroad?”and“Bubbles,banksandfinancialstability”.
The ECB organised or co-organised 23 conferences and workshops on research topics in 2012. Co-organised conferences involved the Centre for Economic Policy Research, the BIS and other central banks, both within and outside the Eurosystem. As in previous years, most of the conferences
24 External researchers visit the ECB on an ad hoc basis or in the context of formal programmes such as the Lamfalussy Research Fellowship.
25 AllResearchBulletinscanbefoundontheECB’swebsiteunder“Publications”.

103ECB
Annual Report2012
andworkshopswererelatedtospecificresearchpriorities.Theprogrammesfortheseeventsandthepapers presented are available on the ECB’s website.
Another long-standing mechanism for the dissemination of research is the organisation of seminar series, of which two are of particular relevance: the Joint Lunchtime Seminars, co-organised with the Deutsche Bundesbank and the Center for Financial Studies, and the Invited Speaker Seminars. These two series comprise weekly seminars at which external researchers are invited to present their recent work at the ECB. The ECB also organises research seminars outside the scope of these two series on a more ad hoc basis.
6 other taSKS and aCtivitieS6.1 ComplianCe with the prohibition oF monetary FinanCinG and privileGed aCCeSS
Pursuant to Article 271(d) of the Treaty, the ECB is entrusted with the task of monitoring the compliance of the 27 EU NCBs and the ECB with the prohibitions implied by Articles 123 and 124 of the Treaty and Council Regulations (EC) Nos 3603/93 and 3604/93. Article 123 prohibits the ECB and the NCBs from providing overdraft facilities or any other type of credit facility to governments and EU institutions or bodies, as well as from purchasing debt instruments directly from them. Article 124 prohibits any measure, not based on prudential considerations, which establishesprivilegedaccessbygovernmentsandEUinstitutionsorbodiestofinancialinstitutions.In parallel with the Governing Council, the European Commission monitors Member States’ compliance with the above provisions.
The ECB also monitors the EU central banks’ secondary market purchases of debt instruments issued by the domestic public sector, the public sector of other Member States and EU institutions and bodies. According to the recitals of Council Regulation (EC) No 3603/93, the acquisition of public sector debt instruments in the secondary market must not be used to circumvent the objective of Article 123 of the Treaty.Suchpurchasesshouldnotbecomeaformofindirectmonetaryfinancingofthepublicsector.
In 2012 the following case could be seen as non-compliant with the provisions of Articles 123 and 124 of the Treaty and the related Council Regulations. Advance payments continued to be made by De Nederlandsche Bank in the context of the operation of the Dutch deposit insurance scheme. While new legislation is under way, the solution chosen will not make the Dutch deposit insurance schemecompliantwiththemonetaryfinancingprohibitionasitwouldcontinuetohaveatypeofoverdraft facility. Further changes by the Dutch government to the legal framework are therefore urgently required.
6.2 adviSory FunCtionS
Articles 127(4) and 282(5) of the Treaty require that the ECB be consulted on any proposed EU or draftnationallegislationfallingwithinitsfieldsofcompetence.26 All ECB opinions are published ontheECB’swebsite.ECBopinionsonproposedEUlegislationarealsopublishedintheOfficialJournal of the European Union.
26 The United Kingdom is exempt from the consultation obligation, pursuant to the Protocol on certain provisions relating to the United Kingdom of Great Britain and Northern Ireland, which is annexed to the Treaty, OJ C 83, 30.3.2010, p. 284.

104ECBAnnual Report2012
In 2012 the ECB adopted 16 opinions on proposed EU legislation and 95 on draft national legislationfallingwithintheECB’sfieldsofcompetence.Alistoftheopinionsadoptedin2012is annexed to this Annual Report (see Annex 1).
opinionS on propoSed eu leGiSlationThe ECB opinions issued at the request of the EU Council, the European Parliament, the European Council and the European Commission concerned, inter alia, strengthened economic governance of the euro area; the proposals for a directive and a regulation to replace the Markets in Financial Instruments Directive; 27 a proposal amending the Regulation on credit rating agencies; a proposal for a regulation on improving securities settlement and on central securities depositories (CSDs); a proposal for a directive establishing a framework for the recovery and resolution of credit institutionsandinvestmentfirms; 28andaproposalforaregulationconferringspecifictasksontheECB concerning policies relating to the prudential supervision of credit institutions.29
The opinion on strengthened economic governance of the euro area 30 welcomed the two proposed regulations and recommended some amendments aimed at further strengthening the budgetary discipline of the euro area countries and at further enhancing the surveillance of those experiencing orthreatenedwithseriousfinancialstabilitydifficulties.Inparticular,theopinionrecommendedthatone of the regulations cover the substance of the Treaty on Stability, Coordination and Governance in the Economic and Monetary Union, including the provisions on a mandatory medium-term budgetary objective and an automatic correction mechanism. The opinion also suggested that the EU Council shouldbeobliged tomakea recommendation toaMemberState toseekfinancialassistance if thesituationofthatMemberStatehassignificantadverseeffectsonthefinancialstabilityoftheeuroarea.
The ECB opinion on the proposal for a regulation amending the Regulation on credit rating agencies 31 expressedsupport for thegeneralobjectiveofcontributing toa reduction infinancialstabilityrisksandrestoringtheconfidenceofinvestorsandmarketparticipantsinfinancialmarketsand the quality of ratings. The ECB supported the gradual approach advocated by the Financial Stability Board and noted that references to the ratings of credit rating agencies should be removed orreplacedonlyoncecrediblealternativeshavebeenidentifiedandcanbesafelyimplemented.
In its opinion on a proposal for a regulation on improving securities settlement in the EU and on CSDs, 32 the ECB strongly supported the Commission’s proposal, especially with regard to the enhancement of the legal and operational conditions for cross-border settlement in the EU in general and in TARGET2-Securities (T2S) in particular.33 The ECB recommended that the proposed regulation and corresponding implementing acts be adopted before the launch of T2S, which is planned for June 2015. This is important in order to ensure a safer, harmonised regulatory environment, as well as increased and fair competition among CSDs in the T2S context. The ECB also recommended that close and effective cooperation should be fostered between the European Securities and Markets Authority, the national competent authorities and the members of the ESCB, in their capacity as both overseers and central banks of issue, in particular with regard to the development of draft technical standards. Such cooperation should facilitate comprehensive supervision and oversight in a cross-border context.
27 CON/2012/21. This opinion is discussed in detail in Section 3.2 of Chapter 3.28 CON/2012/99. This opinion is discussed in detail in Section 1.2 of Chapter 3.29 CON/2012/96. This opinion is discussed in detail in Section 1.2 of Chapter 3.30 CON/2012/18.31 CON/2012/24.32 CON/2012/62.33 For more information about the T2S project, see Section 2.2 of this chapter

105ECB
Annual Report2012
opinionS on draFt national leGiSlation Therewereasignificantnumberofconsultationsbynationalauthorities,manyofwhichconcernedmeasuresrelatingtofinancialmarketstability.34
Several Member States consulted the ECB on recapitalisation measures. The ECB stressed the importance of bank recapitalisation as an essential condition for financial and systemicstability, as well as a precondition for the preservation, by Eurosystem counterparties, of their eligible counterparty status. The ECB expressed, in relation to Slovenia, 35 a preference for bank recapitalisation to be carried out against cash contributions rather than against bonds issued by a state-owned bank assets management company, which would reinforce the link between the state and the banking sector.36 It also stated that the direct placement of government-issued debt instruments for the purpose of bank recapitalisation and their subsequent use as collateral in Eurosystemliquidityoperationswouldgiverisetomonetaryfinancingconcernsintheabsenceofany alternative market-based funding sources.37 Commenting on amendments to the legal framework for the recapitalisation and resolution of credit institutions in Greece,38 the ECB highlighted the importanceofclearlydefiningtheHellenicFinancialStabilityFund’sresponsibilities inorder toavoid inadvertent interference with the Bank of Greece’s powers as a supervisory and resolution authorityandguarantoroffinancialsystemstability.Addressingtheissueofbridgerecapitalisation,the ECB stated that the basic purpose of bridge recapitalisation was to ensure an increase in the loss-absorbingcapitalofabeneficiarycreditinstitution.
The ECB welcomed the new framework for the recovery and resolution of credit institutions and investment firms in France.39 As part of the resolution framework, the ECB welcomed the development of a bail-in tool as a debt write-down or conversion mechanism to absorb losses of institutions that are failing or likely to fail. The bail-in mechanism should be in line with internationally agreed key attributes for effective resolution.
Inrelationtothefinancingofstabilisationfunds,theECBnotedtheneedtoensurethatthefinancialresources of funds used for the resolution or stabilisation of credit institutions are adequate and that the contributions to such funds raised from credit institutions are set at a level which is appropriately calibratedtoensurefinancialstability.40
The ECB broadly welcomed requirements for Spanish credit institutions to increase provisions for real estate exposures (both impaired and performing), as they would strengthen the resilience of the Spanish banking sector while limiting the scope for public intervention.41
Commenting on debt arrangements for over-indebted individuals in Greece and on personal insolvency measures in Ireland,42 the ECB called for a thorough impact assessment to be undertaken in view of the possible negative implications of such measures for credit institutions in their capacity ascreditorsandforthefunctioningofthefinancialsystem.
34 For example, CON/2012/11, CON/2012/14, CON/2012/27, CON/2012/30, CON/2012/39, CON/2012/71, CON/2012/88, CON/2012/91, CON/2012/104 and CON/2012/106.
35 CON/2012/48 and CON/2012/71. 36 The ECB expressed a similar preference with regard to Portugal in CON/2012/23.37 CON/2012/64 and CON/2012/71.38 CON/2012/14, CON/2012/25 and CON/2012/39. See also CON/2012/90.39 CON/2012/106.40 CON/2012/88 and CON/2012/91.41 CON/2012/11 and CON/2012/46.42 CON/2012/40 and CON/2012/70.

106ECBAnnual Report2012
In the context of measures to strengthen the credit union regulatory framework in Ireland,43 the ECB welcomed the substantial enhancement of the regulatory tools available to the Central Bank of Ireland to improve protection for credit union members and stability in the credit union sector.
InanopiniononafinancialtransactiontaximposedoncertaintransactionsoftheMagyarNemzetiBank,44 the ECB considered that such a tax would, inter alia, disrupt the monetary policy transmission mechanism,affecttheselectionofmonetarypolicytools,andpossiblyresultinmonetaryfinancing.In a follow-up opinion,45 the ECB welcomed amendments which exclude central bank transactions fromthebaseofthefinancialtransactiontaxandrecommendedfurtherexemptingfromthetaxallcounterparties to transactions with the central bank involving securities that have not been issued by the central bank, in order to enable it to achieve its monetary policy objectives.
The ECB adopted several opinions concerning the NCBs, including amendments to the statutes of the Hungarian, Greek, Czech, Latvian, Spanish and Lithuanian NCBs.46 In its opinions on successive amendments to the Law on the Magyar Nemzeti Bank, 47 the ECB expressed serious concerns with regard to central bank independence, inter alia, criticising the frequent changes in the numberofdecision-makingbodymembersandin theirremunerationduringtheir termofoffice.The ECB was consulted on amendments to the Statute of the Bank of Greece 48 related to the central bank’soperations,tasksandgovernance,shareholderrightsandprofitdistribution.Inrelationtotheshareholder rights, the ECB noted the revision of the structure and rights of the Bank of Greece’s shareholders to eliminate possible conflicts of interest in the public policy role of the Bank. The ECB considered amendments to the Law on Latvijas Banka in the context of Latvia’s preparations for the introduction of the euro. Considering various aspects of central bank independence,theECBnotedthatthefinancialindependenceofacentralbankmaybestrengthenedby arrangements whereby the operational costs for the discharge of some of its tasks are borne by the entities affected by such tasks.49
The ECB considered the central bank’s role in macro-prudential oversight in the context of its opinionsontheLawonČeskánárodníbankaandwithregardtoanewfinancialstabilitycommitteein Germany.50 The opinions discussed, in particular, the importance of access to information relevant for the exercise of macro-prudential oversight tasks and issues relating to cross-border cooperation between the relevant authorities, in particular on actions taken to address systemic risks at the national level.51
Several Member States consulted the ECB on limitations on cash payments,52 in the context of which the ECB stressed that such measures should be proportionate to the general objective of combating tax evasion and should not go beyond what is necessary to achieve this objective.
The ECB considered the treatment of unexchanged national banknotes, stating that the direct allocation of the value of such banknotes to state revenue outside the distribution of a central
43 CON/2012/68.44 CON/2012/59.45 CON/2012/94.46 CON/2012/26, CON/2012/31, CON/2012/43, CON/2012/44, CON/2012/49, CON/2012/73, CON/2012/80, CON/2012/89 and
CON/2012/105.47 CON/2012/26, CON/2012/43 and CON/2012/49. 48 CON/2012/31.49 CON/2012/73.50 CON/2012/44 and CON/2012/55.51 See also CON/2012/104.52 CON/2012/33, CON/2012/36, CON/2012/37 and CON/2012/83.

107ECB
Annual Report2012
bank’sprofitswouldgiverisetoconcernswithregardtothemonetaryfinancingprohibitionandtheprincipleoffinancialindependence.53
CaSeS oF non-ComplianCe In 2012 the ECB recorded 30 cases of non-compliance with the obligation to consult on draft national legislation 54 and one case of non-compliance with the obligation to consult on draft EU legislation. The following 14 cases were considered clear and important.55
There were five clear and important cases of non-compliance with the consultation obligationin relation toGreece. The first case concerned, inter alia, the purchase by credit institutions ofownshares.ThiscasewasofgeneralsignificancetotheESCBasitrelatedtotheframeworkforenhancing the liquidity of credit institutions. The ECB was also not consulted on legislation entailing a reduction in the salaries of staff and management at the Bank of Greece. The third case, considered to be of general significance to the ESCB, concerned legislation affecting financial institutionsand Bank of Greece staff matters. Finally, there were two cases related to the recapitalisation and resolution of credit institutions where the ECB was consulted late in the legislative procedure.56
Therewerealsofiveclearandimportantcasesofnon-complianceinrelationtoHungary.Oneofthese cases related to measures to help distressed foreign exchange borrowers and another related toamendmentstotherescueschemeforsuchborrowers;bothconcernedfinancialstabilityandtherisks associated with foreign currency loans.57 Two further cases of non-compliance pertained to financialtransactiontaxlegislationandwereofgeneralsignificancetotheESCBastheyreferredto central bank independence.58 Finally, the ECB was not consulted on legislation which, inter alia, extended the obligation of a deposit guarantee scheme to compensate a credit institution’s creditors to include cases where a credit institution’s winding-up procedure has been initiated.
The four remaining cases concerned Italy, Luxembourg, Slovenia and Spain. The Italian authorities failed to properly comply with the obligation to consult the ECB on legislation regarding a guarantee scheme for the liabilities of Italian banks and the treatment of outstanding lira banknotes. In its opinion,59issuedaftertheconversionoftherelevantdecree-lawintolaw,theECBmadesignificantcritical comments concerning the principle of financial independence and monetary financing.The Luxembourg government did not consult the ECB on legislation concerning the increase of Luxembourg’s quota with the IMF; this is deemed to be an important case since it is highly likely that the ECB would have been critical in its response. The Slovenian Ministry of Finance consulted the ECB on draft legislation allowing the recapitalisation of systemically important Slovenian banks in accordance with the European Banking Authority recommendations. This consultation took place too late in the legislative procedure for the ECB opinion 60 to be taken into account before the legislation was adopted. Finally, the ECB issued an opinion on Spanish legislation concerning thereorganisationandsaleofrealestateassetsinthefinancialsector.61 In this case, the ECB was consulted on a law which was already in force and not on draft legislative provisions.53 CON/2012/4.54 Thisincludes(i)caseswhereanationalauthorityfailedtosubmitdraftlegislativeprovisionswithintheECB’sfieldofcompetencefor
consultation to theECB;and(ii)caseswhereanationalauthorityformallyconsulted theECB,butdidnotafford itsufficient time toexamine draft legislative provisions and to adopt its opinion prior to adoption of these provisions.
55 TheECBunderstands“clear”tomeancaseswherethereisnolegaldoubtthattheECBshouldhavebeenconsulted,and“important”tomeancases:(i)where,ifconsultationhadproperlytakenplace,theECBwouldhavemadesignificantcriticalcommentsonthesubstanceofthelegislativeproposal,and/or(ii)whichareofgeneralsignificancetotheESCB.
56 See CON/2012/25 and CON/2012/39.57 SeealsoCON/2012/27,inwhichtheECBmadesignificantcriticalcommentsonthesubstanceofthelegislation.58 See CON/2012/59 and CON/2012/94.59 See CON/2012/4.60 See CON/2012/48.61 See CON/2012/46.

108ECBAnnual Report2012
In addition, the failures to consult the ECB by Greece, Hungary, Italy, Lithuania and Spain in 2012 were considered to be clear and repetitive cases. Repetitive cases are those where the same Member State fails to consult the ECB at least three times in two consecutive years, with at least one case of non-compliance in each year under consideration.
6.3 adminiStration oF borrowinG and lendinG operationS
In line with earlier requests, the ECB continued to administer and/or process several borrowing and lending operations in 2012.
The ECB is responsible for the administration of the borrowing and lending operations of the EU under the medium-term financial assistance facility, as set out in DecisionECB/2003/14 of 7 November 2003.62 Interest payments on 11 loans were processed by the ECB. The total amount of outstanding EU lending operations under this facility as at 31 December 2012 was €11.4 billion, the same amount as at 31 December 2011.
The ECB is responsible for processing, on behalf of the lenders and the borrower, all payments related to the loan facility agreement for Greece.63 The original six loans were consolidated into a single loan on 15 June 2012. In 2012 the ECB processed interest payments on the loans as well as a balancing payment between two lenders on the occasion of the loan consolidation. The balance outstandingasat31December2012inrespectofthepooledbilateralloansforthebenefitofGreecewas €52.9 billion, the same amount as at 31 December 2011.
The ECB is responsible for the administration of the borrowing and lending operations of the EU under the European Financial Stabilisation Mechanism (EFSM).64 In 2012 the ECB processed eight disbursement payments on behalf of the EU and transferred these amounts to the borrower countries (Ireland and Portugal). Interest payments on ten loans were processed by the ECB. The total amount of outstanding EU lending operations under the EFSM as at 31 December 2012 was €43.8 billion, compared with €28 billion as at 31 December 2011.
The ECB is responsible for the administration of European Financial Stability Facility (EFSF) loans to Member States whose currency is the euro.65 In 2012 the ECB processed 15 disbursement payments on behalf of the EFSF and transferred these amounts to the borrower countries (Ireland, Portugal and Greece). Interest payments on eight loans and six interim loan rollover payments were processed by the ECB.
In accordance with Articles 17 and 21 of the Statute of the ESCB, the ECB may open accounts, andactasfiscalagent,fortheEuropeanStabilityMechanism(ESM).Accordingly, theECBhasagreedwiththeESMthatitwillberesponsibleforthetransferoffundsofESMloanstobeneficiaryMember States whose currency is the euro, and has opened an account for the ESM.
62 In accordance with Article 141(2) of the Treaty, Articles 17, 21.2, 43.1 and 46.1 of the Statute of the ESCB and Article 9 of Council Regulation (EC) No 332/2002 of 18 February 2002.
63 In the context of the loan facility agreement between the Member States whose currency is the euro (other than Greece and Germany) andKreditanstaltfürWiederaufbau(actinginthepublicinterest,subjecttotheinstructionsofandwiththebenefitoftheguaranteeoftheFederal Republic of Germany) as lenders and the Hellenic Republic as borrower and the Bank of Greece as agent to the borrower, and pursuant to Articles 17 and 21.2 of the Statute of the ESCB and Article 2 of Decision ECB/2010/4 of 10 May 2010.
64 In accordance with Articles 122(2) and 132(1) of the Treaty, Articles 17 and 21 of the Statute of the ESCB, and Article 8 of Council Regulation (EU) No 407/2010 of 11 May 2010.
65 In accordance with Articles 17 and 21 of the Statute of the ESCB (in conjunction with Article 3(5) of the EFSF Framework Agreement).

109ECB
Annual Report2012
6.4 euroSyStem reServe manaGement ServiCeS
In 2012 a comprehensive set of services continued to be offered within the framework established in 2005 for the management of Eurosystem customers’ euro-denominated reserve assets. The complete set of services – which is available to central banks, monetary authorities andgovernment agencies located outside the euro area, aswell as to international organisations – is offered under harmonised terms and conditions in line with general market standards by individual Eurosystem central banks (the Eurosystem service providers). The ECB performs an overall coordinating role, ensuring the smooth functioning of the framework. The number of customers maintaining a business relationship with the Eurosystem increased slightly, from 289 in 2011 to 299 in 2012. With regard to the services themselves, in the course of 2012 there was a substantial increase (+17%) in customers’ total cash balances (including deposits), whereas securities holdings remained stable. The ECB began work in 2012 to examine possiblewaysoffurtherimprovingthegeneraloperationalefficiencyandtherangeofservicesoffered to customers of the Eurosystem Reserve Management Services. Changes are being considered to improve the flexibility of limits on customer cash holdings. Thiswork is to befinalisedintheearlypartof2013.

Themountingoftheenergy-efficientfacadepanelsforthedoubleofficetowerbeganinFebruary2012andiscontinuingalongsidethefit-outworksandtheinstallationofthetechnicalinfrastructure.Thefacadehasagrey,non-mirrorfinishwitha light green sheen so that it blends into the surrounding environment.

111ECB
Annual Report2012
Chapter 3
FinanCial Stability, taSKS related to the eSrb, and FinanCial inteGration
1 FinanCial StabilityThe Eurosystem contributes to the smooth conduct of policies pursued by the competent national authoritiesrelatingtotheprudentialsupervisionofcreditinstitutionsandthestabilityofthefinancialsystem. The ECB provides advice to the European Commission on the scope and implementation ofEU legislation in thefieldsof prudential supervision andfinancial stability.Furthermore, theECB provides analytical, statistical and logistical support to the macro-prudential discussions in the European Systemic Risk Board (ESRB).
1.1 FinanCial Stability monitorinG
the euro area banKinG SeCtorAs part of the Eurosystem and together with the ESCB’s Financial Stability Committee, the ECBmonitors risks to financial stability and assesses the shock-absorbing capacity of the euroareafinancial system.1 Much of the focus of this important task is on banks, as they remain the primaryfinancialintermediariesintheeuroarea.Thisnotwithstanding,otherfinancialinstitutions,in particular insurance corporations, are also monitored closely. The related monitoring necessarily extends to non-financial sectors of the economy,which interact closelywith the banking sectorin its intermediation role. Moreover, owing to the importance of financial markets, financialinfrastructuresandotherfinancialinstitutions,andtheirlinkageswithbanks,vulnerabilitiesinthesecomponentsofthefinancialsystemarealsomonitoredbytheESCB.
In the course of 2012 several actions taken by policy-makers in the euro area contributed to alleviatingheightenedfinancialstabilityconcerns.Inlate2011theECBannouncedtwothree-yearlonger-termrefinancingoperations(LTROs),thefirstofwhichwasconductedinDecember2011andthesecond inFebruary2012.Thesignificant take-upof liquidity in these twoLTROshelped toalleviate the acute funding pressures faced by euro area banks at that time and thereby prevented what could otherwise have been a disorderly deleveraging process. Moreover, at the EU summit on 28 and 29 June 2012, several decisions to strengthen the foundations of the euro area were taken. Notably, these concerned the establishment of a single supervisory mechanism (SSM), a more flexibleandefficientuseof theEuropeanFinancialStabilityFacilityand theEuropeanStabilityMechanism, and the possibility of direct banking sector recapitalisation. Market sentiment and bank funding conditions, however, only rebounded forcefully after the speech given by the President of the ECB in London on 26 July and following the ECB’s announcement of measures to remove euro area“tailrisk”,includingtheunveilingofOutrightMonetaryTransactionson6September2012(see also Section 1 of Chapter 2). As a follow-up to the June summit, the Presidents of the European Council,theEuropeanCommission,theEurogroupandtheECBsubmittedafirstreporttotheEUHeads of State or Government outlining the four building blocks of a deeper union: banking union,
1 For example, since the end of 2004 the ECB has published its Financial Stability Review, a semi-annual report on the stability of the euro areafinancialsystem.

112ECBAnnual Report2012
fiscalunion,economicunionandpoliticalunion.On12December2012theECOFINCouncilsetout its position on proposals aimed at establishing an SSM for the oversight of banks.2
Followingaperiodofrelativecalminthefinancialsystematthebeginningof2012inthewakeofthetwothree-yearLTROs,theeuroareasovereigndebtcrisisreintensifiedinthelatespringandearlysummer of 2012. A pernicious interplay between distress in the sovereign debt market, deteriorating economicactivityandfundingandcapitalconstraintsonbanks–especiallyincountrieswherethesovereignwasunderstress–continuedtoposeriskstoeuroareafinancialstability.Thedecisionsby the European Council in June to initiate concrete steps towards a banking union and the speech by the President of the ECB in London in July, as well as the ECB’s announcement in the late summerofmeasurestoremoveeuroareatailrisk,providedasignificantboosttoflaggingmarketsentiment.Thisnotwithstanding,fragilityinthefinancialsystempersists.Inparticular,risksremainregarding policy implementation, weak macroeconomic growth prospects and the fragmentation of euroareafinancialmarkets.
Thefinancialperformanceofeuroarealargeandcomplexbankinggroups(LCBGs)deterioratedsomewhatinthefirsthalfof2012,negativelyaffectedbylowertradingincome,loanlossprovisionsand sovereign debt write-downs. Net interest income continued to be the main source of income forLCBGs. In an environmentofweakprofitability, this source remainedbroadly stable acrossbanks. Net fee and commission income likewise remained relatively stable, as the negative effects from sluggish economic activity and weak lending growth were mitigated by income generated from corporate bond issuance. Although characterised by considerable heterogeneity, the average earnings outlook for euro area banks remained subdued owing to a combination of economic and regulatory forces.
The solvency position of euro area LCBGs continued to steadily improve, thus extending the trend observedinpreviousyears.Thisdevelopmentwasduebothtoincreasesincapitallevels–primarilythroughretainedearningsandasset-liabilitymanagement–andtoreductionsinrisk-weightedassetsvia deleveraging and risk-weighted-asset optimisation. The European Banking Authority’s 2011 EU Capital Exercise, which was concluded in September 2012, contributed to increasing bank capital ratios,withallaffectedbanksclosingtheidentifiedcapitalgapsinthecourseof2012.3
Regardingbankfunding,euroareabanksrefinancedonlyafractionoftheirtermdebtthatmaturedin 2012, implying a negative net issuance of close to €200 billion for the euro area banking sector asawhole in thefirst tenmonthsof2012.While thisdevelopmentmaybepartly related to theEurosystem’sthree-yearLTROs,whichattenuatedtheneedforsomebankstoaccessfinancinginthenearterm,thenegativenetissuancecouldalsoreflecttheongoingdeleveragingandrestructuringprocesses in some banking sectors.4 Moreover, the cost of issuing new debt remained highly heterogeneous across banks, mainly according to the country of the issuer. In the third quarter of 2012 improved sentiment in credit markets contributed to better bank funding conditions, which led both to increased debt issuance volumes and to a tightening of spreads on senior unsecured debt and covered bonds. As a further sign of improvement, second-tier lenders from distressed countries alsoreturnedtothedebtmarkets,despitethefactthattheystillfacedhighrefinancingcosts.Indeed,the fragmentation of funding conditions in the euro area remained a feature of bank funding markets throughout 2012. 2 For more details, see Section 1.2 of this chapter.3 Further recapitalisations of Spanish banks in response to the capital shortfalls, identified in the stress-test exercise conducted by the
Spanish authorities during the second and third quarters of 2012, were initiated in the fourth quarter of 2012 and should be completed by the second quarter of 2013.
4 See also Special Feature A in Financial Stability Review, ECB, June 2012.

113ECB
Annual Report2012
The weakening economic environment and the associated deterioration in credit quality resulted in a broad-based increase in loan loss provisions of LCBGs in the second half of 2012 following a decrease earlier in the year. The levels of credit exposure of the euro area banking sector to householdsandfirmsremainedbroadlystableafter increasing inearly2012,although therewasconsiderable heterogeneity across countries and banks. Moreover, the level of credit risk facing euro area banks increased in the course of the year owing to the deterioration in the credit quality of borrowers,asreflectedbyhigherlevelsofnon-performingloansandloanwrite-offrates.
other FinanCial inStitutionSThenon-bankfinancial sectorwas affectedby strong linksbetweenfinancial sectors andacrossmarketsegments.Onaggregate,thefinancialsoundnessoflargeprimaryinsurersintheeuroarearemained broadly stable in the first three quarters of 2012, whereas underwriting performancewas moderate on account of modest economic activity. Despite the toll taken by natural disasters over recent years, the capital buffers of large euro area insurers still seemed to include some shock-absorption capacity. Reinsurers in particular were able to strengthen their capital base by retainingearnings,althoughthesestrongerpositionspartiallyreflectedaccountingeffectssuchaslow yields on highly rated government bonds and the fact that liabilities are not marked to market in most euro area countries. While the outlook for large euro area insurers is stable, there is a high degree of heterogeneity across the individual institutions and countries. Low government bond yieldsandsubduedeconomicactivitycontinuedtostrainprofitabilityandthereforecapital.
Turningtothe“shadowbanking”sector,whichcomprisesactivitiesrelatedtocreditintermediationthat take place outside the regular banking system, recent estimates suggest that it accounts for around half of all banking sector assets.5 Hedge funds constitute an important part of the shadow banking sector. In 2012 hedge fund investment performance was quite volatile, being closely tied to rapidly evolving market conditions over the course of the year.6 For the sector as a whole, the investment performance was slightly below the median of historical returns. According to various estimates, investor net flows into the hedge fund sector slowed down after having increased inthefirstquarterof2012.Nonetheless,institutionalinvestorscontinuedtoexpressinterestinhedgefund investments, not least because of low nominal yields on traditional debt investments. In the course of 2012 funding pressures on hedge funds, associated with large and sudden withdrawals of short-term financing provided by banks and the resulting disorderly fire sales of assets, wererelatively subdued.However,bankfinancingcouldbewithdrawnquickly shouldbanking sectorsoundness or market conditions suddenly deteriorate. Flows of capital from US prime money market funds to euro area banks remained fairly volatile throughout the year, closely correlated witheuroareafinancialstress.
1.2 FinanCial Stability arranGementS
Important work was undertaken in the field of crisis management and resolution in 2012, withsubstantialprogressbeingmadetowardsimprovingfinancialstabilityarrangementsattheEUlevel.
On 6 June 2012 the European Commission published a legislative proposal for a framework for recoveryandresolutionofcreditinstitutionsandinvestmentfirms.7 The proposed framework sets
5 See,forexample,“Shadowbankingintheeuroarea:anoverview”,Occasional Paper Series, No 133, ECB, April 2012.6 A more detailed analysis of hedge fund investment performance can be found in Financial Stability Review, ECB, December 2012. 7 Proposal for a directive of the European Parliament and of the Council establishing a framework for the recovery and resolution of credit
institutionsandinvestmentfirms,COM(2012)280final.

114ECBAnnual Report2012
out the necessary steps and establishes the tools and powers to ensure that bank failures across the EUaremanaged in awaywhich avoidsfinancial instability andminimises costs for taxpayers. In its opinion 8 on the proposal, the ECB fully supported the development of a recovery and resolution framework and the removal of obstacles to effective crisis management at financial institutions. Allfinancial institutionsshouldbeallowed to fail inanorderlymanner, safeguarding thestabilityof thefinancial systemas awhole andminimisingpublic costs andeconomicdisruption.For thispurpose, the development of common support tools tomanage the failure offinancial institutions –such as recovery and resolution plans, a bridge bank, as well as bail-in, sale of business and asset separationtools–isessential.Inparticular,theECBsupportsthedevelopmentofthebail-intool,butalso acknowledges that further studies need to be conducted prior to its introduction. The ECB intends to contribute to the further analysis of the practical implications of the bail-in as a resolution tool.
The proposed EU framework for recovery and resolution is fully in line with the new international standard for resolution regimes – the “Key Attributes of Effective Resolution Regimes forFinancial Institutions”–developedby theFinancialStabilityBoard (FSB).Asamemberof theFSB, the ECB continued to actively contribute to and support the development of such a framework in 2012, notably by being fully involved in the activities of the FSB’s Resolution Steering Group and Cross-Border Crisis Management Working Group. In this context, the ECB also contributed to supporting authorities and crisis management groups in developing effective resolution strategies andoperationalresolutionplansforglobalsystemicallyimportantfinancialinstitutions(G-SIFIs).In 2012 it was agreed that the FSB’s Resolution Steering Group, in which the ECB participates, would address the remaining obstacles to the implementation of resolution strategies for G-SIFIs, withtheaimofhavinginplacethefirstseriesofstrategiesandoperationalplansbymid-2013.
The proposed EU recovery and resolution framework is a vital building block in the process of creatingafinancialmarketunion.During2012 theECBwasactively engaged inpreparingandsupporting theprogression towardsafinancialmarketunion,not least in thecontextof the fourpresidents’ work on how to achieve a genuine Economic and Monetary Union.9 In this context, at the endofJune2012theeuroareasummitandtheEuropeanCouncilaffirmedtheirresolvetoachievea genuine Economic and Monetary Union. To this end, the President of the European Council was invited to develop, in close collaboration with the President of the European Commission, the PresidentoftheEurogroupandthePresidentoftheECB,aspecificandtime-boundroadmapforthe achievement of a genuine Economic and Monetary Union.
AmajorsteptowardsthecreationofafinancialmarketunionwastakeninSeptember2012withthe European Commission’s proposal to establish a single supervisory mechanism, which will conferspecifictasksontheECBconcerningpoliciesrelatingtotheprudentialsupervisionofcreditinstitutions. The SSM will be created at the euro area level, but with the possibility for non-euro area countries to engage in close cooperation with the ECB and be part of the SSM.
In its opinion10, the ECB supports the creation of the SSM and stands ready to perform the new tasks relating to the prudential supervision of credit institutions provided for in the proposed regulation. From the ECB’s perspective, the proposed SSM regulation should comply with the following main principles. First, the ECB, within the SSM, should be able to carry out the tasks assigned to it effectively and rigorously without any risk to its reputation. Second, the ECB should remain
8 CON/2012/99. For further details of this contribution, see the ECB’s website.9 The Presidents of the European Council, the European Commission, the Eurogroup and the ECB. For further details, see the European
Commission’s website (http://ec.europa.eu). 10 CON/2012/96. For further details of this contribution, see the ECB’s website.

115ECB
Annual Report2012
independent in carrying out all its tasks. Third, there should be a strict separation between the ECB’s new tasks concerning supervision and its monetary policy tasks assigned by the Treaty. Fourth, the ECB should be able to have full recourse to the knowledge, expertise and operational resources of national supervisory authorities. Fifth, the SSM should operate in a manner fully consistent with theprinciplesunderpinning the singlemarket infinancial services and in full adherence tothesinglerulebookforfinancialservices.Inthisregard,theECBalsowelcomedthepossibilitytoinvolve non-euro area Member States in the SSM to ensure greater harmonisation of supervisory practices within the EU, thus strengthening the internal market. Sixth, the ECB is ready to comply with the highest standards of accountability when performing these supervisory tasks. Furthermore, the ECB is of the opinion that a single resolution mechanism is a necessary complement to the SSMtoachieveawell-functioningfinancialmarketunion.Therefore,suchamechanismshouldbeestablished, or at least there should be clear deadlines for its establishment, when the ECB assumes its supervisory responsibility in full. Accordingly, the ECB called upon the Commission to urgently present a separate proposal for an independent European resolution mechanism, including aspects of a common European resolution fund.11
On 12 December the ECOFIN Council agreed on a general approach towards proposals aimed at establishing a single supervisory mechanism for the prudential supervision of credit institutions. The establishment of the SSM is essential for the functioning of Monetary Union. The independent supranationalsupervisionbytheSSMwillhelptorestoreconfidenceinthebankingsector,whichwillhelptoreversefinancialfragmentation,prevent theflightofbankdepositsandcontributetorestoring a well-functioning interbank market.
The agreement on the SSM is a milestone in European integration. Member States have agreed to assign to the European level a complete set of banking supervision powers over all banks of the euro area countries, as well as the banks of non-euro area countries joining the SSM, by conferring specificsupervisorytasksontheECB.TheSSMwillbefullyopentotheparticipationofallMemberStatesonanequalfooting.Itisalsoamajorstepforthesinglefinancialmarket.Inaddition,theSSMwillcontributetotheeffectiveapplicationofthesinglerulebookforfinancialservices,whilehelping to better address systemic risks in Europe.
On 14 December the European Council agreed on a roadmap for the completion of EMU, based on deeper integration and reinforced solidarity. The Council concluded that the process would begin with the completion, strengthening and implementation of new enhanced economic governance, as well as the adoption of the SSM and new rules on recovery, resolution and deposit guarantees. This will be completed by the establishment of a single resolution mechanism. A number of other important issues will be further examined before the June 2013 European Council meeting, concerning the coordination of national reforms, the social dimension of EMU, the feasibility and modalities of mutually agreed contracts for competitiveness and growth, and solidarity mechanisms, as well as measures to promote the deepening of the Single Market and to protect its integrity. Throughout this process, democratic legitimacy and accountability will be ensured.
Finally,during2012theECBalsoissuedseveralopinionsrelatedtofinancialmarketstabilityintheeuro area.12
11 See also CON/2012/99.12 See, for example, CON/2012/14, CON/2012/30, CON/2012/53, CON/2012/58 and CON/2012/71, among others. All ECB opinions are
published on the ECB’s website.

116ECBAnnual Report2012
2 taSKS ConCerninG the FunCtioninG oF the european SyStemiC riSK board
2.1 inStitutional FrameworK
2012 was the second year of operation of the European Systemic Risk Board (ESRB). The ESRB is responsibleforthemacro-prudentialoversightoftheEUfinancialsystem,withtheECBprovidingthe ESRB Secretariat with analytical, statistical, logistical and administrative support.
For thefirst five years of its existence, theESRBwill be chairedby thePresident of theECB.In 2012 the ESRB was therefore chaired by Mario Draghi.
With 25 staff, the ESRB Secretariat supported the day-to-day business of the ESRB, including the provision of administrative support to the institutional bodies, the conduct of relevant analytical work,contributionstodefiningaframeworkformacro-prudentialstrategyanditsimplementation,as well as cooperation with supervisory authorities.
In terms of its activities in 2012, the ESRB used the powers entrusted to it by Regulation (EU) No 1092/2010 and adopted two recommendations: Recommendation ESRB/2012/1 on money market funds and Recommendation ESRB/2012/2 on funding of credit institutions.13 Moreover, in accordance with Article 3(2)(g) of the above-mentioned Regulation, the ESRB published in September2012thefirstissueoftheESRBriskdashboard–asetofquantitativeandqualitativeindicators aimed at identifying and measuring systemic risk.
The ESRB used the various channels foreseen in Regulation (EU) No 1092/2010 to ensure its accountability as a new European public body. This included three hearings in the European Parliament where the Chair explained how he intended to discharge his duties, as well as other regularhearingsandconfidentialdiscussionsontheongoingactivityoftheESRBwiththeChairand Vice-Chairs of the Economic and Monetary Affairs Committee of the European Parliament. The ESRB also reported in several forms to the European Council on warnings and recommendations andtheirfollow-up.TheESRBpublisheditsfirstAnnualReport,covering2011,inMay2012.
2.2 analytiCal, StatiStiCal, loGiStiCal and orGaniSational Support to the eSrb
The ECB continued to ensure the ESRB Secretariat and thereby provide analytical, statistical, logistical and organisational support to the ESRB. In the second year of ESRB operations, the ECB contributed to the regularmonitoring, identification and assessment of EU-wide systemic risks. In addition to the regular financial stability surveillance and assessment activities, the ECBcontinued to provide its analytical and statistical support, as described below.
13 The two recommendations were made public in February 2013.

117ECB
Annual Report2012
analytiCal SupportIn 2012 the ECB continued to provide analytical support to the ESRB in the form of contributions totheregularreportsmonitoringandidentifyingsystemicrisksfacedbytheEUfinancialsystemand including assessments of the potential impact of those risks.
Contributions are based on ECB expertise as well as information collected through market intelligenceefforts,inparticulartosupportthesystemicriskidentificationprocess.RegularsystemicrisksurveillanceandassessmentworkalsoreliesonandbenefitsfrominformationreceivedfromESRB member institutions. Systemic risk indicators are important analytical tools aiding the risk surveillance work of the ESRB. The risk assessment is supported, in particular, by macro-stress-testing tools and the analysis of propagation channels to assess and rank the potential severity of specificrisks.
In addition, the ECB also contributed to the various workstreams set up by the ESRB to assess systemic risk and to the preparation of recommendations on regulatory matters or legislative initiatives.
IncooperationwiththeNCBsandnationalandEuropeansupervisoryauthorities–viatheESRB’sAdvisoryTechnicalCommitteeand its sub-structures– theECBregularly reviews theavailabletools, with the objective of continuously improving the analytical framework, and develops new analyticaltoolstofillidentifiedanalyticalgaps.
The ESCB’s Macro-prudential Research Network plays an important role in this regard.14 The work conducted so far can be grouped according to the Network’s three main workstreams: (i) macro-financialmodelslinkingfinancialstabilityandtheperformanceoftheeconomy;(ii)earlywarningsystems and systemic risk indicators; and (iii) assessing contagion risks.
Themainfocusofthefirstworkstreamhasbeentoprovidetheoreticalandempiricalframeworkswhich integrate widespread financial instability into aggregatemodels.Work is progressing ona joint cross-country project involving nine NCBs and the ECB to develop a quantitative model for assessing macro-prudential policies. The model features heterogeneous banks, households and firms,whichcandefaultinequilibrium,aninterbankmarketwithacentralbank,variousfinancialfrictionsandexternalities(includingfiresales)associatedwithbusinessandmortgageloandefaults.15 The model also incorporates variables such as capital and liquidity requirements, dividend restrictions, loan-to-value and loan-to-income ratios for mortgages, leverage ratios and certain taxes or levies, which can be used as regulatory instruments. The model is intended to be used in assessingtheimpactofmacro-prudentialregulatorypoliciesonthestabilityofthefinancialsystem(in terms of the probability of widespread bank defaults), as well as on lending and real activity.
Research in the second workstream is intended to produce output which is more immediately operational. Researchers provided the ESRB with a number of useful operational tools, such as indicators of current systemic stress 16 and key early warning indicators for systemic financialinstability and widespread imbalances. Another contribution was the production of a database of
14 The establishment of the Network was approved by the General Council of the ECB in 2010, with the objective to develop core conceptual frameworks, models and/or tools that would provide research support with the aim of improving macro-prudential supervision in the EU.
15 For more details, see The report on the first two years of the Macro-prudential Research Network, ECB, October 2012.16 For instance, the composite indicator of systemic stress, which was developed at the ECB within the context of the Macro-prudential
Research Network, is now included in the new risk dashboard released by the ESRB. See ESRB risk dashboard, Issue 1, European Systemic Risk Board, 20 September 2012 (available on the ESRB’s website at http://www.esrb.europa.eu).

118ECBAnnual Report2012
crises in EU countries, which provides a homogeneous basis for assessing the performance of early warning and systemic stress indicators.
The main focus of the research in the third workstream is the assessment of cross-border bank contagion via money markets across EU countries. Over the last year, a special effort was undertaken to account for the recent crisis developments in Europe, with a focus on sovereign contagion. In order to complete several ongoing cross-country projects, the Macro-prudential ResearchNetworkwillcontinuetooperateuntiltheendof2013andafinalreportisenvisagedforthe spring of 2014.
StatiStiCal SupportIn 2012 the ECB, assisted by the NCBs, provided statistical support to the ESRB through several channels, having full regard for the fact that the availability of reliable and sound data is a prerequisiteforriskidentificationandassessment.
In the second year of activity of the ESRB, several important legislative initiatives were developed at the EU level. In the context of the elaboration of a sound statistical basis for macro-prudential policy in the EU, the ECB reviewed the potential impact of forthcoming EU legislation on the provision of statistical information to the ESRB.17 In the framework of its statistical support to the ESRB, the ECB contributed to the development by the European Supervisory Authorities (ESAs) of relevant andharmonised reporting standards and,where appropriate, clarified theESRBdatarequirementswhichhadbeenreflectedinpublicESRBcontributions.
ThestatisticalsupportprovidedbytheECBbenefitedfromitsparticipationintheESRBContactGroup on Data. This group, which was established under the aegis of the ESRB Steering Committee to address issues related to the exchange of information among the ESCB, the ESRB and the ESAs, in particular promotes further coordination between the ECB and these institutions, facilitates the minimisation of the reporting burden and fosters the necessary cooperation across institutions to enhance the relevance, reliability and timeliness of data.
TheESCBwasalsoinvolvedinthepreparationoftheESRBriskdashboard,releasedforthefirsttimeaftertheESRBGeneralBoardmeetingon20September2012.TheESRBriskdashboard– as required by the ESRBRegulation (Article 3(2)(g)) – is a set of quantitative and qualitativeindicatorstoidentifyandmeasuresystemicriskintheEUfinancialsystem.Thisstatisticalinstrumentcomprises indicators broken down by risk category, namely interlinkages and composite measures ofsystemic risk,macro risk,credit risk, fundingand liquidity risk,market risk,profitabilityandsolvency. The ESRB risk dashboard is now one of the communication instruments of the ESRB, asitprovidesstatisticalinformationconcerningrisksandvulnerabilitiesinthefinancialsystemtothe public at large.
In the same vein, the ECB supports the ESRB’s risk surveillance and risk analysis work through a quarterly macro-prudential review that presents detailed statistical information with a pivotal role intheidentificationandassessmentofsystemicriskfacedbythenationalandEUfinancialsystems.For this purpose, the ECB has responsibility for ensuring the regular provision to the ESRB of statistical and other information, in accordance with ESRB Decision 2011/6. In particular, steps
17 Such ongoing initiatives include the Capital Requirements Directive and the Capital Requirements Regulation, the Solvency II Directive, the European Market Infrastructure Regulation, the Alternative Investment Fund Managers Directive and the Regulation on Credit Rating Agencies.

119ECB
Annual Report2012
were taken during the year to improve the quality of the aggregated supervisory information that the ESAs transmitted to the ECB and to include this information in the ESRB risk dashboard and the quarterly macro-prudential review. Finally, the ECB put in place measures to ensure access by the ESAs and the ESRB to non-published statistical information collected within the framework of the ESCB.
3 FinanCial reGulation and SuperviSion
3.1 banKinG
In 2012 the ECB continued to participate in and contribute to the work being carried out by the BaselCommitteeonBankingSupervision(BCBS),includingtherevisionandfinalisationofcertainelements of the new capital and liquidity standards (Basel III). A key area of current policy debate is liquidity regulation. In this regard, the ECB welcomes the endorsement by the Group of Governors and Heads of Supervision of the Basel Committee’s amendments to the liquidity coverage ratio (LCR), as agreed in January 2013. The amendments include a limited recognition of additional assets in the range of eligible high-quality liquid assets,18somerefinementstotheassumedinflowandoutflowratestobetterreflectexperienceintimesofstress,arevisedtimetableforthephasing-inofthestandardandareaffirmationoftheusabilityofthestockofliquidassetsinperiodsofstress.These changes are in line with the ECB’s view that, while the need for strict liquidity requirements for banks to hold more liquid assets as well as to better price and manage liquidity risk is indisputable, the review of the initially proposed framework takes better into account the possible impact of the regulation on the interbank market and on the interaction with monetary policy operations. The ECB also supported a more gradual implementation of the liquidity framework in order to avoid disrupting the recovery process in the banking sector and lending to the real economy, especially in light of the stress in some countries and the ongoing macroeconomic adjustment programmes. The LCR is planned to come into force in 2015, although banks will now have until 1 January 2019 to fully meet the standard.
In line with the commitment made by the G20 leaders in November 2010, the ECB to a large extent supports national and international efforts currently focusing on a timely and consistent implementation of the Basel III standards.
The ECB also contributes to the implementation of the Basel standards in Europe and considers the European Commission’s proposals for a capital requirements directive and regulation (known as CRD IV/CRR), which will transpose the Basel III framework into European law, to be an important steptowardsstrengtheningtheregulationofthebankingandinvestmentfirmsectorandcreatingasounderandsaferfinancialsystemintheEU.
In this regard, the ECB published its opinion on CRD IV/CRR on 27 January 2012.19 The ECB stressed the importance of reaching an agreement among EU Member States on the CRD IV/CRR textassoonaspossible.Initsopinion,theECBexpressedstrongsupportforthe“singlerulebook”
18 Supervisors may now choose to include within the Level 2 category of high-quality liquid assets (HQLAs) an additional class of assets, known as Level 2B assets. This new category may comprise no more than 15% of the total stock of HQLAs. It includes a broader range of corporate bonds, a selection of listed equities (both with a 50% haircut), and some highly rated residential mortgage-backed securities (with a 25% haircut).
19 CON/2012/5.

120ECBAnnual Report2012
approach,whichwill ensure that financial institutions providing financial services in the SingleMarket comply with one set of prudential rules.
ThisapproachisexpectedtofurtherenhancefinancialintegrationinEuropeandprovideasoundbasis for the uniform application of rules in the planned single supervisory mechanism, where it is envisaged that theECBwill take responsibility for specific tasksboth formicro- andmacro-prudential supervision, in close cooperation with national authorities, of credit institutions. As regards macro-prudential supervision, the ECB considers it important that the regulation make it possible for the ECB to apply more stringent prudential requirements than those applied by national authorities where systemic or macro-prudential risks arise.
Following the publication in November 2011 of policy measures to address the issue of global systemically important banks (G-SIBs), the Financial Stability Board (FSB) and the BCBS, in line with the G20 mandate, made good progress in completing the framework, by extending it from G-SIBs to also encompass domestic systemically important banks (D-SIBs).20
ThebasicpremiseofthislineofworkisthatthefinancialdistressofaD-SIB–evenintheabsenceofmajordirectcross-borderexternalities–hasawider impacton thedomesticfinancial systemwhen compared with that of a non-systemic institution. Against this background, the D-SIB approach adopts a complementary perspective to the G-SIB regime, i.e. by focusing on the impact of an eventual failure on the domestic economy.
Furthermore, in view of the implementation of the G-SIB framework, work was conducted in 2012 to enhance both the data quality and the robustness of the methodology underlying the G-SIB identificationandcalibration.Inthiscontext,theFSBpublishedinNovember2012anupdatedlistof G-SIBs based on the most recently available data (as at end-2011), with the important indication oftheirbucketclassificationbylevelofprospectiveadditionallossabsorbencyrequirements.
TheECBactivelysupportedtheworkoftheFSBandtheBCBSinthisimportantfield.TheECBendorses these new international standards, as they are instrumental in addressing the negative externalities related to systemic institutions. In particular, the extension to D-SIBs represents welcome progress towards ensuring that all systemic institutions, irrespective of their scope of activity, are subject to regulatory requirements commensurate to the risks that they pose to the financialsystemandtherealeconomy.
3.2 SeCuritieS
In 2012 the comprehensive reform of the EU framework for securities regulation continued, in particular regarding the discussions on the finalisation of key legislative initiatives such as thereview of the Markets in Financial Instruments Directive (MiFID review). The ECB, in its opinion21 of 22 March 2012, broadly supported the MiFID review, which represents an important step towards strengtheningtheprotectionofinvestorsandcreatingasounderandsaferfinancialsystemintheEU.
More specifically, the ECB welcomed the European Commission’s suggestions to upgrade themarket structure framework by broadening the scope of the EU regulatory framework to include a new trading platform– theOrganisedTradingFacility (OTF). It also supported the proposed
20 See A framework for dealing with domestic systemically important banks, Basel Committee on Banking Supervision, October 2012.21 CON/2012/21.

121ECB
Annual Report2012
extension of the scope of pre- and post-trade transparency requirements beyond equity instruments, to include bonds, structured products and derivatives, as it would enhance the price formation process of such instruments. The ECB also supported the proposals to increase data consolidation, as they wouldensureanefficientcomparisonofpricesand tradesacrossvenues.Given thatalgorithmicand high-frequency tradingmay pose risks to the liquidity and efficiency of financial markets,especially in times of stress, the ECB welcomed the proposals to introduce appropriate safeguards for trading venues offering access to high-frequency traders and measures aimed at facilitating the oversight and monitoring of these new trading strategies. Finally, the ECB recommended further improvements in the cooperation and exchange of information within the European System of Financial Supervision and between supervisory authorities and ESCB central banks.
On 2 April 2012 the ECB issued an opinion on a legislative proposal of the European Commission amending Regulation (EC) No 1060/2009 on credit rating agencies, as well as Directives 2009/65/EC and 2011/61/EU.22
In the course of 2012 the ECB was also actively involved in the initiatives aimed at strengthening the regulation of shadow banking, by contributing to the policy and regulatory debate at the FSB level. In addition, the ECB contributed to the Commission’s public consultation on a Green Paper on shadow banking 23 by providing a Eurosystem response.24 In that response, it was emphasised that any regulatory initiative should be consistent with the work of the FSB in order to ensure a levelplayingfieldandavoidregulatoryarbitrage.
As regards concrete regulatory proposals, the ECB supported the Commission’s view that a permanent process should be created at the EU level for the collection and exchange of information concerning shadow banking, suggesting that the European Systemic Risk Board would be well placed to play such a role. It also pointed out the need for more transparency with regard to repo transactionsinviewoftheirrelevanceformonetarypolicyimplementationandfinancialstability.In this context, the ECB put forward a proposal to set up a central EU database for collecting repo data directly from infrastructures and custodian banks, which would improve the visibility of thismarketsegment.Inaddition,theECBemphasisedthebeneficialeffectsintermsoffinancialstability of the use of central counterparties in repo transactions. Lastly, it supported proposals to definearegulatoryframeworkforrepohaircutstocurbpro-cyclicaleffects,whichshouldhoweverbesetoutandcalibratedcarefullysoastopreservetheefficienttransmissionofmonetarypolicy.
3.3 aCCountinG
In 2012 the ECB continued to contribute to the accounting work carried out in various fora, including in sub-structures of the BCBS and the European Banking Authority.
Throughout the year, the International Accounting Standards Board and the Financial Accounting Standards Board continued the work on aligning their respective accounting frameworks. Despite some progress in 2012, material differences continue to exist in key accounting areas, namely in financial instruments accounting (e.g. impairment methodologies, netting). In addition, the US Securities and Exchange Commission’s much-delayed decision on the adoption of the International Financial Reporting Standards (IFRS) in the United States was pushed back even
22 CON/2012/24. This opinion is discussed in detail in Section 6.2 of Chapter 2.23 Green Paper on shadow banking,EuropeanCommission,19March2012,COM(2012)102final.24 Commission’s Green Paper on shadow banking – the Eurosystem’s reply, 5 July 2012 (available on the ECB’s website).

122ECBAnnual Report2012
further. All in all, the developments in 2012 render nearly impossible a timely response to the G20 call for a single set of high-quality global accounting standards and to meet the target of issuing standards on key convergence projects by mid-2013 at the latest. Nonetheless, achieving convergence in key areas of accounting remains critically important. A case in point is the standard on impairment of financial assets. The two accounting standard-setters are expected to renewtheir efforts to converge in a timely manner. Such a convergence process should, however, not be detrimental to the quality of the IFRS. Furthermore, a sound impairment methodology is important fromafinancialstabilityperspective.
4 FinanCial inteGrationTheEurosystemandtheESCBcontributetoenhancingEuropeanfinancialintegrationby:(i)raisingawarenessofandmonitoringfinancialintegration;(ii)actingasacatalystforprivatesectoractivitiesby facilitating collective action; (iii) giving advice on the legislative and regulatory framework for thefinancialsystemanddirectrule-making;and(iv)providingcentralbankingservicesthatfosterfinancialintegration.
raiSinG awareneSS oF and monitorinG FinanCial inteGration InApril 2012 theECBpublished its sixth annual report on “Financial integration inEurope”.25 The main purpose of the report is to contribute to the analysis of the advancement of European financial integration and to raise public awareness of the Eurosystem’s role in supporting thisprocess, providing information about the state of integration and thus an empirical basis for policy measurestofosterfurtherfinancial integration.Thisissueofthereportfocusedontheimpactofthesovereigndebtcrisisintheeuroareaonfinancialintegrationandprovidedanoutlookforfuturepolicy initiatives. The report also contained more detailed analyses of the following topics: (i) the impactofweakeningfinancialintegrationonmonetarypolicytransmissionandtheEurosystem’soperationalframework;(ii)sectoralbalancesandeuroareafinancialintegration;(iii)thebenefitsoftheEU’ssinglefinancialmarketrevisitedinthelightofthecrisis;and(iv)institutionalreformin theEuropeanUnion andfinancial integration.The report concludedwith an overviewof theEurosystem’s contribution towards the achievement ofmore integrated and developed financialmarkets in Europe during 2011.
The Research Network on Capital Markets and Financial Integration in Europe closed down in the autumn of 2011. During its existence, this network brought together academics, market participants, policy-makers and central bankers in an effort to contribute to the understanding of the current and futurestructureandintegrationofthefinancialsysteminEuropeanditsinternationallinkageswiththe United States and Japan. Overall, the network held 14 research workshops.26
As in previous years, the ECB offered five “Lamfalussy Fellowships” to young researchers. Thecurrentresearchprioritiesare:(i)modelsandanalyticaltoolsfortheearlyidentificationandassessmentof systemic risks; (ii) incorporatingfinancial instability intomodelsof theaggregateeconomy; (iii) designing and assessing the effectiveness of macro-prudential regulatory policy instruments; (iv) the design of central bank operational frameworks; and (v) the role played by fiscalrulesandfiscalgovernanceinfinancialmarketconfidence,stabilityandefficiency.
25 This report is available on the ECB’s website.26 Informationontheseandrelatedactivitiescanbefoundunderhttp://www.eu-financial-system.org
123ECB
Annual Report2012
aCtinG aS a CatalySt For private SeCtor aCtivitieS
SepaThe Single Euro Payments Area (SEPA) is an initiative aimed at achieving a fully integrated market for retail payment services in euro, with no distinction between cross-border and national payments. During 2012 the Eurosystem continued to monitor and support the work in this field. Specialattention was paid to the migration to the new SEPA instruments. According to the SEPA indicators, the migration in the euro area from domestic credit transfers to SEPA credit transfers reached 34.9% in December 2012. As regards the SEPA direct debits, the migration amounted to only 1.9%. An end-date regulation to support the migration was adopted in March 2012.27 The regulation lays down rules for the initiation and processing of credit transfer and direct debit transactions denominated ineurowithintheEU.Italsodefinesacleartimelinefortheimplementationoftheserules.Fortheeuro area, the deadline is 1 February 2014. By this date, existing national euro credit transfer and direct debit schemes will need to have been replaced by the SEPA-compliant alternatives. In order to promote a timely start of the preparations, especially those by citizens and smaller and medium-sized companies, the Eurosystem has stepped up its SEPA communication efforts.
FurtherprogressisstillneededinthefieldofSEPAforcards.TheEurosystemanalysedthemeritsof a SEPA Cards Processing Framework, which would connect card processors in order to process card transactionsmore efficiently across borders within the EU. Furthermore, in July 2012 theEurosystemorganisedathirdmeetingoftheForumontheSEPACertificationFramework.Atthismeeting, theEurosystemexpressed itssupport for the jointeffortsofcardschemes,certificationauthorities, evaluation laboratories, terminal manufacturers and the banking industry to develop a thoroughmethodology for the security evaluation and certificationof newpayment terminals,which would at the same time establish a single approval process for terminals to be deployed within the EU. These and other elements of information security and fraud prevention in retail payments remain under the constant attention of the Eurosystem.
The migration to the SEPA schemes and the realisation of an integrated and competitive cards market based on common business practices, technical standards and security requirements form the foundationforinnovativepaymentservicesofferedonapan-Europeanscale.However,inthefieldof internet payments, the roll-out and usage of this way of making payments has not kept pace with the rapid development of e-commerce. Pilot projects for m-payments have been organised in several European countries, sometimes followed by actual deployments. The Eurosystem is concerned that too little attention is being paid to technical standardisation and business interoperability, which are key factors of success also in this area of SEPA.
In 2012 the SEPA Council 28 held in-depth discussions regarding the review of SEPA governance. Moreover, the SEPA Council discussed several issues related to the end-date regulation and SEPA migration, SEPA for cards, and innovation. On the latter, in view of the limited progress achieved bythemarketsofar,itidentifiedanumberofkeychallengestobeexaminedinordertoensuretheprovision of EU-wide e-payment services for e-commerce.
27 Regulation (EU) No 260/2012 of the European Parliament and of the Council of 14 March 2012 establishing technical and business requirements for credit transfers and direct debits in euro and amending Regulation (EC) No 924/2009, OJ L 94, 30.3.2012, p. 22.
28 This is a stakeholders’ forum, co-chaired by the ECB and the European Commission, which aims to promote an integrated euro retail payments market by ensuring the proper involvement of all parties and by fostering consensus on the next steps towards the realisation of SEPA.

124ECBAnnual Report2012
Finally, in September 2012 the ECB published the results of its study on the social and private costs of making retail payments, conducted in cooperation with 13 NCBs.29 These costs amount to around €45 billion, or almost 1% of GDP. If extrapolated to cover all 27 EU Member States, they would be around €130 billion. The results underline how much retail payment services matter for European society and in the economy as a whole. The ECB and the Magyar Nemzeti Bank jointly organised a conference on retail payments, which took place in Budapest on 15 and 16 November 2012. The conference enhanced knowledgeofthemainforcesdrivingchangesintheoverallefficiencyofretailpayments,theroleofcentral banks and other public authorities, and likely future developments in the retail payments market.
SeCuritieS marKetS To increase transparency in the area of asset-backed securities (ABSs), the Governing Council decided in December 2010 to establish loan-by-loan information requirements for ABSs in the Eurosystem collateral framework. Since then, preparatory work has been conducted and concluded, and a market-led single loan-level data repository, the European DataWarehouse, has been created in order to handle the loan-level data. In November 2012 the Governing Council announced that loan-level data reporting would be mandatory within the Eurosystem collateral framework as of 3 January 2013 for residential mortgage-backed securities and for ABSs whose underlying assets include loans to small and medium-sized enterprises, as of 1 March 2013 for commercial mortgage-backedsecurities,andasof1January2014forconsumerfinanceABSs, leasingABSsandautoloan ABSs. Loan-level data are to be provided in accordance with the templates available on the ECB’s website, at least on a quarterly basis.
In addition, the ECB acted as an observer and catalyst in two other market-led initiatives in securitisationmarkets.Thefirst initiative aims to reinforceABSs as sustainable investment andfunding tools, in particular with a view to improving market resilience in Europe. It is promoted by the European Financial Services Round Table and the Association for Financial Markets in Europe. This initiative, which is called the Prime Collateralised Securities (PCS) initiative, rests on EU-wide standards for ABSs which relate to quality, transparency, standardisation and simplicity. These standards are expected to lead to increased liquidity for securities which acquire the PCS label.30Theworkwasfinalisedduring2012andthefirstassetwasPCSlabelledinNovember2012.The second initiative is promoted by the European Covered Bond Council. It aims to establish a “CoveredBond” label,whichwillbegranted tocoveredbondprogrammeswhichmeet specificcriteria, such as increased transparency, strong safeguards provided by dedicated national covered bond legislation, supervision of both the issuing credit institution and the cover pool, and compliance with the requirements of Article 52(4) of the UCITS Directive. This initiative was also concludedduring2012,andthefirstcoveredbondthatcompliedwiththelabelwasintroducedinJanuary 2013.31 The ECB acts as an observer in advisory groups for the PCS initiative and for the Covered Bond label, in the same way as it acts as an observer in the STEP Market Committee.
A well-functioning securitisation market supported by standardisation and enhanced transparency, by ensuring investor access to comprehensive and standardised information across the European securitisationmarkets,will contribute to thecompletenessof theEuropeanfinancial systemandfoster integration through the improved comparability of instruments across borders.
29 Formore details, see Schmiedel, H., Kostova, G. and Ruttenberg,W., “The social and private costs of retail payment instruments: aEuropeanperspective”,Occasional Paper Series, No 137, ECB, September 2012.
30 See www.pcsmarket.org31 More information can be found at www.coveredbondlabel.com

125ECB
Annual Report2012
adviCe on the leGiSlative and reGulatory FrameworK For the FinanCial SyStem and direCt rule-maKinGTo enhance financial integration, the ECB and the Eurosystem, in linewith their advisory andregulatory functions, monitor and actively contribute to the development of the EU regulatory framework. Apart from these activities, as covered in other sections of this report,32 the following ECBactivitiescontributedtoincreasingfinancialintegrationthroughregulatoryinitiatives.
The ECB participates in the UNIDROIT Study Group, which was set up following an endorsement by the General Assembly of UNIDROIT on 1 December 2010 to establish draft principles regarding the enforceability of close-out netting provisions.33 The ECB supports the objectives set for the Study Group, which relate to reducing the fragmentation of the various national netting regimes andenhancingtheeffectivenessofclose-outnettingininternationalfinancialmarkets.TheStudyGroup will work towards establishing principles guiding the consistency and cross-recognition of the national netting regimes.
At the EU level, the ECB participates in the Securities Law Directive Member States Working Group, which is preparing the groundwork for the future harmonisation of the EU securities law and hence for improving the EU’s current fragmented legal framework for holding intermediated securities. The ECB contributed to the earlier public consultations 34 by the European Commission in 2009 and 2011 and continues to provide substantive expert input, in particular into the Commission’s proposals related to collateral management (e.g. on the regulation of collateral reuse).
Furthermore, the ECB contributes to the work of the European Post Trade Group, a joint initiative of the European Commission, the ECB, the European Securities and Markets Authority and the Association for Financial Markets in Europe. The group is mandated to contribute to the development ofanefficient,safeandsoundpost-trademarketintheEUand,assuch,itbuildsontheworkcarriedout in previous initiatives, i.e. by the Expert Group on Market Infrastructures and the Clearing and Settlement Advisory and Monitoring Expert Group II. However, the scope of the present work is limited to areas of financial harmonisation which are currently not covered by other existingregulatory initiatives. This work is therefore complementary to the current regulatory initiatives of the Commission and to the implementation of the TARGET2-Securities (T2S) programme by the ECB.
providinG Central banKinG ServiCeS whiCh FoSter FinanCial inteGrationTARGET2, the second generation of the Eurosystem’s large-value payment system, is the firstmarket infrastructure which is completely integrated and harmonised at the European level. The Eurosystem has continued to make enhancements to TARGET2 in collaboration with the banking industry (see Section 2.1 of Chapter 2).
T2S–thefutureEurosystemserviceforsecuritiessettlement–willhaveanimportantimpactontheharmonisation and integration of the post-trading environment in Europe. T2S will automatically removemany of the “GiovanniniBarriers” 35 to cross-border clearing and settlement by, among
32 See in particular Section 3 of this chapter and Section 6.2 of Chapter 2. 33 See “Study LXXVIII C - Principles and rules on the netting of financial instruments” available on the UNIDROIT website
(www.unidroit.org).34 Seethefirstandsecondconsultationdocumentsentitled“Legislationonlegalcertaintyofsecuritiesholdinganddispositions”of16April
2009 and 5 November 2010, respectively, available on the Commission’s website (http://ec.europa.eu).35 These barriers are technical or market-practice barriers, legal barriers or barriers related to tax procedures (more information can be found
ontheofficialwebsiteoftheEuropeanUnion(http://europa.eu)).
126ECBAnnual Report2012
other things: (i) providing a single IT platform with a common interface and a single messaging protocol; (ii) introducing a harmonised timetable for all connected markets; and (iii) extending a single harmonised settlement model comprising delivery versus payment in central bank money to all national and cross-border transactions. Nevertheless, even with a single technical platform, therearestillsignificantbarrierstocross-bordersettlement,whichmustberemovedinorderforfinancialmarketstoreapthefullbenefitsofT2S.Inordertomakefurtherprogress,aHarmonisationSteering Group (HSG), composed of senior representatives from the industry and from the public sector, was established in 2011. The group’s main task is to foster the T2S post-trade harmonisation agenda, as well as to identify where markets that will use T2S are lagging behind the rest of Europe in the implementation of commonly agreed harmonisation standards. The group regularly publishes harmonisation progress reports (the third report will be published in March 2013) and constantly monitors the progress made by markets that will be connected to T2S. These reports are presented to the T2S Advisory Group and shared with the T2S Board and the ECB’s Governing Council. The HSG is therefore at the core of the T2S harmonisation agenda, giving a major boost to T2S and the broader post-trade harmonisation work in Europe, in cooperation with the European Commission and other relevant actors (see Section 2.2 of Chapter 2).
Finally, in the area of collateral management, the correspondent central banking model (CCBM) has fostered financial integration since its implementation in 1999, by enabling all euro areacounterparties to use on a cross-border basis eligible assets as collateral in Eurosystem credit operations, regardless of the country in which the asset has been issued. The Eurosystem is currently incorporating enhancements to the CCBM, to be implemented in 2014 (see Section 2.3 of Chapter 2).
5 overSiGht oF payment SyStemS and marKet inFraStruCtureS
Through its oversight function, the Eurosystem aims to ensure the safety and efficiency ofpayment and securities clearing and settlement systems processing the euro, as well as of payment instruments, major service providers and other critical infrastructures, by monitoring and assessing them against applicable oversight standards and, where necessary, inducing change.36
TheEurosystemhastranslateditsoversightobjectivesintospecificstandardsandrequirementsthatfinancialmarket infrastructuresshouldmeet.Thesestandardsandrequirementsarelargelybasedon internationally accepted oversight standards. On 16 April 2012 the Committee on Payment and Settlement Systems (CPSS) and the Technical Committee of the International Organization of Securities Commissions (IOSCO) published the CPSS-IOSCO Principles for Financial Market Infrastructures (PFMIs).ThePFMIsarenew international standards forfinancialmarketinfrastructures, including systemically important payment systems, central securities depositories (CSDs), securities settlement systems, central counterparties (CCPs) and trade repositories. The PFMIs replace the previous CPSS Core Principles for Systemically Important Payment Systems (CPSIPS) and CPSS-IOSCO Recommendations for Securities Settlement Systems and CentralCounterparties.Theyaredesignedtomakefinancialmarketinfrastructuresmoreresilienttofinancialcrisesand,inparticular,defaultsbysystemparticipants.InDecember2012theCPSSandIOSCO published a disclosure framework and assessment methodology for PFMIs. The Eurosystem
36 DetailedinformationontheEurosystem’soversightfunctionandactivitiesisalsoprovidedbytheECBonitswebsiteandthroughspecificEurosystem oversight reports, including the Eurosystem oversight policy framework published in July 2011 (available on the ECB’s website).

127ECB
Annual Report2012
considers a timely and consistent implementation of the new principles by major economies to be importantinordertostrengthenglobalfinancialstability,enhancefinancialmarketinfrastructures’ability to manage various risks and avoid the risk of regulatory arbitrage.
In April 2012 the ECB published the Eurosystem Oversight Report 2011, which provides information on the Eurosystem’s oversight policies and main oversight activities.
5.1 larGe-value payment SyStemS and inFraStruCture ServiCe providerS
Large-value payment systems form the backbone of the euro area market infrastructure and play an important role for thestabilityandefficiencyof thefinancialsectorand theoveralleconomy.TheEurosystemapplies awell-definedoversightpolicy framework toall large-valuepayment systemsthatsettleeuro-denominatedtransactions–bothitsownsystemandthosethatareprivatelyoperated.This framework is based on the CPSIPS and the business continuity oversight expectations (BCOE) for systemically important payment systems, which were adopted by the Governing Council in 2006.
tarGet2 The oversight of TARGET2 is led and coordinated by the ECB, in close cooperation with the participating NCBs. In 2012 the Eurosystem’s oversight of TARGET2 focused on operational risk issues.Thisincludedthefollow-uptosomefindingsfromtheassessmentofTARGET2againsttheCPSIPS and the BCOE, as well as the analysis of TARGET2 incidents.
The Eurosystem also conducted an analysis of TARGET2 interdependencies, including system-based, institution-based and environmental interdependencies (including those which could arise from the connection with TARGET2-Securities), with the objective of increasing the overseer’s and operator’s awareness of risks stemming from such interdependencies. The need to address risksstemmingfrominterdependenciesisrecognisedbythePFMIs.Operatorsoffinancialmarketinfrastructures should regularly review the material risks they bear from and pose to other entities as a result of interdependencies and develop appropriate risk management tools to address these risks. The analysis of TARGET2 interdependencies focuses on the risks other entities pose to TARGET2andwillcontributetotheidentificationofentitieswhicharecriticalforTARGET2’snormalperformance,theassessmentofrelatedrisks,aswellastheassessmentoftheefficiencyofrisk management measures used by the operator.
Furthermore, the Eurosystem continued the analytical work initiated in 2011 with the support of the TARGET2 Simulator, using transaction-level data. This comprised scenario-based failure analysis as well asstudiesonintradaypatternsandtimingofpaymentflowsandonthenetworktopologyofTARGET2.Another workstream aims to identify money market loans within payments data, which should support furtheranalyticalworkinthefieldsofpaymentssimulation,monetarypolicyandfinancialstability.
euro1 EURO1 is a large-value payment system for transactions in euro between banks operating in the EU. It is operated by EBA CLEARING. EURO1 works on a multilateral net basis, while the end-of-day positions of EURO1 participants are ultimately settled in central bank money via the TARGET2 system, with the ECB acting as the settlement agent.

128ECBAnnual Report2012
The ECB is entrusted with primary oversight responsibility for EURO1, acting in close cooperation with all euro area NCBs. In 2012 EBA CLEARING reduced the mandatory limit to be granted by each participant to each other participant from €2 million to €1 million, with effect from 2 July 2012. EBA CLEARING adopted this change with the objective of improving credit risk control within EURO1. This reduction follows a previous mandatory limit change, from €5 million to €2 million, in October 2011. In light of the systemic relevance of EURO1 in the euro area payment landscape, the Eurosystem assessed the impact that the envisaged change might have on EURO1’s compliance with the currently applicable oversight standards, namely the CPSIPS, and concluded that it wouldnotadverselyaffectthelegalstructureandriskprofileofEURO1.TheECBisalsocloselymonitoring the implementation of the recommendations that were made to the system operator following the comprehensive assessment of EURO1 against the CPSIPS in 2011. Concerning its operational performance, EURO1 operated smoothly throughout 2012 and no incidents occurred.
ContinuouS linKed Settlement SyStem The Continuous Linked Settlement system (CLS) was launched in 2002 and is operated by CLS BankInternational(CLSBank).Thesystemprovidesamulti-currencyserviceforthesynchronous–i.e.paymentversuspayment(PvP)–settlementofpaymentinstructionsrelatingtoforeignexchangetransactions. Through its PvP mechanism, CLS virtually eliminates the principal risk associated with the settlement of foreign exchange transactions. CLS currently settles in 17 of the world’s most traded currencies, including the euro. Given that CLS Bank is established in the United States, the Federal Reserve System accepts primary oversight responsibility for CLS under a cooperative oversight arrangement involving the G10 central banks and the central banks of issue of currencies settled by CLS. In 2012 CLS Bank was designated in the United States as a systemically important financialmarketutilityundertheDodd-FrankAct.Theexistingcooperativeoversightarrangementcontinues to apply. The ECB, in close cooperation with the euro area NCBs, is part of this cooperative oversight arrangement and has primary oversight responsibility for settlement in euro by CLS.
In 2012 the ECB’s oversight activities with respect to CLS covered the implementation of CLS governance reform, changes in the CLS Board and the senior management team, the progress achieved with strategic initiatives and the review of the CLS risk management framework.
SwiFt SWIFTisimportantfromafinancialstabilityperspective,asitprovidessecuremessagingservicesto the financial community in more than 210 countries around the world. SWIFT is a limitedliability cooperative company which is established in Belgium. The central banks of the G10 have established a cooperative oversight arrangement for SWIFT. The ECB and some other euro area NCBs contribute to various oversight activities carried out by the cooperative oversight group, with the Nationale Bank van België/Banque Nationale de Belgique being the lead overseer.
InrecognitionofglobaleconomicchangesandtheincreaseduseofSWIFTservicesbyfinancialinstitutions in various countries, a SWIFT Oversight Forum was set up in order to expand to a larger group of central banks information-sharing and dialogue in relation to SWIFT oversight. The inaugural meeting of the SWIFT Oversight Forum was held in Brussels on 4 May 2012.
The SWIFT cooperative oversight activities are conducted in the framework of a yearly SWIFT oversight plan, which is prepared using a risk-based oversight planning approach. The SWIFT oversight framework is provided by the High Level Expectations for the oversight of SWIFT 37. It
37 These High Level Expectations can be found on the website of the Nationale Bank van België/Banque Nationale de Belgique (www.nbb.be).

129ECB
Annual Report2012
focusesonthoseSWIFTserviceswithapotentialimpactonsystemicriskfortheglobalfinancialinfrastructure. In 2012 the oversight activities continued to be focused on the implementation of the Distributed Architecture programme, mainly through the construction of an additional operations centre in Europe. Another SWIFT project being closely monitored by the overseers is the renewal of the FIN software, which aims to mitigate technology risk and reduce costs, while ensuring strategic alignment of IT platforms. Other important activities in 2012 included the review of the operational performance and availability of SWIFT’s services and the monitoring of new projects thatcouldpotentiallyhaveanimpactontheconfidentiality,integrityandavailabilityofSWIFT’scritical services. The level of availability of the FIN service in 2012 was 99.992%.
5.2 retail payment SyStemS and payment inStrumentS
The Eurosystem also has oversight responsibility for retail payment systems and payment instruments. The 2003 oversight standards for retail payment systems, which draw on the CPSIPS, are currently being reviewed to take into account the implementation of the PFMIs and also to reflecttheincreasedintegrationofretailpaymentsystemsowingtotheharmonisationoftechnicalstandards and procedures resulting from the Single Euro Payments Area (SEPA) project. SEPA gives incentives to an increasing number of retail payment systems to either establish cross-border links with other such systems or to offer services in more than one country. Therefore, the revised oversightframeworkwillincludeanewclassificationforeuroretailpaymentsystems,reflectingtheimportanceofasystemfromaEuropeanperspective,astheoldclassificationthathadanationalfocusis no longer appropriate. The revised framework will also incorporate the oversight expectations for links between retail payment systems, adopted by the Governing Council in November 2012.
With respect to retail payment systems, the ECB is the lead overseer of the STEP2 system, which is a pan-European automated clearing house for retail payments in euro and is managed and operated by EBA CLEARING. STEP2 offers the processing of different kinds of retail payments, such as SEPA credit transfers andSEPAdirect debits aswell as “national” transactionswithin Italy,which areprocessed according to domestic technical standards and limited to the national banking community. Moreover,itoffersasettlementservicespecificallydesignedforIrishbanks.In2012thereweretwoimportant changes in the services of STEP2 that were subject to an oversight assessment by the ECB. In February STEP2 introduced three additional settlement cycles per day in its STEP2 SCT service, in which SEPA credit transfers are processed. In April a batch processing option, which allows banks to exchange batches of credit transfers, was introduced in the same service. Neither of these changes affected the continued full compliance of STEP2 with the applicable oversight standards.
Concerning payment instruments, in 2012 the focus of Eurosystem oversight remained on payment cards. The Eurosystem made further progress on the oversight assessments of international card payment schemes active in the euro area. Moreover, the ECB published on 25 July the firstEurosystem report on card fraud within SEPA. It reveals that although the overall levels of fraud decreased, fraud using remote payments, mainly over the internet, increased.
The European Forum on the Security of Retail Payments, a voluntary cooperative initiative in particular between central bank overseers and supervisors of payment service providers established in 2011, developed recommendations on the security of internet payments made using payment cards,credit transfers,directdebitelectronicmandateande-money.The“Recommendations forthe security of internet payments” prepared by theForumwere released for public consultationby the ECB in April 2012 and finalised in January 2013. These recommendations should be

130ECBAnnual Report2012
implemented by all payment service providers and governance authorities of payment schemes by 1 February 2015.38 Furthermore, in 2012 the Forum initiated work on security recommendations on third-party access to payment accounts and on mobile payments.
5.3 SeCuritieS and derivativeS ClearinG and Settlement
The Eurosystem has a strong interest in the smooth functioning of securities clearing and settlement systems because failures in the clearing, settlement and custody of securities could jeopardise the implementation of monetary policy, the smooth functioning of payment systems and the maintenance offinancialstability.
Central CounterpartieS and trade repoSitorieSOn 4 July 2012 the European Parliament and the European Council adopted Regulation (EU) No 648/2012 on OTC derivatives, central counterparties and trade repositories, also known as the EuropeanMarketInfrastructureRegulation(EMIR).EMIRwaspublishedin theOfficialJournalof the European Union on 27 July 2012 and entered into force in August 2012. It introduced a common EU framework for the authorisation and supervision of CCPs and trade repositories and for the mandatory central clearing and reporting of over-the-counter (OTC) derivatives in line with the G20 commitment 39.
MostregulatoryandimplementingtechnicalstandardsunderEMIRwerepublishedintheOfficialJournal of the European Union on 23 February 2013 and entered into force 20 days thereafter, while the technical standard relating to CCP colleges will be adopted at a later stage.
The ECB considers the adoption of EMIR and the work of the European Securities and Markets Authority (ESMA) on the technical standards a major achievement in terms of ensuring the effective implementation of the global commitment to OTC derivatives market reform and welcomes the significanteffortsthathavebeenmadetoaligntherequirementsforCCPsandtraderepositorieswiththe PFMIs in order to ensure consistency and pre-empt potential regulatory arbitrage. In addition, theECBwelcomesthefact thatcooperationamongauthoritieswillbesignificantlystrengthenedfor CCPs, notably through the involvement in CCP colleges of the central banks of issue of the most important currencieswith respect to financial instruments cleared by a givenCCP and ofcentral bank overseers. The ECB expects that appropriate cooperation between supervisors and central banks will also be established with respect to trade repositories and that existing cooperative oversight arrangements, such as those in place for the DTCC Derivatives Repository Limited in the United Kingdom, will be continued once ESMA takes over supervisory responsibilities.
Central SeCuritieS depoSitorieSOn 7 March 2012 the European Commission issued a proposal for a regulation on improving securities settlement in the European Union and on central securities depositories. This regulation will establish a common EU framework for the authorisation and supervision of CSDs.
The ECB strongly supports the Commission’s proposal to strengthen the legal framework applicable to CSDs, also in the context of the future TARGET2-Securities environment. In its
38 Nationalauthoritiesmaywishtodefineashortertransitionperiodwhereappropriate.39 TheG20 decided at its 2009 Pittsburgh summit that: “All standardisedOTC derivative contracts should be traded on exchanges or
electronic trading platforms, where appropriate, and cleared through central counterparties by end-2012 at the latest. OTC derivative contractsshouldbereportedtotraderepositories.Non-centrallyclearedcontractsshouldbesubjecttohighercapitalrequirements.”

131ECB
Annual Report2012
opinion of 1 August 2012 the ECB expressed some concerns that the proposed regulation would not sufficiently reflect the statutory competence of themembers of the ESCB as overseers andcentral banks of issue. While the proposal recognises the need for cooperation with the ESCB in thedefinitionof technical standards forCSDs, in linewith internationalprinciples, there shouldbe comprehensive cooperation regarding decisions to grant or withdraw authorisations of CSDs as well as in the ongoing risk assessment of CSDs. In addition, there should be close alignment with existing requirements developed by the CPSS-IOSCO, in particular the PFMIs, in order to ensure global consistency and avoid putting EU CSDs at a competitive disadvantage.
tarGet2-SeCuritieS TARGET2-Securities (T2S) is an infrastructure project that aims to provide European CSDs with a single, pan-European platform for securities settlement in central bank money.
AsconfirmedintheEurosystemoversightpolicyframeworkpublishedinJuly2011,theEurosystemwill oversee T2S services and cooperate with participating CSDs’ competent supervisors and overseers, as well as with central banks of issue for eligible non-euro currencies, in order to share with them comprehensive T2S-related information so that they can perform their statutory duties under their respective legal framework.
The Eurosystem oversight framework for T2S, as well as the cooperative arrangement with other authorities,arecurrentlyunderpreparationandexpectedtobefinalisedinthecourseof2013.Thisframework is being developed in accordance with the new PFMIs published in April 2012. The Eurosystem will thus assume the oversight function and the other authorities with competence for CSDs using T2S will be involved via the T2S cooperative arrangement.
Before T2S goes live, the Eurosystem will also carry out the oversight monitoring of the T2S development and testing phase, as a follow-up to the pre-assessment of the T2S design conducted in 2011.

In the summer of 2012 work started in the market hall on the construction of the steel structure for the conference area. Thiswill function as a separate building integrated into the spacious hall according to the “house-in-house” principle.Thefirstpanelsoftheinteriorfacadeoftheconferenceareahavealreadybeeninstalled.Workhasalsoprogressedontheconstruction of the steel structure for the entrance building, which will connect the Grossmarkthalle with the high-rise and house the press centre.

133ECB
Annual Report2012
Chapter 4
european iSSueS
1 poliCy and inStitutional iSSueSAs Europe had to step up its response to the ongoing economic and financial crisis, 2012wasanother year of intense cooperation among EU institutions and bodies, in particular the European Council, the ECOFIN Council, the Eurogroup, the European Commission, the European Parliament and the ECB.
The President of the ECB participated regularly in Eurogroup and ECOFIN Council meetings when matters relating to the objectives and tasks of the ESCB were discussed. Moreover, the President of the ECB was invited to take part in European Council meetings, when issues related totheEU’spolicyresponsetotheeconomicandfinancialcrisiswereaddressed,aswellasinthe Euro summit meetings. The President of the Eurogroup and the Commissioner for Economic and Monetary Affairs participated in meetings of the Governing Council of the ECB, when considered appropriate.
towardS a Genuine eConomiC and monetary unionThe EU Heads of State or Government asked the President of the European Council, in close cooperation with the Presidents of the European Commission, the Eurogroup and the ECB, to develop a vision for completing EMU. Reports were submitted to the European Council in June, October and December 2012. Moreover, in November 2012, the European Commission presented its blueprint for a deep and genuine EMU.
These reports outlined proposals for a genuine EMU around four building blocks: (i) an integrated financial framework, (ii) an integratedbudgetary framework, (iii) an integratedeconomicpolicyframework, and (iv) democratic legitimacy and accountability.
(i) integrated financial frameworkThe crisis has led to an increasing fragmentationoffinancialmarkets alongnational lines,withcorrespondingimplicationsforcreditconditions.Afinancialmarketunionisneededtoovercomethis fragmentation and to break the interdependency between banks and their sovereigns, which can lead to vicious downward spirals.
In June 2012 the euro area Heads of State or Government made a political commitment to establish a single supervisory mechanism (SSM) for the euro area involving the ECB. In September 2012 the Commission issued a draft Council regulation on the SSM, proposing to give theECBultimateresponsibilityforspecificsupervisorytasksunderArticle127(6)oftheTreaty.On 12 December 2012 the ECOFIN Council adopted a position on several key features related to the set-up and functioning of the SSM.1
(ii) integrated budgetary frameworkThe crisis has illustrated how closely euro area countries are interlinked, and how important it is for MemberStatestosubjecttheirfiscalpoliciestotightercoordinationandsurveillance.Anintegratedbudgetary framework can be instrumental in ensuring that fiscal and economic policies followstability objectives.
1 See also Chapter 3.

134ECBAnnual Report2012
(iii) integrated economic policy frameworkThe crisis has also shown the importance of competitiveness in a monetary union. While respecting Member States’ policy preferences, national commitments to implement structural reforms (e.g. liberalising their product, services and labour markets) should become more binding.
(iv) democratic legitimacy and accountabilityThe reinforcement of the EU’s role in financial, budgetary and economic policies must beaccompanied by stronger democratic accountability. The interim report highlights that the European Parliament, as the body of representatives directly elected by citizens, should be primarily responsible for stronger accountability. Moreover, there could be closer cooperation between the EuropeanParliamentandnationalparliaments,asalreadyenvisagedunderthefiscalcompact.
Thefinalreportbythefourpresidentsproposesathree-stageapproachtowardsagenuineEMU,with thefirst stage (fromend-2012 to2013) comprising steps to ensurefiscal sustainability andbreak the link between banks and sovereigns, the second stage (2013-14) focusing on the completion oftheintegratedfinancialframeworkandpromotingsoundstructuralpolicies,andthethirdstage(post-2014) aiming at improving the resilience of EMU through the creation of a shock-absorption function at the central level.
At its meeting on 14 December 2012, the European Council agreed that it is imperative to break the vicious circle between banks and sovereigns and that moving towards the SSM will also require a single resolution mechanism. The Heads of State or Government asked the President of the European Council, in close cooperation with the President of the European Commission, after a process of consultations with the Member States, to present to the June 2013 European Council possible measures and a time-bound roadmap for the coordination of national reforms, the social dimension of EMU, the feasibility and modalities of mutually agreed contracts for competitiveness and growth, and solidarity mechanisms that can enhance the efforts made by Member States that enter into such contracts. Moreover, any new steps towards strengthening economic governance will need to be accompanied by further steps towards stronger legitimacy and accountability.
TheEurosystemwelcomestheprogressmadeinrecentmonthsontheestablishmentofafinancialmarket union.2 At the same time, given the interdependencies in EMU, it is important to work in parallel on all four building blocks.
eStabliShment oF a permanent Stability meChaniSm For the euro areaFollowing the European Council agreement of March 2011 to establish a permanent crisis management mechanism for the euro area, the Treaty establishing the European Stability Mechanism (ESM) entered into force on 27 September 2012. The ESM was inaugurated on8October2012followingratificationbyall17euroareacountries.Inaddition,theamendmentof the Treaty on the Functioning of the European Union introducing a new Article 136(3) was adopted by the European Council on 25 March 2011 and is scheduled to enter into force in 2013. As reflected in the preamble to the ESM Treaty, access to ESM financial assistance will beconditional,asof1March2013,onMemberStateshavingratifiedthefiscalcompact(seebelow).
On30March2012theEurogroupagreedonthreemeasurestobolstertheESM’sfinancialcapacity:(i)toacceleratethepaying-inoftheESM’scapitalfromfivetothreeyears,withtwotranchesof€16billiontobepaidinin2012,twoin2013,andthefinalonein2014;(ii)toraisetheoverall
2 See also Chapter 3.

135ECB
Annual Report2012
ceiling for combined lending by the ESM and the European Financial Stability Facility (EFSF) from €500billionto€700billion;and(iii)tousetheESMasthemaininstrumenttofinanceprogrammesfollowing its entry into force, with the EFSF’s unused capacity remaining available until July 2013 toensuretherobustnessoftheeuroareafirewalls.
On 29 June 2012 the Heads of State or Government of the euro area took two further decisions related to the ESM. First, they decided that the bank recapitalisation facility provided by the EFSF to Spain would be transferred to the ESM on its entry into force, without the ESM gaining preferred creditor status. Second, they decided that the ESM could, following a regular decision, have the possibility to recapitalise banks directly when an effective single supervisory mechanism involving the ECB was established for banks in the euro area.
StrenGthened eConomiC GovernanCe in the euAspartofthecontinuedeffortstorespondtotheeconomicandfinancialcrisis,furtherreformstostrengthen the EU’s economic governance were adopted in 2012.
The Treaty on Stability, Coordination and Governance in the Economic and Monetary Union (TSCG) was signed by 25 of the 27 EU Member States in March 2012 and entered into force on1January2013.AspartofthisnewTreaty,afiscalcompactenvisagesthemandatoryintroductionof a balanced budget rule and an automatically triggered correction mechanism at the national level. Moreover,thefiscalcompactstrengthenstheautomaticityoftheexcessivedeficitprocedurewithintheStabilityandGrowthPact in theeventofaeuroareacountrybreaching thedeficitcriterion.In addition, the TSCG includes provisions to enhance the coordination of economic policies and the governance of the euro area. The TSCG also provides for strengthened cooperation between the European Parliament and national parliaments of the signatory countries on questions related to their budgetary policies and other issues covered by this Treaty. The agreement on the TSCG, andinparticularthefiscalcompact,constitutesawelcomesteptowardsastrongerrule-basedfiscalgovernance framework. If strictly implemented and rigorously enforced, it should help to prevent unsustainablefiscalpoliciesatthenationallevel.
To further strengthen budgetary and economic surveillance in the euro area, the European CommissionproposedtwoadditionalregulationsinNovember2011(the“two-pack”),whichareinthefinalstageofthelegislativeprocess.3 One of the regulations contains common provisions for monitoring and assessing draft budgetary plans and for intensifying the monitoring of euro area countriessubjecttoanexcessivedeficitprocedure.Theotherregulationaimstoenhanceeconomicandbudgetarysurveillanceofvulnerableeuroareacountriesfacingfinancialtensionsorreceivingfinancialassistance.
Overall, the two regulations are a welcome initiative to further reinforce the economic governance framework in the euro area. Nonetheless, the ECB called for a number of provisions to be more ambitious (see Section 6.2 of Chapter 2).
the european SemeSter and the europe 2020 StrateGy In November 2011 the Commission presented its 2012 Annual Growth Survey, which reviews progress towards Europe 2020 targets and sets out the key measures for recovery and growth for the EU as a whole. The 2012 survey stressed the need for Member States to (i) pursue differentiated,
3 The ECB provided its assessment of the European Commission proposals in its opinion on strengthened economic governance of the euro area (CON/2012/18) of 7 March 2012 (see Section 6.2 of Chapter 2 for a detailed discussion).

136ECBAnnual Report2012
growth-friendly fiscal consolidation, (ii) restore normal lending to the economy, (iii) promotegrowth and competitiveness, (iv) tackle unemployment and the social consequences of the crisis, and (v) modernise public administration. The Annual Growth Survey for 2013, presented by the European Commission on 28 November 2012, reiterates these priorities.
AtitsmeetinginMarch2012theEuropeanCouncilendorsedtheabovefiveprioritiesfor2012,which Member States incorporated into their stability or convergence programmes and national reform programmes. Following a review of these programmes, including the implementation of the voluntary commitments under the Euro Plus Pact, the ECOFIN Council issued policy recommendations to each Member State in July 2012, ahead of the adoption of national budgets and other economic reforms which takes place in the second half of the year.
The2012EuropeanSemestersawthefirstroundofimplementationofthe“six-pack”,apackageofsixlegislativeproposals,applicabletoallMemberStateswithspecificrulesforeuroareacountries(especiallyregardingfinancialsanctions),whichenteredintoforceinDecember2011.Thesix-packstrengthens both the preventive and corrective arms of the Stability and Growth Pact. It establishes new minimum requirements for national budgetary frameworks, a new macroeconomic imbalance procedure,andastrongerenforcementmechanismthroughnewfinancialsanctions,underboththeStability and Growth Pact and the macroeconomic imbalance procedure.
In the context of themacroeconomic imbalance procedure –which aims to prevent and correctmacroeconomic imbalances – the European Commission published the first Alert MechanismReport in February 2012. On the basis of ten macroeconomic indicators and economic analysis, the reportidentified12MemberStateswhosemacroeconomicsituationwasscrutinisedmoreclosely.In May 2012 the Commission published 12 in-depth reviews examining the origin, nature and severity of possible macroeconomic imbalances in the countries concerned.
In the ECB’s opinion, the 2012 European Semester had mixed results. The new provisions introduced bythesix-packpreventedawatering-downofcountry-specificrecommendationsgiventoMemberStates. At the same time, effectiveness and credibility remain subject to a strict implementation of surveillance.Moreover, there is still aneed tomorefinelydifferentiate surveillance tomatchthe severity of the challenges. Peer pressure needs to be reinforced, especially for those euro area countries which have the potential to destabilise EMU as a whole through the accumulation of large imbalances. Importantly, the macroeconomic imbalance procedure should be applied decisively, preferably by further increasing the automaticity of the procedure, in order to strengthen the effectiveness and credibility of the new framework.
the Stability and Growth paCtIn2012themajorityofEUMemberStatesweresubject toexcessivedeficitprocedures(EDPs),with the notable exceptions of Bulgaria, Germany, Estonia, Luxembourg, Finland and Sweden. For Germany, the EDP was abrogated by the ECOFIN Council decision of 5 June 2012, well ahead of the2013deadline,afterEurostatdata revealed that thecountry’sdeficit in2011haddroppedbelow 3% of GDP. For Bulgaria, the ECOFIN Council decided on 22 June 2012 to abrogate the EDP. In the case of Malta, which had a deadline for 2011, the EDP was abrogated on 4 December 2012 on thebasisofnotifieddataandtheCommission’sautumn2012economicforecast,whichpointedtoafiscaldeficitof2.6%ofGDPin2012.
ForHungary, itwas found that thefiscaleffortwas insufficient tokeep thedeficitbelow3%ofGDP in a sustainable manner. In line with the strengthened Stability and Growth Pact procedures,

137ECB
Annual Report2012
the ECOFIN Council decided on 13 March 2012 to suspend part of Hungary’s Cohesion Fund appropriations for 2013 unless the Hungarian authorities took corrective action. However, this sanction was lifted on 22 June 2012, after the Council decided that Hungary had in the meantime takeneffectiveactiontowardscorrectingtheexcessivedeficitinadurablemannerbytheextendedEDP deadline of 2012. For Spain, as the economy re-entered a recession, the EDP deadline was extended to 2014, after the ECOFIN Council decided on 10 July 2012 that Spain had taken effective action in line with its initial recommendation. For Portugal, the ECOFIN Council decided on 9 October 2012 to extend the deadline to 2014, against the background of a considerably worsened macroeconomic situation. The deadline for Belgium, Italy, Cyprus, Latvia, Lithuania, RomaniaandPoland tobring thegeneralgovernmentdeficitbelow the3%thresholdwas2012,while for the remaining countries under EDPs, including those subject to an EU-IMF programme, it is 2013 and beyond.
The ECB welcomes the consolidation efforts being undertaken by euro area countries, which are crucialtoreturntosoundfiscalpositions.However,despitecontinuedfiscaladjustment,anumberofMemberStateshavehaddifficulty inmeetingdeadlinesunder theEDPs.Moreover,forsomeeuro area countries subject to EDPs, the structural adjustment in 2012 was smaller than required. Inviewoftheriskstoatimelyandsustainablecorrectionoftheexcessivedeficits,theECBurgesstrict implementation of the strengthened Stability and Growth Pact procedures.
ConverGenCe reportSIn line with Article 140 of the Treaty, the ECB and the European Commission prepared convergence reports on the progress made by Bulgaria, the Czech Republic, Latvia, Lithuania, Hungary, Poland, Romania and Sweden in meeting the conditions to join the euro area. These reports, which were published on 30 May 2012, examined whether a high degree of sustainable convergence (economic convergence) had been achieved in these countries and gauged compliance with the relevant statutory requirements for NCBs (legal convergence). When assessing the sustainability of convergence, the reports took due account of both the EU’s new enhanced economic governance framework and the strength of the institutional environment in each country in various areas including statistics.
2 developmentS in and relationS with eu aCCedinG and Candidate CountrieS
Further progress was made in the EU enlargement agenda over 2012. Following the closure of theaccessionnegotiationswithCroatiain2011,theAccessionTreatyisbeingratifiedbyallEUMember States, with accession scheduled for 1 July 2013. Accession negotiations have been open with Turkey since October 2005 and continued with Iceland (opened in July 2010). In addition, on 29 June 2012 the European Council endorsed the decision of the General Affairs Council, taken on 26 June 2012, to open accession negotiations with Montenegro, as the European Commission considered that it sufficientlymet thepoliticalcriteria formembershipof theEUandhadmadefurther progress towards a functioning market economy. Serbia was granted candidate country status in March 2012, but the Commission has not yet proposed the opening of negotiations. For the remaining candidate countries, the Commission reiterated its recommendation to open accession negotiations with the former Yugoslav Republic of Macedonia, a candidate country since 2005, but no date has yet been set.

138ECBAnnual Report2012
As regards ECB relations with EU acceding and candidate countries, members of Hrvatska narodna banka (the Croatian central bank) have been invited to attend, as observers, the meetings of the General Council of the ECB and of the ESCB committees, as preparation for the country’s EU accession. The ECB continued its policy dialogue with the central banks of the EU candidate countries in 2012 through bilateral meetings and within the overall institutional framework for the enlargement process set up by the EU. The ECB organised an annual high-level policy dialogue with the Central Bank of the Republic of Turkey in July 2012 in Frankfurt and also held high-level meetings with the Central Bank of Iceland in August 2012 in Reykjavik. Moreover, close relations with the central banks of candidate countries, as well as those of other countries, have been maintained through technical cooperation programmes (see Section 2 of Chapter 5).


The double office tower reached a height of 175 m in July 2012. On the eastern side of the high-rise, work on theconstruction of the framework for the glazing of the atrium is under way.

141ECB
Annual Report2012
Chapter 5
international iSSueS
1 Key developmentS in the international monetary and FinanCial SyStem
SurveillanCe oF maCroeConomiC poliCieS in the Global eConomyGiven the high degree of global economic and financial integration, a good understanding ofthe international environment through monitoring and analysis is essential to policy-making in the euro area. The ECB also plays an important role in the process of international multilateral surveillanceofmacroeconomicpoliciesandfinancialstability,whichatthecentralbankinglevelismainly coordinated by the BIS. Moreover, the ECB participates in working groups and meetings of international organisations such as the IMF and the OECD, as well as fora such as the G20 and G7 financeministersandcentralbankgovernors.
The international economic environment in 2012 was characterised by a weak economic recovery, with growth declining to 1.3% for advanced economies (against 1.6% in 2011) and to 5.3% for emerging and developing economies (against 6.2% in 2011), according to the IMF. The slowdown in global trade and economic activity continued to be accompanied by a narrowing in global imbalances,mostlyreflectingweakerdomesticdemandfromexternal-deficiteconomiesand,toamuch lesser extent, internal rebalancing in external-surplus economies, where adjustment through changes in relative prices remained limited. An environment of high oil prices also contributed to buttressing the external surpluses of oil-exporting countries. As in recent years, the euro area’s current account was broadly balanced in 2012. The ECB continued to stress the risks and distortions that would ensue if global imbalances were to remain at unsustainable levels and to express support for a rebalancing of global demand patterns. In terms of structural factors that would help in substantially reducing global imbalances, countries with external deficits should reducefiscal deficits, complete the structural reform agenda and increase domestic savings.Economieswith external surpluses could also contribute substantially by increasing domestic consumption, developingmoreextensivesocialsafetynets,undertakingfinancialmarketreformsandincreasingexchangerateflexibility.
The ECB continued to play an active role in the G20 and its various workstreams. Under the Mexican presidency these workstreams focused on (i) improving the foundations for strong, sustainableandbalancedgrowth;(ii)advancingtheglobalfinancialregulatoryagendaandmakingprogresstowardsfinancialinclusion;(iii)strengtheningtheinternationalfinancialarchitecture,witha particular focus on IMF quota and governance reform; and (iv) stabilising energy and commodity markets, the volatility of which was identified as a potentially significant source of economicinstability. In June 2012 G20 leaders adopted the Los Cabos Growth and Jobs Action Plan, which focuses on policy actions to reduce near-term risks and improve the medium-term foundations for global growth. In addition, G20 members took stock of previous policy commitments and adopted an Accountability Assessment Framework for more effectively monitoring their implementation.
Finally, the euro area itself is subject to international policy surveillance exercises by the IMF and theOECD.In2012theIMFconducteditsregularreviewofthemonetary,financialandeconomicpolicies of the euro area, as a complement to its reviews of the individual euro area countries. ForthefirsttimetheIMFlaunchedaFinancialSectorAssessmentProgramfortheEU,anEU-wideassessment of the soundness and stability of the EU’s financial sector. TheOECD’s Economic

142ECBAnnual Report2012
Survey of the Euro Area 2012 examined recent economic developments, policies and prospects. This survey also included special chapters on euro area imbalances and euro area governance.
reFormS in international inStitutional proCeSSeS and praCtiCeSFollowing standard practice, the ECB monitored and helped to shape developments in the international monetary system. In 2012 the IMF secured a substantial increase in its resources, IMF surveillance was further developed and given a broader legal foundation, and progress on improving IMF governance continued.
It was decided that the optimal way to augment IMF resources in the short term was through temporary bilateral loans and note purchase agreements with its members. In December 2011 euro area countries had already pledged €150 billion in bilateral loans to the General Resources Account available for lending to the entire IMF membership, and other EU Member States had also indicated their willingness to take part in the process of reinforcing IMF resources. A breakthrough was reached at the Spring Meetings of the IMF and World Bank in 2012, when member countries (including18EUMemberStates)madefirmcommitmentsamountingtoUSD430billion.1 By the time of the Annual Meetings in October, a total of 39 members had made pledges of USD 461 billion and thefirstbatchof loanswas signed intoeffect.Toensure that the IMF’s resourcesavailablefor lending remained adequate, the reformed and expanded New Arrangements to Borrow were activated in April and October of both 2011 and 2012, for six months each time.
2012 was an important year for strengthening IMF surveillance. In July 2012 the IMF Executive Board adopted a landmark new Integrated Surveillance Decision to take effect on 18 January 2013. This decision 2providesthefirstcomprehensiveframeworkfornotonlybilateralbutalsomultilateralsurveillance.Itencouragesmemberstoavoideconomicandfinancialpoliciesthatmaygiverisetodomestic instability and to implement policies that are conducive to the effective operation of the international monetary system.
In September 2012 the IMF Executive Board also agreed on a new strategy for the surveillance of thefinancial sector.Under thenewstrategy, IMFstaffwilldevelopaunifiedmacro-financialframeworktoexploretheinterdependenciesbetweentherealandthefinancialsectorsandbetweenmacroeconomic and macro-prudential policies. Financial surveillance will in this way become a mainstream feature of Article IV consultations.
On the operational side, a Pilot External Sector Report was produced, which provided a multilaterally consistent analysis of the external positions of 28 systemic advanced and emerging countries. The aim was to enhance the methodology and transparency of the Fund’s surveillance of the external sector.Inaddition,thepilotworkonassessinginternationalspilloversfrompolicydecisionsinfivekey economies (China, the euro area, Japan, the United Kingdom and the United States) continued for the second year in 2012, with a comprehensive single report produced in July.
The effectiveness of IMF surveillance and of the IMF’s activities more broadly hinges on the credibility of IMF governance. The implementation of the 2010 quota and governance reform was intensively discussed in 2012. The 2010 reform included the following elements: (i) the Executive Board would consist only of elected members, following the amendment of the IMF’s Articles of Agreement; (ii) the total members’ quotas would be doubled, provided the Board reform took
1 The commitment of the 18 EU countries can be broken down as follows: 13 euro area countries pledged €150 billion; the United Kingdom, USD 15 billion; Sweden, at least USD 10 billion; Denmark, €5.3 billion; Poland, €6.27 billion; and the Czech Republic, €1.5 billion.
2 The Integrated Surveillance Decision replaces the 2007 Decision on Bilateral Surveillance over Members’ Policies.

143ECB
Annual Report2012
effect; (iii) advanced European countries would reduce their combined Board representation by two chairs; (iv) the quota formula would be reviewed by January 2013; and (v) the next (15th) general reviewofquotaswouldbebroughtforwardtoJanuary2014.Theplannedcompletionofthefirstthree reforms by the Annual Meetings in 2012 was not possible because of the lack of the necessary majority for an amendment to the Articles of Agreement. The Europeans have taken actions that will lead to a reduction of advanced European country representation in the IMF Executive Board by 1.64 seats.3
In September 2012 the IMF completed its 2011 Review of Conditionality, which analyses the conditionality, design and effects of IMF-supported programmes during the period from 2002 to September 2011. Finally, the IMF adopted an institutional view on the liberalisation andmanagementofcapitalflows.Itacknowledgedthattheliberalisationofcapitalflowscanhavesubstantialbenefits,butalsothatcarefulplanning,timingandsequencingisrequiredtoensurethatsuchbenefitsoutweighthecosts.
2 Cooperation with CountrieS outSide the euAs in previous years, the Eurosystem organised seminars and workshops with non-EU central banks in order to foster policy dialogue. The ECB also actively participated alongside the European Commission in the EU’s macroeconomic dialogue with key emerging market economies (e.g. Brazil, India and Russia) and EU neighbouring countries. In addition, the technical cooperation provided by the Eurosystem remained an important tool for strengthening the institutional capacity of central banks outside the EU, especially in the EU’s neighbouring regions, and for enhancing compliance with European and international standards.
FoSterinG poliCy dialoGue The ECB continued to deepen its relations with the central banks and monetary authorities of various countries. For example, the ECB took part in EU macroeconomic dialogue with Russia.
The Eurosystem held its third high-level seminar with central banks and monetary agencies of the member states of the Gulf Cooperation Council 4, which was co-organised by the ECB and the Central Bank of the United Arab Emirates and took place on 19 January 2012 in Abu Dhabi. The topicsof the seminarwere thecurrenteconomic,financialandfiscalchallenges in theeuroarea,systemicriskanalysisandthepreventionoffinancialcrises,andtheinternationalmonetaryandfinancialarchitecture.
On 26 and 27 March the ECB organised and hosted a workshop on economic and financialdevelopments in Mediterranean countries. The workshop served to prepare the Eurosystem’s seventh high-level seminar with central banks of Mediterranean countries, which was co-organised by the ECB and Bank Al-Maghrib, the central bank of Morocco, and took place in Casablanca on 12 July. Discussions focused on economic andfinancial developments,monetary policy implementation,andmacro-prudentialpoliciesandfinancialstability.
3 This reduction has been made possible by the formation in 2012 of a new constituency including Belgium, Luxembourg and the Netherlands (with the Executive Director seat rotating between Belgium and the Netherlands), alongside a new central and eastern European constituency, in which from 2014 onwards the position of Executive Director will be assigned exclusively to emerging market countries, and by changes in the rotation of members in the Executive Director seat for the Nordic/Baltic and Swiss constituencies.
4 Bahrain, Kuwait, Oman, Qatar, Saudi Arabia and the United Arab Emirates.

144ECBAnnual Report2012
In addition, the ECB and the Banca d’Italia co-organised the preparatory workshop for the sixth high-level seminar of the Eurosystem and Latin American central banks, which was hosted by the Banca d’Italia on 27 and 28 June in Rome. The seminar itself, which was co-organised by the ECB, the Banco de España and the hosting institution, the Central Bank of Chile, took place on 7 and 8 December in Santiago. Discussions focused on current and past determinants ofsovereigndistress,policyresponses tosovereigncrisesandglobal liquidity,capitalflowsandmacro-prudential responses.
teChniCal CooperationSince 2003 the ECB, together with the NCBs, has implemented several EU-funded technical cooperationprogrammes for thebenefitof centralbanks andbanking supervisors in severalEUneighbouring countries. Moreover, besides EU-funded projects, the ECB has strengthened its long-term cooperation with new countries through memoranda of understanding.
In 2012 the ECB and 21 NCBs continued to support the National Bank of Serbia through an EU-funded technical cooperation programme. This programme, which started in February 2011, covers 11 different areas and aims to strengthen the institutional capacities of the National Bank of Serbia. On the basis of the results, it was agreed to extend this cooperation over 2013.
The ECB and the Central Bank of the Republic of Turkey signed a memorandum of understanding on 4 July 2012, thereby laying the ground for continued cooperation through regular dialogue at the technical and policy levels, technical cooperation and potential staff exchanges. The parties agreedtoinitiallyfocusonfinancialstability,researchandmonetarypolicy,communicationandinternational relations, markets and statistics.
On 15 October 2012 the Eurosystem commenced a technical cooperation programme with the National Bank of the Republic of Macedonia. The ECB and 11 NCBs are participating in this EU-funded programme. The purpose of the nine-month programme, which covers ten areas of central banking, is to assess the central bank’s current institutional and operational framework against EU central banking standards and, on the basis of the outcome, to recommend ways of strengthening its institutional capacity.
On 30 October 2012 the ECB’s President and the Chairman of the Bank of Russia signed a memorandum of understanding laying the groundwork for continued cooperation between the two institutions. The partnership is to consist in regular dialogue at the technical and policy levels, an information exchange on economic and financial developments, and a joint programme ofcooperation activities. The parties agreed to focus on monetary policy, financial stability andbanking supervision in the initial cooperation phase. The ECB will implement the programme of cooperation activities together with euro area NCBs.
With regard to the western Balkans and Turkey, a two-year EU-funded programme on strengthening macro and micro-prudential supervision came to an end in January 2012. The programme, which was implemented by the ECB together with 14 partner NCBs and in cooperation with international andEuropeaninstitutions,wasfor thebenefitof thecentralbanksandsupervisoryauthoritiesofCroatia, the former Yugoslav Republic of Macedonia, Montenegro, Turkey, Albania, Bosnia and Herzegovina, Serbia and Kosovo (under UN Security Council Resolution 1244/99).
In March 2012 the ECB and the Central Bank of Egypt completed a technical cooperation programme on banking supervision which had started on 1 January 2009. Funded by the EU under

145ECB
Annual Report2012
the European Neighbourhood and Partnership Instrument, the programme assisted the central bank in preparing new regulations, guidelines and reporting systems to implement the core components of the Basel II capital adequacy framework in Egypt.
In 2012 the ECB and the People’s Bank of China continued implementing their memorandum of understanding through meetings of their bilateral working group. The memorandum, which was signed on 5 September 2008, aims to strengthen cooperation between the two institutions and foster information-sharing.

By September 2012 approximately two-thirds of the facade and the main structural works had been completed, so that the finallookofthedoubleofficetowerbecameeasytovisualise.Thedeconstructivistdesignofthebuildingmeansthatitlooks different from every angle. The height of its structural framework is such that the torsion of the southern and northern facades, i.e. the twisting along the longitudinal axis, is clearly evident.

147ECB
Annual Report2012
Chapter 6
eXternal CommuniCation and aCCountability
1 aCCountability and CommuniCation poliCy Central bank independence has established itself over the past few decades as an indispensable element of the monetary policy regimes of both advanced and emerging economies. The decision to grantcentralbanksindependencehaslongbeenfirmlysupportedbyeconomictheoryandempiricalevidence, both of which show that such a set-up is conducive to maintaining price stability. At the same time, it is a founding principle of democratic societies that any independent institution bestowed with a public function must be accountable to citizens and their representatives. Accountability is therefore an important counterpart of central bank independence.
The ECB’s commitment to accountability and transparency is illustrated by its reporting to European citizens and their elected representatives, the European Parliament. The Treaty lays down precise reportingrequirementsfortheECB,whichincludethepublicationofaweeklyfinancialstatement,a quarterly report and an annual report. The ECB goes far beyond these statutory obligations in its regular reporting, for instance by publishing a Monthly Bulletin, rather than the required quarterly report. The ECB’s commitment to accountability and transparency is also illustrated by the numerous speeches delivered by the members of the Governing Council, which deal with a broad variety of topics of relevance to the ECB’s tasks. In addition, the President of the ECB appears four times a year before the European Parliament. The ECB also replies to written questions from Members of the European Parliament (MEPs) and publishes these questions and answers on its website.
External communication at the ECB aims to enhance the public’s understanding of the ECB’s policies and decisions and, as such, is an integral part of the ECB’s monetary policy and its other tasks.Twokeyelements–opennessandtransparency–guidetheECB’scommunicationactivities.Bothcontributetotheeffectiveness,efficiencyandcredibilityoftheECB’smonetarypolicyanditsother statutory tasks. They also support the ECB’s efforts to give a full account of its actions.
The ECB’s concept of real-time, regular and comprehensive explanations of its monetary policy assessment and decisions, which was introduced in 1999, represents a uniquely open and transparent approach to central bank communication. Monetary policy decisions are explained at a press conference immediately after the Governing Council has taken them. The President delivers a detailed introductory statement at the press conference, explaining the Governing Council’s decisions. The President and Vice-President are then at the media’s disposal to answer questions. Since December 2004 decisions taken by the Governing Council other than those setting interest rates have also been published every month on the websites of the Eurosystem central banks.
ECB legal acts aremadeavailable in all theofficial languagesof theEU,as are theGoverningCouncil’s monetary policy decisions, the decisions taken by the Governing Council in addition to decisions setting interest rates, and the consolidated financial statements of the Eurosystem.1 The ECB’s Annual Report is also made available in full in all official EU languages.2 The Convergence Report and the quarterly issues of the ECB’s Monthly Bulletin are made availableeitherinfullorinsummaryforminallofficialEUlanguages.3 For the purposes of public
1 With the exception of Irish, for which a derogation is in effect at the EU level.2 With the exception of Irish (by EU derogation) and Maltese (by agreement with the Central Bank of Malta, following the lifting of the
temporary EU derogation in May 2007).3 See footnote 2.

148ECBAnnual Report2012
accountabilityandtransparency,theECBalsopublishesotherdocumentation–inadditiontothestatutorypublications– insomeorallofficial languages, inparticularpressreleasesannouncingstaff macroeconomic projections, policy positions and information of relevance to the general public. The preparation, publication and distribution of the national language versions of the ECB’s key publications are undertaken in close collaboration with the NCBs.
2 aCCountability to the european parliamentThe European Parliament, as the only EU institution whose members are directly elected by the citizens of the EU, plays a key role in holding the ECB to account. Since its establishment, the ECB has maintained a close and fruitful dialogue with the European Parliament.
The President of the ECB continued to report on the ECB’s monetary policy and its other tasks during his quarterly hearings before the European Parliament’s Committee on Economic and Monetary Affairs (ECON) in 2012. In addition, at the invitation of ECON, the President attended an incamerahearingforaninformalexchangeofviewsonthereport“TowardsagenuineEconomicandMonetaryUnion”preparedbythePresidentoftheEuropeanCouncil,inclosecooperationwiththe Presidents of the European Commission, the Eurogroup and the ECB (see Chapter 4).
Other members of the ECB’s Executive Board also appeared before the European Parliament. The Vice-President presented the ECB’s Annual Report 2011 to ECON. Jörg Asmussen participated in a public exchange of views on the economic and social crisis in Greece with the members of ECON and the Committee on Employment and Social Affairs of the European Parliament. In addition, ECB staff were invited to explain the ECB’s views at the expert level. Ignazio Angeloni, the ECB’s Director General for Financial Stability, participated in an exchange of views organised byECONon“Bankingsupervisionandresolution:nextsteps?”.
A wide range of issues were addressed during the various exchanges of views between MEPs and ECB representatives in 2012. The European Parliament expressed support for the ECB and its policiesonmany issues.MEPswelcomedefforts toease theacute tensions infinancialmarketsand help euro area countries under stress. Beyond macroeconomic developments, other important issues that were raised by MEPs pertained to the establishment of a single supervisory mechanism forfinancialsupervision,thedecisiononOutrightMonetaryTransactions,andthedevelopmentofa long-term vision for EMU.
the SinGle SuperviSory meChaniSmThe proposal to establish a single supervisory mechanism (SSM) was a key issue in the exchanges between the ECB and the European Parliament. Discussions focused in particular on the separation of monetary policy and supervisory tasks, the involvement of non-euro area countries, the accountability requirements for the new supervisory tasks, the interaction with national supervisors, the need to ensure compatibility with the Single Market, and the relationship of the SSM with the European Banking Authority. Questions were also raised with regard to the other proposed elements of a financialmarket union, namely an effective resolution regime for financial institutions andharmonised deposit guarantee schemes.
The President of the ECB emphasised the knowledge and expertise of national supervisors on which the ECB would draw when taking on supervisory tasks. He indicated that non-euro area countries would be welcome to join the SSM and stressed that any new supervisory tasks of the ECB must

149ECB
Annual Report2012
be subject to very high standards of accountability. Furthermore, the President emphasised that the SSM should be complemented by a single resolution mechanism.
outriGht monetary tranSaCtionSAnother important topic in discussions between the ECB and the European Parliament in 2012 was the tacklingof theongoingfinancialandeconomiccrisis (seealsoSection1ofChapter2).TheEuropean Parliament welcomed the determined effort by the ECB to respond within its mandate to the challenges of the crisis. In this context, the Governing Council decision of 6 September 2012 on Outright Monetary Transactions (OMTs) was a particular focus of the discussions.
In his exchanges with MEPs the President explained that the decision on OMTs had been indispensable to counter the impairment of the monetary policy transmission mechanism and maintain the singleness of the ECB’s monetary policy. He emphasised that OMTs were aimed at the correction of redenomination risk premia, which were not consistent with the irrevocable nature of the euro and hampered the monetary policy transmission mechanism. Given that the underlying macroeconomic imbalances needed to be addressed in order to restore the proper functioning of the monetary policy transmission mechanism, OMTs would only be activated if a given country adhered strictly to the agreed conditionality under a European Stability Mechanism programme. OMTs could also be activated for countries that are already under a full adjustment programme and regaining market access.
the lonG-term viSion For emuThe European Parliament issued an own-initiative resolution on the report entitled “Towards agenuineEconomicandMonetaryUnion”.InhisdiscussionwiththeParliamentontheissuesraisedin this report, the President of the ECB emphasised the need for a shared vision regarding the direction of EMU over the next decade. He outlined the importance of a solid long-term anchor to inspire confidence in the irreversibility and integrity of EMU and called for a concrete and time-bound schedule to reach this objective.
3 CommuniCation aCtivitieSTheECBaddressesavarietyofaudiences–financialexperts, themedia,academia,parliamentsandpublicinstitutions,aswellasthegeneralpublic–withvaryinglevelsofknowledgeregardingfinance and economics. Its mandate and decisions are therefore explained through a range ofcommunication toolsandactivitieswhichareconstantlybeing refined inorder tomake themaseffective as possible, taking into account the different audiences and the relevant communication environments and needs.
In 2012 the ECB’s communication activities continued to focus on explaining the events and consequencesoftheglobalfinancialandeconomiccrisiswithspecialregardtothesovereigndebtcrisis in Europe and related measures decided on by the Governing Council. The vast majority of public speeches delivered by members of the Executive Board were related to these issues, as were thecommunicationactivitiesofECBexpertsinthecountriesunderofficialadjustmentprogrammesor seeking the assistance of the ECB, in liaison with the European Commission and the IMF. These topics also dominated the questions and requests for information received from the media, the public and visitors to the ECB. The subject of a banking union and the ECB’s assumption of tasks related to the supervision of banks in the euro area featured regularly in the ECB’s communication activities.

150ECBAnnual Report2012
The ECB publishes a number of regular and periodic studies and reports. These include the Annual Report, which presents a review of the ECB’s activities in the previous year, and the Monthly Bulletin, which provides regular updates on the ECB’s assessment of economic and monetary developments and detailed information underlying its decisions. The ECB issued 167 press releases in 2012, covering all aspects of the ECB’s policies and activities, as well as additional information related to the implementation of monetary policy. The ECB also provides a wide range of statistical data, primarily by means of the Statistical Data Warehouse and interactive charts on the ECB’s website.
All members of the ECB’s Executive Board contribute directly to enhancing public knowledge and understanding of the Eurosystem’s tasks and policies by giving testimonies before the European Parliament and national parliaments, delivering public speeches and granting interviews to the media. Over the course of 2012 the members of the Executive Board delivered more than 200 speeches to a variety of audiences and granted over 100 interviews to the media. They also had many articles published in journals, magazines and newspapers.
In 2012 the ECB organised 15 seminars for journalists at its premises and participated in a further 4 seminars organised in Brussels or by the European Journalism Centre. They were all aimed at enhancing the knowledge and understanding of the national and international media as regards the ECB’s mandate, tasks and activities. The ECB organised some of these seminars on its own and others in cooperation with the NCBs, the European Commission, the European Journalism Centre and other public authorities and foundations. In addition to the monthly press conference following themeetings of theGoverningCouncil, theECBorganised numerous press briefingsaimed at fostering a greater understanding of other ECB policies and actions.
The ECB welcomed approximately 800 groups of visitors to its current and future premises in Frankfurtin2012.Some21,000visitorsreceivedfirst-handinformationintheformofpresentationsgiven by ECB staff and tours of the site of the new ECB premises. The progress made in the construction of the new premises, culminating in the topping out ceremony on 20 September 2012, resulted in a greater number of communication activities related to this subject in the course of the year.
All documents published by the ECB and other information about its various activities are available on the ECB’s website. In 2012 the website received 25 million visits; 263 million pages were viewed and 67 million documents were downloaded. In 2012 the ECB replied to around 100,000 enquiries from the public requesting information on a number of issues related to the ECB’s activities, policies and decisions.
A number of high-level international conferences and events were organised in 2012, including “Financialintegrationandstability:towardsamoreresilientsingleEUfinancialmarket”,organisedjointlywiththeEuropeanCommission;“Bankfunding–markets,instrumentsandimplicationsforcorporatelendingandtherealeconomy”,organisedtogetherwiththeFederalReserveBankofNewYork;andanECBcolloquiuminhonourofJoséManuelGonzález-Páramoon“Monetarypolicyinunconventionaltimes”.
On 20 June 2012 the President of the ECB and the governors of the respective euro area NCBs presented the Europe-level prizes to the teams that had won the national contests of the Generation €uro Students’ Award 2011/12. This competition, which will be held each year, aims to enhance the economic literacy of teenagers and to give them a better understanding of the role of the central bank in the economy. More than 3,000 students from the euro area, aged between 16 and 19,

151ECB
Annual Report2012
enteredthecompetition.Thebest528euroareaperformersinthefirstround,whichtooktheformof a multiple-choice test, were invited to participate in the second round. This involved writing an essay predicting the Governing Council’s interest rate decision in March 2012 and giving reasons forit.Altogether,208essayswerereceived.Inthefinalround,thebestteamswereselectedtogivea presentation about the June 2012 interest rate decision and the underlying reasoning before a jury of central bank experts. The following year’s competition was launched on 1 November 2012. Bymid-Decembermorethan750teams–oraround2,500students–hadenteredthecompetition,with additional registrations following in January 2013 in some countries.
The ECB has also expanded its presence in social media. It has a Twitter account, which gained some 30,000 followers in the course of 2012, bringing the total number of followers to 42,000. This tool is used to highlight publications and speeches; in the course of 2012 more than 600 tweets were sent, which were re-tweeted by followers more than 8,000 times. The ECB also maintains a YouTube account for the publication of videos of the monthly press conferences as well as other films.AFacebookaccountwascreatedfortheGeneration€uroStudents’Award,facilitatingdirectcontact with the target audience of the competition. In addition, to mark the tenth anniversary of the introduction of the euro banknotes and coins on 1 January 2012, the ECB organised an EU-wide “EuroRun”internetcompetitionforchildrenaged9to12,whichlastedforthreemonthsandaimedto increase pupils’ awareness of the euro banknotes and coins.
2012 was also an important year in terms of the development of the communication campaign related to the introduction of the second series of euro banknotes. The aim of the campaign, which was prepared during 2012 and launched in 2013, is to ensure that euro area citizens are aware of the new banknotes and their features. To this end, a communication strategy was developed for thewholeeuroarea.Thefirstmajoreventwason8November2012,when thePresidentof theECB announced the introduction of the new “Europa series” of euro banknotes at themonthlypress conference. The first denomination in the new series – the €5 banknote – was unveiledon10January2013duringtheopeningofanexhibitionentitled“Thenewfaceoftheeuro”attheArchaeological Museum in Frankfurt.
The ECB also developed a dedicated website which will serve as a hub for all banknote-related activities, as well as the Euro Cash Academy, a web-based module and smart phone app aimed at making the euro banknotes and their security features more familiar to the public and cashiers.
On 28 and 29 April 2012 the ECB organised visitor days, opening its doors to the public as well as ECB staff and their families and welcoming approximately 1,300 visitors. The programme included guided tours of the building, presentations, workshops on the role and function of the ECB and the euro banknotes and coins, educational games and several exhibitions, including one on the euro banknotes and coins.
As in previous years, in May 2012 the ECB had an information stand at the open day event on the premises of the European Parliament in Strasbourg.
The EUROPEAN CULTURAL DAYS of the ECB took place from 17 October until 14 November 2012 and were dedicated to France. The four-week programme, organised in close cooperation with the Banque de France, showcased some of France’s most exciting and innovative cultural talents. With over 20 events ranging from chanson, classical music, jazz and dance to literature,film,finearts,culinaryarts,designandarchitecture,roundedoffwithanewFrenchcircusproduction, the EUROPEAN CULTURAL DAYS 2012 provided visitors from the Frankfurt area

152ECBAnnual Report2012
and beyond with a unique and varied insight into France’s cultural life. Through its EUROPEAN CULTURAL DAYS initiative, which was launched in 2003, the ECB aims to raise awareness of the EU’s cultural diversity and foster mutual understanding among Europeans.


On 20 September 2012 the ECB held a topping out ceremony to celebrate the completion of the main structural works for its new premises in the Ostend. Such a ceremony is a German tradition and is held by the owner of a newly built house, primarily in order to celebrate the achievements of the planners, construction companies and their workers, who thus account for the majority of the guests. Members of the Executive Board, the Governing Council and the General Council oftheECBplacedtheflagsofall27EUMemberStatesandtheflagoftheEUinthetoppingoutwreath.Theceremonyconcluded with the raising of the topping out wreath and a traditional topping out toast by the construction foreman for the high-rise.

155ECB
Annual Report2012
Chapter 7
inStitutional FrameworK and orGaniSation
1 deCiSion-maKinG bodieS and Corporate GovernanCe oF the eCb
1.1 the euroSyStem and the european SyStem oF Central banKS
The Eurosystem is the central banking system of the euro area. It comprises the ECB and the NCBs of the EU Member States whose currency is the euro (17 since 1 January 2011). The ESCB is composed of the ECB and the NCBs of all 27 EU Member States, i.e. it also includes the NCBs of the Member States which have not yet adopted the euro.
The ECB is the core of the Eurosystem and the ESCB and ensures that the operations which form part of the tasks of the ESCB are carried out either through its own activities or via the NCBs, to which the ECB shall have recourse to the extent deemed possible and appropriate. The ECB is an EU institution and has legal personality under public international law.
Each NCB has legal personality according to the law of its respective country. The euro area NCBs, which form an integral part of the Eurosystem, carry out the tasks conferred upon the
e u r o p e a n S y S t e m o F C e n t r a l b a n K S ( e S C b )
CoverningCouncil
ExecutiveBoard
GeneralCouncil
the decision-making bodies of the eCb
european Central bank
nationale bank van belgië/banque nationale de belgique
deutsche bundesbank
eesti pank
Central bank of ireland
bank of Greece
banco de españa
banque de France
banca d’italia
Central bank of Cyprus
banque centrale du luxembourg
Central bank of malta
de nederlandsche bank
oesterreichische nationalbank
banco de portugal
banka Slovenije
národná banka Slovenska
Suomen pankki − Finlands bank
Бългapcκa нapoднa бaнкa (bulgarian national bank)
Česká národní banka
danmarks nationalbank
latvijas banka
lietuvos bankas
magyar nemzeti bank
narodowy bank polski
banca naţională a româniei
Sveriges riksbank
bank of englande u r o S y S t e m
CoverningCouncil
the decision-making bodies of the eCb
GoverningCouncil
ExecutiveBoard
the decision-making bodies of the eCb
ExecutiveBoard
GeneralCouncil
the decision-making bodies of the eCb
GeneralCouncil

156ECBAnnual Report2012
Eurosystem in accordance with the rules established by the ECB’s decision-making bodies. The NCBs also contribute to the work of the Eurosystem and the ESCB through their participation in the Eurosystem/ESCB committees (see Section 1.5 of this chapter). They may perform non-Eurosystemfunctionsontheirownresponsibility,unlesstheGoverningCouncilfindsthatsuchfunctions interfere with the objectives and tasks of the Eurosystem.
The Eurosystem and the ESCB are governed by the decision-making bodies of the ECB: the Governing Council and the Executive Board. The General Council is constituted as a third decision-making body of the ECB, for as long as there are EU Member States which have not yet adopted the euro. The functioning of the decision-making bodies is governed by the Treaty, the Statute of the ESCB and the relevant Rules of Procedure.1 Decision-making within the Eurosystem and the ESCB is centralised. However, the ECB and the euro area NCBs jointly contribute, strategically and operationally, to attaining the common goals of the Eurosystem, with due respect to the principle of decentralisation in accordance with the Statute of the ESCB.
1.2 the GoverninG CounCil
The Governing Council comprises the members of the Executive Board of the ECB and the governors of the NCBs of the Member States which have adopted the euro. Its main responsibilities, as laid down in the Treaty, are:
– toadopttheguidelinesandtakethedecisionsnecessarytoensuretheperformanceofthetasksentrusted to the Eurosystem;
– toformulatethemonetarypolicyoftheeuroarea,including,asappropriate,decisionsrelatingtointermediate monetary objectives, key interest rates and the supply of reserves in the Eurosystem, and to establish the necessary guidelines for their implementation.
The Governing Council meets, as a rule, twice a month at the ECB’s premises in Frankfurt am Main, Germany. It conducts, inter alia, an in-depth assessment of monetary and economic developments andtakesrelateddecisionsspecificallyatitsfirstmeetingofthemonth,whilethesecondmeetingusually focuses on issues related to other tasks and responsibilities of the ECB and the Eurosystem. In 2012 two meetings were held outside Frankfurt, one hosted by the Banco de España in Barcelona and the other hosted by Banka Slovenije in Brdo pri Kranju. In addition to these meetings, the Governing Council may also hold meetings by means of teleconference or take decisions by written procedure.
When taking decisions on monetary policy and on other tasks of the ECB and the Eurosystem, the members of the Governing Council do not act as national representatives, but in a fully independent personalcapacity.Thisisreflectedbytheprincipleof“onemember,onevote”appliedwithintheGoverningCouncil.In2008theGoverningCouncildecidedtocontinueitsexistingvotingregime–asprovidedforbyArticle10.2oftheStatuteoftheESCB–andtointroducearotationsystemonlywhen the number of governors in the Governing Council exceeds 18.
1 For the ECB’s Rules of Procedure, see: Decision ECB/2004/2 of 19 February 2004 adopting the Rules of Procedure of the European Central Bank, OJ L 80, 18.3.2004, p. 33; Decision ECB/2004/12 of 17 June 2004 adopting the Rules of Procedure of the General Council of the ECB, OJ L 230, 30.6.2004, p. 61; and Decision ECB/1999/7 of 12 October 1999 concerning the Rules of Procedure of the Executive Board of the ECB, OJ L 314, 8.12.1999, p. 34. These rules are also available on the ECB’s website.

the GoverninG CounCil
Front row (from left to right): Jörg Asmussen, Gaston Reinesch, VítorConstâncio,MarioDraghi, Yves Mersch, Christian Noyer
Middle row (from left to right): Carlos Costa, Luc Coene, Josef Bonnici, Luis M. Linde, Jens Weidmann, Patrick Honohan, Marko Kranjec
Back row (from left to right): Erkki Liikanen, Peter Praet, Ardo Hansson, Klaas Knot, Benoît Cœuré, Panicos O. Demetriades, Jozef Makúch, Ewald Nowotny
Note: George A. Provopoulos and Ignazio Visco were not available at the time the photograph was taken.
Mario DraghiPresident of the ECBVítor ConstâncioVice-President of the ECBJörg AsmussenMember of the Executive Board of the ECBJosef BonniciGovernor of the Central Bank of MaltaLuc CoeneGovernor of the Nationale Bank van België/Banque Nationale de BelgiqueBenoît CœuréMember of the Executive Board of the ECBCarlos CostaGovernor of the Banco de PortugalPanicos O. DemetriadesGovernor of the Central Bank of Cyprus(from 3 May 2012)Miguel Fernández OrdóñezGovernor of the Banco de España(until 10 June 2012)José Manuel González-PáramoMember of the Executive Board of the ECB(until 31 May 2012)Ardo HanssonGovernor of Eesti Pank(from 7 June 2012) Patrick HonohanGovernor of the Central Bank of IrelandKlaas KnotPresident of De Nederlandsche BankMarko KranjecGovernor of Banka SlovenijeErkki LiikanenGovernorofSuomenPankki–FinlandsBank
Luis M. LindeGovernor of the Banco de España(from 11 June 2012)Andres LipstokGovernor of Eesti Pank(until 6 June 2012)Jozef MakúchGovernorofNárodnábankaSlovenskaYves MerschMember of the Executive Board of the ECB(from 15 December 2012)Governor of the Banque centrale du Luxembourg(until 14 December 2012)Ewald NowotnyGovernor of the Oesterreichische NationalbankChristian NoyerGovernor of the Banque de FranceAthanasios OrphanidesGovernor of the Central Bank of Cyprus(until 2 May 2012)Peter PraetMember of the Executive Board of the ECBGeorge A. ProvopoulosGovernor of the Bank of GreeceGaston ReineschGovernor of the Banque centrale du Luxembourg(from 1 January 2013)Ignazio Visco Governor of the Banca d’ItaliaJens WeidmannPresident of the Deutsche Bundesbank

158ECBAnnual Report2012
1.3 the eXeCutive board
The Executive Board comprises the President and the Vice-President of the ECB and four other membersappointedbytheEuropeanCouncil,actingbyqualifiedmajority,afterconsultationoftheEuropean Parliament and of the ECB. The main responsibilities of the Executive Board, which as a rule meets once a week, are:
– topreparethemeetingsoftheGoverningCouncil;
– toimplementthemonetarypolicyoftheeuroareainaccordancewiththeguidelinesanddecisionslaid down by the Governing Council and, in doing so, to give the necessary instructions to the euro area NCBs;
– tomanagethecurrentbusinessoftheECB;
– to exercise certain powers delegated to it by the Governing Council, including some of aregulatory nature.
The Executive Board is assisted by a Management Committee in matters relating to the ECB’s management, business planning and annual budget process. The Management Committee is composed of one Executive Board member, who acts as Chairperson, and a number of senior managers.

159ECB
Annual Report2012
Mario DraghiPresident of the ECBVítor ConstâncioVice-President of the ECBJörg AsmussenMember of the Executive Board Benoît CœuréMember of the Executive Board
José Manuel González-PáramoMember of the Executive Board(until 31 May 2012) Yves MerschMember of the Executive Board(from 15 December 2012)Peter PraetMember of the Executive Board
the eXeCutive board
Back row (left to right): Jörg Asmussen, Peter Praet, Benoît Cœuré
Front row (left to right): VítorConstâncio(Vice-President),Mario Draghi (President), Yves Mersch
1.4 the General CounCil
The General Council is composed of the President and the Vice-President of the ECB and the governors of the NCBs of all 27 EU Member States. Since December 2011 the Governor of Hrvatska narodna banka, the Croatian central bank, has been invited to attend the meetings of the General Council in an observer capacity. The General Council mainly carries out those tasks taken over from the European Monetary Institute which still have to be performed because not all the Member States have adopted the euro. These tasks include strengthening cooperation between the NCBs, supporting the coordination of the monetary policies of the Member States with the aim of ensuringpricestability,andmonitoringthefunctioningofERMII.Moreover, it reports– intheformof theECB’sConvergenceReport– to theEUCouncilon theprogressmadebyMemberStateswhichhavenotyetadoptedtheeuroinfulfillingtheirobligationsregardingtheachievementof EMU. It also contributes to the advisory functions of the ECB. In 2012 the General Council had its four quarterly meetings.

Mario DraghiPresident of the ECBVítor ConstâncioVice-President of the ECBMarek BelkaPresident of Narodowy Bank PolskiNils BernsteinGovernor of Danmarks NationalbankJosef BonniciGovernor of the Central Bank of MaltaLuc CoeneGovernor of the Nationale Bank van België/Banque Nationale de BelgiqueCarlos CostaGovernor of the Banco de PortugalPanicos O. DemetriadesGovernor of the Central Bank of Cyprus(from 3 May 2012)Miguel Fernández OrdóñezGovernor of the Banco de España(until 10 June 2012)Ardo HanssonGovernor of Eesti Pank(from 7 June 2012) Patrick HonohanGovernor of the Central Bank of IrelandStefan IngvesGovernor of Sveriges RiksbankMugur Constantin IsărescuGovernorofBancaNaţionalăaRomânieiIvan IskrovGovernorofБългарсканароднабанка(Bulgarian National Bank)Mervyn KingGovernor of the Bank of EnglandKlaas KnotPresident of De Nederlandsche BankMarko KranjecGovernor of Banka Slovenije
Erkki LiikanenGovernorofSuomenPankki–FinlandsBankLuis M. LindeGovernor of the Banco de España(from 11 June 2012)Andres LipstokGovernor of Eesti Pank(until 6 June 2012)Jozef MakúchGovernorofNárodnábankaSlovenskaYves MerschGovernor of the Banque centrale du Luxembourg(until 14 December 2012)Ewald NowotnyGovernor of the Oesterreichische NationalbankChristian NoyerGovernor of the Banque de FranceAthanasios OrphanidesGovernor of the Central Bank of Cyprus(until 2 May 2012)George A. ProvopoulosGovernor of the Bank of GreeceGaston ReineschGovernor of the Banque centrale du Luxembourg(from 1 January 2013)Ilmārs RimšēvičsGovernor of Latvijas BankaAndrás SimorGovernor of the Magyar Nemzeti BankMiroslav SingerGovernorofČeskánárodníbankaVitas VasiliauskasChairman of the Board of Lietuvos bankasIgnazio Visco Governor of the Banca d’ItaliaJens WeidmannPresident of the Deutsche Bundesbank
the General CounCilFront row (left to right):
Christian Noyer, Stefan Ingves, MarkoKranjec,VítorConstâncio, Mario Draghi, György Matolcsy,
Ignazio Visco
Middle row (left to right): Carlos Costa, Luc Coene,
Jozef Makúch, Erkki Liikanen, Ewald Nowotny,
MugurConstantinIsărescu,ReljaMartić*(alternateobserver),
Gaston Reinesch
Back row (left to right): Lars Rohde, IvanIskrov,IlmārsRimšēvičs,
Ardo Hansson, Klaas Knot, Jens Weidmann, Patrick Honohan,
Vitas Vasiliauskas, Miroslav Singer
Note: Marek Belka, Josef Bonnici, Panicos O. Demetriades,
Mervyn King, Luis M. Linde and George A. Provopoulos were not
available at the time the photograph was taken.
*ReljaMartićisDeputyGovernor of Hrvatska narodna banka.

161ECB
Annual Report2012
1.5 euroSyStem/eSCb CommitteeS, the budGet Committee, the human reSourCeS ConFerenCe and the euroSyStem it SteerinG Committee
The Eurosystem/ESCB committees have continued to play an important role in assisting the ECB’s decision-making bodies in the performance of their tasks. At the request of both the Governing Council andtheExecutiveBoard,thecommitteeshaveprovidedexpertiseintheirfieldsofcompetenceandhave facilitated the decision-making process. Membership of the committees is usually restricted to staff of the Eurosystem central banks. However, the NCBs of the Member States which have not yet adopted the euro take part in the meetings of a committee whenever it deals with matters that fall withinthefieldofcompetenceoftheGeneralCouncil.Whereappropriate,othercompetentbodiesmay also be invited. Since the signing of the Accession Treaty in December 2011, and in line with the decision to invite governors of central banks of acceding countries to attend the meetings of the General Council, experts from Hrvatska narodna banka, the Croatian central bank, have been invited to the meetings of ESCB committees in an observer capacity whenever they deal with matters that fallwithinthefieldofcompetenceoftheGeneralCouncil.Asat31December201214Eurosystem/ESCB committees had been established under Article 9.1 of the Rules of Procedure of the ECB.
On 18 April 2012 the Committee on Cost Methodology was changed into the Committee on Controllingwithaviewtofurtherenhancingthefinancialcontrollingsupportprovidedduringthepreparation and conduct of Eurosystem projects.
EUROSYSTEM/ESCB COMMITTEES , EUROSYSTEM IT STEER ING COMMITTEE ,BUDGET COMMITTEE , HUMAN RESOURCES CONFERENCE AND THE IR CHA IRPERSONS1)
International Relations Committee (IRC)Wolfgang DuchatczekWolfgang Duchatczek
Legal Committee (LEGCO)Antonio Sáinz de VicuñaAntonio Sáinz de Vicuña
Market Operations Committee (MOC)Ulrich BindseilUlrich Bindseil
Monetary Policy Committee (MPC)Wolfgang SchillWolWolW fgfgf ang Schill
Payment and Settlement Systems Committee (PSSC)Daniela RussoDaniela Russo
Risk Management Committee (RMC)Carlos Bernadell
Werner Studener
Carlos Bernadell
Statistics Committee (STC)Aurel Schubert
Human Resources Conference (HRC)Steven Keuning
Werner Studener
Ton RoosTon Roos
Pentti HakkarainenPentti Hakkarainen
Christine GraeffChristine Graeff
Ignazio AngeloniIgnazio Angeloni
Koenraad de Geest
Klaus Gressenbauer
José Luis Malo de Molina
Accounting and Monetary Income Committee (AMICO)
Banknote Committee (BANCO)
Committee on Controlling (COMCO)
Eurosystem/ESCB Communications Committee (ECCO)
Financial Stability Committee (FSC)
Information Technology Committee (ITC)
Internal Auditors Committee (IAC)
Budget Committee (BUCOM)
Eurosystem IT Steering Committee (EISC)Yves Mersch
1 As at 1 January 2013.

162ECBAnnual Report2012
Three further committees exist. The Budget Committee, which was established under Article 15 of the Rules of Procedure, assists the Governing Council in matters related to the ECB’s budget. The Human Resources Conference was established in 2005 under Article 9a of the Rules of Procedure as a forum for the exchange of experience, expertise and information among Eurosystem/ESCB centralbanksinthefieldofhumanresourcesmanagement.TheEurosystemITSteeringCommitteewas established in 2007 by the Governing Council, with a mandate to steer continuous improvement in the use of IT within the Eurosystem.
1.6 Corporate GovernanCe
In addition to the decision-making bodies, the corporate governance of the ECB encompasses a number of external and internal control layers, two codes of conduct, an Ethics Framework and rules concerning public access to ECB documents.
eXternal Control layerSThe Statute of the ESCB provides for two control layers, namely the external auditor, which is appointed to audit the annual accounts of the ECB (Article 27.1 of the Statute of the ESCB), and the EuropeanCourtofAuditors,whichexaminestheoperationalefficiencyofthemanagementoftheECB (Article 27.2). The annual report of the European Court of Auditors, together with the ECB’s reply,ispublishedontheECB’swebsiteandintheOfficialJournaloftheEuropeanUnion.Inorderto reinforce public assurance as to the independence of the ECB’s external auditor, the principle of auditfirmrotationisapplied.2 Good practices for the selection and mandate of external auditors, published on the ECB’s website, provide high-level guidance for each Eurosystem central bank when selecting external auditors and determining their mandate. The good practices also enable the Governing Council to formulate its recommendations to the EU Council on the basis of harmonised, consistent and transparent selection criteria. On 14 June 2012 the Governing Council approved a revised version of the good practices.
internal Control layerSThe internal control structure of the ECB is based on an approach in which each organisational unit (section, division, directorate or directorate general) has primary responsibility for managing its own risks,aswellasforensuringtheeffectivenessandefficiencyofitsoperations.Eachorganisationalunit implements operational control procedures within its area of responsibility in accordance with the risk tolerance set in advance by the Executive Board.
WithintheECB,budgetaryresponsibilityandaccountabilityliesfirstwiththeindividualbusinessareas, which are also responsible for the first level of control. The Budget, Controlling andOrganisation Division is responsible for planning, coordinating, steering and executing all related centralised processes as well as for preparing the relevant documentation. It also serves as a second level of control and reports to the Executive Board on a regular basis, alerting it to issues where necessary.
In accordance with its mandate, the Budget Committee assesses the ECB budget planning and monitoring reports submitted by the Executive Board and reports on them to the Governing Council. It assists the Governing Council in the evaluation of the Executive Board’s annual budget
2 Following the conclusion of a tender procedure and in linewith the agreed practice of rotating audit firms, PricewaterhouseCoopersAktiengesellschaftWirtschaftsprüfungsgesellschaftwasappointedastheECB’sexternalauditorforthefinancialyears2008-12.

163ECB
Annual Report2012
proposal before the latter is adopted, and assesses and reports to the Governing Council on budget monitoring reports.
As far as the operational risks of the ECB are concerned, the Operational Risk Committee, an internal ECB committee, is responsible for stimulating and overseeing the development, implementation and maintenance of operational risk management by the business areas who own the risks. It also supports the Executive Board in the execution of its role in overseeing the management of the operational risks of the ECB.
In 2012 the ECB continued, together with the NCBs, to implement the operational risk management framework and updated the related operational risk assessments for Eurosystem tasks and processes. The ECB continued to regularly test and review the business continuity arrangements for its critical operations. Furthermore, in cooperation with the NCBs, the ECB conducted a business impact analysis to identify the time criticality of Eurosystem functions.
TheECB’sRiskManagementOffice 3 is responsible for the risk management framework applicable to all of the ECB’s financial market operations and for monitoring, assessing and proposingimprovements to the Eurosystem’s operational framework for monetary policy and foreign exchange policy from a risk management perspective.
The Risk Management Committee, comprising participants from Eurosystem central banks with expertise in the field of risk management, assists the decision-making bodies in ensuringan appropriate levelofprotection for theEurosystembymanagingandcontrolling thefinancialrisks originating from its market operations, in the context of both the Eurosystem’s monetary policy operations and the ECB’s foreign reserve portfolio. With regard to these activities, the Risk Management Committee contributes to, among other things, the monitoring, measuring and reporting of financial risks and the definition and review of the associated methodologies andframeworks.
Independently from the internal control structure and risk monitoring of the ECB, audit missions are performed by the Directorate Internal Audit under the direct responsibility of the Executive Board. In accordancewith themandate defined in the ECBAudit Charter 4, the ECB’s internal auditors provide independent and objective assurance and consulting services, bringing a systematic approach to evaluating and improving the effectiveness of risk management, control and governance processes. The ECB’s internal audit activities conform with the International Standards for the Professional Practice of Internal Auditing of the Institute of Internal Auditors.
A Eurosystem/ESCB committee, the Internal Auditors Committee, which is composed of the heads of internal audit at the ECB and the NCBs, is responsible for coordinating the auditing of Eurosystem/ESCB joint projects and operational systems.
An ECB Audit Committee further enhances the corporate governance of the ECB and the Eurosystem as a whole. It is composed of three Governing Council members, with Erkki Liikanen (GovernorofSuomenPankki–FinlandsBank)asChairman.
3 The RiskManagement Office, established as an independent business area of the ECB in July 2011, became the Directorate RiskManagement on 1 January 2013.
4 This charter is published on the ECB’s website to foster the transparency of audit arrangements in place at the ECB.

164ECBAnnual Report2012
CodeS oF ConduCtTwo codes of conduct are applicable to the members of the ECB’s decision-making bodies. The firstcodeofconductgivesguidanceto,andsetsethicalstandardsfor,themembersoftheGoverningCouncil and their alternates when exercising their functions as members of the Governing Council.5 It reflects their responsibility to safeguard the integrity and reputationof theEurosystemand tomaintain the effectiveness of its operations. An Ethics Adviser has been appointed by the Governing Council to provide guidance to its members on aspects of professional conduct. The second code is the Supplementary Code of Ethics Criteria for the members of the Executive Board.6 It complements the other code of conduct by further detailing the ethical regime applicable to members of the Executive Board.
The Ethics Framework for members of staff of the ECB 7 provides guidance and sets ethics conventions, standards and benchmarks. All staff are expected to maintain high standards of professional ethical behaviour in the performance of their duties, as well as in their relations with NCBs, public authorities, market participants, media representatives and the public in general. An Ethics Officer appointed by the Executive Board ensures a consistent interpretation of therules.
anti-Fraud meaSureS In 1999 the European Parliament and the EU Council adopted a Regulation 8 tostepupthefightagainst fraud,corruptionandanyother illegalactivitydetrimental to theCommunities’financialinterests. The Regulation provides, inter alia, for the internal investigation of suspected fraud by theEuropeanAnti-FraudOffice(OLAF)withintheEUinstitutions,bodies,officesandagencies.The OLAF Regulation foresees that each of the latter adopt decisions in order for OLAF to be able to carry out its investigations within each of them. In 2004 the Governing Council adopted a Decision 9 concerning the terms and conditions for investigations by OLAF of the ECB, which entered into force on 1 July 2004.
anti-money launderinG/Counter-terroriSt FinanCinG proGrammeIn2007theECBestablisheditsinternalanti-moneylaundering(AML)andcounter-terroristfinancing(CTF) schemes. The design of the AML/CTF provisions is in line with the Recommendations of the Financial Action Task Force (FATF), to the extent that they are applicable to the ECB’s operations. AcompliancefunctionwithintheECBidentifies,analysesandaddressestherisksassociatedwithmoneylaunderingandterroristfinancingforallrelevantactivitiesoftheECB.Inparticular,ensuringcompliance with applicable AML/CTF legislation is part of the process of assessing and monitoring the eligibility of the ECB’s counterparties. In this context, particular attention is paid to restrictive measures adopted by the EU and public statements issued by the FATF. An internal reporting system complements the ECB’s AML/CTF framework to ensure that all relevant information is systematically collected and duly communicated to the Executive Board.
5 See the Code of Conduct for the members of the Governing Council, OJ C 123, 24.5.2002, p. 9, its amendment, OJ C 10, 16.1.2007, p. 6, and the ECB’s website.
6 See the Supplementary Code of Ethics Criteria for the members of the Executive Board of the ECB, OJ C 104, 23.4.2010, p. 8, and the ECB’s website.
7 See Part 0 of the ECB Staff Rules containing the Ethics Framework, OJ C 104, 23.4.2010, p. 3, and the ECB’s website.8 Regulation (EC) No 1073/1999 of the European Parliament and of the Council of 25 May 1999 concerning investigations conducted by
theEuropeanAnti-FraudOffice(OLAF),OJL136,31.5.1999,p.1.9 DecisionECB/2004/11of3June2004concerningthetermsandconditionsforEuropeanAnti-FraudOfficeinvestigationsoftheEuropean
Central Bank, in relation to the prevention of fraud, corruption and any other illegal activities detrimental to the European Communities’ financialinterestsandamendingtheConditionsofEmploymentforStaffoftheEuropeanCentralBank,OJL230,30.6.2004,p.56.

165ECB
Annual Report2012
publiC aCCeSS to eCb doCumentSThe ECB’s Decision on public access to ECB documents,10 adopted in 2004, is in line with the objectives and standards applied by other EU institutions and bodies with regard to public access to their documents. It enhances transparency, while at the same time taking into account the independence of the ECB and of the NCBs and ensuring the confidentiality of certain mattersspecifictotheperformanceoftheECB’stasks.11 In 2011 the ECB amended its Decision on public access to ECB documents in order to take into account the new ESRB-related activities of the ECB.12 In 2012 the number of public access requests remained limited.
10 Decision ECB/2004/3 of 4 March 2004 on public access to European Central Bank documents, OJ L 80, 18.3.2004, p. 42.11 In linewith the ECB’s commitment to openness and transparency, the “Archives” section of the ECB’swebsite provides access to
historical documentation.12 Decision ECB/2011/6 of 9 May 2011 amending Decision ECB/2004/3 on public access to ECB documents, OJ L 158, 16.6.2011, p. 37.

166ECBAnnual Report2012
the orGaniSation Chart oF the eCb(as at 1 January 2013)
1 Reports to the President of the ECB in his capacity as Chair of the ESRB.2 Includes the data protection function.3 Secretary to the Executive Board, the Governing Council and the General Council.
directorate GeneraladministrationWerner StudenerDeputy: Klaus Riemkedivisions:· Accounting and Procurement· Administrative Services· Financial Reporting and Policy· New ECB Premises (Project Office)· Premises· Security
directoratebanknotesTon Roosdivisions:· Currency Development· Currency Management
directorate GeneralCommunications and language ServicesChristine Graeffdivisions:· Language Services· Press and Information· Publishing, Events and Protocol
Counselto the executive boardChristian Thimann
eCb representationin washington, d.C.Georges Pineau
directorate GeneraleconomicsWolfgang SchillDeputies: Hans-Joachim Klöckers,N.N.division: · Fiscal Policies- directorate economic developments Hans-Joachim Klöckers divisions: · Euro Area Macroeconomic Developments · EU Countries
- directorate monetary policy
N.N. divisions: · Capital Markets and Financial
Structure · Monetary Policy Stance · Monetary Policy Strategy
eSrb Secretariat1
Francesco MazzaferroDeputy: Andrea Maechler
directorate GeneralFinancial StabilityIgnazio AngeloniDeputy: John Felldivisions:· Financial Services Policy· Financial Stability Assessment· Financial Stability Surveillance
directorate General hr, budget andorganisationSteven KeuningDeputy: Peter Rennpferdtdivisions:· Budget, Controlling and
Organisation· HR Policies and Staff Relations· Recruitment and Compensation
directorate Generalinformation SystemsKoenraad De GeestDeputy: Magí Clavé Badiadivisions:· Analytical Domain Applications· Enterprise Systems· Executional Domain Applications· Infrastructure and Operations· Security and Architecture
directorateinternal auditKlaus Gressenbauerdivisions:· Audit Missions· Audit Services
directorate Generalinternational andeuropean relationsFrank MossDeputy: Gilles Nobletdivisions:· EU Institutions and Fora (includes the ECB RepresentativeOffice in Brussels)
· External Developments· International Policy Analysis· International Relations and Cooperation
directorate Generallegal ServicesAntonio Sáinz de VicuñaDeputy: Chiara Ziliolidivisions:· Financial Law· Institutional Law2
· Legislation
directorate Generalmarket operationsUlrich BindseilDeputy: Roberto Schiavidivisions:· Bond Markets and International Operations
· Financial Operations Services· Market Operations Analysis· Market Operations Systems· Money Market and Liquidity
directorate Generalpayments and marketinfrastructureDaniela RussoDeputy: Pierre Petitdivisions:· Market Integration· Oversight· TARGET and Collateral
t2S programmeJean-Michel Godeffroydivision:· T2S Programme Office
directorate GeneralresearchFrank SmetsDeputy: Philipp Hartmanndivisions:· Financial Research· Monetary Policy Research
directorate risk management Carlos Bernadelldivisions:· Risk Analysis· Risk Strategy
directorate General SecretariatPierre van der Haegen3
Deputy: Roman Schremserdivisions:· Information Management Services· Secretariat
directorate GeneralStatisticsAurel SchubertDeputy: Werner Bierdivisions:· External Statistics· Macroeconomic Statistics· Monetary and Financial Statistics· Statistical Information Services· Statistics Development/Coordination
directorate directorate
executive board
divisions
directorates General anddirectorates

167ECB
Annual Report2012
2.1 human reSourCeS manaGement
In 2012 the ECB continued to develop and implement human resources management policies with a focus on four areas: working culture, recruitment, professional development and employment conditions.
worKinG Culture In 2012 developments related to the working culture of the ECB continued to focus on diversity, professional ethics and performance management. The ECB introduced a pilot mentoring programme to support the personal and professional development of a group of staff members, giving particular attention to female mentees. Meanwhile, the share of female applicants who were selected for junior managerial and advisory positions considerably exceeded that of male applicants. With regard to professional ethics, the rules concerning private financial activities, and themonitoring thereof,were further reviewed in order to maintain an effective regulatory ethics framework.
reCruitment On 31 December 2012 the actual full-time equivalent number of staff holding employment contracts with the ECB was 1,638 (1,609 on 31 December 2011).13Atotalof73newfixed-termcontracts(limited in nature or convertible to permanent contracts) were offered in 2012. By contrast, 34membersofstaffemployedonafixed-termorpermanentbasislefttheECBin2012(38in2011),following resignation or retirement. Furthermore, to cover for absences of less than one year, 120 short-term contracts were issued during 2012 (in addition to a number of contract extensions), while 114 short-term contracts expired in the course of the year.
The ECB continued to offer short-term contracts to staff from NCBs and international organisations, thus fostering an ESCB-wide team spirit and cooperation with international organisations. On 31 December 2012 142 employees from NCBs and international organisations were working at the ECB on various assignments, 7% less than at the end of 2011.
In September 2012 the ECB welcomed the seventh intake of participants in its Graduate Programme. These participants have various academic backgrounds and are assigned to two different business areas for consecutive periods of one year each.
As in previous years, traineeship opportunities were offered throughout the year to students and graduates with backgrounds in economics, statistics, business administration, law or translation. On 31 December 2012 122 trainees were hosted by the ECB (13% more than in 2011). The ECB also awardedfive fellowships as part of theWimDuisenbergResearchFellowshipProgramme,whichisopentoleadingeconomists,andfivefellowshipstoyoungresearchersunderitsLamfalussyFellowship Programme.
proFeSSional development Mobility continues to be an important tool for the professional development of ECB staff, while also serving to increase synergies across business areas. In the course of 2012 225 staff members, including 59 managers and advisers, moved internally to other positions, on either a temporary or a longer-term basis.
13 Inadditiontocontractsbasedonfull-timeequivalentpositions,thisfigureincludesshort-termcontractsawardedtostaffsecondedfromNCBs and international organisations and contracts awarded to Graduate Programme participants.
2 orGaniSational developmentS

168ECBAnnual Report2012
The ECB, like all ESCB central banks, actively participates in the external mobility schemes promoted by the Human Resources Conference, which enables the ECB to second staff to the 27 NCBs in the EU or to relevant international organisations (e.g. the IMF and the BIS) for periods of two to twelve months. A total of 15 members of staff were seconded under this scheme in 2012 (new cases). The total number of staff members on unpaid leave at the end of December 2012 was 56 (compared with 55 in 2011). The ECB also decided to launch a pilot programme on career transition in January 2013, so as to support staff members who have served the ECB in the same or similar positions for a prolonged period and who are interested in pursuing their career outside the ECB.
The ECB continued to promote the acquisition and development of relevant skills and the further enhancement of the required competencies of management and staff. In addition to a range of in-house training opportunities, management and staff continued to follow external training courses, including those offered under the ESCB training programme.
In 2012 19 area heads, 11 deputy directors general and 50 heads of division participated in a multi-source feedback exercise, in which their staff, peers and external counterparts completed a questionnaire on their managerial and leadership skills. Overall, the feedback was very positive. As a follow-up, these managers devised individual action plans to further enhance their performance.
the human reSourCeS ConFerenCe The activities of the Human Resources Conference covered various aspects of human resources management in 2012, including the organisation of a broad range of ESCB training activities as well as intra-ESCB mobility. The ESCB Training and Development website, a platform for sharing information on training and mobility opportunities with all ESCB staff, was launched in April 2012. In 2012 there were 46 sessions of ESCB training activities, hosted by 23 central banks.
employment ConditionS TheECB’semploymentconditionshavebeenfine-tunedsoas tocontinueofferinganattractivepackage to staff, also in view of their generally high workload, and to balance the needs of staff with those of the organisation.
At the end of 2012 258 staff members were working part time, 34% more than in 2011. The number of staff on unpaid parental leave as at 31 December 2012 was 25 (compared with 33 in 2011). Building on the results of a pilot phase, the teleworking policy was introduced on 1 February 2012. In 2012, on average, around 363 staff members teleworked each month. In 2012 as a whole, 975 staff members teleworked at least once.
2.2 StaFF relationS and SoCial dialoGue
The ECB fully recognises the importance of a constructive dialogue with its staff. In 2012 the ECB consulted and exchanged information with the elected Staff Committee and the recognised trade union IPSO 14 on changes related to remuneration, employment contracts, staff development, performance management, working conditions, health and safety conditions and pensions. In this context, 217 letters were exchanged. In addition, the ECB continued to have a frequent dialogue through regular meetings with the Staff Committee and IPSO on employment and social matters.
14 IPSOstandsfor“InternationalandEuropeanPublicServicesOrganisation”.

169ECB
Annual Report2012
2.3 eSCb SoCial dialoGue
The ESCB Social Dialogue is a consultative forum involving the ECB, employee representatives from the central banks of the ESCB and representatives from European trade union federations.15 Its purpose is to provide information and foster exchanges of views on issues that may have a major impact on employment conditions at the central banks of the ESCB. This information is provided in a biannual newsletter and at meetings held in Frankfurt.
In 2012 the first ESCB Social Dialogue meeting took place in February and focused on theemployment-related effects of the financial crisis, ESCB/Eurosystem training and mobility andfinancialstability.Issuesrelatingtobanknoteproductionandcirculationandpaymentsystemswerealso discussed.
AspecialadhocmeetingonthefinancialcrisisanditsimpactontheESCBanditsstafftookplacein June.
The second regular ESCB Social Dialogue meeting was held in November and focused on the main developments in the areas of banknotes and banking supervision. Other issues discussed were ESCB/Eurosystem training and mobility and IT projects.
The ad hoc working group on banknote production and circulation continued to address technical issues, complementing those discussed in the plenary meeting of the ESCB Social Dialogue. The working group on the ESCB Social Dialogue met in April and October 2012 and, among other things,identifiedpossibleitemstobeincludedintheagendaoftheESCBSocialDialoguemeetings.
2.4 the euroSyStem proCurement Coordination oFFiCe
TheobjectiveoftheEurosystemProcurementCoordinationOffice(EPCO)istoensuretheefficientcoordination of joint procurements of goods and services by those ESCB central banks that have committed to participating in EPCO’s activities,16 as well as to further improve the best procurement practices of these central banks. The network of central bank procurement experts, coordinated by EPCO, met six times in 2012.
The fourth EPCO Procurement Plan (Update 2012) was implemented over the course of the year. The joint procedures on air transport for ESCB meetings and global hotel agreements were renewed.Several joint procurement procedureswerefinalised and implementedduring2012, inareas including information technology, consultancy services, software packages, rating agency and market data services, and audit activities. In addition, EPCO progressed on nine other joint procurement activities and studies to identify potential joint procurement in areas related to banknotepackagingitems,officeproducts,insuranceservicesandinformationtechnology,aswellas–forservicesnotcoveredbytheproceduresalreadyconcluded–toratingagencyandmarketdata services. An evaluation of further opportunities for joint procurement was included in the next EPCO Procurement Plan (Update 2013), which was approved by the Governing Council in December 2012.
15 TheStandingCommitteeofEuropeanCentralBankUnions(SCECBU),UnionNetworkInternational–Europa(UNI-EuropaFinance)and the European Federation of Public Service Unions (EPSU).
16 In2012,inadditiontotheEurosystemcentralbanks,theMagyarNemzetiBankandBancaNaţionalăaRomânieiparticipatedinEPCOactivities.

170ECBAnnual Report2012
EPCO prepared a compilation of best public procurement practices at the ESCB central banks.
The Governing Council decided to extend EPCO’s initial mandate (2008-12) and its hosting by the Banque central du Luxembourg until the end of June 2014, by which time a decision is expected to have been taken on EPCO’s future operational model and host central bank.
2.5 new eCb premiSeS
On 20 September 2012 the ECB held the topping out ceremony for its new premises. The double officetowerhadthenalmostreacheditsfinalheightof185mandthemainstructuralworkshadbeen completed. The steel works for the technical areas and the antenna on top of the building will befinishedinspring2013.
ThemountingofthefacadepanelsonthedoubleofficetowercommencedinFebruary2012andthe installation of the facades and the closing-off of the connecting atrium are due to be completed in spring 2013. The facades of the Grossmarkthalle (the former wholesale market hall) were successfully restored in 2012 and the steel structures were erected for the conference area, designed as a separate house-in-house element within the spacious Grossmarkthalle, as well as for the entrance building, which will house the press centre. The installation of the technical infrastructure and the fit-outworksbeganinspring2012andproceededaccordingtoplan.Adelayofapproximatelysixmonths caused by the complexity of the requisite restoration works on the original fabric of the Grossmarkthalle has been incorporated into the existing time schedule.
Up to the end of 2012 the ECB had spent approximately €600 million in construction and other costs, including the purchase of the site. In 2005 the building costs were estimated at around €500 million and the overall investment costs at €850 million, both at constant 2005 prices, i.e.excludingpriceindexation,inflation,andunforeseenrisksbeyondacertainorderofmagnitude. The current prognosis, estimated in mid-2012, includes all project costs, past and future indexation costs and general construction cost developments until the ECB moves into its new premises in 2014. Price rises for construction materials and construction activities from 2005 until the completion of the project in 2014 are expected to lead to a €200 million increase in the overall investment cost.
The ECB monitors the construction progress, its costs and price developments very closely and implements adjustments and amendments where necessary. The Grossmarkthalle presented a number of challenges that were not detected in the initial examination conducted prior to the acquisition:thefoundationsturnedouttobeinsufficientandrequiredadditionalsupport;theroofcoverage was found to be contaminated and therefore could not be disposed of as envisaged; and partsoftheoldconcreteconstructionhadinsufficientsteelsupport.
All these factors are likely to account for additional costs of about €300 million to €350 million by the time the project is completed in 2014, including the above-mentioned €200 million related to indexation costs, on top of the estimated overall investment costs of €850 million based on constant 2005 prices.
The ECB’s relocation to its new headquarters is planned for 2014.

171ECB
Annual Report2012
2.6 environmental iSSueS
The ECB remains committed to making prudent use of natural resources in order to preserve the quality of the environment and to protect human health. It has established an environmental policy and continuously improves its environmental performance, in particular by minimising its ecological footprint and carbon emissions. To systematically pursue environmental sustainability, the ECB has adopted an Environmental Management System that complies with the international standard EN ISO 14001 and Regulation (EC) No 1221/2009 of the European Parliament and of the Council on the voluntary participation by organisations in a Community eco-management and audit scheme. In 2012 the ECB successfully passed its second environmental surveillance audit.
The ECB’s main impact on the environment and about 75% of its carbon footprint arise from the use of electricity and of energy for heating and cooling. Its carbon emissions have been reduced considerably since 2009, mainly through organisational and technical measures. A comparison of data for 2010 and 2011 reveals a 24% reduction in carbon emissions resulting from electricity, heating and cooling, business travel and paper consumption.
In addition, measures continued to be put in place in the context of the environmental programme implemented by the ECB. A pilot phase for the implementation of a sustainable procurement guidelinewaslaunchedin2012.Moreover,thenumberofpersonalofficeprinterswasreducedandenergy-efficientmulti-functionalon-floordeviceswereinstalledinallECBpremises.
The ECB is convinced that every staff member can contribute to minimising the ECB’s ecological footprint. In 2012 the ECB’s environmental representatives organised staff training sessions, regularmeetingsandworkshops.TheTARGET2-Securities(T2S)ProgrammeOfficehasbecomea pilot business area for an awareness-raising and behaviour change communication campaign. Furthermore, a car-free day was organised on 21 September 2012, successfully encouraging almost 200 employees to travel to work by other means of transport.
Special attention is also being paid to the establishment of state-of-the-art sustainability features in the operation and maintenance plans for the ECB’s new premises.
2.7 inFormation teChnoloGy ServiCe manaGement
Alongside its regular portfolio of IT projects, the Directorate General Information Systems (DG/IS) supported the ECB’s cooperation with the European Financial Stability Facility and the European Stability Mechanism (see Chapter 4). Additional work was undertaken to enhance support for the management of the ECB’s foreign reserve assets, own funds, monetary policy operations and collateral. At the same time, substantial efforts were put into preparations for moving the IT infrastructure and end users’ IT equipment to the new ECB premises, including the provision of new business applications for the management of the new building.
WorkalsocontinuedonincreasingtheefficiencyofITservicesmanagementfortheESCB,inparticularwith regard to identity and access management, while major efforts were made in replacing the storage solution in order to improve the resilience of the IT infrastructure and business applications.
Finally, as part of the continual improvement of internal processes in DG/IS, the ISO/IEC 27001 certification,coveringITsecurity,wasobtained.

Nowthatthemainstructuralworksfortheofficefloorsofthehigh-risehavebeencompleted,theECBisonestepclosertomoving to its new neighbourhood, the Ostend.

173ECB
Annual Report2012
annual aCCountSmanaGement report For the year endinG 31 deCember 2012
1 nature oF the buSineSS
The ECB’s activities in 2012 are described in detail in the relevant chapters of the Annual Report.
2 obJeCtiveS and taSKS
The ECB’s objectives and tasks are described in the Statute of the ESCB (Articles 2 and 3). An overview of performance against these objectives is included in the President’s foreword to the Annual Report.
3 Key reSourCeS, riSKS and proCeSSeS
GovernanCe oF the eCb
The Executive Board, the Governing Council and the General Council are the decision-making bodies of the ECB.
The ECB’s governance framework includes several layers of internal and external controls. The Statute of the ESCB provides for two layers of external controls, namely the external auditors appointed to audit the annual accounts of the ECB (Article 27.1), and the European Court of Auditors,whichexaminestheoperationalefficiencyofthemanagementoftheECB(Article27.2).In order to reinforce public assurance as to the independence of the ECB’s external auditors, the principleofauditfirmrotationeveryfiveyearsisapplied.
In the context of the internal control structure of the ECB, an operational risk management framework is in place, whereby each organisational unit is responsible for managing its own operational risks and implementingitsowncontrols,aswellasfortheeffectivenessandefficiencyofitsoperations.TheOperational Risk Committee (ORC) supports the Executive Board in their oversight role regarding themanagementof theECB’soperational risks.TheRiskManagementOffice 1 is responsible for theriskmanagementframeworkapplicabletoalloftheECB’sfinancialmarketoperationsandformonitoring, assessing and proposing improvements to the Eurosystem’s operational framework for monetary policy and foreign exchange policy from a risk management perspective.
Within the ECB’s internal control structure, responsibility and accountability for budget matters lies primarily with the individual business areas. The Budget, Controlling and Organisation Division (BCO) of the Directorate General Human Resources, Budget and Organisation develops the framework for and prepares and monitors strategic planning in respect of the ECB’s resources, as well as the related operational budget, in cooperation with the business areas. BCO also provides planningandresourcecontrolling,cost-benefitanalysisandinvestmentanalysisforECBandESCBprojects. Spending against agreed budgets is monitored regularly by the Executive Board, taking into account the advice of the BCO, and by the Governing Council with the assistance of the Budget
1 The Risk Management Office became the Directorate Risk Management on 1 January 2013.

174ECBAnnual Report2012
Committee (BUCOM), which is composed of ECB and euro area NCB experts. In accordance with Article 15 of the ECB’s Rules of Procedure, BUCOM supports the Governing Council by providing a detailed evaluation of the ECB’s annual budget proposals and of requests for supplementary budget funding by the Executive Board, prior to their submission to the Governing Council for approval.
In addition, independent audit missions are performed by the Directorate Internal Audit under the direct responsibility of the Executive Board. Moreover, in order to further strengthen the ECB’s corporate governance, the ECB Audit Committee provides assistance to the Governing Council asregards its responsibilities inrespectof the integrityoffinancial information, theoversightofinternal controls and the performance of the ECB’s and the Eurosystem’s audit functions.
A comprehensive ethics framework for the staff of the ECB provides guidance and sets ethics conventions, standards and benchmarks. All staff are expected to maintain high standards of professional ethical behaviour in the performance of their duties, as well as in their relations with NCBs, public authorities, market participants, media representatives and the general public. Two additional codes of conduct deal exclusively with the ethical regime applicable to the members of theECB’sdecision-makingbodies.TheEthicsOfficerappointedbytheExecutiveBoardensuresthat the rules applicable to Executive Board members and staff are interpreted consistently. An Ethics Adviser has been appointed by the Governing Council to provide guidance to its members on aspects of professional conduct.
Further information relating to the governance of the ECB is provided in Section 1 of Chapter 7 of the Annual Report.
memberS oF the eXeCutive board
The members of the Executive Board are appointed from among persons of recognised standing and professional experience in monetary or banking matters by the European Council, upon a recommendation from the EU Council after it has consulted the European Parliament and the Governing Council.
The terms and conditions of members’ employment are determined by the Governing Council, based on a proposal from a committee comprising three members appointed by the Governing Council and three members appointed by the EU Council.
Salaries,allowancesandotherbenefitsofthemembersoftheExecutiveBoardaresetoutinnote30,“Staffcosts”,oftheAnnualAccounts.
employeeS
The ECB fully recognises the importance of a constructive dialogue with its staff. In 2012 the ECB continued to develop and implement human resources management policies in four areas: working culture, recruitment, professional development and employment conditions. Developments related to the working culture of the ECB continued to focus on diversity, professional ethics and performance management. The ECB introduced a pilot mentoring programme to support the personal and professional development of its staff, focusing in particular on female staff members.

175ECB
Annual Report2012
Mobility and staff development measures remained the main tools for professional development. Moreover, the ECB continued to support staff in the areas of childcare and the reconciliation of work and family commitments.
The average number of staff (full-time equivalents) holding contracts with the ECB 2 rose from 1,601 in 2011 to 1,615 in 2012. At the end of 2012 1,638 staff were employed. For further information, seenote30,“Staffcosts”,oftheAnnualAccountsandSection2ofChapter7oftheAnnualReportwhich also describes developments in the area of human resources management in more detail.
portFolio manaGement
The ECB holds two types of investment portfolio, namely the foreign reserves investment portfolio, denominated in US dollars and Japanese yen, and an internal own funds investment portfolio denominated in euro. In addition, the funds relating to the ECB’s pension plan are invested in an externally managed portfolio. The ECB also holds its share of securities for monetary policy purposes, acquired in the context of the Securities Markets Programme and the two covered bond purchase programmes. The various purposes and objectives of the ECB’s investment and monetary policy portfolios, as well as the associated risk management practices, are described in detail in Section 1 of Chapter 2 of the Annual Report.
TheECB is exposed tofinancial risks arising from its investmentportfolios and its holdingsofsecurities purchased for monetary policy purposes. They encompass credit, market and liquidity risks. The ECB closely monitors and measures such risks on an ongoing basis and, where appropriate, mitigates them through the implementation of risk management frameworks, which include eligibility criteria for assets and counterparties and a system of exposure limits. These frameworks take into account the objectives and purposes of the various holdings of securities, aswellastheriskpreferencesspecifiedbytheECB’sdecision-makingbodies.
produCtion oF the eCb’S FinanCial aCCountS
Pursuant to Article 26.2 of the Statute of the ESCB, the Annual Accounts of the ECB are drawn up by the Executive Board, in accordance with the principles established by the Governing Council.3
The Financial Reporting and Policy Division of the Directorate General Administration is responsible for producing the Annual Accounts in cooperation with other business areas and for ensuring that all related documentation is submitted in a timely manner to the auditors and thereafter to the decision-making bodies.
The Directorate Internal Audit provides independent and objective assurance and consulting servicesdesignedtoimprovetheECB’soperations.Inthiscontext,financialreportingprocessesand the ECB’s Annual Accounts may be subject to internal audits. Internal audit reports, which may include audit recommendations addressed to the business areas concerned, are submitted to the Executive Board.
The ECB’s Assets and Liabilities Committee, which is composed of representatives from the ECB’s marketoperations,financialreporting,riskmanagement,budgetandauditfunctions,systematically
2 Staff on unpaid leave are excluded. This number includes staff with permanent, fixed or short-term contracts and the participants in the ECB’s Graduate Programme. Staff on maternity or long-term sick leave are also included.
3 See the notes on accounting policies.

176ECBAnnual Report2012
monitorsandassessesallfactorsthatmayhaveabearingontheECB’sBalanceSheetandProfitand Loss Account. It reviews and comments on the Annual Accounts and the related documentation before they are submitted to the Executive Board for endorsement.
Furthermore, the Annual Accounts of the ECB are audited by independent external auditors recommended by the Governing Council and approved by the EU Council. The external auditors have full power to examine all books and accounts of the ECB and obtain full information about its transactions. The responsibility of the external auditors is to express an opinion as to whether the AnnualAccountsgiveatrueandfairviewofthefinancialpositionoftheECBandoftheresultsof its operations, in accordance with the principles established by the Governing Council. In this regard, the external auditors consider the adequacy of internal controls applied to the preparation and presentation of the Annual Accounts and evaluate the appropriateness of the accounting policies used and the reasonableness of accounting estimates made by the Executive Board.
After the Executive Board has authorised their issuance, the Annual Accounts, together with the external auditors’ opinion and all relevant documentation, are submitted to the ECB’s Audit Committee for review prior to their submission to the Governing Council for approval.
The Executive Board has decided that from 2013 the ECB’s Annual Accounts will be approved at the second Governing Council meeting in February of each year and published immediately thereafter.
4 FinanCial reSourCeS
Capital
In December 2010 the ECB decided to increase its subscribed capital by €5 billion, from €5.8 billion to €10.8 billion. This decision resulted from an assessment of the adequacy of its statutory capital, which was launched in 2009. The capital increase was deemed appropriate in view of increased volatility in foreign exchange rates, interest rates and gold prices, as well as in view of the ECB’s exposure to credit risk. In order to smooth the transfer of capital to the ECB, the Governing Council decided that the euro area NCBs should pay their additional capital contributions in three equal annual instalments due in December 2010, 2011 and 2012.
On27December2012theNCBsof theeuroareapaidanamountof€1,166millionas thefinalinstalment of their contributions to the increase in the ECB’s subscribed capital. Consequently, the ECB’s paid-up capital amounted to €7,650 million on 31 December 2012. Detailed information on thischangeisprovidedinnote17,“Capitalandreserves”,oftheAnnualAccounts.
proviSion For ForeiGn eXChanGe rate, intereSt rate, Credit and Gold priCe riSKS
Since most of the ECB’s assets and liabilities are periodically revalued at current market exchange ratesandsecurityprices,theECB’sprofitabilityisstronglyaffectedbyexchangerateexposuresand,to a lesser extent, interest rate exposures. These exposures stem mainly from its holdings of gold and foreign reserve assets denominated in US dollars and Japanese yen, which are predominantly invested in interest-bearing instruments. The ECB’s investment portfolios and its holdings of securities purchased for monetary policy purposes entail a further exposure to credit risk.

177ECB
Annual Report2012
In view of its large exposure to these risks and the size of its revaluation accounts, the ECB maintains a provision for foreign exchange rate, interest rate, credit and gold price risks. The size of and continuing requirement for this provision is reviewed annually, taking a range of factors into account, including in particular the level of holdings of risk-bearing assets, the extent of materialisedriskexposuresinthecurrentfinancialyear,projectedresultsforthecomingyear,anda risk assessment involving calculations of Values at Risk (VaR) on risk-bearing assets, which is applied consistently over time. The risk provision, together with any amounts held in the ECB’s general reserve fund, may not exceed the value of the capital paid up by the euro area NCBs.
As at 31 December 2011 the provision for foreign exchange rate, interest rate, credit and gold price risks amounted to €6,363 million. After taking the results of its risk assessment into account, the Governing Council decided to increase the size of the risk provision to €7,529 million as at 31 December 2012. This amount equates to the current maximum allowed ceiling.
5 FinanCial reSult For 2012
In 2012 the net income of the ECB prior to the transfer of €1,166 million to the risk provision was €2,164million,comparedwith€1,894millionin2011.Thenetprofit,amountingto€998millionafter this transfer, was distributed to the euro area NCBs.
In 2012 net interest income amounted to €2,289 million, compared with €1,999 million in 2011. The increase in net interest income was mainly due to (a) the lower net interest expense arising from TARGET2 balances; (b) the additional interest income generated on the securities purchased under the Securities Markets Programme and the second covered bond purchase programme; and (c) the lower interest expense arising from the euro area NCBs’ claims in respect of the foreign reserve assets transferred by them to the ECB. The effects of these developments were partially offset by a decrease in interest income on the ECB’s share of the total euro banknotes in circulation.
Net realised gains arising from financial operations decreased from €472 million in 2011 to€319 million in 2012, owing to lower net exchange rate gains that were only partially offset by higher net realised price gains on sales of securities. The exchange rate gains in 2011 mainly arose fromJapaneseyenoutflowsinthecontextoftheECB’sparticipationintheconcertedinternationalintervention in the foreign exchange markets in March 2011.
In 2012 the overall increase in the market value of securities held in the ECB’s own funds portfolio resulted in substantially lower write-downs in that year, amounting to €4 million (2011: €157 million).
As at the end of 2011 unrealised foreign exchange gains, mainly arising on the US dollar portfolio and the Japanese yen portfolio, amounted to €7,976 million, and unrealised gold price gains amountedto€15,718million.In2012theappreciationoftheeurovis-à-vistheJapaneseyenandthe US dollar resulted in a decrease in unrealised foreign exchange gains, which amounted to €6,053 million, while the rise in the price of gold during 2012 led to unrealised gold price gains amounting to €16,434 million. In line with the Eurosystem’s accounting policies, these gains were recorded in revaluation accounts.

178ECBAnnual Report2012
No impairment losses were recorded at the year-end. Regarding the ECB’s holdings of Greek government bonds purchased under the Securities Markets Programme, the Governing Council identified two impairment indicators inparticular,whichoccurred in thecourseof2012.On thebasis of the information available as at 31 December 2012, the Governing Council considered that the occurrence of these indicators did not warrant an impairment of the ECB’s holdings, since there wasnoevidenceofchangesintheestimatedfuturecashflows.
Total administrative expenses of the ECB, including depreciation, amounted to €461 million in 2012, compared with €442 million in 2011. The vast majority of the costs incurred in connection with the construction of the ECB’s new premises have been capitalised and are excluded from this item.


180ECBAnnual Report2012
balanCe Sheet aS at 31 deCember 2012aSSetS note
number2012
€2011
€
Gold and gold receivables 1 20,359,049,520 19,643,678,205
Claims on non-euro area residents denominated in foreign currency 2
Receivables from the IMF 2.1 653,250,711 664,189,254Balances with banks and security investments, external loans and other external assets 2.2 40,669,958,425 40,763,380,487
41,323,209,136 41,427,569,741
Claims on euro area residents denominated in foreign currency 2.2 2,838,176,026 4,827,713,607
Claims on non-euro area residents denominated in euro 3
Balances with banks, security investments and loans 3.1 0 1,456,000,000
Other claims on euro area credit institutions denominated in euro 4 5,000 204,931,400
Securities of euro area residents denominated in euro 5
Securities held for monetary policy purposes 5.1 22,055,516,689 22,819,128,768
Intra-Eurosystem claims 6Claims related to the allocation of euro banknotes within the Eurosystem 6.1 73,007,429,075 71,090,081,710Other claims within the Eurosystem (net) 6.2 24,673,515,571 49,393,103,654
97,680,944,646 120,483,185,364
Other assets 7Tangibleandintangiblefixedassets 7.1 638,474,832 441,349,493Otherfinancialassets 7.2 19,099,638,796 16,040,825,454Off-balance-sheet instruments revaluation differences 7.3 207,025,391 264,245,011Accruals and prepaid expenses 7.4 1,660,056,235 1,861,875,764Sundry 7.5 1,423,836,885 1,400,781,867
23,029,032,139 20,009,077,589
Total assets 207,285,933,156 230,871,284,674

181ECB
Annual Report2012
liabilitieS note number
2012 €
2011 €
Banknotes in circulation 8 73,007,429,075 71,090,081,710
Other liabilities to euro area credit institutions denominated in euro 9 0 204,926,300
Liabilities to other euro area residents denominated in euro 10
Other liabilities 10.1 1,024,000,000 1,056,000,000
Liabilities to non-euro area residents denominated in euro 11 50,887,527,294 77,116,620,293
Liabilities to non-euro area residents denominated in foreign currency 12
Deposits, balances and other liabilities 12.1 0 406,665,121
Intra-Eurosystem liabilities 13Liabilities equivalent to the transfer of foreign reserves 13.1 40,307,572,893 40,307,572,893
Other liabilities 14Off-balance-sheet instruments revaluation differences 14.1 585,953,062 869,160,478Accruals and income collected in advance 14.2 975,648,659 1,251,205,972Sundry 14.3 781,819,158 623,759,817
2,343,420,879 2,744,126,267
Provisions 15 7,595,452,415 6,407,941,415
Revaluation accounts 16 23,472,041,296 24,324,930,772
Capital and reserves 17Capital 17.1 7,650,458,669 6,484,283,669
Profit for the year 998,030,635 728,136,234
Total liabilities 207,285,933,156 230,871,284,674

182ECBAnnual Report2012
proFit and loSS aCCount For the year endinG 31 deCember 2012
note number
2012 €
2011 €
Interest income on foreign reserve assets 24.1 228,883,700 290,220,291Interest income arising from the allocation of euro banknotes within the Eurosystem 24.2 633,084,427 856,392,005Other interest income 24.4 10,917,006,128 8,331,260,026Interest income 11,778,974,255 9,477,872,322Remuneration of NCBs’ claims in respect of foreign reserves transferred 24.3 (306,925,375) (433,970,898) Other interest expense 24.4 (9,182,641,280) (7,044,498,398)Interest expense (9,489,566,655) (7,478,469,296)
Net interest income 24 2,289,407,600 1,999,403,026
Realised gains/losses arising from financialoperations 25 318,835,838 472,219,229Write-downsonfinancialassetsandpositions 26 (4,180,784) (157,457,283) Transfer to/from provisions for foreign exchange rate, interest rate, credit and gold price risks (1,166,175,000) (1,166,175,000)
Net result of financial operations, write-downs and risk provisions (851,519,946) (851,413,054)
Net expense from fees and commissions 27 (2,127,108) (1,980,780)
Income from equity shares and participating interests 28 1,188,176 1,048,891
Other income 29 21,938,157 23,122,157
Total net income 1,458,886,879 1,170,180,240
Staff costs 30 (219,350,856) (216,065,185)Administrative expenses 31 (220,422,011) (208,017,979)Depreciation of tangible and intangible fixedassets (12,918,830) (11,488,672)Banknote production services 32 (8,164,547) (6,472,170)
Profit for the year 998,030,635 728,136,234
Frankfurt am Main, 13 February 2013
EUROPEAN CENTRAL BANK
Mario Draghi President

183ECB
Annual Report2012
aCCount inG pol iC i e S 1
Form and preSentation oF the FinanCial StatementS
ThefinancialstatementsoftheECBhavebeendesignedtopresentfairlythefinancialpositionoftheECB and the results of its operations. They have been drawn up in accordance with the following accounting policies,2 which the Governing Council of the ECB considers to be appropriate to the nature of central bank activity.
aCCountinG prinCipleS
The following accounting principles have been applied: economic reality and transparency, prudence, recognition of post-balance-sheet events, materiality, going concern, the accruals principle, consistency and comparability.
reCoGnition oF aSSetS and liabilitieS
An asset or liability is only recognised in the Balance Sheet when it is probable that any associated futureeconomicbenefitwillflowtoorfromtheECB,substantiallyalloftheassociatedrisksandrewards have been transferred to the ECB, and the cost or value of the asset or the amount of the obligation can be measured reliably.
baSiS oF aCCountinG
The accounts have been prepared on a historical cost basis, modified to include the marketvaluation ofmarketable securities (other than those classified as held-to-maturity), gold and allother on-balance-sheet and off-balance-sheet assets and liabilities denominated in foreign currency. Transactionsinfinancialassetsandliabilitiesarereflectedintheaccountsonthebasisofthedateon which they were settled.
Withtheexceptionofspottransactionsinsecurities,transactionsinfinancialinstrumentsdenominatedin foreign currency are recorded in off-balance-sheet accounts on the trade date. At the settlement date the off-balance-sheet entries are reversed and transactions are booked on-balance-sheet. Purchases and sales of foreign currency affect the net foreign currency position on the trade date, and realised results arising from sales are also calculated on that date. Accrued interest, premiums and discounts relatedtofinancialinstrumentsdenominatedinforeigncurrencyarecalculatedandrecordeddaily,and the foreign currency position is also affected daily by these accruals.
Gold and ForeiGn CurrenCy aSSetS and liabilitieS
Assets and liabilities denominated in foreign currency are converted into euro at the exchange rate prevailing on the balance sheet date. Income and expenses are converted at the exchange rate prevailing on the recording date. The revaluation of foreign exchange assets and liabilities, including on-balance-sheet and off-balance-sheet instruments, is performed on a currency-by-currency basis.
Revaluation to the market price for assets and liabilities denominated in foreign currency is treated separately from the exchange rate revaluation.
1 The detailed accounting policies of the ECB are laid down in Decision ECB/2010/21 of 11 November 2010, OJ L 35, 9.2.2011, p. 1, as amended.
2 These policies are consistent with the provisions of Article 26.4 of the Statute of the ESCB, which require a harmonised approach to the rules governing the accounting and financial reporting of Eurosystem operations.

184ECBAnnual Report2012
Gold is valued at the market price prevailing at the year-end. No distinction is made between the price and currency revaluation differences for gold. Instead, a single gold valuation is accounted for onthebasisofthepriceineuroperfineounceofgold,which,fortheyearending31December2012,was derived from the exchange rate of the euro against the US dollar on 31 December 2012.
Thespecialdrawingright(SDR)isdefinedintermsofabasketofcurrencies.TorevaluetheECB’sholdings of SDRs, the value of the SDR was calculated as the weighted sum of the exchange rates of four major currencies (the US dollar, euro, Japanese yen and pound sterling) converted into euro as at 31 December 2012.
SeCuritieS
Marketablesecurities(otherthanthoseclassifiedasheld-to-maturity)andsimilarassetsarevaluedeither at the mid-market prices or on the basis of the relevant yield curve prevailing on the balance sheet date, on a security-by-security basis. For the year ending 31 December 2012, mid-market prices on 28 December 2012 were used.
Marketablesecuritiesclassifiedasheld-to-maturityandilliquidequitysharesareallvaluedatcostsubject to impairment.
inCome reCoGnition
Income and expenses are recognised in the period in which they are earned or incurred.3 Realised gainsandlossesarisingfromthesaleofforeignexchange,goldandsecuritiesaretakentotheProfitand Loss Account. Such realised gains and losses are calculated by reference to the average cost of the respective asset.
Unrealised gains are not recognised as income but are transferred directly to a revaluation account.
UnrealisedlossesaretakentotheProfitandLossAccountif,attheyear-end,theyexceedpreviousrevaluation gains registered in the corresponding revaluation account. Such unrealised losses on any one security or currency or on gold are not netted against unrealised gains on other securities orcurrenciesorgold.IntheeventofsuchunrealisedlossonanyitemtakentotheProfitandLossAccount, the average cost of that item is reduced to the year-end exchange rate or market price.
Impairment losses are taken to theProfit andLossAccount and are not reversed in subsequentyears unless the impairment decreases and the decrease can be related to an observable event that occurredaftertheimpairmentwasfirstrecorded.
Premiumsordiscountsarisingonpurchasedsecurities,includingthoseclassifiedasheld-to-maturity,are calculated and presented as part of interest income and are amortised over the remaining life of the securities.
reverSe tranSaCtionS
Reverse transactions are operations whereby the ECB buys or sells assets under a repurchase agreement or conducts credit operations against collateral.
3 A minimum threshold of €100,000 applies for administrative accruals and provisions.

185ECB
Annual Report2012
Under a repurchase agreement, securities are sold for cash with a simultaneous agreement to repurchase them from the counterparty at an agreed price on a set future date. Repurchase agreements are recorded as collateralised deposits on the liability side of the Balance Sheet. Securities sold under such an agreement remain on the Balance Sheet of the ECB.
Under a reverse repurchase agreement, securities are bought for cash with a simultaneous agreement to sell them back to the counterparty at an agreed price on a set future date. Reverse repurchase agreements are recorded as collateralised loans on the asset side of the Balance Sheet but are not included in the ECB’s security holdings.
Reverse transactions (including security lending transactions) conducted under an automated security lending programme are recorded on the Balance Sheet only where collateral is provided in the form of cash placed on an account of the ECB. In 2012 the ECB did not receive any collateral in the form of cash in connection with such transactions.
oFF-balanCe-Sheet inStrumentS
Currency instruments, namely foreign exchange forward transactions, forward legs of foreign exchange swaps and other currency instruments involving an exchange of one currency for another at a future date, are included in the net foreign currency position for the purpose of calculating foreign exchange gains and losses.
Interest rate instruments are revalued on an item-by-item basis. Daily changes in the variation margin of open interest rate futures contracts are recorded in the Profit andLossAccount. Thevaluation of forward transactions in securities and of interest rate swaps is based on generally accepted valuation methods using observable market prices and rates, as well as discount factors from the settlement dates to the valuation date.
poSt-balanCe-Sheet eventS
The values of assets and liabilities are adjusted for events that occur between the annual balance sheet date and the date on which the Executive Board authorises the submission of the ECB’s Annual Accounts to the Governing Council for approval, if such events materially affect the condition of assets and liabilities at the balance sheet date.
Important post-balance-sheet events that do not affect the condition of assets and liabilities at the balance sheet date are disclosed in the notes.
intra-eSCb balanCeS/intra-euroSyStem balanCeS
Intra-ESCB balances result primarily from cross-border payments in the EU that are settled in central bank money in euro. These transactions are for the most part initiated by private entities (i.e. credit institutions, corporations and individuals). They are settled in TARGET2 – the Trans-European Automated Real-time Gross settlement Express Transfer system and give rise to bilateral balances in the TARGET2 accounts of EU central banks. These bilateral balances are netted out and then assigned to the ECB on a daily basis, leaving each NCB with a single net bilateral position vis-à-vis theECBonly.Thispositionin thebooksof theECBrepresents thenetclaimor liabilityofeachNCBagainsttherestoftheESCB.Intra-EurosystembalancesofeuroareaNCBsvis-à-visthe ECB arising from TARGET2, as well as other intra-Eurosystem balances denominated in euro

186ECBAnnual Report2012
(e.g.interimprofitdistributionstoNCBs),arepresentedontheBalanceSheetoftheECBasasinglenet asset or liability position and disclosed under “Other claimswithin the Eurosystem (net)” or“OtherliabilitieswithintheEurosystem(net)”.Intra-ESCBbalancesofnon-euroareaNCBsvis-à-visthe ECB, arising from their participation in TARGET2,4aredisclosedunder“Liabilitiestonon-euroarearesidentsdenominatedineuro”.
Intra-Eurosystem balances arising from the allocation of euro banknotes within the Eurosystem are includedasasinglenetassetunder“ClaimsrelatedtotheallocationofeurobanknoteswithintheEurosystem”(see“Banknotesincirculation”inthenotesonaccountingpolicies).
Intra-Eurosystem balances arising from the transfer of foreign reserve assets to the ECB by NCBs joiningtheEurosystemaredenominatedineuroandreportedunder“Liabilitiesequivalenttothetransferofforeignreserves”.
treatment oF FiXed aSSetS
Fixed assets, including intangible assets, but with the exception of land and works of art, are valued at cost less depreciation. Depreciation is calculated on a straight-line basis over the expected useful life of the asset, beginning in the quarter after the asset is available for use. The useful lives applied for the main asset classes are as follows:
Computers, related hardware and software, and motor vehicles 4 yearsTechnical equipment 4 or 10 yearsFurniture and plant in building 10 years
The length of the depreciation period for capitalised building and refurbishment expenditure relating to the ECB’s existing rented premises has been adjusted to ensure that these assets are fully depreciated before the ECB moves to its new premises. Land and works of art are valued at cost.
Fixed assets costing less than €10,000 are written off in the year of acquisition.
Fixed assets that comply with the capitalisation criteria but are still under construction or development arerecordedundertheheading“Assetsunderconstruction”.Therelatedcostsaretransferredtotherelevantfixedassetheadingsoncetheassetsareavailableforuse.ForthedepreciationoftheECB’snew premises, costs will be assigned to the appropriate asset components which will be depreciated in accordance with their estimated useful lives.
the eCb’S penSion plan, other poSt-employment beneFitS and other lonG-term beneFitS
TheECBoperatesadefinedbenefitplanforitsstaff.Thisisfundedbyassetsheldinalong-termemployeebenefitfund.
The compulsory contributions made by the ECB and the staff are 18% and 6% of basic salary respectively.Staffcanmakeadditionalcontributionsonavoluntarybasisinadefinedcontributionpillarthatcanbeusedtoprovideadditionalbenefits.5
4 Asat31December2012thenon-euroareaNCBsparticipatinginTARGET2wereБългарсканароднабанка(BulgarianNationalBank),DanmarksNationalbank,LatvijasBanka,Lietuvosbankas,NarodowyBankPolskiandBancaNaţionalăaRomâniei.
5 The funds accumulated by a staff member through voluntary contributions can be used at retirement to purchase an additional pension. This pension is included in the defined benefit obligation from that point on.

187ECB
Annual Report2012
balance SheetTheliabilityrecognisedintheBalanceSheet inrespectof thedefinedbenefitplanis thepresentvalueofthedefinedbenefitobligationatthebalancesheetdate,less the fair value of plan assets used to fund the obligation, adjusted for unrecognised actuarial gains or losses.
Thedefinedbenefitobligationiscalculatedannuallybyindependentactuariesusingtheprojectedunitcreditmethod.Thepresentvalueofthedefinedbenefitobligationiscalculatedbydiscountingtheestimatedfuturecashflowsusingaratewhichisdeterminedbyreferencetomarketyieldsatthe balance sheet date on high quality euro-denominated corporate bonds that have similar terms of maturity to the term of the pension obligation.
Actuarial gains and losses can arise from experience adjustments (where actual outcomes are different from the actuarial assumptions previously made) and changes in actuarial assumptions.
profit and loss accountThenetamountchargedtotheProfitandLossAccountcomprises:
(a)thecurrentservicecostofthedefinedbenefitsaccruingfortheyear;
(b)interestatthediscountrateonthedefinedbenefitobligation;
(c)theexpectedreturnonplanassetsheldagainstthedefinedbenefitobligation;
(d)anyactuarialgainsandlossesarisingfrompost-employmentbenefits,usinga“10%corridor”approach; and
(e)anyactuarialgainsandlossesarisingfromotherlong-termbenefits,intheirentirety.
“10% corridor” approachNetcumulativeunrecognisedactuarialgainsandlossesonpost-employmentbenefitswhichexceedthegreaterof(a)10%ofthepresentvalueofthedefinedbenefitobligationand(b)10%ofthefairvalueofplan assetsheld against thedefinedbenefitobligation, are amortisedover the expectedaverage remaining working lives of the participating employees.
unfunded benefitsUnfunded arrangements are in place for the post-employment and other long-term benefits ofmembers of the Executive Board of the ECB. For staff, unfunded arrangements are in place for post-employmentbenefitsotherthanpensionsandforotherlong-termbenefits.TheexpectedcostsofthesebenefitsareaccruedovertheExecutiveBoard/staffmembers’termsofoffice/employmentusinganaccountingapproachsimilartothatofdefinedbenefitpensionplans.Actuarialgainsandlossesarerecognisedinthemanneroutlinedundertheheading“ProfitandLossAccount”.
These amounts are valued annually by independent actuaries to establish the appropriate liability in thefinancialstatements.

188ECBAnnual Report2012
banKnoteS in CirCulation
The ECB and the euro area NCBs, which together comprise the Eurosystem, issue euro banknotes.6 The total value of euro banknotes in circulation is allocated to the Eurosystem central banks on the last working day of each month in accordance with the banknote allocation key.7
The ECB has been allocated a share of 8% of the total value of euro banknotes in circulation, which isdisclosedin theBalanceSheetunder the liability item“Banknotes incirculation”.TheECB’sshare of the total euro banknote issue is backed by claims on the NCBs. These claims, which bear interest,8aredisclosedunderthesub-item“Intra-Eurosystemclaims:claimsrelatedtotheallocationofeurobanknoteswithintheEurosystem”(see“Intra-ESCBbalances/intra-Eurosystembalances”inthenotesonaccountingpolicies).InterestincomeontheseclaimsisincludedintheProfitandLossAccountundertheitem“InterestincomearisingfromtheallocationofeurobanknoteswithintheEurosystem”.
interim proFit diStribution
The ECB’s income on euro banknotes in circulation and income arising from securities purchased under the SecuritiesMarkets Programme is due to the euro areaNCBs in the financial year inwhich it accrues. Unless otherwise decided by the Governing Council, the ECB distributes this incomeinJanuaryofthefollowingyearbymeansofaninterimprofitdistribution.9 It is distributed infullunlesstheECB’snetprofitfortheyearislessthanitsincomeearnedoneurobanknotesincirculation and securities purchased under the Securities Markets Programme, and subject to any decisions by the Governing Council to make transfers to the provision for foreign exchange rate, interest rate, credit and gold price risks. The Governing Council may also decide to charge costs incurred by the ECB in connection with the issue and handling of euro banknotes against income earned on euro banknotes in circulation.
other iSSueS
Taking account of the ECB’s role as a central bank, the Executive Board considers that the publicationofacash-flowstatementwouldnotprovidethereadersofthefinancialstatementswithany additional relevant information.
In accordance with Article 27 of the Statute of the ESCB, and on the basis of a recommendation of the Governing Council, the EU Council has approved the appointment of PricewaterhouseCoopers Aktiengesellschaft Wirtschaftsprüfungsgesellschaft as the external auditors of the ECB for a five-yearperioduptotheendofthefinancialyear2012.
6 Decision ECB/2010/29 of 13 December 2010 on the issue of euro banknotes (recast), OJ L 35, 9.2.2011, p. 26.7 “Banknoteallocationkey”meansthepercentagesthatresultfromtakingintoaccounttheECB’sshareinthetotaleurobanknoteissue
and applying the subscribed capital key to the NCBs’ share in that total.8 Decision ECB/2010/23 of 25 November 2010 on the allocation of monetary income of the national central banks of Member States whose
currency is the euro (recast), OJ L 35, 9.2.2011, p. 17, as amended.9 Decision ECB/2010/24 of 25 November 2010 on the interim distribution of the income of the European Central Bank on euro banknotes in
circulation and arising from securities purchased under the Securities Markets Programme (recast), OJ L 6, 11.1.2011, p. 35, as amended.

189ECB
Annual Report2012
1 Gold and Gold reCeivableS
As at 31 December 2012 the ECB held 16,142,871 ounces 10offinegold(2011:16,142,871ounces).No transactions in gold took place in 2012. The increase in the euro equivalent value of the ECB’s holdingsoffinegoldwasduetotheriseinthepriceofgoldduring2012(see“Goldandforeigncurrency assets and liabilities” in the notes on accounting policies and note 16, “Revaluationaccounts”).
2 ClaimS on non-euro area and euro area reSidentS denominated in ForeiGn CurrenCy
2.1 reCeivableS From the imF
This asset represents the ECB’s holdings of SDRs as at 31 December 2012. It arises as the result of a two-way SDR buying and selling arrangement with the International Monetary Fund (IMF), whereby the IMF is authorised to arrange sales or purchases of SDRs against euro, on behalf of the ECB, within minimum and maximum holding levels. For accounting purposes, SDRs are treated as aforeigncurrency(see“Goldandforeigncurrencyassetsandliabilities”inthenotesonaccountingpolicies).
2.2 balanCeS with banKS and SeCurity inveStmentS, eXternal loanS and other eXternal aSSetS; and ClaimS on euro area reSidentS denominated in ForeiGn CurrenCy
These two items consist of balances with banks and loans denominated in foreign currency, and investments in securities denominated in US dollars and Japanese yen.
Claims on non-euro area residents 2012€
2011€
Change€
Current accounts 1,503,909,190 967,861,820 536,047,370Money market deposits 345,932,462 598,657,080 (252,724,618)Reverse repurchase agreements 56,844,020 623,065,152 (566,221,132)Security investments 38,763,272,753 38,573,796,435 189,476,318
Total 40,669,958,425 40,763,380,487 (93,422,062)
Claims on euro area residents 2012€
2011€
Change€
Current accounts 1,189,425 1,439,838 (250,413)Money market deposits 2,836,986,601 4,826,273,769 (1,989,287,168)
Total 2,838,176,026 4,827,713,607 (1,989,537,581)
The decrease in these items in 2012 was mainly due to the depreciation of both the Japanese yen and the US dollar against the euro.
10 This corresponds to 502.1 tonnes.
noteS on the balanCe Sheet

190ECBAnnual Report2012
The ECB’s net foreign currency holdings of US dollars and Japanese yen,11 as at 31 December 2012, were as follows:
2012Currency in millions
2011Currency in millions
US dollars 45,235 44,614Japanese yen 1,046,552 1,041,238
3 ClaimS on non-euro area reSidentS denominated in euro
3.1 balanCeS with banKS, SeCurity inveStmentS and loanS
As at 31 December 2011 this item consisted of a claim on a non-euro area central bank in connection with an agreement on repurchase transactions established with the ECB. Under this agreement the non-euro area central bank can borrow euro against eligible collateral in order to support its domestic liquidity-providing operations. No related claims remained outstanding as at 31 December 2012.
4 other ClaimS on euro area Credit inStitutionS denominated in euro
As at 31 December 2011 this item consisted mainly of claims that arose under reverse repurchase transactions,conductedinthecontextofcoveredbondlendingoperations(seenote9,“Otherliabilitiestoeuroareacreditinstitutionsdenominatedineuro”).Norelatedclaimsremainedoutstandingasat31 December 2012.
As at 31 December 2012 this item consisted of a current account with a euro area resident.
5 SeCuritieS oF euro area reSidentS denominated in euro
5.1 SeCuritieS held For monetary poliCy purpoSeS
As at 31 December 2012 this item consisted of securities acquired by the ECB within the scope of the two covered bond purchase programmes12 and the Securities Markets Programme.13
2012€
2011€
Change€
First covered bond purchase programme 4,426,521,354 4,814,370,827 (387,849,473)Second covered bond purchase programme 1,504,280,207 212,604,879 1,291,675,328Securities Markets Programme 16,124,715,128 17,792,153,062 (1,667,437,934)
Total 22,055,516,689 22,819,128,768 (763,612,079)
11 These holdings comprise assets minus liabilities denominated in the given foreign currency that are subject to foreign currency revaluation.Theyareincludedundertheheadings“Claimsonnon-euroarearesidentsdenominatedinforeigncurrency”,“Claimsoneuroarearesidentsdenominatedinforeigncurrency”,“Accrualsandprepaidexpenses”,“Liabilitiestonon-euroarearesidentsdenominatedin foreign currency”, “Off-balance-sheet instruments revaluation differences” (liabilities side) and “Accruals and income collected inadvance” and take into account foreign exchange forward and swap transactions included in off-balance-sheet items. Price gains onfinancialinstrumentsdenominatedinforeigncurrencyarisingasaresultofrevaluationsarenotincluded.
12 As announced in the ECB’s press releases of 4 June 2009 and 6 October 2011.13 AsannouncedintheECB’spressreleaseof10May2010onmeasurestoaddressseveretensionsinfinancialmarkets.

191ECB
Annual Report2012
Thepurchasesunder thefirstcoveredbondpurchaseprogrammewerefully implementedby theend of June 2010. The net decrease in this item in 2012 was mainly due to redemptions.
Under the second covered bond purchase programme, established in October 2011, the ECB and the NCBs purchased euro-denominated covered bonds issued in the euro area with the objective of easing funding conditions for credit institutions and enterprises, as well as encouraging credit institutions to maintain and expand lending to their clients. The net increase in this item in 2012 was due to purchases in that year in the period until the programme ended on 31 October 2012.
Under the Securities Markets Programme, established in May 2010, the ECB and the NCBs were able to purchase euro area public and private debt securities in order to address the malfunctioning of certain segments of the euro area debt securities markets and restore the proper functioning of the monetary policy transmission mechanism. The net decrease in this item in 2012 was due to redemptions that more than offset the impact of purchases and of the amortisation of net discounts in that year. The Governing Council decided on 6 September 2012 to end the Securities Markets Programme.14
Part of the ECB’s holdings under the Securities Markets Programme comprises debt securities issued by the Hellenic Republic. In February 2012 the Eurosystem central banks exchanged their holdings of Greek government bonds purchased under the Securities Markets Programme for new securities issued by the Hellenic Republic. The newly acquired securities have the same characteristics as those purchased under the Securities Markets Programme in terms of their nominal values, coupon rates, interest payment dates and redemption dates, and were not included on the list of eligible securities that were subject to restructuring in the context of the private sector involvement (PSI) initiative. Consequently, the ECB did not incur any realised losses on its holdings of Greek government bonds.
Securities purchased under the Securities Markets Programme and the covered bond purchase programmesareclassifiedasheld-to-maturitysecuritiesandarevaluedonanamortisedcostbasissubject to impairment (see“Securities” in thenotesonaccountingpolicies).Annual impairmenttests are conducted on the basis of the information available and estimated recoverable amounts as at the year-end.
In the context of the impairment test conducted as at the end of 2012 on securities purchased under theSecuritiesMarkets Programme, theGoverningCouncil identified two impairment indicatorsin particular, relating to the holdings of Greek government bonds, which occurred in the course of2012.ThefirstwastherestructuringinMarch2012ofpartofthedebtissuedbytheHellenicRepublic in the context of the PSI initiative and the second was the debt buy-back operation carried out by the Greek government in December 2012. The Governing Council considered that the occurrence of these impairment indicators did not warrant an impairment of the ECB’s holdings since, on the basis of the information available as at 31 December 2012, there was no evidence of changes in the estimated future cashflows.No impairment losseswere therefore recorded atthe year-end on the ECB’s holdings of Greek government bonds under the Securities Markets Programme. Furthermore, no impairment losses were recorded in respect of the other securities purchased under the Securities Markets Programme.
14 As announced in the ECB’s press release of 6 September 2012 on the technical features of Outright Monetary Transactions.

192ECBAnnual Report2012
With regard to the impairment test conducted on securities purchased under the two covered bond purchase programmes, the Governing Council considered the fact that a number of issuers underwent restructuring in 2012. However, these restructuring operations have not affected the estimatedfuturecashflowsexpectedtobereceivedbytheECBandthereforenoimpairmentlosseswere recorded in respect of these holdings.
TheGoverningCouncilassessesonaregularbasisthefinancialrisksassociatedwiththesecuritiesheld under the Securities Markets Programme and the two covered bond purchase programmes.
6 intra-euroSyStem ClaimS
6.1 ClaimS related to the alloCation oF euro banKnoteS within the euroSyStem
ThisitemconsistsoftheclaimsoftheECBvis-à-vistheeuroareaNCBsrelatingtotheallocationofeurobanknoteswithintheEurosystem(see“Banknotesincirculation”inthenotesonaccountingpolicies). The remuneration of these claims is calculated daily at the latest available marginal interestrateusedbytheEurosysteminitstendersformainrefinancingoperations(seenote24.2,“InterestincomearisingfromtheallocationofeurobanknoteswithintheEurosystem”).
6.2 other ClaimS within the euroSyStem (net)
In2012thisitemconsistedmainlyoftheTARGET2balancesoftheeuroareaNCBsvis-à-vistheECB(see“Intra-ESCBbalances/intra-Eurosystembalances”inthenotesonaccountingpolicies).The net decrease in this position resulted mainly from a reduction in the outstanding amounts related to back-to-back swap transactions conducted with NCBs in connection with US dollar liquidity-providing operations. The impact of this reduction was partially offset by amounts paid fromeuroareatonon-euroarearesidentsthatweresettledinTARGET2(seenote11,“Liabilitiestonon-euroarearesidentsdenominatedineuro”).
The remuneration of TARGET2 positions, with the exception of balances arising from back-to-back swap transactions in connection with US dollar liquidity-providing operations, is calculated daily at thelatestavailablemarginalinterestrateusedbytheEurosysteminitstendersformainrefinancingoperations.
ThisitemalsoincludedtheamountduetoeuroareaNCBsinrespectoftheECB’sinterimprofitdistribution(see“Interimprofitdistribution”inthenotesonaccountingpolicies).
2012€
2011€
Due from euro area NCBs in respect of TARGET2 981,081,428,771 842,032,488,071Due to euro area NCBs in respect of TARGET2 (955,833,285,908) (791,987,384,417)DuetoeuroareaNCBsinrespectoftheECB’sinterimprofitdistribution (574,627,292) (652,000,000)
Other claims within the Eurosystem (net) 24,673,515,571 49,393,103,654

193ECB
Annual Report2012
7 other aSSetS
7.1 tanGible and intanGible FiXed aSSetS
These assets comprised the following items on 31 December 2012:
2012€
2011€
Change€
CostLand and buildings 170,824,151 168,916,034 1,908,117Computer hardware and software 64,633,290 187,324,734 (122,691,444)Equipment, furniture, plant in building and motor vehicles 13,926,711 30,891,846 (16,965,135)Assets under construction 529,636,881 339,020,767 190,616,114Otherfixedassets 7,508,349 1,656,957 5,851,392
Total cost 786,529,382 727,810,338 58,719,044
Accumulated depreciationLand and buildings (82,957,070) (79,214,734) (3,742,336)Computer hardware and software (51,687,755) (177,313,517) 125,625,762Equipment, furniture, plant in building and motor vehicles (13,274,149) (29,730,082) 16,455,933Otherfixedassets (135,576) (202,512) 66,936
Total accumulated depreciation (148,054,550) (286,460,845) 138,406,295
Net book value 638,474,832 441,349,493 197,125,339
Theincreaseinthecategory“Assetsunderconstruction”wasduetoactivitiesrelatedtotheECB’snew premises in 2012.
The decrease in both the cost and the accumulated depreciation in the categories “Computerhardwareandsoftware”and“Equipment,furniture,plantinbuildingandmotorvehicles”reflectedmainly the derecognition of obsolete items that were no longer in use at the end of 2012.
Theincreaseinthecategory“Otherfixedassets”wasprimarilyduetoalicencefeepaidin2012toacquire the intellectual property rights and know-how for technical features relating to the second seriesofeurobanknotes.Thederecognitionin2012ofotherfixedassetsthatwereobsoleteandnolonger in use also had an impact on both the cost and the accumulated depreciation in respect of this category.
7.2 other FinanCial aSSetS
This item consists of the investment of the ECB’s own funds 15 held as a direct counterpart to the capitalandreservesoftheECB,aswellasotherfinancialassetswhichinclude3,211sharesintheBank for International Settlements (BIS) at the acquisition cost of €41.8 million.
15 Repurchase agreements conducted in the context of themanagement of the own funds portfolio are reported under “Sundry” on theliabilitiesside(seenote14.3,“Sundry”).

194ECBAnnual Report2012
The components of this item are as follows:
2012€
2011€
Change€
Current accounts in euro 5,193,816 4,934,974 258,842Securities denominated in euro 16,349,560,714 13,285,988,281 3,063,572,433Reverse repurchase agreements in euro 2,702,963,941 2,707,978,069 (5,014,128)Otherfinancialassets 41,920,325 41,924,130 (3,805)
Total 19,099,638,796 16,040,825,454 3,058,813,342
The net increase in this item was due mainly to the investment in the own funds portfolio of (a) amounts received from the euro area NCBs in 2012 in respect of the third instalment of their contributions to the increase in theECB’ssubscribedcapital in2010 (seenote17,“Capitalandreserves”); and (b) thecounterpartof theamount transferred to theECB’sprovision for foreignexchange rate, interest rate, credit and gold price risks in 2011.
7.3 oFF-balanCe-Sheet inStrumentS revaluation diFFerenCeS
This item is composed mainly of valuation changes in swap and forward transactions in foreign currencythatwereoutstandingon31December2012(seenote21,“Foreignexchangeswapandforwardtransactions”).Thesevaluationchangesaretheresultoftheconversionofsuchtransactionsinto their euro equivalents at the exchange rates prevailing on the balance sheet date, compared with the euro values resulting from the conversion of the transactions at the average cost of the respective foreigncurrencyonthatdate(see“Off-balance-sheetinstruments”and“Goldandforeigncurrencyassetsandliabilities”inthenotesonaccountingpolicies).
Valuation gains on outstanding interest rate swap transactions are also included in this item (seenote20,“Interestrateswaps”).
7.4 aCCrualS and prepaid eXpenSeS
In 2012 this item included accrued coupon interest on securities, including outstanding interest paid atacquisition,amountingto€792.7million(2011:€816.8million)(seenote2.2,“Balanceswithbanks and security investments, external loans and other external assets; and Claims on euro area residentsdenominatedinforeigncurrency”,note5,“Securitiesofeuroarearesidentsdenominatedineuro”,andnote7.2,“Otherfinancialassets”).
It also included accrued interest receivable on the TARGET2 balances due from euro area NCBs for thefinalmonthof2012,amountingto€650.4million(2011:€752.6million),andaccruedinterestreceivable on the ECB’s claims related to the allocation of euro banknotes within the Eurosystem forthefinalquarteroftheyear(see“Banknotesincirculation”inthenotesonaccountingpolicies),amounting to €136.7 million (2011: €230.6 million).
Otheraccruedincome,includingaccruedinterestincomeonotherfinancialassets,andmiscellaneousprepayments are also reported under this item.

195ECB
Annual Report2012
7.5 Sundry
This item consisted mainly of positive balances related to swap and forward transactions in foreign currencythatwereoutstandingon31December2012(seenote21,“Foreignexchangeswapandforwardtransactions”).Thesebalancesarisefromtheconversionofsuchtransactionsintotheireuroequivalents at the respective currency’s average cost on the balance sheet date, compared with the eurovaluesatwhichthetransactionswereinitiallyrecorded(see“Off-balance-sheetinstruments”in the notes on accounting policies).
ThisitemalsoincludedtheaccruedamountsoftheECB’sinterimprofitdistribution(see“Interimprofit distribution” in the notes on accounting policies and note 6.2, “Other claims within theEurosystem(net)”).
A claim against the German Federal Ministry of Finance in respect of recoverable value added tax and other indirect taxes paid is also included under this heading. Such taxes are refundable under the terms of Article 3 of the Protocol on the privileges and immunities of the European Union, which applies to the ECB by virtue of Article 39 of the Statute of the ESCB.
8 banKnoteS in CirCulation
ThisitemconsistsoftheECB’sshare(8%)ofthetotaleurobanknotesincirculation(see“Banknotesincirculation”inthenotesonaccountingpolicies).
9 other liabilitieS to euro area Credit inStitutionS denominated in euro
As at 31 December 2011 this item consisted of liabilities that arose under repurchase agreements conducted in the context of the covered bond lending operations. These lending operations are implemented through matched repurchase transactions, whereby amounts received under the repurchase agreements are fully and simultaneously reinvested with the same counterparty under a reverserepurchaseagreement(seenote4,“Otherclaimsoneuroareacreditinstitutionsdenominatedineuro”).Noliabilitieswereoutstandingasat31December2012.
10 liabilitieS to other euro area reSidentS denominated in euro
10.1 other liabilitieS
This item comprises deposits by members of the Euro Banking Association (EBA) which are used in order to provide the ECB with collateral in respect of the EBA’s payments settled through the TARGET2 system.
11 liabilitieS to non-euro area reSidentS denominated in euro
As at 31 December 2012 this item included an amount of €44.0 billion (2011: €13.0 billion), consisting of balances held with the ECB by non-euro area NCBs and other central banks that arise from, or are the counterpart of, transactions processed via the TARGET2 system.

196ECBAnnual Report2012
The remainder of this item comprised an amount of €6.8 billion (2011: €64.2 billion) arising from the temporary reciprocal currency arrangement with the Federal Reserve. Under this arrangement, US dollars are provided by the Federal Reserve to the ECB by means of a temporary swap line, with the aim of offering short-term US dollar funding to Eurosystem counterparties. The ECB simultaneously enters into back-to-back swap transactions with euro area NCBs, which use the resulting funds to conduct US dollar liquidity-providing operations with Eurosystem counterparties in the form of reverse transactions. The back-to-back swap transactions result in intra-Eurosystem balances between the ECB and the NCBs. The swap transactions conducted with the Federal Reserve and the euro area NCBs also result in forward claims and liabilities that are recorded in off-balance-sheetaccounts(seenote21,“Foreignexchangeswapandforwardtransactions”).
12 liabilitieS to non-euro area reSidentS denominated in ForeiGn CurrenCy
12.1 depoSitS, balanCeS and other liabilitieS
In 2011 this item consisted of liabilities that arose under repurchase agreements conducted with non-euro area residents in connection with the management of the foreign currency reserves of the ECB. No balances were outstanding as at 31 December 2012.
13 intra-euroSyStem liabilitieS
13.1 liabilitieS equivalent to the tranSFer oF ForeiGn reServeS
These represent the liabilities to the euro area NCBs that arose from the transfer of foreign reserve assets to the ECB when they joined the Eurosystem. No changes occurred in 2012.
The remuneration of these liabilities is calculated daily at the latest available marginal interest rate usedby theEurosystem in its tenders formain refinancingoperations, adjusted to reflect azeroreturnonthegoldcomponent(seenote24.3,“RemunerationofNCBs’claimsinrespectofforeignreservestransferred”).
Since 1 January 2011€
Nationale Bank van België/Banque Nationale de Belgique 1,397,303,847Deutsche Bundesbank 10,909,120,274Eesti Pank 103,115,678Central Bank of Ireland 639,835,662Bank of Greece 1,131,910,591Banco de España 4,783,645,755Banque de France 8,192,338,995Banca d’Italia 7,198,856,881Central Bank of Cyprus 78,863,331Banque centrale du Luxembourg 100,638,597Central Bank of Malta 36,407,323De Nederlandsche Bank 2,297,463,391Oesterreichische Nationalbank 1,118,545,877Banco de Portugal 1,008,344,597Banka Slovenije 189,410,251NárodnábankaSlovenska 399,443,638SuomenPankki–FinlandsBank 722,328,205
Total 40,307,572,893

197ECB
Annual Report2012
14 other liabilitieS
14.1 oFF-balanCe-Sheet inStrumentS revaluation diFFerenCeS
This item is composed mainly of valuation changes in swap and forward transactions in foreign currencythatwereoutstandingon31December2012(seenote21,“Foreignexchangeswapandforwardtransactions”).Thesevaluationchangesaretheresultoftheconversionofsuchtransactionsinto their euro equivalents at the exchange rates prevailing on the balance sheet date, compared with the euro values resulting from the conversion of the transactions at the average cost of the respective foreigncurrencyonthatdate(see“Off-balance-sheetinstruments”and“Goldandforeigncurrencyassetsandliabilities”inthenotesonaccountingpolicies).
Valuation losses on outstanding interest rate swaps are also included in this item (see note 20, “Interestrateswaps”).
14.2 aCCrualS and inCome ColleCted in advanCe
As at 31 December 2012 the two main items under this heading were accrued interest payable onTARGET2balancesdue toNCBs for thefinalmonthof 2012, amounting to €641.1million(2011: €770.1 million), and accrued interest payable to the NCBs for the whole of 2012 in respect oftheirclaimsrelatingtoforeignreservestransferredtotheECB(seenote13,“Intra-Eurosystemliabilities”),amountingto€306.9million(2011:€434.0million).Accrualsonfinancialinstrumentsand other accruals are also reported in this item.
Also included under this heading is a contribution to the ECB from the City of Frankfurt of €15.3 million for the preservation of the Grossmarkthalle, which is a listed building, in connection with the construction of the ECB’s new premises. This amount will be netted against the cost of the buildingonceitisavailableforuse(seenote7.1,“Tangibleandintangiblefixedassets”).
14.3 Sundry
This item included outstanding repurchase transactions of €360.1 million (2011: €360.0 million) conducted in connection with the management of the ECB’s own funds (see note 7.2, “Otherfinancialassets”).
It also included negative balances related to swap and forward transactions in foreign currency thatwereoutstandingon31December2012(seenote21,“Foreignexchangeswapandforwardtransactions”). These balances arise from the conversion of such transactions into their euroequivalents at the respective currency’s average cost on the balance sheet date, compared with the eurovaluesatwhichthetransactionswereinitiallyrecorded(see“Off-balance-sheetinstruments”in the notes on accounting policies).
In addition, it included the ECB’s net liability in respect of the post-employment and other long-termbenefitsofitsstaffandthemembersoftheExecutiveBoard,amountingto€109.8million,as described below (see “The ECB’s pension plan, other post-employment benefits and other long-termbenefits”inthenotesonaccountingpolicies).

198ECBAnnual Report2012
the eCb’S penSion plan, other poSt-employment beneFitS and other lonG-term beneFitS
The amounts recognised in the Balance Sheet in respect of post-employment and other long-term employeebenefitswereasfollows:
2012 Staff
€ millions
2012 Executive
Board € millions
2012 Total
€ millions
2011 Staff
€ millions
2011 Executive
Board € millions
2011 Total
€ millions
Present value of obligation 761.3 17.8 779.1 549.1 17.9 567.0Fair value of plan assets (522.7) - (522.7) (418.4) - (418.4)Unrecognised actuarial gains/(losses) (144.5) (2.1) (146.6) (35.6) (0.5) (36.1)
Liability recognised in the Balance Sheet 94.1 15.7 109.8 95.1 17.4 112.5
In 2012 the present value of the obligation vis-à-vis staff of €761.3million included unfundedbenefitsamounting to€109.1million(2011:€86.6million) relating topost-employmentbenefitsotherthanpensionsandtootherlong-termbenefits.Unfundedarrangementsarealsoinplaceforthepost-employmentandotherlong-termbenefitsofmembersoftheExecutiveBoard.
TheamountsrecognisedintheProfitandLossAccountin2012wereasfollows:
2012 Staff
€ millions
2012 Executive
Board € millions
2012 Total
€ millions
2011 Staff
€ millions
2011 Executive
Board € millions
2011 Total
€ millions
Current service cost 29.0 1.3 30.3 31.1 1.4 32.5Interest on obligation 24.5 0.9 25.4 24.2 0.8 25.0Expected return on plan assets (21.6) - (21.6) (20.1) - (20.1)Net actuarial (gains)/losses recognised in the year 0.7 0 0.7 6.2 (0.6) 5.6
Totalincludedin“Staffcosts” 32.6 2.2 34.8 41.4 1.6 43.0
Changes in the present value of the obligation in 2012 were as follows:
2012 Staff
€ millions
2012 Executive
Board € millions
2012 Total
€ millions
2011 Staff
€ millions
2011 Executive
Board € millions
2011 Total
€ millions
Opening obligation 549.1 17.9 567.0 539.6 15.9 555.5Service cost 29.0 1.3 30.3 31.1 1.4 32.5Interest on obligation 24.5 0.9 25.4 24.2 0.8 25.0Contributions paid by plan participants 16.5 0.1 16.6 16.3 0.2 16.5Other net changes in liabilities representing plan participants’ contributions 1 8.9 0 8.9 (1.9) 0 (1.9)Benefitspaid (6.3) (4.0) (10.3) (5.4) (0.8) (6.2)Actuarial (gains)/losses 139.6 1.6 141.2 (54.8) 0.4 (54.4)
Closing obligation 761.3 17.8 779.1 549.1 17.9 567.0
1) Amounts included under this heading represent the return on the funds arising from the voluntary contributions of plan participants.
Actuarialgainsfor2011onthedefinedbenefitobligationrelatingtostaffamountedto€54.8million.Thisamount included the effects of (a) lower than expected growth in the value of the minimum guaranteed benefits; (b)adownward revisionofexpectedcredited returnson the fundunitswithanunderlying

199ECB
Annual Report2012
capital guarantee which are used for calculating the future pensions and consequently the current value ofthedefinedbenefitobligation;and(c)lowerprojectedgrowthinmedicalplanpremiums.
Theactuariallossesof€139.6milliononthedefinedbenefitobligationrelatingtostafffor2012aroseprimarily owing to the decrease in the discount rate from 5.00% to 3.50%. The resulting increase in the closing obligation was only partially offset by the impact of a reduction in the expected future increase in the guaranteed benefits,which are based on unit price developments, aswell as theimpact of a reduction in the assumed future increase in pensions from 1.65% to 1.40%.
Benefitspaidin2012includethesettlementofpensionrightsofsomemembersoftheExecutiveBoard who left the ECB.
Changes in 2012 in the fair value of plan assets relating to staff, including those arising from voluntary contributions paid by plan participants, were as follows:
2012€ millions
2011€ millions
Opening fair value of plan assets 418.4 391.6Expected return 21.6 20.1Actuarial gains/(losses) 30.0 (25.0)Contributions paid by employer 33.6 22.7Contributions paid by plan participants 16.5 16.3Benefitspaid (6.3) (5.4)Other net changes in assets representing plan participants’ contributions 8.9 (1.9)
Closing fair value of plan assets 522.7 418.4
In line with the Conditions of Employment for Staff of the European Central Bank, a long-term valuation of the ECB’s pension plan was carried out by the ECB’s actuaries as at 31 December 2011. Following this valuation, and acting on actuarial advice, the Governing Council approved on 2 August 2012 an annual supplementary contribution of €10.3 million, to be paid for a period of twelve years starting in 2012. This decision will be reviewed in 2014. The increase in contributions paid by the ECB in2012mainlyreflectedthepaymentofthesupplementarycontributiondueinthatyear.
Actuarialgainsonplanassetsin2012reflectedthehigherthanexpectedreturnsonthefundunitsin that year.
In preparing the valuations referred to in this note, the actuaries have used assumptions which the Executive Board has accepted for the purposes of accounting and disclosure. The principal assumptionsusedforthepurposesofcalculatingthebenefitsschemeliabilityareasfollows:
2012%
2011%
Discount rate 3.50 5.00Expected return on plan assets 1 4.50 6.00General future salary increases 2 2.00 2.00Future pension increases 3 1.40 1.65
1)TheseassumptionswereusedforcalculatingboththeECB’sdefinedbenefitobligation,whichisfundedbyassetswithanunderlyingcapital guarantee, and the expected return on plan assets for the forthcoming year.
2) In addition, allowance is made for prospective individual salary increases of up to 1.8% per annum, depending on the age of the plan participants.3) According to the ECB’s pension plan rules, pensions will be increased annually. If general salary adjustments for ECB employees were belowpriceinflation,anyincreaseinpensionswillbeinlinewiththegeneralsalaryadjustments.Ifthegeneralsalaryadjustmentsexceedpriceinflation,theywillbeappliedtodeterminetheincreaseinpensions,providedthatthefinancialpositionoftheECB’spensionplanpermits such an increase.

200ECBAnnual Report2012
15 proviSionS
This item consists of a provision for foreign exchange rate, interest rate, credit and gold price risks as well as other miscellaneous provisions.
The provision for foreign exchange rate, interest rate, credit and gold price risks will be used to the extent deemed necessary by the Governing Council to offset future realised and unrealised losses, in particular valuation losses not covered by the revaluation accounts. The size of and continuing requirement for this provision is reviewed annually, based on the ECB’s assessment of its exposure to the above risks. This assessment takes a range of factors into account, including in particular the level of holdings of risk-bearing assets, the extent of materialised risk exposures in the current financialyear,projectedresultsforthecomingyear,andariskassessmentinvolvingcalculationsofValues at Risk (VaR) on risk-bearing assets, which is applied consistently over time. The provision, together with any amount held in the general reserve fund, may not exceed the value of the ECB’s capital paid up by the euro area NCBs.
As at 31 December 2011 the provision for foreign exchange rate, interest rate, credit and gold price risks amounted to €6,363,107,289. Taking the results of its assessment into account, the Governing Council decided to transfer, as at 31 December 2012, an amount of €1,166,175,000 to theprovision.ThistransferreducedtheECB’snetprofitfor2012to€998,030,635andincreasedthe size of the provision to €7,529,282,289. Following the increase in the ECB’s paid-up capital in2012(seenote17,“Capitalandreserves”),thisamountcorrespondstothevalueoftheECB’scapital paid up by the euro area NCBs as at 31 December 2012.
16 revaluation aCCountS
These accounts represent revaluation balances arising from unrealised gains on assets, liabilities and off-balance-sheet instruments (see “Income recognition”, “Gold and foreign currency assets andliabilities”,“Securities”and“Off-balance-sheetinstruments”inthenotesonaccountingpolicies).
2012 €
2011 €
Change €
Gold 16,433,862,811 15,718,491,496 715,371,315Foreign currency 6,053,396,675 7,975,683,173 (1,922,286,498)Securities and other instruments 984,781,810 630,756,103 354,025,707
Total 23,472,041,296 24,324,930,772 (852,889,476)
The foreign exchange rates used for the year-end revaluation were as follows:
Exchange rates 2012 2011
US dollars per euro 1.3194 1.2939Japanese yen per euro 113.61 100.20Euro per SDR 1.1657 1.1867Europerfineounceofgold 1,261.179 1,216.864

201ECB
Annual Report2012
17 Capital and reServeS
17.1 Capital
With effect from 29 December 2010 the ECB increased its subscribed capital by €5 billion to €10,760,652,403.16 In addition, the Governing Council decided that the euro area NCBs would pay their additional capital contributions resulting from this increase in three equal annual instalments.17 Thefirstandsecondinstalmentswerepaidon29December2010and28December2011respectively.Thefinalinstalment,amountingto€1,166,175,000,waspaidon27December2012.
The ECB’s capital key and subscribed capital remained unchanged in 2012. Owing to the payment ofthefinalinstalmentofthecapitalcontributionsbytheNCBsoftheeuroarea,thepaid-upcapitalof the ECB increased to €7,650,458,669, as shown in the table below:18
Capital key
%
Subscribed capital €
Paid-up capital 2012
€
Paid-up capital 2011
€
Nationale Bank van België/ Banque Nationale de Belgique 2.4256 261,010,385 261,010,385 220,583,718Deutsche Bundesbank 18.9373 2,037,777,027 2,037,777,027 1,722,155,361Eesti Pank 0.1790 19,261,568 19,261,568 16,278,234Central Bank of Ireland 1.1107 119,518,566 119,518,566 101,006,900Bank of Greece 1.9649 211,436,059 211,436,059 178,687,726Banco de España 8.3040 893,564,576 893,564,576 755,164,576Banque de France 14.2212 1,530,293,899 1,530,293,899 1,293,273,899Banca d’Italia 12.4966 1,344,715,688 1,344,715,688 1,136,439,021Central Bank of Cyprus 0.1369 14,731,333 14,731,333 12,449,666Banque centrale du Luxembourg 0.1747 18,798,860 18,798,860 15,887,193Central Bank of Malta 0.0632 6,800,732 6,800,732 5,747,399De Nederlandsche Bank 3.9882 429,156,339 429,156,339 362,686,339Oesterreichische Nationalbank 1.9417 208,939,588 208,939,588 176,577,921Banco de Portugal 1.7504 188,354,460 188,354,460 159,181,126Banka Slovenije 0.3288 35,381,025 35,381,025 29,901,025NárodnábankaSlovenska 0.6934 74,614,364 74,614,364 63,057,697SuomenPankki–FinlandsBank 1.2539 134,927,820 134,927,820 114,029,487
Subtotal for euro area NCBs 69.9705 7,529,282,289 7,529,282,289 6,363,107,289
Българсканароднабанка (Bulgarian National Bank) 0.8686 93,467,027 3,505,014 3,505,014Českánárodníbanka 1.4472 155,728,162 5,839,806 5,839,806Danmarks Nationalbank 1.4835 159,634,278 5,986,285 5,986,285Latvijas Banka 0.2837 30,527,971 1,144,799 1,144,799Lietuvos bankas 0.4256 45,797,337 1,717,400 1,717,400Magyar Nemzeti Bank 1.3856 149,099,600 5,591,235 5,591,235Narodowy Bank Polski 4.8954 526,776,978 19,754,137 19,754,137BancaNaţionalăaRomâniei 2.4645 265,196,278 9,944,860 9,944,860
16 Decision ECB/2010/26 of 13 December 2010 on the increase of the European Central Bank’s capital, OJ L 11, 15.1.2011, p. 53.17 Decision ECB/2010/27 of 13 December 2010 on the paying-up of the increase of the European Central Bank’s capital by the national
central banks of Member States whose currency is the euro, OJ L 11, 15.1.2011, p. 54 and Decision ECB/2010/34 of 31 December 2010 on the paying-up of capital, transfer of foreign reserve assets and contributions by Eesti Pank to the European Central Bank’s reserves and provisions, OJ L 11, 15.1.2011, p. 58.
18 Individual amounts are shown rounded to the nearest euro. Consequently, totals and subtotals in the tables of this section may not add up due to rounding.

202ECBAnnual Report2012
Capital key
%
Subscribed capital €
Paid-up capital 2012
€
Paid-up capital 2011
€Sveriges Riksbank 2.2582 242,997,053 9,112,389 9,112,389Bank of England 14.5172 1,562,145,431 58,580,454 58,580,454
Subtotal for non-euro area NCBs 30.0295 3,231,370,113 121,176,379 121,176,379
Total 100.0000 10,760,652,403 7,650,458,669 6,484,283,669
The non-euro area NCBs are required to pay up 3.75% of their share in the ECB’s subscribed capital as a contribution to the operational costs of the ECB. This contribution amounted to €121,176,379 at the end of 2012. The non-euro area NCBs are not entitled to receive any share of the distributable profitsoftheECB,noraretheyliabletofundanylossoftheECB.
oFF-balanCe-Sheet inStrumentS
18 automated SeCurity lendinG proGramme
As part of the management of the ECB’s own funds, the ECB has an automated security lending programme agreement in place, whereby an appointed agent enters into security lending transactions on behalf of the ECB with a number of counterparties, designated by the ECB as eligible counterparties. Under this agreement, reverse transactions with a value of €1.3 billion (2011: €1.2 billion) were outstanding as at 31 December 2012.
19 intereSt rate FutureS
As at 31 December 2012 the following foreign currency transactions, presented at year-end market rates, were outstanding:
Foreign currency interest rate futures 2012 Contract value
€
2011 Contract value
€
Change €
Purchases 2,460,891,314 1,651,132,236 809,759,078Sales 6,245,269,283 1,728,229,838 4,517,039,445
These transactions were conducted in the context of the management of the ECB’s foreign reserves.
20 intereSt rate SwapS
Interest rate swap transactions with a contract value of €355.1 million (2011: €225.7 million), presented at year-end market rates, were outstanding as at 31 December 2012. These transactions were conducted in the context of the management of the ECB’s foreign reserves.

203ECB
Annual Report2012
21 ForeiGn eXChanGe Swap and Forward tranSaCtionS
manaGement oF the ForeiGn reServeS
Foreign exchange swap and forward transactions were conducted in 2012 in the context of the management of the ECB’s foreign reserves. The following forward claims and liabilities resulting from these transactions, presented at year-end market rates, remained outstanding as at 31 December 2012:
Foreign exchange swap and forward transactions 2012€
2011€
Change€
Claims 2,110,145,191 2,304,007,744 (193,862,553)Liabilities 1,947,015,270 2,309,882,385 (362,867,115)
liquidity-providinG operationS
US dollar-denominated forward claims on NCBs and liabilities to the Federal Reserve, which arose in connection with the provision of US dollar liquidity to Eurosystem counterparties (see note 11, “Liabilities to non-euro area residents denominated in euro”), were outstandingon 31 December 2012.
22 adminiStration oF borrowinG and lendinG operationS
The ECB is responsible for the administration of the borrowing and lending operations of the EU under the medium-term financial assistance mechanism. In 2012 the ECB processed paymentsrelated to loans granted by the EU to Latvia, Hungary and Romania under this scheme.
In the context of the loan facility agreement between the Member States whose currency is the euro 19 and Kreditanstalt für Wiederaufbau,20 as lenders, the Hellenic Republic, as the borrower, and the Bank of Greece, as the agent of the borrower, the ECB is responsible for processing all related payments on behalf of the lenders and the borrower.
Furthermore, the ECB has an operational role in the administration of loans under the European Financial Stabilisation Mechanism (EFSM) and the European Financial Stability Facility (EFSF). In 2012 the ECB processed payments in relation to loans granted to Ireland and Portugal under the EFSM scheme and loans granted to Ireland, Portugal and Greece under the EFSF scheme.
Moreover, the ECB administers payments in relation to the authorised capital stock and stability support operations of the newly established European Stability Mechanism (ESM).21 In 2012 the ECB processed payments from the Member States whose currency is the euro, in respect of the ESM’s authorised capital stock.
19 Other than the Hellenic Republic and the Federal Republic of Germany.20 Actinginthepublicinterest,subjecttotheinstructionsofandwiththebenefitoftheguaranteeoftheFederalRepublicofGermany.21 The Treaty establishing the European Stability Mechanism entered into force on 27 September 2012.

204ECBAnnual Report2012
23 pendinG lawSuitS
An action for damages was brought against the ECB before the Court of First Instance of the European Communities (CFI) 22 by Document Security Systems Inc. (DSSI), alleging that the ECB had infringed a DSSI patent 23 in the production of euro banknotes. The CFI dismissed DSSI’s action for damages against the ECB.24 The ECB is still pursuing actions to revoke the patent in one particular national jurisdiction and has already succeeded in revoking it in all other relevant jurisdictions.Furthermore,theECBfirmlymaintainsthatithasinnowayinfringedthepatent,andwill consequently also enter a defence against any infringement action brought by DSSI before any competent national court.
As a result of the CFI’s dismissal of DSSI’s action for damages against the ECB, as well as the ECB’s successful actions to date in certain national jurisdictions to revoke national portions of DSSI’s patent, the ECB remains confident that the possibility of payments to DSSI is remote.The ECB is actively monitoring all developments in the continuing litigation.
22 Following the entry into force of the Treaty of Lisbon on 1 December 2009, the name of the Court of First Instance was changed to the General Court.
23 DSSI’s European Patent No 0455 750 B1.24 Order of the Court of First Instance of 5 September 2007, Case T-295/05. Available at www.curia.europa.eu.

205ECB
Annual Report2012
noteS on the proFit and loSS aCCount24 net intereSt inCome
24.1 intereSt inCome on ForeiGn reServe aSSetS
This item includes interest income, net of interest expense, in respect of the ECB’s net foreign reserve assets, as follows:
2012€
2011€
Change€
Interest income on current accounts 726,972 2,088,888 (1,361,916)Interest income on money market deposits 16,294,022 18,279,491 (1,985,469)Interest income on reverse repurchase agreements 1,881,260 1,479,020 402,240Net interest income on securities 197,474,767 254,699,342 (57,224,575)Net interest income on interest rate swaps 2,096,989 6,284,214 (4,187,225)Net interest income on foreign exchange swap and forward transactions 10,581,922 7,686,740 2,895,182
Total interest income on foreign reserve assets 229,055,932 290,517,695 (61,461,763)
Interest expense on current accounts (24,240) (6,126) (18,114)Net interest expense on repurchase agreements (147,992) (291,278) 143,286
Interest income on foreign reserve assets (net) 228,883,700 290,220,291 (61,336,591)
The overall decrease in net interest income in 2012 was due mainly to lower interest income generated on the US dollar portfolio.
24.2 intereSt inCome ariSinG From the alloCation oF euro banKnoteS within the euroSyStem
This item consists of the interest income relating to the ECB’s share of the total euro banknote issue (see“Banknotesincirculation”inthenotesonaccountingpoliciesandnote6.1,“ClaimsrelatedtotheallocationofeurobanknoteswithintheEurosystem”).Thedecreaseinincomein2012mainlyreflectedthefactthattheaveragemainrefinancingratewaslowerthanin2011.
24.3 remuneration oF nCbS’ ClaimS in reSpeCt oF ForeiGn reServeS tranSFerred
Remuneration paid to euro area NCBs on their claims on the ECB in respect of the foreign reserve assets transferredunderArticle30.1of theStatuteof theESCB(seenote13,“Intra-Eurosystemliabilities”)isdisclosedunderthisheading.Thedecreaseinthisremunerationin2012reflectedthefactthattheaveragemainrefinancingratewaslowerthanin2011.
24.4 other intereSt inCome; and other intereSt eXpenSe
In 2012 these items included interest income of €8.8 billion (2011: €6.6 billion) and expenses of €8.9billion(2011:€6.9billion)arisingfromTARGET2balances(seenote6.2,“OtherclaimswithintheEurosystem(net)”,andnote11,“Liabilitiestonon-euroarearesidentsdenominatedineuro”).
They also included net income of €1,107.7 million (2011: €1,002.8 million) on the securities purchased by the ECB under the Securities Markets Programme, and €209.4 million (2011: €165.7 million) on those purchased under the covered bond purchase programmes, including net income on the related security lending transactions. Interest income and interest expense in respect of other assets and liabilities denominated in euro, as well as interest income and interest expense arising from US dollar liquidity-providing operations, are also shown under these headings.

206ECBAnnual Report2012
25 realiSed GainS/loSSeS ariSinG From FinanCial operationS
Netrealisedgainsarisingfromfinancialoperationsin2012wereasfollows:
2012€
2011€
Change€
Net realised price gains 317,311,647 260,059,727 57,251,920Net realised exchange rate and gold price gains 1,524,191 212,159,502 (210,635,311)
Netrealisedgainsarisingfromfinancialoperations 318,835,838 472,219,229 (153,383,391)
Net realised price gains included realised gains on securities, interest rate futures and interest rate swaps.
In 2011 net realised exchange rate and gold price gains arose mainly as a result of Japanese yen outflows in the context of the ECB’s participation in the concerted international intervention in the foreign exchange markets on 18 March 2011.
26 write-downS on FinanCial aSSetS and poSitionS
Write-downsonfinancialassetsandpositionsin2012wereasfollows:
2012€
2011€
Change€
Unrealised price losses on securities (1,737,805) (155,240,641) 153,502,836Unrealised price losses on interest rate swaps (2,442,218) (2,216,642) (225,576)Unrealised exchange rate losses (761) 0 (761)
Total write-downs (4,180,784) (157,457,283) 153,276,499
In 2012 the overall increase in the market value of the securities held in the ECB’s own funds portfolio resulted in substantially lower write-downs compared with 2011.
27 net eXpenSe From FeeS and CommiSSionS
2012€
2011€
Change€
Income from fees and commissions 90,314 77,858 12,456Expenses relating to fees and commissions (2,217,422) (2,058,638) (158,784)
Net expense from fees and commissions (2,127,108) (1,980,780) (146,328)
In 2012 income under this heading consisted of penalties imposed on credit institutions for non-compliance with the minimum reserve requirements. Expenses relate to fees payable on currentaccountsandinconnectionwithinterestratefuturestransactions(seenote19,“Interestratefutures”).

207ECB
Annual Report2012
28 inCome From equity ShareS and partiCipatinG intereStS
DividendsreceivedonshareswhichtheECBholdsintheBIS(seenote7.2,“Otherfinancialassets”)are shown under this heading.
29 other inCome
Other miscellaneous income during 2012 arose mainly from the accrued contributions of the euro area NCBs to the costs incurred by the ECB in connection with a major market infrastructure project.
30 StaFF CoStS
Salaries, allowances, staff insurance and other miscellaneous costs of €184.6 million (2011: €173.1 million) are included under this heading. Also included in this item is an amount of €34.8 million (2011: €43.0 million) recognised in connection with the ECB’s pension plan, other post-employment benefits andother long-termbenefits (see note 14.3, “Sundry”). Staff costs of€1.3 million (2011: €1.3 million) incurred in connection with the construction of the ECB’s new premises have been capitalised and are excluded from this item.
Salaries and allowances, including the emoluments of holders of senior management positions, are modelled in essence on, and are comparable with, the remuneration scheme of the European Union.
Members of the Executive Board receive a basic salary and additional allowances for residence and representation.InthecaseofthePresident,anofficialresidenceownedbytheECBisprovidedinlieu of a residence allowance. Subject to the Conditions of Employment for Staff of the European Central Bank, members of the Executive Board are entitled to household, child and education allowances, depending on their individual circumstances. Basic salaries are subject to a tax for the benefitoftheEuropeanUnionaswellastodeductionsinrespectofcontributionstothepension,medical and accident insurance schemes. Allowances are non-taxable and non-pensionable.
Basic salaries paid to members of the Executive Board in 2012 were as follows:25
2012€
2011€
Jean-Claude Trichet (President until October 2011) - 309,290Mario Draghi (President since November 2011) 374,124 61,858VítorConstâncio(Vice-President) 320,688 318,132Gertrude Tumpel-Gugerell (Board Member until May 2011) - 110,460José Manuel González-Páramo (Board Member until May 2012) 111,345 265,104Lorenzo Bini Smaghi (Board Member until December 2011) - 265,104Jürgen Stark (Board Member until December 2011) - 265,104Peter Praet (Board Member since June 2011) 267,228 154,644Jörg Asmussen (Board Member since January 2012) 267,228 -Benoît Cœuré (Board Member since January 2012) 267,228 -
Total 1,607,841 1,749,696
25 Mr Yves Mersch took office on 15 December 2012. The remuneration that accrued to him up to the end of 2012 was paid in January 2013 and is recorded in the staff costs for the financial year 2013.

208ECBAnnual Report2012
The total allowances paid to the members of the Executive Board and the ECB’s contributions to the medical and accident insurance schemes on their behalf amounted to €509,842 (2011: €646,154).
Inaddition,thebenefitsonappointmentorterminationofservicepaidtoExecutiveBoardmembersjoining or leaving the ECB amounted to €133,437 (2011: €159,594). They are reported under “Administrativeexpenses”intheProfitandLossAccount.
Transitional payments are made to former members of the Executive Board for a limited period after theendof their termsofoffice. In2012thesepayments, relatedfamilyallowancesand theECB’s contributions to the medical and accident insurance schemes of former members amounted to €1,183,285 (2011: €479,665). Pension payments, including related allowances, to former members of the Executive Board or their dependents and contributions to the medical and accident insurance schemes amounted to €324,830 (2011: €321,929). Upon leaving the ECB, two Board Members, MrLorenzoBiniSmaghi andMr JoséManuelGonzález-Páramo, decided to forego their rightsto future monthly pension payments and instead opted to receive the corresponding lump sums, amounting to €2,461,469, in accordance with the conditions of employment. The total payments toformermembersoftheExecutiveBoardarereportedas“Benefitspaid”andreducetheECB’sdefined benefit obligation in respect of the post-employment benefits for the Executive Board (seenote14.3,“Sundry”).
At the end of 2012 the actual full-time equivalent number of staff holding contracts with the ECB was 1,638,26 including 158 with managerial positions. The change in the number of staff during 2012 was as follows:
2012 2011
Total staff as at 1 January 1,609 1,607Newcomers/change of contractual status 370 313Resignations/end of contract (341) (299)Net increase/(decrease) due to changes in part-time working patterns 0 (12)
Total staff as at 31 December 1,638 1,609Average number of staff employed 1,615 1,601
31 adminiStrative eXpenSeS
These cover all other current expenses relating to the renting and maintenance of premises, goods and equipment of a non-capital nature, professional fees and other services and supplies, together with staff-related expenses including recruitment, relocation, installation, training and resettlement expenses.
32 banKnote produCtion ServiCeS
This expense arises owing to the cross-border transportation of euro banknotes between banknote printing works and NCBs, for the delivery of new banknotes, and between NCBs, for the compensation of shortages with surplus stocks. These costs are borne centrally by the ECB.
26 Staff on unpaid leave are excluded. This number includes staff with permanent, fixed or short-term contracts and the participants in the ECB’s Graduate Programme. Staff on maternity or long-term sick leave are also included.


210ECBAnnual Report2012
This note is not part of the financial statements of the ECB for the year 2012.
Pursuant to Article 33 of the Statute of the ESCB, the net profit of the ECB shall be transferred in the following order:
an amount to be determined by the Governing Council, which may not exceed 20% of the net (a) profit,shallbetransferredtothegeneralreservefund,subjecttoalimitequalto100%ofthecapital; and
theremainingnetprofitshallbedistributedtotheshareholdersoftheECBinproportiontotheir(b) paid-up shares.
In the event of a loss incurred by the ECB, the shortfall may be offset against the general reserve fund of the ECB and, if necessary, following a decision by the Governing Council, against the monetary income of the relevant financial year in proportion and up to the amounts allocated to the NCBs in accordance with Article 32.5 of the Statute of the ESCB.1
After the transfer to the risk provision, the ECB’s net profit for 2012 was €998.0 million. Following a decision by the Governing Council, an interim profit distribution, amounting to €574.6 million, was made to the euro area NCBs on 31 January 2013. The Governing Council also decided to make no transfer to the general reserve fund and to distribute the remaining profit for 2012, amounting to €423.4 million, to the euro area NCBs. Profit is distributed to the NCBs in proportion to their paid-up shares.
Non-euro area NCBs are not entitled to receive any share of the ECB’s profit, nor are they liable to fund any loss of the ECB.
2012 €
2011 €
Profitfortheyear 998,030,635 728,136,234Interimprofitdistribution (574,627,292) (652,000,000)Profitfortheyearaftertheinterimprofitdistribution 423,403,343 76,136,234DistributionoftheremainingprofittoNCBs (423,403,343) (76,136,234)
Total 0 0
1 Under Article 32.5 of the Statute of the ESCB, the sum of the NCBs’ monetary income shall be allocated to the NCBs in proportion to their paid-up shares in the capital of the ECB.
note on proFit diStribution/ alloCation oF loSSeS


212ECBAnnual Report2012
ConSolidated balanCe Sheet oF the euroSyStem aS at 31 deCember 2012(eur millionS) 1
aSSetS 31 deCember 2012
31 deCember 2011 2
1 Gold and gold receivables 438,686 423,458
2 Claims on non-euro area residents denominated in foreign currency 250,771 244,6232.1 Receivables from the IMF 86,980 85,6552.2 Balances with banks and security investments,
external loans and other external assets 163,791 158,968
3 Claims on euro area residents denominated in foreign currency 32,727 98,226
4 Claims on non-euro area residents denominated in euro 19,069 25,3554.1 Balances with banks, security investments and loans 19,069 25,3554.2 Claims arising from the credit facility under ERM II 0 0
5 Lending to euro area credit institutions related to monetary policy operations denominated in euro 1,126,019 863,5685.1 Mainrefinancingoperations 89,661 144,7555.2 Longer-termrefinancingoperations 1,035,771 703,8945.3 Fine-tuning reverse operations 0 05.4 Structural reverse operations 0 05.5 Marginal lending facility 587 14,8235.6 Credits related to margin calls 0 97
6 Other claims on euro area credit institutions denominated in euro 202,764 176,490
7 Securities of euro area residents denominated in euro 586,133 618,7647.1 Securities held for monetary policy purposes 277,153 273,8547.2 Other securities 308,979 344,910
8 General government debt denominated in euro 29,961 33,926
9 Other assets 276,582 248,860
Total assets 2,962,712 2,733,270
1 Totals/subtotals may not add up due to rounding.2 Comparative data as at 31 December 2011 have been restated to include reclassifications which took place in the week ending
20 April 2012 in order to harmonise under asset item 6 the disclosure of the emergency liquidity assistance (ELA) provided by Eurosystemcentralbanks todomesticcredit institutions(seealso thepressreleaseaccompanyingtheweeklyconsolidatedfinancialstatement of the Eurosystem as at 20 April 2012).

213ECB
Annual Report2012
liabilitieS 31 deCember 2012
31 deCember 2011
1 Banknotes in circulation 912,592 888,676
2 Liabilities to euro area credit institutions related to monetary policy operations denominated in euro 925,386 849,4772.1 Current accounts (covering the minimum reserve system) 447,112 223,5392.2 Deposit facility 280,219 413,8822.3 Fixed-term deposits 197,559 211,0002.4 Fine-tuning reverse operations 0 02.5 Deposits related to margin calls 496 1,056
3 Other liabilities to euro area credit institutions denominated in euro 6,688 2,423
4 Debt certificates issued 0 0
5 Liabilities to other euro area residents denominated in euro 135,655 79,7265.1 General government 95,341 65,5905.2 Other liabilities 40,314 14,137
6 Liabilities to non-euro area residents denominated in euro 184,484 156,876
7 Liabilities to euro area residents denominated in foreign currency 3,629 4,546
8 Liabilities to non-euro area residents denominated in foreign currency 6,226 9,0278.1 Deposits, balances and other liabilities 6,226 9,0278.2 Liabilities arising from the credit facility under ERM II 0 0
9 Counterpart of special drawing rights allocated by the IMF 54,952 55,942
10 Other liabilities 237,605 209,646
11 Revaluation accounts 407,373 394,013
12 Capital and reserves 88,122 82,918
Total liabilities 2,962,712 2,733,270

The two relatively narrow towers of the high-rise are braced by the interchange platforms and diagonal steel trusses in the atrium. The various platforms and steel structures within the atrium were completed in November and December 2012.
Spring 2013 will see the completion of the facade and closing-off of the atrium, as well as the completion of the steel structuresforthetechnicalareasandantennaatthetopofthedoubleofficetower.
COOP HIMMELB(L)AU’s vision has become reality over the last two years of intensive construction works. The vision ofthearchitect,WolfPrix,andhisteamwastocreateanewanduniquelandmarkcombining“oldandnew”,andhisvisionhas now come to fruition for the ECB.
215ECB
Annual Report2012
anneXeS1 leGal inStrumentS adopted by the eCbThe following tables list the legal instruments that were adopted by the ECB in 2012 and published inthe“Legalframework”sectionoftheECB’swebsite.
(a) ECB legal instruments other than opinions
Number Title
ECB/2012/1 Recommendation of the European Central Bank of 10 February 2012 to the Council of the European Union on the external auditors of the Bank of Greece (OJ C 48, 18.2.2012, p. 1)
ECB/2012/2 Decision of the European Central Bank of 27 February 2012 repealing Decision ECB/2010/3 on temporary measures relating to the eligibility of marketable debt instruments issued or guaranteed by the Greek Government (OJ L 59, 1.3.2012, p. 36)
ECB/2012/3 Decision of the European Central Bank of 5 March 2012 on the eligibility of marketable debt instruments issued or fully guaranteed by the Hellenic Republic in the context of the Hellenic Republic’s debt exchange offer (OJ L 77, 16.3.2012, p. 19)
ECB/2012/4 Decision of the European Central Bank of 21 March 2012 amending Decision ECB/2011/25onadditionaltemporarymeasuresrelatingtoEurosystemrefinancingoperations and eligibility of collateral (OJ L 91, 29.3.2012, p. 27)
ECB/2012/5 Recommendation of the European Central Bank of 23 March 2012 to the Council of the European Union on the external auditors of the Banque de France (OJ C 93, 30.3.2012, p. 1)
ECB/2012/6 Decision of the European Central Bank of 29 March 2012 on the establishment of the TARGET2-Securities Board and repealing Decision ECB/2009/6 (OJ L 117, 1.5.2012, p. 13)
ECB/2012/7 Decision of the European Central Bank of 26 April 2012 amending Decision ECB/2010/22 on the quality accreditation procedure for manufacturers of euro banknotes (OJ L 126, 15.5.2012, p. 13)
ECB/2012/8 Decision of the European Central Bank of 26 April 2012 amending Decision ECB/2011/8 on the environmental and health and safety accreditation procedures for the production of euro banknotes (OJ L 126, 15.5.2012, p. 14)
ECB/2012/9 Recommendation of the European Central Bank of 1 June 2012 to the Council of the European Union on the external auditors of Banka Slovenije (OJ C 161, 7.6.2012, p. 1)
ECB/2012/10 Decision of the European Central Bank of 19 June 2012 amending Decision ECB/2007/5 laying down the Rules on Procurement (OJ L 178, 10.7.2012, p. 14)
ECB/2012/11 Decision of the European Central Bank of 28 June 2012 amending Decision ECB/2011/25onadditionaltemporarymeasuresrelatingtoEurosystemrefinancingoperations and eligibility of collateral (OJ L 175, 5.7.2012, p. 17)

216ECBAnnual Report2012
Number Title
ECB/2012/12 Decision of the European Central Bank of 3 July 2012 amending Decision ECB/2011/25onadditionaltemporarymeasuresrelatingtoEurosystemrefinancingoperations and eligibility of collateral (OJ L 186, 14.7.2012, p. 38)
ECB/2012/13 Guideline of the European Central Bank of 18 July 2012 on TARGET2-Securities (recast) (OJ L 215, 11.8.2012, p. 19)
ECB/2012/14 Decision of the European Central Bank of 18 July 2012 repealing Decision ECB/2012/3 on the eligibility of marketable debt instruments issued or fully guaranteed by the Hellenic Republic in the context of the Hellenic Republic’s debt exchange offer (OJ L 199, 26.7.2012, p. 26)
ECB/2012/15 Decision of the European Central Bank of 17 July 2012 on the sub-delegation of powers to grant, renew or extend accreditations (OJ L 209, 4.8.2012, p. 17)
ECB/2012/16 Guideline of the European Central Bank of 20 July 2012 on the Data Exchange for Cash Services (OJ L 245, 11.9.2012, p. 3)
ECB/2012/17 Decision of the European Central Bank of 2 August 2012 repealing Decision ECB/2011/25onadditionaltemporarymeasuresrelatingtoEurosystemrefinancingoperations and eligibility of collateral (OJ L 218, 15.8.2012, p. 19)
ECB/2012/18 Guideline of the European Central Bank of 2 August 2012 on additional temporary measuresrelatingtoEurosystemrefinancingoperationsandeligibilityofcollateraland amending Guideline ECB/2007/9 (OJ L 218, 15.8.2012, p. 20)
ECB/2012/19 Decision of the European Central Bank of 7 September 2012 amending Decision ECB/2010/14 on the authenticity and fitness checking and recirculation of eurobanknotes (OJ L 253, 20.9.2012, p. 19)
ECB/2012/20 Recommendation of the European Central Bank of 14 September 2012 to the Council of the European Union on the external auditors of the Central Bank of Ireland (OJ C 286, 22.9.2012, p. 1)
ECB/2012/21 Guideline of the European Central Bank of 26 September 2012 on the data quality management framework for the Centralised Securities Database (OJ L 307, 7.11.2012, p. 89)
ECB/2012/22 Recommendation of the European Central Bank of 26 September 2012 on the data quality management framework for the Centralised Securities Database (OJ C 339, 7.11.2012, p. 1)
ECB/2012/23 Guideline of the European Central Bank of 10 October 2012 amending Guideline ECB/2012/18onadditionaltemporarymeasuresrelatingtoEurosystemrefinancingoperations and eligibility of collateral (OJ L 284, 17.10.2012, p. 14)
ECB/2012/24 Regulation of the European Central Bank of 17 October 2012 concerning statistics on holdings of securities (OJ L 305, 1.11.2012, p. 6)
ECB/2012/25 Guideline of the European Central Bank of 26 November 2012 amending Guideline ECB/2011/14 on monetary policy instruments and procedures of the Eurosystem (OJ L 348, 18.12.2012, p. 30)

217ECB
Annual Report2012
Number Title
ECB/2012/26 Decision of the European Central Bank of 29 November 2012 on the approval of the volume of coin issuance in 2013 (OJ L 334, 6.12.2012, p. 50)
ECB/2012/27 Guideline of the European Central Bank of 5 December 2012 on a Trans-European Automated Real-time Gross settlement Express Transfer system (TARGET2) (recast) (OJ L 30, 30.1.2013, p. 1)
ECB/2012/28 Decision of the European Central Bank of 7 December 2012 amending Decision ECB/2009/4 concerning derogations that may be granted under Regulation (EC) No 958/2007 concerning statistics on the assets and liabilities of investment funds (ECB/2007/8) (OJ L 9, 15.1.2013, p. 11)
ECB/2012/29 Guideline of the European Central Bank of 10 December 2012 amending Guideline ECB/2010/20onthelegalframeworkforaccountingandfinancialreportingintheEuropean System of Central Banks (OJ L 356, 22.12.2012, p. 94)
ECB/2012/30 Decision of the European Central Bank of 10 December 2012 amending Decision ECB/2010/21 on the annual accounts of the European Central Bank (OJ L 356, 22.12.2012, p. 93)
ECB/2012/31 Decision of the European Central Bank of 11 December 2012 amending Decision ECB/2007/7 concerning the terms and conditions of TARGET2-ECB (OJ L 13, 17.1.2013, p. 8)
ECB/2012/32 Decision of the European Central Bank of 19 December 2012 on temporary measures relating to the eligibility of marketable debt instruments issued or fully guaranteed by the Hellenic Republic (OJ L 359, 29.12.2012, p. 74)
ECB/2012/33 Decision of the European Central Bank of 19 December 2012 amending Decision ECB/2010/24 on the interim distribution of the income of the European Central Bank on euro banknotes in circulation and arising from securities purchased under the securities markets programme (OJ L 13, 17.1.2013, p. 12)
ECB/2012/34 Decision of the European Central Bank of 19 December 2012 on temporary changes to the rules relating to the eligibility of foreign currency denominated collateral (OJ L 14, 18.1.2013, p. 22)

218ECBAnnual Report2012
(b) ECB opinions following a consultation by a European institution
Number Originator and subject
CON/2012/5 Council–Aproposalforadirectiveontheaccesstotheactivityofcreditinstitutionsand the prudential supervision of credit institutions and investment firms anda proposal for a regulation on prudential requirements for credit institutions and investmentfirms(OJC105,11.4.2012,p.1)
CON/2012/10 Council – A proposal for a directive of the European Parliament and of theCouncil amending Directive 2004/109/EC on the harmonisation of transparency requirements in relation to information about issuers whose securities are admitted to trading on a regulated market and Commission Directive 2007/14/EC (OJ C 93, 30.3.2012, p. 2)
CON/2012/17 Council – A proposal for a regulation of the European Parliament and of theCouncil establishing an exchange, assistance and training programme for the protection of the euro against counterfeiting (the “Pericles 2020” programme) (OJ C 137, 12.5.2012, p. 7)
CON/2012/18 Council – Strengthened economic governance of the euro area (OJ C 141,17.5.2012, p. 7)
CON/2012/21 Council–(i)aproposalforadirectiveonmarketsinfinancialinstrumentsrepealingDirective 2004/39/EC of the European Parliament and of the Council; (ii) a proposal for a regulation on markets in financial instruments and amending Regulation(EMIR) on OTC derivatives, central counterparties and trade repositories; (iii) a proposal for a directive on criminal sanctions for insider dealing and market manipulation; and (iv) a proposal for a regulation on insider dealing and market manipulation (market abuse) (OJ C 161, 7.6.2012, p. 3)
CON/2012/24 Council–Aproposal fora regulationamendingRegulation (EC)No1060/2009on credit rating agencies and a proposal for a directive amending Directive 2009/65/EC on the coordination of laws, regulations and administrative provisions relating to undertakings of collective investment in transferable securities (UCITS) and Directive 2011/61/EU on alternative investment funds managers in respect of the excessive reliance on credit ratings (OJ C 167, 13.6.2012, p. 2)
CON/2012/32 Council – A proposal for a regulation of the European Parliament and of theCouncil on European venture capital funds and a proposal for a regulation of the European Parliament and of the Council on European social entrepreneurship funds (OJ C 175, 19.6.2012, p. 11)
CON/2012/42 Commission–AdraftCommissiondelegatedregulationsupplementingDirective2011/61/EU of the European Parliament and of the Council with regard to exemptions, general operating conditions, depositaries, leverage, transparency and supervision (OJ C 47, 19.2.2013, p.1)
CON/2012/56 EuropeanCouncil–ACouncilrecommendationontheappointmentofamemberof the Executive Board of the European Central Bank (OJ C 218, 24.7.2012, p. 3)
CON/2012/62 Council – A proposal for a regulation on improving securities settlement in theEuropean Union and on central securities depositories (OJ C 310, 13.10.2012, p. 12)

219ECB
Annual Report2012
Number Originator and subject
CON/2012/77 Commission – A proposal for a Commission regulation amending Regulation(EC) No 2214/96 concerning harmonised indices of consumer prices (HICP): transmission and dissemination of sub-indices of the HICP, as regards establishing harmonised indices of consumer prices at constant tax rates and a proposal for a Commission regulation laying down detailed rules for the implementation of Council Regulation (EC) No 2494/95 concerning harmonised indices of consumer prices, as regards establishing owner-occupied housing price indices (not yet publishedintheOfficialJournal)
CON/2012/84 Council – A proposal for a regulation of the European Parliament and of theCouncil amending Regulation (EC) No 223/2009 on European statistics (OJ C 374, 4.12.2012, p. 2)
CON/2012/95 Commission – Various draft regulatory and implementing technical standardssubmitted by the European Securities and Markets Authority to the Commission to be adopted by means of Commission delegated and implementing regulations supplementing Regulation (EU) No 648/2012 of the European Parliament and of the Council of 4 July 2012 on OTC derivatives, central counterparties and trade repositories (OJ C 60, 1.3.2013, p. 1)
CON/2012/96 Council – A proposal for a Council regulation conferring specific tasks on theEuropean Central Bank concerning policies relating to the prudential supervision of credit institutions and a proposal for a regulation of the European Parliament and of the Council amending Regulation (EU) No 1093/2010 establishing a European Supervisory Authority (European Banking Authority) (OJ C 30, 1.2.2013, p. 6)
CON/2012/99 Council –Aproposal for a directive establishing a framework for recovery andresolutionofcreditinstitutionsandinvestmentfirms(OJC39,12.2.2013,p.1)
CON/2012/103 CouncilandEuropeanParliament–Aproposal fora regulationof theEuropeanParliament and of the Council on key information documents for investment products(notyetpublishedintheOfficialJournal)

220ECBAnnual Report2012
(c) ECB opinions following a consultation by a Member State
Number Originator and subject
CON/2012/1 Cyprus–Thesalariesofcivilservants
CON/2012/2 Germany–Measuresforthestabilisationofthefinancialmarket
CON/2012/3 Luxembourg–Dematerialisedsecurities
CON/2012/4 Italy –Aguarantee scheme for the liabilities of Italian banks and the exchangeof lira banknotes
CON/2012/6 Ireland–Pensionreformsinthepublicsector
CON/2012/7 Romania–Theminimumreservesregime
CON/2012/8 Greece–Thesystemformonitoringtransactionsinbook-entrysecurities
CON/2012/9 Italy–ThemanagementofliquidityintheTreasuryaccountsattheBancad’Italiaand the selection of counterparties for related operations
CON/2012/11 Spain–ThereorganisationoftheSpanishfinancialsector
CON/2012/12 Greece–ThetermsofsecuritiesissuedorguaranteedbytheGreekState
CON/2012/13 Spain–Stateguarantees
CON/2012/14 Greece–TherecapitalisationandresolutionofcreditinstitutionsinGreece
CON/2012/15 Greece–Theprotectionoftheeuroagainstcounterfeitingandtheauthenticationof euro coins
CON/2012/16 Latvia–Minimumreserverequirements
CON/2012/19 Latvia–Theappointmentof themembersof theGoverningCouncilofLatvijasBanka
CON/2012/20 Italy–Italy’sparticipationinInternationalMonetaryFundprogrammesinresponsetothefinancialcrisis
CON/2012/22 Slovenia–Thedepositguaranteescheme
CON/2012/23 Portugal–Implementingmeasuresrelatingtorecapitalisation
CON/2012/25 Greece–TherecapitalisationandresolutionofcreditinstitutionsinGreece
CON/2012/26 Hungary–AmendmentstotheLawontheMagyarNemzetiBank
CON/2012/27 Hungary–Foreigncurrencymortgagesandresidentialpropertyloanagreements
CON/2012/28 Belgium – Belgian covered bonds and measures to facilitate the mobilisationof credit claims
CON/2012/29 Bulgaria–Thestatefundforguaranteeingthestabilityofthestatepensionsystem
CON/2012/30 Denmark–Thedepositguaranteefundandthebankresolutionregime
CON/2012/31 Greece–TheStatuteoftheBankofGreece

221ECB
Annual Report2012
Number Originator and subject
CON/2012/33 Spain–Limitationsoncashpayments
CON/2012/34 Germany – The protection against counterfeiting and the quality of cashcirculation
CON/2012/35 Belgium–Supervision-relatedoperatingcosts
CON/2012/36 Lithuania–Restrictionsofsettlementsincash
CON/2012/37 Denmark–Limitationsoncashpayments
CON/2012/38 Italy–Theoversightofretailpaymentservicesandsystems
CON/2012/39 Greece – The recapitalisation and resolution framework for credit institutionsin Greece
CON/2012/40 Greece–Debtarrangementsforover-indebtedindividuals
CON/2012/41 Poland – The introduction of a legal framework for the operation of centralcounterparties
CON/2012/43 Hungary–TheLawontheMagyarNemzetiBank
CON/2012/44 CzechRepublic–TheLawonČeskánárodníbanka
CON/2012/45 Hungary–TheincreaseofHungary'squotawiththeInternationalMonetaryFund
CON/2012/46 Spain–Thereorganisationandsaleofrealestateassetsinthefinancialsector
CON/2012/47 Slovenia–Preventionoflatepayments
CON/2012/48 Slovenia–Bankrecapitalisation
CON/2012/49 Hungary–TheMagyarNemzetiBank
CON/2012/50 Cyprus–TherecapitalisationoftheCyprusPopularBank
CON/2012/51 Cyprus–TheCentralBankofCyprusLawsof2002to2007
CON/2012/52 Ireland –Newmeasures strengthening supervision and enforcement in financialregulation
CON/2012/53 Slovakia–Thebanklevyandcontributionstothedepositguaranteescheme
CON/2012/54 Sweden–Certainoldbanknotesceasingtobelegaltender
CON/2012/55 Germany–Thestrengtheningoffinancialsupervisionandtheestablishmentofafinancialstabilitycommittee
CON/2012/57 Slovenia–TheSloveniaSovereignHolding
CON/2012/58 Poland–Astabilisationfundforbanks
CON/2012/59 Hungary–Thefinancialtransactiontax
CON/2012/60 Spain–Stateguarantees
CON/2012/61 Italy–Thereformofsupervisionofinsuranceandretirementprovision

222ECBAnnual Report2012
Number Originator and subject
CON/2012/63 Lithuania – The stabilising budgetary policy and the creation of an anti-crisistreasury reserves account at Lietuvos bankas
CON/2012/64 Italy–RecapitalisationoftheBancaMontedeiPaschidiSiena
CON/2012/65 Austria–TheincreaseofAustria’squotawiththeInternationalMonetaryFund
CON/2012/66 Germany–Foreigntradereportingrequirements
CON/2012/67 Austria–Reportingrequirementsforcross-borderservicetransactions
CON/2012/68 Ireland–Creditunions
CON/2012/69 Luxembourg–AcapitalincreaseoftheBanquecentraleduLuxembourg
CON/2012/70 Ireland–Measuresrelatingtopersonalinsolvency
CON/2012/71 Slovenia–Strengtheningbankstability
CON/2012/72 Poland–Aconsolidatedlegalframeworkforpaymentservices
CON/2012/73 Latvia–Preparationsand legal amendments required for the introductionof theeuro
CON/2012/74 Ireland–NewcreditregistermeasuresinIreland
CON/2012/75 Spain–Europeanfinancialassistance
CON/2012/76 Ireland–Thefreedomofinformation
CON/2012/78 Romania–Openmarketoperationsandstandingfacilities
CON/2012/79 Bulgaria–Fiscalrulesandtheservicingofbankaccountsandpaymentsofbudgetorganisations
CON/2012/80 Latvia–AmendmentstotheLawonLatvijasBanka
CON/2012/81 Belgium – Profit distribution between the Nationale Bank van België/BanqueNationale de Belgique and the Belgian state
CON/2012/82 Germany–Thecheckingofcash
CON/2012/83 Slovakia–Restrictionsoncashpayments
CON/2012/85 Cyprus–Governmentguaranteesforcreditinstitutions
CON/2012/86 Portugal–TheBancodePortugal’sstaffremunerationandthebudget
CON/2012/87 Latvia–Thespellingofthesinglecurrency
CON/2012/88 Germany–Thestabilisationofthefinancialmarket
CON/2012/89 Spain – Euro banknotes and coins and amendments to the Banco de España’sStatute
CON/2012/90 Greece – Amendments to the framework for the recapitalisation of creditinstitutions

223ECB
Annual Report2012
Number Originator and subject
CON/2012/91 Poland–Astabilisationfundforbanks
CON/2012/92 Germany–Coveredbonds(Pfandbriefe)
CON/2012/93 Slovenia –A tax on financial services and a tax on the total value of a bank’sbalance sheet
CON/2012/94 Hungary–AmendmentstotheLawonthefinancialtransactiontax
CON/2012/97 Latvia–Theintroductionoftheeuro
CON/2012/98 Ireland–TheextensionoftheIrishstateguaranteeofeligibleliabilitiesofcreditinstitutions
CON/2012/100 Belgium – A State guarantee covering certain commitments of subsidiariesof Dexia SA
CON/2012/101 Slovenia–TheLawonbanking
CON/2012/102 Romania–Certainconditionsongrantingloans
CON/2012/104 Denmark–Financiallegislation
CON/2012/105 Lithuania – The implementation of the Treaty on Stability, Coordination andGovernance in the Economic and Monetary Union
CON/2012/106 France–Bankingandfinancialstability
CON/2012/107 Germany–High-frequencytrading
CON/2012/108 Spain–Assetmanagementcompanies
CON/2012/109 Italy–ThecreationofcapitalbuffersfortheBancaMontedeiPaschidiSiena
CON/2012/110 Lithuania–Thereserverequirementsforcreditinstitutions
CON/2012/111 Ireland–NewcreditregistermeasuresinIreland

224ECBAnnual Report2012
2 ChronoloGy oF monetary poliCy meaSureS oF the euroSyStem
12 January, 9 February, 8 marCh, 4 april and 3 may 2012
TheGoverningCounciloftheECBdecidesthattheinterestrateonthemainrefinancingoperationsand the interest rates on the marginal lending facility and the deposit facility will remain unchanged at 1.00%, 1.75% and 0.25% respectively.
6 June 2012
TheGoverningCounciloftheECBdecidesthattheinterestrateonthemainrefinancingoperationsand the interest rates on the marginal lending facility and the deposit facility will remain unchanged at 1.00%, 1.75% and 0.25% respectively.
It also decides on the details as regards the tender procedures and modalities to be applied in its refinancingoperationsupto15January2013,notablytocontinueitsfixedratetenderprocedureswith full allotment.
In addition, theGoverningCouncil decides to conduct the three-month longer-term refinancingoperationstobeallotteduntiltheendof2012asfixedratetenderprocedureswithfullallotment.
5 July 2012
TheGoverningCouncilof theECBdecidestodecreasetheinterestrateonthemainrefinancingoperations by 25 basis points to 0.75%, starting from the operation to be settled on 11 July 2012. In addition, it decides to decrease the interest rates on both the marginal lending facility and the deposit facility by 25 basis points, to 1.50% and 0.00% respectively, both with effect from 11 July 2012.
2 auGuSt 2012
TheGoverningCounciloftheECBdecidesthattheinterestrateonthemainrefinancingoperationsand the interest rates on the marginal lending facility and the deposit facility will remain unchanged at 0.75%, 1.50% and 0.00% respectively.
It also decides on measures to address the severe malfunctioning in the price formation process in the bond markets of euro area countries. In particular, the Governing Council, within its mandate to maintain price stability over the medium term and in observance of its independence in determining monetary policy, decides that it may undertake outright open market operations of a size adequate to reach its objective.
6 September 2012
TheGoverningCounciloftheECBdecidesthattheinterestrateonthemainrefinancingoperationsand the interest rates on the marginal lending facility and the deposit facility will remain unchanged at 0.75%, 1.50% and 0.00% respectively.

225ECB
Annual Report2012
It also decides on the modalities for undertaking Outright Monetary Transactions (OMTs) in secondary markets for sovereign bonds in the euro area. Furthermore, following this decision on OMTs, the Governing Council announces the immediate termination of the Securities Markets Programme (SMP). It decides that the liquidity injected through the SMP will continue to be absorbed as in the past, and that the existing securities in the SMP portfolio will be held to maturity.
4 oCtober and 8 november 2012
TheGoverningCounciloftheECBdecidesthattheinterestrateonthemainrefinancingoperationsand the interest rates on the marginal lending facility and the deposit facility will remain unchanged at 0.75%, 1.50% and 0.00% respectively.
6 deCember 2012
TheGoverningCounciloftheECBdecidesthattheinterestrateonthemainrefinancingoperationsand the interest rates on the marginal lending facility and the deposit facility will remain unchanged at 0.75%, 1.50% and 0.00% respectively.
It also decides on the details as regards the tender procedures and modalities to be applied in its refinancingoperationsupto9July2013,notablytocontinueitsfixedratetenderprocedureswithfull allotment.
10 January, 7 February and 7 marCh 2013
TheGoverningCounciloftheECBdecidesthattheinterestrateonthemainrefinancingoperationsand the interest rates on the marginal lending facility and the deposit facility will remain unchanged at 0.75%, 1.50% and 0.00% respectively.

226ECBAnnual Report2012
3 overview oF the eCb’S CommuniCation related to the proviSion oF liquidity1
For more details on the liquidity-providing operations conducted by the Eurosystem in 2012, seethe“Openmarketoperations”sectionoftheECB’swebsite.
proviSion oF liquidity in euro
9 February 2012The ECB approves, for the seven NCBs that put forward relevant proposals, specific nationaleligibility criteria and risk control measures for the temporary acceptance of additional credit claims as collateral in Eurosystem credit operations.
28 February 2012The ECB announces the temporary suspension of the eligibility of marketable debt instruments issued or fully guaranteed by the Hellenic Republic for use as collateral in Eurosystem monetary policy operations as a result of the launch of the private sector involvement offer.
8 marCh 2012The ECB announces that marketable debt instruments issued or fully guaranteed by the Hellenic Republic will again be accepted as collateral in Eurosystem credit operations, without applying the minimum credit rating threshold for collateral eligibility.
6 June 2012TheECBannouncesdetailsofrefinancingoperationswithsettlement in theperiodfrom11Julyto 15 January 2013.
22 June 2012The ECB takes further measures to increase collateral availability for counterparties.
6 July 2012The ECB announces the implementation of loan-level data reporting requirements for asset-backed securities.
20 July 2012The ECB announces the suspension of the eligibility of marketable debt instruments issued or fully guaranteed by the Hellenic Republic for use as collateral in Eurosystem monetary policy operations.
6 September 2012The ECB announces the technical features of Outright Monetary Transactions and the termination of the Securities Markets Programme.
The ECB decides on additional measures to preserve collateral availability for counterparties in order to maintain their access to the Eurosystem’s liquidity-providing operations.
31 oCtober 2012The ECB announces that the second covered bond purchase programme has ended as scheduled.
1 Dates refer to the date of publication of the announcement.

227ECB
Annual Report2012
27 november 2012The ECB announces the rescheduling of loan-level data reporting requirements for asset-backed securities as announced on 6 July 2012.
6 deCember 2012TheECBannouncesdetailsofrefinancingoperationswithsettlementintheperiodfrom16Januaryto 9 July 2013.
TheECBannouncesthatitwillcontinueconductingitsmainrefinancingoperationsasfixedratetender procedures with full allotment for as long as necessary, and at least until the end of the sixth maintenance period of 2013 on 9 July 2013.
The ECB announces that the three-month longer-term refinancing operations to be allottedbetween30Januaryand26June2013willbeconductedasfixedratetenderprocedureswithfullallotment.Theratesinthesethree-monthoperationswillbefixedattheaveragerateofthemainrefinancingoperationsoverthelifeoftherespectivelonger-termrefinancingoperation.
19 deCember 2012The ECB announces that marketable debt instruments issued or fully guaranteed by the Hellenic Republicand fulfillingallothereligibilitycriteriawillagainconstituteeligiblecollateral for thepurposes of Eurosystem credit operations, subject to special haircuts.
proviSion oF liquidity in other CurrenCieS and aGreementS with other Central banKS
12 September 2012The ECB announces the prolongation of its swap facility agreement with the Bank of England until 30 September 2013.
13 deCember 2012The ECB announces jointly with the Bank of Canada, the Bank of England, the Federal Reserve and the Swiss National Bank the extension until 1 February 2014 of the existing temporary US dollar liquidity swap arrangements.
The ECB announces jointly with the Bank of Canada, the Bank of England, the Federal Reserve and the Swiss National Bank the extension until 1 February 2014 of the network of temporary bilateral liquidity swap arrangements.

228ECBAnnual Report2012
4 publiCationS produCed by the eCbThe ECB produces a number of publications which provide information about its core activities: monetary policy, statistics, payment and securities settlement systems, financial stability andsupervision, international and European cooperation, and legal matters. These include the following:
Statutory publiCationS
Annual Report –Convergence Report –Monthly Bulletin –
reSearCh paperS
Legal Working Paper Series –Occasional Paper Series –Research Bulletin –Working Paper Series –
other/taSK-related publiCationS
Enhancing monetary analysis –Financial integration in Europe –Financial Stability Review –Statistics Pocket Book –The European Central Bank: history, role and functions –The international role of the euro –Theimplementationofmonetarypolicyintheeuroarea(“GeneralDocumentation”) –The monetary policy of the ECB –The payment system –
The ECB also publishes brochures and information materials on a variety of topics, such as the euro banknotes and coins, as well as seminar and conference proceedings.
For a complete list of documents (in PDF format) published by the ECB and the European Monetary Institute, the ECB’s forerunner from 1994 to 1998, please visit the ECB’s website at http://www.ecb.europa.eu/pub/. Language codes indicate the languages in which each publication is available.
Unless otherwise indicated, hard copies can be obtained or subscribed to free of charge, stock permitting, by contacting [email protected]

229ECB
Annual Report2012
This glossary contains selected terms that are used in the Annual Report. A more comprehensive and detailed glossary can be found on the ECB’s website.
Balance of payments (b.o.p.):astatisticalstatementthatsummarises,foraspecificperiodoftime,the economic transactions of an economy with the rest of the world. The transactions considered are:thoseinvolvinggoods,servicesandincome;thoseinvolvingfinancialclaimson,andliabilitiesto,therestoftheworld;andthose(suchasdebtforgiveness)thatareclassifiedastransfers.
Banking union: one of the building blocks for completing Economic and Monetary Union, whichconsistsofanintegratedfinancialframeworkwithasinglerulebook,asingle supervisory mechanism, common deposit protection and a single bank resolution mechanism.
Central counterparty (CCP): an entity that interposes itself, in one or more markets, between the counterparties to the contracts traded, becoming the buyer to every seller and the seller to every buyer and thereby guaranteeing the performance of open contracts.
Central government: the government as defined in theEuropean System of Accounts 1995, but excluding regional and local governments (see also general government).
Central securities depository (CSD): an entity that: (i) enables securities transactions to be processed and settled by book entry, (ii) provides custodial services (e.g. the administration of corporate actions and redemptions), and (iii) plays an active role in ensuring the integrity of securities issues. Securities can be held in a physical (but immobilised) form or in a dematerialised form (whereby they exist only as electronic records).
Collateral: assets pledged or otherwise transferred (e.g. by credit institutions to central banks) as a guarantee for the repayment of loans, as well as assets sold (e.g. by credit institutions to central banks) under repurchase agreements.
Correspondent central banking model (CCBM): a mechanism established by the European System of Central Banks with the aim of enabling counterparties to use eligible collateral in a cross-border context. In the CCBM, NCBs act as custodians for one another. This means that each NCB has a securities account in its securities administration for each of the other NCBs and the ECB.
Counterparty: the opposite party in a financial transaction (e.g. any party transacting with a central bank).
Covered bond purchase programme (CBPP): an ECB programme, based on the decision of the Governing Council of 7 May 2009 to purchase euro-denominated covered bonds issued in the euro area, insupportofaspecificfinancialmarketsegment that is important for thefundingofbanks andwas particularly affectedby thefinancial crisis.Thepurchases under the programmewere for a nominal value of €60 billion, and they were fully implemented by 30 June 2010. On 6 October 2011 the Governing Council decided to launch a second covered bond purchase programme, the CBPP2. This programme allowed the Eurosystem to purchase euro-denominated covered bonds issued in the euro area for an intended nominal value of €40 billion. The purchases were conducted in both the primary and secondary markets from November 2011 until the end of October 2012, with the purchases totalling a nominal amount of €16.418 billion.
5 GloSSary

230ECBAnnual Report2012
Credit institution: an undertaking the business of which is to receive deposits or other repayable funds from the public and to grant credit for its own account.
Credit risk: the risk that a counterpartywillnotsettle thefullvalueofanobligation–neitherwhen it becomes due, nor at any time thereafter. Credit risk includes replacement cost risk and principal risk. It also includes the risk of the settlement bank failing.
Debt (general government): the total gross debt (currency, deposits, loans and debt securities) at nominal value outstanding at the end of the year and consolidated between and within the sectors of general government.
Debt security: a promise on the part of the issuer (i.e. the borrower) to make one or more payment(s) to theholder (the lender)ona specified futuredateordates.Suchsecuritiesusuallycarryaspecificrateofinterest(thecoupon)and/oraresoldatadiscounttotheamountthatwillberepaid at maturity.
Debt-to-GDP ratio (general government): the ratio of debt to gross domestic product at currentmarketprices.ItisthesubjectofoneofthefiscalcriterialaiddowninArticle126(2)ofthe Treatytodefinetheexistenceofanexcessivedeficit.
Deficit (general government): the general government’s net borrowing, i.e. the difference between total government revenue and total government expenditure.
Deficit-debt adjustment (general government): the difference between the general government budget balance (deficit or surplus) and the change in debt.
Deficit ratio (general government): the ratio of the deficit to gross domestic product at current marketprices.ItisthesubjectofoneofthefiscalcriterialaiddowninArticle126(2)oftheTreaty to define the existence of an excessive deficit (see also excessive deficit procedure). It is also referredtoasthebudgetdeficitratioorthefiscaldeficitratio.
Deposit facility: a standing facility of the Eurosystem which counterparties may use to make overnight deposits at an NCB. Such deposits are remunerated at a pre-specified interest rate(see also key ECB interest rates).
Direct investment: cross-border investment for the purpose of obtaining a lasting interest in an enterprise resident in another economy (assumed, in practice, for ownership of at least 10% of the ordinary shares or voting power). Included are equity capital, reinvested earnings and other capital associated with inter-company operations.
ECOFIN Council: the term often used to refer to the EU Council meeting in the composition oftheministersofeconomicsandfinance.
Economic analysis: one pillar of the ECB’s framework for conducting a comprehensive analysis of the risks to price stability, which forms the basis for the Governing Council’s monetary policy decisions. The economic analysis focuses mainly on the assessment of current economic andfinancialdevelopmentsandtheimpliedshorttomedium-termriskstopricestabilityfromtheperspective of the interplay between supply and demand in goods, services and factor markets

231ECB
Annual Report2012
at those horizons. Due attention is paid to the need to identify the nature of shocks affecting the economy, their effects on cost and pricing behaviour, and the short to medium-term prospects for their propagation in the economy (see also monetary analysis).
Economic and Financial Committee (EFC): a committee which contributes to the preparation of the work of the ECOFIN Council and the European Commission. Its tasks include reviewing theeconomicandfinancialsituationofboth theMemberStatesand theEU,andcontributing tobudgetary surveillance.
Economic and Monetary Union (EMU): the process that led to the single currency, the euro, and the single monetary policy in the euro area, as well as to the coordination of the economic policies of the EU Member States. This process, as laid down in the Treaty, took place in three stages. StageThree,thefinalstage,startedon1January1999withthetransferofmonetarycompetencetothe ECB and the introduction of the euro. The cash changeover on 1 January 2002 completed the process of setting up EMU.
Effective exchange rate (EER) of the euro (nominal/real): a weighted average of the bilateral euro exchange rates against the currencies of the euro area’s main trading partners. The ECB publishes nominal EER indices for the euro against two groups of trading partners: the EER-20 (comprising the ten non-euro area EU Member States and ten trading partners outside the EU) and the EER-40(composedoftheEER-20and20additionalcountries).Theweightsusedreflecttheshareof each partner country in the euro area’s trade in manufactured goods and account for competition inthirdmarkets.RealEERsarenominalEERsdeflatedbyaweightedaverageofforeign,relativeto domestic, prices or costs. They are thus measures of price and cost competitiveness.
EONIA (euro overnight index average): a measure of the effective interest rate prevailing in the euro interbank overnight market. It is calculated as a weighted average of the interest rates on unsecured overnight lending transactions denominated in euro, as reported by a panel of contributing banks.
Equities: securities representing ownership of a stake in a corporation. They comprise shares traded on stock exchanges (quoted shares), unquoted shares and other forms of equity. Equities usually produce income in the form of dividends.
ERM II (exchange rate mechanism II): the exchange rate mechanism which provides the framework for exchange rate policy cooperation between the euro area countries and the non-euroareaEUMemberStates.ERMIIisamultilateralarrangementwithfixed,butadjustable,central rates and a standard fluctuation band of ±15%. Decisions concerning central rates and,possibly,narrowerfluctuationbandsaretakenbymutualagreementbetweentheEUMemberStateconcerned, the euro area countries, the ECB and the other EU Member States participating in the mechanism.AllparticipantsinERMII,includingtheECB,havetherighttoinitiateaconfidentialprocedure aimed at changing the central rates (realignment).
EU Council (Council of the European Union): the institution of the EU made up of representatives of the governments of the EU Member States, normally the ministers responsible for the matters under consideration, and the relevant European Commissioner (see also ECOFIN Council).
EURIBOR (euro interbank offered rate): the rate at which a prime bank is willing to lend funds in euro to another prime bank, as reported by a panel of contributing banks, computed daily for interbank deposits with different maturities of up to 12 months.

232ECBAnnual Report2012
Euro area: the area formed by the EU Member States whose currency is the euro and in which a single monetary policy is conducted under the responsibility of the Governing Council of the ECB. The euro area currently comprises Belgium, Germany, Estonia, Ireland, Greece, Spain, France, Italy, Cyprus, Luxembourg, Malta, the Netherlands, Austria, Portugal, Slovenia, Slovakia and Finland.
Eurogroup: an informal gathering of the ministers of economics and finance of the EU Member States whose currency is the euro. Its status is recognised under Article 137 of the Treaty and in Protocol No 14. The European Commission and the ECB are regularly invited to take part in its meetings.
Europe 2020 strategy: the EU’s strategy for employment and smart, sustainable and inclusive growth. It was adopted by the European Council in June 2010. Building on the earlier Lisbon strategy, it is intended to provide a coherent framework for EU Member States to implement structural reforms aimed at raising potential growth and for mobilising EU policies and instruments.
European Council: the institution of the EU consisting of the Heads of State or Government of the EU Member States and, as non-voting members, the President of the European Commission and the European Council’s own President. It provides the EU with the necessary impetus for its developmentanddefinesthegeneralpoliticaldirectionsandprioritiesthereof.Itdoesnothavealegislative function.
European Financial Stabilisation Mechanism (EFSM): an EU facility, based on Article 122(2) of the Treaty, that allows the European Commission to raise up to €60 billion on behalf of the EU for lending to EU Member States experiencing, or being threatened with, exceptional circumstances beyond their control. EFSM lending is subject to strong conditionality in the context of joint EU-IMF programmes.
European Financial Stability Facility (EFSF): a limited liability company established by the euro area countries, on an intergovernmental basis, for the purpose of providing loans to euro area countriesinfinancialdifficulties.Suchfinancialassistanceissubjecttostrongconditionalityinthecontext of joint EU-IMF programmes. The EFSF has an effective lending capacity of €440 billion, anditsloansarefinancedthroughtheissuanceofdebt securities, guaranteed by euro area countries on a pro rata basis.
European Monetary Institute (EMI): a temporary institution established at the start of Stage Two of Economic and Monetary Union on 1 January 1994. It went into liquidation following the establishment of the ECB on 1 June 1998.
European Stability Mechanism (ESM): an intergovernmental organisation established by the euro area countries on the basis of the Treaty establishing the European Stability Mechanism. It is a permanent crisis management mechanism for the euro area which issues debt instruments inordertofinanceloansandotherformsoffinancialassistancetoeuroareacountries.TheESMentered into force on 8 October 2012. It has an effective lending capacity of €500 billion and will replace both the European Financial Stability Facility and the European Financial Stabilisation Mechanism. ESM lending is subject to strict conditionality.

233ECB
Annual Report2012
European System of Accounts 1995 (ESA 95): a comprehensive and integrated system of macroeconomicaccountsbasedonasetofinternationallyagreedstatisticalconcepts,definitions,classifications and accounting rules aimed at achieving a harmonisedquantitativedescriptionofthe economies of the EU Member States. The ESA 95 is the EU’s version of the world System of National Accounts 1993 (SNA 93).
European System of Central Banks (ESCB): composed of the ECB and the NCBs of all 27 EU Member States, i.e. it includes, in addition to the members of the Eurosystem, the NCBs of those Member States whose currency is not the euro. The ESCB is governed by the Governing Council and the Executive Board of the ECB, and, as a third decision-making body of the ECB, by the General Council.
European System of Financial Supervision (ESFS): the group of institutions in charge of ensuring thesupervisionof theEU’sfinancialsystem.Itcomprises theEuropean Systemic Risk Board, the three European Supervisory Authorities, the Joint Committee of the European Supervisory Authorities, and the national supervisory authorities of the EU Member States.
European Systemic Risk Board (ESRB): an independent EU body responsible for the macro-prudentialoversightofthefinancialsystemwithintheEU.Itcontributestothepreventionormitigation of systemic risks to financial stabilitythatarisefromdevelopmentswithinthefinancialsystem, taking into account macroeconomic developments, so as to avoid periods of widespread financialdistress.
Eurosystem: the central banking system of the euro area. It comprises the ECB and the NCBs of the EU Member States whose currency is the euro.
Eurosystem credit assessment framework (ECAF): procedures, rules and techniques which ensure that the Eurosystem requirement of high credit standards for all eligible assets is met.
Excessive deficit procedure: the provision set out in Article 126 of the Treaty and specifiedin Protocol (No 12) on the excessive deficit procedure requires EUMember States tomaintainbudgetarydiscipline,definesthecriteriaforabudgetarypositiontobeconsideredanexcessivedeficitand regulates steps to be taken following the observation that the requirements for the budgetary balance or government debt have not been fulfilled. Article 126 is supplemented by CouncilRegulation (EC) No 1467/97 of 7 July 1997 on speeding up and clarifying the implementation of theexcessivedeficitprocedure,whichisoneelementoftheStability and Growth Pact.
Executive Board: one of the decision-making bodies of the ECB. It comprises the President and the Vice-President of the ECB and four other members appointed by the European Council, acting by a qualifiedmajority, on a recommendation from theEU Council, after it has consulted the European Parliament and the ECB.
Financial stability: the condition in which the financial system – comprising financialintermediaries, markets andmarket infrastructures – is capable of withstanding shocks and theunravellingoffinancialimbalances,therebymitigatingthelikelihoodofdisruptionsinthefinancialintermediationprocesswhicharesevereenoughtosignificantlyimpairtheallocationofsavingstoprofitableinvestmentopportunities.

234ECBAnnual Report2012
Fine-tuning operation: an open market operation executed by the Eurosystem in order to deal with unexpected liquidity fluctuations in themarket. The frequency andmaturity of fine-tuningoperations are not standardised.
GDP deflator: gross domestic product (GDP) expressed in current prices (nominal GDP) divided bythevolumeofGDP(realGDP).ItisalsoknownastheimplicitpricedeflatorofGDP.
General Council: one of the decision-making bodies of the ECB. It comprises the President and the Vice-President of the ECB and the governors of all the NCBs of the European System of Central Banks.
General government:asectordefinedintheEuropean System of Accounts 1995 as comprising resident entities that are engaged primarily in the production of non-market goods and services intended for individual and collective consumption and/or in the redistribution of national income and wealth. Included are central, regional and local government authorities, as well as social security funds. Excluded are government-owned entities that conduct commercial operations, such as public enterprises.
Governing Council: the supreme decision-making body of the ECB. It comprises all the members of the Executive Board of the ECB and the governors of the NCBs of the EU Member States whose currency is the euro.
Gross domestic product (GDP): a measure of economic activity, namely the value of an economy’s total output of goods and services, less intermediate consumption, plus net taxes on products and imports, in a specified period.GDP can be broken downby output, expenditure or incomecomponents.ThemainexpenditureaggregatesthatmakeupGDParehouseholdfinalconsumption,governmentfinalconsumption,grossfixedcapitalformation,changesininventories,andimportsand exports of goods and services (including intra-euro area trade).
Harmonised Index of Consumer Prices (HICP): a measure of the development of consumer prices that is compiled by Eurostat and harmonised for all EU Member States.
Implied volatility: the expected volatility (i.e. standard deviation) in the rates of change of the price of an asset (e.g. a share or a bond). It can be derived from the asset’s price, its maturity date and the exercise price of its options, as well as from a riskless rate of return, using an option pricing model such as the Black-Scholes model.
Key ECB interest rates: the interest rates set by the Governing Council. They are the rates on the main refinancing operations, the marginal lending facility and the deposit facility.
Longer-term refinancing operation: a credit operation with a maturity of more than one week that is executed by the Eurosystem in the form of reverse transactions. The regular monthly operations haveamaturityofthreemonths.DuringthefinancialmarketturmoilthatstartedinAugust2007,supplementary operations with maturities ranging from one maintenance period to three years were conducted, the frequency of which varied.
M1: a narrow monetary aggregate that comprises currency in circulation plus overnight deposits held with MFIs and central government(e.g.atthepostofficeortreasury).

235ECB
Annual Report2012
M2: an intermediate monetary aggregate that comprises M1 plus deposits redeemable at a period of notice of up to and including three months (i.e. short-term savings deposits) and deposits with an agreed maturity of up to and including two years (i.e. short-term time deposits) held with MFIs and central government.
M3: a broad monetary aggregate that comprises M2 plus marketable instruments, in particular repurchase agreements, money market fund shares/units, and debt securities with a maturity of up to and including two years issued by MFIs.
Main refinancing operation: a regular open market operation executed by the Eurosystem in the form of reverse transactions. Such operations are carried out through a weekly standard tender procedure and normally have a maturity of one week.
Maintenance period: the period over which credit institutions’ compliance with reserve requirementsiscalculated.Themaintenanceperiodbeginsonthesettlementdayofthefirstmain refinancing operation following the meeting of the Governing Council at which the monthly assessment of the monetary policy stance is pre-scheduled. The ECB publishes a calendar of the reserve maintenance periods at least three months before the start of the year.
Marginal lending facility: a standing facility of the Eurosystem which counterparties may usetoreceiveovernightcreditfromanNCBatapre-specifiedinterestrateagainsteligibleassets(see also key ECB interest rates).
Market risk: the risk of losses (in both on and off-balance-sheet positions) arising from movements in market prices.
MFIs (monetary financial institutions): financial institutionswhich together form themoney-issuing sector of the euro area. These include the Eurosystem, resident credit institutions (as defined inEU law) and all other resident financial institutionswhose business is to receivedeposits and/or close substitutes for deposits from entities other than MFIs and, for their own account (at least in economic terms), to grant credit and/or invest in securities. The latter group consists predominantly of money market funds, i.e. funds that invest in short-term and low-risk instruments, usually with a maturity of one year or less.
Minimum bid rate: the lower limit to the interest rates at which counterparties may submit bids in the variable rate tenders.
Monetary analysis: one pillar of the ECB’s framework for conducting a comprehensive analysis of the risks to price stability, which forms the basis for the Governing Council’s monetary policydecisions.Themonetaryanalysishelps toassessmediumto long-termtrends in inflation,in view of the close relationship between money and prices over extended horizons. The monetary analysis takes into account developments in a wide range of monetary indicators, including M3, its components and counterparts, notably credit, and various measures of excess liquidity (see also economic analysis).
Monetary income: income accruing to the NCBs in the performance of the Eurosystem’s monetary policy function, derived from assets earmarked in accordance with guidelines established by the Governing Council and held against banknotes in circulation and deposit liabilities to credit institutions.

236ECBAnnual Report2012
Money market: the market in which short-term funds are raised, invested and traded, using instruments which generally have an original maturity of up to and including one year.
Non-standard measures: temporary measures taken by the Governing Council to support the effectiveness of interest rate decisions and their transmission to the wider euro area economy in thecontextofadysfunctionalsituationinsomefinancialmarketsegmentsandthefinancialsystemmore broadly.
OFIs (other financial intermediaries): corporations or quasi-corporations (other than insurance corporations or pension funds) that are engagedmainly in financial intermediation by incurringliabilities in forms other than currency, deposits and/or close substitutes for deposits from institutional entities other than MFIs. OFIs include in particular corporations engaged primarily in long-termfinancing(suchasfinancialleasing),securitisedassetholdings,otherfinancialholdings,securities and derivatives dealing (on their own account), venture capital and development capital.
Open market operation:anoperationexecutedontheinitiativeofthecentralbankinthefinancialmarket. With regard to their aims, regularity and procedures, Eurosystem open market operations can be divided into four categories: main refinancing operations; longer-term refinancing operations; fine-tuning operations; and structural operations. As for the instruments used, reverse transactions are the main open market instrument of the Eurosystem and can be employed in all fourcategoriesofoperation.Inaddition,theissuanceofdebtcertificatesandoutrighttransactionsare available for structural operations, while outright transactions, foreign exchange swaps and the collectionoffixed-termdepositsareavailablefortheconductoffine-tuningoperations.
Outright Monetary Transactions (OMTs): transactions that aim to safeguard an appropriate monetary policy transmission and the singleness of the monetary policy in the euro area through purchases of euro area government bonds in the secondary market based on strict and effective conditionality.
Over-the-counter (OTC) trading: a method of trading that does not involve a regulated market. In over-the-counter markets, such as those for OTC derivatives, participants trade directly with each other, typically through telephone or computer links.
Price stability: the maintenance of price stability is the primary objective of the Eurosystem. The Governing Councildefinespricestabilityasayear-on-yearincreaseintheHarmonised Index of Consumer Prices for the euro area of below 2%. The Governing Council has also made it clear that,inthepursuitofpricestability,itaimstomaintaininflationratesbelow,butcloseto,2%overthe medium term.
Projections: the results of exercises conducted four times a year to project possible future macroeconomic developments in the euro area. Eurosystem staff projections are published in June and December, whereas ECB staff projections are published in March and September. They form part of the economic analysis pillar of the monetary policy strategy of the ECB and are thus one of several inputs into the Governing Council’s assessment of the risks to price stability.
Real-time gross settlement (RTGS) system: a settlement system in which processing and settlement take place on a transaction-by-transaction basis in real time (see also TARGET).

237ECB
Annual Report2012
Reference value for M3 growth: the annual growth rate of M3 over the medium term that is consistent with the maintenance of price stability. At present, the reference value for annual M3 growth is 4½%.
Repurchase agreement: the process of borrowing money by combining the sale of an asset (usuallyafixedincomesecurity)withthesubsequentrepurchaseofthatsameassetonaspecifieddateforaslightlyhigherspecifiedprice(whichreflectstheborrowingrate).
Reserve base: the sum of the eligible balance sheet items (in particular liabilities) that constitute the basis for calculating the reserve requirement of a credit institution.
Reserve requirement: the minimum amount of reserves a credit institution is required to hold with the Eurosystem over apredefinedmaintenance period. Compliance with the requirement is determined on the basis of the average of the daily balances in the reserve accounts over the maintenance period.
Reverse transaction: an operation whereby the central bank buys or sells assets under a repurchase agreement or conducts credit operations against collateral.
Securities Markets Programme (SMP): a programme for conducting interventions in the euro area public and private debt securities markets to ensure depth and liquidity in dysfunctional market segments with a view to restoring an appropriate monetary policy transmission mechanism. The SMP was terminated when the technical features of the Outright Monetary Transactions were announced on 6 September 2012.
Securities settlement system (SSS): a system which allows the transfer of securities, either free of payment or against payment (delivery versus payment).
Securitisation: the pooling of financial assets, such as residential mortgage loans, and theirsubsequentsaletoaspecial-purposevehicle,whichthenissuesfixedincomesecuritiesforsaletoinvestors.Theprincipalandinterestofthesesecuritiesdependonthecashflowsproducedbythepoolofunderlyingfinancialassets.
Settlement risk: the risk that settlement in a transfer system will not take place as expected, usually owing to a party defaulting on one or more settlement obligations. This risk includes, in particular, operational risks, credit risks and liquidity risks.
Single supervisory mechanism (SSM): a mechanism composed of the ECB and national competent authorities for the exercise of the supervisory tasks to be conferred upon the ECB. The ECB will be responsible for the effective and consistent functioning of this mechanism, which will form part of the banking union.
Stability and Growth Pact: intended to serve as a means of safeguarding sound government finances in theEUMember States in order to strengthen the conditions forprice stability and for strong, sustainable growth conducive to employment creation. To this end, the Pact prescribes that Member States specify medium-term budgetary objectives. It also contains concrete specifications on the excessive deficit procedure. The Pact consists of the Resolution of the Amsterdam European Council of 17 June 1997 on the Stability and Growth Pact and three Council Regulations, namely (i) Regulation (EC) No 1466/97 of 7 July 1997 on the strengthening of the

238ECBAnnual Report2012
surveillance of budgetary positions and the surveillance and coordination of economic policies, (ii) Regulation (EC) No 1467/97 of 7 July 1997 on speeding up and clarifying the implementation oftheexcessivedeficitprocedure,and(iii)Regulation(EU)No1173/2011of16November2011on the effective enforcement of budgetary surveillance in the euro area. The Stability and Growth Pact is complemented by the ECOFIN Council’sreportentitled“Improvingtheimplementationof the Stability and Growth Pact”, which was endorsed by the Brussels European Council of 22and23March2005.ItisalsocomplementedbyaCodeofConductentitled“Specificationsonthe implementation of the Stability and Growth Pact and Guidelines on the format and content of stability and convergence programmes”, which was endorsed by the ECOFIN Council on11 October 2005.
Standing facility: a central bank credit facility available to counterparties at their own initiative. The Eurosystem offers two overnight standing facilities: the marginal lending facility and the deposit facility.
Straight-through processing (STP): the automated end-to-end processing of trades/payment transfers – including, where relevant, the automated completion of confirmation, matching andgeneration of orders, clearing and settlement.
Systemic risk: the risk that the inability of one participant to meet its obligations in a system will cause other participants to be unable to meet their obligations when they become due, potentially withspillovereffects (e.g. significant liquidityorcreditproblems) threatening thestabilityoforconfidenceinthefinancialsystem.Thatinabilitytomeetobligationscanbecausedbyoperationalorfinancialproblems.
TARGET (Trans-European Automated Real-time Gross settlement Express Transfer system): the Eurosystem’s real-time gross settlement systemfortheeuro.Thefirst-generationTARGETsystem was replaced by TARGET2 in May 2008.
TARGET2: the second-generation TARGET system. It settles payments in euro in central bank money and functions on the basis of a single shared IT platform, to which all payment orders are submitted for processing.
TARGET2-Securities (T2S): the Eurosystem’s single technical platform enabling central securities depositories and NCBs to provide core, borderless and neutral securities settlement services in central bank money in Europe.
Treaties:unless statedotherwise,all references in this report to the“Treaties” refer toboth theTreaty on the Functioning of the European Union and the Treaty on European Union.
Treaty:unlessstatedotherwise,allreferencesinthisreporttothe“Treaty”refertotheTreatyontheFunctioningoftheEuropeanUnion,andthereferencestoarticlenumbersreflectthenumberingin effect since 1 December 2009.
Treaty of Lisbon (Lisbon Treaty): amends the EU’s two core treaties: the Treaty on European Union and the Treaty establishing the European Community. The latter has been renamed the Treaty on the Functioning of the European Union. The Treaty of Lisbon was signed in Lisbon on 13 December 2007 and entered into force on 1 December 2009.


EURO
PEAN
CEN
TRAL
BAN
K AN
NUAL
REP
ORT
2012