annual report 2013 a4 eng - udc · will reflect positively on udc’s operations in 2014,...
TRANSCRIPT


2 A BUSINESS LEGEND, LEADING WITH GENUINE INNOVATIONNNOVGEN
A LEADING COUNTRY WITH AN INNOVATIVEVISION
His Highness
Sheikh Tamim Bin Hamad Al ThaniEmir of the State of Qatar

5ANNUAL REPORT 2013
CONTENT
BOARD OF DIRECTORS 7
CHAIRMAN’S MESSAGE 8-9
UNITED DEVELOPMENT COMPANY (UDC) 16-17
FLAGSHIP PROJECT 18-19 THE PEARL-QATAR (TPQ)
FULLY OWNED SUBSIDIARIES OPERATING IN TPQ 20-37
HOSPITALITY DEVELOPMENT COMPANY (HDC) 20
RONAUTICA MIDDLE EAST (RME) 22
ABRAJ QUARTIER COMPANY 24
MEDINA CENTRALE COMPANY 26
UNITED FASHION COMPANY (UFC) 28
SCOOP 30
GLITTER 32
MADINAINOVA 34
THE PEARL OWNERS CORPORATION (TPOC) 36
FULLY OWNED SUBSIADIRIES OPERATING OUTSIDE TPQ 38-45
UNITED FACILITIES MANAGEMENT COMPANY (UFMCO) 38
PRAGMATECH 40
INSURE PLUS 42
UNITED FACILITIES SOLUTIONS (UFS) 44
JOINT VENTURES 46-59
GULF FORMALDEHYDE COMPANY (GFC) 46
QATAR COOL 48
MIDDLE EAST DREDGING COMPANY (MEDCO) 50
SEEF LIMITED 52
UNITED READYMIX 54
ASTECO QATAR 56
GEKKO LLC 58
CONSOLIDATED FINANCIAL STATEMENTS 60-97
“A GENUINE LEADER IS NOT A SEARCHER FOR CONSENSUS BUT A MOLDER OF CONSENSUS.” ~ MARTIN LUTHER KING, JR.

7ANNUAL REPORT 2013
BOARD OF DIRECTORS
FROM LEFT STANDING
Ali Hassan Al-Khalaf
Board member
Abdul Aziz Mohammed Al-Mana
Board member
Dr. Thani Abdul Rahman Al-Kuwari
Board member
Rashid Hamad Al-Meadadi
Board member
Moftah Jassim Al-Moftah
Board member
FROM LEFT SITTING
Abdulrahman Abdullah Al-Abdul ghani
Vice Chairman
Turki Mohamed Al-Khater
Chairman
Omar Hussain Alfardan
Board member
Sheikh Ali Bin Ghanem Al-Thani
Board member
“LEADERSHIP IS THE ART OF
GIVING PEOPLE A PLATFORM FOR
SPREADING IDEAS THAT WORK.”
~ SETH GODIN
8 9A BUSINESS LEGEND, LEADING WITH GENUINE INNOVATION ANNUAL REPORT 2013
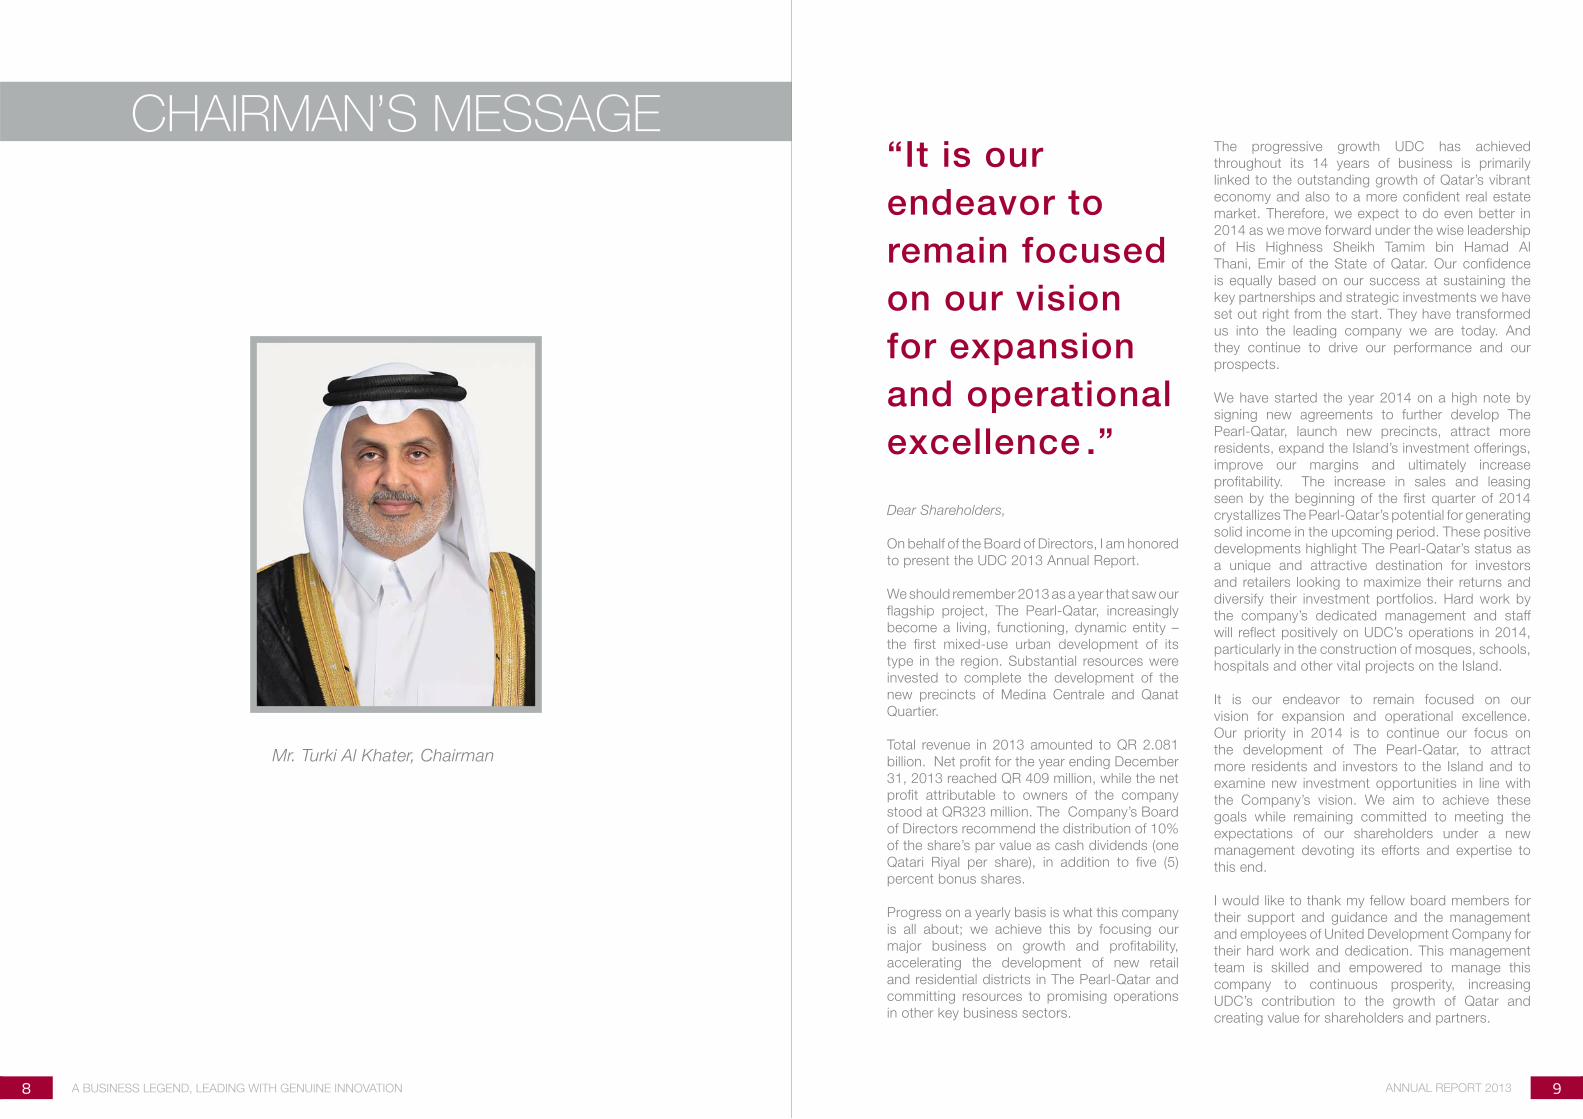
Dear Shareholders,
On behalf of the Board of Directors, I am honored
to present the UDC 2013 Annual Report.
We should remember 2013 as a year that saw our
flagship project, The Pearl-Qatar, increasingly
become a living, functioning, dynamic entity –
the first mixed-use urban development of its
type in the region. Substantial resources were
invested to complete the development of the
new precincts of Medina Centrale and Qanat
Quartier.
Total revenue in 2013 amounted to QR 2.081
billion. Net profit for the year ending December
31, 2013 reached QR 409 million, while the net
profit attributable to owners of the company
stood at QR323 million. The Company’s Board
of Directors recommend the distribution of 10%
of the share’s par value as cash dividends (one
Qatari Riyal per share), in addition to five (5)
percent bonus shares.
Progress on a yearly basis is what this company
is all about; we achieve this by focusing our
major business on growth and profitability,
accelerating the development of new retail
and residential districts in The Pearl-Qatar and
committing resources to promising operations
in other key business sectors.
“It is our
endeavor to
remain focused
on our vision
for expansion
and operational
excellence .”
The progressive growth UDC has achieved
throughout its 14 years of business is primarily
linked to the outstanding growth of Qatar’s vibrant
economy and also to a more confident real estate
market. Therefore, we expect to do even better in
2014 as we move forward under the wise leadership
of His Highness Sheikh Tamim bin Hamad Al
Thani, Emir of the State of Qatar. Our confidence
is equally based on our success at sustaining the
key partnerships and strategic investments we have
set out right from the start. They have transformed
us into the leading company we are today. And
they continue to drive our performance and our
prospects.
We have started the year 2014 on a high note by
signing new agreements to further develop The
Pearl-Qatar, launch new precincts, attract more
residents, expand the Island’s investment offerings,
improve our margins and ultimately increase
profitability. The increase in sales and leasing
seen by the beginning of the first quarter of 2014
crystallizes The Pearl-Qatar’s potential for generating
solid income in the upcoming period. These positive
developments highlight The Pearl-Qatar’s status as
a unique and attractive destination for investors
and retailers looking to maximize their returns and
diversify their investment portfolios. Hard work by
the company’s dedicated management and staff
will reflect positively on UDC’s operations in 2014,
particularly in the construction of mosques, schools,
hospitals and other vital projects on the Island.
It is our endeavor to remain focused on our
vision for expansion and operational excellence.
Our priority in 2014 is to continue our focus on
the development of The Pearl-Qatar, to attract
more residents and investors to the Island and to
examine new investment opportunities in line with
the Company’s vision. We aim to achieve these
goals while remaining committed to meeting the
expectations of our shareholders under a new
management devoting its efforts and expertise to
this end.
I would like to thank my fellow board members for
their support and guidance and the management
and employees of United Development Company for
their hard work and dedication. This management
team is skilled and empowered to manage this
company to continuous prosperity, increasing
UDC’s contribution to the growth of Qatar and
creating value for shareholders and partners.
CHAIRMAN’S MESSAGE
Mr. Turki Al Khater, Chairman

10 A BUSINESS LEGEND, LEADING WITH GENUINE INNOVATION
“INNOVATION DISTINGUISHES BETWEEN A LEADER AND A FOLLOWER.” ~ STEVE JOBS

12 13A BUSINESS LEGEND, LEADING WITH GENUINE INNOVATION ANNUAL REPORT 2013
2009 20112008 2010
* GLITTER
* PRAGMATECH
* GEKKO
* TPOC
* UFS
* UFC
* SCOOP
* MEDINA CENTRALE COMPANY
* ABRAJ QUARTIER COMPANY
* UFMCO
* MADINAINOVA
* INSURE PLUS
2000 2004 20072003 2006
* UDC * MEDCO
* SEEF
* QATAR COOL
* TPQ
* RME
* ASTECO
* HDC
* GFC* UNITED READYMIX
UDC GROWTH TIMELINEFourteen years of innovationTwenty-one subsidiaries and partnerships

14 15A BUSINESS LEGEND, LEADING WITH GENUINE INNOVATION ANNUAL REPORT 2013
UNITED DEVELOPMENT COMPANY (UDC)1
FLAGSHIP PROJECT THE PEARL-QATAR (TPQ)
1
FULLY OWNED SUBSIDIARIES OPERATING IN TPQ
MADINAINOVA | HOSPITALITY DEVELOPMENT COMPANY (HDC)
| UNITED FASHION COMPANY (UFC) | MEDINA CENTRALE
COMPANY | ABRAJ QUARTIER COMPANY | RONAUTICA
MIDDLE EAST (RME) | THE PEARL OWNERS CORPORATION
(TPOC) | GLITTER | SCOOP
9
JOINT VENTURES
MIDDLE EAST DREDGING COMPANY (MEDCO) | SEEF LIMITED |
QATAR COOL | UNITED READYMIX | ASTECO QATAR | GEKKO LLC
| GULF FORMALDEHYDE COMPANY (GFC)
7
FULLY OWNED SUBSIDIARIES OPERATING OUTSIDE TPQ
PRAGMATECH | UNITED FACILITIES SOLUTIONS (UFS) | UNITED
FACILITIES MANAGEMENT COMPANY (UFMCO) | INSURE PLUS
4
* The above color codes are used to distinguish the different subcategory to which each subsidiary belong. Please refer to this legend from
page 14 to page 59.
LEGEND *
UDC GROUP OF COMPANIES Fifteen fully owned companies, seven joint ventures and more is yet to come...
ONE TEAM

16 17A BUSINESS LEGEND, LEADING WITH GENUINE INNOVATION ANNUAL REPORT 2013
One of Qatar’s leading shareholding
companies, United Development
Company was established in 2000
and listed on the Qatar Exchange
in June 2003. It has an authorized
share capital of QR 3.372 billion, a
market capitalization of QR 7.625
billion and total assets of QR 18.764
billion at 31 December 2013.
Since day one, UDC has strived
to become a cornerstone in the
development of Qatar and the
region by targeting investment
and joint venture opportunities in
infrastructure, real estate, energy-
intensive industries, hydrocarbon
downstream manufacturing,
maritime and environment-related
businesses, urban development,
utilities, hospitality, retail and fashion,
property management, security and
other services.
Through a combination of project
activities and commercial enterprise,
the company has developed into
the first-choice private sector
and joint venture partner for
international investors in Qatar,
and has successfully established
several new ventures and business
operations in recent years. Wholly-
owned subsidiaries under the
umbrella of United Development
Company include: Hospitality
Development Company, United
Fashion Company, Ronautica
Middle East, Madinainova, Resorts
and Leisure Company and The
Pearl Owners Corporation.
One of UDC’s landmark projects
is the urban development of The
Pearl-Qatar, Qatar’s only man-made
Island. Located some 350 meters
offshore of Doha’s prestigious West
Bay District, The Pearl-Qatar Island
is one of the largest mixed-use real
estate developments in the Gulf.
Today, the company continues to
quest for excellence and progress
by identifying new investments
and partnerships for its diversified
portfolio of businesses.
Ownership: Qatari Shareholding CompanyIncorporated: 2000Sector: Projects Development and Investments
UNITED DEVELOPMENT COMPANY (UDC)

18 19A BUSINESS LEGEND, LEADING WITH GENUINE INNOVATION ANNUAL REPORT 2013
The Pearl-Qatar is a unique and
innovative mixed-use urban
development in Doha, Qatar.
Owned and developed by United
Development Company (UDC), the
Island spans over four million square-
meters of land that was meticulously
developed into a masterpiece of
private and modern living. Today,
it offers residents and visitors a
complete lifestyle experience that
includes residential solutions of the
highest international standards, a
fantastic choice of retail, dining and
hospitality offerings and a host of
other amenities and facilities.
Admired as Doha’s “Riviera Arabia,”
The Pearl-Qatar occupies a prime
location off the coast of Doha’s West
Bay. An assortment of residential
accommodations for every taste and
style, balanced mixtures of retail and
hospitality outlets, three world-class
marinas and an impressive beachfront
have made this man-made Island
one of the most desirable addresses
in the Gulf region.
World-class architecture, luxurious
amenities and aesthetic nuances
exude old-world charm and the best
in modern living. The result is as much
a destination as it is an experience,
blending residential charm with the
comfort of an exclusive resort.
The Pearl-Qatar’s first phase and
gateway to the Island houses the
world’s longest waterfront luxury
retail walkway, the 3.5 kilometer
marina-front pedestrian boardwalk
“La Croisette”, which is home to
international hospitality brands and
fashion boutiques.
In 2013, Porto Arabia witnessed
the grand openings of a multitude
of internationally renowned outlets.
These included fashion outlets
Nahle Fashion, The Closet, Ascots
& Chapels, Lass, and DNA. Other
lifestyle brands that had opened in
2013 include Altamoda Furniture,
Poltrona Frau and Kaira Beauty.
In the Food and Beverage sector,
Patagonia, Marble Slab, Caribou
Coffee, Cake & Bake, Casa Paco
and Al Mayass led the way in 2013,
while more are scheduled to open in
2014.
Porto Arabia hosted in 2013
numerous exclusive events as well
as seasonal live entertainment in
the midst of Porto Arabia’s award-
winning 782-berth marina.
Development of The Pearl-Qatar’s
10 precincts is well underway. Upon
completion, approximately 19,000
residential dwellings will be in use.
Ownership: UDC – 100% Incorporated: 2007Sector: Island Development
THE PEARL-QATAR

20 21A BUSINESS LEGEND, LEADING WITH GENUINE INNOVATION ANNUAL REPORT 2013
Hospitality Development Company
(HDC) owns, develops and operates
world-class hospitality projects
and businesses. The Company’s
strategy revolves around UDC’s
vision of creating and managing
a diverse portfolio of hospitality
related businesses. Many of HDC’s
brands are entering the Middle East
market for the first time at The Pearl-
Qatar. They include internationally
celebrated and recognized names
in the food and beverage industry.
HDC brands:
HDC currently operates eight
restaurants and cafés in The Pearl-
Qatar. A ninth restaurant is located
in the West Bay business district.
These restaurants, most of which
are joint ventures with international
partners, are:
Tse Yang: an elegant, high-end
Chinese restaurant.
Megu: the finest in modern
Japanese cuisine.
Pampano: this Latin American
inspired restaurant was created
by Chef Richard Sandoval and
Maestro Placido Domingo.
Liza: a Paris-based restaurant
combining Levantine
gastronomy with a modern
twist.
Burj Al Hamam: “The Art of
Lebanese Cuisine” for over 50
years, this elegant restaurant
offers a wide range of Lebanese
traditional dishes and fresh
seafood specialties.
Alison Nelson’s Chocolate
Bar: a slick, chic and stylish
café offering salads, desserts,
chocolate and ice-cream.
Al Tabkha: authentic home-like
cooking Lebanese food.
The Bread Basket: a café-like
bakery offering fresh bakery
products.
Bistro 61: this stylish but casual
eatery is located in the West
Bay and boasts an extensive
menu, including business lunch,
popular international dishes
as well as traditional Lebanese
favorites.
Future plans
Social Club: anticipated to open
soon.
Ownership: UDC – 100% Incorporated: 2007Sector: Hospitality
HOSPITALITY DEVELOPMENT COMPANY (HDC)

22 23A BUSINESS LEGEND, LEADING WITH GENUINE INNOVATION ANNUAL REPORT 2013
A fully owned subsidiary of United
Development Company, Ronautica
Middle East has become a trusted
name in marina management
and nautical services. After its
incorporation in 2007, the Company
established itself as an authority in
the marine industry, spearheading
Qatar’s luxury boating business.
Ronautica Middle East boasts
a team of seasoned marina
specialists and is charged with the
management of The Pearl-Qatar’s
three world-class marinas. They
include the marina at Porto Arabia,
which can moor 782 vessels up to
100 meters in length. The marina
is truly state-of-the-art, providing
access to an innovative vacuum
sewage system set at every super
yacht berth.
In addition to developing and
operating The Pearl-Qatar’s marina
infrastructure, Ronautica Middle
East runs a water taxi service and
provides the Island with yacht
charters, limited fuel sales and boat
cleaning services. Many super
yachts in excess of 50 meters in
length are permanently berthed at
Porto Arabia Marina. The marina
also regularly welcomes visiting
super yachts that are considerably
larger in size.
In 2013, Ronautica Middle East
underwent a series of changes
in structure and personnel to
position the Company for growth
in revenue and profit. Several
unprofitable lines of business
were exited, including large yacht
charter, yacht sales, yacht repair
and many of the nautical activities
that were previously offered. Some
support staff roles were eliminated
and operations staff repositioned
to concentrate on a core marina
management function.
In 2014, Ronautica Middle East will
continue to focus on streamlining
operations with a move to smaller,
better-located offices. The
company also plans to launch an
exciting new yacht club format and
to open and operate two major fuel
piers to better satisfy current berth
holders and to aid in attracting new
clients.
Ownership: UDC – 100% Incorporated: 2007Sector: Marine Industry and Services
RONAUTICA MIDDLE EAST

24 25A BUSINESS LEGEND, LEADING WITH GENUINE INNOVATION ANNUAL REPORT 2013
The Abraj Quartier Company will
develop the mixed-use district of
Abraj Quartier, capitalizing on the
substantial value resulting from its
location immediately adjacent to the
entrance of The Pearl-Qatar from
the mainland.
The construction of the two main
office towers commenced in 2013.
Ownership: UDC – 100% Incorporated: 2008Sector: Real Estate Investment and Development
ABRAJ QUARTIER COMPANY

26 27A BUSINESS LEGEND, LEADING WITH GENUINE INNOVATION ANNUAL REPORT 2013
Medina Centrale Company is the
development and investment arm of
Medina Centrale, the vibrant Pearl-
Qatar community centre. Nestled
between the residential, shopping
and dining district of Porto Arabia
and the relaxed, family-oriented
beachfront community of Viva
Bahriya, Medina Centrale has
been conceived from the outset
as the heart of The Pearl-Qatar.
The entire Medina Centrale district
forms a single, mixed-use property
development comprising residential
apartments, ample retail space and
ample car parking spaces.
Medina Centrale offers residents
benefits that include:
Parks, plazas, water features
and on street parking.
Retail facilities in open-air
promenades as well as indoor
shopping facilities.
Centralized gathering place in
the district’s Central Piazza, well
suited to host public activities
and community events.
The Medina Centrale Company
retains ownership of the
development as an investment.
Income is generated from leasing
of the various residential and retail
components of the property. The
retail services are diverse, offering
the following facilities:
Spinneys, the only full-time
supermarket in The Pearl-Qatar.
A giant cinema complex.
More than 100 quality retail
units.
Forty restaurants and cafes
from around the world.
The demand to lease residential
property in Medina Centrale is
driven by the appeal of living in a
central community characterized by
low-rise buildings, abundant green
space and the interesting variety of
retail shops.
Ownership: UDC – 100% Incorporated: 2008Sector: Real Estate Investment and Development
MEDINA CENTRALE COMPANY

28 29A BUSINESS LEGEND, LEADING WITH GENUINE INNOVATION ANNUAL REPORT 2013
United Fashion Company brings
world-class luxury fashion brands
to The Pearl-Qatar. Its long-term
strategy envisions a network
of stores that branch from
Internationally acclaimed luxury and
mid to mid-upper brands across a
variety of retail categories.
The Company owns and manages
a wide range of boutiques. It also
focuses on service-driven products
such as beauty salons. UFC’s
brand portfolio to date includes:
L.K.Bennett, Alberta Ferretti, Calvin
Klein Collection, Etro, George
Jensen, Harmont & Blaine, Missoni,
Rene Caovilla, Salvatore Ferragamo,
Santoni and Stefano Ricci, Hiref,
Lancel, RonyNacouzi and Porto
Salon.
UFC brings the best of fashion to
Qatar at prices competitive with
those charged at European retailers.
Most of the Company’s leading
international brands had opened
their flagship Middle East region
stores at The Pearl-Qatar.
UFC’s core customer market is
diverse, reflecting the company’s
brand portfolio for men and
women. Future strategies call for
diversification by bringing in popular
fashion and lifestyle brands catering
to middle income customers and
families.
Ownership: UDC – 100% Incorporated: 2008Sector: Fashion and Beauty
UNITED FASHION COMPANY (UFC)

30 31A BUSINESS LEGEND, LEADING WITH GENUINE INNOVATION ANNUAL REPORT 2013
Assigned as The Pearl-Qatar’s
exclusive Out-Of-Home media
provider, SCOOP manages the vast
potential of media and advertising
space on the Island and offers an
integrated range of specialized
solutions incorporating tailor-made
design concepts for indoor and
outdoor media.
Within a relatively short period of time,
SCOOP has positioned The Pearl-
Qatar as an acknowledged Out-
Of-Home advertising destination
in Doha. Through an outstanding
customer-centric approach and
state of the art innovative media
offerings, the Company was able to
build an extensive client database,
delivering campaigns to an array
of blue-chip companies from
diverse industries. SCOOP’s list of
past clients included: Qatar 2022
Supreme Committee, ExxonMobil,
Qtel, Total, Vodafone, Barwa
Bank, Doha Tribeca Film Festival,
Mercedes-Benz, Qatar Football
Association and others.
Ownership: UDC – 100% Incorporated: 2008Sector: Media and Advertising
SCOOP

32 33A BUSINESS LEGEND, LEADING WITH GENUINE INNOVATION ANNUAL REPORT 2013
Glitter was incorporated in 2009
to handle facilities and waste
management services. Operating
primarily in The Pearl-Qatar, its
services are also offered to other
UDC subsidiaries. The Company
was founded on a vision aimed at
meeting Qatar’s growing needs in
the facilities and waste management
logistics.
Ownership: UDC – 100% Incorporated: 2009Sector: Facility and Waste Management
GLITTER

34 35A BUSINESS LEGEND, LEADING WITH GENUINE INNOVATION ANNUAL REPORT 2013
The Madinainova Company was
established to address the needs
of property owners and residents of
The Pearl-Qatar.
Madinainova is the central point of
communication for the stakeholders,
investors and residents of the Island.
It coordinates with government
agencies and related entities to
resolve issues and develop further
policies and procedures with the
aim of ensuring that a five-star
quality lifestyle is delivered at The
Pearl-Qatar.
The Company is comprised of two
main divisions:
The Pearl-Qatar Central Authority
Directorate (TCAD), and The Master
Community Management.
or regulatory body and five-star
service provider for The Pearl-Qatar
registry, single window, helpdesk,
and community relations services
for the Island investors, retailers and
residents.
Management ensures that
appropriate mechanisms required
to manage the high standards of
maintenance and use of the shared
facilities are in place, and that they
are administered and preserved for
the mutual benefit of current and
future owners and residents.
Madinainova Achievements in
2013 and Future Plans
Sustainably provided five-
star governmental and non-
governmental services to Pearl-
Qatar residents, retailers and
investors.
Effectively enforced rules and
regulations, contributing to
a quality living and working
environment in The Pearl-Qatar.
Processed the issuance of
title deeds and various registry
transactions.
Issued event and exhibition
licenses.
Managed the clearance of
certification prerequisite for
reselling of properties and/or
obtaining title deeds.
Provided community based
amenities such as playgrounds,
tennis courts and walkways.
Provided a single point of contact
for The Pearl-Qatar through the
Ittisal Help Desk initiative.
Provided residents and owners,
through its easily accessible
offices in Porto Arabia, a
single window for accessing
the services offered by the
Department.
Provided a one-stop solution for
easy access to applicable Qatar
Government services.
Plans for 2014 include the
introduction of new and efficient
Madinainova customer-service
offerings.
Ownership: UDC – 100% Incorporated: 2010Sector: Property Management and Services
MADINAINOVA

36 37A BUSINESS LEGEND, LEADING WITH GENUINE INNOVATION ANNUAL REPORT 2013
The Pearl Owners Corporation
(TPOC) provides Co-Owners
Association Management services
to Co-Owned freehold property
owners in Qatar.
TPOC’s full service Association
Management services comprise
four main activities:
Administrative Management
Services: These services
include arranging and facilitating
meetings of each association
and providing comprehensive
support to Co-Owners’
representatives.
Financial Management
Services: Included in these
services are setting budgets
for Co-Owned properties,
issuing service charges and
collection services as well as
full management of the Co-
Owners’ budgets.
Property Management Services:
Covers the management of the
Co-Owned Built Environment,
including administering service
providers and monitoring the
planned maintenance to ensure
the properties achieve their
designated life cycle as well as
overseeing the enforcement
of community rules and
regulations.
Transparent Record Keeping:
The management of the records,
including all financial chronicles
for the Co-Owners Associations
to ensure accurate accounts
as well as full transparency in
decision-making.
Achievements in 2013 and
Future Plans
Providing consultancy for Qanat
Quartier.
Provision of Co-Owners
Association Management
Services for additional
properties in Porto Arabia as
more properties in TPQ are
completed.
The issuance of a fully output-
based FM delivery model that
innovates and permits efficient
in-class service delivery.
Benchmarking of services
across Co-Owners
Associations.
Full compliance with TPQ
Constitution.
The TPOC 2014 plans stipulate an
increase in service platforms for all
owners and residents of the Co-
Owners Associations, as well as
increasing customer satisfaction
across all existing Co-Owners
Associations.
Ownership: UDC – 100% Incorporated: 2011Sector: Co-Owners Association Management Services
THE PEARL OWNERS CORPORATION (TPOC)

38 39A BUSINESS LEGEND, LEADING WITH GENUINE INNOVATION ANNUAL REPORT 2013
United Facilities Management
Company was incorporated in
March 2008 and currently employs
300 staff members. This number is
forecast to exceed 350 during 2014.
UFMCO’s core business is the
delivery of integrated facilities
management services. Geared
initially to service The Pearl-Qatar,
it presently manages the Master
Community Area of The Pearl-Qatar
along with retail and residential
assets, notably in Porto Arabia,
Medina Centrale, Viva Bahriya and
Qanat Quartier.
Building on its 2012 momentum,
UFMCO has reported in 2013 the
conclusion and successful renewal
of a number of facilities management
agreements with companies located
in West Bay, as well as in Mesaieed.
Other developments are in the
pipeline as the company expands
its horizons throughout Qatar.
Range of facilities provided include
municipal services, building fabric
maintenance, waste management,
pest control, helpdesk, building
handover and inspections, as
well as mechanical, electrical and
plumbing system maintenance.
UFMCO will continue to seek clients
and to act as their head facilities
management contractor, providing
a single point of contact and taking
responsibility for its clients’ property
portfolio maintenance and upgrade
requirements.
UFMCO is an ISO certified company
- ISO 9001:2008, ISO 14001:2004
and OHSAS 18001:2007.
It uses these capabilities, as well as
the Balanced Scorecard Strategic
Management System, in order to
execute its stated mission: “We will focus relentlessly on solving our customers’ facilities-related challenges, acting as a trusted partner and advisor to ensure that our customers’ total cost of property ownership is kept to the minimum.”
Ownership: UDC – 100% Incorporated: 2008Sector: Facilities Management Services
UNITED FACILITIES MANAGEMENT COMPANY (UFMCO)

40 41A BUSINESS LEGEND, LEADING WITH GENUINE INNOVATION ANNUAL REPORT 2013
Headquartered in Doha, Pragmatech
was incorporated in 2009 with
a mission to create and deliver
innovative information technology
services and products.
The Company’s scope of operations
included: development, consulting,
research and training. It specializes in
software engineering, computational
linguistics, security and privacy,
algorithms and artificial intelligence.
In addition to addressing the
information technology requirements
of today’s modern businesses,
Pragmatech commits substantial
resources to research and
development.
Solutions and Products by
Pragmatech:
Ctrl: a semantic engine for text
analysis.
Ctrl-News: a research solution
that processes a number of online
news sources and delivers to
subscribers news articles related
to their subject of interest.
snagR: snagging and inspection
management software for the
MENA region.
Proprietary CRM: targeting
mainly the convention and visitors
bureaus in the USA.
Ownership: UDC – 100% Incorporated: 2009Sector: Information Technology
PRAGMATECH

42 43A BUSINESS LEGEND, LEADING WITH GENUINE INNOVATION ANNUAL REPORT 2013
Insure Plus is an insurance
consultancy firm incorporated in
2010 to fill a need in the Qatari
insurance market for a professional
and competent Insurance and Risk
Management Consultancy.
The company offers services of the
highest professional standards while
remaining focused on delivering
value to its clients and underwriting
partners through expertise and
innovation.
Insure Plus offers a comprehensive
list of insurance products and
services covering fire and burglary,
motor and home care, marine hull,
cargo and bulk oil, contractor’s all
risk and workmen’s compensation,
professional indemnity, directors’
and officers’ liability, electronic data
and communication insurance,
business interruption insurance and
loss of profit and oil and gas.
The Consultancy
Insure Plus integrates expert
insurance and alternate risk transfer.
It increasingly helps in the application
of finite and blended risk solutions
to assist companies overcome the
rising cost of insurance.
These advisory services make
policies issued through Insure
Plus tailor-made. The client will
be properly protected and will
save costs. Insure Plus supplies all
necessary services to the insured
throughout its contract period,
including:
Updating insurance policies
Offering new insurance products
Handling claim management
The Risk Management
Insure Plus innovates in the growing
field of alternative risk transfer and
management to create the detailed,
effective and comprehensive
structure needed to address risk
inherent in its clients’ business. An
assembled risk management would
be of high interest to the insured in
order to avoid dispersion of actual
from expected results.
Risk management starts by
identifying and measuring risks
of accidental loss through a
pre-risk survey conducted by
certified, internationally recognized
surveyors. Insure Plus would then
operate a selection of appropriate
risk management techniques for
resolving exposure problems by
risk assumption, risk reduction, risk
retention, risk transfer and other
systems, including the purchase of
insurance.
Ownership: UDC – 100% Incorporated: 2010Sector: Insurance Consultancy and Risk Management
INSURE PLUS

44 45A BUSINESS LEGEND, LEADING WITH GENUINE INNOVATION ANNUAL REPORT 2013
United Facilities Solutions (UFS) is
a knowledge-based Technical and
Business Solutions and Services
provider.
UFS delivers unparalleled solutions
and services, aiming to establish
SMART Business with a SMART
Team, and to provide innovative,
high quality ‘Solutions and Services’
designed to add value to clients.
UFS solutions and services are
vendor-independent, enabling clients
to mix and match leading products to
meet business requirements rather
than having a ‘one fit all’ approach
that often results in a compromised
quality and business innovation.
The Company’s end-to-end
solutions and services across
various technically challenging
vertical markets include:
1. Building Management systems
– Solutions, Integration and
Maintenance.
2. Home Automation Systems
– Solutions, Integration and
Maintenance.
3. Security Management Systems
– Solutions, Integration and
Maintenance.
4. Fire Alarm and Protection
Systems – Solutions, Integration
and Maintenance.
5. Digital Meters, AMR/
AMI Systems and Energy
Management Systems.
6. IT and Network Infrastructure
– Solutions, Integration and
Maintenance.
7. Enterprise Resource planning
systems (ERP) and Facilities
Management Systems (FMS) –
Solutions and Maintenance.
8. Command control centers and
Data Centre Management and
Establishment.
9. IPTV and Telecommunications
Services – Solutions and
Maintenance.
10. Project Management and PMO
– Consultancy, Services and
Solutions.
Achievements in 2013 and Future
Plans
Within a short span of time, UFS
has provided world-class business
solutions and services, while
offering the most professional
systems integrations and project
implementation services. The
Company has recorded tangible
growth in 2013, boasting a healthy
financial performance and offering
innovative customer solutions. UFS
manages the IPTV system within
The Pearl-Qatar with ‘Free to Air’
channels in several languages and
paid channels from the leading
content providers.
UFS will continue in 2014 to
focus on existing projects within
The Pearl-Qatar and will aim at
larger new projects outside. The
Company has an interest in a range
of innovative solutions and services
targeting specific market segments.
To achieve this, UFS will remain
vendor independent and will focus
on strategic partnerships to provide
value added services.
Ownership: UDC – 100% Incorporated: 2011Sector: Technical and Business Solutions & Services
UNITED FACILITIES SOLUTIONS (UFS)

46 47A BUSINESS LEGEND, LEADING WITH GENUINE INNOVATION ANNUAL REPORT 2013
Gulf Formaldehyde Company
(GFC) is a fast growing Qatari
shareholding company with a paid
up capital of QAR 40 Million. It is
a joint venture between United
Development Company (UDC),
Qatar Fertilizer Company (QAFCO)
and Qatar Industrial Manufacturing
Company (QIMC).
The Company produces and sells
Urea Formaldehyde Condensate
(UFC). Its plant in Mesaieed is fully
integrated with the production
facilities of Qatar Fertilizer Company
(QAFCO), the majority shareholder
in GFC and its prime customer.
GFC produces 82 tons of Urea
Formaldehyde (UFC-85) per day,
a viscous liquid with 60 percent
formaldehyde, 25 percent urea and
15 percent water. Eighty percent of
the UFC-85 produced is consumed
by QAFCO and is used as an anti-
caking agent in the production
of urea, a solid fertilizer and one
of QAFCO’s primary products.
The remainder is exported
internationally.
Ownership: UDC – 10%; QAFCO – 70%; QIMC – 20%Incorporated: 2003Sector: Industrial Manufacturing
GULF FORMALDEHYDE COMPANY (GFC)

48 49A BUSINESS LEGEND, LEADING WITH GENUINE INNOVATION ANNUAL REPORT 2013
Now in its 10th year of operation, Qatar Cool has capitalized on UDC’s strategic vision to create a centralized utility company dedicated to providing district cooling to both The Pearl-Qatar and Doha’s growing industrial, commercial and residential developments.
District cooling entails the production and circulation of chilled water to multiple buildings through a network of insulated underground pipes.
In 2010, the Company inaugurated the world’s largest district cooling plant ‘The Integrated District Cooling Plant’ (IDCP) at the Pearl-Qatar. IDCP will service more than 80 apartment towers, beachfront villas and townhouses, shopping complexes, offices, schools and hotels throughout the Island, ultimately supplying 130,000 tons of refrigeration to the Island’s 45,000 residents.
Two other plants are fully-operational in West Bay, producing 66,609 Tons of Refrigeration (TR) and serving 46 towers. Additionally, a third plant in the West Bay area with a capacity of 40,000 TR will be operational in 2016.
Key Advantages of District Cooling1. Reliability:
- Higher energy utilization and substantially reduced energy consumption.
- Continuous operations with a back-up system in case of emergency.
2. Energy efficient and environmentally sound:- Conserves energy and improves
operating efficiency.- Reduces CO2 levels, resulting in
cleaner air.- Reduces the need for huge
capital investment for A/C equipment on developed sites, bringing cost down while making buildings safer and more environmentally friendly.
- Easy to operate and maintain.- Comfort and convenience
through significant reduction of vibration and noise.
Accomplishments and Milestones in 2013
Increased the connected capacity of its cooling plant at The Pearl-Qatar from 65,105 tons of refrigeration in 2012, serving 55 Energy Transfer Stations to 76,964 tons of refrigeration in 2013, serving 65 Energy Transfer Stations. Increased the connected capacity of its West Bay plants from 64,967 tons of refrigeration in 2012, serving 45 towers, to 66,609 tons of refrigeration in 2013, serving 46 towers. Awarded the “Award of Excellence” at the 3rd Global District Energy Climate Awards in New York City, USA – organized by the International District Energy Association (IDEA) along with Euroheat and Power.Awarded the “Best District Cooling Utility Provider” at the Middle East Climate Control awards ceremony in Dubai.Accumulated various industry awards from the International District Energy Association (IDEA) for square footage served, number of buildings served, and a special recognition for innovation. Participated in environmental events such as Earth Day 2013.Engaged in Corporate Social Responsibility (CSR) activities that included: blood donation drive, educational tours at the world’s largest district cooling plant, celebrating Earth Hour, among others.
Plans for 2014New improvements on online billing systems and customer self-service portal. Targeting energy optimization for all Qatar Cool plants to ensure energy is stored during idle periods for future use in more demanding periods.In light of Qatar’s 2030 vision, Qatar Cool is actively coordinating with different agencies and authorities to find the optimum solutions for future infrastructure. Growth is expected at all levels of operation, including increase in the number of full-time staff, increases in plant capacities as well as increases in production levels.
Ownership: UDC – 51%; Tabreed UAE – 44%; Qatari Investors – 5% Incorporated: 2004Sector: District Cooling
QATAR COOL

50 51A BUSINESS LEGEND, LEADING WITH GENUINE INNOVATION ANNUAL REPORT 2013
Middle East Dredging Company
is a joint venture between United
Development Company, Dredging,
Environmental and Marine
Engineering (DEME) of Belgium,
and Qatar Holding. Incorporated in
2004, MEDCO’s first project was the
establishment of The Pearl-Qatar’s
site. It completed dredging and land
reclamation work for the Island in
2007.
MEDCO was awarded several major
projects in Qatar and the Gulf region.
The Company led an international
consortium as it completed dredging
and reclamation work for the New
Doha International Airport (NDIA)
in 2008. In late 2010, MEDCO
completed the first two phases
for the Qatar-Bahrain Causeway
Project, and discussions re-started
in November 2013 for Phase-3
Causeway construction.
In March 2012, MEDCO was
awarded the prestigious four-year,
QR 4.5 billion New Port Project in
Qatar, covering dredging of main
access channel, reclamation of
Naval Base, general reclamation,
soil treatment and construction of
outer breakwater.
While actively completing projects
in Qatar, MEDCO also expanded
its regional reach. In 2010, MEDCO
completed a major project for
Khalifa Port as well as construction
of Ras Ghanada Channel Extension
and dredging and reclamation
works granted by the Department
of Presidential Affairs in Abu Dhabi.
In 2011, MEDCO completed a
project on Boubyan Island (Kuwait);
a major project in the UAE was
handed over in 2012 to TAKREER
in Ruwais Refinery Expansion, and
another project involving dredging
/ backfilling of seawater intake pipe
lines, also at Ruwais Refinery, was
completed in 2013.
In early 2011, MEDCO was awarded
the EPC contract for a challenging
design and construction of two
artificial islands on the Satah Al
Razboot (SARB) ADNOC oilfield, built
120 km offshore of Abu Dhabi; first
island, SARB-1, was handed over in
December 2013, while the second
island, SARB-2, will be handed over
in January 2014. In 2013, MEDCO
was awarded and completed the
dredging of a navigation channel for
ARAMCO in Saudi Arabia.
Key Achievements in 2013 and
Expected Growth for 2014
Growth in market share in Qatar,
UAE (Abu Dhabi, Dubai), Bahrain
and Saudi Arabia.
Utilization of MEDCO-owned
marine equipment, rock
positioning spud barges, rock
barges and the brand new self-
propelled cutter suction dredger
“Al Jarraf” at SARB Project
in Abu Dhabi and at the New
Port Project in Qatar. MEDCO
deployed two mega cutter
dredgers for dredging the very
hard rock at access channel to
New Port Project in Qatar.
Execution with extreme
precision of all rock installation
of breakwaters, embankments,
concrete quay walls, artificial
concrete blocks accropodes for
ports and shore protection at
SARB Islands.
Achievement of updated ISO
9001, ISO 14001 and OHSAS
18001 certificates.
Our Branches in Abu Dhabi,
Bahrain, Ras Al Khaimah are
actively targeting new projects.
Targeting new projects in Saudi
Arabia, Oman and Kuwait.
Ownership: UDC – 45.9%; DEME – 44.1%; Qatar Holding – 10% Incorporated: 2004Sector: Dredging and Land Reclamation
MIDDLE EAST DREDGING COMPANY (MEDCO)

52 53A BUSINESS LEGEND, LEADING WITH GENUINE INNOVATION ANNUAL REPORT 2013
SEEF Limited is a semi government
Petrochemical Company. The
Company was incorporated under
the laws of the State of Qatar and
was registered in July 2004. It is a
joint venture between Al-Waseeta
and United Development Company.
The shareholders’ paid up capital is
QR one billion.
The Company owns a plant in
Mesaieed Industrial City that
produces Linear Alkyl Benzene
(LAB), a hydrocarbon based
petrochemical used as the
main feedstock to manufacture
commercial detergents. The plant
produces 100,000 metric tons of
LAB per year, as well as heavy Alkyl
Benzene (HAB), a by-product used
as feed stock for the production of
lubricant oil.
SEEF adheres to environmental
policies by following strict national
and international production
standards. It employs the latest
environmental friendly UOP DETAL
process, using a solid bed catalyst
alkylation process that abolishes
the use of hazardous liquid acid in
the plant. The UOP process is an
effective method of continuously
separating Normal Paraffin from a
stream of co-boiling hydrocarbons
by means of physically selective
absorption.
SEEF’s vision is to be world leader
in the production of LAB and its
sales worldwide. Consequently,
SEEF products today are well
established in the market place,
and the company has earned the
goodwill of its customers through a
professional and customer focused
approach adopted over the years.
Qatar Chemical and Petrochemical
Marketing and Distribution
Company (Muntajat) holds exclusive
rights to purchase, market,
distribute and sell Qatar’s production
of chemical and petrochemical
regulated products to the global
market. Linear Alkyl Benzene (LAB)
and Heavy Alkyl Benzene (HAB),
which are produced by SEEF, are
part of the regulated chemical and
petrochemical products Muntajat
will purchase, market distribute
and sell to customers in over 120
countries worldwide. Muntajat
will operate through up to 36
offices spread around the globe
in addition to a number of logistic
establishments and warehouses
that will support its activities of
marketing, sales and distribution.
Muntajat started taking orders for
Linear Alkyl Benzene and Heavy
Alkyl Benzene as of 1st of April 2013.
Muntajat and SEEF have completed
the regulatory consultation process
in order to secure a seamless
transition of the current marketing,
sales and associated operations
activities to Muntajat, ensuring
smooth continuous supply to the
existing valuable customers.
Through its stake in SEEF, United
Development Company leverages
its presence in the petrochemical
sector, a strategically and
economically reliable industry.
Ownership: Ownership: UDC – 20%; Qatar Intermediate Industries Co. Ltd (Al-Waseeta) – 80%Incorporated: 2004Sector: Petrochemical
SEEF LIMITED

54 55A BUSINESS LEGEND, LEADING WITH GENUINE INNOVATION ANNUAL REPORT 2013
A joint venture between United
Development Company and BESIX
of Belgium as major shareholders,
United Readymix has served the
construction needs of The Pearl-
Qatar since 2006. More recently,
United Readymix extended its new
line of focus to secure and supply
various prestigious development
projects outside The Pearl-
Qatar, including Lusail, where
the company had underlined its
commitment to expansion and
growth by establishing there a
production branch in 2011.
United Readymix operates three
state-of-the-art batching plants
adjacent to The Pearl-Qatar, and
two batching plants in the Lusail
Project. These plants utilize over
60 mixer trucks to produce more
than 60,000 cubic meters of
concrete monthly. Other equipment
supporting the plants include 10
static concrete pumps and placing
booms and 14 mobile pumps.
Despite increasing competition
in the market, the Company was
able to achieve a good turnover
compared to last year.
United Readymix strives to deliver
the highest quality of concrete, and
its production capacity is likely to
go up substantially in 2014 as so far
witnessed during the last quarter of
2013 and as construction projects
in Qatar multiply following FIFA’s
choice of Qatar to host the 2022
World Cup. Moreover, the ambitious
infrastructure and other industrial
development plans embarked by
the State of Qatar are expected
to boost the demand for readymix
concrete over the next decade.
Ownership: UDC – 32%; BESIX – 40%; Six Construct – 9%; Qatari Investors – 19%Incorporated: 2006Sector: Ready Mixed Concrete
UNITED READYMIX W.L.L.

56 57A BUSINESS LEGEND, LEADING WITH GENUINE INNOVATION ANNUAL REPORT 2013
Asteco Qatar is a joint venture
between United Development
Company, Commercial Bank of
Qatar, Qatar Insurance Company
and Asteco Property Management.
It offers property management,
residential sales and leasing,
commercial leasing, valuation,
research and property consultancy
services.
Through efficient property
management systems and ongoing
consultation with developers and
owners, the Company facilitates
consistent property operations
and focuses on client satisfaction
throughout the Doha real estate
market.
Key Advantages
Asteco Qatar is one of the leading
real estate services providers in
Qatar.
The Company is connected to
operations in Dubai, Abu Dhabi,
Al Ain, Saudi Arabia, Jordan and
Bahrain through Asteco Property
Management LLC. As a group,
Asteco Property Management
LLC is the largest real estate
services provider in the Gulf
Region.
Asteco Qatar’s clients include
developers, institutions,
corporations, private investors, high
net-worth individuals, government
bodies and sovereign wealth funds.
The Company also represents
landlords and tenants of apartment
units and villas.
Asteco Qatar has leased in excess
of 700 units and sold over 315 units
on behalf of clients at The Pearl-
Qatar. The Company’s Property
Management Division currently
boasts over one million sq. ft. of
residential and commercial property
under management throughout
Doha. Asteco Qatar’s portfolio of
residential properties managed
on behalf of clients enjoyed an
impressive 97% average occupancy
rate during 2013, demonstrating
Asteco’s market-leading approach to
leasing and property management.
Its RICS-qualified professionals
provide valuation and consultancy
services to some of Qatar’s largest
and most prestigious buildings.
Future Plans
Asteco will continue to play an
integral role in the success of The
Pearl-Qatar through providing
professional management,
leasing and sales solutions to an
expanding list of clients.
Asteco’s expansion strategy
includes additional property
advisory and consultancy
services to further positively
impact the Qatar property
landscape.
The choice of Qatar to host
the 2022 FIFA World Cup will
continue to create unlimited
growth opportunities in the real
estate market, and Asteco will
capitalize on this potential in
2014.
Ownership: UDC – 30%; CBQ – 30%; QIC – 20%; Asteco Property Management – 20%Incorporated: 2007Sector: Real Estate
ASTECO QATAR

58 59A BUSINESS LEGEND, LEADING WITH GENUINE INNOVATION ANNUAL REPORT 2013
GEKKO LLC is a joint venture set up in
2009 between United Development
Company and Commercial Bank of
Qatar. The company was founded
to operate “smart” solutions for
individuals and merchants in the
fields of secure payments, loyalty
and identification.
GEKKO’s shareholders have recently
decided to wound up the company
in a voluntary move to liquidate its
assets.
Ownership: UDC – 50%; CBQ – 50%Incorporated: 2009Sector: Business Solutions
GEKKO LLC

60 61A BUSINESS LEGEND, LEADING WITH GENUINE INNOVATION ANNUAL REPORT 2013
"THE SECRET OF SUCCESS IS
CONSISTENCY OF PURPOSE."
~ BENJAMIN DISRAELI ~
UNITED DEVELOPMENT COMPANY (Q.S.C.)31 CONSOLIDATED FINANCIAL STATEMENTSFor the year ended 31 December 2013
Consolidated statement of profit or loss
Consolidated statement of comprehensive income
Consolidated statement of financial position
Consolidated statement of changes in equity
Consolidated statement of cash flows
Notes to the consolidated financial statements
Independent auditors’ report to the shareholders
Consolidated financial statements
62
63
63
64
65
66
67
Table of Contents

62 63A BUSINESS LEGEND, LEADING WITH GENUINE INNOVATION ANNUAL REPORT 2013
*The attached notes 1-35 form an integrated part of these consolidated financial statements
Consolidated Statement of Profit and LossFor the year ended 31 December 2013
2013 2012
Note QR’000 QR’000
Revenue 2,081,258 2,730,925
Cost of revenue (1,215,874) (1,652,983)
Gross profit 865,384 1,077,942
Dividend income 26,044 26,222
Other income 6 229,829 95,200
Impairment loss on available-for-sale financial assets (2,910) (33,633)
Sales and marketing expenses (76,394) (54,650)
General and administrative expenses 7 (336,844) (209,960)
Operating profit 705,109 901,121
Finance income 21,955 40,800
Finance costs (84,234) (83,383)
Net finance cost (62,279) (42,583)
Net share of results of associates 12 (233,841) (8,650)
Profit for the year 408,989 849,888
Profit attributable to:
Equity holders of the parent 322,766 730,290
Non-controlling interests 86,223 119,598
Profit for the year 408,989 849,888
Earnings per share
Basic and diluted earnings per share 8 0.96 2.17
Consolidated Statement Of Comprehensive Income For the year ended 31 December 2013
2013 2012
Notes QR’000 QR’000
Profit for the year 408,989 849,888
Other comprehensive income
Other comprehensive loss not to be reclassified to profit or
loss in subsequent periods:
Net change in fair value of property, plant and equipment21 (66,697) -
Other comprehensive income (loss) to be reclassified to profit
or loss in subsequent periods:Net change in fair value of available-for- sale financial assets 21 91,942 (27,315)
Change in cash flow hedge reserve 21 6,048 (7,833)
Total comprehensive income for the year 440,282 814,740
Total comprehensive income attributable to:
Equity holders of the parent 354,059 695,142
Non-controlling interests 86,223 119,598
TOTAL COMPREHENSIVE INCOME FOR THE YEAR 440,282 814,740
INDEPENDENT AUDITORS’ REPORT TO THE SHAREHOLDERS OF UNITED DEVELOPMENT COMPANY Q.S.C.
Report on the consolidated financial statements
We have audited the accompanying consolidated financial statements of United Development Company (Q.S.C.) (the “Company”),
and its subsidiaries (together referred to as the “Group”) which comprise the consolidated statement of financial position as at 31
December 2013 and the consolidated statements of profit or loss, comprehensive income, changes in equity and cash flows for the
year then ended, and notes, comprising a summary of significant accounting policies and other explanatory notes.
Board of Directors’ responsibility for the consolidated financial statements
The Board of Directors is responsible for the preparation and fair presentation of these consolidated financial statements in accordance
with International Financial Reporting Standards and for such internal control as the Board of Directors determines is necessary to
enable the preparation of consolidated financial statements that are free from material misstatement, whether due to fraud or error.
Auditors’ responsibility
Our responsibility is to express an opinion on these consolidated financial statements based on our audit. We conducted our audit
in accordance with International Standards on Auditing. Those standards require that we comply with ethical requirements and plan
and perform the audit to obtain reasonable assurance about whether the consolidated financial statements are free from material
misstatement.
An audit involves performing procedures to obtain audit evidence about the amounts and disclosures in the consolidated financial
statements. The procedures selected depend on the auditors’ judgement, including the assessment of the risks of material
misstatement of the consolidated financial statements, whether due to fraud or error. In making those risk assessments, the auditor
considers internal control relevant to the entity’s preparation and fair presentation of the consolidated financial statements in order
to design audit procedures that are appropriate for the circumstances, but not for the purpose of expressing an opinion on the
effectiveness of the entity’s internal control. An audit also includes evaluating the appropriateness of accounting policies used and
the reasonableness of accounting estimates made by management, as well as evaluating the overall presentation of the consolidated
financial statements.
We believe that the audit evidence we have obtained is sufficient and appropriate to provide a basis for our audit opinion.
Opinion
In our opinion, the consolidated financial statements present fairly, in all material respects, the financial position of the Group as of 31
December 2013 and its financial performance and its cash flows for the year then ended in accordance with International Financial
Reporting Standards.
Report on legal and other regulatory matters
Furthermore, in our opinion proper books of account have been kept by the Group, an inventory count has been conducted in
accordance with established principles and the consolidated financial statements comply with the Qatar Commercial Companies’ Law
No. 5 of 2002 and the Company’s Articles of Association. We have obtained all the information and explanations we required for the
purpose of our audit, and are not aware of any violations of the above mentioned law or the Articles of Association having occurred
during the year which might have a material effect on the business of the Group or on its financial position.
Firas QoussousErnst and YoungAuditor’s Registration No. 236
Date: 25 February 2014 Doha
64 65A BUSINESS LEGEND, LEADING WITH GENUINE INNOVATION ANNUAL REPORT 2013
*The attached notes 1 to 35 form an integral part of these consolidated financial statements.
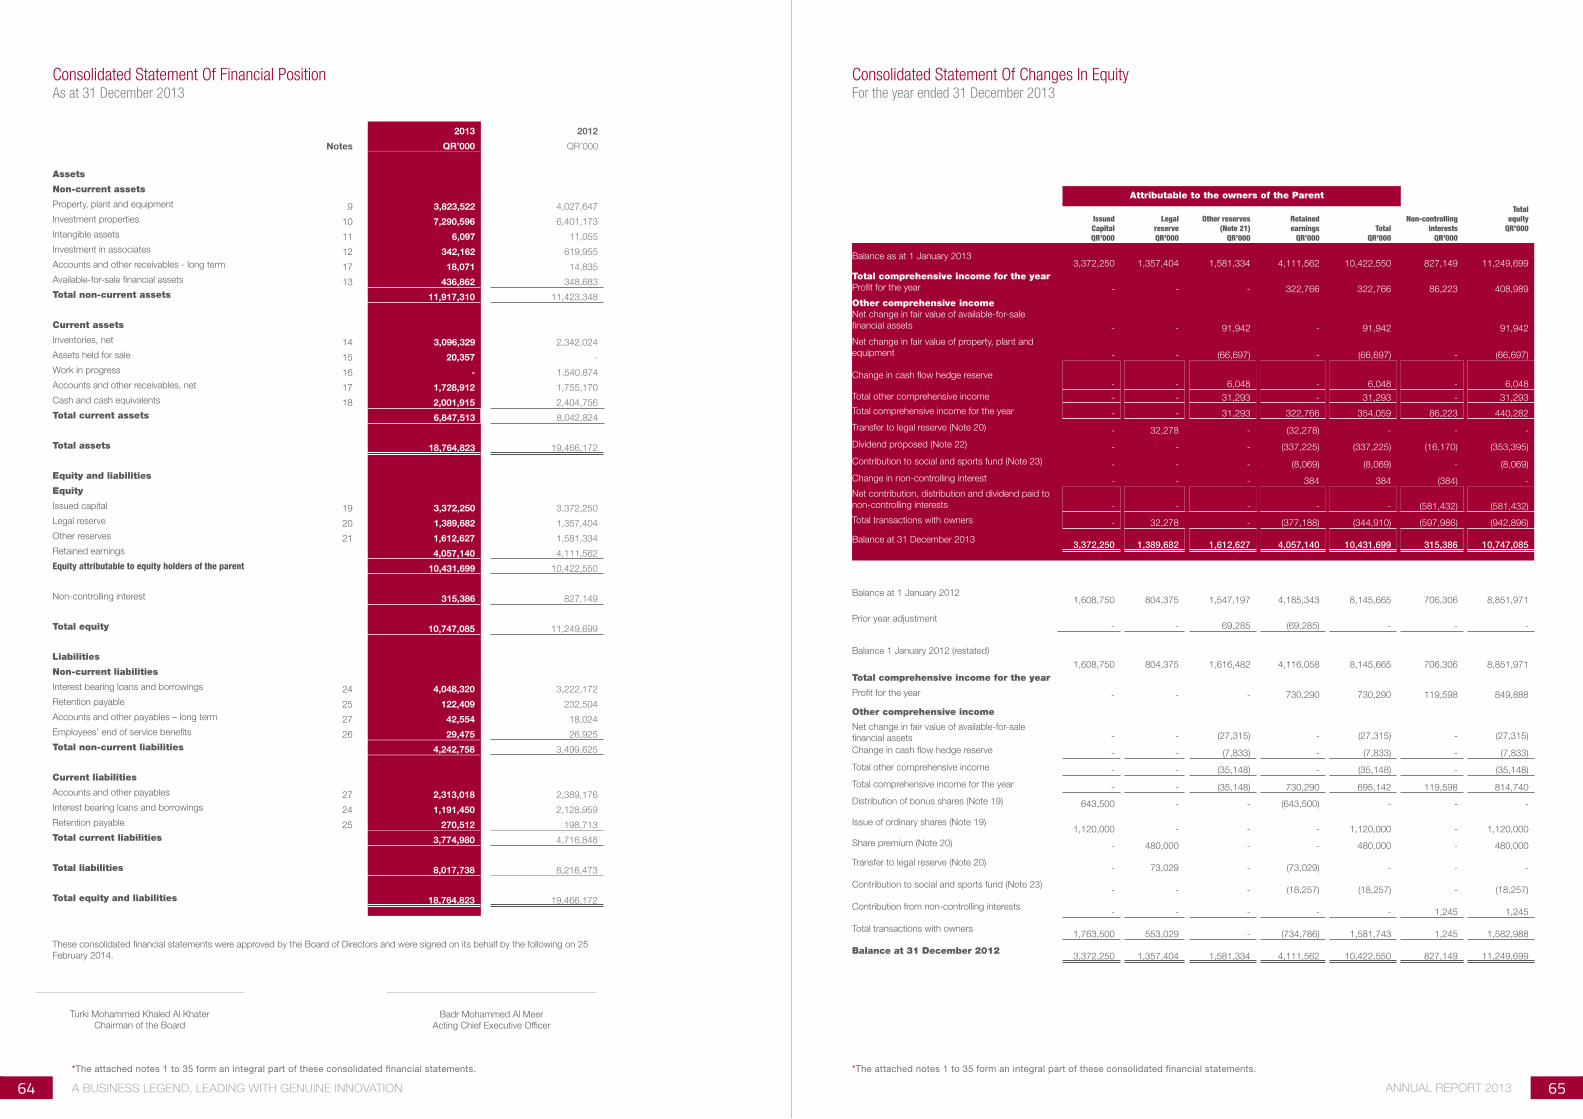
Consolidated Statement Of Changes In EquityFor the year ended 31 December 2013
Attributable to the owners of the Parent
Issued CapitalQR’000
LegalreserveQR’000
Other reserves (Note 21)
QR’000
Retainedearnings
QR’000Total
QR’000
Non-controlling interests
QR’000
Total equity
QR’000
Balance as at 1 January 20133,372,250 1,357,404 1,581,334 4,111,562 10,422,550 827,149 11,249,699
Total comprehensive income for the yearProfit for the year - - - 322,766 322,766 86,223 408,989
Other comprehensive incomeNet change in fair value of available-for-sale
financial assets - - 91,942 - 91,942 91,942
Net change in fair value of property, plant and
equipment - - (66,697) - (66,697) - (66,697)
Change in cash flow hedge reserve- - 6,048 - 6,048 - 6,048
Total other comprehensive income - - 31,293 - 31,293 - 31,293
Total comprehensive income for the year - - 31,293 322,766 354,059 86,223 440,282
Transfer to legal reserve (Note 20) - 32,278 - (32,278) - - -
Dividend proposed (Note 22) - - - (337,225) (337,225) (16,170) (353,395)
Contribution to social and sports fund (Note 23) - - - (8,069) (8,069) - (8,069)
Change in non-controlling interest - - - 384 384 (384) -
Net contribution, distribution and dividend paid to
non-controlling interests - - - - - (581,432) (581,432)
Total transactions with owners - 32,278 - (377,188) (344,910) (597,986) (942,896)
Balance at 31 December 20133,372,250 1,389,682 1,612,627 4,057,140 10,431,699 315,386 10,747,085
Balance at 1 January 20121,608,750 804,375 1,547,197 4,185,343 8,145,665 706,306 8,851,971
Prior year adjustment - - 69,285 (69,285) - - -
Balance 1 January 2012 (restated)
1,608,750 804,375 1,616,482 4,116,058 8,145,665 706,306 8,851,971
Total comprehensive income for the year
Profit for the year - - - 730,290 730,290 119,598 849,888
Other comprehensive income
Net change in fair value of available-for-sale
financial assets - - (27,315) - (27,315) - (27,315)
Change in cash flow hedge reserve - - (7,833) - (7,833) - (7,833)
Total other comprehensive income - - (35,148) - (35,148) - (35,148)
Total comprehensive income for the year - - (35,148) 730,290 695,142 119,598 814,740
Distribution of bonus shares (Note 19) 643,500 - - (643,500) - - -
Issue of ordinary shares (Note 19)1,120,000 - - - 1,120,000 - 1,120,000
Share premium (Note 20) - 480,000 - - 480,000 - 480,000
Transfer to legal reserve (Note 20)- 73,029 - (73,029) - - -
Contribution to social and sports fund (Note 23)- - - (18,257) (18,257) - (18,257)
Contribution from non-controlling interests- - - - - 1,245 1,245
Total transactions with owners1,763,500 553,029 - (734,786) 1,581,743 1,245 1,582,988
Balance at 31 December 20123,372,250 1,357,404 1,581,334 4,111,562 10,422,550 827,149 11,249,699
*The attached notes 1 to 35 form an integral part of these consolidated financial statements.
2013 2012
Notes QR’000 QR’000
Assets
Non-current assets
Property, plant and equipment 9 3,823,522 4,027,647
Investment properties 10 7,290,596 6,401,173
Intangible assets 11 6,097 11,055
Investment in associates 12 342,162 619,955
Accounts and other receivables - long term 17 18,071 14,835
Available-for-sale financial assets 13 436,862 348,683
Total non-current assets 11,917,310 11,423,348
Current assets
Inventories, net 14 3,096,329 2,342,024
Assets held for sale 15 20,357 -
Work in progress 16 - 1,540,874
Accounts and other receivables, net 17 1,728,912 1,755,170
Cash and cash equivalents 18 2,001,915 2,404,756
Total current assets 6,847,513 8,042,824
Total assets 18,764,823 19,466,172
Equity and liabilities
Equity
Issued capital 19 3,372,250 3,372,250
Legal reserve 20 1,389,682 1,357,404
Other reserves 21 1,612,627 1,581,334
Retained earnings 4,057,140 4,111,562
Equity attributable to equity holders of the parent 10,431,699 10,422,550
Non-controlling interest 315,386 827,149
Total equity 10,747,085 11,249,699
Liabilities
Non-current liabilities
Interest bearing loans and borrowings 24 4,048,320 3,222,172
Retention payable 25 122,409 232,504
Accounts and other payables – long term 27 42,554 18,024
Employees’ end of service benefits 26 29,475 26,925
Total non-current liabilities 4,242,758 3,499,625
Current liabilities
Accounts and other payables 27 2,313,018 2,389,176
Interest bearing loans and borrowings 24 1,191,450 2,128,959
Retention payable 25 270,512 198,713
Total current liabilities 3,774,980 4,716,848
Total liabilities 8,017,738 8,216,473
Total equity and liabilities 18,764,823 19,466,172
These consolidated financial statements were approved by the Board of Directors and were signed on its behalf by the following on 25
February 2014.
Turki Mohammed Khaled Al Khater
Chairman of the BoardBadr Mohammed Al Meer
Acting Chief Executive Officer
Consolidated Statement Of Financial PositionAs at 31 December 2013

66 67A BUSINESS LEGEND, LEADING WITH GENUINE INNOVATION ANNUAL REPORT 2013
Notes To The Consolidated Financial Statements At 31 December 2013
1 CORPORATE INFORMATION AND PRINCIPAL ACTIVITIES
United Development Company Q.S.C. (the “Company”) was incorporated as a Qatari Shareholding Company in accordance with
the Emiri Decree number (2) on 2 February 1999. The registered office of the Company is situated in Doha, State of Qatar. The
consolidated financial statements of the Company as at and for the year ended 31 December 2013 comprise the Company and its
subsidiaries (together referred to as the “Group” and individually as “Group entities”) and the Group’s interest in associates. Information
regarding the Group’s structure is provided in Note 4.
The principal activity of the Group is to contribute and invest in infrastructure and utilities, hydrocarbon and energy, urban development,
environment related businesses, marina and related services, fashion, hospitality and leisure, business management, advertising,
providing information technology solutions, E-payment protocol activities, cleaning activities and insurance agency activities.
Pursuant to the Emiri Decree No 17 of 2004, the Company has been provided with a right to develop an island off the shore of
Qatar for the sale and/or lease of properties. The Company is presently engaged in the development of this area known as “Pearl
Qatar project”. The Pearl Qatar project involves reclamation of land covering an area of 985 acres (4.2 million square meters) into a
manmade island and the development of the island into various districts comprising housing beachfront villas, town homes, luxury
apartments, retail shopping complex, penthouse, five star hotels, marinas and schools with related infrastructure and community
facilities. The reclamation and the development of the land is being performed on a mix use development basis which was substantially
completed in 2011.
The consolidated financial statements for the year ended 31 December 2013 were authorised for issue in accordance with a resolution
of the Board of Directors on 25 February 2014.
2 BASIS OF PREPARATION
The consolidated financial statements of the Group have been prepared in accordance with International Financial Reporting Standards
(IFRS) as issued by the International Accounting Standard Board (IASB) and applicable requirements of Qatar Commercial Companies’
Law No 5 of 2002.
The consolidated financial statements have been prepared on a historical cost basis, except for land, investment properties, assets
held for sale and available-for-sale financial assets that are presented at fair value in accordance with IFRS.
These consolidated financial statements are presented in Qatari Riyals, which is the Group’s functional currency. All financial information
is presented in Qatari Riyals and all values are rounded to the nearest thousands unless and otherwise indicated.
Judgments
In the process of applying the Group’s accounting policies, management has made the following judgments, apart from those involving
estimations, which have the most significant effect on the amounts recognised in the consolidated financial statements:
Impairment of available-for-sale financial assetsThe Group treats available-for-sale financial assets as impaired when there has been a significant or prolonged decline in fair value
below its cost or where other objective evidence of impairment exists. The determination of what is “significant” or “prolonged”
requires considerable judgment.
Classification of propertyThe Group determines whether a property is classified as investment property or inventory:
Investment property comprises of land and buildings which are not occupied, substantially for the use by or in the operation of the
Group, nor for sale in the ordinary course of business, but held primarily to earn rental income and capital appreciation;
Inventory comprises of land and residential properties that are held for sale in the ordinary course of business. Principally these
residential properties represent those that the Group develops and intends to sell before or on completion of construction.
Estimates and assumptions
The key assumptions concerning the future and other key sources of estimation uncertainty at the reporting date, that have a significant
risk of causing a material adjustment to the carrying amounts of assets and liabilities within the next financial year are discussed below:
Impairment of goodwillThe Group determines whether goodwill is impaired at least on an annual basis. This requires an estimation of the ‘value in use’ of the
cash-generating units to which the goodwill is allocated. Estimating a value in use amount requires management to make an estimate
of the expected future cash flows from the cash-generating unit and also to choose a suitable discount rate in order to calculate the
present value of those cash flows.
2013 2012
Notes QR’000 QR’000
Operating activities
Profit for the year 408,989 849,888
Adjustments for:
Net share of results of associates 233,841 8,650
Depreciation and amortisation 99,029 78,914
Impairment of property, plant and equipment 7 & 9 45,100 -
Impairment of assets held for sale 7 &15 29,754 -
Impairment of intangible assets 11 3,479 -
Gain on sale of available-for-sale financial assets 6 (176) -
(Reversal)/provision for slow moving inventory (2,598) 1,240
Impairment of accounts receivable 17.1 22,982 5,367
Impairment loss on available-for-sale financial assets 2,910 28,386
Loss on disposal of assets 3,171 299
Net finance cost 62,279 42,583
Dividend income (26,044) (26,222)
Provision for employees’ end of service benefits 26 8,016 10,397
890,732 999,502
Working capital adjustments
Long term receivables (3,236) (12,429)
Inventories (801,996) 423,147
Work in progress 1,540,874 775,958
Accounts and other receivables 436 (283,867)
Accounts and other payables (380,827) (1,000,209)
Retention payable (38,296) (190,684)
Cash from operating activities 1,207,687 711,418
Employees’ end of service benefits paid 26 (5,154) (6,074)
Finance cost paid (82,125) (90,105)
Net cash from operating activities 1,120,408 615,239
Investing activities
Additions to property, plant and equipment 9 (494,418) (118,306)
Proceeds from sale of property, plant and equipment 1,826 710
Proceeds from sale of available-for-sale financial assets 1,023 -
Time deposits with maturities more than three months 27,877 (78,913)
Acquisition of intangible assets 11 (427) (2,484)
Additions to investment properties 10 (91,754) (25,021)
Interest received 24,795 35,049
Dividend received from associates 50,000 40,000
Dividend received from other investee companies 33 26,044 26,222
Net cash used in investing activities (455,034) (122,743)
Financing activities
Proceeds from issue of ordinary shares - 1,600,000
Proceeds from interest bearing loans and borrowings 2,405,697 4,566
Repayment of interest bearing loans and borrowings (2,519,425) (792,878)
Dividend paid (345,178) -Net contribution, distribution and dividend paid to non-controlling
interests (581,432) 1,245
Net cash (used in)/ from financing activities (1,040,338) 812,933
Net (decrease) / increase cash and cash equivalents (374,964) 1,305,429
Cash and cash equivalents at 1 January 2,265,843 960,414
Cash and cash equivalents at 31 December 18 1,890,879 2,265,843
Consolidated Statement Of Cash FlowsFor the year ended 31 December 2013
*The attached notes 1 to 35 form an integral part of these consolidated financial statements.

68 69A BUSINESS LEGEND, LEADING WITH GENUINE INNOVATION ANNUAL REPORT 2013
Standards issued but not yet effective
The standards and interpretations that are issued, but not yet effective, up to the date of issuance of the Group’s financial statements
are disclosed below. The Group intends to adopt these standards, if applicable, when they become effective.
The Group is currently considering the implications of the new IFRSs and has not early adopted any of the new standards as listed
below:
IFRS 9 Financial InstrumentsIFRS 9, as issued, reflects the first phase of the IASB’s work on the replacement of IAS 39 and applies to classification and measurement
of financial assets and financial liabilities as defined in IAS 39. The standard was initially effective for annual periods beginning on or
after 1 January 2013, but Amendments to IFRS 9 Mandatory Effective Date of IFRS 9 and Transition Disclosures, issued in December
2012, moved the mandatory effective date to 1 January 2015. In subsequent phases, the IASB is addressing hedge accounting and
impairment of financial assets. The adoption of the first phase of IFRS 9 will have an effect on the classification and measurement of
the Group’s financial assets, but will not have an impact on classification and measurements of the Group’s financial liabilities. The
Group will quantify the effect in conjunction with the other phases, when the final standard including all phases is issued.
Investment Entities (Amendments to IFRS 10, IFRS 12 and IAS 27)These amendments are effective for annual periods beginning on or after 1 January 2014 and provide an exception to the consolidation
requirement for entities that meet the definition of an investment entity under IFRS 10. The exception to consolidation requires
investment entities to account for subsidiaries at fair value through profit or loss. This amendment is not expected to have any impact
on the Group’s financial statements.
IAS 32 Offsetting Financial Assets and Financial Liabilities - Amendments to IAS 32These amendments clarify the meaning of “currently has a legally enforceable right to set-off” and the criteria for non-simultaneous
settlement mechanisms of clearing houses to qualify for offsetting. These are effective for annual periods beginning on or after 1
January 2014. These amendments are not expected to be relevant to the Group.
Recoverable Amount Disclosures for Non-Financial Assets – Amendments to IAS 36 Impairment of AssetsThese amendments remove the unintended consequences of IFRS 13 on the disclosures required under IAS 36. In addition, these
amendments require disclosure of the recoverable amounts for the assets or CGUs for which impairment loss has been recognized or
reversed during the period. These amendments are effective retrospectively for annual periods beginning on or after 1 January 2014
with earlier application permitted, provided IFRS 13 is also applied. The Group does not expect that IFRIC 21 will have a material
financial impact on future financial statements.
IFRIC Interpretation 21 Levies (IFRIC 21)IFRIC 21 clarifies that an entity recognizes a liability for a levy when the activity that triggers payment, as identified by the relevant
legislation, occurs. For a levy that is triggered upon reaching a minimum threshold, the interpretation clarifies that no liability should be
anticipated before the specified minimum threshold is reached. IFRIC 21 is effective for annual periods beginning on or after 1 January
2014. The Group does not expect that IFRIC 21 will have a material financial impact in future financial statement.
IAS 39 Novation of Derivatives and Continuation of Hedge Accounting – Amendments to IAS 39These amendments provide relief from discontinuing hedge accounting when novation of a derivative designated as a hedging
instrument meets certain criteria. These amendments are effective for annual periods beginning on or after 1 January 2014. These
amendments are not expected to be relevant to the Group.
Annual Improvements May 2012
These improvements will not have an impact on the Group, but include:
IAS 1 Presentation of Financial StatementsThis improvement clarifies the difference between voluntary additional comparative information and the minimum required comparative
information. Generally, the minimum required comparative information is the previous period.
IAS 16 Property Plant and EquipmentThis improvement clarifies that major spare parts and servicing equipment that meet the definition of property, plant and equipment
are not inventory.
IAS 32 Financial Instruments, PresentationThis improvement clarifies that income taxes arising from distributions to equity holders are accounted for in accordance with IAS 12
Income Taxes.
IAS 34 Interim Financial ReportingThe amendment aligns the disclosure requirements for total segment assets with total segment liabilities in interim financial statements.
This clarification also ensures that interim disclosures are aligned with annual disclosures.
Sale of properties (land)An estimate of the ability of the buyers to meet financial commitments in respect of properties is made in determining the amount
of revenue recognised from the sale of properties using the percentage of completion method. The percentage of completion is
determined by comparing the actual costs incurred and the estimated cost to complete at the end of the reporting period.
Fair value of property (land classified as property plant and equipment and investment property)The fair value of land and investment property is determined by independent real estate valuation experts using recognised valuation
techniques. These techniques comprise both the Yield Method and the Discounted Cash Flow Method. In some cases, the fair values
are determined based on recent real estate transactions with similar characteristics and location to those of the Group assets.
3 CHANGES IN ACCOUNTING POLICIES AND DISCLOSURES
New and amended standards and interpretations
The accounting policies adopted are consistent with those of the previous financial year, except for the following amendments to IFRS
effective as of 1 January 2013:
IFRS 10 Consolidated Financial Statements and IAS 27 Separate Financial StatementsIFRS 10 replaces the portion of IAS 27 Consolidated and Separate Financial Statements that addresses the accounting for consolidated
financial statements. It also addresses the issues raised in SIC-12 Consolidation — Special Purpose Entities. IFRS 10 establishes
a single control model that applies to all entities including special purpose entities. The changes introduced by IFRS 10 will require
management to exercise significant judgement to determine which entities are controlled and therefore are required to be consolidated
by a parent, compared with the requirements that were in IAS 27. This standard becomes effective for annual periods beginning on or
after 1 January 2013 and has had no effect on the Group’s financial position, performance or its disclosures.
IFRS 11 Joint Arrangements IFRS 11 replaces IAS 31 Interests in Joint Ventures and SIC-13 Jointly-controlled Entities — Non-monetary Contributions by Venturers.
IFRS 11 removes the option to account for jointly controlled entities (JCEs) using proportionate consolidation. Instead, JCEs that meet
the definition of a joint venture must be accounted for using the equity method. This standard becomes effective for annual periods
beginning on or after 1 January 2013, and is to be applied retrospectively for joint arrangements held at the date of initial application.
The standard has no material impact on the Group’s financial position, performance or its disclosures.
IAS 28 Investments in Associates and Joint Ventures (as revised in 2012)As a consequence of the new IFRS 11 Joint Arrangements, and IFRS 12 Disclosure of Interests in Other Entities, IAS 28 Investments
in Associates, has been renamed IAS 28 Investments in Associates and Joint Ventures, and describes the application of the equity
method to investments in joint ventures in addition to associates. The revised standard becomes effective for annual periods beginning
on or after 1 January 2013 and has no material impact on the Group’s financial position, performance or its disclosures.
IFRS 12 Disclosure of Interests in Other EntitiesIFRS 12 sets out the requirements for disclosures relating to an entity’s interests in subsidiaries, joint arrangements, associates and
structured entities. The requirements in IFRS 12 are more comprehensive than the previously existing disclosure requirements for
subsidiaries. For example, where a subsidiary is controlled with less than a majority of voting rights. The standard has no material
impact on the Group’s financial position, performance or its disclosures.
IFRS 13 Fair Value MeasurementIFRS 13 establishes a single source of guidance under IFRS for all fair value measurements. IFRS 13 does not change when an entity
is required to use fair value, but rather provides guidance on how to measure fair value under IFRS. IFRS 13 defines fair value as an exit
price. As a result of the guidance in IFRS 13, the Company re-assessed its policies for measuring fair values, in particular, its valuation
inputs such as non-performance risk for fair value measurement of liabilities. IFRS 13 also requires additional disclosures.
The application of IFRS 13 has not materially impacted the fair value measurements of the Group.
IAS 19 Employee Benefits (Revised)The IASB has issued numerous amendments to IAS 19. These range from fundamental changes such as removing the corridor
mechanism and the concept of expected returns on plan assets to simple clarifications and re-wording. The amendment becomes
effective for annual periods beginning on or after 1 January 2013. The standard had no impact on the Group’s financial position,
performance or its disclosures.
IAS 1 Presentation of Items of Other Comprehensive Income – Amendments to IAS 1The amendments to IAS 1 change the grouping of items presented in other comprehensive income (OCI). Items that could be
reclassified (or ‘recycled’) to profit or loss at a future point in time would be presented separately from items that will never be
reclassified (for example, net loss or gain on available-for-sale financial assets). The amendment affects presentation only and is
effective for annual periods beginning on or after 1 July 2012.
The amendments clarify that the opening statement of financial position, presented as a result of retrospective restatement or
reclassification of items in financial statements does not have to be accompanied by comparative information in the related notes. The
amendments affect presentation only and have no impact on the Group’s financial position or performance.

70 71A BUSINESS LEGEND, LEADING WITH GENUINE INNOVATION ANNUAL REPORT 2013
United Facilities Management Company O.M.C is engaged in facility management activity.
Scoop Media and Communication Company O.M.C operates in the advertising sector.
PragmaTech Company O.M.C. is engaged in providing information technology solutions. During the year 2012, a decision was taken
to close this company’s branch in Lebanon.
Gekko L.L.C is engaged in E-payment protocol activities and during the year, a decision was taken to liquidate the company. The
liquidation process is currently being carried out.
Glitter O.M.C. is engaged in cleaning services and related activities.
The Enterprise Development Company operates in the real estate sector and during the year, a decision was taken to liquidate the
company. The liquidation process is currently being carried out.
Insure plus O.M.C acts as an insurance agent and provides technical services and risk related services of an insurance nature to the
Group.
Madina Innova O.M.C is engaged in providing registry and master community services at the Pearl Qatar.
The Pearl Owners Corporation O.M.C is engaged in property management support services.
United Development Investment Company is engaged in development related activities.
United Facility Solution Management O.M.C is engaged in providing information technology solutions.
Porto Arabia Retail Company 1 is engaged in real estate rental activities.
Leisure and Resorts O.M.C engages in resort operations and development activities.
All intra-group balances, transactions, income and expenses and profits and losses resulting from intra-group transactions that are
recognised in assets, are eliminated in full on consolidation.
Subsidiaries are entities controlled by the Group. The financial statements of subsidiaries are included in the consolidated financial
statements from the date that control commences until the date that control ceases. The Group consolidates all the entities where it
has the power to govern the financial and operating policies.
Non-controlling interests represent the portion of profit or loss and net assets not held by the Group and are presented separately in
the consolidated statement of income and within equity in the consolidated statement of financial position, separately from the parent
shareholders’ equity.
A change in the ownership interest of a subsidiary, without a loss of control, is accounted for as an equity transaction.
On the loss of control, the Group derecognises the assets and liabilities of the subsidiary including any non-controlling interest and the
other components of equity related to the subsidiary. Any surplus or deficit recognised on the loss of control is recognised in profit or
loss and the Group recognises the fair value of any consideration received. If the Group retains any interest in the previous subsidiary,
then such interest is measured at fair value at the date that the control is lost. Subsequently it is accounted for as an equity accounted
investee or as an available-for-sale financial asset depending of the level of the influence retained.
Business combinations and goodwill
Business combinations are accounted for using the acquisition method. The cost of an acquisition is measured as the aggregate of
the consideration transferred measured at acquisition date fair value and the amount of any non-controlling interest in the acquiree.
For each business combination, the Group elects whether to measure the non-controlling interest in the acquiree at fair value or at
the proportionate share of the acquiree’s identifiable net assets. Acquisition-related costs are expensed as incurred and included in
administrative expenses. It is then considered in determination of goodwill.
When the Group acquires a business, it assesses the financial assets and liabilities assumed for appropriate classification and
designation in accordance with the contractual terms, economic circumstances and pertinent conditions as at the acquisition date.
This includes the separation of embedded derivatives in host contracts by the acquirer. If the business combination is achieved in
stages, the previously held equity interest is remeasured at its acquisition date fair value and any resulting gain or loss is recognised
in profit or loss.
Goodwill is initially measured at cost, being the excess of the aggregate of the consideration transferred and the amount recognised
for non-controlling interest over the net identifiable assets acquired and liabilities assumed. If the fair value of the net assets acquired is
in excess of the aggregate consideration transferred, the Group re-assesses whether it has correctly identified all of its assets acquired
and all of the liabilities assumed and reviews the procedures used to measure amounts to be recognised at the acquisition date. If
4 SIGNIFICANT ACCOUNTING POLICIES
The accounting policies set out below have been applied consistently to all periods presented in these consolidated financial
statements, and have been applied consistently by Group entities.
Basis of consolidation
The consolidated financial statements comprise the financial statements of United Development Company Q.S.C. and all its
subsidiaries as at 31 December each year. The financial statements of the subsidiaries are prepared for the same reporting year
as the parent company, using consistent accounting policies.
The consolidated financial statements include the financial statements of United Development Company Q.S.C. and its
subsidiaries listed in the following table:
Country of
incorporation
% equity interest
2013 2012
Qatar District Cooling Company Q.C.S.C Qatar 51 51
Ronautica Middle East O.M.C. Qatar 100 100
The Pearl Qatar Company O.M.C. Qatar 100 100
Hospitality Development Company O.M.C. Qatar 100 100
United Fashion Company O.M.C. Qatar 100 100
Madina Centrale Company O.M.C. Qatar 100 100
Abraj Quartier Company O.M.C. Qatar 100 100
The Pearl Qatar Real Estate Development Fund Cayman Island 53 53
United Facilities Management Company O.M.C Qatar 100 100
Scoop Media and Communication Company O.M.C. Qatar 100 100
Pragmatech Company O.M.C. Qatar 100 100
Gekko L.L.C Qatar 50 50
Glitter O.M.C Qatar 100 100
Enterprise Development Company Republic of Turkey 100 100
Insure Plus O.M.C. Qatar 100 100
Madina Innova O.M.C Qatar 100 100
The Pearl Owners Corporation O.M.C Qatar 100 100
United Development Investment Company Cayman Island 100 100
United Facility Solution Management Company O.M.C Qatar 100 100
Porto Arabia Retail Company 1 Cayman Island 100 100
Leisure and Resorts O.M.C Qatar 100 100
Qatar District Cooling Company Q.C.S.C is engaged in the construction, owning and operation of district cooling systems and it
consolidates Installation Integrity 2006 W.L.L. (51%) and Cool Tech Qatar W.L.L. (51%) in its consolidated financial statements.
Ronautica Middle East O.M.C. is involved in the development, operation and sale of marina and marine related equipment. During
2008, the capital of Ronautica Middle East O.M.C. was increased from QR 30 million to QR 100 million. The increase in capital
was fully paid by the Group, which increased its equity interest from 60% to 88%. During 2009, the Group has purchased the
non-controlling interest of Ronautica Middle East O.M.C., which increased its equity interest from 88% to 100%.
The Pearl Qatar Company O.M.C activity in the real estate sector.
Hospitality Development Company O.M.C. (HDC) is engaged in the investment and management of restaurants, hotels and
resorts development and sales / purchase of fast moving consumer goods in the hospitality sector. HDC consolidates Lebanese
Restaurants Development L.L.C (84%), China Square L.L.C (80.01%), Flavour of Mexico L.L.C (90%), Modern Lebanese
Restaurant L.L.C (90%), The Rising Sun L.L.C (95.68%) and Urban Restaurant Development L.L.C (90%) in its consolidated
financial statements. During the year 2011, the capital of the company was increased from QR 18.25 million to QR 50 million.
United Fashion Company O.M.C. (UFC) is engaged in fashion retailing. The mandate of the Company is to acquire top international
names for brand franchising in the Middle East. UFC consolidates Hiref (51%) and Rony Nacouzi (60%) in its consolidated
financial statements. During the year 2011, the capital of the company was increased from QR 18.25 million to QR 80 million.
Madina Centrale Company O.M.C. is engaged in the investment of real estate properties.
Abraj Quartier Company O.M.C is engaged in the development of real estate properties.
The Pearl Qatar Real Estate Development Fund was engaged in the sale of real estate properties in the Pearl Qatar. The Fund’s
original tenure was three years (with the option to extend for another two periods of 12 months each). The Fund’s tenure was
extended in 2011 and 2012 for one year each respectively and expired on 19 February 2013. The assets of the Fund were sold
with proceeds being distributed to the partners on 5 August 2013 based on their respective contribution towards the Fund after
settling the Fund liabilities at current values.
72 73A BUSINESS LEGEND, LEADING WITH GENUINE INNOVATION ANNUAL REPORT 2013
Where a contract is judged to be for the construction of a property, revenue is recognised using the percentage of completion method
as construction progresses.
Where the contract is judged to be for the sale of a completed property, revenue is recognised when the significant risks and
rewards of ownership of the real estate have been transferred to the buyer. If, however, the legal terms of the contract are such that
the construction represents the continuous transfer of work in progress to the purchaser, the percentage-of-completion method of
revenue recognition is applied and revenue is recognised as work progresses.
Revenue from the sale of goods and chilled water Revenue from the sale of goods is recognised when the significant risks and rewards of ownership of the goods and services have
passed to the buyer and the amount of revenue can be measured reliably.
For the sale of chilled water, revenue comprises of available capacity and variable output provided to customers and is recognized
when services are provided.
Service charges and expenses recoverable from tenantsIncome arising from expenses recharged to tenants is recognized in the period in which the compensation becomes receivable.
Revenue from services Revenue from rendering services is recognized by reference to the stage of completion of the transaction at the reporting date when
the outcome of the transaction can be reliably estimated.
Profit on sale of available-for-sale financial assetsOn sale of available-for-sale financial assets, a gain is recognised as the difference between the carrying amount and the sum of:
a. consideration received and
b. any cumulative gain previously recognised directly in equity.
Interest incomeInterest income is recognised using the effective interest rate method, under which the rate used exactly discounts estimated future
cash receipts through the expected life of the financial asset to the net carrying amount of the financial asset. Interest income is
included in finance income in the statement of profit or loss.
Dividend incomeDividend income is recognised when the right to receive the dividend is established which is generally when shareholders approve
the dividends.
Fee incomeFee income is recognised on a time proportion basis when realized.
Rental income Rental income from investment properties and the leasing of berths is recognised in profit or loss on a straight-line basis over the term
of the lease. Lease incentives granted are recognised as an integral part of the total rental income over the term of the lease.
Revenue from sale of goods (retail fashion and restaurant sales)Revenue from the sale of goods is measured at the fair value of the consideration received or receivable, net of returns and trade
discounts. Revenue is recognised when persuasive evidence exists, that the significant risks and rewards of ownership have been
transferred to the buyer; recovery of the consideration is probable, the associated costs and possible return of goods can be estimated
reliably, there is no continuing management involvement with the goods and the amount of revenue can be measured reliably. If it is
probable that discounts will be granted and the amount can be measured reliably, then the discount is recognised as a reduction of
revenue as the sales are recognised.
Property, plant and equipment
Recognition and measurementItems of property, plant and equipment are measured at cost less accumulated depreciation and accumulated impairment losses.
Land is measured at fair value.
Cost includes expenditure that is directly attributable to the acquisition of the asset. The cost of self-constructed assets include the
cost of materials and direct labour, any other costs directly attributable to bringing the assets to working condition for their intended
use, the costs of dismantling and removing the items and restoring the site on which they are located, and capitalised borrowing costs.
Purchased software that is integral to the functionality of the related equipment is capitalised as part of that equipment.
When parts of an item of property, plant and equipment have different useful lives, they are accounted for as separate items (major
components) of property, plant and equipment.
Any revaluation surplus is recognized in other comprehensive income and presented in the revaluation reserve in equity, except to
the extent that it reverses a revaluation decrease of the same asset previously recognized in profit or loss, in which case the increase
is recognized in the statement of profit or loss. A revaluation deficit is recognized in the statement of profit or loss, except where the
deficit directly offsets a previous surplus on the same asset which is directly offset against the surplus in the asset revaluation reserve.
the reassessment still results in an excess of the fair value of net assets acquired over the aggregate consideration transferred, the
gain is recognised in profit or loss. After initial recognition, goodwill is measured at cost less any accumulated impairment losses. For
the purpose of impairment testing, goodwill acquired in a business combination is, from the acquisition date, allocated to each of the
Group’s cash-generating units that are expected to benefit from the combination, irrespective of whether other assets or liabilities of
the acquiree are assigned to those units. Where goodwill has been allocated to a cash-generating unit and part of the operation within
that unit is disposed of, the goodwill associated with the disposed operation is included in the carrying amount of the operation when
determining the gain or loss on disposal. Goodwill disposed in these circumstances is measured based on the relative values of the
disposed operation and the portion of the cash-generating unit retained.
Any contingent consideration to be transferred by the acquirer will be recognized at fair value at the acquisition date. Contingent
consideration classified as an asset or liability that is a financial instrument and within the scope of IAS 39 - Financial Instrument:
Recognition and Measurement, is measured at fair value with changes in fair value recognised either in profit or loss or as a change
to other comprehensive income. If the contingent consideration that is classified as equity is not remeasured, subsequent settlement
is accounted for within equity.
Investment in associates
Associates are those entities in which the Group has the significant influence, but not control, over the financial and operating policies.
Significant influence is presumed to exist when the Group holds between 20% and 50% of the voting power of another entity. The
Group’s investments in its associates are accounted for under the equity method of accounting.
Under the equity method, the investment in associate is initially recognised at cost. The carrying amount of the investment is adjusted
to recognise the change in the Group’s share of net assets of the associate since the acquisition date. Goodwill relating to the
associate is included in the carrying amount of the investment and is neither amortised nor individually tested for impairment.
The consolidated statement of profit or loss reflects the Group’s share of the results of its associates after adjustments to align the
accounting policies with those of the Group, from the date that significant influence commences until the date that significant influence
ceases. The reporting dates of the associate and the Group are identical and the associate’s accounting policies conform to those
used by the Group for like transactions and events in similar circumstances.
Unrealised gains and losses resulting from transactions between the Group and the associate are eliminated to the extent of the
interest in the associate.
When the Group’s share of losses exceeds its interest in an associate, the carrying amount of that interest, including any long-term
investments, is reduced to zero, and the recognition of further losses is discontinued except to the extent that the Group has an
obligation or has made payments on behalf of the investee.
Upon loss of the significant influence over the associate, the Group measures and recognizes any retained investments at its fair
value. Any differences between the carrying amount of the associate upon loss of significant influence and the fair value of retained
investments and proceeds from disposal is recognized in the statement of profit or loss.
Transactions eliminated on consolidation
Intra-group balances and transactions, and any unrealised income and expenses arising from intra-group transactions are eliminated
in preparing these consolidated financial statements. Unrealised gains arising from the transactions with equity-accounted investees
are eliminated against the investment to the extent of the Group’s interest in the investee. Unrealised losses are eliminated in the same
way as unrealised gains, but only to the extent that there is no evidence of impairment.
Revenue recognition
Revenue from the sale of completed properties (land, townhouses, apartments and villas)The Group applies IAS 18 revenue recognition principles to recognise the revenue from the sale of properties and accordingly the
following conditions should be satisfied to recognise a sale:
a. the entity has transferred to the buyer the significant risks and rewards of ownership of the properties
b. the entity retains neither continuing managerial involvement to the degree usually associated with ownership nor effective control
over the properties sold;
c. the amount of revenue can be measured reliably;
d. it is probable that the economic benefits associated with the transaction will flow to the entity; and
e. the costs incurred or to be incurred in respect of the transaction can be measured reliably.
Sales of property under developmentWhere property is under development and an agreement has been reached to sell such property when construction is complete, the
Group considers whether the contract comprises:
A contract to construct a property, or
A contract for the sale of a completed property

74 75A BUSINESS LEGEND, LEADING WITH GENUINE INNOVATION ANNUAL REPORT 2013
Investment properties
Investment property comprises completed property and property under construction or re-development held either to earn rental
income or for capital appreciation or for both, but not for sale in the ordinary course of business, use in the production or supply of
goods or services or for administrative purposes. Investment property is measured at cost on initial recognition and subsequent to
the initial recognition, investment property is stated at fair value with gains or losses arising from changes in fair value included in the
statement of profit or loss in the year which they arises.
Cost includes expenditure that is directly attributable to the acquisition of investment property. The cost of self-constructed investment
property includes the cost of materials and direct labour and any other costs directly attributable to bringing the investment property
to a working condition for their intended use. Any gain or loss on disposal of an investment property (calculated as the difference
between the net proceeds from disposal and the carrying amount of the item) is recognised in the statement of profit or loss. When
an investment property that was previously classified as property, plant and equipment is sold, any related amount included in the
revaluation reserve is transferred to retained earnings.
When the use of a property changes such that it is reclassified as property, plant and equipment, its fair value at the date of
reclassification becomes its cost for subsequent accounting.
Transfers are made to investment property when and only when, there is a change in use, evidenced by the end of the owner
occupation or commencement of an operating lease. Transfers are made from investment or commencement of an operating lease.
Transfers are made from investment property when and only when, there is a change in use, evidenced by commencement of owner
occupation or commencement of development with a view to sale.
Borrowing costs
The Group capitalises borrowing costs directly attributable to the acquisition, construction or production of a qualifying asset as part
of the cost of that asset. For the purpose of determining interest available for capitalization, the costs related to these borrowings are
reduced by any investment income on the temporary investment of the borrowings.
The capitalization of borrowing costs will cease once the asset is ready for its intended use. All other interest is recognised in the
statement of profit or loss.
Impairment
Financial assets A financial asset is assessed at each reporting date to determine whether there is any objective evidence that it is impaired. A financial
asset is considered to be impaired if objective evidence indicates that one or more events that has occurred after the initial recognition
of the asset, has a negative effect on the estimated future cash flows of that asset and can be estimated reliably.
The Group considers evidence of impairment for receivables at both a specific asset and collective level. All individually significant
receivables are assessed for specific impairment. All individually significant receivables found not to be specifically impaired are then
collectively assessed for any impairment that has been incurred but not yet identified. In assessing collective impairment, the Group
uses historical trends of the probability of default, timing of recoveries and the amount of loss incurred, adjusted for the management’s
judgment as to whether current economic and credit conditions are such that the actual losses are likely to be greater or less than
suggested by historical trends.
An impairment loss in respect of a financial asset measured at amortised cost is calculated as the difference between its carrying
amount, and the present value of the estimated future cash flows (excluding future expected credit losses that have not yet been
incurred) discounted at the original effective interest rate. All impairment losses are recognized in the statement of profit or loss.
An impairment loss is reversed if the reversal can be related objectively to an event occurring after the impairment loss was recognized.
For financial assets measured at amortized cost, the reversal is recognized in profit or loss.
Non-financial assetsThe carrying amounts of the Group’s non-financial assets other than investment property and inventories are reviewed at the end of
each reporting period to determine whether there is any indication of impairment. If any such indication exists then asset’s recoverable
amount is estimated.
An impairment loss is recognised if the carrying amount of an asset or its cash-generating unit exceeds its estimated recoverable
amount. Impairment losses are recognised in the statement of profit or loss. Impairment losses recognised in respect of cash-
generating units are allocated first to reduce the carrying amount of any goodwill allocated to the units and then to reduce the carrying
amount of the other assets in the unit (group of units) on a pro rata basis. An impairment loss in respect of goodwill is not reversed. In
respect of other assets, impairment losses recognised in prior periods are assessed at each reporting date for any indications that the
loss has decreased or no longer exists. An impairment loss is reversed if there has been a change in the estimates used to determine
the recoverable amount. An impairment loss is reversed only to the extent that the asset’s carrying amount does not exceed the
carrying amount that would have been determined, net of depreciation or amortisation, if no impairment loss had been recognised.
An item of property, plant and equipment is derecognised upon disposal or when no future economic benefits are expected from its
use or disposal. Gains and losses on disposal of an item of property, plant and equipment are determined by comparing the proceeds
from disposal with the carrying amount of property, plant and equipment, and are recognised net within other income in the statement
of profit or loss. When revalued assets are sold, the amounts included in the revaluation reserve are transferred to retained earnings.
Valuations are performed frequently enough to ensure that the fair value of the revalued assets do not differ materially from its carrying
value.
Reclassification to investment propertiesWhen the use of a property changes from owner-occupied to investment property, the property is re-measured to fair value and
reclassified as investment property. Property that is being constructed for future use as investment property is accounted for at fair
value. Any gain arising on re-measurement is recognised in profit or loss to the extent the gain reverses a previous impairment loss on
the specific property, with any remaining gain recognised in other comprehensive income and presented in the revaluation reserve in
equity. Any loss is recognised in other comprehensive income and presented in the revaluation reserve in equity to the extent that an
amount had previously been included in the revaluation reserve relating to the specific property, with any remaining loss recognised
immediately in profit or loss.
Subsequent costsThe cost of replacing a part of an item of property, plant and equipment is recognised in the carrying amount of the item if it is probable
that the future economic benefits embodied within the part will flow to the Group, and its cost can be measured reliably. The carrying
amount of the replaced part is derecognised. When significant parts of property, plant and equipment are required to be replaced at
intervals, the Group recognises such parts as individual assets with specific useful lives and depreciates them accordingly. Likewise,
when a major inspection is performed, its cost is recognised in the carrying amount of the plant and equipment as a replacement if
recognition criteria are met. All other repair and maintenance costs are recognised in profit or loss as incurred.
DepreciationDepreciation is calculated over the depreciable amount, which is the cost of an asset, or other amount substituted for cost, less its
residual value.
Depreciation is recognised in profit or loss on a straight-line basis over the estimated useful lives of each part of an item of property,
plant and equipment, since this most closely reflects the expected pattern of consumption of the future economic benefits embodied
in the asset. Land is not depreciated.
The estimated useful lives for the current and comparative periods are as follows:
Buildings, plant and facilities 20 –25 years
Building improvements 3 – 7 years
Furniture, fixtures, equipment and instruments 3 – 7 years
Motor vehicles and boats 5 years
Depreciation methods, useful lives and residual values are reviewed at each financial year-end and adjusted if appropriate.
Intangible assets
The Group recognises intangible assets arising from corporate branding, a brand strategy development arrangement where it has the
right to charge for usage of brand strategy, development cost of technical know-how and computer software. These intangible assets
are measured at cost upon initial recognition. Following initial recognition, the intangible asset is measured at cost, less accumulated
amortisation and accumulated impairment losses. Subsequent expenditure is capitalised only when it increases the future economic
benefits embodied in the specific asset to which it relates. All other expenditure, including expenditure on internally generated goodwill
and brands, is recognised in the profit or loss as incurred.
Computer software which is not an integral part of hardware is recognised as an intangible asset and is amortised over its estimated
useful life of 5 years as determined by the Group’s management. Corporate branding and brand strategy development cost is
amortised over its estimated useful life of between 8 and 12 years as determined by the Group’s management. Development cost of
technical know-how is amortised over its estimated useful life of 5 years as determined by the Group management.
Amortisation methods, useful lives and residual values are reviewed at each reporting date and adjusted if appropriate.
Capital work–in-progress
The cost of capital work-in-progress consists of the contract value, directly attributable costs of developing and bringing the project
assets to the location and condition necessary for them to be capable of operating in the manner intended by management. The costs
of capital work-in-progress will be transferred to tangible and intangible non-current asset classifications when these assets reach
their working condition for their intended use. The carrying values of capital work in progress are reviewed for impairment when events
or changes in circumstances indicate the carrying value may not be recoverable. If any such indication exists and where the carrying
values exceed the estimated recoverable amount, the assets are written down to their recoverable amount.

76 77A BUSINESS LEGEND, LEADING WITH GENUINE INNOVATION ANNUAL REPORT 2013
Work-in-progress
The work-in-progress represents the development and construction cost related to land, apartments, town houses and villas for
which revenue has not been recognised by the Group. The development and construction costs include direct material, direct labour,
contract related overheads and all other directly attributable costs of the development.
Interest bearing loans and borrowings
All the term loans are initially recognised at the fair value of the consideration received plus directly attributable transaction costs.
After initial recognition, interest bearing term loans are subsequently measured at amortised cost using the effective interest rate
method.
Employees’ end of service benefits
The Group provides end of service benefits to its employees. The entitlement to these benefits is based upon the employees’ final
salary and the length of service, subject to the completion of a minimum service period, calculated under the provisions of the Qatar
Labour Law and is payable upon resignation or termination of employment. The expected costs of these benefits are accrued over
the period of employment.
Accounts and other payables
Liabilities are recognised for amounts to be paid in the future for goods or services received, whether billed by the supplier or not.
Provisions
Provisions are recognised when the Group has an obligation (legal or constructive) arising from a past event, and the costs to settle the obligation are
both probable and reliably measured.
Foreign currency translation
Each entity in the Group determines its own functional currency and items included in the financial statements of each entity are
measured using that functional currency. Transactions in foreign currencies are initially recorded at the functional currency rate ruling at
the date of the transaction. Monetary assets and liabilities denominated in foreign currencies are retranslated at the functional currency
rate of exchange ruling at the reporting date. All differences are recognised in the profit or loss with the exception of differences on
foreign currency borrowings that provide a hedge against a net investment in a foreign entity. These are taken directly to equity until
the disposal of the net investment, at which time they are recognised in the profit or loss. Non-monetary items that are measured in
terms of historical cost in a foreign currency are translated using the exchange rates as at the date of the initial transaction.
Non-monetary items measured at fair value in a foreign currency are translated using the exchange rates at the date when the fair
value was determined. Any goodwill arising on the acquisition of a foreign operation and any fair value adjustments to the carrying
amounts of assets and liabilities arising on the acquisition are treated as assets and liabilities of the foreign operation and translated
at the closing rate.
Current versus non-current classification
The Group presents assets and liabilities in the statement of financial position based on current/non-current classification. An asset
is current when it is:
Expected to be realised or intended to sold or consumed in the normal operating cycle;
Held primarily for the purpose of trading; or
Expected to be realised within twelve months after the reporting period, or cash or cash equivalent unless restricted
from being exchanged or used to settle a liability for at least twelve months after the reporting period.
All other assets are classified as non-current. A liability is current when:
It is expected to be settled in normal operating cycle;
It is held primarily for the purpose of trading;
It is due to be settled within twelve months after the reporting period, or
There is no unconditional right to defer the settlement of the liability for at least twelve months after the reporting period.
The Group classifies all other liabilities as non-current.
Discontinued operations
A discontinued operation is a component of the Group’s business that represents a separate geographical area of operations that has
been disposed of or is held for sale. Classification as a discontinued operation occurs upon disposal or when the operation meets the
criteria to be classified as held-for-sale.
Financial instruments
Non-derivative financial assetsThe Group initially recognises accounts and other receivables and deposits on the date that they are originated. All other financial
assets are recognised initially on the trade date at which the Group becomes a party to the contractual provisions of the instrument.
Non-derivative financial assets comprise investments in equity securities, accounts and other receivables, cash and cash equivalents.
Financial assets and liabilities are offset and the net amount presented in the statement of financial position when, and only when, the
Group has a legal right to offset the amounts and intends either to settle on a net basis or to realise the asset and settle the liability
simultaneously.
The Group derecognizes a financial asset when the contractual right to the cash flows from the asset expires, or it transfers the right to
receive the contractual cash flows on the financial asset in a transaction in which substantially all the risk and rewards of the financial
asset are transferred.
Non-derivative financial assets are recognised initially at fair value plus, for instruments not at fair value through profit or loss, any
directly attributable transaction costs. Subsequent to initial recognition non-derivative financial instruments are measured as described
below.
Available-for-sale financial assetsThe Group’s investments in equity securities are classified as available-for-sale financial assets. After initial recognition, investments
which are classified “available-for-sale – quoted” are measured at fair value and changes therein, other than impairment losses and
foreign exchange gains and losses on available-for-sale financial assets (refer to note 21), are recognised directly in equity.
On de-recognition or impairment, the cumulative gain or loss previously reported in equity is included in the profit or loss for the year.
Due to the nature of the cash flows arising from the Group’s unquoted investments, the fair value of investments cannot be reliably
measured and consequently, these investments are carried at cost, less provision for impairment losses, if any.
Available-for-sale instruments are recognised and derecognised on a trade date basis, when the Group becomes or ceases to be a
party to the contractual provisions of the instrument.
Accounts and other receivablesAccounts and other receivables are financial assets with fixed or determinable payments that are not quoted in an active market. Such
assets are recognised initially at fair value plus any directly attributable transaction costs. Subsequent to initial recognition loans and
receivables are measured at amortised cost using the effective interest method, less any impairment losses.
Cash and cash equivalentsCash and cash equivalents consist of cash, bank balances and short term original deposits with maturities of three months or less
from the acquisition date that are subject to an insignificant risk of changes in their fair value, and are used by the Group in the
management of its short-term commitments.
Non-derivative financial liabilitiesAll the financial liabilities are recognised initially on the trade date at which the Group becomes a party to the contractual provisions
of the instrument.
Financial assets and liabilities are offset and the net amount presented in the statement of financial position when, and only when, the
Group has a legal right to offset the amounts and intends either to settle on a net basis or to realise the asset and settle the liability
simultaneously.
Non-derivative financial liabilities comprise term loans, accounts and other payables and retention payable.
Such financial liabilities are recognised initially at fair value plus any directly attributable transaction costs. Subsequent to initial
recognition these financial liabilities are measured at amortised cost using the effective interest method.
The Group derecognizes a financial liability when its contractual obligations are discharged, cancelled or expired.
Share capitalOrdinary shares are classified as equity. Incremental costs directly attributable to the issue of ordinary shares are recognised as a
deduction from equity.
Inventories
Inventories are measured at the lower of cost or net realisable value. The cost of inventories is based on the weighted average
principle, and includes expenditure incurred in acquiring the inventories and other costs incurred in bringing them to their existing
location and condition. Net realisable value is the estimated selling price in the ordinary course of business, less the estimated costs
of completion and estimated cost necessary to make the sale.
78 79A BUSINESS LEGEND, LEADING WITH GENUINE INNOVATION ANNUAL REPORT 2013
5 FINANCIAL RISK MANAGEMENT
The Group’s principal financial liabilities comprise loans and borrowings, accounts and other payables. The main purpose of these
financial liabilities is to finance the Group’s operations and to provide guarantees to support its operations. The Group has trade and
other receivables, and cash and short-term deposits that arrive directly from its operations.
The Group has exposure to the following risks from its use of financial instruments
Credit risk
Liquidity risk
Market risk
Operational risk
Quantitative disclosures are included throughout these consolidated financial statements. The Board of Directors has the overall
responsibility for the establishment and oversight of the Group’s risk management frame work.
Credit risk
Credit risk is the risk of financial loss to the Group if a customer or counterparty to a financial instrument fails to meet its contractual
obligations, and arises principally from the Group’s receivables from customers and investment securities.
Accounts and other receivables The Group’s exposure to credit risk is influenced mainly by the individual characteristics of each customer. The demographics of the
Group’s customer base, including the default risk of the industry and country, in which customers operate, has less of an influence
on credit risk. The majority of the Group’s revenue is attributable to customers originating from the Gulf cooperative Council States.
There is no concentration of credit risk attributable to a single customer.
Properties sold are subject to retention of title clauses, so that in the event of non-payment the Group may have a secured claim. The
Group does not require collateral in respect of accounts and other receivables.
Accounts receivable are stated at original invoice amount less a provision for any uncollectible amounts. An estimate for doubtful debts
is made when collection of the full amount is no longer probable. Bad debts are written off when there is no possibility of recovery.
Liquidity risk
Liquidity risk is the risk that the Group will not be able to meet its financial obligations as they fall due. The Group’s approach to managing liquidity is to
ensure, as far as possible, that it will always have sufficient liquidity to meet its liabilities when due, under both normal and stressed conditions, without
incurring unacceptable losses or risking damage to the Group’s reputation.
The Group uses activity-based costing to cost its products and services, which assists it in monitoring cash flow requirements
and optimising its cash return on investments. Typically the Group ensures that it has sufficient cash on demand to meet expected
operational expenses for a period of 60 days, including the servicing of financial obligations; this excludes the potential impact of
extreme circumstances that cannot reasonably be predicted, such as natural disasters.
Market risk
Market risk is the risk that changes in market prices, such as foreign exchange rates, interest rates and equity prices will affect the
Group’s income or the value of its holdings of financial instruments.
Currency riskThe Group is exposed to currency risk on sales, purchases and borrowings that are denominated in a currency other than the
respective functional currency of Group entities. The majority of the Group’s transactions are denominated in the functional currency
of the Group’s entities or currencies with a fixed exchange rate to the functional currency.
Equity price riskThe Group monitors equity securities based on the market indices. Material investments are managed by the Group on individual
basis and all buy and sell decisions are approved by the Board of Directors. The equity securities performance is actively monitored
and managed on a fair value basis.
Interest rate riskInterest rate risk is the risk that the fair value or future cash flows of a financial instrument will fluctuate because of change in market
interest rates. The Group’s exposure to the risk of change in the market interest rate relates primarily to the Group’s interest bearing
loans and borrowings. The Group adopts a policy of ensuring that interest rate exposures are reviewed quarterly.
Assets and liabilities of discontinued operations are considered as disposal groups and classified as held-for-sale. Impairment loss on
initial classification to held-for-sale and subsequent gain or loss on re-measurement are recognised in profit or loss.
The disposal group is remeasured in accordance with the Group’s accounting policies immediately before classification as held-for-
sale. Therefore, generally the disposal group is measured at the lower of its carrying amount and fair value less costs to sell. When
an operation is classified as a discontinued operation, the comparative statement of comprehensive income is re-presented as if the
operation had been discontinued from the start of the comparative period.
Derecognition of financial assets and financial liabilities
Financial assetsA financial asset is primarily derecognised where:
the right to receive cash flows from the asset have expired or
the Group has transferred its rights to receive cash flows from the asset or has assumed an obligation to pay the received cash
flows in full without material delay to a third party under a ‘pass through’ arrangement and
either has transferred substantially all the risks and rewards of the asset, or has neither transferred nor retained substantially all
the risks and rewards of the asset, but has transferred control of the asset.
Financial liabilitiesA financial liability is derecognised when the obligation under the liability is discharged or cancelled or expires. Where an existing
financial liability is replaced by another from the same lender on substantially different terms, or the terms of an existing liability are
substantially modified, such an exchange or modification is treated as a derecognition of the original liability and the recognition of a
new liability, and the difference in the respective carrying amount is recognised in profit or loss.
Determination of fair values
The fair value is the estimated amount for which assets could reasonably be exchanged for on the date of valuation between a willing
buyer and a willing seller in an arm’s length transaction wherein the buyer and seller has each acted knowledgeably, prudently and
without compulsion.
Available-for-sale financial assets For investments actively traded in organised financial markets, fair value is determined by reference to quoted market bid prices at the
close of business at the reporting date.
Where the investments are not traded in an active market, traded in small volumes or where there is no quoted market price, a
reasonable estimate of fair value is determined by reference to current market value of a similar investment or is based on the expected
discounted cash flows. Investments whose fair value cannot be reliably measured are carried at cost less any impairment in value.
Accounts and other receivables The fair value of trade and other receivables, excluding construction work in progress, is estimated as the present value of future cash
flows, discounted at the market rate of interest at the reporting date.
Non-derivative financial liabilities Fair value, which is determined for disclosure purposes, is calculated based on the present value of future principal and interest cash
flows, discounted at the market rate of interest at the reporting date.
Investment property The Group values its investment property portfolio at each reporting date. The fair values are based on market values, being the
estimated amount for which a property could be exchanged on the date of the valuation between a willing buyer and a willing seller in
an arm’s length transaction after proper marketing wherein the parties had each acted knowledgeably and willingly.
In the absence of current prices in an active market, the valuations are prepared by considering the estimated rental value of the
property. A market yield is applied to the estimated rental value to arrive at the gross property valuation. When actual rents differ
materially from the estimated rental value, adjustments are made to reflect actual rents.
Valuations reflect, when appropriate, the type of tenants actually in occupation or responsible for meeting lease commitments or
likely to be in occupation after letting vacant accommodation, the allocation of maintenance and insurance responsibilities between
the Group and the lessee, and the remaining economic life of the property. When rent reviews or lease renewals are pending with
anticipated reversionary increases, it is assumed that all notices, and when appropriate counter-notices, have been served validly and
within the appropriate time.
Investment property under construction is valued by estimating the fair value of the completed investment property and then deducting
from that amount the estimated costs to complete construction, financing costs and a reasonable profit margin.

80 81A BUSINESS LEGEND, LEADING WITH GENUINE INNOVATION ANNUAL REPORT 2013
Notes
(a) The proposed Directors’ remuneration for the year 2012 was not approved by the shareholders at the AGM held on 24 February
2013 and subsequently reversed in the year 2013, disclosed under other income.
2013 2012
(b) Asset write off and impairment QR’000 QR’000
Write off of property, plant and equipment (Note 9) 41,881
Impairment of property, plant and equipment (Note 9) 3,219 -
Impairment of intangible assets (Note 11) 3,479 -
Impairment of boats (Note 15) 29,754 -
78,333 -
8 BASIC AND DILUTED EARNINGS PER SHARE
Basic earnings per share is calculated by dividing the net profit for the year attributable to ordinary equity holders of the parent by the
weighted average number of shares outstanding during the year.
2013 2012
QR’000 QR’000
Profit attributable to equity holders of the parent 322,766 730,290
Weighted average number of shares outstanding
during the year 337,225 337,225
Basic and diluted earnings per share (QR) 0.96 2.17
There were no potentially dilutive shares outstanding at any time during the year. Therefore, the diluted earnings per share are equal
to the basic earnings per share.
9 PROPERTY, PLANT AND EQUIPMENT
Land Building BoatsPlant
facilities
-ture, equipment,
instruments and building
improvementsMotor
vehicles
Capital work in
progressTotal 2013
Tota2012
QR’000 QR’000 QR’000 QR’000 QR’000 QR’000 QR’000 QR’000 QR’000
Cost or valuation:
At 1 January 1,928,858 179,607 46,179 459,221 425,909 31,466 1,272,992 4,344,232 4,260,919
Revaluation gain 10 - - - - - - 10 -
Additions - - 13 704 9,934 1,028 482,739 494,418 118,306
Transfers - (76,299) (25,803) 880,364 2,099 (79) (1,261,152) (480,870) (30,639)
Written off - - - - (8,410) - (37,370) (45,780) -
Disposals - - (5,319) - (5,756) (1,910) (1,098) (14,083) (4,354)
At 31 December 1,928,868 103,308 15,070 1,340,289 423,776 30,505 456,111 4,297,927 4,344,232
Depreciation and impairment:
At 1 January - 35,022 14,019 79,803 120,513 19,479 47,749 316,585 227,785
Depreciation charge for the year - 6,100 3,961 25,333 50,373 4,242 21,791 111,800 99,825
Transfers - (7,907) (2,856) 69,540 (261) 105 (69,540) (10,919) (7,680)
Impairment including revaluation loss - - 22 - 69,265 105 - 69,392 -
Written off - - - - (3,899) - - (3,899) -
Disposals - - (4,649) - (2,650) (1,255) - (8,554) (3,345)
At 31 December - 33,215 10,497 174,676 233,341 22,676 - 474,405 316,585
Net carrying amount:
At 31 December 2013 1,928,868 70,093 4,573 1,165,613 190,435 7,829 456,111 3,823,522
At 31 December 2012 1,928,858 144,585 32,160 379,418 305,396 11,987 1,225,243 4,027,647
Operational risk
Operational risk is the risk of direct or indirect loss arising from a wide variety of causes associated with the Group’s processes,
personnel, technology and infrastructure, and from external factors other than credit, market and liquidity risks such as those arising
from legal and regulatory requirements and generally accepted standards of corporate behaviour. Operational risks arise from all of
the Group’s operations.
The Group’s objective is to manage operational risk so as to balance the avoidance of financial losses and damage to the Group’s
reputation with overall cost effectiveness and to avoid control procedures that restrict initiative and creativity.
The primary responsibility for the development and implementation of controls to address operational risk is assigned to senior
management within each business unit. This responsibility is supported by the development of overall Group standards for the
management of operational risk in the following areas:
requirements for appropriate segregation of duties, including the independent authorisation of transactions;
requirements for the reconciliation and monitoring of transactions;
compliance with regulatory and other legal requirements;
documentation of controls and procedures;
requirements for the periodic assessment of operational risks faced, and the adequacy of controls and procedures to address
the risks identified;
requirements for the reporting of operational losses and proposed remedial action;
development of contingency plan;
training and professional development;
ethical and business standards;
risk mitigation, including insurance where this is effective.
Compliance with Group standards is supported by a programme of periodic reviews undertaken by Internal Audit. The results of
Internal Audit reviews are discussed with the management of the business unit to which they relate, with summaries submitted to the
Board of Directors and senior management of the Group.
Capital management
The Board’s policy is to maintain a strong capital base so as to maintain investor, creditor and market confidence and to sustain future
development of the business. The Board seeks to maintain a balance between the higher returns that might be possible with higher
levels of borrowings and the advantages and security afforded by a sound capital position.
The Group objectives when managing capital are:
To safeguard the Group’s ability to continue as going concern, so that it can continue to provide return for shareholders and
benefits for other stakeholders;
To provide an adequate return to shareholders by pricing products and services commensurately with the level of risk; and
To ensure that it meets financial covenants attached to the interest bearing loans and borrowings.
6 OTHER INCOME2013 2012
QR’000 QR’000
Fee income28,205 36,825
Sundry income100,376 7,421
Reversal of Board of Directors remuneration22,586 -
Miscellaneous78,486 50,954
Gain on sale of available-for-sale financial assets176 -
229,829 95,200
7 GENERAL AND ADMINISTRATIVE EXPENSES
2013 2012
QR’000 QR’000
Staff costs 120,342 76,191
Depreciation (Note 9) 28,294 28,839
Rent 8,902 7,528
Professional charges 16,470 2,092
Directors remuneration (Note a) 9,982 22,586
Asset write off and impairment (Note b) 78,333 -
Other general and administrative expenses 74,521 72,724
336,844 209,960

82 83A BUSINESS LEGEND, LEADING WITH GENUINE INNOVATION ANNUAL REPORT 2013
The investment properties, which include properties under development, located in The Pearl Qatar were revalued by independent
professional valuers and the resulting gain amounting to QR 3,057,235 thousands has been recognised in the profit or loss in the year
2011. The Group believes that the carrying value of investment properties as at 31 December 2013 approximates its fair value.
The Pearl Marina is recognised at cost as of 31 December 2013 amounting to QR309,219 thousand (2012: QR306,098 thousand)
and based on management’s estimate, the carrying amount approximates its fair value.
11 INTANGIBLE ASSETS
Branding Goodwill Operating software Others Total
QR’000 QR’000 QR’000 QR’000 QR’000
Cost:
Balance at 1 January 2012 6,175 8,867 7,049 2,790 24,881
Additions during the year 1,159 - 1,301 24 2,484
Balance at 31 December 2012 7,334 8,867 8,350 2,814 27,365
Balance at 1 January 2013 7,334 8,867 8,350 2,814 27,365
Additions during the year 427 - - - 427
Impairment (Note 7b) (1,851) - (1,628) - (3,479)
Balance at 31 December 2013 5,910 8,867 6,722 2,814 24,313
Branding Goodwill Operating software Others Total
QR’000 QR’000 QR’000 QR’000 QR’000
Amortisation
Balance at 1 January 2012 1,100 8,867 2,685 604 13,256
Amortisation for the year 732 - 1,751 571 3,054
Balance at 31 December 2012 1,832 8,867 4,436 1,175 16,310
Balance at 1 January 2013 1,832 8,867 4,436 1,175 16,310
Amortisation for the year 772 - 121 1,013 1,906
Balance at 31 December 2013 2,604 8,867 4,557 2,188 18,216
Net carrying amounts:
At 31 December 2013 3,306 - 2,165 626 6,097
At 31 December 2012 5,502 - 3,914 1,639 11,055
12 INVESTMENT IN ASSOCIATES
The Group has the following investments in associate companies:
2013 2012
QR’000 QR’000
Country of incorporation Shareholding Carrying Value Carrying Value
Middle East Dredging Company Q.S.C.
(Note a)
Qatar 45.9% - 263,823
Al-Seef Limited Q.S.C (Note b) Qatar 20% 302,360 317,225
United Readymix W.L.L. (Note c) Qatar 32% 38,056 36,942
ASTECO Qatar (Note d) Qatar 30% 1,746 1,965
342,162 619,955
The depreciation charge has been disclosed in the consolidated financial statements as follows:
2013 2012
QR’000 QR’000
Cost of revenue 67,450 45,182
Sales and marketing expenses 1,379 1,839
General and administrative (Note 7) 28,294 28,839
Capital work in progress - 1,553
Others 14,677 22,412
111,800 99,825
i. The district cooling system plant and related facilities are being constructed on the freehold land owned by the Group.
ii. The revaluation of the lands in the West Bay area and Pearl Qatar was carried out by an independent external valuator in 2011.
The cost of the land which was subject to revaluation amounted to QR 109,500 thousands. The Group believes that the carrying
value of revalued assets net of impairment as at 31 December 2013 approximates its fair value.
iii. Capital work in progress comprises the costs incurred in respect of the following:
2013 2012
QR’000 QR’000
Cooling plants – Qatar District Cooling
Company Q.C.S.C
13,292 836,817
Properties under development 440,465 387,792
Others 2,354 634
456,111 1,225,243
iv. The impairment loss of QR 69,392 thousands was as a result of a review carried out by the Group where the recoverable amount
of the items of property, plant and equipment was found to be lower than the carrying amount of such assets, of which certain
assets were previously revalued.
The recoverable amounts were determined as the higher of fair value less cost to sell or value in use.
Impairment loss and write offs amounting to QR 69,392 thousands and QR 41,881 thousands respectively are disclosed in the
consolidated financial statements as follows:
2013 2012
QR’000 QR’000
Impairment loss
Asset revaluation reserve (Note 21d) 66,173 -
General and administration expenses
(Note 7b)
3,219 -
69,392 -
Write off
General and administration expenses
(Note 7b)
41,881 -
111,273 -
10 INVESTMENT PROPERTIES
2013 2012
QR’000 QR’000
Balance at 1 January 6,401,173 6,318,835
Additions - development costs incurred
during the year
91,754 25,021
Transfers 797,669 57,317
Balance at 31 December 7,290,596 6,401,173
The cost of investment properties as of 31 December 2013 includes capitalised borrowing costs amounting to QR 194,272 thousands
(2012: QR 160,322 thousands).

84 85A BUSINESS LEGEND, LEADING WITH GENUINE INNOVATION ANNUAL REPORT 2013
15 ASSETS HELD FOR SALE
During the year, the Directors of the Company passed a resolution to dispose of certain yachts owned by Ronautica Middle East,
a 100% owned subsidiary of the Company. Accordingly, as at 31 December 2013, the yachts are classified as assets held for sale.
As of 31 December 2013, assets held for sale amounting to QR 29,754 thousands were impaired and fully provided for.
2013 2012
QR’000 QR’000
As at 1 January 50,111 -
Impairment loss (Note 7b) (29,754) -
20,357 -
16 WORK IN PROGRESS
2013 2012
QR’000 QR’000
Qanat Quartier - 1,540,874
Work-in-progress primarily represents costs incurred for the Qanat Quartier Project Development up to end of year 2012 which were
not billed or transferred to inventories as of 31 December 2012. The Company purchased the remaining inventory as part of the Fund’s
liquidation process which occurred in 2013.
17 ACCOUNTS AND OTHER RECEIVABLES
2013 2012
QR’000 QR’000
Accounts and other receivables, net - current (Note 17.1) 1,728,912 1,755,170
Accounts and other receivables - long term (Note 17.2) 18,071 14,835
1,746,983 1,770,005
17.1 ACCOUNTS AND OTHER RECEIVABLES, NET - CURRENT
2013 2012
QR’000 QR’000
Accounts receivable 110,099 136,089
Accrued income 2,831 5,752
Advances to contractors 97,457 72,863
Amounts due from customers 963,783 972,400
Amounts due from related parties (Note a) 27,398 23,188
Prepaid expenses and other assets 527,344 544,878
1,728,912 1,755,170
As at 31 December 2013, accounts receivable amounting to QR 30,798 thousands (2012: QR 7,993 thousands) were impaired and
fully provided for.
2013 2012
QR’000 QR’000
Balance as of 1 January 7,993 2,626
Provision made during the year 22,982 5,367
Written off during the year (177) -
Balance as of 31 December 30,798 7,993
Notes:
a. Middle East Dredging Company Q.S.C. (the associate) is involved in project related dredging and reclamation activities in the Gulf
states and other neighbouring countries.
The associate sustained losses relating to the Satah Al Razboot (SARB) Project. The project has been characterised by various
delays and difficulties resulting in a cost overrun on the part of the associate. The management of the associate has submitted a
claim to the counterparty in an effort to recover a portion of the cost overruns and the settlement amount is under negotiation. As
a result the 45.9% equity holding in the associate is impaired in full as at 31 December 2013.
b. Al-Seef Limited Q.S.C. is engaged in production and selling of Linear Alkyl Benzene (LAB), downstream petrochemical products
and essential feedstock to worldwide detergent manufacturing industries.
c. United Readymix W.L.L. is engaged in the production and sale of ready-mix concrete and other building materials.
d. ASTECO Qatar is involved in property management activity.
The net share of results of associates represents the Group’s share of the associates’ net loss for the year.
The following table represents the summarized financial information of the Group’s investments in associates.
Share of associates’ statement of financial position: 2013 2012
QR’000 QR’000
Non-current assets 684,794 617,666
Current assets 700,457 856,334
Non-current liabilities (297,068) (152,760)
Current liabilities (746,021) (701,285)
Net assets 342,162 619,955
Associates’ share of revenue and results:
Group’s share of revenue 990,956 664,937
Group’s share of loss for the year (233,841) (8,650)
13 AVAILABLE-FOR-SALE FINANCIAL ASSETS
2013 2012
QR’000 QR’000
Available for sale financial assets – quoted shares 432,862 344,683
Available for sale financial assets – unquoted shares 4,000 4,000
436,862 348,683
As of 31 December 2013, unquoted equity investments are carried at cost less impairment due to non-availability of quoted market
prices or other reliable measures of fair value.
14 INVENTORIES, NET
2013 2012
QR’000 QR’000
Land and properties held for sale 3,053,438 2,276,175
Spare parts 5,120 4,148
Construction work in progress – equipment 23,124 19,831
Boat stock 343 27,679
Fashion items 6,297 5,161
Food, beverage and consumables 954 7,785
Material and chemical items 7,053 1,136
Goods in transit - 109
3,096,329 2,342,024

86 87A BUSINESS LEGEND, LEADING WITH GENUINE INNOVATION ANNUAL REPORT 2013
19 ISSUED CAPITAL
2013 2012
QR’000 QR’000
Authorised, issued and fully paid up capital:
337,225,000 ordinary shares of QR 10 each
(2012 : 337,225,000 ordinary shares of QR 10 each) 3,372,250 3,372,250
Number of shares
On issue at 1 January (thousands) 337,225 160,875
On issue at 31 December(thousands) 337,225 337,225
At 31 December 2013, the authorised share capital comprised of 337,225,000 ordinary shares (2012: 337,225,000 ordinary shares),
all shares have a par value of QR 10. All issued shares are fully paid. The holders of ordinary shares are entitled to receive a dividend,
as declared from time to time and are entitled to one vote per share at meetings of the Company. All shares rank equally with regard
to the Group’s residual assets.
During 2012, the authorised, issued and fully paid up capital was increased by QR 1.76 billion by way of an issue of 64,350,000 bonus
shares worth QR 643.5 million and a private placement of 112,000,000 shares worth QR 1.12 billion allotted to the Pension and Social
Insurance Authority.
20 LEGAL RESERVE
In accordance with Qatar Commercial Companies’ Law No. 5 of 2002, 10% of the profits for the year are transferred to a legal reserve.
Transfers may cease when the reserve totals 50% of the paid up share capital. The reserve is not available for distribution, except in
the circumstances stipulated by the Qatar Commercial Companies’ Law No. 5 of 2002. In 2006, the Company capitalized QR 57,280
thousands from legal reserve in order to issue bonus shares for 2005.
During the year, an amount of QR 32,278 thousands were transferred to the legal reserve (2012: QR 553,029 thousands including
share premium amounting to QR 480,000 thousands).
21 OTHER RESERVES
Fair value
reserve
Cash flow
hedge reserve
Asset revaluation
reserve
Total 2013 Total 2012
QR’000 QR’000 QR’000 QR’000 QR’000
Balance at 1 January (10,171) (12,365) 1,603,870 1,581,334 1,616,482
Increase/(decrease) 91,942 6,048 (66,697) 31,293 (35,148)
Balance at 31 December 81,771 (6,317) 1,537,173 1,612,627 1,581,334
Notes
a. Fair value reserve
The fair value reserve is used to record the changes, other than impairment losses in the fair value of available-for-sale financial assets.
b. Cash flow hedge reserve
The cash flow hedge reserve represents the Group’s share of other comprehensive income of associates.
c. Asset revaluation reserve
The asset revaluation reserve is used to record increases in the fair value of property, plant and equipment that were subject to fair
valuation and decreases to the extent that such decreases relates to an increase on the same asset previously recognised in equity.
a. Included in the amounts due from related parties are the following balances:
2013 2012
QR’000 QR’000
United Readymix W.L.L. 11,148 7,259
China Square L.L.C 3,945 3,945
Lebanese Restaurants Development L.L.C 3,201 3,200
Middle East Dredging Company Q.S.C. 3,524 2,739
Flavour of Mexico L.L.C 1,264 1,264
Urban Restaurant Development L.L.C 970 1,116
Lavantine SAS 1,105 1,105
Food Scope America 1,097 1,097
ASTECO Qatar - 679
Resorts Development Co L.L.C - 536
National Central Cooling Company P.J.S.C 1,042 147
Installation Integrity 2006 W.L.L 102 98
Cooltech Qatar W.L.L - 3
27,398 23,188
Accounts receivable is non-interest bearing and as at 31 December 2013, the analysis of accounts receivables and amounts due from
customers that were past due but not impaired is set out below:
Neither past due
nor impaired
Past due but not
impaired
Total Total
2013 2013 2013 2012
QR’000 QR’000 QR’000 QR’000
Accounts receivable 22,535 87,564 110,099 136,089
Amounts due from customers 552,651 411,132 963,783 972,400
575,186 498,696 1,073,882 1,108,489
Refer to Note 31, on credit risk of accounts receivable, which explains how the Group manages and measures credit quality of
accounts receivable that are neither past due nor impaired.
17.2 ACCOUNTS AND OTHER RECEIVABLES - LONG TERM
This amount represents the deposit paid for the purpose of obtaining utilities services by the subsidiary, Qatar Cool District Cooling
Company Q.C.S.C. This deposit will be released upon the discontinuation of the service provided for each cooling plant.
18 CASH AND CASH EQUIVALENTS
2013 2012
QR’000 QR’000
Cash on hand and bank balances 675,262 1,041,404
Time deposits 1,326,653 1,363,352
Total cash and cash equivalents 2,001,915 2,404,756
Less: Reserves / Time deposits maturing after 90 days (111,036) (138,913)
Cash and cash equivalents as per the statement of cash
flows
1,890,879 2,265,843
Time deposits carry interest at commercial rates.

88 89A BUSINESS LEGEND, LEADING WITH GENUINE INNOVATION ANNUAL REPORT 2013
The loans carry interest at variable rates of Qatar Central Bank repo rate and/or LIBOR plus a percentage. The finance costs associated
with raising funds represent arrangement fee, agency and participation fees.
i. Loan 1: In May 2007, the subsidiary, Qatar District Cooling Company signed a loan agreement with a consortium of banks to
provide loan facilities. This loan agreement grants a total facility of US$ 285 million available for drawdown to repay the existing
debt facility in full, fund the completion of the construction of the existing and new project facilities and to pay the interest,
fees and other costs and expenses under the finance documents. The loan is repayable in nineteen semi-annual instalments
commencing 36 months after the agreement date i.e. May 2010 and ending on May 2019. The loan is secured against the project
assets and other tangibles of the chilling plants of the company. Additionally, all revenues from the chilling plants and insurance
proceeds have been assigned in favour of the lenders.
ii. Loan 2: This represents a project finance loan obtained by the Company for US$ 38.8 million in May 2006. The loan was fully
drawn down in 2006. It is repayable in six annual instalments commencing from April 2008 and ending in April 2013. The loan
was fully settled in 2013.
iii. Loan 3: In September 2006, the Company signed a syndicated loan agreement of US$ 225 million with a group of local, regional
and international banks for corporate purposes available for 5 years as a revolving facility. In August 2011, the Company had
refinanced the facility to increase the loan amount by an additional US$ 10 million. The facility was fully drawn by the Company
and available for three additional years from August 2011. The facility was amended on 24 December 2012 stating a partial
settlement of US$ 25 million amending the loan balance to US $ 210 million. The partial settlement was made in 2013.
iv. Loan 4: In February 2008, the subsidiary The Pearl Qatar Real Estate Development Fund signed a Musharaka agreement of US$
300 million for the construction of the Qanat Quartier precinct at the Pearl Qatar project. The loan is available for 3 years and
renewable for two more additional years. The facility was renewed for one year in 2011 and 2012 and expired on 19th February
2013. The loan was amended during 2012 stating a partial settlement of US$ 50 million amending the loan balance to US $ 250
million. The loan was fully settled in 2013.
v. Loan 5: In August 2008, the subsidiary, Medina Centrale Company signed a syndicated loan agreement of QR 940 million and
US$ 27.4 million with a group of local, regional and international banks for the construction of Medina Centrale precinct at the
Pearl Qatar project .The facility is available for 9 years as a revolving facility. The loan was amended and restated on 30 December
2012 stating a partial settlement of QR 148.35 million amending the loan balance to QR 765 million and keeping the US$ portion
the same. A partial settlement was made in 2013. The repayment of this loan commences from August 2014. The facility was
fully drawn by the Company.
vi. Loan 6: This represents a corporate banking facility obtained by the Company in March 2010 for QR 728 million payable over
a period of three years. The loan was fully settled by the Company during the year to the initial lender. However, the Company
obtained a new loan of the same amount and purpose in March 2013 from a different lender. The loan was fully drawn by the
Company during the year and repayable over a period of 3 years.
vii. Loan 7: This represents a general corporate facility obtained by the subsidiary, Porto Arabia Retail Company 1 in August 2011.
The facility limit is QR 350 million payable semi-annually commencing from February 2013 to August 2018. The facility was fully
drawn by the Company.
viii. Loan 8: This represents a general corporate facility obtained by the Company in September 2011. The facility limit is QR 780
million payable quarterly commencing from January 2013 to October 2021.
ix. Loan 9: This facility was obtained by the subsidiary United Development Investment Company in February 2011. The facility limit
is QR 400 million payable in full in June 2015. The outstanding balance as at 31 December 2013 represents the drawn amount
of the facility.
d. Asset revaluation reserve
The movement in asset revaluation reserve during the year is as follows;
2013 2012
QR’000 QR’000
Revaluation gain 10 -
Impairment loss taken to asset revaluation reserve (Note 9) (66,173) -
Relating to disposals (534) -
(66,697) -
22 PROPOSED DIVIDENDS
The Board of Directors proposed a cash dividend of 10% of share capital amounting to QR 337,225 thousands and a bonus shares
of 5% of issued share capital amounting to QR 168,612.5 thousands for the year 2013 which will be subject to the approval of the
shareholders at the Annual General Meeting (2012: 10% of share capital amounting to QR 337,225 thousands as cash dividend).
23 SOCIAL AND SPORTS FUND
Qatar Law No. 13 of 2008 requires all Qatari listed shareholding companies to pay 2.5% of net profit to a social and sports fund.
In pursuant to this Law and further clarifications for the Law issued in 2010, the Group has made an appropriation of QR 8,069
thousands representing 2.5% of the net profit attributable to the owners of Company for the year ended 31 December 2013 (2012:
QR 18,257 thousands).
24 INTEREST BEARING LOANS AND BORROWINGS
2013 2012
QR’000 QR’000
Loan 1 705,820 799,236
Loan 2 - 23,550
Loan 3 764,925 855,988
Loan 4 - 909,389
Loan 5 864,970 881,623
Loan 6 728,000 728,000
Loan 7 297,500 350,000
Loan 8 693,342 780,000
Loan 9 60,834 60,834
Loan 10 1,159,500 -
5,274,891 5,388,620
Less: Unamortised finance cost associated with raising
finance
(35,121) (37,489)
Balance at 31 December 5,239,770 5,351,131
Presented in the consolidated statement of financial
position as:
Current liability 1,191,450 2,128,959
Non-current liability 4,048,320 3,222,172
5,239,770 5,351,131

90 91A BUSINESS LEGEND, LEADING WITH GENUINE INNOVATION ANNUAL REPORT 2013
27 ACCOUNTS AND OTHER PAYABLES
2013 2012
QR’000 QR’000
Accounts and other payables - current (Note 27.1) 2,313,018 2,389,176
Accounts and other payables - long term (Note 27.2) 42,554 18,024
2,355,572 2,407,200
27.1 ACCOUNTS AND OTHER PAYABLES - CURRENT
2013 2012
QR’000 QR’000
Accounts payable 84,509 124,606
Accrued contracts costs 1,340,666 1,276,653
Advances received from customers 402,428 442,614
Other accrued expenses 105,482 165,547
Other payables 379,933 379,756
2,313,018 2,389,176
27.2 ACCOUNTS AND OTHER PAYABLES – LONG TERM
2013 2012
QR’000 QR’000
Master community reserve fund 10,488 5,397
Customer deposits 32,066 12,627
42,554 18,024
28 RELATED PARTY DISCLOSURES
Related party transactions
During the year, certain transactions have occurred with related parties on the same commercial basis and conditions as other non-
related parties. Pricing policies and terms of these transactions are approved by the Group’s management.
Transactions with related parties included in the consolidated statement of income are as follows:
2013 2012
QR’000 QR’000
Other related parties:
Revenue 85,100 102,588
Associates:
Management fee 44 43
Rent income 2,548 2,214
Amounts due from related parties are disclosed in note 17 to these financial statements.
Compensation of key management personnel
The details of compensation and remuneration to key management personnel are as follows:
2013 2012
QR’000 QR’000
Short term benefits 23,818 23,698
Employees’ end of service benefits 798 1,267
24,616 24,965
x. Loan 10: This represents a project finance loan obtained by the Company amounting to QR 1.54 billion in July 2013 for the
purpose of financing the purchase of residential units at the Qanat Quartier Project in the Pearl-Qatar Island from the Pearl-Qatar
Real Estate Fund. The loan is repayable in quarterly instalments commencing from September 2013 and ending in October 2022.
The loan was fully drawn down by the Company during the year.
The maturity profiles of the term loans are as follows:
31 December 2013 1 year 2-5 years Over 5 years Total
QR’000 QR’000 QR’000 QR’000
Loan 1 102,492 603,328 - 705,820
Loan 2 - - - -
Loan 3 764,925 - - 764,925
Loan 4 - - - -
Loan 5 45,734 552,976 266,260 864,970
Loan 6 - 728,000 - 728,000
Loan 7 52,500 245,000 - 297,500
Loan 8 86,658 346,631 260,053 693,342
Loan 9 - 60,834 - 60,834
Loan 10 139,141 579,749 440,610 1,159,500
1,191,450 3,116,518 966,923 5,274,891
Loan 1 93,418 627,972 77,846 799,236
Loan 2 23,550 - - 23,550
Loan 3 91,062 764,926 - 855,988
Loan 4 909,389 - - 909,389
Loan 5 148,349 733,274 - 881,623
Loan 6 728,000 - - 728,000
Loan 7 52,500 227,500 70,000 350,000
Loan 8 86,658 346,632 346,710 780,000
Loan 9 - 60,834 - 60,834
2,132,926 2,761,138 494,556 5,388,620
This note provides information regarding the contractual terms of the Group’s term loans, which are measured at amortised cost. For
more information about the Group’s exposure to interest rate and liquidity risk, refer to note 31.
25 RETENTION PAYABLE
Retention payable represents amounts withheld from the payments to contractors. These amounts will be settled upon completion
of the maintenance period subject to satisfactory discharge of the obligations of the contractors. This has been disclosed in the
consolidated statement of financial position as follows:
2013 2012
QR’000 QR’000
Current portion 270,512 198,713
Non-current portion 122,409 232,504
392,921 431,217
26 EMPLOYEES’ END OF SERVICE BENEFITS
The movements in the provision recognised in the consolidated statement of financial position are as follows:
2013 2012
QR’000 QR’000
Provision at 1 January 26,925 22,602
Transfers (312) -
Provided during the year 8,016 10,397
End of service benefits paid (5,154) (6,074)
Provision at 31 December 29,475 26,925

92 93A BUSINESS LEGEND, LEADING WITH GENUINE INNOVATION ANNUAL REPORT 2013
receivables. Included in the Group’s receivables are customer balances which are past due but not impaired at the end of the reporting
date (refer to note 17) for which no allowance has been provided for as there was no significant change in the credit quality of the
customers and the amounts are still considered recoverable.
Impairment losses
Except as disclosed in note 17 to these financial statements, based on the management’s assessment and historic default rates,
the Group believes that no impairment allowance is necessary in respect of accounts receivables and amounts due from customers.
Liquidity risk
The following are the contractual maturities of financial liabilities and the impact of netting agreements:
Carrying
amount
Contractual
cash flows
Less than
12 months
1 – 2 years 2- 5 years More than 5
years
QR’000 QR’000 QR’000 QR’000 QR’000 QR’000
31 December 2013
Retention payable 392,921 (392,921) (270,512) (122,409) - -
Employees’ end of service benefits 29,475 (29,475) - - - (29,475)
Accounts and other payables 909,424 (909,424) (866,870) - - (42,554)
Interest bearing loans and borrowings 5,274,891 (5,274,891) (1,191,450) - (3,116,518) (966,923)
6,606,711 (6,606,711) (2,328,832) (122,409) (3,116,518) (1,038,952)
31 December 2012
Retention payable 431,217 (431,217) (198,713) (123,586) (108,918) -
Employees’ end of service benefits 26,925 (26,925) - - - (26,925)
Accounts and other payables 965,000 (965,000) (946,976) - - (18,024)
Interest bearing loans and borrowings 5,388,620 (5,388,620) (2,132,926) - (2,761,138) (494,556)
6,811,762 (6,811,762) (3,278,615) (123,586) (2,870,056) (539,505)
Market risk
Interest rate riskAt the reporting date the interest rate profile of the Group’s interest-bearing financial instruments was:
Carrying Amount
2013 2012
QR’000 QR’000
Fixed rate instruments
Time deposits 1,326,653 1,363,352
Term loans (297,500) (350,000)
1,029,153 1,013,352
Variable rate instruments
Term loans 4,977,391 5,038,620
Sensitivity analysis
A change of 100 basis points in interest rates at the reporting date would have increased / (decreased) equity and profit or loss by the
amount shown below. This analysis assumes that all other variables remain constant.
The Group has provided for Directors’ remuneration for the year 2013 amounting to QR 9,982 thousands which is subject to the
approval by the shareholders at the Annual General Meeting.
29 CONTINGENT LIABILITIES
2013 2012
QR’000 QR’000
Bank guarantees and bonds 8,008 7,600
Letters of credit 5,694 10,282
The Group anticipates that no material liability will arise from the above guarantees and letter of credits, which are issued in the ordinary course of business.
30 CAPITAL COMMITMENTS
2013 2012
QR’000 QR’000
Contractual commitments to contractors/suppliers 802,209 156,643
31 FINANCIAL INSTRUMENTS AND RISK MANAGEMENT
A financial instrument is any contract that gives rise to both a financial asset of one enterprise and a financial liability or equity
instrument of another enterprise.
Accounting policies for financial assets and liabilities are set out in note 4.
Financial instruments comprise of cash and bank balances, time deposits, accounts receivable, other receivables, due from / to
related parties and accounts and other payables.
Credit risk
Credit risk is the risk that one party to a financial instrument will fail to discharge an obligation and cause the other party to incur a
financial loss. The Group’s exposure to credit risk is as indicated by the carrying amount of its financial assets which consist principally
of accounts receivable, amounts due from customers, due from related parties and bank balances. Accounts receivable, amounts
due from customers and amounts due from related parties are shown net of provision for doubtful receivables and bank balances are
with reputed banks.
As at the reporting date, there were no significant concentrations of credit risk. The Group has a credit policy in place and the exposure
to credit risk is monitored on an ongoing basis.
Exposure to credit riskThe carrying amount of financial assets represents the maximum credit exposure. The maximum exposure to credit risk at the
reporting date was:
Carrying amount
2013 2012
QR’000 QR’000
Accounts and other receivables 1,198,737 1,204,540
Bank balances 2,001,740 2,404,240
3,200,477 3,608,780
The maximum exposure to credit risk for accounts and other receivables at the reporting date by geographic region was equal to
accounts receivable amount disclosed in the consolidated statement of financial position.
Considering prevailing market conditions, the Group has mutually agreed with some of its customers to revise the terms of its

94 95A BUSINESS LEGEND, LEADING WITH GENUINE INNOVATION ANNUAL REPORT 2013
Set out below is a comparison of the carrying amounts and fair value of the Group’s financial instruments as at 31 December 2013
and 31 December 2012:
Carrying amounts Fair values
31 December
2013
31 December
2012
31 December
2013
31 December
2012
QR’000 QR’000 QR’000 QR’000
Financial assets
Cash and cash equivalents 2,001,915 2,404,756 2,001,915 2,404,756
Accounts and other receivables, net 1,746,983 1,770,005 1,746,983 1,770,005
Available-for-sale financial assets 436,862 348,683 436,862 348,683
4,185,760 4,523,444 4,185,760 4,523,444
Financial liabilities
Accounts and other payables 2,355,572 2,407,200 2,355,572 2,407,200
Interest bearing loans and borrowings 5,239,770 5,351,131 5,239,770 5,351,131
Retentions payable 392,921 431,217 392,921 431,217
7,988,263 8,189,548 7,988,263 8,189,548
Fair value hierarchyThe table below analyses financial instruments carried at fair value, by valuation method. The different levels have been defined as
follows:
Level 1: quoted prices (unadjusted) in active markets for identical assets or liabilities.
Level 2: inputs other than quoted prices included within Level 1 that are observable for the asset or liability, either directly (i.e. as
prices) or indirectly (i.e. derived from prices).
Level 3: inputs for the asset or liability that are not based on observable market data (unobservable inputs).
Financial Assets Date of valuation Level 1 Level 2 Level 3 Total
QR’000 QR’000 QR’000 QR’000
31 December 2013
Available-for-sale financial assets 31 Dec 2013 432,862 - - 432,862
432,862 - - 432,862
31 December 2012
Available-for-sale financial assets 31 Dec 2012 344,683 - - 344,683
344,683 - - 344,683
33 FINANCE INCOME AND EXPENSE
2013 2012
QR’000 QR’000
Interest income on bank deposits 21,955 40,800
Dividend income on available-for-sale financial assets 26,044 26,222
Finance income 47,999 67,022
Interest expense on financial liabilities (84,234) (83,383)
Finance expense (84,234) (83,383)
Net finance expense (36,235) (16,361)
Change in variable Impact on net profit Impact on equity
QR’000 QR’000
31 December 2013
+100 basis points (49,774) (49,774)
-100 basis points 49,774 49,774
31 December 2012
+100 basis points (50,386) (50,386)
-100 basis points 50,386 50,386
Currency risk
Currency risk is the risk that the value of financial instruments will fluctuate due to changes in foreign exchange rates. All time deposits
are designated in Qatar Riyals and United States Dollar (USD) which is pegged against the Qatari Riyal. The Group’s exposure towards
currency risk is minimal as majority of the foreign currency financial assets and liabilities are denominated in currencies that have a fixed
exchange rate with its functional currency.
Equity price risk
Equity price risk is the risk that the fair value of future cash flows of a financial instrument will fluctuate because of changes in market
prices (other than those arising from interest rate risk or currency risk), where those changes are caused by factors specific to the
individual financial instrument or its issuer, or factors affecting all similar financial instruments traded in the market.
Sensitivity analysis
The analysis below is performed for reasonably possible movements in key variables with all other variables held constant, showing
the impact on the equity of the Group.
Impact on equity
Changes in variables 2013 2012
QR’000 QR’000
Qatar market +10% 26,118 24,368
International markets +10% 17,168 10,100
Qatar market -10% (26,118) (24,368)
International markets -10% (17,168) (10,100)
The method used for deriving sensitivity information and significant variables did not change from the previous period.
32 FAIR VALUES OF FINANCIAL INSTRUMENTS
Financial instruments comprise of financial assets and financial liabilities.
Financial instruments consist of cash and bank balances, available-for-sale financial assets and receivables. Financial liabilities consist
of term loans, payables, and accrued expenses.
The fair values of financial instruments, with the exception of certain available-for-sale financial assets carried at cost, are not materially
different from their carrying values.
Change in fair value recognised directly in equity
2013 2012
QR’000 QR’000
Net change in fair value of available-for-sale financial assets 91,942 (27,315)
Fair values
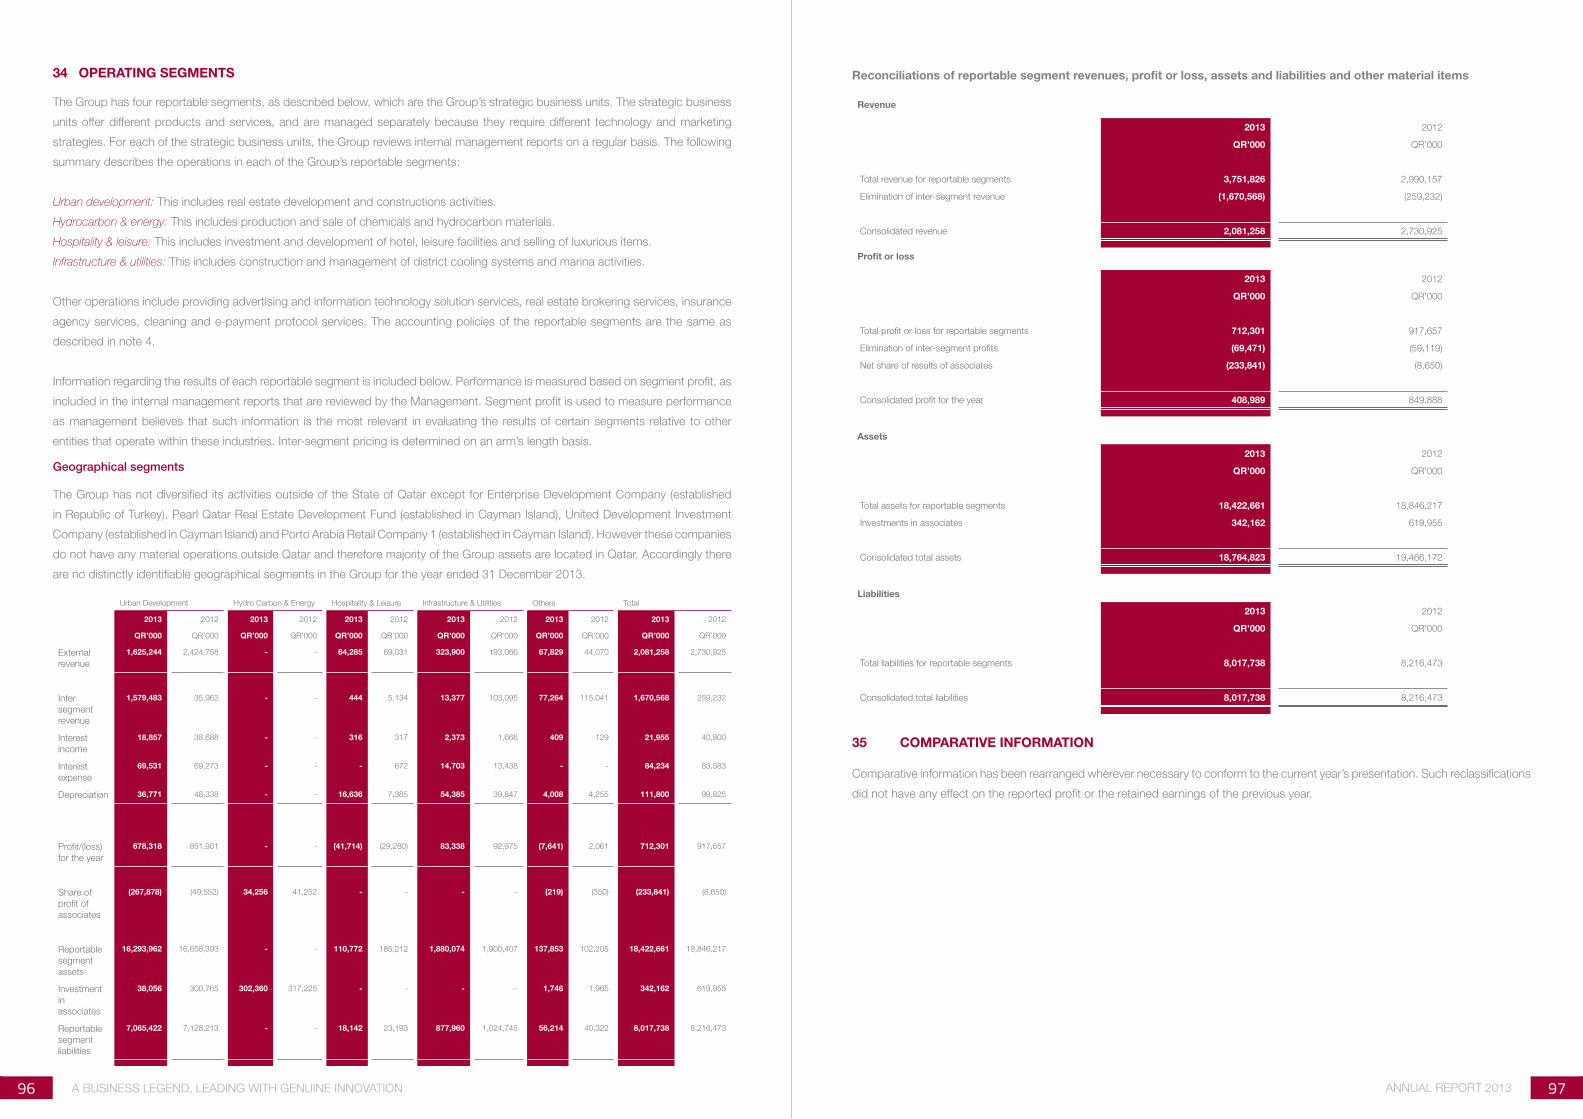
96 97A BUSINESS LEGEND, LEADING WITH GENUINE INNOVATION ANNUAL REPORT 2013
Reconciliations of reportable segment revenues, profit or loss, assets and liabilities and other material items
Revenue
2013 2012
QR’000 QR’000
Total revenue for reportable segments 3,751,826 2,990,157
Elimination of inter-segment revenue (1,670,568) (259,232)
Consolidated revenue 2,081,258 2,730,925
Profit or loss
2013 2012
QR’000 QR’000
Total profit or loss for reportable segments 712,301 917,657
Elimination of inter-segment profits (69,471) (59,119)
Net share of results of associates (233,841) (8,650)
Consolidated profit for the year 408,989 849,888
Assets
2013 2012
QR’000 QR’000
Total assets for reportable segments 18,422,661 18,846,217
Investments in associates 342,162 619,955
Consolidated total assets 18,764,823 19,466,172
Liabilities
2013 2012
QR’000 QR’000
Total liabilities for reportable segments 8,017,738 8,216,473
Consolidated total liabilities 8,017,738 8,216,473
35 COMPARATIVE INFORMATION
Comparative information has been rearranged wherever necessary to conform to the current year’s presentation. Such reclassifications
did not have any effect on the reported profit or the retained earnings of the previous year.
34 OPERATING SEGMENTS
The Group has four reportable segments, as described below, which are the Group’s strategic business units. The strategic business
units offer different products and services, and are managed separately because they require different technology and marketing
strategies. For each of the strategic business units, the Group reviews internal management reports on a regular basis. The following
summary describes the operations in each of the Group’s reportable segments:
Urban development: This includes real estate development and constructions activities.
Hydrocarbon & energy: This includes production and sale of chemicals and hydrocarbon materials.
Hospitality & leisure: This includes investment and development of hotel, leisure facilities and selling of luxurious items.
Infrastructure & utilities: This includes construction and management of district cooling systems and marina activities.
Other operations include providing advertising and information technology solution services, real estate brokering services, insurance
agency services, cleaning and e-payment protocol services. The accounting policies of the reportable segments are the same as
described in note 4.
Information regarding the results of each reportable segment is included below. Performance is measured based on segment profit, as
included in the internal management reports that are reviewed by the Management. Segment profit is used to measure performance
as management believes that such information is the most relevant in evaluating the results of certain segments relative to other
entities that operate within these industries. Inter-segment pricing is determined on an arm’s length basis.
Geographical segments
The Group has not diversified its activities outside of the State of Qatar except for Enterprise Development Company (established
in Republic of Turkey), Pearl Qatar Real Estate Development Fund (established in Cayman Island), United Development Investment
Company (established in Cayman Island) and Porto Arabia Retail Company 1 (established in Cayman Island). However these companies
do not have any material operations outside Qatar and therefore majority of the Group assets are located in Qatar. Accordingly there
are no distinctly identifiable geographical segments in the Group for the year ended 31 December 2013.
Urban Development Hydro Carbon & Energy Hospitality & Leisure Infrastructure & Utilities Others Total
2013 2012 2013 2012 2013 2012 2013 2012 2013 2012 2013 2012
QR’000 QR’000 QR’000 QR’000 QR’000 QR’000 QR’000 QR’000 QR’000 QR’000 QR’000 QR’000
External
revenue
1,625,244 2,424,758 - - 64,285 69,031 323,900 193,066 67,829 44,070 2,081,258 2,730,925
Inter
segment
revenue
1,579,483 35,962 - - 444 5,134 13,377 103,095 77,264 115,041 1,670,568 259,232
Interest
income
18,857 38,688 - - 316 317 2,373 1,666 409 129 21,955 40,800
Interest
expense
69,531 69,273 - - - 672 14,703 13,438 - - 84,234 83,383
Depreciation 36,771 48,338 - - 16,636 7,385 54,385 39,847 4,008 4,255 111,800 99,825
Profit/(loss)
for the year
678,318 851,901 - - (41,714) (29,280) 83,338 92,975 (7,641) 2,061 712,301 917,657
Share of
profit of
associates
(267,878) (49,552) 34,256 41,252 - - - - (219) (350) (233,841) (8,650)
Reportable
segment
assets
16,293,962 16,658,393 - - 110,772 185,212 1,880,074 1,900,407 137,853 102,205 18,422,661 18,846,217
Investment
in
associates
38,056 300,765 302,360 317,225 - - - -- 1,746 1,965 342,162 619,955
Reportable
segment
liabilities
7,065,422 7,128,213 - - 18,142 23,193 877,960 1,024,745 56,214 40,322 8,017,738 8,216,473

98 A BUSINESS LEGEND, LEADING WITH GENUINE INNOVATION