annual report 2013 - hifabfile... · we have more than 65 years of experience in the real estate...
TRANSCRIPT

ANNUAL REPORT 2013

22
C O N T E N T SThe year 2013 in numbers ______ 2
Key events in 2013 ____________ 3
Annual general meeting ________ 4
Report by the CEO ____________ 5
International projects ___________ 6
National projects ______________ 8
Hifab expands its portfolio _____ 14
Services – Virtual market _______ 15
We are building a sustainable company ____________________ 16
Five-year review _____________ 17
Employees ___________________ 18
The Hifab way _______________ 20
The Hifab Group share ________ 22
Administration report __________ 24
Financial position _____________ 28
Consolidated income statement _ 30
Statement of consolidated financial position _____________ 31
Statement of changes in equity __ 33
Statement of consolidated cash flow ____________________ 34
Income statement, parent company ____________________ 35
Balance sheet, parent company _ 36
Cash flow statement, parent
company ___________________ 38
Notes _______________________ 39
Auditor’s report ______________ 60
The Board ___________________ 62
The Management _____________ 63
V I S I O N
As a partner to our clients we are at the forefront in a changing society.
B U S I N E S S C O N C E P T
Hifab offers project management and advisory services for sustainable
development.
O P E R AT I O N S A N D O R G A N I Z AT I O N
Hifab is Sweden’s leading project management company, and the key to our
success is our employees. We are building a sustainable future, both here in
Sweden and far beyond the country’s borders. This is a commitment that re-
quires courage, collaboration, resourcefulness, and expertise. Our consultants
possess all of these qualities, and this is apparent from our projects.
We have more than 65 years of experience in the real estate industry and in
all of its sectors. We provide project management and advisory services
throughout Sweden in the sectors of building & industry, transport &
infrastructure, environment & energy and process technology, always with
a focus on sustainability. Hifab’s engagement in international development
projects spans some 20 countries.
Hifab Group AB is the parent company of the Group.
THIS IS HIFAB
The year 2013 in numbersRevenue: 460 (418) MSEKOperating profit from consultancy activities 14.1 (27.2) MSEKProfit after financial items 13.7 (26.0) MSEKThe average number of employees on a yearly basis 413 (354) Earnings per share 0.34 (0.55) SEK
Loft apartment terrace, new housing development, Djursholm

33
Hifab enhances and complements its expertise
in local planning by hiring six key people from
Struktur Svenska Kontor AB.
Hifab acquires DU Teknik AB on March 1 and
enhances and complements its expertise in energy
and process technology.
Hifab establishes office in Sundsvall.
Hifab International leads the “Subregional Transport
Project Preparatory Facility” project in Bangladesh.
The assignment is funded by the Asian Develop-
ment Bank and includes a feasibility study, and
design and expansion of the road network from
India, through Bangladesh, to Myanmar. The
project volume is USD 3 million, and will be
implemented by Hifab International’s regional
office in Dhaka, together with four subcontractors.
Hifab now offers services in CEEQUAL, which
is a system for certifying the sustainability of civil
engineering projects, such as roads, bridges,
stadiums and parking garages.
Agneta Jacobsson and Jan Skoglund elected as new
members of Hifab’s board at the AGM in May.
Hifab wins a framework agreement with the
Swedish Migration Board for inspection of the
board’s rented properties. We are the primary
supplier in Kalmar, Jönköping, Västra Götaland,
Östergötland, Skåne, Blekinge, Halland and
Kronoberg counties. In other counties we are the
alternative supplier.
Hifab wins a framework agreement with
Sörmland County Council for plumbing in
spection, construction inspection and construction
management. The framework agreement covers
the geographical areas of Katrineholm, Nyköping,
Oxelösund and Gnesta.
Hifab wins a framework agreement with the
City of Stockholm’s traffic and development
office for project management. We already have
a framework agreement for construction mana-
gement, through which we are currently assistant
construction project manager in the rebuilding
of Hornstull and in new development projects on
Kungsholmen.
Hifab wins an extended and continued contract
to act as construction manager for subarea Berg
in the Slussen project. The contract covers design
management and responsibility for the delivery of
construction documents for a new bus terminal
at Katarinaberget.
Hifab wins a contract to act as construction manager
for public spaces in Vallastaden in Linköping,
which will ultimately be a whole new neighbour-
hood, where parts of the area will be a housing
and community expo in 2016. Public spaces in this
project means streets, site design, Smedstadsbäcken,
bridges and a square. The assignment will run
from October 2013 until 2016.
Hifab wins a contract to provide HSB Bostad
with a production organization for implementa-
tion of a project under shared contractors for 106
new apartments in a meadow next to Rösjöskogen
at Edsberg in Sollentuna.
Hifab Western Region signs a framework agreement
with Göteborgs Stads Upphandlingsbolag AB in
respect of services including project management,
construction management, inspection, control
responsibilities and radon surveys. The framework
agreements cover both new construction and
rebuilding projects, through which all companies
and departments within the City of Gothenburg
can request services. The contracts run for two years
with the option of a further two–year extension.
Hifab signs a framework agreement with
European Spallation Source ESS AB in Lund.
The plant is expected to cost approximately SEK
14 billion. The agreement includes services in
construction management and project manage-
ment and runs until 2015.
KEY EVENTS IN 2013

4
TIME AND PLACE
PARTICIPATION REQUIREMENTS
NOTIFICATION
PROXIES AND ASSISTANTS
DIVIDEND
DISTRIBUTION OF ANNUAL REPORT
FINANCIAL INFORMATION 2014
ANNUAL GENERAL MEETINGThe Annual General Meeting of Shareholders will be held on Thursday, 15 May
2014 at 17.00 hrs.
Hifab’s Head Office: Norrtullspalatset, Sveavägen 167, 3rd, floor Stockholm, Sweden
Participation at the Annual General Meeting of Shareholders requires that the share-
holder is registered on the record date of 9 May 2014 in the share register maintained
by Euroclear Sweden AB on behalf of the company, and that the shareholder has
notified the company of its intention to attend the meeting no later than Wednesday,
14 May 2014 at 12.00 noon.
To be qualified to attend the meeting, a shareholder whose shares have been registered
in the acquisition register is required to temporarily register the shares in his/her own
name with Euroclear Sweden AB not later than 9 May 2014.
Notification of participation at the Annual General Meeting can be made to the
company as follows:
E–mail: [email protected]
Fax: +46 10 476 67 80
Telephone: +46 10 476 60 00
Post: Hifab Group AB, Box 19090, 104 32 Stockholm, Sweden
The notification from the shareholder should include name, personal/corporate
identification number, address, telephone number, number of shares represented
and, where applicable, name(s) of assistant(s).
The rights of a shareholder at the Annual General Meeting may be exercised by a
proxy holding a power of attorney. The power of attorney must be in writing and
no older than 12 months. Please note that the power of attorney must be submitted
in the original or be presented at the Annual General Meeting. A shareholder who
wishes to exercise the right to bring not more than two assistants to the AGM must
notify the company of his/her intention, stating the number of assistants, with the
notification of the intention to attend the Annual General Meeting.
The Board of Directors proposes that the Annual General Meeting approve a dist-
ribution of dividend in the amount of SEK 0.20 per share for the financial year
2013.The proposed record date for the dividend is 20 May 2014. Should the Annual
General Meeting approve the proposal, dividends are expected to be distributed by
Euroclear Sweden AB on 23 May 2014.
The Annual Report is available at the company’s offices and on its website at
www.hifab.se from 11 April 2014. The Annual Report will also be distributed by
post to shareholders who have notified the company accordingly.
Interim reports
January–March 2014: 8 May 2014
January–June 2014: 27 August 2014
January–September 2014: 7 November 2014
Information channels
Please visit Hifab’s website at www.hifab.se to view interim reports, annual reports,
share price graphs and press releases. For printed copies, please contact the company
by telephone on +46 10 476 60 00 or by e–mail at [email protected].
Year–end report
January–December 2014: February 2015

We have worked intensively
in 2013 to recruit and to
implement our new regional
organization. All the regional
managers are now in place
and I look forward to continuing this work in 2014.
Despite a slow start, we were able to demonstrate
a recovery in the autumn and we have grown in line
with our strategy. Sales have increased by 10% and the
number of employees by 17%. This growth has largely
been organic, as well as through the acquisition of DU
Teknik. DU Teknik works with operational manage-
ment and process management in the power industry.
In 2014, we will place our energy on further growth in
this area.
Our international operations continued during the
year to focus on managing and controlling projects in
progress. Most of the projects we are currently working
with are aid–related, and the funding agencies include
the World Bank, the Asian Development Bank, SIDA
and the EU. Our focus is mainly in Asia, Africa and
Eastern Europe. More than 40 years of experience in
international projects gives us a powerful reference
portfolio, which of course makes us strong, and we look
forward to continued growth in 2014.
In 2013, we took another step in our strategy to
improve the balance between public and commercial
clients. At year–end, the distribution was 60% public
sector clients and 40% commercial clients. Our long–
term target is to have 50/50. It is strategically important
that we have a balanced portfolio of clients to manage
the fluctuations that occur in the market.
This year's client survey revealed a stunning average
result of 3.4 (on a scale of 1–4). Our clients commented
particularly on our strengths, in that we deliver on time,
our expertise, that we are orderly and responsive, and
that our employees show great commitment.
We can proudly say that we have welcomed 100 new
employees during the year. We handle all recruitment
internally through our own recruitment resources. This
has been a successful solution, and is a core function to
manage our organic growth.
The market for 2014 looks cautiously positive and we
see continued opportunity to grow during the year. The
main growth areas are within our international ope-
rations and within the energy and infrastructure sectors.
I am now tying my bow around 2013 and looking
forward to the challenges of 2014!
REPORT BY THE CEO
Norra Länken, Stockholm
5
J E A N E T T E S AV E R O S , CEO, Hifab Group AB

6
Other project informationProject period: January 2013 – September 2014Financed by: The project is being financed with 3.5 MUSD from the Asian Development Bank (ADB)
Other project informationProject period: 2012–2015Financed by: The project is being financed with 1.6 MEUR by the Foreign Ministry of Finland
Nepal – Capacity expansion of ministry
of education
Hifab International and Hifab Oy are jointly opera-
ting a project for the ministry of education in Nepal.
The project is working to improve teacher training
and curricula for grades 6–10 in order to better prepare
students to meet labour market requirements. Hifab
has overall responsibility for this nationwide project,
and a project office has been established in Kathmandu.
INTERNATIONAL PROJECTS
Bangladesh – Feasibility study and design
of national road network
In Bangladesh, Hifab Roads and Highway Department
is helping to improve the national road network
capacity for efficient transport to both India and
Myanmar. Hifab’s mission encompasses both the
feasibility study and design of a total of 831 km of
roads. Cost estimates, plans for social and environ-
mental measures, and preparation of tender
documents are included.
The project is led by Hifab International and is
being implemented together with international
and local partners.
Phot
o: V
esa
Kurk
ela,
Hifa
b O
Y
Källa
: Nat
halie
Tra
nefe
ldt,
Hifa
b In
tern
atio
nal
Phot
o: N
atha
lie T
rane
feld
t, H
ifab
Inte
rnat
iona
l
66

Other project informationProject period: 2013 – 2014Financed by: The project is being financed with 1.9 MEUR from EU aid agencies together with Serbian ministries (Ministry of Labour, Employment and Social Policy and Ministry of Health)
Other project informationHifab’s mission: Assist Electricidade de Mozambique E.P with project management throughout the project with qualified technical personnelProject period: July 2012 – July 2016Financed by: The project is being jointly financed with 100 MUSD from the International Development Association (IDA), the European Investment Bank (EIB), Agence Française de Développement (AFD), OPEC Fund for International Development (OFID) and the Government of Mozambique (GoM)
Phot
o: V
esa
Kurk
ela,
Hifa
b O
Y
7
Mozambique – Power supply for 93,000
households
The project includes construction of substations,
transmission lines, a medium–voltage grid and
a low–voltage grid. It will provide around 93,000
households with electricity.
Serbia – Open arms
This project's very appropriate name is “Open arms”, and aims to create
favourable conditions for the social integration of the mentally ill. As part
of Serbia's progression towards the EU, the country wishes to implement
major reforms in this area.
Hifab’s mission is to help two ministries to transform existing mental
health institutions and to create conditions for a more integrated life,
including both living and working. Hifab is the project manager
and is working with around thirty international and local experts
who are active in the project.
77
8
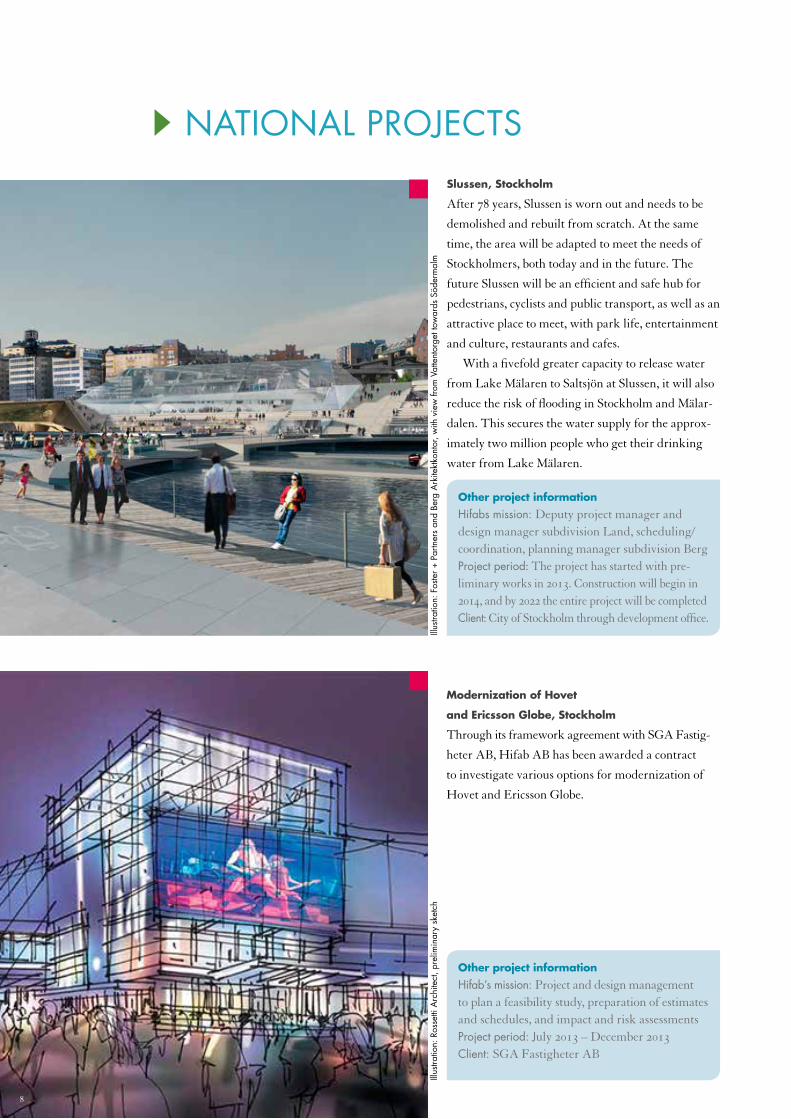
Slussen, Stockholm
After 78 years, Slussen is worn out and needs to be
demolished and rebuilt from scratch. At the same
time, the area will be adapted to meet the needs of
Stockholmers, both today and in the future. The
future Slussen will be an efficient and safe hub for
pedestrians, cyclists and public transport, as well as an
attractive place to meet, with park life, entertainment
and culture, restaurants and cafes.
With a fivefold greater capacity to release water
from Lake Mälaren to Saltsjön at Slussen, it will also
reduce the risk of flooding in Stockholm and Mälar-
dalen. This secures the water supply for the approx-
imately two million people who get their drinking
water from Lake Mälaren.
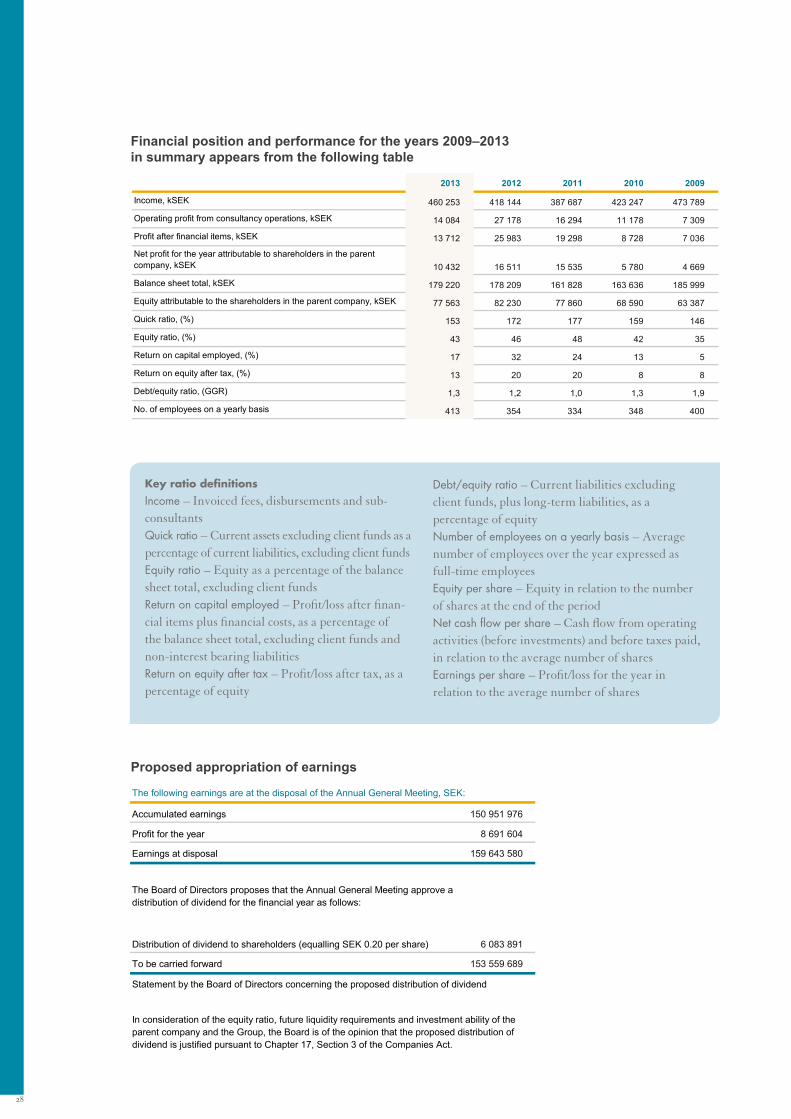
Modernization of Hovet
and Ericsson Globe, Stockholm
Through its framework agreement with SGA Fastig-
heter AB, Hifab AB has been awarded a contract
to investigate various options for modernization of
Hovet and Ericsson Globe.
Illus
tratio
n: F
oste
r + P
artn
ers
and
Berg
Ark
itekt
kont
or, w
ith v
iew
from
Vat
tent
orge
t tow
ards
Söd
erm
alm
NATIONAL PROJECTS
Illus
tratio
n: R
osse
tti A
rchi
tect
, pre
limin
ary
sket
ch
Other project informationHifab’s mission: Project and design management to plan a feasibility study, preparation of estimates and schedules, and impact and risk assessmentsProject period: July 2013 – December 2013Client: SGA Fastigheter AB
Other project informationHifabs mission: Deputy project manager and design manager subdivision Land, scheduling/coordination, planning manager subdivision BergProject period: The project has started with pre- liminary works in 2013. Construction will begin in 2014, and by 2022 the entire project will be completedClient: City of Stockholm through development office.
8

9
Uarda 1C neighbourhood, Arenastaden Solna
Building C is the third building to be constructed at the
Uarda 1 property in Solna. The building comprises app-
roximately 25,000 sqm and will primarily contain offices,
as well as a restaurant, café, conference hall and shops.
City Hall area, Umeå
The City Hall area in Umeå is being transformed.
The investment project includes the renovation and
conversion of approximately 500 sqm of office space,
a restaurant and the construction of approximately
3,000 sqm of office space.
Illus
tratio
n: W
hite
ark
itekt
er A
B
Illus
tratio
n: L
ink
arki
tekt
ur, M
ats
Thor
en
Other project informationHifab’s mission: Fire protection advice and planning from feasibility to tenant improvements, damp expertise and environmental soil testingProject period: October 2012 – December 2013 Client: Fabege AB
Other project informationHifab’s mission: Project management, controller and inspectionProject period: Started 2012, scheduled for completion in autumn 2014Client: Umeå Municipality
9

10
Manillaskolan Konradsberg, Stockholm
The major challenge in this project has been the
exceptional acoustic requirements set for the hearing
impaired to have the best potential for education.
This has meant a complete redevelopment of 3,800
sqm while the tenant has remained in the other areas.
Karlstad CCC, kongress & kulturcenter
Hifab has been tasked with environmental certification
of Karlstad CCC, one of Scandinavia's largest congress
and cultural buildings. The building is 25,000 sqm
and will be certified according to BREEAM In–Use,
which is an international environmental certification
for existing buildings.
Phot
o: K
arim
a W
icks
tröm
, Hifa
b
Phot
o: A
nder
s Ka
rlsso
n, H
ifab
Other project informationHifab’s mission: Design management from start of the project, and the entire project and construction managementProject period: 2011–2013Client: Akademiska Hus
NATIONAL PROJECTS
Other project informationProject period: Autumn 2013 – spring 2014Client: SPP

11
New construction of the University Hospital
in Linköping
The University Hospital in Linköping is taking a
comprehensive approach to the hospital’s development.
The future hospital must provide high quality health
care, opportunities for research and education, and a
good working environment. Their future building will
contribute to safe care, with effective care flows and
with the best interests of the patient always in mind.
The assignment includes construction of a building
of 7,500 sqm, a rebuild of 3,900 sqm, and ground and
road works for the affected areas. The newly construc-
ted building houses up to 200 workstations, group
and conference rooms, classrooms, wards, staff rooms,
rooms for IT technicians and a student kitchen.
The rebuild accommodates student kitchens,
archives, stores, workstations, equipment rooms,
entrances and elevators.
Decontamination of former dry cleaner, Linköping
This project is complex because the land area to be
decontaminated is populated with housing. The
decontamination has to be performed in the middle of
the residential area, and parts of the excavation will be
carried out under residential buildings that are piled
and situated on a slope down towards Stångån. This
makes it geotechnically very complicated.
Hifab conducted a main risk assessment of the area in
2008, and in 2011–2012 participated in the preparations.
NATIONAL PROJECTS
Pho
to: E
rik G
usta
vsso
n, H
ifab
Illus
tratio
n: C
arlst
edt A
rkite
kter
AB
Other project informationProject period: May – November 2013, environ-mental control and construction management during decontamination works.Project period: May 2011 – January 2013, planning and permit application for water activityClient: Linköping Municipality
Other project informationHifab’s mission: Construction managerProject period: June 2013 – February 2015Client: Östergötland County Council
11

12
Gothenburg Botanical Garden
Erection of new barnyard (supply building) and
school building. Hifab’s mission is project mana-
gement that encompass the establishment of
feasibility study reports for each building, describing
the requirements for business premises, functional
requirements and economic conditions. This is being
conducted in conjunction with user representatives
and other consultants.
New biofuel–fired power plant in Torsvik, Jönköping
The new plant will be powered with biofuels, and the
expansion secures availability of heat in a growing
network. The combined heat and power plant will
produce both heat and electricity simultaneously.
The planned output of the plant is approximately
110 MW, which annually provides approximately
340 GWh of district heating, nearly half of today's
heating needs in the network.
In connection with this, a new office building and
test station will be built adjacent to the combined heat
and power plant. The buildings total 7,300 sqm.
Phot
o: G
othe
nbur
g Bo
tani
cal G
arde
n 13
Illus
tratio
n: L
iljew
all A
rkite
kter
in G
othe
nbur
g
NATIONAL PROJECTS
Other project informationHifab’s mission: Inspection of contractors, PBL (Swedish Planning and Building Act) control-lers and building health and safety coordina-tion, BAS–U (construction work coordinator for performance of building and construction work)Project period: September 2013 – January 2015Client: Jönköping Energi
Other project informationProject period: From June 2013. Feasibility study report presented in October 2013Client: Västfastigheter

13
Inre Hamnen, Sundsvall
Sundsvall Municipality is conducting preparatory
ground works, street works and pipeline works
in Inre Hamnen in central Sundsvall. Work is being
carried out ahead of the construction of housing
in an attractive central location overlooking
Sundsvallsfjärden.
Hifab’s role in the project consists of project mana
gement and design management of the decontamination
works as part of the preparatory works. Hifab’s
project manager has made a detailed plan for soil
remediation and has led the design and preparation
of tender documents for the overall procurement of
works in the ground, street and pipeline fields. In the
execution phase, Hifab is responsible for the client's
environmental control.
Viggbyholm road junction, Täby
The interchange has its design from the days of driving on the
left, and must be rebuilt to meet current and future traffic flows.
The project also includes the improvement of pedestrian and
bicycle traffic in the area.
Hifab’s mission is to provide a construction management
organization, consisting of a main construction manager and
specialist expertise in bridges, geotechnical, road & traffic,
environmental, water and electrical engineering for initial
investment in a new bridge over the E18, and the rebuilding
of Bergtorpsvägen in connection with the new bridge.
The contract is being carried out as a turnkey contract and
covers demolition of the existing bridge and the construction of
road infrastructure for road E18 at the Viggbyholm junction.
The main contractor is SVEAB.
Phot
o: S
tefa
n N
ordh
, Hifa
b
Phot
o: H
ifab
Other project informationProject period: 2012–2015Client: Sundsvall Municipality
Other project informationProject period: June 2013 – June 2015Client: Swedish Transport Administration
13

14
HIFAB EXPANDS ITS PORTFOLIO
H ifab's strengthened and supp-
lemented its expertise in energy
and process technologies when
it acquired DU Teknik AB on
March 1.
Hifab DU Teknik AB operates primarily within
the power industry, where we help to build or modernize
facilities. We perform assignments with great breadth.
These may include acting as site manager for new
buildings, coordinator in shared construction projects,
commissioner for new power plants, environmental
and financial optimization, operational and main-
tenance management, operations technicians, shift
engineers etc. in an operating organization.
The operational school at Hifab DU Teknik provides
comprehensive training activities adapted for heating
and combined heating and power plants.
Other project informationProject period: 2011–2013 assist with skills in commissioning, operation and development of the carbon capture system. 2012–2014 staffing of site manager.Client: Alstom Power CCS (world leader in carbon capture using ammonia–based technology)Alstom has for a very long time taken an active role in emissions reduction, and Hifab DU Teknik has participated in this work. This work has resulted in environmental improve- ment worldwide, improved finances, better process control and reduced energy losses.
Phot
o: T
CM
DA
Technology Centre Mongstad, Norway
Technology Centre Mongstad (TCM) is the largest
carbon capture plant in operation, and is a vital com-
ponent in the development of the technologies needed
to reduce the total human emissions of pollutants on
a global scale. One of the stated objectives of TCM is
to evaluate all commercially available technology and
thereby facilitate future investment.
The total investment in this development facility is
over NOK 7 billion. Hifab DU Teknik’s mission is to
manage, plan and staff the commissioning, and to set
up the operational organization of the supplier.
14

15
Web-shops touch-down
Solutions for virtual business are being integrated at
the construction process into future business centres.
With shopping behaviour constantly changing, and
steady progress in digitalization, there are large gains
to be made for property owners that keep up with
developments. In a world where the line between
digital and physical stores has become blurred, Virtual
Market is an initiative to build the optimal conditions
for online stores to expand into physical venues.
Behind Virtual Market is Sweden’s largest project
management company, Hifab, and Artspace Group, a
specialist in omni–channel retailing trends.
The role of Virtual Markets is to provide support
within a single offering, with independent knowledge
of consumers’ physical and virtual shopping environments.
This may include virtual restaurants, with meetings
without physical boundaries, a physical branch of an
online store, or a digital branch of a physical store on
the other side of the world. Concepts and solutions are
tailored to each marketplace’s needs and circumstances.
The rapid development of e–commerce requires
innovation and new business models if the real estate
industry is to keep up with the future.
SERVICES – VIRTUAL MARKET
Hifab expanding in local plan-
ning. In April 2013, we had
the opportunity to take over
six project managers from the
company Struktur. We have
now hired two additional project managers and have
employees with these skills in Stockholm, Gothenburg
and Malmö. We feel that property owners often
have a challenge in getting their tenants to define
their requirements in our projects. Backed by this
expertise within local planning, Hifab can now assist
both property owners and tenants to assure our
projects through all phases. Synergies are also seen in
our common client base and the ability to undertake
more extensive local development projects. We are
involved in the entire chain, from performing needs
analysis and feasibility studies for tenant improve-
ments, interior design and moving logistics to all
support and communication related to the projects.
With great understanding of both the property
owner’s and the tenant’s needs, lease content and all
of the elements included in a restart or new–start, we
create peace of mind for both parties.
The client may be a property owner who wants
to support prospective and existing tenants in their
local project, or a tenant who wants professional help
regarding leases, tendering and other processes to fill
the premises with the right content.
In photo: Katja Bolander, Project Manager and
Marketing Manager, Hifab

16
Hifab's vision – As a partner to
our clients we are at the forefront
in a changing society. Our vision
is to commit to securing a sustai-
nable society, from environmental,
social and economic aspects. The path to achieving our
vision is our business concept, with committed mana-
gement and committed employees. This is very much a
natural part of our company.
Our business concept – Hifab offers project manage-
ment and advisory services for sustainable development.
Hifab’s own quality assurance and environmental
work has been conducted actively for many years, and
we have been ISO 9001 certified since 1996 and ISO
14001 certified since 2001.
Over the years, Hifab’s quality and environmental
objectives have been clarified and refined, and we
implement continuous improvement of our certified
business systems. We have taken many steps towards
being a more sustainable company.
At least 20% of our consultants work with specialized
environmental services. All of our project managers
have received training in environmental governance of
their projects. This is something we are proud of, and it
ensures that all of our other services in the Group
maintain the quality and meet the sustainability require-
ments that both society and our clients expect.
Hifab has increased its involvement in the Sweden
Green Building Council, SGBC, during the year.
Managing Director Jeanette Saveros sits on the board,
and we have been contracted to develop and coordinate
BREEAM in Sweden.
Building a sustainable business consists of three
pillars, of which the environment is just one. The other
two are social and economic. We actively work to take
care of, and protect, our employees, and to run a profit-
able business. This forms the foundation that allows us
to be sustainable as a company.
We have produced a sustainability report for 2013.
Hifab’s sustainability work is reported in accordance
with the guidelines of the Global Reporting Initiative
(GRI), GRI version 3.1, application level C.
WE ARE BUILDING A SUSTAINABLE COMPANY
Phot
o: R
icha
rd L
agbe
rg, H
ifab
16

17
kSEK
500000
450 000
400 000
350 000
300 000
250 000
200 000
150 000
100 000
50 000
0
450
400
350
300
250
200
150
100
50
0
2013 2012 2011 2010 2009
2013 2012 2011 2010 2009
INCOME Sweden Internationally kSEK
30 000
25 000
20 000
15 000
10 000
5 000
0 2013 2012 2011 2010 2009
OPERATING PROFIT, CONSULTANCY OPERATIONS
NUMBER OF EMPLOYEES ON A YEARLY BASIS
Five-year summary; Hifab Group2013 2012 2011 2010 2009
INCOME STATEMENT, kSEK
Income 460 253 418 144 387 687 423 247 473 789
Operating profit from consultancy operations 14 084 27 178 16 294 11 178 7 309
Profit after financial items 13 712 25 983 19 298 8 728 7 036
Taxes -3 280 -9 472 -3 522 -2 984 -1 762
Profit for the year attributable to shareholders in the parentcompany 10 432 16 511 15 535 5 780 4 669
BALANCE SHEET, kSEK
Non-current assets 28 264 20 526 29 742 25 465 27 664
Current assets 150 956 157 683 132 086 138 171 158 335
Equity attributable to shareholders in the parent company 77 563 82 230 77 860 68 590 63 387
Minority interests 44 44 44 1 423 1 663
Long-term liabilities 2 956 4 159 9 204 6 640 12 841
Current liabilities 98 657 91 776 74 720 86 983 108 108
Balance sheet total 179 220 178 209 161 828 163 636 185 999
Photo: Daniel Glatz, HifabSweden Internationally
Five-year summary, Hifab Group

18
In 2013, we have purposefully continued to
attract and recruit new employees, and to
retain existing employees. This is supported
by our internal resource management
department in collaboration with the
marketing function. This year we have reduced staff
turnover by 2%.
During the year we appointed a number of regional
managers to better monitor the regional markets, and
to make employees feel a stronger regional belonging
and closeness to their managers.
The number of employees in the Group at year–
end, including the international operations, was 413
(354), an increase of 59 compared with 2012.
Of the year’s employees, 280 (237) were male and
133 (117) female.
The number of permanent employees in Sweden
at year–end was 312 (290.)
H I FA B ’ S C O R E VA L U E S A N D
C O R P O R AT E C U L T U R E
Hifab’s core values are:
Professionalism, which means that we examine
the entire business of our clients, act as a seller
and evaluate our delivery.
Collaboration, which means that we create trust
and transparency, feel a sense of pride and are
loyal to each other.
Commitment, which means that we take active
responsibility, we are ground–breaking and we
have the courage to carry through our promises
and explore new paths.
In order to build a foundation of the core values that
will be reflected in our behaviour towards our clients
and each other, we conduct two block courses for new
recruits within our training operations, which we call
Hifab Pro. Hifab’s business concept, targets and core
values are recurring elements in both our internal and
our external communication. Of those who completed
the employee survey in 2013, 86% said that they use
Hifab’s core values in their day–to–day actions to a very
high or high degree.
Development as a project manager is one of the
most important career paths at Hifab. More prestigious
and larger projects, with higher standards, not only
build up an employee’s resume, but also open up the
potential for larger projects with our clients. We have
therefore developed a career ladder for consultants at
Hifab, which sets out the opportunities for professio-
nal development within the company.
E M P L O Y E E B R A N D I N G
Our aim is to become more visible in the labour market.
Hifab participates in career days to improve its
profile among students and those generations that are
entering the industry. Hifab offers opportunities for a
career and for personal development on several levels.
We train those individuals that we consider suitable
for the role of line manager, and the majority of line
manager positions in the company are filled internally
in this way. This provides a continuity of generational
change and strengthens our corporate culture. Our
internal training also aims to gradually enhance the
capabilities of employees on assignments.
E M P L O Y E E S U R V E Y
From 2013, Hifab conducts an annual employee survey
of all staff in Sweden to measure the working climate,
collaboration and leadership, and to assess employees’
overall opinion of the company. This year's survey,
conducted in spring 2013, showed that the number of
EMPLOYEES
Junior Consultant
Assistant Consultant
Experienced Consultant
Senior Consultant
Consultant
Hifab’s career ladder Level require-ments are based largely on the requirements of our clients for our employees in consulting and project manager roles.

19
satisfied employees was 82% (77%) and the leadership
index, i.e. confidence in an employee’s immediate
manager, was 78% (83%). Both of these results are
positive indices for the industry. Our employees are
keen to talk about why they are happy at Hifab. Some
of the main reasons are:
Being able to participate in large and
interesting projects
Good professional development linked to
the career ladder
High level of responsibility
High ceilings
Good leadership
Opportunities to work abroad
Time off between Christmas and New Year,
and shortened working hours in the form of
a personal time bank
Collective bargaining agreements
It’s fun to go to work
A G E D I S T R I B U T I O N
Traditionally, a large proportion of employees at
Hifab have been middle–aged, with approximately
10–15 years of experience in roles as project managers
or consultants. Today, it is not only necessary to find
new employees further down the age groups, but
it is at least as important to retain those who reach
retirement age for another few years. The combi-
nation of younger and older employees allows for
on–the–job training, which is appreciated by both
categories. This is also often something that major
clients demand, especially in long–term projects.
Key figuresNumber of permanent employees in Sweden at year–end: 312 (290)
Management recruitment: – internal recruitment 44%– external recruitment 56%
Equality:– women in management positions 7%(as proportion of number of women in company)– men in management positions 14%(as proportion of number of men in company)
Average age: 45
In photo: Johan Liderfors, Senior Project Manager, Hifab
> 66 years 2%
8%
9%
12%
12%
16%
14%
15%
7%
61–65 years
56–60 years
51–55 years
46–50 years
41–45 years
36–40 years
31–35 years
20–30 years
Age distribution %

20
We have been able to welcome
many new employees this
year. This demands that, as a
company, we have a strategic
plan for how we provide a
good introduction for our new employees. We recruit
employees from many parts of the industry, such as
contractors, designers and property owners. The in-
troduction to what Hifab stands for as a company, and
how we work as consultants, is important.
Leadership succession is critical in a consulting
company, and our two–year Hifab Leadership
Programme for Potential Leaders (HLP) started with
a new group in 2013. This places a focus on Hifab’s
business operations, management and leadership in
practice. Participants also have a great opportunity to
work in close dialogue with the management to develop
Hifab as a company.
Our Hifab Pro school of expertise is linked to our
competence ladder to ensure that employees receive
excellent professional development, regardless of their
experience. Most of our courses take place internally to
promote interaction and collaboration within the Group.
Our ambition is to always try to offer all employees
the necessary training to be competitive in the market,
and, of course, to be the best advisors for our clients.
If our clients or employees value a high level of profes-
sional development, they have come to the right place.
THE HIFAB WAY
Construction site at Nya Karolinska, Solna

21
In p
hoto
: Olle
Cyr
én, C
OO
Sca
ndin
avia
, Hifa
b

22
Data per share before and after dilution1) 2013 2012 2011 2010 2009 2008 2007 2006
Average number of shares 30 419 456 30 419 456 30 419 456 30 419 456 30 419 456 20 269 456 10 013 456 9 271 456
Number of shares at year-end 30 419 456 30 419 456 30 419 456 30 419 456 30 419 456 30 342 596 10 119 456 9 271 456
Earnings per share attributable to shareholders in parentcompany, SEK 0,34 0,55 0,51 0,19 0,15 0,79 0,27 -1,52
Net cash flow per share, SEK -0,46 0,82 0,48 0,31 0,08 1,98 1,72 -0,60
Equity per share, SEK 2,55 2,70 2,55 2,25 2,09 2,03 12,08 11,52
Dividend per share as proposed by the Board, SEK 0,20 0,50 0,40 0,20 - - 6,00 -
Market value at year-end, SEK 7,90 6,70 4,20 4,34 3,90 3,12 7,30 10,30
The years 2006-2013 are accounted for or translated in accordance with IFRS.1) Profit/loss from operations in the stage of wind-up are separately accounted for in the years 2006 and 2007. Earlier years are not separately accounted for.The financial year 2008 is not comparable, as the Group was restructured through a reverse acquisition.
THE HIFAB GROUP SHARE
Development of the share capital
Share price performance
Data per share before and after dilution 1)
Development of the share capitalDevelopment of the Hifab Group share since 1998
Year Transaction Share capital No. of shares
1998 Directed issue 704 000 7 040 000
1999 Directed issue 719 000 7 190 000
1999 Exercise of warrants 779 000 7 790 000
2000 Directed issue 799 146 7 991 456
2000 Directed issue 927 146 9 271 456
2007 Directed issue 1 011 946 10 119 456
2008 Directed issue related to reverse acquisition 3 034 259 30 342 596
2009 Directed issue related to reverse acquisition 3 041 946 30 419 456
SEK10
9
8
7
6
5
4
3
2
1
02009 2010 2011 2012 2013
Class of share
Number of shares
% of capital
% of voting rights
Serie A 781 333 2,57 20,86
Serie B 29 638 123 97,43 79,14
T H E S H A R E
The Hifab share is traded on the First North
exchange. Share capital amounts to SEK 3 041 946,
distributed among 30 419 456 shares. The nominal
value of a share is SEK 0.10.
One A class share holds ten voting rights, and one
B class share holds one voting right. An A class share
can be converted into a B class share upon application
to the company’s board of directors. The distribution
of A class shares and B class shares is shown below:
O W N E R S H I P
The five largest shareholders together accounted for
67.29% (67.10) of capital and 64.73%(64.58) of the
voting rights on 30 December 2013.
Foreign holdings amounted to 0.67% (0.79) of the
shares and 0.54% (0.64) of the voting rights.
D I V I D E N D S
The Board of Directors proposes that the Annual
General Meeting approve a dividend of SEK 0.20 for
the financial year 2013.

23
Major shareholders
Shareholders registered by Euroclear Sweden AB 2013-12-30 A-shares B-shares Holding (%)Voting
rights (%)
AB TRACTION 100 000 14 447 057 47,82 41,24
NIVEAU HOLDING AB 319 333 1 775 497 6,89 13,27
HANS WALDAEUS ANLÄGGNING AB 0 1 400 172 4,60 3,74
JAN BOIJA MANAGEMENT AB 0 1 251 257 4,11 3,34
NORDNET PENSIONSFÖRSÄKRING AB 0 1 176 757 3,87 3,14
LÄNSFÖRSÄKRINGAR FONDFÖRVALTNING AB 0 1 012 022 3,33 2,70
P-O ANDERSSON I ÄNGELHOLM AB 362 000 138 666 1,65 10,04
ZIRKONA AB 0 500 000 1,64 1,34
ESILENTIO AB 0 470 280 1,55 1,26
SKANDIA, FÖRSÄKRINGS AB 0 364 339 1,20 0,97
10 major shareholders 781 333 22 536 047 76,66 81,04
Total other owners 0 7 102 076 23,34 18,96
Total as at 2013-12-30 781 333 29 638 123 100,00 100,00
Major shareholders
Owner structureOwner structure
Shareholding acc. to Euroclear Sweden AB 2013-12-30No. of
shareholdersNo. of
A-sharesNo. Of
B-sharesShareholding
(%)Voting
rights (%)
1 - 500 940 0 204 771 0,67 0,55
501 - 1 000 262 0 239 515 0,79 0,64
1 001 - 2 000 160 0 270 466 0,89 0,72
2 001 - 5 000 154 0 561 315 1,85 1,50
5 001 - 10 000 65 0 495 805 1,63 1,32
10 001 - 20 000 40 0 571 333 1,88 1,53
20 001 - 50 000 26 0 818 396 2,69 2,19
50 001 - 100 000 12 0 811 437 2,67 2,17
100 001 - 500 000 18 0 4 463 657 14,67 11,92
500 001 - 1 000 000 1 362 000 138 666 1,65 10,04
1 000 001 - 7 419 333 21 062 762 70,62 67,44
Total 1 685 781 333 29 638 123 100,00 100,00
Photo by: Christopher Kronwall, Hifab.

Road work construction,
Sjöviksbacken, Årstadal
A D M I N I S T R AT I O N R E P O R T
The Board of Directors and the CEO of Hifab Group
AB (publ), corporate identity number 556394–1987,
with its registered office in Stockholm, hereby present
the annual report and the consolidated financial state-
ments for the financial year 2013-01-01 – 2013-12-31.
B U S I N E S S C O N C E P T
Hifab provides project management and advisory
services for sustainable development.
O W N E R S H I P
Hifab Group AB is listed on Nasdaq OMX First North.
At year–end 2013, Hifab Group AB had 1 685 (1 768)
shareholders according to the official register of sharehold-
ers held by Euroclear Sweden AB. For more detailed in-
formation of Hifab Group AB’s ownership, please refer
to the Hifab Group Share section on Pages 22–23.
O R G A N I Z AT I O N I N 2 0 1 3
The parent company of the Group is Hifab Group AB.
Group–wide functions, including finance, administration,
information and market communication, etc., are
managed by the subsidiary HifabGruppen AB.
Hifab Group AB has one operational subsidiary
group. The major competence of the Group is project
management. The largest proportion of the Group’s
sales is attributable to the construction and civil
engineering sector. International development projects
around the world have also been an important part
of Hifab’s operations for more than 40 years.
Hifab is also a leader in Sweden for advisory
services and environmental project management.
The subsidiary groups are:
Hifab Finans AB, which is the owner of three companies:
HifabGruppen, which manages group–wide
staff functions.
Hifab AB, which conducts project management
in construction, civil engineering and environ-
mental projects in Sweden. Hifab AB has an
operational subsidiary group, Hifab DU Teknik
AB, which operates in process technology.
Hifab International AB is operationally responsible
for assignments financed by international de-
velopment banks or development agencies and
has an operational subsidiary group in Finland,
Hifab Oy.
O V E R A L L TA R G E T S
The overall financial target of the Group is to achieve
a profit margin of 7% on sales over a business cycle.
Each of the companies and departments has its
individual profit targets in combination with clear
objectives in marketing, the environment, quality and
personnel development.
Equity refers to shareholders’ equity and borrowed
capital. The Group’s target for administration of
capital is to safeguard the continued existence and
freedom of action of the Group and to ensure that
shareholders continue to receive a return on their
investment. The allocation between shareholders’
equity and borrowed capital shall ensure an adequate
balance between risk and return.
Where appropriate, the capital structure may be
adapted to changes in economic conditions and other
external factors. In order to maintain, or adapt, the capital
Administration Report
24

25
structure, the Group may distribute dividends, increase
equity through issuance of new shares or through share-
holder’s contributions, and reduce or increase debt. The
consolidated debt and equity appear in the Statement
of financial position. The various components included
appear in the Statement of changes in equity.
T H E M A R K E T
Hifab is Sweden’s market leader in project manage-
ment, and maintains a nationwide office network.
The order situation during the year was stable, and
prospects for 2014 are good. Hifab has been able to
maintain an inflow of orders in the operations
corresponding to processed volumes.
We estimate that the market for the Group will
remain good in 2014. With 18 offices, we are able
to deliver our services to clients nationwide. Our
internationally–based aid–financed projects are not
sensitive to fluctuations in the economy, and capital
flow to the various aid agencies in the world continues
to increase year on year. Our assessment is that this
trend will continue in the foreseeable future.
A C Q U I S I T I O N S
In March 2013, DU Teknik AB was acquired as part of
the Group’s strategic focus to complement the offering
of services in process technology.
C O N S O L I D AT E D I N C O M E
A N D E A R N I N G S
Consolidated income amounted to SEK 460 (418)
million, an increase of 10.1%. Operating profit was
SEK 14.1 (27.2) million. Operating expenses increased
by SEK 27.6 million (17.7%), which is attributable to
the increase in sales in the international operations.
Consolidated earnings after financial items for the
year amounted to SEK 13.7 (26.0) million. Earnings
per share amounted to SEK 0.34 (0.55).
C A S H F L O W A N D F I N A N C I A L P O S I T I O N
Cash and cash equivalents, including credits facilities,
amounted to SEK 63.2 (77.2) million at 31 December
2013. Interest–bearing liabilities amounted to 3.4
(5.0) million, and at year–end the interest–bearing
net assets of the Group amounted to SEK 39.8 (52.2)
million. The equity ratio was 43 (46)%. Consolidated
equity including minority interests amounted to SEK
77.6 (82.3) million. Cash flow from operating activities
before changes in working capital amounted to SEK
9.5 (26.5) million for the year, and changes in working
capital amounted to SEK 4.2 (15.8) million. Cash flow
from investing activities during the period amounted
to a net of SEK –11.0 (–3.5) million, which is largely
attributable to the acquisition of DU Teknik AB. Cash
flow from financing activities amounted to SEK –16.8
(–13.8) million, including amortization of SEK 1.6
million and distribution of dividends in the amount of
SEK 15.2 million.
C O N S U L TA N C Y O P E R AT I O N S
The planning of consultancy operations is focused on
growth and expansion, mainly in existing geographi-
cal and specialist areas.
Hifab AB provides professional project manage-
ment services in the building, construction, environ-
ment, energy, real estate and process technology
sectors, with the objective of maximizing the profita-
bility of the client’s operations.
Hifab AB is represented in Sweden through 18
offices. The operations had sales of SEK 345 (321)
million, with earnings after distribution of common
costs of the Group, and after financial items, of SEK
9.4 (25.1) million. There were 295 (249) employees.
Hifab International AB provides professional
project management services in international deve–
lopment projects, financed mainly by international
development banks and development agencies.
Hifab Oy in Finland is a wholly–owned subsidiary.
The operations had sales of SEK 118 (85) million
and reported earnings after distribution of common
costs of the Group, and after financial items, of SEK
2.7 (–3.3) million. Most of the year’s sales were invoi-
ced abroad. There were 95 (72) employees in Sweden
and internationally.
E N V I R O N M E N T
Hifab AB is environmentally certified according to ISO
14001. The certification involves working actively to
promote environmentally–friendly travel management,
consumption, purchases, and use of energy. The overall
targets, as well as local targets, are identified and followed
up twice a year through audits and management re-
views of the system.

26
T H E W O R K O F T H E B O A R D O F
D I R E C T O R S I N 2 013
The Directors of the Board of Hifab Group AB were
elected in May 2013. The Board is composed of six
members. Anders Eriksson was re–elected Chairman
of the Board. Jan Skoglund and Agneta Jacobsson were
elected as new members of the Board. Other members
of the Board were Bengt Stillström, Carina Edblad and
Hans Waldaeus. Hellen Wohlin Lidgard resigned from
the Board at the Annual General Meeting. Employee
representatives were Denise Lucas, representing Unio-
nen, and Elin Pirard and Ebba Wadstein, representing
Sveriges Ingenjörer. Deputies were not elected.
In 2013, the Board held five meetings, documented
by minutes, including the statutory meeting. The
Board has performed its work in accordance with the
established annual plan. The auditor of the company
attended the meeting at which the year–end financial
statements were presented.
D I V I D E N D
The proposed dividend for the financial year 2013 is
SEK 0.20 (0.50), corresponding to a total of SEK 6.1
(15.2) million.
R I S K S
Risks and risk management
All business operations are exposed to a certain
amount of risk. Hifab’s operations are exposed to
several risk factors, some of which are within the
control of the company, while other risks are beyond
its control. The following is not a comprehensive
account of risk factors, nor are the risks ranked accor-
ding to their level of significance. Risks are classified
as market risks, operational risks, insurable risks,
financial risks, and currency risks.
Market risks
The operations of the Group are exposed to general
economic trends, which have a great impact on the
willingness and ability of private companies to make
investments. A significant proportion of sales are
made to public–sector clients, and political decisions
may have an impact on the business opportunities
of the Group.
Operational risks
The operational risks of the Group are mainly related
to client and supplier relationships and can, for
example, relate to the payment capacity of a client,
or the reliability and quality of a supplier. Reviews
are regularly conducted to assess the business risks
involved in these relationships.
Insurable risks
Hifab Group AB maintains customary insurance
coverage for the Group for property damage and
liability risks.
Financial risks
The parent company coordinates liquidity planning
and complies with the financial policy resolved by
the Board.
Financial risk factors
The operations of the Group are exposed to various
financial risks, such as market risks (including currency
risks, interest–rate risks, and price risks), credit risks,
and liquidity risks. The financial risks of the parent
company are the same as those of the Group.
Interest–rate risk
Interest–rate risk is the risk of fluctuations in the
value of financial instruments due to changes in
market interest rates. On the reporting date, the
interest–bearing net assets of the Group amounted to
SEK 39,835 thousand.
Credit risks
A credit risk is the risk that a party to a financial
instrument transaction will be unable to honour its
commitment. The majority of Hifab Group’s key
clients in continuing operations are large and finan-
cially sound. New clients are subject to credit checks.
In our assessment, there are no major risks from the
concentration of credit, whether geographically or in
a particular client segment.
Liquidity risk
Prudent management of liquidity risks means main-
taining access to sufficient cash and cash equivalents,
or, alternatively, to contractual credit facilities to

Preconstruction research Photo: Daniel Glatz, Hifab
enable closing of market positions. At present the
liquidity risk is assessed to be reasonably low.
Fair values
The carrying amount of all financial assets and
financial liabilities of the Group equals the fair value.
All financial assets of the Group are classified as
trade receivables and loan receivables, and financial
liabilities are classified as financial liabilities measured
at accrued cost.
The target for the capital structure of the Group is
to safeguard the capacity of the Group to continue its
operations for the purpose of generating a return for
shareholders, for the benefit of other stakeholders,
and to maintain an optimal capital structure to keep
capital costs low. The measures available to the Group
to adjust the capital structure include distributions
of dividends to shareholders, redemption of shares,
issuance of new shares, or divestment of assets.
Currency risks
Contracts with international clients are predominant-
ly prepared in EUR or USD. Our policy requires that
expenses and income shall as far as possible be deno-
minated in the same currency. Anticipated currency
surpluses are hedged on an ongoing basis.
Disputes
In 2010, Hifab Group AB received a lawsuit from the
bankruptcy estate of a former subsidiary. For further
information, please refer to Notes 22 and 27.
C O M PA N Y O U T L O O K
The assessment for 2014 is a continued strong
economic trend in Hifab’s market segments, both in
Sweden and internationally. Both public and private
investments are expected to increase. There is a
substantial need for improvement and renovation of
homes in the so–called Million Programme, and for
infrastructure in Sweden.
Attracting new employees is a success factor. Organic
growth is an element in the operational planning of
each individual profit centre. We are also actively
seeking add–on acquisitions.
E V E N T S O C C U R I N G A F T E R
T H E R E P O R T I N G D AT E
Hifab International has signed a contract for the
Coastal Climate Resilient Infrastructure Project in
Bangladesh. The project aims to build climate–proof
infrastructure in the south of the country, and is
co–financed by the Asian Development Bank, the
International Fund for Agricultural Development
and the German KfW Development Bank. The total
contract volume is USD 7.5 million, and the project
duration is five years. Hifab is implementing the project
together with one international partner and three
local partners.
Per Ångquist joines Hifab in May as the new busi-
ness manager. He has in recent years been head of the
marketing organization at WSP Sverige. Per will join
Hifab Group AB’s group management, and this strategic
recruitment is part of Hifab’s growth strategy.
27
28
Proposed appropriation of earningsThe following earnings are at the disposal of the Annual General Meeting, SEK:
Accumulated earnings 150 951 976
Profit for the year 8 691 604
Earnings at disposal 159 643 580
The Board of Directors proposes that the Annual General Meeting approve adistribution of dividend for the financial year as follows:
Distribution of dividend to shareholders (equalling SEK 0.20 per share) 6 083 891
To be carried forward 153 559 689
Statement by the Board of Directors concerning the proposed distribution of dividend
In consideration of the equity ratio, future liquidity requirements and investment ability of theparent company and the Group, the Board is of the opinion that the proposed distribution ofdividend is justified pursuant to Chapter 17, Section 3 of the Companies Act.
Nyckeltalsdefinitioner – finansiell ställning
Financial position and performance for the years 2009–2013in summary appears from the following table
Proposed appropriation of earnings
Financial position and performance for the years 2009-2013in summary appears from the following table
2013 2012 2011 2010 2009
Income, kSEK 460 253 418 144 387 687 423 247 473 789
Operating profit from consultancy operations, kSEK 14 084 27 178 16 294 11 178 7 309
Profit after financial items, kSEK 13 712 25 983 19 298 8 728 7 036
Net profit for the year attributable to shareholders in the parentcompany, kSEK 10 432 16 511 15 535 5 780 4 669
Balance sheet total, kSEK 179 220 178 209 161 828 163 636 185 999
Equity attributable to the shareholders in the parent company, kSEK 77 563 82 230 77 860 68 590 63 387
Quick ratio, (%) 153 172 177 159 146
Equity ratio, (%) 43 46 48 42 35
Return on capital employed, (%) 17 32 24 13 5
Return on equity after tax, (%) 13 20 20 8 8
Debt/equity ratio, (GGR) 1,3 1,2 1,0 1,3 1,9
No. of employees on a yearly basis 413 354 334 348 400
Nyckeltalsdefinitioner – finansiell ställningKey ratio definitionsIncome – Invoiced fees, disbursements and sub-consultants Quick ratio – Current assets excluding client funds as a percentage of current liabilities, excluding client funds Equity ratio – Equity as a percentage of the balance sheet total, excluding client funds Return on capital employed – Profit/loss after finan-cial items plus financial costs, as a percentage of the balance sheet total, excluding client funds and non-interest bearing liabilities Return on equity after tax – Profit/loss after tax, as a percentage of equity
Debt/equity ratio – Current liabilities excluding client funds, plus long-term liabilities, as a percentage of equity Number of employees on a yearly basis – Average number of employees over the year expressed as full-time employees Equity per share – Equity in relation to the number of shares at the end of the period Net cash flow per share – Cash flow from operating activities (before investments) and before taxes paid, in relation to the average number of shares Earnings per share – Profit/loss for the year in relation to the average number of shares

29
In p
hoto
: And
ers
Will
ner,
Seni
or P
roje
ct M
anag
er, H
ifab
29

30
Consolidated income statementkSEK Note 2013 2012
OPERATING INCOME
Income 460 253 418 144
Other operating income 1 508 820
Total 460 761 418 964
OPERATING EXPENSES
Other external expenses 2 -182 993 -155 369
Salaries and personnel 3 -262 500 -234 222
Depreciation 11, 12 -1 184 -2 195
Total -446 677 -391 786
Operating profit 14 084 27 178
PROFIT/LOSS FROM FINANCIAL ITEMS
Profit/loss from participations in Group companies 4 - -
Profit/loss from participations in associated companies - -136
Profit/loss from securities classified as non-current assets - -
Interest income and similar income statement items 5 162 495
Interest expenses and similar income statement items 6 -534 -1 554
Total financial income and expenses -372 -1 195
Profit after financial items 13 712 25 983
Tax on profit for the year 7 -3 280 -9 472
Net profit for the year 10 432 16 511
Profit for the year attributable to shareholders in the parent company 17 10 432 16 511
Minority shareholders - -
10 432 16 511
Earnings per share calculated on profit for the year attributable to shareholders in the parentcompany (SEK per share) 17 0,34 0,55
THE GROUPConsolidated income statement
Statement of consolidated comprehensive income2013 2012
Net profit for the year 10 432 16 511
Components that may later be reclassified to profit and loss for the year:
Exchange rate differences from translation of foreign operations 142 36
Tax attributable to components of other comprehensive income -31 -9
Total other comprehensive income for the year, net after tax 111 27
Total comprehensive income for the year 10 543 16 538
Total comprehensive income attributable to:
Shareholders in the parent company 10 543 16 538
Minority shareholders - -
10 543 16 538
Earnings per share calculated on comprehensive income attributable to shareholders in theparent company (SEK per share) 0,34 0,55
Earnings per share calculated on comprehensive income for the year attributable to minorityowners in the parent company (SEK per share) 0,00 0,00
Statement of consolidated comprehensive income

31
Statement of consolidated financial positionkSEK Note 2013-12-31 2012-12-31
ASSETS
INTANGIBLE ASSETS
Goodwill 10 15 954 6 148
Total intangible non-current assets 15 954 6 148
TANGIBLE NON-CURRENT ASSETS
Equipment 11, 12 2 826 2 272
Total tangible non-current assets 2 826 2 272
FINANCIAL NON-CURRENT ASSETS
Other long-term holding of securities 8, 14 194 194
Deferred tax asset 7 9 290 11 912
Total financial non-current assets 9 484 12 106
Total non-current assets 28 264 20 526
CURRENT ASSETS
Work in progress, not yet invoiced 15 21 809 13 601
Advance payments to suppliers 5 070 3 811
Total work in progress 26 879 17 412
CURRENT RECEIVABLES
Trade receivables 8, 9 63 222 70 164
Tax asset 7 817 3 538
Other receivables 8 828 1 960
Prepaid expenses and accrued income 8, 16 8 975 7 440
Total current receivables 80 842 83 102
Cash and cash equivalents 8, 19 43 235 57 169
Total current assets 150 956 157 683
Total aggregate assets 179 220 178 209
THE GROUPStatement of consolidated financial position

32
Statement of consolidated financial position, cont.kSEK Note 2013-12-31 2012-12-31
EQUITY AND LIABILITIES
EQUITY
Share capital 18 3 042 3 042
Other capital contribution 1 109 1 109
Translation reserve 767 656
Retained earnings including profit for the year 72 645 77 423
Total equity attributable to shareholders in the parent company 77 563 82 230
Minority portion of equity 44 44
Total equity 77 607 82 274
LONG-TERM LIABILITIES
Liabilities to credit institutions 8, 20 1 800 3 400
Deferred tax liability 7 773 759
Other long-term liabilities 8, 20 383 -
Total long-term liabilities 2 956 4 159
CURRENT LIABILITIES
Liabilities to credit institutions 8, 20 1 600 1 600
Advance payment from customers 8, 20 12 975 9 693
Trade liabilities 8, 20 23 332 25 972
Other current liabilities 8, 20 18 792 18 741
Accrued expenses and deferred income 8, 21 41 958 35 770
Total current liabilities 98 657 91 776
Total equity and liabilities 179 220 178 209
Contingent liabilities 22 41 446 40 132
THE GROUP
Key ratio per shareNote 2013-12-31 2012-12-31
Number of shares at year-end 17 30 419 456 30 419 456
Equity, SEK 2,55 2,70
Distribution of dividend as proposed by the Board, SEK 0,20 0,50
Key ratio definitions, refer to page 28
THE GROUP
Statement of consolidated financial position, cont.
Key ratio per share

33
kSEKSharecapital
Statutoryreserve
Retainedearnings
Profit for theyear Total equity
Opening balance as at 1 January 2012 3 042 200 163 861 12 213 179 316
Appropriation of earnings as determined by the AnnualGeneral Meeting 12 213 -12 213
Dividend -12 168 -12 168
Net profit for the year 2 255 2 255
Closing balance as at 31 December 2012 3 042 200 163 906 2 255 169 403
Opening balance as at 1 January 2013 3 042 200 163 906 2 255 169 403
Appropriation of earnings as determined by the AnnualGeneral Meeting 2 255 -2 255
Dividend -15 210 -15 210
Net profit for the year 8 692 8 692
Closing balance as at 31 December 2013 3 042 200 150 951 8 692 162 885
Statement of equity - parent company
kSEKSharecapital
Other capitalcontribution
Translationreserve
Retainedearnings incl.profit for the
year
Totalattributable to shareholders in
parentcompany
Minorityinterest
Totalequity
Opening balance as at 1 January 2012 3 042 1 109 629 73 080 77 860 44 77 904
CHANGES IN EQUITY 2012
Net profit for the year 16 511 16 511 16 511
Components that may later be reclassified to profit and loss forthe year
Exchange rate differences resulting from translation of foreign operations 36 36 36
Tax attributable to components in other comprehensive income -9 -9 -9
Total comprehensive income for the year 27 16 511 16 538 16 538
Dividend paid -12 168 -12 168 -12 168
Closing balance as at 31 December 2012 3 042 1 109 656 77 423 82 230 44 82 274
Opening balance as at 1 January 2013 3 042 1 109 656 77 423 82 230 44 82 274
CHANGES IN EQUITY 2013
Net profit for the year 10 432 10 432 10 432
Components that may later be reclassified to profit and loss forthe year
Exchange rate differences resulting from translation of foreign operations 142 142 142
Tax attributable to components in other comprehensive income -31 -31 -31
Total comprehensive income for the year 111 10 432 10 543 10 543
Dividend paid -15 210 -15 210 -15 210
Closing balance as at 31 December 2013 3 042 1 109 767 72 645 77 563 44 77 607
Statement of changes in equity
Statement of changes in equity
Statement of changes in equity – parent company

34
Statement of consolidated cash flowskSEK Note 2013 2012
OPERATING ACTIVITIES
Operating profit 14 084 27 178
Non-cash items 25 706 2 290
Interest received and income from financial transactions 162 359
Interest paid -534 -1 554
Taxes paid -4 936 -1 790
Total cash flow from operating activities before changes in working capital 9 482 26 483
CASH FLOW FROM CHANGES IN WORKING CAPITAL
Change in work in progress -7 665 -2 973
Change in operating receivables 9 027 2 925
Change in operating liabilities 2 833 15 877
Total changes in working capital 4 195 15 829
Cash flow from operating activities 13 677 42 312
INVESTING ACTIVITIES
Acquisition of subsidiary 28 -9 208 -2 550
Acquisition of tangible non-current assets 11, 12 -1 758 -1 095
Divestment of financial non-current assets - 135
Cash flow from investing activities -10 966 -3 510
FINANCING ACTIVITIES
Amortization of bank loan -1 600 -1 600
Dividend -15 210 -12 168
Cash flow from financing activities -16 810 -13 768
Cash flow for the year -14 099 25 034
Cash and cash equivalents at beginning of year 57 169 32 268
Exchange rate differences in cash and cash equivalents 165 -133
Cash and cash equivalents at year-end 43 235 57 169
THE GROUPStatement of consolidated cash flows

35
Income statement - Parent CompanykSEK Note 2013 2012
OPERATING INCOME
Other operating income 1 - -
Total - -
OPERATING EXPENSES
Other external expenses 2 -90 -
Salaries and personnel 3 - -
Total -90 -
Operating profit/loss -90 -
PROFIT/LOSS FROM FINANCIAL INVESTMENTS
Write-down of participations in Group companies 4 -497 -4 762
Interest income and similar income statement items 5 14 369 14 293
Interest expenses and similar income statement items 6 -2 499 -1 953
Total financial income and expenses 11 373 7 578
Profit after financial items 11 283 7 578
Tax on profit for the year 7 -2 591 -5 323
Net profit for the year 8 692 2 255
Comprehensive income for the year - Parent CompanykSEK 2013 2012
Net profit for the year 8 692 2 255
Comprehensive income for the year 8 692 2 255
PARENT COMPANY
PARENT COMPANY
Income statement – parent company
Comprehensive income for the year – parent company

36
Balance sheet - Parent CompanykSEK Note 2013-12-31 2012-12-31
ASSETS
NON-CURRENT ASSETS
TANGIBLE ASSETS - -
Total tangible assets - -
FINANCIAL NON-CURRENT ASSETS
Participations in Group companies 13 1 021 1 150
Other long-term receivables from Group companies 221 983 210 554
Deferred tax asset 7 8 035 10 627
Total financial assets 231 039 222 331
Total non-current assets 231 039 222 331
CURRENT ASSETS
CURRENT RECEIVABLES
Other receivables 87 87
Total current assets 87 87
Cash and cash equivalents - -
Total current assets 87 87
Total aggregate assets 231 126 222 418
PARENT COMPANYBalance sheet – parent company

37
Balance sheet; Parent Company, cont.kSEK Note 2013-12-31 2012-12-31
EQUITY AND LIABILITIES
RESTRICTED EQUITY
Share capital 18 3 042 3 042
Statutory reserve 200 200
Total restricted equity 3 242 3 242
NON-RESTRICTED EQUITY
Non-restricted reserves/retained earnings 150 951 163 906
Net profit for the year 8 692 2 255
Total non-restricted equity 159 643 166 161
Total equity 162 885 169 403
LONG-TERM LIABILITIES
Liabilities to Group companies 20 723 19 710
Total long-term liabilities 20 723 19 710
CURRENT LIABILITIES
Liabilities to Group companies 20 47 428 33 305
Other current liabilities 90 -
Total current liabilities 47 518 33 305
Total equity and liabilities 231 126 222 418
Pledged assets and contingent liabilities 22, 27 - -
PARENT COMPANYBalance sheet – parent company, cont.

38
Cash flow statement - Parent CompanykSEK Note 2013 2012
OPERATING ACTIVITIES
Operating profit/loss -90 -
Non-cash items 25 497 4 762
Taxes paid 1 -
Interest received and result from share transactions 14 369 -
Interest paid and result from share transactions -2 996 7 578
Total cash flow from operating activities before changes in working capital 11 781 12 340
CASH FLOW FROM CHANGES IN WORKING CAPITAL
Change in operating receivables - -
Change in operating liabilities - -
Total changes in working capital - -
Cash flow from operating activities 11 781 12 340
INVESTING ACTIVITIES
Divestment of Group company 129 -
Cash flow from investing activities 129 -
FINANCING ACTIVITIES
Intra-group financial transfers 3 300 -172
Dividend -15 210 -12 168
Cash flow from financing activities -11 910 -12 340
Cash flow for the year - -
Cash and cash equivalents at beginning of year - -
Exchange differences in cash and cash equivalents - -
Cash and cash equivalents at year-end - -
PARENT COMPANYCash flow statement – parent company

39
Notes1 . N AT U R E O F T H E O P E R AT I O N SThe principal activities of Hifab Group AB (publ) and its subsidiaries
(hereinafter jointly referred to as “the Group”) are to provide project
management and advisory services for sustainable development.
2 . G E N E R A L I N F O R M AT I O NHifab Group AB (publ), corporate identity number 556394–1987,
is a Swedish limited company with its head office in Stockholm.
The address of Hifab Group AB’s head office is:
Box 19090, 104 32 Stockholm, Sweden
Visiting address: Sveavägen 167, 113 46 Stockholm.
The Hifab Group share has been traded on the OMX First North
exchange since 7 October 2008. Information about the share and
shareholders is provided on Pages 22–23.
The Board approved release of the Annual Report for the finan-
cial year ended 31 December 2013 (including comparative figures
up to and including 31 December 2012) on 11 April 2014.
3 . A C C O U N T I N G P R I N C I P L E S
3.1 Compliance with standards and applicable lawThe consolidated financial statements of Hifab Group have been
prepared in accordance with International Financial Reporting
Standards (IFRS), as approved by the EU, and the interpretations
of the IFRS Interpretation Committee, as approved by the Euro-
pean Commission for application within the EU. Moreover, the
Group applies the Swedish Financial Reporting Board’s recom-
mendation RFR 1, Supplementary Reporting Rules for Groups,
which specifies the addition to the IFRS disclosures required by
the provisions of the Swedish Annual Accounts Act.
3.2 New and amended standards and interpretations 2013
The following new or amended standards and interpretations have
entered into force and are applicable to the financial year 2013:
Standards Interpretation
Amendments to IAS 1 Presentation of Financial Statements (Presentation of Items of Other Comprehensive Income)
– Amendments to IAS 19 Employee Benefits– IFRS 13 Fair Value Measurement– Improvements to IFRSs 2009–2011 Cycle– Amendments to IFRS 7 Financial Instruments: Disclosures
(Offsetting Financial Assets and Financial Liabilities)
Amendments to IAS 1 Presentation of Financial Statements requires additional disclosures in other comprehensive income so that items
of other comprehensive income are grouped into two categories:
a) items that will not be recycled to profit and loss; and
b) items that will be recycled to profit and loss if certain criteria are met.
Amendments to IAS 19 Employee Benefits modifies the accounting for defined benefit pension plans and termination benefits. The
most significant change is to accounting for defined benefit obligations and plan assets. The amendments require that actuarial gains and
losses are recognized immediately in other comprehensive income, which means that the corridor method is eliminated. Furthermore,
the interest expense and the expected return on plan assets are replaced by a net interest income, which is calculated using the discount
rate on the defined benefit pension liability or asset, net. As the Group has applied the amendments to IAS 19, it is terminating applica-
tion of UFR 4 Accounting for special employer’s contribution and tax on returns, which has been withdrawn by the Swedish Financial
Reporting Board. The Group instead reports special employer’s contribution in accordance with IAS 19, which means that the actuarial
assumptions to be made in the calculation of defined benefit pension plans also include taxes accruing on pension benefits.
The Group has only defined contribution plans, so the changes have not had any material impact on the financial statements, see IAS 8.28)
IFRS 13 Fair Value Measurement establishes a framework for measuring fair value where required by other standards. The stan-
dard is applicable in measuring the fair value of both financial and non–financial items. Fair value is defined as the price that would be
received from a sale of an asset or the compensation that would be paid to transfer a liability in a rational transaction between market
participants at the measurement date (exit price). IFRS 13 requires a number of quantitative and qualitative disclosures about fair value
measurements.
Aside from enhanced disclosure requirements, the new standard has not had any material monetary effect on the Group.

40
3.3 New and amended standards and interpretations not yet in force
The International Accounting Standards Board (IASB) has issued the following new standards, which are not yet in force:
IFRS Interpretation Committee has published the following new interpretations, which have not yet entered into force:
Standard
Applies to accounting periods starting on or after Interpretation
Applies to acounting periods starting on or after
Amendments to IAS 32 Financial Instruments: Classification (Offsetting Financial Assets and Financial Liabilities)
1 January 2014 or later
IFRIC 21 Levies*
1 January 2014 or later
IFRS 10 Consolidated Financial Statements ** 1 January 2014 or later
IFRS 11 Joint Arrangements** 1 January 2014 or later
IFRS 12 Disclosure of Interests in Other Entities** 1 January 2014 or later
Amendments to IFRS 10, IFRS 11 and IFRS 12 (Transitional Provisions)**
1 January 2014 or later
Amendments to IAS 27 Separate Financial Statements** 1 January 2014 or later
Amendments to IAS 28 Investments in Associates and Joint Ventures** 1 January 2014 or later
Investment Entities (Amendments to IFRS 10, IFRS 12 and IAS 27) 1 January 2014 or later
Amendments to IAS 36 Impairment of Assets (Recoverable Amount Disclosures for Non–Financial Assets)
1 January 2014 or later
Amendments to IAS 39 Financial Instruments: Recognition and Measurement (Novation of Derivatives and Continuation of Hedge Accounting)
1 January 2014 or later
Improvements to IFRSs 2010–2012 Cycle* 1 January 2014 or later
Improvements to IFRSs 2011–2013 Cycle* 1 January 2014 or later
Amendments to IAS 19 Employee Benefits (Defined Benefit Plans: Employee Contributions)*
1 January 2014 or later
IFRS 9 Financial Instruments and subsequent amendments to IFRS 9 and IFRS 7 Financial Instruments: Disclosures and IAS 39 Financial Instruments: Recognition and Measurement*
Not decided
IFRS 14 Regulatory Deferral Accounts* 1 January 2016 or later
Amendments to IFRS 7 Financial Instruments: Disclosures was updated in 2013 and now includes a clear requirement to present and
explain the “recognized financial instruments that are subject to an enforceable master netting arrangement or similar agreement”.
Disclosures are provided as follows for financial assets and financial liabilities in respect of:
a) Gross amount of the financial assets and financial liabilities
b) Offset amounts in accordance with IAS 32 (Paragraph 42)
c) Net amounts presented in the statement of financial position
d) Amounts subject to a master arrangement (or similar) but not offset
e) Net amounts
Similar requirements apply to the parent. Common financial instruments covered by the above rules are forward exchange contracts
and interest rate swaps. The company has compiled an inventory of its financial instruments in order to identify possible netting arrang-
ements. The amendments have not resulted in any changes for the company.
Improvements to IFRSs 2009–2011 Cycle is a package of amendments with improvements to various standards and interpretations.
These have not had any material effect on the consolidated financial statements, see IAS 8.30–31

41
4 . S U M M A RY O F M AT E R I A L A C C O U N T I N G P R I N C I P L E S
4.1 General
The material accounting principles applied in the preparation of
these consolidated financial statements are summarized below.
Measurements in the consolidated financial statements are
made at cost, except for certain financial instruments measured at
fair value and at accrued cost.
The preparation of the financial statements in accordance with
IFRS requires that the management makes assessments, estima-
tes, and assumptions that have an impact on the application of the
accounting principles and the recognized amounts in the income
statement and balance sheet. These assessments and estimates
are based on the information available on each reporting date.
Although these assessments and estimates are based on the most
reliable information available to the management, the actual
outcome may differ from these assessments and estimates.
4.2 Consolidated financial statementsThe consolidated financial statements reflect the commitments
of the parent company and all its subsidiaries up to 31 December
2013. Subsidiaries are defined as entities over which Hifab Group
AB has a controlling influence. The term controlling influence
signifies a direct or indirect right to determine the financial and
operational strategies of an entity with an aim to gain financial
benefit. Hifab Group exercises its controlling influence through
voting rights.
Amounts reported in the annual financial statements of the
subsidiaries have been adjusted, where appropriate, to warrant a uni-
form application of the accounting principles adopted by the Group.
Unrealized gains or losses from intra–group transactions
are eliminated in their entirety. Where unrealized losses from
divestment of intra–group assets are eliminated at consolidation, the
underlying asset is also tested for impairment from Hifab Group’s
consolidation perspective.
Business combinations are recognized using the acquisition
method. Using this method, the fair value of acquired assets and
liabilities is determined on the date that control is gained over the
acquired company, and also constitutes the basis for subsequent
measurement in accordance with the accounting principles of the
Group. Transaction costs related to the business combination are
not included in the cost of the subsidiary.
The difference between cost, the value of minority interest, and
the fair value of previous holdings, and the fair value of acquired
identifiable assets, liabilities, and contingent liabilities is recogni-
zed as goodwill. Where a negative difference arises, the difference
is recognized directly in profit and loss.
Minority interests are recognized either as a proportional share
of the acquired net assets, or at fair value, an assessment that is
made at each individual acquisition. Additional purchase conside-
rations are recognized at the estimated fair value, with subsequent
changes recognized in profit and loss.
Gradual acquisitions are measured at fair value at the date
control is gained. Effects of revaluation of the portion owned before
gaining control are recognized in profit and loss. An increase or
decrease in the ownership portion where the subsidiary is under
continued control is recognized as a change in equity.
Minority interests are recognized under equity in the consolida-
ted financial statements, and are separated from the equity of the
parent company. Minority interests are included in the consoli–
dated net income and comprehensive income, and are recognized
separately from the parent company’s portion as an apportionment
of the income and comprehensive income for the period.
4.3 Investments in associates and joint venturesEntities whose financial activities are under common control of
the Group and other, independent co–owners (joint ventures) are
recognized using the proportional method. Hifab Group exercises
its control through voting rights.
Associates are entities over which the Group exercises signi–
ficant influence, but which are neither subsidiaries nor stakehol-
ders in a joint venture. Hifab Group exercises its control through
voting rights.
Investments in associates are recognized in the Group using the
equity method.
Acquired investments in associates are also recognized using
the acquisition method as explained in Note 4.2 above. However,
adjustments for goodwill or fair value attributable to the associate
are included in the amount recognized under participations
in associates.
4.4 Foreign currency translationHifab Group’s consolidated financial statements are presented in
Swedish kronor (SEK), which is also the functional currency of
the parent company.
Transactions in foreign currency are translated to the functional
currency of each Group company by applying exchange rates
applicable on the respective transaction dates (spot exchange rate).
Foreign currency gains or losses deriving from the translation
of such transactions and the restatement of monetary balance
sheet items at the rate of exchange on the reporting date are recog-
nized in the income statement as other income or other expenses.
In the consolidated financial statements, all items and
transactions of Group companies in functional currencies other
than Swedish kronor (which is the Group’s reporting currency)
* Not yet approved for application within the EU.
** Not yet approved for application within the EU. According to IASB, IFRS 10, IFRS 11, IFRS 12, IAS 27 and IAS 28 enter into force for
financial years starting 1 January 2013, but within the EU they will come into effect from the financial year beginning 1 January 2014 or later.
Other new and amended standards and interpretations that are not yet in force have not been applied. Management believes that the new and
amended standards and interpretations applicable from the financial year 2014 will not have any material impact on the consolidated financial
statements. Management is currently analysing the impact of other standards.

42
have been translated to Swedish kronor at consolidation. Assets
and liabilities of subsidiaries have been translated to Swedish
kronor at the rate of exchange on the reporting date. Income and
expenses have been translated to the reporting currency of the
Group using the average rates of exchange during the reporting
period. Differences arising using this method have been recogni-
zed under other comprehensive income.
4.5 Recognition of income and expenses, and borrowing costs
The Group has assignments based on both running accounts and
fixed prices. Running–account assignments are recognized as pro-
fit or loss when invoiced. Fixed–price assignments are recognized as
profit or loss using the percentage of completion method. The de-
gree of completion of an assignment is determined by comparing
costs incurred on the reporting date with estimated total costs.
The degree of completion is determined based on the project ma-
nager’s written assessments of work performed and the estimated
work remaining to completion.
Work in progress is measured in the balance sheet at the degree
of completion after deduction of actual losses and estimated risks.
Assignments in which the accrued revenue exceeds part–invoi-
ced amounts are recognized as receivables from work in progress.
Assignments in which part–invoiced amounts exceed accrued
revenue are recognized as liabilities from work in progress.
Where the outcome of an assignment cannot be reliably
estimated, revenue from work performed is recognized at the
same amount as cost incurred from work performed, if it is
probable that the cost will be compensated by the principal.
An anticipated loss from an assignment is immediately recognized
as an expense.
Operating expenses are recognized in profit and loss when the
product has been delivered or the service has been consumed.
Operational leasing costs are recognized in profit and loss on a
straight–line basis over the term of the lease contract. Variable fees
are expensed as they arise.
Interest income is recognized over the term using the effective
rate of interest method.
Borrowing costs (interest expenses) are charged to the income
for the period to which they relate.
4.6 Goodwill
Goodwill is recognized as the difference between cost, the value
of minority interests, the fair value of previous holdings, and the
fair value of acquired, identifiable assets, liabilities and contingent
liabilities. Where the value is negative, the difference is recognized
directly in profit and loss.
Goodwill is measured at cost, less accumulated impairment.
Goodwill is distributed to cash–generating units and tested for im-
pairment on an annual basis, or more often if there is an indication
of impairment.
Goodwill arising from an acquisition of an associate is included in
the carrying amount for investments in associates.
4.7 Property, plant and equipment
Property, plant and equipment is recognized at cost, less accumu-
lated depreciation and impairment, where applicable. The cost
includes expenses directly attributable to the acquisition of the asset.
Depreciation of property, plant and equipment is expensed so that
the cost of the asset less estimated residual value at end of useful life
is depreciated on a straight–line basis over its estimated useful life.
Other equipment (office equipment, office machines and vehicles)
has been assigned a useful life of 5 years, while computers and
computer equipment have a useful life of 3 years.
4.8 Impairment
The carrying amounts of the Group’s assets, with the exception of
deferred tax assets, which are measured in accordance with IAS 12
Income Taxes, are tested on each reporting date to assess whether
there is an indication of impairment.
Where any such indication exists, an estimate is made of the
recoverable amount of the asset or the cash–generating unit.
Impairment is recognized in profit and loss.
4.9 Recognition of financial assets
The financial assets of the company are classified in the following
categories and balance sheet items:
• Financial assets at fair value in profit and loss; equity and fixed
income funds
• Loan receivables and trade receivables; trade receivables
Financial assets are classified in the respective categories at initial
recognition, based on the characteristics and purpose of the instruments.
All financial instruments are initially recognized at cost, equalling the
fair value of the instrument plus transaction costs, with the exception
of financial instruments recognized at fair value in profit and loss,
which are recognized at fair value excluding transaction costs.
Subsequent recognition is made based on their classification according
to IAS 39.
A financial asset is recognized in the balance sheet when the
company becomes a party to the contractual terms of the instrument.
Trade receivables are recognized in the balance sheet upon submission
of an invoice.
A financial asset is derecognized from the balance sheet when the
contractual rights are consumed, expire, or when the company loses
control over the asset.
Acquisition or divestment of financial assets is recognized on the trade
date. Acquisition or divestment of traded financial assets is recognized
on the settlement date.
The fair value of traded financial assets, i.e. equity funds and fixed
income funds, equals the market value on the reporting date.
On each reporting date, an assessment is made to ascertain
whether indications exist for impairment of a financial asset, or a
group of financial assets.
Financial assets at fair value in profit and loss include financial

43
assets that the company intends to measure at fair value in profit
and loss at initial recognition. Equity funds and fixed income
funds are recognized in this category. Assets in this category are
regularly measured at fair value, and changes in value are recogni-
zed in profit and loss and classified as current assets if they are held
for trade or expected to be realized within a period of 12 months.
Trade receivables are classified as financial assets and recognized
in the category loan receivables and trade receivables. This catego-
ry of assets is measured at accrued cost, which is determined based
on the effective interest rate calculated at the time of acquisition.
Current receivables with short maturity dates, e.g. trade receiva-
bles, are measured at nominal amounts.
4.10 Income tax
Income tax consists of current tax and deferred tax.
Current tax is a tax liability or a tax asset to be paid or received for
the current year, applying tax rates enacted or in practice enacted on
the reporting date, including adjustments of current tax attributable
to prior periods.
Deferred tax is calculated using the balance sheet method. De–
ferred tax is generally determined based on the difference between
the carrying amount of assets and liabilities, and their respective
value for tax purposes. However, deferred tax is not determined at
the initial recognition of goodwill, or at the initial recognition of an
asset or liability, unless the related transaction is a business combina-
tion, or affects tax or the revenue for accounting purposes.
Deferred tax on temporary differences related to shares in subsi-
diaries, associates and joint ventures is not carried where a reversal
of such temporary differences can be controlled by the Group, and a
reversal is not likely to occur in the foreseeable future.
Deferred tax liabilities are recognized in their entirety, whereas
deferred tax assets are recognized only to the extent that it is probable
that these may be offset against future taxable income. Hifab Group’s
management bases its assessment with regard to the prospects of
future taxable income on the Group’s most recently approved budget,
which is adjusted for significant tax–exempt income and expenses.
Changes in deferred tax assets or tax liabilities are recognized as
a portion of the tax expense in profit and loss, except where they are
attributable to items recognized in equity, when the related deferred
tax is also recognized in equity.
Tax assets and tax liabilities are recognized net in the balance sheet
where a legal right exists to do so, or where the intention is that the net
amount be paid, or that the asset and liability be paid simultaneously.
4.11 Cash and cash equivalents
Cash and cash equivalents include cash, bank balances and other
current investments, the maturity date of which is three months or
less from the date of acquisition.
4.12 Equity and distribution of dividends
The share capital is the registered share capital, equalling the no-
minal value of shares issued.
Premium paid includes any contributions received in excess of
the share capital received in new issues. Transaction costs attribu-
table to a new issue of shares are deducted from premium paid,
after deduction of income tax.
Currency translation of foreign operations is included in the
translation reserve (provisions).
Retained earnings include all earnings accrued in the current
period and previous periods as reported in profit and loss.
Dividends to shareholders are recognized as a liability upon
approval by the Annual General Meeting.
4.13 Post–employment benefitsHifab Group’s pension commitments are classified as defined
contributions plans. A defined contribution plan is a pension
plan according to which the Group pays fixed contributions to an
independent body. The Group has no legal or constructive obli-
gation to pay additional contributions upon completion of the
fixed payment commitment. Payment commitments of defined
contribution plans are recognized as an expense in profit and loss
as they arise.
4.14 Financial liabilities
The financial liabilities of the company are classified in the
following categories and balance sheet items:
• Other financial liabilities; liabilities to credit institutions; trade
payables. A financial liability is entered in the balance sheet when
the company becomes a party to the contractual terms of an
instrument. A liability is recognized when the counterparty has
performed, and there is a contractual obligation to pay, even if an
invoice has not yet been received. Trade payables are recognized
in the balance sheet upon receipt of an invoice. A financial liabi-
lity is derecognized from the balance sheet when the contractual
obligation has been fulfilled or otherwise extinguished.
• Financial liabilities, as liabilities to credit institutions, are classified
as other financial liabilities, entailing initial recognition at amounts
received, less transaction costs. Post–acquisition liabilities to credit
institutions are measured at accrued cost using the effective rate
of interest method. The expected maturity date of non–current
liabilities is more than one year, whereas the maturity date of current
liabilities is less than one year. Liabilities with short maturity dates,
e.g. trade payables, are measured at their nominal amounts.
4.15 Leasing
A finance lease is a contract under which the financial risks and
benefits associated with the ownership of an object are in all mate-
rial respects transferred from the lessor to the lessee. Other leases
are classified as operational leases.

44
All leases have been classified as operational leases. Lease fees
for operational leases are expensed on a straight–line basis over
the term of the lease.
4.16 Parent company accounting principlesThe parent company complies with the Swedish Annual
Accounts Act and recommendation RFR 2 Accounting of Legal
Entities, issued by the Swedish Financial Reporting Board.
Application of RFR 2 means that the parent company must
apply all EU approved IFRSs as far as possible within the
framework of the Annual Accounts Act and the law on safegu-
arding pension commitments, and with regard to the connection
between accounting and taxation.
Changes to RFR 2 Accounting of Legal Entities that have ente-
red into force and are applied for financial year 2013 relate to the
following areas:
IAS 27 Consolidated and Separate Financial Statements.
The Swedish Financial Reporting Board has published an amend-
ment to RFR 2 that relates to the reporting of group contributions.
The amendment means that entities can choose to report group
contributions according to the recommendation’s main rule or un-
der an alternative rule. Under the main rule, the parent recognizes
group contributions received from subsidiaries as financial income,
and group contributions paid to subsidiaries as an increase in par-
ticipation in group companies. Under the alternative rule, group
contributions the parent pays to or receives from subsidiaries are
recognized as appropriations. Hifab has chosen to apply the alter-
native rule.
Other amendments to RFR 2 have had no material impact on
the financial statements of the parent company. The amendments
to RFR 2 Accounting of Legal Entities that enter into force from 1
January 2014 relate to the following areas:
IFRS 10 Consolidated Financial Statements
Given that IFRS 10 enters into force on 1 January 2014, there
have been additions to RFR 2 showing that IFRS 10 does not apply
to legal entities.
IFRS 11 Joint Arrangements
RFR 2 contains two exceptions relating to IFRS 11.
IFRS 11 P 26b) requires that participations in joint ventures be
recognized in accordance with IAS 27 P 10. The presentation requi-
rements of IFRS 5 are not compatible with the presentation of the
Annual Accounts Act and therefore the provisions regarding classi-
fication of joint ventures held for sale should not be applied in legal
entities. Reporting under IFRS 11 P 26(a) and 27(a) regarding joint
activities should not apply where this is contrary to Swedish law.
IAS 40 Investment Property
Paragraph 2 has been amended so that investment property not
carried at fair value in accordance with IAS 40 should, according
to P 56, be recognized using the cost model. A company may still
choose to apply RR24 and RR12, but in this case P 16–19 of IAS
40 should not be applied to accounting for investment property
subsequent to initial recognition.
IAS 37 Provisions, Contingent Liabilities and Contingent Assets
The additions have been made in accordance with RFR 2: Chap-
ter 3, Section 1 of the Annual Accounts Act requires disclo-
sures of contingent liabilities as memorandum items on the
balance sheet. IAS 37 P 86 requires disclosures of all contingent
liabilities unless the probability of regulation of these is remote.
It may be inferred from the legislative history to the Annual
Accounts Act that a company should always make disclosures in
respect of pledge contracts and similar obligations as contingent
liabilities. Furthermore, disclosure should be made if the company
has unlimited liability as a joint owner of another entity.
The differences in the accounting principles applied by the
Group and those applied by the Parent Company are set out below:
Participations in subsidiaries. Participations in subsidiaries
are recognized using the cost method. Costs related to an acquisition
of a subsidiary, which are expensed in the consolidated financial
statements, are included as a portion of the cost of acquisition of
participations in subsidiaries. The carrying amount of participations
in subsidiaries is tested for impairment where an indication of a need
for impairment exists.
Associates and joint ventures. Participations in associates and
joint ventures are recognized using the cost method.
Service assignments. The result of an assignment is recognized
as profit or loss by the parent company in accordance with Chapter 2,
Section 4 of the Swedish Annual Accounts Act upon completion of
the assignment. Pending completion, work in progress is recognized
at the lower of cost and net realizable value on the reporting date.
Group contributions and shareholders’ contributions.
Group contributions paid by a subsidiary are recognized as fi-
nancial income. Group contributions paid to a subsidiary are
recognized as an increase in participations in group companies.
Shareholders’ contributions are recognized directly in the equ-
ity of the recipient and capitalized by the paying party as parti-
cipations in subsidiaries.
4.17 IFRS 8 Operating SegmentsThe Group has identified the Management Group as the
highest executive decision–making body, and operating segments
are based on the management’s monitoring and control of the
operations. The operating segments are identified based on their
internal reporting to the management group.
It is the assessment of the management that the operations of
the operating segments are similar in nature based on the criteria
of IFRS 8, and the Group therefore reports one segment: Project
Management.

45
4.18 Important estimates and assumptions for accounting purposesEstimates and assumptions are regularly evaluated based on histo-
rical experience and other factors, including expectations on future
events considered reasonable under the present circumstances. The
preparation of an annual report includes making estimates and
assumptions concerning the future. Estimates and assumptions for
accounting purposes will, by definition, not always equal the actual
outcome.
Taxes. Deferred tax is calculated on temporary differences between
the carrying amount and value for tax purposes of assets and liabi-
lities and tax loss carry–forwards. There are mainly two kinds of
estimates and assumptions that have an impact on the recognized de-
ferred tax. These estimates and assumptions are necessary to establish
the carrying amount of various assets and liabilities and of future tax-
able earnings, if the future use of deferred tax assets depends on this.
Impairment testing of goodwill. Estimates and assumptions
concerning margins, growth, discount rates etc. are made during
impairment testing of consolidated goodwill. See Note 10 for more
detailed information on impairment testing. The carrying amount
of goodwill at 31 December 2013 amounted to SEK 15,954 thousand.
In p
hoto
: And
ers
Karls
son,
Pro
ject
Man
ager
Hifa
b

46
Note 2 Other external costskSEK 2013 2012 2013 2012
Cost of services purchased 79 418 72 481 - -
Disbursements 53 891 36 018 - -
Other external costs 49 684 46 870 -90 -
Total 182 993 155 369 -90 -
AUDIT ENGAGEMENT
kSEK 2013 2012 2013 2012
Deloitte 425 425 - -
Other auditors 89 97 - -
Total 514 522 - -
ENGAGEMENTS OTHER THAN AUDIT ENGAGEMENTS
kSEK 2013 2012 2013 2012
Deloitte - - - -
Other auditors 156 32 - -
Total 156 32 - -
OTHER SERVICES
kSEK 2013 2012 2013 2012
Deloitte - - - -
Other auditors - 33 - -
Total - 33 - -
THE GROUP
THE GROUP
THE GROUP
THE GROUP
PARENT COMPANY
PARENT COMPANY
PARENT COMPANY
PARENT COMPANY
Note 1 Other operating incomekSEK 2013 2012 2013 2012
Rental income 323 541 - -
Other 185 279 - -
Total 508 820 - -
THE GROUP PARENT COMPANYNote 1 Other operating income
Note 2 Other external costs

47
Note 3 Allocation of employees by country of service2013 2012 2013 2012
THE GROUP Men Men Women Women
Sweden 218 189 110 102
Bangladesh 22 13 4 3
Finland 7 8 1 1
Cambodia 3 1 - -
Kenya - 1 1 2
Kosovo 4 2 2 2
Laos 7 10 4 4
Liberia 6 5 1 1
Nepal 2 1 3 1
Serbia 6 1 6 1
Sri Lanka - 1 - -
Tanzania 2 2 - -
Turkey 1 - - -
Vietnam - 1 - -
Other countries 2 2 1 -
Total 280 237 133 117
Note 3 Allocation of employees by country of service
Number of women on the Board and in management positions, %Number of women on the Board and in management positions, %
2013-12-31 2012-12-31
Board of Directors 43 32
Management 40 48
THE GROUP

48
Note 3, cont. Salaries and personnel, kSEK THE GROUP PARENT COMPANY
Salaries; Board of Directors and Managing Director 2013 2012 2013 2012
Anders Eriksson, Chairman 170 162 - -
Bengt Stillström, Director 85 82 - -
Hans Waldaeus, Director 85 82 - -
Hellen Wohlin-Lidgard, Director 28 82 - -
Carina Edblad, Director 85 50 - -
Lennart Karlsson, Director - 32 - -
Jan Skoglund, Director 57 - - -
Agneta Jacobsson, Director 57 - - -
Total 567 490 - -
Managing directors 2 952 2 736 - -
Other executives (4) 3 995 4 124 - -
Salaries, other 173 669 154 824 - -
Total salaries and compensation 181 183 162 174 - -
Total payroll overhead 54 132 46 699 - -
of which related to the Board and Managing Directors 1 125 952 - -
of which related to other executives 1 560 1 561 - -
Total pension costs 21 501 19 103 - -
of which related to the Board - - - -
of which related to Managing Directors 623 869 - -
of which related to other executives 1 256 1 091 - -
Total 256 816 227 976 - -
Note 3, cont. Salaries and personnel kSEK
COMPENSATION TO EXECUTIVES
PENSIONS
Directors of the Board, Managing Directors, and other executives have not been granted subscription rights or other financial instruments.
AlectaDefined benefits pension commitments for white-collar employees in Sweden under the ITP 2 plan for retirement and family pensions are securedthrough an insurance policy with Alecta. According to a statement from the Swedish Financial Reporting Board, UFR 3 Classification of ITP plansfinanced by insurance in Alecta, this is a defined benefits plan that covers multiple employers.For the financial year 2013 the company has not had access to information enabling reporting of its proportional share of the plan’s obligation, planassets and costs, which means it has not been possible to report the plan as a defined benefits plan. The ITP 2 pension plan secured through insurancewith Alecta is therefore reported as a defined contribution plan.Anticipated fees during the next reporting period for ITP 2 insurances with Alecta amount to 14 669 kSEKThe collective level of consolidation comprises the market value of Alecta’s assets as a percentage of the insurance commitments calculated usingAlecta’s actuarial methods and assumptions, which do not correspond with IAS 19. At the end of 2013 Alecta’s surplus in the form of the collective levelof consolidation amounted to 148% (2012: 129%).
Salary and other compensation of 1 594 (487) kSEK and pension expenses of 292 (89) kSEK were paid during the year to Managing Director and CEOJeanette Saveros. The CEO benefits from a defined contribution pension with a premium of 18.3% of monthly salary. The pensionable age complies withthe ITP plan. No profit-based variable compensation was paid during 2013. The notice period is nine months on the part of the Group, and six months onthe part of the CEO. The CEO is an employee of HifabGruppen AB. Other senior executives have a mutual notice period of three months.
The annual fee payable to each Director of the Board, as determined by the Annual General Meeting 2013, is 85 kSEK and to the Chairman 170 kSEK.No fees are payable to the Directors of the Boards of the subsidiaries.
Fees to the Chairman and Directors of the Board have been paid as determined by the Annual General Meeting 2013.
Salaries and compensations to other Managing Directors (2,0) in the Group totaled 1 358 (1 198) kSEK. Profit-based variable bonuses have not beenpaid. Pension benefits to other Managing Directors and executives are in accordance with the ITP plan or similar plans. Some of the executives havechosen a defined pension plan within the cost fram of the ITP pension plan. Pension costs amount to 331 (1 310) kSEK.
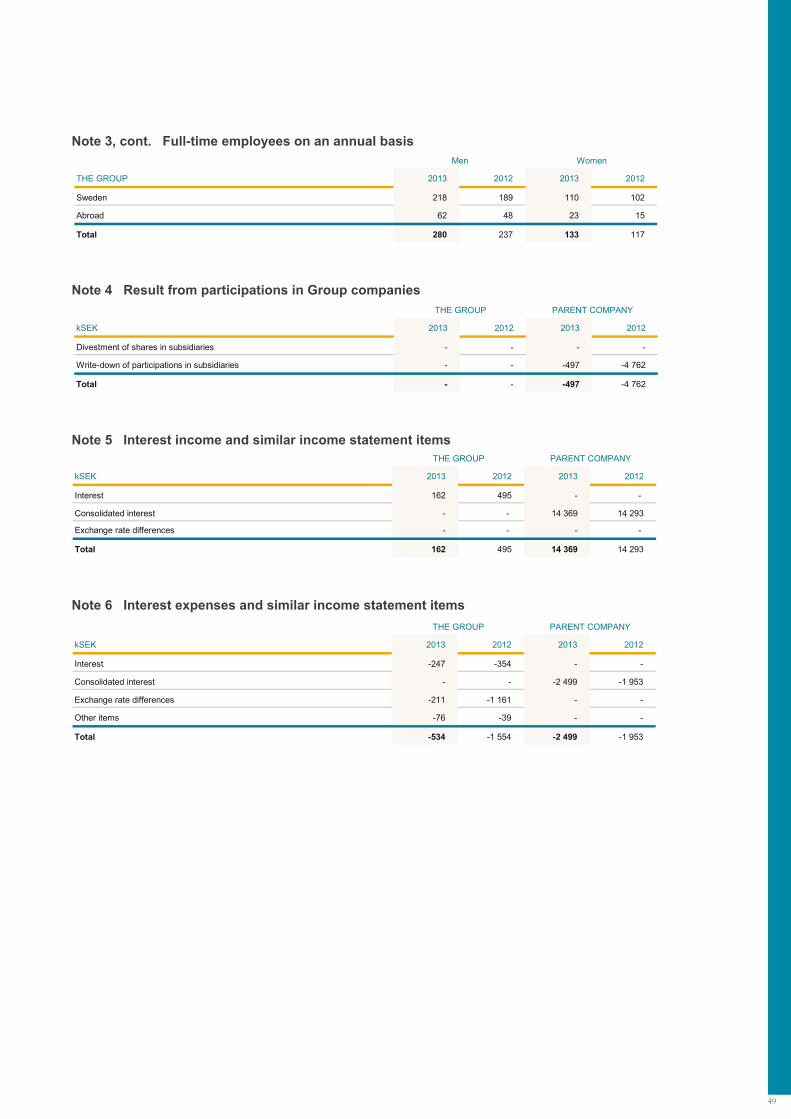
49
kSEK 2013 2012 2013 2012
Interest -247 -354 - -
Consolidated interest - - -2 499 -1 953
Exchange rate differences -211 -1 161 - -
Other items -76 -39 - -
Total -534 -1 554 -2 499 -1 953
THE GROUP
Note 6 Interest expenses and similar income statement itemsPARENT COMPANY
Note 5 Interest income and similar income statement items
kSEK 2013 2012 2013 2012
Interest 162 495 - -
Consolidated interest - - 14 369 14 293
Exchange rate differences - - - -
Total 162 495 14 369 14 293
THE GROUP PARENT COMPANY
Note 4 Result from participations in Group companies
kSEK 2013 2012 2013 2012
Divestment of shares in subsidiaries - - - -
Write-down of participations in subsidiaries - - -497 -4 762
Total - - -497 -4 762
PARENT COMPANYTHE GROUP
Note 3, cont. Full-time employees on an annual basis
THE GROUP 2013 2012 2013 2012
Sweden 218 189 110 102
Abroad 62 48 23 15
Total 280 237 133 117
Men Women
Note 3, cont. Full-time employees on an annual basis
Note 4 Result from participations in Group companies
Note 5 Interest income and similar income statement items
Note 6 Interest expenses and similar income statement items

50
Note 7 Tax for the yearkSEK 2013 2012 2013 2012
TAX ON PROFIT FOR THE YEAR
Current tax for the year -678 -1 644 - -
Current tax attributable to previous years - 523 - -
Deferred tax -2 602 -8 351 -2 591 -5 323
Total -3 280 -9 472 -2 591 -5 323
DIFFERENCES IN RECOGNIZED TAX LIABILITY AND APPLICABLE TAX RATES
Profit before tax and appropriations 13 712 25 983 11 283 7 578
Estimated tax, 22% (26,3%) -3 017 -6 833 -2 482 -1 993
Difference in foreign tax rates -2 -397 - -
Tax effect on non-deductible expenses -381 -513 - -1 253
Tax effect on non-taxable income 162 355 - -
Current tax attributable to previous year(s) - -19 - -
Tax effect on changes in untaxed reserves -10 -377 - -
Tax effect on other temporary differences 1) -236 -2 230 -109 -2 077
Tax effect on acquisition of subsidiary 204 542 - -
Non-recognized tax asset on loss carry-forward - - - -
Tax for the year -3 280 -9 472 -2 591 -5 323
The applicable tax rate is the income tax rate for the Group; 22% (26,3%) .
PARENT COMPANYTHE GROUP
Deferred tax assets and tax liabilities are set off where a legal right exists to offset current tax assets and tax liabilities, and deferred taxes relate to thesame tax authority. As a result of such set-off, the following amounts were established and recognized in the balance sheet:
1) Deferred tax assets are recognized to the extent they are expected to be set off against future tax surpluses. At 31 December 2013 there were noconsolidated loss carry-forwards that have not been carried in the balance sheet. Total estimated tax loss carry-forwards amount to 30.8 (50.6) MSEKFigures for 2012 include the effect of recalculation at the lower tax rate.
Note 7 Tax for the year
kSEK 2013 2012 2013 2012
Deferred tax assets; loss carry-forwards 8 530 11 122 8 035 10 627
Deferred tax liabilities; untaxed reserves -773 -759 - -
Other deferred tax 760 790 - -
Deferred tax assets recognized in the balance sheet 8 517 11 153 8 035 10 627

51
Note 8 Financial instrumentsHifab Group's financial assets and liabilities appear from the following
THE GROUP, as at 2013-12-31
kSEK
Trade andloanreceivables
Financialassets held for trade
Otherfinancialliabilities
Totalcarryingamount Fair value
Non-financialassets andliabilities
Balancesheet total
Other long-term security holdings - 194 - 194 194 - 194
Trade receivables 63 222 - - 63 222 63 222 - 63 222
Other receivables 828 - - 828 828 - 828
Prepaid expenses and accrued income 8 975 - - 8 975 8 975 - 8 975
Cash and cash equivalents 43 235 - - 43 235 43 235 - 43 235
Total financial assets 116 260 194 - 116 454 116 454 - 116 454
Interest-bearing long-term liabilities - - 1 800 1 800 1 800 - 1 800
Other long-term liabilities - - 383 383 383 - 383
Trade liabilities - - 23 332 23 332 23 332 - 23 332
Advance payments from customers - - 12 975 12 975 12 975 - 12 975
Interest-bearing current liabilities - - 1 600 1 600 1 600 - 1 600
Other current liabilities - - 18 792 18 792 18 792 - 18 792
Accrued expenses and deferred income - - 41 958 41 958 41 958 - 41 958
Total financial liabilities - - 100 840 100 840 100 840 - 100 840
Out of the total consolidated trade receivables, totalling 66 206 kSEK, 2 984 kSEK was provided for as doubtful receivables.Trade receivables more than 90 days overdue total 3 840 kSEK.
Note 8 Financial instruments
THE GROUP, as at 2012-12-31
kSEK
Trade andloan
receivables
Financialassets held for trade
Otherfinancialliabilities
Totalcarryingamount Fair value
Non-financialassets andliabilities
Balancesheet total
Other long-term security holdings - 194 - 194 194 - 194
Trade receivables 70 164 - - 70 164 70 164 - 70 164
Other receivables 1 960 - - 1 960 1 960 - 1 960
Prepaid expenses and accrued income 7 440 - - 7 440 7 440 - 7 440
Cash and cash equivalents 57 169 - - 57 169 57 169 - 57 169
Total financial assets 136 733 194 - 136 927 136 927 - 136 927
Interest-bearing long-term liabilities - - 3 400 3 400 3 400 - 3 400
Other long-term liabilities - - - - - - -
Trade liabilities - - 25 972 25 972 25 972 - 25 972
Advance payments from customers - - 9 693 9 693 9 693 - 9 693
Interest-bearing current liabilities - - 1 600 1 600 1 600 - 1 600
Other current liabilities - - 18 741 18 741 18 741 - 18 741
Accrued expenses and deferred income - - 35 770 35 770 35 770 - 35 770
Total financial liabilities - - 95 176 95 176 95 176 - 95 176
Out of the consolidated trade receivables, totalling 73 321 kSEK, 3 157 kSEK was provided for as doubtful debts.Trade receivables more than 90 days overdue total 6 690 kSEK.

52
Note 9 Trade receivableskSEK 2013-12-31 2012-12-31 2013-12-31 2012-12-31
Trade receivables, gross 66 206 73 321 - -
Provision for doubtful debts -2 984 -3 157 - -
Total trade receivables, net, after provision for doubtful debts,correspond to their fair value 63 222 70 164 - -
According to the assessment of the Management, the recognized net value of trade receivables, after provision for doubtful debts, corresponds to the fair value.
kSEK 2013-12-31 2012-12-31 2013-12-31 2012-12-31
Provision for doubtful debts at beginning of year -3 157 -3 279 - -
Net change in provision 169 -1 028 - -
Divested operations - - - -
Translation differences 2 74 - -
Recovery of prior write-offs 2 1 076 - -
Total provision for doubtful debts -2 984 -3 157 - -
THE GROUP
Age analysis trade receivableskSEK Gross amount
Provision for doubtful debts Gross amount
Provision for doubtful debts
Not fallen due 54 945 - 50 689 -
30 days overdue 4 675 - 11 311 -
31-60 days overdue 1 805 - 4 175 -
61-90 days overdue 941 - 456 -
> 90 days overdue 3 840 -2 984 6 690 -3 157
Total 66 206 -2 984 73 321 -3 157
Management believes that a maturity analysis of upcoming payments does not differ materially from the above ageing analysis.
IFRS THE GROUP
THE GROUP
ANNUAL ACCOUNTS ACT PARENT COMPANY
PARENT COMPANY
2013-12-31 2012-12-31
Note 9 Trade receivables
Note 10 GoodwillkSEK 2013 2012 2013 2012
Acquisition cost; opening balance as at 2013-01-01 6 148 6 148 - -
Acquisitions for the year 9 806 - - -
Total accumulated acquisition cost as at 2013-12-31 15 954 6 148 - -
Carrying value at year-end 15 954 6 148 - -
THE GROUP PARENT COMPANY
The assessed value of the consolidated goodwill item is based on the cash-generating unit's value in use. An impairment test is made annually. Thevalue in use is based on the cash flow expected to be generated by the unit to the Group in future. The future cash flows used when assessing a unit'svalue in use are based on the business plan for the year 2014. Subsequent cash flows are based on forecasts up to the year 2017. The assessed growth for the years 2014-2017 is 2% (2%); thereafter growth is expected to be zero. The assessment of values in use are based on a discount interestof 10% (10%) before tax. The possibility to attract new and retain existing personnel is a sensibility factor. Based on the assumptions presented in theabove, the value in use exceeds the recognized goodwill value of all cash-generating units. A reasonable deviation from these assumptions is notexpected to cause a need for impairment of goodwill.
Also refer to note 28.
Note 10 Goodwill

53
Note 11 EquipmentkSEK 2013-12-31 2012-21-31 2013-12-31 2012-12-31
Acquisition value opening balance 14 799 14 038 - -
Acquisitions for the year 1 777 1 095 - -
Divestments/disposals -79 -325 - -
Translation differences for the year 6 -9 - -
Total accumulated acquisition value 16 503 14 799 - -
Depreciation opening balance -12 527 -11 183 - -
Divestments/disposals 50 325 - -
Depreciation for the year -1 184 -1 678 - -
Translation differences for the year -16 9 - -
Total accumulated depreciation -13 677 -12 527 - -
Carrying value closing balance 2 826 2 272 - -
Depreciation of equipment according to plan is based on the following useful life:
Office equipment 5 years
Computer equipment 3 years
Other equipment 5 years
THE GROUP PARENT COMPANYNote 11 Equipment
Note 12 Capitalized conversion expenseskSEK 2013-12-31 2012-12-31 2013-12-31 2012-12-31
Acquisition value opening balance 1 146 1 146 - -
Acquisitions for the year - - - -
Divestments/disposals - - - -
Total accumulated acquisition value 1 146 1 146 - -
Depreciation opening balance -1 146 -629 - -
Divestments/disposals - - - -
Depreciation for the year - -517 - -
Total accumulated depreciation -1 146 -1 146 - -
Carrying value closing balance 0 0 - -
THE GROUP PARENT COMPANYNote 12 Capitalized conversion expenses

54
HIFAB GROUP AB Corp. ID No. DomicileNo. of shares
Capital & votes, % 2013-12-31 2012-12-31
Hifab Finans AB 556544-8098 Stockholm 205 100 316 316
Hifabgruppen AB 556537-8261 Stockholm 100
Hifab AB 556125-7881 Stockholm 100
Envipro Miljöteknik AB 556326-9314 Stockholm 100
Pontem Access AB 556519-9220 Stockholm 75,5
Hifab AS Norge 954 985 601 Oslo 100
CMn Byggprojektledaren i Norr AB 556377-2739 Stockholm 100
Hifab LSPI 81 01-83 Vilnius 100
Hifab DU Teknik AB 556573-1550 Stockholm 100
Hifab Netcom AB 556599-8787 Stockholm 100
Hifab International AB 556100-3962 Stockholm 100
Hifab Kazakhstan Sweden Ltd 26879-1901-TOO Astana 50
Hifab Oy 1775079-9 Esbo 100
Hifab Development AB 556426-9297 Stockholm 100
Hifab Middle East Ltd 1010183035 Riyadh 50
Hifab Metodkonsult AB 556628-6661 Stockholm 100
Hifab SIA 33699 Riga 100
Hifab Konsult AB 556189-3545 Stockholm 100
ICS Interconsult Sweden AB 556460-7884 Stockholm 100
Hifab Netcom Nigeria Ltd 603173 Lagos 72,5
Fiberdata Operations AB 556589-6742 Stockholm 1 000 100 79 81
WJEK AB 556088-7142 Stockholm 1 000 100 109 109
Hifab Activity AB 556318-5833 Stockholm 4 000 100 517 517
Hifab Invest AB 556510-0798 Stockholm 1 000 100 0 127
Danovia Data AB 556435-0584 Stockholm 100
LBK Projektledning AB 556657-7473 Stockholm 100
1 021 1 150Total
Note 13 Participations in Group companies Book value, kSEKNote 13 Participations in Group companies
HIFAB GROUP AB Corp. ID No. DomicileNo. of shares
Capital & votes, % 2013-12-31 2012-12-31
Hifab Finans AB 556544-8098 Stockholm 205 100 316 316
Hifabgruppen AB 556537-8261 Stockholm 100
Hifab AB 556125-7881 Stockholm 100
Envipro Miljöteknik AB 556326-9314 Stockholm 100
Pontem Access AB 556519-9220 Stockholm 75,5
Hifab AS Norge 954 985 601 Oslo 100
CMn Byggprojektledaren i Norr AB 556377-2739 Stockholm 100
Hifab LSPI 81 01-83 Vilnius 100
Hifab DU Teknik AB 556573-1550 Stockholm 100
Hifab Netcom AB 556599-8787 Stockholm 100
Hifab International AB 556100-3962 Stockholm 100
Hifab Kazakhstan Sweden Ltd 26879-1901-TOO Astana 50
Hifab Oy 1775079-9 Esbo 100
Hifab Development AB 556426-9297 Stockholm 100
Hifab Middle East Ltd 1010183035 Riyadh 50
Hifab Metodkonsult AB 556628-6661 Stockholm 100
Hifab SIA 33699 Riga 100
Hifab Konsult AB 556189-3545 Stockholm 100
ICS Interconsult Sweden AB 556460-7884 Stockholm 100
Hifab Netcom Nigeria Ltd 603173 Lagos 72,5
Fiberdata Operations AB 556589-6742 Stockholm 1 000 100 79 81
WJEK AB 556088-7142 Stockholm 1 000 100 109 109
Hifab Activity AB 556318-5833 Stockholm 4 000 100 517 517
Hifab Invest AB 556510-0798 Stockholm 1 000 100 0 127
Danovia Data AB 556435-0584 Stockholm 100
LBK Projektledning AB 556657-7473 Stockholm 100
1 021 1 150Total
Note 13 Participations in Group companies Book value, kSEK

55
Note 15 Work in progress
Fixed price, kSEK 2013-12-31 2012-12-31 2013-12-31 2012-12-31
Fixed price 3 885 461 - -
Current account, accrued 17 924 13 140 - -
Total 21 809 13 601 - -
THE GROUP PARENT COMPANY
PARTICIPATIONS IN JOINT VENTURES Share of equity; % Voting rights; %Consolidated book
value; kSEK Corp. ID No. Domicile
Hifab Middle East Co Ltd 50 50 23 1 010 183 035 Riyadh
Hifab Kazakhstan 50 50 - 26879-1901-TOO Astana
INCOME STATEMENT 2013 BALANCE SHEET 2013-12-31
Net sales - Non-current assets -
Operating expenses -68 Current assets 207
Profit/loss for the year -68 Total assets 207
Share of average male employees 0 Equity -640
Laibilities 847
207Total equity and liabilities
The consolidated income statement and balance sheet include, in addition to the book value of the parent company, the following added value derivedfrom Hifab Middle East Co. Ltd. and Hifab Kazakhstan, amounting to 50% of the company's income statement and balance sheet.
Note 14 Other long–term security holdings
Note 15 Work in progress
Note 14 Other long-term security holdings
Nominal value,kSEK
Consolidatedbook value
kSEK2013-12-31
Consolidatedbook value
kSEK 2012-12-31
Book value;parent
company kSEK 2013-12-31
Book value; parent company
kSEK 2012-12-31
Brf Hemfjällsbyn, Sälen 194 194 194 - -
Other - - - - -
Total 194 194 194 - -
Note 13 Participations in Group companies, cont.
PARTICIPATIONS IN GROUP COMPANIES
kSEK 2013-12-31 2012-12-31
Acquisition value opening balance 36 758 36 758
Investments for the year - -
Divestments for the year - -
Accumulated acquisition value closing balance 36 758 36 758
Write-downs opening balance -35 608 -35 608
Divestments for the year - -
Revaluation/write-down for the year -129 -
Accumulated write-downs for the year closing balance -35 737 -35 608
Book value closing balance 1 021 1 150
PARENT COMPANY
Note 13 Participations in Group companies, cont.

56
Note 16 Prepaid expenses and accrued income
kSEK 2013-12-31 2012-12-31 2013-12-31 2012-12-31
Prepaid rents 3 478 3 585 - -
Prepaid pension costs 509 391 - -
Prepaid insurance fees 914 224 - -
Accrued income 4 074 3 240 - -
Total 8 975 7 440 - -
THE GROUP PARENT COMPANY
Note 17 Earnings per share
kSEK 2013 2012
Earnings for the year attributable to shareholders in theparent company 10 432 16 511
Average number of shares 30 419 456 30 419 456
Earnings per share 0,34 0,55
Ordinary share do not exist, and the above compilation refers to earnings per share before and after dilution.
THE GROUP
Note 16 Prepaid expenses and accrued income
Note 17 Earnings per share
Note 18 Share capital
NUMBER OF SHARES
PROPOSED DISTRIBUTION OF DIVIDEND
Number of shares A-shares B-sharesTotal number
of shares
Opening balance 2013-01-01 781 333 29 638 123 30 419 456
Closing balance 2013-12-31 781 333 29 638 123 30 419 456
As stated in the administration report, the Board proposes that a dividend of SEK 0.20 (0.50) per share be distributed.
The share capital of the parent company is distributed to 781 333 A-shares and 29 638 123 B-shares. A-sharescarry 10 voting rights and B-shares 1 voting right.
The share capital of the parent company consists of 30 419 456 shares, each at a nominal value of SEK 0.10. A specification of change in equity appears from the summary of Equity on page 33.
Note 18 Share capital

57
Note 19 Bank overdraft facilityThe Group has a granted, non-utilized overdraft facility in the amount of 20 000 (20 000) kSEK.
Note 20 Financial liabilities
kSEK 2013-12-31 2012-12-31 2013-12-31 2012-12-31
Maturity date within 1 year 56 699 56 006 47 518 33 305
Maturity date within 2 years 1 600 1 600 - -
Maturity date within 3 years 200 1 600 - -
Maturity date within 4 years - 200 - -
Total 58 499 59 406 47 518 33 305
THE GROUP PARENT COMPANY
Note 21 Accrued expenses and deferred income
kSEK 2013-12-31 2012-12-31 2013-12-31 2012-12-31
Personnel related expenses 25 991 23 866 - -
Accrued expenses, sub-consultants 7 221 5 769 - -
Other items 8 746 6 135 - -
Total 41 958 35 770 - -
THE GROUP PARENT COMPANY
Note 22 Contingent liabilities
kSEK 2013-12-31 2012-12-31 2013-12-31 2012-12-31
Chattle mortgage for liabilities to credit institutions 26 500 26 500 - -
Pledged assets for participations in Group companies 12 969 12 969 - -
Warranties 1 977 663 - -
Total 41 446 40 132 - -
Dispute-related contingent liability - refer to note 27
Pledged assets and similar securities for own liabilities and provisions.
THE GROUP PARENT COMPANY
Note 19 Bank overdraft facility
Note 22 Contingent liabilities
Note 23 Intra-group purchases and salesIntra-group purchases and sales in the parent company totalled 0% (0%) during the year.
Transactions with related parties. No transactions with related parties have occured during the year.
Note 24 Items affecting comparabilityThe consolidated earnings for the year have not been charged with items affecting comparability.
Note 23 Intra–group purchases and sales
Note 24 Items affecting comparability
Note 20 Financial liabilities
Note 21 Accrued expenses and deferred income

58
Note 28 Acquisition of subsidiariesSpecification of net assets acquired
kSEK GROUPPARENT
COMPANY
Cost of acquisition 10 875 0
Paid regarding acquisitions from prior years 0Less unpaid share of cost -875 0
Total cash paid 10 000 0
Non-current assets 19
Goodwill 9 806
Current assets 4 290
Cash and cash equivalents 792
Current liabilities -4 027
Deferred tax liabilities -5Less unpaid share of cost -875
10 000
Net cash flow arising from acquisition of subsidiaries -9 208
Hifab AB acquired 100% of the share capital of DU Teknik AB on 1 March 2013. The acquisition is part of the Group's strategic focusto provide services in process engineering. Goodwill represents the future profits according to the business plan and projections. Theadditional purchase consideration is based on the profit for the financial year 1 Jan 2013 until 31 Dec 2013 and is measured based onthe profit forecast for the period. This is reported as other long-term liability in the balance sheet. The fair value of acquired assets isequal to the carrying amount.
Note 25 Non-cash items
kSEK 2013 2012 2013 2012
Depreciation according to plan 1 184 2 195 - -
Write-down of shares in subsidiaries - - 497 4 762
Write-down of participations - 133 - -
Change in reserves, including tax -2 -74 - -
Exchange rate fluctuations -23 36 - -
Other 39 - - -
Adjusted purchase price, variable component -492 - - -
Summa 706 2 290 497 4 762
THE GROUP PARENT COMPANY
Not 22 Eventualförpliktelser
kSEK 2012-12-31 2011-12-31 2012-12-31 2011-12-31
Företagsinteckningar för skuld till kreditinstitut 26 500 26 500 - -
Ställda panter för andelar i koncernföretag 12 969 12 969 - -
Garantiförbindelser 663 2 971 - -
Summa 40 132 42 440 - -
Eventualförpliktelse i tvist - se not 27
Not 23 Köp och försäljning till koncernbolagUnder året har moderbolagets inköp och försäljning från och till koncernbolag uppgått till 0% (0%).
Transaktioner med närstående. Inga transaktioner till närstående har skett under året.
Not 24 Jämförelsestörande posterÅrets resultat i koncernen har ej belastats med några jämförelsestörande poster.
Not 25 Ej kassaflödespåverkande redovisningsposter
kSEK 2012 2011 2012 2011
Avskrivningar enligt plan 2 195 2 247 - -
Nedskrivningar aktier dotterbolag - - 4 762 -
Kursförändringar 36 -246 - -
Reavinster - -3 106 - -
Nedskrivning i andelar 133 - - -
Minoritetsintressen (BR+RR) - -241 - -
Förändringar avsättningar inkl skatt -74 -131 - -
Summa 2 290 -1 477 4 762 -
Not 26 Operationella leasingavtalkSEK 2012 2011
Hyror och övriga leasingavgifter betalda under året 3 192 2 783
Summa 3 192 2 783
Panter och därmed jämförliga säkerheter för egna skulder och avsättningar.
KONCERNEN MODERBOLAGET
KONCERNEN MODERBOLAGET
KONCERNEN
Note 25 Non–cash items
Note 27 DisputesHifab Group AB has received a summons application from the bankruptcy estate of Rimp AB, a former subsidiary. The claim refers to the period prior to Thalamus's acquisition of Hifab. The summons application concerns i.a. a claim for recovery based on the allegationthat the subsidiary was insolvent at the time when transactions were made. Hifab contests the allegation and any alledged damage to external creditors. The total claim amounts to approximately 47 MSEK. Based on legal advice, the Board rejects the claim. Therefore,Hifab has not set up a provision for the alledged claim, but reports the dispute as a contingent liability.
Note 27 Disputes
Note 28 Acquisition of subsidiaries
Note 26 Operational leasingkSEK 2013 2012
Cars 2 123 1 686
Administrative equipment 1 060 1 356
Other 111 150
Total 3 294 3 192
THE GROUPNote 26 Operational leasing
59
ANDERS ERIKSSON
Chairman of the Board
BENGT STILLSTRÖM
JAN SKOGLUND
CARINA EDBLAD
HANS WALDAEUS
JEANETTE SAVEROS
CEO
DENISE LUCAS
Employee representative Unionen
AGNETA JACOBSSON
Our audit report was presented on 31 March 2014. Deloitte AB
Svante Forsberg
Authorized Public Accountant
Stockholm 31 March 2014

60
R E P O R T O N T H E A N N U A L A C C O U N T S A N D T H E C O N S O L I D AT E D A C C O U N T SWe have audited the annual accounts and the consolidated accounts
of Hifab Group AB for the year 2013-01-01 – 2013-12-31. The annual
accounts and consolidated accounts of the company are included in the
printed version of this document, see pages 24–59.
Responsibilities of the Board of Directors and the Managing
Director for the annual accounts and consolidated accounts
The Board of Directors and the Managing Director are responsible
for the preparation and fair presentation of these annual accounts and
consolidated accounts in accordance with the Annual Accounts Act and
of the consolidated accounts in accordance with International Financial
Reporting Standards, as adopted by the EU, and the Annual Accounts
Act, and for such internal control as the Board of Directors and the Mana-
ging Director determine is necessary to enable the preparation of annual
accounts and consolidated accounts that are free from material misstate-
ment, whether due to fraud or error.
Auditor’s responsibility
Our responsibility is to express an opinion on these annual accounts
and consolidated accounts based on our audit. We conducted our audit
in accordance with International Standards on Auditing and generally
accepted auditing standards in Sweden. Those standards require that
we comply with ethical requirements and plan and perform the audit to
obtain reasonable assurance about whether the annual account are free
from material misstatement.
An audit involves performing procedures to obtain audit evidence about
the amounts and disclosures in the annual accounts and consolidated ac-
counts. The procedures selected depend on the auditor’s judgement, inclu-
ding assessment of the risks of material misstatement of the annual accounts
and consolidated accounts, whether due to fraud or error. In making those
risk assessments, the auditor considers internal control relevant to the com-
pany’s preparation and fair presentation of the annual accounts and conso-
lidated accounts in order to design audit procedures that are appropriate in
the circumstances, but not for the purpose of expressing an opinion on the
effectiveness of the company’s internal control. An audit also includes evalu-
ating the appropriateness of accounting policies used and the reasonableness
of accounting estimates made by the Board of Directors and the Managing
Director, as well as evaluating the overall presentation of the annual accounts
and consolidated accounts.
We believe that the audit evidence we have obtained is sufficient and
appropriate to provide a basis for our audit opinions.
Opinions
In our opinion, the annual accounts have been prepared in accordance
with the Annual Accounts Act and present fairly, in all material respects,
the financial position of the parent company as of 31 December 2013 and
of its financial performance and its cash flows for the year then ended in
accordance with the Annual Accounts Act. The consolidated accounts
have been prepared in accordance with the Annual Accounts Act and
present fairly, in all material respects, the financial position of the group
as of 31 December 2013 and of their financial performance and cash
flows for the year then ended in accordance with International Financial
Reporting Standards, as adopted by the EU, and the Annual Accounts
Act. The statutory administration report is consistent with the other parts
of the annual accounts and consolidated accounts.
We therefore recommend that the annual meeting of shareholders
adopt the income statement and balance sheet for the parent company
and the group.
R E P O R T O N O T H E R L E G A L A N D R E G U L AT O R Y R E Q U I R E M E N T S In addition to our audit of the annual accounts and consolidated
accounts, we have also audited the proposed appropriations of the com-
pany’s profit or loss and the administration of the Board of Directors
and the Managing Director of Hifab Group AB for the financial year
2013-01-01 – 2013-12-31.
Responsibilities of the Board of
Directors and the Managing Director
The Board of Directors is responsible for the proposal for appropria-
tions of the company’s profit or loss, and the Board of Directors and
the Managing Director are responsible for administration under the
Companies Act.
Auditor’s responsibility
Our responsibility is to express an opinion with reasonable assurance on
the proposed appropriations of the company’s profit or loss and on the
administration based on our audit. We conducted the audit in accordan-
ce with generally accepted auditing standards in Sweden.
As a basis for our opinion on the Board of Directors’ proposed appropria-
tion of the company’s profit or loss, we examined the Board of Directors’ re-
asoned statement and a selection of supporting evidence in order to be able
to assess whether the proposal is in accordance with the Companies Act.
As a basis for our opinion concerning discharge from liability, in
addition to our audit of the annual accounts and consolidated accounts,
we examined significant decisions, actions taken and circumstances of
the company in order to determine whether any member of the Board
of Directors or the Managing Director has, in any other way, acted in
contravention of the Companies Act, the Annual Accounts Act or the
Articles of Association.
We believe that the audit evidence we have obtained is sufficient and
appropriate to provide a basis for our opinion.
Opinions
We recommend to the annual meeting of shareholders that the profit(loss)
be appropriated in accordance with the proposal in the statutory admini-
stration report and that the members of the Board of Directors and the
Managing Director be discharged from liability for the financial year.
Stockholm, 31 March 2014
Deloitte AB
Svante Forsberg
Authorized Public Accountant
Auditor’s reportAnnual General Meeting of Hifab Group AB Corporatenumber 556394–1987

61
Kapt
ensb
ron
in M
alm
ö, P
hoto
: Ada
m H
aglu
nd

The Board of Directors of Hifab Group AB
ANDERS ERIKSSON Chairman of the Board of Directors, 1956
Elected to the Board: 2006
Other significant engagements:
Director Softronic AB and
AB Traction.
A shares: –
B shares: 152 000
DENISE LUCAS Employee Representative, Unionen, 1954
Elected to the Board: 2013
Other significant engagements:
A shares: –
B shares: –
CARINA EDBLAD Member of the Board of Directors, 1963
Elected to the Board: 2012
Other significant engagements:
CEO Färdig Betong AB and Director
Svensk Betong.
A shares: –
B shares: –
AGNETA JACOBSSON Member of the Board of Directors, 1956
Elected to the Board: 2013
Other significant engagements:
CEO DTZ Sweden AB since
2006. Chairman RICS in Sweden.
Director AMF Fastigheter. Co–
founder Green Building Council
in Sweden.
A shares: –
B shares: –
HANS WALDAEUSMember of the Board of Directors, 1944
Elected to the Board: 2005
Other significant engagements:
Director SHL Group AB
Shares owned through a company:
A shares: –
B shares: 1 400 172
BENGT STILLSTRÖM Member of the Board of Directors, 1943
Elected to the Board: 2004
Other significant engagements:
Founder and Chairman AB
Traction, Director Feelgood,
Empire, Profilgruppen, Ringvägen
Venture, SwitchCore.
Shares owned through a company:
A shares: 100 000
B shares: 14 447 057
JAN SKOGLUND Member of the Board of Directors, 1951
Elected to the Board: 2013
Other significant engagements:
Chairman Drillcon Group AB,
Director Svensk Teknik and
Design, STD
A shares: –
B shares: –
Norra Länken, Stockholm
62

The Management of Hifab Group AB
JEANETTE SAVEROS CEO
A shares: –
B shares: 55 547
ELISABETH BRATTLUNDCFO
A shares: –
B shares: 44 400
HENRIK FORSBERGChief Operating Officer Stockholm International
A shares: –
B shares: –
LARS ANDER Human Resources Director
A shares: –
B shares: 12 800
OLLE CYRÉN Chief Operating Officer Scandinavia
A shares: –
B shares: 15 000
In photo: Anders Karlsson, Project Manager, Hifab
63

1
ANNUAL REPORT 2013
Hifab Group ABH E A D O F F I C E
Sveavägen 167, 3rd Floor, P.O. Box 19090, SE-104 32 Stockholm tel +46-10 476 60 00 fax +46-10 476 67 80
www.hifab.se
H I FA B A B – R E G I O N A L O F F I C E S
Tullgatan 8, SE-632 20 Eskilstuna
tel +46-10 476 60 00 fax +46-10 476 61 79
Magasinsgatan 22, SE-411 18 Göteborg
tel +46-10 476 60 00 fax +46-10 476 60 69
Klammerdammsgatan 6, SE-302 42 Halmstad
tel +46-10 476 60 00 fax +46-10 476 60 59
Berga Allé 1, SE-254 52 Helsingborg
tel +46-10 476 60 00 fax +46-10 476 60 49
Målargatan 3, SE-553 22 Jönköping
tel +46-10 476 60 00 fax +46-10 476 62 49
Postgatan 2, SE-392 33 Kalmar
tel +46-10 476 60 00 fax +46-10 476 61 29
Dagvindsgatan 5, SE-652 21 Karlstad
tel +46-10 476 60 00 fax +46-10 476 61 19
Brigadgatan 5, SE-587 58 Linköping
tel +46-10 476 60 00 fax +46-10 476 61 29
Varvsgatan 47, SE-972 33 Luleå
tel +46-10 476 60 00 fax +46-10 476 62 29
Kattsundsgatan 15, SE-211 26 Malmö
tel +46-10 476 60 00 fax +46-10 476 60 19
Skolgatan 1A, SE-602 25 Norrköping
tel +46-10 476 60 00 fax +46-10 476 61 59
Parkgatan 1, SE-151 32 Södertälje
tel +46-10 476 60 00 fax +46-10 476 68 99
Brogatan 1, SE-903 25 Umeå
tel +46-10 476 60 00 fax +46-10 476 61 99
St Persgatan 13, SE-753 20 Uppsala
tel +46-10 476 60 00 fax +46-10 476 67 80
Kopparbergsvägen 8, SE-722 13 Västerås
tel +46-10 476 60 00 fax +46-10 476 61 79
Mellringevägen 120F, SE-703 53 Örebro
tel +46-10 476 60 00 fax +46-10 476 61 09
H I FA B I N T E R N AT I O N A L A B
Sveavägen 167, 3rd Floor, P.O. Box 19090, SE-104 32
Stockholm tel +46-10 476 60 00 fax +46-10 476 67 80
I N T E R N AT I O N A L O F F I C E S
Hifab Bangladesh
House 14 (7th floor), Road 32, Gulshan 1,
Dhaka 1212, Bangladesh, GPO Box 4185,
Dhaka 1000
mobile +880 175 555 72 57
Swedish mobile +46 768 400 901
Hifab Kenya
Beverly Court, Marcus Garvey Road,
P.O. Box 35249-00100, Nairobi, Kenya
tel +254 716 198 269
Hifab Oy Finland
Lars Sonckin kaari 14, FI-02600 Espoo, Finland
tel +358 9 5406 55 50 fax +358 9 5406 55 55